Department of Agriculture and Food - agric.wa.gov.au of... · Department of Agriculture and Food |...
126
Cover option 2 Making every hectare count Making every hectare count 09 Department of Agriculture and Food Annual Report Department of Agriculture and Food
Transcript of Department of Agriculture and Food - agric.wa.gov.au of... · Department of Agriculture and Food |...

Cover option 2
Making every hectare count
Making every hectare count
09Department of Agriculture and Food
Annual Report
Department ofAgriculture and Food

ISSN 1834-3740 Copyright © Western Australian Agriculture Authority, 2009
Western Australian Government materials, including website pages, documents and online graphics, audio and video are protected by copyright law. Copyright of materials created by or for the Department of Agriculture and Food resides with the Western Australian Agriculture Authority established under the Biosecurity and Agriculture Management Act 2007. Apart from any fair dealing for the purposes of private study, research, criticism or review, as permitted under the provisions of the Copyright Act 1968, no part may be reproduced or reused for any commercial purposes whatsoever without prior written permission of the Western Australian Agriculture Authority.
StAtement of compliAnce
For the year ended 30 June 2009
The Honourable Terry Redman MLAMinister for Agriculture and Food; Forestry; Minister Assisting the Minister for Education
In accordance with section 61 of the Financial Management Act 2006, I hereby submit for your information and presentation to Parliament, the Annual Report of the Department of Agriculture and Food, Western Australia for the financial year ended 30 June 2009.
The Annual Report has been prepared in accordance with the provisions of the Financial Management Act 2006 and any other relevant written law.
Contact details
PostalLocked Bag 4Bentley Delivery Centre WA 6983
Street3 Baron-Hay CourtSouth Perth WA 6151
ElectronicInternet: www.agric.wa.gov.auEmail: [email protected]: 61 8 9368 3333Facsimile: 61 8 9474 2405
Copies of this document are available in alternative formats upon request. Should you have a hearing or speech impairment you can contact the department through the National Relay Service: TTY or computer with modem users phone 133 677 Speak and listen users phone 1300 555 727
If you require the assistance of an interpreter, please contact the department through TIS National on 131 450.
Malcolm Goff A/Director General Department of Agriculture and Food

Department of Agriculture and Food | Annual Report 2009 1
contentS
Statement of compliance ........................................................................................... ii
Director General’s foreword .................................................................................... 2
Overview of the department .................................................................................... 3
Executive summary ........................................................................................................ 3
Operational structure ...................................................................................................... 4
Performance management framework ........................................................................... 8
Agency performance .................................................................................................13
Report on operations .....................................................................................................13
Financial targets .............................................................................................................15
Summary of key performance indicators .......................................................................15
Significant issues and trends .................................................................................16
Disclosures and legal compliance ........................................................................17
Financial statements ......................................................................................................17
Key performance indicators ...........................................................................................75
Other financial disclosures ...........................................................................................105
Governance disclosures & ministerial directives ...........................................................109
Other legal requirements .............................................................................................110
Government policy requirements ................................................................................. 115
APPENDICES ............................................................................................................. 119
Appendix 1: ................................................................................................................. 119
Appendix 2: .................................................................................................................120
Appendix 3: .................................................................................................................121
Appendix 4: .................................................................................................................122

Department of Agriculture and Food | Annual Report 2009 2
DiRectoR GeneRAl’S foRewoRD
The agrifood sector has an impressive record of successfully competing in domestic and international markets. However, the sector must continue to innovate, evolve and adapt to take advantage of the opportunities and to maximise its contribution to the economic and regional development of Western Australia.
As in many other industries around the world, the pressures and challenges confronting the agriculture and food industries are increasing. With support from the Department of Agriculture and Food through technical innovation, the sector will continue to adapt to unrelenting change. The department has outstanding science and innovation capability and this, coupled with policy and leadership, has provided the basis for us to contribute to industry competitiveness and profitability for more than a century.
This year the department is overseeing the first commercial trials of genetically modified (GM) canola in Western Australia. This technology has the potential to significantly reduce chemical use, which in turn will lead to considerable economic and environmental benefits for grain growers and the state. We also demonstrated leadership to industry by ceasing mulesing on all of the department
research stations to trial management options for farmers opting to cease the practice.
The recently released National Fruit Fly Strategy is the result of nearly three years work by state and federal governments and industry to protect the nation’s $6.9 billion horticulture industries, and its completion is largely due to the expertise and input provided by the Department of Agriculture and Food, Western Australia.
The department also leads whole-of-government responses in the areas of natural resource management, biosecurity and food as well as leading the agriculture sector to understand and adapt to climate change. We also work in collaboration with many other agencies and organisations, sharing responsibility for several important services. The newly established Livestock Compliance Unit is a fully operational division of the department and works closely with WA Police. While the department has historically assisted police officers with their stock crime investigations, the new arrangement provides a more effective direct mechanism for assistance in reducing livestock theft.
The government’s Priority Plan for Agriculture ‘Making every hectare count’ and our review of our projects and services will change the way the department operates in the future. I am confident the result will be a Department of Agriculture and Food that is able to more quickly respond to industry and market demands and efficiently
and effectively target projects and services that contribute to economic and regional development.
The department strives for corporate excellence. During the year the department won a multicultural award for our Indigenous Management Services program. The department not only received its Worksafe Plan Gold Certificate for our safety systems but has also been recognised in the WA safety awards as a leader in the public sector. We have also implemented an initiative to monitor and reduce our site energy consumption as part of our ongoing commitment to greening the department.
This is my last annual report for the department and I would like to say it has been a privilege to have led the organisation through the challenges and changes of the past five years. I would like to thank the Ministers, Members of Parliament and industry leaders whose support I have enjoyed during my tenure. I am especially proud to have worked with the talented, professional and dedicated people that are the Department of Agriculture and Food. I have every confidence the activities of the department will continue to achieve great impact and lead the agriculture, food and fibre industries of Western Australia into the future.
Ian Longson, Director General
Like the agrifood sector it supports, the department continues to innovate, evolve and adapt.

Department of Agriculture and Food | Annual Report 2009 3
oveRview of the DepARtment
Executive summary
Agriculture is the ultimate renewable industry. Mines and gas fields will eventually be depleted and the sector will lurch between booms and busts. However, people will always need to eat. People will also choose fibre for clothes and houses and increasingly they will turn to biofuels for energy.
While the global financial crisis has significantly impacted on the minerals sector, agricultural exports have remained steady. Over the past two decades the value of agricultural production has had a 3.5 per cent average annual growth. This has the potential to improve further; whereas the trends in exports by the minerals sector will no doubt drop considerably. Refer to comparative graph.
The Department of Agriculture and Food is entrusted with driving continuous improvement in the productivity, profitability and sustainability of Western Australia’s agricultural and food industries. This pivotal role involves supporting and developing all aspects of the supply chain through:• innovative research and development• extension• regulation• marketing.
Fundamentally this includes the development of new and advanced agricultural products and practices, and providing advice on farming systems, land management, seasonal conditions and sustainability issues. While the department is primarily involved in economic development, its widespread activities also generate considerable social, community and environmental benefits.
Our responsibilities cover more than 100 million hectares devoted to Western Australia’s agricultural and pastoral production as well as protecting both industry and the broader community from various pests, weeds and diseases that cause significant problems elsewhere. On average, around 1,500 highly skilled staff work throughout the state, delivering a diverse range of quality services and products from more than 30 locations (see Appendix 1).
A highlight for 2008–09 was the establishment of the first trials of genetically modified (GM) canola to be permitted in Western Australia. Twenty trials totalling 860 hectares (spread from Cunderdin in the north to Plantagenet in the south) have been established and they will be evaluated over the growing season for agronomic performance and the industry’s ability to segregate the grain from non-GM successfully.
This year the department produced the State Natural Resource Management Plan for government and is now developing the implementation strategy for that plan. Water quality improvement plans, complete with water quality targets, were also completed for the Swan-Canning River and the Peel-Harvey catchment. These plans will improve fertiliser management, helping to reduce phosphorous and nitrogen run-off into waterways such as the Swan River.
The department also looks at ways to meet consumer expectations for safe, quality, ethically and environmentally produced food products. The government’s food marketing campaign buy west eat best now has around 80 companies
supporting the program. The level of support being given to this initiative clearly demonstrates it continues to meet the ever-growing consumer demand for state-of-origin labelling on food products.
With the release of the government’s Priority Plan for agriculture and food in Western Australia in March 2009, the department embarked on developing a new structure that will more effectively and efficiently deliver functional responsibilities (see the section on changes to outcome-based management framework for more information).
The department will continue to work closely with industry and communities to encourage the agriculture and food industries to adapt to a changing world, thereby ensuring a safe and sustainable food supply for future generations of Western Australians, intergenerational economic sustainability for producers and the sustainable use of land and water. In short, making every hectare count.
-20,000
-10,000
0
10,000
20,000
30,000
40,000
50,000
60,000
70,000
1970 1975 1980 1985 1990 1995 2000 2005 2010
Trend – WA Export by Sector (A$ million)
$m
Minerals and Energy Agri-food and fibre
Linear (Minerals and Energy )
Linear (Agri-food and fibre )
Year

Department of Agriculture and Food | Annual Report 2009 4
oveRview of the DepARtment
Operational structure
Enabling legislationThe Department of Agriculture and Food, Western Australia is established as a department under the Public Sector Management Act 1994.
Responsible ministerThe Honourable Terry Redman MLAMinister for Agriculture and Food; Forestry; Minister Assisting the Minister for Education
Department profile
Government’s priority plan for Agriculture and FoodFive priorities have been established for the agriculture and food sectors that will set the framework for all the decisions made by government.
1. Profitability – improving the long-term profitability of the agriculture and food sectors
2. Natural resources – effectively managing land and water assets, climate variability and biosecurity
3. People – building the capacity of the industry to adapt and grow
4. Markets – improving market access for Western Australian products
5. Industry – promoting a positive profile of the Western Australian agriculture and food sectors
Our visionMaking a difference – through excellence and innovation to grow Western Australia’s world-class agriculture and food sector.
Our missionTo accelerate the success of agriculture, food and fibre industries through information, science and innovation, responsible management of the resource base, policy and regulation across all elements of the supply chain. The department is primarily involved in economic and regional development. Our widespread activities also generate strong social, community and environmental benefits. We lead key areas of cross-government activity including:• food• natural resource management• biosecurity.
We continuously build and develop our capacity and capability to deliver the best outcome for our stakeholders and clients. We work in partnership with our key stakeholders and clients to deliver these outcomes.
Honourable Terry Redman MLA

Department of Agriculture and Food | Annual Report 2009 5
oveRview of the DepARtment
Our values• We apply professionalism, innovation, respect
and integrity to all that we do• We are committed to making a difference in all
areas in which we work• We value our customers’ requirement for
high-quality service delivery• We work as a team, being supportive of
each other, appreciative of others’ inputs and respecting their differences
• We encourage creativity, are receptive to new ideas, strive for continuous learning and improvement, and share our knowledge.
• We are honest and open in our communication and accept accountability for our dealings with others
• We value and respect the health and safety of our people.
Administered legislationThe Minister for Agriculture and Food also administers a large number of related Acts. These are listed in Appendix 2.
Legislative changes• The Artificial Breeding of Stock Act 1965
was repealed pursuant to the Biosecurity and Agriculture Management (Repeal and Consequential Provisions) Act 2007 on 21 February 2009. State government licensing of the premises for the artificial breeding of stock is no longer required.
• The Veterinary Surgeons Act 1960 was amended to provide for national consistency in qualifications for registration as a veterinary surgeon.
Proposed legislative changes• Repeal of the Grain Marketing Act 2002 to
remove the requirement for licences for the bulk export of barley, lupins and canola.
• Repeal of the Agricultural Practices (Disputes) Act 1995
• Amendments to the Agriculture and Related Resources Protection Act 1976 and repeal of the Agriculture Protection Board Act 1950 to facilitate implementation of certain provisions of the Biosecurity and Agriculture Management Act 2007
• A new Act to replace the Veterinary Surgeons Act 1960
• Amendments to the Agricultural Produce Commission Act 1988
• Amendments to the Gene Technology Act 2006 to complement amendments made to the Commonwealth Gene Technology Act 2000
Other key legislation impacting on activitiesIn the performance of its functions, the department complies with a number of relevant written laws. These are listed in Appendix 3.

Department of Agriculture and Food | Annual Report 2009 6
oveRview of the DepARtment
Senior officers
Mr Malcolm Goff (A/Director General)Malcolm was appointed Acting Director General in June 2009. He has over 30 years experience in education, training and organisational development. Prior to his appointment Malcolm was CEO of TVET Australia and before that Managing Director of Challenger TAFE.
Mr Graeme Wilson (Director Policy and Planning)Graeme joined the WA Public Sector in 1979. He has held senior finance, strategy and business development positions at the Department of Productivity and Labour Relations, Department of Education, Water Authority, TAFE, and the Advanced Manufacturing Technology Centre. Graeme joined the department as Director of Policy and Planning in 1998.
Mr Damian Collopy (A/Executive Director Biosecurity)Damian was appointed to this position in November 2008. He has 39 years experience in the management of animal disease, invasive species and plant health, and currently represents WA on the National Biosecurity Committee. Damian managed the response to the outbreak of Australian Plague Locusts in 2000, which received the Premier’s Award and was runner-up in the International CAPAM awards for its innovation and governance.
Dr Mark Sweetingham (A/Executive Director Research)Since joining the department in 1983 Mark has had a productive career in research, most notably in the fields of crop disease management and genetic improvement of legumes. More recently he has been involved in the realignment of agricultural research and development to the critical needs of industry.
Mr Roger O’Dwyer (Executive Director Industry and Rural Services)Roger rejoined the department in 2006 after working in a range of roles in the Queensland Department of Primary Industries and Northern Territory Department of Primary Industry. He also worked for the Rural Adjustment and Finance Corporation of WA and the Agricultural Bank of Tasmania.
Mr Eric Wright (A/Executive Director Natural Resource Management)Eric was appointed to this position in March 2009. He has worked in the mining services sector and spent 11 years with the Waterways Commission in various roles including Regional Manager for the Bunbury region. He joined the department in 1997.
Mr Paul Frapple (A/Executive Director Food and Trade Development)Paul commenced his career in the mining sector. He joined the Department of Agriculture and Food in 1979 and has held various management positions focused on industry development and post farm-gate activities until his appointment as A/Executive Director Food and Trade Development in 2007.
Mr Mike Marsh (Executive Director Business Services)Mike was appointed the department’s Chief Finance Officer in 1997. Prior to joining the department Mike held a number of senior positions in the WA Public Service. Mike is a member of the Australian Society of Certified Practising Accountants.

Department of Agriculture and Food | Annual Report 2009 7
oveRview of the DepARtment
Organisational chart
MINISTER FOR AGRICuLTuRE AND FOOD
The Hon Terry Redman MLA
DIRECTOR GENERALMalcolm Goff
Internal Audit
POLICy AND PLANNING
Graeme Wilson
BIOSECuRITy AND RESEARCH
Damian Collopy and Mark Sweetingham
INDuSTRy AND RuRAL SERvICES
Roger O’Dwyer
NATuRAL RESPONSE MANAGEMENT
Eric Wright
FOOD AND TRADE DEvELOPMENT
Paul Frapple
BuSINESS SERvICES
Mike Marsh
Agriculture Protection Board
Rural BusinessDevelopment Corporation
Planning and Evaluation
Policy Development
Legislation
Public Affairs
Chief Economist
Modelling and Economic Development
Project Management
Animal Biosecurity
Border Biosecurity and Emergency Response
Plant Biosecurity
Invasive Species
Animal Research
Crop Research
Intensive Plant Research
Agricultural Systems Research
Animal Industries Development
Horticulture Industry Development
Grain Industries Development
Farm Business Development
Central Agricultural Region
South West Agricultural Region
Southern Agricultural Region
Northern Agricultural Region
Rangelands
State NRM Program Development
Natural Resource Science
Strategic NRM Analysis
NRM Regional Delivery
Soil and Land Conservation Act
NRM – Integration
Market and Trade Development
Agri-industry Opportunity
Food Industry Development
AgWest International
Finance
Asset Management
Human Resources
Information Services
Shared Services Implementation
Agricultural Research Western Australia (ARWA)

Department of Agriculture and Food | Annual Report 2009 8
Performance management framework
Outcome-based management frameworkBroad high-level government goals are supported at agency level by specific outcomes. The Department of Agriculture and Food delivers four agency-level services to achieve these outcomes, which ultimately contribute to meeting the higher level government goals.
Government goalStronger focus on the regions – greater focus on service delivery, infrastructure investment and economic development to improve the overall quality of life in remote and regional areas.
Agency-level government-desired outcomeIncreased competitiveness and profitability of agriculture, food and fibre industries
Service 1 – Food and Fibre Industry DevelopmentThe achievements within the Food and Fibre Industry Development service are mostly of an industry research and development nature. This service contributes to increased profitability and competitiveness of agri-industry by providing it with leading-edge science and innovation.
Making every hectare count in the ORIAWith the state government committing $220 million to develop a further 8,000 hectares of irrigated farmland in the Ord River Irrigation Area (ORIA) and the Australian Government spending $190 million on social infrastructure in the East Kimberley, prospects for the region are exciting.
Brendan Grylls MLA, Minister for Regional Development, visited the department’s Frank Wise Research Institute in Kununurra to look at this year’s research trials. During the visit Mr Grylls inspected crops in the area and received an update on the department’s key research activities. One such activity is the department’s surveys of the sandy soils (Cockatoo Sands) that surround the irrigation areas.
Other activities include small trials of 15 varieties of genetically modified (GM) cotton and four varieties of temperate paddy rice; thirteen short season wheat varieties as well as oats and triticale are being evaluated as these crops offer the prospect of double cropping in paddocks, potentially making each hectare more profitable.
Nine maize varieties and two soybean varieties are also being evaluated. Banana, mango, mangosteen, red grapefruit and table grape trials will also continue. 2009–10 should see a more extensive research program established with more efficient use of water through drip irrigation rather than flood irrigation a research priority.
oveRview of the DepARtment

Department of Agriculture and Food | Annual Report 2009 9
oveRview of the DepARtment
Government goalSocial and environmental responsibility – ensuring that economic activity is managed in a socially and environmentally responsible manner for the long-term benefit of the State
Agency-level government-desired outcomeImproved ecological sustainable development of agri-industry
Service 2 – Agricultural Resource ManagementThe achievements within the Agricultural Resource Management service are mainly related to the department’s natural resource management (NRM) activities, which develop the capacity of rural communities and industries to profit from environmentally responsible agriculture. This service contributes to the ecologically sustainable development of agri-industry by demonstrating how to best manage production risks by preventing the decline in the productive capacity of natural resources and minimising off-site impacts of agricultural practices.
WARMS for sustainable hectaresWith a broad range of climatic and physical environments and covering 892,000 square kilometres, Western Australia’s pastoral rangelands extend from the Kimberley in the north to the Great Australian Bight in the south; and, unlike the South West Land Division, much of the rangelands is vested in the Crown. This means the state has primary responsibility for managing the natural resources in this area.
In what is thought to be the first system of its kind, perhaps anywhere in the world, the Department has developed a sophisticated biophysical monitoring system for this vast region that shows changes to the landscape. The Western Australian Rangeland Monitoring System (WARMS) has now been operating in its current form for well over 15 years, providing objective evidence of how the Crown’s natural resources are being managed in the rangelands.
WARMS uses a system of permanent ground-based sites on which perennial vegetation and soil surface characteristics are assessed and recorded (on the map shown, grassland sites are green and shrubland sites are red).
There are 1,615 sites in total and information from these sites, combined with other data including rainfall, stock numbers and incidence of fire, allows us to make objective assessments of the pressure the land is under and to determine whether management is environmentally sustainable.
Although WARMS information is focused at regional level, information on rangeland change can be used to support planning and grazing management at individual property level. Grazing land ecosystems are very complex, and maintaining land in good condition and making appropriate decisions about livestock numbers requires a suite of information that has been enhanced by the establishment of WARMS.

Department of Agriculture and Food | Annual Report 2009 10
Government goalSocial and environmental responsibility – ensuring that economic activity is managed in a socially and environmentally responsible manner for the long-term benefit of the State
Agency-level government-desired outcomeEffective management of biosecurity
Service 3 – BiosecurityThe achievements within the Biosecurity service are mainly related to the department’s management and control of plant and animal pests and diseases. This service contributes to the protection of Western Australia through:• effective barrier quarantine and protection• effective surveillance programs• leading emergency responses to incursions
and outbreaks of high priority animal and plant pests and diseases
• effective management of specific pests and diseases
• ensuring community awareness of biosecurity risks.
Getting rid of gorse – a top 20 pest
oveRview of the DepARtment
Since being introduced as a garden plant in the 1800s gorse invaded more than 23 million hectares across Australia and currently costs more than $7 million each year in lost farming and forestry production, damage to biodiversity and control activities. This prickly perennial shrub was officially declared a pest in Western Australia in 1976 and since then the department has led efforts to eradicate the weed from farmlands and other areas.
The eradication effort is paying off, with gorse now infesting less than 100 hectares spread over 360 locations (primarily around Albany). The key issue is control of the dormant seedbank, which needs follow-up control for 20–30 years. Department research in 2006 identified two potential seedbank control techniques (microwave radiation and chemical soil treatment) and both
are being studied to produce a method that can be used effectively in the field. On the prevention of new infestations (which are normally associated with the movement of seed-infested soil), the Albany City Council has joined the fight and now imposes a condition on all new development applications that requires soil infested with gorse seed to be disposed of in a manner that prevents establishment of new infestations.
Early in 2009 the National Gorse Taskforce listed gorse as an eradication target in Western Australia and made a commitment to support the eradication project. The completion of the project will mark the first time any state or territory has eradicated one of the top 20 weeds plaguing farmers, land managers and the environment. It will also be an inspiration to other communities and land managers.

Changes to outcome-based management framework
oveRview of the DepARtment
Government goalStronger focus on the regions – greater focus on service delivery, infrastructure investment and economic development to improve the overall quality of life in remote and regional areas
Agency-level government-desired outcomeIncreased competitiveness and profitability of agriculture, food and fibre industries
Service 4 – Rural Business Development CorporationThe department provides services to the Rural Business Development Corporation (RBDC) under a contract for services. This service contributes to the ecological sustainable development of agri-industry by ensuring industry profitability is at least maintained. A key focus is to assist farmers who are significantly impacted by exceptional seasonal events (such as drought and flooding). Further information can be found in the corporation’s Annual Report at www.agric.wa.gov.au/PC_91754.html?s=1062309520
For more than a decade the Department of Agriculture and Food has been charged by government to deliver against three core outcomes. Although appropriate for the nineties, the outcomes no longer reflect changes in the industry, the ongoing challenges facing the sector or the range of services the department is called upon to provide. The department has developed a new strategic plan that aligns our activities against four core outcomes and one support outcome. These outcomes are closely aligned to the government’s goals and
Priority Plan for agriculture and food in Western Australia. The department will also restructure the organisation to more effectively and efficiently deliver its functional responsibilities. A new executive team will be established early in 2009–10.
The department has also revised its performance measures. Full details of the new Agency-level government desired outcomes and their associated performance indictors are reported in the section “Key Performance Indicators” on page 77.
Department of Agriculture and Food | Annual Report 2009 11

Department of Agriculture and Food | Annual Report 2009 12
oveRview of the DepARtment
Shared responsibilities with other agencies
• Natural resource management: The Department of Agriculture and Food is the lead agency and together with the Department of Environment and Conservation aims to ensure that Western Australia has an environment in which resources are managed, developed and used sustainably, biological diversity is preserved, and habitats are protected. 2008–09 was a transition year with the joint natural resource management (NRM) programs NAP and NHT2 being wound down. New delivery arrangements for the replacement program Caring for Our Country (CFOC) will operate on a model of centralised funding decisions on a competitive basis from 2009–10.
The department also delivers a number of services and outcomes under collaborative and/or partnership arrangements including:• animal welfare (promoting livestock stewardship
and inspectorial duties in regional areas) – with the Department of Local Government and Regional Development and the RSPCA
• research and management of European House Borer – with the Forest Products Commission
• development and implementation of the State Water Plan – with the Department of Water
• development of components of the Shared Land Information Platform – with Fire and Emergency Services, the Department of Water, and the Department of Environment and Conservation
• emergency animal disease responses – with Fire and Emergency Services and WA Police
• Pastoral lease inspections – for Pastoral Lands Board (Department for Planning and Infrastructure).
Livestock Compliance Unit now on the beatSeven specially trained stock inspectors are now assisting WA Police in cases of suspected livestock crime through their livestock compliance activities. The inspectors, situated around Western Australia and known collectively as the Livestock Compliance Unit (LCU), monitor saleyards, export depots and abattoirs to ensure stock is correctly identified and their movements have complied with regulations. They use brands, waybills and National Livestock Identification System (NLIS) information to check livestock ownership. Where signs of livestock theft are found, LCU inspectors refer the case to WA Police and assist with livestock expertise when needed.
The inspectors have been trained in evidence gathering and preservation procedures and maintain a database of suspected livestock breaches, investigations, prosecutions and outcomes.
The collaboration between WA Police and the department represents a highly effective and cost-efficient use of resources with each party working in its area of expertise.

Department of Agriculture and Food | Annual Report 2009 13
Report on operations
AGency peRfoRmAnce
The Department of Agriculture and Food uses a program management approach to deliver against its four services—Food and Fibre Industries Development, Agricultural Resource Management, Biosecurity, and services to the Rural Business Development Corporation. Outcomes are delivered state-wide through six directorates.
Directorate Key achievements for 2008–09
Natural Resource Management *
• DepartmentconvenedtheClimate21 Conference— the first major forum held in Western Australia to address climate change
• DevelopedWaterQualityImprovementPlansfortheSwanandCanningriversandthePeel-Harveycatchment
• DevelopedWesternAustralia’sNaturalResourceManagementPlan(StateNRMPlan)andstarteddevelopingtheImplementationStrategy
Biosecurity and Research ** • GeneticallymodifiedcanolatrialsestablishedinWesternAustralia
• DevelopedthePestDetectiveInitiative—encourageschildrentofindandidentifyproblempests(insectsandotherinvasivespecies,includingstarlingsandEuropeanwasps)
• Developedamulti-lingualbrochureaimedatincomingtravellersdetailingquarantinerestrictionsforWesternAustralia
• Sent8animalexperts(veterinaryofficersandstockinspectors)toassistintheVictorianbushfirereliefeffort
Food and Trade Development • ‘Buy West Eat Best’—first restaurant signed up. Now have just over 80 businesses committed to the program
• ProducedtheinauguralissueofWesternAustralianMarket Outlook—an annual publication that provides internal and external clients with the latest information on major Western Australian agrifood export markets
Industry and Rural Services • Catalystfortheformationofasinglepeakorganisationforthegrainsindustry—GrainsIndustryWesternAustralia(GIWA)
• DevelopedtheGascoyneFoodBowlStrategy• UnderstandingGrainMarketing(UGM)coursedevelopedbythedepartmentwithCurtinUniversityandGrainTradeAustraliatogivegrowersskillstotransition to a
deregulated export market system
Policy and Planning • ReviewedthepotentialfordevelopingaMulti-PerilCropInsuranceprograminWesternAustralia
• AchievedBronzeinthe2008LonnieAwardsforexcellenceinannualreporting
Business Services • AchievedWorksafeGoldCertificateinoccupationalsafetyandhealth
• Developedandimplementedaninitiativetoactivelymonitorandreduceenergyconsumptionatthedepartment’sheadquarters
* In accordance with Section 25 F of the Soil and Land Conservation Act 1945, The Commissioner of Soil and Land Conservation’s report on operations for 2009 can be found at Appendix 4.
** Additional information is available in the 2009 Annual Report of the Agriculture Protection Board and the Biosecurity report on operations for 2009.
Quarantine WA achievements 2007–08 2008–09
Number of vehicles checked at Eucla and Kununurra checkpoints 119,960 115,982
Amount of quarantine risk material confiscated at Eucla and Kununurra checkpoints 26,991 kg 28,802 kg
Number of air travellers arriving in Perth 2,348,084 2,505,480
Amount of quarantine risk material voluntarily dumped at airports by arriving travellers 10,673 kg 10,958 kg
Amount of hidden quarantine risk material found by inspectors and detector dogs 2,141 kg 3,017 kg
Number of live animals checked at the Kalgoorlie and Kununurra quarantine facilities 15,669 13,956

Department of Agriculture and Food | Annual Report 2009 14
Sources of fundingWhile the state government remains the major source of funding for the department, other major sources of funding are the Australian Government, a range of industry sources, agreements and fees for services rendered.
This year the Department of Agriculture and Food delivered $272,991,000 of services to Western Australia.
AGency peRfoRmAnce
Nosy dog picks fruitOne little beagle named Deakin bagged a big prize at Perth Domestic Airport by sniffing out an unusually large stash of fruit being carried by an individual passenger from interstate. For the department’s Quarantine WA’s detector dogs, finding the odd couple of apples or bananas in someone’s hand luggage is routine; however, finding 26 mandarins, 18 oranges, four apples, three lemons, three avocados and a few bunches of grapes in the baggage of a single passenger was astonishing.
It’s not just the quantity that represents a colossal risk; it is also the range of different fruits, each of which could host a number of pests and diseases that are not yet present in Western Australia (and which could severely harm our agriculture and horticulture industries, affect our access to international markets and impact on our economy).
When questioned, the passenger said they did not think they needed to declare the fruit because they were going to catch a connecting flight overseas.
Despite quarantine announcements in-flight and on arrival, and despite the brochures and amnesty bins, passengers often only surrender their fruit, vegetables, honey, flowers or other plant material when picked out by a detector dog.
Cwth grants14%
Interest1%
Non-govt grants14%
Fees & charges5%Other revenue
9%
Revenue from State
Government57%
Industrydevelopment
33%
Biosecurity26%
Services to Rural Business Development Corporation
0%
AgricultureResource
Management41%
Expenditure by service (output)

Department of Agriculture and Food | Annual Report 2009 15
0
500
1000
1500
2000
2009(actual)
2009 (target)
20082007200620052004200320022001
17051669
1565 1516 1512 15361604 1565
1449 1436
Financial targets
2008–09 Target (1)
$’000
2008–09 Actual $’000
variation (2)
$’000
Total cost of services (expense limit) 301,477 272,091 29,386
Net cost of services 181,159 152,923 28,236
Total equity 272,013 298,144 (26,131)
Net increase/decrease in cash held (27,058) (19,865) 7,193
Approved full-time equivalent (FTE) staff level 1,591 1,436 155
1 As specified in the department’s budget statements.
2 Explanations are contained in Notes to the Financial Statements section of this annual report.
AGency peRfoRmAnce
2008-09 Target (1)
2008-09 Actual
variation (2)
Service 1: Food and Fibre Industry Development
Desired outcome: Increased competitiveness and profitability of agriculture, food and fibre industries
Key effectiveness indicator(s): Increased competiveness and profitability of agriculture
Strawberry exports (tonnes) 1,200 1,384 13%
Carrot exports (tonnes) 64,000 51,601 -19%
Potato exports (tonnes) 1,700 2,720 37%
Service 2: Agricultural Resource Management
Desired outcome: Improved ecological sustainable development of agri-industry
Key effectiveness indicator(s): Percentage of rangelands primary producers who used selected sustainable land management practices
Preserve or enhanced areas of conservation value
57% 50% -12%
Protected river or creek frontages from grazinganimals
31% 27% -13%
Average cost per information product $15,682 $21,633 38%
Service 3: Biosecurity
Desired outcomes: Effective management of biosecurity
Key effectiveness indicator(s): Identifications of pests, weeds and diseases
Identifications of notifiable animal diseases (number)
5 36 14%
Number of animal diseases identified 3 5 60%
Interceptions of significant pests, diseases and weeds (number)
185 131 -29%
Number of pests, diseases and weed species identified
57 42 -26%
Removal of properties from quarantine (number) 66 58 -12%
1 As specified in the department’s budget statements
2 Explanations for the variations between target and actual results are presented in the detailed Key Performance Indicator Section of this annual report.
Summary of key performance indicators
FTE totals

Department of Agriculture and Food | Annual Report 2009 16
SiGnificAnt iSSueS AnD tRenDS
Issues• Animal welfare – issues associated with the
transport of live animals, the live animal export trade, the growing power of animal rights groups such as PETA (People for the Ethical Treatment of Animals), the use of animals for scientific purposes (such as in methane emission research or breeding sheep with a bare breech)
• Greenhouse gas emissions – some agricultural practices can be significant greenhouse gas producers
• Climate change – rainfall and temperature changes in agricultural regions have reduced groundwater system capacity and increased soil acidification, which leads to reduced productive capacity. On a positive note, reduced rainfall in the wheatbelt has resulted in a slower spread of dryland salinity in the region
• Pest and disease risk – greater numbers of people travelling throughout Australia and the world continues to increase the risk of significant quarantine breaches in Western Australia (including pandemic disease outbreaks such as InfluenzaA(H1N1)
• GM (genetic modification) – this technology has been adopted by most major food-producing regions throughout the world.
Trends• Access to information continues to grow rapidly• The world’s economy continues to globalise• Consumers around the world are increasingly
demanding food security assurances and food miles is an emerging trend
• Governments are becoming increasingly aware of their use of resources such as water and power
• More collaborative national approaches are being taken to manage issues (for example fruit fly, fireants,electricantsandequineinfluenza)andresearch (Western Australia is the lead state in apple breeding and grains research)
• Increasingly issues are being addressed by a whole-of-government approach involving multiple agencies
Opportunities• Building on our leading-edge research and
development through collaborative partnerships• Industry development in the Kimberley and
Carnarvon regions• Food industry development• Biofuel industry development• Regional leadership role• Delivery of rural services for government
Challenges• Developing and maintaining our resource
base to effectively deliver value (staff, budgets, knowledge and technology)
• Ability to demonstrate value• Ability to influence key stakeholders• Being able to deliver services to the greatest
need and in the most efficient manner
Site energy consumption – greening the department initiativeIn recognition of the need to reduce energy consumption in line with the whole-of-government Energy Smart Program, the department introduced a new software energy-tracking tool at its South Perth headquarters and 12 regional offices early in 2009. The tool has a number of simple energy reports that represent real-time energy readings on a daily, monthly and yearly basis.
This initiative has raised awareness among staff members of energy use at each site and the impact their behaviour and activities have on consumption. Many staff members have indicated their attitude to energy consumption has changed as a result of monitoring the times of high and low consumption.
Site Energy Consumption
More Info
73%
Click for Reports
73%

Department of Agriculture and Food | Annual Report 2009 17
Financial statements
DiScloSuReS AnD leGAl compliAnce
Certification of financial statementsThe accompanying financial statements of the Department of Agriculture and Food Western Australia have been prepared in compliance with the provisions of the Financial Management Act 2006 from proper accounts and records to present fairly the financial transactions for the financial year ending 30 June 2009 and the financial position as at 30 June 2009. At the date of signing we are not aware of any circumstances which would render any particulars included in the financial statements misleading or inaccurate.
Ron LucasChief Financial Officer
4 August 2009
Malcolm GoffAccountable Authority
4 August 2009
Table of contents – Financial Statements
Income statement ............................................. 19
Balance sheet ...................................................20
Statement of changes in equity ...................... 21
Cash flow statement ........................................22
Schedule of income and expenses by service for the year ended 30 June 2009 ....................23
Schedule of assets and liabilities by service as at year ended 30 June 2009 ....................... 24
Summary of consolidated account appropriations and income estimates for the year ended 30 June 2009 ....................25
Notes to the financial statements ...................26

Department of Agriculture and Food | Annual Report 2009 18
inDepenDent AuDit opinion

Department of Agriculture and Food | Annual Report 2009 19
income StAtementfor the year ended 30 June 2009
Note 2009$’000
2008$’000
ExpensesEmployee benefits expense 9 135,847 122,378Depreciation and amortisation expense 10 7,739 7,489Supplies and services 11 32,717 34,480Other expenses 12 21,912 23,878Grants and subsidies 13 81,050 122,809Cost of sales 14 386 272Share of loss in joint venture entity using the equity method 25 91 1,113Total cost of services 279,742 312,419
IncomeRevenueSales 14 543 385User charges and fees 15(a) 18,106 16,801Commonwealth grants and contributions 15(b) 32,370 65,660Grants and subsidies from non-Government sources 15(c) 31,739 38,120Interest revenue 15(d) 2,990 4,660Other revenue 15(e) 18,506 13,633Total revenue 104,254 139,259
Gains/(Losses)Gains/(Losses) on disposal of non-current assets 16 89 (817)Gains/(Losses) arising from changes in fair value – Livestock 12 173Other gains 5 89Total gains 106 (555)
Total income other than income from State Government 104,360 138,704
NET COST OF SERvICES 175,382 173,715
INCOME FROM STATE GOvERNMENT 17Service Appropriation 133,610 177,359Resources received free of charge 485 487Total income from State Government 134,095 177,846
SuRPLuS/(DEFICIT) FOR THE PERIOD (41,287) 4,131
The Income Statement should be read in conjunction with the accompanying notes.

Department of Agriculture and Food | Annual Report 2009 20
BAlAnce Sheetas at 30 June 2009
Note2009
$’0002008
$’000
ASSETSCurrent Assets
Cash and cash equivalents 18 31(a) 10,351 22,720Restricted cash and cash equivalents 19 31(a) 44,199 74,412Biological assets 20 2,380 2,348Agricultural produce 300 436Inventories 21 1,947 1,933Receivables 22 14,307 14,552Amounts receivable for services 23 3,365 4,600Other current assets 24(a) 1,000 1,397
Total Current Assets 77,849 122,398Non-Current Assets
Restricted cash and cash equivalents 19 31(a) 1,521 985Amounts receivable for services 23 35,209 31,860Investment accounted for using equity method 25 1,955 22Property, plant and equipment 26 215,936 206,362Financial assets 24(b) 435 570
Total Non-Current Assets 255,056 239,799TOTAL ASSETS 332,905 362,197
LIABILITIESCurrent Liabilities
Payables 28 8,832 19,002Provisions 29 30,222 26,060
Total Current Liabilities 39,054 45,062Non-Current Liabilities
Provisions 29 10,509 7,198Total Non-Current Liabilities 10,509 7,198TOTAL LIABILITIES 49,563 52,260
NET ASSETS 283,342 309,937
EQuITy 30Contributed equity 25,586 23,009Reserves 200,706 188,591Accumulated surplus/(deficiency) 57,050 98,337
TOTAL EQuITy 283,342 309,937
The Balance Sheet should be read in conjunction with the accompanying notes.

Department of Agriculture and Food | Annual Report 2009 21
StAtement of chAnGeS in equityfor the year ended 30 June 2009
Note 2009$’000
2008$’000
Balance of equity at start of period 30 309,937 282,686
CONTRIBuTED EQuITyBalance at start of period 23,009 16,304Capital Contribution 2,577 560Other contributions by owners – 6,145Distributions to owners – –Balance at end of period 25,586 23,009
RESERvESAsset Revaluation ReserveBalance at start of periodInvestments 264 507Non-current assets 188,327 168,204
188,591 168,711
Gains/(losses) from asset revaluationCurrent assets• Investments (218) (243)
(218) (243)Non-current assets• Barrierfence 138 (1,389)• Land 6,798 15,356• Buildings 5,397 6,156
12,333 20,123Total Gains/(losses) from asset revaluation 12,115 19,880Balance at end of period Investments 46 264Non-current assets 200,660 188,327
200,706 188,591ACCuMuLATED SuRPLuS (RETAINED EARNINGS)Balance at start of period 102,712 97,671Changes to accounting policy (4,375) (3,465)Restated balance at start of period 98,337 94,206Surplus/(deficit) for the period (41,287) 4,131Balance at end of period 57,050 98,337
Balance of equity at end of period 30 283,342 309,937Total income and expenses for the period(a) (29,172) 24,011
(a) The aggregate net amount attributable to each category of equity is: deficit $41,287,000 plus gains from asset revaluation of $12,115,000 (2008: surplus $4,131,000 plus gains from asset revaluation of $19,880,000)
The Statement of Changes in Equity should be read in conjunction with the accompanying notes.

Department of Agriculture and Food | Annual Report 2009 22
cASh flow StAtementfor the year ended 30 June 2009
Note2009
$’0002008
$’000
CASH FLOWS FROM STATE GOvERNMENT
Service appropriation 126,896 170,308
Capital contribution 2,577 560
Holding account drawdowns 23 4,600 7,300
Net cash provided by State Government 134,073 178,168
utilised as follows:
CASH FLOWS FROM OPERATING ACTIvITIES
Payments
Employee benefits (133,351) (103,801)
Communications (2,006) (1,871)
Supplies and services (30,711) (35,300)
GST payments on purchases (17,489) (22,076)
GST payments to taxation authority (356) (123)
Other payments (23,558) (14,721)
Grants and subsidies (81,371) (119,498)
Receipts
Sales of goods and services 102,774 120,660
GST receipts on sales 6,135 6,340
GST receipts from taxation authority 12,054 15,538
Net cash provided by/(used in) operating activities 31 (b) (167,879) (154,852)
CASH FLOWS FROM INvESTING ACTIvITIES
Investment in joint venture partnerships and shares (2,082) (2,050)
Purchase of non-current physical assets (6,696) (6,856)
Proceeds from sale of non-current physical assets 539 117
Net cash provided by/(used in) investing activities (8,239) (8,519)
Net increase/(decrease) in cash and cash equivalents (42,045) 14,797
Cash and Cash equivalents at the beginning of period 98,117 83,320
Cash and Cash Equivalents at the end of period 31 (a) 56,071 98,117
The Cash Flow Statement should be read in conjunction with the accompanying notes.

Department of Agriculture and Food | Annual Report 2009 23
ScheDule of income AnD expenSeS By SeRvice for the year ended 30 June 2009
Food & Fibre Industry
Development Biosecurity
Agricultural Resource
ManagementServices
provided to RBDC Total2009
$’0002008
$’0002009
$’0002008
$’0002009
$’0002008
$’0002009
$’0002008
$’0002009
$’0002008
$’000
COST OF SERvICES Expenses
Employee benefits expense 57,396 50,912 49,417 43,981 28,080 26,513 954 972 135,847 122,378Depreciation & amortisation expense 3,483 3,370 2,631 2,546 1,625 1,573 – – 7,739 7,489Supplies and services 13,315 13,607 12,890 13,691 6,512 7,182 – – 32,717 34,480Other expenses 9,713 10,039 7,504 8,939 4,695 4,900 – – 21,912 23,878Grants, subsidies & transfer payments 3,722 3,531 4,962 5,066 72,366 114,212 – – 81,050 122,809Cost of sales – – 386 272 – – – – 386 272Share of loss in joint venture entity using the equity method 91 1,113 – – – – – – 91 1,113Capital User Charge – – – – – – – – – –
Total cost of services 87,720 82,572 77,790 74,495 113,278 154,380 954 972 279,742 312,419
Income Revenue Sales – – 543 385 – – – – 543 385User charges and fees 3,844 3,945 11,284 10,740 2,024 1,144 954 972 18,106 16,801Commonwealth grants and contributions 31,503 763 283 622 584 64,275 – – 32,370 65,660Grants and subsidies from non-Government sources 5,753 18,574 7,899 8,672 18,087 10,874 – – 31,739 38,120Interest revenue 242 237 415 535 2,333 3,888 – – 2,990 4,660Other revenue 9,280 4,506 4,349 4,258 4,877 4,869 – – 18,506 13,633
Total revenue 50,622 28,025 24,773 25,212 27,905 85,050 954 972 104,254 139,259 Gains
Gain on disposal of non-current assets 40 (368) 30 (278) 19 (171) – – 89 (817)Gains arising from changes in fair value - Livestock 5 78 4 59 3 36 – – 12 173Other Gains 2 40 2 30 1 19 – – 5 89
Total Gains 47 (250) 36 (189) 23 (116) – – 106 (555)
Total income other than income from State Government 50,669 27,775 24,809 25,023 27,928 84,934 954 972 104,360 138,704 NET COST OF SERvICES 37,051 54,797 52,981 49,472 85,350 69,446 – – 175,382 173,715
INCOME FROM STATE GOvERNMENT Service Appropriations 45,787 48,611 64,492 68,159 23,331 60,589 – – 133,610 177,359Resources received free of charge 218 219 165 166 102 102 – – 485 487
Total Income from State Government 46,005 48,830 64,657 68,325 23,433 60,691 – – 134,095 177,846 Surplus/(deficit) for the period 8,954 (5,967) 11,676 18,853 (61,917) (8,755) – – (41,287) 4,131
* Rural Business Development CorporationThe Schedule of Income and Expenses by Service should be read in conjunction with the accompanying notes

Department of Agriculture and Food | Annual Report 2009 24
ScheDule of ASSetS AnD liABilitieS By SeRvice as at year ended 30 June 2009
Food & Fibre Industry
Development Biosecurity
Agricultural Resource
ManagementServices provided to
RBDC* Total
2009$’000
2008$’000
2009$’000
2008$’000
2009$’000
2008$’000
2009$’000
2008$’000
2009$’000
2008$’000
ASSETS
Current assets 19,610 22,090 27,901 70,125 30,339 30,183 – – 77,850 122,398
Non-current assets 111,915 105,574 90,913 84,843 52,227 49,382 – – 255,055 239,799
Total assets 131,525 127,664 118,814 154,968 82,566 79,565 – – 332,905 362,197
LIABILITIES
Current liabilities 17,479 18,424 12,857 14,437 8,718 12,201 – – 39,054 45,062
Non-current liabilities 4,729 3,239 3,573 2,447 2,207 1,512 – – 10,509 7,198
Total liabilities 22,208 21,663 16,430 16,884 10,925 13,713 – – 49,563 52,260
NET ASSETS 109,317 106,001 102,384 138,084 71,641 65,852 – – 283,342 309,937
* Rural Business Development Corporation
The Schedule of Assets and Liabilities by Service should be read in conjunction with the accompanying notes

Department of Agriculture and Food | Annual Report 2009 25
SummARy of conSoliDAteD Account AppRopRiAtionS AnD income eStimAteS for the year ended 30 June 2009
Note
2009 Estimate
$’000
2009 Actual
$’000variation
$’000 Note
2009 Actual$’000
2008 Actual$’000
variation$’000
DELIvERy OF SERvICES
Item 48 Net amount appropriated to deliver services 153,684 133,320 (20,364) 133,320 177,077 43,757
Amount authorised by Other Statutes – Salaries & Allowances Act 1975 287 290 3 290 282 (8)
Total appropriations provided to deliver services 36.1 153,971 133,610 (20,361) 36.8 133,610 177,359 43,749
DETAILS OF EXPENSES By SERvICE
Food and Fibre Industry Development 36.2 93,917 87,720 (6,197) 36.9 87,720 82,572 (5,148)
Agricultural Resource Management 36.3 130,277 113,278 (16,999) 36.10 113,278 154,380 41,102
Biosecurity 36.4 64,395 77,790 13,395 36.11 77,790 74,495 (3,295)
Services Provided to Rural Business Development Corporation 34.5 12,888 954 (11,934) 954 972 18
Total Cost of Services 301,477 279,742 (21,735) 279,742 312,419 32,677
Less total income 36.6 (120,318) (104,360) 15,958 36.12 (104,360) (138,704) (34,344)
Net Cost of Services 181,159 175,382 (5,777) 175,382 173,715 (1,667)
Adjustments (i) (27,188) (41,772) 14,584 (41,772) 3,644 45,416
Total appropriations provided to deliver services 153,971 133,610 (20,361) 133,610 177,359 43,749
CAPITAL
Item 143 Capital Contribution
Capital Expenditure
Purchase of non-current physical assets 7,448 7,502 54 36.13 7,502 11,049 3,547
Adjustment for other funding sources (j) (3,724) (4,925) (1,201) 36.14 (4,925) (10,489) (5,564)
Capital Contribution (appropriation) 3,724 2,577 (1,147) 2,577 560 (2,017)
ADMINISTERED TRANSACTIONS
Item 39 Amount provided for Administered Grants, Subsidies & Transfer Payments
Administered capital appropriations 36.7 – 11,308 11,308 36.15 11,308 3,000 (8,308)
Total Administered transactions – 11,308 11,308 11,308 3,000 (8,308)
GRAND TOTAL OF APPROPRIATIONS 157,695 147,495 (10,200) 147,495 180,919 33,424
DETAIL OF INCOME ESTIMATES
Income disclosed as Administered Income. Refer note 45. – 515 515 515 468 (47)
(i) Adjustments are related to movements in cash balances and other accrual items such as receivables, payables and superannuation.
(j) Includes unexpended capital contributions carried forward from last year, contributions from grants and service programs.
The Summary of Consolidated Fund Appropriations, Variances to Budget and Actual should be read in conjunction with the accompanying notes.
This Summary provides the basis for the Explanatory Statement Information requirements of Treasurer’s Instruction, TI 945, set out in note 36

Department of Agriculture and Food | Annual Report 2009 26
noteS to the finAnciAl StAtementS
Index of notes to the financial statements
23. Amounts receivable for services .......................................................47
24. Other and financial assets ..................................................................47
25. Investment accounted for using equity method ..............................48
26. Property, plant and equipment ..........................................................49
27. Impairment of assets ..........................................................................53
28. Payables ...............................................................................................53
29. Provisions .............................................................................................54
30. Equity ....................................................................................................55
31. Notes to the cash flow statement ......................................................58
32. Resources provided free of charge ...................................................59
33. Commitments ......................................................................................60
34. Contingent liabilities and contingent assets .....................................61
35. Events occurring after reporting date ...............................................61
36. Explanatory Statements .....................................................................62
37. Remuneration of senior officers .........................................................65
38. Remuneration of auditor .....................................................................66
39. Related bodies .....................................................................................66
40. Affiliated bodies ...................................................................................66
41. Jointly controlled operations ..............................................................66
42. Financial instruments ..........................................................................67
43. Supplementary information ................................................................72
44. Special Purpose Accounts – Section 16(1)(c) Financial Management Act 2006.......................................................72
45. Administered transactions .................................................................. 74
1. Departmental mission and funding ...................................................27
2. Australian equivalents to International Financial Reporting Standards ..........................................................................27
3. Summary of significant accounting policies .....................................27
4. Disclosure of changes in accounting policy and estimates ..............34
5. Judgments made by management in applying accounting standards .........................................................................35
6. Key sources of estimation uncertainty ..............................................35
7. Memorandum of understanding service costs ................................35
8. Services of the department ...............................................................35
9. Employee benefits expense ...............................................................36
10. Depreciation and amortisation expense ...........................................36
11. Supplies and services .........................................................................37
12. Other expenses ...................................................................................38
13. Grants and subsidies ..........................................................................39
14. Trading profit ........................................................................................39
15. Revenue ...............................................................................................40
16. Net gain/(loss) on disposal of non-current assets ...........................42
17. Income from State Government ........................................................43
18. Cash and cash equivalents ................................................................44
19. Restricted cash and cash equivalents ..............................................44
20. Biological assets ..................................................................................45
21. Inventories ............................................................................................45
22. Receivables ..........................................................................................46

Department of Agriculture and Food | Annual Report 2009 27
noteS to the finAnciAl StAtementS
3. Summary of significant accounting policies(a) General statementThe financial statements constitute a general purpose financial report which has been prepared in accordance with the Australian Accounting Standards, the Framework, Statements of Accounting Concepts and other authoritative pronouncements of the Australian Accounting Standards Board as applied by the Treasurer’s Instructions. Several of these are modified by the Treasurer’s instructions to vary application, disclosure, format and wording. The Financial Management Act 2006 and the Treasurer’s Instructions are legislative provisions governing the preparation of financial statements and take precedence over the Accounting Standards, the Framework, Statements of Accounting Concepts and other authoritative pronouncements of the Australian Accounting Standards Board. Where modification is required and has a material or significant financial effect upon the reported results, details of that modification and the resulting financial effect are disclosed in the notes to the financial statements.
(b) Basis of preparationThe financial statements have been prepared on the accrual basis of accounting using the historical cost convention, modified by the revaluation of land, buildings and infrastructure which have been measured at fair value. The accounting policies adopted in the preparation of the financial statements have been consistently applied throughout all periods presented unless otherwise stated. The financial statements are presented in Australian dollars rounded to the nearest thousand dollars ($’000).
(c) Reporting entityThe department administers assets, liabilities, income and expenses on behalf of government which are not controlled by, nor integral to the function of the department. These administered balances and transactions are not recognised in the principal financial statements of the department but schedules are prepared using the same basis as the financial statements and are presented at note 45(i) ‘Administered expenses and income’ and note 45(ii) ‘Administered assets and liabilities’.
1. Departmental mission and fundingAccelerate the success of agriculture, food and fibre industries through information, science and innovation, responsible management of the resource base, policy and regulation across all elements of the supply chain. The department is predominantly funded by Parliamentary appropriations. The fees charged are determined by prevailing market forces. The financial statements encompass all funds through which the department controls resources to carry on its functions.
(Return to index of notes)
2. Australian equivalents to International Financial Reporting StandardsGeneralThe department’s financial statements for the year ended 30 June 2009 have been prepared in accordance with Australian equivalents to International Financial Reporting Standards (AIFRS), which comprise a Framework for the Preparation and Presentation of Financial Statements (the Framework) and Australian Accounting Standards (including the Australian Accounting Interpretations). In preparing these financial statements the department has adopted, where relevant to its operations, new and revised Standards and Interpretations from their operative dates as issued by the Australian Accounting Standards Board (AASB) and formerly the Urgent Issues Group (UIG).
Early adoption of standardsThe department cannot early adopt an Australian Accounting Standard or Australian Accounting Interpretation unless specifically permitted by TI 1101 ‘Application of Australian Accounting Standards and Other Pronouncements’. No Standards and Interpretations that have been issued or amended but are not yet effective have been early adopted by the department for the annual reporting period ended 30 June 2009.
(Return to index of notes)

noteS to the finAnciAl StAtementS
Department of Agriculture and Food | Annual Report 2009 28
(d) Contributed equityAASB Interpretation 1038 ‘Contributions by Owners Made to Wholly-Owned Public Sector Entities’ requires transfers, other than as a result of a restructure of administrative arrangements, in the nature of equity contributions to be designated by the government (the owner) as contributions by owners (at the time of, or prior to transfer) before such transfers can be recognised as equity contributions. Capital contributions (appropriations) have been designated as contributions by owners by Treasurer’s Instruction (TI) 955 ‘Contributions by Owners made to Wholly Owned Public Sector Entities’ and have been credited directly to Contributed Equity. Transfer of net assets to/from other agencies, other than as a result of a restructure of administrative arrangements, is designated as contributions by owners where the transfers are non discretionary and non reciprocal. See note 30 ‘Equity’.
(e) Income
Revenue recognitionRevenue is measured at the fair value of consideration received or receivable. Revenue is recognised for the major business activities as follows:
Sale of goodsRevenue is recognised from the sale of goods and disposal of other assets when the significant risks and rewards of ownership control transfer to the purchaser and can be measured reliably.
Rendering of servicesRevenue is recognised on delivery of the service or by reference to the stage of completion of the transaction.
InterestRevenue is recognised as the interest accrues.
Service AppropriationsService Appropriations are recognised as revenues in the period in which the department gains control of the appropriated funds. The department gains control of appropriated funds at the time those funds are deposited into the department’s bank account or credited to the holding account held at Treasury. See note 17 ‘Income from State Government’ for further details.
Net Appropriation DeterminationThe Treasurer may make a determination providing for prescribed receipts to be retained for services under the control of the department. In accordance with the determination specified in the 2008-09 Budget Statements, the department retained $106.08 million in 2009 ($143.85m in 2008) from the following:• proceeds from fees and charges;• Commonwealth specific purpose grants and contributions;• one-off revenues with a sale of less than $10,000 derived from the
sale of property other than real property;• revenues from services provided though the establishment of
Memorandum of Understandings; and• other departmental revenue.
Grants and other contributions revenueRevenue is recognised at fair value when the department obtains control over the assets comprising the contributions which is usually when cash is received. Other non-reciprocal contributions that are not contributions by owners are recognised at their fair value. Contributions of services are only recognised when a fair value can be reliably determined and the services would be purchased if not donated.
GainsGains may be realised or unrealised and are usually recognised on a net basis. These include gains arising on the disposal of non-current assets and some revaluations of non-current assets.
(f) Property, plant and equipment
Initial recognition and measurementThe cost method of accounting is used for all acquisitions of assets. Cost is measured as the fair value of the assets given up or liabilities undertaken at the date of acquisition plus incidental costs directly attributable to the acquisition. Assets acquired at no cost or for nominal consideration, are initially recognised at their fair value at the date of acquisition.

noteS to the finAnciAl StAtementS
Department of Agriculture and Food | Annual Report 2009 29
Capitalisation/expensing of assetsItems of property, plant and equipment and infrastructure costing over $5,000 are recognised as assets and the cost of utilising assets is expensed (depreciated) over their useful lives. Items of property, plant and equipment and infrastructure costing less than $5,000 are immediately expensed direct to the Income Statement (other than where they form part of a group of similar items which are significant in total).
Subsequent measurementAfter recognition as an asset, the department uses the revaluation model for the measurement of land, buildings and infrastructure and the cost model for all other property, plant and equipment. Land, buildings and infrastructure are carried at fair value less accumulated depreciation on buildings and infrastructure and accumulated impairment losses. All other items of property, plant and equipment are carried at historical cost less accumulated depreciation and accumulated impairment losses. Where market based evidence is available, the fair value of land and buildings is determined on the basis of current market buying values determined by reference to recent market transactions. When buildings are revalued by reference to recent market transactions, the accumulated depreciation is eliminated against the gross carrying amount of the asset and the net amount restated to the revalued amount. Where market based evidence is not available, the fair value of land and buildings is determined on the basis of existing use. This normally applies where buildings are specialised or where land use is restricted. Fair value for existing use assets is determined by reference to the cost of replacing the remaining future economic benefits embodied in the asset, that is, the depreciated replacement cost. Where the fair value of buildings is dependent on using the depreciated replacement cost, the gross carrying amount and the accumulated depreciation are restated proportionately. Independent valuations of land and buildings are provided annually by the Western Australian Land Information Authority (Valuation Services) and recognised with sufficient regularity to ensure that the carrying amount does not differ materially from the asset’s fair value at the balance sheet date. The most significant assumptions in estimating fair value are made in assessing whether to apply the existing use basis to assets and in determining estimated useful life. Professional judgment by the valuer is required where the evidence does not provide a clear distinction between market type assets and existing use assets.
Refer to note 26 ‘Property, plant and equipment’ for further information on revaluations.
DerecognitionUpon disposal or derecognition of an item of property, plant and equipment, any revaluation reserve relating to that asset is retained in the asset revaluation reserve.
Asset revaluation reserveThe asset revaluation reserve is used to record increments and decrements on the revaluation of non-current assets as described in note 26 ‘Property, plant and equipment’.
DepreciationAll non-current assets having a limited useful life are systematically depreciated over their useful lives in a manner which reflects the consumption of their future economic benefits. Land is not depreciated. Depreciation on other assets is calculated using the straight line method, using rates which are reviewed annually. Estimated useful lives for each class of depreciable asset are:
Buildings 20–40 yearsVehicles & transportation equipment 8 yearsIT equipment 4 yearsFurniture & fittings 10 yearsPlant & equipment 5–10 yearsOffice equipment 5–10 yearsFarm equipment 10 yearsLaboratory & scientific equipment 5 yearsState Barrier Fence 20 years
(g) Impairment of assetsProperty, plant and equipment are tested for any indication of impairment at each reporting date. Where there is an indication of impairment, the recoverable amount is estimated. Where the recoverable amount is less than the carrying amount, the asset is considered impaired and is written down to the recoverable amount and an impairment loss is recognised. As the department is a not-for-profit entity, unless an asset has been identified as a surplus asset, the recoverable amount is the higher of an asset’s fair value less costs to sell and depreciated replacement cost. The risk to impairment is generally limited to circumstances where an asset’s depreciation is materially understated where the replacement cost is falling or where there is a significant change in useful life.

noteS to the finAnciAl StAtementS
Department of Agriculture and Food | Annual Report 2009 30
Each relevant class of asset is reviewed annually to verify that the accumulated depreciation/amortisation reflect the level of consumption or expiration of the asset’s future economic benefits and to evaluate any impairment risk from falling replacement costs. For assets identified as surplus assets, the recoverable amount is the higher of fair value less costs to sell and the present value of future cash flows expected to be derived from the asset. Surplus assets carried at fair value have no risk of material impairment where fair value is determined by reference to market-based evidence. Where fair value is determined by reference to depreciated replacement cost, surplus assets are at risk of impairment and the recoverable amount is measured. Surplus assets at cost are tested for indications of impairment at each reporting date. See note 27 ‘Impairment of Assets’. Refer also to note 3(n) ‘Receivables’ and note 22 ‘Receivables’.
(h) Non-current assets (or disposal groups) classified as held for sale
Non-current assets (or disposal groups) held for sale are recognised at the lower of carrying amount and fair value less costs to sell and are presented separately in the Balance Sheet. Assets classified as held for sale are not depreciated or amortised. All land holdings are Crown land vested in the department by the government. The Department of Planning (DOP) is the only agency with the power to sell Crown land. The department transfers Crown land and any attaching buildings to DOP when the land becomes available for sale.
(i) Inventories and biological assetsBiological assets comprising of livestock and field crops are valued at fair value less estimated point of sale costs and costs necessary to get them to market. A gain or loss on valuation is recognised in the income statement. See note 20 ‘Biological assets’. Raw material and stores are measured at the lower of cost and net realisable value. See note 21 ‘Inventories’.
(j) ProvisionsProvisions are liabilities of uncertain timing and amount and are recognised where there is a present legal, equitable or constructive obligation as a result of a past event and when the outflow of resources embodying economic benefits is probable and a reliable estimate can be made of the amount of the obligation. Provisions are reviewed at each balance sheet reporting date. See note 29 ‘Provisions’.
Provisions – employee benefits(i) Annual leave and long service leaveThe liability for annual and long service leave expected to be settled within 12 months after the balance sheet date is recognised and measured at the undiscounted amounts expected to be paid when the liabilities are settled. Annual and long service leave expected to be settled more than 12 months after the reporting date is measured at the present value of amounts expected to be paid when the liabilities are settled. Leave liabilities are in respect of services provided by employees up to the reporting date. When assessing expected future payments consideration is given to expected future wage and salary levels including non-salary components such as employer superannuation contributions. In addition, the long service leave liability also considers the experience of employee departures and periods of service. The expected future payments are discounted using market yields at the reporting date on national government bonds with terms to maturity that match, as closely as possible, the estimated future cash outflows. A liability for long service leave is recognised after an employee has completed four years of service. An actuarial assessment of long service leave undertaken by PricewaterhouseCoopers Actuaries in 2009 determined that the liability measured using the short-hand method was not materially different from the liability measured using the present value of expected future payments.
(ii) Sick leaveLiabilities for sick leave are recognised when it is probable that sick leave paid in the future will be greater than the entitlement that will accrue in the future. Past history indicates that on average, sick leave taken each reporting period is less than the entitlement accrued. This is expected to continue in future periods. Accordingly, it is unlikely that existing accumulated entitlements will be used by employees and no liability for unused sick leave entitlements is recognised. As sick leave is non vesting, an expense is recognised in the income statement for this leave as it is taken.
(iii) SuperannuationThe Government Employees Superannuation Board (GESB) in accordance with legislative requirements administers public sector superannuation arrangements in Western Australia. Employees may contribute to the Pension Scheme, a defined benefit pension scheme now closed to new members or the Gold State Superannuation Scheme (GSS), a defined benefit lump sum scheme also closed to new members. The department has no liabilities for superannuation

noteS to the finAnciAl StAtementS
Department of Agriculture and Food | Annual Report 2009 31
charges under the Pension or the GSS Schemes as the liability has been assumed by the Treasurer. Employees commencing employment prior to 16 April 2007 who were not members of either the Pension or the GSS Schemes became non contributory members of the West State Superannuation Scheme (WSS). Employees commencing employment on or after 16 April 2007 became members of the GESB Super Scheme (GESBS). Both of these schemes are accumulation schemes. The department makes concurrent contributions to GESB on behalf of employees in compliance with the Commonwealth Government’s Superannuation Guarantee (Administration) Act 1992. These contributions extinguish the liability for superannuation charges in respect of the WSS and GESBS Schemes. The GESB makes all benefit payments in respect of the Pension and GSS Schemes, and is recouped by the Treasurer for the employer’s share. See note 9 ‘Employee benefit expense’.
(iv) Provisions – otherEmployee on-costsEmployment on-costs, including workers’ compensation insurance, are not employee benefits and are recognised separately as liabilities and expenses when the employment to which they relate has occurred. Employment on-costs are included as part of ‘Other expenses’ and are not included as part of the department’s ‘Employee benefits expense’. The related liability is included in ‘Employment on-costs provision’. See note 12 ‘Other Expenses’ and note 29 ‘Provisions’.
Deferred leaveThe provision for deferred leave relates to Public Service employees who have entered into an agreement to self-fund an additional twelve months leave in the fifth year of the agreement. The provision recognises the value of salary set aside for employees to be used in the fifth year. This liability is measured on the same basis as annual leave. Deferred leave is reported as a non-current provision until the fifth year.
Purchased leaveThe provision for purchased leave relates to Public Service employees who have entered into an agreement to self-fund up to an additional four weeks leave per calendar year. The provision recognises the value of salary set aside for employees and is measured at the nominal amounts expected to be paid when the liabilities are settled. This liability is measured on the same basis as annual leave.
(k) Superannuation expenseThe following elements are included in calculating the superannuation expense in the Income Statement:
(a) Defined benefit plans – For 2007–08 the change in the unfunded employer’s liability (i.e. current service cost and, actuarial gains and losses) assumed by the Treasurer in respect of current employees who are members of the Pension Scheme and current employees who accrued a benefit on transfer from that Scheme to the Gold State Superannuation Scheme (GSS); and
(b) Defined contribution plans – Employer contributions paid to the GSS (concurrent contributions), the West State Superannuation Scheme (WSS), and the GESB Super Scheme (GESBS).
Defined benefit plans – For 2007–08 the movements (i.e. current service cost and, actuarial gains and losses) in the liabilities in respect of the Pension Scheme and the GSS Scheme transfer benefits are recognised as expenses directly in the Income Statement. As these liabilities are assumed by the Treasurer—refer note 17 (III), a revenue titled ‘Liabilities assumed by the Treasurer’ equivalent to the expense is recognised under Income from State Government in the Income Statement. See note 17 ‘Income from State Government’. Commencing in 2008–09, the reporting of annual movements in these notional liabilities has been discontinued and is no longer recognised in the Income Statement.
Defined contribution plans – in order to reflect the department’s true cost of services; the department is funded for the equivalent of employer contributions in respect of the GSS Scheme (excluding transfer benefits). These contributions were paid to the GESB during the year and placed in a trust account administered by the GESB on behalf of the Treasurer. The GESB subsequently paid these employer contributions in respect of the GSS Scheme to the Consolidated Account. The GSS Scheme is a defined benefit scheme for the purposes of employees and whole of government reporting. However, apart from the transfer benefit, it is a defined contribution plan for agency purposes because the concurrent contributions (defined contributions) made by the agency to GESB extinguishes the agency’s obligations to the related superannuation liability.

Department of Agriculture and Food | Annual Report 2009 32
noteS to the finAnciAl StAtementS
(l) Financial instrumentsIn addition to cash the department has three categories of financial instrument:• Loans and receivables• Financial liabilities measured at amortised cost; and• Available for sale financial assets.These have been disaggregated into the following classes:
Financial assets− Cash and cash equivalents− Restricted cash and cash equivalents− Receivables− Amounts receivable for services− Investments
Financial liabilities− Payables
Initial recognition and measurement of financial instruments is at fair value which normally equates to the transaction cost or the face value. Subsequent measurement is at amortised cost using the effective interest method. The fair value of short-term receivables and payables is the transaction cost or the face value because there is no interest rate applicable and subsequent measurement is not required as the effect of discounting is not material. See note 42 ‘Financial Instruments’.
(m) LeasesThe department has entered into a number of operating lease arrangements for motor vehicles, buildings and office equipment where the lessors effectively retain all of the risks and benefits incidental to ownership of the items held under the operating leases. Lease payments are expensed on a straight line basis over the lease term as this represents the pattern of benefits derived from the leased properties.
(n) ReceivablesReceivables are recognised and carried at original invoice amount less an allowance for uncollectible amounts (i.e. impairment). The collectability of receivables is reviewed on an ongoing basis and any receivables identified as uncollectible are written off against the allowance account. The allowance for uncollectible amounts (doubtful debts) is raised when there is objective evidence that the department will not be able to collect the debts. The carrying amount is equivalent to fair value as it is due for settlement within 30 days. See note 42 ‘Financial Instruments’ and note 22 ‘Receivables’.
(o) Accrued salariesThe accrued salaries suspense account (see note 19 ‘Restricted cash and cash equivalents’) consists of amounts paid annually into a suspense account over a period of 10 financial years to largely meet the additional cash outflow in each eleventh year when 27 pay days occur in that year instead of the normal 26. No interest is received on this account. Accrued salaries represent the amount due to staff but unpaid at the end of the financial year, as the pay date for the last pay period for that financial year does not coincide with the end of the financial year. Accrued salaries are settled within a fortnight of the financial year end. The department considers the carrying amount of accrued salaries to be equivalent to the net fair value. See note 28 ‘Payables’.
(p) PayablesPayables are recognised when the department becomes obliged to make future payments as a result of a purchase of goods or services. The carrying amount is equivalent to fair value, as they are generally settled within 30 days. See note 42 ‘Financial Instruments’ and note 28 ‘Payables’.
(q) Joint ventures
Jointly controlled operationsInterests in joint venture operations have been reported in the financial report including the department’s share of assets employed in the joint ventures, the share of liabilities incurred in relation to the joint ventures and the share of any expenses incurred in relation to the joint ventures in their respective classification categories. Details of the department’s interest in assets are set out in Note 25 ‘Investment accounted for using equity method’ and Note 41 ‘Jointly controlled operations’.
Joint venture entitiesThe interest in a joint venture partnership is accounted for in the department’s financial statements using the equity method. Under the equity method, the share of the profit or losses of the partnership is recognised in the income statement, and the share of movements in reserves is recognised in reserves in the balance sheet. Details relating to the partnership are set out in note 25 ‘Investment accounted for using equity method’.

Department of Agriculture and Food | Annual Report 2009 33
noteS to the finAnciAl StAtementS
(r) Amounts receivable for services (Holding Account)The department receives appropriation funding on an accrual basis that recognises the full annual cash and non-cash cost of services. The appropriations are paid partly in cash and partly as an asset (Holding Account receivable) that is accessible on the emergence of the cash funding requirement to cover items such as leave entitlements and asset replacement. See also note 17 ‘Income from State Government’ and note 23 ’Amounts receivable for services’
(s) Cash and cash equivalentsFor the purpose of the Cash Flow Statement, cash and cash equivalents include cash assets and restricted cash assets. These include cash on hand; short-term deposits with original maturities of 3 months or less that are readily convertible to cash on hand and are subject to insignificant risk of changes in value.
(t) Financial assetsThe Department’s investments in shares are classified as available-for-sale Financial assets. Subsequent to initial recognition, they are measured at Fair Value and changes therein, other than impairment losses, are recognised directly in a separate component of equity. When an investment is derecognised, the cumulative gain or loss in equity is transferred to profit or loss. See note 24 (b)
(u) Research and development costsResearch and development costs are charged against income in the Statement of Financial Performance as incurred, except to the extent that such costs, together with unamortised deferred costs in relation to a project, are expected, beyond reasonable doubt, to be recoverable
(v) Resources received free of charge or for nominal costResources received free of charge or for nominal value which can be reliably measured are recognised as income and as assets or expenses as appropriate at fair value.
(w) Comparative figuresComparative figures are, where appropriate, reclassified to be comparable with the figures presented in the current financial year.
The following amounts in prior year have been reclassified to comply with AASB 101 “Presentation of financial statement”.
Audited amount
$’000
Reclassified amount
$’000
Other non current assets 5,941 –
Financial assets – 570
Property, plant and equipment 205,366 210,737 (a)
(a) This figure has been re-stated to $206,362,000 as a result of change in assets, capitalisation threshold.
(x) Revaluation of land, buildings and State Barrier Fence
Valuation of non-current assetsThe department has a policy of valuing land and buildings at fair value. The annual revaluations of the department’s land and buildings undertaken by the Land Information Authority (Valuation Services) are recognised in the financial statements. See note 26 ‘Property, plant and equipment’.
(y) Goods and Services TaxIn accordance with the grouping provisions the right to receive GST and the obligation to pay GST rests with the Department of Agriculture and Food in regard to all GST transactions incurred by members of the group. As a result separate GST transactions are not recognised within the individual members’ financial statements as they are all brought to account in the Department of Agriculture and Food’s financial statements.
(Return to index of notes)

noteS to the finAnciAl StAtementS
Department of Agriculture and Food | Annual Report 2009 34
4. Disclosure of changes in accounting policy and estimatesInitial application of an Australian Accounting StandardThe department has applied the following Australian Accounting Standards and Australian Accounting Interpretations effective for annual reporting periods beginning on or after 1 July 2008 that impacted on the department:
Review of AAS 27 ‘Financial Reporting by Local Governments’, AAS 29 ‘Financial Reporting by Government Departments’ and AAS 31 ‘Financial Reporting by Governments’. The AASB has made the following pronouncements from its short-term review of AAS 27, AAS 29 and AAS 31:• AASB 1004 ‘Contributions’• AASB 1050 ‘Administered Items’• AASB 1052 ‘Disaggregated Disclosures’• AASB 2007-9 ‘Amendments to Australian Accounting Standards
arising from the review of AASs 27, 29 and 31 [AASB 3, AASB 5, AASB 8, AASB 101, AASB 114, AASB 116, AASB 127 & AASB 137]
• Interpretation 1038 ‘Contributions by Owners Made to Wholly-Owned Public Sector Entities’.
The existing requirements in AAS 27, AAS 29 and AAS 31 have been transferred to the above new and revised topic-based Standards and Interpretation. These requirements remain substantively unchanged. The new and revised Standards and Interpretation make some modifications to disclosures and provide additional guidance.
voluntary changes in accounting policyAs at 1 July 2008 the department is required to apply Treasurer’s Instructions 1101 (14)(ii) with respect to the asset capitalisation threshold. The department has increased its threshold from $1,000 to $5,000 for its Properties, Plant and Equipment to meet the Treasurer’s Instructions. The change in accounting policy has been accounted for under AASB 108 “Accounting Policies, Changes in Accounting Estimates and Errors”. See note 30 “Equity”.
Future impact of Australian Accounting Standards not yet operativeThe department cannot adopt Australian Accounting Standard or Australian Accounting Interpretation unless specifically permitted by TI 1101 ‘Application of Australian Accounting Standards and Other Pronouncements’. Consequently the department has not applied early the following Australian Accounting Standards and Australian Accounting Interpretations and Australian Accounting Interpretations that have been issued and which may impact the department but are not yet effective. Where applicable, the department plans to apply these Standards and Interpretations from their application date. The following standards are:(a) to be applied to annual reporting periods beginning on or after 1 July
2009;• AASB 2008-13 ‘Amendments to Australian Accounting Standards
arising from AASB Interpretation 17 – Distributions of Non-cash Assets to Owners [AASB 5 & AASB 110]. This Standard amends AASB 5 ‘Non-current Assets Held for Sale and Discontinued Operations’ in respect of the classification, presentation and measurement of non-current assets held for distribution to owners in their capacity as owners. This may impact on the presentation and classification of Crown land held by the Department where the Crown land is to be sold by the Department of Planning. The department does not expect any financial impact when the Standard is first applied prospectively.
(b) to be applied to annual reporting periods beginning on or after 1 January 2009:
• AASB 101 ‘Presentation of Financial Statements’ (September 2007). This Standard has been revised and will change the structure of the financial statements. These changes will require that owner changes in equity are presented separately from non-owner changes in equity. The Department does not expect any financial impact when the Standard is first applied.
• AASB 2009-2 ‘Amendments to Australian Accounting Standards – Improving Disclosures about Financial Instruments [AASB 4, AASB 7, AASB 1023 & AASB 1038]’. This Standard amends AASB 7 and will require enhanced disclosures about fair value measurements and liquidity risk with respect to financial instruments. The Authority does not expect any financial impact when the Standard is first applied.
• AASB 2008-7 ‘Amendments to Australian Accounting Standards – Cost of an Investment in a Subsidiary, Jointly Controlled Entity or Associate [AASB 1, AASB 121, AASB 127 & AASB 136]’.
(Return to index of notes)

Department of Agriculture and Food | Annual Report 2009 35
noteS to the finAnciAl StAtementS
5. Judgments made by management in applying accounting standardsNo significant judgment has been made in the process of applying accounting policies that have a material effect on the amounts recognised in the financial statements.
(Return to index of notes)
6. Key sources of estimation uncertaintyThe key estimates and assumptions made concerning the future and other key sources of estimation at the balance sheet date that have significant risk of causing a material adjustment to the carrying of assets and liabilities within the next financial year include:
Provision for employee benefitsSeveral estimations are used in the calculation for the provision of employee benefits. These include future salary rates, workforce demographics and the discount rates used. The salary rates used for the valuation at 30 June 2009 reflect the then current employer offer. There is uncertainty in the above elements that could affect the provision.
(Return to index of notes)
7. Memorandum of understanding service costsThe Department of Agriculture and Food has a memorandum of understanding with the Agriculture Protection Board, the Agricultural Produce Commission and the Rural Business Development Corporation. The objective of these arrangements is to establish the types and standards of services to be provided, the basis for determining the level and the costs of services and responsibilities of the parties to the memorandum.
(Return to index of notes)
8. Services of the departmentInformation about the department’s services is set out in the Schedule of Expenses and Revenues by Service. Information about the department’s administered expenses, revenues, assets and liabilities is set out in note 45 ‘Administered Transactions’. The four key services of the department:
Service 1 – Food and Fibre Industry DevelopmentGeneration, integration and application of knowledge which, together with appropriate industry policy, increases the international competitiveness and market opportunities for state agriculture, food and fibre industries.
Service 2 – Agricultural Resource ManagementGeneration, integration and application of knowledge which together with appropriate investment, policy and regulation develops the capacity of rural communities and industries to profit from environmentally responsible agriculture.
Service 3 – BiosecurityGeneration, integration and application of knowledge, policy and regulation to ensure the agriculture and related resources are protected and that safety and quality standards are upheld.
Service 4 – Services provided to Rural Business Development Corporation of Western AustraliaProvision of contractual services to the Rural Business Development Corporation to assist farmers to enhance their skills, leading to improved sustainable long-term profitability and better capacity to deal with risks inherent in farming.
(Return to index of notes)

Department of Agriculture and Food | Annual Report 2009 36
9. Employee benefits expense2009
$’0002008
$’000
Wages & salaries (a) 108,306 101,583
Superannuation – defined contribution plans(b) 10,456 9,184
Change in long service leave provision (c) 4,861 743
Change in annual leave provision (c) 1,514 307
Memorandum of understanding service costs
Agriculture Protection Board 2,196 1,278
Rural Business Development Corporation 954 972
Other related expenses 7,560 8,311
135,847 122,378
(a) Includes the value of the fringe benefit to the employee plus the fringe benefits tax component.(b) Defined contribution plans include West State, Gold State and GESB Super Scheme (contributions paid).(c) Includes a superannuation contribution component.
(Return to index of notes)
10. Depreciation and amortisation expense2009
$’0002008
$’000
Barrier fence 238 311
Plant & equipment 2,346 2,226
IT equipment 675 942
Furniture & fittings 26 35
Vehicles & transportation equipment 774 715
Buildings 3,680 3,260
7,739 7,489
(Return to index of notes)
noteS to the finAnciAl StAtementS

Department of Agriculture and Food | Annual Report 2009 37
11. Supplies and services2009
$’0002008
$’000
Consultants and contractors 11,033 13,935
Communications 2,006 1,910
Other 8,951 8,937
Lease or rent payments 5,854 4,810
Resources received free of charge (see note 17) 485 487
Memorandum of understanding service costs
Agriculture Protection Board 4,330 4,307
Agricultural Produce Commission 58 94
32,717 34,480
(Return to index of notes)
noteS to the finAnciAl StAtementS

Department of Agriculture and Food | Annual Report 2009 38
12. Other expenses2009
$’0002008
$’000
Maintenance & repairs 6,489 7,287
Expensed assets 2,087 2,105
Employment on-costs (a) 1,124 332
Supplies Expenses 6,101 5,651
Electricity, gas & fuel, water 2,123 2,079
GROH housing subsidies 1,949 1,839
Recoups to external funds 513 656
Stock movement 368 329
Change to provision for doubtful debts 277 25
Bad debts expense 5 15
Provision for impairment expense (b) (17) 1,505
Other (c) 893 2,055
21,912 23,878
(a) Includes workers’ compensation insurance and other employment on-costs. The on-costs liability associated with the recognition of annual and long service leave liability is included at note 29 ‘Provisions’ Superannuation contributions accrued as part of the provision for leave are employee benefits and are not included in employment on-costs.
(b) Refer note 25 ‘Investment accounted for using equity method’ and note 22 ‘Receivables’.(c) Include audit fee, see also note 38 ‘Remuneration of auditor’.
(Return to index of notes)
noteS to the finAnciAl StAtementS
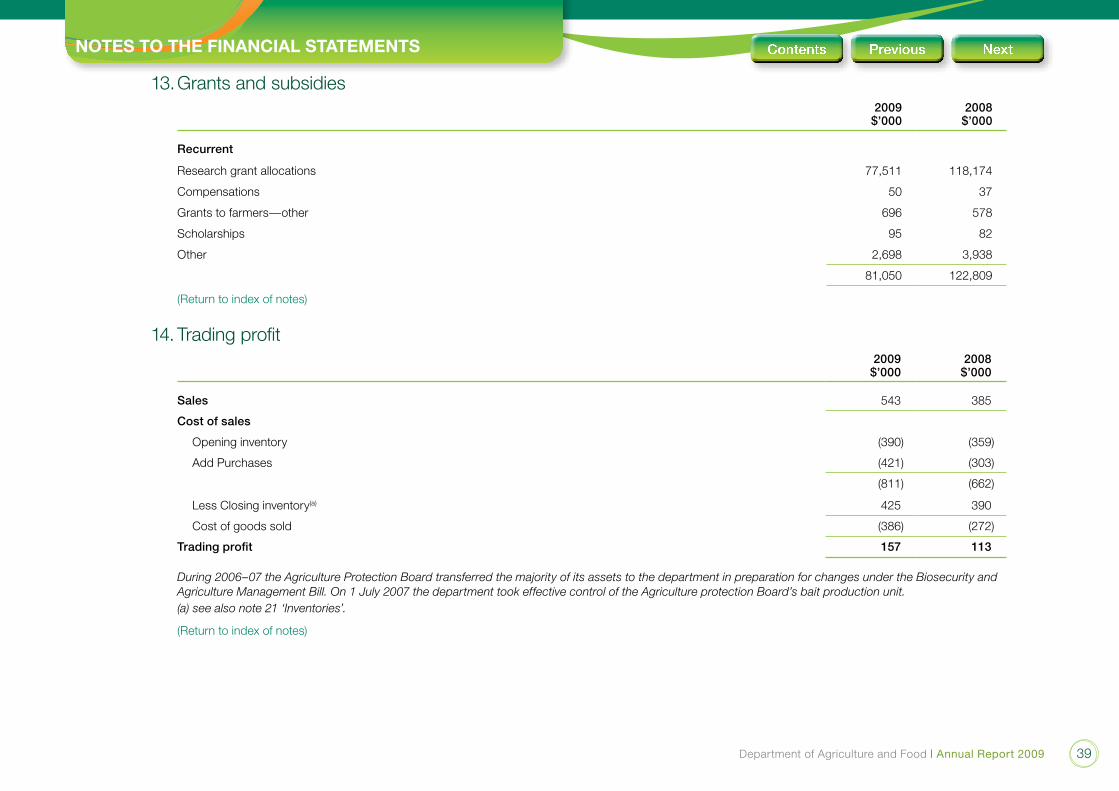
Department of Agriculture and Food | Annual Report 2009 39
13. Grants and subsidies2009
$’0002008
$’000
Recurrent
Research grant allocations 77,511 118,174
Compensations 50 37
Grants to farmers—other 696 578
Scholarships 95 82
Other 2,698 3,938
81,050 122,809
(Return to index of notes)
14. Trading profit2009
$’0002008
$’000
Sales 543 385
Cost of sales
Opening inventory (390) (359)
Add Purchases (421) (303)
(811) (662)
Less Closing inventory(a) 425 390
Cost of goods sold (386) (272)
Trading profit 157 113
During 2006–07 the Agriculture Protection Board transferred the majority of its assets to the department in preparation for changes under the Biosecurity and Agriculture Management Bill. On 1 July 2007 the department took effective control of the Agriculture protection Board’s bait production unit.(a) see also note 21 ‘Inventories’.
(Return to index of notes)
noteS to the finAnciAl StAtementS

Department of Agriculture and Food | Annual Report 2009 40
15. Revenue2009
$’0002008
$’000
(a) user charges and fees
Sale of goods & services 10,568 10,150
Memorandum of understanding service costs
Agriculture Protection Board 6,526 5,585
Agricultural Produce Commission 58 94
Rural Business Development Corporation 954 972
18,106 16,801
(b) Commonwealth grants and contributions
Commonwealth Agriculture Activity Grants 2,882 2,714
National Action Plan for Salinity – 39,098
National Landcare Program 68 3,349
Natural Heritage Trust Fund 29,420 20,499
32,370 65,660
(c) Grants and subsidies from non-government sources
Agriculture Research Grants Account No. 1
Rural Industry Research Funds
Meat and Livestock Australia 515 636
Cotton Research and Development Corporation 200 –
Dairy Research and Development Corporation 370 319
Grains Research and Development Corporation 7,646 8,239
Grape and Wine Research Corporation 18 70
Land and Water Resources Research and Development Corporation 60 429
Rural Industry Research and Development Corporation 183 351
Sugar Research and Development Corporation 56 56
Australian Wool Innovation Pty Ltd 929 695
Australian Centre for International Agricultural Research 1,975 814
noteS to the finAnciAl StAtementS

Department of Agriculture and Food | Annual Report 2009 41
2009$’000
2008$’000
(c) Grants and subsidies from non-government sources (continued)
Agriculture Research Grants Account No. 1
Australian Pork Limited 7 42
Land Conservation District Fund 32 113
Plant Health Australia 163 –
Centre for Legumes in Mediterranean Agriculture 80 87
National Landcare Program Third Party Grants – 197
CRC Research Grants 2,761 2,918
Commercial Grants 9,057 9,797
NRM 3rd Party Funding Grants 246 79
NRM State Funding Grants – 1,941
24,298 26,783
Agriculture Research Grants Account No. 2
Horticulture Industry 1,749 1,282
NRM 3rd Party Funding Grants 4,262 8,294
Commercial Grants 461 676
6,472 10,252
Governmental operating & special purpose accounts
Plant Research and Development – 33
– 33
Other grants & subsidies 969 1,052
Total grants and subsidies from non-Government Sources 31,739 38,120
(d) Interest revenue
Interest received 2,990 4,660
15. Revenue (continued)
noteS to the finAnciAl StAtementS

Department of Agriculture and Food | Annual Report 2009 42
2009$’000
2008$’000
(e) Other revenue
Levies, rates and licenses 1,144 1,169
Return of grant allocations 13,036 10,121
Royalties 3,238 1,914
Other 1,088 429
18,506 13,633
(Return to index of notes)
16. Net gain/(loss) on disposal of non-current assets2009
$’0002008
$’000
Cost on disposal of non-current assets
Land 8 490
Buildings 107 369
Vehicles and transportation equipment 109 39
IT equipment 12 16
Plant and equipment 214 20
450 934
Proceeds on the disposal of non-current assets
Land 6 -
Buildings 12 -
Vehicles and transportation equipment 294 67
IT equipment 1 22
Plant and equipment 226 28
539 117
Gain/(losses) on disposal of non-current assets 89 (817)
(Return to index of notes)
15. Revenue (continued)
noteS to the finAnciAl StAtementS

Department of Agriculture and Food | Annual Report 2009 43
17. Income from State Government2009
$’0002008
$’000
Appropriation revenue received during the year
Service appropriations (I) 133,610 177,359
133,610 177,359
Resources received free of charge (II)
Determined on the basis of the following estimates provided by agencies:
Department of Water 1 –
Department of Health – 20
Landgate 213 247
Department of Treasury and Finance 149 145
State Solicitor’s Office 122 75
485 487
Total income from State Government 134,095 177,846
(I) Service appropriations are accrual amounts reflecting the full cost of services delivered. The appropriation revenue comprises a cash component and a receivable (asset). The receivable (holding account) comprises the depreciation expense for the year and any agreed increase in leave liability during the year.
(II) Where assets or services have been received free of charge or for nominal consideration, the department recognises revenues equivalent to the fair value of the assets and/or the fair value of those services that can be reliably measured and which would have been purchased if they were not donated, and those fair values shall be recognised as assets or expenses, as applicable. Where the contribution of assets or services are in the nature of contributions by owners, the department makes an adjustment direct to equity.
(III) The assumption of the superannuation liability by the Treasurer is a notional income to match the notional superannuation expense reported in respect of current employees who are members of the Pension Scheme and current employees who have a transfer benefit entitlement under the Gold State Superannuation Scheme. (The notional superannuation expense is disclosed at note 9 ‘Employee Benefits Expense’). Commencing in 2008–09, the reporting of the notional superannuation expense and equivalent notional income has been discontinued.
(IV) Discretionary transfers of assets between State Government agencies are reported as assets assumed/(transferred) under Income from State government. Non-discretionary non-reciprocal transfers of net assets other than those resulting from a restructure of administrative arrangements have been classified as Contributions by Owners (CBOs) under TI 955 and are taken directly to equity.
(Return to index of notes)
noteS to the finAnciAl StAtementS

Department of Agriculture and Food | Annual Report 2009 44
18. Cash and cash equivalents2009
$’0002008
$’000
Petty cash/travel advance 44 44
Cash at bank 10,307 22,676
10,351 22,720
(Return to index of notes)
19. Restricted cash and cash equivalents2009
$’0002008
$’000
Current
Restricted cash (a)
Cattle Industry Compensation Fund 6,682 6,341
Departmental Receipts in Suspense 55 82
Land Conservation Districts Fund 42 54
6,779 6,477
Special purpose accounts (b)
Agriculture Research Grants Account No. 1 6,018 11,152
Agriculture Research Grants Account No. 2 4,953 3,697
Commonwealth Agriculture Activity Grants (Non-interest bearing) 2,674 3,317
Commonwealth Agriculture Activity Grants (Interest bearing) 19,529 47,316
Plant Research and Development 4,246 2,453
37,420 67,935
Total current 44,199 74,412
(a) Funds held in the following accounts are for the following purposes.
• CattleIndustryCompensationfund:TomakecompensationpaymentsinaccordancewiththeCattle Industry Compensation Act.
• DepartmentalReceiptsinSuspense:Toholdanddistributefundspendingidentificationforallocation.
• LandConservationDistrictsFund:Topromotesoilconservationthroughresearch&implementationofsoil&conservationmeasures&practices.
(b) Receipts and disbursement are disclosed in note 44 in accordance with section 16(1)(c) of the Financial Management Act 2006
noteS to the finAnciAl StAtementS

Department of Agriculture and Food | Annual Report 2009 45
2009$’000
2008$’000
Non-current
Accrued salaries suspense account 1,521 985
Accrued salaries suspense account consists of amounts paid annually to a suspense account over a period of 10 financial years to largely meet the additional cash outflow in each eleventh year when 27 pay days occur in that year instead of the normal 26. No interest is received on this account.
Accrued salaries suspense account is represented by a cash balance and is therefore equivalent to the net fair value.
Total restricted cash and cash equivalents 45,720 75,397
(Return to index of notes)
20. Biological assets2009
$’0002008
$’000
Livestock 1,534 1,522
Field crops 846 826
2,380 2,348
(Return to index of notes)
21. Inventories2009
$’0002008
$’000
Inventories held for resale
Raw materials and stores 393 306
Finished goods 32 84
425 390
Other
Raw materials and stores 1,522 1,543
1,947 1,933
(Return to index of notes)
19. Restricted cash and cash equivalents (continued)
noteS to the finAnciAl StAtementS

Department of Agriculture and Food | Annual Report 2009 46
22. Receivables2009
$’0002008
$’000
Trade Receivables 7,411 9,846
Less: Allowance for impairment of receivables (a) (310) (38)
Interest receivable 494 1,277
Accrued revenue 5,938 619
GST receivable 686 2,729
Other receivables 88 709
Less: Allowance for impairment of other receivables (b) – (590)
Total Receivables 14,307 14,552(a) Reconciliation of changes in the allowance for impairment of receivables:
Balance at start of year 38 28
Doubtful debts expense recognised in the income statement 277 25
Amounts written off during the year (5) (15)
Balance at end of year 310 38(b) Reconciliation of changes in the allowance for impairment of other receivables:
Balance at start of year 590 –
Doubtful debts expense recognised in the income statement (590) 590
Balance at end of year – 590
(Return to index of notes)
noteS to the finAnciAl StAtementS

Department of Agriculture and Food | Annual Report 2009 47
23. Amounts receivable for services2009
$’0002008
$’000
Current 3,365 4,600
Non-current 35,209 31,860
38,574 36,460
This asset represents the non-cash component of service appropriations (see note 3 (r) ‘Amounts receivable for services (Holding Account)’). It is restricted in that it can only be used for asset replacement or payment of leave liability.
The reconciliation at the beginning and end of the current and previous year is set out below:
Opening balance of Holding Account 36,460 36,709
Non cash appropriation 6,714 7,051
Departmental drawdown (4,600) (7,300)
Closing balance of Holding Account 38,574 36,460
(Return to index of notes)
24. Other and financial assets2009
$’0002008
$’000
(a) Other assets
Current
Prepayments
Lease rentals 798 952
Goods & Services 22 155
Registrations 180 290
1,000 1,397
(b) Financial assets
Investments
Investment valued as at 30 June 2009
Listed shares 242 415
Unlisted shares 193 155
435 570
(Return to index of notes)
noteS to the finAnciAl StAtementS

Department of Agriculture and Food | Annual Report 2009 48
25. Investment accounted for using equity method2009
$’0002008
$’000
Investment in joint venture entity at initial cost of investment 4,647 2,050
Share of loss using the equity method (1,204) (1,113)
Provision for impairment (1,488) (915)
1,955 22
The Western Australian Agriculture Authority (WAAA) is a body corporate established under the Biosecurity and Agriculture Management Act 2007, and is a joint investor in InterGrain Pty Ltd, which was incorporated on 26 October 2007 and resident in Australia. The joint venture principal activity is to commercialise the research from wheat breeding.
As at 30 June 2009, WAAA holds a 66.93% (2008: 75.65%) equity interest in InterGrain Pty Ltd. The department regarded the investment in InterGrain Pty Ltd as a joint venture entity due to the contractually agreed sharing of control over an economic activity and the financial and operating decisions relating to the activity require the unanimous consent of the shareholders.
The department has no obligations with respect to losses incurred by InterGrain Pty Ltd.
Summary financials from the management accounts for equity accounted investees, not adjusted for the percentage ownership by the department:
Current assets 7,583 3,349
Non current assets 75 29
Total assets 7,658 3,378
Current liabilities 4,737 3,348
Total liabilities 4,737 3,348
Net assets 2,921 30
Revenue 6,934 2,068
Expenses (7,069) (3,539)
(Loss) (135) (1,471)
(Return to index of notes)
noteS to the finAnciAl StAtementS

Department of Agriculture and Food | Annual Report 2009 49
26. Property, plant and equipment2009
$’0002008
$’000
Barrier Fence
At fair value (a)4,400 4,500
Land
At fair value (a)106,340 99,550
Buildings
At fair value (a)83,231 81,535
Plant & equipment
At cost 30,531 27,081
Accumulated depreciation (19,068) (17,261)
11,463 9,820
Vehicles & transportation equipment
At cost 11,493 11,344
Accumulated depreciation (8,135) (7,929)
3,358 3,415
IT equipment
At cost 5,082 5,994
Accumulated depreciation (3,600) (3,854)
1,482 2,140
Furniture & fittings
At cost 93 81
Accumulated depreciation (70) (50)
23 31
Capital works in progress
Buildings 5,271 4,960
Other 368 411
5,639 5,371
noteS to the finAnciAl StAtementS

Department of Agriculture and Food | Annual Report 2009 50
2009$’000
2008$’000
Total assets
At cost 52,838 49,871
Accumulated depreciation (30,873) (29,094)
Total at cost 21,965 20,777
At Fair Value 193,971 185,585
Total at Fair Value 193,971 185,585
Total non-current assets 215,936 206,362
At cost and fair value 246,809 235,456
Accumulated depreciation (30,873) (29,094)
Total non-current assets 215,936 206,362
(a) Freehold land, barrier fence and buildings were revalued as at 1 July 2008 by the Western Australian Land Information Authority (Valuation Services). The valuations were performed during the year ended 30 June 2009 and recognised at 30 June 2009.
26. Property, plant and equipment (continued)
noteS to the finAnciAl StAtementS

Department of Agriculture and Food | Annual Report 2009 51
ReconciliationsReconciliations of the carrying amounts of property, plant, equipment and vehicles at the beginning and end of the current and previous financial year are set out below
2009
Barrier Fence$’000
Land$’000
Buildings$’000
Plant & equipment
$’000
vehicles & transportation
equipment$’000
IT equipment
$’000
Furniture & fittings
$’000
Capital works in
progress$’000
Total$’000
Carrying amount 1 July 2008 4,500 99,550 81,535 9,820 3,415 2,140 31 5,371 206,362
Additions (a) – – – 4,279 826 48 18 2,331 7,502
Transfer between classes – – – – – – – (1,773) (1,773)
Expensed assets – – – – – – – (290) (290)
Disposals (b) – (8) (107) (214) (109) (12) – – (450)
Adjustments – – 86 (61) – – – – 25
Revaluation increment (decrement) 138 6,798 5,397 – – – – – 12,333
Depreciation (238) – (3,680) (2,346) (774) (675) (26) – (7,739)
Write-off of assets – – – (15) – (19) – – (34)
Carrying amount 30 June 2009 4,400 106,340 83,231 11,463 3,358 1,482 23 5,639 215,936
26. Property, plant and equipment (continued)
noteS to the finAnciAl StAtementS

Department of Agriculture and Food | Annual Report 2009 52
2008
Barrier Fence$’000
Land$’000
Buildings$’000
Plant & equipment
$’000
vehicles & transportation
equipment$’000
IT equipment
$’000
Furniture & fittings
$’000
Capital works in progress
$’000Total
$’000
Carrying amount 1 July 2007 6,200 79,189 75,522 8,550 3,214 2,379 66 5,159 180,279
Additions (a) – – 3,510 3,536 954 733 – 4,457 13,190
Transfer between classes – – – – – – – (4,116) (4,116)
Asset transfer from APB – 5,496 – – – – – – 5,496
Expensed assets – – – – – – – (129) (129)
Disposals (b) – (492) (370) (22) (39) (16) – – (939)
Adjustments – – – – – – – – –
Revaluation increment (decrement) (1,390) 15,357 6,156 – – – – – 20,123
Depreciation (310) – (3,260) (2,226) (714) (943) (35) – (7,488)
Write-off of assets – – (23) (18) – (13) – – (54)
Change in accounting policy (c) – – – – – – – – –
Carrying amount 30 June 2008 4,500 99,550 81,535 9,820 3,415 2,140 31 5,371 206,362
(a) Additions include adjustments and restated assets.
(b) Disposal includes adjustments and retired assets.
(c) Refer Note 30 ‘Equity’
The Department of Planning (DOP) is the only agency with the power to sell Crown land. The land is transferred to DOP for sale and the department accounts for the transfer as a distribution to owner.
(Return to index of notes)
26. Property, plant and equipment (continued)
noteS to the finAnciAl StAtementS

Department of Agriculture and Food | Annual Report 2009 53
27. Impairment of assetsThere were no indications of impairment to property, plant and equipment, infrastructure and intangible assets at 30 June 2009 other than the impairment recognised in the ‘Investment accounted for using equity method’ as described in note 25. The department held no goodwill or intangible assets with an indefinite useful life during the reporting period and at balance sheet date there were no intangible assets not yet available for use. All surplus assets at 30 June 2009 have either been classified as assets held for sale or written off.
(Return to index of notes)
28. Payables2009
$’0002008
$’000
Trade payables 1,371 6,430
Accrued expenses 3,620 5,138
Accrued salaries (a) 1,621 5,500
Other payables 2,220 1,934
See also note 3 (p) ‘Payables’ and note 42 ‘Financial instruments’ 8,832 19,002
(a) The accrued salaries provision is represented by:
(i) The amount due to staff but unpaid at the end of the financial year as the end of the last pay period does not coincide with the end of the financial year.
Amounts owing for the 3 working days to 30 June 2009 (2008 – 30 June, 2 working days) 1,621 793
(ii) An accrual to recognise the current year impact on the wage increase with respect to the Specified Callings to be paid from 1 July 2007 under the Public Service Award. Payment to be made first pay period in July 2008. – 4,707
Total accrued salaries 1,621 5,500
The carrying amount of accrued salaries approximates the net fair value.
(Return to index of notes)
noteS to the finAnciAl StAtementS

Department of Agriculture and Food | Annual Report 2009 54
29. Provisions2009
$’0002008
$’000
Current
Employee Benefit provisions
Annual leave (a) 11,674 10,160
Long service leave (b) 13,425 11,582
25,099 21,742
Other provisions
Employment on-costs (c) 5,123 4,318
Total current provisions 30,222 26,060
Non-current
Employee Benefit provisions
Long service leave (b) 9,338 6,320
Deferred salary scheme 244 270
9,582 6,590
Other provisions
Employment on-costs (c) 927 608
Total non-current provisions 10,509 7,198
Total Employee Benefit provisions 40,731 33,258
(a) Annual leave liabilities have been classified as current as there is no unconditional right to defer settlement for at least 12 months after balance sheet date. Assessments indicate that actual settlement of the liabilities will occur as follows:
Within 12 months of balance sheet date 6,087 5,407
More than 12 months after balance sheet date 5,587 4,753
11,674 10,160
noteS to the finAnciAl StAtementS

Department of Agriculture and Food | Annual Report 2009 55
2009$’000
2008$’000
(b) Long service leave liabilities have been classified as current as there is no unconditional right to defer settlement for at least 12 months after balance sheet date. Assessments indicate that actual settlement of the liabilities will occur as follows:
Within 12 months of balance sheet date 10,232 9,039
More than 12 months after balance sheet date 12,531 8,863
22,763 17,902
(c) The settlement of annual and long service leave liabilities gives rise to the payment of employment on-costs including workers’ compensation insurance. The provision is the present value of expected future payments. See also note 12 ‘Other expenses’.
(Return to index of notes)
30. EquityEquity represents the residual interest in the net assets of the department. The government holds the equity interest in the department on behalf of the community. The asset revaluation reserve represents that portion of equity resulting from the revaluation of non-current assets.
2009$’000
2008$’000
Contributed equity
Balance at the start of the year 23,009 16,304
Contribution by owners
Capital contributions (a) 2,577 560
Transfer of assets from the Agriculture Protection Board (a) – 6,145
2,577 6,705
Balance at the end of the year 25,586 23,009
(a) Capital Contributions (appropriations) and non-discretionary (non-reciprocal) transfers of net assets from other state government agencies have been designated as contributions by owners in Treasurer’s Instruction TI 955 ‘Contributions by Owners Made to Wholly Owned Public Sector Entities’ and are credited directly to equity.
29. Provisions (continued)
noteS to the finAnciAl StAtementS

Department of Agriculture and Food | Annual Report 2009 56
2009$’000
2008$’000
Reserves
Asset revaluation reserve
The asset revaluation reserve represents the portion of equity resulting from the revaluation of non-current assets.
Balance at the start of the year
Investments 264 507
Non-current assets 188,327 168,204
188,591 168,711
Net revaluation increments/(decrements)
Investments (218) (243)
Non-current assets
Land 6,798 15,356
Buildings 5,397 6,156
Barrier fence 138 (1,389)
12,333 20,123
Total net revaluation increments/(decrements) 12,115 19,880
Balance at the end of the year
Investments 46 264
Non-current assets 200,660 188,327
200,706 188,591
The asset revaluation reserve is used to record increments and decrements on the revaluation of non-current assets, as described in accounting policy note 3 (f) ‘Property, Plant and equipment’.
Accumulated surplus/(deficit) (Retained Earnings)
30. Equity (continued)
noteS to the finAnciAl StAtementS

Department of Agriculture and Food | Annual Report 2009 57
2009$’000
2008$’000
Balance at the start of the year 102,712 97,671
Change in accounting policy (a) (4,375) (3,465)
Restated balance at start of period 98,337 94,206
Result for the period (41,287) (4,131)
Balance at end of the year 57,050 98,337
Total Equity balance at the end of the year 283,342 309,937
(a) As at 1 July 2008 the department is required to apply Treasurer Instructions 1101 (14) (ii) with respect to the asset capitalisation threshold. The department has increased its threshold from $1,000 to $5,000 for its Properties, Plant and Equipment to meet the Treasurer’s Instructions.
The change in accounting policy has been accounted for under AASB 108 ‘Accounting Policies, Changes in Accounting Estimates and Errors’. In applying AASB 108 the department has reflected the asset write off in its opening balance of accumulated surplus/(deficiency) 1 July 2008 and has restated its 2008 comparatives.
Restated comparatives (increments)/decrements
Other expenses for expensed assets (2,105)
Depreciation expense written back – 1,195
Change in accounting policy – (3,465)
– (4,375)
(Return to index of notes)
30. Equity (continued)
noteS to the finAnciAl StAtementS

Department of Agriculture and Food | Annual Report 2009 58
31. Notes to the cash flow statement2009
$’0002008
$’000
(a) Reconciliation of cash
For the purposes of the Cash Flow Statement, cash includes cash at bank; cash on hand, restricted cash and amounts in suspense. Cash at the end of the financial year as shown in the Statement of Cash Flows is reconciled to the related items in the Balance Sheet as follows:
Cash and cash equivalents (refer to note 18) 10,351 22,720
Restricted cash and cash equivalents: current (refer to note 19) 44,199 74,412
Restricted cash and cash equivalents: non-current (refer to note 19) 1,521 985
56,071 98,117
(b) Reconciliation of net cost of services to net cash flows provided by/(used in) operating activities
Net cost of services (175,382) (173,715)
Non-cash items:
Net loss/(profit) from sale of assets (89) 817
Depreciation and amortisation 7,739 7,489
Resources received free of charge 485 487
Share of net loss in joint venture entity using equity method 91 1,113
Provision for impairment 260 1,530
8,486 11,436
(Increase)/decrease in assets:
Inventories (14) (157)
Biological Assets – Livestock (12) (382)
Biological Assets – Field Crops (20) (89)
Agricultural Produce 136 (93)
Receivables (a) (1,480) (1,309)
Prepayments 397 110
noteS to the finAnciAl StAtementS

Department of Agriculture and Food | Annual Report 2009 59
2009$’000
2008$’000
Increase/(decrease) in liabilities:
Provisions 7,473 1,214
Payables (a) (10,170) 8,692
Net GST receipts/(payments) (b) 74 (321)
Change in GST in receivables/payables (c) 2,043 (238)
(983) 7,427
Net cash used in operating activities (167,879) (154,852)
(a) Note that the ATO receivable/payable in respect of GST and receivable/payable in respect of the sale/purchase of non-current assets are not included in these items as they are not reconciling items.
(b) This is the net GST paid/received, i.e. cash transactions.(c) This reverses out the GST in receivables and payables
(Return to index of notes)
32. Resources provided free of charge2009
$’0002008
$’000
During the year the following resources were provided to other agencies free of charge for functions outside the normal operations of the Department of Agriculture and Food
Agriculture Protection Board 13,494 14,479
Agricultural Produce Commission 6 8
Other – 7
13,500 14,494
(Return to index of notes)
31. Notes to the cash flow statement (continued)
noteS to the finAnciAl StAtementS

Department of Agriculture and Food | Annual Report 2009 60
33. Commitments2009
$’0002008
$’000
(a) Capital expenditure commitments
Capital expenditure commitments, being contracted capital expenditure additional to the amounts reported in the financial statements, are payable as follows:
Within one year 1,751 508
1,751 508
(b) Total lease commitments
Commitments in relation to leases contracted for at the balance sheet date but not recognised as liabilities are payable as follows:
Within one year 3,584 4,956
Later than one year and not later than five years 3,897 20,891
Later than five years 164 226
7,645 26,073
Representing:
Non-cancellable operating lease commitments 7,645 26,073
The property leases are non-cancellable leases with five year terms, with rents payable monthly in advance. Contingent rental provisions within the lease agreements require that the minimum lease payments shall be increased by the lower of CPI or 4% per annum. An option exists to renew the leases at the end of their five-year terms for an additional term of five years.
(c) Guarantees and undertakings
There are no guarantees and undertakings at balance sheet date, not otherwise provided for in these financial statements.
(Return to index of notes)
noteS to the finAnciAl StAtementS

Department of Agriculture and Food | Annual Report 2009 61
34. Contingent liabilities and contingent assetsContingent LiabilitiesIn addition to the liabilities included in the financial statements, there are the following contingent liabilities:
Employment contract claimA claim against the department for entitlements arising from employment conditions has been lodged in Western Australian Industrial Relations Commission (WAIRC), in the Industrial Magistrate’s Court (IMC), by three employees on behalf of a larger group totalling 84 employees. Subject to the ruling from the IMC scheduled in August 2009, a contingent liability in the range $0.65 million to $1.30 million is acknowledged by the department.
Contaminated sitesUnder the Contaminated Sites Act 2003, the department is required to report known and suspected contaminated sites to the Department of Environment and Conservation. In accordance with the Act, Department of Environment and Conservation classifies these sites on the basis of the risk to human health, the environment and environmental values. Where sites are classified as contaminated investigation and remediation may be required. The department may have a liability in respect of investigation and/or remediation expenses.
During the year the department reported one suspected contaminated site to Department of Environment and Conservation (2008 – nil suspected sites). The total suspected contaminated site reported as at balance sheet date is 70 (2008 : 69).
The reported contaminated sites have yet to be classified. The department is unable to assess the likely outcome of the classification process, and accordingly, it is not practicable to estimate the potential financial effect or to identify the uncertainties relating to the amount or timing of any outflows. The department may apply for funding from the Contaminated Sites Management Account to assist with future remediation costs that may be required.
(Return to index of notes)
35. Events occurring after reporting dateThere were no events that occurred after balance date which would materially affect the financial statements or disclosures.
(Return to index of notes)
noteS to the finAnciAl StAtementS

Department of Agriculture and Food | Annual Report 2009 62
36. Explanatory StatementsSignificant variations between estimates and actual results for income and expense as presented in the financial statement titled ‘Summary of Consolidated Account Appropriations and Income Estimates’ are shown below. Significant variations are considered to be those greater than 10% or $4 million.
2009 Estimate$’000
2009 Actual$’000
variation$’000
Significant variances between estimate and actual for 2009
36.1 Total appropriations to deliver services 153,971 133,610 (20,361)The reduction on estimate is a result of a combination of the following fiscal impacts:
• Salariesincreases(GA4)• Defermentof$15mStatecontributiontoNaturalResourceManagementintothe2010
financial year• RemovalofregionalsaleyardfundingfromDAFWAappropriation($8.5m)• Reductionfor3%EfficiencyDividend
36.2 Food and Fibre Industry Development 93,917 87,720 (6,197)Variation relates to the net impact of regional saleyard funding returned to government, efficiency dividend reductions and salary increases.
36.3 Agricultural Resource Management 130,277 113,278 (16,999)The variation mainly relates to the deferment of State NRM program funding to 2010 fiscal year with a further minor variation relating to the net of salary increases and efficiency dividend reductions.
36.4 Biosecurity (1) 64,395 77,790 13,395The variation mainly relates to:
• AdditionalfundingfromanationalagreementtoaddressEuropeanHouseBorer• ImpactofincreasedsalarycostsassociatedwithPublicServiceAwardincreases(GA4)• Increasedfundingfromindustrysourcesforbiosecurityresearchactivities(1) includes services provided to the Agriculture Protection Board
36.5 Services provided to Rural Business Development Corporation 12,888 954 (11,934)The variation relates to reductions in Exceptional Circumstances grant estimates and revised service delivery charges/parameters.
noteS to the finAnciAl StAtementS

Department of Agriculture and Food | Annual Report 2009 63
2009 Estimate$’000
2009 Actual$’000
variation$’000
36.6 Total income (120,318) (104,360) 15,958Revenue retained by the department was less than budget estimates primarily due to a decrease to:• NationalActionPlanforSalinitygrantsfromtheCommonwealthassociatedwiththe
transition year between national schemes• NRM3rdpartygrantsandfundingfromindustrysourcesforresearchactivities.
36.7 Administered capital appropriations – 11,308 11,308This expenditure represents two unbudgeted loans made under the Western Australian Cooperative Loans Scheme
2009 Actual$’000
2008 Actual$’000
variation$’000
Significant variances between actuals for 2008 and 2009
36.8 Total appropriations provided to deliver services 133,610 177,359 43,749The decrease in appropriations resulted from a combination of the following fiscal impacts:• DecreaseinrelationtoNationalActionPlancommitmentsforsalinityactivitiesdueto
finalisation of the national program in 2008 and reduced funding in 2009, being the transition year towards the development of new State and Commonwealth programs
• IncreaseinPublicServiceAward(GA4)• Decreasetomeet3%efficiencydividend
36.9 Food and Fibre Industry Development 87,720 82,572 (5,148)The increase is a result of the combination of salary increases, efficiency dividend reductions and increased focus on food development.
36.10 Agricultural Resource Management 113,278 154,380 41,102The reduced expenditure primarily relates to reductions in National Action Plan funding for salinity activities due to the finalisation of the national program in 2008 and reduced funding provided in the transition year (2009) as development progressed towards new State and Commonwealth programs.
36. Explanatory Statements (continued)
noteS to the finAnciAl StAtementS

Department of Agriculture and Food | Annual Report 2009 64
2009 Estimate$’000
2009 Actual$’000
variation$’000
36.11 Biosecurity (1) 77,790 74,495 (3,295)The increase in expenditure is a result of a combination of increased national funding to address European House Borer control, reduced locust campaign program in 2009, salaries increases and efficiency dividend reductions.(1) includes services provided to the Agriculture Protection Board
36.12 Total income (104,360) (138,704) (34,344)The reduction in total income is due to reductions in funding provided for:• NationalActionPlan(NAP)andnaturalresourcemanagement(NRM)grants• NRM3rdpartygrants• Researchactivitiesfundedbyindustrysources
36.13 Purchase of non-current physical assets 7,502 11,049 3,547The reduction relates to a number of capital works projects that were completed in 2007–08 and variations in the level of capital items funded through projects.
36.14 Capital expenditure adjustment for other funding sources (4,925) (10,489) (5,564)The reduction relates to reduced funding drawn from the holding accounting in 2008–09 compared to 2007–08 and a reduced level of assets funded from projects.
36.15 Administered capital appropriations 11,308 3,000 (8,308)The increase in expenditure is a result of increases in payments in 2009 made under the Western Australian Cooperative Loans Scheme.
(Return to index of notes)
36. Explanatory Statements (continued)
noteS to the finAnciAl StAtementS

Department of Agriculture and Food | Annual Report 2009 65
37. Remuneration of senior officersThe number of senior officers whose total of fees, salaries, superannuation, non-monetary benefits and other benefits received or due and receivable for the financial year, falling within the following bands are:
‘$2009
Number2008
Number
80,001 – 90,000 – 1
90,001 – 100,000 1 –
110,001 – 120,000 1 –
120,001 – 130,000 1 –
140,001 – 150,000 1 3
150,001 – 160,000 1 –
160,001 – 170,000 1 –
170,001 – 180,000 1 1
210,001 – 220,000 – 1
320,001 – 330,000 – 1
350,001 – 360,000 1 –
2009$’000
2008$’000
The total remuneration of senior officers is: 1,343 1,226
The total remuneration includes the superannuation expense incurred by the department in respect of senior officers. There are no senior officers who are presently members of the Government Pension Scheme.
(Return to index of notes)
noteS to the finAnciAl StAtementS

Department of Agriculture and Food | Annual Report 2009 66
38. Remuneration of auditor2009
$’0002008
$’000
Remuneration to the Auditor General in respect of the audit for the current financial year is as follows:
Auditing the accounts, financial statements and performance indicators
227 244
This expense is included in note 12 ‘Other expenses’
(Return to index of notes)
39. Related bodiesThere are no related bodies with the Department of Agriculture and Food, Western Australia.
(Return to index of notes)
40. Affiliated bodiesThere are no affiliated bodies with the Department of Agriculture and Food, Western Australia.
(Return to index of notes)
41. Jointly controlled operations(i) Major Cooperative Research Agreements – Audited 2008
Joint venture name and principal activitiesInterest
(%)Termination
date
2008
Cooperative Research Centre for Australian Weed Management 16.00 30/12/08
Cooperative Research Centre for Value Added Wheat 8.75 30/09/08
Cooperative Research Centre for Tropical Savannas 5.57 30/06/08
Cooperative Research Centre for Emerging Infectious Diseases 6.35 30/10/10
Cooperative Research Centre for Spatial Information 5.23 14/06/10
Cooperative Research Centre for Plant Based Management of Dryland Salinity 10.10 30/06/08
Cooperative Research Centre for Desert Knowledge 0.76 30/06/10
Cooperative Research Centre for Cotton Catchment Communities 2.29 30/06/12
noteS to the finAnciAl StAtementS
Department of Agriculture and Food | Annual Report 2009 67
(ii) Other joint venturesThe department has collaborative arrangements with other parties to perform research and share in the outputs (i.e. intellectual property) in proportion to each participant’s research input, initial intellectual property or cash contributions. These collaborative arrangements also share the characteristics of joint venture operations. The principal activities of these joint venture operations are scientific research and development, extension and technology transfer with the ultimate aim of sharing in the output. The numbers of this type of arrangement make it impractical to list separately. The department’s contributions to these joint ventures are included in the department’s operating statements.
(iii) AlliancesThe Department of Agriculture and Food, Western Australia has joined with CSIRO, Curtin University of Technology, Murdoch University and the University of Western Australia to form a research alliance known as Agricultural Research Western Australia (ARWA). The alliance fosters collaborative high priority research, facilitates the sharing of knowledge and resources, and the creation of the science capacity required to deliver enhanced benefits to the Western Australian agricultural sector. The cost of managing ARWA activities is funded by way of subscription from the above-mentioned agencies.
(Return to index of notes)
42. Financial instruments(a) Financial risk management objectives and policiesFinancial instruments held by the department are cash and cash equivalents, restricted cash and cash equivalents, receivables, payables and listed and unlisted shares. All of the department’s cash is held in the public bank account (non-interest bearing) apart from restricted cash held in a special purpose account. The department has limited exposure to financial risks. The department’s overall risk management program focuses on managing the risks identified below.
Credit riskCredit risk arises when there is the possibility of the department’s receivables defaulting on their contractual obligations resulting in financial loss to the department. The maximum exposure to credit risk at balance sheet date in relation to each class of recognised financial assets is the gross carrying amount of those assets inclusive of any provisions for impairment, as shown in the table at Note 42(b), Note 22 and Note 25.
Credit risk associated with the department’s financial assets is minimal because the main receivable is the ‘Amounts receivable for services’ (holding account). For receivables other than government, the department trades only with recognised, creditworthy third parties. The department has policies in place to ensure that sales of products and services are made to customers with an appropriate credit history. In addition, receivable balances are monitored on an ongoing basis with the result that the department’s exposure to bad debts is minimal. At the balance sheet date there are no significant concentrations of credit risk.
Allowance for impairment of financial assets is calculated based on objective evidence such as observed data indicating changes. For financial assets that are either past due or impaired, refer to Note 42(b).
Liquidity riskThe department is exposed to liquidity risk through its trading in the normal course of business. Liquidity risk arises when the department is unable to meet its financial obligations as they fall due. The department has appropriate procedures to manage cash flows including drawdowns of appropriations by monitoring forecast cash flows to ensure that sufficient funds are available to meet its commitments.
41. Jointly controlled operations (continued)
noteS to the finAnciAl StAtementS

Department of Agriculture and Food | Annual Report 2009 68
42. Financial instruments (continued)Market riskMarket risk is the risk that changes in market prices such as foreign exchange rates and interest rates will affect the department’s income or the value of its holdings of financial instruments. The department does not trade in foreign currency and is not materially exposed to other price risks (for example, equity securities or commodity prices changes). Other than as detailed in the interest rate sensitivity analysis table at Note 42(b), the department is not exposed to interest rate risk because apart from minor amounts of restricted cash, all other cash and cash equivalents and restricted cash are non-interest bearing. The department has no borrowings.
(b) Financial instrument disclosures
Categories of financial instrumentsIn addition to cash and bank overdraft, the carrying amounts of each of the categories of financial assets and financial liabilities at balance sheet date are as follows:
2009$’000
2008$’000
Financial assets
Cash and cash equivalents 10,351 22,720
Restricted cash and cash equivalents 45,720 75,397
Loans and receivables (a) 52,195 48,283
Investments 435 570
Financial liabilities
Financial liabilities measured at amortised cost 8,832 19,002
(a) The amount of loans and receivables excludes GST recoverable from the ATO (statutory receivable)
noteS to the finAnciAl StAtementS

Department of Agriculture and Food | Annual Report 2009 69
42. Financial instruments (continued)Credit risk and interest rate risk exposures
The following tables disclose the department’s maximum exposure to credit risk, interest rate exposures and the ageing analysis of financial assets. The department’s maximum exposure to credit risk at the balance sheet date is the carrying amount of financial assets as shown below. The table discloses the ageing of financial assets that are past due but not impaired and impaired financial assets. The table is based on information provided to senior management of the department. The department does not hold any collateral as security or other credit enhancements relating to the financial assets it holds. The department does not hold any financial assets that had to have their terms renegotiated that would have otherwise resulted in them being past due or impaired.
Interest rate exposures and ageing analysis of financial assets
Interest rate exposure Past due but not impaired
2009
Weighted average effective
interest rate%
Carrying amount$’000
variable interest rate
$’000
Non interest bearing$’000
up to 3 months$’000
3–12 months$’000
More than 12 months$’000
Impaired financial assets$’000
Financial assets
Cash and cash equivalents 10,351 – 10,351 – – – –
Restricted cash and cash equivalents 5.38 45,720 35,452 10,268 – – – –
Financial assets 435 – 435 – – – –
Amounts receivable for services 38,574 – 38,574 – – – –
Receivables (a) 13,621 – 13,621 13,260 361 – –
Total financial assets 108,701 35,452 73,249 13,260 361 – –
2008 % $’000 $’000 $’000 $’000 $’000 $’000 $’000
Financial assets
Cash and cash equivalents 22,720 – 22,720 – – – –
Restricted cash and cash equivalents 7.03 75,397 59,861 15,536 – – – –
Financial assets 570 – 570 – – – –
Amounts receivable for services 36,460 – 36,460 – – – –
Receivables (a) 11,823 – 11,823 11,310 513 – –
Total financial assets 146,970 59,861 87,109 11,310 513 – –
(a) The amount of receivables excludes the GST recoverable from the ATO (statutory receivable).
noteS to the finAnciAl StAtementS
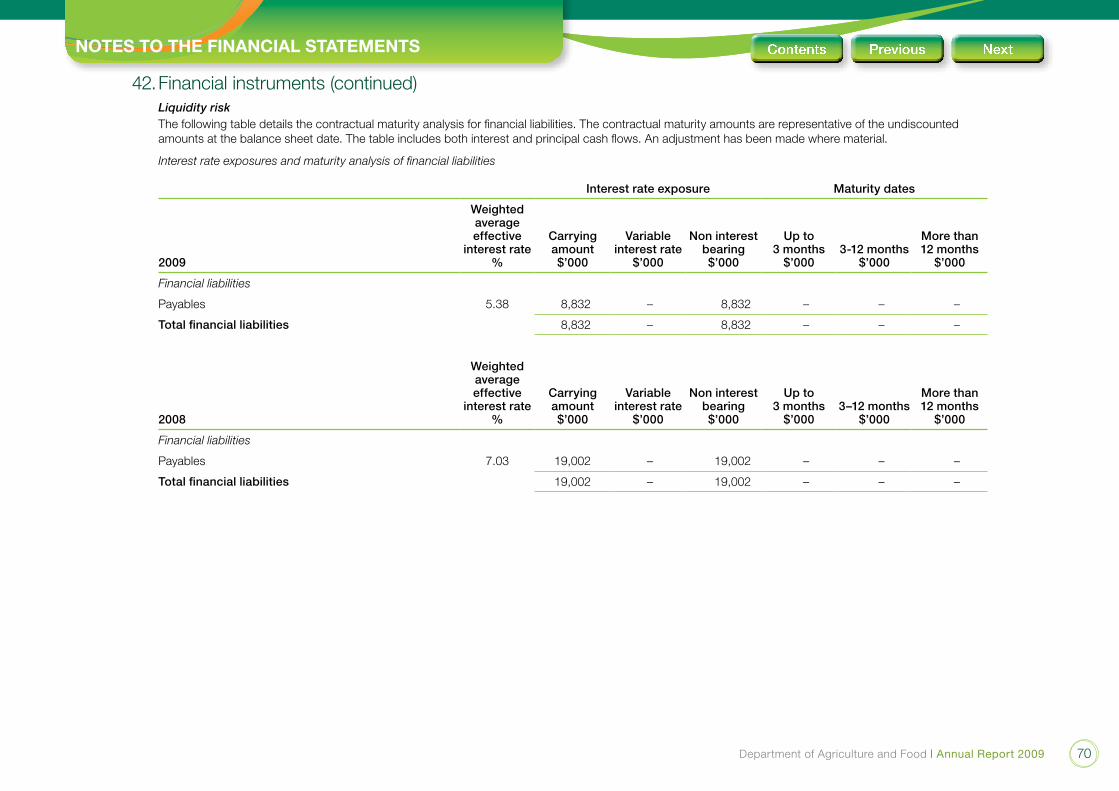
Department of Agriculture and Food | Annual Report 2009 70
42. Financial instruments (continued)Liquidity riskThe following table details the contractual maturity analysis for financial liabilities. The contractual maturity amounts are representative of the undiscounted amounts at the balance sheet date. The table includes both interest and principal cash flows. An adjustment has been made where material.
Interest rate exposures and maturity analysis of financial liabilities
Interest rate exposure Maturity dates
2009
Weighted average effective
interest rate%
Carrying amount$’000
variable interest rate
$’000
Non interest bearing$’000
up to 3 months
$’0003-12 months
$’000
More than 12 months
$’000
Financial liabilities
Payables 5.38 8,832 – 8,832 – – –
Total financial liabilities 8,832 – 8,832 – – –
2008
Weighted average effective
interest rate%
Carrying amount$’000
variable interest rate
$’000
Non interest bearing$’000
up to 3 months
$’0003–12 months
$’000
More than 12 months
$’000
Financial liabilities
Payables 7.03 19,002 – 19,002 – – –
Total financial liabilities 19,002 – 19,002 – – –
noteS to the finAnciAl StAtementS

Department of Agriculture and Food | Annual Report 2009 71
42. Financial instruments (continued)Interest rate sensitivity analysisThe following table represents a summary of the interest rate sensitivity of the department’s financial assets and liabilities at the balance sheet date on the surplus for the period and equity for a 1% change in interest rates. It is assumed that the change in interest rates is held constant throughout the reporting period.
-1% change +1% change
2009
Carrying amount$’000
Profit$’000
Equity$’000
Profit$’000
Equity$’000
Financial assets
Cash equivalents 35,452 (355) (355) 355 355
2008
Carrying amount$’000
Profit$’000
Equity$’000
Profit$’000
Equity$’000
Financial assets
Cash equivalents 59,861 (599) (599) 599 599
(c) Fair valuesAll financial assets and liabilities recognised in the balance sheet, whether they are carried at cost or fair value, are recognised at amounts that represent a reasonable approximation of fair value unless otherwise stated in the applicable notes.
(Return to index of notes)
noteS to the finAnciAl StAtementS

Department of Agriculture and Food | Annual Report 2009 72
43. Supplementary information2009
$’0002008
$’000
Write-offs: Non-current assetsDuring the financial year $34,710 (2008: $54,392) was written off the department’s asset register under the authority of• TheAccountableAuthority
35 54
Write-offs: Irrecoverable amountsDuring the financial year $4,836 (2008: $16,087) was written off in bad debts under the authority of:• TheAccountableAuthority
5 16
Losses through theft, defaults and other causes
Losses of public moneys and public and other property through theft or default – –
Amounts recovered-insurance 5 50
(Return to index of notes)
44. Special Purpose Accounts – Section 16(1)(c) Financial Management Act 20062009
$’0002008
$’000
Agriculture Research Grants Account No. 1 (non-interest bearing)
The purpose of the fund is to receive and disperse funds from industry and other organisations in support of Agricultural research projects.
Balance at the start of the year 11,152 12,689
Receipts 36,763 35,748
Payments (41,897) (37,285)
Balance at the end of the year 6,018 11,152
Agriculture Research Grants Account No. 2 (interest bearing)
The purpose of the fund is to receive and disperse funds from industry and other organisations in support of Agricultural research projects.
Balance at the start of the year 3,697 5,121
noteS to the finAnciAl StAtementS

Department of Agriculture and Food | Annual Report 2009 73
2009$’000
2008$’000
Receipts 10,228 12,776
Payments (8,972) (14,200)
Balance at the end of the year 4,953 3,697
Commonwealth Agriculture Activity Grants (non-interest bearing)
The purpose of the fund is to receive and disperse to conduct Commonwealth funded activities.
Balance at the start of the year 3,317 2,707
Receipts 1,563 2,424
Payments (2,206) (1,814)
Balance at the end of the year 2,674 3,317
Commonwealth Agriculture Activity Grants (interest bearing)
The purpose of the fund is to receive and disperse to conduct Commonwealth funded activities.
Balance at the start of the year 47,316 47,438
Receipts 39,334 69,257
Payments (67,121) (69,379)
Balance at the end of the year 19,529 47,316
Plant research & development
The purpose of the fund is to receive and disperse funds to conduct plant research and development in Western Australia.
Balance at the start of the year 2,453 1,420
Receipts 6,975 4,669
Payments (5,182) (3,636)
Balance at the end of the year 4,246 2,453
(Return to index of notes)
44. Special Purpose Accounts – Section 16(1)(c) t (continued)
noteS to the finAnciAl StAtementS

Department of Agriculture and Food | Annual Report 2009 74
45. Administered transactions2009
$’0002008
$’000
(i) ADMINISTERED EXPENSES AND INCOME
COST OF SERvICE
EXPENSES
Interest Payments 424 396
Total administered expenses 424 396
INCOME
User charges and fees 25 10
Interest revenue 490 458
Total Administered income 515 468
(ii) ADMINISTERED ASSETS AND LIABILITIES
CURRENT ASSETS
Cash Assets 212 121
Loan 13,680 4,082
Total Administered Current Assets 13,892 4,203
Total Administered Assets 13,892 4,203
NON-CURRENT LIABILITIES
Borrowings 13,680 4,082
Total Administered Non Current Liabilities 13,680 4,082
Total Administered Liabilities 13,680 4,082
Administered transactions are not considered to form part of the department’s operational services
(Return to index of notes)
noteS to the finAnciAl StAtementS

Department of Agriculture and Food | Annual Report 2009 75
Key peRfoRmAnce inDicAtoRS
Certification of Key Performance Indicators
As prescribed by Treasurer’s Instruction 904, the Key Performance Indicators provide information to assist readers to assess the performance of the Department of Agriculture and Food in meeting its mission and outcomes.
I hereby certify that the performance indicators are based on proper records, are relevant and appropriate for assisting users to assess the Department of Agriculture and Food’s performance, and fairly represent the performance of the Department of Agriculture and Food for the financial year ended 30 June 2009.
Malcolm GoffA/Director GeneralDepartment of Agriculture and Food
4 August 2009

Department of Agriculture and Food | Annual Report 2009 76
Key peRfoRmAnce inDicAtoRS
Introduction
The Department of Agriculture and Food’s mission is to accelerate the success of agriculture, food and fibre industries through information, science and innovation, responsible management of the resource base and policy regulation across all elements of the supply chain. The department is primarily involved in economic and regional development and our widespread activities also generate strong social, community and environmental benefits. The department leads areas of cross-government activity including food, natural resource management and biosecurity. Our values of professionalism, innovation, respect and integrity are applied in the attainment of the department’s vision—to make a difference through excellence and innovation to grow Western Australia’s world-class agriculture and food sector.
Agency-level government-desired outcomesThe relationship between government goals, department-level desired outcomes and the department’s services are outlined below. Details on the specific relationship are contained within each service description.
Government goal Agency-level government-desired outcome Service Key indicators
Creating conditions that foster a strong economy delivering more jobs, opportunities and greater wealth for all Western Australians
Increased competitiveness and profitability of agriculture, food and fibre industries
1 Food and Fibre Industry Development
4 Services provided to the Rural Business Development Corporation
Effectiveness indicators(PI 1) Benefit–cost ratio and net present value of the agency’s research and development activity; (PI 2) Uptake of crop varieties developed by the department; (PI 3) Extent to which new market opportunities are developed or maintained for Western Australian agricultural produce and (PI 4) Extent to which the outcomes of research, development and extension projects improve the profitability or potential profitability of rural industries
Efficiency Indicator (PI 5) Average cost per unit of knowledge
Protecting and enhancing the unique Western Australian lifestyle and ensuring sustainable management of the environment
Improved ecological sustainable development of agri-industry
2 Agricultural Resource Management
Effectiveness indicators(PI 6) Impact of department activity on the adoption of management practices that address off-site environmental impact or contribute to the long-term sustainability of the natural resource base; (PI 7) Impact of department activity on improving the capacity of primary producers to sustainably and profitably manage the agricultural resource base and (PI 8) The impact of department activity on the capacity of agri-industry to manage change and respond to opportunities
Efficiency Indicator (PI 9) Average cost per information product; (PI 10) Average cost per hectare assessed for risks, options and impacts; (PI 11) Average cost per regulatory activity processed; (PI 12) Average cost per landcare grant administered and (PI 13) Average administrative cost per participant in farm business and rural community development activities
Ensuring that regional Western Australia is strong and vibrant
Effective management of biosecurity
3 Biosecurity Effectiveness indicators(PI 14) Animal disease identification; (PI 15) Pest interceptions by interstate and international barrier quarantine activities and (PI 16) Quarantine releases
Efficiency Indicator (PI 17) Cost per freight consignment cleared or certified; (PI 18) Passenger quarantine checking cost (per passenger); (PI 19) Cost per property management plan for animal disease and (PI 20) Cost per diagnostic samples processed (animal and plant disease and plant pest

Department of Agriculture and Food | Annual Report 2009 77
Key peRfoRmAnce inDicAtoRS
Changes to agency-level government-desired outcomes
For more than a decade the department has been charged by government to deliver against the above-mentioned outcomes. During this time the department’s services have been reviewed to meet the changes in the industry, the ongoing challenges facing the sector and the range of services the department is called upon to provide. A new strategic plan has been developed which aligns our activities against four core outcomes and one support outcome. These five outcomes are better associated with the new government goals and priority plan for agriculture and food in Western Australia and better reflect the interrelationship of the department’s key service areas.
The department has also revised its performance measures. The key effectiveness indicators are designed to measure the extent of impact of the delivery of services on the achievement of desired outcomes. The key efficiency indicators monitor the relationship between the service delivered and the benefit/cost of producing the service. The department will commence reporting against the new outcome framework in 2009–10, although some performance indicators will not be applied until subsequent financial years to allow for the collection of trend data.
Government goal: Social and environmental responsibility – ensuring that economic activity is managed in a socially and environmentally responsible manner for the long-term benefit of the state
Desired outcomes Service Key indicators (reporting to commence from 2009–10)
Land managers and producers using best-management practices
1. Land management Effectiveness:• Theimpactofdepartmentactivityontheadoptionofmanagementpracticesthataddressoff-siteenvironmentalimpactorcontributeto
the long-term sustainability of the natural resource base (reference current indicator 6)• Theimpactofdepartmentactivityonimprovingthecapacityofprimaryproducerstosustainablyandprofitablymanagetheagricultural
resource base (reference current indicator 7)
Additional effectiveness indicators proposed from 2011–12:• Adoptionratebyprimaryproducerofbetterpracticesinpriorityareas• Indexdemonstratingresourcehealthofprimaryproducersystems(changesinon-farmproductionandNRMpractices)
Efficiency:• Averagecostperunitofresearchanddevelopmentaimedatsustainableresourcesystems• Averagecostperactivityfocusedonbestmanagementpractices
Additional efficiency indicator proposed from 2011–12:
• Averagecostofmonitoringservicetrends(nominal)
Reduced incidence and impact of environmental and community-based risks
5. Community and environmental risk management
Effectiveness:• TheimpactofdepartmentactivityonthemanagementofcommunityandenvironmentalrisksAdditional effectiveness indicator proposed from 2011–12:• Impactofdepartmentactivityonthemanagementofcommunityandenvironmentalrisks
Efficiency:• Averagecostperactivityfocusedoncommunityandenvironmentalriskmanagementservices• Costperdiagnosticsamplerelatedtonon-agriculturalpestsanddiseases
Additional efficiency indicator proposed from 2011–12:• Responsetimetoeffectivelyputinplaceamanagementplan

Department of Agriculture and Food | Annual Report 2009 78
Key peRfoRmAnce inDicAtoRS
Government goal: Stronger focus on the regions – greater focus on service delivery, infrastructure investment and economic development to improve the overall quality of life in remote and regional areas
Desired outcomes Service Key indicators (reporting to commence from 2009–10)
An innovative and adaptive production sector which effectively manages risk
2. Production system solutions Effectiveness:• Uptakeofcropvarietiesdevelopedbythedepartment(referencecurrentindicator6)• Theextenttowhichtheoutcomesofresearch,developmentandextensionprojectsimprovetheprofitabilityorpotentialprofitabilityof
rural industries (reference current indicator 4)
Additional effectiveness indicators proposed from 2011–12:• Totalfactorproductivity• Rateofuptakeofdepartment-developedproductivity-focusedtechnologieswhichimprovelong-termprofitability
Efficiency:• Averagecostperunitofresearchanddevelopmentaimedatproductionsystemsolutions• Averagecostperactivityfocusedoninnovationandadaptation• Averagecostperregulatoryactivity.
Additional efficiency indicator proposed from 2011–12:• Biosecurityservicecosttrends(nominalusingscheduledsetofpestsanddiseases)
Competitive food and agricultural industries
3. Industry and regional support
Effectiveness:• Thebenefit–costratioandnetpresentvalueoftheagency’sresearchanddevelopmentandbiosecurityactivity(referencecurrent
indicator 1)• Theimpactofdepartmentactivityonthecapacityofagri-industrytomanageandchangeandrespondtoopportunities(reference
current indicator 8).
Additional effectiveness indicators proposed from 2011–12:• RateofreturntrendoncapitalforWAagriculturebusinessesexcludinglandappreciationbenefitscomparedtoeasternstates• Chainefficiency–trendinunitcost/timeofsupply/valuechaincomponents(costofdoingbusinessinWAagrifoodindustries,key
elements of value chain)
Efficiency:• Averagecostperactivityfocusedonfoodindustryneeds,issuesandpolicydevelopment.• Averagecostperactivityfocusedonindustrysupplychainissues• Averagecostperactivityfocusedonregionalindustryneedsandissues
Additional efficiency indicator proposed from 2011–12:• Returnoninvestmentattractionactivities

Department of Agriculture and Food | Annual Report 2009 79
Key peRfoRmAnce inDicAtoRS
Government goal: Outcome-based service delivery – greater focus on achieving results in key service delivery areas for the benefit of all Western Australians
Desired outcomes Service Key indicators (reporting to commence from 2009–10)
Increased value of domestic and international trade
4. Market development Effectiveness:• TheextenttowhichnewmarketopportunitiesaredevelopedormaintainedforWesternAustralianagriculturalproduce(referencecurrent
indicator 3)• Interceptionsofsignificantpests,diseasesandweedsbyinterstateandinternationalbarrierquarantineactivities(referencecurrent
indicator 15)
Additional effectiveness indicators proposed from 2011–12:• Valueofexportrevenueslost(saved)asaresultofbreachesofWAbiosecuritysystems• Valueoftraderelatedtospecificmarketsthatthedepartmenthashaddirectinvolvementinitsdevelopment
Efficiency:• Averagecostperunitofresearchanddevelopmentaimedatmarketdevelopmentservices• Averagecostperactivityfocusedonmarketdevelopment,policyandadvice• Averagecostperactivityfocusedonlegislation,regulationandpolicydevelopment.• Averagecostperregulatoryactivityprocessed• Costperfreightconsignmentinspected(notallconsignmentsinspected)• Costperdiagnosticsample
Measuring our performanceEffectiveness indicators provide information on the extent to which the department’s programs have contributed to economic and regional development. Key efficiency indicators measure the level of resource inputs required to deliver them, including costs. Analysis of the measures includes comparison with targets for the current year and performance in previous years.
The department’s focus is moving to a whole of supply chain approach and the indicators support decision-making processes that are relative to the department’s role to identify, support and promote a competitive and profitable industry sector and diversified markets. The department’s performance is measured through statistical-based information and survey questionnaires. The use of both qualitative and quantitative measures adds scope and objectivity to the sources of information used in measuring our performance.
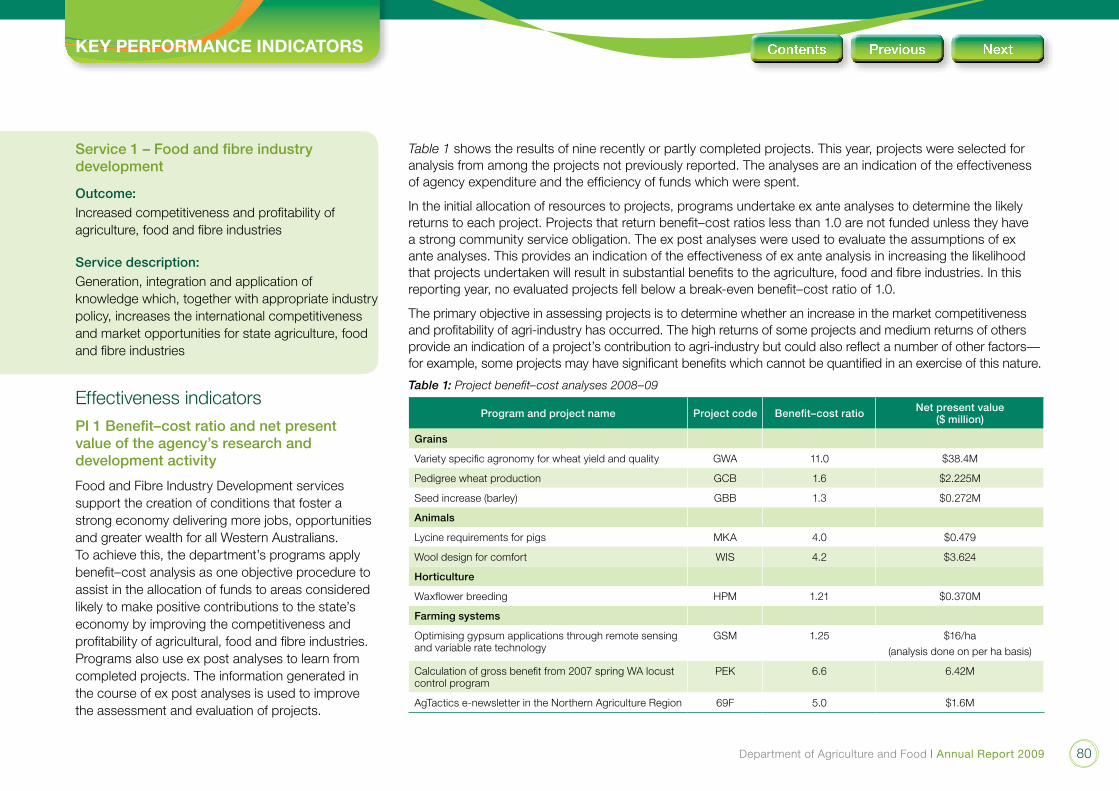
Department of Agriculture and Food | Annual Report 2009 80
Key peRfoRmAnce inDicAtoRS
Table 1 shows the results of nine recently or partly completed projects. This year, projects were selected for analysis from among the projects not previously reported. The analyses are an indication of the effectiveness of agency expenditure and the efficiency of funds which were spent.
In the initial allocation of resources to projects, programs undertake ex ante analyses to determine the likely returns to each project. Projects that return benefit–cost ratios less than 1.0 are not funded unless they have a strong community service obligation. The ex post analyses were used to evaluate the assumptions of ex ante analyses. This provides an indication of the effectiveness of ex ante analysis in increasing the likelihood that projects undertaken will result in substantial benefits to the agriculture, food and fibre industries. In this reporting year, no evaluated projects fell below a break-even benefit–cost ratio of 1.0.
The primary objective in assessing projects is to determine whether an increase in the market competitiveness and profitability of agri-industry has occurred. The high returns of some projects and medium returns of others provide an indication of a project’s contribution to agri-industry but could also reflect a number of other factors—for example, some projects may have significant benefits which cannot be quantified in an exercise of this nature.
Table 1: Project benefit–cost analyses 2008–09
Program and project name Project code Benefit–cost ratio Net present value ($ million)
Grains
Variety specific agronomy for wheat yield and quality GWA 11.0 $38.4M
Pedigree wheat production GCB 1.6 $2.225M
Seed increase (barley) GBB 1.3 $0.272M
Animals
Lycine requirements for pigs MKA 4.0 $0.479
Wool design for comfort WIS 4.2 $3.624
Horticulture
Waxflower breeding HPM 1.21 $0.370M
Farming systems
Optimising gypsum applications through remote sensing and variable rate technology
GSM 1.25 $16/ha
(analysis done on per ha basis)
Calculation of gross benefit from 2007 spring WA locust control program
PEK 6.6 6.42M
AgTactics e-newsletter in the Northern Agriculture Region 69F 5.0 $1.6M
Service 1 – Food and fibre industry development
Outcome:Increased competitiveness and profitability of agriculture, food and fibre industries
Service description:Generation, integration and application of knowledge which, together with appropriate industry policy, increases the international competitiveness and market opportunities for state agriculture, food and fibre industries
Effectiveness indicatorsPI 1 Benefit–cost ratio and net present value of the agency’s research and development activity
Food and Fibre Industry Development services support the creation of conditions that foster a strong economy delivering more jobs, opportunities and greater wealth for all Western Australians. To achieve this, the department’s programs apply benefit–cost analysis as one objective procedure to assist in the allocation of funds to areas considered likely to make positive contributions to the state’s economy by improving the competitiveness and profitability of agricultural, food and fibre industries. Programs also use ex post analyses to learn from completed projects. The information generated in the course of ex post analyses is used to improve the assessment and evaluation of projects.

Department of Agriculture and Food | Annual Report 2009 81
Key peRfoRmAnce inDicAtoRS
PI 2 uptake of crop varieties developed by the departmentHistorically the department has been the main provider of new varieties of dominant export crops grown in Western Australia such as wheat, lupins and barley. The choice of variety is a major factor when considering production costs and marketing strategies. Before production even begins farmers need to know how a variety is likely to perform, having considered its suitability to soil and climate, the benefits in terms of disease resistance and end-product quality and demand.
Meeting the target represents a positive result. It demonstrates actions by the department to
increase the competitiveness and profitability of the grains fibre industries. This outcome fosters a strong economy delivering more jobs, opportunities and greater wealth for all Western Australians.
Table 2 indicates that the department expects the uptake of varieties developed by the department (or in a partnership arrangement) to remain at high levels with most varieties having a greater than 75 per cent level of market utilisation. This market share of varieties highlights the effectiveness of the breeding programs for Western Australian conditions.
The total of seasonal hectares sown increased almost 15 per cent on 2007–08 as the result of an excellent season and strong market. See Figure 1.
Figure 1: Trend indicating uptake of crop varieties developed by the department (or in a partnership agreement)
Table 2: Uptake of crop varieties developed by the department (or in a partnership arrangement)
2007–08 2008–09 Target 2008–09 Actual
variety% of WA crop area sown to crop varieties
developed by the department (or in a partnership arrangement)
Season hectares
Percentage of Western Australian crop area sown to crop varieties developed by the department (or in a partnership
arrangement)
Percentage of Western Australian crop area sown to crop varieties developed by the department (or in a partnership
arrangement)
Season hectares
Wheat 78% 3,459,901 75% 77% 3,964,924
Barley 96% 1,088,712 95% 93% 1,259,789
Oats 98% 119,908 98% 96% 176,581
Lupins 100% 178,802 100% 100% 351,167
Total 83% 4,847,323 80% 83% 5,752,461
Source: Co-operative Bulk Handling Ltd (CBH)
Note: Due to the low volume of chick pea production in Western Australia, chick peas have not been reported. In future years the percentage of crop area sown to wheat will not be reported in the department’s annual report.
83% 83% 83%85%88%89%
0
1,000,000
2,000,000
3,000,000
4,000,000
5,000,000
6,000,000
7,000,000
8,000,000
2003-04 2004-05 2005-06 2006-07 2007-08 2008-09
Hec
tare
s
76%
78%
80%
82%
84%
86%
88%
90%
92%
Season hectares plantedPercentage of WA crop area sown to varieties developed by the Department (or in a partnership arrangement)

Department of Agriculture and Food | Annual Report 2009 82
InterGrain Pty Ltd, an incorporated wheat breeding joint venture between the Western Australian Agriculture Authority and the Grains Research and Development Corporation (established October 2007), is conducting the wheat breeding activities formerly undertaken by the department to continue to breed better wheat varieties for Western Australia and parts of South-East Australia. Industry utilisation of wheat varieties, now under management of InterGrain, remains high at 77 per cent of total area sown, reflecting the historical strength of the wheat breeding effort combined with the ongoing success of the InterGrain Pty Ltd breeding effort.
PI 3 Extent to which new market opportunities are developed or maintained for Western Australian agricultural produce
The department is committed to developing the trade for agrifood products and increasing investment in and the expansion of the Western Australian agrifood industry. One of the department’s key roles is to assist the industry in the identification and development of markets for international trade. The aim of this service is to promote a sustainable and strong economy that benefits Western Australians. This requires building long-term relationships with overseas buyers and often takes many years to produce tangible results.
The overall results for this indicator are considered to be positive. Table 3 shows a range of products the department has focused its efforts on, in various markets, over a number of years. Efforts to develop export markets can be impacted by a range of adverse measures including the global economic crisis, climate variability, outbreak of diseases, currency fluctuations and global conflicts.
Working with the Western Australian Government’s International Trade and Investment Offices (WATO) and Austrade, the department assisted in the coordination of a number of trade exhibitions aimed at promoting the state’s agrifood industries to targeted markets.
The department has engaged in a number of ongoing activities that have contributed to Western Australian agrifood producers and companies securing new export opportunities and becoming more competitive. Through continued efforts the department has encouraged and developed stronger trading relations for the state’s producers. The following examples support this activity.
Table 3: Trade opportunities developed in export markets
Commodity Destination2004–05($’000)
2005*($’000)
2006*($’000)
2007*($’000)
2008*Target($’000)
2008*Actual($’000)
Pork Singapore 29,607 28,629 30,358 26,762 23,000 26,303
Beef Japan 51,950 42,260 29,468 32,028 34,000 36,023
South Korea 26,038 29,466 42,365 33,084 36,000 31,170
Lamb Japan 6,267 9,788 10,096 6,045 7,000 5,353
South Korea 686 960 1,779 2,511 3,000 2,032
UAE 5,098 5,571 7,636 12,736 12,000 19,786
Milk Malaysia 2,199 2,328 2,984 4,550 4,500 4,295
Hong Kong 7,484 8,663 8,173 8,920 9,000 7,405
Hay Japan 69,394 80,603 99,634 82,656 75,000 93,274
South Korea 7,385 6,861 7,479 10,565 9,000 21,010
Strawberries Thailand 113 141 242 382 350 522
Source: Australian Bureau of Statistics (ABS)
* Due to a change in the reporting requirements, the export trade data from 2005 on is reported on a calendar year basis rather than a financial year basis. ABS also moved to an Australian Business Register (ABR)-based framework to conduct the 2005–06 Agricultural Census. These changes should be taken into account when comparing trends.
Key peRfoRmAnce inDicAtoRS
Department of Agriculture and Food | Annual Report 2009 83
Japan• The department organised a buyers’ visit and assisted major importers to source Western Australian canola, barley, wheat and oaten hay and beef.• In association with WATO Japan the department assisted with an investigation of the marron industry in Western Australia and introductions of a local exporter
to a seafood importer. This was aimed at successfully reopening marron exports from Western Australia to Japan after they were suspended due to a change in Japanese import protocols.
• The department identified and facilitated business opportunities for Western Australian fresh produce, processed foods and meat products exporters (that is, carrots concentrate, cheese, olive oil, salt and wildflowers).
Middle East/Africa• The department worked with industry stakeholders to expand the Libyan cattle/sheep market to Australian exporters and producers resulting in livestock exports of
cattle and sheep increasing by about 25 per cent and 350 per cent respectively. Since 2007, over $25 million of livestock has been exported to Libya.
• Working with industry new opportunities were identified for:− export of lupin and hay to Saudi Arabia, and facilitated the development of a Western Australian forage group which will be focusing on the Gulf region− wheat export to Saudi Arabia generating commercial interest by the major Saudi importer which resulted in a joint project on scientific research to support the
sale of Western Australian wheat to the Saudi market− import of Nejdi sheep genetics for the development of the Western Australian sheep industry.
• The department has collaborated with the Ministry of Agriculture Libya in association with the universities of Curtin and Western Australia to provide a Project Design for two rangeland centres dealing with pasture and fodder shrubs, extension and capacity building. Revenue received for the project in 2008–09 was $1.17 million.
• The department completed the Abu Dhabi Soil Survey Project and received revenue of $635 000 in 2008–09.• The department completed a capacity building assignment for the Ministry of Agriculture in Botswana to enhance their plant quarantine system and received almost
$120 000 in revenue.
China/HongKong/Taiwan• With a view to expanding commercial ties, the department—with WATO China and Austrade—promoted Western Australian products to the region. Events
supported included joint Australian Food and Culture Festivals to promote Western Australian exports in four major cities in China (Beijing, Shanghai, Tianjin and Shenyang) and the Western Australian Fine Food Festival. Almost $1 million worth of olive oil, wine, fruit juice, nougat and lobster was exported as a result of the events.
• In association with the Wine Industry Association of Western Australia, the department organised the Hong Kong International Wine Fair during November 2008 resulting in exports of over $200 000.
• The department provided a Western Australia study tour and training program for 12 senior Chinese agribusiness managers.
Key peRfoRmAnce inDicAtoRS

Department of Agriculture and Food | Annual Report 2009 84
South-East Asia• In association with Austrade, the department organised visit programs for Singaporean buyers. This program resulted in the export of meat, fresh produce and
gourmet fine food. The program was similar to an earlier exercise when the department hosted Singaporean buyers at Fine Food Perth 2007. A buyer recently advised that since attending the 2007 function they have estimated their purchases, from Western Australia, increased by almost 60 per cent to over A$2.3 million.
• The department, together with industry and major importers in Thailand, identified and promoted export opportunities for Western Australian over $1 million of fresh produce and meat products.
• The department provided support industry to overcome quarantine issues with the Thai Government resulting in the ongoing exports of seed potatoes in Thailand.• The department assisted industry to establish an export network and conduct consumer and market testing to develop long-term marketing strategies for a new
variety of fruit in South-East Asia.• In association with WATO Kuala Lumpur, the department organised and assisted nine companies to exhibit and participate at the Malaysia Agriculture, Horticulture
and Agro-Tourism Show in Kuala Lumpur.• The department, in partnership with the Malaysian Department for Veterinary Services, assisted in the development of a strategic master plan to invigorate the
Malaysian Boer goat industry. Revenue received was over $110 000.
South Korea• In conjunction with Meat & Livestock Australia and WATO Korea, the department organised a study tour for Korea’s major meat importers (accounting for over 80
percent of the total Australian beef market in Korea). This tour will assist the state to maintain its market share as the South Korean market reopens to US beef imports.
• Together with WATO Korea and E-mart (the largest hypermarket chain in Korea), a WA beef promotion was organised at all the chain’s branches, resulting in $870 000 of sales during the promotion.
• Together with WATO Korea, new wine sales contracts worth $180 000 for the first shipment were facilitated.
PI 4 Extent to which the outcomes of research, development and extension projects improve the profitability or potential profitability of rural industries
The department undertakes research, development and extension activities across a range of agri-industries aimed at improving, or maintaining, the profitability of rural industries. These activities support the sustained economic development of the state.
The following industry sectors provide examples of the outcomes of this work.
Key peRfoRmAnce inDicAtoRS

Department of Agriculture and Food | Annual Report 2009 85
StrawberriesThe strawberry industry in Western Australia accounts for about 80 per cent of Australia’s strawberry exports by both volume and value. Widespread adoption of soil fumigation practices by Wanneroo growers resulted in yield increases by most growers in the 2007 season and these were enhanced in 2008 as growers became more familiar with the application techniques. The results for 2008–09 are considered to be positive. In comparison to 2007 the tonnage of strawberries exported increased by 15 per cent in 2008. The department, in partnership with University of Western Australia (UWA) played a significant role in this productivity shift by identifying the primary cause of premature plant death and yield loss and demonstrating the benefits of fumigation and tolerant varieties to growers. This productivity gain made more fruit available for export than in 2007
and, coupled with a more favourable exchange rate and a decreased demand from eastern Australia, resulted in export targets being exceeded.
The top three markets for Western Australian strawberries are United Arab Emirates (UAE) Singapore and Hong Kong. There was significant growth in trade to Thailand, New Zealand, Qatar, Bahrain and the United Kingdom. The department actively assisted local exporters to find new markets in Thailand, and the work done in 2007 to overcome quarantine barriers in the UAE resulted in an uninterrupted trade in 2008. Steady growth trends are forecast in 2009 due to the excellent reputation of the state’s strawberries in export markets, particularly in the Middle East.
The department has developed best practice guidelines for irrigation and nutrition of strawberries on coastal sands. These guidelines have not yet been fully adopted by industry and steady productivity gains are expected over the next five years as adoption becomes more widespread. Research is continuing to improve cool chain handling and out turn in distant markets as well as to identify the next generation of high yield and quality strawberry varieties. The department and industry are jointly funding a project with the UWA to further elucidate causes of root disease and to explore the genetic basis of resistance using molecular biology techniques with a longer term view to introduce key genes into Australian-bred varieties.
CarrotsWestern Australian carrots have an outstanding reputation for quality, reliability and food safety. The department has assisted carrot producers and exporters to focus on costs, quality, product differentiation and market access. The department continues to work closely with the carrot industry to develop highly efficient production systems to improve yield and quality, thereby reducing unit production costs and increasing international competitiveness. Irrigation and nutrient-use efficiency are currently the focus of the department’s industry-funded research and development projects. This work underpins the development of environmental assurance systems that aim to contribute to increased scope for differentiating Western Australian produce in international
$6,291,217$5,765,907
$6,000,000
$7,534,041
1,050
1,100
1,150
1,200
1,250
1,300
1,350
1,400
Tonn
es
$0
$1,000,000
$2,000,000
$3,000,000
$4,000,000
$5,000,000
$6,000,000
$7,000,000
$8,000,000
Valu
e of
Exp
orts
Tonnes Value of Export ($)
2006 2007 2008(target)
2008(actual)
Figure 2: Volume and value of strawberry exports (A$)
Source: Australian Bureau of Statistics (ABS)
Key peRfoRmAnce inDicAtoRS
$41,200,000
$34,226,396
$40,228,408$36,579,396
0
10,000
20,000
30,000
40,000
50,000
60,000
70,000
Tonn
es
$0$5,000,000$10,000,000$15,000,000$20,000,000$25,000,000$30,000,000$35,000,000$40,000,000$45,000,000
Valu
e of
Exp
orts
Tonnes Value of Exports ($)
2006 2007 2008(target)
2008(actual)
Figure 3: Volume and value of carrot exports (A$)
Source: Australian Bureau of Statistics (ABS)

Department of Agriculture and Food | Annual Report 2009 86
markets. Department specialists are also working closely with industry and Biosecurity Australia in developing a protocol to reopen the carrot market in Taiwan following changes to Taiwan’s quarantine regulations implemented in March 2009 which saw Western Australian carrots excluded from Taiwan.
In comparison to 2006 statistics, the value and volume of carrot exports from Western Australia to overseas markets declined in 2007 and 2008. This was as a result of the strength of the Australian dollar and high prices offered by eastern states markets. Continued drought in the Murray-Darling Basin resulted in an increased demand for Western Australian carrots. The department estimates that about 20 000 tonnes were sold in 2007–08 to the eastern states. Sales within Australia are not reflected in Figure 3.
Western Australia produces almost 90 per cent of Australia’s carrot exports (by value) with carrots being shipped to more than 20 countries. The major export markets for Western Australian carrots were Singapore, United Arab Emirates, Malaysia and Saudi Arabia. In 2008 significant growth occurred in export markets to Fiji, Qatar, Saudi Arabia, Maldives, Japan and Kuwait. New markets were obtained to New Caledonia, Vanuatu and Papua New Guinea while shipments to niche markets in the United Kingdom and Indonesia contracted.
Seed potatoesWestern Australia has a competitive advantage in this high-value international market because of our state’s freedom from major potato pests and diseases. Exceeding the target represents a positive result. In 2008 the tonnage of seed potatoes exported increased by almost 50 per cent when compared to the previous calendar year. This improvement followed a recent decline in the market that was caused by a range of challenges including Indonesian import permit issues, the continuing high value of the Australian dollar and difficulty in obtaining written advanced contracts. The year saw a significant increase in the demand from export markets in Mauritius, Indonesia, Thailand and Bangladesh.
The department continues to be actively involved in the development of the export seed potato market and plays a role in promoting Western Australian seed in new markets. For example, in 2008 the department continued as the lead agency in the Australian Centre for International Agricultural Research development project ‘Optimising the productivity of the potato/brassica cropping system in Central and West Java’. Work is being undertaken, together with industry and other government agencies, to further refine and develop sustainable production practices and secure new markets.
Diversification of wheat gradesThe department has been innovative in developing and enhancing the value of the Western Australian wheat industry having consideration to soil types used for growing crops, tighter crop rotations and characteristics sought by international markets. The results for 2008–09 are considered to be within an acceptable range.
The department responded to market signals and jointly invested with the Grains Research Development Corporation and InterGrain Pty Ltd to develop agronomic packages and premium quality wheat varieties for specific market requirements and products. The department also worked with industry to develop appropriate grain segregations and quality testing procedures. A diverse range of varieties is required to allow for environmental, climatic, seasonal and market changes.
$1,209,732 $1,191,890
$1,459,000
$2,706,125
0
500
1,000
1,500
2,000
2,500
3,000
Tonn
es
0
$500,000
$1,000,000
$1,500,000
$2,000,000
$2,500,000
$3,000,000
Valu
e of
Exp
orts
Tonnes Value of Exports ($)
2006 2007 2008(target)
2008(actual)
Figure 4: Exports of seed potatoes from Western Australia (A$)
Source: Australian Bureau of Statistics (ABS)
Key peRfoRmAnce inDicAtoRS

Department of Agriculture and Food | Annual Report 2009 87
Figure 5 shows the five-year trend summary of the wheat delivery data that shows the move towards higher quality and premium segregation and away from the more generic lower quality Australian Standards White (ASW) grade. The impact of seasonal variances on crop production is also evident. The graph indicates the relationship between ASW and Australian Standard White Noodles (ASWN) as the varieties are better suited to different conditions. There is a need to continue to monitor trends and respond to the need to develop agronomic packages and premium quality wheat varieties for specific market requirements, climatic conditions and products.
The department will commence reporting against the new outcome framework in 2009–10 and in the future this performance measure will not be reported.
Western Australian wheat yieldsThe department has worked to increase the yields of the state’s wheat producers through a range of activities. These include promoting a high input/high yield package and many better climate risk management techniques, such as early sowing with more nitrogen, better rotations and improved disease control. The preliminary ABARE estimate of 1.82 tonne/hectare (t/ha) is slightly higher than the 10-year average. The results are considered to fall within an acceptable range.
As shown in Performance Indicator (PI) 2 the higher yielding varieties developed by the department have had a high rate of adoption by the state’s wheat industry. Figure 6 shows that these activities have resulted in a marked increase in the rate of crop yield improvement over the past 25 years. Between 1930 and 1981 wheat yields increased by 7 kg/ha/year but this has increased to 20 kg/ha/year between 1982 and 2008. By comparison, eastern Australian yields have levelled out over the past 25 years and have only increased at 1/kg/ha/year. In Western Australia very poor seasons in 2000, 2002, 2006 and 2007 have contributed to greater yield variability.
The department is reviewing the need to update our crop forecasting system to work out real increases in state yields with climate trends removed.
The need to apply risk management strategies such as seasonal forecasting systems and risk management tools is critical if farmers are to take advantage of good seasons and minimise losses in dry years. The department works with agrifood producers to increase their profitability by providing market and growing season outlooks and findings of research and economic development activities.
50%
AH APW ASW ASWN AGP2004-05 2005-06 2006-07 2007-08 2008-09
20%
15%
10%
5%
0%
45%
40%
35%
30%
25%
Source: Co-operative Bulk Handling (CBH)
Note: Wheat grades have not been reported where they have remained below five per cent during the trend period
Figure 5: Percentage of Western Australian wheat grades delivered from 2004-05 to 2008-09
0
0.4
0.8
1.2
1.6
2
Year
Yiel
d (t/
ha)
1930 1945 1960 1975 1990 2005
Figure 6: Average wheat yields in Western Australia 1930-2008 (t/ha/year)
Source: Australian Bureau of Statistics (ABS) and ABAR
Key peRfoRmAnce inDicAtoRS

Department of Agriculture and Food | Annual Report 2009 88
WoolThe state’s wool clip has responded to market demand for finer wool. In 2008–09, 34.7 per cent of the state’s clip was classed as super fine (under 19.5 micron) (Australian Wool Testing Authority, June 2009). This is the premium segment of the market for Merino wool. It is mainly used in the production of fine apparel. Since July 2008, the fibre diameter of Western Australian wool has averaged 20.3 micron, around two micron finer than a decade earlier. This is a result of improved selection for fine wool and the increased proportion of ewes in the flock resulting from the widespread uptake of prime lamb production. The results are considered to fall within an acceptable range and support the improvement and profitability of rural industries.
Seasonal variation, both within and between years, exerts considerable short-term influence on fibre diameter. Poorer growing conditions in 2006 and 2007 across some sheep-producing areas have contributed to the lower fibre diameter of the state’s wool clip in those years. Better conditions in 2008 have resulted in a small rebound in fibre diameter accompanied by the benefits of increased wool cut per sheep.
Continued reduction in fibre diameter will be impeded by the increase in cross-bred lamb production and the broader wool produced by those sheep. The target over the next five years is to maintain fibre diameter at the current level or to slightly reduce diameter of the Merino component of the clip.
Fluctuations in seasonal conditions between years drive increases or decreases in both fleece weight and fibre diameter. For the producer, these changes largely cancel each other, as a higher average diameter and the resulting lower price is to some extent offset by higher wool cut per sheep.
Table 4: Average fibre diameter of wool tested in Western Australia and percentage of state clip in superfine category
Service measures 2006–07 Actual
2007–08 Actual
2008–09 Target
2008–09 Actual
1 Average diameter of wool tested in state 20.3 20.1 19.9 20.3
2 Percentage of state clip in superfine category 37.5 42 39 35
Source: Department of Agriculture and Food and Australian Wool Testing Authority (AWTA) data.
Key peRfoRmAnce inDicAtoRS
Efficiency indicatorPI 5 Average cost per unit of knowledge
The Food and Fibre Industry Development service is described as the generation, integration and application of knowledge that increases the international competitiveness and market opportunities for the state’s agriculture, food and fibre industries. The use of this knowledge promotes conditions that foster a profitable and strong economy that benefits all Western Australians.
Research, Development and Extension (R,D&E) organisations tend to have particular difficulty determining meaningful and measurable units of services to report efficiency. It is not cost-effective to measure each individual piece of R,D&E and the component processes as the service produced is knowledge. Knowledge may also take many forms each requiring different resources and commitment. Some organisations have elected to count variations in person days or hours committed to research. This is input focused and is not considered to be a true determinant of efficiency, such as inputs to outputs.

In 1998–99 the department instituted a process to enable annual collection of numbers of publications and other services produced by department staff associated with Food and Fibre Industry Development. Publications are considered the most suitable means of capturing (in the form of cost to a unit of service) the knowledge produced. In addition, another key form of knowledge generation, integration and application is the key strategies directly related to improving the productivity and competitiveness of producers.
Figure 7 presents the results of this efficiency measure for the past five years. The average cost of generating units of knowledge within the Food and Fibre Industry Development service area has not varied significantly (less than one per cent movement). Both average and total costs fell below the target figure. These results are considered to be within an acceptable range.
The department’s research projects vary in terms of complexity and may have timeframes of five to 10 years. The R,D&E services fluctuate from year to year having consideration to the nature of the department’s operations. The department will commence reporting against the new outcome framework in 2009–10 and this performance measure will not be reported in the same format.
Key peRfoRmAnce inDicAtoRS
Figure 7: Average cost per unit of knowledge 2004-05 to 2008-09
$26,298 $31,543 $31,635 $28,422 $32,013 $28,667$0
$10,000
$20,000
$30,000
$40,000
(target) (actual)
Ave
rage
cos
t
$70,000,000
$80,000,000
$90,000,000
$100,000,000
Tota
l cos
t
Average cost per unit of knowledge Total cost
2004-05 2005-06 2006-07 2008-09 2008-092007-08
Source: Department of Agriculture and Food
Department of Agriculture and Food | Annual Report 2009 89

Department of Agriculture and Food | Annual Report 2009 90
Service 2 – Agricultural Resource Management
Outcome:Improved ecological sustainable development of agri-industry
Service description:Generation, integration and application of knowledge which, together with appropriate policy and regulation, develops the capacity of rural communities and industries to profit from environmentally responsible agriculture
Effectiveness indicatorsThe ecological sustainability of agri-industry will be improved if primary producers are able to:• adopt sustainable land management practices• sustainably and profitably manage their
businesses• be responsive to change and open to
opportunities.The Agricultural Resource Management (ARM) service contributes to all these areas. However, its effect is often difficult to measure due to concurrent changes in seasonal conditions and market forces and the long timeframes for response and improvement in natural systems. By promoting continuous ecological sustainable development of agri-industry the unique Western Australian lifestyle is enhanced and protected.
It is considered that the department met the performance measures for this service’s effectiveness indicators. The analysis of each indicator is discussed below.
PI 6 Impact of department activity on the adoption of management practices that address off-site environmental impact or contribute to the long-term sustainability of the natural resource base
The adoption of management practices that reduce off-site environmental impact or contribute to the long-term sustainability of the natural resource base is crucial to the development and maintenance of profitable agricultural industries in Western Australia. A 2006–07 nationwide natural resource management (NRM) survey by the Australian Bureau of Statistics1 ABS (4620.0) asked primary producers to report the extent of natural resource management issues and activity. In Western Australia the survey (latest release June 2008) found that:• about 65 per cent of agricultural businesses
performed some form of NRM (namely weed, pest and land and soil management) activity
• agricultural businesses invested an estimated $526 million in NRM. Of this, 65 per cent was spent on weed management, 20 per cent on pest management and 15 per cent on land and soil management
• on an individual basis, agricultural businesses spent an average of $41 000 on NRM—the highest rate of investment of all states/territories
• 68 per cent of agricultural businesses reported improved NRM practices. The national average was 66 per cent
• as with all other states and territories, increasing productivity and farm sustainability were the most commonly reported reasons for improving NRM practices
• a higher proportion of farmers reported undertaking activities other than those reported as problems, indicating NRM problems continue to be managed preventatively as well as remedially.
The results of this national survey support the department’s findings. The department has a number of natural resource asset and industry-based extension programs to increase the adoption of sustainable agricultural practices. PI 6 includes information on a number of measures that reflect the department’s effectiveness in achieving increased adoption of sustainable management practices.
Agricultural extension research identifies that increasing the levels of primary producers’ knowledge and skills contributes to an increase in the adoption rates of recommended practice.
1 ABS 2008. Natural Resource Management on Australian Farms 2006-07.Australian Bureau of Statistics, Canberra. www.abs.gov.au
Key peRfoRmAnce inDicAtoRS
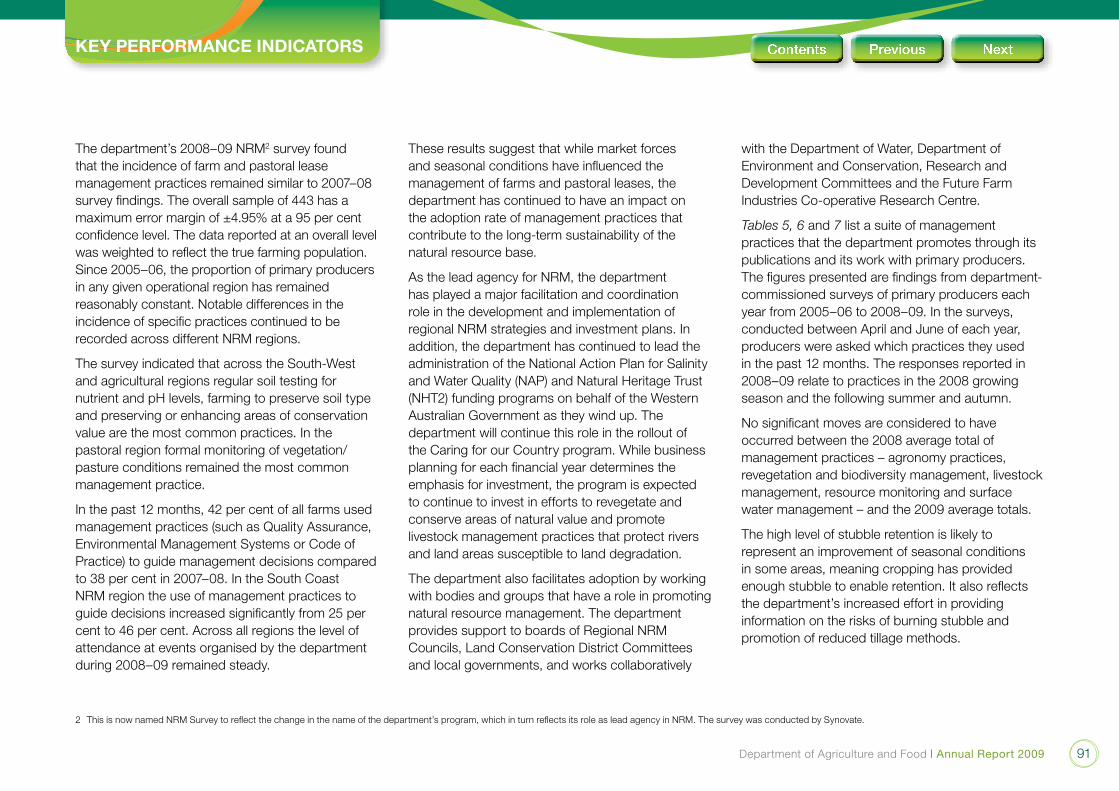
Department of Agriculture and Food | Annual Report 2009 91
2 This is now named NRM Survey to reflect the change in the name of the department’s program, which in turn reflects its role as lead agency in NRM. The survey was conducted by Synovate.
The department’s 2008–09 NRM2 survey found that the incidence of farm and pastoral lease management practices remained similar to 2007–08 survey findings. The overall sample of 443 has a maximum error margin of ±4.95% at a 95 per cent confidence level. The data reported at an overall level was weighted to reflect the true farming population. Since 2005–06, the proportion of primary producers in any given operational region has remained reasonably constant. Notable differences in the incidence of specific practices continued to be recorded across different NRM regions.
The survey indicated that across the South-West and agricultural regions regular soil testing for nutrient and pH levels, farming to preserve soil type and preserving or enhancing areas of conservation value are the most common practices. In the pastoral region formal monitoring of vegetation/pasture conditions remained the most common management practice.
In the past 12 months, 42 per cent of all farms used management practices (such as Quality Assurance, Environmental Management Systems or Code of Practice) to guide management decisions compared to 38 per cent in 2007–08. In the South Coast NRM region the use of management practices to guide decisions increased significantly from 25 per cent to 46 per cent. Across all regions the level of attendance at events organised by the department during 2008–09 remained steady.
These results suggest that while market forces and seasonal conditions have influenced the management of farms and pastoral leases, the department has continued to have an impact on the adoption rate of management practices that contribute to the long-term sustainability of the natural resource base.
As the lead agency for NRM, the department has played a major facilitation and coordination role in the development and implementation of regional NRM strategies and investment plans. In addition, the department has continued to lead the administration of the National Action Plan for Salinity and Water Quality (NAP) and Natural Heritage Trust (NHT2) funding programs on behalf of the Western Australian Government as they wind up. The department will continue this role in the rollout of the Caring for our Country program. While business planning for each financial year determines the emphasis for investment, the program is expected to continue to invest in efforts to revegetate and conserve areas of natural value and promote livestock management practices that protect rivers and land areas susceptible to land degradation.
The department also facilitates adoption by working with bodies and groups that have a role in promoting natural resource management. The department provides support to boards of Regional NRM Councils, Land Conservation District Committees and local governments, and works collaboratively
with the Department of Water, Department of Environment and Conservation, Research and Development Committees and the Future Farm Industries Co-operative Research Centre.
Tables 5, 6 and 7 list a suite of management practices that the department promotes through its publications and its work with primary producers. The figures presented are findings from department-commissioned surveys of primary producers each year from 2005–06 to 2008–09. In the surveys, conducted between April and June of each year, producers were asked which practices they used in the past 12 months. The responses reported in 2008–09 relate to practices in the 2008 growing season and the following summer and autumn.
No significant moves are considered to have occurred between the 2008 average total of management practices – agronomy practices, revegetation and biodiversity management, livestock management, resource monitoring and surface water management – and the 2009 average totals.
The high level of stubble retention is likely to represent an improvement of seasonal conditions in some areas, meaning cropping has provided enough stubble to enable retention. It also reflects the department’s increased effort in providing information on the risks of burning stubble and promotion of reduced tillage methods.
Key peRfoRmAnce inDicAtoRS

Department of Agriculture and Food | Annual Report 2009 92
The 2008–09 survey recorded the highest percentage response rate (81 per cent) against the agronomy practices of farming to soil type since this survey was first conducted in 2001–02. This result is significant as fertiliser forms one of the major farm inputcostsandaone-size-fit-allapproachisnolonger appropriate. By farming to soil type potential inputs are only applied where they are needed.
The increase across all areas of surface water management acknowledges the need to build and maintain an ecologically sustainable landscape. The management of surface water assists to protect the production value of land, improve on farm water storage and enhance areas of conservation value.
Overall, the proportion of farmers using sustainable and multi-disciplinary land management practices remained relatively constant. The results indicate that there is a high proportion of farmers who continue to use sustainable practices, reflecting long-term department activity in this area.
Table 5: Percentage of Western Australian primary producers in the sheep/wheat agricultural areas who used selected sustainable land management practices
Agricultural (%)
2006 (n=232)
2007 (n=280)
2008 (n=249)
2009 Target
2009 Actual (n=224)
Agronomy practices
Planted non-irrigated perennial pasture species 40 39 37 45 31
Planted saltland pasture species 32 29 37 45 39
Planted trees for commercial production (e.g. oil mallees, pines & bluegums)
20 18 19 45 20
Stubble retention or mulching practices 64 51 64 45 75
Farmed to soil type 72 73 68 45 81
Revegetation and biodiversity management
Tree/shrub planting 69 74 70 78 72
Preserved or enhanced areas of conservation value 80 73 71 78 79
Livestock management
Excluded stock from areas impacted by land degradation 69 66 66 72 66
Protectedriverorcreekfrontagesfromgrazinganimals 49 51 49 55 49
Resource monitoring
Regular soil testing for nutrient levels 74 74 72 75 74
Regular soil testing for pH 76 74 70 74 75
Regular soil testing for compaction 11 15 12 nil 17
Regular monitoring of the watertable 34 35 29 nil 38
Regular monitoring of pasture/vegetation cover on sandy/light soils 58 49 54 50 59
Surface water management
Water on sloping land (e.g. grade banks) 73 58 61 60 63
Water on the valley floors using surface drains 49 28 40 30 37
Water on the valley floor using deep drains 27 23 23 25 26
Source: NRM survey Denotes a statistical increase at 95 per cent confidence level Denotes a statistical decrease at 95 per cent confidence leveln = number of respondents
Key peRfoRmAnce inDicAtoRS

Department of Agriculture and Food | Annual Report 2009 93
Table 6 shows continued application of sustainable management practices by primary producers in the high rainfall region. This region includes the shires of Murray, Boddington, Collie, Bridgetown, Manjimup and all local government areas to the west of them. Since 2001–02, there has been a consistently high trend in farm management practices in the key areas of agronomy, resource monitoring and surface water management.
In comparison to 2008 no significant moves are considered to have occurred in 2009 between the average total of management practices – agronomy practices, revegetation and biodiversity management, livestock management, resource monitoring and surface water management – and average totals.
The proportion of farms managing surface water on sloping land declined. It is considered that this trend is being driven by primary producers in the eastern areas of the region where lower rainfalls were experienced. Consequently, there was less need for surface water management except in valley floors where waterlogging and salinity remain an issue irrespective of the reduced rainfall. Second, higher grain production is expected when lower rainfall is indicated because there is less nutrient leaching and waterlogging. It is also easier to manage surface water on sloping land with crop stubbles. It is thought that the respondents may not have included this method as a managing surface water practice when replying.
Table 6: Percentage of Western Australian primary producers in high rainfall agricultural areas who used selected sustainable land management practices
South West (%)
2005 (n=216)
2006 (n=232)
2007 (n=280)
2008 (n=87)
2009 (n=90)
Agronomy practices
Planted non-irrigated perennial pasture species 47 49 41 34 36
Planted trees for commercial production (e.g. oil mallees, pines & bluegums)
9 20 14 21 16
Farmed to soil type 53 55 55 52 59
Revegetation and biodiversity management
Tree/shrub planting 46 60 54 57 59
Preserved or enhanced areas of conservation value 48 58 58 62 56
Livestock management
Excluded stock from areas impacted by land degradation 35 39 35 37 33
Protectedriverorcreekfrontagesfromgrazinganimals 38 45 41 41 37
Resource monitoring
Regular soil testing for nutrient levels 58 68 65 68 64
Regular soil testing for pH 58 63 59 62 64
Regular monitoring of the watertable 22 22 28 26 28
Regular monitoring of pasture/vegetation cover on sandy/light soils 32 41 26 43 41
Surface water management
Water on sloping land (e.g. grade banks) 26 36 29 32 19
Water on the valley floors using surface drains 11 27 14 18 37
Source: NRM survey Denotes a statistical increase at 95 per cent confidence level Denotes a statistical decrease at 95 per cent confidence leveln = number of respondents
Key peRfoRmAnce inDicAtoRS

Department of Agriculture and Food | Annual Report 2009 94
This follows several years of significant action in this area and is likely to be a result of the poor seasonal conditions, lower stocking rates in some rangelands areas and the completion of sustainable land management activities.
The rangelands may be separated into two areas—southern and northern. These two areas have different landscapes, generally experience different weather and have different pastoral enterprises. For example, 2007–08 saw drought across southern areas, and flood in the northern regions. For these reasons survey findings are analysed, together with other relevant information, to identify recommended actions that are considered appropriate for specific areas within the rangelands. In recent times the department has promoted the benefits of pasture rotation. Significant investment and promotion has also occurred in the Kimberley area regarding controlled burning for management purposes.
Overall the results in Table 7 show there is a high proportion of primary producers who continue to use sustainable management practices in the rangelands. This again reflects the department’s continued efforts in this area.
Table 7: Percentage of Western Australian primary producers in the rangelands who use selected sustainable land management practices
Pastoral (%)
2005(n=110)
2006(n=89)
2007(n=61)
2008(n=104)
2009 (n=96)
Permanent control methods on stock water supplies 74 62 89 52 52
Rotational pasture spelling during plant growth season 48 53 47 44 50
Fencing to land systems 56 57 63 55 50
Conducted a prescribed burn for management purposes 27 43 42 35 41
Preserved or enhanced areas of conservation value 40 49 61 58 50
Excluded stock from areas impacted by land degradation 65 64 65 48 43
Protectedriverorcreekfrontagesfromgrazinganimals 31 33 26 34 27
Formal monitoring of vegetation/pasture conditions 74 79 82 63 58
Specifically spelled pasture for subsequent use by export cattle 22 28 30 28 25
Source: NRM survey Denotes a statistical increase at 95 per cent confidence level Denotes a statistical decrease at 95 per cent confidence leveln = number of respondents
Key peRfoRmAnce inDicAtoRS
The number of primary producers reporting planting trees for comm ercial production declined. However, there was an increase in tree/shrub planning for revegetation and biodiversity management.
Fencing has been completed, or is near completion, by community groups to protect river frontages and other vulnerable areas. The decline in livestock management is thought to be the result of this activity and changing focus of sustainable management practices by primary producers.
Compared with survey results in 2008 there was a slight decrease in the percentage of primary producers installing permanent controls on stock water supplies. This is probably because significant effort in bore capping has occurred and comparably minimal action is required in subsequent years. The percentage of pastoralists undertaking formal monitoring of vegetation/pasture conditions and fencing to land systems also declined slightly.

Department of Agriculture and Food | Annual Report 2009 95
PI 7 Impact of department activity on improving the capacity of primary producers to sustainably and profitably manage the agricultural resource base
The adoption of a continuous learning culture, innovation and improved business management skills are key drivers in building the self-reliance, competitiveness and capacity of Australia’s primary producers to meet the challenge of global change.
The department undertakes extensive work in developing and implementing farm and catchment planning workshops and farm business planning that incorporates containment strategies for natural resource risk, and contingency planning.
A survey initiated by the department in 2005 to identify influences on decision making in NRM in the Avon River Basin found that farmers and small landholders form stronger opinions of NRM strategies when influenced by the department’s extension officers, particularly for practices where they have had little experience or knowledge. The report also found that many primary producers do not belong to Landcare or catchment groups and prefer learning from their own trials. The department’s extension officers therefore provide one-on-one and group assistance and the promotion of initiatives focusing on practical, actionable on-ground activities has been important, especially on larger farms.
Figure 8 shows the percentage of respondents to the department’s NRM survey who undertook training by regions over four years. 2007 was considered to be an exceptional year with the number of respondents undertaking formal training being higher than previous years. The number of primary producers in the pastoral area involved in some form of formal training was at the second-highest level recorded at 42 per cent. The average total across the regions was considered to be maintained when compared to 2008 results. The 2009 results are considered to reflect the department’s continued efforts in this important area of building capacity.
Figure 9 shows the participation in a range of NRM/Landcare training options across all operational regions. In 2009 there was a decrease in the average number of producers who undertook formal training in the areas specified. This may reflect the need for primary producers to focus on managing day-to-day issues in the recovery from difficult seasonal conditions and postponing longer term issues of training and development. In comparison to 2008 there has been a 33 per cent decrease in the number of respondents who attended people management training. Importantly, the participation in formal training, reflected in the survey, indicates that as well as accessing a range of training opportunities provided by the department, producers are continuing to participate in external NRM training opportunities independent of public funding. This is a desirable long-term outcome that supports government goals.
n = number of respondents
24%34%42%
37%34%
15%
29%50% 37%
26%
57%
0%
15%
30%
45%
60%
2006(n=412)
2007(n=446)
2008(n=440)
2009(n=410)
Per
cent
age
of r
espo
nden
ts
South-West region Agricultural region Pastoral region
Figure 8: Number of respondents who undertook formal training by region (by per cent)
Source: NRM survey
6%
16%23%
5%
19%
9%
29%
10% 17%19%
32%25%
0%
15%
30%
45%
2006(n=412)
2007(n=446)
2008(n=440)
2009(n=410)
n = number of respondents
Per
cent
age
of r
espo
nden
ts
People management (e.g. human resource management, communication, leadership, negotiation)NRM/LandcareBusiness management (e.g. marketing, quality assurance, benchmarking)
Figure 9: Percentage of Western Australian primary producers that undertook formal training in the areas specified (%)
Source: NRM survey
Key peRfoRmAnce inDicAtoRS

Department of Agriculture and Food | Annual Report 2009 96
PI 8 The impact of department activity on the capacity of agri-industry to manage change and respond to opportunities
To profitably and sustainably manage the agricultural resource base in the long term—in the face of declining terms of trade in agriculture, increasing community expectation and market demands for environmentally responsible agriculture—it is important that agri-industry has the capacity to adapt to change and respond to opportunities. In response, the department actively promotes risk management strategies as a means of building capacity in this area through its publications and its work with primary producers and their support organisations. Figure 10 presents results from the NRM survey in which respondents were asked if they had used at least one of four risk management strategies.
These are:• drought-proofing through management of farm
water supplies• succession planning• price risk management (for example, futures
control)• off-farm investment.
Survey results reveal that a high proportion of primary producers (78 per cent) continue to use risk management strategies and that fluctuations coincide with changes in farmers’ economic conditions (due to seasonal and market factors). Commodity price trends and farm business liquidity affect both the value of hedging on wool and grain futures markets and the cash available for off-farm investment. In aggregate, the percentage of respondents who have adopted (or maintained) one of four risk management strategies has remained relatively stable throughout the eight years of surveying. There was 2.5 per cent movement between 2008 and 2009.
As a result of continued department investment in this area, it is anticipated that the adoption of management strategies will continue.
Figure 11 shows that the level of adoption of QA/EMS or Code of Practice to guide management decisions by the state’s farmers and pastoralists has increased, with all three regions having a response rate of 40 per cent or higher. In 2006–07 there
was a significant fall in the number of South-West respondents using these systems to guide their management decisions. However, in the agricultural region modest increases maintained the longer term trend of increased usage. The continued trend would in part reflect the activities of the department and the impact of co-investment with the Australian Government’s EMS Pathways to Sustainable Agriculture pilot and pathway programs.
Another factor would be the more vigorous support for these assurance approaches by other participants in the value chain—for example, the Co-operative Bulk Handling Group of Companies’ BetterFarmIQ on farm food safety and quality assurance program in the agricultural operational area.
78%
80%
79%
80%
75%
77%
79%
81%
83%
85%
2006(n=412)
2007(n=446)
2008(n=440)
2009(n=410)
n = number of respondents
Per
cent
age
of r
espo
nden
ts
Figure 10: Percentage of Western Australian primary producers who have adopted one of four risk management strategies
Source: NRM survey
Key peRfoRmAnce inDicAtoRS
2006 2007 2008 2009
Per
cent
age
of r
espo
nden
ts
0%
15%
30%
45%
60% 50%
30%
12%
South-West region Agricultural region Pastoral region
n = number of respondents
34%
31%
11%
41%
37%
43%40%
(n=412) (n=446) (n=440) (n=410)
Figure 11: Percentage of Western Australian primary producers who have adopted a Quality Assurance, Environmental Management System or Code of Practice to guide their management decisions by region
Source: NRM survey

Department of Agriculture and Food | Annual Report 2009 97
From 2008 to 2009, there was an increase of almost 10 per cent in the adoption of management practices across the regions. There has been a significant increase in the use of programs to guide their management decisions in specific areas within the pastoral region. This is attributable to the continued rollout of the Ecological Sustainable Rangeland Management (ESRM) project and its predecessor the Ecological Management Unit (EMU) project.
However, as a result of continued department investment in this area, it is anticipated that the adoption will increase, albeit slowly, across all regions in the future as market and government demand for use of these systems increases.
Key peRfoRmAnce inDicAtoRS
Efficiency indicatorsThe Agricultural Resource Management service accounts for a large number of activities that can be summarised as:• information products and services• hectares assessed for risks, options and impacts• regulatory actions under the Soil and Land
Conservation Act 1945• Landcare grant administration• farm business development and rural community
development.
PI 9 Average cost per information product
The average cost per information product was calculated by recognising that information products produced by the service are manifold and can be divided into categories such as:• publications which include serials, monographs
and refereed papers• cartographic products• contributions to corporate publications• audiovisual products such as CD-ROMs and
videos.
In all 13 projects within the department contributed to this indicator in 2009 and the average cost per information product is slightly higher than the target figure. As forecast in last year’s report there has been a reduction in total funds allocated to this indicator.
$28,206$27,578 $21,633$16,676 $15,682 $20,827$0
$5,000
$10,000
$15,000
$20,000
$25,000
$30,000
(target) (actual)
Ave
rage
cos
t
$0
$5,000,000
$10,000,000
$15,000,000
$20,000,000
$25,000,000
$30,000,000
Tota
l cos
t
Average cost per unit of information Total cost
2004-05 2005-06 2006-07 2007-08 2008-092008-09
Figure 12: Average cost per information product
Source: Project Managers, ARM Program, Department of Agriculture and Food
Figure 12 shows the actual variance between 2008 and 2009 was 16 per cent and the average cost per information product increased by over 35 per cent. This is due to a reallocation to meet the department’s obligation to NRM regional groups. These results are considered to be within an acceptable range as the number of information products varies from year to year having consideration to seasonal impacts and the nature, complexity and timeframe of the relevant project.
The department aims to provide the best possible service and make a valuable contribution to improve the ecological sustainable development of agri-industry to protect and enhance the unique Western Australian lifestyle and ensure sustainable management of the environment.

Department of Agriculture and Food | Annual Report 2009 98
To better align with government objectives and priorities a review has been completed regarding our monitoring, evaluation and performance measurement frameworks. The department will commence reporting against the new outcome framework in 2009–10 and this performance measure will not be reported in the same format.
PI 10 Average cost per hectare assessed for risks, options and impacts
Dryland salinity, waterlogging and soil erosion by wind and surface water are examples of land degradation which may be caused by agricultural practices in Western Australia. These problems affect not only farm land but public assets such as streams and rivers, native vegetation, nature reserves, road and rail infrastructure and rural towns.
Under the Western Australian Government’s State Salinity Strategy (2000) the department undertook to provide all landholders in the agricultural areas with:• an assessment of current status of, and
degradation risks to, natural resources in the south-west
• options for reducing those risks and their likely impacts
• help in accessing further information.
This is a major initiative for the department with assessments being completed in the south-west agricultural areas of the state. The project aims to assess 24 million hectares and is expected to be
completed in 2009. The resources supporting this initiative have been reallocated to other activities within the Rapid Catchment Appraisal project.
In 2008 the south coast was targeted. Because of agricultural and public land variability, the report covers smaller areas when compared to previous years. This has resulted in the average cost per hectare significantly increasing in 2008-09 to over $15 (figure 13).
$16$3$2$1$2 $14$0
$4
$8
$12
$16
(target)2008-09
(actual)
Ave
rage
cos
t
$4,000,000
$6,000,000
$8,000,000
$10,000,000
Tota
l cos
t
Average cost per hectare assessed for risks, options and impacts
Total Cost
2007-082006-072005-062004-05 2008-09
Figure 13: Average cost per hectare assessed for risks, options and impacts
Source: Project Managers, NRM Program, Department of Agriculture and Food
1 Figures reported in the 2008-09 Budget Papers were incorrect. The number of hectares was incorrectly reported as 3.352 million. The correct figure was 0.76 million hectares.
2 The average cost per hectare assessed has increased as additional funds have been allocated to this PI because the NRM service attracted additional funds via contracting with NRM Regional Groups. This arrangement with the NRM Regional Groups continued throughout 2008-09 and has impacted on the average cost per hectare assessed.
3 Figures reported in the 2008-09 Budget Papers were incorrect. The average cost per hectare assessed was incorrectly reported as $3.08. The correct figure was $13.58.
Key peRfoRmAnce inDicAtoRS
The work involved in preparing the appraisal is similar to that required for a large area. The department will commence reporting against the new outcome framework in 2009–10 and this performance measure will not be reported in future.
PI 11 Average cost per regulatory activity processed
The department is responsible for implementing the Soil and Land Conservation Act 1945. Key activities include conducting land degradation risk assessment for land clearing and drainage controls, investigation of complaints of poor land management and protection of native vegetation through covenants registered on land titles. In addition, under the Environmental Protection Act 1986, land degradation advice is provided to the Department of Environment and Conservation (DEC) and the Department of Industry and Resources (DOIR) on clearing permit applications.
In 2008–09 the number of regulatory actions processed continued to decline at a similar rate as previous year in response to changed operational arrangements (greater capacity) within the Department of Mines and Petroleum and Environment and Conservation, dry seasons and tight economic circumstances.

Department of Agriculture and Food | Annual Report 2009 99
Figure 14 presents that the average cost per regulatory action processed has reduced by one per cent when compared to 2008–09. The cost is not considered to accurately represent the average cost per service (for this project).
The department aims to provide the best possible service and make a valuable contribution to improve the ecological sustainable development of agri-industry to protect and enhance the unique Western Australian lifestyle and ensure sustainable management of the environment. To achieve this objective the department has reviewed our monitoring, evaluation and performance measurement frameworks and reallocated resources.
The department will commence reporting against the new outcome framework in 2009–10 and this performance measure will not be reported in the same format.
PI 12 Average cost per Landcare grant administered
The department provides an important service to the community through the administration of Landcare grants on behalf of the Commonwealth and state governments. Since 2008, total costs remained relatively constant while there was a lower than expected number of grants processed– Figure 15. The increase in average cost to $7,573 is considered to be within an acceptable range. The reduction in Landcare grants processed–from 320 to 242–reflects the move to funding smaller numbers of higher value projects and the winding up of projects that have come to the end of their funding. This resulted in the average cost per Landcare grant administered being higher than in previous years.
The department will commence reporting against the new outcome framework in 2009–10 and this performance measure will not be reported in future.
PI 13 Average administrative cost per participant in farm business and rural community development activities
As reported in the department’s 2008 Annual Report this activity will not be reported this year. The replacement program, Farm Training WA, commenced on 1 July 2008 and is administered by the Rural Business Development Corporation.
Key peRfoRmAnce inDicAtoRS
$27,908$22,044 $22,635 $20,627$0
$10,000
$20,000
$30,000
Ave
rage
cos
t
0
$3,000,000
$6,000,000
$9,000,000
Tota
l cos
t
Average cost per regulatory action processed
Total Cost
2008-092007-082006-072005-062004-05
$20,826
Figure 14: Average cost regulatory activity processed
Source: Register maintained by the Commissioner of Soil and Land Conservation
$4,348 $7,054 $5,869 $5,671$0
$3,000
$6,000
$9,000
Ave
rage
cos
t
$0
$1,000,000
$2,000,000
$3,000,000
Tota
l cos
t
Average cost per Landcare grant processed
Total Cost
$7,573
2004-05 2005-06 2006-07 2007-08 2008-09
Figure 15: Average cost per Landcare grant administered
Source: State NRM Office

Department of Agriculture and Food | Annual Report 2009 100
Service 3 – Biosecurity
Outcome:Effective management of biosecurity
Service description:Generation, integration and application of knowledge, policy and regulation to ensure agriculture and related resources are protected and that safety and quality standards are upheld
Effectiveness indicatorsEffective management of biosecurity directly supports the government goal of ensuring that regional Western Australia is strong and healthy. The main function of biosecurity is the gathering and provision of information on pest and disease freedom which enables producers to continue to access and establish new markets for their produce. The protection program’s key services include activities which prevent (or ensure early detection of) incursions by exotic pests, diseases and other biological and chemical threats. These threats have the potential to cause serious damage through loss of market access, damage to industry reputation, and flow-on impact to domestic and international trade, productivity losses or cost increases.
A certain frequency of incursions is inevitable—to which the response is to remove or minimise the risk of spread or damage. Removal of properties from quarantine signifies the effective local eradication or management of a pest or chemical threat.
Three streams of recorded activities are used to assess the biosecurity program’s effectiveness. These streams reflect the diversity of activities and also focus on matters of greater significance to the industry. The aggregated statistics of PI 14 Animal disease identification, PI 15 Pest interceptions by interstate and international barrier quarantine activities and PI 16 Quarantine releases are shown in Table 8.
The table includes numbers of pests and diseases as well as numbers of identifications and interceptions. This, to some extent, corrects the exaggerated influence of multiple occurrences associated with a single incident.
It is considered that overall performance of these three measures was positive and achieved due to a sustained approach to awareness-raising and compliance activities. Working closely with our key stakeholders and respective industries the department promotes biosecurity management practices that guard against animal and plant pests and diseases.
Key peRfoRmAnce inDicAtoRS
Table 8: Indicators
Service measure 2006–07 2007–08 2008–09Target
2008–09 Actual
1 Identifications of notifiable animal diseases 3 17 5 36
2 Number of animal diseases 2 4 3 5
3 Interceptions of significant pests, diseases & weeds 180 188 185 131
4 Number of pests, disease & weeds species 53 36 57 42
5 Removal of properties from quarantine 142 66 66 58
Source: Department of Agriculture and Food

Department of Agriculture and Food | Annual Report 2009 101
PI 14 Animal disease identification
For animal disease identification, early identification is critical to successful control of a disease. A primary focus is the identification of potentially serious diseases. A disease is designated as being notifiable if it matches a set of criteria that relate to the likely scale of impact on agriculture and human health.
Caution is required when comparing trends in animal disease identifications (Figure 16). The list of notifiable stock diseases of Western Australia was reduced considerably between 2002 and 2006 to bring the state list into line with changes to the national list.
While figure 16 presents that there has been an increase in the number of identifications of notifiable animal diseases in 2008 and 2009, the actual number of animal diseases identified totalled five and is considered to be a positive result. The increase in the number of identifications is mainly due to identification of porcine circovirus, virulent footrot and equine herpes virus 1. Despite remaining on the Notifiable Disease List virulent footrot and porcine circovirus have been declared as endemic.
The Department of Agriculture and Food has supported the adoption of the National Livestock Identification System (NLIS). NLIS supports the improved management of exotic and notifiable animal diseases by delivering lifetime traceability, which allows for improved speed and accuracy in the identification, ownership and movement of livestock. The department will also continue to work with the respective industries to identify, manage and successfully control exotic and notifiable animal diseases through the use of programs including the Ovine Johne’s disease abattoir surveillance program and Footrot Control Program.
The department will commence reporting against the new outcome framework in 2009–10 and this performance measure will not be reported in future.
PI 15 Interceptions of significant pests, diseases and weeds by interstate and international barrier quarantine activities
The total excludes interceptions of insects from international sources, which are reported to the Commonwealth Government. Indicator 4—number of pests, diseases and weeds—is meant to minimise undue influence of individual pest species on the total. Figure 17 shows that 42 individual pests, diseases and weeds were intercepted a total of 131 times.
The exclusion of quarantine risk material is considered an effective measure by interstate and international barrier quarantine activities. Sampling indicates successful exclusion of insect pests, plant diseases and weeds identified as quarantine risk material. A given pest is deemed significant when it is not known to be present or established in Western Australia but is capable of causing economically significant damage to the state’s agriculture, food and fibre industries.
Both the number of pests, weeds and diseases and their interceptions were less than the target for the 2008–09 year and this is viewed as a positive result. This decline is considered to reflect the results of targeted education practices by the department and improved risk management strategies. This measure fluctuates from year to year in the normal course of business and having consideration to seasonal variations.
Key peRfoRmAnce inDicAtoRS
23 3 17 5 36
2
3
4
3
55
0
10
20
30
40
Iden
tific
atio
ns o
f not
ifiab
le a
nim
al d
isea
ses
0
1
2
3
4
5
6
Num
ber
of a
nim
al d
isea
ses
Total identifications Number of animal diseases
2008-09(actual)
2008-09(target)
2007-082006-072005-06 2004-05
3
Figure 16: Animal disease identifications
Source: Department of Agriculture and Food

Department of Agriculture and Food | Annual Report 2009 102
The availability of crop and pasture seed for sowing also fluctuates and, in times of shortages, growers may have to obtain seed from sources they would normally avoid. Consequently the seed they acquire may have a low germination rate or contain a high rate of weed seed contamination. The department offers a service of assessing the documentation of seed consignments prior to the consignment being sent.
PI 16 Quarantine interventions
For quarantine releases, two activities—footrot eradication and chemical residue management—were included to demonstrate effectiveness. When a property, flock or herd is released from quarantine, usually by the issue of a permit, this signifies either freedom from a biosecurity threat or effective control of the problem by virtue of management arrangements in place. Progressive releases indicate wider freedom from the threat, while reducing the number of properties or flocks subject to future release is considered to represent a positive result.
In 2007 several animal disease programs moved into a control phase and the number of quarantined properties decreased. This is shown in figure 18. In 2009, 49 properties were removed from chemical residue quarantine and nine from footrot quarantine. The number of properties under management plans for other threats or problems has continued to decline steadily over time from 615 in 2005 to 462 in 2009. This is also an indicator of the effectiveness of the project.
The department will commence reporting against the new outcome framework in 2009–10 and this performance measure will not be reported in future.
297 192 180 188 185 131
42
78
5953
36
57
0
80
160
240
320
No.
of s
igni
fican
t pes
ts, d
isea
ses
& w
eeds
0
15
30
45
60
75
90
No.
of p
ests
, dis
ease
s &
wee
d sp
ecie
s
Interceptions of significant pests, diseases & weeds
Number of pests, disease & weeds species
2004-05 2005-06 2006-07 2007-08 2008-09(target)
2008-09 (actual)
Source: Department of Agriculture and Food
106 142 66 66 580
30
60
90
120
150
(target)
2008-09(actual)N
o. o
f pro
pert
ies
rem
oved
from
qua
rant
ine
101
2004-05 2005-06 2006-07 2007-08 2008-09
Figure 18: Removal of properties from quarantine
Source: Department of Agriculture and Food
Figure 17: Interception of significant pests, diseases and weeds
Key peRfoRmAnce inDicAtoRS

Department of Agriculture and Food | Annual Report 2009 103
Efficiency indicators
Efficient management of biosecurity directly supports the government goal of ensuring that regional Western Australia is strong and healthy. Key service areas of the protection program include those activities which prevent (or ensure early detection of) incursions by exotic pests, diseases and other biological and chemical threats. An outbreak of pests or disease has the potential to seriously impact both regional and metropolitan areas of the state. The gathering and provision of information on pest and disease freedom enables producers to continue to maintain and establish new markets for their produce.
The aggregated statistics of PI 17 Cost per freight consignment cleared or certified, PI 18 Passenger quarantine checking cost (per passenger), PI 19 Cost per property management plan for animal disease and PI 20 Cost per diagnostic samples processed (animal and plant disease and plant pest are shown in Table 9.
These activities relating to the Agriculture Protection Service have generally been classified according to the key areas of:• providing barrier quarantine and export
standards• management of animal and plant pests and
diseases• surveillance and preparedness activities (systems
to detect incursions and outbreaks and take appropriate action).
PI 17 Cost per freight consignmentThe average cost per freight consignment has increased by almost three per cent to $336 when compared to last year’s cost but remains under the amount for 2006–07. The trend for the cost per freight consignment figure has remained relatively stable. The number of consignments cleared increased around 10 per cent for 2008–09 compared to 2006–07. The target was based on a lesser number. This anticipated decrease in number did not eventuate.
PI 18 Cost per passengerThe number of domestic passenger arrivals (via air, rail, sea and vehicle) subject to quarantine checks in 2008–09 was 2 505 480 compared to 2 348 084 in 2007–08. This represents an increase of 7 per cent on the previous year. The average cost per passenger decreased from $5.29 in 2007–08 to $5.22 this year. This result falls within the expected trend and is seen as a positive outcome. The numbers of passengers entering the state fluctuates from year to year and this variation contributed to the 2008–09 target cost per passenger. The department will commence reporting against the new outcome framework in 2009–10 and in the future this performance measure will not be reported.
Key peRfoRmAnce inDicAtoRS
Table 9: Agriculture Protection Service cost measures
2006–07 2007–08 2008–09 Target
2008–09 Actual
Cost per freight consignment cleared or certified ($) 340 328 244 336
Passenger quarantine checking cost (per passenger) ($)
6.01 5.29 5.31 5.22
Cost per property management plan for animal disease ($)
7,633 7,556 6,349 3,710
Cost per diagnostic sample processed ($) 581 546 471 528
Source: Department of Agriculture and Food
Note: The figures in Table 9 were allocated from the total cost of services. The total amount of funds spent by the department towards agricultural protection was $77,790 million but includes approximately $20,262 million from the Agriculture Protection Board (APB) under a Memorandum of Understanding and Contract for Service with the department. This expenditure is accounted for in the board’s Annual Report.
The following observations and conclusions were drawn from the 2008–09 results.

Department of Agriculture and Food | Annual Report 2009 104
PI 19 Cost per property management planThe average cost per inspection to monitor property management plans decreased significantly (by almost 50 per cent). The cost stayed constant while the total number of management plans for properties inspected with organochlorines, footrot, liver fluke and bovine Johne’s disease increased from an average of 1,069 in 2007–08 to an average of 1,946 in 2008–09. The target figures for 2008–09 on property inspections were underestimated by almost 100 per cent. The placement of a property under a management plan minimises the impact of a biosecurity risk to the state’s regional areas. Inspection costs per property vary significantly. The reduction in average cost from $7,556 in 2007–08 to $3,710 in 2008–09 is seen as a positive result. The department will commence reporting against the new outcome framework in 2009–10 and in the future this performance measure will not be reported.
PI 20 Cost per diagnostic sampleThe average cost per diagnostic sample processed in 2008–09 was $528. This was a decrease by about three per cent from the previous year. This trend has remained constant over the last couple of years. The number of plant samples was up 10 per cent from 2007–08 and there was also an increased number of inquires through the department’s call centre. This result is considered to be positive.
Key peRfoRmAnce inDicAtoRS

Department of Agriculture and Food | Annual Report 2009 105
Other financial disclosures
Employment and industrial relations
Staff profile (on FTE basis)
2006–07 2007–08 2008–09
Full-time permanent 1124 1133 1095
Full-time contract 285 262 181
Part-time permanent 112 121 123
Part-time contract 59 47 33
On secondment 1 2 4
Total 1581 1565 1436
Staff development activitiesThe department is committed to the development of its employees. Our strategies focus on building a highly skilled, professional and fair workforce that has the ability to adapt to changing technology, knowledge and environment. Key activities that enhanced the professional capability of the department during 2008–09 included:• Primary Industry Science Program – a
partnership with other organisations to develop the talent and interest in primary industry science at secondary school level
• Undergraduate Studentship Program – 14 students are participating in the 2009 program and five receive financial support from the department
• Opportunities for Indigenous cadetships and traineeships continue in the fields of veterinary science, natural resource management, administration, information technology and rural operations
• The employment of apprentices with a greater opportunity for the department to employ and develop staff with relevant trade skills required by the department
• The Visiting Specialist Program encourages skilled professionals to visit Western Australia and provide learning and development opportunities for department staff.
Leave liability managementThe department’s liability for long service leave and annual leave at the end of this financial year was an average of 9.02 weeks per employee. Management initiatives for leave reduction are slowly reducing the liability.
DiScloSuReS & leGAl compliAnce
Professional44%
Technical24%
Administrative21%
Inspectorial8%
Wages 3%
20092008200720062005
9.68
9.97 9.95
9.19
9.02

Department of Agriculture and Food | Annual Report 2009 106
Workplace reform
The department, consistent with government policy on labour relations, is currently in the process of negotiating and registering an Agency Specific Agreement. The agreement incorporates entitlements which continue to provide the department and employees with mutually beneficial conditions of employment and cost-effective and efficient work practices. A process of continuous assessment and review of current conditions of employment and work practices has occurred in consultation with employees, managers and relevant unions.
Corporate support reformThe government initiated the reform of corporate services in 2005–06. Readiness activities have continued in the department throughout 2008–09 to prepare us for a smooth transition to the Office of Shared Services.
Staff sustainability projectStaff workshops for all regions were initiated in 2008–09 to seek input to develop a staff sustainability project. Innovative ideas were sought (and were provided) in recruiting, engaging and retaining a talented and committed workforce to ensure the department’s sustainable success.
TrainingThe department strives to develop and maintain a highly skilled, professional and equitable workforce. This is achieved through its commitment to continued staff learning. The department continues to provide compulsory training activities for all staff in Indigenous Australian Cultural Awareness, Equal Employment Opportunity Awareness, Occupational Safety and Health Awareness, Driver Safety and Driver Development training, and Basic First Aid Awareness.
Key achievements in training in 2008–09• Implementation of an online induction for
staff providing staged delivery of corporate information. In order to complement the online delivery, the corporate induction manual has been redesigned and will be piloted early in 2009–10.
• The department has invested in a number of online training modules to increase accessibility and availability of training that caters to different learning styles and meets goals for a family-friendly workplace by reducing travel time and time spent away from home.
• The Line Manager’s Roadmap was launched as an online reference tool to aid line managers in their people management responsibilities and to provide links to relevant information resources on the intranet.
Staff reward and recognition programAs in previous years the department’s Excellence Awards recognised staff that made outstanding contributions towards the goals of the department. These awards continue to support a culture of excellence in the organisation and foster an environment of innovation and creativity. This year, seven Excellence Awards were awarded to staff groups or individuals who demonstrated significant achievements in a wide variety of services. The Geographic Information Services team, the Northern Agricultural Region AgTactics team and the Small Landholder Information Service team were some of the award recipients this year.
Lengths of Service Awards acknowledge the loyalty and commitment of employees who have achieved length of service milestones in excess of 20 years. Forty-five staff members received these awards in 2008–09.
Length of service (years) Number of recipients in 2008–09
20 21
30 18
40 6
Social clubThe Department of Agriculture and Food Social Club Inc. ensures staff members have access to a canteen and other amenities. These include a gymnasium, discount tickets to various events and a range of social activities. The Social Club also supports activities such as table tennis, yoga, Pilates and tai chi.
DiScloSuReS & leGAl compliAnce

Department of Agriculture and Food | Annual Report 2009 107
Quality of Life InitiativeThe Quality of Life Initiative (QoL) is the department’s holistic management and decision-making approach that relates to our people in nine areas—Family, Health, Economic, Work, Personal Growth, Social, Recreation, Security and Community. QoL has gained momentum throughout the department as it promotes a working environment that is supportive and conducive to our peoples’ quality of life.
Key achievements• 480 staff participated in voluntary health checks• Depression awareness program provided to all staff• 290 staff members participated in the Choose 2
Move weight loss challenge• 530 staff attended a one-day personal financial
management program• Over $11,000 raised for community organisations
through a range of activities such as Workplace Giving, Movember, Victorian Bushfires Appeal and cancer awareness and fundraising
• Bank you Blood program saw many staff make regular donations to the Red Cross Blood Service throughout the year
• Refurbishment of the department’s Family Room at South Perth (provided to assist employees in caring for their children or other dependent family members)
• Developed a series of seven Life Stages brochures that explain to employees how the department can support them and their family through flexible working conditions, leave flexibilities and link to further resources.
The true spirit of the departmentThe true spirit of the department was shown once again when we responded to the Victorian bushfire disaster early in 2009.
The Victorian Government requested assistance to deal with the many animal welfare issues that arose following the bushfires, so the department sent a team of eight veterinary officers and stock inspectors to help in the relief effort. The officers assisted livestock owners to assess burnt and injured livestock and offered treatment and management advice.
In addition, all our staff were given the opportunity to donate goods to help victims of the bushfire tragedy. Over 68 boxes of goods including blankets, toiletries, food, clothes and home wares were collected at short notice and delivered to Greyhound Freight to be taken to Victoria.
A large number of staff also supported the relief effort directly through donations to the Red Cross State Government Victorian Bushfire Appeal Fund through the department’s Workplace Giving program.
DiScloSuReS & leGAl compliAnce

Department of Agriculture and Food | Annual Report 2009 108
otheR finAnciAl DiScloSuReS
Capital worksCapital works projects incomplete
Project year of completion
Approved project
budget cost $’000
Estimated total
completion cost $’000
Cost variation
$’000Explanation of variation
South Boulder Quarantine yards
2009 1,657 2,107 450 Steel and labour costs escalated over construction period. Variation covered by completed surplus land asset sale
DAFWA HQ/ARWA 2015 186,611 (part funding)
TBA TBA New Business Case being prepared by the Office of Strategic Projects
Capital projects completed
Project year of completion
Approved project
budget cost $’000
Estimated total
completion cost $’000
Cost variation
$’000Explanation of variation
Kimberley Regional Office (Frank Wise Institute)
2009 3,350 3,450 100 Scope variation to address OSH, heritage and fire service requirements. Variation covered by completed surplus land asset sale
Capital Equipment Replacement Program
2009 3,600 3,600 0 Program completed to budget
Pricing policies of services providedThe department charges on a full or partial cost recovery basis for some goods and services rendered. The department’s fees and charges were determined in accordance with Costing and Pricing Government Services published by the Department of Treasury and Finance. The current list of fees and charges were implemented on 1 July 2008 as published in the Gazette on 20 May 2008.
Department’s annual estimatesAll special purpose accounts held by the Department of Agriculture and Food are detailed in the department’s budget statements and financial statements. The level of grants and contributions from both Australian Government and non-government sources for the next financial year (2009–10) is currently estimated at $85,370,000. For details regarding the range of special purpose funding sources see Note 15 of the financial statements.
Property rationalisation programLand surplus to the department’s needs has been identified and is in the process of disposal.

109
GoveRnAnce DiScloSuReS & miniSteRiAl DiRectiveS
Contracts with senior officers
At the date of reporting, other than normal contracts of employment of service, no senior officers, or firms of which senior officers are members, or entities in which senior officers have substantial interests, had any interests in existing or proposed contracts with the department and senior officers.
Audit committee
The Audit Committee is established to assist the Director General and the Executive in their promotion of good governance throughout the organisation.
Ministerial directives
No Ministerial directives were received during the financial year.
Department of Agriculture and Food | Annual Report 2009
Department of Agriculture and Food | Annual Report 2009 110
otheR leGAl RequiRementS
Disability access and inclusion plan outcomes
The department’s Disability Access and Inclusion Plan 2007–10 (DAIP) complements the department’s Equal Employment Opportunity (EEO) Management Plan 2007–09 and provides strategies for the inclusion of its customers and staff with disabilities through improved access to information, services and facilities.
The following are the achievements made by the department in the area of disability services:
Outcome 1People with disabilities have the same opportunities as other people to access the services of, and any events organised by, a public authority.
• The Equity and Diversity Committee meets on a regular basis and plans and monitors outcomes and champions EEO strategies, including those for people with disabilities.
• The department’s Events and Display Guidelines were reviewed to ensure that all events are accessible to people with disabilities.
Outcome 2People with disabilities have the same opportunities as other people to access the buildings and other facilities of a public authority.
• The development of a consistent approach towards appropriate signage to meet the needs of people with disabilities is in progress.
Outcome 3People with disabilities receive information from a public authority in a format that will enable them to access the information as readily as other people are able to access it.
• A process has been implemented to ensure that all new publications state that alternative formats are available upon request and made available.
• The editorial and corporate style guides were reviewed to ensure that departmental written communications are provided in a format more suitable for people with disabilities.
Outcome 4People with disabilities receive the same level and quality of service from the staff of a public authority as other people receive from the staff of that public authority.
• Staff awareness-raising of equity and diversity issues, including disability and access issues, continue via a range of methods including the EEO learning and development program, online induction, Diversity Speaks program, corporate celebrations and regular internal communications.
Outcome 5People with disabilities have the same opportunities as other people to make complaints to a public authority.
• Customer complaint processes have been reviewed to make them more accessible to people with disabilities. A review into the staff grievance process is underway.
Outcome 6People with disabilities have the same opportunities as other people to participate in any public consultation by a public authority.
• Public consultation activities include recognition in the planning and implementation of the needs for people with disabilities and accommodate these accordingly through both accesses to information and input mechanisms. The corporate policy and procedures will be reviewed during 2009–10.

Department of Agriculture and Food | Annual Report 2009 111
otheR leGAl RequiRementS
Compliance with Public Sector Standards and Ethical Codes
OPSSC reporting under Section 31 of the Public Sector Management Act 1994Compliance issues that arose during the financial year 2008–09 regarding public sector standards included:
2007–08 2008–09
Applications carried over 2 1
New applications received 3 4
Total applications 5 5
Breach claims lodged
Recruitment, selection and appointment
2 2
Transfer 0 0
Grievance resolution 1 2
Outcome of claims handled
Withdrawn in agency 2 0
Resolved in agency 1 2
Still pending in agency 0 0
Referred to OPSSC 1 2
Total applications completed 4 4
Code of ConductCompliance issues that arose during the financial year 2008–09 regarding the department’s Code of Conduct and the WA Code of Ethics included:a) Six matters dealt within the department’s
Grievance Policyb) Five matters dealt within accordance with the
breach of discipline process pursuant to the Public Sector Management Act 1994
c) Significant action taken to monitor and ensure compliance included:• Information about the standards and codes
included in the department’s policies and procedures, on the intranet, newsletters, workshops and information sessions and in induction packages
• Contact Officer and Grievance Officer network updated and trained (November 2008 and May 2009)
• Revised Code of Conduct in accordance with OPSSC Guide (with particular attention to the areas of integrity, accountability, bullying and personal conduct)
• Development of a workplace conduct, conflict and grievance resolution training program for managers.
Freedom of InformationA description of the types of information and documents the department holds and how to access information under the Freedom of Information Act 1992 is contained in the department’s FOI information statement. The Information Statement is reviewed annually and made available on the department’s website.
2007–08 2008–09
Applications carried over 1 3
New applications received 16 10
Total applications 17 13
Application types
Personal information requests 3 1
Non-personal information requests 14 12
Request to amend personal information 0 0
Application outcome
Applications transferred in full 1 0
Applications withdrawn 1 0
Applications completed 12 12
Total applications completed 14 12
Applications outstanding at 30 June 3 1
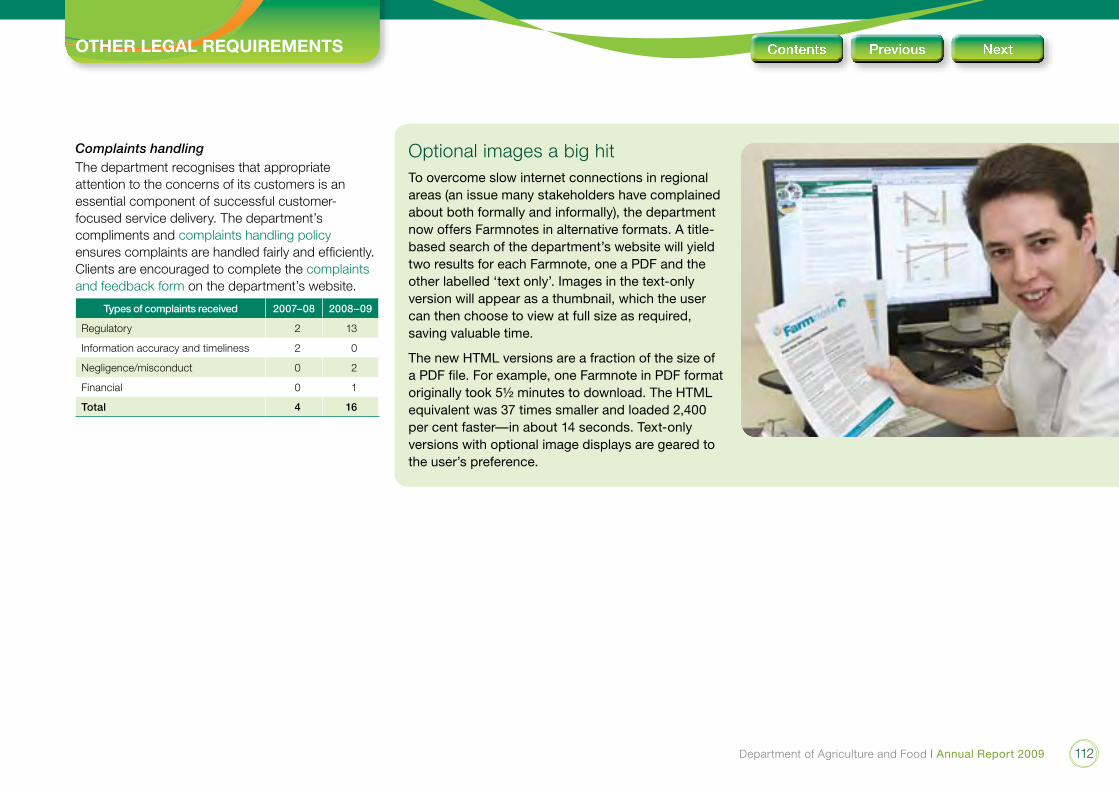
Department of Agriculture and Food | Annual Report 2009 112
otheR leGAl RequiRementS
Complaints handlingThe department recognises that appropriate attention to the concerns of its customers is an essential component of successful customer-focused service delivery. The department’s compliments and complaints handling policy ensures complaints are handled fairly and efficiently. Clients are encouraged to complete the complaints and feedback form on the department’s website.
Types of complaints received 2007–08 2008–09
Regulatory 2 13
Information accuracy and timeliness 2 0
Negligence/misconduct 0 2
Financial 0 1
Total 4 16
Optional images a big hitTo overcome slow internet connections in regional areas (an issue many stakeholders have complained about both formally and informally), the department now offers Farmnotes in alternative formats. A title-based search of the department’s website will yield two results for each Farmnote, one a PDF and the other labelled ‘text only’. Images in the text-only version will appear as a thumbnail, which the user can then choose to view at full size as required, saving valuable time.
The new HTML versions are a fraction of the size of a PDF file. For example, one Farmnote in PDF format originally took 5½ minutes to download. The HTML equivalent was 37 times smaller and loaded 2,400 per cent faster—in about 14 seconds. Text-only versions with optional image displays are geared to the user’s preference.
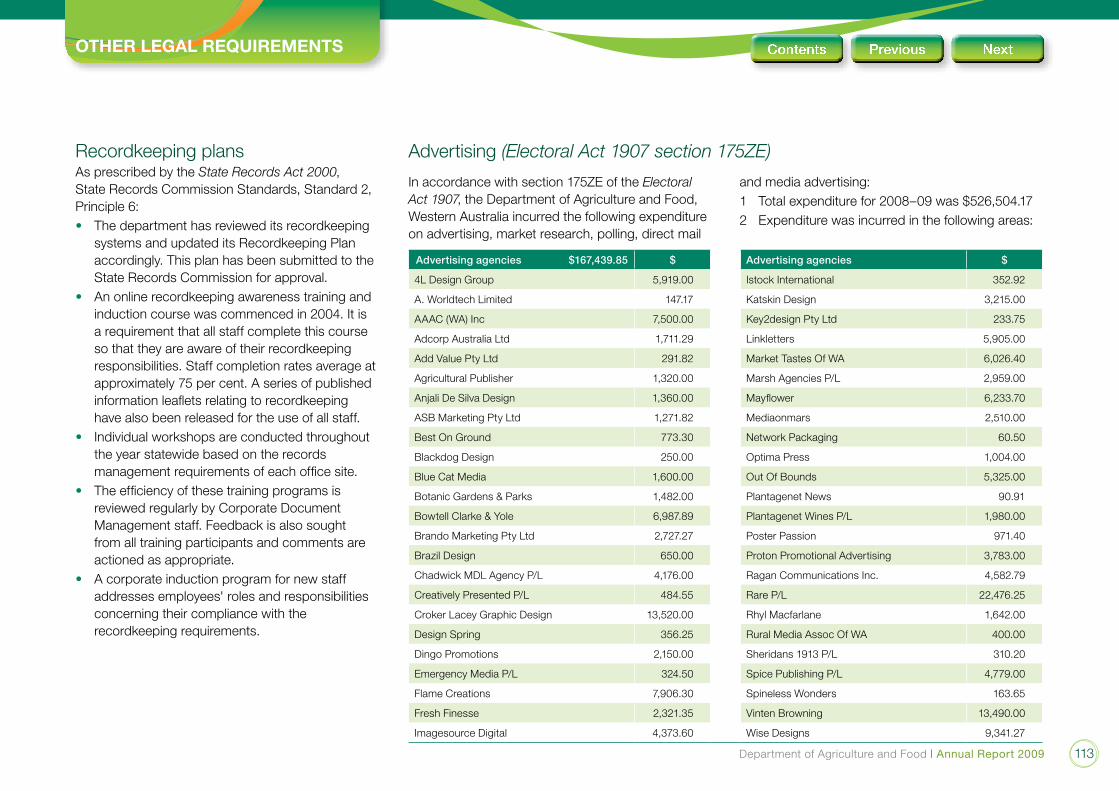
Department of Agriculture and Food | Annual Report 2009 113
otheR leGAl RequiRementS
Recordkeeping plansAs prescribed by the State Records Act 2000, State Records Commission Standards, Standard 2, Principle 6:• The department has reviewed its recordkeeping
systems and updated its Recordkeeping Plan accordingly. This plan has been submitted to the State Records Commission for approval.
• An online recordkeeping awareness training and induction course was commenced in 2004. It is a requirement that all staff complete this course so that they are aware of their recordkeeping responsibilities. Staff completion rates average at approximately 75 per cent. A series of published information leaflets relating to recordkeeping have also been released for the use of all staff.
• Individual workshops are conducted throughout the year statewide based on the records management requirements of each office site.
• The efficiency of these training programs is reviewed regularly by Corporate Document Management staff. Feedback is also sought from all training participants and comments are actioned as appropriate.
• A corporate induction program for new staff addresses employees' roles and responsibilities concerning their compliance with the recordkeeping requirements.
Advertising (Electoral Act 1907 section 175ZE)
Advertising agencies $167,439.85 $ Advertising agencies $
4L Design Group 5,919.00 Istock International 352.92
A. Worldtech Limited 147.17 Katskin Design 3,215.00
AAAC (WA) Inc 7,500.00 Key2design Pty Ltd 233.75
Adcorp Australia Ltd 1,711.29 Linkletters 5,905.00
Add Value Pty Ltd 291.82 Market Tastes Of WA 6,026.40
Agricultural Publisher 1,320.00 Marsh Agencies P/L 2,959.00
Anjali De Silva Design 1,360.00 Mayflower 6,233.70
ASB Marketing Pty Ltd 1,271.82 Mediaonmars 2,510.00
Best On Ground 773.30 Network Packaging 60.50
Blackdog Design 250.00 Optima Press 1,004.00
Blue Cat Media 1,600.00 Out Of Bounds 5,325.00
Botanic Gardens & Parks 1,482.00 Plantagenet News 90.91
Bowtell Clarke & Yole 6,987.89 Plantagenet Wines P/L 1,980.00
Brando Marketing Pty Ltd 2,727.27 Poster Passion 971.40
BrazilDesign 650.00 Proton Promotional Advertising 3,783.00
Chadwick MDL Agency P/L 4,176.00 Ragan Communications Inc. 4,582.79
Creatively Presented P/L 484.55 Rare P/L 22,476.25
Croker Lacey Graphic Design 13,520.00 Rhyl Macfarlane 1,642.00
Design Spring 356.25 Rural Media Assoc Of WA 400.00
Dingo Promotions 2,150.00 Sheridans 1913 P/L 310.20
Emergency Media P/L 324.50 Spice Publishing P/L 4,779.00
Flame Creations 7,906.30 Spineless Wonders 163.65
Fresh Finesse 2,321.35 Vinten Browning 13,490.00
Imagesource Digital 4,373.60 Wise Designs 9,341.27
In accordance with section 175ZE of the Electoral Act 1907, the Department of Agriculture and Food, Western Australia incurred the following expenditure on advertising, market research, polling, direct mail
and media advertising:1 Total expenditure for 2008–09 was $526,504.172 Expenditure was incurred in the following areas:

Department of Agriculture and Food | Annual Report 2009 114
otheR leGAl RequiRementS
Media advertising organisations $359,064.32 Media advertising organisations $ Media advertising organisations $
Adcorp Australia Limited 26,765.92 Jerramungup Telecentre 136.36 Shire of Merredin 350.00
Agbizcareers 4,805.00 Job Media P/L 288.00 Shire of Trayning 15.45
Agricultural Publisher 2,923.80 Kalgoorlie Miner 145.20 Shire of Yilgarn 35.00
AHRI Ltd 137.50 Marketforce 276,456.42 SW Printing & Publishing Co 153.01
Albany Advertiser 2,857.01 Media Decisions WA 1,945.89 State Law Publisher 35.85
Albany CCI 118.75 Mingenew Telecentre 36.00 Telecentre Cunderdin 18.18
Australialink 214.50 Morawa Telecentre 22.73 The Albany Advertiser 1,320.42
Avon Advocate 166.54 Muka Matters Inc 32.00 TheBoyupGazette 85.00
Beacon Bulletin 34.00 Mullewa Telecentre 50.90 The Fence Post Inc 30.00
Big Red Sky 684.00 Nationwide Business 1,760.00 The Gimlet Newspaper Inc 32.00
Bruce Rock Telecentre 81.82 Northampton Community News 30.00 The Pipeline Newsletter 17.00
Community Newspapers 3290.00 Nungarin Newslink 15.00 The Windmill Newspaper 30.00
Construct Data Publishers 2,044.88 Pingelly Times 14.50 The York Comm Matters 60.00
Countrywide Publications 2,348.00 Pingrup Telecentre 18.18 WA News 1,922.98
Email Media 1,372.50 Promotions Only 423.50 Welcome2 Australia Pty Ltd 2,596.96
Emergency Service Publishing 359.09 Radiowest Broadcasters P/L 1,932.70 WestOzMedia 1,000.00
Goolarri Media Enterprises 1,780.00 Rare P/L 12,806.43 Wongan Business Association 125.00
Hallmark Editions 580.00 Redgum Reports 30.00 Wongan Hills Telecentre 20.00
Harvey Water 163.64 Redwave Media Ltd 330.00 Worldwide Online Print 2,325.00
Institute of Internal Auditors 1,053.64 Rural Press Limited 551.75 Wyalkatchem Weekly Inc 58.18
Market research organisations: Nil
Polling organisations: Nil
Direct mail organisations: Nil

Department of Agriculture and Food | Annual Report 2009 115
GoveRnment policy RequiRementS
Occupational Safety and Health
OSH consultationThe department has a two-tier system of consultation. A departmental OSH Policy Committee is responsible for policy, strategy and monitoring performance. This committee comprises managers and regional OSH representatives. Local committees in larger district offices and staff meetings in smaller offices form the second tier of consultation. Quarterly committee and staff meetings consider incident, hazardandinspectionreportsandactionsraisedbythe OSH Policy Committee. There are elected OSH representatives in every district office. Staff members are made aware of their local and regional OSH representatives through local OSH induction and the department’s OSH awareness course.
Commitment to Occupational Safety and Health and injury managementThe department has a general Occupational Safety and Health (OSH) policy, 26 other policies covering OSHsystemsandhazardsandonepolicyoninjurymanagement and workers’ compensation. Most of these policies have been in place for more than 10 years and are reviewed bi-annually. Any initiatives required for new or reviewed policies are determined by the OSH Policy Committee and are included in the department’s annual OSH strategy.
OSH and injury management targets are included in each annual OSH strategy (these are highlighted in the table OSH performance statistics). Changes to policy are communicated to all OSH committee chairpersons, OSH representatives and relevant managers immediately after each policy committee meeting. All policies are available on the department’s intranet site. All new staff members are made aware of the location of policies and other OSH information at their corporate induction.
OSH training: During 2008–09 the department continued to raise the safety of the work environment through a number of specific OSH training initiatives, including the provision of manual handling programs for technical officers and correct workstation practices. Additional training was provided for staff safety representatives to support their enhanced role of managing work incident investigations. Occupational Safety and Health Awareness training is still mandatory for all staff and 94 per cent of our workforce had completed the training at 30 June 2009.
Injury management complianceThe department’s injury management system and return to work program process are documented in its injury management policy and supporting guidelines. The department has an early intervention injury management program in place which exceeds the requirements of the Workers’ Compensation and Injury Management Act 1981.
OSH Management system assessmentThe department completed a Worksafe Plan Assessment using an externally accredited assessor in April 2008, achieving a performance score of 83 per cent. This score meets the Gold Certificate of performance for OSH management systems. The department received its Gold Certificate in August 2008.
OSH performance statistics
IndicatorGovernment
target2008–09
DAFWA target 2007–08 2008–09 Target achieved
Number of fatalities 0 0 0 0 Yes
Lost time injury/disease (LTI/D) incidence rate 0 or 10% reduction 10% reduction 1.0 1.5 No
Lost time injury severity rate 0 or 10% improvement
0 6.3 00 Yes
%age of injured workers returned to work within 28 weeks
Actual %age 100% Not required 100% Yes
%age of managers trained in OSH and injury management
50% or greater 95% 93% 94% Yes
Note: figures relate to permanent staff.

Department of Agriculture and Food | Annual Report 2009 116
GoveRnment policy RequiRementS
Public Sector Leadership in OSHThe Department of Agriculture and Food has around 1,500 staff based in more than 30 locations working throughout the state. The department services more than 100 million hectares devoted to Western Australia’s agricultural and pastoral production and our staff members are engaged in a diverse range of activities. Many of these activities are extremely hazardous. For example, we have people who work with chemicals and poisons, people who are required to use firearms, people who work with livestock, people who work in the sun and rain, people who use heavy farm machinery, people working in laboratories, people who work in remote areas, and, of course, many people who drive very long distances on all types of roads.
Because of this complexity the department has developed a comprehensive occupational safety and health system to ensure injuries are minimised and the safety of staff is paramount. Continuous improvement and refinement resulted in the department achieving a Worksafe Plan Gold Certificate in August 2008.
This was followed by the department winning the Public Sector Leadership category in the Work Safety Awards WA 2008 and representing Western Australia at the national Safe Work Australia Awards.
OSH initiatives in 2008–09• commenced regional OSH representative forums• converted all forklift users to High Risk Licences• commenced program of asbestos audit reviews and facilitated training of assessors across public sector• reviewed and improved organophosphate health surveillance systems• completed a program to raise awareness of depression• initiated first staff weight loss challenge• converted to new distress beacons and developed user information package• reviewed safe aerial work guidelines and procedures• implemented audit and training program for use of small trailers.

Department of Agriculture and Food | Annual Report 2009 117
GoveRnment policy RequiRementS
Substantive equalitySubstantive Equality was transferred to the Industry and Rural Services (IRS) directorate in 2008–09. The delegation to IRS is intended to improve service delivery and lead to integration of these principles into business planning and client services. In 2006–07 the department conducted a needs and impact assessment on horticulture services at the Carnarvon office. The assessment highlighted issues related to providing information to customers, improving access to services, and staff awareness of substantive equality principles. A key recommendation of the assessment was to improve service delivery for culturally and linguistically diverse stakeholders in the Carnarvon region. In the first instance, the department has developed initiatives to improve access and service delivery for the Vietnamese community in the region. Initially activities focus on introducing the Vietnamese community to the agribusiness commercial sector. Other activities to be undertaken include collating information on the Vietnamese community’s specific agricultural needs and concerns. This project will form the basis of initiatives implemented for other equity groups.
Reconciliation Action PlanThe department’s Reconciliation Action Plan 2008–10 provides key strategies for our vision of reconciliation and in recognising and respecting the role of traditional land owners in the agricultural and pastoral industries.
Key achievements in 2008–09• Corporate celebrations marking NAIDOC week
include a flag-raising ceremony, bush tucker and medicine walk
• Indigenous Australian Cultural Awareness mandatory training program ensures appropriate support and understanding for Aboriginal staff and the provision of effective services to Aboriginal clients
• An increased number of Indigenous land managers utilise the department’s services
• Indigenous employment, development and management opportunities within the department and the Western Australian agricultural, pastoral and land management sectors have increased.
Winner of the 2008 Multicultural Community Services AwardThe department was the proud recipient of the 2008 Multicultural Community Services Award for its Indigenous Management Support Service (IMSS).
The department established the pilot IMSS in the Kimberley in 2002 and has extended the program to the Pilbara, Mid-West and Southern Agricultural regions. Around 25 per cent of Western Australia’s pastoral land (38 million hectares) is owned and managed by Indigenous Australians keen to pursue economic independence.
The IMSS works with Aboriginal landholders one on one, providing technical advice, on-the-job training and ongoing support. This approach has led to the creation of an ongoing partnership where customer needs are predominant and equality and respect are practices on a day-to-day basis. The service has been so successful the department is looking to extend it to all other regions and to adapt the framework to other projects.

GoveRnment policy RequiRementS
Corruption preventionThe department’s approach to corruption prevention is to strongly promote ethical behaviour and integrity as core values. Key achievements for 2008–09 were:• The department’s new online induction course includes sections on Ethics and Integrity and the Public Interest Disclosure Act 2003 (PID). New employees must
correctly complete these sections before they can progress to the next topic.• In early 2009 the department started working on an ethical decision-making program to reduce the potential for misconduct. An outcome is expected towards the
latter part of 2009.• PID was given prominence by having two clips presented via the department’s internal video channel AgTube. The first video included the PID satellite transmission
made in late 2007 by the Office of the Public Sector Standards Commissioner (OPSSC). A second OPSSC video highlighting how to report a wrongdoing in the workplace showed how making a disclosure was not a complex procedure. Both videos were also strongly promoted through articles appearing the department’s newsletter AgBrief.
Department of Agriculture and Food | Annual Report 2009 118

Department of Agriculture and Food | Annual Report 2009 119
AppenDiceS
Appendix 1: Department of Agriculture and Food offices
Floreat
Murdoch
Airport - Domestic
Airport - International
ForrestfieldSouth Perth
Canning Vale
Medina
Legend
OfficesResearch FacilitiesQuarantine Facilities
Geraldton
Bunbury
Albany
Esperance
Narrogin
Merredin
Kununurra
Derby
Karratha
Meekatharra
Carnarvon
Kalgoorlie
Katanning
Waroona
ManjimupJerramungup
Lake Grace
Northam
Three Springs
Moora
South Perth
Badgingarra
Avondale
NewdegateVasse
Wongan Hills
Mt. Barker
Halls Creek
Eucla
Broome
Legend
OfficesResearch FacilitiesQuarantine Facilities

Department of Agriculture and Food | Annual Report 2009 120
AppenDiceS
The Minister for Agriculture and Food also administers the following related Acts:
Aerial Spraying Control Act 1966
Agricultural and Veterinary Chemicals (Taxing) Act 1995
Agricultural and Veterinary Chemicals (Western Australia) Act 1995
Agricultural Practices (Disputes) Act 1995
Agricultural Produce (Chemical Residues) Act 1983*
Agricultural Produce Commission Act 1988
Agricultural Products Act 1929*
Agriculture and Related Resources Protection Act 1976*
Agriculture Protection Board Act 1950*
Argentine Ant Act 1968*
Artificial Breeding of Stock Act 1965*
Beekeepers Act 1963*
Biological Control Act 1986
Biosecurity and Agriculture Management Act 2007
Biosecurity and Agriculture Management Rates and Charges Act 2007
Biosecurity and Agriculture Management (Repeal and Consequential Provisions) Act 2007
Bulk Handling Act 1967
Cattle Industry Compensation Act 1965*
Chicken Meat Industry Act 1977
Dairy Industry and Herd Improvement Legislation Repeal Act 2000
Exotic Diseases of Animals Act 1993
Fertilizers Act 1977*
Gene Technology Act 2006
Genetically Modified Crops Free Areas Act 2003
Grain Marketing Act 2002
Industrial Hemp Act 2004
Loans (Co-operative Companies) Act 2004
Marketing of Eggs Act 1945
Marketing of Potatoes Act 1946
Ord River Dam Catchment Area (Straying Cattle) Act 1967
Perth Market Act 1926
Pig, Potato and Poultry Industries (Compensation Legislation) Repeal Act 2004
Plant Diseases Act 1914*
Plant Pests and Diseases (Eradication Funds) Act 1974*
Royal Agricultural Society Act 1926
Royal Agricultural Society Act Amendment Act 1929
Rural Business Development Corporation Act 2000
Seeds Act 1981*
Soil and Land Conservation Act 1945
Stock (Identification and Movement) Act 1970*
Stock Diseases (Regulations) Act 1968*
Tree Plantation Agreements Act 2003
Veterinary Chemical Control and Animal Feeding Stuffs Act 1976*
Veterinary Surgeons Act 1960
Western Australian Meat Industry Authority Act 1976
Western Australian Meat Marketing Co-operative Limited (Shares) Act 2003
* Legislation to be repealed once Biosecurity and Agriculture Management Regulations are in place.
Appendix 2: Administered legislation

Department of Agriculture and Food | Annual Report 2009 121
Appendix 3: Other key legislation impacting on activities
AppenDiceS
Health Act 1911
Industrial Relations Act 1979
Land Administration Act 1997
Library Board of Western Australia Act 1951
Minimum Conditions of Employment Act 1993
Occupational Safety and Health Act 1984
Occupiers Liability Act 1985
Parliamentary Commissioner Act 1971
Poisons Act 1964
Public and Bank Holidays Act 1972
Public Interest Disclosure Act 2003
Public Sector Management Act 1994
Salaries and Allowances Act 1975
State Administrative Tribunal Act 2004
State Records Act 2000
State Superannuation Act 2000
State Supply Commission Act 1991
Transfer of Land Act 1893
Waterways Conservation Act 1976
Wildlife Conservation Act 1950
Workers’ Compensation and Injury Management Act 1981
In the performance of its functions, the Department of Agriculture and Food complies with the following relevant written laws:
Animal Welfare Act 2002
Auditor General Act 2006
Carbon Rights Act 2003
Conservation and Land Management Act 1984
Contaminated Sites Act 2003
Corruption and Crime Commission Act 2003
Disability Services Act 1993
Electoral Act 1907
Electronic Transactions Act 2003
Emergency Management Act 2005
Environmental Protection Act 1986
Equal Opportunity Act 1984
Explosives and Dangerous Goods Act 1961
Financial Management Act 2006
Firearms Act 1973
Forest Products Act 2000
Freedom of Information Act 1992
Government Employees Housing Act 1964
Government Employees Superannuation Act 1987

Department of Agriculture and Food | Annual Report 2009 122
AppenDiceS
Appendix 4: Statement from the Commissioner of Soil and Land Conservation
A report on the Commissioner’s operations during the year was submitted to the accountable officer in accordance with Section 25F of the Soil and Land Conservation Act 1945.
DelegationsThe delegation of powers under Part II of the Act by the Commissioner to one Department of Environment and Conservation (DEC) and one Department of Water (DOW) Regional Manager to negotiate and administer covenants under Part IVA remain in effect.
Land clearing assessmentsDuring 2008–09, 61 agricultural clearing area and purpose permit applications were assessed with advice provided to DEC for determination. Advice is pending on three applications.
ComplianceThe Commissioner investigated 30 clearing, 7 drainage and 12 land degradation complaints. Three complaints remain pending.
Agreements to reserve and conservation covenantsThe Commissioner registered five Agreements to Reserve and two irrevocable Conservation Covenants during the financial year protecting 591 hectares of the State’s native vegetation. In total, instruments under the Soil and Land Conservation Act 1945 now protect about 200,000 hectares.
Land drainageDuring the year 26 landholders submitted Notices of Intention to Drain (NOIs) with the following outcomes:• 10 landowners were issued letters of no objection• Two letters of objection were issued; and• 14 NOIs were pending a decision. Of these,
10 proposals were assessed as likely to impact on declared rare flora (DRF).
Land Conservation District Committees (LCDC)45 of the 114 Land Conservation Districts (LCDs), that are proclaimed under the Soil and Land Conservation Act 1945, do not have a committee and are effectively in recess. The reduction in numbers reflects the declining relevance of LCDCs in the delivery of natural resource management outcomes. During the year, one LCDC was audited and a complaint alleging misappropriation of funds was referred to the Corruption and Crime Commission. This matter is being investigated by the police.
Condition of the resource base
Agricultural RegionThe impact of drought seasons in 2006 and 2007 saw significantly reduced levels of ground cover and increasedwinderosionhazards.Byspring2008there was adequate ground cover and nearly every site was considered safe. Over the summer of 2009 the vegetation was again consumed or degraded andby autumn between 2.8 per cent and 5.1 per cent of the landscape was at risk of soil and wind erosion.
Pastoral regionsThe Western Australian Rangeland Monitoring System (WARMS) provides information on the trend in the pastoral rangelands at a regional scale. It does this through a representative network of point-based sites on which attributes of the soil surface and vegetation are recorded. Of the 1,622 sites 633 are grassland sites and the remainder shrubland sites. Seasonal condition is estimated for each reassessment period (epoch) at each site. Grassland and shrubland sites are reassessed on a three and five year cycle respectively.

Department of Agriculture and Food | Annual Report 2009 123
AppenDiceS
Favourable conditions experienced in the Kimberley region over the past 15 years are reflected in the recorded increase in the frequency of perennial grasses and reported increases in stock densities. However, given the current plateau in grass frequencies recorded there is a risk that maintenance of the current stock densities would be unsustainable if average seasonal conditions were to return.
Seasonal conditions in the Pilbara grasslands were variable. Reported cattle numbers in the grasslands south of the Kimberley have also increased over the period 1993 to 2008 (Figure 2), more than doubling in the East Pilbara and DeGrey LCDs.
The increase in reported stock density in this region has not been accompanied by similar improvements in the frequency of perennial grasses. It is considered that stock numbers are reducing the capacity of the rangeland to respond to more favourable seasons. A return to average seasons or perhaps below-average seasons could cause significant land degradation problems if stock numbers are not reduced.
Change in shrub density on WARMS sites between 1999 and 2008 was quite variable. (Figure 3).
The largest decline (15 per cent) was in the sites that had below-average seasonal conditions. There was still a 3 per cent decline in plant numbers in sites that had above-average seasonal conditions, suggesting that season alone was not the only factor. It would be anticipated that in above-average seasons plant numbers would increase. However, in six LCDs where seasonal conditions were rated above average, plant numbers have declined. This suggests that stock densities are potentially too high to allow the favourable seasonal conditions to be capitalised on.
70
75
80
85
90
95
100
EPOCH1 EPOCH2 EPOCH3 EPOCH4 EPOCH5
% fr
eque
ncy
pere
nnia
l gra
ss
Broome (BRM) Derby WK (DWK) Halls Creek EK (HAL) N Kimberley (NTK)
Figure 1: Mean perennial grass frequencies, Kimberley LCDs, Epoch 1 to Epoch 5
0.0
0.5
1.0
1.5
2.0
2.5
3.0
1993 1994 1995 1996 1997 1998 1999 2000 2001 2002 2003 2004 2005 2006 2007 2008
CU
per
sq
km
ASH DEG EAP ROE LYN
Figure 2: Mean stock densities (cu/sq km) south of Kimberley LCDs 1993 to 2008
0
100
200
300
400
0 100 200 300 400 500
No
of p
lant
s at
Epo
ch 3
No of plants at Epoch 2
above average (19% of sites) average (47% of sites) below average (34% of sites)
Figure 3: Shrub density on Shrubland WARMS sites as recorded in Epoch 2 and Epoch 3