Department for Environment and Heritage ANNUAL REPORT … · I am pleased to present the Department...
120
www.environment.sa.gov.au Department for Environment and Heritage ANNUAL REPORT 2007-08 1 July 2007 to 30 June 2008
Transcript of Department for Environment and Heritage ANNUAL REPORT … · I am pleased to present the Department...
www.environment.sa.gov.au
Department for Environment and Heritage
ANNUAL REPORT 2007-081 July 2007 to 30 June 2008

Head OfficeChesser House91-97 Grenfell StreetADELAIDE SA 5000
Telephone +61 (8) 8204 9000Facsimile +61 (8) 8204 9334Internet: www.environment.sa.gov.auFIS 80106ABN 36702093234ISSN 1446-7380
RepORt pRepaRed by:Corporate Planning and Development BranchPeople and Strategy DirectorateDepartment for Environment and [email protected]
cOpies Of tHe RepORt can be Obtained fROm:DEH Information LineLevel 1/100 Pirie StreetADELAIDE SA 5000Telephone +61 (8) 8204 1910Email: [email protected]
© State of South Australia through the Department for Environment and Heritage. You may copy, distribute, display, download and otherwise freely deal with this publication for any purpose subject to the condition that you (1) attribute the Department as the copyright owner of this publication and that (2) you obtain the prior written consent of the Department for Environment and Heritage if you wish to modify the work or offer the publication for sale or otherwise use it or any part of it for a commercial purpose.
published by the department for environment and Heritage south australia

30 September 2008
Hon Jay Weatherill MPMinister for Environment and ConservationParliament HouseNorth TerraceADELAIDE SA 5000
Dear Minister
I am pleased to present the Department for Environment and Heritage Annual Report for the financial year 1 July 2007 — 30 June 2008.
Appended to the DEH Annual Report is the Annual Report of the Marine Parks Council. The Marine Parks Council is established pursuant to the recently proclaimed Marine Parks Act 2007 and members of the Council were appointed on 22 May 2008. The Council met once in the 2007‑08 year. For administrative efficiency the Council’s report is included as part of the DEH Annual Report.
This report has been prepared in accordance with the requirements of the Public Sector Management Act 1995, the Act’s accompanying regulations, the financial reporting requirements of the Public Finance and Audit Act 1987, and DPC Circular DPC013 – Annual Reporting Requirements.
Yours sincerely
Allan HolmesCHIEF EXECUTIVE
Chief Executive Level 9 Chesser House 91‑97 Grenfell Street Adelaide SA 5000
GPO Box 1047 Adelaide SA 5001 Australia
Ph: +61 8 8204 9323 Fax: +61 8 8204 9321
www.environment.sa.gov.au

ii
CHIEF EXECUTIVE’S STATEMENTIt’s possible that the role of the Department for Environment and Heritage has never
been as important as it is today. As I write this, South Australia looks to a future in
which water supply and climate change will dramatically affect the future of the
state, its people, and its natural environment. At the same time, almost daily we
hear expressions of concern about how our built and natural heritage is being
altered or destroyed as part of the ‘necessary’ road to progress.
The Department for Environment and Heritage is clearly linked to these two areas
of interest and debate, through monitoring and protecting the state’s heritage
and environment and in ensuring that progress in these areas contributes to the
South Australian Government’s targets for sustainable economic development and
prosperity.
DEH’s environmental responsibilities require it to watch over the state’s diverse
natural environments, and to encourage sustainable development in our rapidly
changing world. In its heritage role, the department can help the community
appreciate, conserve and invest in its rich history. One of the ways we do this is by
producing public communication materials and programs – sometimes involving
the mass media – designed to educate South Australians so they consider the
natural and cultural value of their surroundings before acting in ways that could
compromise or seriously impair them for the future.
This year, resources were directed at additional methods of external
communications. We redeveloped the parks website and created useful web-
based mapping systems, while the Heritage Conservation Program established
a single register for heritage places and developed virtual tours of state heritage
areas on the DEH website.
DEH’s Nature Conservation Program works toward achieving South Australia’s
Strategic Plan target to lose no native species as a result of human activity; this
year the department finalised and released No Species Loss: a Nature Conservation
Strategy for South Australia 2007-2017 – our first state-wide nature conservation
strategy.
Other achievements this year included the passing of the Marine Parks Act 2007, a
major step towards meeting South Australia’s Strategic Plan target of creating 19
marine parks by 2010; the proclaiming of three new conservation parks; and the
development of partnerships to protect 215 000 hectares of ephemeral freshwater
ecosystem, grassland and woodland habitat in the state’s outback.
The state’s domesticated animals will be better protected due to the Animal
Welfare Program’s work this year. The Prevention of Cruelty to Animals (Animal
Welfare) Bill passed through both houses of parliament, and will be introduced as
law in 2008-09. Other work effectively eliminated the rodeo event known as “calf
roping” and introduced new regulations that establish minimum stocking conditions
for layer hens.
iii
As part of the Botanic Gardens 150 celebrations, the G150 Foundation capital
fundraising campaign raised $5.7 million for G150 capital works. Among the 150th
anniversary celebration events was the long-awaited opening of the $4.3 million
Amazon Waterlily Pavilion by the Premier, the Hon. Mike Rann MP, in November
2007.
In many ways, the pavilion encapsulates the overall role of DEH in the 21st century.
It enables visitors to learn about charismatic plants and their place in the natural
world, shows how careful planning can create sustainable structures to support and
nourish the natural world, and demonstrates how new structures can work with old
to take us into a prosperous future.
Our achievements this year prove that DEH’s own emphasis on sustainable
economic development enables it to contribute toward the government’s
targets in this area. In doing so, it works hard and successfully for the people, the
environment and the future of this state. This report is testament to the hard work
and endeavours of an outstanding group of public servants, volunteers, associates
and partners. I thank them all for their contributions.
I also thank my portfolio colleagues for their co-operation: Rob Freeman, Chief
Executive of the Department of Water, Land and Biodiversity Conservation,
Paul Vogel, the former Chief Executive of the EPA, and Vaughan Levitzke, Chief
Executive of Zero Waste SA.
Finally, to Minister Gail Gago. I acknowledge the excellent working relationship that
existed between her office and this department. I thank her for her efforts, wish her
well in her new role, and welcome our new Minister, Jay Weatherill.
Allan HolmescHief eXecUtiVe

iv
De
pa
rtm
en
t fo
r En
viro
nm
en
t a
nd
He
rita
ge
- O
rga
nisa
tion
al S
tru
ctu
re (
30 J
un
e 2
008)
chi
ef e
xec
utiv
e
alla
n H
olm
es
Off
ice
of
the
Ch
ief
Exe
cu
tive
co
nse
rva
tion
polic
y &
pr
og
ram
sEx
ec
utiv
e
Dire
cto
rG
reg
Le
am
an
•Aborig
inalPartne
rships
•AdelaideLivingBeache
s
•BiodiversityConservation
•Coastand
Marine
co
nse
rva
tion
•CoastalM
ana
gement
•Heritage
•Land
Administration
•Land
Mana
gement
•PerpetualLease
ac
ce
lera
ted
fre
e-h
old
ing
pr
oje
ct
(pLa
f)
•StatutoryPlanningand
a
sse
ssm
ent
•VisitorMana
gement
bota
nic
G
ard
ens
Exe
cu
tive
D
irec
tor
ste
phe
n fo
rbe
s•AdelaideBotanicGarden
•HillsBo
tanicGarden
•Collectionsand
Learning
Reg
iona
l c
ons
erv
atio
n d
eliv
ery
Exe
cu
tive
D
irec
tor
John
sc
hutz
•Adelaide
•Kang
arooIsland
•Murrayland
s
•Northe
rn/Yorke
•Outback
•SouthEast
•West
•FireM
ana
gement
•Investigationand
c
om
plia
nce
•VolunteerSupport
info
rma
tion,
sc
ienc
e &
te
chn
olo
gy
A/E
xec
utiv
e
Dire
cto
rJo
hn O
’ma
lley
•BiologicalSurveyand
m
oni
torin
g
•Im
ageand
Produc
tse
rvic
es
•Inform
ationSystems
•ITServices
•ICTProjectsand
Strategy
•SpatialInform
ation
se
rvic
es
•StateHerbarium
peo
ple
&
stra
teg
y
Ex
ec
utiv
e
Dire
cto
rKym
Nicolson
•Corporate
co
mm
unic
atio
ns
•CorporateGovernanc
e
and
po
licy
•CorporatePlanningand
d
eve
lop
me
nt
•Environm
entalEduc
ation
•Hum
anRe
sourceServices
busi
ness
se
rvic
es
Exe
cu
tive
D
irec
tor
RickJanssan
•Busine
ssOperations
•Fina
ncialServices
1
CONTENTS2007-08 pROGRam HiGHLiGHts 2
GOVeRnance statement 5
deH pROGRam peRfORmance 14nature conservation program 14
public Land - Visitor management program 16
public Land - fire management program 18
public Land - stewardship program 20
coast and marine conservation 22
botanic Gardens management program 24
Heritage conservation program 26
AnimalWelfareProgram 28
agency support services program 30Asset Management Services Sub-program 30
Business Support Services Sub-program 31
Environmental Information Sub-program 32
Financial Services Sub-program 33
Governance, Environment Policy and Public Affairs Sub-program 34
Human Resources Services Sub-program 35
Information Technology Sub-program 36
abORiGinaL RecOnciLiatiOn statement 38
financiaL cOmmentaRy 40
appendices 47A1 Management of Human Resources 47
A2 Disability Action Plan Report 50
A3 Occupational, Health and Safety and Injury Management Report 52
A4 Freedom of Information Statement 54
A5 Contractual Arrangements 54
A6 Consultants 54
A7 Fraud 54
A8 Accounts Payable Report 55
A9 Overseas Travel 56
A10 Greening of Government Operations Report 57
A11 Asbestos Management in Government Buildings 60
A12 DEH Boards and Committees 61
A13 Legislation Administered by DEH 62
financiaL statements 64
aUXiLiaRy RepORt 112MarineParksCouncilofSouthAustralia 2007-08 Report of activities 112

2
2007-08 HIGHLIGHTSnature conservation program
Released • No Species Loss: a Nature Conservation Strategy for South Australia
2007-2017.
Finalised the draft • East meets West NatureLinks Plan.
River Murray Forest project launched by the Premier, the Hon. Mike Rann MP, •
in August 2007.
Gazetted revisions to the Threatened Species Schedules under the • National
Parks and Wildlife Act 1972 in February 2008.
Released the draft • South Australian Arid Lands Biodiversity Strategy 2008-2018
for public comment.
public Land Visitor management programCompleted major facility upgrades at Belair National Park and at West Cape, •
Innes National Park.
Finalised the Trail Strategy for South Australia’s National Parks. •
Completed strategic plans for the Seal Bay Conservation Park, and Lincoln and •
Coffin Bay national parks.
Completed policies for cycling, rock-climbing and abseiling in DEH-managed •
reserves.
Developed a Commercial Tour Operator Licensing Policy in consultation with •
industry.
public Land fire management programDeveloped draft fire management plans that cover approximately one-third of •
the protected areas managed by DEH.
Completed a fire severity project after the December 2007 bushfires on •
Kangaroo Island.
Supported the CFS in bushfire suppression operations and developed remote •
area fire fighting team (RAFT) capabilities in conjunction with the CFS.
Appointed a senior DEH executive as an Assistant Chief Officer of the CFS.•
Joint agency arrangements continued with SA Water to increase DEH’s fire •
suppression capabilities.
public Land stewardship programThree new conservation parks totalling 214 ha were proclaimed and reserve •
management plans were adopted for four reserves, with public consultation
completed for a further seven reserves.
An Indigenous Land Use Agreement and Co-management Agreement was •
formalised over Witjira National Park.
The Crown Land Management Bill 2008 was introduced to Parliament to •
replace the Crown Lands Act 1929.
Completed 93 per cent of the Perpetual Leases Accelerated Freeholding •
Project.

3
coast and marine conservation program
Proclaimed the • Marine Parks Act 2007 and established the Marine Parks
Council.
DEH staff consulted widely with community groups to support the development •
of marine parks. The Design Principles document was released detailing
international best practice for designing and selecting marine parks.
Completed a program of sandshifter trials as part of • Adelaide’s Living Beaches
Strategy: A Strategy for 2005–2025.
Finalised the • Adelaide Dolphin Sanctuary Management Plan.
Continued to work with the South Australian Research and Development •
Institute (SARDI) Aquatic Sciences division on a seagrass restoration project.
botanic Gardens managementOpened the Amazon Waterlily Pavilion to the public.•
Attracted 1.726 million visitors in 2007-08. •
The Sustainable Landscapes project has achieved significant results in •
demonstrating and promoting appropriate park and garden design, species
selection and sustainable horticultural practices relevant to the South Australian
climate.
A research partnership between Iluka Resources Ltd, the University of Adelaide •
and Botanic Gardens of Adelaide entered its second year, with the focus on
field and laboratory-based experiments.
Continued the focus on sustainable horticulture and community leadership by •
demonstrating and promoting responsible water usage.
Heritage conservationCompleted the third stage of the single heritage register for national, state and •
local heritage in South Australia.
Developed virtual tours of heritage places on the DEH website.•
A total $240 000 in Heritage Grants helped private owners of heritage buildings •
complete 47 conservation projects across the state.
The marking of the grave of an unknown sailor from the • Fides, a Finnish ship
wrecked near Kangaroo Island in 1860 with the loss of 10 lives, was a highlight
of the marine heritage program.
Completed maintenance and conservation work upgrades of heritage places •
in several parks and reserves and on DEH-managed land.
AnimalWelfareIntroduced the Prevention of Cruelty to Animals (Animal Welfare) Bill 2008 to •
parliament to amend the Prevention of Cruelty to Animals Act 1985.
Additional funding from the State Government was provided for the RSPCA for •
the enforcement of the amended Act.
The Dog and Cat Management Board commissioned and received •
impact assessments outlining options for the management of cats and for
microchipping of companion animals during the year.
4
agency support servicesRedeveloped the parks website to extend community knowledge about •
access to DEH parks.
Developed web-based mapping systems and training for DEH staff, and •
provided mapping support for emergency response at incident control centres.
Introduced a range of improved policies and processes to serve customers by •
the automation of account-payment options.
The first ‘Leadership for Sustainability’ program was provided for DEH staff.•
Conducted a customer satisfaction survey with the University of South •
Australia’s Ehrenberg Bass School of Marketing, which led to the preparation of
a draft customer service charter.
Coordinated ‘Stirring the Possum’ community forums and a World Environment •
Day event in Rundle Mall.
CASE STUDYHealthyParksforHealthyPeople
In line with DEH’s corporate goal of South Australians Involved, social inclusion
research was conducted with multicultural groups and people with disabilities
to identify the relevance and value to them of DEH-protected areas.
Other Healthy Parks Healthy People initiatives were designed to engage
people and groups with little connection to or awareness of national parks,
and community members most at risk of poor health.
New arrival communities were consulted and African and Afghani refugee
groups taken to Morialta Conservation Park, where they could see how parks
may be used for recreation and play, as venues for community and family
gatherings, and for appreciating the Australian environment and wildlife.
Feedback from the visitors and the social-inclusion research data, together
with information from other agencies involved with new arrival and
multicultural communities, will contribute to the Visitor Management Branch’s
promotion of parks and policies for connecting targeted communities to the
natural environment.
DEH and its Healthy Parks Healthy People program has been listed in the
South Australian Health Department’s Public Health Bulletin as a key example
of the Health in All Policies approach and how across-government efforts
can help reduce overweight and obesity in South Australia.

5
GOVERNANCE STATEMENTThe Department for Environment and Heritage (DEH) is responsible for environment
policy, biodiversity conservation, heritage conservation and animal welfare,
and is a custodian of information and knowledge about the state’s environment.
The department also manages the state’s public land, both that held in the
conservation reserve system and that held as Crown lands. DEH is part of the
Environment and Conservation Portfolio and reports to the Minister for Environment
and Conservation.
the environment and conservation portfolioThe Environment and Conservation Portfolio includes DEH and three other agencies.
The Department of Water, Land and Biodiversity Conservation (DWLBC) •
is responsible for the allocation and sustainable management of natural
resources.
The Environment Protection Authority (EPA) supports industry, community •
and governments in adopting more sustainable practices.
Zero Waste SA (ZWSA) promotes waste-management practices that minimise •
waste, and advances resource recovery and recycling.
deH GovernanceDEH is an administrative unit established under the Public Sector Management Act
1995 within the South Australian Public Service.
The Chief Executive and the DEH Executive (comprising the Executive Directors of
the six directorates) implement, evaluate and improve DEH’s governance structures
and processes. Risk management and internal controls are important elements
of DEH’s governance framework. The internal audit function helps DEH monitor
the implementation and effectiveness of its internal controls and risk management
policies.
Consultation with DEH staff occurs through regular internal media, including the
CE Update, the Chief Executive’s quarterly consultative forum and directorate
consultative committees, and through staff meetings and reference groups.
south australia’s strategic planSouth Australia’s Strategic Plan is the state’s plan for growth. DEH has been
assigned responsibility for developing strategies to achieve three targets from the
SASP’s Goal 3, ‘Attaining Sustainability’, which are nominated as key objectives
within the DEH Corporate Plan 2007-2010. The three SASP lead targets contribute
directly to the Corporate Plan’s ‘Healthy environment’ goal.
A biannual independent review assesses progress towards each SASP target.
The SASP Audit Committee’s assessments of DEH’s three lead targets are included
in this report.
6
T3.1–Losenospecies:Losenoknownnativespeciesasaresultofhumanimpacts.
In July 2007 the Minister for Environment and Conservation released No Species Loss,
a framework for conserving South Australia’s natural environment. No Species Loss
is now reflected in strategies within the State Natural Resources Management Plan
2006 and Tackling Climate Change: South Australia’s Greenhouse Strategy
2006-2020.
DEH data provided to the biannual review indicated that there were no extinctions
recorded in South Australia between 2000 and 2008. However, there was an
increase in the number of listed threatened species during this period, which can
be attributed to:
• ongoingcataloguingandrefinementofSouthAustralia’sspecies;
• taxonomicrevisions;
• improvedinformationaboutspeciespopulation,distributionandhabits;and
• declinesinthenumbersorrangeofsomespecies.
SASP Audit Committee’s assessment:
• Progresstowardtarget–steadyornomovement
• Targetachievability–withinreach
T3.2–Landbiodiversity:by2010havefivewell-establishedbiodiversitycorridorsaimed at maximising ecological outcomes particularly in the face of climate change.
The NatureLinks program finalised and released the first draft corridor plan in
2007-08 – East meets West NatureLinks Corridor Plan. Planning for the Flinders Olary,
Cape Borda to Barossa, and River Murray Coorong corridors commenced.
During 2007-08 marketing tools were developed to communicate the NatureLinks
philosophy to communities and industries.
SASP Audit Committee’s assessment:
• Progresstowardtarget–positivemovement
• Targetachievability–withinreach
T3.4–Marinebiodiversity:by2010create19marineparksaimedatmaximisingecological outcomes.
The Marine Parks Act 2007 was proclaimed, providing for the establishment of 19 marine parks. The marine parks program has also identified 19 sites as having high marine biodiversity conservation value as potential sites for the marine parks.
SASP Audit Committee’s assessment:
• Progresstowardtarget–positivemovement
• Targetachievability–ontrack

7
aLL-aGency sasp taRGetsDEH also contributes to the achievement of other across-government
SASP targets that have been incorporated into its planning and program and
sub-program activities.
Achievement against each All-Agency Target is discussed in the relevant program
or sub-program report later in this report.
T1.7 – Performance in the public sector – customer and client satisfaction with •
government services (refer to Governance, Environment Policy and Public
Affairs Sub-program report)
T1.8 – Performance in the public sector – government decision making •
(refer to Governance, Environment Policy and Public Affairs Sub-program
report)
T3.13 – Energy efficiency – government buildings (refer to Energy Efficiency •
report)
T5.1 – Boards and committees: increase the number of women on all State •
Government boards and committees to 50 per cent on average by 2008, and
maintain thereafter by ensuring that 50 per cent of women are appointed, on
average, each quarter (refer to Governance, Environment Policy and Public
Affairs Sub-program report)
T5.2 – Chairs of boards and committees: increase the number of women •
chairing state government boards and committees by 50 per cent by 2010
(refer to Governance, Environment Policy and Public Affairs Sub-program
report)
T6.1 – Aboriginal wellbeing (refer to the DEH Reconciliation Report)•
T6.22 – People with disabilities: double the number of people with disabilities •
employed by 2014 (refer to the Disability Action Plan report)
T6.23 – Women: have women comprising half of the public sector employees •
in the executive levels (including Chief Executives) by 2014 (refer to the Human
Resource Services Sub-program report)
T6.24 – Aboriginal employees: increase the participation of Aboriginal people •
in the South Australian public sector, spread across all classifications and
agencies, to 2 per cent by 2010 and maintain or better those levels through to
2014 (refer to the Human Resource Services Sub-Program report).
deH corporate planThe Department for Environment and Heritage Corporate Plan 2007-2010 was
released in July 2007. DEH’s four core values were bolstered with the addition
of a new value:
• publicservice,responsibilityandaccountability;
• candour,diplomacyandcooperation;
• imagination,diversityandinnovation;
• thinking,inquiryanddiscipline;and
• safety,healthandenjoyment.

8
The department’s priorities were refocused through five new goals that responded
to changes in government priorities, including the SASP targets. The Corporate Plan
goals are now:
• SouthAustraliansinvolved;
• Ahealthyenvironment;
• Sustainablegrowth;
• Betterdecisionsandpartnerships;and
• Gettingresults.
2007-08 was the first full year of delivering DEH’s business based on the philosophy of
the revised Corporate Plan. It identifies clearly DEH’s strategic goals and objectives,
enabling every person in the department to consider shared outcomes when
developing programs and activities.
A targeted communications program led by the DEH Executive helped the
department’s staff and external partners understand the organisation’s priorities
and objectives and that the Corporate Plan is not separate from the department’s
planning and delivery structure.
Organisational structureIn order to improve the effectiveness of DEH in achieving its Corporate Plan
goals, the Chief Executive during the year implemented minor changes to the six
directorates that comprise the organisation’s structure. These changes aimed to:
• consolidatepolicyandprogramresponsibilitiesinonedirectorate,
Conservation Policy and Programs (CPP);
• maintaintheBotanicGardensasadirectoratetoreflectitsimportanceasa
scientific and cultural institution in South Australia;
• maintainastrongregionalemphasisonconservationdelivery,withaname
change – to Regional Conservation Delivery (RCD) – that reflects this goal;
• bringscience,knowledge,informationandtechnologyendeavourstogetherin
a new directorate called Information, Science and Technology (IST);
• establishanothernewdirectorate,PeopleandStrategy(PSD),consistingof
the former Office of the Chief Executive and the Human Resources Branch of
Business Services; and
• maintaintheBusinessServicesDirectorate(BSD),withitsfocusonsupporting
and improving business performance and effectiveness.
In addition, the title of Executive Director was introduced to align DEH with other
departments in the public service.
9
conservation policy and programs
The Conservation Policy and Programs Directorate provides policy leadership,
program direction and support for the protection and management of natural and
cultural heritage across the state. Specifically, the directorate:
provides strategic policy advice, programs and support for protected area and •
public land management, coast and marine conservation, heritage protection,
natural resources management, visitor management, biodiversity conservation,
Aboriginal partnerships, volunteer support and animal welfare; and
delivers programs such as conservation and management of state heritage, •
Crown lands and coast and marine environments, where there is a need for
centralisation, scientific support, monitoring for biodiversity management and
ensuring environmental objectives are addressed in development proposals.
The Executive Director, Conservation Policy and Programs, holds the statutory
position of Director of National Parks and Wildlife under the National Parks and
Wildlife Act 1972.
botanic Gardens
The Botanic Gardens Directorate manages the Botanic Gardens and State
Herbarium. The directorate promotes the Botanic Gardens and State Herbarium as
a cultural and scientific institution focusing on plants, people and culture, promotes
sustainable urban landscapes, and contributes to habitat restoration.
The Executive Director holds the statutory position of Director, Botanic Gardens and
State Herbarium under the Botanic Gardens and State Herbarium Act 1978.
Regional conservation delivery
The Regional Conservation Delivery Directorate undertakes the majority of DEH
on-ground programs and:
delivers DEH conservation programs statewide;•
manages the state’s public lands (national parks and wildlife reserves and •
Crown land), including maintenance of built assets and visitor facilities;
delivers statewide programs addressing fire management and resource •
protection, including wildlife licensing; and
supports Natural Resources Management (NRM) Boards.•
Close working relationships with the Conservation Policy and Programs Directorate
and other public, private and community organisations are maintained to ensure
that policy and programming work can achieve desired outcomes.

10
information, science and technology
The Information, Science and Technology Directorate has a multi-faceted role,
servicing the diverse needs of DEH, the Environment and Conservation Portfolio,
business and the wider community. Its responsibilities include:
enabling efficient, effective access to a wide range of environmental data, •
information and products;
providing aerial photography and satellite imagery services to DEH and other •
government programs;
developing an environmental education framework;•
providing information communication technology (ICT) services and •
infrastructure to support DEH, the EPA and Zero Waste; and
coordinating development and maintenance of the DEH Internet and Intranet •
websites.
business services
The Business Services Directorate provides leadership in corporate processes and
offers strategic advice – in line with the requirements of the government, Minister
and central agencies – to DEH directorates, the Environment Protection Authority,
Zero Waste SA and various boards and committees in financial, asset management,
procurement and general administrative services.
The directorate ensures that the department delivers sound, efficient and effective
support services, processes, and advice to its customers.
people and strategy
The People and Strategy Directorate provides high-level leadership to the
department and a range of strategic and management services to support the
Minister, the Chief Executive and Executive Directors. The directorate’s key roles
include:
establishing and reviewing DEH’s corporate governance arrangements, •
including monitoring internal control frameworks and independent assurance
of departmental activities;
managing the corporate planning cycle and providing leadership in the •
application and continuous improvement of the department’s planning,
budgeting and reporting structure;
strategic coordination of internal and external communications, including •
electronic and print media production, public relations, marketing and
event management;
identifying, delivering and evaluating strategic projects to enhance the •
performance of the organisation;
promoting agency-wide and cross-portfolio partnerships to ensure informed •
decision-making in the achievement of government objectives; and
fostering intra-agency communication and liaison on behalf of the •
Chief Executive.
11
program structureAdjustments to the DEH program structure were approved and implemented in
2006-07. As a result the department managed its business through nine programs
and seven sub-programs in 2007-08.
This annual report provides a summary of each program’s progress during 2007-08
and lists their 2008-09 targets.
nature conservation
The protection and restoration of ecosystems, habitats, species and populations by
developing conservation policies and programs with industries, government and
communities and by undertaking and supporting research, surveys and monitoring
of South Australia’s ecosystems, habitats, species and populations.
public Land – Visitor management
The promotion of public enjoyment and the conservation of the state’s natural
and cultural heritage by providing opportunities for environmentally sensitive,
economically viable and socially responsible visitor experiences.
public Land – fire management
The development and implementation of fire management policy, procedures
and programs to reduce risk to life and property while conserving our natural and
cultural heritage on lands managed by the department.
public Land – stewardship
To ensure that public lands are managed effectively and that ecologically
sustainable principles are applied when acquiring, allocating and disposing of
public lands.
coast and marine conservation
The conservation, protection and associated management of the state’s coast and
marine environments.
botanic Gardens management
The management of the natural and cultural resources of the Botanic Gardens
and State Herbarium to advance plant conservation and sustainable horticulture
practices, and to enrich society.
Heritage conservation
The identification, conservation, protection and celebration of the state’s places
and objects of non-Aboriginal heritage significance.
AnimalWelfare
The promotion and regulation of the humane treatment of animals.
agency support services
The provision of business support services to the various operational units within the
Department for Environment and Heritage, the Environment Protection Authority,
Zero Waste SA and other related boards and committees. Agency Support Services
consists of seven sub-programs – Environmental Information; IT; Web and Records
Management; Governance, Environmental Policy and Public Affairs; Human
Resources; Asset Management; Financial Services and Administration.
A matrix of DEH’s programs and directorates forms the basis of the department’s
planning, budgeting and reporting framework.

12
Program managers and sub-program managers work with branches and regions
to determine priorities for the next three to five years and develop activities for
implementation. These priorities and activities direct the allocation of the base,
project and capital investing budgets.
The implementation of the priorities in each program plan occurs through the
directorates, branches and regions. These are reviewed through local reporting
and monitoring practices and performance management discussions. Each
directorate’s progress is recorded in the DEH Management Planning and Reporting
Tool (MPRT) and reports are generated each quarter to help Executive Directors
monitor progress.
CASE STUDY managing a mine site
Iluka Resources Limited has identified a major mineral sands province in
the northwest corner of Yellabinna Regional Reserve. In May 2008 Iluka
announced that its board had agreed to develop the mine, with approval
given for $420 million worth of capital expenditure.
Iluka has advised that the combined ‘Jacinth’ and ‘Ambrosia’ deposits total
about 150 million tonnes, and that the mine life is about 10 years. The project
will deliver significant benefits for the state and the region with approximately
250 people employed during construction and 120 when the mine is
operational. The project includes two mining pits, a transferable mining
unit, a wet concentrator, a clay disposal dam and associated infrastructure
including power station, airstrip, village, bore field, water pipeline, borrow pits,
and access roads.
Jacinth-Ambrosia is expected to be Australia’s largest zircon operation and
a major global supplier of high-quality zircon, used in the manufacture of
ceramics. As the mine is located on a reserve, strict environmental guidelines
are being established. DEH has worked closely with PIRSA and Iluka to
develop appropriate conditions to address all environmental and park
management issues.
The heavy mineral concentrate will be transported by road from the
mine site to Port Thevenard at Ceduna, where it will be loaded onto ships
and transported to Western Australia for processing for export at existing
Iluka operations. The existing dirt Ooldea Road between Yellabinna and
Nullarbor Regional Reserves will be upgraded to cater for transport of mineral
concentrate.
The Ministers for Environment and Conservation and Mineral Resources
Development have approved the mining lease, but Iluka is also required to
develop a Mining and Rehabilitation Program (MARP) with DEH and PIRSA.
The MARP will include environmental management provisions to cover the life
of the mine, as well as rehabilitation requirements.
13
CASE STUDYCooperativeManagementofWitjiraNationalPark
In August 2007 the Minister for Environment and Conservation signed an
Indigenous Land Use Agreement (ILUA) and a Co-Management Agreement
(CMA) with traditional owners over the Witjira National Park.
In recognition of the Lower Southern Arrernte (urr-an-dah) and
Wangkangurru (won-kon-guru) people’s traditional association with the land,
the Park was proclaimed as the Witjira National Park in November 1985. The
name ‘Witjira’ is derived from the Lower Southern Arrernte language and
refers to a paperbark tree fringing many of the springs at Dalhousie.
Witjira National Park was the first National Park in South Australia to have
joint management between the traditional owners and the then Minster for
Environment and Natural Resources. Since 1995 the park has been managed
according to the terms of a 99-year lease between the Irrwanyere
(err-wan-ya-re) Aboriginal Corporation (IAC) representing the Lower
Southern Arrernte and Wangkangurru peoples and the then Minister for
Environment and Natural Resources, and the management plan for the park.
In 1995 the then Minister for Environment and Natural Resources established
the Witjira National Park Board of Management, representing the traditional
owners/native title claimants and DEH, to help ensure that the park was
managed in a way that respects both contemporary and traditional culture,
knowledge and skills.
In 2005 negotiations commenced between the State and the IAC for an
Indigenous Land Use Agreement and a Co-management Agreement.
As part of the overall settlement of the native title claim including the
National Park, the Federal Court will hand down a Consent Determination
on 9 September 2008 at Dalhousie Springs in the Witjira National Park. This is
the first time a Consent Determination is being handed down to native title
claimants in conjunction with a negotiated ILUA and a CMA over a national
park in South Australia.
DEH has enjoyed a long relationship with the traditional owners. The
department recognises that the Aboriginal people wish to be involved in
park management and that negotiation is preferable to court proceedings in
settling native title claims.
14
DEH PROGRAM PERFORMANCE
nature conservation program Protecting,maintaining,improvingandrestoringecosystems,habitats,species and populations by developing nature conservation policies and programswithindustries,governmentandcommunitiesandbyundertakingandsupportingresearchandmonitoringofSouthAustralia’sbiodiversity.
HighlightsThe Nature Conservation Program in 2007-08 finalised No Species Loss: a Nature
Conservation Strategy for South Australia 2007-2017, a key milestone in South
Australia’s Strategic Plan target to lose no more native species as a result of human
activity. Released by the Minister for Environment and Conservation,
the Hon. Gail Gago MLC, on 10 July 2007, No Species Loss is the first statewide
nature conservation strategy for South Australia. During 2007-08, considerable effort
has been devoted to ensuring the strategy’s goals are a focus of the department’s
conservation endeavours.
While work focused on ensuring the state loses no species, the program found
two new populations of one of Australia’s rare native orchids and identified four
previously unrecorded species. The Hindmarsh Valley Greenhood, Pterostylis
bryophila, is an orchid at risk of extinction and not found anywhere else in the
world. The Biological Survey program recorded new four species – the pink-
blotched gecko, the broad-banded sandswimmer, the western blue tongue lizard
and Bolam’s mouse – while surveying the proposed Caroona Creek Conservation
Park.
The South Australian Government has determined that by 2010 there will be five
well established biodiversity (NatureLinks) corridors aimed at maximising ecological
outcomes. The program released for public comment the draft East meets West
NatureLinks Corridor Plan during 2007-08; the final plan is planned for release in
late 2008.
The Premier, the Hon. Mike Rann MP, formally launched the River Murray Forest
project in August 2007. The project aims to establish an additional 2.5 million-tree
native forest between Morgan and Renmark in the Riverland.
Revisions to the Threatened Species Schedules under the National Parks and Wildlife
Act 1972 were gazetted in February 2008, recognising 96 more threatened species
and taking the total to 1137.
DEH assisted with the development of an ecological recovery strategy for Lake
Alexandrina and Lake Albert, aiming to restore these areas to a functioning
freshwater wetland ecosystem. DEH’s support included modelling ecosystem
responses to river flows and various water and land management options, and
introducing a monitoring system to track changes in water chemistry.
In 2007-08, 19 new native vegetation Heritage Agreements were registered, adding
6205 hectares to more than 600 000 protected hectares.

15
In partnership with the South Australian Arid Lands Natural Resources Management
(NRM) Board, the draft South Australian Arid Lands Biodiversity Strategy was
completed and released for public comment.
The Nature Conservation Program introduced recovery plans for threatened species
including the sandhill dunnart, black-flanked rock-wallaby (or warru), black-eared
miner, mallee fowl and threatened plants including orchids in the Mount Lofty
Ranges and Northern and Yorke region.
Regional status assessments have started for flora and fauna and Australia’s Virtual
Herbarium (AVH) web interface was upgraded, with data captured for more than
700 000 vascular plant collections.
KeyChallengesandTargetsfor2008-09challenges
Key challenges to the successful implementation of No Species Loss include:
working with industry and communities to develop and implement actions;•
accessing knowledge crucial to achieving the desired outcomes, particularly •
given the added pressure of and uncertainty about climate change; and
completing landscape restoration projects and threatened species •
management within current resource levels.
targets
Complete the development of the • No Species Loss implementation plan and
support other agencies in delivering targets
Increase the awareness of landowners, industry, government and communities •
about how they can conserve and sustainably work with biodiversity
Release the • East meets West Biodiversity Corridor Plan and continue the
development of, and undertake public consultation on, draft NatureLinks
Corridor plans for Flinders Olary, River Murray Coorong, and Cape Borda to
Barossa
Continue establishing the River Murray Forest •
Finalise the environmental impact assessment of a proposed temporary weir •
near Pomanda Island
Develop a recovery strategy to re-establish wetland vegetation and organic •
matter at Lake Alexandrina and Lake Albert
Monitor the effectiveness of bio-accumulation in mitigating acid sulphate soils •
and re-establishing functioning wetland ecosystems
Continue the landscape restoration project and the regional status assessments •
for flora and fauna
Release and implement biodiversity strategies for South Australia’s Arid Lands •
and the Adelaide and Mount Lofty Ranges NRM regions
Monitor the effects of drought on the operation of the kangaroo industry•

16
public Land – Visitor management programPromotingpublicenjoymentandtheconservationofthestate’snaturaland cultural heritage through the provision of sustainable opportunities forenvironmentallysensitive,economicallyviableandsociallyresponsiblevisitorexperiences.
HighlightsDuring 2007-08 major facility upgrades were completed at Belair National Park
and at West Cape, Innes National Park. Car parks, shelters and barbecues have
been built at Belair, and stage two of Belair National Park’s Interpretation Plan
has been completed to improve visitor orientation and connection with the park.
Improvements at West Cape included sealing the entry road and building a car
park, picnic shelter, toilets, lookout, clifftop walk and beach access.
The DEH Trails Strategy, On Track – A Trail Strategy for South Australia’s National
Parks, was finalised. This was supported by the development of the DEH
Interpretation Plan and the Heysen Trail Strategic Plan and Management Plan for
priority sections of the trail.
Other achievementsStrategic plans for the Seal Bay Conservation Park and Lincoln and Coffin Bay
national parks were completed with input from tourism industry representatives and
other stakeholders. A range of potential visitor experiences has been identified for
Seal Bay and will be investigated during 2008-09.
Policies for cycling, rock-climbing and abseiling in DEH-managed reserves were
completed during 2007-08. The policies aim to balance the conservation of natural
and cultural values with the provision of safe, sustainable and high-quality visitor
experiences in parks and reserves. Similarly, the draft policy and procedure for
the management in parks of motor vehicles, including four-wheel drives and trail
bikes – which has been released for community consultation – seeks to provide
opportunities for motor-vehicle access while minimising the impact of such access
on the environment.
A Commercial Tour Operator Licensing Policy has been developed in consultation
with industry to provide a framework for licensing tour operators accessing and
using South Australia’s reserves.
A comprehensive Interpretation Plan was completed for Flinders Ranges National
Park. First-stage implementation focused on Indigenous cultural interpretation and
advancement of reconciliation.
‘Ikara - the meeting place’ was designed as a public art space where
Adnyamathanha people could share their culture and knowledge with park visitors.
Ikara has received several prestigious awards since its launch in April 2007, including
the 2007 ArtSA Ruby Award for best new work, SA Great’s Regional SATC Tourism
Award 2007 and the Interpretation Australia Association Award 2007 for excellence
in heritage interpretation. During the year, cultural awareness workshops were
hosted at Ikara for DEH staff and local tour operators.

17
KeyChallengesandTargetsfor2008-09challenges
The major challenge for the program will be to prepare a contemporary Visitor
Management Strategy.
targets
Prepare a Visitor Management Strategy•
Use the • HealthyParks,HealthyPeople program to encourage visitors to parks
Implement the • Statewide Trails Strategy and the Heysen Trail Strategic Plan
Improve existing commercial operations and develop additional sustainable •
opportunities
Plan visitor management requirements for marine parks•
Complete the Commercial Marine Mammal Interaction policy and permit •
system to support the proposed Marine Mammal Regulations
Implement the DEH risk assessment and management program to improve •
visitor safety in parks
Undertake visitor site and infrastructure planning, upgrade and refurbishment •
projects guided by approved strategic master plans
Implement the DEH Visitor Interpretation and Information plans •
CASE STUDY Scientificpartnershipsformarineparks
DEH marine scientists were joined by a team of robotics experts from the
University of Sydney for a six-day research trip on board the SA Research and
Development Institute (SARDI) marine research vessel Ngerin.
DEH was one of two South Australian groups to win access to the Integrated
Marine Observing System’s (IMOS) nation-wide pool of resources, giving
our marine scientists the extraordinary opportunity to use the autonomous
underwater vehicle (AUV).
The AUV was used to reach deeper and more remote parts of South
Australia’s marine environment and retrieved more than a quarter of a
million images from the ocean floor off Eyre Peninsula. The images provide
continual coverage of the ocean floor, and may answer a range of research
questions.
The robotics engineers will collate the data obtained from the trip and use it
to create sea-floor habitat maps that will contribute to the design of South
Australia’s proposed 19 marine parks.
The opportunity to use the AUV formed part of the larger $6.4 million Southern
Australia IMOS managed by SARDI and Flinders University.
18
public Land – fire management programThedevelopmentandimplementationoffiremanagementpolicy,procedures and programs to reduce risk to life and property while conserving our natural and cultural heritage on lands managed by the department.
HighlightsIn 2007-08 DEH continued to develop comprehensive fire-management plans for
South Australia’s reserves. Plans for reserves in the following areas have passed
through public consultation and await adoption: the Southern Foothills and Hills
Face Zone in the Mount Lofty Ranges, South-western Fleurieu Peninsula, Southern
Flinders Ranges, Southern Eyre Peninsula, Ngarkat and Billiatt Districts and Bookmark
Mallee. Another two plans – the Cape Forbin Integrated Plan (Kangaroo Island)
and Reserves of the South East – which are currently being prepared will be
completed during 2008-09.
Recommended works in all draft plans are being integrated into annual works
programs. When the current plans are completed, 119 reserves – or about 30 per
cent of DEH reserves – will have approved Fire Management Plans.
All fire-management policies and procedures were reviewed for inclusion in a
procedure manual to be adopted by the Chief Executive in 2008-09.
Project FuSE – the collaboration between the Bushfire Cooperative Research
Council, DEH and CSIRO – completed its third burning phase in 2007-08.
Experimental burning began in March 2008 on the western boundary of Kirra in
Ngarkat Conservation Park. With the support of the Country Fire Service (CFS), the
project has been expanded to include investigating the effectiveness of aerial
suppression.
Other achievementsCollaboration with an Australian Research Council Linkage Project continues, with
two PhD students commencing in March 2008. The project is examining species
and community shifts and fire histories in Eyre Peninsula mallee reserves. Fieldwork
will commence in the 2008-09 financial year.
The Kangaroo Island bushfires – started by lightning strikes on 6 December 2007 –
burned 73 000 hectares of DEH reserves, including 65 per cent of Flinders Chase
National Park, 98 per cent of Ravine des Casoars Wilderness Protection Areas and
other reserve land at Cape Gantheaume, Seal Bay and Western River. The fires
were the most complex in South Australian history and suppression efforts were
assisted by firefighters from four states.
A fire severity project was undertaken as a result of the Kangaroo Island fires. Fire
severity is the ecological expression of fire intensity, affecting vegetation recovery,
water quality, future ecological burning, planning and operations. Initial findings
are to be presented at the FIRE2008 conference in Adelaide in September 2008.
DEH continued to support the CFS in suppression operations, with staff attending
67 bushfires that burned 443 727 hectares, of which 437 848 hectares were within
DEH-managed reserves.

19
During the year, 39 prescribed burns, totalling about 4960 hectares, were
conducted. Targeted training in specialist fire management operations continued,
as did an arrangement with SA Water that has resulted in six new fire appliances
and the recruitment of more seasonal firefighters, taking the firefighter tally to 64.
The CFS is working with DEH to develop remote area firefighting capabilities for the
fire season ahead.
Ecological fire management guidelines were developed for the Billiatt District,
Bookmark Mallee, South East and Lower Eyre Peninsula. A new flora and fauna fire
response database will assist fire managers prepare for prescribed burns.
Improved knowledge of the fire behaviours of various animal and plant species,
including mallee and heath vegetation types, has provided valuable information
for future management.
Two DEH staff members participated in a Fire Study Tour of Canada and the United
States, and a senior DEH executive was appointed an Assistant Chief Officer of the
CFS. DEH staff will help stage the International Fire and Research conference in
Adelaide in September 2008.
KeyChallengesandTargetsfor2008-09challenges
As the state’s largest land manager, DEH is confronting fire-management issues
and problems such as climate change, urban sprawl, water availability, fewer
volunteers, litigation, staff retention and soaring suppression costs.
Traditionally, a bigger bushfire threat is fought with more suppression resources.
Despite advancements in suppression equipment and technology, the impact
of bushfires is increasing. The global focus is now shifting to fuel and vegetation
management, which significantly affects land managers such as DEH.
targets
• WiththeCFS,developremote-areafirefightingcapabilities
• Completeandimplement10FireManagementPlans
• ContinuecollaboratingwithSAWateranddevelopotherkeypartnerships
• Continueskilledandspecialisttraining
• IncreaseDEHbrigademembership
• Furtherintegratefireecology,scienceandresearchintofire
management practices
• Continuefuelreductionandecologicalmanagementoperationsacross
the state
20
public Land – stewardship programEnsuringthatpubliclandsandprotectedareasaremanagedeffectively.
Highlights Three new conservation parks totalling 214 hectares were proclaimed during
2007-08: Vivigani Ardune in the South East, and Minlacowie and Ramsay on Yorke
Peninsula. DEH has also developed partnerships with private land-conservation
organisations that have led to the purchase and protection of about 215 000
hectares of ephemeral freshwater ecosystem, grassland and woodland habitat in
outback South Australia.
Management plans have been adopted by the Minister for Environment and
Conservation for four reserves – the Mowantjie Willauwar and Poonthie Ruwi
Conservation Parks, and O’Halloran Hill and Shepherds Hill Recreation Parks.
Public consultation was completed on draft management plans for Ngaut Ngaut
Conservation Park, Mainland Conservation Parks of Yorke Peninsula, Sturt Gorge
Recreation Park, Mamungari Conservation Park, and Althorpe Islands, Goose Island
and Troubridge Island Conservation Parks.
Negotiations for an Indigenous Land Use Agreement and Co-management
Agreement over Witjira National Park formalised the former co-managed lease
arrangement.
The Crown Land Management Bill was introduced into parliament to replace the
Crown Lands Act 1929. The new legislation establishes ecologically sustainable
development as the basis for land management decision-making and clearly
defines offences relating to the misuse of Crown land.
The program completed 93 per cent of the Perpetual Lease Accelerated
Freeholding Project, and contributed to the finalisation of an Environmental
Assessment Bilateral under the Commonwealth Environment Protection and
Biodiversity Conservation Act 1999.
Other achievementsThe Perpetual Lease Accelerated Freeholding project continued with the issuing
of a further 1100 freehold titles and is now 93 per cent complete. Remaining
applications will be processed in 2008-09.
The Crown Land Revenue Project (CLRP) continued to identify unallotted Crown
land surplus to DEH requirements. Suitable land parcels were sold with part of the
proceeds used for DEH’s acquisition of high-priority conservation land for the parks
system. The CLRP expects a stream of sales during the next four years that will
provide more revenue for the purchase of high biodiversity value land.
A project to develop a ‘Protected Areas on Private Land’ framework began
with Commonwealth funding through the National Reserve System Program.
The framework aims to develop partnerships and create private land protected
areas to complement the public reserve system and contribute to the National
Reserve System.
21
DEH worked closely with other relevant agencies to finalise an Environmental
Assessment Bilateral under the Environment Protection and Biodiversity Conservation
Act 1999 and to identify other ways to streamline environmental assessment
and approvals processes in line with COAG’s 2008 regulatory reforms and the
government’s red tape reduction targets.
There has been a significant focus on managing exploration and mining activities,
including assessing Iluka Resources’ proposed Jacinth-Ambrosia mineral sands mine
in Yellabinna Regional Reserve.
Progress was made on implementing the DEH Volunteer Strategy, which includes
establishing Volunteer Support Ranger positions to coordinate volunteer programs.
KeyChallengesandTargetsfor2008-09challenges
Resolution of native title claims, particularly those which involve co-management
arrangements over parks, will continue to provide opportunities for greater
engagement of Indigenous communities in managing the state’s protected areas
and to advance reconciliation.
Maximising economic and community benefits from Crown lands by extending
the Crown Land Revenue Project and development of the public protected area
system through the Australian Government‘s National Reserve System Program
funding, under the Caring for our Country initiative, are other challenges.
The program also aims to:
develop partnerships with private land-conservation organisations and •
Indigenous communities in establishing and managing protected areas, and to
develop a legislative framework to facilitate this approach;
investigate opportunities to help manage the environmental impacts of •
increased mineral and petroleum exploration in South Australia; and
develop EPBC Act reforms to streamline state and Commonwealth processes. •
Further streamlining of park management plans and processes will be investigated
due to decreased resources from 2008-09.
targets
Complete the Perpetual Lease Accelerated Freeholding Project•
Develop regulations and commence implementation planning for the •
Crown Lands Management Bill
Finalise the • Protected Areas Strategy
Introduce an Amendment Bill to parliament to modernise the reserve •
classification system
Complete the 10-year review of Innamincka and Simpson Desert Regional •
Reserves for tabling in parliament
Complete assessments of Iluka Resources’ proposed Jacinth-Ambrosia mine •
in Yellabinna Regional Reserve

22
coast and marine conservation programEnsuringtheconservation,protectionandongoingsustainableproductivityofSouthAustralia’scoastal,estuarineandmarineenvironments.
HighlightsThe key achievement in 2007-08 was the proclamation in May 2008 of the Marine
Parks Act 2007, which establishes the legal framework for creating and managing
marine parks in South Australia. The legislation is a major step towards meeting
South Australia’s Strategic Plan target of creating 19 marine parks by 2010.
The program also continued its marine-habitat mapping and sand-shifter trial
programs, the latter as part of Adelaide’s Living Beaches Strategy: A Strategy for
2005-2025.
Digital elevation modelling for high-risk coastal areas on Yorke Peninsula has been
developed for the Coast Protection Board (CPB) to address the impact of rising
sea levels due to climate change. Assistance was given to the CPB in preparing
a submission to the Environment Resources and Development Committee’s inquiry
into coastal development.
Funding was provided for critical cliff-stabilisation works in the City of Onkaparinga,
again in conjunction with the CPB.
Other achievementsIn addition to formalising a system for creating parks, the Marine Parks Act 2007
establishes the Marine Parks Council of South Australia, which will provide advice
to the Minister for Environment and Conservation and which held its first meeting in
June 2008.
To support the development of marine parks, DEH staff consulted widely with
community groups, speaking face to face with more than 4500 people during
the first six months of 2008.
DEH’s innovative scientific work continued to ensure that planning and policies
related to the state’s marine parks are supported by the best available
information. Among the information is the Design Principles document released
by the Minister for Environment and Conservation that details international best
practice for designing and selecting marine parks. The principles include scientific
considerations as well as social and economic factors.
The Adelaide Dolphin Sanctuary Management Plan was finalised after public
consultation, and consultation on the National Parks and Wildlife
(Protected Animals – Marine Mammals) Regulations was completed.
23
The Coast and Marine Conservation Program supported the CPB in introducing
policies to manage the effect of coastal hazards such as flooding, erosion and sea-
level rise as a result of climate change. To ensure future coastal development is not
at risk from these and other hazards, DEH:
assessed 215 coastal development applications under delegation from •
the CPB;
contributed to 20 Development Plan amendments and 12 Statements •
of Intent on coastal hazard matters; and
helped establish a Sea Level Rise Advisory Committee to review the CPB’s •
sea-level rise policies and related measures.
DEH continued to work with the South Australian Research and Development
Institute (SARDI) Aquatic Sciences division on a seagrass restoration project.
Results of the project were monitored through a program developed between
Flinders University and SARDI. A joint Australian Research Council (ARC) Linkage
application was lodged to develop a $35 000 research collaboration grant from
Flinders University.
KeyChallengesandTargetsfor2008-09challenges
The assessment and prioritisation of coastal vulnerability mitigation works for coastal
settlements is an important responsibility of the Coast Protection Board. Quantifying
the vulnerability of the South Australian coast will require broad-scale digital
elevation modelling of the coast. Elevation modelling will be developed upon
finalisation and implementation of the Australian Government’s National Elevation
Data Framework.
targets
Proclaim boundaries for 19 marine parks •
Establish regional consultative forums to support the development •
of marine-park management plans
Develop regulations under the • Marine Parks Act 2007
The Sea Level Rise Advisory Committee to the CPB to review scientific evidence •
on sea-level rise and advise the Board on policies
Continue the identification of coastal land vulnerable to flooding, erosion •
and the effects of climate change-induced sea-level rise
Continue to work with the Australian Government on the National Elevation •
Data Framework and coastal vulnerability assessment programs
24
botanic Gardens management programManaging the natural and cultural resources of the Botanic Gardens and State Herbarium to advance plant conservation and sustainable horticulturepractices,andtoenrichsociety.
HighlightsAs part of the Botanic Gardens’ 150th birthday celebrations, the G150 Foundation
raised $5.7 million for capital works. Overwhelming support from the corporate
sector and wider community has provided the gardens with facilities where visitors
learn the vital roles plants play in our daily life, environmental reconciliation and
conservation.
Among the anniversary celebrations was the opening of the $4.3 million Amazon
Waterlily Pavilion – an energy-efficient glass house containing the Gardens’ iconic
giant Amazon waterlily and a world-class terrestrial bromeliad collection – and
Victoria amazonia exhibition by the Premier, the Hon Mike Rann MP, in November
2007. More than 120 rare books, artworks and ethno-botanical objects from
Guyana, archival documents, photographs, plans, drawings and plant specimens
were displayed in the exhibition.
Sustainable design principles have been incorporated into the pavilion and the
neighbouring SA Water Mediterranean Garden, which displays more than 130
plant species suitable to South Australia’s climatic conditions. The Sustainable
Landscapes project has also helped demonstrate ‘water-wise’ garden design,
species selection and sustainable horticultural practices suitable for the South
Australian climate.
With state and local-government partners, the Gardens has started planning the
redevelopment of the Adelaide Zoo Frome Road entrance and its impact on the
Adelaide Botanic Park.
Other achievementsA research partnership between Iluka Resources Ltd, the University of Adelaide
and the Botanic Gardens of Adelaide continues to investigate soil seedbank
dynamics, seed dormancy and germination biology for plant species indigenous
to the Western Myall (Acacia papyrocarpa) open woodland within Yellabinna
Regional Reserve, northwest of Ceduna.
Other research included the Adelaide garden’s collaboration with Alcoa World
Alumina Ltd to provide topsoil seed reserves and examine the role of fire related
germination cues in restoring Victoria’s Anglesea coalmine site.
A quality assurance program has been introduced for volunteers helping in the
Schomburgk Pavilion’s Visitor Information Centre.
Events and cultural programs staged at the Botanic Gardens included Moonlight
Cinema, Adelaide Symphony Orchestra Alfresco, ParkLife, the tercentenary
commemoration of the work of Swedish botanist Carl Linnaeus, and the 10th
staging of WOMADelaide at Botanic Park.
An expedition to Guyana led by Botanic Gardens of Adelaide director Stephen
Forbes retraced the 1800s journey of the second director, Richard Schomburgk,
and collected seed of the giant Amazon waterlily, Victoria amazonica.

25
Schools programs including the World Environment Day SA Water quiz trails,
Branch-Out education extension programs, and Frog Census Night for students
from the SA School for Vision Impaired attracted 22 724 students.
Research findings were published in scientific and conservation journals and
presented at national and international conferences.
The Botanic Gardens attracted 1.726 million visitors in 2007-08 and staged eight
major cultural events.
In 2007-08, more than 20 per cent of the Adelaide Botanic Garden lawn areas
again were allowed to dry out and water schedules were adjusted. The
replacement of irrigation systems has improved irrigation efficiency across the
gardens, and investigation continues into the potential for wetland and aquifer
storage and a redraw (ASR) facility using excess flows from First Creek.
The Cascade Fountain now uses wastewater from the reverse osmosis desalinisation
system in the Bicentennial Conservatory, a change projected to save 400 000 litres
of mains water a year.
Mount Lofty Botanic Garden liaised with the Department of Water, Land and
Biodiversity Conservation to secure enough water from the now prescribed
Piccadilly aquifer to ensure Botanic Garden of Adelaide business delivery,
effective management of aquifer water and Mount Lofty Botanic Garden
collection development.
Despite these initiatives, the continued drought prevented significant additional
water savings this year.
KeyChallengesandTargetsfor2008-09challenges
The gardens will continue to demonstrate responsible water usage. Irrigation Master
Plan recommendations will continue to be implemented and negotiations with SA
Water will lead to the use of recycled water from the Glenelg–Adelaide pipeline
from 2010.
targets
Develop a new western entry to the Adelaide Botanic Garden •
Continue the development of a new Garden of Health •
Upgrade water infrastructure to demonstrate effective, efficient and •
appropriate water use
Refurbish the Museum of Economic Botany•
In partnership with the Millennium Seed Bank, continue collecting and •
researching seed of South Australian plant species
Stage seven major cultural events in the gardens•
Extend the Sustainable Landscapes project•

26
Heritage conservation programEnsuringthatthestate’sbuiltandmaritimeheritageandheritageobjectsareidentified,protected,conserved,maintainedandcelebrated.
HighlightsDuring 2007-08 the Heritage Conservation Program achieved a major target
established in Heritage Directions – the creation of a single register for local, state
and national heritage places. As part of this project, DEH completed the mapping
of state heritage places and released the data to Planning SA’s new South
Australian Heritage Places Database website. This provides a single access point for
data on, and hyperlinks to, world, national, state and local heritage places in the
state. Virtual tours of heritage areas have been added to the DEH website.
The Heritage Advisory Service was expanded so that 80 per cent of all state
heritage places now have access to heritage advisors, and a review will lead to
red-tape reduction in development applications.
Other achievementsSouth Australian Heritage Fund grants of $240 000 helped private owners complete
47 conservation projects, including major church restorations in Adelaide and
Gawler, re-roofing at Poltalloch Station, stone conservation at Campbell Park in
the South East and ongoing metal and stone conservation at Marines Terrace in
Grange.
A partnership with the Channel 9 Postcards television show prompted ‘Heritage
Postcards’, which highlighted local places and encouraged students to explore
their local heritage. Thirty new website fact sheets detailed heritage places and
shipwrecks and celebrated significant anniversaries in 2008. In addition, new
interactive maps mean a wider audience can now better appreciate 17 state
heritage areas without leaving home.
History Week prompted a record number of visitors to pass through the ‘Open
Doors’ of 69 heritage-listed buildings while celebrating the 30th anniversary of the
state’s built heritage legislation.
A series of seminars enabled the South Australian Heritage Council and Register
Committee to identify issues and provide information for the Council’s Planning
Review submission.
Reviews of three grants will lead to a more targeted allocation of resources, while
a series of workshops has helped heritage advisers respond to heritage-related
development applications.
A highlight of the marine heritage program was the strengthening of the bond
between Kangaroo Island and the Finnish town of Kristinestad, through the marking
of the grave of an unknown sailor from the Fides, a Finnish ship wrecked near
Kangaroo Island in 1860 with the loss of 10 lives.
Projects funded through ‘Heritage on Parks’ included stonework conservation on
built structures in the Adelaide Hills, on Yorke Peninsula and at Parachilna, and a
Conservation Management Plan was prepared for the Lady Alice Gold Mine near
Williamstown.
In its 21st year, the Heritage Advisory Service has been expanded, bringing the
27
number of participating councils to 33. As a part of the 21st anniversary, a new
brochure was released telling people about their local heritage services.
The second stage of the 20th-century heritage survey program was completed
during the year, with nominations to be considered during 2008-09.
The store of in-depth knowledge about our built heritage continues to grow with the
research findings of the second DEH South Australian Built Heritage Fellow, Dr Adam
Dutkiewicz, on the works of South Australian architect Brian Claridge.
Nineteen councils received a total $120 000 to support 24 local heritage projects
that assist local government’s capacity to manage and conserve local heritage.
The provision of Heritage Advisory Service expertise to councils was supported
through $317 000 in funding.
KeyChallengesandTargetsfor2008-09challenges
Updating Heritage Directions, introducing red-tape reduction measures and helping
government agencies and non-government organisations identify, conserve, and
manage South Australia’s heritage places are major challenges for the year ahead.
Ongoing challenges include responding to community expectations regarding
heritage (particularly at the local level) and emergency nominations for state listing,
and the increasing number and complexity of heritage development applications
referred to DEH for comment.
targets
Undertake a mid-term review of • Heritage Directions
Identify and implement heritage red-tape reduction strategies•
Improve the information in the • South Australian Register (especially pre-1993
listings) so that it meets the needs of community and government
Establish a strategic policy framework for the conservation and management of •
State Government-owned built heritage assets, to be implemented in 2009-10
Improve internal processes to increase heritage-related development •
application referral response rates, further contributing to the government’s
target to reduce red tape
Review and provide direction for maritime heritage •

28
AnimalWelfareProgramEnsuring that animals are treated humanely and that companion animals aremanagedappropriately.
HighlightsThe Prevention of Cruelty to Animals (Animal Welfare) Bill passed through both
Houses of Parliament, and will be introduced as law in South Australia in 2008-09.
The Bill was strongly supported by the Royal Society for the Prevention of Cruelty to
Animals (RSPCA).
The new legislation aims to improve the welfare of animals throughout South
Australia. It increases penalties for ill-treatment of animals – including organised
animal fights such as cock-fighting – and enables inspectors to enter property to
rescue animals or investigate suspected cases of animal cruelty or neglect.
The inclusion of the words “Animal Welfare” in its title reflects the emphasis of
the legislation, which now is more clearly seen to promote positive treatment
of animals.
The State Government has provided additional funding for the RSPCA for the
enforcement of the amended Act. A Memorandum of Understanding that
establishes each organisation’s roles and responsibilities in relation to investigation
and enforcement of the amended Act was signed by DEH; the Department of
Water, Land and Biodiversity Conservation; the Department of Primary Industries and
Resources; and the RSPCA.
Other highlights included banning the use of calves that weigh less than
200 kilograms in rodeo events, which effectively eliminates the event known as “calf
roping”, and the introduction of hen-housing regulations that increase the welfare
of layer hens.
The Dog and Cat Management Board commissioned and received impact
assessments outlining options for the management of cats. The Board will examine
the reports and, after consultation with local councils and the community, consider
recommendations to the Minister during 2008-09.
Other achievements The Department has provided input into the development of national standards
and guidelines for various animals – in particular for the housing of pigs – to ensure
national consistency and enforceable minimum requirements. The pig standards
are expected to be finalised and regulations prepared during 2008-09. Other
national standards relating to issues as diverse as the transport of livestock and
the management of feral animal populations are being developed and will be
regulated in due course.

29
KeyChallengesandTargetsfor2008-09challenges
The imminent implementation of the amended Animal Welfare Act will require
the regulations under the new Act to be updated, the introduction of training
programs for animal welfare inspectors appointed under the legislation, and public
information strategies.
Animal welfare is an issue with increasing national focus and, as a result, there
is greater cooperation between jurisdictions, all of which are keen to formulate
consistent and cohesive policies across the country. This requires significant
consultation and negotiation, which will continue in 2008-09.
An increase in the number of people hospitalised as a result of dog attacks has
required investigation into the underlying causes of the attacks and a re-evaluation
of the Dog and Cat Management Board’s programs. The report commissioned
into the increase will be important in the Board’s determination of its programs and
priorities in the new financial year.
targets
Animal Welfare
• Participateinthedevelopmentandimplementationofnationalagreements
and standards
• Developaresourcekit,trainingprotocolsandcoursesforinspectors
• Regulatepighousingandlivestocktransportstandards
Dog and Cat Management
Finalise recommendations on the • Dog and Cat Management Act 1995 amend-
ments and ensure that the legislation is enforced effectively
Develop and introduce inspector training and upgrade the ‘Good Dog’ •
campaign
Investigate the possibility of adopting Victoria’s ‘Don’t feed the problem’ stray-•
cat campaign in South Australia
Complete and introduce a database for recording and analysing dog attacks•
Recommend to the Minister cat-management strategies that have council and •
stakeholder support

30
agency support services programTheAgencySupportServicesProgramcomprisessevensub-programs. Areportontheperformanceofeachsub-programfollows.
asset manaGement seRVices sUb-pROGRamContributing to the achievement of the agency’s program goals by the provision of
strategic and operational asset management services.
HighlightsIn 2007-08, DEH’s Asset Management Services Sub-program focused on achieving
its key purpose – providing robust, accurate and timely analytical information to
support strategic decision-making and day-to-day operations within DEH.
Highlights of the year included delivering the State Procurement Board action plan
and placing regional asset services officers and introducing asset management
plans in each regional office.
The refurbishment of levels 8 and 9 of Chesser House means the department now
has office accommodation that is safe and healthy and meets its current and
future needs. Green strategies and activities have been integrated as much as
possible into the new offices.
The Regional Accommodation Strategy has been instigated at key sites across the
state, to ensure the DEH corporate image is promoted in regional offices and that
regional staff operate in safe and healthy workplaces. Operations were established
at Noonamena and the Clare office was upgraded.
Of the sub-program’s projects, 97 per cent were delivered within quality, cost and
time benchmarks.
KeyChallengesandTargetsfor2008-09challenges
The challenge is to continue to deliver required services efficiently and sustainably
with rationalised resources.
targets
Complete design and cost estimates for renovating Black Hill’s fire-•
management staff accommodation and depot facilities
Complete stage 2 of the Kangaroo Island bushfire-recovery program•
Complete Adelaide Gaol work, public access road upgrades and the Botanic •
Gardens 150 infrastructure upgrade
Introduce integrated asset/risk management plans in regional conservation sites •
Complete stages 2 and 3 design and documentation of the Innes National Park •
facilities upgrade, and stage 6 of Belair National Park’s upgrade
Introduce a life-cycle management program for on-park housing•
Complete stage 3 of the disability access plan•
Complete stage 3 of the structures audit and stage 2 of the energy audit•

31
bUsiness sUppORt seRVices sUb-pROGRamContributing to the achievement of the agency’s program goals by providing a business support function to Adelaide-based directorates and supportingregionaloperations.
HighlightsThe Business Support Sub-program provided efficient and effective business
administration services to DEH directorates, enabling those entities to effectively
deliver their services. The Business Support and Asset Management Services sub-
programs were merged to form the Business Operations Sub-program.
In 2007-08 the sub-program accomplished four key targets. The review of security
at the Keswick Precinct was completed, resulting in the development of concept
design plans for the upgrade of the reception area. Work will commence in August
2008. The department’s motor vehicles registration processes were reviewed and
changed, resulting in a more efficient processing of annual renewals. An electronic
cab-charge ticketing process was introduced in the Information, Science and
Technology Directorate as a trial for wider departmental use.
KeyChallengesandTargetsfor2008-09challenges
The key challenge for 2008-09 is to ensure the new Business Operations Sub-
program efficiently and effectively performs its functions for the maximum benefit
of the entire department. An element of this will involve capitalising on available
technology to assist in streamlining business processes.
targets
Upgrade security at Keswick reception•
Upgrade public counter presentation and security at key DEH sites•
Continue to provide responsive and high-quality business support services to •
metropolitan-based business units
32
enViROnmentaL infORmatiOn sUb-pROGRamTheprovision,analysisandmanagementofinformationandknowledge tosupportDEH’sstrategicdecision-making.
HighlightsThe development of information to help community knowledge of and access to
DEH parks – including the redevelopment of the parks website – was a focus in
2007-08. The sub-program also developed web-based mapping systems and
training to improve the use of and access to data for DEH staff, and provided
mapping support for emergency response at incident control centres.
Information and analysis was provided for DEH’s coastal conservation assessments,
the proposed Wellington Weir and native vegetation assessments, and improved
regional support for spatial analysis and data management was made available.
Other achievementsDEH developed maps, images and data now sold through the Mapland outlet
and associated resellers, and a promotional catalogue is being developed. Soon
customers will be able to buy these products online, and the Mapland foyer will be
redesigned to create a more interactive and efficient customer service area.
The Biological Data Project began with the establishment of a board and
management team, the latter visiting three states to investigate existing system
improvement processes.
The sub-program assisted the Asset Management Sub-program to introduce the
Asset Recording and Management Information System (ARAMIS) Change Requests
system in late 2007, and the Records Management System Replacement Project
began to replace the Recfind system.
KeyChallengesandTargetsfor2008-09challenges
The increasing use of mobile and on-line tools for collaboration and knowledge-
sharing in DEH will create challenges for the sub-program over the next 12 months,
as will increasing community expectations that DEH products and information are
available online.
targets
Develop client-centred online information and tools•
Use wikis, blogs and other ICT tools to share DEH information and support •
decision-making
Develop spatial information products for planning and decision-making•
Create a long-term investment strategy to upgrade, replace and/or develop •
DEH business applications
Create partnerships and tools to develop and share key data sets such as •
biological data, elevation models, water, and vegetation extent and condition

33
financiaL seRVices sUb-pROGRamSupport the achievement of the agency’s program goals and external reportingrequirementsbyprovidingpro-active,efficientandprofessionalfinancialservices.
Highlights A range of policies and processes – including the automation of account payment
options, new Financial Management Framework procedures, better analysis and
advice, and improved reporting and executive support – improved the Financial
Services Sub-program’s operations and customer service in 2007-08.
Other achievementsProgress continued on developing a system to help DEH customers pay accounts
or receive invoices electronically. Full implementation should be achieved by
October 2008, giving customers access to BPAY, telephone and electronic fund
transfer options and online invoicing.
An extensive review of departmental financial policies and procedures has
continued in line with the new whole-of-government Financial Management
Framework. The most significant development is a budget policy and handbook
that improves planning, budgeting and reporting systems. By June 2008, 17
procedures – relating to cash management, accounts receivable and payable,
fixed-assets management and other policies – had been finalised or were nearly
complete.
The sub-program supported an analysis of commercial activities at DEH parks
on Kangaroo Island and in the Mount Lofty Ranges, and provided business and
economic advice to many of the department’s investment activities.
The sub-program achieved its best outcome in many years in meeting its account
payment targets.
KeyChallengesandTargetsfor2008-09challenges
The biggest challenge facing Financial Services is recruiting and retaining skilled
staff in a job market in which there is a high demand and low supply of financial
expertise.
During 2008-09 whole-of-government Shared Services will introduce a new model
for the delivery of ‘accounts receivable and payable’ services.
targets
Develop a high-level analytical and interpretative support service for program •
managers
Develop a policy framework to improve links between budget setting and •
performance measures within commercial sites
Review monthly directorate and corporate reports •
Review the accounting requirements for Unallotted Crown Lands information in •
the department’s financial statements
Ensure appropriate negotiation and transfer of accounts operations functions to •
Shared Services

34
GOVeRnance, enViROnment pOLicy and pUbLic affaiRs sUb-pROGRamBuilding a strong organisation through sound corporate governance and clearstrategicdirection.
HighlightsA review of DEH Executive Committee functions, the adoption of terms of reference
and a code of conduct, and the delivery of the internal audit plan were highlights
of 2007-08.
In addition, the sub-program launched a new publication, Landscapes, introduced
new corporate branding and published Environment Highlights 2007. Internal
communication methods now include an electronic newsletter, OCHRE, and
a ‘Connecting Women’ site on the Intranet.
Other achievementsThe Women in DEH Action Plan has added to the measures that assist in the
development of women leaders and contribute to DEH’s role in achieving South
Australia’s Strategic Plan target relating to women in leadership (T6.23)
A customer satisfaction survey conducted with the University of South Australia’s
Ehrenberg Bass Marketing Institute led to the preparation of a draft customer
service charter – the first step in focusing the department’s customer service effort
to work towards the customer satisfaction target outlined in South Australia’s
Strategic Plan.
‘Stirring the Possum’ community forums involved a cross-section of the community,
and a World Environment Day event in Rundle Mall was staged to increase public
awareness of many DEH issues.
At 30 June 2007 the composition of DEH boards and committees was 54 per cent
male and 45 per cent female. A year later the balance had shifted to 51 per cent
male and 49 per cent female – although the proportion fluctuates during the year –
with women chairing five DEH boards and committees.
Since January 2007 DEH has introduced initiatives such as streamlining planning and
development processes, and improving licensing processes to reduce red-tape
costs to business. Total cost-savings to June 2008 have reached almost $1 million.
KeyChallengesandTargetsfor2008-09challenges
From 2008-09 the new Corporate Development and Strategy Sub-program will have
as its core responsibility helping the Chief Executive build an effective, responsive
and sustainable organisation.
targets
Develop and promote an organisation that:
is effective and outcome focused, while pro-actively preparing for challenges •and opportunities;
can persuade decision-makers that environmental management and •economic growth are complementary in the development of a sustainable, prosperous state; and
builds and maintains strong internal and external partnerships.•

35
HUman ResOURce seRVices sUb-pROGRamSignificantly contribute to the achievement of the department’s goals by building human resource and safety management capacity and capability that include the provision of associated operational and strategic programs,adviceandsupport,information,transactionprocessing andbusinesssystems.
Highlights The second DEH Climate Survey achieved an 83 per cent response rate and
showed that the DEH workplace climate had improved in most categories since
2006. A third survey is being conducted in September 2008.
The Performance Review and Development (PRD) program was revised, with
participation increasing from 60 per cent to 90 per cent. The program for 2008-09
commenced in May 2008.
Other achievementsThe Human Resources Sub-program introduced initiatives to meet WorkCover
performance standards for self-insurers and Premier’s Safety in the Workplace
Strategy 2007-10 targets, and participated in a WorkCover evaluation of DEH’s
OHS and injury management systems.
A review of executive job design and flexible working arrangements ensured that
no prohibitive clauses would stop women competing for executive positions.
Staff development initiatives included the introduction of high-performing
employee and staff exchange programs.
Work began on social inclusion projects including reviews of Aboriginal employment
and disability action planning, and the promotion of carers’ legislation and services.
A revised Disability Action Plan was introduced.
DEH’s first draft Workplace Flexibility Agreement for bushfire-fighting employees
was prepared.
KeyChallengesandTargetsfor2008-09challenges
DEH must attract and retain quality staff – both generally and to meet South
Australia’s Strategic Plan targets relating to the employment of Aboriginal people
and people with disabilities, and placing women in executive positions. Crucial to
this goal is a safe and attractive working environment, in which conditions such as
voluntary flexible working arrangements are seen as beneficial to everyone.
Other challenges are the successful introduction of conditions of employment
for firefighting staff, transferring payroll and HR services to a shared services
environment, and examining the effects of the proposed Public Sector Bill.
targets
Increase the number of Aboriginal people and people with a •
disability employed in DEH
Attract and retain more quality candidates•
Provide staff with more access to development opportunities•

36
infORmatiOn tecHnOLOGy sUb-pROGRamThe provision and management of information and communications technologysystemsandinfrastructuretosupportDEHbusinessoperations.
HighlightsDuring 2007-08 the Information Technology (IT) Sub-program upgraded DEH’s
notebook and PC fleet with a Windows XP and Office 2003-based standard
operating environment.
Several information and communications technology (ICT) support and
procurement contracts were transferred to a new suite of across-government
sourcing contracts.
The IT team also introduced a storage area network to meet current and predicted
business demands.
Other achievementsA number of regional DEH offices were upgraded to higher bandwidth services.
The Telstra Next G wireless network was tested for the first time at the new
Noonameena office. It is anticipated that several geographically remote sites
will be provided with Next G links during 2008-09.
The geographically dispersed nature of DEH has led to increased demand for
shared communication and collaboration tools. In 2007-08, the viability of tools
such as wikis was investigated, leading to the development of web portals based
on the Microsoft SharePoint application and their testing for DEH requirements.
DEH’s ICT Service Continuity and Disaster Recovery Plan was updated during
2007-08 to outline service-recovery procedures after major interruptions and
emergencies.
KeyChallengesandTargetsfor2008-09
challenges
The push for across-government collaboration and centralised IT services poses
technical and workforce challenges to the delivery of IT services to DEH business
units.
In line with whole-of-government directions, resources and budgets are expected
to diminish further in 2008-09. This presents a challenge to the implementation of
the IT Sub-program’s work, as services will be expected despite reduced resources.
targets
Regional DEH staff to have access to adequate ICT services•
DEH business units to be supported by ICT infrastructure that enables the use •
of tools such as wikis
The PC and electronic office equipment replacement program to support •
departmental business operations
IT to help DEH manage changes related to Shared Services transfer•
When recruiting, to consider applicants’ skills in managing contracts and •
in relating long-term with external partners and suppliers

37
CASE STUDYsacRed seeds
SACRED Seeds is a six-year international conservation partnership between
the Royal Botanic Gardens (Kew UK), Millennium Seed Bank (MSB) and the
Botanic Gardens of Adelaide. Its complete title – South Australian Collection
of Rare and Endangered Seeds – points to its chief goal: to conserve
threatened and priority plant species indigenous to South Australia using
seedbanking methods.
During the past 12 months, collections have been expanded through field
trips involving staff from across DEH, specialist conservation contractors and
other government departments.
As a result of these field trips, 824 seed lots representing more than 700 native
plant species were collected. Most importantly, collections included
182 threatened species, and seeds were discovered for four species not
previously recorded in South Australia. All seed lots have been processed,
undergone routine germination testing and are being prepared for long-term
storage in low temperatures.
Of the collected seed lots, 252 were sent to the MSB for duplicate storage.
The total number of species new to the collections of the MSB and sent by
the Botanic Gardens of Adelaide since the project started has now reached
880 – 55 species more than the agreed milestone for the end of the project’s
fifth year – and the South Australian program is set to become the first in
Australia to meet its overall conservation target. To date, 42 per cent of
South Australia’s threatened plant species have been collected and stored
as a result of the partnership.
This is DEH’s only project conducting off-site conservation of threatened
plant species. It is aligned with the No Species Loss program and targets,
and appears set to achieve by 2009 the target requiring that “60 per cent
of SA endangered and vulnerable threatened vascular plant species (be)
conserved ex situ by 2010”.
The SACRED Seeds project also advances flora knowledge and knowledge
of seed biology, supports other government-agency restoration and
revegetation programs, and works in partnership with university programs
and research.
38
ABORIGINAL RECONCILIATION STATEMENTDEH recognises the profound spiritual and cultural connection of Aboriginal people
to sea and country, and that Aboriginal involvement in planning and caring for sea
and country can both reinforce cultural understanding and improve environmental
outcomes.
This is reflected in the DEH Corporate Plan 2007-10, which requires that the
department “work with Aboriginal people to manage biodiversity cooperatively
and contribute to the reconciliation of past actions”.
agendaDEH recognises that cooperation between the department and Aboriginal people
should lead to advances in health and well being, employment and economic
opportunities, and increased public awareness of the value of Aboriginal culture
and heritage.
DEH’s Reconciliation Committee is responsible for efforts to further these
advances, through:
• supportingthedevelopmentandimplementationofinitiativesthathelp
DEH achieve the government’s reconciliation objectives;
• drivingDEH’sreconciliationactivities;and
• monitoringtheimplementationoftheDEH Reconciliation Action Plan.
DEH has four areas of reconciliation activities: Land, Sea and Biodiversity; Heritage
and Native Title; Communications and Awareness; and Employment and Training.
Land, sea and biodiversityDEH supports land and sea management programs on Aboriginal lands in
partnership with Aboriginal land managers and communities.
One of the successful partnerships is the Kuka Kanyini pilot project at Watarru in
the Anangu Pitjantjatjara Yankunytjatjara (APY) Lands. With support from the
Department of the Premier and Cabinet, the Indigenous Land Corporation and APY
Land Management, the Kuka Kanyini project ensures that the country, biodiversity,
culture, health and socio-economic concerns of APY peoples are monitored.
Since it began in January 2004 the project has won the 2005 SA Great Environment
Award, and in 2006 was a finalist in the Prime Minister’s Environmentalist of
the Year and Land and Biodiversity categories of the Banksia Awards.
In another partnership, DEH is represented on the Alinytjara Wilurara Natural
Resources Management Board, helping determine how the state’s natural
resources are managed in the Alinytjara Wilurara region, about 107 000 square
kilometres in northwest South Australia. DEH also works with Aboriginal communities
in the area to form links between marine planning and natural resources
management.
39
Other alliances include DEH’s regional ecologists working closely with Aboriginal
people and other partners on programs that require both scientific and traditional
knowledge, such as the black flanked rock wallaby (Warru) recovery project.
Heritage and native titleFour Cooperative Management Agreements (CMAs) have been created with local
Aboriginal groups, relating to the Vulkathunha Gammon Ranges National Park,
Mamungari Conservation Park, Ngaut Ngaut Conservation Park and Witjira National
Park. Under these arrangements, traditional knowledge and contemporary park
management skills contribute to park management and reconciliation.
South Australia is subject to 21 native title claims. DEH is involved in a number of
native title negotiations with the Attorney-General’s Department, which is the lead
negotiator on behalf of the South Australian Government.
The Aboriginal Heritage Strategy fosters cooperation between Aboriginal
communities and DEH field staff in protecting Aboriginal cultural heritage on parks
and Crown land, and ensures field staff are trained in native title and Aboriginal
heritage issues.
communicationsThe DEH Aboriginal Partnerships Unit (APU) provides policy advice and develops
strategic initiatives and programs for cooperative management of natural and
cultural heritage. The APU liaises with Aboriginal communities on DEH publications
and signs.
As part of the South Australian Government’s recognition of the interests of
Aboriginal people, it acknowledges the profound connection to land by Aboriginal
people and communities across the state. This has taken the form of the ‘Welcome
to Country Protocol’, a written or spoken expression of acknowledgment of
Aboriginal peoples’ connection with the land.
Ikara, a public art installation, was launched in April 2007 and acknowledges the
Indigenous pastoral heritage of the Flinders Ranges. The installation marks the first
public acknowledgement and symbolic interpretation of the Adnyamathanha
people in developing the region’s pastoral industry.
employment and trainingAt 30 June 2008 Aboriginal people represented 2.2 per cent of DEH’s workforce,
exceeding South Australia’s Strategic Plan target of two per cent.
The Kuka Kanyini project provides training and development opportunities in
land management for members of the Watarru community in the APY Lands.
Co-management initiatives also provide for Aboriginal employment in park
management. As part of the DEH Reconciliation Program, the APU has cultural-
awareness products and training available for managers and staff. Where possible,
activities are undertaken in partnership with local Aboriginal communities.

40
FINANCIAL COMMENTARYfinancial OverviewThe Department for Environment and Heritage financial statements include assets,
liabilities, revenue and expenses, changes in equity and cashflows controlled or
incurred by the department in its own right, including the General Reserves Trust,
the Wildlife Conservation Fund and the State Heritage Fund.
The actual figures in the abridged Income Statement, Balance Sheet, Statement
of Changes in Equity and Cash Flow Statement have been extracted from the DEH
audited financial statements, which are available at the DEH Internet website at
www.environment.sa.gov.au
The budget figures used in this document relate to the 2007-08 budget papers
that were tabled in Parliament in May 2007 and therefore do not reflect budget
changes. The following variance analysis will identify these material changes.
program expenditure
Actual Expenditure by Program
The three major programs in terms of actual expenditure are Agency Support
(33 per cent), Nature Conservation (24 per cent) and Public Land Management –
Visitor Management (19 per cent).
Nature Conservation
Public Land - Visitor Management
Public Land - Fire Management
Public Land - Stewardship
Coast and Marine Conservation
Botanic Gardens Management
Heritage Conservation
Animal Welfare
Agency Support
33%
24%
19%5%
7%
6%
4%
0%
2%

41
income statement
sUmmaRy incOme statement fOR tHe yeaR endinG 30 JUne 2008
budget 2007-08 ($’000)
actual 2007-08 ($’000)
Operating expenses 181 720 166 719
Operating revenues 27 758 38 354
net cost of providing services 153 962 128 365
Revenues from Government 134 717 104 605
net Result before restructuring (19 245) (23 760)
Net revenue (expense) from restructuring - -
net Result after restructuring (19 245) (23 760)
The department’s budgeted operating result showed a net deficit after restructuring
of $19.245 million. The actual result was a net deficit after restructuring of
$23.760 million.
Operating expenditure
Actual Operating Expenditure by Program
Operating expenses were approximately $15 million lower than expected, largely as
a result of:
a one-time repayment from the DEH Accrual Appropriation Excess Funds •
Account to Consolidated Account ($18.8 million) budgeted as ‘Other’ expense.
However, the payment was recorded as payments to SA Government. This
transaction is budget neutral.
a decrease in expenditure related to • Adelaide’sLivingBeachesStrategy.
Budget deferred to a future year ($5 million) in accordance with the revised
project plan.
a decrease in expenditure primarily relating to Commonwealth funded projects •
for which carryovers are being requested in 2008-09 ($5 million).
Employee Expenses
Goods and Services
Depreciation and Amortisation
Grants and Transfers
Borrowing Cost Expense
Net Loss Disposal NC Assets
Other
14%
47%
32%
3%3% 1%
0%
42
a decrease in depreciation and amortisation expense due to a change in •
accounting policy where the definition of a network asset was changed to only
include roads and fences; and on park road assets that had reached the end
of their useful life ($2.9 million).
a decrease in expenditure related to the River Murray Forest project budget •
deferred to 2008-09 due to drought conditions ($1.3 million).
a reduction in annual grants due to the Adelaide City Council ($1.2 million) •
being re-categorised from controlled to administered expenditure.
This is offset by:
unbudgeted expenditure resulting from an accounting treatment associated •
with the transfer of the Amazon Waterlily Pavilion project managed by DEH,
under the Capital Work Program, on behalf the Board of the Botanic Gardens
and State Herbarium ($4.3 million).
once-off additional expenditure primarily funded by revenues from •
Commonwealth and other external bodies ($4.2 million).
an accounting policy change that increased the department’s asset •
capitalisation threshold from $2000 to $5000, resulting in a once-off accounting
reclassification of expenditure in 2007-08 ($3.1 million).
unbudgeted operating expenditure as a result of an accounting reclassification •
of budgeted capital works expensed in line with the department’s
capitalisation policies ($1.7 million).
unbudgeted expenditure relating to water security/drought activities in the River •
Murray ($1.1 million). Funding was provided post original budget formulation.
additional expenditure of $1.1 million relating to SAICORP insurance recoveries •
for flood damage and bushfires.
an unbudgeted expenditure of $0.816 million associated with the recruitment of •
an additional 26 seasonal fire fighters for a three-month period due to the fire
danger resulting from the extreme weather conditions in January 2008.
unbudgeted net loss on disposal of $0.810 million.•

43
Operating Revenues
Actual Operating Revenues
Operating revenue was approximately $10.596 million higher than budgeted,
primarily as a result of:
once-off income relating to SAICORP insurance recoveries for fire and flood •
damage ($5.0 million).
higher than anticipated revenue primarily received from Commonwealth and •
other external bodies ($4.2 million).
Net revenue from Government was approximately $30.1 million lower than budget
as a result of:
an increase in revenue related to the sale of Crown lands under Premier and •
Cabinet Circular 114 ($2.9 million).
a supplementation to fund the Water Security agenda ($1.085 million) and •
additional fire-fighting resources during the 2007-08 fire season ($0.826 million).
Offset by:
a one-time repayment from the DEH Accrual Appropriation Excess Funds •
Account ($18.8 million) budgeted as other expense with the payment recorded
as payments to the South Australian Government. This transaction is budget
neutral.
a reduction in appropriation relating to various major initiatives that were •
approved to be carried over or re-profiled from 2007-08 into future years
($7.7 million).
an above-budget payment to the Consolidated Account under the Cash •
Alignment Policy ($6.1 million).
a reduction in appropriation relating to the Adelaide City Council grant being •
transferred from controlled to administered expenditure ($1.2 million).
Fees and Charges
Grants and Transfers
Interests and Dividends
Net Revenues from Government
Other Revenues
73%
4%
12%
11%
0%

44
sUmmaRy baLance sHeet and statement Of cHanGes in eqUity
as at 30 JUne 2008
budget 2007-08 ($’000)
actual 2007-08 ($’000)
Current assets 100 981 108 703
Non-current assets 296 795 302 584
total assets 397 776 411 287
Current liabilities 15 910 23 578
Non-current liabilities 19 335 18 950
total liabilities 35 245 42 528
net assets 362 531 368 759
equity 362 531 368 759
equity at 30 June 2007 $384 393
Surplus for the year ($23 760)
Net Increment for Asset Valuation adjustments $4 821
Net Increment for Asset First time recognition $2 859
Other adjustments $446
Equity 362 531 $368 759
Net Assets and Equity is approximately $6.2 million higher than expected.
Budget details for 2007-08 were established prior to the finalisation of the
Auditor-General’s Report for the 2006-07 financial year. Consequently, the opening
balances of the budgeted Balance Sheet do not reflect the 2006-07 audited
financial result, with the budget opening equity position being understated by
$6.2 million.
assets and Liabilities
Assets and Liabilities
Budget
Actual
$ m
illio
n
Assets0
100
200
300
400
500
Liabilities

45
Current Assets for the department are approximately $7.7 million higher than
budgeted. The main reason for this variance was that the cash opening balance for
2007-08 was understated in the budget by $11.7 million when compared to the 2006-
07 audited financial statements. This is offset by lower than anticipated receivables
and higher than anticipated payables balances. As a result, the department’s cash
balance was $10.8 million higher than budget during 2007-08.
Non Current Assets are approximately $5.781 million higher than budgeted, primarily
as a result of understating the opening balance of budgeted Non Current Assets for
2007-08 in the budget when compared to the 2007-08 audited financial statements.
Liabilities are approximately $7.2 million higher than expected due to the Current
Liabilities opening balance being understated for 2007-08 when compared to the
2007-08 audited financial statements.
cash flow statement
SuMMARYCASHFLOWSTATEMENT fOR tHe yeaR ended 30 JUne 2008
budget 2007-08 ($’000)
actual 2007-08 ($’000)
Cash flows from operating activities:
Payments 135 784 146 127
Receipts 27 758 46 911
Cash flows from Government 115 917 104 605
net casH pROVided by OpeRatinG actiVities 7 891 5 389
Cash flows from investing activities:
Payments 13 804 12 265
Receipts - 152
net casH Used in inVestinG actiVities (13 804) (12 113)
Cash flows from financing activities
Payments 38 054 38.054
Receipts - -
net casH pROVided by financinG actiVities (38 054) (38 054)
net increase (decrease) in cash held (43 967) (44 778)
Cash at 1 July 2007 133 640 145 343
cash at 30 June 2008 89 673 100 565
The department’s budget provided for a net decrease in cash of approximately
$43.9 million. The actual result was a decrease of $44.7 million.
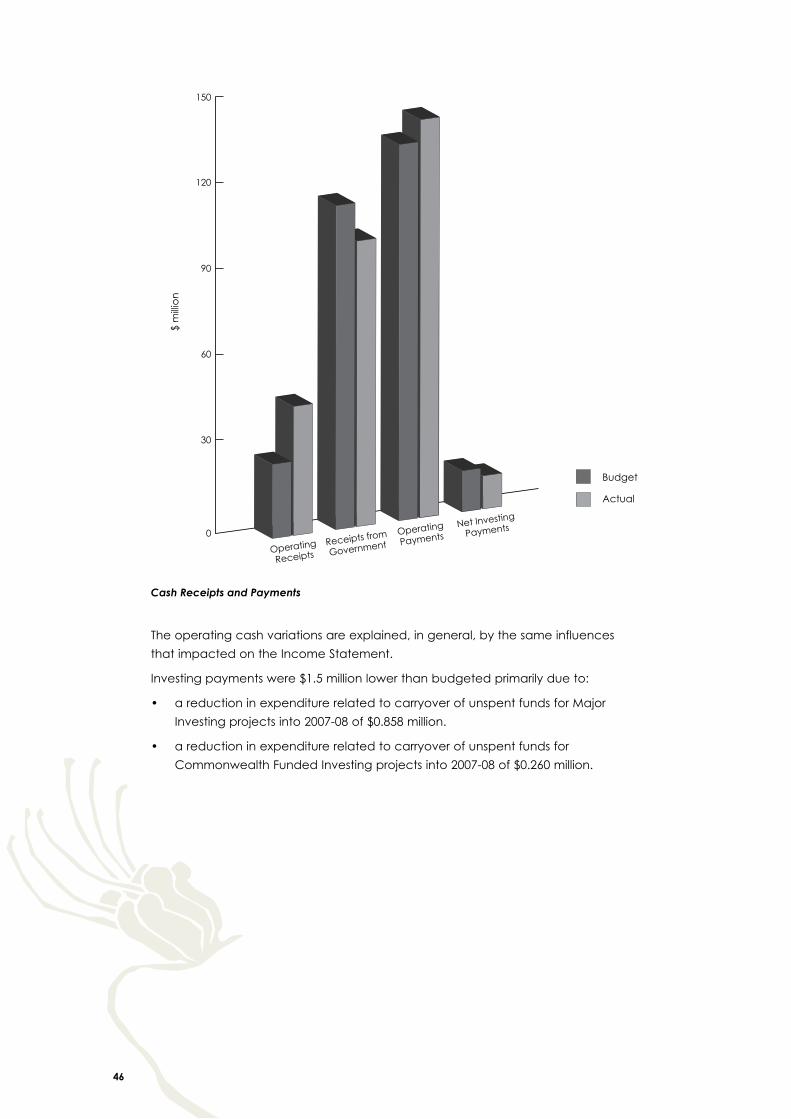
46
Cash Receipts and Payments
The operating cash variations are explained, in general, by the same influences
that impacted on the Income Statement.
Investing payments were $1.5 million lower than budgeted primarily due to:
a reduction in expenditure related to carryover of unspent funds for Major •
Investing projects into 2007-08 of $0.858 million.
a reduction in expenditure related to carryover of unspent funds for •
Commonwealth Funded Investing projects into 2007-08 of $0.260 million.
$ m
illio
n
Budget
Actual
Operating
ReceiptsReceipts from
GovernmentOperating
PaymentsNet Investing
Payments0
30
60
90
120
150
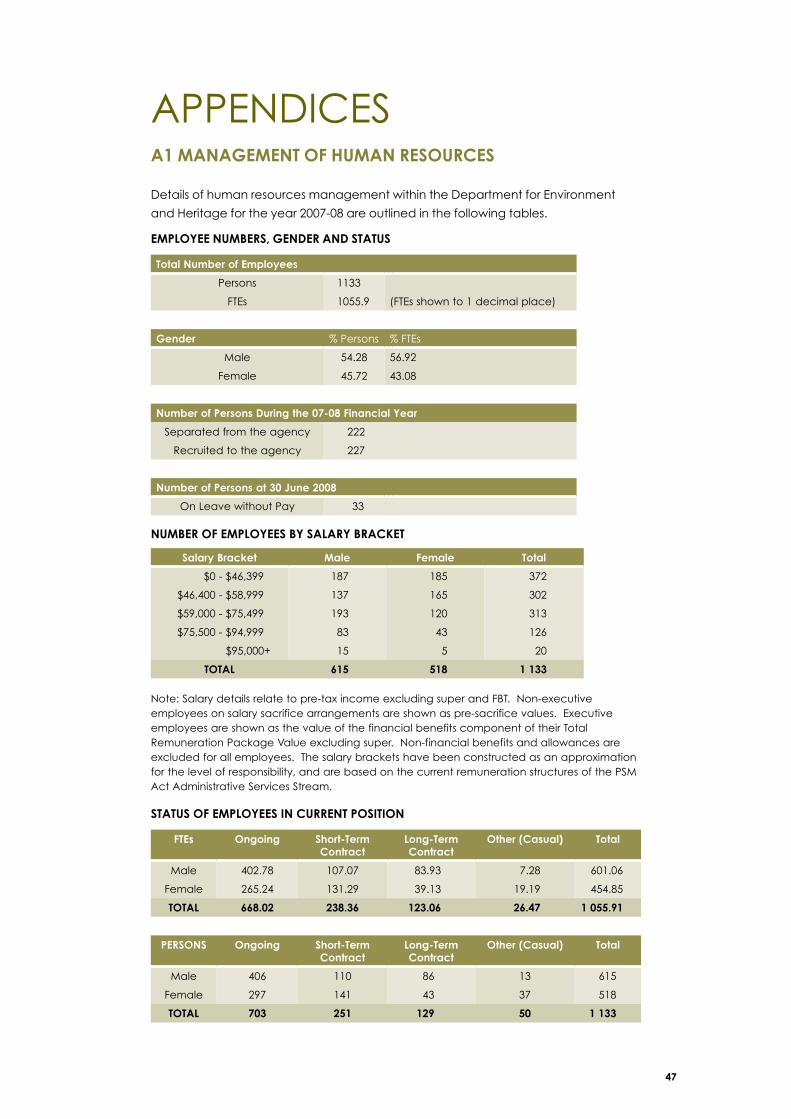
47
APPENDICESa1 manaGement Of HUman ResOURces
Details of human resources management within the Department for Environment
and Heritage for the year 2007-08 are outlined in the following tables.
empLOyee nUmbeRs, GendeR and statUs
NuMBEROFEMPLOYEESBYSALARYBRACKET
Note: Salary details relate to pre-tax income excluding super and FBT. Non-executive employees on salary sacrifice arrangements are shown as pre-sacrifice values. Executive employees are shown as the value of the financial benefits component of their Total Remuneration Package Value excluding super. Non-financial benefits and allowances are excluded for all employees. The salary brackets have been constructed as an approximation for the level of responsibility, and are based on the current remuneration structures of the PSM Act Administrative Services Stream.
statUs Of empLOyees in cURRent pOsitiOn
total number of employees
Persons 1133
FTEs 1055.9 (FTEs shown to 1 decimal place)
Gender % Persons % FTEs
Male 54.28 56.92
Female 45.72 43.08
number of persons during the 07-08 financial year
Separated from the agency 222
227Recruited to the agency
number of persons at 30 June 2008
On Leave without Pay 33
SalaryBracket male female total
$0 - $46,399 187 185 372
$46,400 - $58,999 137 165 302
$59,000 - $75,499 193 120 313
$75,500 - $94,999 83 43 126
$95,000+ 15 5 20
tOtaL 615 518 1 133
ftes Ongoing short-term contract
Long-term contract
Other (casual) total
Male 402.78 107.07 83.93 7.28 601.06
Female 265.24 131.29 39.13 19.19 454.85
tOtaL 668.02 238.36 123.06 26.47 1 055.91
peRsOns Ongoing short-term contract
Long-term contract
Other (casual) total
Male 406 110 86 13 615
Female 297 141 43 37 518
tOtaL 703 251 129 50 1 133
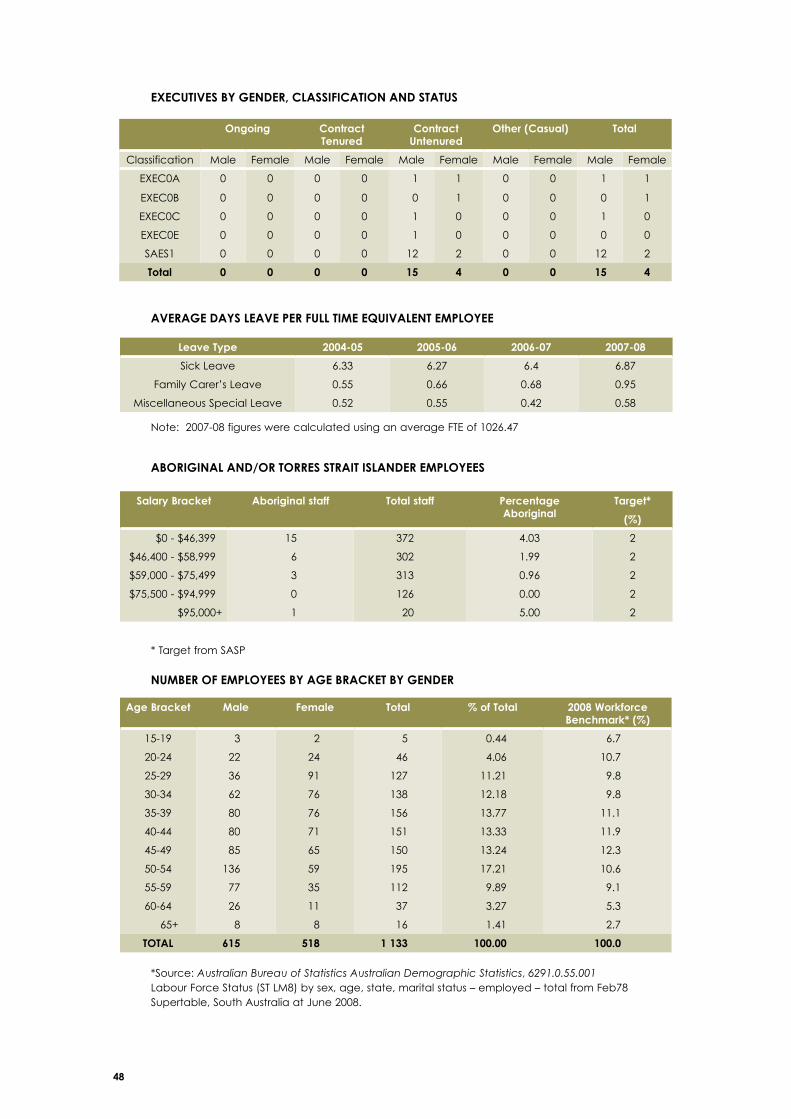
48
eXecUtiVes by GendeR, cLassificatiOn and statUs
aVeRaGe days LeaVe peR fULL time eqUiVaLent empLOyee
Note: 2007-08 figures were calculated using an average FTE of 1026.47
ABORIGINALAND/ORTORRESSTRAITISLANDEREMPLOYEES
* Target from SASP
NuMBEROFEMPLOYEESBYAGEBRACKETBYGENDER
*Source: Australian Bureau of Statistics Australian Demographic Statistics, 6291.0.55.001 Labour Force Status (ST LM8) by sex, age, state, marital status – employed – total from Feb78 Supertable, South Australia at June 2008.
Ongoing contract tenured
contract Untenured
Other (casual) total
Classification Male Female Male Female Male Female Male Female Male Female
EXEC0A 0 0 0 0 1 1 0 0 1 1
EXEC0B 0 0 0 0 0 1 0 0 0 1
EXEC0C 0 0 0 0 1 0 0 0 1 0
EXEC0E 0 0 0 0 1 0 0 0 0 0
SAES1 0 0 0 0 12 2 0 0 12 2
total 0 0 0 0 15 4 0 0 15 4
Leave type 2004-05 2005-06 2006-07 2007-08
Sick Leave 6.33 6.27 6.4 6.87
Family Carer’s Leave 0.55 0.66 0.68 0.95
Miscellaneous Special Leave 0.52 0.55 0.42 0.58
SalaryBracket aboriginal staff total staff percentage aboriginal
target*
(%)
$0 - $46,399 15 372 4.03 2
$46,400 - $58,999 6 302 1.99 2
$59,000 - $75,499 3 313 0.96 2
$75,500 - $94,999 0 126 0.00 2
$95,000+ 1 20 5.00 2
AgeBracket male female total % of total 2008WorkforceBenchmark*(%)
15-19 3 2 5 0.44 6.7
20-24 22 24 46 4.06 10.7
25-29 36 91 127 11.21 9.8
30-34 62 76 138 12.18 9.8
35-39 80 76 156 13.77 11.1
40-44 80 71 151 13.33 11.9
45-49 85 65 150 13.24 12.3
50-54 136 59 195 17.21 10.6
55-59 77 35 112 9.89 9.1
60-64 26 11 37 3.27 5.3
65+ 8 8 16 1.41 2.7
tOtaL 615 518 1 133 100.00 100.0
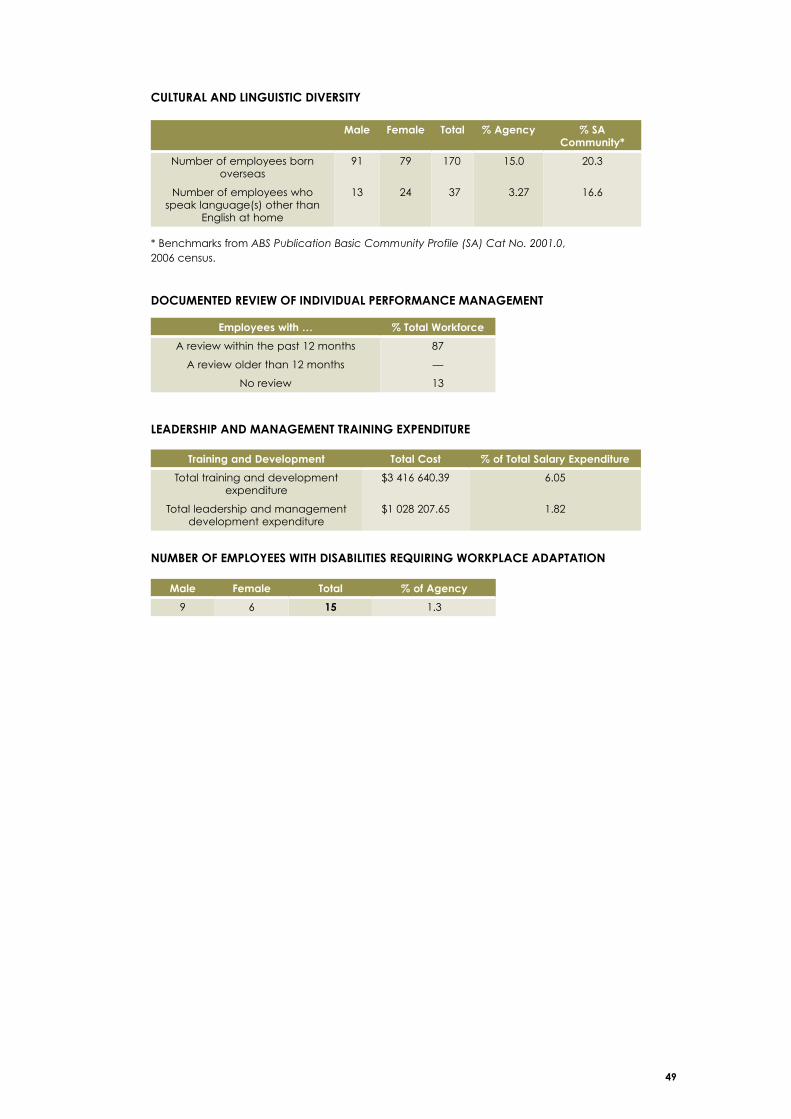
49
cULtURaL and LinGUistic diVeRsity
* Benchmarks from ABSPublicationBasicCommunityProfile(SA)CatNo.2001.0, 2006 census.
DOCuMENTEDREVIEWOFINDIVIDuALPERFORMANCEMANAGEMENT
LeadeRsHip and manaGement tRaininG eXpenditURe
NuMBEROFEMPLOYEESWITHDISABILITIESREQuIRINGWORKPLACEADAPTATION
male female total % agency % sa community*
Number of employees born overseas
91 79 170 15.0 20.3
Number of employees who speak language(s) other than
English at home
13 24 37 3.27 16.6
employees with … %TotalWorkforce
A review within the past 12 months 87
A review older than 12 months —
No review 13
training and development total cost % of total salary expenditure
Total training and development expenditure
$3 416 640.39 6.05
Total leadership and management development expenditure
$1 028 207.65 1.82
male female total % of agency
9 6 15 1.3

50
a2 disabiLity actiOn pLan RepORt
Outcome 1 – ensure access to facilities and servicesThe DEH Disability Policy Statement outlines the responsibility of DEH managers and
employees in ensuring that planning and decision-making is inclusive of people with
disabilities; ensuring staff are aware, skilled and equipped to respond sensitively and
fairly to colleagues and customers with a disability; and identifying and eliminating
discriminatory practices within the workplace.
The DEH Promoting Independence for People with Disabilities Procedure was
developed in 2007-08 to ensure key stakeholders are aware of their responsibilities
in implementing the DEH Disability Action Plan.
A program of assessment and associated works and management strategies has
been established for the high-visitation sites in national parks. This is a staged and
planned program designed to be ongoing.
DEH strives to provide integrated access where possible. Internationally recognised
symbol signage is utilised in national parks and botanic gardens to assist with
access for people with disabilities. The Companion Card Program has recently
been approved for implementation in selected DEH parks and reserves where fees
are charged on a per person basis, as well as within the Adelaide Botanic Garden
(Bicentenary Conservatory) to provide free entry to Companion Card holders.
Outcome 2 – information and communicationThe DEH Access and Equity Guidelines for Communication, developed in 2007-08,
covers communication, publications and information requirements to be addressed
by DEH. It also provides a summary of the information access requirements for
people with disabilities. Relevant areas within DEH will now develop strategies
for the provision of appropriate and readily available information to address the
requirements outlined in the guidelines. It should be noted that some strategies are
already in place.
All documents on the DEH website are tagged for accessibility. When alternative
format requests are made for information and/or publications that are not
available on the DEH website, the department will take action to provide in the
appropriate format. No requests were received in 2007-08.
Outcome 3 – disability awareness trainingA pilot training program was developed from the Disability Awareness and
Discrimination Training Framework and implemented in 2007-08 with the first
workshop held for staff in Human Resource Services. DEH aims to train 20 per cent
of staff in 2008-09 and continue until all staff have been provided with disability
awareness training.
The review of DEH training programs for inclusion of DDA obligations and awareness
has commenced and will be completed in 2008-09.
Information is available on the DEH Intranet site to assist staff in understanding
the issues affecting people with disabilities. The site also provides easy access to
websites that may raise staff awareness of, or provide information for, people
with disabilities.
51
Outcome 4 – consultation and complaints processAll DEH managers are expected to take the DEH Disability Policy Statement into
account when undertaking community consultation. Where consultation is required
an assessment of appropriate consultation mechanisms and audience is made
prior to undertaking the consultation. DEH managers liaise with Human Resources
for input when required.
Visitor Management Services undertook a consultation process during
2006-07 to gain a baseline of data on community awareness levels, motivations,
expectations and satisfaction. During 2007-08 further consultation occurred
for feedback from particular user groups within the wider community (that is,
multicultural and disability groups). The feedback provided was very positive and
the individuals involved appreciated the opportunity to comment.
A general complaints policy has been developed and will be reviewed prior to
implementation to ensure that issues for people with disabilities are covered.
Outcome 5 – compliance with dda and eOaThe DEH Disability Action Plan 2007-08 was endorsed by Executive in December
2007. An update is due and will be undertaken with key stakeholders to review
action items and timeframes.
DEH promotes a culture that reflects the value of diversity in the workplace and in
the general population. While the DEH Corporate Plan 2007-2010 does not have
a specific objective addressing inclusion of people with disabilities or their access
requirements, diversity has been included as one of the core values. This notion of
diversity is not limited to specific clusters of employees, but embraces the diversity
of all staff.
Outcome 6 – increased employment RatesPortfolios report on how they are increasing the number of people with a disability
in order to meet South Australia’s Strategic Plan Target 6.22 – “to double the
number of people with disabilities employed in the public sector by 2014”.
A comprehensive review of DEH recruitment and selection processes was
undertaken in 2007-08 and included 15 recommendations. Some actions from the
review have commenced with the remainder to be incorporated into the next DEH
Disability Action Plan.

52
DEH had two Notifiable Injuries which were investigated by SafeWork SA. SafeWork
SA was satisfied with DEH’s response to the incidents and no further action was
taken.
In 2007-08 there was a reduction in income maintenance, Section 42 payments and
medical and hospital combined costs as a result of a decrease in lost-time injuries.
Fewer claims resulted in a reduction in medical and hospital costs combined.
However, there was a Section 43 payment in 2007-08 that increased costs and also
an increase in legal expenses classified under ‘Other’. These costs were associated
with claims that occurred prior to 2007-08.
Table1:OHSNoticesandCorrectiveActiontaken
Number of notifiable occurrences pursuant to OHS&W Regulations Division 6.6 0
Number of notifiable injuries pursuant to OHS&W Regulations Division 6.6 2
Number of notices served pursuant to OHS&W Act s35, s39 and s40 (default, improvement and prohibition notices)
0
Table2:Agencygrossworkerscompensationexpenditurefor2007-08comparedwith2006-07
eXpenditURe 2007-08
($m)
2006-07
($m)
Variation
($m) + (-)
% change
+ (-)
Income Maintenance $114 519 $135 430 -$20 911 -15.5
Lump Sum Settlements Redemptions - Sect.42
$60 000 $65 000 -$5 000 -7.8
Lump Sum Settlements Permanent Disability – Sect. 43
$17 694 0 +$17 694
Medical/Hospital Costs combined $113 018 $123 284 -$10 266 -8.3
Other $41 287 $13 100 +$28 187
total claims expenditure $346 518 $336 814 +$9 704 +2.8
a3 OccUpatiOnaL, HeaLtH, safety and inJURy manaGement RepORt
The following tables report the department’s OHS&W performance for
the year 2007-08.

53
There has been a significant reduction in the number of new claims in DEH.
The Notional Quarterly Target for new claims is 57 and DEH had 39, which is also
below the 2010 target.
The New Workplace Injury Claims Frequency Rate and the Lost Time Injury
Frequency Rate also decreased.
Action is being taken to address the increase in income maintenance costs based
on the average of the previous two years.
table 3 meeting safety performance targets
base:
2005-06
performance: 12 months to end of June 2008 *
final target
numbers or %
actual national quarterly target**
Variation numbers or %
1. Workplace Fatalities 0 0 0 0 0
2. New Workplace Injury Claims 62 39 57 -18 50
3. New Workplace Injury Claims Frequency Rate
35.8 28.6 33.5 -4.9 28.6
4. Lost Time Injury Frequency Rate *** 9.2 7.3 8.4 -1.1 7.4
5. New Psychological Injury Claims 2 3 2 +1 2
6. Rehabilitation and Return to Work:
6a. Early Assessment within 2 days 19.67% 59% 80% -21% 80% or more
6b. Early Intervention within 5 days 100% 100% 80% +20% 80% or more
6c. RTW within 5 business days 92.3% 76.9% 75% +1.9% 75% or more
7. Claim Determination:
7a. Claims determined in 10 business days
71% 75% 75% 0% 75% or more
7b. Claims still to be determined after 3 months
4.8% 4.5% 3% +1.5% 3% or less
8. Income Maintenance Payments for Recent Injuries:
2006-07 Injuries (at 24 months development)
- $63 000 $58 000 +$5 000 Below previous
2 years average
2007-08 Injuries (at 12 months development)
- $33 000 $30 000 +$3 000 Below previous 2
years average
* Except for Target 8, which is YTD. For Targets 5, 6c, 7a and 7b, performance is measured up to the previous quarter to allow reporting lag.
** Based on cumulative reduction from base at a constant quarterly figure.
*** Lost Time Injury Frequency Rate Injury frequency rate for new lost-time injury/disease for each one million hours worked. This frequency rate is calculated for benchmarking and is used by the WorkCover Corporation.
Lost Time Injury frequency rate (new claims): Number of new cases of lost-time injury/disease for year x 1 000 000 Number of hours worked in the year
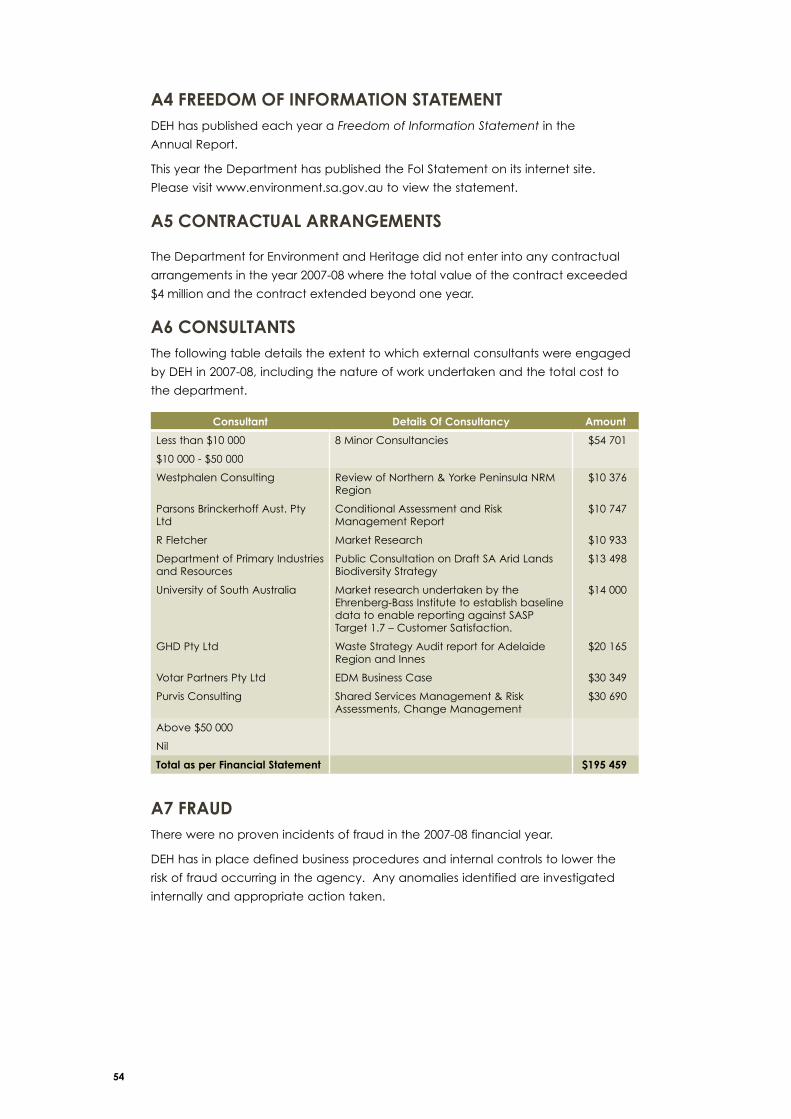
54
a4 fReedOm Of infORmatiOn statementDEH has published each year a Freedom of Information Statement in the
Annual Report.
This year the Department has published the FoI Statement on its internet site.
Please visit www.environment.sa.gov.au to view the statement.
a5 cOntRactUaL aRRanGements
The Department for Environment and Heritage did not enter into any contractual
arrangements in the year 2007-08 where the total value of the contract exceeded
$4 million and the contract extended beyond one year.
a6 cOnsULtantsThe following table details the extent to which external consultants were engaged
by DEH in 2007-08, including the nature of work undertaken and the total cost to
the department.
consultant details Of consultancy amount
Less than $10 000 8 Minor Consultancies $54 701
$10 000 - $50 000
Westphalen Consulting Review of Northern & Yorke Peninsula NRM Region
$10 376
Parsons Brinckerhoff Aust. Pty Ltd
Conditional Assessment and Risk Management Report
$10 747
R Fletcher Market Research $10 933
Department of Primary Industries and Resources
Public Consultation on Draft SA Arid Lands Biodiversity Strategy
$13 498
University of South Australia Market research undertaken by the Ehrenberg-Bass Institute to establish baseline data to enable reporting against SASP Target 1.7 – Customer Satisfaction.
$14 000
GHD Pty Ltd Waste Strategy Audit report for Adelaide Region and Innes
$20 165
Votar Partners Pty Ltd EDM Business Case $30 349
Purvis Consulting Shared Services Management & Risk Assessments, Change Management
$30 690
Above $50 000
Nil
total as per financial statement $195 459
a7 fRaUdThere were no proven incidents of fraud in the 2007-08 financial year.
DEH has in place defined business procedures and internal controls to lower the
risk of fraud occurring in the agency. Any anomalies identified are investigated
internally and appropriate action taken.
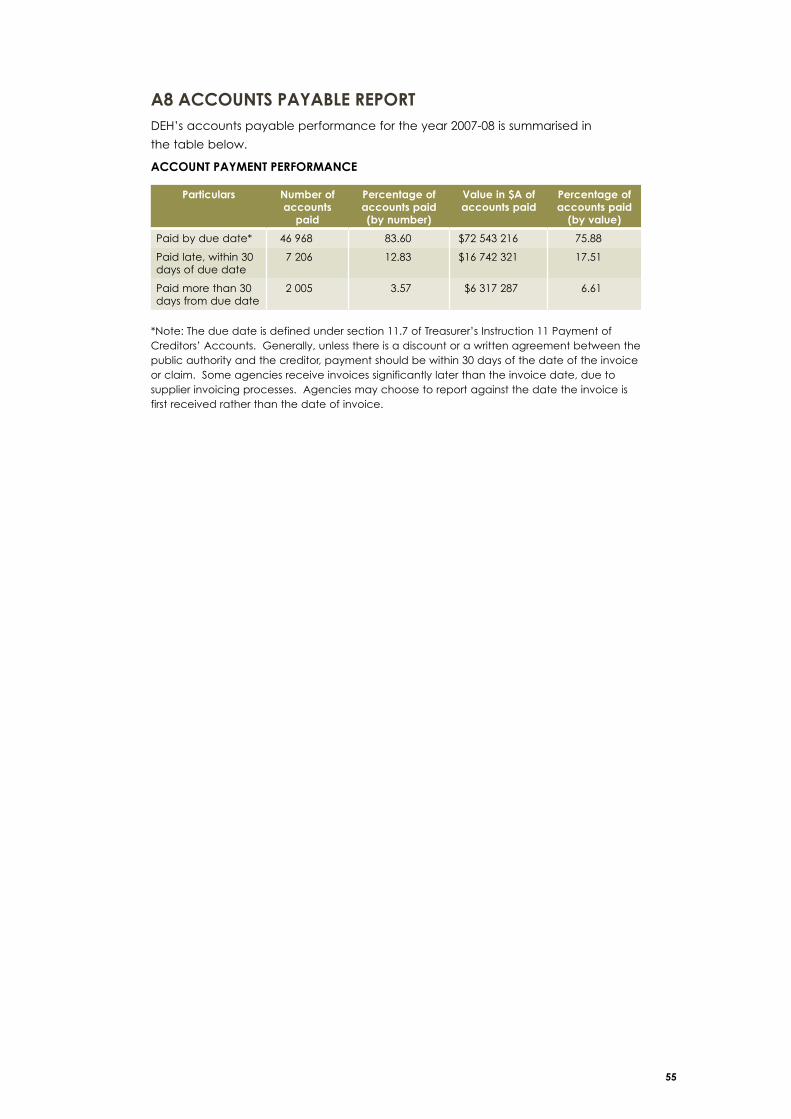
55
a8 accOUnts payabLe RepORtDEH’s accounts payable performance for the year 2007-08 is summarised in
the table below.
accOUnt payment peRfORmance
*Note: The due date is defined under section 11.7 of Treasurer’s Instruction 11 Payment of Creditors’ Accounts. Generally, unless there is a discount or a written agreement between the public authority and the creditor, payment should be within 30 days of the date of the invoice or claim. Some agencies receive invoices significantly later than the invoice date, due to supplier invoicing processes. Agencies may choose to report against the date the invoice is first received rather than the date of invoice.
particulars number of accounts
paid
percentage of accounts paid (by number)
Value in $a of accounts paid
percentage of accounts paid
(by value)
Paid by due date* 46 968 83.60 $72 543 216 75.88
Paid late, within 30 days of due date
7 206 12.83 $16 742 321 17.51
Paid more than 30 days from due date
2 005 3.57 $6 317 287 6.61
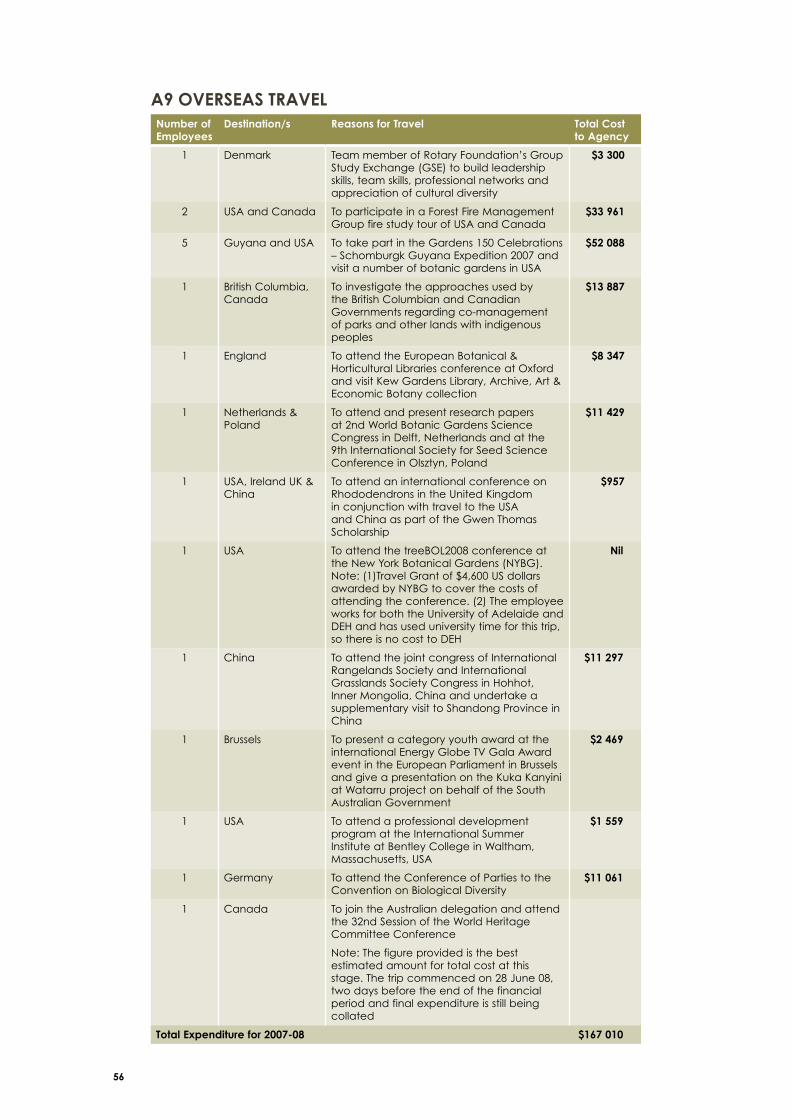
56
a9 OVeRseas tRaVeLnumber of employees
Destination/s Reasons for travel total cost to agency
1 Denmark Team member of Rotary Foundation’s Group Study Exchange (GSE) to build leadership skills, team skills, professional networks and appreciation of cultural diversity
$3 300
2 USA and Canada To participate in a Forest Fire Management Group fire study tour of USA and Canada
$33 961
5 Guyana and USA To take part in the Gardens 150 Celebrations – Schomburgk Guyana Expedition 2007 and visit a number of botanic gardens in USA
$52 088
1 British Columbia, Canada
To investigate the approaches used by the British Columbian and Canadian Governments regarding co-management of parks and other lands with indigenous peoples
$13 887
1 England To attend the European Botanical & Horticultural Libraries conference at Oxford and visit Kew Gardens Library, Archive, Art & Economic Botany collection
$8 347
1 Netherlands & Poland
To attend and present research papers at 2nd World Botanic Gardens Science Congress in Delft, Netherlands and at the 9th International Society for Seed Science Conference in Olsztyn, Poland
$11 429
1 USA, Ireland UK & China
To attend an international conference on Rhododendrons in the United Kingdom in conjunction with travel to the USA and China as part of the Gwen Thomas Scholarship
$957
1 USA To attend the treeBOL2008 conference at the New York Botanical Gardens (NYBG). Note: (1)Travel Grant of $4,600 US dollars awarded by NYBG to cover the costs of attending the conference. (2) The employee works for both the University of Adelaide and DEH and has used university time for this trip, so there is no cost to DEH
nil
1 China To attend the joint congress of International Rangelands Society and International Grasslands Society Congress in Hohhot, Inner Mongolia, China and undertake a supplementary visit to Shandong Province in China
$11 297
1 Brussels To present a category youth award at the international Energy Globe TV Gala Award event in the European Parliament in Brussels and give a presentation on the Kuka Kanyini at Watarru project on behalf of the South Australian Government
$2 469
1 USA To attend a professional development program at the International Summer Institute at Bentley College in Waltham, Massachusetts, USA
$1 559
1 Germany To attend the Conference of Parties to the Convention on Biological Diversity
$11 061
1 Canada To join the Australian delegation and attend the 32nd Session of the World Heritage Committee Conference
Note: The figure provided is the best estimated amount for total cost at this stage. The trip commenced on 28 June 08, two days before the end of the financial period and final expenditure is still being collated
total expenditure for 2007-08 $167 010

57
a10 GReeninG Of GOVeRnment OpeRatiOns RepORt
eneRGy efficiency RepORt
total energy UsageTable 1 below shows the total energy used by DEH in the delivery of its programs
and services, listed in the end-use categories required for reporting to government.
DEH has determined its energy usage from primary source data in line with the 2005
decision by the Energy Efficiency Reference Group.
buildings energy UseSouth Australia’s Strategic Plan (SASP) has a target to improve energy efficiency in
government agency buildings by 25 per cent by 2014 (Target 3.13). In addition to
the office premises leased by DEH, the department owns and operates a buildings
asset folio of 1400 structures. The range of buildings includes the Bicentennial
Conservatory within the Adelaide Botanic Garden that is a very high consumer of
natural gas, and many structures in regional areas that source their electricity from
diesel-powered generators. Identifying actual energy usage associated with the
full folio of assets has made it necessary to report energy usage across the ‘Other
Buildings’ and ‘Other Uses’ categories in Table 1 above. As a result, DEH’s total
buildings energy usage cannot be accurately calculated by simply adding ‘Office
Light & Power’ and ‘Other Buildings’. This affects DEH’s ability to accurately report
against SASP Target 3.13.
The ‘Office Light & Power’ data, which is exclusively electricity-based, shows a
1.5 per cent increase in energy use from 2006-07. DEH has undertaken energy
audits on the top six energy usage sites in 2007 08 and these audits have been
used to inform DEH’s future program of energy efficiency projects to further reduce
energy usage. On the other hand, energy consumption in DEH’s ‘Other Buildings’
category has decreased, with usage falling by 19 per cent in the last 12 months.
This decrease is directly attributable to the reduction in diesel usage in generators
following the installation of Remote Area Power Systems (RAPS). The installation of
RAPS puts DEH in a good position to achieve the energy efficiency performance
required for government buildings under SASP Target 3.13.
A complete breakdown of the updated DEH energy data for usage, emissions and
cost, by type, is shown in Tables 2.1 - 2.3 on the following pages.
table 1 - total deH annual energy Usage (Giga Joules - GJ)
Office Light & power
Other buildings
Other transport
Other Uses passenger Vehicles
tOtaL GJ
2000-01 15 849 16 596 3 016 8 158 17 955 61 574
2001-02 4 998 15 866 2 910 8 158 17 955 49 887
2002-03 4 576 16 717 2 805 8 158 17 955 50 211
2003-04 4 810 15 875 1 606 8 158 23 697 54 146
2004-05 6 963 14 790 1 787 6 993 23 813 54 346
2005-06 6 724 8 060 646 10 225 21 415 47 070
2006-07 3 836 15 590 2 059 12 335 22 721 56 541
2007-08 3 897 12 657 3 265 8 891 20 900 49 611
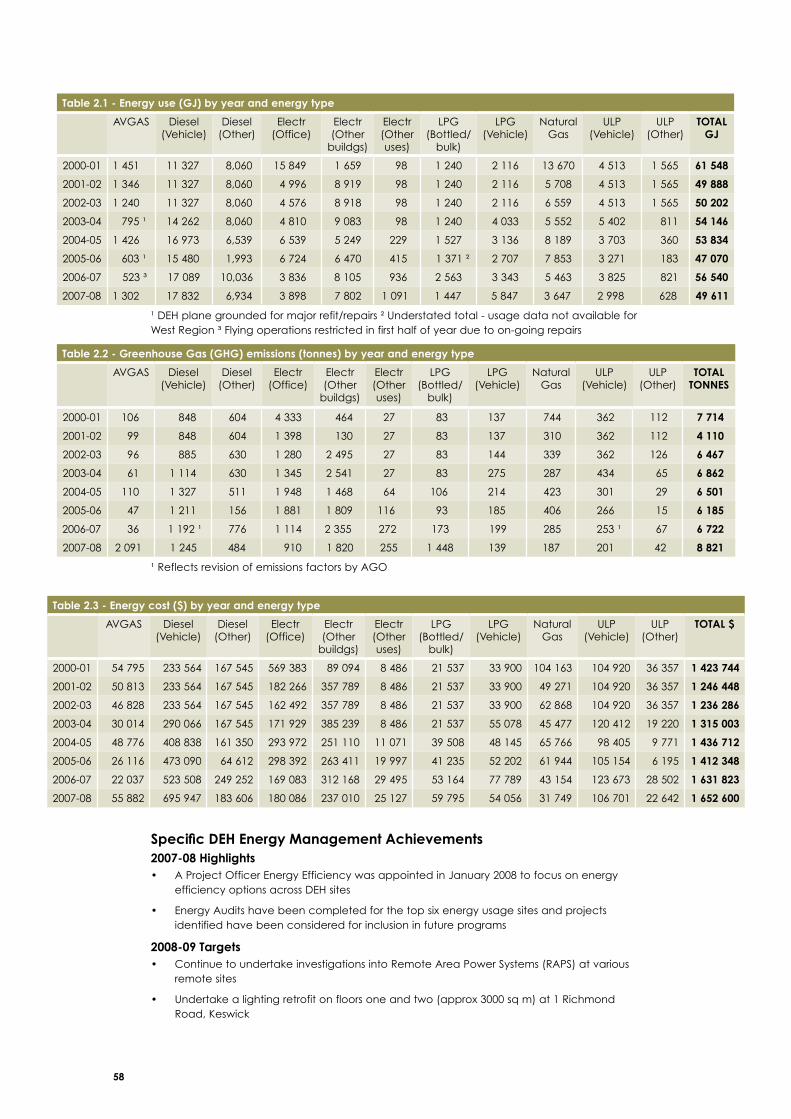
58
table 2.1 - energy use (GJ) by year and energy type
AVGAS Diesel (Vehicle)
Diesel (Other)
Electr (Office)
Electr (Other
buildgs)
Electr (Other uses)
LPG (Bottled/
bulk)
LPG (Vehicle)
Natural Gas
ULP (Vehicle)
ULP (Other)
tOtaL GJ
2000-01 1 451 11 327 8,060 15 849 1 659 98 1 240 2 116 13 670 4 513 1 565 61 548
2001-02 1 346 11 327 8,060 4 996 8 919 98 1 240 2 116 5 708 4 513 1 565 49 888
2002-03 1 240 11 327 8,060 4 576 8 918 98 1 240 2 116 6 559 4 513 1 565 50 202
2003-04 795 ¹ 14 262 8,060 4 810 9 083 98 1 240 4 033 5 552 5 402 811 54 146
2004-05 1 426 16 973 6,539 6 539 5 249 229 1 527 3 136 8 189 3 703 360 53 834
2005-06 603 ¹ 15 480 1,993 6 724 6 470 415 1 371 ² 2 707 7 853 3 271 183 47 070
2006-07 523 ³ 17 089 10,036 3 836 8 105 936 2 563 3 343 5 463 3 825 821 56 540
2007-08 1 302 17 832 6,934 3 898 7 802 1 091 1 447 5 847 3 647 2 998 628 49 611
¹ DEH plane grounded for major refit/repairs ² Understated total - usage data not available for West Region ³ Flying operations restricted in first half of year due to on-going repairs
table 2.2 - Greenhouse Gas (GHG) emissions (tonnes) by year and energy type
AVGAS Diesel (Vehicle)
Diesel (Other)
Electr (Office)
Electr (Other
buildgs)
Electr (Other uses)
LPG (Bottled/
bulk)
LPG (Vehicle)
Natural Gas
ULP (Vehicle)
ULP (Other)
tOtaL tOnnes
2000-01 106 848 604 4 333 464 27 83 137 744 362 112 7 714
2001-02 99 848 604 1 398 130 27 83 137 310 362 112 4 110
2002-03 96 885 630 1 280 2 495 27 83 144 339 362 126 6 467
2003-04 61 1 114 630 1 345 2 541 27 83 275 287 434 65 6 862
2004-05 110 1 327 511 1 948 1 468 64 106 214 423 301 29 6 501
2005-06 47 1 211 156 1 881 1 809 116 93 185 406 266 15 6 185
2006-07 36 1 192 ¹ 776 1 114 2 355 272 173 199 285 253 ¹ 67 6 722
2007-08 2 091 1 245 484 910 1 820 255 1 448 139 187 201 42 8 821
SpecificDEHEnergyManagementAchievements2007-08 Highlights
A Project Officer Energy Efficiency was appointed in January 2008 to focus on energy •efficiency options across DEH sites
Energy Audits have been completed for the top six energy usage sites and projects •identified have been considered for inclusion in future programs
2008-09 targetsContinue to undertake investigations into Remote Area Power Systems (RAPS) at various •remote sites
Undertake a lighting retrofit on floors one and two (approx 3000 sq m) at 1 Richmond •Road, Keswick
¹ Reflects revision of emissions factors by AGO
table 2.3 - energy cost ($) by year and energy type
AVGAS Diesel (Vehicle)
Diesel (Other)
Electr (Office)
Electr (Other
buildgs)
Electr (Other uses)
LPG (Bottled/
bulk)
LPG (Vehicle)
Natural Gas
ULP (Vehicle)
ULP (Other)
tOtaL $
2000-01 54 795 233 564 167 545 569 383 89 094 8 486 21 537 33 900 104 163 104 920 36 357 1 423 744
2001-02 50 813 233 564 167 545 182 266 357 789 8 486 21 537 33 900 49 271 104 920 36 357 1 246 448
2002-03 46 828 233 564 167 545 162 492 357 789 8 486 21 537 33 900 62 868 104 920 36 357 1 236 286
2003-04 30 014 290 066 167 545 171 929 385 239 8 486 21 537 55 078 45 477 120 412 19 220 1 315 003
2004-05 48 776 408 838 161 350 293 972 251 110 11 071 39 508 48 145 65 766 98 405 9 771 1 436 712
2005-06 26 116 473 090 64 612 298 392 263 411 19 997 41 235 52 202 61 944 105 154 6 195 1 412 348
2006-07 22 037 523 508 249 252 169 083 312 168 29 495 53 164 77 789 43 154 123 673 28 502 1 631 823
2007-08 55 882 695 947 183 606 180 086 237 010 25 127 59 795 54 056 31 749 106 701 22 642 1 652 600
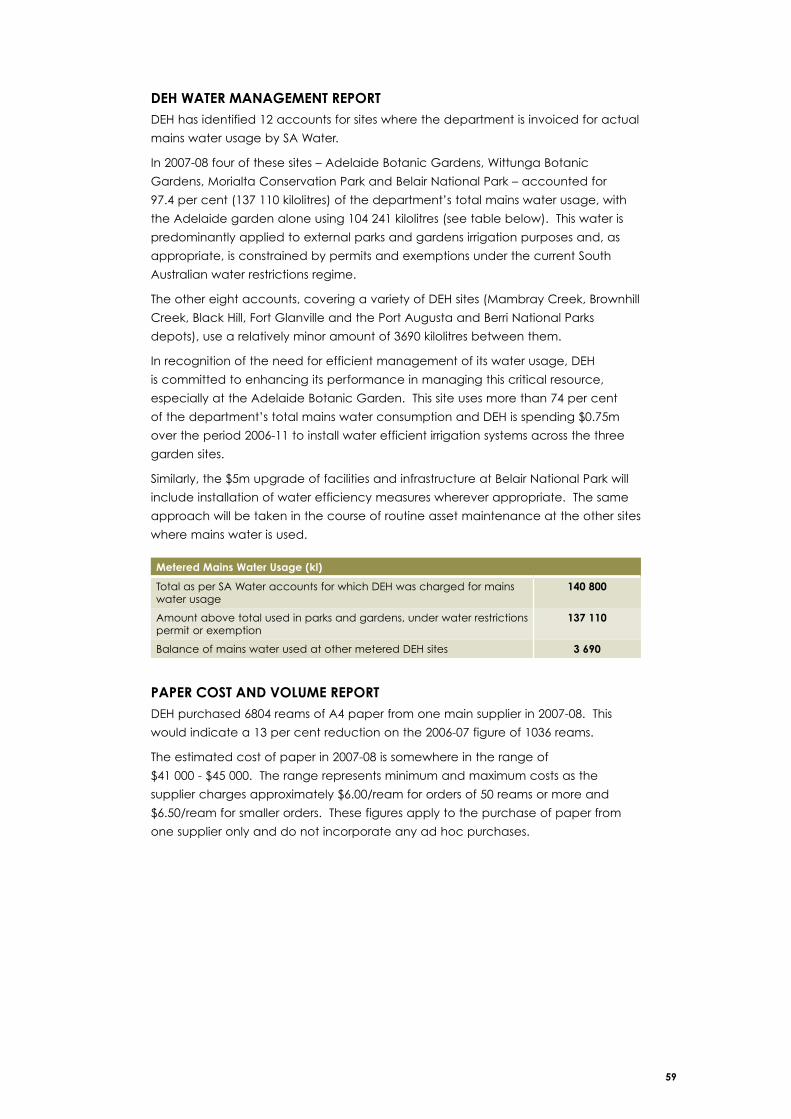
59
DEHWATERMANAGEMENTREPORTDEH has identified 12 accounts for sites where the department is invoiced for actual
mains water usage by SA Water.
In 2007-08 four of these sites – Adelaide Botanic Gardens, Wittunga Botanic
Gardens, Morialta Conservation Park and Belair National Park – accounted for
97.4 per cent (137 110 kilolitres) of the department’s total mains water usage, with
the Adelaide garden alone using 104 241 kilolitres (see table below). This water is
predominantly applied to external parks and gardens irrigation purposes and, as
appropriate, is constrained by permits and exemptions under the current South
Australian water restrictions regime.
The other eight accounts, covering a variety of DEH sites (Mambray Creek, Brownhill
Creek, Black Hill, Fort Glanville and the Port Augusta and Berri National Parks
depots), use a relatively minor amount of 3690 kilolitres between them.
In recognition of the need for efficient management of its water usage, DEH
is committed to enhancing its performance in managing this critical resource,
especially at the Adelaide Botanic Garden. This site uses more than 74 per cent
of the department’s total mains water consumption and DEH is spending $0.75m
over the period 2006-11 to install water efficient irrigation systems across the three
garden sites.
Similarly, the $5m upgrade of facilities and infrastructure at Belair National Park will
include installation of water efficiency measures wherever appropriate. The same
approach will be taken in the course of routine asset maintenance at the other sites
where mains water is used.
papeR cOst and VOLUme RepORtDEH purchased 6804 reams of A4 paper from one main supplier in 2007-08. This
would indicate a 13 per cent reduction on the 2006-07 figure of 1036 reams.
The estimated cost of paper in 2007-08 is somewhere in the range of
$41 000 - $45 000. The range represents minimum and maximum costs as the
supplier charges approximately $6.00/ream for orders of 50 reams or more and
$6.50/ream for smaller orders. These figures apply to the purchase of paper from
one supplier only and do not incorporate any ad hoc purchases.
MeteredMainsWaterusage(kl)
Total as per SA Water accounts for which DEH was charged for mains water usage
140 800
Amount above total used in parks and gardens, under water restrictions permit or exemption
137 110
Balance of mains water used at other metered DEH sites 3 690
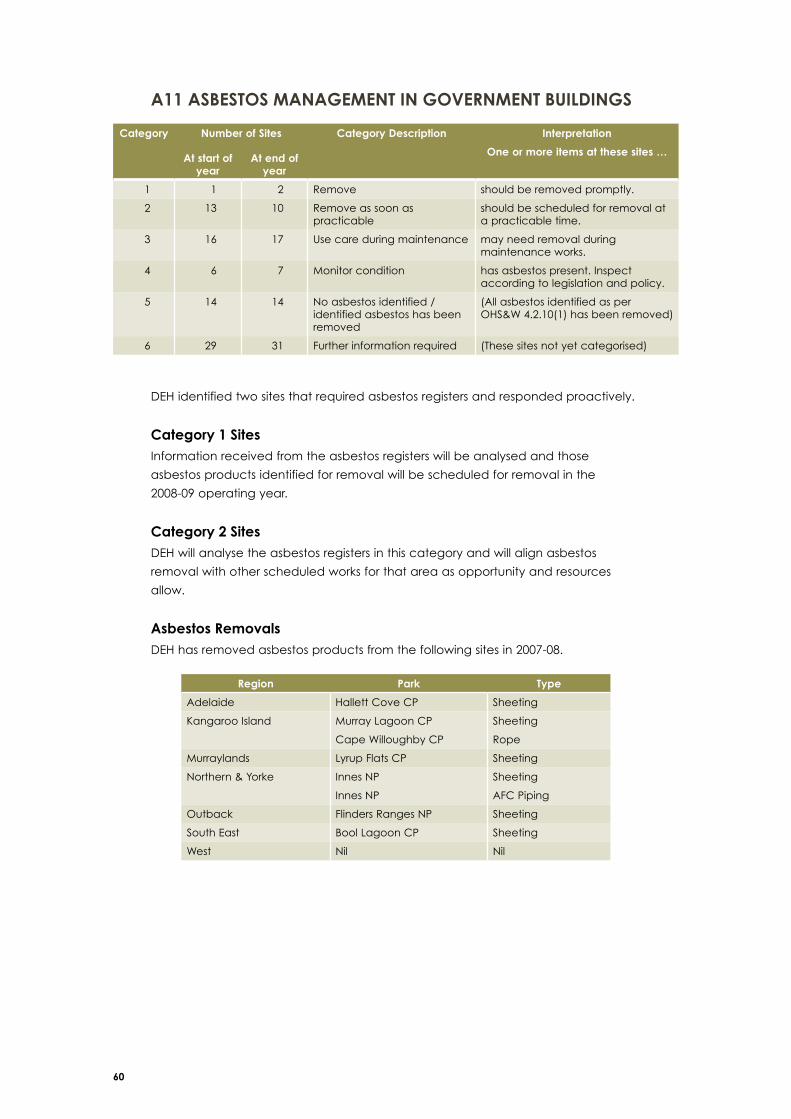
60
a11 asbestOs manaGement in GOVeRnment bUiLdinGs
DEH identified two sites that required asbestos registers and responded proactively.
category 1 sitesInformation received from the asbestos registers will be analysed and those
asbestos products identified for removal will be scheduled for removal in the
2008-09 operating year.
category 2 sitesDEH will analyse the asbestos registers in this category and will align asbestos
removal with other scheduled works for that area as opportunity and resources
allow.
asbestos RemovalsDEH has removed asbestos products from the following sites in 2007-08.
category number of sites category description interpretation
One or more items at these sites …at start of year
at end of year
1 1 2 Remove should be removed promptly.
2 13 10 Remove as soon as practicable
should be scheduled for removal at a practicable time.
3 16 17 Use care during maintenance may need removal during maintenance works.
4 6 7 Monitor condition has asbestos present. Inspect according to legislation and policy.
5 14 14 No asbestos identified / identified asbestos has been removed
(All asbestos identified as per OHS&W 4.2.10(1) has been removed)
6 29 31 Further information required (These sites not yet categorised)
Region Park type
Adelaide Hallett Cove CP Sheeting
Kangaroo Island Murray Lagoon CP
Cape Willoughby CP
Sheeting
Rope
Murraylands Lyrup Flats CP Sheeting
Northern & Yorke Innes NP
Innes NP
Sheeting
AFC Piping
Outback Flinders Ranges NP Sheeting
South East Bool Lagoon CP Sheeting
West Nil Nil

61
a12 deH bOaRds and cOmmittees In 2007-08 the Department for Environment and Heritage provided administrative
support to the following boards and committees.
The Marine Advisory Committee was terminated on 28 June 2008 and the PLAF
Project Review Panel was disbanded on 30 September 2007.
Adelaide Dolphin Sanctuary Advisory Board Consultative Committee – The Outback
*Adelaide Park Lands Authority Board of Management
Consultative Committee – West
Animal Ethics Committee – Children, Youth and Women’s Health Services
Coorong and Lower Lakes Ramsar Taskforce
Animal Ethics Committee – CSIRO Dog and Cat Management Board
Animal Ethics Committee - Dept of Education and Children’s Services
General Reserves Trust
Animal Ethics Committee - Flinders University Land Board
Animal Ethics Committee – IMVS/Central Northern Adelaide Health Service
Maralinga Lands Mamungari Conservation Park Board
Animal Ethics Committee - Non Government Schools
Marine Advisory Committee
Animal Ethics Committee – PIRSA/SARDI Marine Parks Council of South Australia
Animal Ethics Committee – TAFE SA Ngaut Ngaut Conservation Park Co Management Committee
Animal Ethics Committee - University of Adelaide
Perpetual Lease Accelerated Freeholding Project Review Panel
Animal Ethics Committee - Wildlife Scientific Working Group
Animal Welfare Advisory Committee Sea Level Rise Advisory Committee
Board of the Botanic Gardens and State Herbarium
South Australian Heritage Council
*Board of the Royal Zoological Society of South Australia Inc
South Australian Heritage Council Register Committee
Coast Protection Board South Australian National Parks and Wildlife Council
Consultative Committee - Adelaide Tail Docking Advisory Panel
Consultative Committee – Kangaroo Island Vulkathunha-Gammon Ranges National Park Co Management Board
Consultative Committee – Murraylands Wilderness Advisory Committee
Consultative Committee – Northern and Yorke
Witjira National Park Board of Management
Consultative Committee – South East
* Independent incorporated body that has a courtesy reporting relationship with the Minister/Department

62
a13 LeGisLatiOn administeRed by deHDEH derives its functions, responsibilities and powers from legislation committed to
the Minister for Environment and Conservation. All legislation under the Minister’s
responsibility is reviewed to ensure that it maximises the social, economic and
environmental sustainability of the state, and complies with national
competition policy.
the following legislation committed to the minister is administered by deH:
Adelaide Dolphin Sanctuary Act 2005
Adelaide Park Lands Act 2005
Botanic Gardens and State Herbarium Act 1978
Coast Protection Act 1972
Crown Lands Act 1929
Crown Rates and Taxes Recovery Act 1945
Discharged Soldiers Settlement Act 1934
Dog and Cat Management Act 1995
Heritage Places Act 1993
Historic Shipwrecks Act 1981
Irrigation (Land Tenure) Act 1930
Lands for Public Purposes Acquisition Act 1914
Marginal Lands Act 1940
Marine Parks Act 2007
Monarto Legislation Repeal Act 1980
National Environment Protection Council (South Australia) Act 1995
National Parks and Wildlife Act 1972
National Trust of South Australia Act 1955
Prevention of Cruelty to Animals Act 1985
War Service Land Settlement Agreement Act 1945
Wilderness Protection Act 1992
Wilpena Station Tourist Facility Act 1990

63

64
FINANCIAL STATEMENTS
65
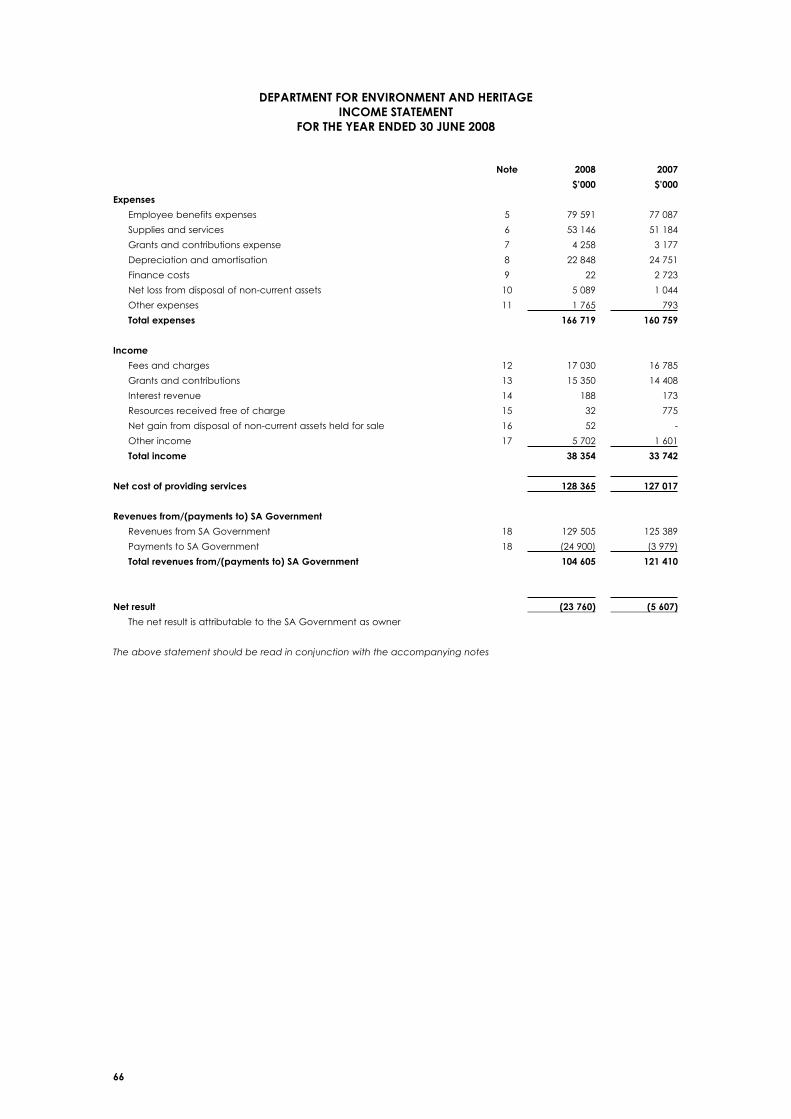
66
note 2008 2007
$’000 $’000
expenses
Employee benefits expenses 5 79 591 77 087
Supplies and services 6 53 146 51 184
Grants and contributions expense 7 4 258 3 177
Depreciation and amortisation 8 22 848 24 751
Finance costs 9 22 2 723
Net loss from disposal of non-current assets 10 5 089 1 044
Other expenses 11 1 765 793
total expenses 166 719 160 759
income
Fees and charges 12 17 030 16 785
Grants and contributions 13 15 350 14 408
Interest revenue 14 188 173
Resources received free of charge 15 32 775
Net gain from disposal of non-current assets held for sale 16 52 -
Other income 17 5 702 1 601
total income 38 354 33 742
net cost of providing services 128 365 18 127 017
Revenuesfrom/(paymentsto)SAGovernment
Revenues from SA Government 18 129 505 125 389
Payments to SA Government 18 (24 900) (3 979)
Totalrevenuesfrom/(paymentsto)SAGovernment 104 605 121 410
net result (23 760) (5 607)
The net result is attributable to the SA Government as owner
Theabovestatementshouldbereadinconjunctionwiththeaccompanyingnotes
depaRtment fOR enViROnment and HeRitaGe incOme statement
fOR tHe yeaR ended 30 JUne 2008
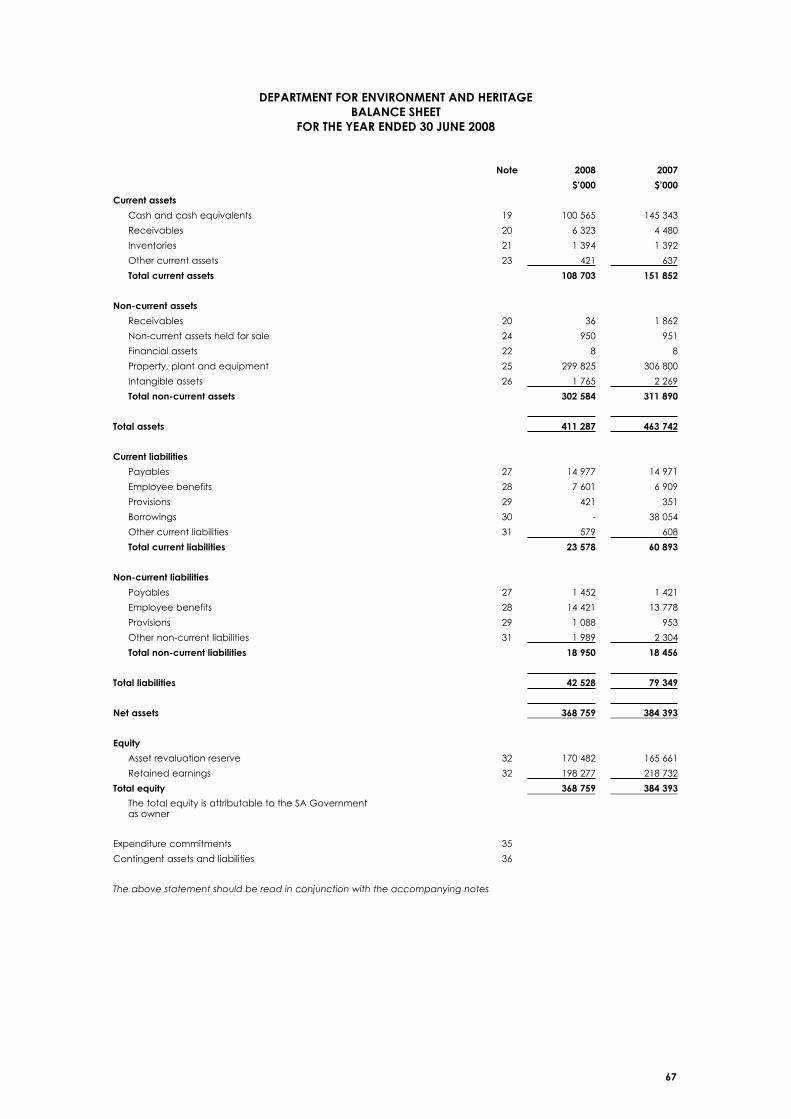
67
depaRtment fOR enViROnment and HeRitaGe baLance sHeet
fOR tHe yeaR ended 30 JUne 2008
note 2008 2007
$’000 $’000
current assets
Cash and cash equivalents 19 100 565 145 343
Receivables 20 6 323 4 480
Inventories 21 1 394 1 392
Other current assets 23 421 637
total current assets 108 703 151 852
non-current assets
Receivables 20 36 1 862
Non-current assets held for sale 24 950 951
Financial assets 22 8 8
Property, plant and equipment 25 299 825 306 800
Intangible assets 26 1 765 2 269
total non-current assets 302 584 311 890
total assets 411 287 463 742
current liabilities
Payables 27 14 977 14 971
Employee benefits 28 7 601 6 909
Provisions 29 421 351
Borrowings 30 - 38 054
Other current liabilities 31 579 608
total current liabilities 23 578 60 893
non-current liabilities
Payables 27 1 452 1 421
Employee benefits 28 14 421 13 778
Provisions 29 1 088 953
Other non-current liabilities 31 1 989 2 304
total non-current liabilities 18 950 18 456
total liabilities 42 528 79 349
net assets 368 759 384 393
equity
Asset revaluation reserve 32 170 482 165 661
Retained earnings 32 198 277 218 732
total equity 368 759 384 393
The total equity is attributable to the SA Government as owner
Expenditure commitments 35
Contingent assets and liabilities 36
Theabovestatementshouldbereadinconjunctionwiththeaccompanyingnotes
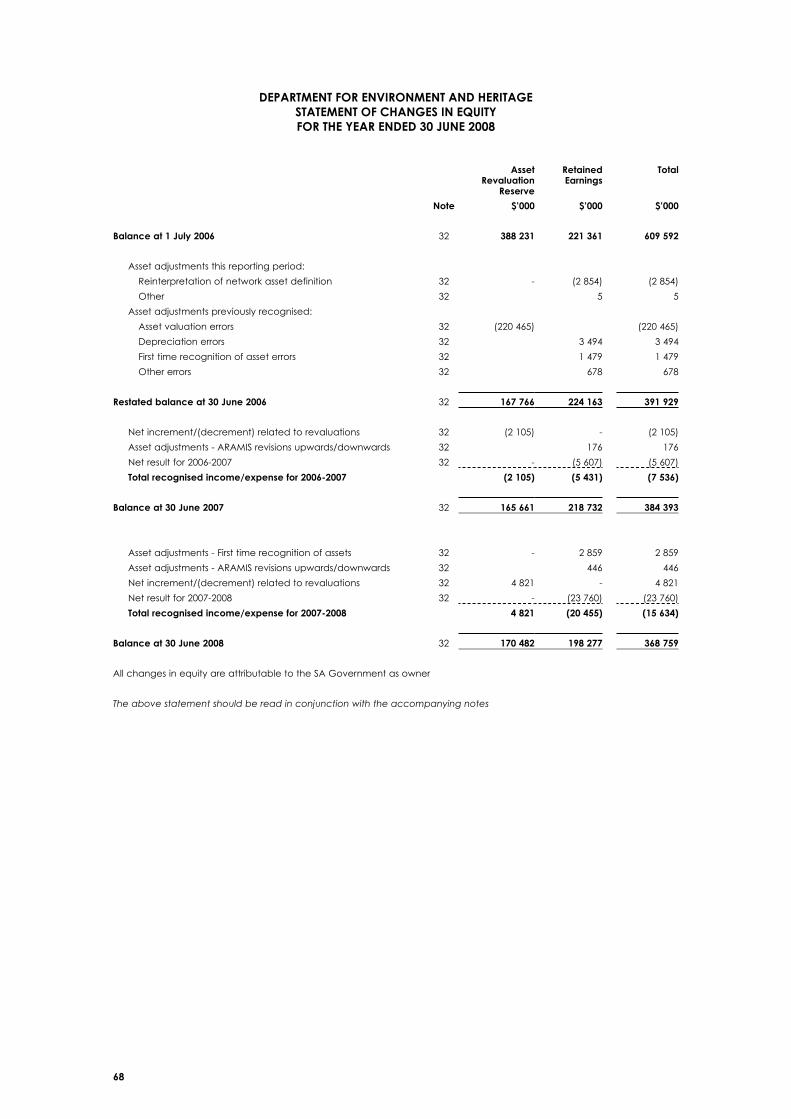
68
depaRtment fOR enViROnment and HeRitaGe statement Of cHanGes in eqUity fOR tHe yeaR ended 30 JUne 2008
asset Revaluation
Reserve
Retained earnings
total
note $’000 $’000 $’000
balance at 1 July 2006 32 388 231 221 361 609 592
Asset adjustments this reporting period:
Reinterpretation of network asset definition 32 - (2 854) (2 854)
Other 32 5 5
Asset adjustments previously recognised:
Asset valuation errors 32 (220 465) (220 465)
Depreciation errors 32 3 494 3 494
First time recognition of asset errors 32 1 479 1 479
Other errors 32 678 678
Restated balance at 30 June 2006 32 167 766 224 163 391 929
Net increment/(decrement) related to revaluations 32 (2 105) - (2 105)
Asset adjustments - ARAMIS revisions upwards/downwards 32 176 176
Net result for 2006-2007 32 - (5 607) (5 607)
Totalrecognisedincome/expensefor2006-2007 (2 105) (5 431) (7 536)
balance at 30 June 2007 32 165 661 218 732 384 393
Asset adjustments - First time recognition of assets 32 - 2 859 2 859
Asset adjustments - ARAMIS revisions upwards/downwards 32 446 446
Net increment/(decrement) related to revaluations 32 4 821 - 4 821
Net result for 2007-2008 32 - (23 760) (23 760)
Totalrecognisedincome/expensefor2007-2008 4 821 (20 455) (15 634)
balance at 30 June 2008 32 170 482 198 277 368 759
All changes in equity are attributable to the SA Government as owner
Theabovestatementshouldbereadinconjunctionwiththeaccompanyingnotes
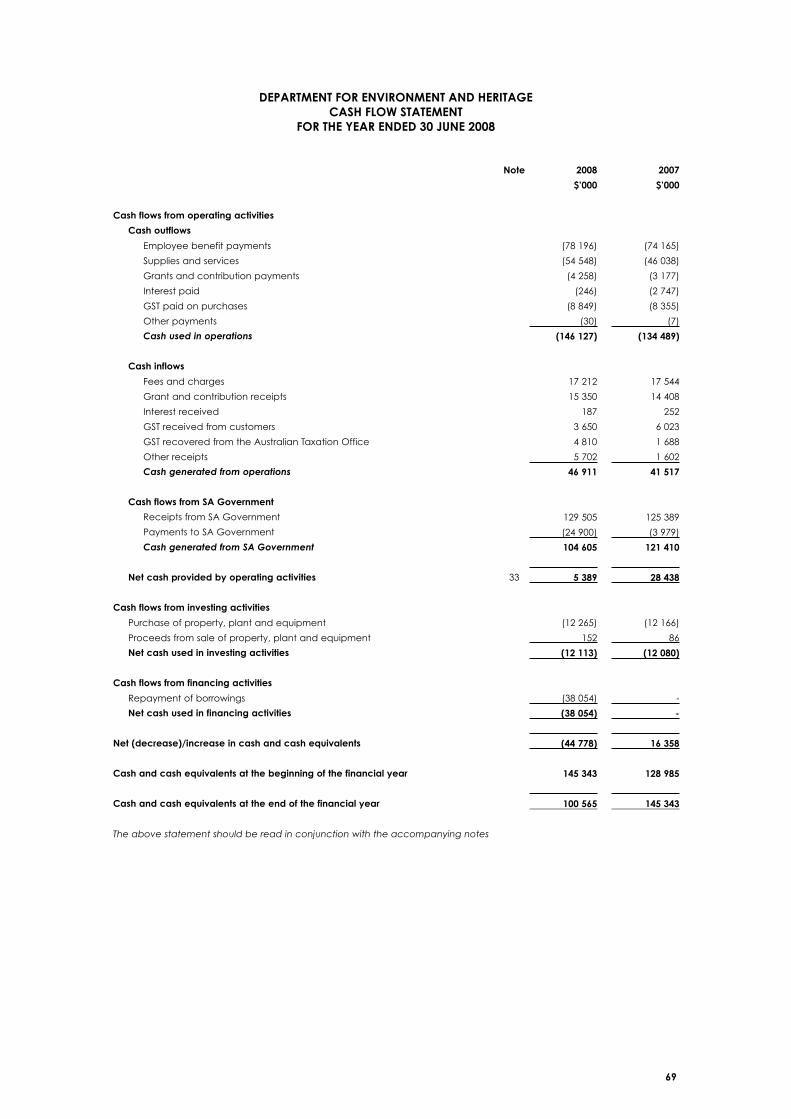
69
depaRtment fOR enViROnment and HeRitaGe CASHFLOWSTATEMENT
fOR tHe yeaR ended 30 JUne 2008
note 2008 2007
$’000 $’000
cash flows from operating activities
cash outflows
Employee benefit payments (78 196) (74 165)
Supplies and services (54 548) (46 038)
Grants and contribution payments (4 258) (3 177)
Interest paid (246) (2 747)
GST paid on purchases (8 849) (8 355)
Other payments (30) (7)
Cash used in operations (146 127) (134 489)
cash inflows
Fees and charges 17 212 17 544
Grant and contribution receipts 15 350 14 408
Interest received 187 252
GST received from customers 3 650 6 023
GST recovered from the Australian Taxation Office 4 810 1 688
Other receipts 5 702 1 602
Cash generated from operations 46 911 41 517
cash flows from sa Government
Receipts from SA Government 129 505 125 389
Payments to SA Government (24 900) (3 979)
Cash generated from SA Government 104 605 121 410
net cash provided by operating activities 33 5 389 28 438
cash flows from investing activities
Purchase of property, plant and equipment (12 265) (12 166)
Proceeds from sale of property, plant and equipment 152 86
net cash used in investing activities (12 113) (12 080)
cash flows from financing activities
Repayment of borrowings (38 054) -
net cash used in financing activities (38 054) -
Net(decrease)/increaseincashandcashequivalents (44 778) 16 358
cash and cash equivalents at the beginning of the financial year 145 343 128 985
cash and cash equivalents at the end of the financial year 100 565 145 343
Theabovestatementshouldbereadinconjunctionwiththeaccompanyingnotes
70
depaRtment fOR enViROnment and HeRitaGe nOte indeX
fOR tHe yeaR ended 30 JUne 2008
note contents1 Objectives of the Department for Environment and Heritage
2 Summary of significant accounting policies
3 Changes in accounting policies
4 Programs of the Department
5 Employee benefits expenses
6 Supplies and services
7 Grants and contributions expense
8 Depreciation and amortisation
9 Finance costs
10 Net gain/(loss) from disposal of non-current assets
11 Other expenses
12 Fees and charges
13 Grants and contributions
14 Interest revenue
15 Resources received free of charge
16 Net gain from disposal of non-current assets held for sale
17 Other income
18 Revenues from/(payments to) SA Government
19 Cash and cash equivalents
20 Receivables
21 Inventories
22 Financial assets
23 Other assets
24 Non-current assets held for sale
25 Property, plant and equipment
26 Intangible assets
27 Payables
28 Employee benefits
29 Provisions
30 Borrowings
31 Other liabilities
32 Equity
33 Cash flow reconciliation
34 Restrictions on contributions received
35 Expenditure commitments
36 Contingent liabilities
37 Remuneration of Board and Committee Members
38 Events subsequent to reporting date
39 Financial instruments/Financial risk management
40 State Heritage Fund
Asset movement reconciliation 2007-08
Restated asset movement reconciliation 2006-07
Administered items - Balance Sheet
Administered items - Income Statement
Administered items - Statement of Changes in Administered Equity
Administered items - Statement of Administered Cash Flows
Administered items - Programs
Administered items - Notes to and forming part of the Administered Financial Statements

71
depaRtment fOR enViROnment and HeRitaGe nOtes tO and fORminG paRt Of tHe financiaL statements
fOR tHe yeaR ended 30 JUne 2008
1 Objectives of the department for environment and HeritageThe Department for Environment and Heritage (the Department) is responsible for nature conservation, heritage conservation and animal welfare. We collect and provide information and knowledge about the State’s environment. We manage the State’s public land, which includes our national parks, marine parks, botanic gardens and coastline. We also advise on environment policy.
this is achieved through commitment to the following objectives:
- involving all south australians
Encouraging all South Australians to enjoy and be actively involved with their rich heritage and diverse natural environments.
- a healthy environment
Improving South Australia’s rich heritage and diverse natural environments, both public and private, particularly sites and places of state significance.
- sustainable growth
Facilitating economic growth and work to help others recognise that sound environmental management and economic growth are complementary contributors to the sustainable growth of our State.
- better decisions and partnerships
Providing quality information and policy advice based on evidence and research. Building and maintaining strong partnerships to deliver better decisions and results.
- Getting results
Making sure that the Department is accountable and well led, and gets the results it sets out to achieve.
2 summary of significant accounting policies(a) statement of compliance
The financial report is a general purpose financial report. The accounts have been prepared in accordance with Australian Accounting Standards, Treasurer’s Instructions and Accounting Policy Statements promulgated under the provisions of the PublicFinanceandAuditAct1987.
Australian accounting standards include Australian International Financial Reporting Standards and AAS29 Financial Reporting by Government Departments. Australian accounting standards and interpretations that have recently been issued or amended but are not yet effective have not been adopted by the Department for the reporting period ending 30 June 2008, refer Note 3.
(b) basis of preparation
The preparation of the financial report requires:
- the use of certain accounting estimates and requires management to exercise its judgement in the process of applying the Department’s accounting policies. Areas involving a higher degree of judgement or where assumptions and estimates are significant to the financial statements, are outlined in the applicable notes;
- accounting policies are selected and applied in a manner which ensures that the resulting financial information satisfies the concepts of relevance and reliability, thereby ensuring that the substance of the underlying transactions or other events are reported; and
- compliance with Accounting Policy Statements issued pursuant to Section 41 of the Public Finance and Audit Act1987. In the interest of public accountability and transparency the Accounting Policy Statements require the following Note disclosures, that have been included in this financial report:
(a) revenues, expenses, financial assets and financial liabilities where the counterparty/transaction is with an entity within the SA Government as at reporting date, classified according to their nature. A threshold of $100 000 for separate identification of these items may be utilised resulting in the respective transaction/balance being included within the classification of Entities external to SA Government. The Department has elected to utilise this threshold in relation to transactions applicable to revenue and expense items. However, the Department has reported all SA Government balances applicable to financial assets and financial liabilities within the classification of Entities within the SA Government.
(b) expenses incurred as a result of engaging consultants;
(c) employees whose normal remuneration is $100 000 or more (within $10 000 bandwidths) and the aggregate of the remuneration paid or payable or other wise made available, directly or indirectly by the entity to those employees; and
(d) board/committee member and remuneration information, where a board/committee member is entitled to receive income from membership other than a direct out-of-pocket reimbursement.
The Department’s Income Statement, Balance Sheet and Statement of Changes in Equity have been prepared on an accrual basis and are in accordance with historical cost convention, except for certain assets that were valued in accordance with the valuation policy applicable.
The Cash Flow Statement is prepared on a cash basis.
The financial report has been prepared based on a twelve month operating cycle and presented in Australian currency.
The accounting policies set out below have been applied in preparing the financial report for the year ended 30 June 2008 and the comparative information presented for the year ended 30 June 2007.

72
(c) Reporting entity
The Department is a government department of the State of South Australia, established pursuant to the Public SectorManagementAct1995. The department is an administrative unit acting on behalf of the Crown.
The financial report includes all the controlled activities of the Department. Transactions and balances relating to administered resources are not recognised as Departmental income, expense, assets and liabilities. As administered items are significant in relation to the Department’s overall financial performance and position, they are disclosed in the administered financial statements (schedule of administered items) at the back of the controlled General Purpose Financial Report. Except as otherwise disclosed, administered items are accounted for on the same basis and using the same accounting policies as for Departmental items.
(d) comparative information
The presentation and classification of items in the financial report are consistent with prior periods except where a specific Accounting Policy Statement or Australian Accounting Standard has required a change.
Where presentation or classification of items in the financial report has been amended, comparative amounts have been reclassified unless reclassification is impracticable.
The restated comparative amounts do not replace the original financial report for the preceding period.
(e) Rounding
All amounts in the financial report have been rounded to the nearest thousand dollars ($’000).
(f) taxation
The Department is not subject to income tax. The Department is liable for payroll tax, fringe benefits tax, goods and services tax (GST), emergency services levy, land tax equivalents and local government rate equivalents.
Income, expenses and assets are recognised net of the amount of GST except:
- where the GST incurred on a purchase of goods or services is not recoverable from the Australian Taxation Office, in which case GST is recognised as part of the cost of acquisition of the asset or as part of the expense item applicable; and
- receivables and payables, which are stated with the amount of GST included.
The net amount of GST recoverable from, or payable to, the Australian Taxation Office is included as part of receivables or payables in the Balance Sheet.
Cash flows are included in the Cash Flow Statement on a gross basis and the GST component of cash flows arising from investing and financing activities, which is recoverable from, or payable to, the Australian Taxation Office is classified as part of operating cash flows.
Unrecognised contractual commitments and contingencies are disclosed net of the amount of GST recoverable from, or payable to the Australian Taxation Office. If GST is not payable to, or recoverable from the Australian Taxation Office, the commitments and contingencies are disclosed on a gross basis.
(g) events after balance date
Where an event occurs after 30 June but provides information about conditions that existed at 30 June, adjustments are made to amounts recognised in the financial statements.
Note disclosure is made about events between 30 June and the date the financial statements are authorised for issue where the events relate to a condition which arose after 30 June and which may have a material impact on the results of subsequent years.
(h) income and expenses
Income and expenses are recognised to the extent that it is probable that the flow of economic benefits to or from the Department will occur and can be reliably measured.
Income and expenses have been classified according to their nature and have not been offset unless required or permitted by a specific accounting standard, or where offsetting reflects the substance of the transaction or other event.
income
The following are specific recognition criteria:
Fees and Charges
Revenues from fees and charges are derived from the provision of goods and services to other SA Government agencies and to the public. This revenue is recognised upon delivery of the service to the clients or by reference to the stage of completion.
Contributions received
Contributions are recognised as an asset and income when the Department obtains control of the contributions or obtains the right to receive the contributions and the income recognition criteria are met (i.e. the amount can be reliably measured and the flow of resources is probable).
Generally, the Department has obtained control or the right to receive for:
- Contributions with unconditional stipulations - this will be when the agreement becomes enforceable i.e. the earlier of when the receiving entity has formally been advised that the contribution (i.e. grant application) has been approved; agreement/contract is executed; and/or the contribution is received.
- Contributions with conditional stipulations - this will be when the enforceable stipulations specified in the agreement occur or are satisfied; that is income would be recognised for contributions received or receivable under the agreement.
Resources received free of charge
Resources received free of charge are recorded as revenue in the Income Statement at their fair value.

73
Disposal of non-current assets
Income from the disposal of non-current assets is recognised when the control of the asset has passed to the buyer and determined by comparing proceeds with carrying amount. When revalued assets are sold, the revaluation increments are transferred to retained earnings.
Revenues from SA Government
Appropriations for program funding are recognised as revenues when the Department obtains control over the funding. Control over appropriations is normally obtained upon receipt.
Other income
Other income consists of recoveries of insurance claims lodged with the State of South Australia’s government insurance service SAICORP.
expenses
Employee benefits
Employee benefit expense includes all costs related to employment including wages and salaries and leave entitlements. These are recognised when incurred.
Superannuation
The amount charged to the Income Statement represents the contributions made by the Department to the superannuation plan in respect of current services of current Departmental staff. The Department of Treasury and Finance centrally recognises the superannuation liability in the whole of government general purpose financial report.
Contributions paid
For contributions payable, the contribution will be recognised as a liability and expense when the entity has a present obligation to pay the contribution and the expense recognition criteria are met.
Borrowing costs
All borrowing costs are recognised as expenses.
Payments to SA Government
Payments to the SA Government include the return of surplus cash pursuant to the cash alignment policy, taxation revenues and expiation fees received on behalf of the government and paid directly to the Consolidated Account.
(i) current and non-current classification
Assets and liabilities are characterised as either current or non-current in nature. Assets and liabilities that are sold, consumed or realised as part of the normal operating cycle even when they are not expected to be realised within twelve months after the reporting date have been classified as current assets or current liabilities. All other assets and liabilities are classified as non-current.
Where asset and liability line items combine amounts expected to be realised within 12 months and more than 12 months, the Department has separately disclosed the amounts expected to be recovered or settled after more than 12 months.
(j) cash and cash equivalents
Cash and cash equivalents in the Balance Sheet includes cash at bank and on hand and in other short-term, highly liquid investments with maturities of three months or less that are readily converted to cash and which are subject to insignificant risk of changes in value.
For the purposes of the Cash Flow Statement, cash and cash equivalents consist of cash and cash equivalents as defined above.
Cash is measured at nominal value.
(k) Receivables
Receivables include amounts receivable from goods and services, GST input tax credits recoverable, and other accruals.
Trade receivables arise in the normal course of selling goods and services to other government agencies and to the public. Trade receivables are generally receivable within 30 days after the issue of an invoice or the goods/services have been provided under a contractual arrangement.
Collectibility of trade receivables is reviewed on an ongoing basis. An allowance for doubtful debts is raised when there is objective evidence that the Department will not be able to collect the debt. Bad debts are written off when identified.
(l) inventories
Inventories include goods and other property held either for sale or distribution at no or nominal cost in the ordinary course of business. It excludes depreciating assets.
Inventories held for distribution, for no or nominal consideration, are measured at cost and adjusted when applicable for any loss of service potential. Inventories (other than those held for distribution at no or nominal consideration) are measured at the lower of cost or their net realisable value.
Bases used in assessing loss of service potential for inventory held for distribution at no or minimal cost include current replacement cost and technological or functional obsolescence.
Cost for all inventory is measured on the basis of the first-in, first-out method. Net realisable value is determined using the estimated sales proceeds less costs incurred in marketing, selling and distribution to customers.
The amount of any inventory write-down to net realisable value/replacement cost or inventory losses are recognised as an expense in the period the write-down or loss occurred. Any write-down reversals are recognised as an expense reduction.
74
(m) financial assets
The Department measures financial assets and debt at historical cost.
(n) non current asset acquisition and Recognition
Non-current assets are initially recorded at cost or at the value of any liabilities assumed, plus any incidental cost involved with the acquisition.
Where assets are acquired at no value, or minimal value, they are recorded at their fair value in the Balance Sheet. However, if the assets are acquired at no or nominal value as part of a restructuring of administrative arrangements then the assets are recorded at the value recorded by the transferor prior to transfer.
All non-current tangible assets with a value of $5000 or greater are capitalised.
Componentisation of complex assets is only performed when the complex asset’s fair value at the time of acquisition is greater than $5 million for infrastructure assets and $1 million for other assets.
Assets deemed to be at fair value
For those classes of non-current assets where an independent revaluation has not been undertaken, as the criteria within APF III Asset Accounting Framework have not been met, these classes of non-current assets are deemed to be at fair value.
Heritage assets
In accordance with APF III Asset Accounting Framework, heritage assets are recognised in the Balance Sheet as part of the aggregate value of the classes of the assets to which they belong. Certain heritage assets and works of art that are unique due to their historical or cultural interest are not depreciated due to their long and indeterminate useful lives. Heritage assets that provide a functional service are recorded at depreciable fair value.
Land
Land comprising National, Conservation and Recreation Parks and Wilderness Protection Areas and Reserves generally have restrictions on use imposed by statute or regulation. These restrictions have been taken into account by the independent valuers.
The Department is custodian of unallotted Crown land, by virtue of its responsibilities under the Crown Lands Act 1929. This land is considered to be an administered asset. Unallotted Crown land is not included in the Administered Items activities as the Department has not been able to formulate a suitable methodology for determining a reliable measure of the value of these holdings. In addition, limitations exist on the reliability of the base information used to determine the valuation of property, plant and equipment actually included in Crown Lands.
(o) Revaluation of non current assets
All non-current tangible assets are valued at written down current cost (a proxy for fair value). Revaluation of non-current assets or group of assets is only performed when its fair value at the time of acquisition is greater than $1 million and estimated useful life is greater than 3 years.
The Department revalues its land, buildings and leasehold improvements on at least a three year rolling basis. However, if at any time management considers that the carrying amount of an asset materially differs from its fair value, then the asset will be revalued regardless of when the last valuation took place. Non-current tangible assets that are acquired between revaluations are held at cost until the next valuation, when they are revalued to fair value.
Property, plant and equipment assets are assessed on an annual basis to determine whether they should be classified as generic assets or unique assets.
Generic building, infrastructure and road assets are valued using a data dictionary approach. Plant and equipment and moveable vehicle assets were also valued using a data dictionary approach for the first time as at 30 June 2008. The data dictionary model is contained within the Department’s ARAMIS system. The data dictionary model calculates a value for an asset based on description, grade / composition, condition and size / quantity. For buildings, infrastructure and roads, the model value is adjusted by a locality factor to take into account climatic conditions. The valuation model itself is reviewed every three years.
Unique assets are items which cannot be categorised within standard data dictionary groups. Assets that are deemed to be unique are externally valued by independent professional valuers. The valuers used by the Department are as follows:
- Data dictionary (Buildings, Infrastructure and Roads)
June 2006, Valcorp Australia Pty Ltd, Mr A.J. Lucas, MBA, BAppSc(Val), DipAcc, AAPI and Mr F. Taormina, BAppSc(Val), AAPI
- Data dictionary (Plant and equipment, and Moveable Vehicles)
June 2008, Valcorp Australia Pty Ltd, Mr A.J. Lucas, MBA, BAppSc(Val), DipAcc, AAPI and Mr F. Taormina, BAppSc(Val), AAPI
- Unique items
June 2008, Valcorp Australia Pty Ltd, Mr A.J. Lucas, MBA, BAppSc(Val), DipAcc, AAPI
- Land and buildings
June 2008, Valcorp Australia Pty Ltd, Mr F. Taormina, BAppSc(Val), AAPI
The fair value of unique items was determined by identifying a market buying price, estimated as written down modern equivalent replacement cost. The fair value of land and buildings was based on recent market transactions for similar land and buildings in the area taking into account zoning and restricted use.
Any revaluation increment is credited to the asset revaluation reserve, except to the extent that it reverses a revaluation decrease of the same asset class previously recognised in the Income Statement, in which case the increase is recognised in the Income Statement.
Any revaluation decrease is recognised in the Income Statement, except to the extent that it offsets a previous revaluation increase for the same asset class, in which case the decrease is debited directly to the asset revaluation reserve to the extent of the credit balance existing in revaluations reserve for that asset class.
Any accumulated depreciation, as at the revaluation date, is restated proportionately with the change in the gross carrying amount of the asset so that the carrying amount of the asset after revaluation equals its revalued amount.
Upon disposal or derecognition, any revaluation reserve relating to that asset is transferred to retained earnings.

75
(p) impairment
All non-current tangible and intangible assets are tested for indication of impairment at each reporting date. Where there is an indication of impairment, the recoverable amount is estimated. An amount by which the asset’s carrying amount exceeds the recoverable amount is recorded as an impairment loss.
For revalued assets, an impairment loss is offset against the asset revaluation reserve.
(q) non-current assets (or disposal groups) held for sale
Non-current assets classified as held for sale are stated at the lower of their carrying amount and fair value less costs to sell, if their carrying amount will be recovered principally through a sale transaction rather than through continuing use. This condition is regarded as met only when the sale is highly probable and the asset’s sale is expected to be completed one year from the date of classification.
Non-current assets classified as held for sale and the assets of a disposal group classified as held for sale are presented separately from the other assets in the balance sheet.
(r) depreciation and amortisation of non-current assets
All non-current assets, having a limited useful life, are systematically depreciated/amortised over their useful lives in a manner that reflects the consumption of their service potential. Amortisation is used in relation to intangible assets such as computer software, while depreciation is applied to tangible assets such as property, plant and equipment.
Assets’ residual values, useful lives and amortisation methods are reviewed and adjusted if appropriate, on an annual basis.
Changes in the expected useful life or the expected pattern of consumption of future economic benefits embodied in the asset are accounted for prospectively by changing the time period or method, as appropriate, which is a change in accounting estimate.
The value of leasehold improvements is amortised over the estimated useful life of each improvement, or the unexpired period of the relevant lease, whichever is shorter.
Land and assets held for sale are not depreciated.
Depreciation/amortisation is calculated on a straight line basis over the estimated useful life of the following classes of assets as follows:
class of asset Useful Life
Property,plantandequipment:
Buildings and improvements
1-70 years
Computing equipment 3-10 years
Furniture and fittings 3-20 years
Moveable vehicles 2-20 years
Park infrastructure 1-76 years
Plant and equipment 1-50 years
Roads, tracks and trails 1-50 years
Other 1-60 years
Intangible assets:
Computer software 3-10 years
Other (War services leases) 45 years
(s) intangible assets
An intangible asset is an identifiable non-monetary asset without physical substance. Intangible assets are measured at cost. Following initial recognition, intangible assets are carried at cost less any accumulated amortisation and any accumulated impairment losses.
The useful lives of intangible assets are assessed to be either finite or indefinite. The Department only has intangible assets with finite lives. The amortisation period and the amortisation method for intangible assets is reviewed on an annual basis. For the War Services leases the rate of amortisation has been determined after reference to both the unexpired period of the leases and the rate of extinguishment of the leases.
The acquisition of or internal development of software is capitalised only when the expenditure meets the definition criteria (identifiability, control and the existence of future economic benefits) and recognition criteria (probability of future economic benefits and cost can be reliably measured) and when the amount of expenditure is greater than or equal to $5000.
All research and development costs that do not meet the capitalisation criteria outlined in AASB 138 are expensed.
(t) payables
Payables include creditors, accrued expenses and employment on-costs.
Creditors represent the amounts owing for goods and services received prior to the end of the reporting period that are unpaid at the end of the reporting period. Creditors include all unpaid invoices received relating to the normal operations of the Department.
Accrued expenses represent goods and services provided by other parties during the period that are unpaid at the end of the reporting period and where an invoice has not been received.
All payables are measured at their nominal amount and are normally settled within 30 days from the date of the invoice or the date the invoice is first received.
Employment on-costs include superannuation contributions and payroll tax with respect to outstanding liabilities for salaries and wages, long service leave and annual leave.
The Department makes contributions to several state government and externally managed superannuation schemes. These contributions are treated as an expense when they occur. There is no liability for payments to beneficiaries as they have been assumed by the respective superannuation schemes. The only liability outstanding at balance date relates to any contributions due but not yet paid to the South Australian Superannuation Board.
76
(u) employee benefits
These benefits accrue for employees as a result of services provided up to the reporting date that remain unpaid. Long-term employee benefits are measured at present value and short-term employee benefits are measured at nominal amounts.
Wages,salaries,annualleaveandsickleave
Liabilities for salaries and wages are measured as the amount unpaid at the reporting date at remuneration rates current at reporting date.
The annual leave liability is expected to be payable within 12 months and is measured at the undiscounted amount expected to be paid. In the unusual event where salary and wages and annual leave are payable later than 12 months, the liability will be measured at present value.
No provision has been made for sick leave as all sick leave is non-vesting and the average sick leave taken in future years by employees is estimated to be less than the annual entitlement of sick leave.
Long service leave
The liability for long service leave is recognised after an employee has completed 6.5 years of service. An actuarial assessment of long service leave undertaken by the Department of Treasury and Finance based on a significant sample of employees throughout the South Australian public sector determined that the liability measured using the short hand method was not materially different from the liability measured using the present value of expected future payments. This calculation is consistent with the Department’s experience of employee retention and leave taken.
Employee benefit on-costs
Employee benefit on-costs (payroll tax, workcover and superannuation) are recognised separately under payables.
Provisions
Provisions are recognised when the Department has a present obligation as a result of a past event, it is probable that an outflow of resources embodying economic benefits will be required to settle the obligation and a reliable estimate can be made of the amount of the obligation.
When the Department expects some or all of a provision to be reimbursed, the reimbursement is recognised as a separate asset but only when the reimbursement is virtually certain. The expense relating to any provision is presented in the Income Statement net of any reimbursement.
Provisions are measured at the present value of management’s best estimate of the expenditure required to settle the present obligation at the balance sheet date. If the effect of the time value of money is material, provisions are discounted for the time value of money and the risks specific to the liability.
(v) interest bearing liabilities
Borrowings consisted of an unsecured loan advanced by Department of Treasury and Finance. Interest was incurred at a rate determined by the Treasurer with interest paid quarterly in arrears. The loan was fully repaid in July 2007. All borrowing costs have been recognised as an expense.
(w) financial guarantees
The Department has reviewed its financial guarantees and determined that there is no material liability to be recognised for financial guarantee contracts as at 30 June 2008 (there was no material liability recognised for financial guarantee contracts in 2007).
Whilst no liability has been recognised for financial guarantee contracts, further note disclosures relating to financial guarantees are contained at Note 36 Contingent Liabilities.
(x) Leases
The determination of whether an arrangement is or contains a lease is based on the substance of the arrangement. The Department has assessed whether the fulfilment of the arrangement is dependent on the use of a specific asset or assets and the arrangement conveys a right to use an asset. The Department has entered into one or more operating leases.
Operating Leases
Operating lease payments are recognised as an expense in the Income Statement on a straight-line basis over the lease term. The straight-line basis is representative of the pattern of benefits derived from the leased assets.
Lease Incentive
The Department entered into an operating lease for accommodation whereby it received an incentive, in the form of a rent free period. A liability has been recognised to reflect the deferred benefits received under the lease incentive arrangement and is systematically reduced by the allocation of lease rental payments between rental expense and reduction of the lease incentive liability.
(y) Unrecognised contractual commitments and contingent assets and liabilities
Commitments include those operating, capital and outsourcing commitments arising from contractual or statutory sources and are disclosed at their nominal value.
Contingent assets and contingent liabilities are not recognised in the Balance Sheet, but are disclosed by way of a note and, if quantifiable, are measured at nominal value.
Unrecognised contractual commitments and contingencies are disclosed net of the amount of GST recoverable from, or payable to the Australian Taxation Office. If GST is not payable to, or recoverable from the Australian Taxation Office, the commitments and contingencies are disclosed on a gross basis.
77
3 changes in accounting policiesAustralian accounting standards and interpretations that have recently been issued or amended but are not yet effective, have not been adopted by the Department for the reporting period ending 30 June 2008. The Department has assessed the impact of the new and amended standards and interpretations and considers there will be no impact on the accounting policies for the financial report of the Department.
4 programs of the departmentIn achieving its objectives, the Department provides a range of services classified into the following programs:
Program 1: Nature Conservation
Protecting, maintaining, improving and restoring ecosystems, habitats, species and populations by developing nature conservation policies and programs with industries, government and communities and by undertaking and supporting research, surveys and monitoring of South Australia’s biodiversity.
Program 2: Public Land Management - Visitor Management
Promoting public enjoyment and the conservation of the state’s natural and cultural heritage through the provision of sustainable opportunities for environmentally sensitive, economically viable and socially responsible visitor experiences.
Program 3: Public Land Management - Fire Management
Managing fire to reduce the risk to life and property, and conserve our natural and cultural heritage on lands managed by DEH.
Program 4: Public Land Management - Stewardship
Ensuring that public lands and protected areas are managed effectively.
Program 5: Coast and Marine Conservation
Ensuring the conservation, protection and ongoing sustainable productivity of South Australia’s coastal, estuarine and marine environments.
Program 6: Botanic Gardens Management
Managing the natural and cultural resources of the Botanic Gardens and State Herbarium to advance plant conservation and sustainable horticulture practices, and to enrich society.
Program 7: Heritage Conservation
Ensuring that the state’s built and maritime heritage and heritage objects are identified, protected, conserved, maintained and celebrated.
Program 8: Animal Welfare
Ensuring animals are treated humanely and that companion animals are managed appropriately.
Program 9: Agency Support Services
The provision of business support services to the various operational units within the Department for Environment and Heritage, the Environment Protection Authority, Zero Waste SA and other related boards and committees. These services include the provision and management of information to support the state’s environmental needs, human resource management, payroll, financial management, IT infrastructure, IT Helpdesk support, facilities management, project management, asset management, administrative support, business planning, governance, government business, executive support, public affairs, procurement and environmental policy advice.
The Program Schedule of expenses and income presents information regarding the Department’s programs for the years ended 30 June 2008 and 30 June 2007.

78
Program 1: Nature
Conservation
Program 2: Public Land
- Visitor Management
Program 3: Public Land - Fire
Management
Program 4: Public Land - Stewardship
2008 2007 2008 2007 2008 2007 2008 2007
$’000 $’000 $’000 $’000 $’000 $’000 $’000 $’000
expenses
Employee benefits costs 15 637 14 610 11 504 10 619 6 225 5 165 8 187 9 032
Supplies and services 10 608 9 274 9 639 9 099 2 250 2 250 2 871 3 368
Grants and contributions 1 080 1 221 6 61 34 37 1 133 201
Depreciation and amortisation 10 431 11 488 10 431 11 488 120 60 297 284
Finance costs - - - - - - - -
Net loss from disposal of non-current assets - - - - - - - -
Other expenses 89 45 846 359 9 2 1 2
Total: Expenses 37 845 36 638 32 426 31 626 8 638 7 514 12 489 12 887
income
Fees and charges 1 034 1 103 8 435 8 204 1 176 1 199 3 145 3 113
Grants and contributions 8 663 8 430 166 106 65 363 667 1 027
Interest 33 32 136 121 - - 12 16
Assets received free of charge - - - - - - - -
Net gain from disposal of non-current assets held for sale - - - - - - - -
Other revenue 38 17 4 053 816 990 94 62 132
Total: Income 9 768 9 582 12 790 9 247 2 231 1 656 3 886 4 288
net cost of providing services 28 077 27 056 19 636 22 379 6 407 5 858 8 603 8 599
Revenuesfrom/(paymentsto)SAGovernment
Revenues from SA Government - - - - - - - -
Payments to SA Government - - - - - - - -
Total: Net revenues from SA Government - - - - - - - -
net result (28 077) (27 056) (19 636) (22 379) (6 407) (5 858) (8 603) (8 599)
depaRtment fOR enViROnment and HeRitaGe pROGRam scHedULe Of eXpenses and incOme
fOR tHe yeaR ended 30 JUne 2008

79
Program 5:
Coast & Marine
Program 6: Botanic Gardens
Management
Program 7: Heritage
Conservation
Program 8: Animal Welfare
Program 9: Agency Support tOtaL
2008 2007 2008 2007 2008 2007 2008 2007 2008 2007 2008 2007
$’000 $’000 $’000 $’000 $’000 $’000 $’000 $’000 $’000 $’000 $’000 $’000
5 053 4 189 3 828 3 529 1 691 1 563 181 156 27 285 28 224 79 591 77 087
5 076 6 575 2 189 2 075 1 240 916 26 36 19 247 17 591 53 146 51 184
433 188 82 78 684 703 580 501 226 187 4 258 3 177
253 212 131 153 167 49 39 42 979 975 22 848 24 751
- - - - - - - - 22 2 723 22 2 723
- - - - - - - - 5 089 1 044 5 089 1 044
- - 449 145 114 (22) - - 257 262 1 765 793
10 815 11 164 6 679 5 980 3 896 3 209 826 735 53 105 51 006 166 719 160 759
12 - 1 2 812 876 3 4 2 412 2 284 17 030 16 785
949 553 2 231 1 499 63 62 - - 2 546 2 368 15 350 14 408
- - - - - - - - 7 4 188 173
- - - - - - - - 32 775 32 775
- - - - - - - - 52 - 52 -
15 85 31 25 24 2 - - 489 430 5 702 1 601
976 638 2 263 1 526 899 940 3 4 5 538 5 861 38 354 33 742
9 839 10 526 4 416 4 454 2 997 2 269 823 731 47 567 45 145 128 365 127 017
- - - - - 250 - - 129 505 125 139 129 505 125 389
- - - - - - - - (24 900) (3 979) (24 900) (3 979)
- - - - - 250 - - 104 605 121 160 104 605 121 410
(9 839) (10 526) (4 416) (4 454) (2 997) (2 019) (823) (731) 57 038 76 015 (23 760) (5 607)
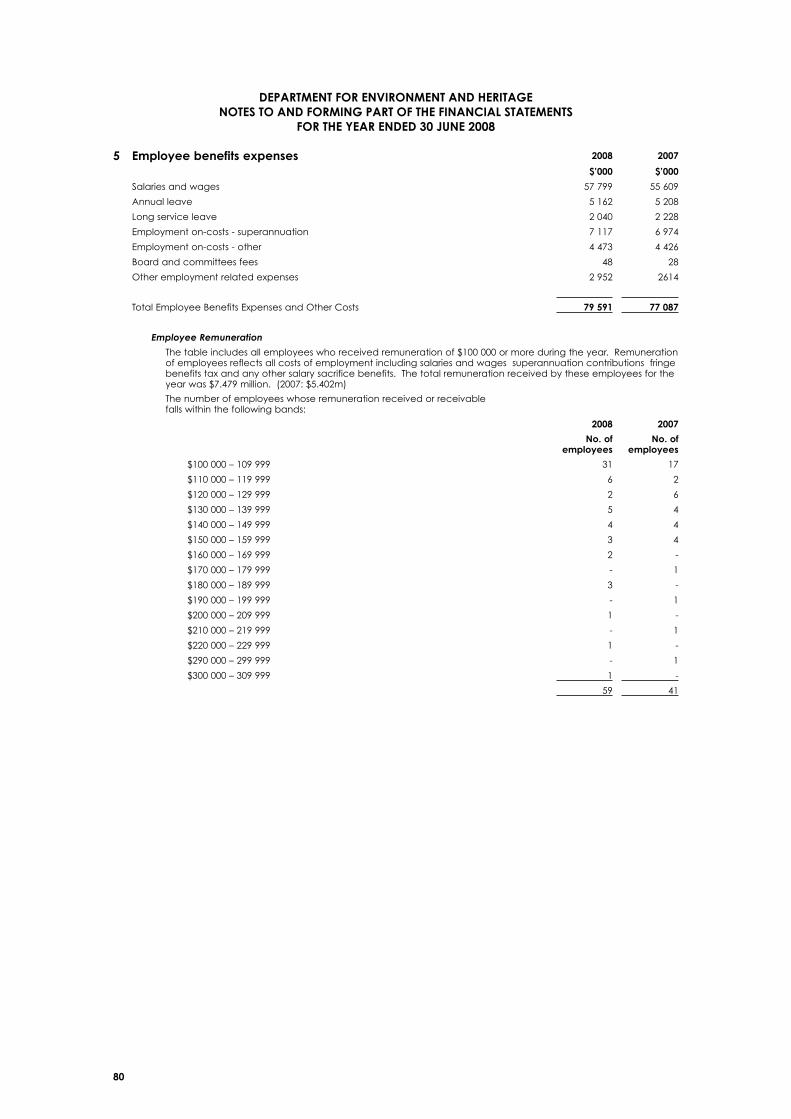
80
5 employee benefits expenses 2008 2007
$’000 $’000
Salaries and wages 57 799 55 609
Annual leave 5 162 5 208
Long service leave 2 040 2 228
Employment on-costs - superannuation 7 117 6 974
Employment on-costs - other 4 473 4 426
Board and committees fees 48 28
Other employment related expenses 2 952 2614
Total Employee Benefits Expenses and Other Costs 79 591 77 087
Employee Remuneration
The table includes all employees who received remuneration of $100 000 or more during the year. Remuneration of employees reflects all costs of employment including salaries and wages superannuation contributions fringe benefits tax and any other salary sacrifice benefits. The total remuneration received by these employees for the year was $7.479 million. (2007: $5.402m)
The number of employees whose remuneration received or receivable falls within the following bands:
2008 2007
no. of employees
no. of employees
$100 000 – 109 999 31 17
$110 000 – 119 999 6 2
$120 000 – 129 999 2 6
$130 000 – 139 999 5 4
$140 000 – 149 999 4 4
$150 000 – 159 999 3 4
$160 000 – 169 999 2 -
$170 000 – 179 999 - 1
$180 000 – 189 999 3 -
$190 000 – 199 999 - 1
$200 000 – 209 999 1 -
$210 000 – 219 999 - 1
$220 000 – 229 999 1 -
$290 000 – 299 999 - 1
$300 000 – 309 999 1 -
59 41
depaRtment fOR enViROnment and HeRitaGe nOtes tO and fORminG paRt Of tHe financiaL statements
fOR tHe yeaR ended 30 JUne 2008
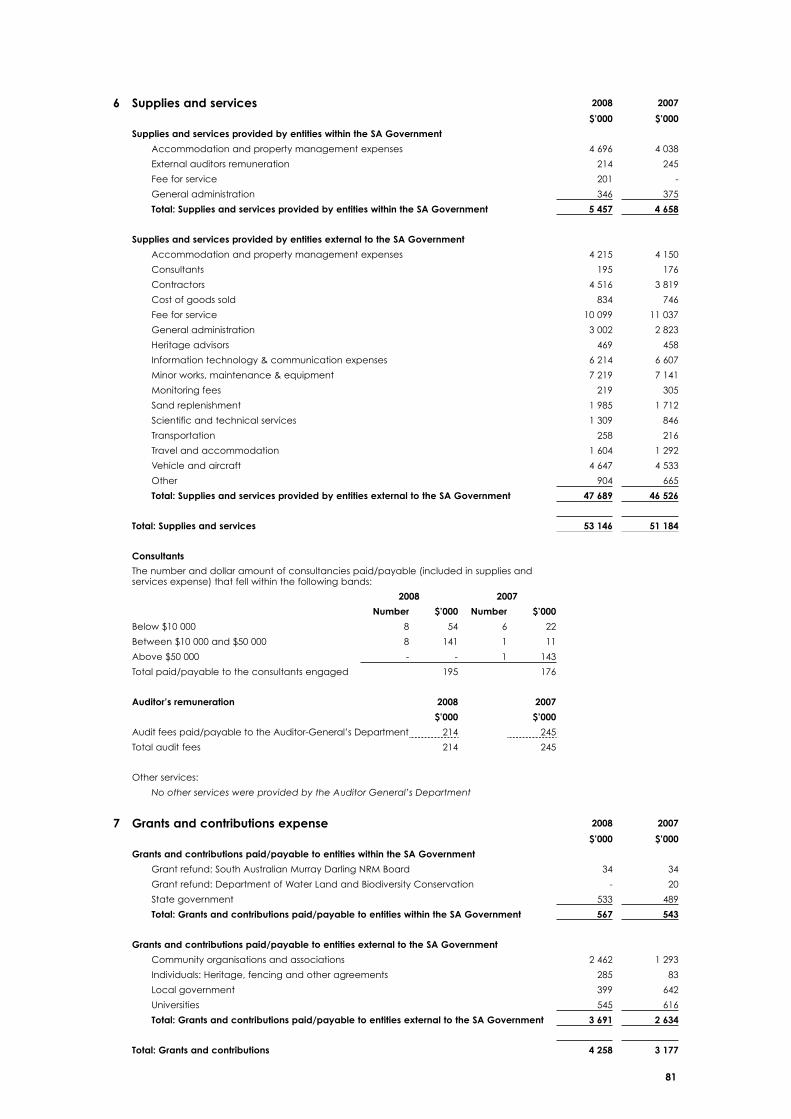
81
6 supplies and services 2008 2007
$’000 $’000
supplies and services provided by entities within the sa Government
Accommodation and property management expenses 4 696 4 038
External auditors remuneration 214 245
Fee for service 201 -
General administration 346 375
total: supplies and services provided by entities within the sa Government 5 457 4 658
supplies and services provided by entities external to the sa Government
Accommodation and property management expenses 4 215 4 150
Consultants 195 176
Contractors 4 516 3 819
Cost of goods sold 834 746
Fee for service 10 099 11 037
General administration 3 002 2 823
Heritage advisors 469 458
Information technology & communication expenses 6 214 6 607
Minor works, maintenance & equipment 7 219 7 141
Monitoring fees 219 305
Sand replenishment 1 985 1 712
Scientific and technical services 1 309 846
Transportation 258 216
Travel and accommodation 1 604 1 292
Vehicle and aircraft 4 647 4 533
Other 904 665
total: supplies and services provided by entities external to the sa Government 47 689 46 526
total: supplies and services 53 146 51 184
consultants
The number and dollar amount of consultancies paid/payable (included in supplies and services expense) that fell within the following bands:
2008 2007
number $’000 number $’000
Below $10 000 8 54 6 22
Between $10 000 and $50 000 8 141 1 11
Above $50 000 - - 1 143
Total paid/payable to the consultants engaged 195 176
auditor’s remuneration 2008 2007
$’000 $’000
Audit fees paid/payable to the Auditor-General’s Department 214 245
Total audit fees 214 245
Other services:
No other services were provided by the Auditor General’s Department
7 Grants and contributions expense 2008 2007
$’000 $’000
Grantsandcontributionspaid/payabletoentitieswithintheSAGovernment
Grant refund: South Australian Murray Darling NRM Board 34 34
Grant refund: Department of Water Land and Biodiversity Conservation - 20
State government 533 489
Total:Grantsandcontributionspaid/payabletoentitieswithintheSAGovernment 567 543
Grantsandcontributionspaid/payabletoentitiesexternaltotheSAGovernment
Community organisations and associations 2 462 1 293
Individuals: Heritage, fencing and other agreements 285 83
Local government 399 642
Universities 545 616
Total:Grantsandcontributionspaid/payabletoentitiesexternaltotheSAGovernment 3 691 2 634
total: Grants and contributions 4 258 3 177

82
8 depreciation and amortisation 2008 2007
$’000 $’000
depreciation
Buildings and improvements 4 166 3 219
Computing equipment 566 578
Furniture and fittings 293 283
Moveable vehicles 696 631
Park infrastructure 6 894 7 143
Roads, tracks and trails 8 962 11 824
Plant and equipment 713 533
Other 54 26
total: depreciation 22 344 24 237
amortisation
Application software 482 483
Other - War services leases 22 31
total: amortisation 504 514
total: depreciation and amortisation 22 848 24 751
Errorcorrectionduetoreinterpretationofnetworkassetdefinition
In 2007-08 the Department performed a review of network assets valued less than $5000 to determine whether they hadbeentreatedinaccordancewithAccountingPolicyFrameworkIII.Thepurposeofthereviewwastoidentifynetwork assets which: • had fundamentally different characteristics to the network assets to which they were attached; and • whengroupedtogetherdidnothaveavaluewhichrepresentedasignificantpercentageoftheDepartment’s totalassets. Thereviewidentifiedthosecapitalisednetworkassetswhichmetthesecriteria.Asaresulttheseassetswereexpensed. InaccordancewithAASB108,theresultingadjustmenthasbeenappliedretrospectively.TheeffectoftheadjustmentonequityhasbeendisclosedinNote32.
The effect of the change is a reduction in the 2006-07 depreciation expense as follows:
2007
$’000
Buildings and Improvements 2
Park Infrastructure 417
Roads, Tracks and Trails 5
Plant and Equipment 3
Other 2
429
changes in estimated useful lives
During2007-08,theDepartmentprofessionallyrevaluedanumberofassets.Theprofessionalvaluationsindicatedthatrevisionswerenecessarytotheusefullivesofcertainassets.Theimpactoftheseusefulliferevisionsoncurrentand future years’ depreciation expense is as follows:
$’000
Buildings and Improvements (347)
Park Infrastructure 225
Roads, Tracks and Trails (15)
Other (2)
(139)
9 finance costs 2008 2007
$’000 $’000
Borrowingcostspaid/payabletoentitieswithintheSAGovernment
Interest on borrowings 22 2 723
Total:Borrowingcostspaid/payabletoentitieswithintheSAGovernment 22 2 723
total: borrowing costs 22 2 723

83
10 Netgain/(loss)fromdisposalofnon-currentassets 2008 2007
$’000 $’000
Land
Proceeds from disposal - -
Less: Net book value of assets disposed (32) -
Netgain/(loss)fromdisposal (32) -
buildings
Proceeds from disposal - -
Less: Net book value of assets disposed (3 532) (256)
Netgain/(loss)fromdisposal (3 532) (256)
Parkinfrastructure
Proceeds from disposal - 4
Less: Net book value of assets disposed (1 310) (677)
Netgain/(loss)fromdisposal (1 310) (673)
Roadstracksandtrails
Proceeds from disposal - -
Less: Net book value of assets disposed (148) (43)
Netgain/(loss)fromdisposal (148) (43)
moveable vehicles
Proceeds from disposal 208 71
Less: Net book value of assets disposed (138) (27)
Netgain/(loss)fromdisposal 70 44
computing equipment
Proceeds from disposal - -
Less: Net book value of assets disposed (9) (8)
Netgain/(loss)fromdisposal (9) (8)
furniture and fittings
Proceeds from disposal - 3
Less: Net book value of assets disposed (16) (56)
Netgain/(loss)fromdisposal (16) (53)
plant and equipment
Proceeds from disposal - 8
Less: Net book value of assets disposed (112) (33)
Netgain/(loss)fromdisposal (112) (25)
Other assets
Proceeds from disposal - -
Less: Net book value of assets disposed - (30)
Netgain/(loss)fromdisposal - (30)
total: assets
Proceeds from disposal 208 86
Less: Net book value of assets disposed (5 297) (1 130)
Total:Netgain/(loss)fromdisposal (5 089) (1 044)
assets transferred free of charge
The figures above include assets relating to the Amazon Waterlily Pavilion transferred free of charge to the Board oftheBotanicGardensandStateHerbarium,asfollows:
2008
$’000
Buildings and Improvements 3 500
Park Infrastructure 731
Roads, Tracks and Trails 33
Plant and Equipment 15
4 279
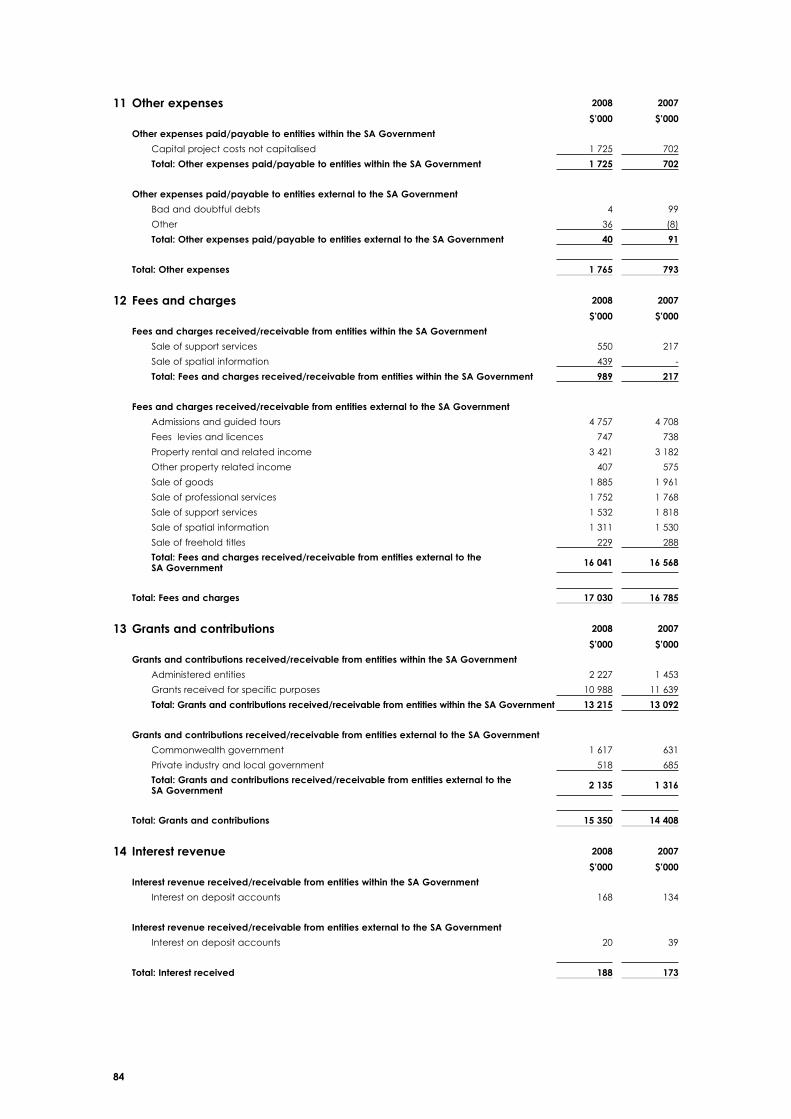
84
11 Other expenses 2008 2007
$’000 $’000
Otherexpensespaid/payabletoentitieswithintheSAGovernment
Capital project costs not capitalised 1 725 702
Total:Otherexpensespaid/payabletoentitieswithintheSAGovernment 1 725 702
Otherexpensespaid/payabletoentitiesexternaltotheSAGovernment
Bad and doubtful debts 4 99
Other 36 (8)
Total:Otherexpensespaid/payabletoentitiesexternaltotheSAGovernment 40 91
total: Other expenses 1 765 793
12 fees and charges 2008 2007
$’000 $’000
Feesandchargesreceived/receivablefromentitieswithintheSAGovernment
Sale of support services 550 217
Sale of spatial information 439 -
Total:Feesandchargesreceived/receivablefromentitieswithintheSAGovernment 989 217
Feesandchargesreceived/receivablefromentitiesexternaltotheSAGovernment
Admissions and guided tours 4 757 4 708
Fees levies and licences 747 738
Property rental and related income 3 421 3 182
Other property related income 407 575
Sale of goods 1 885 1 961
Sale of professional services 1 752 1 768
Sale of support services 1 532 1 818
Sale of spatial information 1 311 1 530
Sale of freehold titles 229 288
Total:Feesandchargesreceived/receivablefromentitiesexternaltothe sa Government 16 041 16 568
total: fees and charges 17 030 16 785
13 Grants and contributions 2008 2007
$’000 $’000
Grantsandcontributionsreceived/receivablefromentitieswithintheSAGovernment
Administered entities 2 227 1 453
Grants received for specific purposes 10 988 11 639
Total:Grantsandcontributionsreceived/receivablefromentitieswithintheSAGovernment 13 215 13 092
Grantsandcontributionsreceived/receivablefromentitiesexternaltotheSAGovernment
Commonwealth government 1 617 631
Private industry and local government 518 685
Total:Grantsandcontributionsreceived/receivablefromentitiesexternaltothe sa Government 2 135 1 316
total: Grants and contributions 15 350 14 408
14 interest revenue 2008 2007
$’000 $’000
Interestrevenuereceived/receivablefromentitieswithintheSAGovernment
Interest on deposit accounts 168 134
Interestrevenuereceived/receivablefromentitiesexternaltotheSAGovernment
Interest on deposit accounts 20 39
total: interest received 188 173

85
15 Resources received free of charge 2008 2007
$’000 $’000
Resources received free of charge from entities within the sa Government
Land and improvements - 775
- 775
Resources received free of charge from entities external to the sa Government
Land and improvements 32 -
32 -
total: Resources received free of charge 32 775
16 Netgain/(loss)fromdisposalofnon-currentassetsheldforsale 2008 2007
$’000 $’000
Land held for sale
Proceeds from disposal 53 -
Less: Net book value of assets disposed (1) -
Netgain/(loss)fromdisposal 52 -
17 Other income 2008 2007
$’000 $’000
Otherincomereceived/receivablefromentitieswithintheSAGovernment
Insurance recoveries 5 020 758
Insurance recoveries consist of monies received as a result of claims lodged with the State of South Australia’s governmentinsuranceserviceSAICORP.Severalsignificantclaimswerelodgedandsubsequentlysettledduring2008.InsuranceclaimsarerecognisedasincomewhenaclaimhasbeenlodgedwithSAICORP.
Otherincomereceived/receivablefromentitiesexternaltotheSAGovernment
Insurance recoveries - 116
Salaries and wages recoveries 383 355
Sponsorships donations commissions and bequests 32 24
Other sundry revenue 267 348
Total:Otherincomereceived/receivablefromentitiesexternaltotheSAGovernment 682 843
total: Other income 5 702 1 601
18 Revenuesfrom/(paymentsto)SAGovernment 2008 2007
$’000 $’000
Revenues from sa Government
Consolidated appropriation 129 445 124 219
Contingency funds 60 1 170
total sa Government Revenues 129 505 125 389
payments to sa Government
Return to consolidated account (18 800) -
Return of surplus cash (6 100) (3 979)
total sa Government payments (24 900) (3 979)
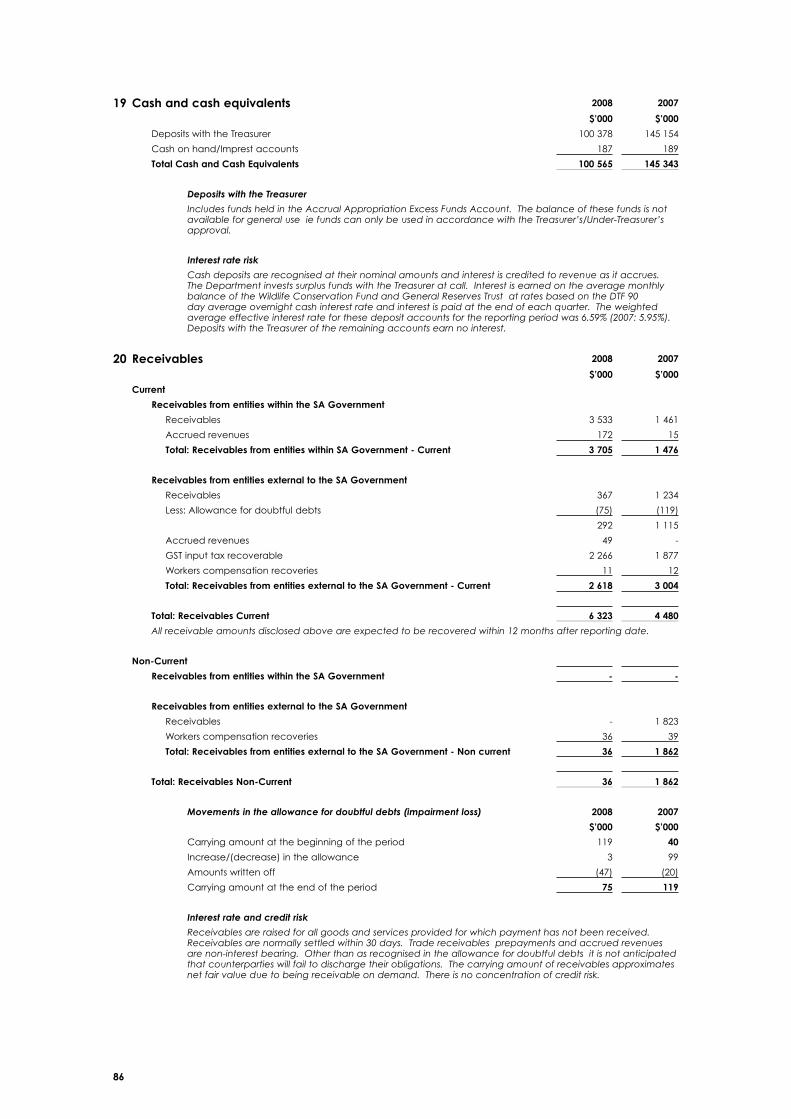
86
19 cash and cash equivalents 2008 2007
$’000 $’000
Deposits with the Treasurer 100 378 145 154
Cash on hand/Imprest accounts 187 189
total cash and cash equivalents 100 565 145 343
Deposits with the Treasurer
IncludesfundsheldintheAccrualAppropriationExcessFundsAccount.Thebalanceofthesefundsisnotavailable for general use ie funds can only be used in accordance with the Treasurer’s/Under-Treasurer’s approval.
Interest rate risk
Cashdepositsarerecognisedattheirnominalamountsandinterestiscreditedtorevenueasitaccrues.TheDepartmentinvestssurplusfundswiththeTreasureratcall.Interestisearnedontheaveragemonthlybalance of the Wildlife Conservation Fund and General Reserves Trust at rates based on the DTF 90 dayaverageovernightcashinterestrateandinterestispaidattheendofeachquarter.Theweightedaverageeffectiveinterestrateforthesedepositaccountsforthereportingperiodwas6.59%(2007:5.95%).DepositswiththeTreasureroftheremainingaccountsearnnointerest.
20 Receivables 2008 2007
$’000 $’000
current
Receivables from entities within the sa Government
Receivables 3 533 1 461
Accrued revenues 172 15
total: Receivables from entities within sa Government - current 3 705 1 476
Receivables from entities external to the sa Government
Receivables 367 1 234
Less: Allowance for doubtful debts (75) (119)
292 1 115
Accrued revenues 49 -
GST input tax recoverable 2 266 1 877
Workers compensation recoveries 11 12
total: Receivables from entities external to the sa Government - current 2 618 3 004
total: Receivables current 6 323 4 480
Allreceivableamountsdisclosedaboveareexpectedtoberecoveredwithin12monthsafterreportingdate.
non-current
Receivables from entities within the sa Government - -
Receivables from entities external to the sa Government
Receivables - 1 823
Workers compensation recoveries 36 39
total: Receivables from entities external to the sa Government - non current 36 1 862
total: Receivables non-current 36 1 862
Movements in the allowance for doubtful debts (impairment loss) 2008 2007
$’000 $’000
Carrying amount at the beginning of the period 119 40
Increase/(decrease) in the allowance 3 99
Amounts written off (47) (20)
Carrying amount at the end of the period 75 119
Interest rate and credit risk
Receivablesareraisedforallgoodsandservicesprovidedforwhichpaymenthasnotbeenreceived.Receivablesarenormallysettledwithin30days.Tradereceivablesprepaymentsandaccruedrevenuesarenon-interestbearing.Otherthanasrecognisedintheallowancefordoubtfuldebtsitisnotanticipatedthatcounterpartieswillfailtodischargetheirobligations.Thecarryingamountofreceivablesapproximatesnetfairvalueduetobeingreceivableondemand.Thereisnoconcentrationofcreditrisk.
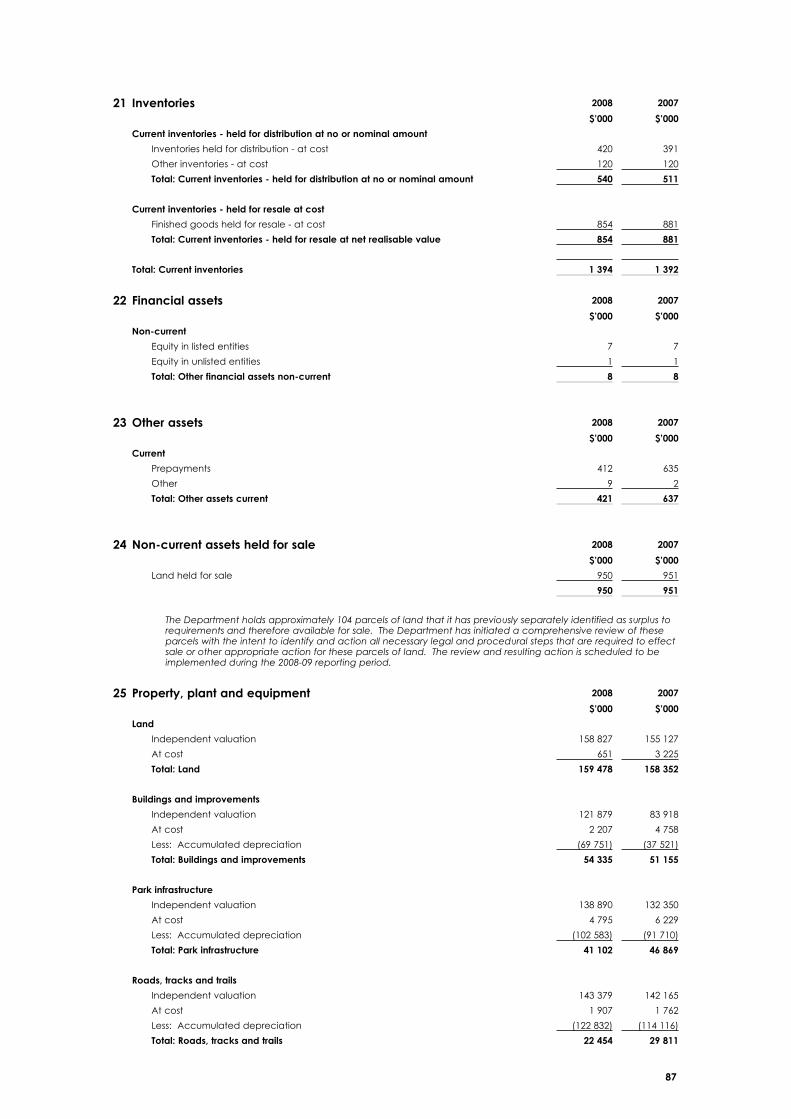
87
21 inventories 2008 2007
$’000 $’000
current inventories - held for distribution at no or nominal amount
Inventories held for distribution - at cost 420 391
Other inventories - at cost 120 120
total: current inventories - held for distribution at no or nominal amount 540 511
current inventories - held for resale at cost
Finished goods held for resale - at cost 854 881
total: current inventories - held for resale at net realisable value 854 881
total: current inventories 1 394 1 392
22 financial assets 2008 2007
$’000 $’000
non-current
Equity in listed entities 7 7
Equity in unlisted entities 1 1
total: Other financial assets non-current 8 8
23 Other assets 2008 2007
$’000 $’000
current
Prepayments 412 635
Other 9 2
total: Other assets current 421 637
24 non-current assets held for sale 2008 2007
$’000 $’000
Land held for sale 950 951
950 951
The Department holds approximately 104 parcels of land that it has previously separately identified as surplus to requirementsandthereforeavailableforsale.TheDepartmenthasinitiatedacomprehensivereviewoftheseparcels with the intent to identify and action all necessary legal and procedural steps that are required to effect saleorotherappropriateactionfortheseparcelsofland.Thereviewandresultingactionisscheduledtobeimplementedduringthe2008-09reportingperiod.
25 property, plant and equipment 2008 2007
$’000 $’000
Land
Independent valuation 158 827 155 127
At cost 651 3 225
total: Land 159 478 158 352
buildings and improvements
Independent valuation 121 879 83 918
At cost 2 207 4 758
Less: Accumulated depreciation (69 751) (37 521)
total: buildings and improvements 54 335 51 155
Parkinfrastructure
Independent valuation 138 890 132 350
At cost 4 795 6 229
Less: Accumulated depreciation (102 583) (91 710)
Total:Parkinfrastructure 41 102 46 869
Roads,tracksandtrails
Independent valuation 143 379 142 165
At cost 1 907 1 762
Less: Accumulated depreciation (122 832) (114 116)
Total:Roads,tracksandtrails 22 454 29 811

88
Capitalworksinprogress
Capital works in progress 8 111 9 931
Total:Capitalworksinprogress 8 111 9 931
moveable vehicles
Independent valuation 6 359 12
At cost (deemed fair value) 2 489 8 492
Less: Accumulated depreciation (4 857) (5 338)
total: moveable vehicles 3 991 3 166
computing equipment
At cost (deemed fair value) 4 572 4 777
Less: Accumulated depreciation (3 846) (3 804)
total: computing equipment 726 973
furniture and fittings
Independent valuation 71 71
At cost (deemed fair value) 5 353 7 730
Less: Accumulated depreciation (2 303) (5 594)
total: furniture and fittings 3 121 2 207
plant and equipment
Independent valuation 2 018 1 005
At cost (deemed fair value) 3 530 4 187
Less: Accumulated depreciation (3 496) (3 217)
total: plant and equipment 2 052 1 975
Other
Independent valuation 1 359 1 210
At cost (deemed fair value) 3 323 1 338
Less: Accumulated depreciation (227) (187)
total: Other 4 455 2 361
total: property plant and equipment 299 825 306 800
Carrying amounts of plant and equipment
Classes of property plant and equipment are valued as follows:
* At cost: Items exceeding $1m acquisition cost are held at cost pending revaluation that occurs within three yearsfromacquisitiondate.
* At cost (deemed fair value): All items have an acquisition cost of below $1m and are deemed held at fair value pursuant to Accounting Policy Framework III;
*Independent valuation: Generic assets are held at values determined by the Department’s Data Dictionary ValuationSystemandUniqueassetsareheldatvaluesdeterminedbyexternalindependentvaluers.RefertoNote2forfurtherdetails.
The independent professional valuation performed by Valcorp Pty Ltd as at 30 June 2008 included assets that: (i) had previously been revalued on a net basis rather than a gross basis (ii) had reverted from a professional valuation basis to a data dictionary valuation basis in prior years (iii) were previously valued at construction cost or(iv)weredueforrevaluationinpriorreportingperiods.
Assets included in category (i) were last revalued prior to 2005-06 when the Department changed from the ‘net’ methodofrevaluationtothe‘gross’method.Theseassetshavebeenrevaluedasat30June2008aspartoftheDepartment’srollingthreeyearvaluationcycle.Theadoptionofthegrossmethodfortheseassetshasresultedinsignificantincreasesintheirgrosscarryingamountandaccumulateddepreciation.
The Valcorp valuation which was based on inspection of individual assets also indicated that the total/remainingusefullivesderivedusingpreviousvaluationmethodologiesrequiredrevision.Hencefurthersignificantadjustmentstopriorperiodaccumulateddepreciationparticularlyforbuildingsandimprovementswerenecessary.TheadjustmentstopriorperiodaccumulateddepreciationhavenotbeenreflectedretrospectivelythroughthecomparativesinNote32Equity.Giventhenatureandtimingofthevaluationmethodologiesthathave been adopted for the revalued assets previously it is not feasible to quantify the precise amount by which accumulateddepreciationanddepreciationexpensehasbeenmisstatedforprioryears.
ThetotaladjustmentmadeasaresultoftheValcorpvaluationto“BuildingsandImprovementsatIndependentValuation”is$33.643m.AccumulatedDepreciationfor“BuildingsandImprovements”hasbeenadjustedby$27.596m.TheimpactofthechangestoestimatedusefullivesondepreciationexpenseincurrentandfutureyearsisdisclosedatNote8.

89
department for environment and Heritage
property, plant and equipment movement reconciliation 2007-08
Land Buildings Park Infra-
structure
Roads, Tracks &
Trails
Moveable Vehicles
Computing Equipment
Furniture & Fittings
P&E Other Capital WIP
Sub-total
$’000 $’000 $’000 $’000 $’000 $’000 $’000 $’000 $’000 $’000 $’000
Carrying amount at the beginning of the year 158 352 51 155 46 869 29 811 3 166 973 2 207 1 975 2 361 9 931 306 800
Transfers between classes - - (46) - - - - 46 - - -
Additions 328 - 6 - 300 328 - 522 2 013 10 790 14 287
Additions - Transfers to/(from) Capital WIP - 4 421 3 467 916 800 - 1 223 58 - (10 885) -
Depreciation expense - (4 166) (6 894) (8 962) (696) (566) (293) (713) (54) - (22 344)
Net revaluation increment/(decrement) 596 6 047 (2 051) (194) 381 - - (93) 135 - 4 821
Assets received for nil consideration 32 - - - - - - - - - 32
Asset - First time recognition 202 310 851 938 178 - - 380 - - 2 859
Disposals (32) (3 532) (1 310) (148) (138) (9) (16) (112) - - (5 297)
Aramis revisions upwards/(downwards) - 129 223 94 - - - - - - 446
Capital WIP - expensed in current period - - - - - - - - - (1 725) (1 725)
Other adjustments - (29) (13) (1) - - - (11) - - (54)
Carrying amount at the end of the period 159 478 54 335 41 102 22 454 3 991 726 3 121 2 052 4 455 8 111 299 825
department for environment and Heritage
Restated property, plant and equipment movement reconciliation 2006-07
Land Buildings Park Infra-
structure
Roads Tracks &
Trails
Moveable Vehicles
Computing Equipment
Furniture & Fittings
P&E Other Capital WIP
Sub-total
$’000 $’000 $’000 $’000 $’000 $’000 $’000 $’000 $’000 $’000 $’000
Carrying amount at the beginning of the year 156 527 57 830 52 970 40 102 3 347 811 1 888 1 745 2 374 5 125 322 719
Transfers between classes 548 - 19 - 186 118 - 38 (909) - -
Additions 737 - 27 9 291 630 - 133 744 8 915 11 486
Additions - Transfers to/(from) Capital WIP - 409 1 161 163 - - 658 626 208 (3 407) (182)
Depreciation expense - (3 219) (7 143) (11 824) (631) (578) (283) (533) (26) - (24 237)
Net revaluation increment/(decrement) - (4 010) 501 1 405 - - - (1) - - (2 105)
Assets received for nil consideration 540 235 - - - - - - - - 775
Asset - First time recognition - - - - - - - - - - -
Disposals - (256) (677) (43) (27) (8) (56) (33) (30) - (1 130)
Aramis revisions - upwards/(downwards) - 166 11 (1) - - - - - - 176
Capital WIP - expensed in current period - - - - - - - - - (702) (702)
Carrying amount at the end of the period 158 352 51 155 46 869 29 811 3 166 973 2 207 1 975 2 361 9 931 306 800
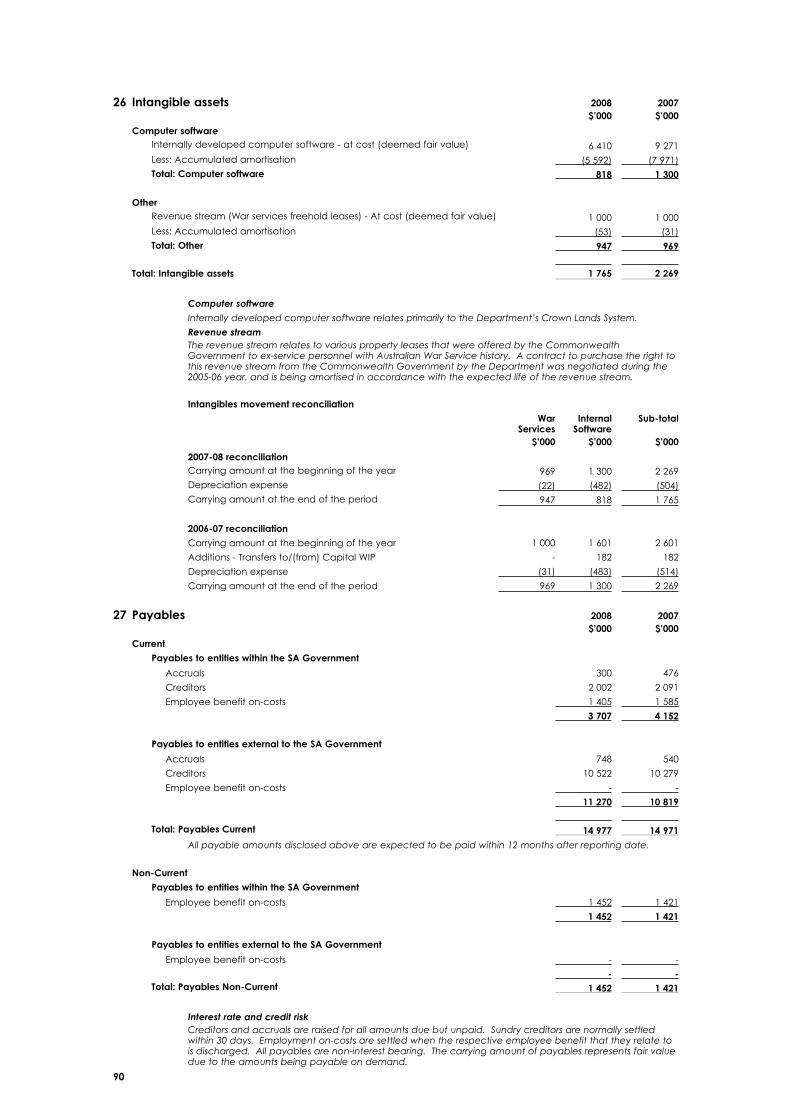
90
26 intangible assets 2008 2007$’000 $’000
computer softwareInternally developed computer software - at cost (deemed fair value) 6 410 9 271 Less: Accumulated amortisation (5 592) (7 971)total: computer software 818 1 300
OtherRevenue stream (War services freehold leases) - At cost (deemed fair value) 1 000 1 000 Less: Accumulated amortisation (53) (31)total: Other 947 969
total: intangible assets 1 765 2 269
Computer software
InternallydevelopedcomputersoftwarerelatesprimarilytotheDepartment’sCrownLandsSystem.
Revenue streamThe revenue stream relates to various property leases that were offered by the Commonwealth Governmenttoex-servicepersonnelwithAustralianWarServicehistory.Acontracttopurchasetherighttothis revenue stream from the Commonwealth Government by the Department was negotiated during the 2005-06year,andisbeingamortisedinaccordancewiththeexpectedlifeoftherevenuestream.
intangibles movement reconciliation
Warservices
internal software
sub-total
$’000 $’000 $’000
2007-08 reconciliationCarrying amount at the beginning of the year 969 1 300 2 269 Depreciation expense (22) (482) (504)Carrying amount at the end of the period 947 818 1 765
2006-07 reconciliation
Carrying amount at the beginning of the year 1 000 1 601 2 601
Additions - Transfers to/(from) Capital WIP - 182 182
Depreciation expense (31) (483) (514)
Carrying amount at the end of the period 969 1 300 2 269
27 payables 2008 2007$’000 $’000
current
payables to entities within the sa Government
Accruals 300 476
Creditors 2 002 2 091
Employee benefit on-costs 1 405 1 585
3 707 4 152
payables to entities external to the sa Government
Accruals 748 540
Creditors 10 522 10 279
Employee benefit on-costs - -
11 270 10 819
total: payables current 14 977 14 971
Allpayableamountsdisclosedaboveareexpectedtobepaidwithin12monthsafterreportingdate.
non-current
payables to entities within the sa Government
Employee benefit on-costs 1 452 1 421
1 452 1 421
payables to entities external to the sa Government
Employee benefit on-costs - -
- - total: payables non-current 1 452 1 421
Interest rate and credit riskCreditorsandaccrualsareraisedforallamountsduebutunpaid.Sundrycreditorsarenormallysettledwithin30days.Employmenton-costsaresettledwhentherespectiveemployeebenefitthattheyrelatetoisdischarged.Allpayablesarenon-interestbearing.Thecarryingamountofpayablesrepresentsfairvalueduetotheamountsbeingpayableondemand.
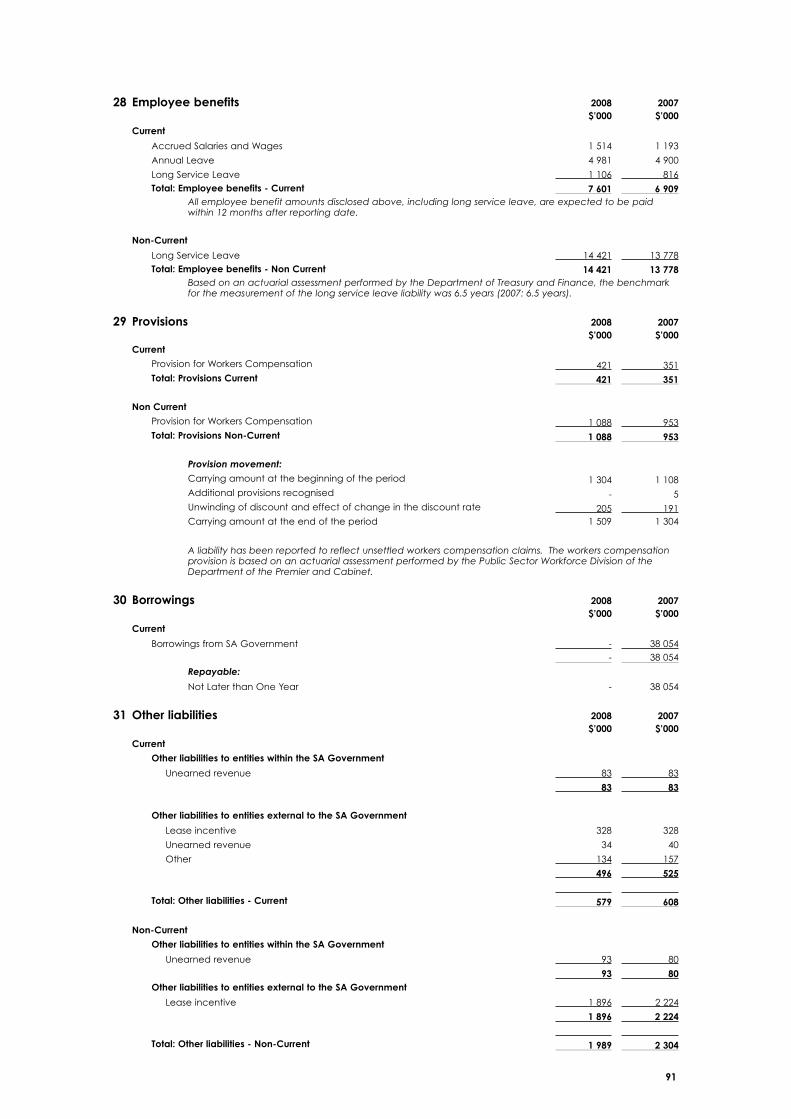
91
28 employee benefits 2008 2007$’000 $’000
current
Accrued Salaries and Wages 1 514 1 193
Annual Leave 4 981 4 900
Long Service Leave 1 106 816 total: employee benefits - current 7 601 6 909
Allemployeebenefitamountsdisclosedabove,includinglongserviceleave,areexpectedtobepaidwithin12monthsafterreportingdate.
non-current
Long Service Leave 14 421 13 778 total: employee benefits - non current 14 421 13 778
BasedonanactuarialassessmentperformedbytheDepartmentofTreasuryandFinance,thebenchmarkforthemeasurementofthelongserviceleaveliabilitywas6.5years(2007:6.5years).
29 provisions 2008 2007$’000 $’000
current
Provision for Workers Compensation 421 351 total: provisions current 421 351
non current
Provision for Workers Compensation 1 088 953 total: provisions non-current 1 088 953
Provision movement:
Carrying amount at the beginning of the period 1 304 1 108 Additional provisions recognised - 5 Unwinding of discount and effect of change in the discount rate 205 191 Carrying amount at the end of the period 1 509 1 304
Aliabilityhasbeenreportedtoreflectunsettledworkerscompensationclaims.Theworkerscompensationprovision is based on an actuarial assessment performed by the Public Sector Workforce Division of the DepartmentofthePremierandCabinet.
30 borrowings 2008 2007$’000 $’000
current
Borrowings from SA Government - 38 054 - 38 054
Repayable:
Not Later than One Year - 38 054
31 Other liabilities 2008 2007$’000 $’000
current
Other liabilities to entities within the sa Government
Unearned revenue 83 83
83 83
Other liabilities to entities external to the sa Government
Lease incentive 328 328
Unearned revenue 34 40
Other 134 157
496 525
total: Other liabilities - current 579 608
non-current
Other liabilities to entities within the sa Government
Unearned revenue 93 80
93 80 Other liabilities to entities external to the sa Government
Lease incentive 1 896 2 224
1 896 2 224
total: Other liabilities - non-current 1 989 2 304

92
32 equityEquity represents the residual interest in the net assets of the Department. The State Government holds the equity interest in the Department on behalf of the community. The asset revaluation reserve represents that portion of equity resulting from the revaluation of non-current assets.
asset Revaluation
Reserve
Retained earnings
total
$’000 $’000 $’000
balance at 1 July 2007 165 661 218 732 384 393
asset adjustments - first-time recognition of assets: (i)
Land - 202 202
Buildings and improvements - 310 310
Park infrastructure - 851 851
Roads,tracksandtrails - 938 938
Moveable Vehicles - 178 178
Plant and equipment - 380 380
Sub-total: First time recognition of assets errors - 2 859 2 859
Assetadjustments-ARAMISrevisionsupwards/downwards:(ii) 446 446
net result for the 2007-08 year - (23 760) (23 760)
Netincrement/(decrement)relatedtorevaluations:
Land (iii) 596 - 596
Buildings and Improvements (iii) 1 109 - 1 109
Buildings and Improvements (iv) 5 004 5 004
Buildings and Improvements (v) (66) (66)
Park Infrastructure (iii) (720) - (720)
Park Infrastructure (iv) (945) (945)
Park Infrastructure (v) (386) (386)
Roads,TracksandTrails(iii) (194) - (194)
Moveable Vehicles (iii) 381 - 381
Plant and Equipment (iii) (93) - (93)
Other (iii) (1) - (1)
Other (iv) 3 3
Other (v) 133 133
Sub-total: Net increment/(decrement) related to revaluations 4 821 - 4 821
balance at 30 June 2008 170 482 198 277 368 759
(i) first-time recognition of assets A review of fixed assets data during 2007-08 identified a number of first time recognition assets that were not recognised, in error, as part of stocktakes undertaken in prior reporting periods.
(ii) ARAMISrevisionsupwards/(downwards) ARAMIS revisions occur as a result of infrastructure stocktakes and park re-surveys that result in an assets description, grade/composition, condition or size/quantity being altered on the Data Dictionary System to correctly reflect the current attributes of the asset.
(iii) Revaluationofassetsduring2007-08-professionalvaluationprocessundertaken During 2007-08 the Department revalued items of property, plant and equipment due for revaluation in accordance with its three year revaluation cycle. Valuations used have been obtained from the Department’s Data Dictionary System and also from Valcorp, Certified Practising Valuers. Professional valuations have been arrived at via reference to arms length or market transactions for similar items of property, plant and equipment and take into account any zoning or other restrictions on use.
(iv) Revaluation of assets during 2007-08 - early valuation cycle During 2007-08 the Department elected, in accordance with Accounting Standards and the Department’s Revaluation Policy, to professionally revalue certain items of property, plant and equipment earlier than the normal three year valuation cycle. These items were previously held at valuations obtained via the Department’s Data Dictionary Valuation System.
(v) Revaluation of assets during 2007-08 - additional assets included for valuation in 2007-08 During 2007-08, the Department identified a small number of assets that were due for revaluation in the prior reporting period. These assets were included for professional revaluation in 2007-08 and the net revaluation increment/(decrement) related to these assets has been disclosed separately.
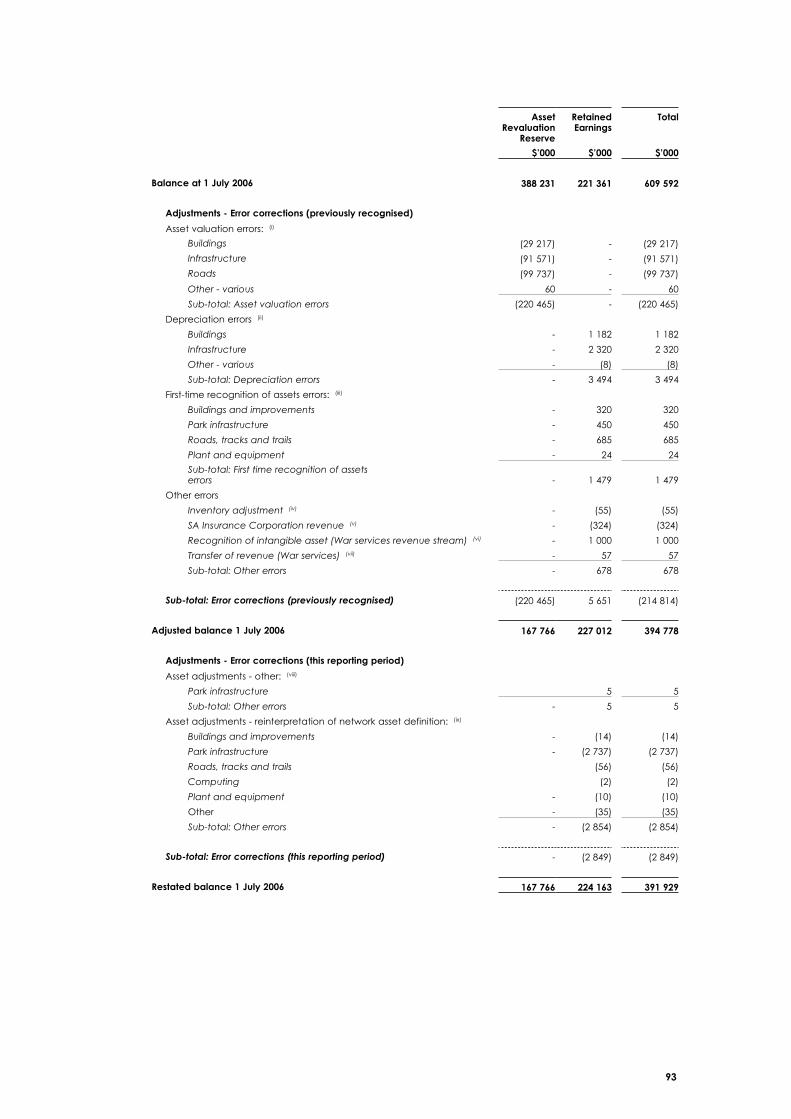
93
asset Revaluation
Reserve
Retained earnings
total
$’000 $’000 $’000
balance at 1 July 2006 388 231 221 361 609 592
adjustments - error corrections (previously recognised)
Asset valuation errors: (i)
Buildings (29 217) - (29 217)
Infrastructure (91 571) - (91 571)
Roads (99 737) - (99 737)
Other - various 60 - 60
Sub-total: Asset valuation errors (220 465) - (220 465)
Depreciation errors (ii)
Buildings - 1 182 1 182
Infrastructure - 2 320 2 320
Other - various - (8) (8)
Sub-total: Depreciation errors - 3 494 3 494
First-time recognition of assets errors: (iii)
Buildings and improvements - 320 320
Park infrastructure - 450 450
Roads,tracksandtrails - 685 685
Plant and equipment - 24 24
Sub-total: First time recognition of assets errors - 1 479 1 479
Other errors
Inventoryadjustment(iv) - (55) (55)
SA Insurance Corporation revenue (v) - (324) (324)
Recognition of intangible asset (War services revenue stream) (vi) - 1 000 1 000
Transfer of revenue (War services) (vii) - 57 57
Sub-total: Other errors - 678 678
Sub-total: Error corrections (previously recognised) (220 465) 5 651 (214 814)
adjusted balance 1 July 2006 167 766 227 012 394 778
adjustments - error corrections (this reporting period)
Asset adjustments - other: (viii)
Park infrastructure 5 5
Sub-total: Other errors - 5 5
Asset adjustments - reinterpretation of network asset definition: (ix)
Buildings and improvements - (14) (14)
Park infrastructure - (2 737) (2 737)
Roads,tracksandtrails (56) (56)
Computing (2) (2)
Plant and equipment - (10) (10)
Other - (35) (35)
Sub-total: Other errors - (2 854) (2 854)
Sub-total: Error corrections (this reporting period) - (2 849) (2 849)
Restated balance 1 July 2006 167 766 224 163 391 929

94
net result for the 2006-07 year:
Deficit per prior year financial statements - (6 005) (6 005)
Depreciation reduction - reinterpretation of network asset definition (ix) - 429 429
Depreciation increase - amortisation of war services leases (x) (31) (31)
Sub-total: Net result for the year per financial statements - (5 607) (5 607)
adjustments - error corrections (previously recognised)
Asset errors - ARAMIS revisions upwards/(downwards) - 176 176
Netincrement/(decrement)relatedtorevaluations: -
Buildings and improvements (4 010) - (4 010)
Park infrastructure 501 - 501
Roads,tracksandtrails 1 405 - 1 405
Plant and equipment (1) - (1)
Sub-total: Net increment/(decrement) related to revaluations (2 105) - (2 105)
balance at 30 June 2007 165 661 218 732 384 393
(i) Netincrement/(decrement)relatedtoassetvaluationerrors During the 2006-07 reporting period the Department undertook a comprehensive review of the fixed assets processes for recording, revaluing, reconciling and reporting in the statutory accounts. Through this process the errors in revaluation were attributed to the incorrect use of replacement cost rather than written down replacement cost and consequently the accumulated depreciation for all asset classes (excluding land) were incorrectly stated in the 2005-06 financial year.
(ii) Netincrement/(decrement)relatedtodepreciationerrors The 2006-07 review process also identified errors in depreciation expense in prior periods for a small number of assets.
(iii) first-time recognition of assets The review of fixed assets data during 2006-07 identified a number of first time recognition assets that were not recognised, in error, as part of stocktakes undertaken in prior reporting periods.
(iv) inventory adjustment During the 2005-06 reporting period, inventory holdings belonging to the Board of the Botanic Gardens and State Herbarium were incorrectly reported as part of the Department’s current assets. This error was adjusted in the 2006-07 reporting period.
(v) sa insurance corporation revenue Insurance revenue from SA Insurance Corporation was incorrectly raised as a receivable in a prior period.
(vi) Recognitionofintangibleasset(Warservicesrevenuestream) During 2005-06 reporting period, the War Services Leases reverted from the Commonwealth to the Department by way of a payment by the Department of $1m in two equal instalments spread over two financial years. The revenue stream relating to the leases was recognised as an intangible asset during the 2006-07 reporting period and capitalised retrospectively.
(vii) Transferofrevenue(WarServices) As a result of the War Services Leases being acquired by the Department, an amount of residual revenue originally payable to the Commonwealth was received by the Department. This was adjusted in the 2006-07 reporting period.
(viii) asset adjustments - other Other asset adjustments of a non-material amount and/or nature.
(ix) Reinterpretationofnetworkassetdefinition During the 2007-08 reporting period the Department performed a review of network assets valued less than $5000 to determine whether they had been treated in accordance with Accounting Policy Framework III. The purpose of the review was to identify network assets which: * had fundamentally different characteristics to the network assets to which they were attached; and * when grouped together, did not have a value which represented a significant percentage of the Department’s total assets. The review identified those capitalised network assets which met this criteria. As a result, these assets were expensed with the adjustment being applied retrospectively in accordance with AASB 108.
(x) Warservicesleasesamortisation The rate of amortisation of the War Services leases has been determined after reference to both the unexpired period of the leases and the rate of extinguishment of the leases. Amortisation commenced during the 2007-08 reporting period, with the amortisation being applied retrospectively in accordance with AASB 108.

95
33 cash flow reconciliation2008 2007
$’000 $’000
Reconciliation of cash and cash equivalents
Cash at year end as per:
Cash and cash equivalents disclosed in the Balance Sheet 100 565 145 343
Cash and cash equivalents disclosed in the Cash Flow Statement 100 565 145 343
Reconciliation of net cash provided by operating activities to net cost of providing services
net cash provided by operating activities 5 389 28 438
Add/(less):
Cash flows from government (129 505) (125 389)
Cash flows to government 24 900 3 979
Add/(less)non-cashitems:
Depreciation and amortisation (22 848) (24 751)
Assets received free of charge 32 775
Assets written-off (1 779) (702)
Net loss on sale of assets (5 089) (1 043)
Net gain from disposal of non-current assets held for sale 52 -
movement in assets and liabilities
Increase/(decrease) in receivables (92) (938)
Increase/(decrease) in inventories 2 5
Increase/(decrease) in other assets (216) (218)
(Increase)/decrease in payables 1 985 (5 031)
(Increase)/decrease in employee benefits (1 335) (2 117)
(Increase)/decrease in provisions (205) (196)
(Increase)/decrease in other liabilities 344 171
net cost of providing services (128 365) (127 017)
34 Restrictions on contributions receivedThe Department is engaged in a variety of funding programs involving State and Commonwealth sources who provide monies to the Department on the premise that these funds are expended in a manner consistent with the terms of the agreement. At reporting date the Department had the following outstanding funding commitments:
2008 2007
$’000 $’000
Resource Conservation and Management 2 990 3 794
2 990 3 794

96
35 expenditure commitments 2008 2007
$’000 $’000
Operating lease commitments:
The total value of future non-cancellable operating lease commitments not provided for and payable as at the end of the reporting period are detailed below. These amounts have not been brought to account in the financial statements.
Not later than one year 3 799 4 644
Later than one year but not later than five years 11 902 17 301
Later than five years 3 499 8 819
Total: Operating lease commitments 19 200 30 764
Duringthe2005-06financialyear,thedepartmentreceivedleaseincentivesfortwoleasedpropertiesamountingto$3.28million.Theseleaseincentivesarebeingamortisedatarateof$328000perannumuntil2015.
Theweightedaverageinterestrateimplicitinnon-cancellableoperatingleasesis3.37%(2007:3.30%).
The operating leases held by the Department are related to property leases with penalty clauses equal to the amountoftheresidualpaymentsremainingfortheleaseterms.TheleasesarepayableonemonthinadvanceandtheDepartmenthastherightofrenewal.Therearenoexistingorcontingentrentalprovisions.
capital commitments:
The total value of capital commitments not provided for and payable as at the end of the reporting period are detailed below. These amounts have not been brought to account in the financial statements.
Not later than one year 436 939
Total: Capital commitments 436 939
TheDepartment’scapitalcommitmentsincludeamountsassociatedwithcapitalinfrastructureprojectsincompleteatthereportingdate.
Remuneration commitments:
Commitments for the payment of salaries and other remuneration under fixed-term employment contracts in existence at the reporting date but not recognised as liabilities are payable as follows:
Not later than one year 3 088 2 615
Later than one year but not later than five years 10 008 5 075
Total: Remuneration commitments 13 096 7 690
Amountsdisclosedincludecommitmentsarisingfromexecutiveandotherservicecontracts.TheDepartmentdoesnotofferfixed-termremunerationcontractsgreaterthanfiveyears.
36 contingent liabilities
Wilpena Tourist Centre
The Minister (on behalf of the Department) extended during the 2000-01 financial year a guarantee to a maximum valueof$1.25milliontoANZBankonbehalfofFlindersTouristServicesPtyLtd,inrespectoftheWilpenaTouristCentreredevelopment/leasearrangement.Themaximumexposureinrelationtotheguaranteeasat30June2008is$325000(2007:$400000).Theloanrepaymentsandassociatedguaranteeiscurrentlyreducingatanamountof$75000peryeareffectivefromNovember2004.Asatthereportingdate,noeventwasknowntohaveoccurredwhichwouldcrystallisetheliabilityundertheguarantee.
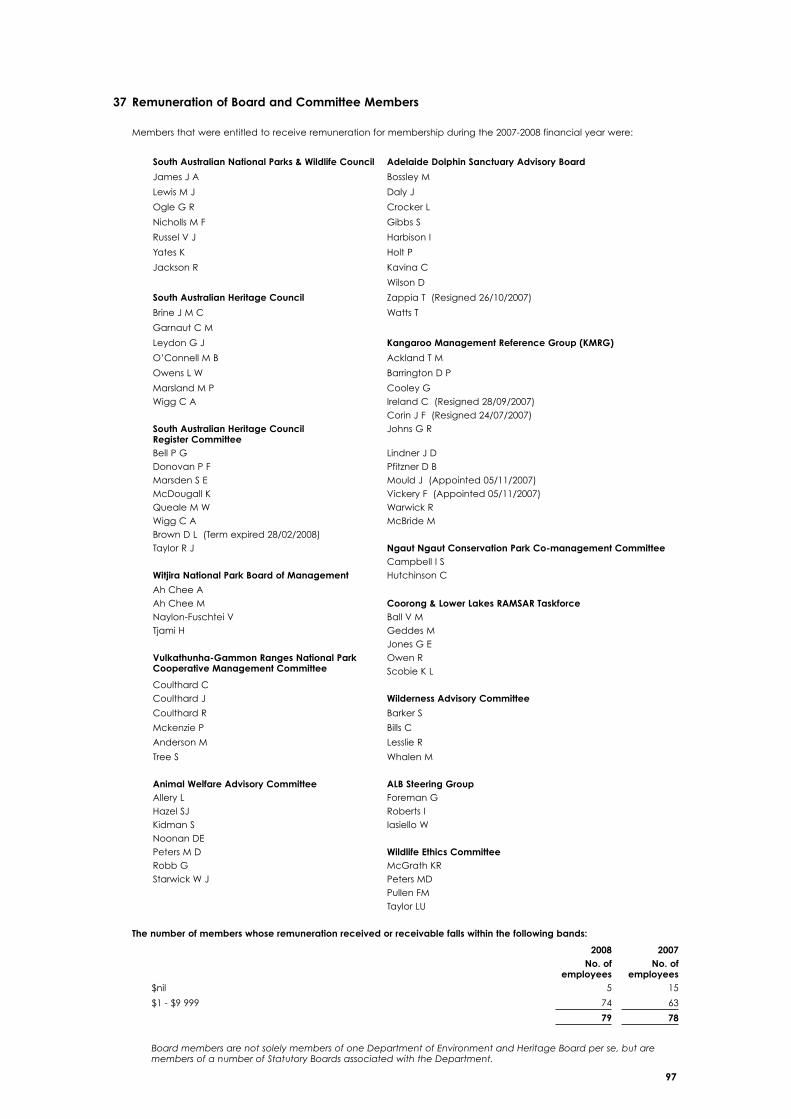
97
37 Remuneration of board and committee members
Members that were entitled to receive remuneration for membership during the 2007-2008 financial year were:
SouthAustralianNationalParks&WildlifeCouncil adelaide dolphin sanctuary advisory board
James J A Bossley M
Lewis M J Daly J
Ogle G R Crocker L
Nicholls M F Gibbs S
Russel V J Harbison I
Yates K Holt P
Jackson R Kavina C
Wilson D
south australian Heritage council Zappia T (Resigned 26/10/2007)
Brine J M C Watts T
Garnaut C M
Leydon G J KangarooManagementReferenceGroup(KMRG)
O’Connell M B Ackland T M
Owens L W Barrington D P
Marsland M P Cooley GWigg C A Ireland C (Resigned 28/09/2007)
Corin J F (Resigned 24/07/2007)south australian Heritage council Register committee
Johns G R
Bell P G Lindner J DDonovan P F Pfitzner D BMarsden S E Mould J (Appointed 05/11/2007)McDougall K Vickery F (Appointed 05/11/2007)Queale M W Warwick RWigg C A McBride MBrown D L (Term expired 28/02/2008)Taylor R J NgautNgautConservationParkCo-managementCommittee
Campbell I SWitjiraNationalParkBoardofManagement Hutchinson C
Ah Chee AAh Chee M Coorong&LowerLakesRAMSARTaskforceNaylon-Fuschtei V Ball V M Tjami H Geddes M
Jones G EVulkathunha-GammonRangesNationalPark cooperative management committee
Owen RScobie K L
Coulthard C Coulthard J WildernessAdvisoryCommittee
Coulthard R Barker S
Mckenzie P Bills C
Anderson M Lesslie R
Tree S Whalen M
AnimalWelfareAdvisoryCommittee aLb steering GroupAllery L Foreman GHazel SJ Roberts IKidman S Iasiello WNoonan DEPeters M D WildlifeEthicsCommitteeRobb G McGrath KRStarwick W J Peters MD
Pullen FMTaylor LU
the number of members whose remuneration received or receivable falls within the following bands:
2008 2007no. of
employeesno. of
employees$nil 5 15
$1 - $9 999 74 63
79 78
BoardmembersarenotsolelymembersofoneDepartmentofEnvironmentandHeritageBoardperse,butaremembersofanumberofStatutoryBoardsassociatedwiththeDepartment.

98
Remunerationofmembersreflectsallcostsofperformingboard/committeememberdutiesincludingsittingfees,supercontributions,fringebenefitstaxandsalarysacrificearrangements.Thetotalremunerationreceivedorreceivablebymemberswas$61006(2007:$42291).Duringthe2007-08financialyear,membersoftheBoardwerepaidsuperannuationof$776(2007:$187).
InaccordancewiththeDepartmentofthePremierandCabinet’sCircularNumber16,governmentemployeesdidnotreceiveanyremunerationforboard/committeedutiesduringthefinancialyear.Unlessotherwisedisclosed,transactionsbetweenmembersandtheDepartmentareonconditionsnomorefavourable than those that it is reasonable to expect the Department would have adopted if dealing with the relatedpartyatarm’slengthinthesamecircumstances.
38 events subsequent to reporting date
There are no known events after balance date that affect this general purpose financial report in a material manner.
39 Financialinstruments/Financialriskmanagement
categorisation of financial instruments
Details of the significant accounting policies and methods adopted including the criteria for recognition, the basis of measurement, and the basis on which income and expenses are recognised with respect to each class of financial asset, financial liability and equity instrument are disclosed in Note 2 “Summary of Significant Accounting Policies”.
balance sheet line item category of financial assets and financial liability
2008 2007 note numbercarrying
amountfair
valuecarrying amount
fair value
$’000 $’000 $’000 $’000financial assets
Cash and cash equivalents Cash and cash equivalents 100 565 100 565 145 343 145 343 19
ReceivablesLoans and receivables (at cost)
6 359 6 359 6 342 6 342 20
Financial assetsHeld to maturity investments (at cost)
8 8 8 8 22
financial liabilities
Payables Financial liabilities (at cost) 16 429 16 429 16 392 16 392 27
Borrowings Financial liabilities (at cost) - - 38 054 38 054 30
Creditrisk
Credit risk arises when there is the possibility of the department’s debtors defaulting on their contractual obligations resulting in financial loss to the department. The department measures credit risk on a fair value basis and monitors risk on a regular basis.The department has minimal concentration of credit risk. The department has policies and procedures in place to ensure that transactions occur with customers with appropriate credit history. The department does not engage in high risk hedging for its financial assets.Allowances for impairment of financial assets are calculated on past experience and current and expected changes in credit rating. Currently the department does not hold any collateral as security for any of its financial assets. Other than receivables, there is no evidence to indicate that financial assets are impaired. Refer to note 20 for information on the allowance for impairment in relation to receivables.
ageing analysis of financial assets
The following table discloses the ageing of financial assets and the ageing of impaired assets.
financial assets item current (not
overdue)
Overdue for
< 30 days
Overdue for
30–60 days
Overdue for > 60 days
total
$’000 $’000 $’000 $’000 $’000
2008
not impaired
Receivables 5 835 236 125 88 6 284
Financial assets 8 - - - 8
impaired
Receivables - - 75 75
Financial assets - - - - -
2007
not impaired
Receivables 5 113 286 139 685 6 223
Financial assets 8 - - - 8
impaired
Receivables - - 119 119
Financial assets - - - - -
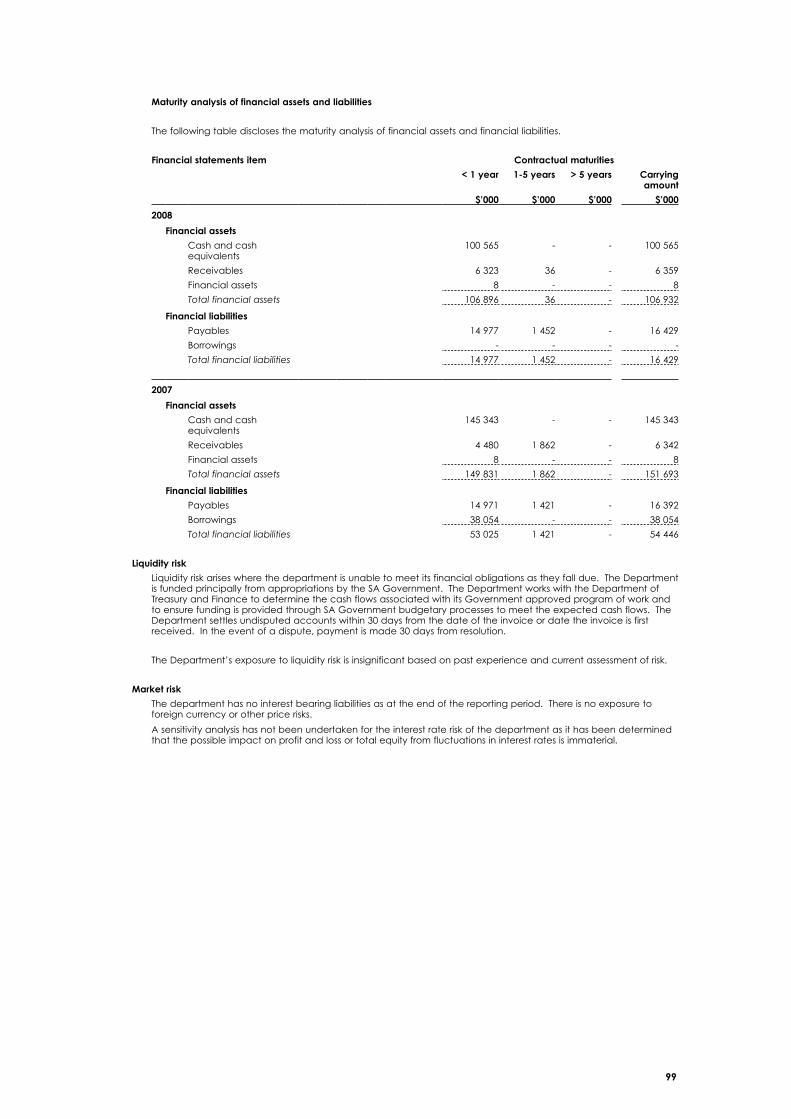
99
maturity analysis of financial assets and liabilities
The following table discloses the maturity analysis of financial assets and financial liabilities.
financial statements item contractual maturities
< 1 year 1-5 years > 5 years carrying amount
$’000 $’000 $’000 $’000
2008
financial assets
Cash and cash equivalents
100 565 - - 100 565
Receivables 6 323 36 - 6 359
Financial assets 8 - - 8
Total financial assets 106 896 36 - 106 932
financial liabilities
Payables 14 977 1 452 - 16 429
Borrowings - - - -
Total financial liabilities 14 977 1 452 - 16 429
2007
financial assets
Cash and cash equivalents
145 343 - - 145 343
Receivables 4 480 1 862 - 6 342
Financial assets 8 - - 8
Total financial assets 149 831 1 862 - 151 693
financial liabilities
Payables 14 971 1 421 - 16 392
Borrowings 38 054 - - 38 054
Total financial liabilities 53 025 1 421 - 54 446
Liquidityrisk
Liquidity risk arises where the department is unable to meet its financial obligations as they fall due. The Department is funded principally from appropriations by the SA Government. The Department works with the Department of Treasury and Finance to determine the cash flows associated with its Government approved program of work and to ensure funding is provided through SA Government budgetary processes to meet the expected cash flows. The Department settles undisputed accounts within 30 days from the date of the invoice or date the invoice is first received. In the event of a dispute, payment is made 30 days from resolution.
The Department’s exposure to liquidity risk is insignificant based on past experience and current assessment of risk.
Marketrisk
The department has no interest bearing liabilities as at the end of the reporting period. There is no exposure to foreign currency or other price risks.
A sensitivity analysis has not been undertaken for the interest rate risk of the department as it has been determined that the possible impact on profit and loss or total equity from fluctuations in interest rates is immaterial.

100
40 state Heritage fundThe State Heritage Fund (“the Fund”) was established under the Heritage Places Act 1993 to conserve places of heritage value. The revenues, expenses, assets, liabilities, changes in equity and cash flows of the Fund are disclosed below. It is noted that these amounts also form part of and are incorporated within the Department’s Financial Statements. When incorporating these amounts into the Department’s Financial Statements all transactions between the Fund and the Department have been eliminated.
income statement for the year ended 30 June 2008
2008 2007
$’000 $’000
expenses
Supplies and services - 5
Grants and contributions 214 230
Other expenses - 23
total: expenses 214 258
income
Other income 23 -
total: income 23 -
net cost of providing services 191 258
Revenues from sa Government 250 250
net result 59 (8)
balance sheet as at 30 June 2008
2008 2007
$’000 $’000
current assets
Cash 218 140
Receivables 35 -
253 140
non current assets
Receivables - 35
Total assets 253 175
current liabilities 35 16
Payables
Total: Liabilities 35 16
net assets 218 159
equity
Retained earnings 218 159
total: equity 218 159
statement of changes in equity for the year ended 30 June 2008
Retained earnings total
$’000 $’000
balance at 1 July 2006 167 167
Net result for 2006-2007 (8) (8)
balance at 30 June 2007 159 159
Net result for 2007-2008 59 59
balance at 30 June 2008 218 218
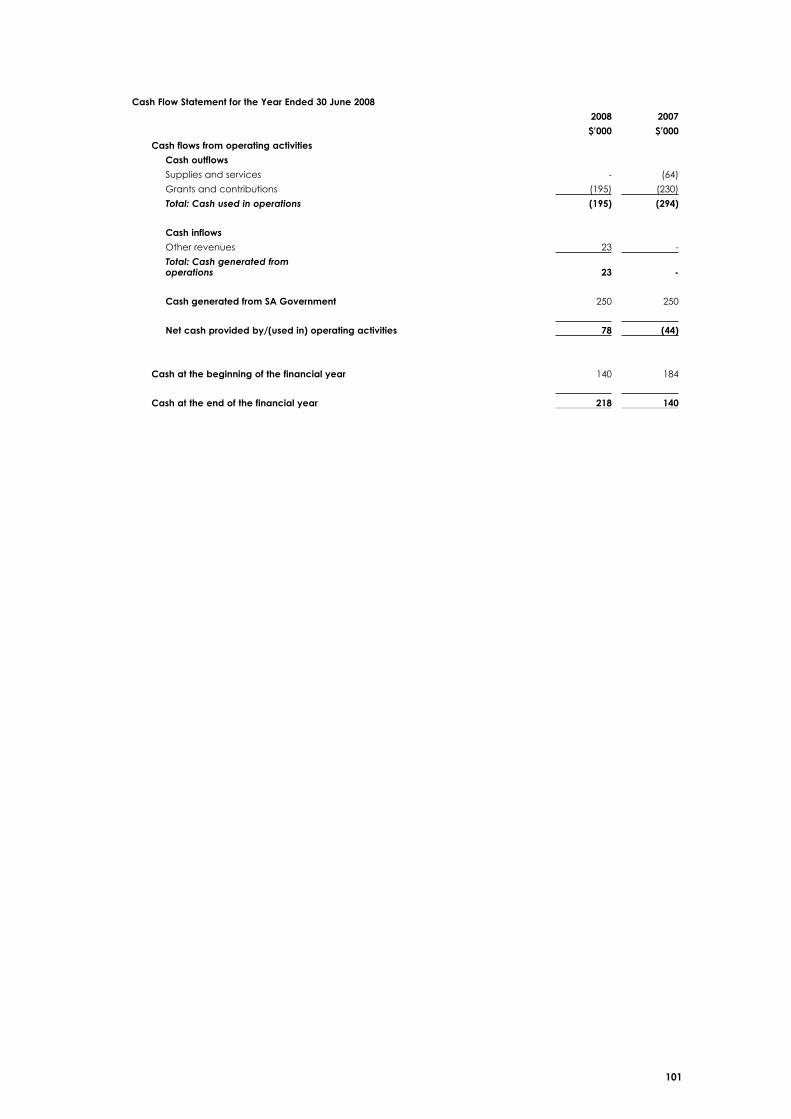
101
cash flow statement for the year ended 30 June 2008
2008 2007
$’000 $’000
cash flows from operating activities
cash outflows
Supplies and services - (64)
Grants and contributions (195) (230)
Total: Cash used in operations (195) (294)
cash inflows
Other revenues 23 -
Total: Cash generated from operations 23 -
cash generated from sa Government 250 250
Netcashprovidedby/(usedin)operatingactivities 78 (44)
cash at the beginning of the financial year 140 184
cash at the end of the financial year 218 140

102
note 2008 2007
$’000 $’000
expenses
Employee benefits costs 317 336
Supplies and services 1 634 1 473
Grants and contributions 25 620 5 176
Depreciation and amortisation 2 782 2 523
Other expenses 10 (58)
total: expenses 30 363 9 450
income
Fees and charges 923 976
Grants and contributions 97 104
Interest 175 142
Assets received free of charge 4 279 1 014
Net gain from disposal of non-current assets 9 726 11 022
Other revenue 1 422 1 110
total: income 16 622 14 368
Net(cost)/surplusofprovidingservices (13 741) 4 918
Revenuesfrom/(paymentsto)SAGovernment
Revenues 23 517 3 976
Payments (12 964) (33 495)
Totalrevenuesfrom/(paymentsto)SAGovernment 10 553 (29 519)
net result (3 188) (24 601)
Theabovestatementshouldbereadinconjunctionwiththeaccompanyingnotes
depaRtment fOR enViROnment and HeRitaGe administeRed incOme statement fOR tHe yeaR ended 30 JUne 2008

103
note 2008 2007
$’000 $’000
current assets
Cash and cash equivalents 7 854 12 351
Receivables 342 594
Inventories 149 159
total: current assets 8 345 13 104
non-current assets
Receivables 106 156
Property, plant and equipment 77 205 71 114
total: non-current assets 77 311 71 270
total assets 85 656 84 374
current liabilities
Payables 283 748
Other current liabilities 1 385 2 151
total: current liabilities 1 668 2 899
non-current liabilities
Payables 105 140
total: non-current liabilities 105 140
total liabilities 1 773 3 039
net assets 83 883 81 335
eqUity
Asset revaluation reserve 42 943 37 219
Retained earnings 40 940 44 116
total equity 83 883 81 335
Theabovestatementshouldbereadinconjunctionwiththeaccompanyingnotes
depaRtment fOR enViROnment and HeRitaGe administeRed baLance sHeet
fOR tHe yeaR ended 30 JUne 2008
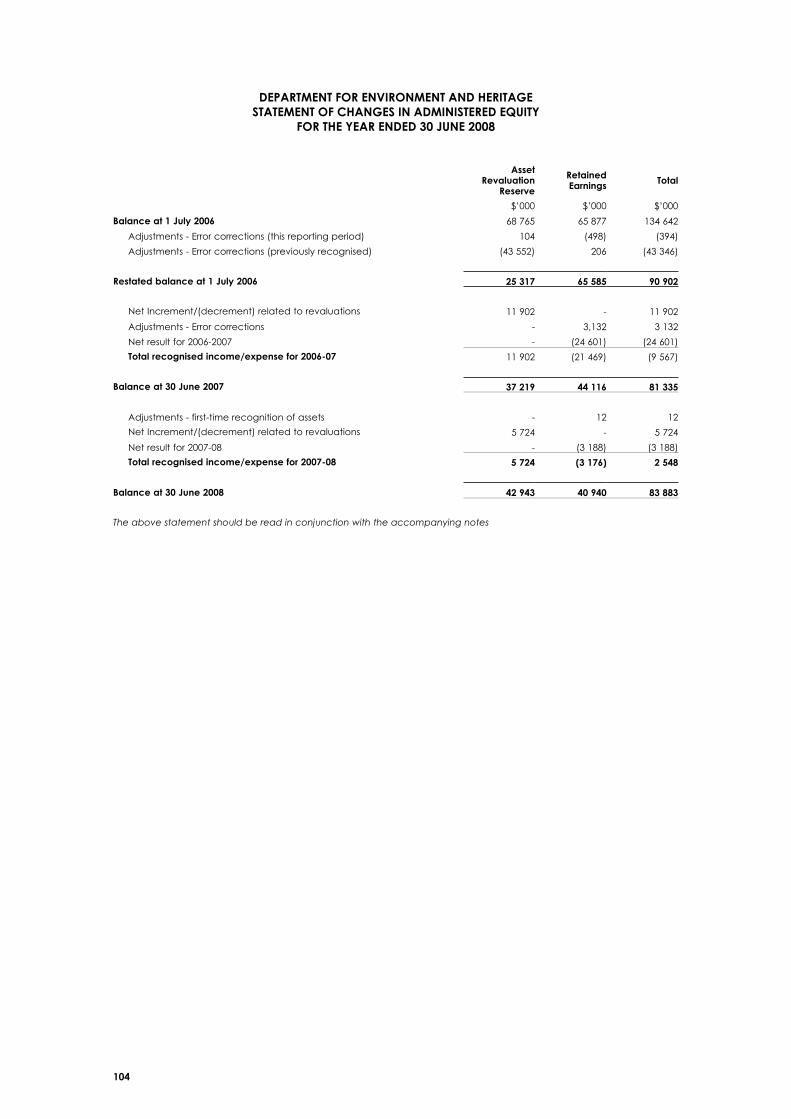
104
asset Revaluation
Reserve
Retained earnings total
$’000 $’000 $’000
balance at 1 July 2006 68 765 65 877 134 642
Adjustments - Error corrections (this reporting period) 104 (498) (394)
Adjustments - Error corrections (previously recognised) (43 552) 206 (43 346)
Restated balance at 1 July 2006 25 317 65 585 90 902
Net Increment/(decrement) related to revaluations 11 902 - 11 902
Adjustments - Error corrections - 3,132 3 132
Net result for 2006-2007 - (24 601) (24 601)
Totalrecognisedincome/expensefor2006-07 11 902 (21 469) (9 567)
balance at 30 June 2007 37 219 44 116 81 335
Adjustments - first-time recognition of assets - 12 12
Net Increment/(decrement) related to revaluations 5 724 - 5 724
Net result for 2007-08 - (3 188) (3 188)
Totalrecognisedincome/expensefor2007-08 5 724 (3 176) 2 548
balance at 30 June 2008 42 943 40 940 83 883
Theabovestatementshouldbereadinconjunctionwiththeaccompanyingnotes
depaRtment fOR enViROnment and HeRitaGe statement Of cHanGes in administeRed eqUity
fOR tHe yeaR ended 30 JUne 2008

105
depaRtment fOR enViROnment and HeRitaGe STATEMENTOFCHANGESINCASHFLOWS
fOR tHe yeaR ended 30 JUne 2008
note 2008 2007
$’000 $’000
cash flows from operating activities
cash outflows
Employee benefits payments (332) (318) 1043
Supplies and services (2 098) (5 241)
Grants and contributions (25 620) (5 176)
Other payments (4) -
cash used in operations (28 054) (10 735)
cash inflows
Fees and charges 457 834
Grant and contribution receipts 97 140
Interest received 171 140
Loan repayments - 140
Other receipts 1 422 1 073
cash generated from operations 2 147 2 327
cash flows from sa Government
Receipts from sa Government
Recurrent appropriation 23 517 3 976
total receipts from sa Government 23 517 3 976
payments to sa Government
Return of surplus cash (12 964) (33 495)
total payments to sa Government (12 964) (33 495)
net cash (used in) operations (15 354) (37 927)
cash inflows from investing activities
Purchase of property, plant and equipment (23) (1 357)
Proceeds from sale of property, plant and equipment 10 880 39 451
net cash provided by investing activities 10 857 38 094
Net(decrease)/increaseincashandcashequivalents (4 497) 167
cash and cash equivalents at the beginning of the financial year 12 351 12 184
cash and cash equivalents at the end of the financial year 7 854 12 351
Theabovestatementshouldbereadinconjunctionwiththeaccompanyingnotes
106
depaRtment fOR enViROnment and HeRitaGe nOtes tO and fORminG paRt Of tHe administeRed financiaL statements
fOR tHe yeaR ended 30 JUne 2008
a1 administered items of the department(a) Reporting entities and strategic context
The activities of the administered items are:
board of the botanic Gardens and state Herbarium
The Board was established under Section 6 of the Botanic Gardens and State Herbarium Act 1978 to ensure the maintenance and development of South Australias Botanic Gardens and State Herbarium and to provide advice on relevant policies consistent with the provisions of the Act and with the objectives of the Minister for Environment and Conservation.
The Department is related to the Board in the following manner: •TheBoard’sbudgetformspartoftheDepartment’sbudgetapprovedbytheDepartmentofTreasuryandFinance; •AssetsconstructedthroughtheDepartment’scapitalworksprogram,onbehalfoftheBoard,aretransferredto the Board at nil cost; and •DepartmentalstaffprovideanumberofservicestotheBoardatnilcost.
However the Board constitutes a separate legal entity, with members appointed by the Governor. Hence the Department cannot direct the Board to expend funds in a particular manner. As a result, the Board is not controlled by the Department and has been reflected as an Administered Item.
crown Lands
Crown Lands is comprised of an account established by the Treasurer to record receipts and payments associated with the sale of Crown land and other surplus Government land and property. The net revenues from these sales are returned to the DTF Consolidated Account.
ministerial Other payments
Payments made under Special Acts such as grant payments to Zoos SA. Grants and contributions expense for the 2007-08 year includes a one-off grant of $18.9m made to Zoos SA for a new entrance and underwater fairy penguin enclosure.
special acts allocation
Payments made under Special Acts for the salary and allowances for the Minister for Environment and Conservation.
(b) administered items’ financial arrangements
The financial activities of the administered items are conducted through a number of deposit accounts with Department of Treasury and Finance pursuant to the Public Finance and Audit Act 1987. For those administered items that do not have their own deposit account their financial activities are conducted through the Department’s deposit account.
The Department conducts a large number of activities directed towards meeting the administered items’ objectives and responsibilities as specified in the legislation and/or other authoritative documentation that establishes the administered items. Many of the administered items, in accordance with the Acts, have delegated certain functions to officers within the Department who provide technical and administrative support including the use of plant and equipment, office accommodation and various administrative services. The cost of the services provided that can be identified with the activities of the administered items and can be measured reliably are met by the administered items. Other support services that are not identifiable and/or cannot be measured reliably are provided free of charge and have not been recognised in the administered items’ schedules.
(c) administered items’ summary of significant accounting policies
The administered items schedules detail the sum of the individual administered items’ revenues, expenses, assets, liabilities, changes in equity and cash flows and as such the principles of consolidation have not been applied in preparing the schedules as the definition of an economic entity has not been satisfied. Accordingly, transactions and balances between the individual administered items have not been eliminated.
In general, the administered items adopt the accounting policies of the Department. As detailed in Note 2 of the Department’s financial statements, deviations from these policies are as follows:
property, plant and equipment
The Department is custodian of unallotted Crown land, by virtue of its responsibilities under the Crown Lands Act 1929. This land is considered to be an administered asset. Unallotted Crown land is not included in the administered items activities as the Department has not been able to formulate a suitable methodology for determining a reliable measure of the value of these holdings. In addition, limitations exist on the reliability of the base information used to determine the valuation of property, plant and equipment actually included in Crown Lands.
The administered items activities include the Crown’s interest in land leased to third parties under perpetual and other leases and annual licences.
Total property, plant & equipment as disclosed in the Administered Balance Sheet consists of assets belonging to the Botanic Gardens and State Herbarium ($55.7 million) and Crown Lands ($21.5 million).

107
employee benefits
In general, administered items’ utilise the services of contractors or the Department’s employees rather than recruiting and appointing employees in their own right. In the majority of cases, the services provided by the Department’s employees are provided free of charge. If, however, the services provided by the Department’s employees are directly attributable to the activities of an administered item and can be reliably measured the services are charged to the administered item on a fee for service (cost recovery) basis. These charges are included in the Administered Income Statement as employee benefits. Further, the liability for employee benefits arising from services rendered by employees is not recognised in the Administered Financial Statements as the Department is obligated to pay employees for services provided. Accordingly, employee benefits are recognised in the Department’s financial statements.
Details of the Administered Items’ revenues and expenses are provided in the following schedules:
Schedule 1(A): Administered expenses and income for the Year Ended 30 June 2008
Schedule 1(B): Administered expenses and income for the Year Ended 30 June 2007
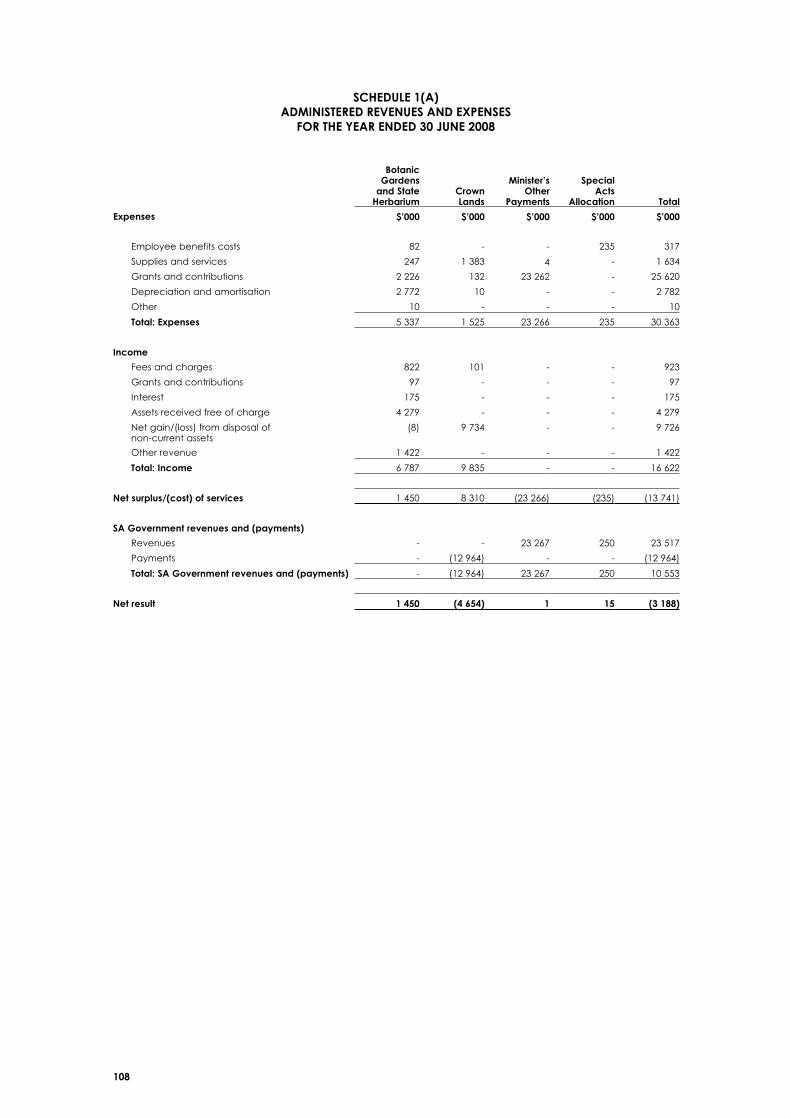
108
botanic Gardens
and state Herbarium
crown Lands
minister’s Other
payments
special acts
allocation total
expenses $’000 $’000 $’000 $’000 $’000
Employee benefits costs 82 - - 235 317
Supplies and services 247 1 383 4 - 1 634
Grants and contributions 2 226 132 23 262 - 25 620
Depreciation and amortisation 2 772 10 - - 2 782
Other 10 - - - 10
total: expenses 5 337 1 525 23 266 235 30 363
income
Fees and charges 822 101 - - 923
Grants and contributions 97 - - - 97
Interest 175 - - - 175
Assets received free of charge 4 279 - - - 4 279
Net gain/(loss) from disposal of non-current assets
(8) 9 734 - - 9 726
Other revenue 1 422 - - - 1 422
total: income 6 787 9 835 - - 16 622
Netsurplus/(cost)ofservices 1 450 8 310 (23 266) (235) (13 741)
sa Government revenues and (payments)
Revenues - - 23 267 250 23 517
Payments - (12 964) - - (12 964)
total: sa Government revenues and (payments) - (12 964) 23 267 250 10 553
net result 1 450 (4 654) 1 15 (3 188)
scHedULe 1(a) administeRed ReVenUes and eXpenses
fOR tHe yeaR ended 30 JUne 2008

109
botanic Gardens
and state Herbarium
crown Lands
minister’s Other
payments
special acts
allocation total
expenses $’000 $’000 $’000 $’000 $’000
Employee benefits costs 77 - - 259 336
Supplies and services 329 1 140 4 - 1 473
Grants and contributions 1 450 - 3 726 - 5 176
Depreciation and amortisation 2 515 8 - - 2 523
Other (58) - - - (58)
total: expenses 4 313 1 148 3 730 259 9 450
income
Fees and charges 823 153 - - 976
Grants and contributions 104 - - - 104
Interest 142 - - - 142
Assets received free of charge 1 005 9 - - 1 014
Net gain from disposal of non-current assets - 11 022 - - 11 022
Other revenue 1 110 - - - 1 110
total income 3 184 11 184 - - 14 368
Netsurplus/(cost)ofservices 1 129 (10 036) 3 730 259 (4 918)
sa Government revenues and (payments)
Revenues 3 730 246 3 976
Payments (33 495) (33 495)
total: sa Government revenues and (payments) - (33 495) 3 730 246 (29 519)
net result (1 129) (23 459) - (13) (24 601)
scHedULe 1(a) administeRed ReVenUes and eXpenses
fOR tHe yeaR ended 30 JUne 2007

110

111

112
AUXILIARY REPORT
MarineParksCouncilofSouthAustralia 2007-08 Report of activities
introductionThe Marine Parks Act 2007 (the Act) was proclaimed on 22 May 2008. At the time
of proclamation sections 1 to 9 and sections 22 to 31 were proclaimed and the
remaining sections were suspended. It is expected that the suspended sections of
the Act will be proclaimed when required, to support the proclamation of marine
park outer boundaries.
The proclamation of the initial sections occurred to support the process of
establishing South Australia’s marine parks network, and, in the first instance, the
Marine Parks Council of South Australia (the Council).
The proclamation of the Act contributes to Objective 3 of South Australia’s Strategic
Plan, specifically Target 3.4 – by 2010 create 19 marine parks aimed at maximising
ecological outcomes.
TheMarineParksCouncilofSouthAustraliaThe Council is established pursuant to section 24 of the Act. Of the inaugural
members of the Council, 10 were appointed by the Governor, on the nomination of
the Minister for Environment and Conservation (the Minister), on 22 May 2008.
The Council’s functions are set out in Section 29 of the Act, as follows.
29 – Functions of Council
(1) The Council has the following functions:
(a) toprovideadvicetotheMinisterontheestablishmentofmarineparks,
including –
(i) advice on any community nominations for marine parks; and
(ii) advice on the areas to be specified as marine parks;
(b) toprovideadvicetotheMinisterinrelationtotheintroduction,variationor
revocation of interim protection orders;
(c) to provide advice to the Minister in relation to a proposal to alter the
boundaries of a marine park;
(d) to provide advice to the Minister in relation to a proposal to establish or
alter a zone within a marine park;
(e) to provide advice to the Minister in relation to the management of marine
parks,theformulationandoperationofmanagementplansunderthisAct,
andtheextenttowhichtheobjectsoftheActarebeingachievedthrough
the implementation of management plans under this Act;
(f) to provide advice to the Minister on ways to promote community
participation in the management of marine parks and the conservation of
relevant marine environments;
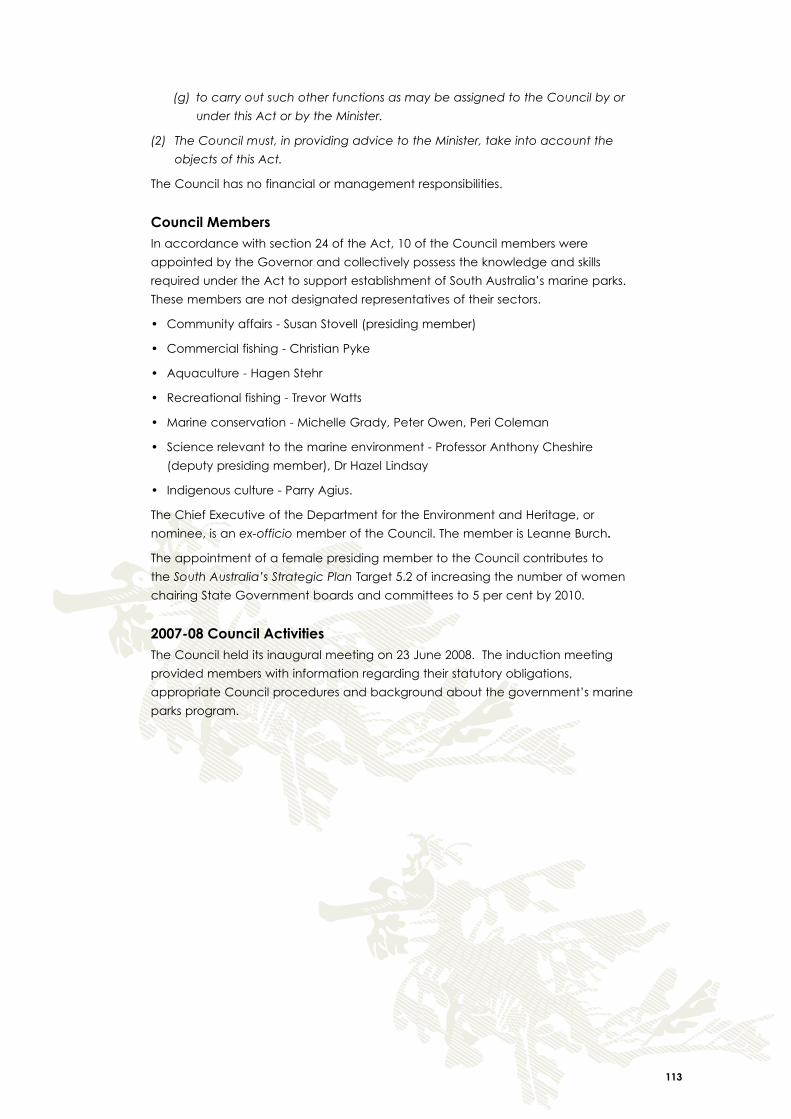
113
(g) to carry out such other functions as may be assigned to the Council by or
underthisActorbytheMinister.
(2) TheCouncilmust,inprovidingadvicetotheMinister,takeintoaccountthe
objectsofthisAct.
The Council has no financial or management responsibilities.
council membersIn accordance with section 24 of the Act, 10 of the Council members were
appointed by the Governor and collectively possess the knowledge and skills
required under the Act to support establishment of South Australia’s marine parks.
These members are not designated representatives of their sectors.
• Communityaffairs-SusanStovell(presidingmember)
• Commercialfishing-ChristianPyke
• Aquaculture-HagenStehr
• Recreationalfishing-TrevorWatts
• Marineconservation-MichelleGrady,PeterOwen,PeriColeman
• Sciencerelevanttothemarineenvironment-ProfessorAnthonyCheshire
(deputy presiding member), Dr Hazel Lindsay
• Indigenousculture-ParryAgius.
The Chief Executive of the Department for the Environment and Heritage, or
nominee, is an ex-officio member of the Council. The member is Leanne Burch.
The appointment of a female presiding member to the Council contributes to
the South Australia’s Strategic Plan Target 5.2 of increasing the number of women
chairing State Government boards and committees to 5 per cent by 2010.
2007-08 council activitiesThe Council held its inaugural meeting on 23 June 2008. The induction meeting
provided members with information regarding their statutory obligations,
appropriate Council procedures and background about the government’s marine
parks program.