DEP AGREEMENT NO. CM619 Coordinated Coral and … · 2017-01-20 · Planner decision support tool...
35
FILE CODE: F-4244-14-F Fish & Wildlife Research Institute DEP AGREEMENT NO. CM619 Coordinated Coral and Hardbottom Ecosystem Mapping, Monitoring and Management, Year 5 Florida Fish and Wildlife Conservation Commission Fish and Wildlife Research Institute Annual Project Report This report funded in part, through a grant agreement from the Florida Department of Environmental Protection, Florida Coastal Management Program, by a grant provided by the Office of Ocean and Coastal Resource Management under the Coastal Zone Management Act of 1972, as amended, National Oceanic and Atmospheric Administration Award No. NA11NOS4190073. The views, statements, findings, conclusions and recommendations expressed herein are those of the author(s) and do not necessarily reflect the views of the State of Florida, NOAA or any of their sub-agencies. December 2016- Submitted by Richard O. Flamm – FWC FWRI
Transcript of DEP AGREEMENT NO. CM619 Coordinated Coral and … · 2017-01-20 · Planner decision support tool...

FILE CODE: F-4244-14-F
Fish & Wildlife Research Institute
DEP AGREEMENT NO. CM619
Coordinated Coral and Hardbottom Ecosystem Mapping, Monitoring and
Management, Year 5
Florida Fish and Wildlife Conservation Commission
Fish and Wildlife Research Institute
Annual Project Report
This report funded in part, through a grant agreement from the Florida Department of
Environmental Protection, Florida Coastal Management Program, by a grant provided by the
Office of Ocean and Coastal Resource Management under the Coastal Zone Management Act of
1972, as amended, National Oceanic and Atmospheric Administration Award No.
NA11NOS4190073. The views, statements, findings, conclusions and recommendations
expressed herein are those of the author(s) and do not necessarily reflect the views of the State of
Florida, NOAA or any of their sub-agencies.
December 2016- Submitted by Richard O. Flamm – FWC FWRI
2
Final Project Report for CM619
Coordinated Coral and Hardbottom Ecosystem Mapping, Monitoring and Management
Executive Summary
This work addresses the need for a single coordinated perspective on the mapping,
monitoring and management of the Florida Reef Tract. Prior to this project, mapping of the reef
tract was conducted piecemeal with limited geographic scope using a wide range of mapping
methods and classification schemes. The Unified Reef Map was developed as a solution for
integrating existing map data into a single, seamless map of benthic habitats from Martin County
to the Dry Tortugas. The Unified Reef Map consists of a geospatial framework which includes a
single GIS database for mapping, monitoring, and management data associated with the Florida
Reef Tract. Another component of the Unified Reef Map framework focused on making data
available to the public via online map applications, web mapping services, and other web
resources. These web-based map services provide current and historical in situ information about
Florida reef habitats as well as other relevant spatial information such as management areas, field
observations, marine infrastructure, and socio-economic data. Products generated during the final
year of this 5-year project include version 2.0 of the Unified Florida Reef Map, updated ancillary
data for the Unified Reef Map web mapping services, and the roll out of an updated webpage
which provides access to project reports, GIS data, and online map applications. To date, the
Unified Reef Map framework has contributed to several management efforts including the
Florida Keys National Marine Sanctuary (FKNMS) Zoning and Regulatory Review by
incorporating healthy coral reefs that were not captured in the 1995 zoning effort.
This study also contributed to the Our Florida Reefs (OFR) community planning process
for southeast Florida’s coral reefs. Community Working Group (CWG) meetings were held and
were comprised of local reef users, scientists, and representatives from non-governmental
organizations as well as local, state, and federal agencies. Topics of the meetings included
updates on relevant current events, mooring buoy spatial planning, MPA framework, the Marine
Planner decision support tool compiling a prioritized list of recommendations for the
comprehensive management strategy, and preparation for the Southeast Florida Coral Reef
Initiative (SEFCRI) review. Radio and Television public service announcements, print and
electronic advertisements and press releases were produced and distributed to publicize the
CWGs and encourage participation in the meetings. Outreach events were also conducted. The
principle outcome of the OFR process was a prioritized list of Recommended Management
Actions (RMAs). These were first drafted based on the work of the stakeholder-driven CWG
and augmented with suggestions from the SEFCRI Team and Technical Advisory Committee.
The draft RMAs were then presented to local stakeholders for discussion at a series of
community meetings in January and February 2016. The public was encouraged to comment,
write letters, and draft petitions in order to share their perspectives following the meetings. In
all, almost 2000 comments were received and 12 letters and petitions. The CWG reviewed all
feedback received and further edited RMAs based on suggestions and comments from the public.
The final result was a prioritized list of 68 RMAs that will be contained in a final process
summary report that will be rolled out in June 2017.

3
Methodology
Unified Reef Map – Years 1 & 2:
A technical team of source map authors and benthic mapping experts was formed to
review and discuss the data integration process approach and to work out technical challenges for
the Unified Reef Map. The best available benthic mapping layers were compiled into an ESRI
ArcGIS Geodatabase. All Feature Class attribute tables were checked and corrected to ensure
data integrity and additional fields were added to accommodate attributes of the original source
data.
The Unified Class (UC) schema was developed to integrate different classification
schemes throughout the region into a common framework while maintaining original source
information. The UC system was adapted from several schemes throughout the area including;
FWC’s SCHEME (Madley, Sargent, & Sargent, 2002), NOAA Puerto Rico and US Virgin
Islands Scheme (Kendall, et al., 2001), NOAA Florida Scheme (National Oceanic and
Atmospheric Administration, 2008) and CMECS (Federal Geographic Data Committee, June
2012). Five hierarchical UC Level classes were added and attributed. Lower UC Levels represent
more generalized classes. Higher UC Levels (Levels 3 and 4) provide more detailed information
such as the type and extent of biological cover.
In order to spatially integrate data, individual source map Feature Classes were merged
into a single Geodatabase Feature Class. The overlapping area of the layer with the most current
information was kept. If overlapping areas were of a comparable time period (within
approximately 5 years), priority was given to the layer which best matched the overall mapping
area in terms of classification scheme and mapping resolution. Polygon geometry and
classification were edited where features were incongruent along boundaries between maps using
the best available imagery. Ancillary fields were added to document edits. Fields were also
added and attributed to identify geographic region, reef map zone, and CMECS attributes
including Geoform, Substrate and/or Biology.
The Unified Reef Map, in situ observation data, historic benthic maps, management
areas, and other relevant ancillary layers are available through the map data service. An open
source REST endpoint for this map data service allows for access by third party mapping
applications. Updates to data services are maintained by FWC staff and automatically pushed to
all clients and applications accessing the map data service. Additionally, URM map services are
also available for viewing in a dedicated ArcGIS Online web map.
Management-focused meetings were held in South Florida and Key West to introduce the
map product to local, state, and federal resource managers. The objective of the meetings was to
demonstrate how resource managers can access and use the Unified Reef Map and associated
spatial data to support decision making. These meetings and related correspondences between
the technical team and managers resulted in a vetted Unified Reef Map product that provides a
GIS-based framework for management, research, monitoring, and other uses.
Unified Reef Map – Year 3:
Data gaps in Boca Grande and Hawk Channel were mapped using photo-interpretation
methods comparable to those used for surrounding areas in the Florida Keys. Photointerpretation
was made using the best available satellite imagery, Lidar, side-scan sonar, ground verification
information, and additional ancillary data where available. Edits to existing maps were made

4
where there were differences in classification with neighboring maps. In addition to these data
gap areas, the Unified Reef Map was updated with new data for Biscayne Bay Aquatic Preserve
provided by the National Park Service.
The most recent updates of in situ data from the Coral Reef Evaluation and Monitoring
Project (CREMP) were incorporated into the ancillary data sets and used to evaluate existing
map classifications.. Documentation, metadata, GIS data/layer packages and CMECS crosswalk
tables were updated in the web mapping applications and are available for download from the
FWC website at http://ocean.floridamarine.org/IntegratedReefMap/.
ArcGIS server web map services were created for distribution of the Unified Reef Map,
LiDAR, and other ancillary spatial data. These web map services were directly fed into the OFR
Marine Planner web based mapping tool. Source GIS files and documentation were also made
publicly available for download through the FWC website. Documentation made available on
this web site includes accuracy assessment reports, final grant reports, related peer reviewed
publications and links to source satellite imagery and in situ data.
Unified Reef Map – Year 4:
Data gaps in the northern Marquesas and Back Country areas were mapped using photo-
interpretation methods comparable to those used for surrounding areas in the Florida Keys. More
recent, higher resolution satellite imagery, LiDAR, and ground verification information were
identified as data sources for mapping these historically unmapped areas. LiDAR reflectance and
relative depth data provided information in deeper areas of the Marquesas where satellite
imagery was inadequate. Additional ancillary data including field observations acquired by
NOAA, FWC, and National Park Service (NPS) were referenced as necessary to assist with
photo-interpretation. Existing maps of the surrounding area were considered during
classification, and line-work was matched at map boundaries. Additional QA/QC of the Unified
Reef Map was conducted to edit and correct topology errors throughout the entire study area.
Approximately 820km2 were mapped in the Marquesas and Back Country gap areas and
integrated into the Unified Reef Map.
Additionally, a standalone patch reef data layer was also generated for the Unified Reef
Map study area. The Unified Patch Reef Map provides a continuous and consistent spatial
representation of individual and aggregated patch reefs in Southeast Florida and the Florida
Keys. The Unified Patch Reef Map was created by extracting patch reef features from several
maps throughout the Keys including NOAA, Nova Southeastern University (NSU), NPS, and
FWC. Following compilation of datasets, patch reef features were extensively reviewed and
edited using updated and higher resolution imagery, LiDAR, acoustic side-scan data, and
ancillary patch reef mapping data to ensure map accuracy and consistency. The resulting GIS
layer consists of 14,196 patch reefs identified using the best available imagery and a consistent
minimum mapping unit and scale throughout the Unified Reef Map study area.
Unified Reef Map – Year 5:
Version 2.0 of the Unified Reef Map was released during Year 5 which included two
major updates: 1) integration of the Unified Patch Reef Map into the Unified Reef Map, and 2)
addition of new mapping data provided by NSU. Integration of the Unified Patch Reef dataset
required extensive review and editing using updated high resolution imagery, LiDAR, acoustic
side-scan, and ancillary patch reef mapping data. Intersected patch reef features from the Unified
Reef Map were either merged or reclassified at a mapping scale comparable to the original

5
source map. All edits were documented in the attribute table of the Unified Reef Map. Topology
errors, including gaps and overlaps generated from the intersection, were reviewed and
corrected. In addition to the Patch Reef features, updated map data of Southeast Florida benthic
features were provided by NSU and integrated into the Unified Reef Map. Version 2.0 of the
Unified Reef Map and additional layers depicting reef zones, regions, and map footprints were
compiled into a geodatabase along with metadata and custom symbology for distribution. Online
resources including the Unified Reef Map website and web mapping services (i.e. REST
endpoints) were also updated during Year 5. Updates to the Unified Reef Map were made to
improve consistency and accessibility to the most critical information and data. The primary
Unified Reef Map web service was updated with Version 2.0 map data. Staff also coordinated
with project partners to obtain the most current monitoring and management data to update the
Ancillary Map Service.
Another deliverable for Year 5 included an accuracy assessment of the broader Unified
Reef Map. A comprehensive accuracy assessment of the Unified Reef Map would require
additional collection of in situ observations, particularly in recently mapped areas and in areas
where maps are likely out of date (e.g. FKNMS hasn’t been mapped since 2006). In the absence
of funds to acquire additional in situ data, accuracy was assessed by compiling existing accuracy
assessment results for individual maps and findings from FWC’s review of integration issues
which was a product of additional CMP special merit funding during Year 3. Findings suggest
that most maps meet recommended accuracy standards with some exceptions for ephemeral
habitats (e.g. seagrass) and certain hard bottom habitat classes (e.g. pavement v. reef, aggregated
v. individual patch reef). Despite relatively high accuracy of individual maps, there were
considerable differences between neighboring and/or overlapping maps and discrepancies
revealed during the patch reef integration efforts. Most discrepancies were attributed to
differences in mapping methods, map scale, resolution of source imagery, and conflicting
interpretations of broadly defined classes. In effect, results suggest that one map is not
necessarily more accurate than another, rather, both maps are often correct based on their
respective mapping scale and methods. Detailed accuracy assessment results are summarized in
Appendix I.
A final meeting was held with resource managers and mapping partners to acquire input
on mapping issues and future monitoring needs. The meeting was held on April 14, 2016 at Nova
Southeastern University in Dania Beach. Discussions with managers and map end users provided
valuable feedback for addressing consistency in mapping scale, methods for new mapping
efforts, classification issues, filling data needs (gaps), and acquiring future support for the
Unified Reef Map. These discussions and lessons learned over the course of this 5-year project
contributed to the creation of the Mapping Guide for Partners of the Florida Reef Tract
(Appendix II). The Mapping Guide provides recommended best practices for resolving existing
map issues and promoting consistent methods for future mapping efforts.
Our Florida Reefs Community Working Group
OFR CWG - Year 1: July 1, 2013 – December 31, 2014
Florida LLC (Carol Lippincott, Ph.D.) was contracted to provide professional facilitation
services for the Our Florida Reefs (OFR) community working group meetings. The OFR-
contracted facilitator worked with DEP’s Coral Reef Conservation Program (CRCP) staff to
coordinate community working groups. Facilitation of collaboration and information exchange
between working groups was necessary to ensure the management options identified by the

6
groups targeted the entire northern third of the Florida Reef Tract. Responsibilities included the
development of meeting structure and agendas, creation of a working group charter with
consensus approval by working group members, identification of background materials as
needed, coordinating follow-up tasks from community working group meetings to ensure
continued participation between meetings from working group members and, assisting working
group members in coordinating additional informal efforts to further discuss and develop work
as needed.
OFR CWG -Year 1: October 1, 2013 – 12/31/2014 Special Merit
The OFR Assistant activities included booking venues for OFR community working
group meetings, ordering supplies, preparing meeting materials, and providing assistance to
CRCP staff and the OFR facilitation contractor. Outreach included a total of 31 social media
posts, 68 web updates, and 13 education/outreach events. Meeting minutes were recorded and
compiled for 26 OFR community working group meetings. 6,031 total 30-second PSAs aired (11
total with 8 in English and 2 in Spanish) between December 1, 2014 and March 9, 2015. A total
of 15 advertisements, including 6 newspaper and 9 magazine advertisements were produced and
published.
OFR CWG - Year 2: July 1, 2014 – September 30, 2015
CWG meetings were held from July 2014 through June 2015. Working group meeting
accomplishments included CWG member education about coral reef issues in southeast Florida
often having guest speakers, development of shared interest and vision for southeast Florida
coral reefs, introduction and use of the Marine Planner tool, compilation and prioritization of
management actions for inclusion into the Marine Planner tool, and taking of public comment.
Documentation of the OFR facilitation services was provided in the form meeting minutes, and
progress reports.
Six outreach events run by the outreach coordinator were conducted during the contract
period. During 2015, web postings, including blog updates, resource updates, and meeting
announcements were produced continuously between January 5 and March 30, May 11 and July
16, and August 14 and September 15 of 2015. Twenty-five printed or electronic
advertisements/meeting announcements were published regularly from January into
September. Between July 1, 2015 and September 1, 2015 2,594 radio and television public
service announcement were produced and distributed.
OFR CWG - Year 3: July 1, 2015 and September 30, 2016
Six outreach events were held between November 2015 and April 2016 and 4
presentations given between October 2015 and February 2016 to different stakeholder groups.
Additional meetings included fish ID and coral ID classes in April 2016. There were 7 SEFCRI
meetings, 5 of which spanned 2 days and one was the Bi-annual meeting on August 18, 2016.
There were 4 Process Planning Team meetings held between October 2015 and January 2016.
There were a total of 170 web postings including blog posts and website updates. There were 8
OFR ads distributed to print media and 1,192 OFR Rack Cards, SEFCRI pens, and/or ESRI App
cards distributed at 22 additional outreach events. PSAs totaled 1,641 for TV with 290 in
Spanish and 496 for radio with 86 in Spanish. The goal was to distribute 3,500 brochures,
pamphlets, rack cards, pens, etc. That number was not reached and we believe for a few reasons.
First, while these materials were made available at all outreach events, they were not necessarily
picked up by many of the attendees. Second, expected attendance was lower than expected at

7
some outreach events, which reduced the expected amount of materials distributed. The SEFCRI
DEP program will continue to distribute the materials and they will also be available at their June
2016 roll-out of the RMAs.
OFR-CWG - Total project summary
There were over 14,000 PSAs aired on television and radio (including English and
Spanish) throughout the OFR process that promoted the Community Working Group (CWG)
meetings to the public. There were a total of 37 CWG meetings between March 2014 and June
2016, including a Decision Support Tool Workshop. Twelve Community Meetings held in 2016
were designed to acquire input on the Recommended Management Actions. During these 2016
meetings, there were a total of 517 attendees. At the close of the public comment period
following 2016 Community Meetings, a total of 1,942 comments as well as 12 letters and
petitions were received. Two CWG subcommittees were formed at the final June 2016 CWG
meeting. A “Report Committee”, which will be working with DEP staff to edit and augment the
final report, and a “Fishing Liaison Committee”, which will be engaging in outreach to their
stakeholder group to disseminate information about OFR outcomes and other local efforts. The
CWG achieved their goal of creating a prioritized list of RMAs, with some RMAs having
already been implemented or on the verge of implementation.
Outcome
Unified Reef Map
Years 1 and 2 of this project produced and implemented a vetted methodology for
integration and distribution of Florida Reef Tract spatial data. Extensive spatial edits and
adjustments were completed around source map boundaries to create a seamless map.
Presentations and discussions with marine resource managers provided valuable input which
helped refine a distributable map product. General feedback from the management perspective
confirmed that the tools and map products would be helpful in supporting decision making
needs. During Years 3 and 4, significant data gaps in the Unified Reef Map were filled in Boca
Grande Channel, Hawks Channel, northern Marquesas and the Back Country region west of
Florida Bay. Also during Year 4 and in response to stakeholder requests, patch reefs were re-
mapped at a consistent classification methodology and map scale. The standalone patch reef map
was subsequently integrated with the Unified Reef Map during Year 5. Throughout the duration
of the 5 year project, web mapping services and the Unified Reef Map website were kept current
with updated data from map providers.
Stakeholders and other end users of the Unified Reef Map can access the updated map
products and project information via several on-line sources:
Unified Reef Map website
(http://ocean.floridamarine.org/IntegratedReefMap/UnifiedReefTract.htm);
Downloadable geodatabase available at FWC’s new online data portal,
http://geodata.myfwc.com/;
Java-based web map viewer hosted by FWC
(http://ocean.floridamarine.org/InDevelopment/IntegratedReefMap/#);
ArcGIS Online web map (http://arcg.is/1L0NJUs); and

8
Web mapping services for the Unified Reef Map and ancillary data which can be
accessed directly by ArcGIS users and support FWC’s online map viewers as well as
other map applications including the Our Florida Reef’s Marine Planner web map.
Differences in methods between map providers continues to be a factor influencing the
accuracy, consistency, and comparability of mapped habitats. Collaborative meetings with map
providers have been an effective tool for developing strategies to improve consistency between
methods and identify mapping needs. Coordination among mapping partners has also helped to
fill data gaps, ensure map information is current, and facilitate the use of new imagery and
mapping technologies. These issues are discussed in the Accuracy Assessment Report (Appendix
I) which summarizes existing accuracy assessment efforts and issues encountered during map
integration efforts. While accuracy issues are inherent with any mapping process and may vary
with habitat type, most discrepancies between individual source maps were not necessarily
indicative of one map being more accurate than another. Rather, accuracy assessment results
suggested that source maps are often correct according to their respective mapping scale and
methods. For this reason, source information was maintained whenever possible and very few
edits were made during the integration process. Instead, recommendations were proposed to
improve consistency in mapping scale, classification methodology, and source imagery between
map providers as maps are updated in the future.
Our Florida Reefs
The OFR communication strategy was supported by the production and distribution of
products used to inform stakeholders and user groups on the stakeholder-driven OFR process.
This communication strategy also improved the rates of participation by stakeholders in the
northern four coastal counties along the reef tract through education and outreach efforts.
Stakeholders were solicited for their input and participation in the OFR process. The OFR
process provided stakeholders the opportunity to take part in coastal and marine spatial planning
for the region’s coral reefs in order to develop a management strategy that seeks to better balance
the use and protection of southeast Florida’s coastal and ocean resources. This communication
strategy allowed CRCP to reach specific audiences that could not be targeted otherwise.
Increased stakeholder participation provided support to management options identified and
increased awareness at the state and federal level.
The principle outcome of the OFR process was a list of Recommended Management
Actions (RMAs). These were first drafted based on the work of the stakeholder-driven Community
Working Groups (CWG). The draft RMAs were then presented at community meetings for
discussion with stakeholders during January and February 2016. The public was allowed to
comment, write letters, and draft petitions. In all, almost 2000 comments were received and 12
letters and petitions. The CWG reviewed the comments and modified prioritized RMAs will be
available in their final report to be released in 2017.
Further Recommendations
This project has successfully established a GIS framework for integrating information
from throughout the Florida Reef Tract and a comprehensive set of tools for making data
available to stakeholders and the broader public. Additionally, this project initiated and
facilitated a cooperative network of managers and scientists to coordinate mapping and
monitoring efforts. As the final year of this project ends, a major challenge is continued

9
coordination to sustain these established resources. Based on previous coordination efforts, we
recommend annual meetings attended by both management and technical staff, list-serve updates
distributed to the Unified Reef Map user community, and more frequent correspondence between
key GIS staff. Collaborative meetings with map providers and interested stakeholders during the
initial and final phases of this project have been an effective tool for developing strategies to
improve consistency and identify mapping needs. Maintaining coordination between mapping
interests will help to address data gaps, ensure map information is current and as consistent as
possible across the Florida Reef Tract. The Mapping Recommendations Guide (Appendix II)
will also promote consistent methods and help to streamline the integration process for future
map updates.
A major recommendation made during the mapping stakeholder meeting held in 2016
was to expand mapping efforts beyond the reef tract to include nearshore waters and contributing
watersheds (Appendix III). This is an important consideration because the reef tract does not
exist in isolation. The geospatial framework of the Unified Reef Map is uniquely suited to
address these gaps and link watershed stressors with the condition and productivity of reef
resources.
Similarly, we recommend integrating the reef tract and nearshore areas with those
uplands whose drainages have influence over the health of the reef tract. These areas can be
integrated through expansion of the mapping effort (nearshore bays and estuaries) and engaging
uplands communities, organizations, and agencies need to be joined with the reef tract and
treated as a single system.
We recommend that the reef tract, nearshore bays and estuaries, uplands, be
operationalized as a social-ecological system (SES) (Berkes and Folke 1998; Ostrom 2009;
Tabara and Chabay 2013). Most simply, a SES is the combined ecological and human
components and their interactions in a complex managed landscape. By complex we are
referring to the large number of components and the likelihood of unpredictable system
behaviors. In an SES an ideal landscape-level management unit is a watershed because they
bound the ecological and socioeconomic patterns and processes that shape the watershed and
ultimately impact the Florida reef tract. For the Florida reef tract, the landscape extends from
Martin County, Florida down through the Florida Keys and includes the nearshore as well as the
upland areas that drain into the Atlantic and can influence the health of the reef. While
managing the reef track without considerations of the other system components will likely be
inefficient at best and futile at worst, it is a very difficult task because of its size, variety of
ecosystems, and large number of political jurisdictions, social institutions, and beliefs and values
of millions of residents and visitors.
Given that the southeast Florida reef tract SES would be large, with different habitats,
with many socioeconomic and political regions, expertise and resources that span the region, and
the simple fact that this research-management system is complex, an operations management
(OM) approach to implement the SES is recommended (Krajewski and Ritzman 1999). By
operations management we are referring to planning, organizing, and coordinating in the context
of producing a desired outcome: a sustainable Florida reef tract. One of the strengths of OM is
that it presents a structured platform from which to tackle complex problems, including
organizational structure and function. Possible benefits include more highly structured problem
solving; more efficient resource use; stronger and better defined partnerships; elimination of
ineffectual legacy activities; removal of barriers between programs that hinder productivity and

10
innovation; increasing creativity and staff morale by nurturing desired behaviors that emerge
from employees in the lower half of the organizational hierarchy; and providing internal and
external benefits through increased transparency and simplified reporting and accountability.
Success of the OFR process required effectiveness in two areas: stakeholder management
and knowledge management. Stakeholder management involves recruiting and retaining, at a
minimum, a core set of participants that represent a broad spectrum of the stakeholder
community. Much of this stakeholder management was associated with the CWGs. Knowledge
management, as it relates here, is a mechanism for managing both environmental data as well as
input and information collected from stakeholders. Knowledge management also extends to
developing strategies for communicating this information to the public. Knowledge management
involved both the CWGs and the Marine Planner tool. Significant progress has been made in
both these areas, in this regard, we recommend continued stakeholder engagement and the
continued support of tools, like the marine planner, that help manage data and build knowledge.
Finally, we suggest, that the OFR process be integrated into the SES described above and serve
as a focal point for Florida reef tract collaborative decision making.
Citations
Berkes, F. and C. Folke. 1998. Linking social and ecological systems: management practices and
social mechanisms for building resilience for complexity and change. Cambridge University
Press, Cambridge, UK.
Federal Geographic Data Committee. (June 2012). Coastal and Marine Ecological Classification
Standard (No. FGDC-STD-018-2012).
Kendall, M. S., Monaco, M. E., Buja, K. R., Christensen, J. D., Kruer, C. R., Finkbeiner, M., et
al. (2001). Methods Used to Map the Benthic Habitats of Puerto Rico and the U.S. Virgin
Islands. Silver Spring, MD: NOAA National Ocean Service.
Krajewski L., Ritzman P. 1999. Operations management. Reading, Massachusetts: Addison-
Wesley.
Madley, K., Sargent, B., & Sargent, F. J. (2002). Development of a system for classification of
habitats in estuarine and marine environments (SCHEME) for Florida. Florida. Unpublished
report to the U.S. Environmental Protection Agency, Gulf of Mexico Program (Grant
Assistance Agreement MX-97408100) Florida Marine Research Institute, Florida Fish and
Wildlife Conservation Commission, St. Petersburg, Florida 43 pp.
National Oceanic and Atmospheric Administration. (2008). A Classification Scheme for
Mapping the Shallow-water Coral Ecosystems of Southern Florida. Version 3.2. Retrieved
September 2012, from
http://ccma.nos.noaa.gov/ecosystems/coralreef/fl_mapping/FLClassScheme.pdf
Ostrom, E. 2009. A general framework for analyzing sustainability of social-ecological systems.
Science 325:419-422.
Tabara JD, Chabay I. 2013. Coupling human information and knowledge systems with social-
ecological systems change: reframing research, education, and policy for sustainability.
Environmental Science & Policy 28:71–81.

Final Project Report for CM619
1
Appendix I:
Accuracy Assessment of the Unified Reef Map
Introduction
Maps are thematic representations of reality and as a result are subject to varying degrees of error caused by
uncertainty between thematic classifications and true ground, or in this case, seafloor conditions. Accuracy assessments
provide a means for estimating classification error and are a useful tool for reporting the degree of uncertainty in the final
map product. Map accuracy is a measure of agreement between classification results and reference or “ground-truth”
observations. Accuracy assessments typically consist of field surveys to collect ground-truth data and comparing those
observations to map results using various statistical tools. Map accuracy and precision are largely influenced by mapping
methods including scale, source imagery, and classification scheme. This is important to note, as the reported accuracy of
any map is a function of the spatial and thematic mapping scale as well as the feature mapping and classification methods.
The Unified Reef Map (URM) consists of individual regional maps that have been integrated to provide a
seamless representation of benthic habitats across the Florida reef tract (Figure 1 and Table 1). Accuracy assessments
have been conducted on several individual maps within the URM, however, the accuracy of the integrated URM product
has yet to be evaluated. A single accuracy estimate for the entire URM is problematic due to differences in mapping
methods which may influence accuracy estimates between individual maps. Furthermore, a comprehensive accuracy
assessment would require additional in situ observations, particularly in recently mapped areas and in areas where maps
are likely out of date. In the absence of additional in situ data, this report will provide a general accuracy summary of the
URM by compiling results from individual map accuracy reports and findings from the Fish & Wildlife Research Institute
(FWRI) 2015 report, A Review of Issues Pertaining to the Integration of Florida Reef Tract Benthic Maps.
Readers should also take note that accuracy assessment methods and metrics used to report results vary between
maps and may limit direct comparisons of accuracy results between individual maps. Interpretation of accuracy
assessment results must take into account the classification level and mapping scale at which results are reported. For
example, accuracy will likely be higher for broad, broad level habitat classes (e.g. hard v. soft bottom) than for more
detailed level classes (e.g. patch reefs, pavement, seagrass). Furthermore, there are varying ways for reporting map
accuracy including overall accuracy and adjusted accuracy, which corrects for bias due to differences in proportional area
between habitat classes (see Walker et al. 2013). Overall accuracy of broad level habitat classes is reported most
consistently among individual maps throughout the Florida Reef Tract and will be the focus for this summary.
Overall Map Accuracy from Previous Assessments
Accuracy assessments have been performed for most individual maps within the URM study area. Accuracy
assessment results for individual maps which have been incorporated in to the URM are summarized in Table 1. Overall
or total map accuracy is generally high and ranges from 85.6% to 98.0% for broad habitat classes (sediment v.
hardbottom/reef) among individual URM maps. Adjusting accuracy for differences in proportional area among classes
(see Walker et al. 2013), in general, increased map accuracy by 5-10%. There were no obvious spatial patterns in accuracy
among individual maps, although Walker et al. (2013) noted higher accuracy where habitat diversity was lower (e.g.
Backcountry) compared to areas with higher habitat diversity (e.g. reef tract). Accuracy was also generally higher for
more recent maps in the Southeast Florida region which were generated from higher resolution source imagery across
multiple remote sensing platforms.
Overall accuracy for detailed habitat classes (i.e. types of hardbottom, sediment, seagrass) was slightly lower than
for major classes, ranging from 84.6% to 96.0%. Map accuracy was generally lowest for certain types of reef and
hardbottom. Accuracy of pavement ranked among the lowest classes in the Florida Keys map and Marquesas map. In
Biscayne Bay, the National Park Service (NPS) reported low accuracy for spur and groove, pavement, reef terrace, and
remnant reef. NPS reported similar results for the Dry Tortugas, indicating lowest accuracy certain types of aggregate reef

Final Project Report for CM619
2
(remnant v. reef terrace) and spur and groove (high v. low relief). Accuracy was also low for Seagrass particularly in the
Marquesas and Florida Keys/Backcountry (80.4, 81.6%) maps.
All individual maps which are currently integrated into the URM meet accuracy standards recommended by the
FGDC (85% attribute accuracy for wetlands) and by the NPS (80% for 1:24,000 vegetation maps). Maps are within the
recommended range for thematic accuracy (85-95%) for the Florida Reef Tract published in the Southern Florida
Shallow-water Coral Ecosystem Mapping Implementation Plan (Rohmann and Monaco, 2005). Accuracy of most URM
maps is also within the range reported by Zitello et al. (2009) of 96% for major classes and 86% for detailed classes in the
Virgin Islands and Puerto Rico.
Table 1. Accuracy assessment results for maps throughout the Florida Reef Tract.
URM Map Provider1 Overall
Accuracy2 Citation
Palm Beach County NSU 89.2% Riegl, B. et al. 2005.
Broward County NSU 89.6% Walker, B.K. et al. 2008
Miami-Dade County NSU 93.6% Walker, B.K. 2009.
Martin County NSU 85.6% Walker, B.K. et al. 2012.
SE Florida
(Key Biscayne to Hilsboro Inlet)
NSU 98.3% Walker, B.K. et al. 2014.
Biscayne Bay NPS 96.0% (v2011) Estep, A.J. et al. 2014.
Florida Bay FWRI Unknown
Florida Keys/Backcountry2 NOAA 90.4% Walker, B.K. et al. 2013;
Marquesas FWRI 91.2% CP&E. 2011.
Dry Tortugas NPS 98.0% (v2010) Waara, R. J. 2011
Hawk Channel FWRI Not conducted.
Boca Grande FWRI Not conducted.
North Keys/Backcountry FWRI Not conducted.
1Map provider or data owner, subcontractors not listed. NSU: Nova Southeastern University (NSU), FWRI: Florida Fish & Wildlife
Commission, Fish & Wildlife Research Institute, NPS: National Park Service, South Florida/Caribbean Network (SFCN), NOAA: NOAA
National Centers for Coastal Ocean Science, Center for Coastal Monitoring and Assessment (CCMA) 2Accuracy assessment did not include the entire mapped areas.
*Reported accuracy at the coarsest classification level (sediment v. hardbottom/reef) unadjusted for proportional area bias.
Findings from the FWRI Report, “Review of Issues Pertaining to the Integration of Florida Reef Tract Benthic
Maps”
The Unified Reef Map project seeks to integrate different benthic mapping efforts into a single continuous and
seamless map. The data integration effort introduced the need to resolve discrepancies between maps in overlap areas and
seams where maps meet. This work focused on integration issues in two areas within Biscayne National Park (BNP)
where the National Park Service (NPS) mapping efforts overlap the mapping extents of both National Oceanic and
Atmospheric Administration (NOAA) and the Nova Southeastern University (NSU). FWRI conducted ground truth
surveys in 2014 to investigate areas where discrepancies between maps frequently occurred. In addition to comparison
with ground truth data, discrepancies were evaluated by quantitatively comparing overlapping maps. As expected, there
was lower agreement between the NPS and NOAA maps (65%) than between the NPS and NSU maps (80%). In general,
higher resolution imagery enabled more detailed discrimination between habitats in the NPS and NSU maps compared to
the NOAA map delineated from coarser Ikonos imagery. Discrepancies tended to be class specific, with frequent
confusion between seagrass and pavement and also between certain hard bottom classes including pavement, aggregate
reef, scattered coral rock and different types of patch reef habitat.

Final Project Report for CM619
3
Low agreement between maps is not necessarily indicative of higher or lower map accuracy, rather, results
suggest that maps are typically correct according to their respective mapping methods. Three primary factors which
contributed to discrepancies and comparability between maps; 1) resolution of source imagery, 2) scale and minimum
mapping unit (MMU), and 3) confusion between similar habitat types. Consistency in benthic mapping efforts would best
be improved by adhering to an agreed upon methodology including consistent MMU, mapping scale and also consistent
interpretation of classification schema between map sources.
Accuracy Issues and Sources of Map Error
Review of existing accuracy assessment results and findings from FWRI’s 2014 verification efforts reveal the
following sources of map error which are common among URM maps.
Issue 1) Time lag between collection of source imagery and ground truth observations
Several URM map sources attributed low map accuracy, in part, as a result of lag time between acquisition of
source imagery and acquisition of ground verification information (Keys, Southeast FL, Marquesas). Seagrass cover can
vary throughout the year in response to a variety of environmental factors which can cause shifts between continuous or
discontinuous seagrass and sediment. Macroalgae which often co-occurs and can easily be confused with seagrass cover
can also vary over short time periods contributing to lower accuracy (Marquesas). Sediment transport during large storm
events may also influence the accuracy of low relief hardbottom habitats such as pavement and spur and groove (Walker
et al. 2013; Walker 2009, Walker and Foster 2009). Ground truth observations collected months or years after acquisition
of source imagery are unlikely to capture seasonal and storm-related habitat changes.
Issue 2) Scale and interpretation of field verification observations
Collection of in situ information is a critical component of guiding and verifying classification during the
mapping process as well as assessing the accuracy of the resulting map product. Interpretation of field observations for
accuracy assessments must consider how data were collected including distribution, extent, and spatial scale of individual
observations. Disparity between mapping scale and observer scale was frequently cited as a major source for disagreement
between map results and field observations (Tortugas, Biscayne, Keys, Marquesas, Southeast Florida). Field information
is often collected at a scale far smaller (<100m2) than most minimum mapping units (>1,000m2). This scale disparity, may
produce lower accuracy for classes which tend to include mixed bottom types or in polygons containing patches smaller
than the minimum mapping unit. In these instances, field sites can be located within a particular bottom type that is either
too small to map independently and/or is not representative of the dominant bottom type in the surrounding area. In the
Backcountry/Keys map, for example, several sites identified as sand during field surveys were located in polygons
mapped as aggregated patch reef. In some maps, such as Biscayne Bay and Dry Tortugas, these errors are considered
acceptable given that certain habitats may include other bottom types, most often unconsolidated sediment. Throughout
the URM, observer-mapping scale issues were most common for certain types of hardbottom (aggregated and individual
patch reef, reef rubble, scattered coral rock, pavement, aggregate/remnant reef, spur and groove) and between
discontinuous and continuous seagrass.
3) Availability and resolution of source data
Map accuracy and precision are highly influenced by the availability and quality of source imagery and ancillary
information used to inform benthic classification. Spatial resolution was cited as a contributor to low accuracy in nearly
all accuracy assessments conducted in the URM. Higher resolution imagery improved discrimination between certain
hard bottom classes with visually similar signatures and often lack visually distinct boundaries. Furthermore, accuracy
generally increased when maps were updated with higher resolution source imagery in the Dry Tortugas, Biscayne Bay,
and Southeast Florida. Ancillary data including LiDAR, sidescan/multibeam sonar, and intensive ground surveys also
improved accuracy of linear reef subclasses, spur and groove, and pavement.
4) Confusion between similar habitats

Final Project Report for CM619
4
Accuracy of certain habitat classes remained low in several maps, despite additional field verification and higher
and more robust source imagery. Often confusion between these similar classes occurred at the user-level either during
photo-interpretation or classification of field observations. These errors were common for aggregate reef and pavement
classes which share similar aerial signatures and also classes which may consist of more than one bottom type including
reef rubble, scattered coral rock, spur and groove, and subclasses of linear reef (e.g. remnant, reef terrace) Several maps
also reported difficulty visually distinguishing sediment colonized by macroalgae with seagrass particularly in areas
where both macroalgae and seagrass co-exist. Lack of clear classification thresholds between certain classes may have
also contributed to low accuracy. For example, Walker et al. cited the need for a size threshold distinguishing larger patch
reefs from structurally and visually similar aggregate reefs. Walker et al. also attributed map error to lack of a clear
vertical relief threshold between low relief pavement and other higher relief reef classes (2014).
Recommendations for Assessing and Improving Map Accuracy
Classification Scheme Refinements
Classification scheme modifications which reduce confusion between visually and spatial similar bottom types will
contribute to higher map accuracy as well as consistency between maps throughout the URM study area. Specific
recommendations for the URM include;
Vertical relief threshold between low relief pavement and higher relief reef classes
Inclusion of sand grazing halo should be clearly specified for individual and aggregated patch reefs,
Designate a size threshold differentiating individual patch reefs from larger reef classes (Walker et al. 2014)
Creation of a mixed hardbottom-seagrass class or, similar to CMECs, classification of geological structure
independent of biological cover which retains both hardbottom and seagrass information, compared to other
classification schemes which document the dominant cover type,
Clear decision rules and subclasses or modifiers which retain information of less dominant classes for mixed
bottom types,
Classification modifications should consider whether application of thresholds and decisions rules is feasible
given the typical spatial and vertical resolution of source imagery, particularly current LiDAR and side scan/multibeam
sonar (Estep et al. 2014). Ideal thresholds will also be derived from observed differences between classes from field
surveys and existing research (Brock et al. 2008) and whether differentiation between classes is ecologically relevant.
Improved Field Verification Methods
Accuracy of map results may be increased with modifications and refinement of field verification methods.
Adherence to a standardized field monitoring protocol by mapping partners would encourage consistency and maximize
observer information for accuracy assessments (Waara et al. 2011). Standardized monitoring methods should consider the
following;
Several URM accuracy assessments suggested collection of field verification and accuracy assessment
data at a spatial scale more comparable to the mapping scale and minimum mapping unit (Waara et al.
2011, Estep et al. 2014, Walker et al. 2014). Observations over a larger area may be achieved via drifting
observations (Walker et al. 2014) or video transects (Walker et al. 2013, FWRI 2015).
Clearer guidance for omission of observations which are not likely representative of the dominant habitat
(e.g. patch of sand located in a polygon classified as aggregated patch reef). Rohmann and Monaco
(2005) recommend acceptable disagreement between map and field observations where “a seven-meter
radius field assessment falls on a habitat feature in the field that is smaller than the MMU. For example, if
a field assessment falls on a small patch reef surrounded by sand that is less than the MMU and thus is not
mapped, the point is excluded from the accuracy assessment report”. Field methods should also indicate
whether to include errors located near polygon edges in accuracy assessment results (Estep et al. 2014,
Rohmann ad Monaco 2005, Walker et al. 2014),

Final Project Report for CM619
5
Intensive observer training prior to field surveys and provide observers with classification criteria, photos,
and aerial imagery during field surveys (Waara et al. 2011, Estep et al. 2014).
Increased sampling for classes with lower accuracy, particularly between similar types of hardbottom
(pavement, spur and groove, remnant reef), where seagrass and macroalgae co-occur, and in areas where
bottom type is mixed (aggregated patch reef, scattered coral rock, spur and groove) (Madden and Goodin,
2007). Increased sampling is also recommended for species-level mapping (Walker et al. 2014)
Shorter lag between acquisition of source imagery and field surveys. Waara et al. (2011) recommended
concurrent collection of field verification and accuracy assessment data may improve timeliness and
efficiency of field survey efforts.
Improved Imagery and Ancillary Source Data
Accuracy improvements are likely to result from source data that is 1) higher spatial and spectral resolution, 2)
collected more frequently, and 3) combined with data across multiple remote sensing platforms (e.g LiDAR, side
scan/multibeam). The subtle or finer scale feature detail available with higher resolution imagery helped to improve
accuracy of several classes including; aggregate reef, spur and groove and pavement. Source data providing vertical
elevation/relief information such as LiDAR or sidescan/multibeam sonar also improved accuracy of spur and groove,
scattered coral rock, pavement, linear reef subclasses, and detection of Acropora and larger coral colonies (Walker et al.
2014). Combination of imagery across multiple remote sensing platforms can improve differentiation between classes
which tend to have lower accuracy such as pavement, aggregate reef, and different types of biological cover (e.g. algae v.
seagrass).
Conclusions
Map accuracy is influenced by a variety of factors including photointerpretation preferences, spatial and thematic
mapping scale and methods, field verification methods, resolution of source imagery and availability of ancillary data.
Differences in accuracy between maps can be addressed to some extent by development and adherence to accuracy
standards such as the accuracy standard recommended in the Southern Florida Shallow-water Coral Ecosystem Mapping
Implementation Plan (Rohmann and Monaco 2005) and standardized field monitoring protocols (Waara et al. 2011).
Implementation of these standards relies on the continued collaboration between URM map partners. Benefits of
improved map accuracy and precision include; more detailed bottom type information that are better predictors of habitat
suitability for reef fish and other fauna (Waara et al. 2011), improve site selection for biological monitoring and
restoration efforts (Estep et al. 2014), and inform re-zoning protection efforts (Estep et al. 2014).

Final Project Report for CM619
6
Figure 1. URM study area and map providers

Final Project Report for CM619
7
Table 2. Metadata summary and accuracy assessment results for individual maps within the Unified Reef Map v2.0.
URM
Name
Data
Provider1
Minimum Mapping
Unit
Mapping
Scale Source Imagery
Overall Map Accuracy2
Citation
Martin
County NSU
1 acre and smaller
for patch reefs 1:6,000 LiDAR, 2008-2009 (4m)
Major = 85.6% (94.9% adjusted)
Detailed habitat = 85.0% (91.5% adjusted) Walker, B.K. et al. 2012.
Palm Beach
County NSU
1 acre and smaller
for patch reefs 1:6,000
LiDAR, 2002
QTC Acoustic, 2006
Major = 89.2%
Riegl, B. et al. 2007.
Broward
County
NSU 1 acre and smaller
for patch reefs 1:6,000
LiDAR, 2002
QTC Acoustic, 2003-04
Major = 89.6%
Generalized 3 classes = 88.1%
(linear reef, pavement, sediment)
Riegl, B. et al. 2004.
Miami-Dade
County NSU
1 acre and smaller
for patch reefs 1:6,000
Aerial image, 2005 (1ft)
LiDAR, 2002 (4m)
Major* = 93.6%
Detailed habitat = 90.5% Walker, B.K. 2009.
Southeast
Florida (Key
Biscayne to
Hillsboro Inlet)
NSU 0.1 ha
(~0.2 acre) 1:1,000
Aerial image, 2013 (1ft)
LiDAR, 2008-2009 (4m)
Major* = 98.3%
Detailed habitat = 96.0% (95.9% adjusted) Walker, B.K. et al. 2014.
Biscayne Bay
(v2011) NPS
~1 acre, all
discernible patch
reefs
ns Aerial image, 2005 (30cm)
LiDAR, 2008 (3m)
Major* = 96% (exact)
Detailed habitat = 94.4% (acceptable) Estep, A.J. et al. 2014.
Florida Bay FWRI 0.5 acre 1:24,000 Aerial image, 2004 Not specified/Unknown FWRI, 2004.
Florida Keys &
Backcountry NOAA ~1 acre 1:6,000 IKONOS, 2006 (4m)
Major = 90.4% (92.6% adjusted)
Detailed structure = 84.6% (85.9% adjusted)
Seagrass = 81.6-86.6% (88.7-86.6% adjusted)
Walker, B.K. et al. 2013;
Rohmann, S.O. & M.E.
Monaco. 2005.
Marquesas FWRI ~1 acre and 0.154
acre for patch reefs ns IKONOS, 2006 (1-4m)
Major = 91.2% (90.8% adjusted)
Detailed structure = 87.0% (88.6% adjusted)
Seagrass = 80.4-86.5% (80.4-88.2% adjusted)
Coastal Planning and
Engineering (CP&E). 2011.
Dry Tortugas
(v2010) NPS
~1 acre and all
discernible patch
reefs
ns
NAIP, 2007 (1m)
IKONOS, 2006 (4m)
LiDAR, 2004 (1m)
Side scan, 2008 (30cm)
Major* = 98% (acceptable)
Detailed habitat = 89.7% (acceptable) Waara, R. J. 2011
Hawk Channel FWRI 1 acre & patch
reefs 0.154 acre ns
WV2, 2010-2013 (0.5m)
Side scan, 2012-13 (30cm) Accuracy assessment not conducted. FWRI, 2014.
Boca Grande FWRI 1 acre and 0.154
acre for patch reefs 1:3,000
WV2, 2013 (0.5m)
GE1, 2011 (1.8m)
LiDAR, 2012 (3m)
Side scan, 2012-13 (30cm)
Accuracy assessment not conducted. FWRI, 2014.
North Keys/
Backcountry FWRI 1 acre 1:3,000
Aerial 2012-13 (0.5ft),
WV2, 2010, 2013 (0.5m),
GE1, 2011-2012 (1.8m),
LiDAR, 2012 (3m)
Accuracy assessment not conducted. FWRI, 2014.
1Subcontractors not listed. NSU: Nova Southeastern University (NSU), FWRI: Florida Fish & Wildlife Commission, Fish & Wildlife Research Institute, NPS: National Park Service,
South Florida/Caribbean Network (SFCN), NOAA: NOAA National Centers for Coastal Ocean Science, Center for Coastal Monitoring and Assessment (CCMA) 2Major = Unconsolidated Sediment v. Hardbottom/Reef, Major* = calculated, not directly reported by data source. Detailed (geomorphological) structure = Sand, Mud, Pavement,
Patch Reef, Aggregate Reef, Spur and Groove, Rubble, Pavement with Sand Channels, Detailed habitat = Aggregated & Individual Patch Reefs, Continuous SRV, Discontinuous
SRV, Spur and Groove, Patchy Coral and/or Rock in Unconsolidated Bottom, Pavement, Reef Rubble, Reef Terrace, Remnant,, Unconsolidated Sediment

Final Project Report for CM619
8
Cited Literature
Brock, J., M. Palaseanu-Lovejoy, C. Wright, and A. Nayegandhi. 2008. Patch-reef morphology as a proxy for Holocene
sea-level variability, Northern Florida Keys, USA. Coral Reefs 27:555-568.
Coastal Planning and Engineering, Inc. (CP&E). 2011. Benthic Habitat Mapping of the Marquesas/Quicksands Area of
the Florida Keys. Final Report to the Fish and Wildlife Research Institute. 57p.
Estep, A.J., R. J. Waara, L. J. Richter, M. W. Feeley, M. E. Patterson, A. D. Davis, W. J. Miller, B. D. Witcher, J. M.
Patterson, R. M. Vargas, A. J. Atkinson. 2014. Biscayne National Park offshore benthic habitat mapping project. Natural
Resource Report NPS/SFCN/NRTR—2014/XXX. National Park Service, Fort Collins, Colorado.
Hall, M. O., and P. R. Carlson Jr. 2015. Summary report for Florida Bay, pp. xx-xx, in L. Yarbro and P. R. Carlson, eds.
Seagrass Integrated Mapping and Monitoring Report No. 2. Fish and Wildlife Research Institute Technical Report TR-
17B, Florida Fish and Wildlife Conservation Commission, St. Petersburg, xxx p.
Federal Geographic Data Committee (FGDC). 1998. Geospatial Positioning Accuracy Standards, Part 3: National
Standard for Spatial Data Accuracy. FGDC-STD-007.3-1998. Online linkage:
https://www.fgdc.gov/standards/projects/accuracy/part3.
Florida Fish and Wildlife Research Institute (FWRI). 2015. Review of Issues Pertaining to the Integration of Florida Reef
Tract Benthic Maps. Technical Report. Online linkage:
http://ocean.floridamarine.org/IntegratedReefMap/UnifiedReefTract.htm
Florida Fish and Wildlife Research Institute (FWRI). 2014. Unified Florida Coral Reef Tract Map v1.2. GIS Metadata.
Online linkage:http://ocean.floridamarine.org/IntegratedReefMap/UnifiedReefTract.htm.
Madden, C. J. and K. L. Goodin. 2007. Ecological Classification of Florida Bay Using the Coastal Marine Ecological
Classification Standard (CMECS). NatureServe, Arlington, Virginia.
National Park Service (NPS). 2010. Authors Lea, C. and A. C. Curtis. 2010. Thematic accuracy assessment procedures:
National Park Service Vegetation Inventory, version 2.0. Natural Resource Report NPS/2010/NRR—2010/204. National
Park Service, Fort Collins, Colorado.
Riegl, B., B. Walker, G. Foster, K. Foster. 2004. Development of GIS maps for southeast Florida coral reefs. Florida
Department of Environmental Protection. DEP agreement no. G0098; NOAA Award NA03NOS4190209.
Riegl, B., B. Walker, G. Foster, K. Foster. 2007. Development of GIS maps for southeast Florida coral reefs. Florida Fish
and Wildlife Conservation Commission. NOAA Award NA03NOS4190209.
Rohmann, S.O. and M.E. Monaco. 2005. Mapping Southern Florida’s Shallow-water Coral Ecosystems: An
Implementation Plan. NOAA Technical Memorandum NOS NCCOS 19. NOAA/NOS/NCCOS/CCMA. Silver Spring,
MD. 39 pp.
Waara, R.J., J. M. Patterson, A. J. Atkinson, A. J. Estep. 2011. Development and policy applications of the 2010 benthic
habitat map for Dry Tortugas National Park. Natural Resource Technical Report NPS/SFCN/NRTR—2011/474. National
Park Service, Fort Collins, Colorado.
Walker, B. K., B. Riegl, and R. E. Dodge. 2008. Mapping Coral Reef Habitats in Southeast Florida Using a Combined
Technique Approach. Journal of Coastal Research 24:1138-1150.
Walker, B.K. 2009. Benthic Habitat Mapping of Miami-Dade County: Visual Interpretation of LADS Bathymetry and
Aerial Photography. Florida DEP report #RM069. Miami Beach, FL. Pp. 47.

Final Project Report for CM619
9
Walker B.K., G. Foster. 2009. Accuracy Assessment and Monitoring for NOAA Florida Keys mapping AA ROI-1 (Hawk
Channel near American Shoal). Prepared for the Office of National Marine Sanctuaries NOS/NOAA, Silver Spring, MD
32.
Walker, B. K. 2012. Spatial Analyses of Benthic Habitats to Define Coral Reef Ecosystem Regions and Potential
Biogeographic Boundaries along a Latitudinal Gradient. PLoS ONE 7:1-14.
Walker, B. K., I. Rodericks, and A. Costaregni. 2013. Accuracy Assessment of NOAA's Florida Keys Benthic Habitat
Map. Prepared for: Steven O. Rohmann, Ph.D., Office of National Marine Sanctuaries NOS/NOAA : 1 -56.
http://nsuworks.nova.edu/occ_facreports/32.
Walker, B.K. and K. Klug. 2014. Southeast Florida shallow-water habitat mapping & coral reef community
characterization. Florida DEP Coral Reef Conservation Program report. Miami Beach, FL. Pp. 83.
Waara, R. J., J. M. Patterson, A. J. Atkinson, A. J. Estep. 2011. Development and policy applications of the 2010 benthic
habitat map for Dry Tortugas National Park. Natural Resource Technical Report NPS/SFCN/NRTR—2011/474. National
Park Service, Fort Collins, Colorado.
Zitello, A.G., L.J. Bauer, T.A. Battista, P.W. Mueller, M.S. Kendall and M.E. Monaco. 2009. Shallow-Water Benthic
Habitats of St. John, U.S. Virgin Islands. NOAA Technical Memorandum NOS NCCOS 96. Silver Spring, MD. 53 pp.

Final Project Report for CM619
1 FWC-FWRI January 2017
Appendix II:
Mapping Guide for Partners of the Florida Reef Tract
Coordinated Coral and Hardbottom Ecosystem Mapping, Monitoring and Management
The Mapping Guide for Partners of the Florida Reef Tract was designed to serve as a “best practices
guide” for mapping the Florida Reef Tract. The goals of this document are to promote consistent methods
among partners and ensure mapping efforts meet management needs. Mapping partners and managers can
use this guide as a reference for optimizing current methods, and as a standards of practice for mapping
projects. These recommendations will benefit long term maintenance of the Unified Reef Map (URM) by
resolving inconsistencies among maps and increasing efficiency of map integration. These
recommendations also support cooperative research efforts and coordinated monitoring of the Florida
Reef Tract.
This Guide is organized based on four primary mapping needs for the Florida Reef Tract.
Recommendations were based on 1) guidance from mapping partners, 2) participant feedback during
mapping coordination meetings, and 3) lessons learned throughout the Unified Reef Map integration
process. This effort is supported by the invaluable contributions of our mapping partners and funding
from the Florida Department of Environmental Protection’s Coastal Management Program under
NOAA’s Coastal Zone Management (CZM) program. A list of partners and the URM study area is
shown in Table 1 and Figure 1.
1) Improve consistency in mapping scale and minimum mapping unit (MMU)
Issue: Reported map scale and MMU does not correspond to true mapping scale. The resolution of source
imagery is a more reliable indicator of true mapping scale.
Issue: Map scale and MMU vary considerably among maps throughout the URM (Error! Reference
source not found.). Differences in mapping scale limit spatial comparisons across the Reef Tract and
create inconsistent linework and classification along seams between neighboring maps.
Recommendations:
Mapping partners will adhere to a clearly defined mapping scale and MMU.
At a minimum, metadata should include mapping scale, MMU, detailed image information
(resolution, acquisition dates, sensor type) and any additional information used during the
classification process (i.e. bathymetry, historic maps, field data, etc.)
Adopt the following mapping scale guidelines for all new mapping efforts in the Florida Reef
Tract
o Recommended digitizing scale = 1:4,000, no more than 1:3,000
Average resolution of newer imagery and source data = 0.5m to 1.0m
# pixels/cells to distinguish between spatial features = 4 pixels (Rohmann and
Monaco, 2005)
Digitizing scale is a function of resolution and size of smallest detectable feature
= 1000* resolution * smallest detectable feature (Tobler, 1987)
o Recommended MMU for all features = 0.1ha
Based on NOVA Southeast university’s SEFL 2013 updated maps
Likely approximates National Park Service’s true mapping scale and MMU
Is reasonable in most areas considering coverage of higher resolution imagery

Final Project Report for CM619
2 FWC-FWRI January 2017
Will likely improve discrimination between problematic classes
o Recommended MMU for patch reefs = 150sqm
Based on Unified Patch Reef v1.3
2) Resolve classification issues
Issue: Classification of seagrass mixed with hardbottom differs among maps using NOAA’s
GeoForm/BioCover scheme (Zitello et al 2009) and maps classifying habitats based on the SCHEME
system (e.g. NPS, NSU, Florida Bay). When GeoForm and BioCover are not classified as separate
attributes often only BioCover information (i.e. seagrass) is retained while presence of hard bottom is not
documented.
Issue: Classification of certain habitats such as patch reefs and seagrass is sensitive to MMU size and
mapping scale. For example, identifying a patch reef as either an individual or aggregated patch reef, will
vary among maps with different MMUs. A group of small patch reefs would be delineated separately and
classified as individual patch reefs at a smaller MMU, whereas, the same group of patch reefs at a larger
MMU would be grouped together and classified as aggregated patch reefs. Delineation between sediment
and seagrass is also influenced by map scale and MMU. For example, at a coarser scale an area may be
classified as discontinuous seagrass, whereas, at a finer scale that same area would be subdivided into
patches of continuous seagrass and sediment.
Issue: Hardbottom classes such as pavement, aggregate and patch reef are often not mapped consistently
throughout the URM. Differences among hardbottom classes are often subtle both in situ and from aerial
imagery. Because of these similarities it is often difficult to consistently apply current classification
schemes, especially because current schemes lack clear thresholds among classes. Additionally,
information necessary for discriminating among types of hardbottom is either not available or not mapped
at a scale fine enough to inform classification. For example, high resolution bathymetry would likely
improve consistent classification between low relief pavement and higher relief reef habitat, which often
appear very similar in aerial imagery when pavement is heavily colonized.
Issue: Difficultly distinguishing sediment from seagrass when seagrass cover is sparse and near the 10%
cover classification threshold. This is particularly challenging in the presence of algae which is easily
confused with seagrass.
Recommendations
Modify existing classification schemes and encourage mapping partners to implement proposed
changes for new mapping efforts. Proposed classification criteria are listed in Tables 3 and
Figure 3 and include;
o Addition of Pavement with Seagrass at UC Level 0 and modified decision rules which
identifies both GeoForm and BioCover in the initial phases of classification (Figure 2).
This modification will ensure that both seagrass and pavement are represented at the
coarsest level of the Unified Reef map, which is the default display for online map
viewers and the most practical scale for conducting reef-tract wide assessments. For maps
using the GeoForm and BioCover classification method, this modification will be largely
superficial, only changing the way data are symbolized at the Unified Reef Maps coarsest
UC Levels. In the remaining areas of the URM where hardbottom has not been
traditionally mapped if seagrass was present, maps should be updated or reclassified to
include hardbottom using the new Pavement with Seagrass class (i.e. Florida Bay, NSU,
NPS).

Final Project Report for CM619
3 FWC-FWRI January 2017
o Clear decision thresholds for hardbottom classes based on unique characteristics such as
relief, feature size, presence of grazing halo, and extent of coral cover (Table 3 and
Figures 2 and 3).
o Classification rules which are independent of map scale or MMU for patch reefs and
seagrass (i.e. presence of shared halo for patch reefs).
Expand collection of ancillary data which can improve discrimination between similar habitats
including high resolution bathymetric data and increased field verification observations,
particularly for classes which cannot easily be delineated from aerial imagery alone (e.g.
hardbottom classes and seagrass v. algae)
3) Assess and improve map accuracy
Issue: Currently, there is no estimate for the overall accuracy of the entire URM map. Accuracy
assessments have been conducted in portions of the Florida Reef Tract, however, gaps among studies and
differences in accuracy assessment methods limit comparisons among maps. Maps requiring accuracy
assessments include; Boca Grande, Hawk’s Channel, North Keys/Backcountry, and the Unified Patch
Reef dataset.
Issue: Disagreement between field and map results due to disparity between the resolution of in situ
observations and mapping scale (Walker et al 2013; Estep et al 2014; Waara et al 2011). Additionally,
disagreement is more likely to occur due to time lags between field observations and image acquisition.
Collectively these issues can limit usefulness of survey data and the reliability of accuracy assessment
results.
Recommendations:
Conduct accuracy assessments in recently mapped areas including Hawk’s Channel, Boca
Grande, North Keys/Backcountry, and the Unified Patch Reef dataset.
Conduct a comprehensive accuracy assessment of the URM.
Develop field verification methods and accuracy assessment standards for mapping partners.
These standards should include the following;
o Encourage collection of groundtruth and/or accuracy assessment data as close to
collection of source imagery as possible to reduce errors due to temporal changes in
benthic communities (see Walker et al 2014).
o Reference data should be collected at a scale as close to the MMU as possible (Walker et
al 2014; Waara et al 2011). The scale of field observations should also take into account
the type of benthic class being evaluated and variability of benthic features within that
class.
4) Continued support for the Unified Reef Map and future mapping efforts
The URM is a dynamic map which requires continued maintenance to ensure data are current and
publicly accessible. GIS editing will be necessary as maps are updated and provided by URM
partners. The URM website and web mapping services will require maintenance as needed and
web server support.
There are various gaps throughout the Florida Reef Tract, these areas are represented as voids in
the URM or features which were delineated but have not been classified. Gaps in map coverage
typically occur where there are gaps in source imagery or where imagery cannot be interpreted
due to cloud cover, high turbidity, sun glint or glare, or other atmospheric conditions. There are
also gaps between the benthic coverage of the URM and intertidal and terrestrial maps.

Final Project Report for CM619
4 FWC-FWRI January 2017
Advances in remote sensing technology have created opportunities to expand the URM to include
areas and features which have historically been unmapped such as deep water corals, turbid
channels, and fine scale hardbottom features. Reduced acquisition costs enable more frequent
and current source imagery which may improve map accuracy for ephemeral habitats such as
seagrass and low relief hardbottom. Collection of high resolution bathymetric data (LiDAR and
side scan/multibeam) can improve accuracy of smaller habitat features, enable discrimination
between low relief and high relief hardbottom, help resolve visually similar classes, and allow
species-level identification (Walker et al 2014).
Recommendations:
Updates are recommended for the following areas/habitats; Florida Bay, NOAA Keys and
Marquesas.
Expand the URM to include the following;
o Dry Tortugas Eco Reserves
o Offshore deeper water reefs using new acoustic technologies such as multi-beam or side-
scan sonar (60 – 100ft deep)
o Bays and estuaries north of Biscayne Bay, shoreward of the reef tract
o Gaps between the URM coverage and intertidal or terrestrial maps. Filling these gaps
will enable integration of the benthic URM with terrestrial maps to create a continuous
“land-to-sea” map.
Expand collection of high resolution bathymetric data (LiDAR and acoustic) throughout URM.
Expand mapping of Acropora and other coral species of concern
Additional field monitoring of areas where Acropora and other species of concern are expected.
These habitats are difficult to map from aerial imagery and require additional field verification.
Survey methods developed by Walker and others (2014) provide an ideal framework for mapping
and monitoring these communities over time. Implementing a citizen science-based program may
provide a cost effective solution to increasing collection of ground truth and accuracy assessment
data.
Improve integration of field data with benthic maps by cross-walking observations to the URM
Unified Class scheme where possible.

Final Project Report for CM619
5 FWC-FWRI January 2017
Table 1. List of Florida Reef Tract mapping partners, v2016
Partner1 Points of Contact Areas mapped
in the URM
Biscayne Bay
National Park
Andy Davis, [email protected]
Amanda Bourque, [email protected]
Caryl Alarcon, [email protected]
Biscayne Bay
Dry Tortugas
National Park
Rob Warra, [email protected] Dry Tortugas
National Park
Everglades
National Park
Matt Patterson, [email protected] Florida Bay (2016)
FWC Fish and
Wildlife Research
Institute (FWRI)
Renee Duffey (primary) [email protected]
Richard Flamm, [email protected]
Paul Carlson (seagrass mapping) [email protected]
Florida Bay (2004)
Biscayne Bay
(portions)
Marquesas, Boca
Grande Channel,
Hawk's Channel
Northern Keys/
Backcountry
NOAA-NCCOS
Center for Coastal
Monitoring and
Assessment
(CCMA)
Steve Rohmann, [email protected]
Mark Monaco, [email protected]
Florida Keys National
Marine Sanctuary
(FKNMS)
Nova Southeastern
University (NSU)
Brian Walker, [email protected] Martin County
Palm Beach County
Broward County
Miami-Dade County
Martin County Kathy Fitzpatrick, [email protected]
Jessica Garland, [email protected]
Palm Beach County Janet Phipps, [email protected]
Broward County Ken Banks, [email protected]
Miami-Dade County Jamie Monty, [email protected]
Josh Mahoney, [email protected]
Sara Thanner, [email protected]
FDEP Coastal
Management
Program (CMP)
Lauren Waters, [email protected]
Francisco Pagan, [email protected]
Florida Keys
National Marine
Sanctuary (FKNMS)
No contact person designated
South Florida Water
Management
District (SFWMD)
No contact person designated
1Includes primary points of contact responsible for mapping or subcontracting map efforts, does not
include managers or other map end users.

Final Project Report for CM619
6 FWC-FWRI January 2017
Figure 1. Unified Reef Map data sources and mapping partners.

Final Project Report for CM619
7 FWC-FWRI January 2017
Table 2. Metadata summary of Unified Reef Map (URM) mapping partners, v2016.
URM
Name
Data
Provider1 Minimum Mapping Unit
Mapping
Scale Source Imagery
Martin
County NSU
1 acre and smaller for
patch reefs 1:6,000 LiDAR, 2008-2009 (4m)
Palm Beach
County NSU
1 acre and smaller for
patch reefs 1:6,000
LiDAR, 2002
QTC Acoustic, 2006
Broward
County NSU
1 acre and smaller for
patch reefs 1:6,000
LiDAR, 2002
QTC Acoustic, 2003-04
Miami-Dade County NSU 1 acre and smaller for
patch reefs 1:6,000
Aerial image, 2005 (1ft)
LiDAR, 2002 (4m)
Southeast Florida
(Key Biscayne to
Hillsboro Inlet)
NSU 0.1 ha
(~0.2 acre) 1:1,000
Aerial image, 2013 (1ft)
LiDAR, 2008-2009 (4m)
Biscayne Bay
(v2011) NPS
~1 acre, all discernible
patch reefs ns
Aerial image, 2005 (30cm)
LiDAR, 2008 (3m)
Florida Bay FWRI 0.5 acre 1:24,000 Aerial image, 2004
Florida Keys &
Backcountry NOAA ~1 acre 1:6,000 IKONOS, 2006 (4m)
Marquesas FWC ~1 acre and 0.154 acre for
patch reefs ns IKONOS, 2006 (1-4m)
Dry Tortugas
(v2010) NPS
~1 acre and all discernible
patch reefs ns
NAIP, 2007 (1m)
IKONOS, 2006 (4m)
LiDAR, 2004 (1m)
Side scan, 2008 (30cm)
Hawk Channel FWC 1 acre & patch reefs 0.154
acre ns
WV2, 2010-2013 (0.5m)
Side scan, 2012-13 (30cm)
Boca Grande FWC 1 acre and 0.154 acre for
patch reefs 1:3,000
WV2, 2013 (0.5m)
GE1, 2011 (1.8m)
LiDAR, 2012 (3m)
Side scan, 2012-13 (30cm)
North Keys/
Backcountry FWC 1 acre 1:3,000
Aerial 2012-13 (0.5ft), WV2, 2010,
2013 (0.5m), GE1, 2011-2012
(1.8m), LiDAR, 2012 (3m) 1Subcontractors not listed.
NSU: Nova Southeastern University (NSU)
FWC: Florida Fish & Wildlife Commission, Fish & Wildlife Research Institute
NPS: National Park Service, South Florida/Caribbean Network (SFCN)
NOAA: NOAA National Centers for Coastal Ocean Science, Center for Coastal Monitoring and Assessment (CCMA)
WV2 = WorldView-2 Satellite
GE1 = GeoEye-1 Satellite
ns = not specified by data provider

Final Project Report for CM619
8 FWC-FWRI January 2017
Table 3. Proposed changes to URM classification methods to be adopted in the Mapping Guide for Partners of the Florida Reef Tract.
Unified Class (UC)
NOAA1 SCHEME2/ NSU3 Proposed
Individual or
Aggregated
Patch Reef
UC Level 1
Coral formations that are isolated from other
coral reef formations by bare sand, seagrass, or
other habitats and that have no organized
structural axis relative to the contours of the
shore or shelf edge. They are characterized by a
roughly circular or oblong shape with a vertical
relief of one meter or more in relation to the
surrounding seafloor
Irregularly shaped reef communities. They may
range in size from tens to thousands of square
meters. Patches are separated from each other by
uncolonized hardbottom, sand, or colonized
substrate with SAV, macroalgae, gorgonians or
sponges. Most often the patches are surrounded by
a halo of bare substrate created by foraging,
obligate reef inhabitants.
Individual or Aggregated Patch Reef class will be replaced by
subclasses Individual Patch Reef and Aggregated Patch Reef.
Individual Patch
Reef
*New class at UC
Level 1,
previously at UC
Level 4
Distinctive single patch reefs that are larger
than or equal to the MMU
Isolated, single reef (larger than the MMU)
without associated halo area. These individual
reefs may have an associated halo, however if
large enough (>MMU) to be delineated the halo
will be mapped as its own subclass.
Smaller (<1ha) distinctive single coral formation that is isolated
from other coral reef formations with a vertical relief of one
meter or more. Most patches are often surrounded by a halo of
bare substrate created by foraging, obligate reef inhabitants.
Larger, neighboring patch reefs close enough that halos
coalesce should be classified as Aggregated Patch Reefs.
Aggregated
Patch Reef
*New UC Level 1
Clustered patch reefs that individually are too
small (<MMU) or are too close together to
map separately
Clustered patch reefs that individually are too
small (<MMU) or are too close together to map
separately or where halos coalesce
Clustered coral formations that are too small or are too close
together to map separately as Individual Patch Reefs. Clustered patches are often surrounded by a halo of bare
substrate created by foraging, obligate reef inhabitants. Includes
larger, individual patch reefs sharing a halo with 1 or more
patch reefs.
Aggregate Reef
UC Level 1
Continuous, high-relief coral formation of
variable shapes lacking sand channels of Spur
and Groove. Includes linear reef formations that
are oriented parallel to shore or the shelf edge.
This class is used for such commonly referred to
terms as linear reef, fore reef or fringing reef
Linear Reef (under Platform Reef): Linear,
contiguous coral formations. Reef crest, fore reef,
and back reef zones could be mapped as Linear
Reef. Most often has associated spur and groove
and reef rubble habitats.
Contiguous, high-relief (>1m) coral formation of variable shapes
lacking sand channels of Spur and Groove. Includes linear reef
formations that are oriented parallel to shore or the shelf edge.
Reef crest, fore reef, and back reef zones could be mapped as
Aggregate Reef. Also referred to as fringing or bank reef
formations. Reefs smaller than 1ha should be classified as
patch reefs.
Reef Rubble
UC Level 1
Dead, unstable coral rubble often colonized with
filamentous or other macroalgae. This habitat
often occurs landward of well-developed reef
formations in the reef crest, ridges and swales, or
back reef zone.
*Rare occurrences of reef rubble in the SEFL
mapping area are classified as Colonized
Pavement.
Dead, unstable coral rubble often colonized with filamentous or
other macroalgae. This habitat often occurs landward of well-
developed reef formations in the reef crest, ridges and swales, or
back reef zone.
Scattered
Coral/Rock in
Unconsolidated
Sediment
UC Level 1
Primarily sand bottom with scattered rocks or
small, isolated coral heads that are too small to
be delineated individually (i.e., smaller than
individual patch reef). If the density of small
coral heads is greater than 10% of the entire
polygon, this structure type is described as
Aggregated Patch Reefs.
Areas of primarily sand, submerged aquatic
vegetation (SAV), or low relief rock covered with
a sand veneer. Often adjacent to spur and groove
habitats, these areas contain small, individual
corals or rocks that are distinctive yet a very low
percentage of the total cover (and certainly
<MMU).
Primarily sand bottom with <10% of the area consisting of
scattered colonized rocks or small, live coral heads that are too
small to be delineated individually.
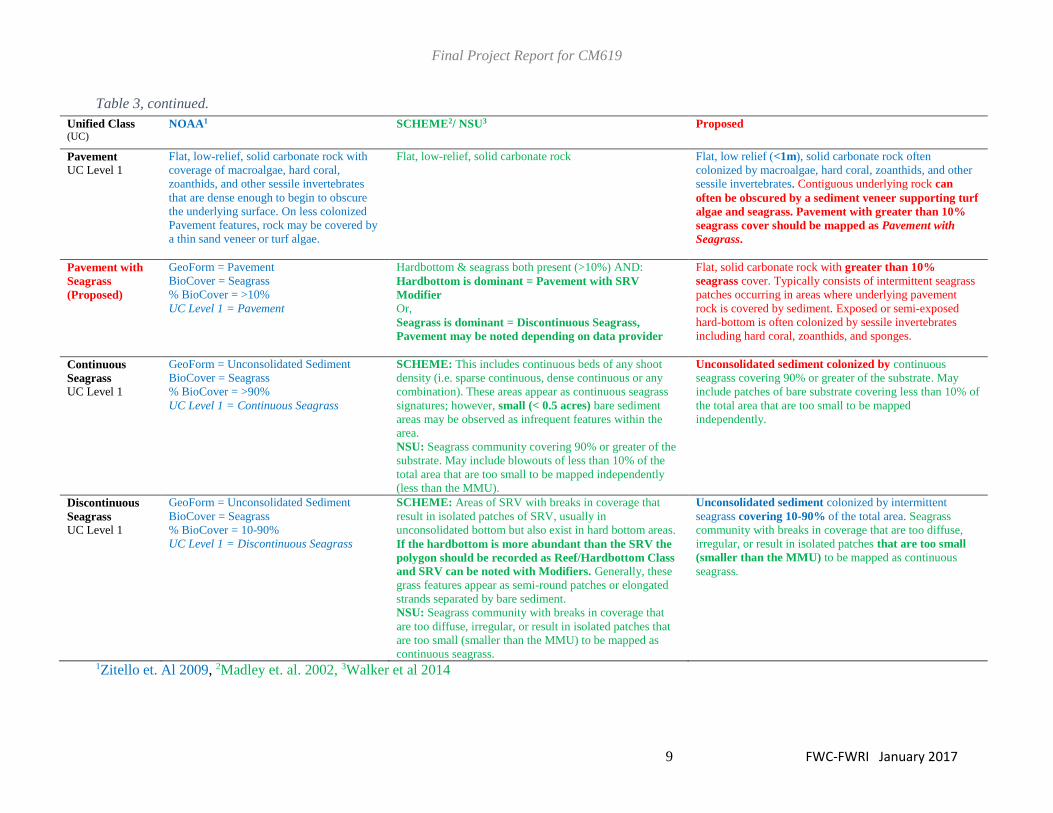
Final Project Report for CM619
9 FWC-FWRI January 2017
Table 3, continued.
Unified Class (UC)
NOAA1 SCHEME2/ NSU3 Proposed
Pavement
UC Level 1
Flat, low-relief, solid carbonate rock with
coverage of macroalgae, hard coral,
zoanthids, and other sessile invertebrates
that are dense enough to begin to obscure
the underlying surface. On less colonized
Pavement features, rock may be covered by
a thin sand veneer or turf algae.
Flat, low-relief, solid carbonate rock Flat, low relief (<1m), solid carbonate rock often
colonized by macroalgae, hard coral, zoanthids, and other
sessile invertebrates. Contiguous underlying rock can
often be obscured by a sediment veneer supporting turf
algae and seagrass. Pavement with greater than 10%
seagrass cover should be mapped as Pavement with
Seagrass.
Pavement with
Seagrass
(Proposed)
GeoForm = Pavement
BioCover = Seagrass
% BioCover = >10%
UC Level 1 = Pavement
Hardbottom & seagrass both present (>10%) AND:
Hardbottom is dominant = Pavement with SRV
Modifier
Or,
Seagrass is dominant = Discontinuous Seagrass,
Pavement may be noted depending on data provider
Flat, solid carbonate rock with greater than 10%
seagrass cover. Typically consists of intermittent seagrass
patches occurring in areas where underlying pavement
rock is covered by sediment. Exposed or semi-exposed
hard-bottom is often colonized by sessile invertebrates
including hard coral, zoanthids, and sponges.
Continuous
Seagrass
UC Level 1
GeoForm = Unconsolidated Sediment
BioCover = Seagrass
% BioCover = >90%
UC Level 1 = Continuous Seagrass
SCHEME: This includes continuous beds of any shoot
density (i.e. sparse continuous, dense continuous or any
combination). These areas appear as continuous seagrass
signatures; however, small (< 0.5 acres) bare sediment
areas may be observed as infrequent features within the
area.
NSU: Seagrass community covering 90% or greater of the
substrate. May include blowouts of less than 10% of the
total area that are too small to be mapped independently
(less than the MMU).
Unconsolidated sediment colonized by continuous
seagrass covering 90% or greater of the substrate. May
include patches of bare substrate covering less than 10% of
the total area that are too small to be mapped
independently.
Discontinuous
Seagrass
UC Level 1
GeoForm = Unconsolidated Sediment
BioCover = Seagrass
% BioCover = 10-90%
UC Level 1 = Discontinuous Seagrass
SCHEME: Areas of SRV with breaks in coverage that
result in isolated patches of SRV, usually in
unconsolidated bottom but also exist in hard bottom areas.
If the hardbottom is more abundant than the SRV the
polygon should be recorded as Reef/Hardbottom Class
and SRV can be noted with Modifiers. Generally, these
grass features appear as semi-round patches or elongated
strands separated by bare sediment.
NSU: Seagrass community with breaks in coverage that
are too diffuse, irregular, or result in isolated patches that
are too small (smaller than the MMU) to be mapped as
continuous seagrass.
Unconsolidated sediment colonized by intermittent
seagrass covering 10-90% of the total area. Seagrass
community with breaks in coverage that are too diffuse,
irregular, or result in isolated patches that are too small
(smaller than the MMU) to be mapped as continuous
seagrass.
1Zitello et. Al 2009, 2Madley et. al. 2002, 3Walker et al 2014

Final Project Report for CM619
10 FWC-FWRI January 2017
Figure 2. SCHEME classification decision tree (Madley et al. 2002) with proposed modifications for UC Level 0 classes (in red text)) to be adopted in the
Mapping Guide for Partners of the Florida Reef Tract.
Unspecified Habitat
Greater than
10% SAV Seagrass cover
Substrate consists of less than 10% Reef/Hardbottom
SAV Class Seagrass
Substrate consists of 10% or greater Reef/Hardbottom
Reef/Hardbottom Class with SAV Modifiers
Pavement with Seagrass
Less than
10% SAV Seagrass cover
Substrate is greater than 90% Unconsolidated Sediment
Unconsolidated Sediments Class
Substrate is 10% or greater Reef/Hardbottom
Reef/Hardbottom Class
= UC Level 0

Final Project Report for CM619
11 FWC-FWRI January 2017
Coral Reef and Hardbottom
Low relief <1m
Other Hardbottom
Linear, shore-parallel, low-relief features, potentially ancient shoreline deposits
Ridge
*field verification needed
Unconsolidated, dead, unstable coral rubble
Reef Rubble
Rubble
Mostly consolidated, carbonate rock
Pavement
Contiguous to patchy, lacking spur and groove
channel formations
Pavement
Presence of macroalgae, hard coral, gorgonians, and other sessile invertebrates, dense enough to obscure underlying rock
Colonized Rubble Colonized Pavement
Alternating, linear sand and pavement formations, perpendicular to reef crest
Pavement with Sand Channels
Variable relief, or depth profile unknown
Dead coral rubble or carbonate rock, lacks live,
stony coral reef formations
Established, live coral reef formations, often
surrounded by grazing halos
High relief >1m
Coral Reef
Larger than 1ha
Aggregate Reef
Contiguous reef, lacking sand channels
Aggregate Reef
Alternating linear sand and coral formations,
perpendicular to reef crest
Spur and Groove
Smaller than 1ha
Patch Reefs
*Renamed from Individual or Aggregated Patch Reef
Greater than 150sqm
Non-MMU alternative: Isolated reefs, often with distinct halo
Individual Patch Reef
Less than 150sqm
Non-MMU alternative: Clustered reefs, close enough to share the same halo
Reef features covering >10% of the area
Aggregated Patch Reef
Mostly sand, reef features covering <10% of the area
Scattered Coral Rock
= UC Level 0
= UC Level 1
= UC Level 2

Final Project Report for CM619
12 FWC-FWRI January 2017
Figure 3. Recommended hardbottom/reef classification decision tree

Final Project Report for CM619
13 FWC-FWRI January 2017
Cited Literature
Estep, A.J., R. J. Waara, L. J. Richter, M. W. Feeley, M. E. Patterson, A. D. Davis, W. J. Miller, B. D. Witcher, J. M.
Patterson, R. M. Vargas, A. J. Atkinson. 2014. Biscayne National Park offshore benthic habitat mapping project. Natural
Resource Report NPS/SFCN/NRTR—2014/XXX. National Park Service, Fort Collins, Colorado.
Madley, K.A., B. Sargent, and F.J. Sargent. Development of a System for Classification of Habitats in Estuarine and
Marine Environments (SCHEME) for Florida. 2002. Unpublished report to the U.S. Environmental Protection Agency,
Gulf of Mexico Program (Grant Assistance Agreement MX-97408100). Florida Marine Research Institute, Florida Fish
and Wildlife Conservation Commission, St. Petersburg. 43pp.
Rohmann, S.O. and M.E. Monaco. 2005. Mapping Southern Florida’s Shallow-water Coral Ecosystems: An
Implementation Plan. NOAA Technical Memorandum NOS NCCOS 19. NOAA/NOS/NCCOS/CCMA. Silver Spring,
MD. 39 pp.
Tobler, Waldo. 1987. “Measuring Spatial Resolution”, Proceedings, Land Resources Information Systems Conference,
Beijing, pp. 12-16.
Waara, Robert J., Judd M. Patterson, Andrea J. Atkinson, Andrew J. Estep. 2011. Development and policy applications of
the 2010 benthic habitat map for Dry Tortugas National Park. Natural Resource Technical Report NPS/SFCN/NRTR—
2011/474. National Park Service, Fort Collins, Colorado.
Walker, B. K., Rodericks, I., and Costaregni, A. 2013. Accuracy Assessment of NOAA's Florida Keys Benthic Habitat
Map. Prepared for: Steven O. Rohmann, Ph.D., Office of National Marine Sanctuaries NOS/NOAA : 1 -56.
http://nsuworks.nova.edu/occ_facreports/32.
Walker, B.K. and Klug, K. 2014. Southeast Florida shallow-water habitat mapping & coral reef community
characterization. Florida DEP Coral Reef Conservation Program report. Miami Beach, FL. Pp. 83.
Zitello, A.G., L.J. Bauer, T.A. Battista, P.W. Mueller, M.S. Kendall and M.E. Monaco. 2009. Shallow-Water Benthic
Habitats of St. John, U.S. Virgin Islands. NOAA Technical Memorandum NOS NCCOS 96. Silver Spring, MD. 53 pp.

Final Project Report for CM619
1
Appendix III:
Management Needs for Mapping, Monitoring, and Citizen Engagement along the Florida Reef Tract
The management needs below were identified by participants in the unified reef track meeting held April 14, 2016.
1) Mapping, monitoring and research needs
Need: Mapping gaps
Nearshore bays and estuaries landward of the reef tract in SEFL
Integrate the benthic URM with intertidal and upland habitats to create a seamless land-to-sea map
Expand the OFR Marine Planner beyond the SE reef tract to include Biscayne Bay and the Florida Keys.
Need: Monitoring gaps
Consistent methods for reef monitoring including survey design, sampling frequency, and measured variables
Coordinated disease-response monitoring throughout the Reef Tract
Expanded genetic monitoring and consistent reporting of genetic results
Long term post-restoration monitoring of coral out plants, beach renourishment efforts, artificial reef construction,
etc.
Monitoring of environmental variables which may impact reef communities both at the reef tract as well as
associated nearshore waters and contributing watersheds (e.g. temperature, water clarity, CO2
Need: Additional research
Assessing upland impacts to the Florida Reef Tract
Evaluating changes in hardbottom over time
o Example: Changes in hardbottom and sediment shifts in nearshore Palm Beach County
Associate reef structure and function with reef-fish distribution and abundance
Determine coral restoration success and continue to evaluate out plant establishment and recruitment
Improve understanding of climate change effects on the Florida Reef Tract
Recommendations
The reef tract, nearshore bays and estuaries, uplands, and human influences make up a social-ecological system
(SES). Most simply a SES is the ecological and human components and their interactions of a complex
landscape. By complex we are referring to the large number of components and the likelihood of unpredictable
system behaviors. In conservation, the landscape can be considered an ideal management unit because they are
“easily” encapsulated by often well-defined boundaries, like a watershed for example. For the Florida reef tract,
the landscape extends from Stuart, Florida down through the Florida Keys and includes the nearshore as well as
the upland areas that drain into the Atlantic and can influence the health of the reef. While managing the reef
track without considerations of the other system components will likely be inefficient at best and futile at worst, it
is a very difficult task because of its size, variety of ecosystems, and large number of political jurisdictions, social
institutions, and beliefs and values of millions of residents and visitors. With these considerations in mind we
recommend the following:
1. Re-conceive the Florida reef tract as a social-ecological system.
a. Include collaborative management as a major organizing philosophy
b. Introduce operations management concepts and consider identifying an operations manager to begin
organizing the SES for long-term research, management, and collaboration.
i. Develop operations models and use these as road maps for collaboration and funding.

Final Project Report for CM619
2
2. Maintain the Our Florida Reefs initiative and expand it to include nearshore and uplands areas in its sphere.
The OFR should serve as a foundation for expanding collaborations across the Florida reef tract SES.
3. Work with state and local government agencies to secure commitments of staff and resources for stabilizing
and strengthening the SES to protect the reef tract.
4. Explore new remote sensing technologies and opportunities for leveraging alternative sources for imagery and
bathymetric data
There is a need to understand and articulate how healthy reefs are associated with healthy reef-fish populations
and then to apply this knowledge to improve management decision making and stakeholder collaboration. We
need to understand how reef fish use different parts of the reef and interact with the reef at various spatial scales,
how the spatial arrangement of physical attributes of the reef affect distribution and abundance of reef fish life
stages, how reef-fish life stages respond to changes to the reef tract and stressors originating from human uses in
and around the reef tract. Addressing this issue is expected to include species-habitat modeling, spatial modeling,
and scenario-based simulations. Regulations, the Magnuson-Stevens and National Environmental Policy Acts,
have requirements that support this need. Identifying essential fish habitat--mapping and censusing the organisms
that use them—and cumulative effects analysis to assess impacts and cause and effect are two relevant examples.
Work with NOVA Southeastern University to expand the OFR Marine Planner to cover all the reefs in Florida
waters.
Continue to support and expand monitoring efforts through coordination with partners, securing funds for long
term monitoring, and exploring unique solutions for multi-agency collaboration. High priority monitoring and
research include; genetic research, larval dispersal and population connectivity for species of special concern,
post-restoration monitoring, water quality, CO2 and ocean acidification.
Work with partners to develop standards for measuring and reporting genetic information.
Expand coral nursery efforts and post-restoration monitoring.
Continue support and encourage collaboration between the numerous initiatives and agencies with similar
objectives including; FWRI, Nova Southeastern University, Rosenstiel School of Marine and Atmospheric
Science of the University of Miami, DEP’s Coral Reef Conservation Program (CRCP), FKNMS, Marine
Biodiversity Observing Network (MBON), NOAA Office for Coastal Management, etc.
2) Agency coordination needs
Need: Ensure compatibility of maps, minimize negative effects of scale
Recommendations
Initiate the Florida Reef Tract Mapping Committee
1. Identify 1-2 contacts from the primary mapping partners and agencies throughout the reef tract
2. Revise and adopt the “Mapping Guide for Partners of the Florida Reef Tract” doc
3) Engaging public participation in reef management
Need: Keeping the public involved
Recommendations
Maintain, support, and strength the Our Florida Reefs initiative.
Expand the Our Florida Reefs initiative to include uplands land uses that effect the reef.
Rethink meeting frequencies, times, and places to increase effectiveness of the meetings if needed.
4) Distributing scientific information to the public

Final Project Report for CM619
3
Need: Ensure that the public has access to information concerning the reef tract
Recommendations
Develop a single web application for distributing mapping, monitoring, and management information throughout
the entire Florida Reef Tract
1. Expand the OFR Marine Planner web viewer and Decision Support tool to include the entire Reef Tract.
Develop mobile mapping and reporting applications
Use Our Florida Reefs to keep citizens informed in additional to their other responsibilities.