Denver Health’s 21st Century Care: Population Health … · Population Health-Informed Primary...
40
Denver Health’s 21 st Century Care: Population Health-Informed Primary Care Services Tracy Johnson, PhD, MA, co-PI, Evaluation Lead Holly Batal, MD, MBA, co-PI, Clinical Lead
Transcript of Denver Health’s 21st Century Care: Population Health … · Population Health-Informed Primary...

Denver Health’s 21st Century Care: Population Health-Informed Primary Care Services
Tracy Johnson, PhD, MA, co-PI, Evaluation LeadHolly Batal, MD, MBA, co-PI, Clinical Lead

© 2012 Denver Health
Acknowledgements and Disclaimers
• Core Team, Clinical Teams, IT Team, Evaluation Team, ACS and Executive Leadership (past and present)
• Denver Health’s 21st Century Care project is supported by the Department of Health and Human Services, Centers for Medicare & Medicaid Services, Contract Number 1C1CMS331064.
• The contents of this publication are solely the responsibility of the authors and do not necessarily represent the official views of the U.S. Department of Health and Human Services or any of its agencies.
• The analysis presented was conducted by the awardee. Findings may or may not be consistent with or confirmed by the independent evaluation contractor.
• The Colorado Multiple Institutional Review Board determined this project to be Quality Assurance, Not Human Subject Research.
DHHA Confidential 2

© 2012 Denver Health
Presentation Outline
• Denver Health: integrated safety net delivery system
• 21st Century Care: a population health approach to primary care delivery
• Population Segmentation/Risk Stratification: – Who?– How?– Why?
• Super-Utilizer Case Study
DHHA Confidential 3

© 2012 Denver Health
Denver Health and Hospital Authority
4

© 2012 Denver Health
Denver Health –21st Century Care
Improve access and achieve Triple Aim: better care, smarter spending, healthier people
Enhanced clinical services through redesigned health teams (~$9m)– Clinical pharmacists– Behavioral health consultants– RN care coordinators– Patient navigators– Social workers– Specialized high intensity teams
Enhanced health information technology (~$9m)– Population segmentation/patient risk stratification– 3M™ Clinical Risk Groups (CRGs) – eTouch Services
Administration and Evaluation (~2m)– Rapid Cycle Evaluation NOT Research
CMMI Award
2012
3 years
$19.8 million
Data Notes: Adapted from Rachel M. Everhart, EVALUATION OF A MEDICAL HOME TRANSITIONS OF CARE INTERVENTION IN A SAFETY NET SETTING, Health Services Research PhD Program Thesis Defense. April 24, 2014 5

© 2012 Denver Health
Patients MMs Enhanced Clinical & HIT ServicesBaseline PMPMs
$6,919
$3,035
$560
$93
Tier 4
Tier 3
Tier 2
Tier 1
High Intensity Treatment Clinics
Complex Case Management
Care Management for Chronic Disease
Panel Management
Notes: Baseline period is July 2010 through June 2011. This initial "proof of concept" tiering algorithm was implemented by Milliman using CDPS predictive modeling tool thresholds to define tiers. Tier sizes were pre-determined according to estimated resource capacity. The attributed managed care population was identified through membership files, whereas the fee-for-service population was selected at a single point in time at the beginning of the time period and fixed for the duration. All attributed individuals were tiered. MM: Member months, PMPMs: Per member per month, PN: Patient Navigator, RN CC: Nurse Care Coordinators, PharmD: Clinical Pharmacist, BHC: Behavioral Health Consultant, SW: Social Worker, HIT: Health Information Technology.
Staffing Model
Adults: $3,449Peds: $1,410
Adults: $137Peds: $76
Adults: $7,801Peds: $4,552
Adults: $614Peds: $314
Multidisciplinary High Risk Health
Teams and Clinics
PN, RN CC, PharmD,
BHC, SW, HIT
PN, BHC,
SW, HIT
HIT
10,087Adult 73% Peds 27%
31,372Adult 80%
Peds 20%
397,463Adult 82%Peds 18%
640,933Adult 27% Peds 73%
Population Health “Tiered” Delivery of Enhanced Care Management Services
Citation: Johnson T, Estacio R, Vlasimsky T et al., "Augmenting Predictive Modeling Tools with Clinical Insights for Care Coordination Program Design and Implementation," eGEMS August 2015. Vol 3:1(14). 6

© 2012 Denver Health
Assemble multi-
disciplinary team
Choose macro
accountable population
Develop risk stratification
rules to define
population segments
(risks/tiers)
Evaluate financial
stratification & clinical
coherence of tiers
Develop care models for use within
tiers
Identify individuals
who are good
candidates for care model
Develop associated workflows
Develop performance monitoring &
evaluation
Iterate to optimize population segmentation & patient identificationInspired by Institute for Healthcare Improvement (IHI) BHLC Collaborative
How We Tier?
Citation: Johnson T, Estacio R, Vlasimsky T et al., "Augmenting Predictive Modeling Tools with Clinical Insights for Care Coordination Program Design and Implementation," eGEMS (Generating Evidence & Methods to improve patient outcomes). August 2015. Vol 3:1(14).

© 2012 Denver Health
How Do We Tier?CRG (Clinical Risk Group) predicts future costs, BUT also needed to include consideration of severity & “actionable patients”
DHHA ConfidentialData Notes: Slide courtesy of Dan Brewer
8

© 2012 Denver Health
How Do We Tier?: Predictive Modeling and Clinical Insight (Adults)
CRG 5(43%)
(1%)
(9%)
CRG 6(82%)
Tier 4n=3,266
Tier 3n=7,411
Tier 2n=27,325
Tier 1n=31,490
Adverse Birth Outcomes
(1%)
Adult High Risk
(5%)
Super Utilizers(40%)
TotalN=69,492
CRGs 1 & 2(94%)
CRG 8(2%)
CRG 4
CRG 9(3%)
(1%)
(3%)
CRG 7(60%)
Adult High Risk
(5%)
Adverse Birth Outcomes
(1%)
CRGs (diagnosis grouper) are primary basis for tier assignment
Utilization overrides CRG-assigned tier
Citation: Johnson T, Estacio R, Vlasimsky T et al., "Augmenting Predictive Modeling Tools with Clinical Insights for Care Coordination Program Design and Implementation," eGEMS (Generating Evidence & Methods to improve patient outcomes). August 2015. Vol 3:1(14).
9

© 2012 Denver Health
How are Tiers Used Administratively?
• Triggering outreach activities • Triggering activities at the point of care• Matching resources to populations (slide 34)• Describing/risk-adjusting provider panels (slide 35)• Describing patients/users (slides 36-7)• Hot-spotting/mapping (slide 38)• Evaluating program reach/performance (slide 39)• In-depth analysis of population subgroups *
DHHA Confidential 10

© 2012 Denver Health
Population Segmentation: Deep Dive
CRG 5(43%)
(1%)
(9%)
CRG 6(82%)
Tier 4n=3,266
Tier 3n=7,411
Tier 2n=27,325
Tier 1n=31,490
Adverse Birth Outcomes
(1%)
Adult High Risk
(5%)
Super Utilizers(40%)
TotalN=69,492
CRGs 1 & 2(94%)
CRG 8(2%)
CRG 4
CRG 9(3%)
(1%)
(3%)
CRG 7(60%)
Adult High Risk
(5%)
Adverse Birth Outcomes
(1%)
CRGs are primary basis for tier assignment
Utilization overrides CRG-assigned tier
<= 3% of adults; 30% of facility costs
11
Citation: Johnson T, Estacio R, Vlasimsky T et al., "Augmenting Predictive Modeling Tools with Clinical Insights for Care Coordination Program Design and Implementation," eGEMS (Generating Evidence & Methods to improve patient outcomes). August 2015. Vol 3:1(14).

© 2012 Denver Health
Super Utilizer Descriptive Analysis
• “Super-utilizers” defined as patients who had three or more hospitalizations in a rolling twelve-month look-back period or had both a serious mental health diagnosis and two or more hospitalizations
• Setting: urban safety-net integrated delivery system • N= 4774 (primarily publicly-insured or uninsured)• Study Period: May 1, 2011-April 30, 2013• Cross-sectional and longitudinal analyses
Tracy L. Johnson, Deborah J. Rinehart, Josh Durfee, Daniel Brewer, Holly Batal, Joshua Blum, Carlos I. Oronce, Paul Melinkovich, and Patricia Gabow. For Many Patients Who Use Large Amounts Of Health Care Services,
The Need Is Intense Yet Temporary. Health Affairs. August 2015; 34(8):1312-1319; doi:10.1377/hlthaff.2014.1186
12

© 2012 Denver Health
Super-Utilizer Demographics & Health Status
Percentages Of 4,774 Adult Super-Utilizers In Denver County, Colorado, With Selected Characteristics, May 1, 2011–April 30, 2013
SOURCE Authors’ analysis of data from the data warehouse of Denver Health. NOTE Each population characteristic percentage was calculated from the cross-sectional snapshot of patients identified as super-utilizers in that month.
Tracy L. Johnson, Deborah J. Rinehart, Josh Durfee, Daniel Brewer, Holly Batal, Joshua Blum, Carlos I. Oronce, Paul Melinkovich, and Patricia Gabow. For Many Patients Who Use Large Amounts Of Health Care Services, The Need Is Intense Yet Temporary. Health Affairs. August 2015; 34(8):1312-1319; doi:10.1377/hlthaff.2014.1186

© 2012 Denver Health
“Super-Utilizers” are Stable in Number, BUTIndividual Turn-Over is High
Tracy L. Johnson, Deborah J. Rinehart, Josh Durfee, Daniel Brewer, Holly Batal, Joshua Blum, Carlos I. Oronce, Paul Melinkovich, and Patricia Gabow. For Many Patients Who Use Large Amounts Of Health Care Services, The Need Is Intense Yet Temporary. Health Affairs. August 2015; 34(8):1312-1319; doi:10.1377/hlthaff.2014.1186 14
DATA NOTES: Authors’ analysis of data from the data warehouse of Denver Health. NOTES “Not in original cohort” is people who became super-utilizers after the study period began (members of all other categories were in the original cohort). “Will die” is people from the original cohort who died during the study period; some people who died also permanently or temporarily lost super-utilizer status. “Will lose and not regain status” is people from the original cohort who stopped being super-utilizers and did not regain that status during the study period. “Will lose and regain status” is people from the original cohort who stopped being super-utilizers and did regain that status during the study period. “Continuously met criteria” is people who met the criteria for super-utilizers throughout the study period. Some people classified as “not in original cohort” also died, permanently or temporarily lost super-utilizer status, or both during the study period. However, these super-utilizer status changes were not tracked. Only status changes affecting the original cohort are shown in the exhibit.
Population And Individual-Level Analyses of Adult Super-Utilizers in Denver County, Colorado, May 1, 2011−April 30, 2013

© 2012 Denver Health
Cost Savings Analysis: Why can’t we simply compare utilization/costs of before and after program enrollment?
This natural tendency for high-utilizing patients to become less high-utilizing over time is known as “regression to the mean”.
Charges reduced 44% & admissions reduced 53%, but NO clinical intervention was provided!$63 K
DHHA ConfidentialData Notes: Slide courtesy of Tracy Johnson 15

© 2012 Denver Health
Regression to the Mean
Figure 3: Per Capita Inpatient And Outpatient Charges For 1,682 Adult Super-Utilizers In Denver County, Colorado, At Baseline And Years 1 And 2
Year Charges Percent change from BaselineBaseline $113,522 n/a1 63,434 −44.12 47,017 −58.6
SOURCE Authors’ analysis of data from the data warehouse of Denver Health. NOTES Charges are those for the original cohort of 1,682 super-utilizers identified in the first month of the study period and are in the relevant year’s dollars. (They were not adjusted for inflation.) The baseline year corresponds to the year prior to super-utilizer identification and was May 1, 2010–April 30, 2011. Year 1 corresponds to the year immediately after identification and was May 1, 2011—April 30, 2012. Year 2 corresponds to two years after identification and was May 1, 2012–April 30, 2013.
Tracy L. Johnson, Deborah J. Rinehart, Josh Durfee, Daniel Brewer, Holly Batal, Joshua Blum, Carlos I. Oronce, Paul Melinkovich, and Patricia Gabow. For Many Patients Who Use Large Amounts Of Health Care Services, The Need Is Intense Yet Temporary. Health Affairs. August 2015; 34(8):1312-1319; doi:10.1377/hlthaff.2014.1186

© 2012 Denver Health
Super-Utilizers are HeterogenousProgram/Policy-Relevant Subgroups
Subgroups Of Super-Utilizers In Denver County, Colorado, And Associated Policies Or Interventions
Before and after identification as
Associated policy or
Super-utilizers on May 1, 2011
Percent in a Denver Health primary
super-utilizers
Average annual per person
Mean annual inpatient
Risk score, concurrent
Subgroup intervention Number Percent care panel spending admissions and predictive Recipients of
emergency inpatient dialysis
Change in federal Medicaid policy to enable access to outpatient dialysis services under emergency Medicaid
30 1.8 43.3 $397,089, $408,567 33.9, 36.4 17.8, 15.7
Terminal cancer patients
Hospice, palliative care 11 0.7 36.4 $230,513, $682,176 5.8, 1.5 14.8, 9.0
Trauma patients Highway safety/speed limits, violence prevention initiatives
195 11.6 45.1 $136,050, $79,366 4.4, 1.8 6.8, 4.7
Orthopedic surgery patients (not trauma related)
Individuals with
serious mental health diagnoses
Patients with multiple chronic diseases/other
Shared decision making, infection prevention education, postdischarge follow-up
Integrated or collaborative behavioral health models
Redesigned primary care
with enhanced social or mental health services
60 3.6 76.7 $201,334, $80,039 4.2, 1.4 10.0, 5.4
685 40.7 54.5 $87,236, $62,600 3.2, 1.1 5.4, 4.2
701 41.6 71.4 $120,520, $77,833 3.9, 1.5 7.4, 5.5
NOTES The numbers and percentages for the subgroups are based on the original cohort of 1,682 super-utilizers. Each pair of numbers represents before and after identification as super-utilizers.
Tracy L. Johnson, Deborah J. Rinehart, Josh Durfee, Daniel Brewer, Holly Batal, Joshua Blum, Carlos I. Oronce, Paul Melinkovich, and Patricia Gabow. For Many Patients Who Use Large Amounts Of Health Care Services, The Need Is Intense Yet Temporary. Health Affairs. August 2015; 34(8):1312-1319; doi:10.1377/hlthaff.2014.1186

© 2012 Denver Health
Evaluation Implications
• Most existing programs have not been implemented under a research framework
• Most patient subgroups showed reduced utilization pre-vs. post-identification
• Programs that use a pre-post evaluation design may overstate program impact
• Randomized clinical trials and strong observational designs are needed
DHHA Confidential 18
© 2012 Denver Health
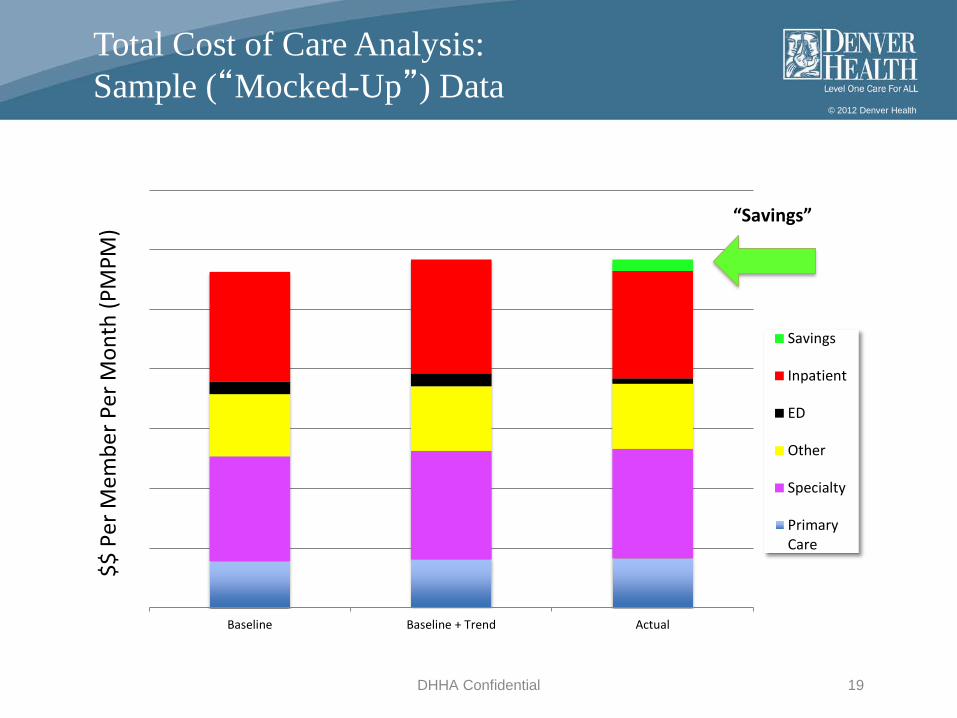
DHHA Confidential 19
Baseline Baseline + Trend Actual
Savings
Inpatient
ED
Other
Specialty
PrimaryCare
“Savings”
$$ P
er M
embe
r Per
Mon
th (P
MPM
)
Total Cost of Care Analysis:Sample (“Mocked-Up”) Data

© 2012 Denver Health
Super-Utilizer Program Implications
• Real-time identification is critical – Billing data is helpful for descriptive analysis
but “too old” for program identification– Window of opportunity may be short
• Where, when, how to intervene must be matched to the target population – Subpopulations differ by primary care use,
reasons for utilization, and cost trajectory– Non-target populations are likely to be
identifiedTracy L. Johnson, Deborah J. Rinehart, Josh Durfee, Daniel Brewer, Holly Batal, Joshua Blum, Carlos I. Oronce, Paul Melinkovich, and Patricia Gabow. For Many Patients Who Use Large Amounts Of Health Care Services, The Need Is Intense Yet Temporary. Health Affairs. August 2015; 34(8):1312-1319; doi:10.1377/hlthaff.2014.1186
20

© 2012 Denver Health
Care of Super utilizers at DH:Clinical Feasibility Approach
• Organizational capacity• Literature review of model types• Review of existing clinical models (esp.,
Hennepin)• Medical record review to fine-tune
eligibility requirements and needed staffing
• Experimented with patient outreach approach
DHHA Confidential 21

© 2012 Denver Health
Super-Utilizer Program Development:Adult High Intensity Teams
DHHA Confidential 22
“Ambulatory ICU”
© 2012 Denver Health
Intensive Outpatient Clinic (aICU)
• Targeted to adults with multiple, potentially avoidable, inpatient admissions
• Serves as the patient’s medical home • More robust staffing model • care coordination/plan inclusive of the medical, mental
health/substance abuse, medication management, and social needs of the individual
• In addition to integrated behavioral health services also have strong connection to Mental Health Center of Denver
23

© 2012 Denver Health
aICU Patient Recruitment
• Need real time patient identification• Trigger event - when a patient was
hospitalized and had index, or subsequent, qualifying admission
• Daily list pushed to IOC on patient admission• IOC screens for clinical eligibility• Team follows eligible patients until discharge
to attempt to engage them in care• More recent iteration - MD rounding in
hospital24

© 2012 Denver Health
Daily aICU List
DHHA Confidential 25
© 2012 Denver Health
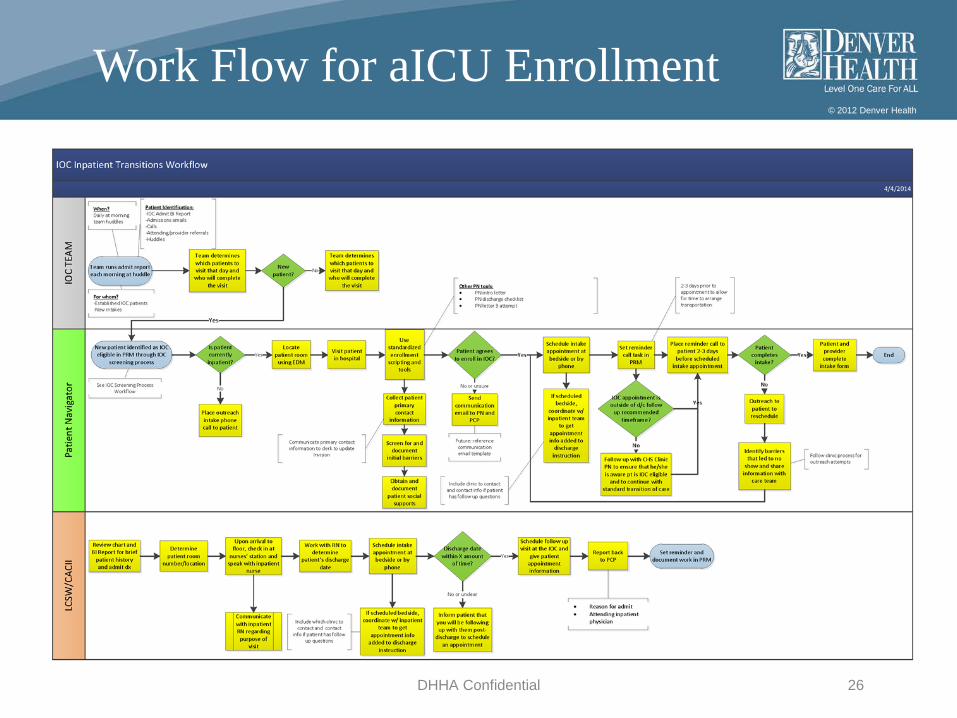
Work Flow for aICU Enrollment
DHHA Confidential 26

© 2012 Denver Health
Work Flow for aICU Enrollment
DHHA Confidential 27
© 2012 Denver Health
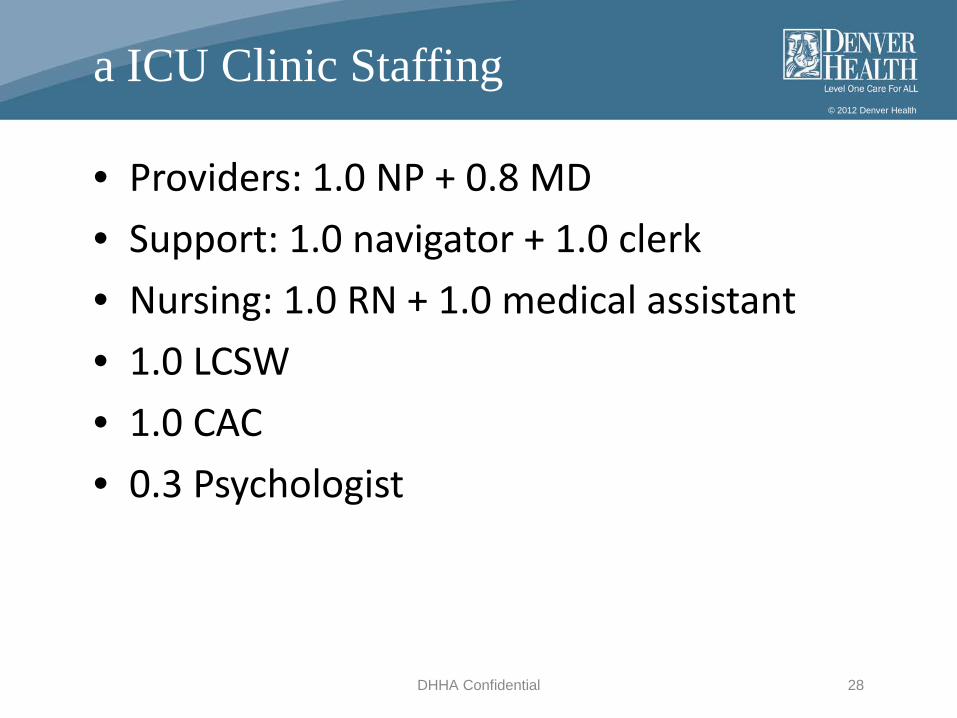
a ICU Clinic Staffing
• Providers: 1.0 NP + 0.8 MD• Support: 1.0 navigator + 1.0 clerk• Nursing: 1.0 RN + 1.0 medical assistant• 1.0 LCSW• 1.0 CAC• 0.3 Psychologist
DHHA Confidential 28

© 2012 Denver Health
aICU Patient enrollment (2013)
Ineligible695
Tier 4 Patients 7,219
Super-Utilizers2,409
Eligible601
Enrolled to IOC252
Not evaluated (prior to IOC opening)
1,113
Eligible: not enrolled*416
Refer to other high intensity team: MHCD, geriatrics, HIV, primary
cancer dx
Deemed non preventable admissions,
including emergency dialysis only patients

© 2012 Denver Health
a ICU Patient Demographics (2013)
Demographics(data from 2013)
Tier 4 pts (n=7219)
Tier 4 super utilizers (n=2409)
Ineligible(n=695)
Eligible, not enrolled(416)
Enrolled (n=252)
Homeless (%) 15 26 22 30 29
African American(%) 17 19 18 23 19
Latino (%) 33 36 37 37 33
CHF (%) 14 17 19 25 31
MH and SA (%) 26 51 46 52 61
# of meds 5 5 5 7 11

© 2012 Denver Health
a ICU Sustainability
• Evaluation – evidence of cost avoidance• Operational support – ongoing financing• Organizational support – provider
satisfaction• Patient support – patient satisfaction
DHHA Confidential 31

© 2012 Denver Health
Super-Utilizer Patient Experience: aICU
Preliminary Summary of Findings•Most of the clients interviewed liked the IOC•Felt respected (known to providers, not judged, not rushed, caring staff)•Better access (regular/same day appts, can call IOC and talk to someone)•IOC helped with medication management and connected them to other needed services•Most don’t want to “graduate” to regular primary care
Areas for improvement•Expand current clinic and establish more locations or “step-down” clinics•Nurse advice line dedicated to IOC patients (currently 2 day call back)•Home visits and social support outside the clinic•Better parking options and help with transportation
DHHA ConfidentialData Notes: Slide courtesy of Dr. Debbie Rinehart 32

© 2012 Denver Health
Super utilizers: next steps
• Clinical model development– Transitions back to “regular” primary care– Step down IOC at other clinic sites– Frequent ED users
• Evaluation– Enhanced analyses of super-utilizer subgroups– Cross-sector “super-utilization” (homeless & jail services)– Quasi-experimental analyses re: cost/utilization– Actuarial analyses
DHHA Confidential 33
© 2012 Denver Health
Contact Information
Contact information:
Holly Batal, MD, MBA [email protected], Clinical Lead
Tracy Johnson, PhD, MA, [email protected], Evaluation Lead
DHHA Confidential 34
Thank you!
© 2012 Denver Health
1.0 FTE Provider
0.33 FTE RN
1.0 FTE HCP
0.8 FTE Clerk
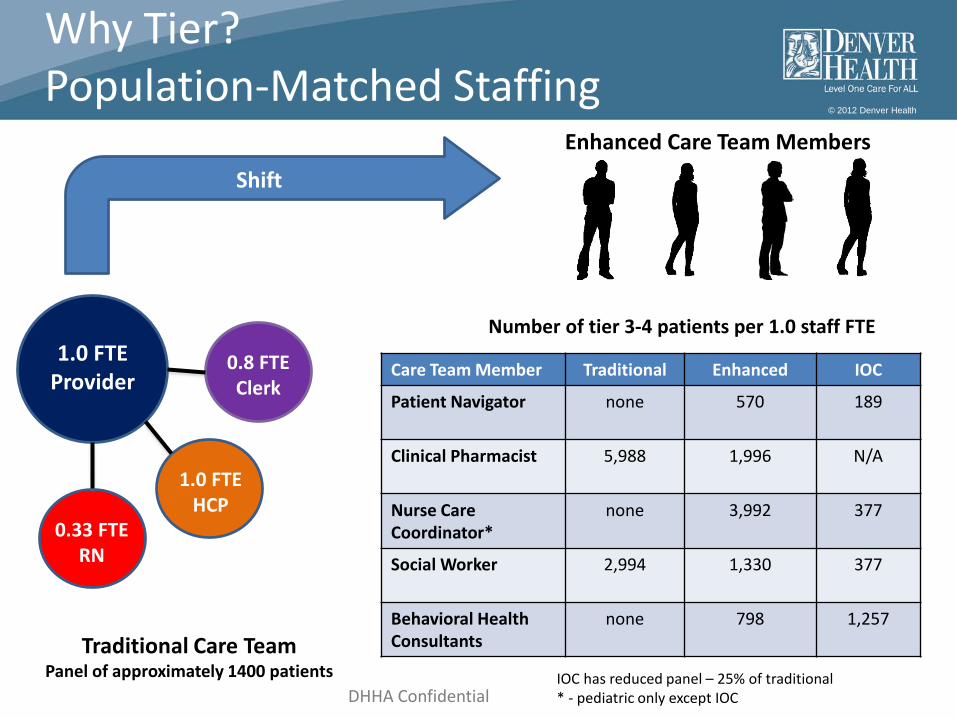
Traditional Care TeamPanel of approximately 1400 patients
Care Team Member Traditional Enhanced IOC
Patient Navigator none 570 189
Clinical Pharmacist 5,988 1,996 N/A
Nurse Care Coordinator*
none 3,992 377
Social Worker 2,994 1,330 377
Behavioral Health Consultants
none 798 1,257
Enhanced Care Team Members
Number of tier 3-4 patients per 1.0 staff FTE
Shift
Why Tier?Population-Matched Staffing
IOC has reduced panel – 25% of traditional* - pediatric only except IOCDHHA Confidential

© 2012 Denver Health
Why Tier?Provider Panel Analysis
Provider Patient Dashboard:
DHHA ConfidentialData Notes: Slide courtesy of Dan Brewer 36
© 2012 Denver Health
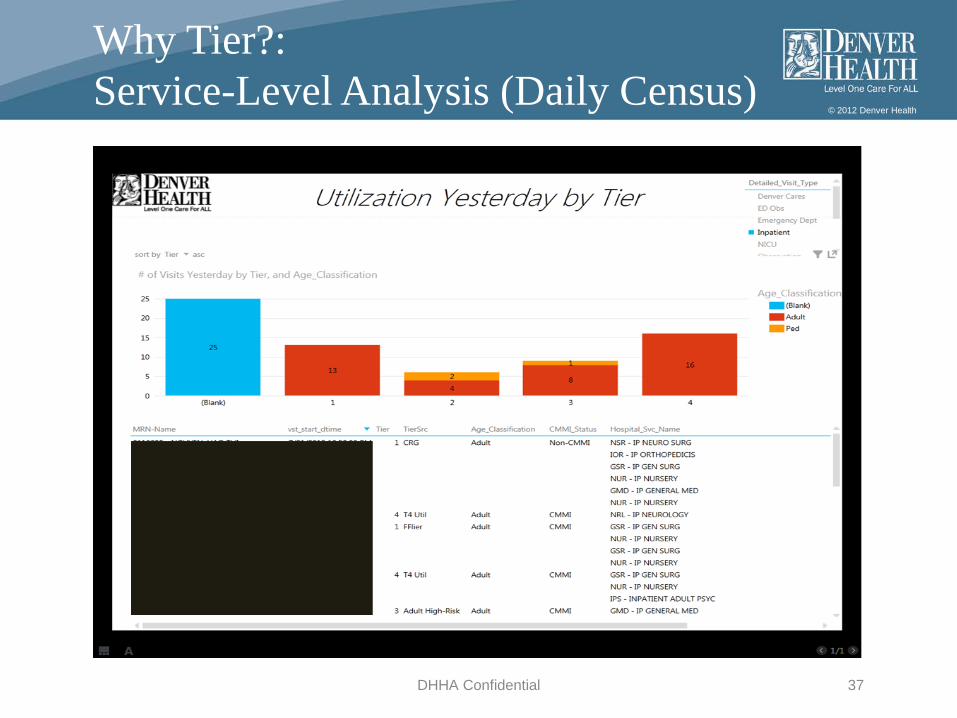
Why Tier?:Service-Level Analysis (Daily Census)
DHHA Confidential 37

© 2012 Denver Health
Why Tier?Patient-Specific Analysis
DHHA Confidential 38

© 2012 Denver Health
Why Tier?Population-Level (Geographic) Analysis
© 2012 Denver Health
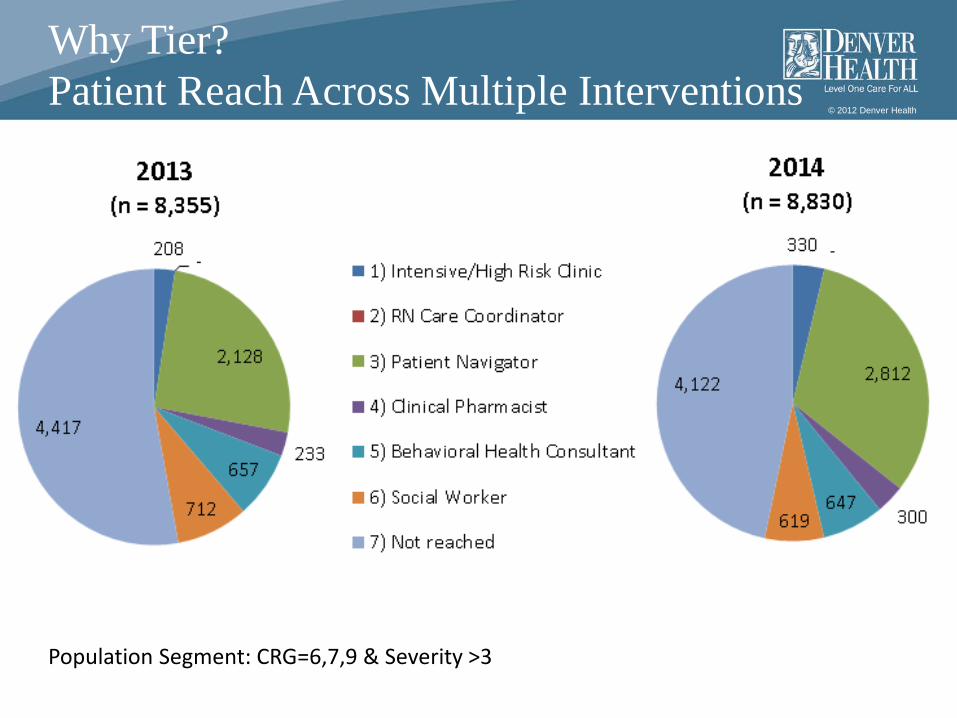
Why Tier?Patient Reach Across Multiple Interventions
Population Segment: CRG=6,7,9 & Severity >3