Dentists - fhb.gov.hk
158
Transcript of Dentists - fhb.gov.hk

Table of Contents
Page
List of Tables v List of Figures vi List of Appendices ix
1 INTRODUCTION 1
2 SETTING THE SCENE2
21 MODELS FOR POLICY LEVEL PLANNING 2
211 Need-based models2
212 Demandutilisation-based models 2
213 Benchmarking3
214 Trend analysis 3
22 LEARNING FROM INTERNATIONAL ORGANISATIONS3
221 World Health Organisation3
222 Organisation for Economic Cooperation and Development (OECD) 5
23 LEARNING FROM OVERSEAS JURISDICTIONS 6
231 Australia 6
232 Canada 7
233 Japan 8
234 The Netherlands 8
235 New Zealand9
236 Scotland10
237 Singapore 11
238 United Kingdom 11
239 United States 12
24 LEARNING FROM COMMONLY ADOPTED TECHNICAL APPROACHES 13
25 LEARNING FROM LOCAL EXPERIENCE IN WORKFORCE PLANNING 16
251 Department of Health16
252 Hospital Authority 16
253 Hong Kong Academy of Medicine17
254 Independent manpower planning and policy reviews 18
26 IMPLICATIONS FOR THE HONG KONG MANPOWER PROJECT 18
3 PROJECTING DEMAND 21
ii
31 MODELLING DEMAND 21
311 Empirically observed historical (EOH) approach 22
3111 Support vector machine (SVM)22
3112 Regression-based method (RBM)23
3113 Time series approach 24
312 Macroeconomic scenario drive (MSD) approach25
3121 Constant growth rate 25
3122 Historical growth rate 26
3123 Capped growth rate 26
32 MODEL COMPARISON27
321 International dentist utilisation rates30
33 PARAMETERS FOR DENTAL DEMAND MODEL PROJECTIONS 30
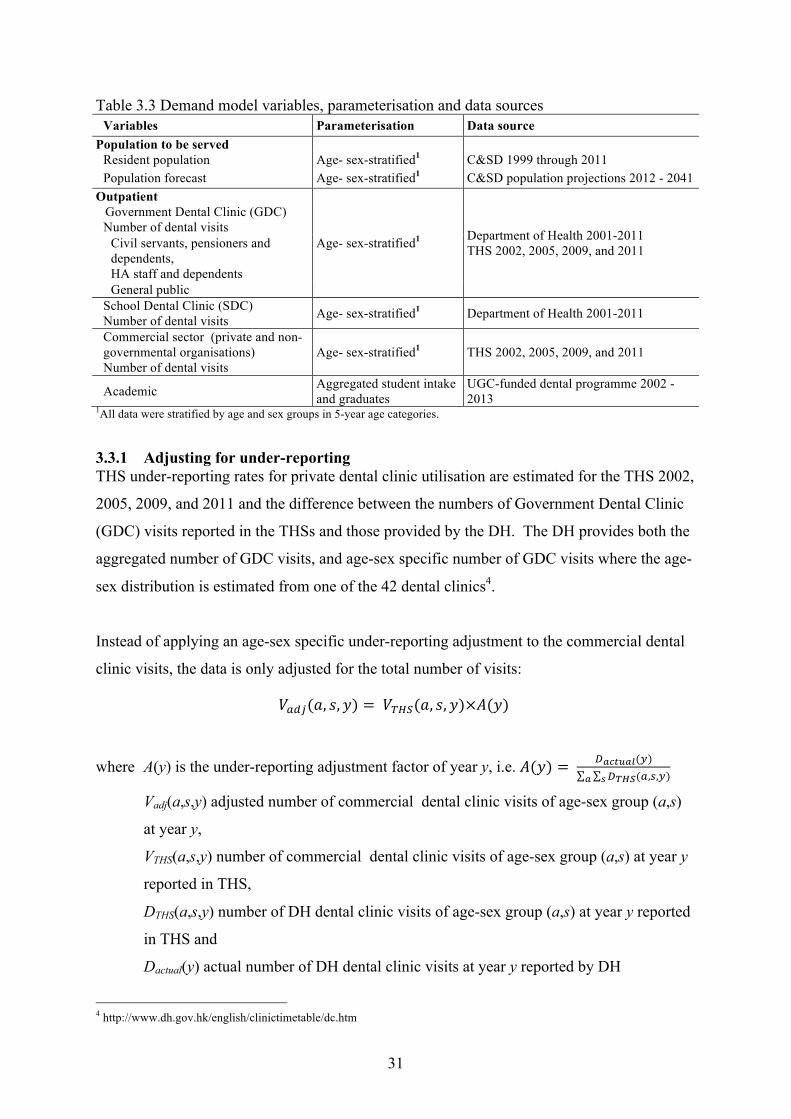
331 Adjusting for under-reporting 31
34 DEMAND INDICATORS32
341 Private dental sector 32
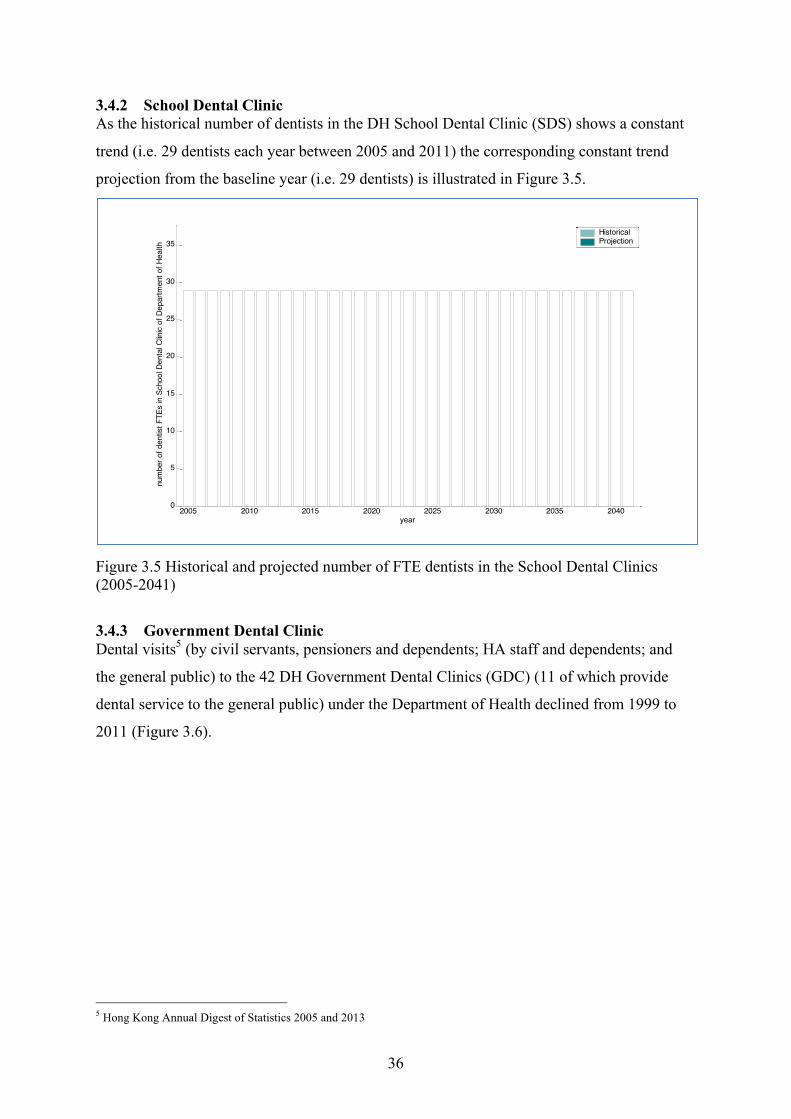
342 School Dental Clinic 36
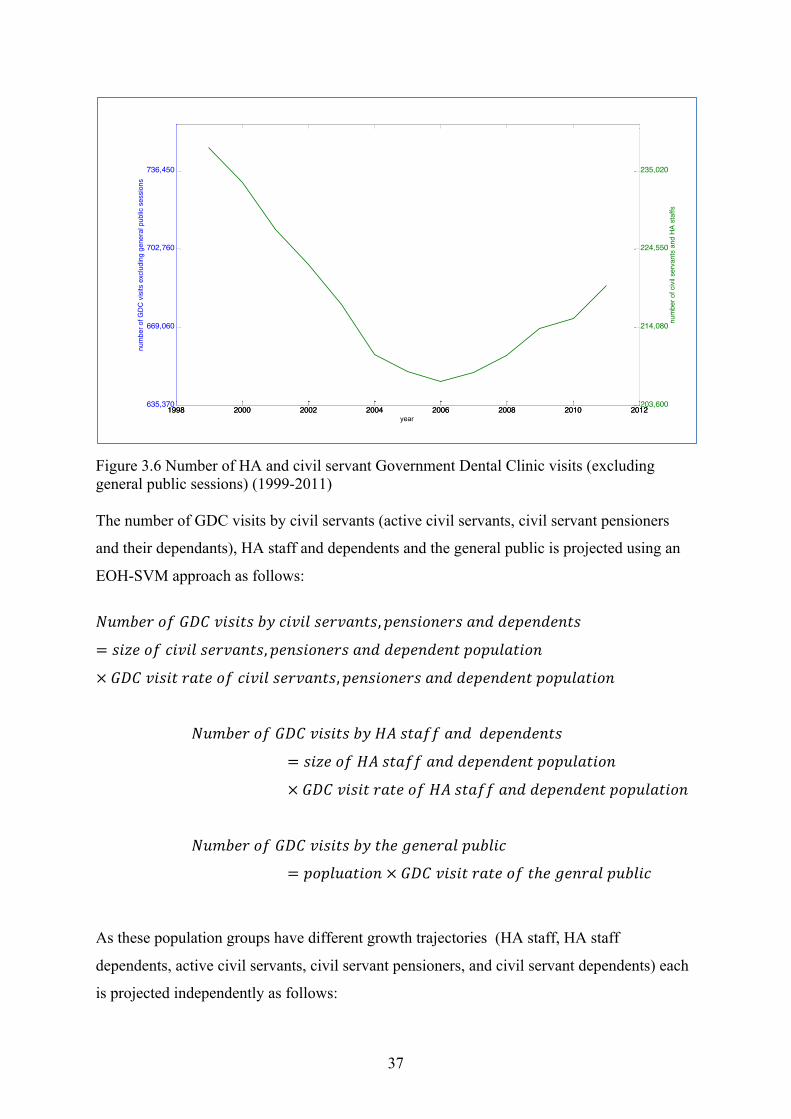
343 Government Dental Clinic 36
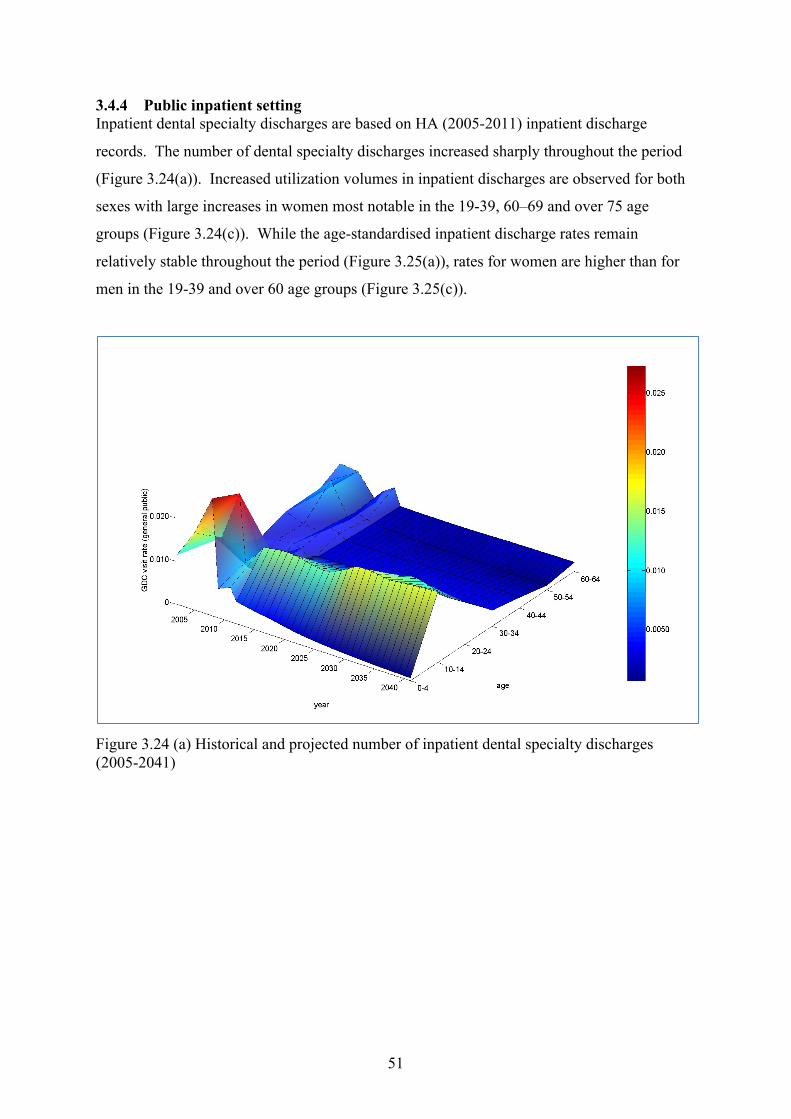
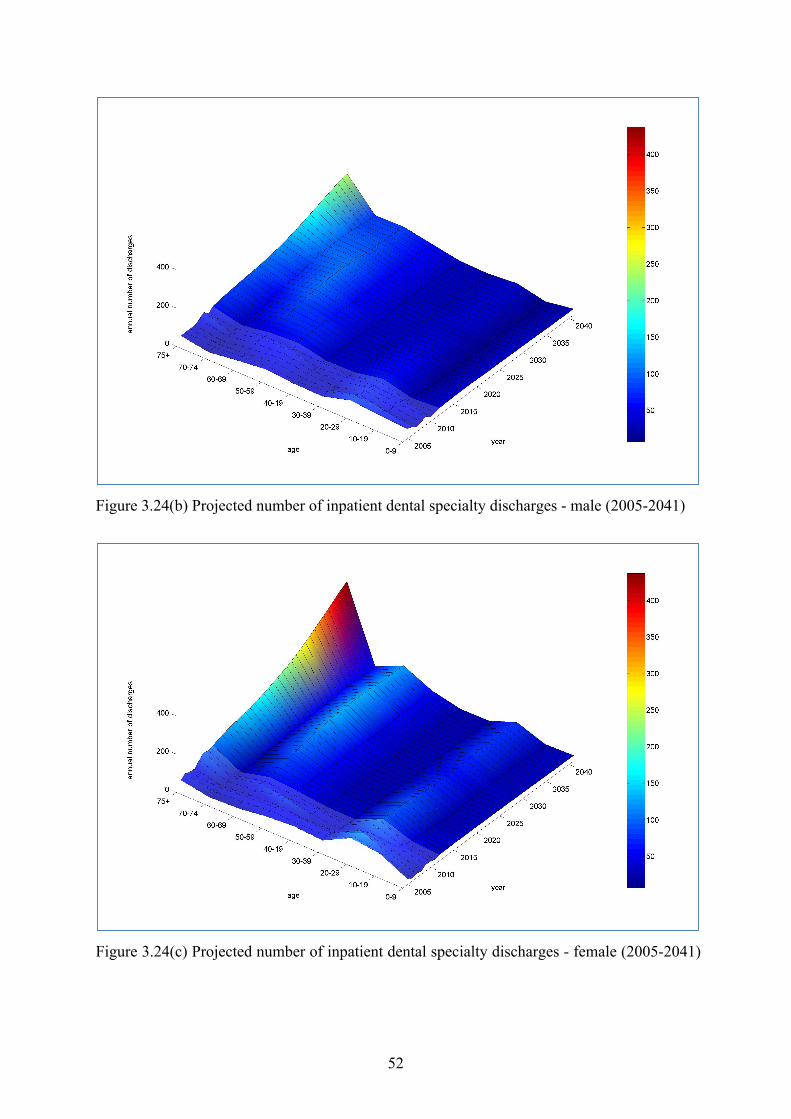
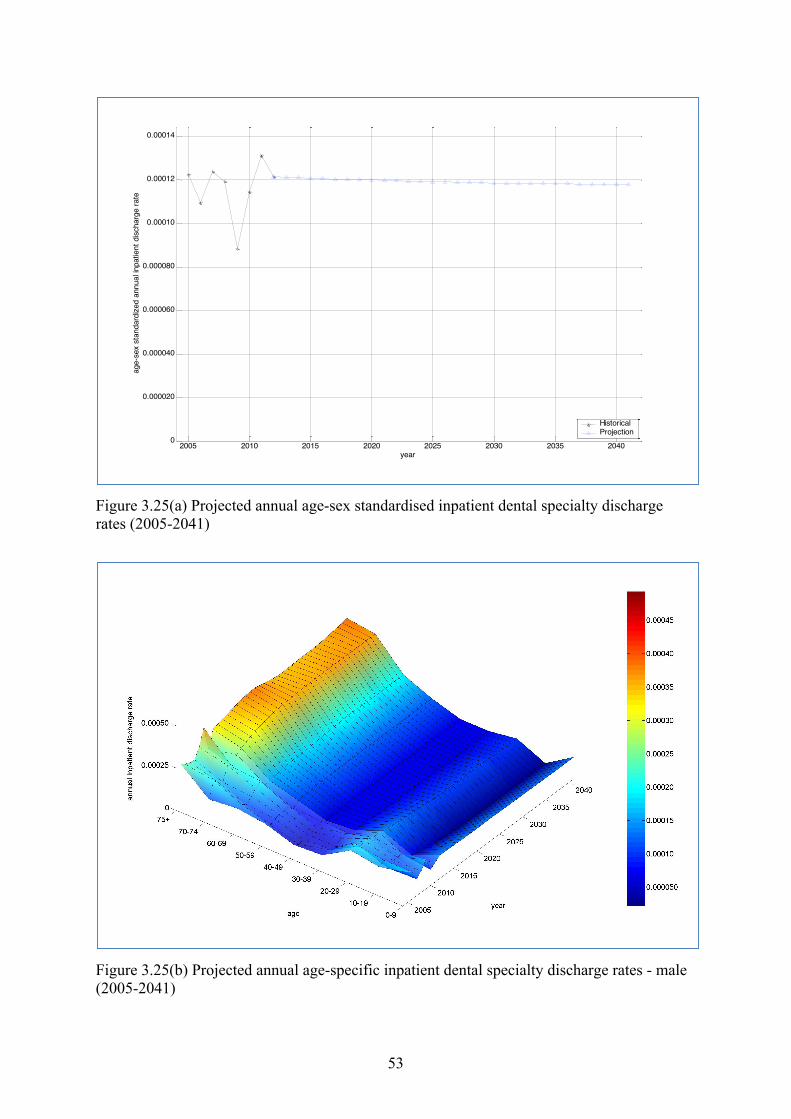
344 Public inpatient setting51
345 Academic sector 54
35 CONVERTING HEALTHCARE UTILISATION TO FULL TIME EQUIVALENTS (FTES) 55
351 Private sector 55
352 Public sector ndash Government Dental Clinics56
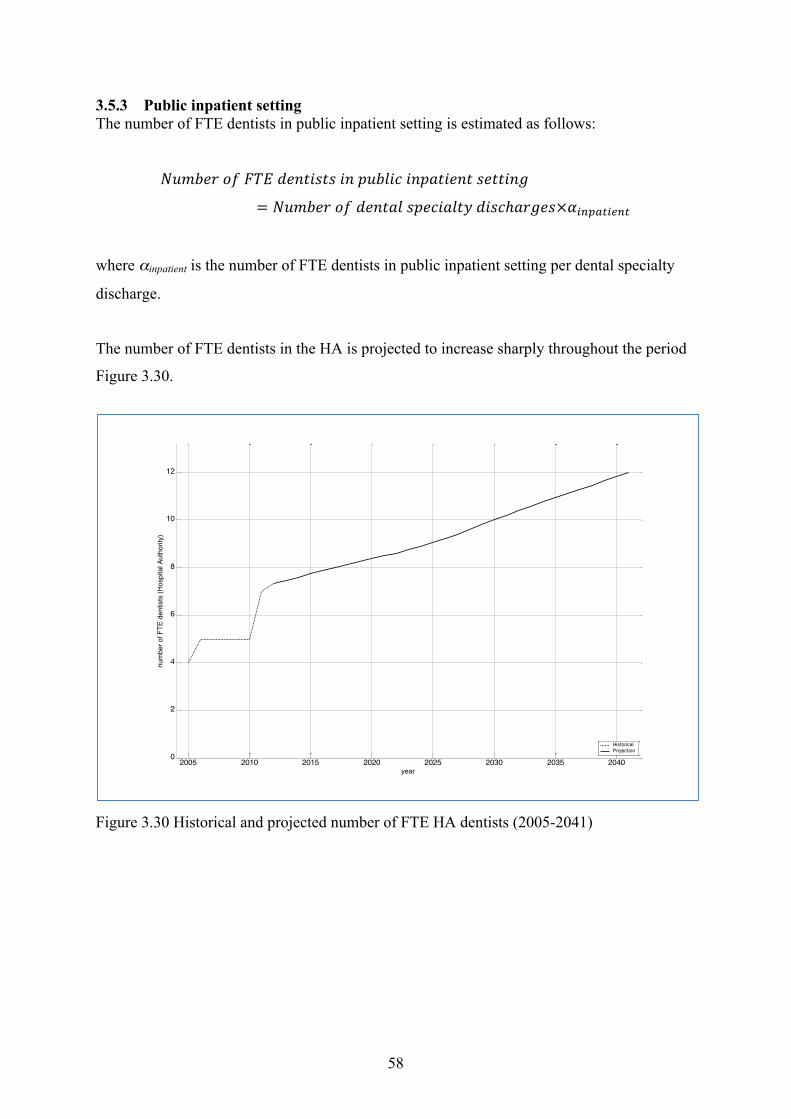
353 Public inpatient setting58
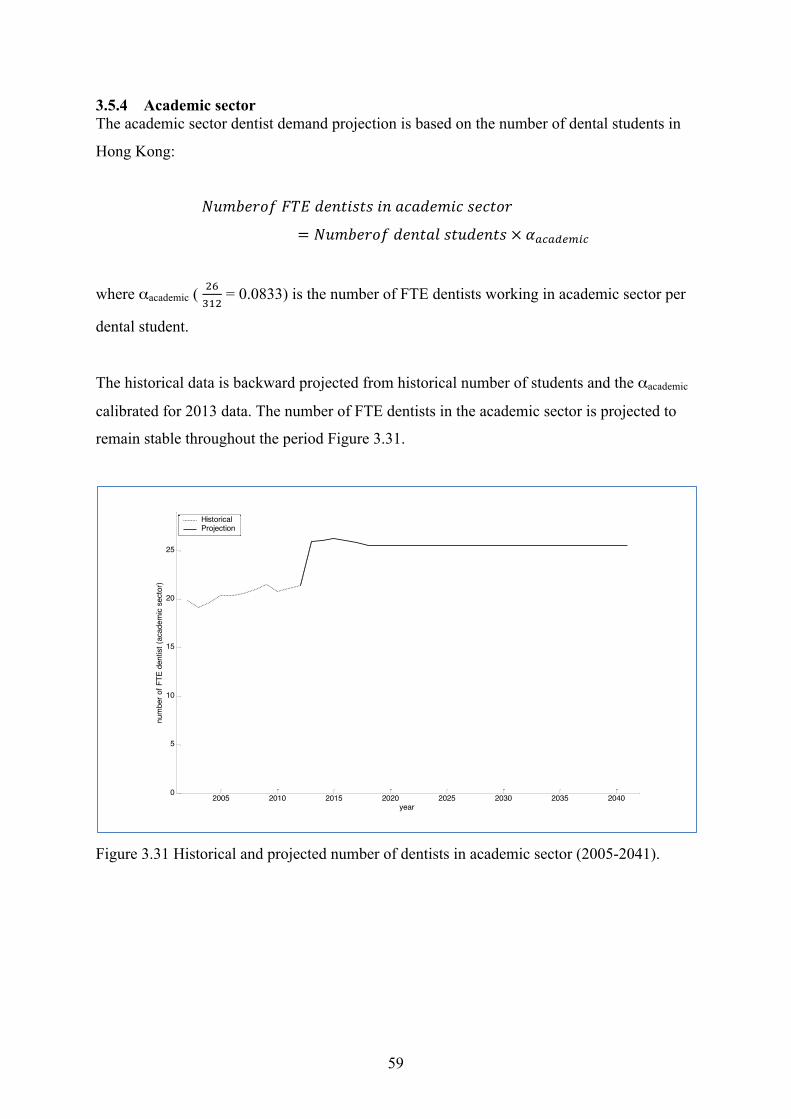
354 Academic sector 59
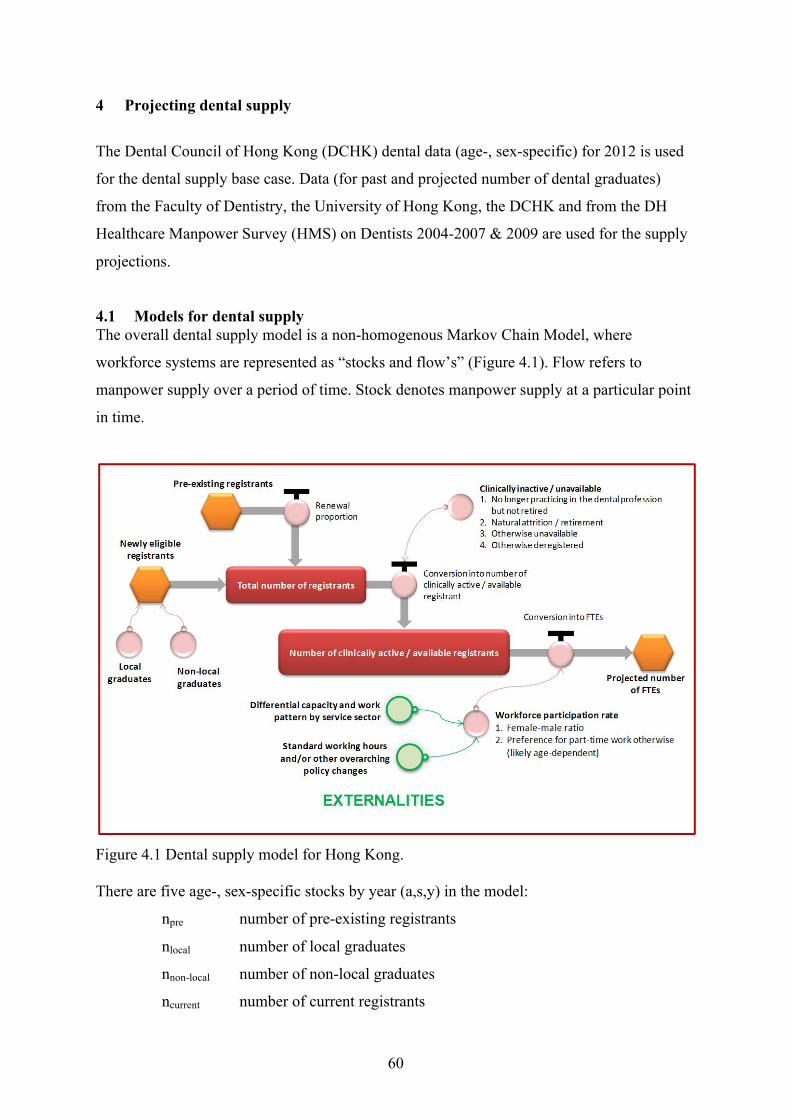
4 PROJECTING DENTAL SUPPLY 60
41 MODELS FOR DENTAL SUPPLY 60
42 DETERMINANTS OF SUPPLY PROJECTING STOCK AND FLOW 61
421 Baseline adjustments 61
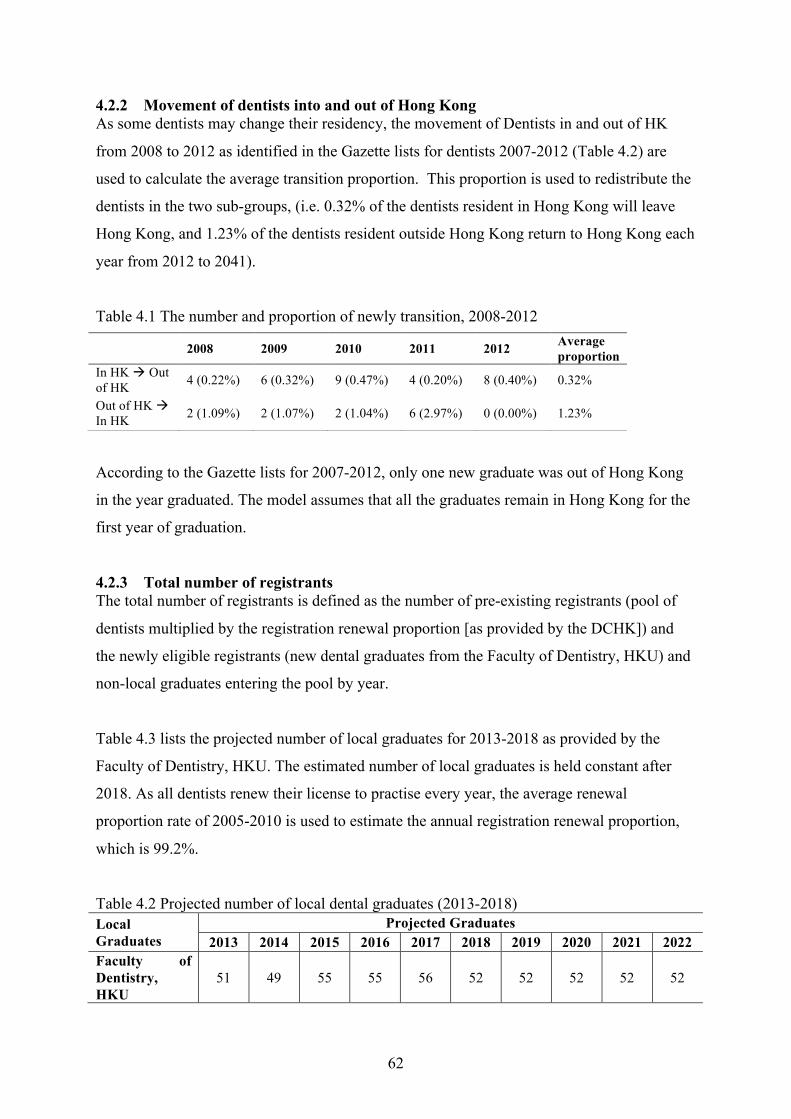
422 Movement of dentists into and out of Hong Kong62
423 Total number of registrants62
424 Number clinically active63
4241 No longer practicing in the dental profession but not retired 63
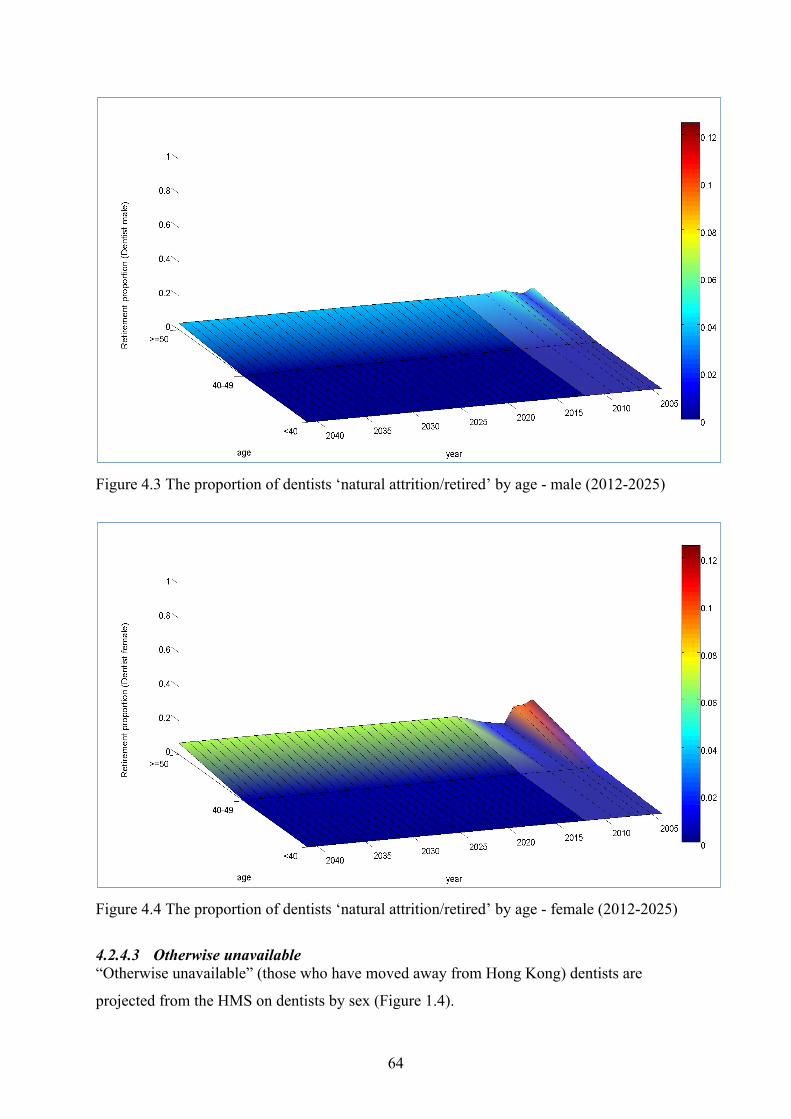
4242 Natural attritionretirement 63
iii
4243 Otherwise unavailable64
43 SUPPLY EXTERNALITIES65
431 Workforce participation and differential work capacity65
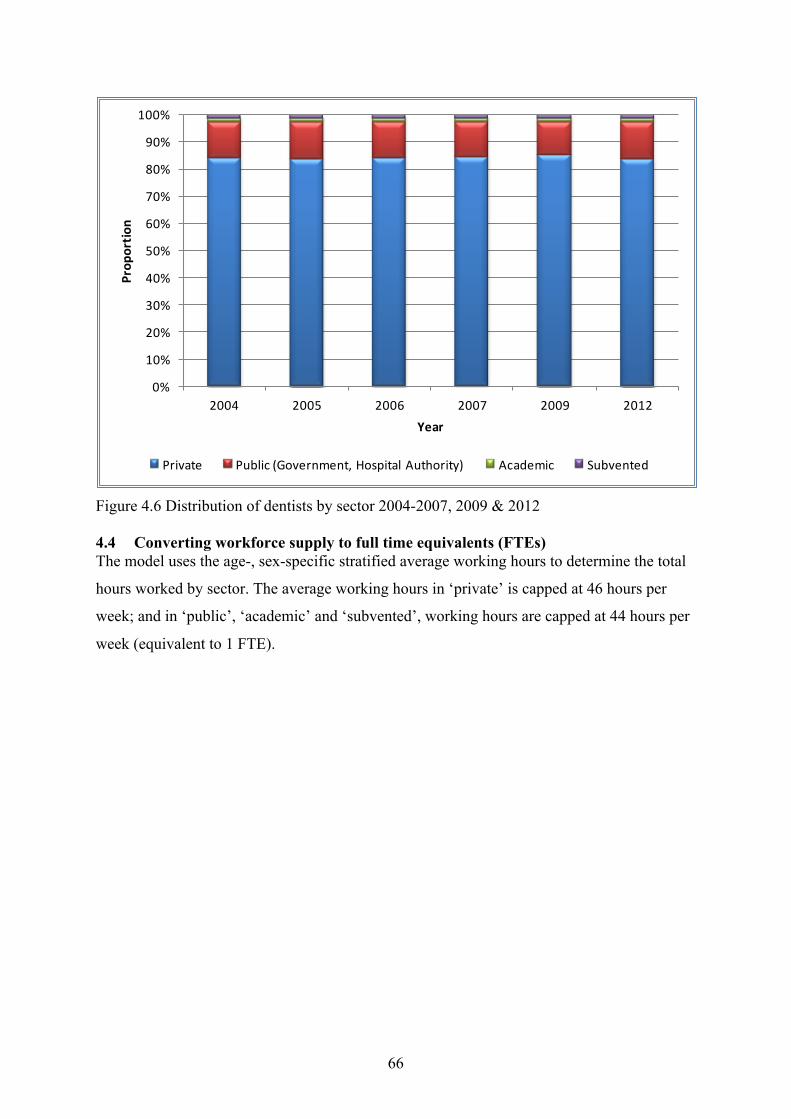
44 CONVERTING WORKFORCE SUPPLY TO FULL TIME EQUIVALENTS (FTES) 66
45 DENTIST SUPPLY PROJECTION FROM 2012-2041 67
5 GAP ANALYSIS68
51 METHOD 69
52 ANNUAL NUMBER OF FTE 69
53 YEAR-ON-YEAR FTE69
54 ANNUAL INCREMENTAL FTE69
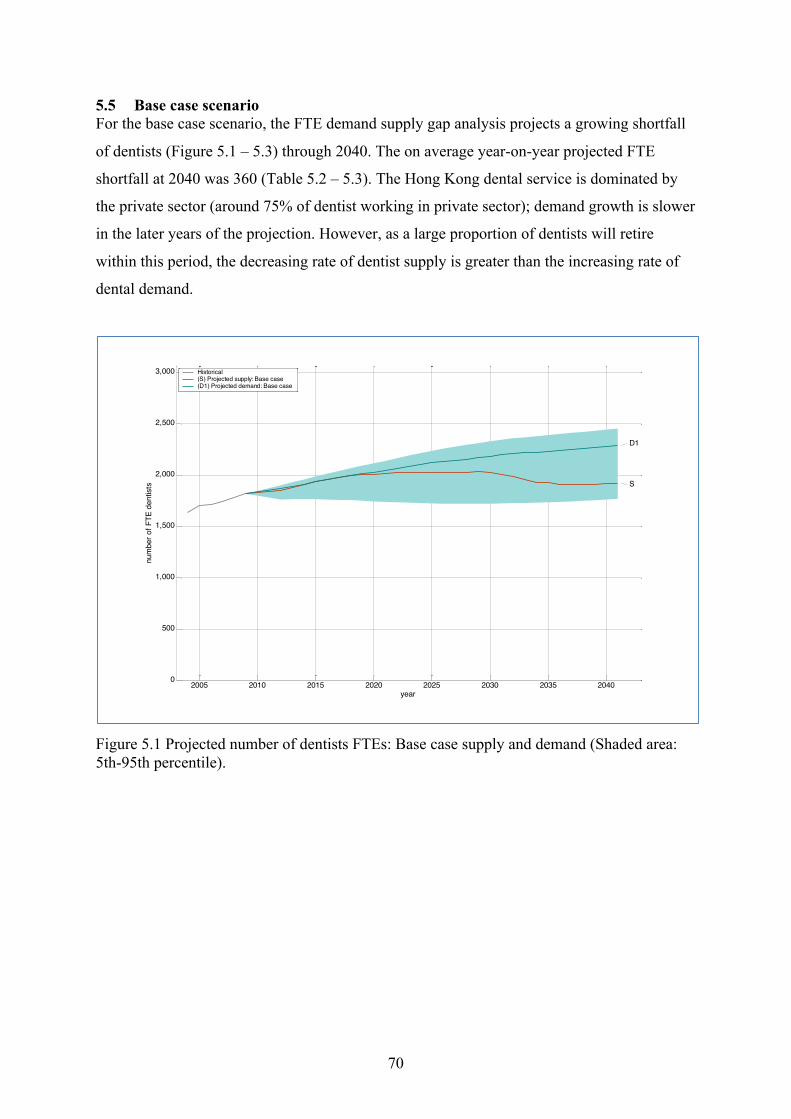
55 BASE CASE SCENARIO 70
6 POLICY OPTIONS73
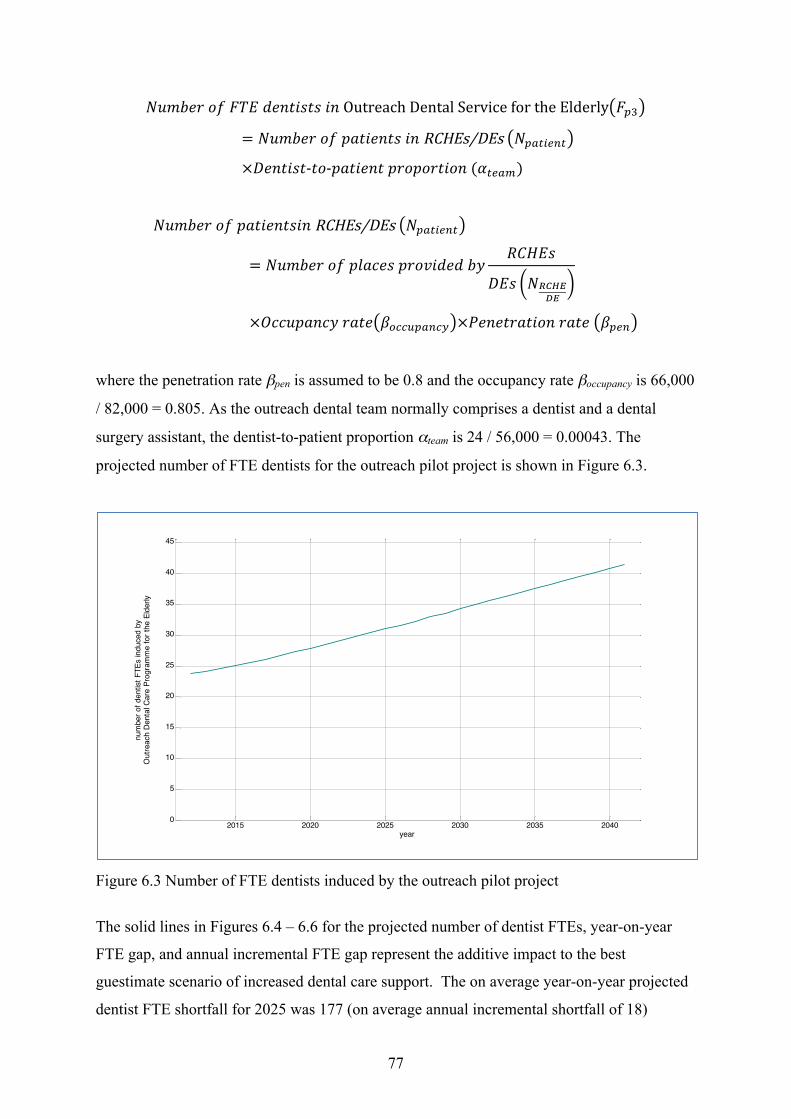
61 DENTAL CARE SUPPORT 73
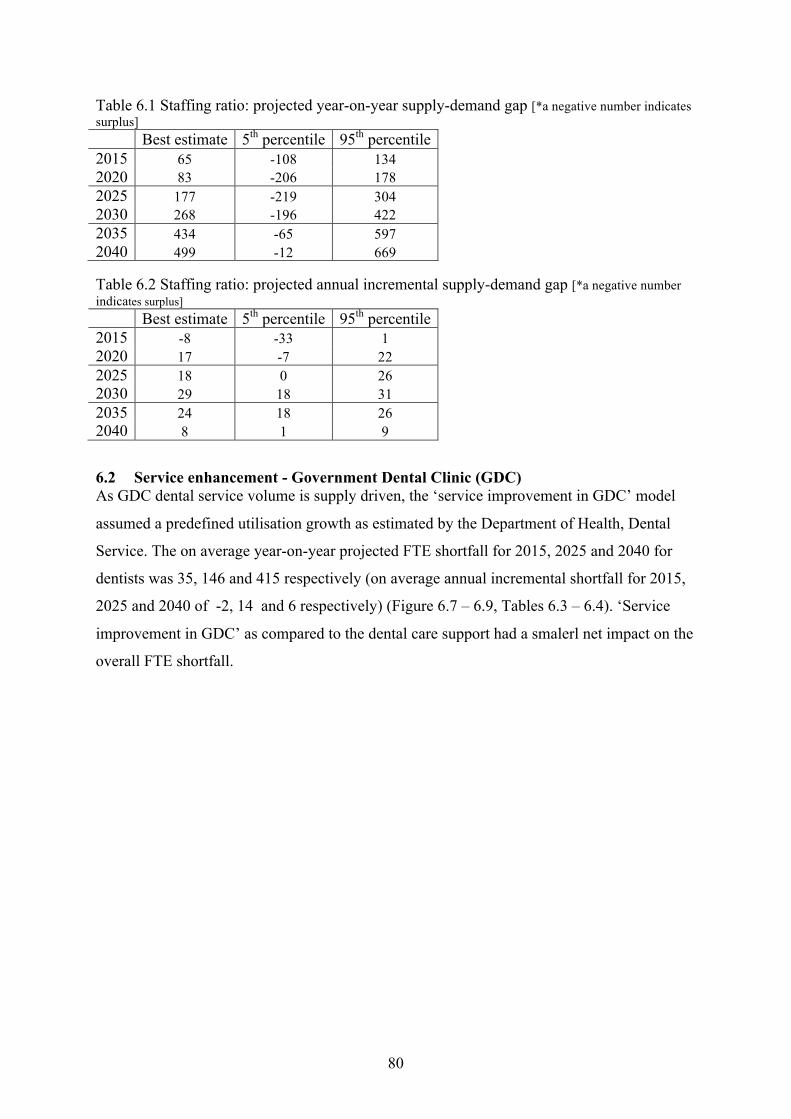
62 SERVICE ENHANCEMENT - GOVERNMENT DENTAL CLINIC (GDC) 80
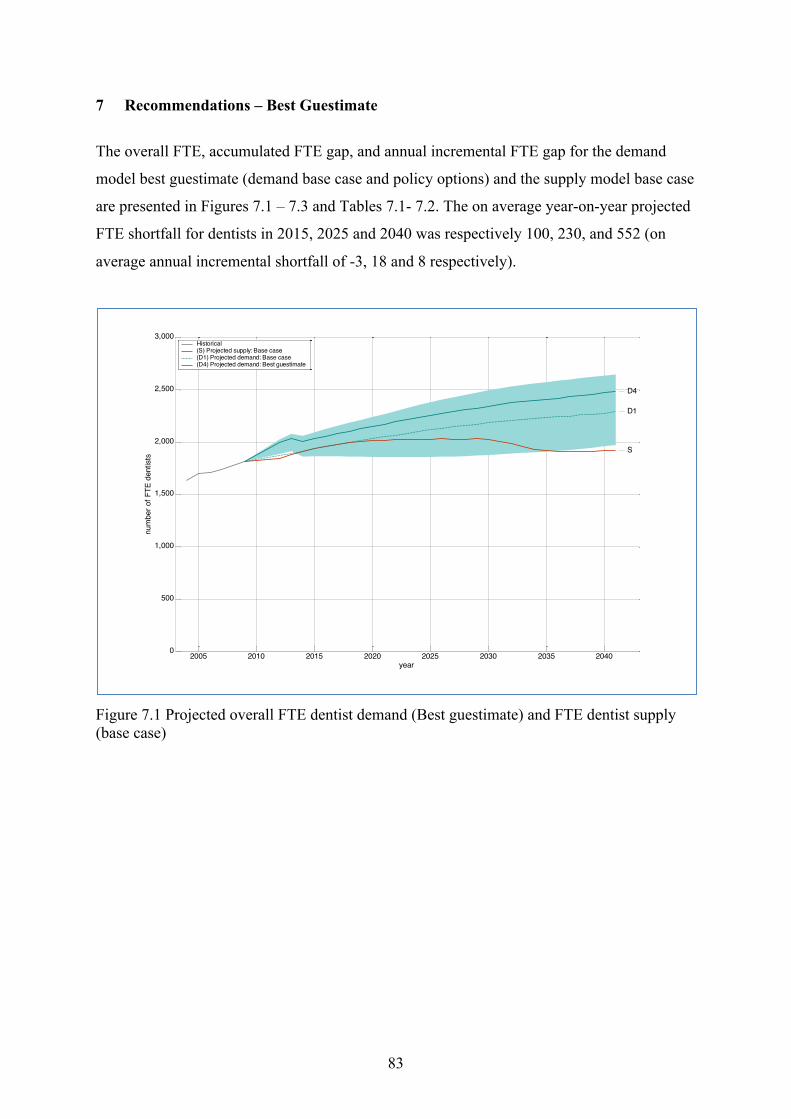
7 RECOMMENDATIONS ndash BEST GUESTIMATE 83
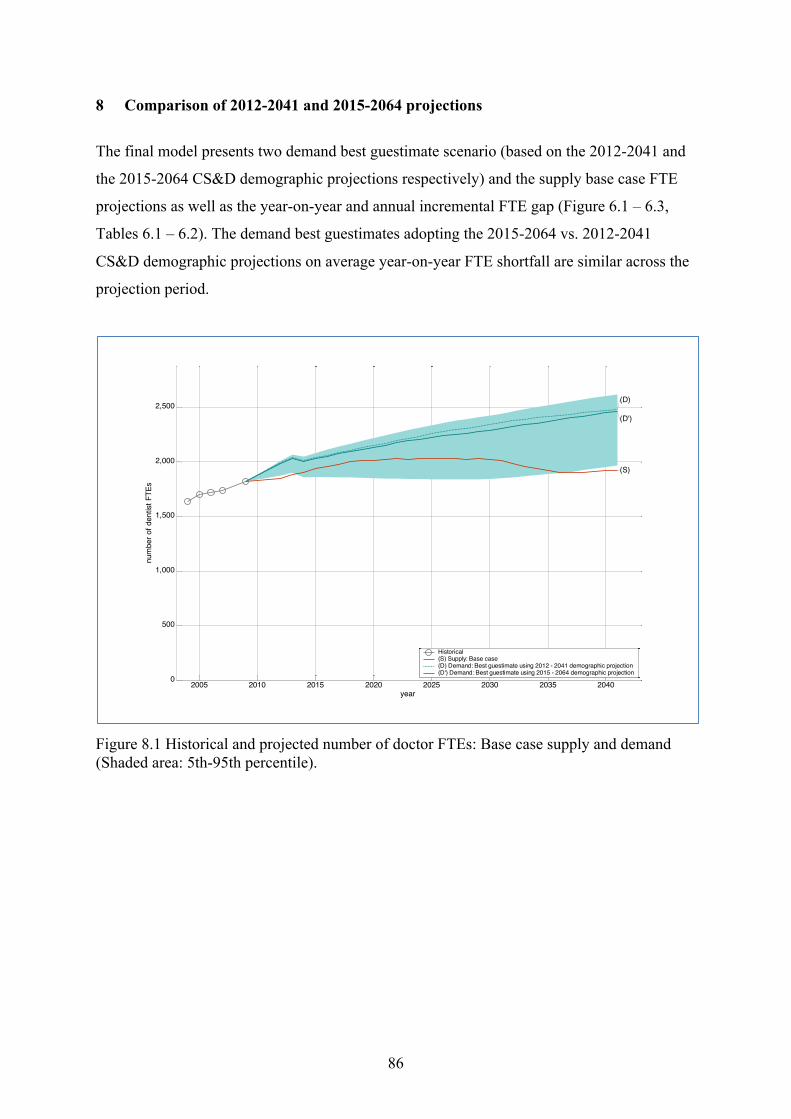
8 COMPARISON OF 2012-2041 AND 2015-2064 PROJECTIONS 86
9 REFERENCES89
iv
List of Tables
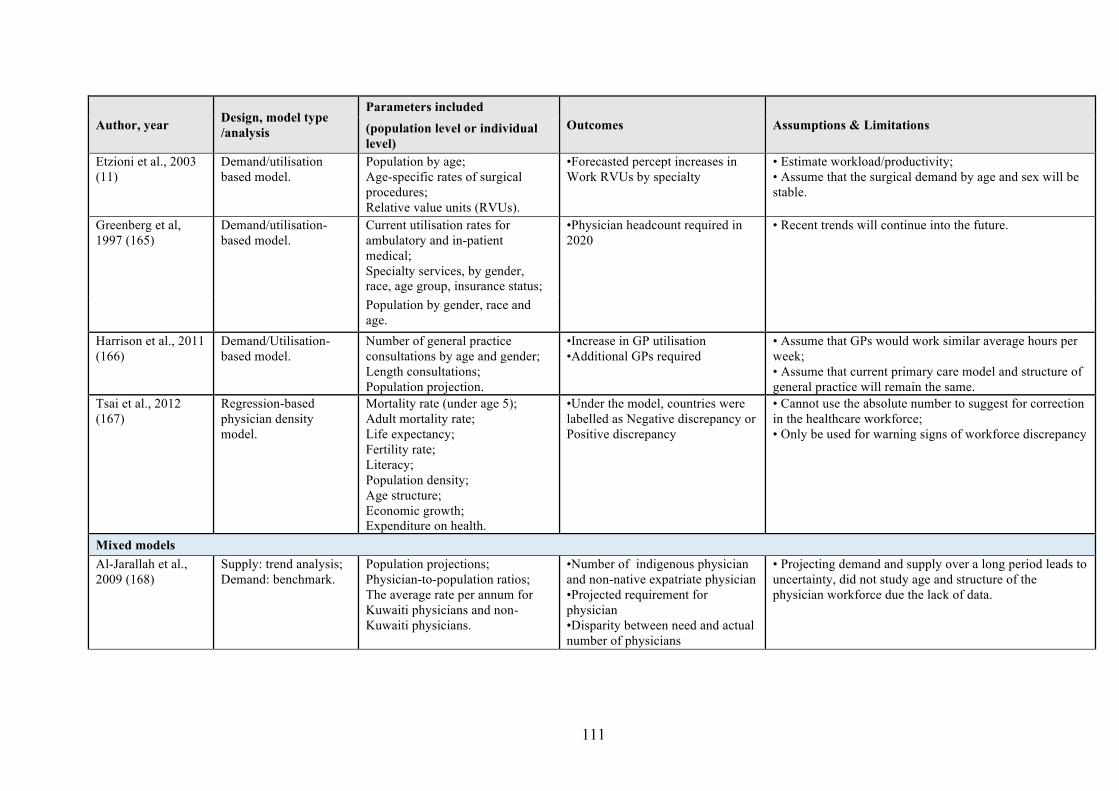
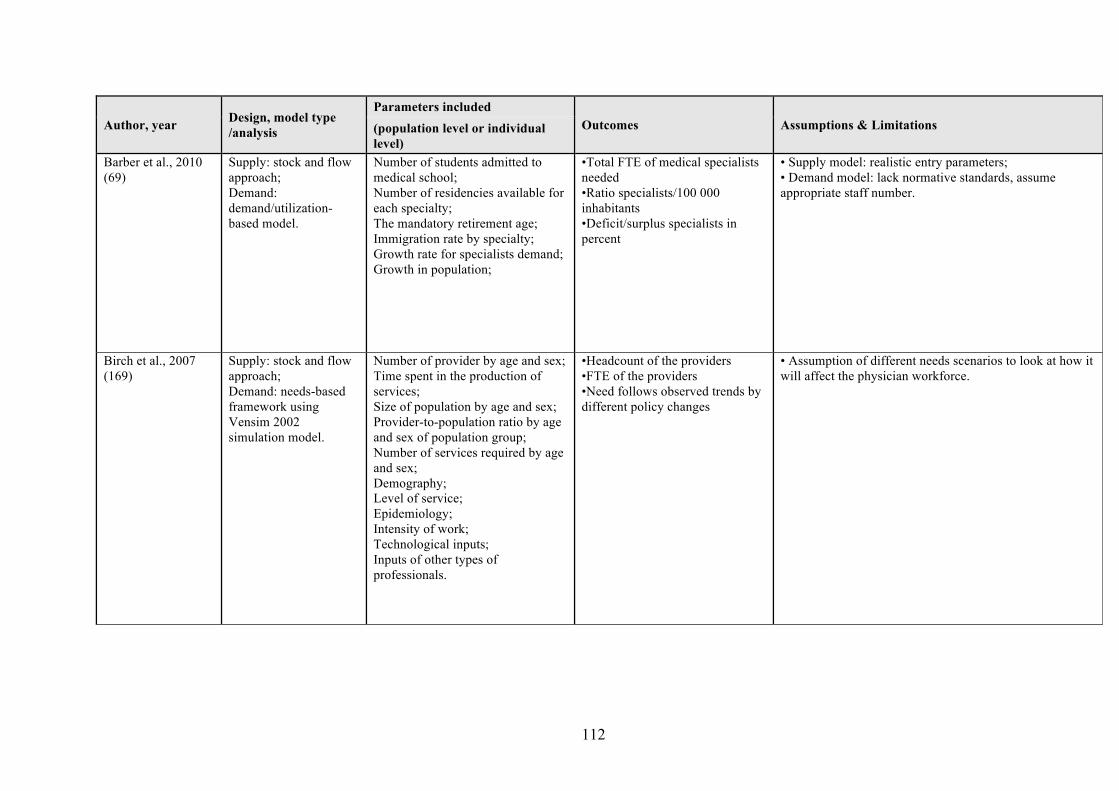
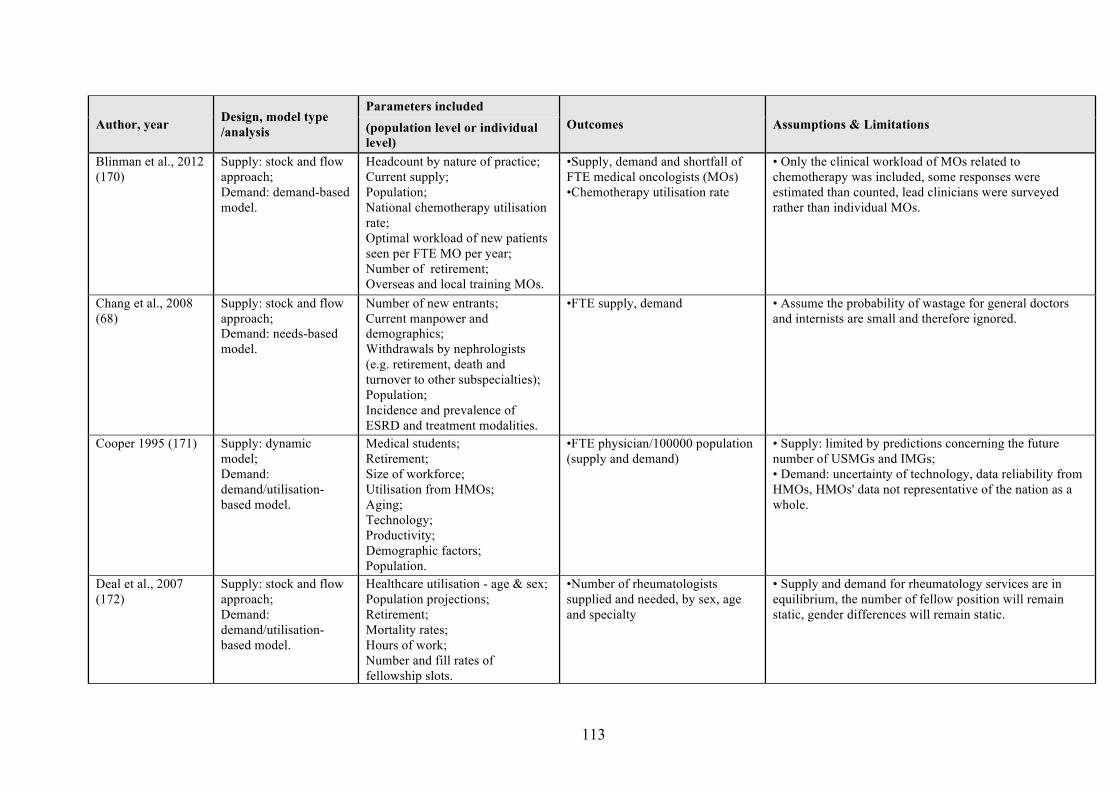
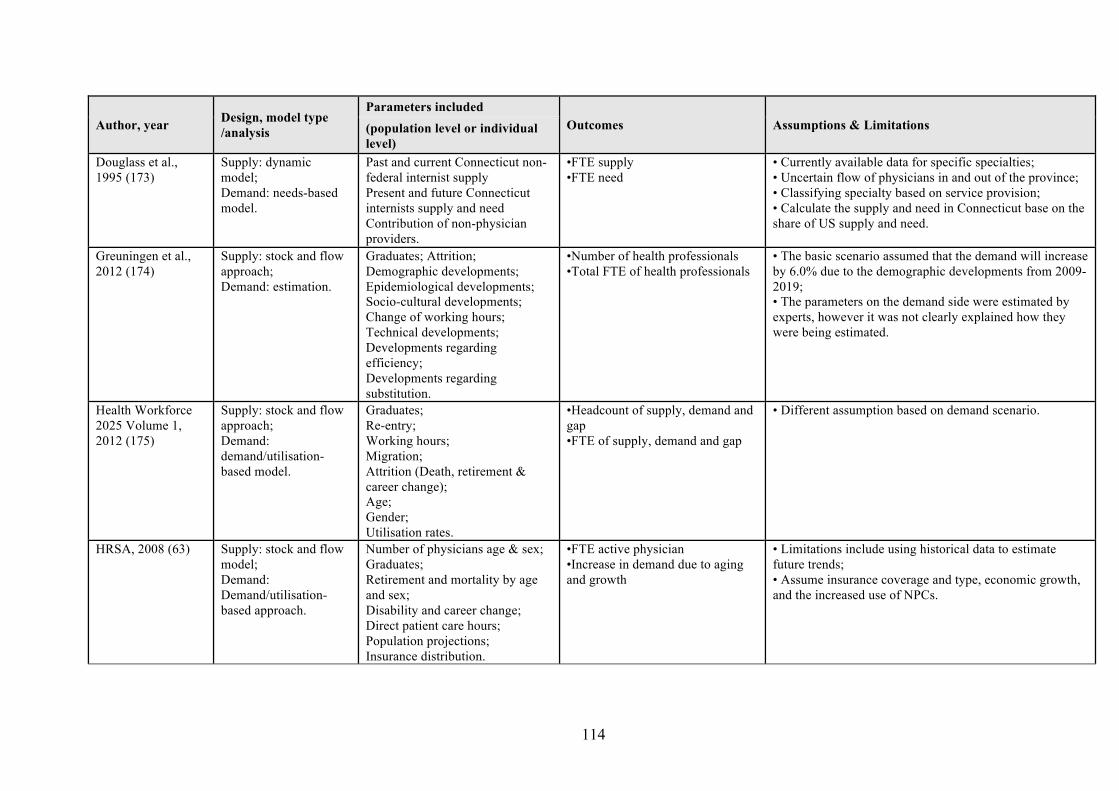
Table 21 Projection methods demand and supply parameters for manpower projection models by healthcare professionals 15
Table 31 Comparison of EOH-SVM MSD-constant growth MSD-historical growth rate
Table 32 Comparison of the linear and exponential RBM utilisation projections mean
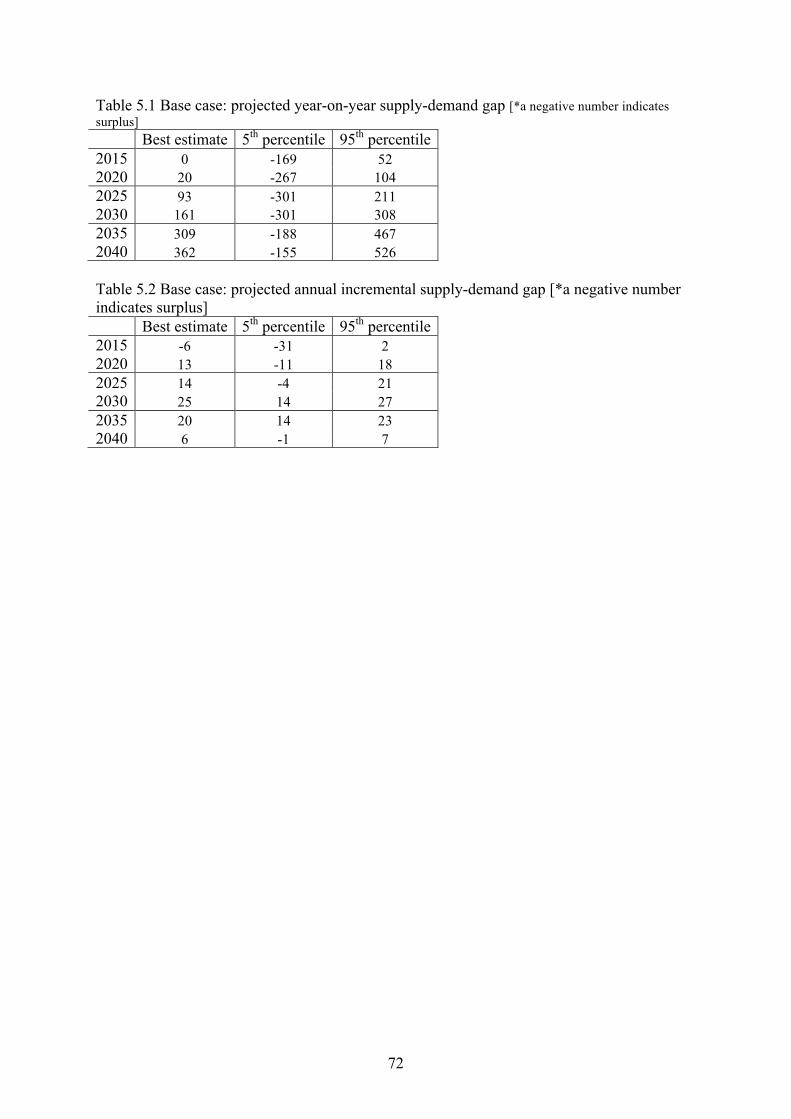
Table 51 Base case projected year-on-year supply-demand gap [a negative number
Table 52 Base case projected annual incremental supply-demand gap [a negative number
Table 61 Staffing ratio projected year-on-year supply-demand gap [a negative number
Table 62 Staffing ratio projected annual incremental supply-demand gap [a negative
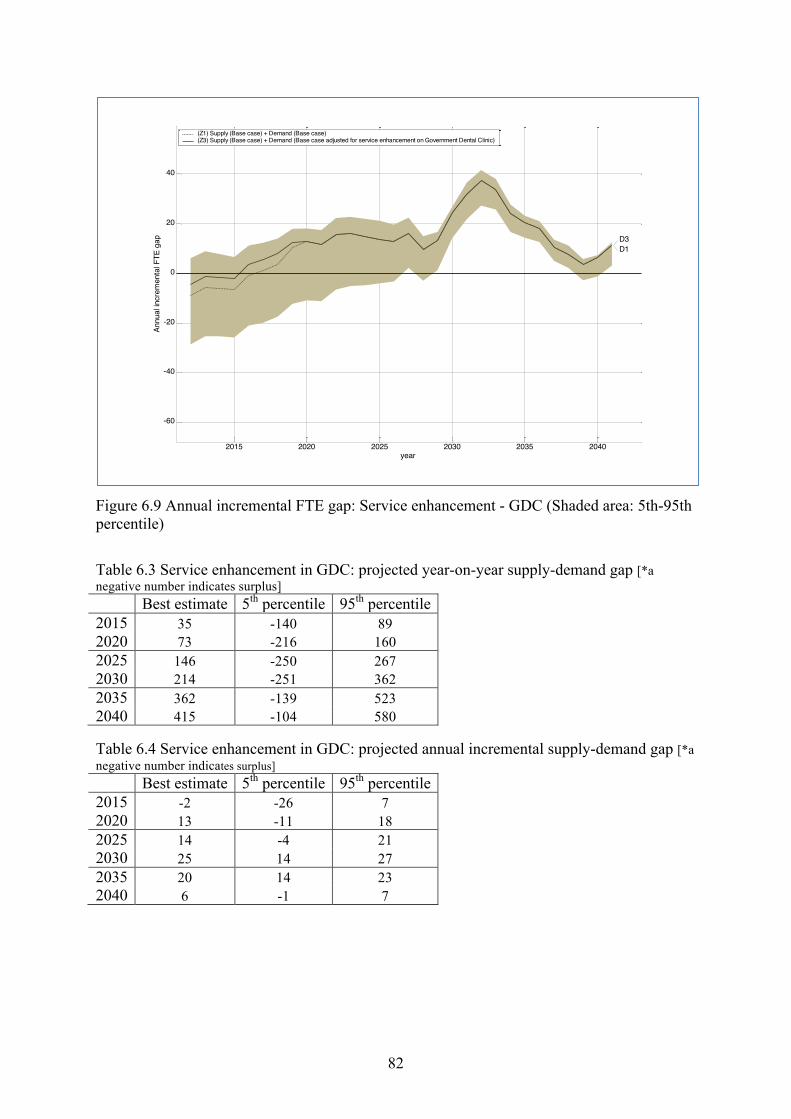
Table 63 Service enhancement in GDC projected year-on-year supply-demand gap [a
Table 64 Service enhancement in GDC projected annual incremental supply-demand gap
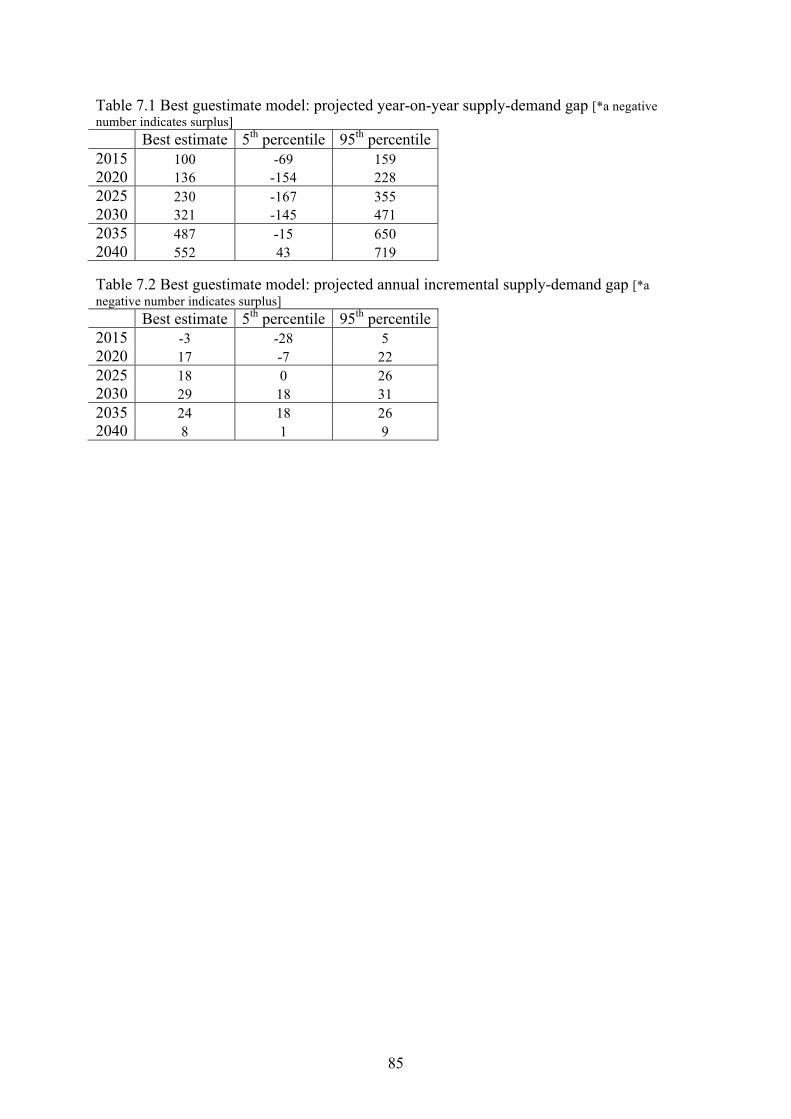
Table 71 Best guestimate model projected year-on-year supply-demand gap [a negative
Table 72 Best guestimate model projected annual incremental supply-demand gap [a
Table 81 Best guestimate projected year-on-year supply-demand gap (assuming retirement
Table 82 Best guestimate projected annual incremental supply-demand gap (assuming
estimation errors28
squared error (MSE) for selected demandutilisation variables29
Table 33 Demand model variables parameterisation and data sources 31
Table 41 The number and proportion of newly transition 2008-201262
Table 42 Projected number of local dental graduates (2013-2018)62
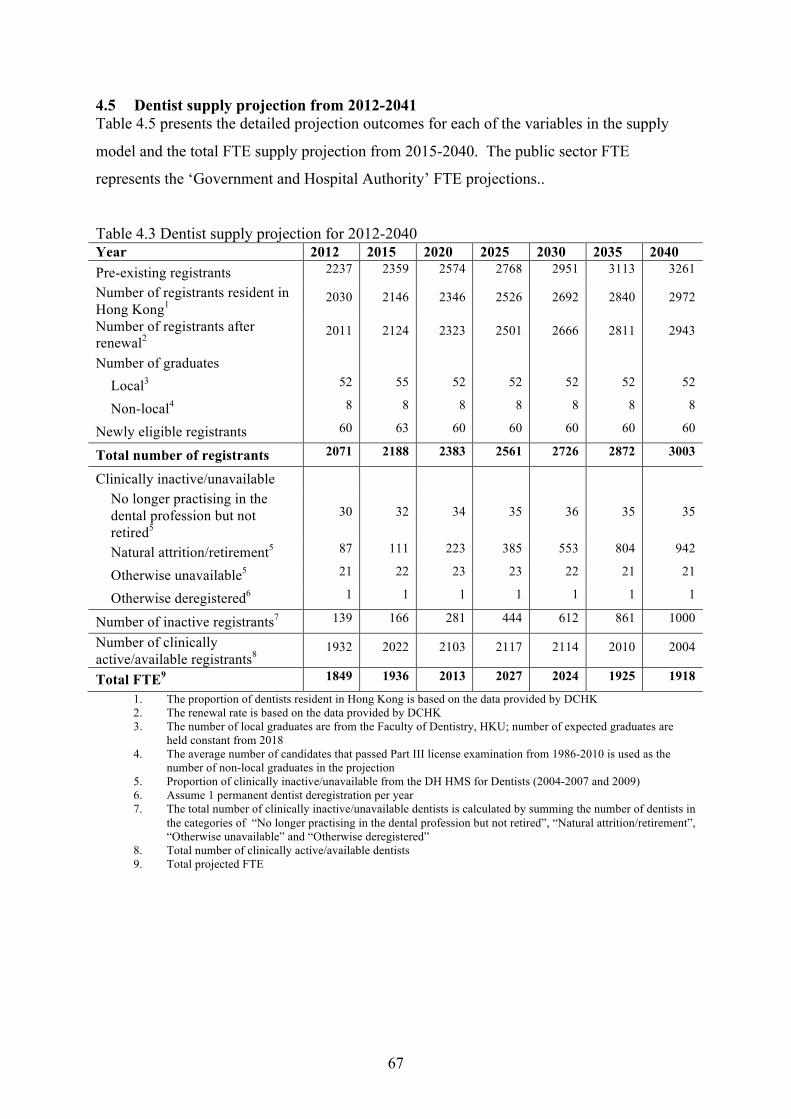
Table 43 Dentist supply projection for 2012-2040 67
indicates surplus] 72
indicates surplus] 72
indicates surplus] 80
number indicates surplus] 80
negative number indicates surplus]82
[a negative number indicates surplus]82
number indicates surplus] 85
negative number indicates surplus]85
=gt65 years of age) [a negative number indicates surplus] 88
retirement =gt65 years of age) [a negative number indicates surplus] 88
v
List of Figures Figure 21 (reproduced from WHO original) WHO concepts for linking healthcare workforce
requirements and supply projections (7)5
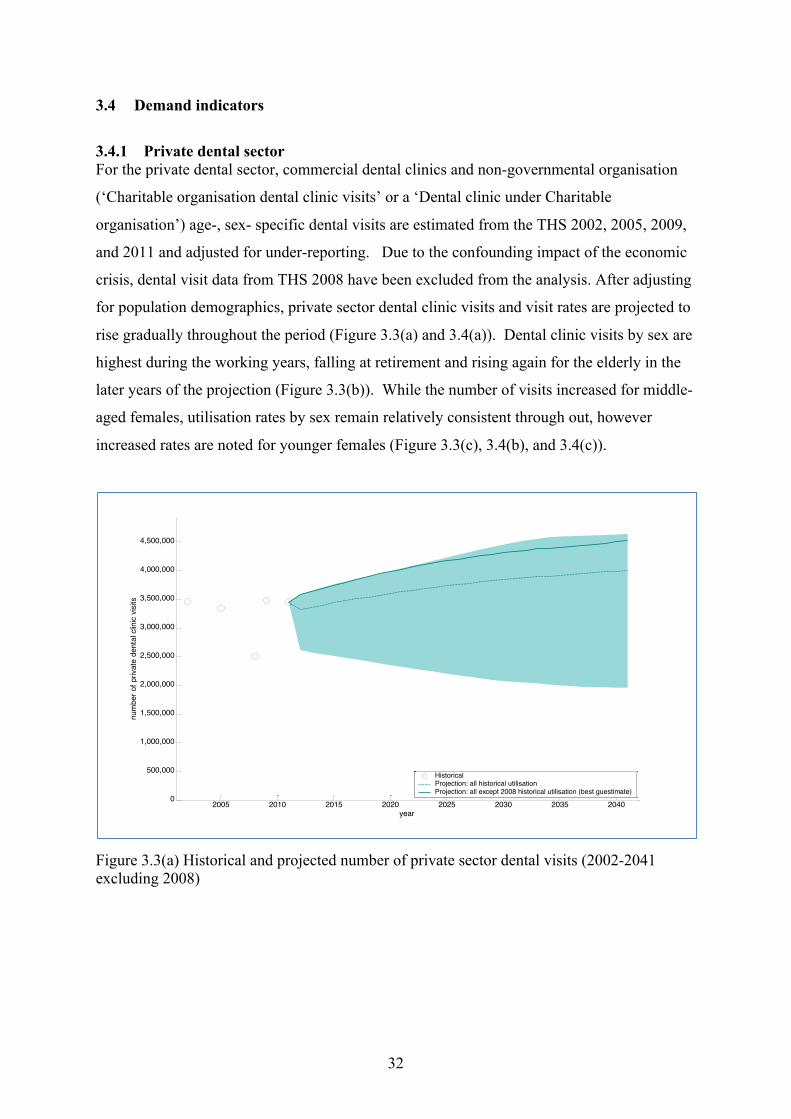
Figure 33(a) Historical and projected number of private sector dental visits (2002-2041
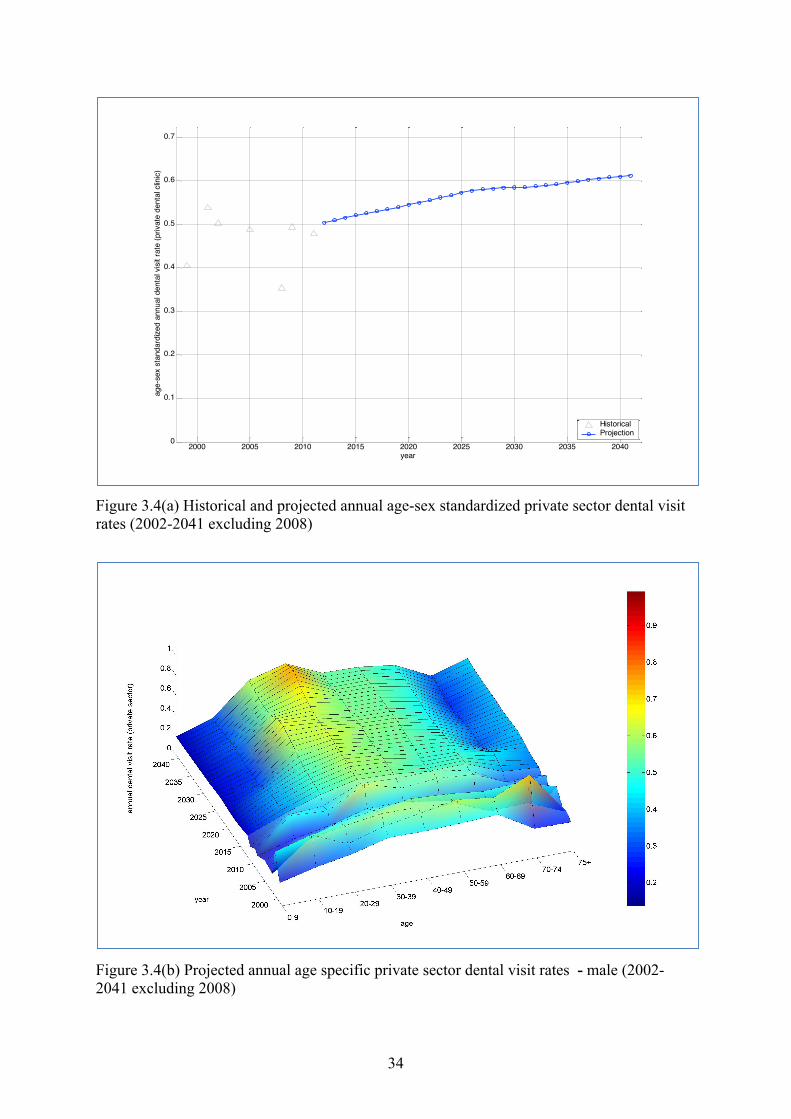
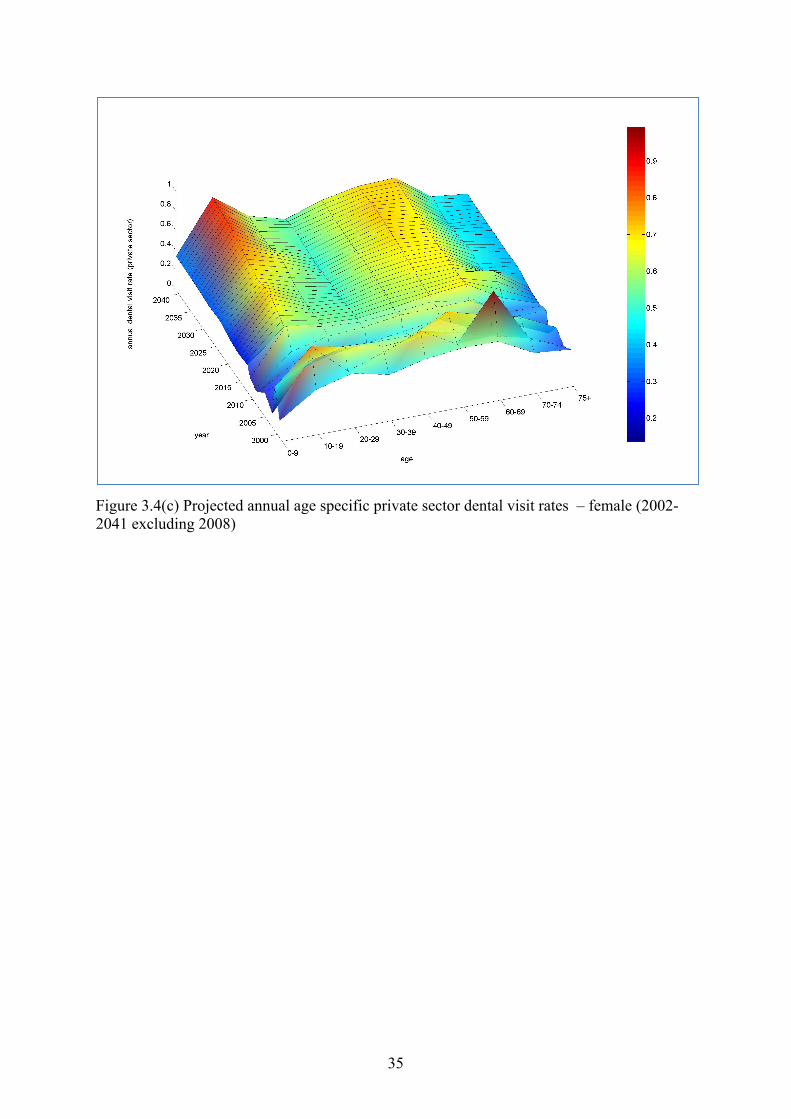
Figure 34(a) Historical and projected annual age-sex standardized private sector dental visit
Figure 35 Historical and projected number of FTE dentists in the School Dental Clinics
Figure 36 Number of HA and civil servant Government Dental Clinic visits (excluding
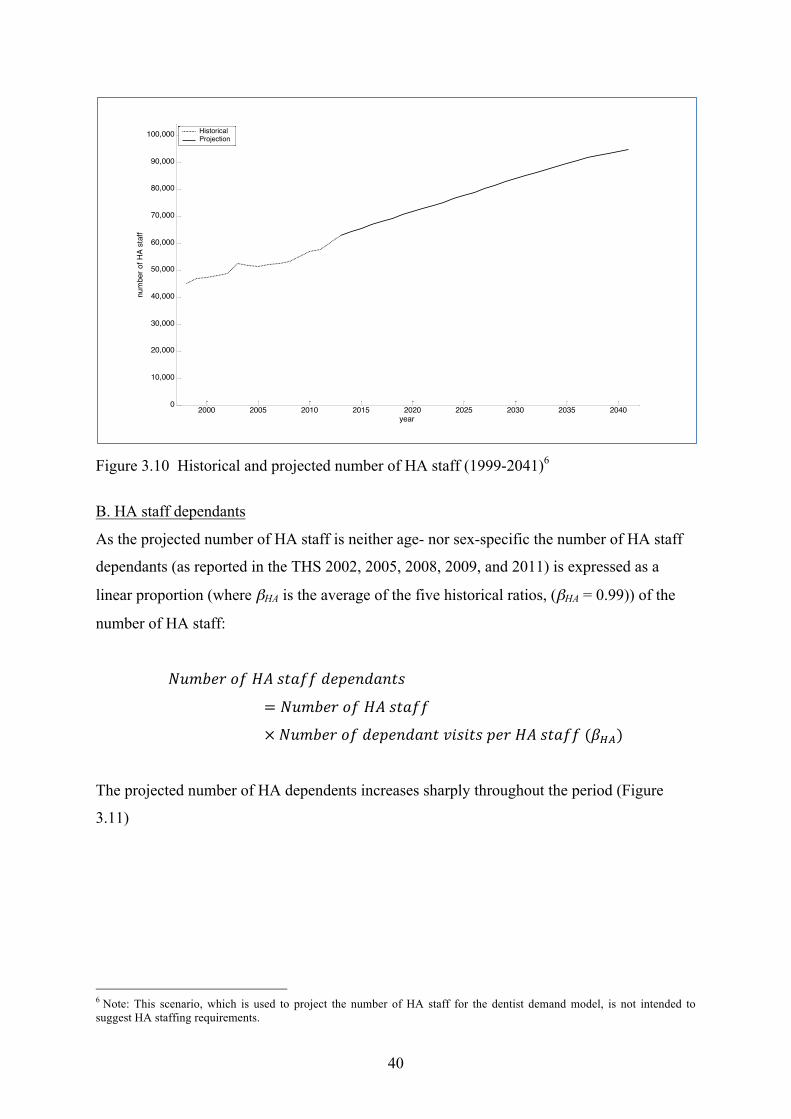
Figure 39 Historical and projected number of doctors (black) nurses (blue) and other staff
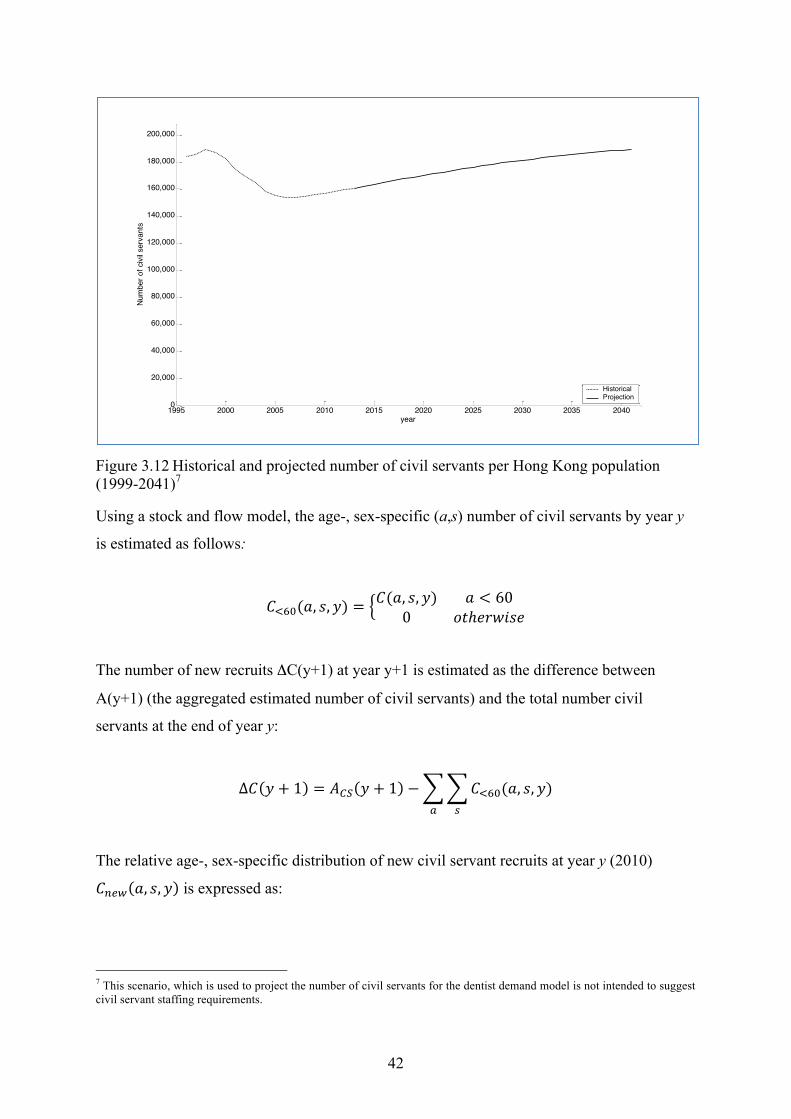
Figure 312 Historical and projected number of civil servants per Hong Kong population
Figure 316 Projected number of civil servant dependants less than 19 years of age spouses
Figure 317 Historical and projected number of GDC visits by general public civil servants
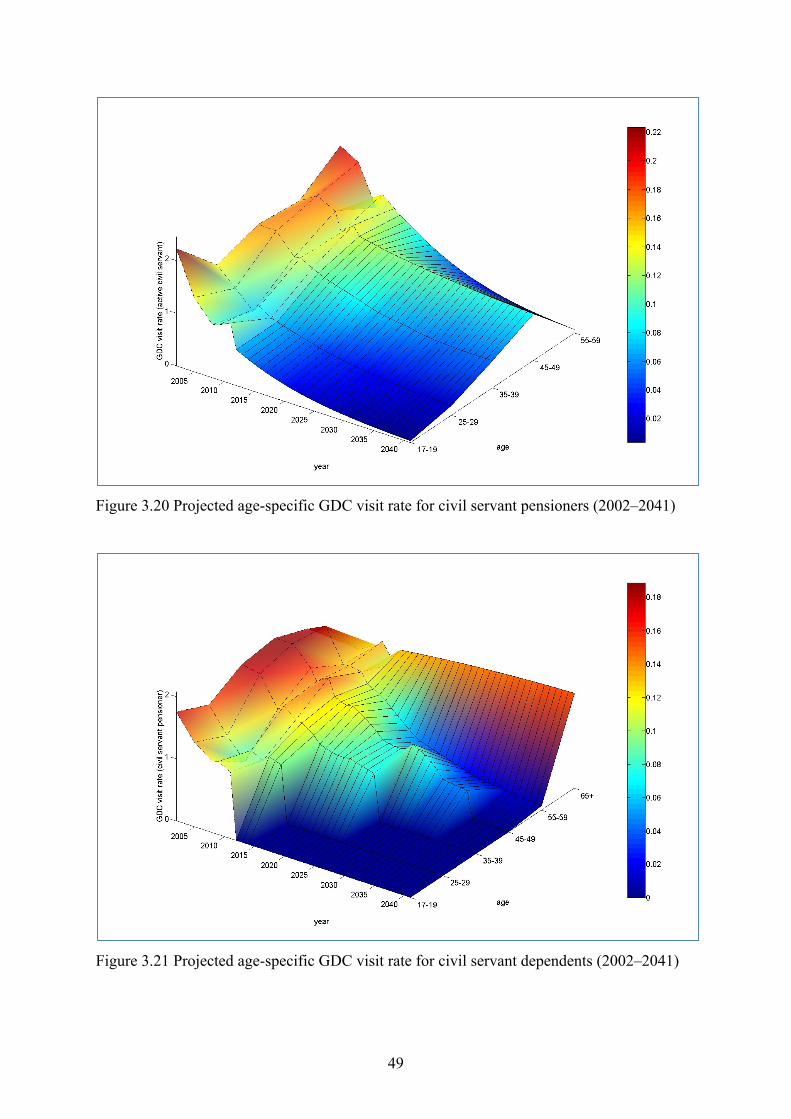
Figure 321 Projected age-specific GDC visit rate for civil servant dependents (2002ndash2041)49
Figure 324 (a) Historical and projected number of inpatient dental specialty discharges
Figure 325(a) Projected annual age-sex standardised inpatient dental specialty discharge
Figure 31 Approaches to estimating demand22
Figure 32 Comparison of Hong Kong and OECD dental outpatient visit rates (152153)30
excluding 2008) 32
rates (2002-2041 excluding 2008) 34
(2005-2041)36
general public sessions) (1999-2011) 37
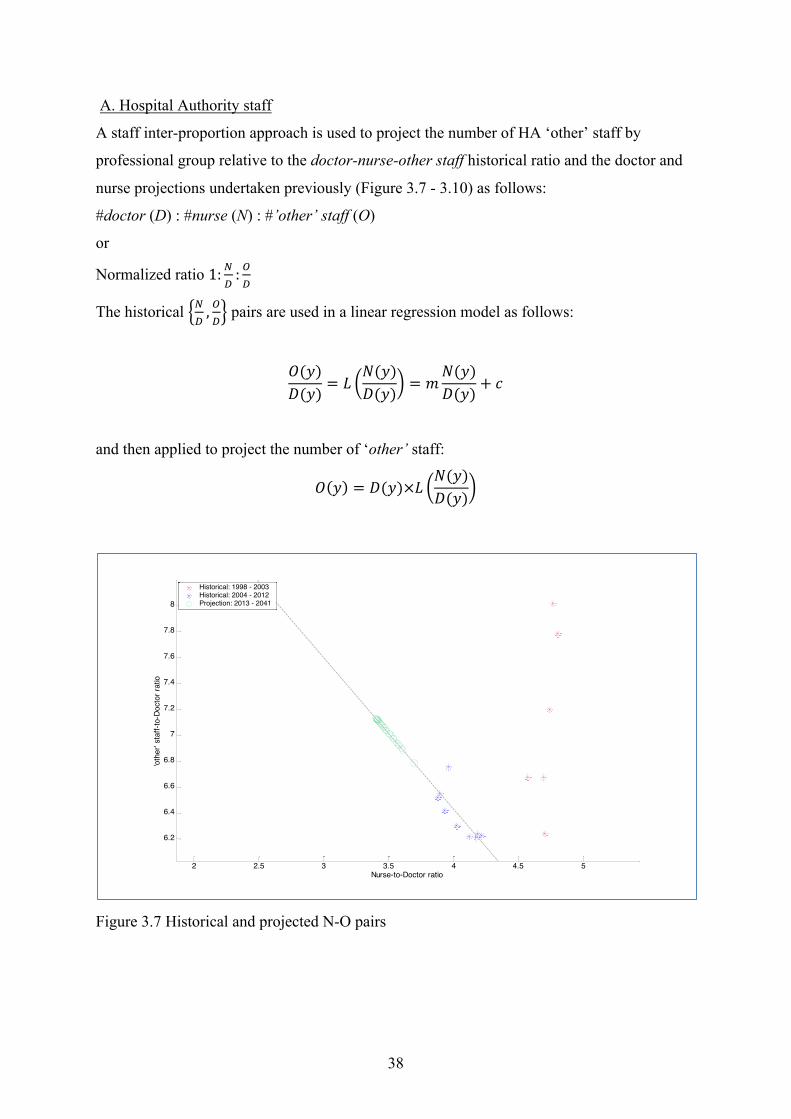
Figure 37 Historical and projected N-O pairs38
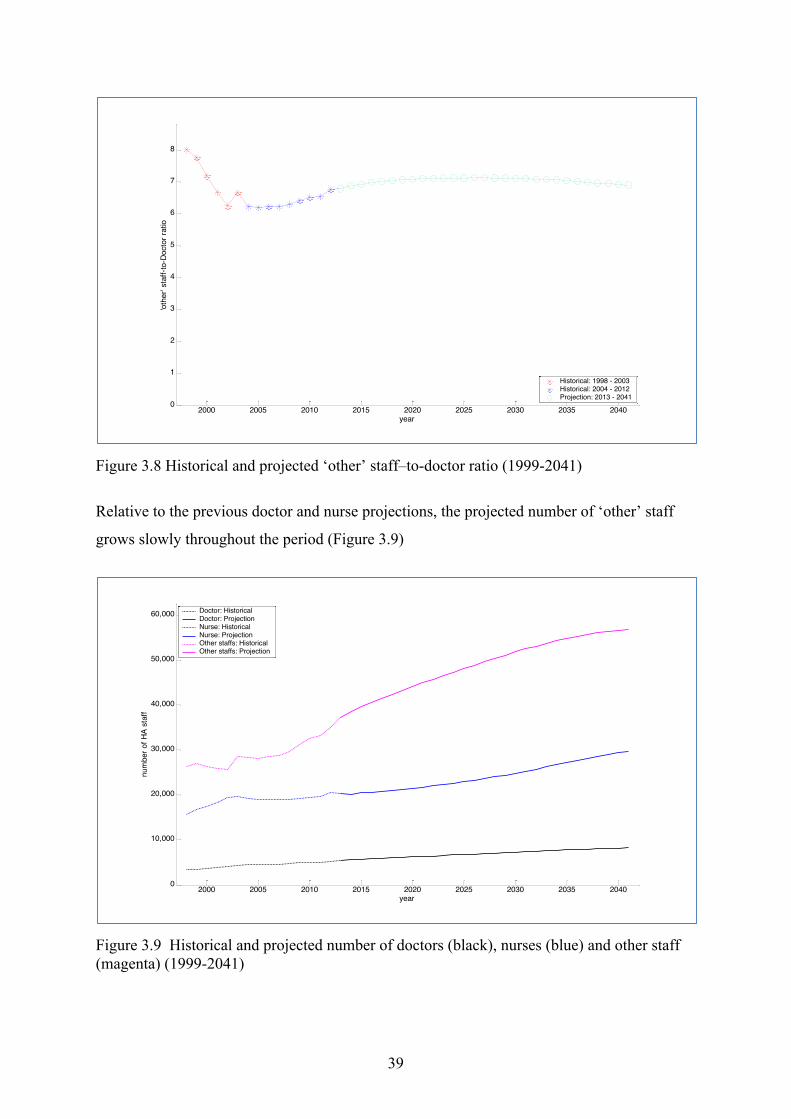
Figure 38 Historical and projected lsquootherrsquo staffndashto-doctor ratio (1999-2041)39
(magenta) (1999-2041) 39
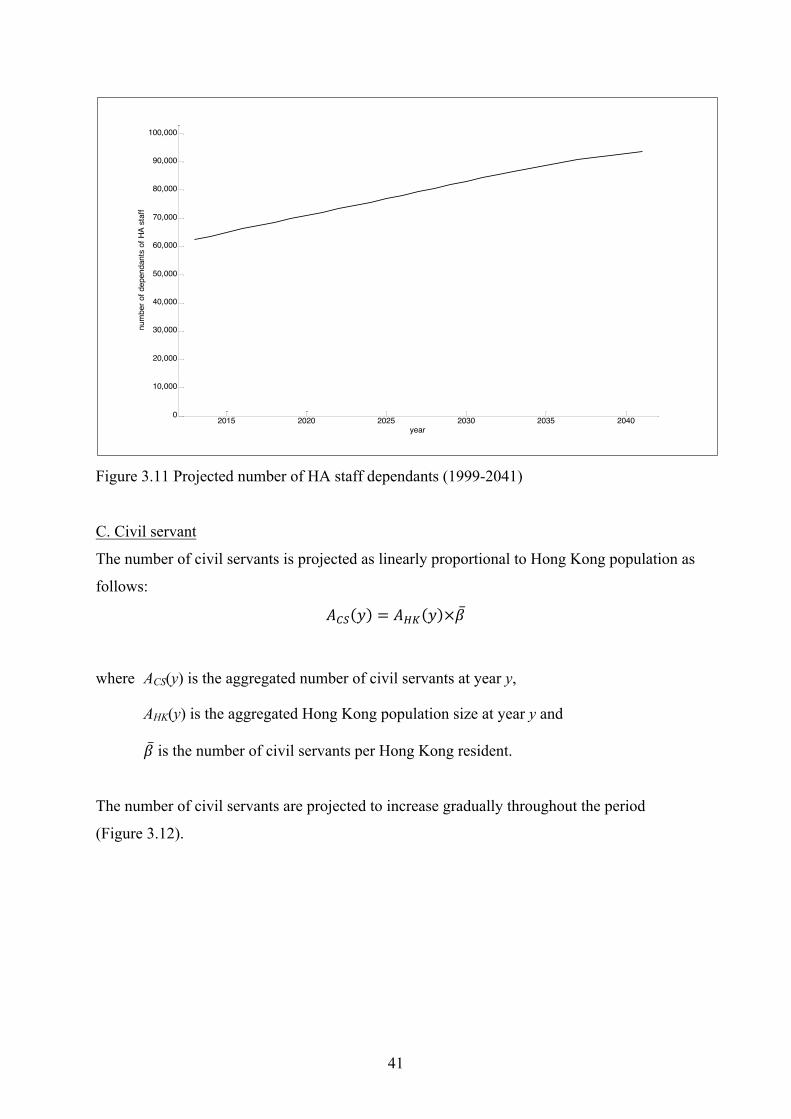
Figure 310 Historical and projected number of HA staff (1999-2041) 40
Figure 311 Projected number of HA staff dependants (1999-2041)41
(1999-2041)42
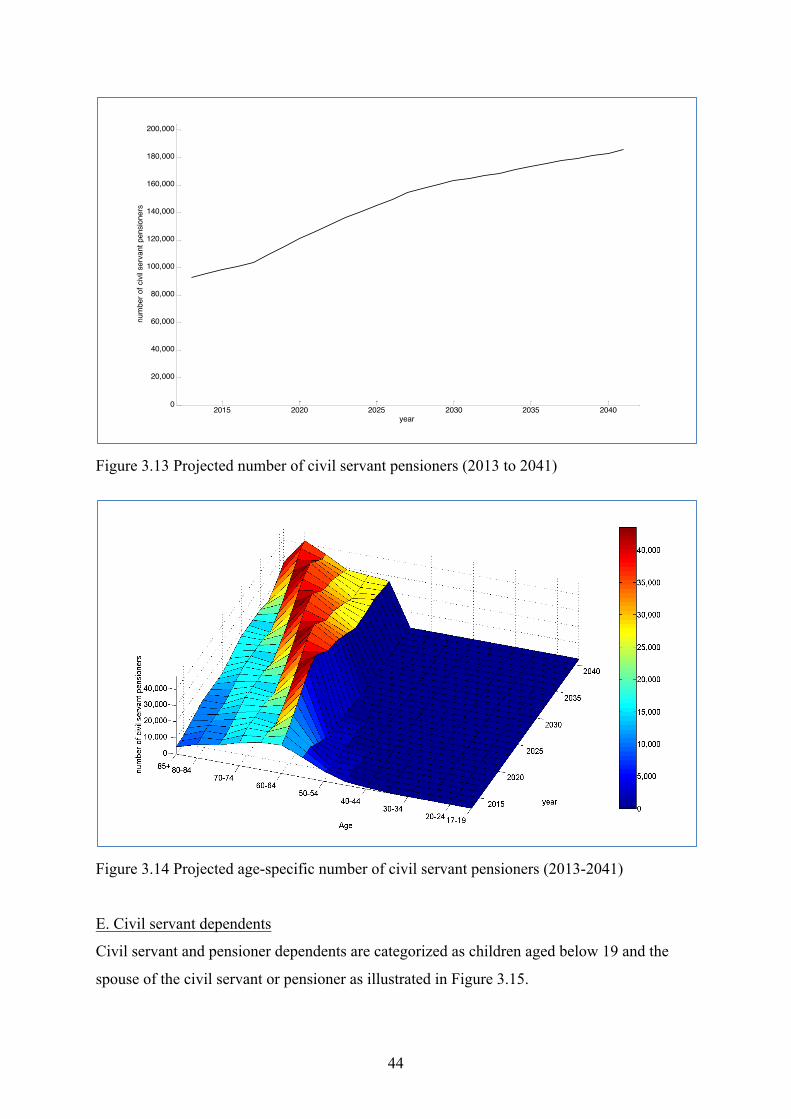
Figure 313 Projected number of civil servant pensioners (2013 to 2041)44
Figure 314 Projected age-specific number of civil servant pensioners (2013-2041) 44
Figure 315 Civil servant and pensioner dependents by age group 45
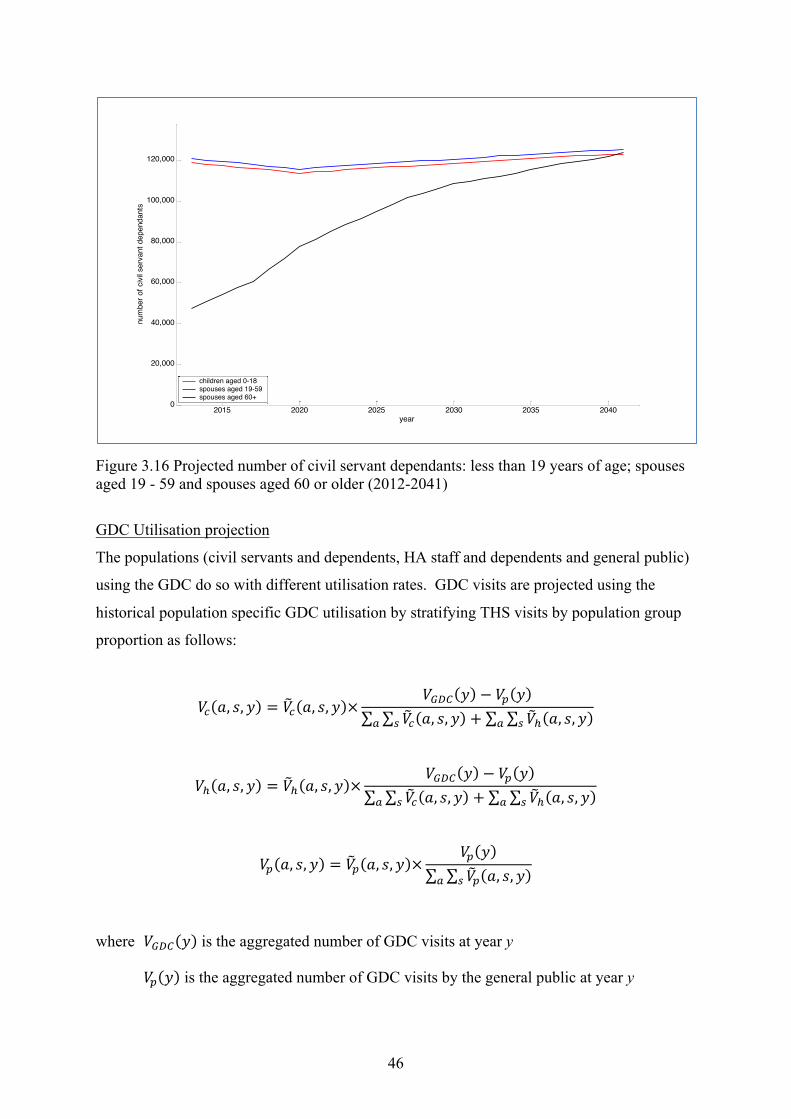
aged 19 - 59 and spouses aged 60 or older (2012-2041) 46
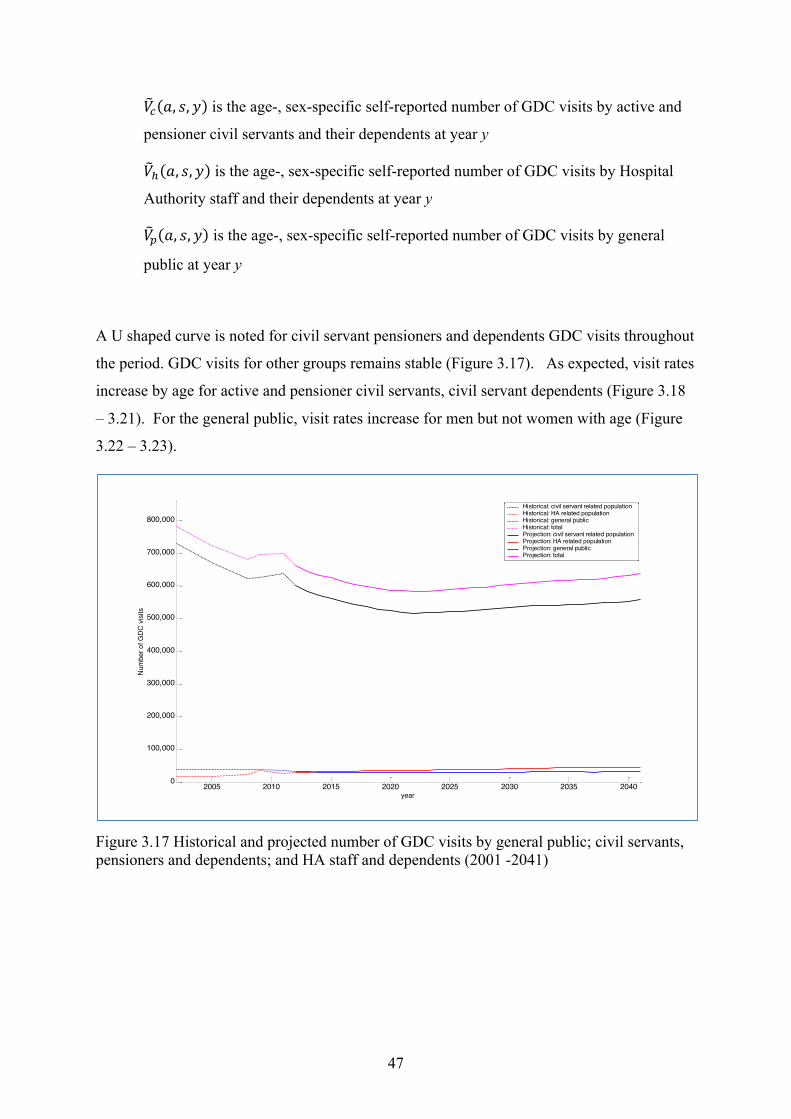
pensioners and dependents and HA staff and dependents (2001 -2041) 47
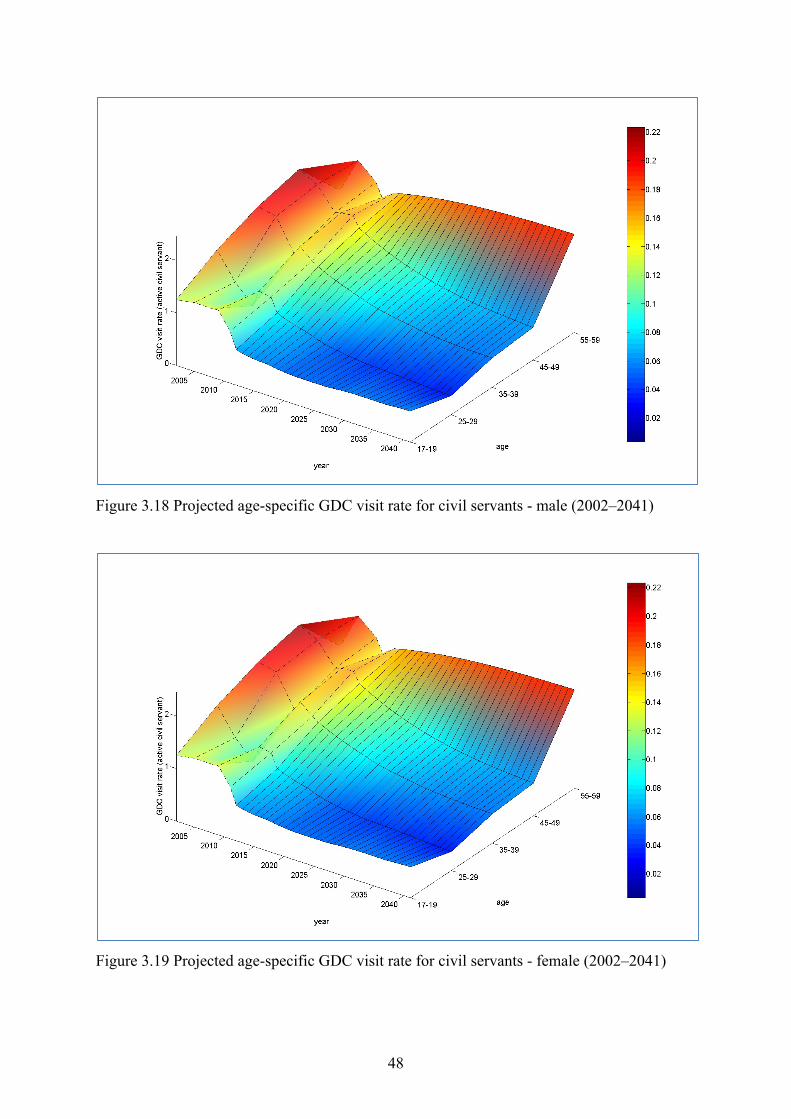
Figure 318 Projected age-specific GDC visit rate for civil servants - male (2002ndash2041)48
Figure 319 Projected age-specific GDC visit rate for civil servants - female (2002ndash2041)48
Figure 320 Projected age-specific GDC visit rate for civil servant pensioners (2002ndash2041) 49
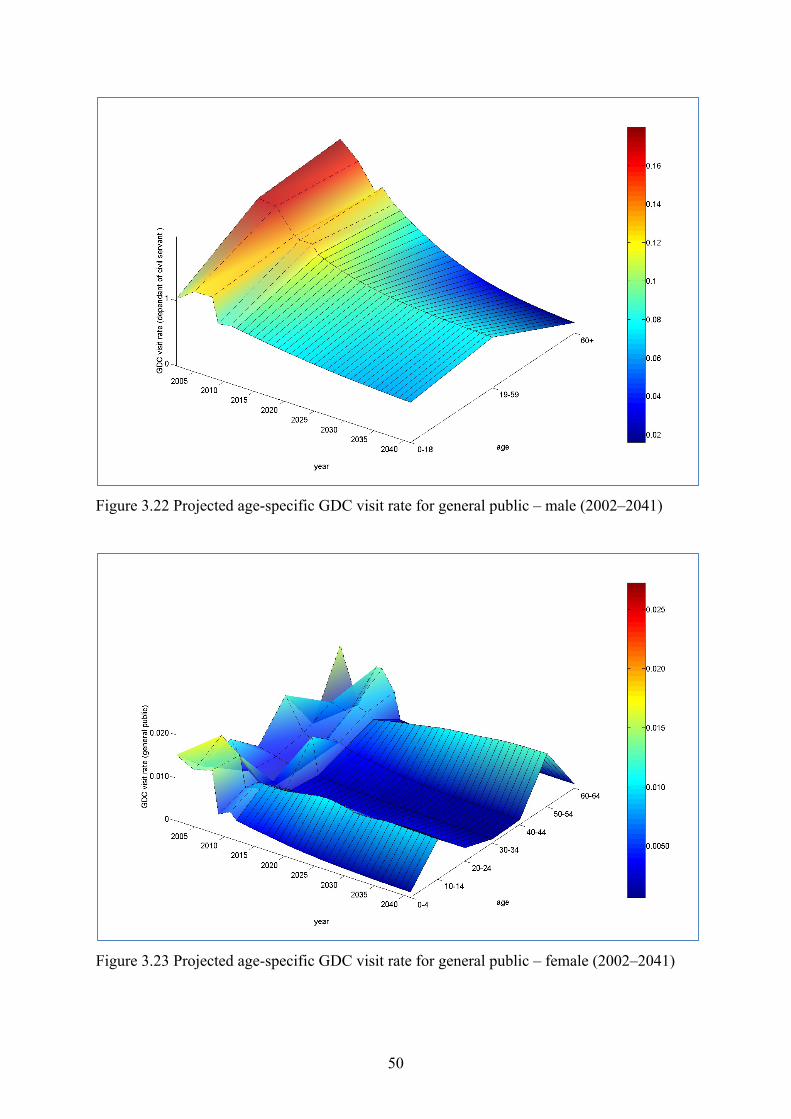
Figure 322 Projected age-specific GDC visit rate for general public ndash male (2002ndash2041) 50
Figure 323 Projected age-specific GDC visit rate for general public ndash female (2002ndash2041) 50
(2005-2041)51
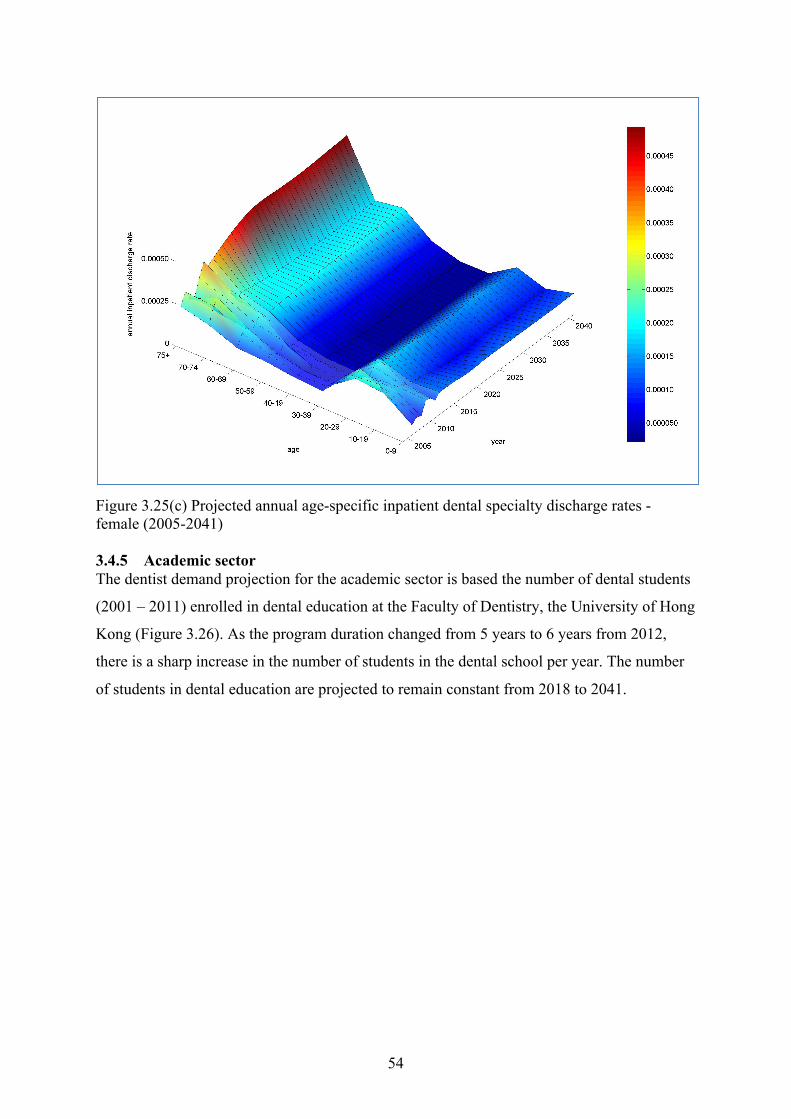
rates (2005-2041) 53
vi
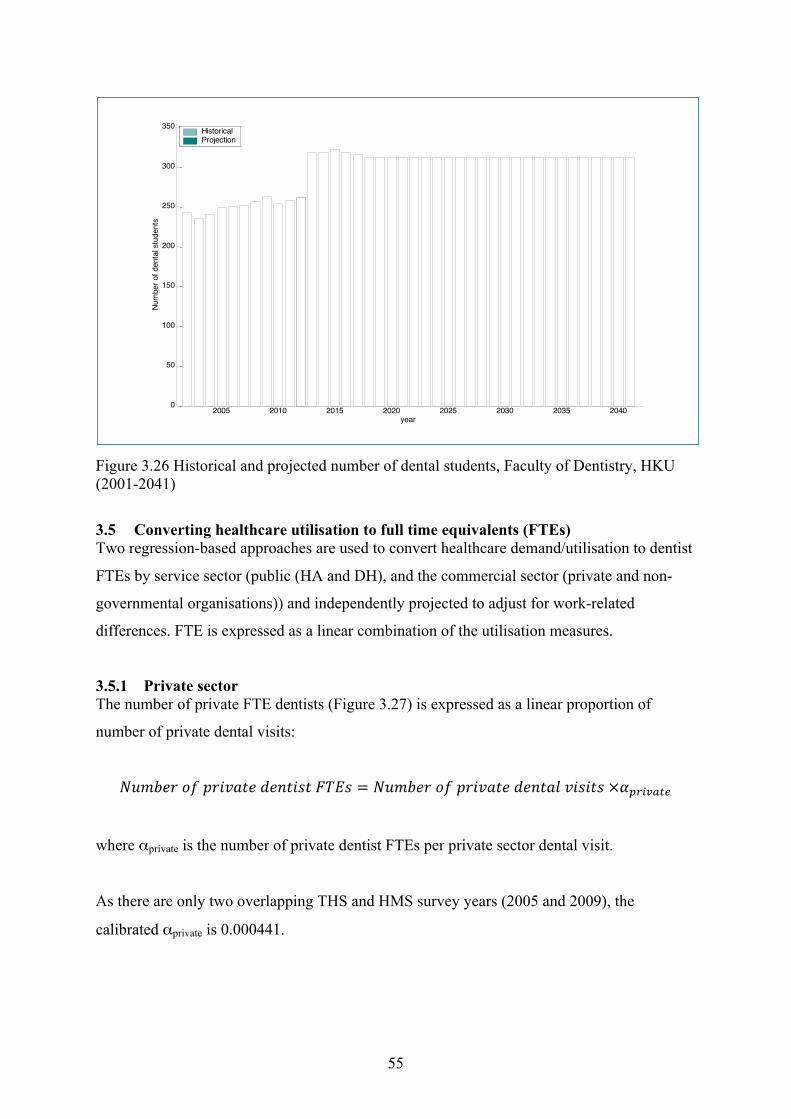
Figure 326 Historical and projected number of dental students Faculty of Dentistry HKU (2001-2041)55
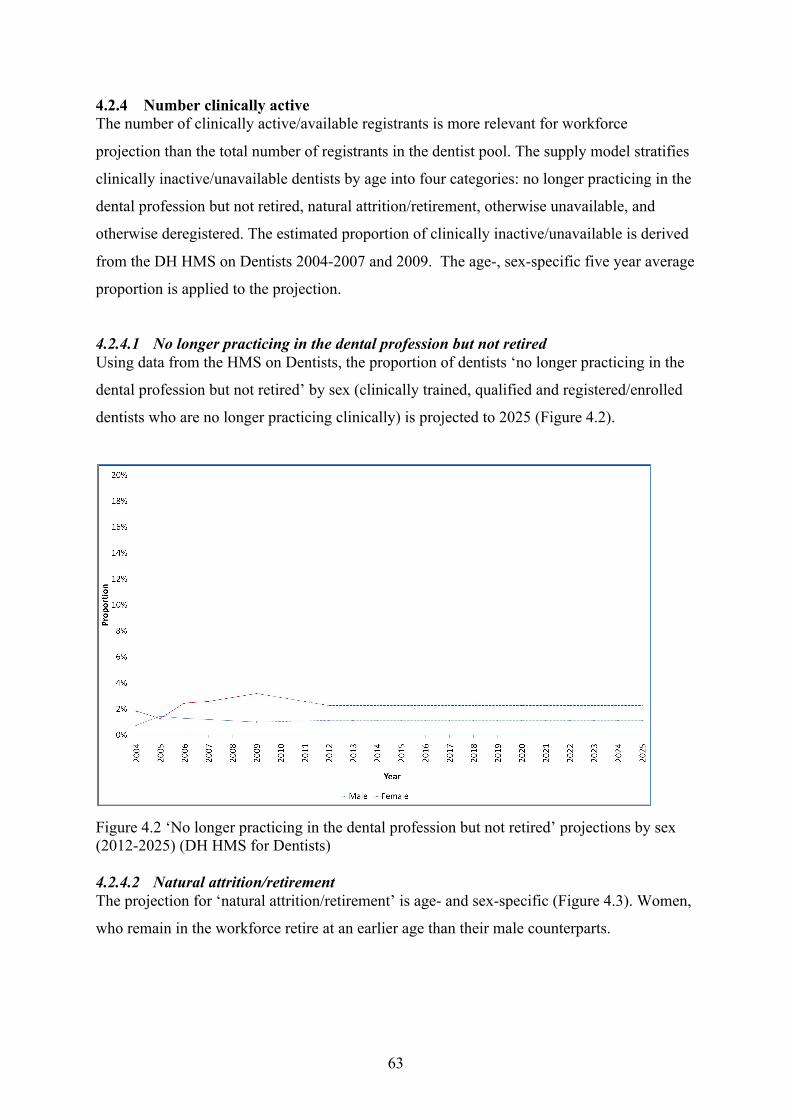
Figure 42 lsquoNo longer practicing in the dental profession but not retiredrsquo projections by sex
Figure 44 The proportion of dentists lsquonatural attritionretiredrsquo by age - female (2012-2025)64
Figure 51 Projected number of dentists FTEs Base case supply and demand (Shaded area
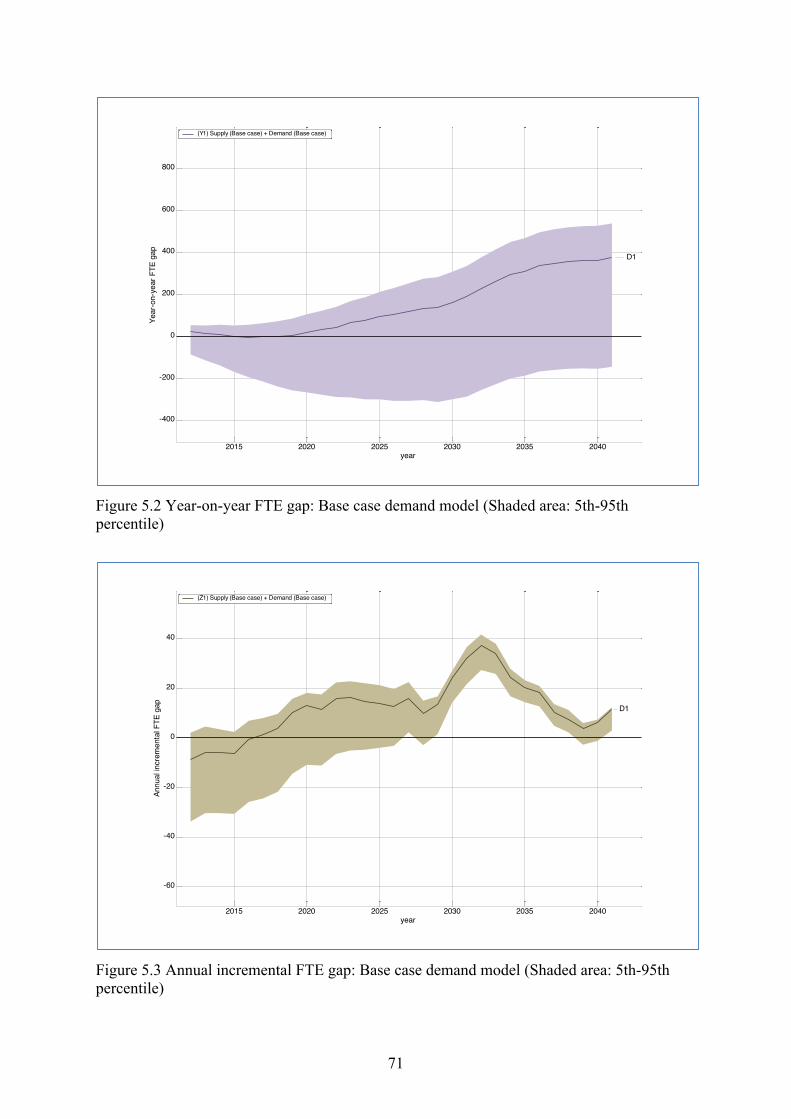
Figure 52 Year-on-year FTE gap Base case demand model (Shaded area 5th-95th
Figure 53 Annual incremental FTE gap Base case demand model (Shaded area 5th-95th
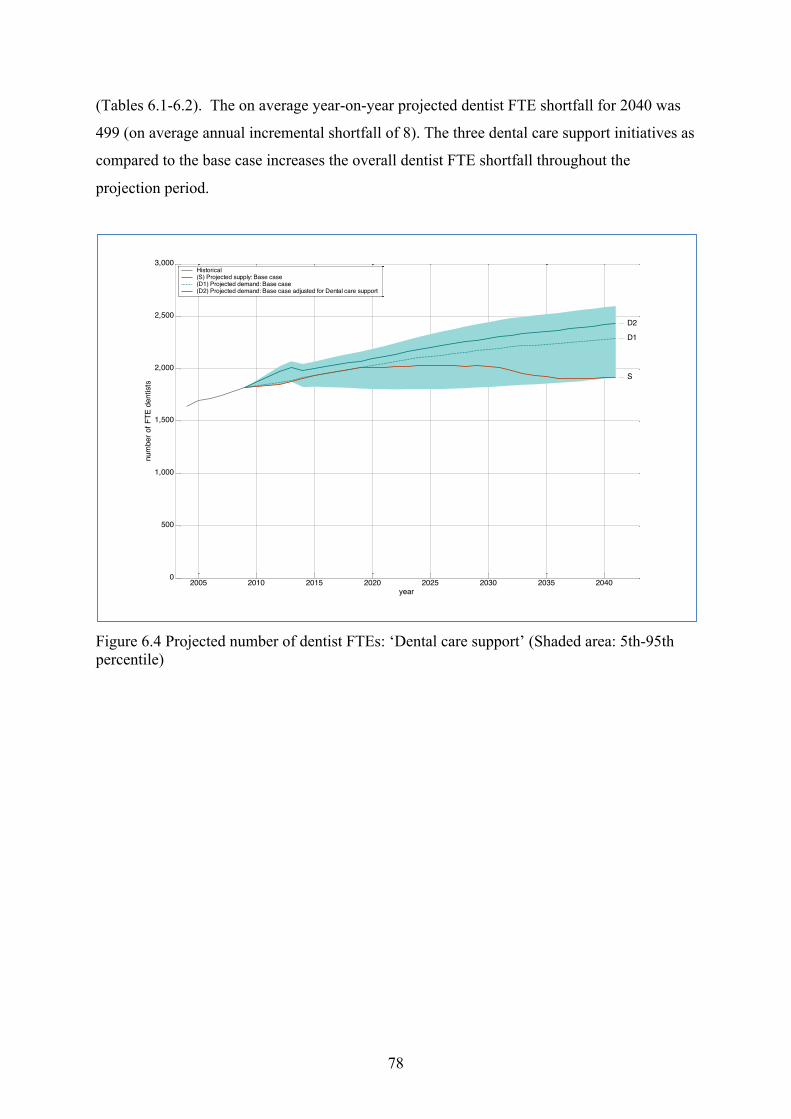
Figure 64 Projected number of dentist FTEs lsquoDental care supportrsquo (Shaded area 5th-95th
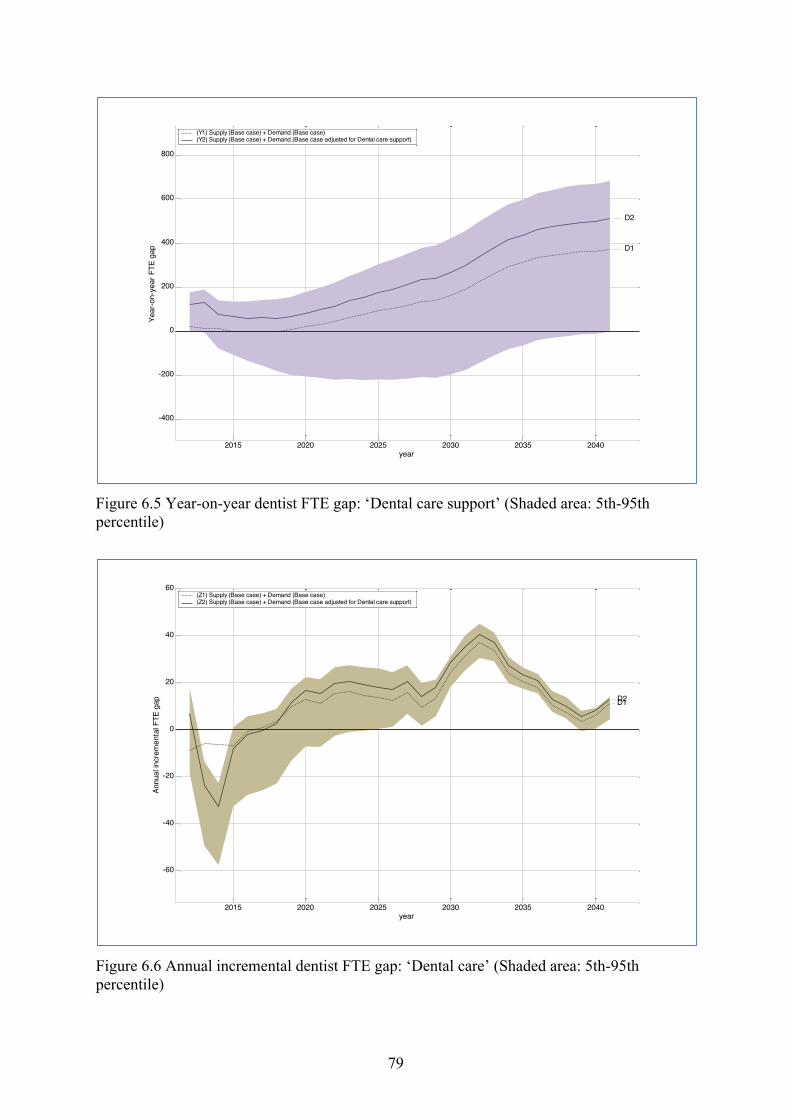
Figure 65 Year-on-year dentist FTE gap lsquoDental care supportrsquo (Shaded area 5th-95th
Figure 66 Annual incremental dentist FTE gap lsquoDental carersquo (Shaded area 5th-95th
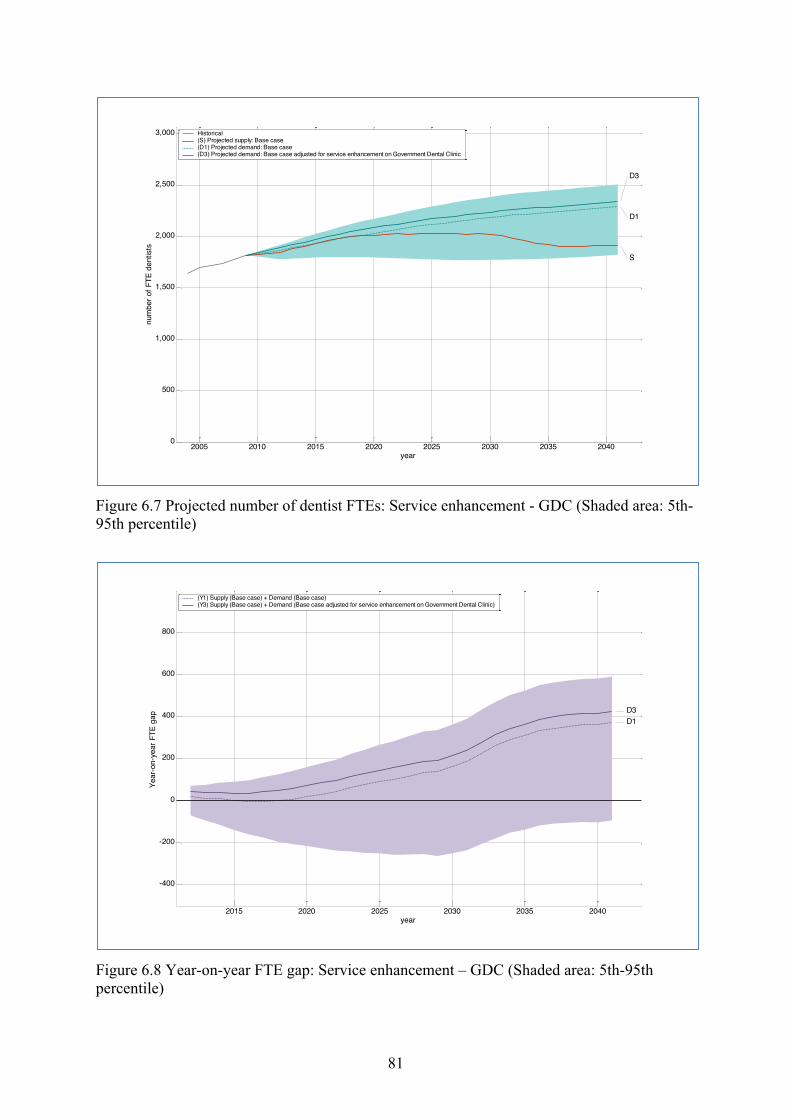
Figure 67 Projected number of dentist FTEs Service enhancement - GDC (Shaded area 5th-
Figure 68 Year-on-year FTE gap Service enhancement ndash GDC (Shaded area 5th-95th
Figure 69 Annual incremental FTE gap Service enhancement - GDC (Shaded area 5th-95th
Figure 71 Projected overall FTE dentist demand (Best guestimate) and FTE dentist supply
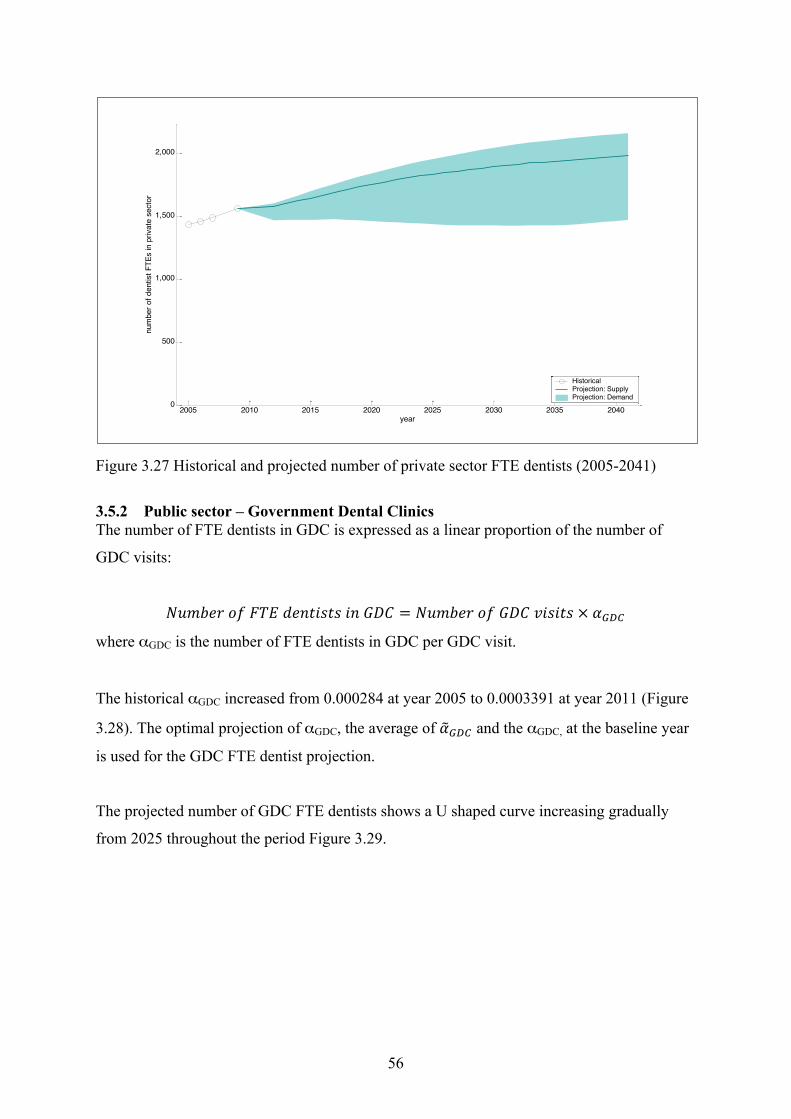
Figure 327 Historical and projected number of private sector FTE dentists (2005-2041) 56
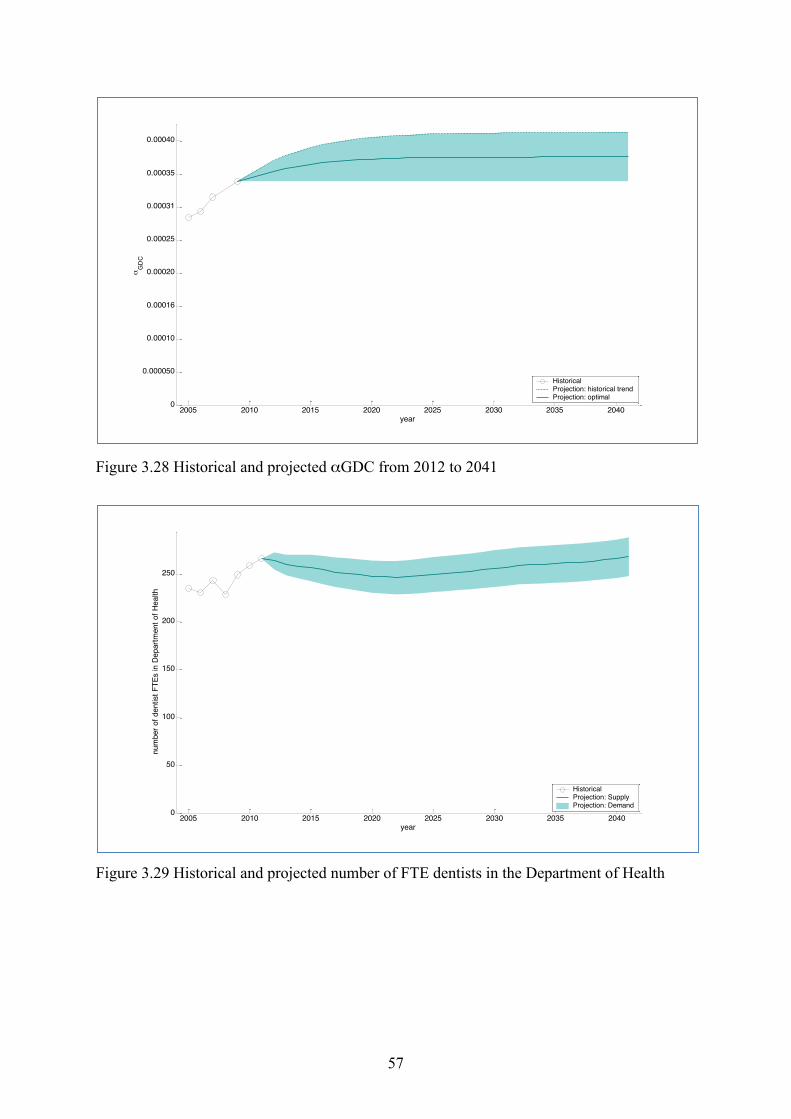
Figure 328 Historical and projected αGDC from 2012 to 204157
Figure 329 Historical and projected number of FTE dentists in the Department of Health57
Figure 330 Historical and projected number of FTE HA dentists (2005-2041) 58
Figure 331 Historical and projected number of dentists in academic sector (2005-2041) 59
Figure 41 Dental supply model for Hong Kong 60
(2012-2025) (DH HMS for Dentists)63
Figure 43 The proportion of dentists lsquonatural attritionretiredrsquo by age - male (2012-2025)64
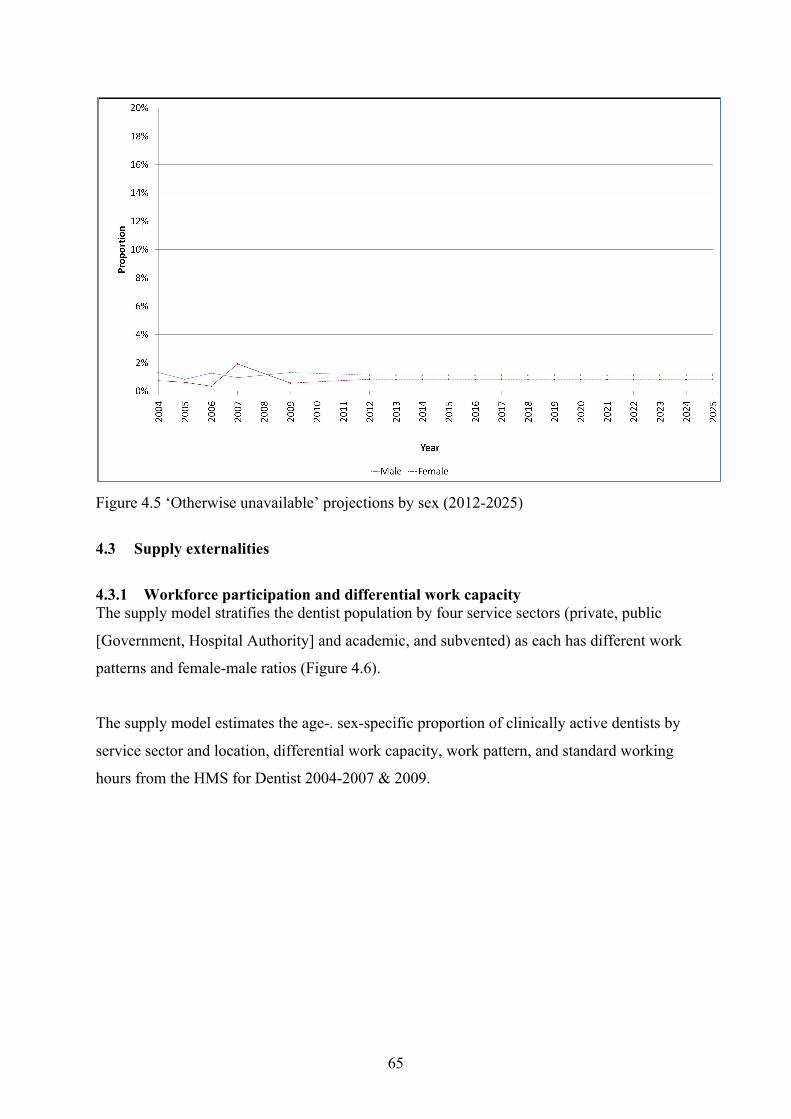
Figure 45 lsquoOtherwise unavailablersquo projections by sex (2012-2025) 65
Figure 46 Distribution of dentists by sector 2004-2007 2009 amp 2012 66
5th-95th percentile) 70
percentile) 71
percentile) 71
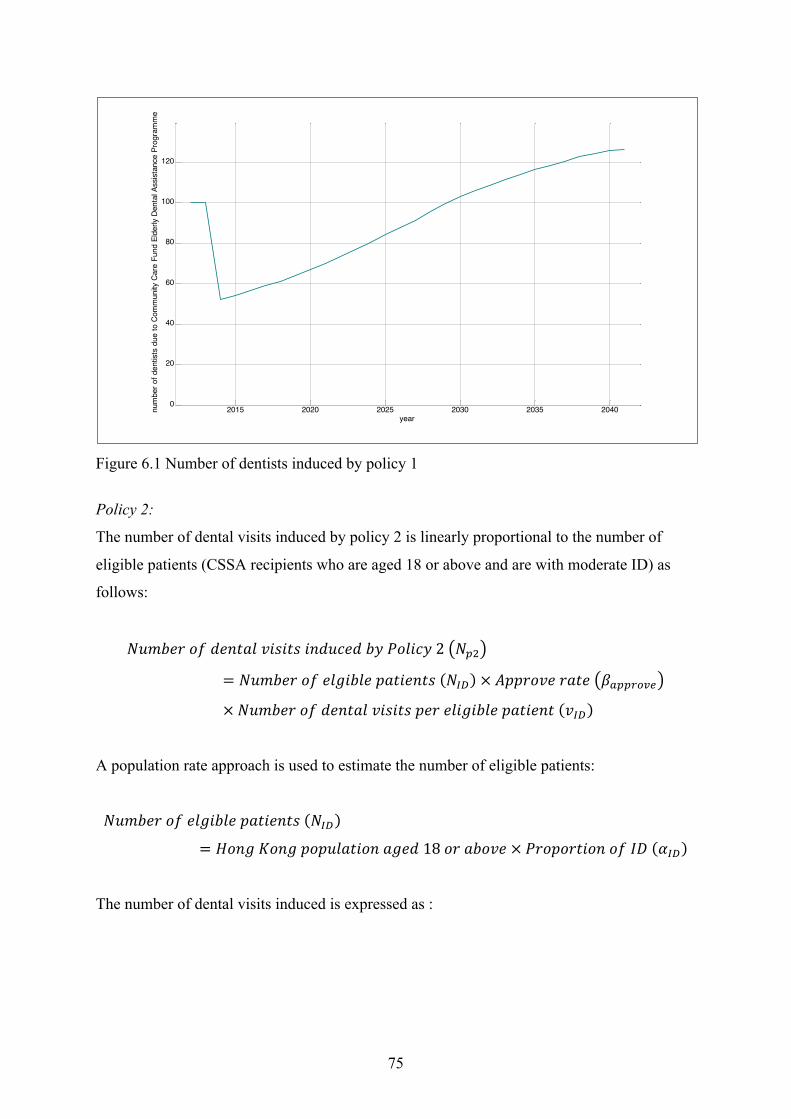
Figure 61 Number of dentists induced by policy 175
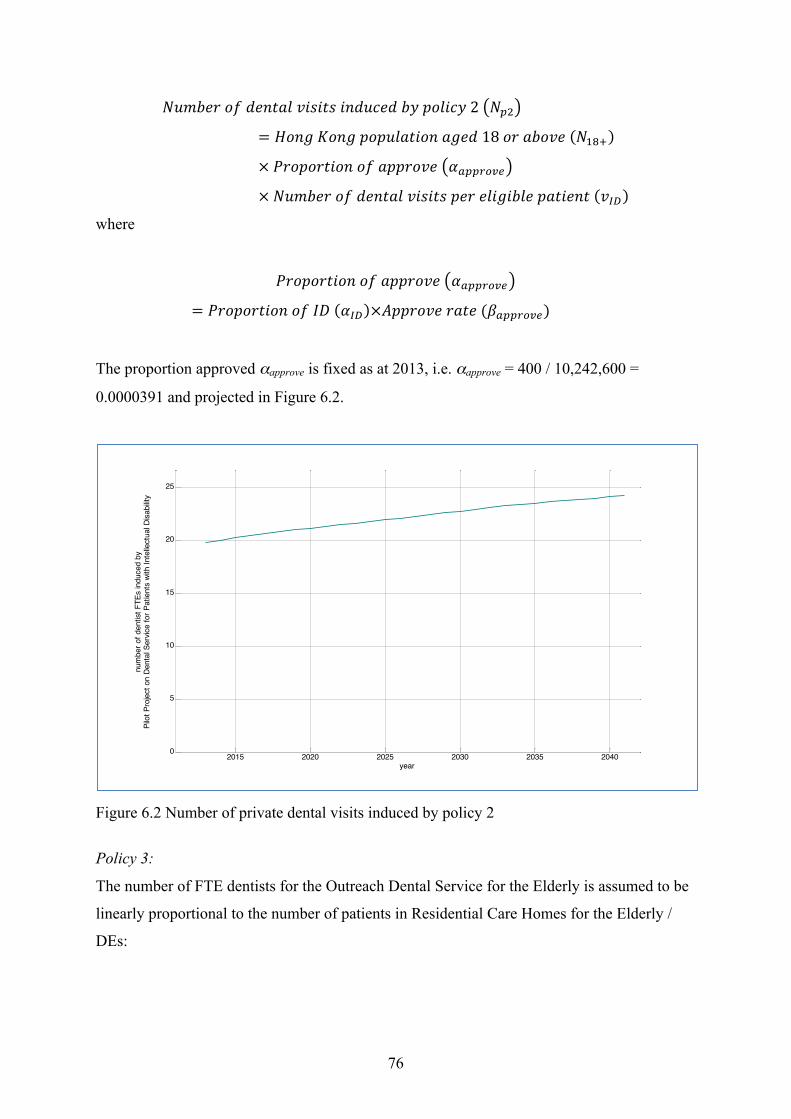
Figure 62 Number of private dental visits induced by policy 276
Figure 63 Number of FTE dentists induced by the outreach pilot project77
percentile) 78
percentile) 79
percentile) 79
95th percentile) 81
percentile) 81
percentile) 82
(base case)83
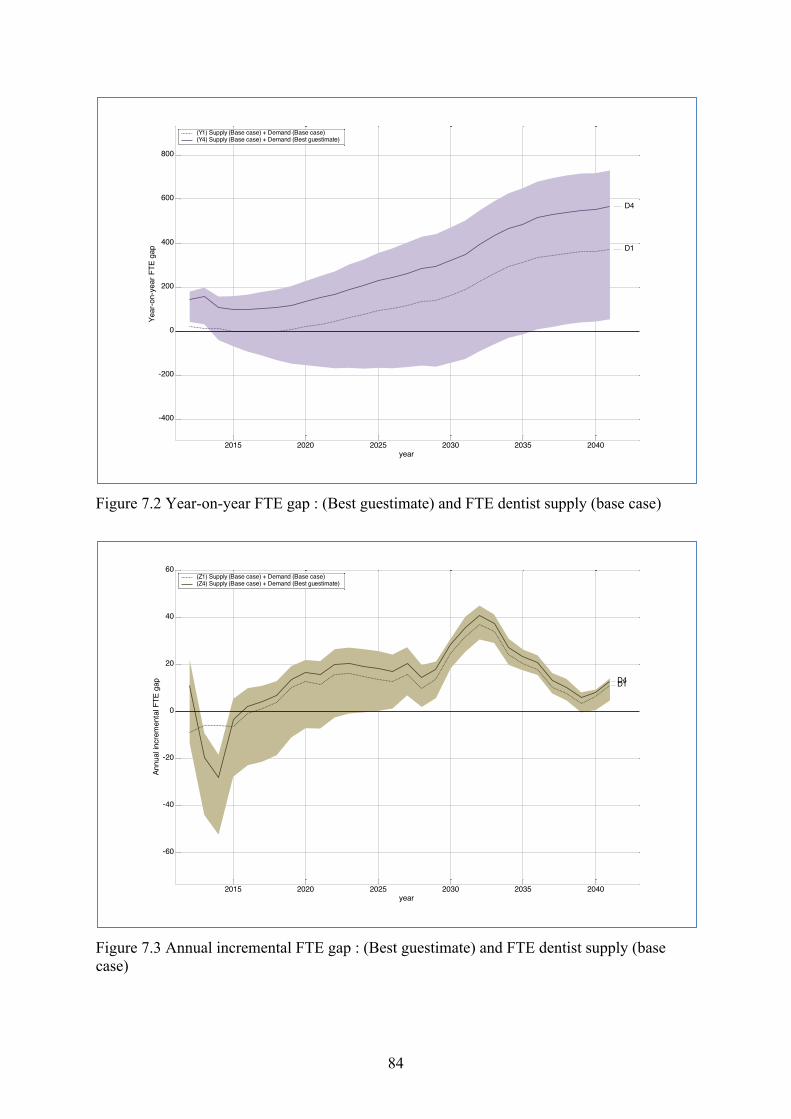
Figure 72 Year-on-year FTE gap (Best guestimate) and FTE dentist supply (base case)84
vii
Figure 73 Annual incremental FTE gap (Best guestimate) and FTE dentist supply (base case) 84
Figure 81 Historical and projected number of doctor FTEs Base case supply and demand (Shaded area 5th-95th percentile) 86
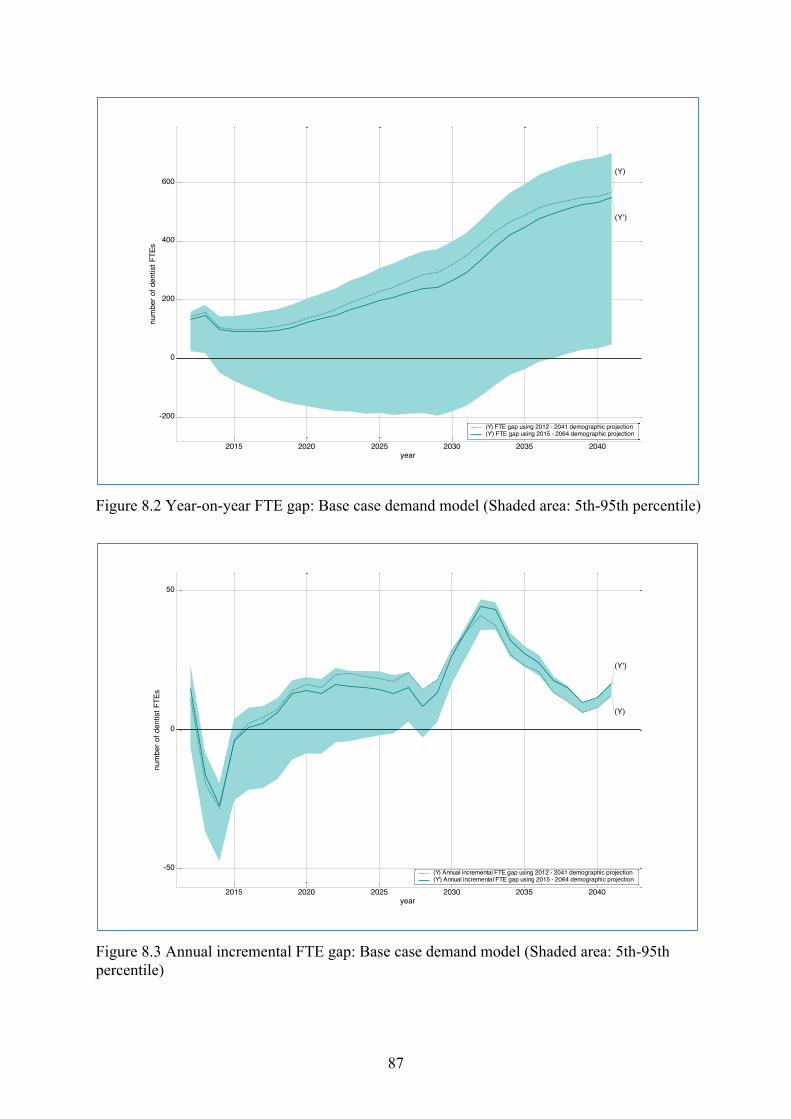
Figure 81 Year-on-year FTE gap Base case demand model (Shaded area 5th-95th percentile) 87
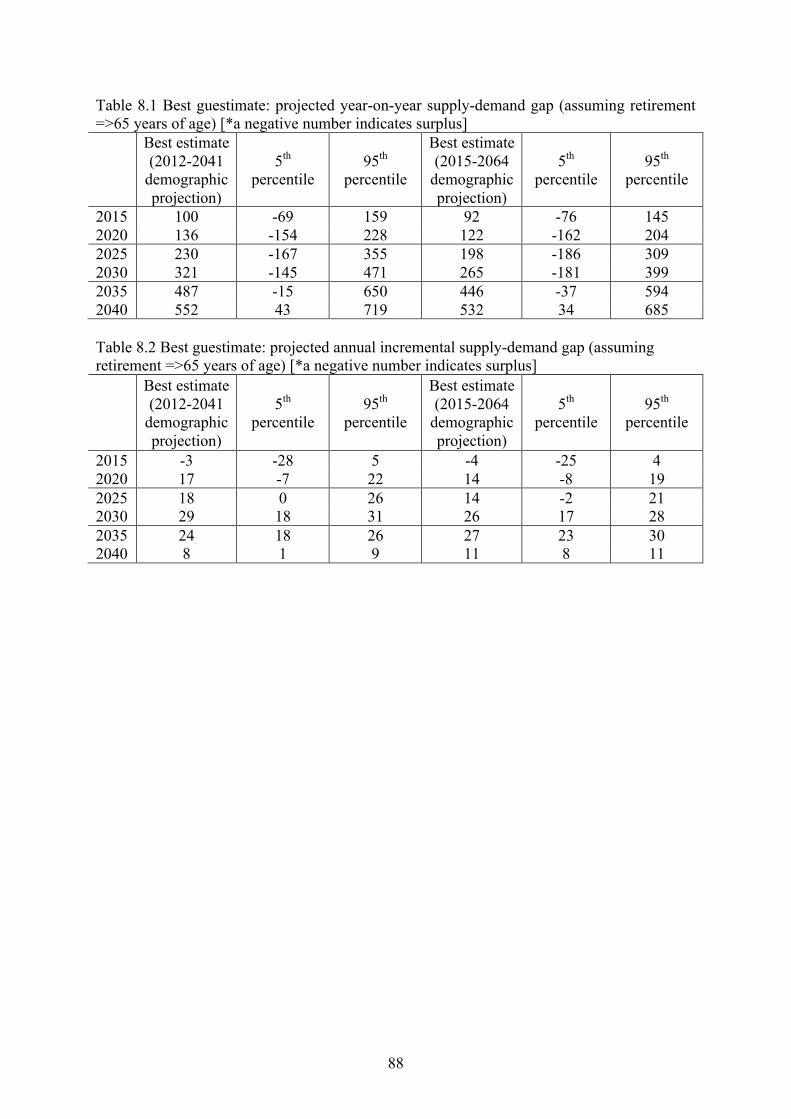
Figure 81 Annual incremental FTE gap Base case demand model (Shaded area 5th-95th percentile) 87
viii
List of Appendices
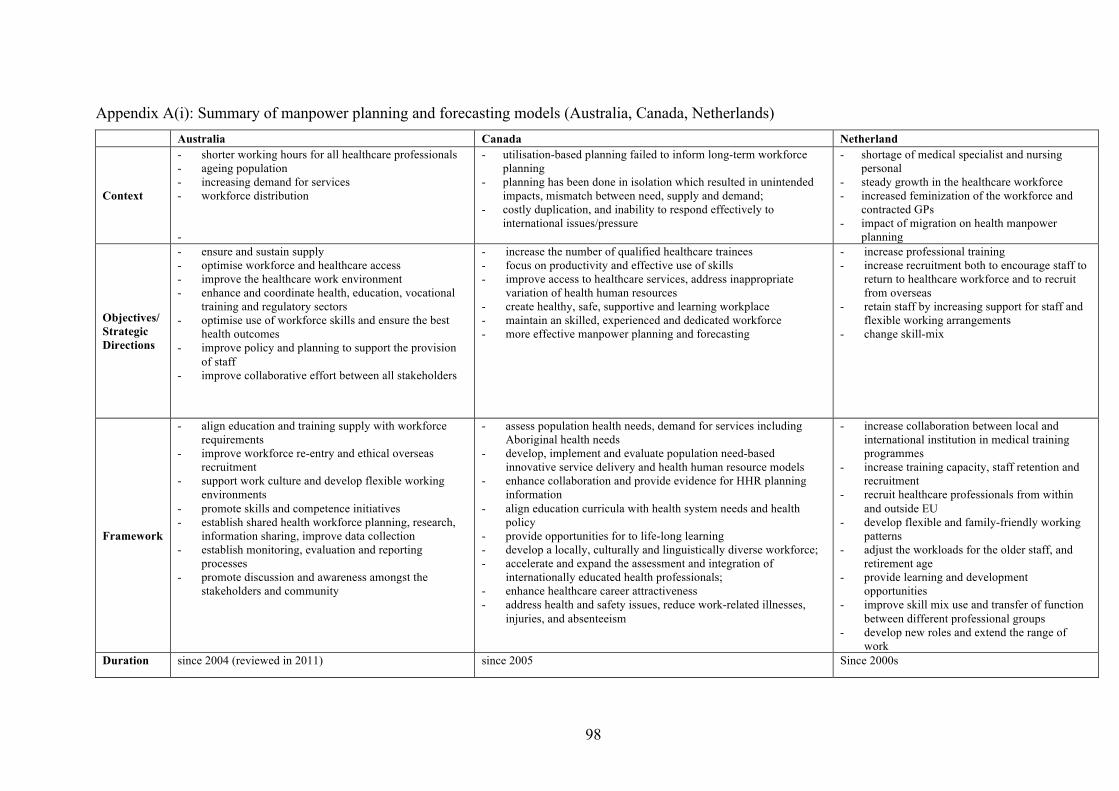
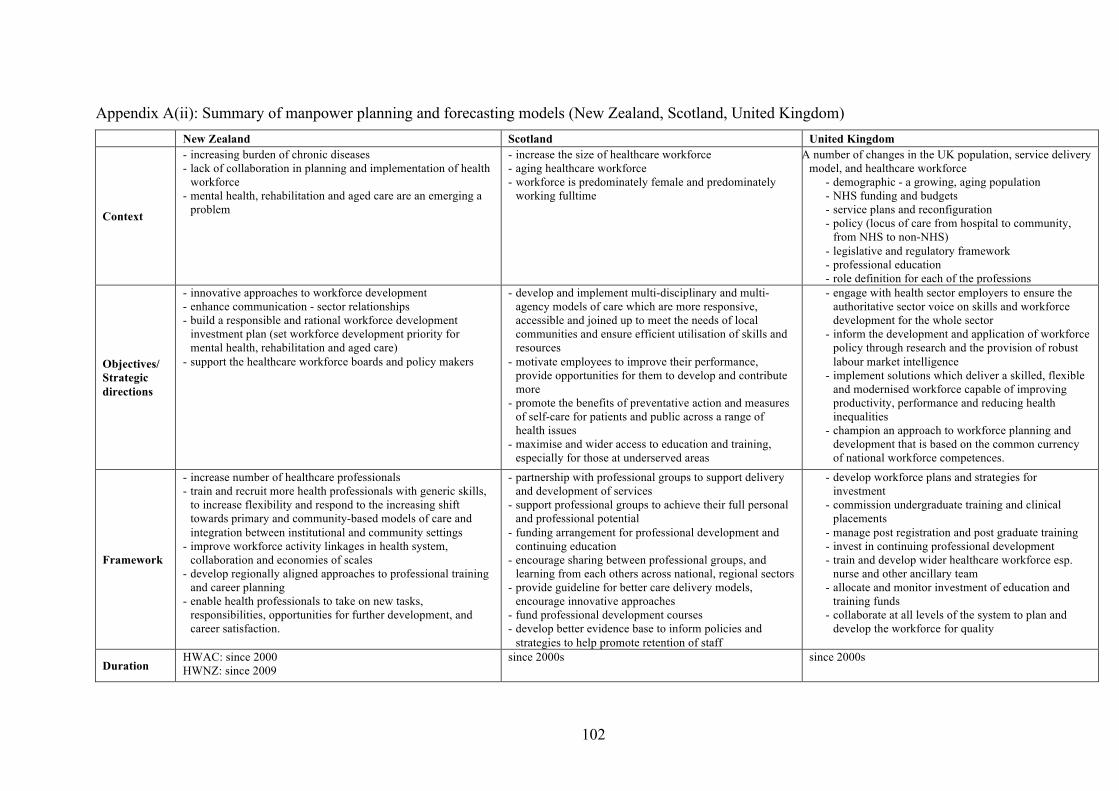
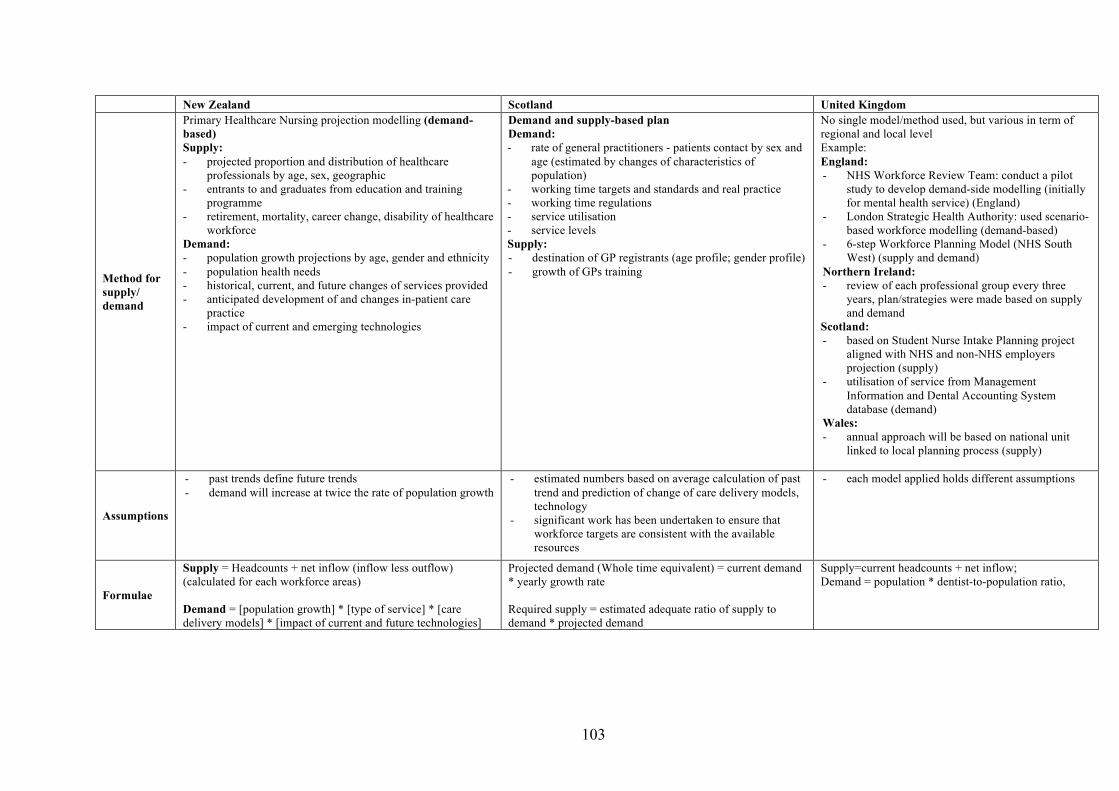
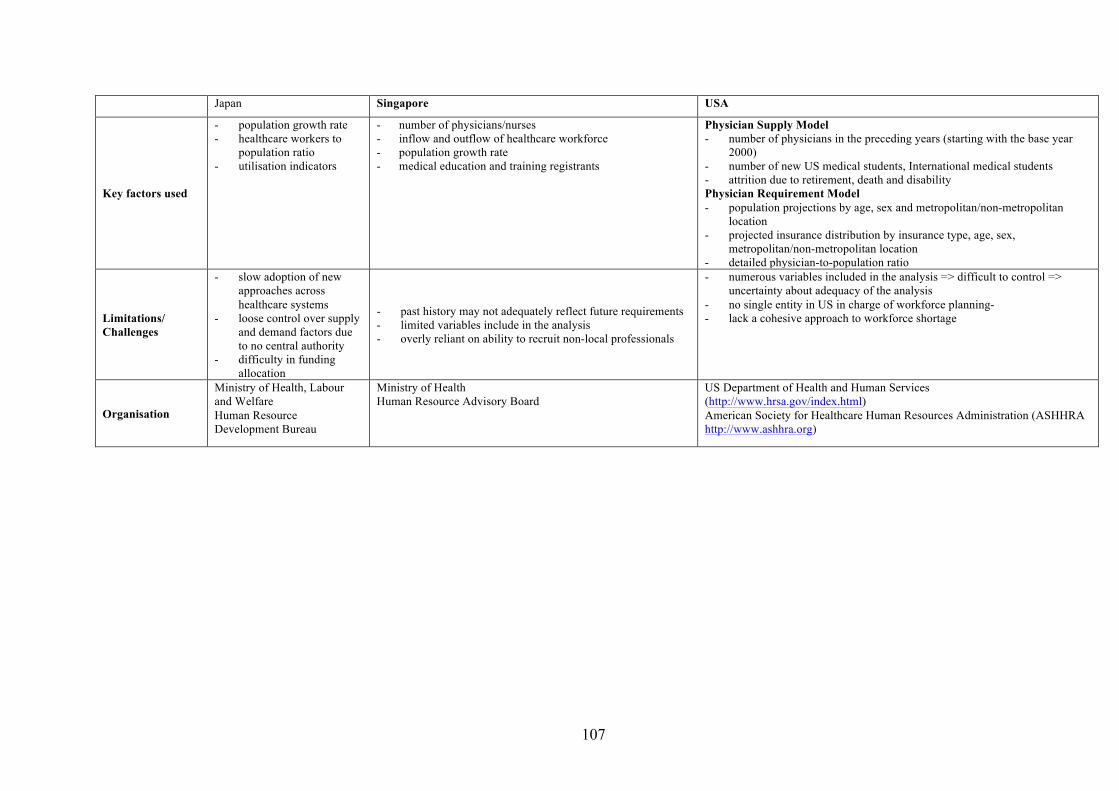
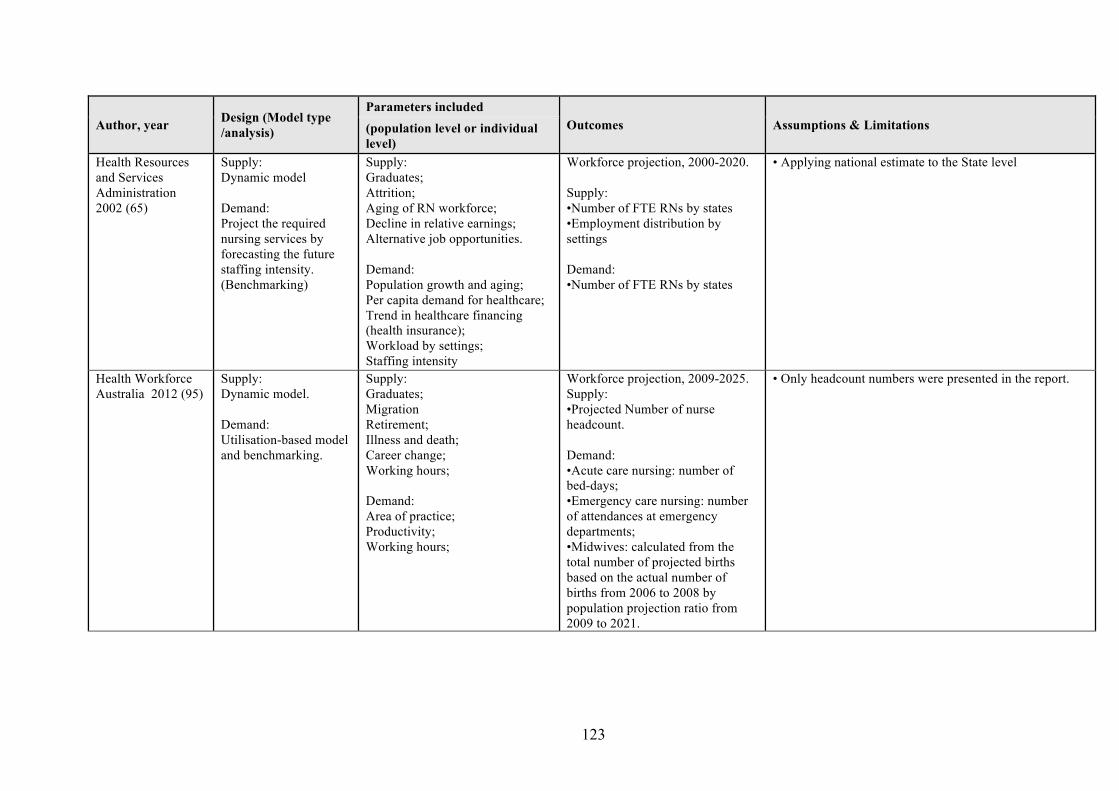
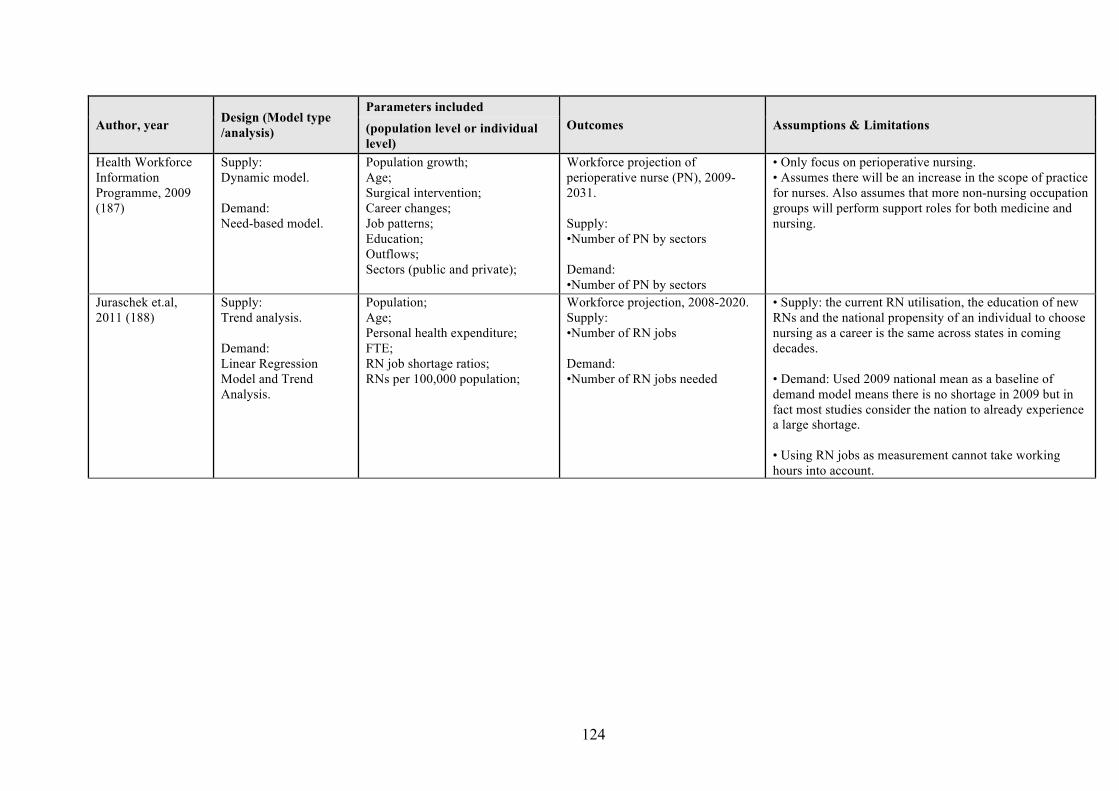
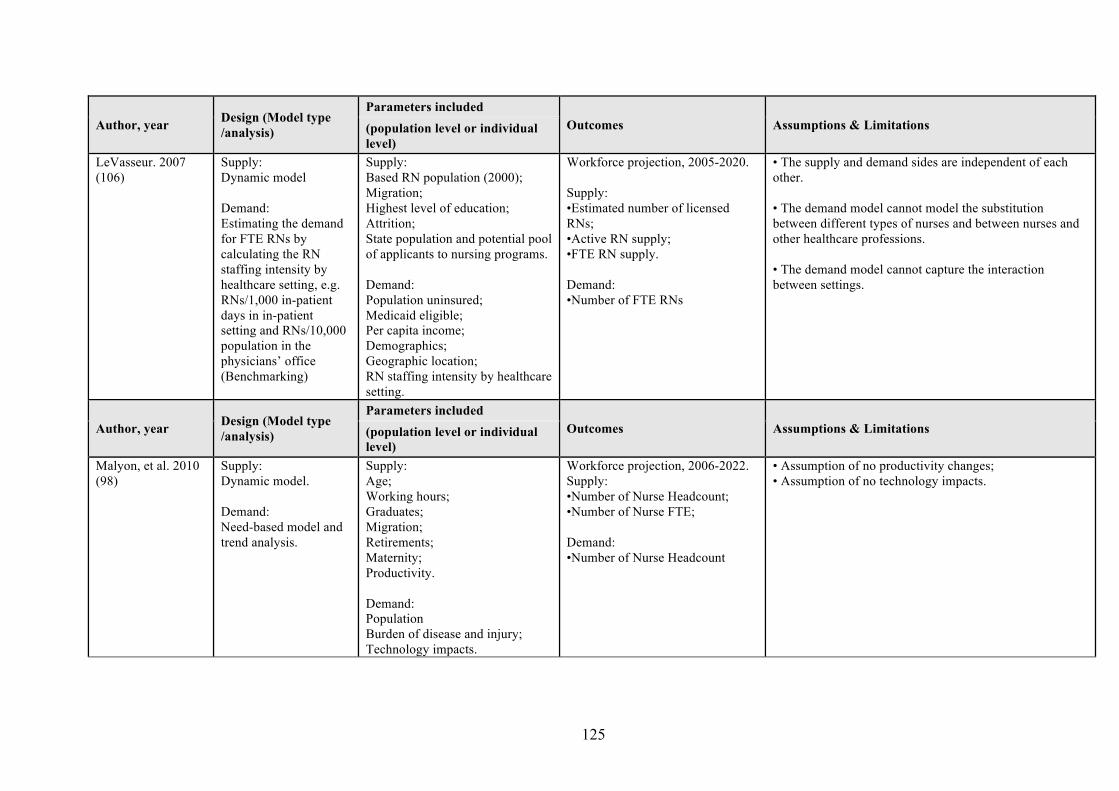
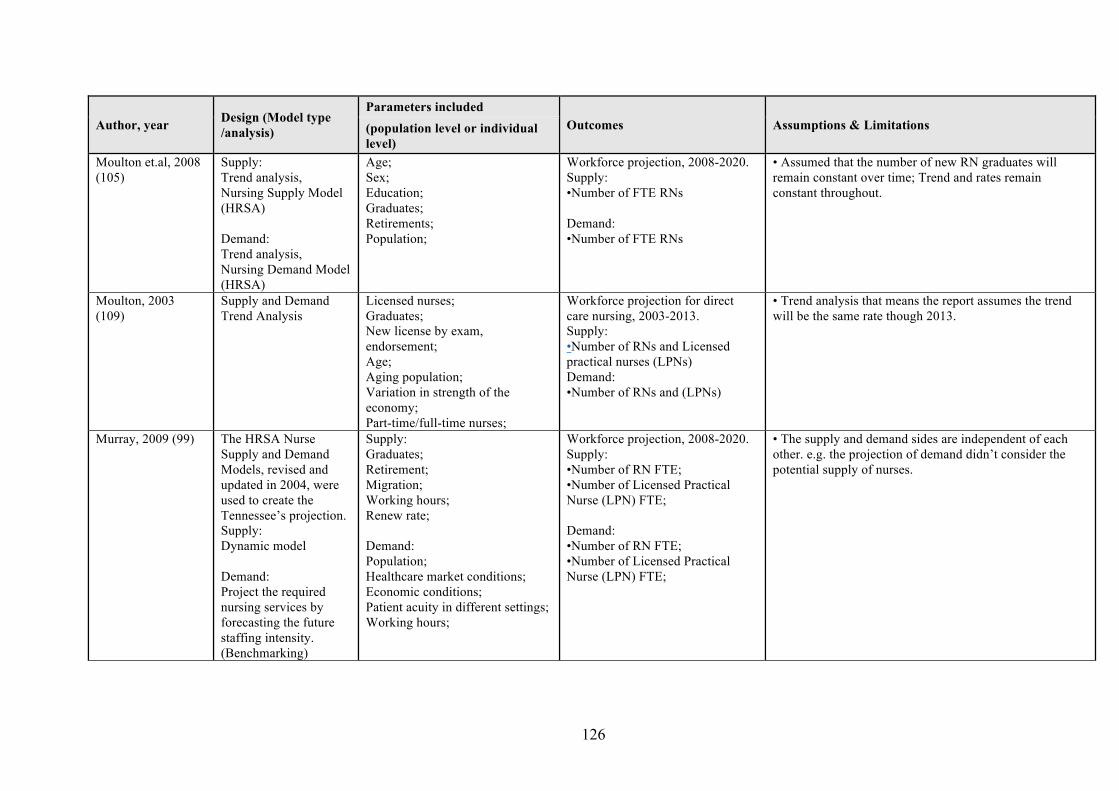
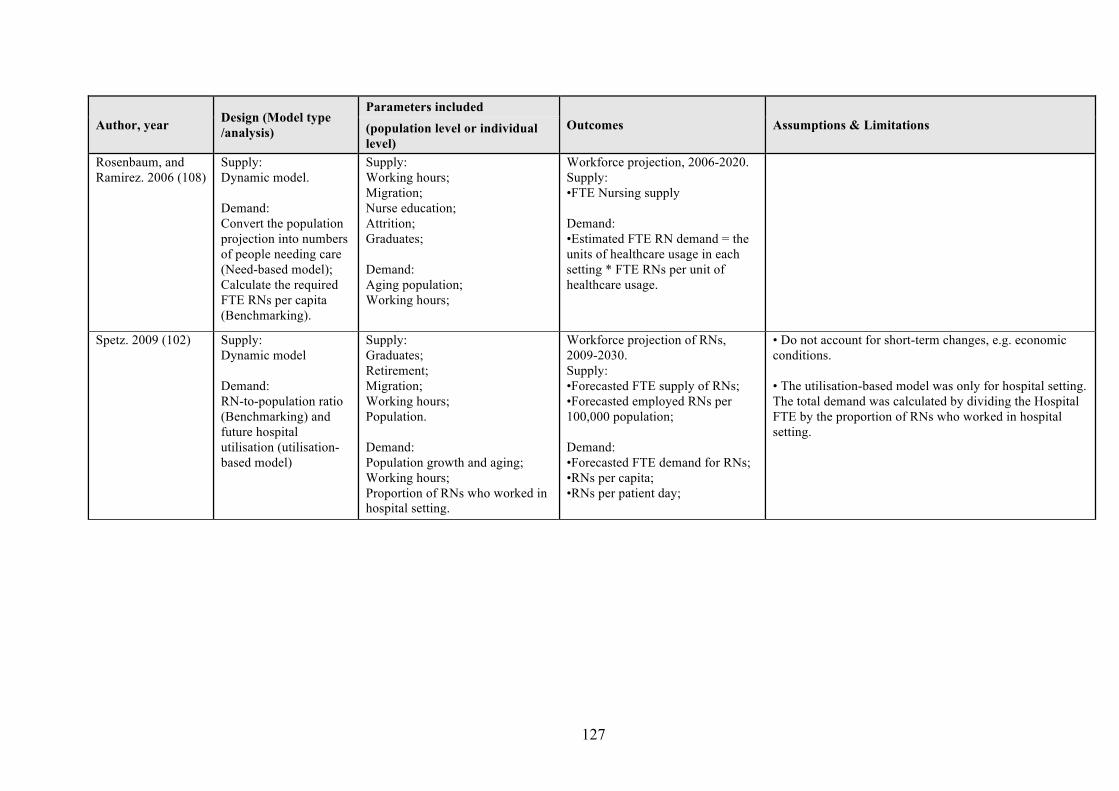
Appendix A(i) Summary of manpower planning and forecasting models (Australia Canada Netherlands)98 Appendix A(ii) Summary of manpower planning and forecasting models (New Zealand
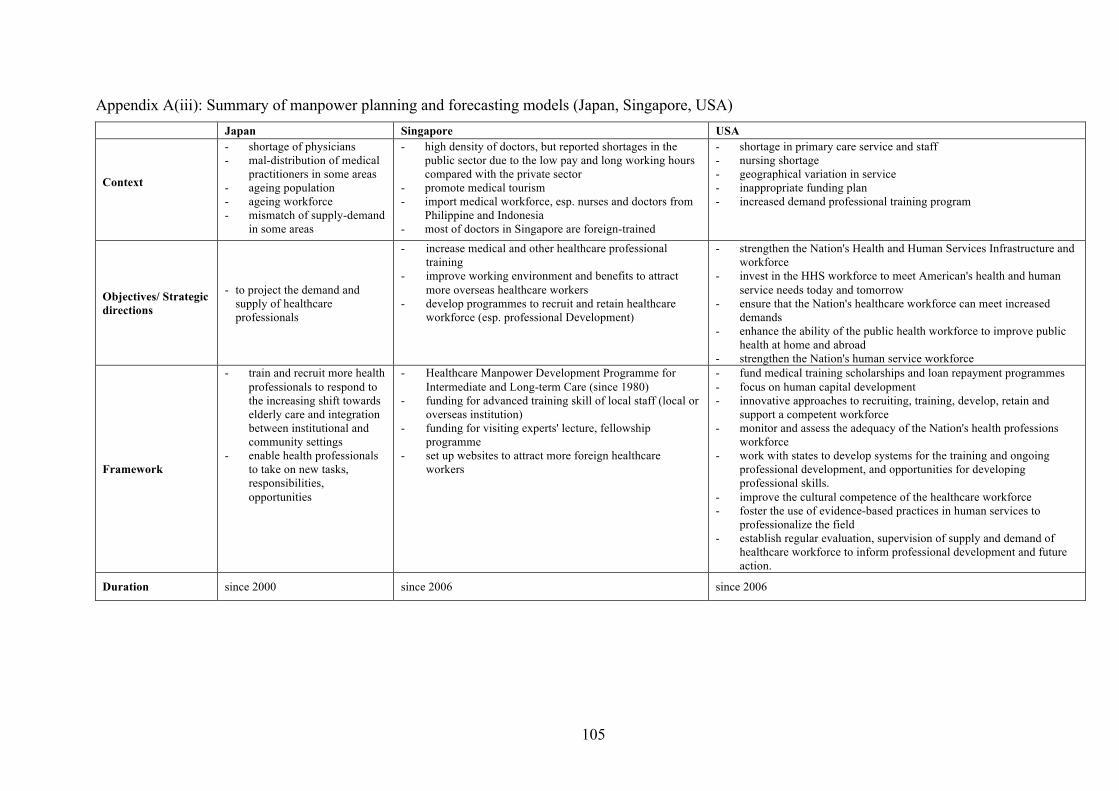
Appendix A(iii) Summary of manpower planning and forecasting models (Japan Singapore Scotland United Kingdom) 102
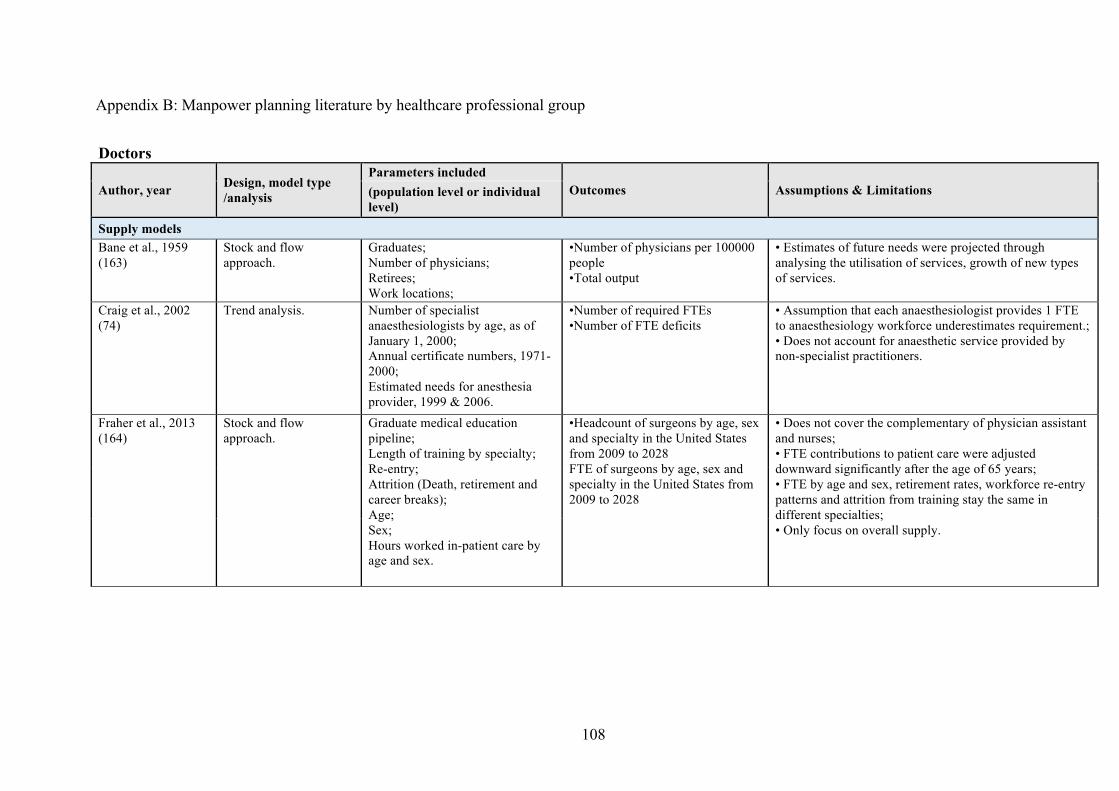
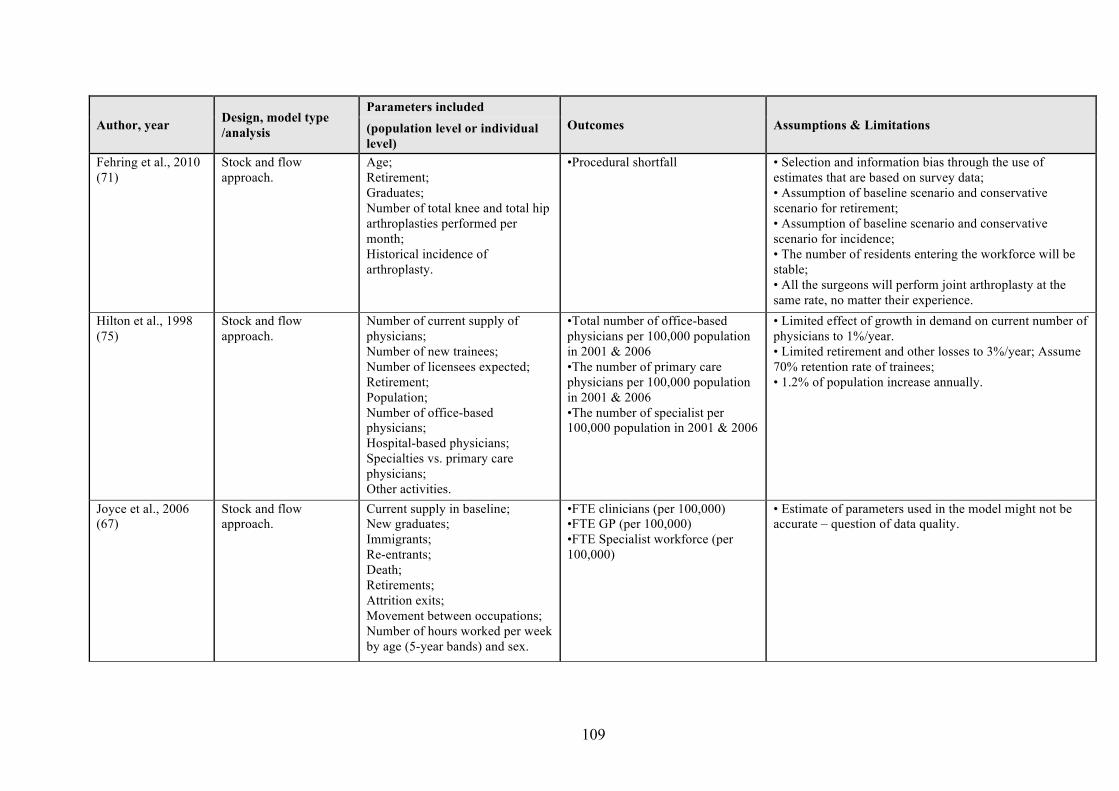
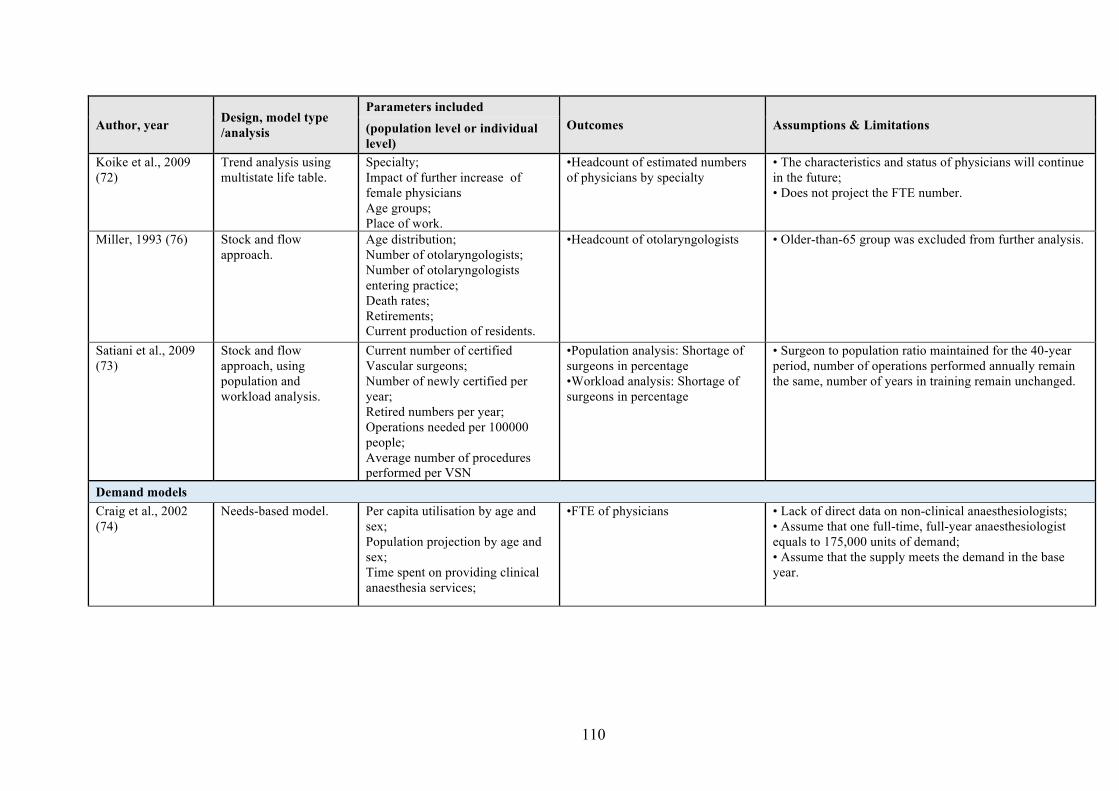
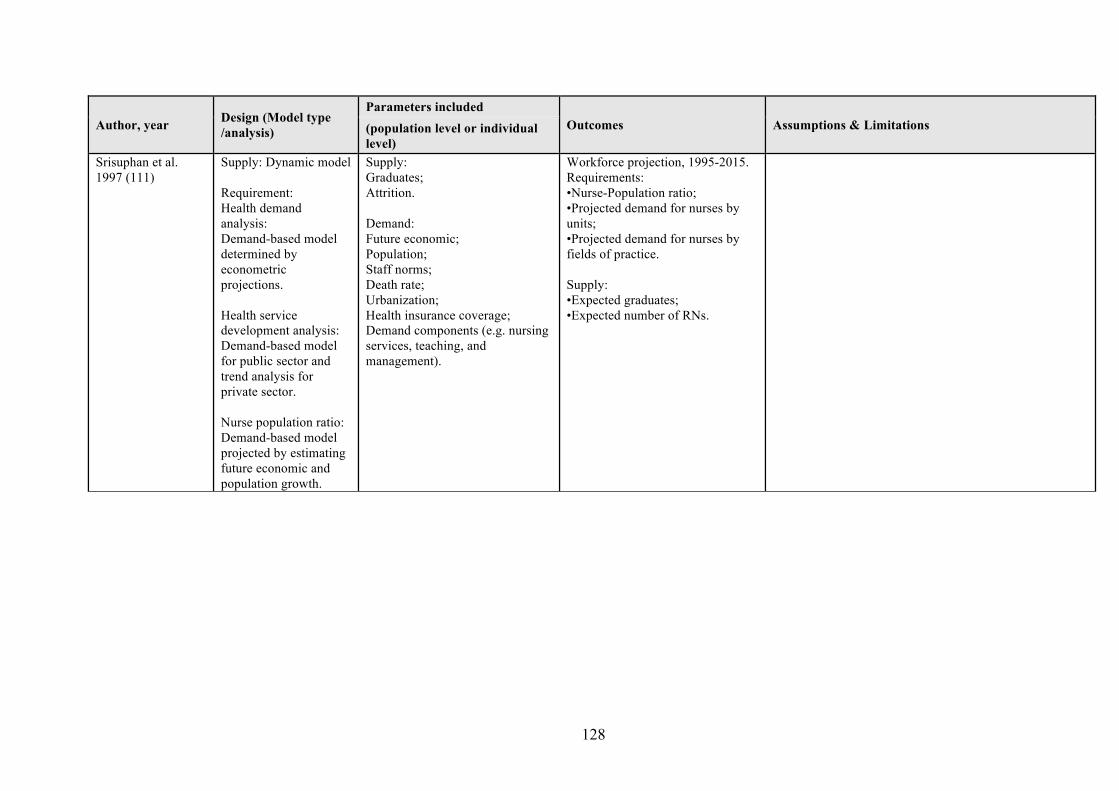
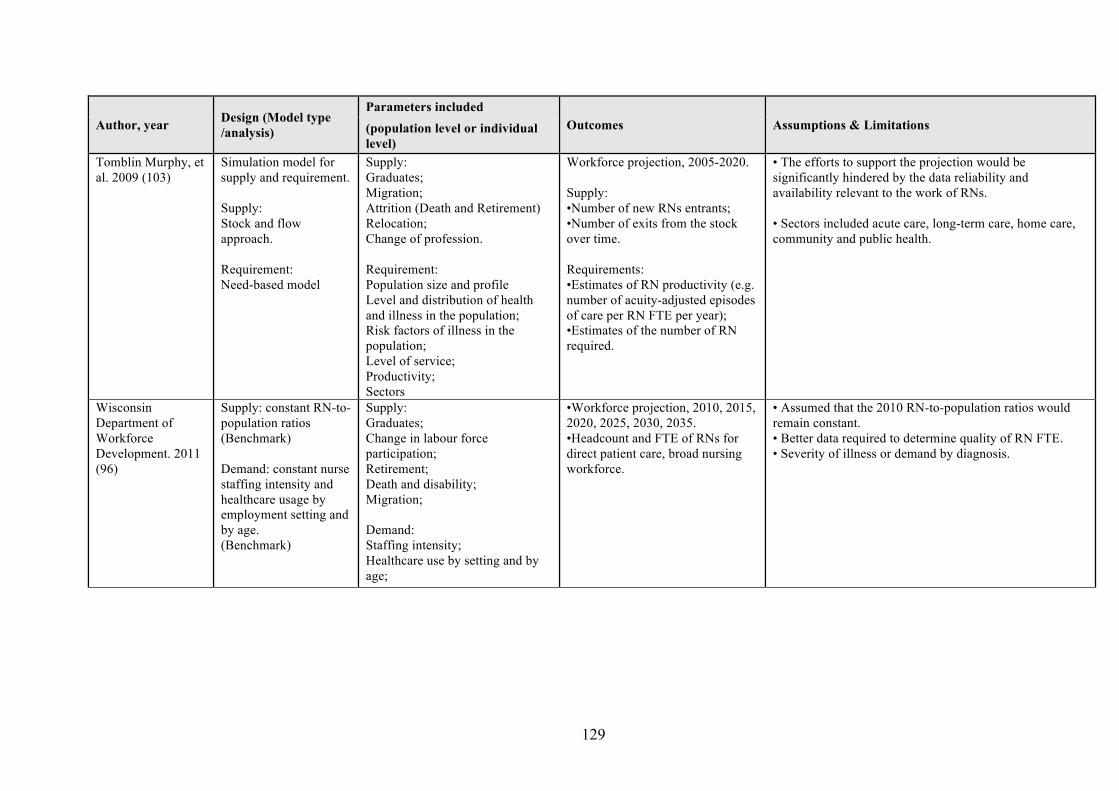
USA) 105 Appendix B Manpower planning literature by healthcare professional group108
ix
1 Introduction
Manpower or workforce planning which is defined as ldquoensuring that the right people are
available to deliver the right services to the right people at the right timerdquo (1) is believed to
be the appropriate approach to tackling the allocative and technical efficiency issues
associated with the lsquoproductionrsquo function of healthcare Human resources for health (HRH)
planning and forecasting is an important strategic objective in many countries and often
reflects an increasing mismatch between the needdemand for and supply of healthcare
professionals at regional as well as national levels
Historically HRH forecasting has been weakly linked to national health policies and
population health needs It was based on the assumption that more healthcare input produced
better health and was done by modelling supply demand and need for manpower
independently (2-4)
HRH forecasting is extremely complex and often framed by healthcare financing models and
resources allocated to healthcare service delivery models the level and mix of healthcare
services controls on the volume and appropriateness of clinical activity productivity
elasticity of supply work-force complementarity and substitution (3 5) Comprehensive
forecasting models combine economic concepts with determinants of health the peculiarities
of the medical environment and training time lags (6)
Modelling is an essential tool for manpower projections Depending on the underlying
assumptions the models adopted may be deterministic or stochastic Deterministic models
are used when the outcome is certain whereas stochastic models allow for uncertainty and
flexibility in the model and deliver different results over multiple runs Over time stochastic
models are believed to reveal the most likely outcome but they are more computational
involved use complex programming and present analytical challenges There are however
also methodological limitations in these stochastic models including the lack of easily
accessible clinical administrative and provider databases for modelling as well as conceptual
challenges Many of these models are of variable quality andor project only for (a) specific
diseases(s) or professional group only The quantity and quality of the data will directly
determine how accurately the model reflects the real situation and therefore the reliability of
the projections (7)
1
Considering the many factors that shape projection models (eg availability and quality of
data assumptions regarding characteristics of population change and growth developments
in medical technology andor clinical practice) selecting the model structure and attributes
most suitable for the setting is essential A number of projection models are described in the
formal academic and grey literature however a comprehensive ldquogold standardrdquo that fits all
situations equally well remains elusive There is little consensus on the best methods for
estimating healthcare manpower in the literature The most common approaches include
workforce-population ratios need-based demandutilisation-based and supply models (8)
Each method has its strengths and limitations and requires many compromises
simplifications and assumptions
2 Setting the scene
21 Models for policy level planning
211 Need-based models Need-based models allow for estimates of true population need by considering changes in
health status and efficacy of healthcare services (3 8 9) while adjusting for population size
and characteristics including age sex household income risk behaviour and self-perceived
health These models project healthcare deficits as well as healthcare service need (both
professional staff or quality of service to an optimum standard) As need-based approaches
have greater data demands than approaches based on supply or utilisation epidemiological
data is an important limiting factor For these models detailed information on the efficacy of
individual medical services for specific medical conditions is required (8) Although need-
based models usually cannot account for historically unmet need they can avoid perpetuating
existing inequity and inefficiency within the healthcare delivery system a common problem
with other forecasting models however the assumption that healthcare resources will be
used in accordance with relative levels of need is seldom verified
212 Demandutilisation-based models Demandutilisation models are built on service utilisation data (8) under the assumption that
healthcare workload remains constant over time and population growth directly leads to
increased workload (4 9) Demand models commonly include 1) estimates of healthcare
demand or at least historical utilisation patterns (most frequently by diagnosis) 2) anticipated
change in practice patterns 3) the impact of current and emerging technologies and 4) policy
2
change The projections are often limited to age and sex although other characteristics of the
population market conditions institutional arrangements and patterns of morbidity may be
included Previous demand models have often assumed that doctors were required for all
demanded service current demand was appropriate age and sex specific resource
requirements were constant and demographic change was predictable over time (8)
213 Benchmarking Benchmarks refer to a current best estimate of a reasonable workforce These estimates are
valid for comparison only if communities and healthcare planning are comparable ie
adjusted for key demographic health and health system parameters Estimates of manpower
requirements are based on healthcare worker-to-population ratios and current healthcare
services For such models to be relevant adjustments for differences in population
demography population health health insurance productivity and health system organization
are important (8)
214 Trend analysis Based on aggregate level and time series historical data trend analysis uses observed
historical population growth and ageing trends for predicting future trends It is a macro
simulation based on the extrapolation of past trends Trend analysis is often useful for
projecting likely growth particularly in the private sector (7 10) These models assume 1) a
causal relationship between economic growth and the number of doctors per capita 2) that
future requirements will reflect current requirements (eg the current level mix and
distribution of providers are sufficient) 3) productivity remains constant and 4) demographic
profiles (such as population growth) are consistent with observed trends (8 11) Some argue
these models have lsquolabour myopiarsquo and should be revised to include determinants of doctor
productivity and elasticity of labour supply for different provider groups (5) These models
do not consider the evolution of the demand for care
22 Learning from international organisations
221 World Health Organisation The mission of the Department of Human Resources for Health World Health Organisation
(WHO) is to ldquoprovide equitable access for all people to an adequately trained skilled and
supported health workforce to contribute towards the attainment of the highest possible level
of healthrdquo (12) The strategic direction of the department is to provide technical and
3
administrative coordination through several priority programmes one of which is the Health
Workforce Information and Governance team This team provides countries and other
healthcare partners policy and planning advice and technical support in the form of tools
guidelines norms and standards on health workforce assessment planning monitoring and
evaluation (7 13-21) The WHO has identified three fundamental principles associated with
the integration of healthcare service and the development of health personnel (13) First the
planning production and management functions for HRH must go together Second human
resources are to serve the needs of the health system Third the health system must serve the
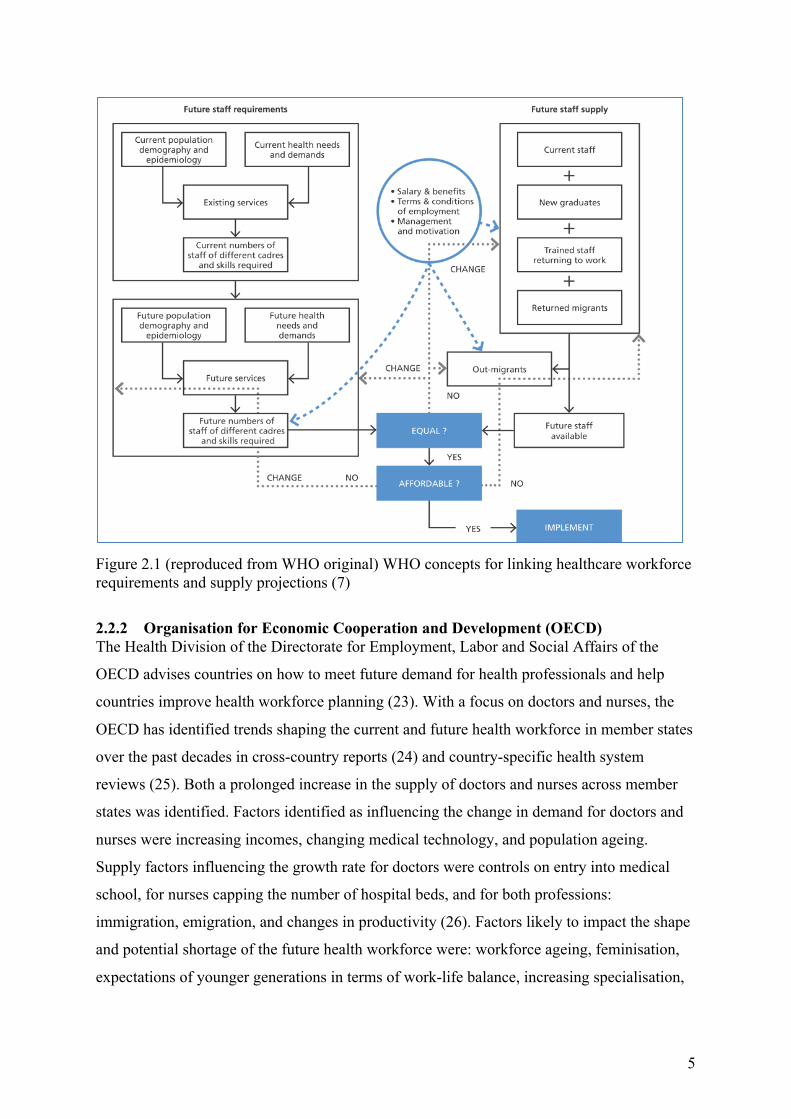
peoplersquos needs The WHO has developed a conceptual framework for HRH projection which
pulls all these activities together It consists of 4 different phases including 1) situation
analysis 2) planning 3) implementation and 4) monitoring and evaluation (22) While the
HRH framework is applicable in all countries its application will be influenced by elements
specific to the country context Figure 21 provides the outline adopted by the WHO to
identify the mechanism by which balance in the requirements (demand for healthcare
provision) and the supply can be achieved
The WHO uses simulation as the tool to assess the potential impact of various strategies on
change in the model outcomes Both deterministic and stochastic processes can be applied to
this model Typically the variables included in these models are demographic growth and
change health policy and related legislation technological change burden of disease service
and provider utilisation relevant service quality standards organisational efficiency skills
mix individual provider performance public demand and expectations and availability and
means of financing The most commonly used approaches to project workforce requirements
are workforce-to-population health-needs service-demand and service targets methods
Each has its advantages and disadvantages Although supply side projections are relatively
less complex and simpler careful accounting is needed to ensure all relevant and available
workers are included in the estimates Aspects to consider are the capacity to produce
healthcare workers the different types of healthcare workers needed for future work loss
rates due to retirement and emigration death or pre-retirement leaving
4
Figure 21 (reproduced from WHO original) WHO concepts for linking healthcare workforce requirements and supply projections (7)
222 Organisation for Economic Cooperation and Development (OECD) The Health Division of the Directorate for Employment Labor and Social Affairs of the
OECD advises countries on how to meet future demand for health professionals and help
countries improve health workforce planning (23) With a focus on doctors and nurses the
OECD has identified trends shaping the current and future health workforce in member states
over the past decades in cross-country reports (24) and country-specific health system
reviews (25) Both a prolonged increase in the supply of doctors and nurses across member
states was identified Factors identified as influencing the change in demand for doctors and
nurses were increasing incomes changing medical technology and population ageing
Supply factors influencing the growth rate for doctors were controls on entry into medical
school for nurses capping the number of hospital beds and for both professions
immigration emigration and changes in productivity (26) Factors likely to impact the shape
and potential shortage of the future health workforce were workforce ageing feminisation
expectations of younger generations in terms of work-life balance increasing specialisation
5
and changes in delivery of service such as an increase in day case treatment and overall
declining length of stay (26)
The OECD has also explored specific issues such as the impact of skill-mix and policy
change on the health workforce (27) staff shortages (28) and strategies on how to adapt
supply to a growing demand within particular workforce specialties (29)
The extensive work undertaken by the WHO and the OECD and the development of
manpower planning and forecasting tools by these organisations are useful guides for
manpower projections in Hong Kong They provide an excellent source of benchmarking
tools in the area of health manpower planning for both developing and developed countries
23 Learning from overseas jurisdictions To learn from international approaches to workforce planning nine jurisdictions were
selected for review ndash Australia (30) Canada (31) Japan (32) The Netherlands (33) New
Zealand (34) Scotland (35) Singapore (36) United Kingdom (37) and the United States (38
39) to determine 1) strategies for national level manpower planning and forecasting 2)
methods used to project population level healthcare professional demand and supply and 3)
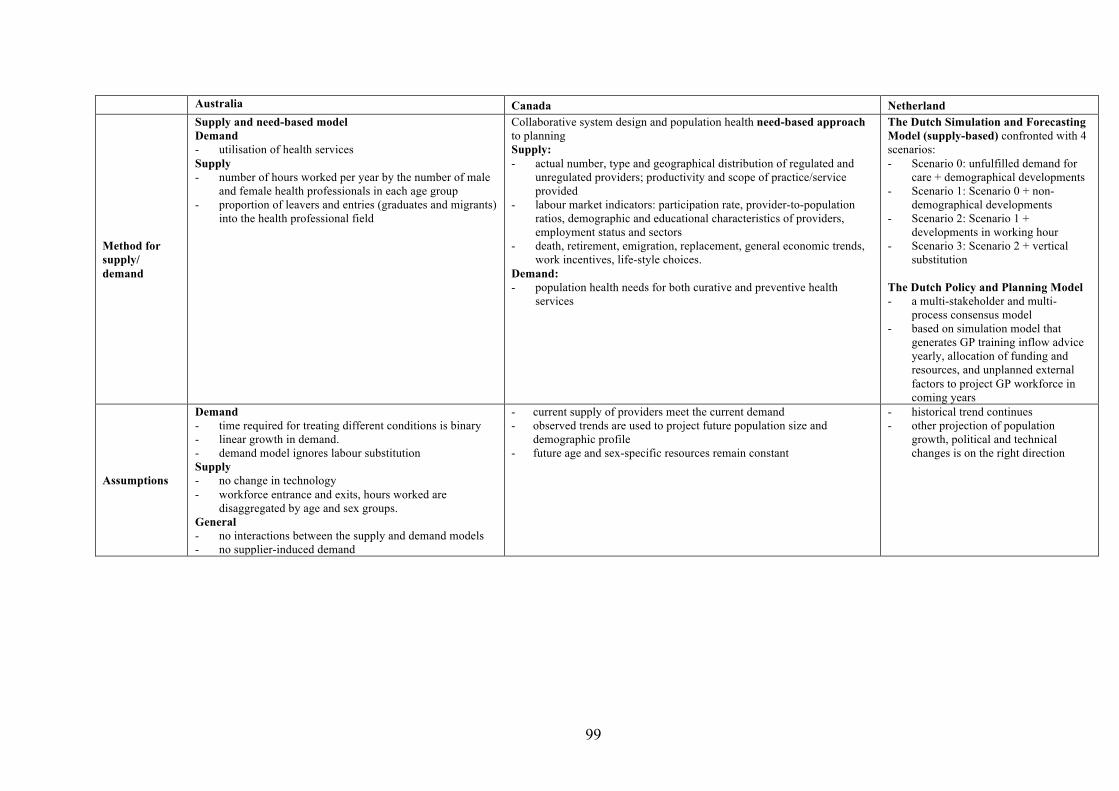
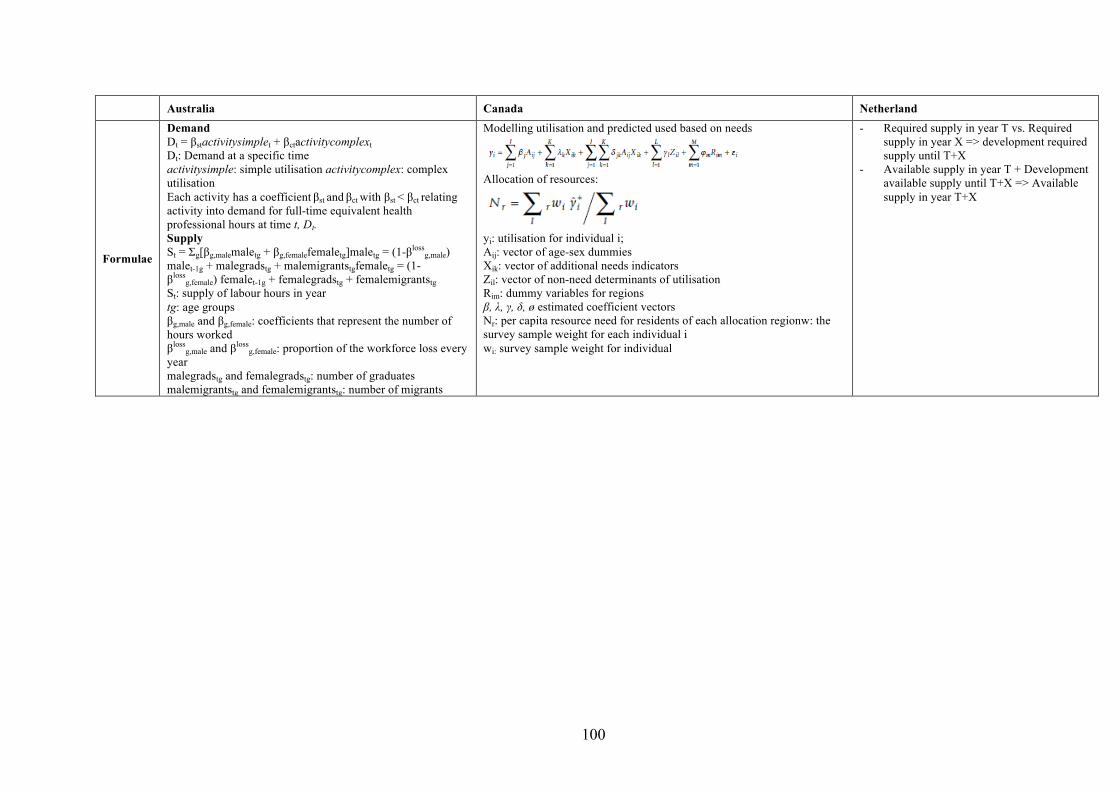
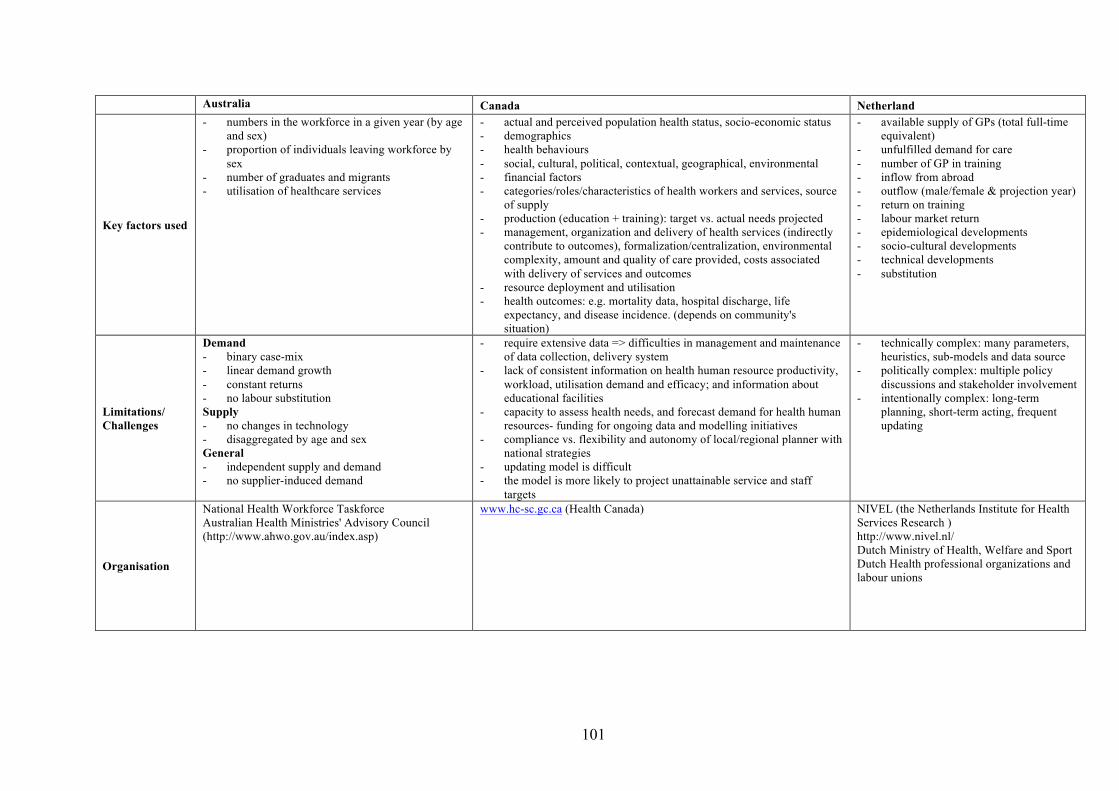
methods to improve workforce productivity and capability Appendix A (i) (ii) and (iii)
illustrates the context framework methods and assumptions guiding these manpower
planning and forecasting models These jurisdictions were selected for the maturity of their
manpower planning models and comparability of workforce issues to Hong Kong
231 Australia Set up by the Council of Australian Governments and reporting to the Australian Health
Ministersrsquo Advisory Council Health Workforce Australia (HWA) is responsible for
projecting the healthcare manpower requirements in Australia and advising and informing
governing bodies on the dynamic changes in the healthcare workforce (30) HWA has
adopted a lsquomodels of carersquo approach based on competencies required for the delivery of the
best healthcare The HWA projects manpower requirements based on the expected change in
model parameters (such as changes in immigration innovationtechnology healthcare and
health system reform as well as skills or roles or healthcare professionals) through scenarios
analyses
6
The HWA 2025 healthcare workforce projection for midwives registered and enrolled nurses
used a stock and flow supply model and applied a constant linear growth rate model to
calculate demand (40) Supply model parameters included graduates immigration of nurses
no longer available for nursing practice training time and hours worked The demand model
parameters included total hospital bed-days by population growth service related groups
(similar to Diagnostic Related Groups) total number of aged care packages by population
growth aged 70 years and over service utilisation total number of projected births and total
number of projected Registered Nurse (RN) Enrolled Nurse (EN) full time equivalent (FTE)1
by population ratio (40)
The HWA adopted a similar model for the November 2012 projection of medical specialties
The stock and flow supply model parameters included workforce headcount demographic
characteristics number of graduates and medical fellows immigration of overseas specialists
lost to medical practice FTE benchmarks training time and number of hours worked (40)
The demand model parameters were service utilisation by sex and five-year age cohort
publicprivate hours worked services related groups and enhanced service related groups
Diagnosis groups were used to assign medical services to medical specialties and sub-
specialties (41) and to adjust for complexity of care (proxy for severity of illness) The
assumption being that higher complexity inherently drives manpower requirements These
models derive estimates from a baseline year and assume a consistent linear future trend in
healthcare need and technological change
232 Canada Prior to 2003 healthcare workforce planning in Canada was undertaken by each jurisdiction
or province independently and did not address pan-Canadian supply and demand In seven of
the ten provinces historical patterns of health service utilisation and health human resource
supply as proxies for public sector demand and supply were used to project healthcare
manpower requirements The remaining three provinces adopted a need-based approach
Since 2003 Health Canada (a department of the federal government) has worked with the
provinces and territories to improve coordination in and develop a conceptual model for
human health resource planning (42) The proposal includes a stock and flow model for
supply and a need-based model using utilisation of curative and preventive services (43)
1 Full-time equivalent (FTE) is a standardized measure of time at work for an employed person An FTE of 10 indicates a full-time worker whereas FTE of 05 signals half-time
7
More specifically most jurisdictions calculated health workforce supply using parameters
such as new local and non-local registrants attrition and employment status (44) Although
many parameters were available to project manpower demand and supply most of the
provinces used historical trends (age and sex stratified) to project future healthcare workforce
requirements (44) The newer projection models adopt additional supply-side parameters
such as education immigration and career patterns (44) Overall Canadian healthcare
manpower demand models project FTE requirements on current utilisation patterns including
parameters such as changes in the total population size and age-sex structure Only two
jurisdictions report including parameters such as socio-economic characteristics in the
models or addressing the impact of externalities such as change in healthcare policy
Although Health Canada is coordinating healthcare manpower planning and forecasting as
with most other health care issues healthcare manpower regulation and registration planning
and forecasting remains the jurisdiction of the provinces While there are similarities and
commonalities between provinces the models as developed and applied are broadly
applicable only to the province of origin
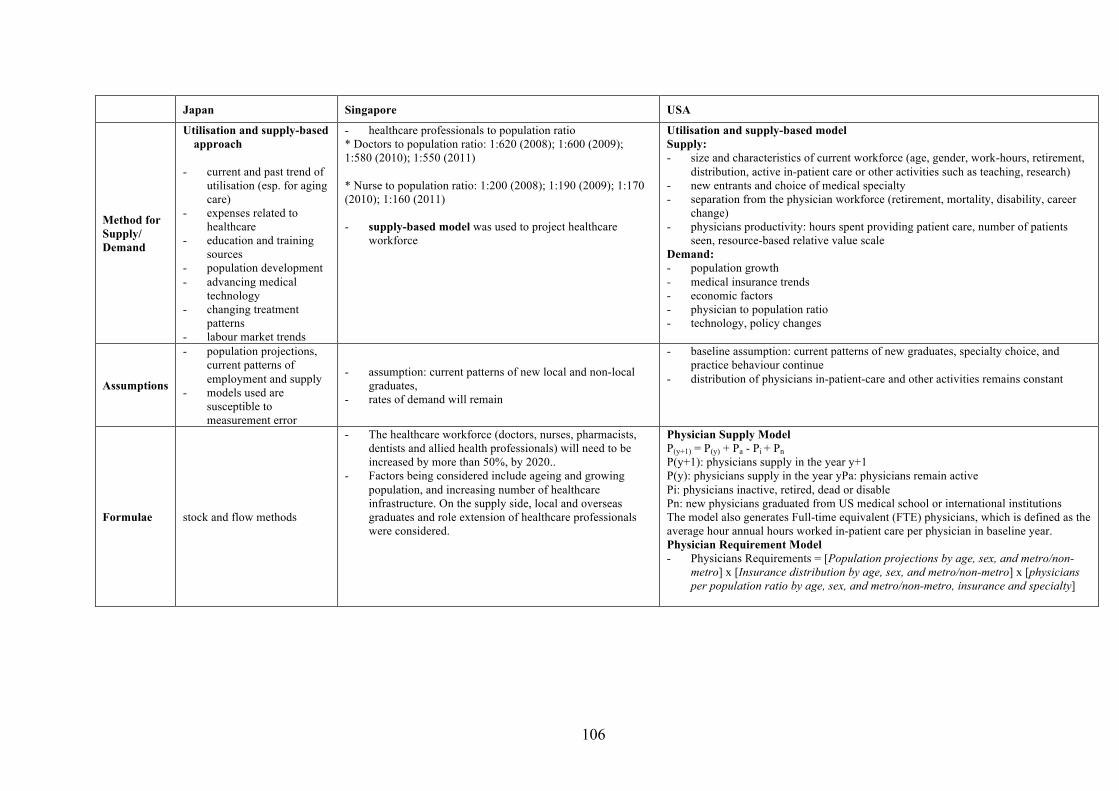
233 Japan The Ministry of Health Labour and Welfare (Japan) projects the supply and demand for
healthcare personnel (45) The 7th Projection of Estimated Supply and Demand for Nursing
Personnel was prepared in 2010 estimated a shortfall of 15000 nurses in 2016 (46) The
supply parameters included current employment status by year local and international
graduates re-employment and retirement The demand parameters included service
utilisation by hospitals clinics maternity clinics long-term care facilities social welfare
facilities health centres and municipal facilities educational institutions workplaces and
schools (46) Currently the full report of the 7th Projection of Estimated Supply and Demand
for Nursing Personnel is not released thus more specific methods are not publicly available
Historical trends were used to quantify but not project the demand for other healthcare
professionals such as doctors dentists and pharmacists (46)
234 The Netherlands The Netherlands Institute for Health Services Research (NIVEL) is an independent
organisation with manpower planning as a particular area of research (47) NIVEL deployed
stock and flow methods to project supply and demand for healthcare professionals (48)
8
Parameters used in their supply model included working capacity primary activity
graduates drop-out rates expected age of retirement working hours and task delegation (48)
The supply model also incorporated the flow of medical professionals by sex in and out of
the healthcare market and projected total FTE The demand model (a three-part model) used
simulation methods to project service utilisation on demographic and epidemiological
developments (48) Part 1 established the baseline supply and demand of healthcare
professionals by FTE adjusted by gender (49) The manpower gap between the supply and
demand was then estimated Part 2 projected supply and demand FTE requirements for the
target year by projecting parameters such as demographic change and the inflow and outflow
of health professionals (49) Part 3 compared the expected manpower supply by FTE from
labour market returns with projected FTE supply in three scenarios (49) The base scenario
used trend analysis to forecast the impact of demographic change on the demand for
healthcare The first scenario included parameters such as epidemiological socio-cultural and
technical developments as well as efficiency change horizontal substitution and working
hours per FTE in the demand model The second scenario considered the impact of vertical
substitution on demand (49)
Although a comprehensive methodology has been used for healthcare manpower planning in
the Netherlands the models generally draw on a subjective interpretation of the demand
(expert opinion determines unmet demand)
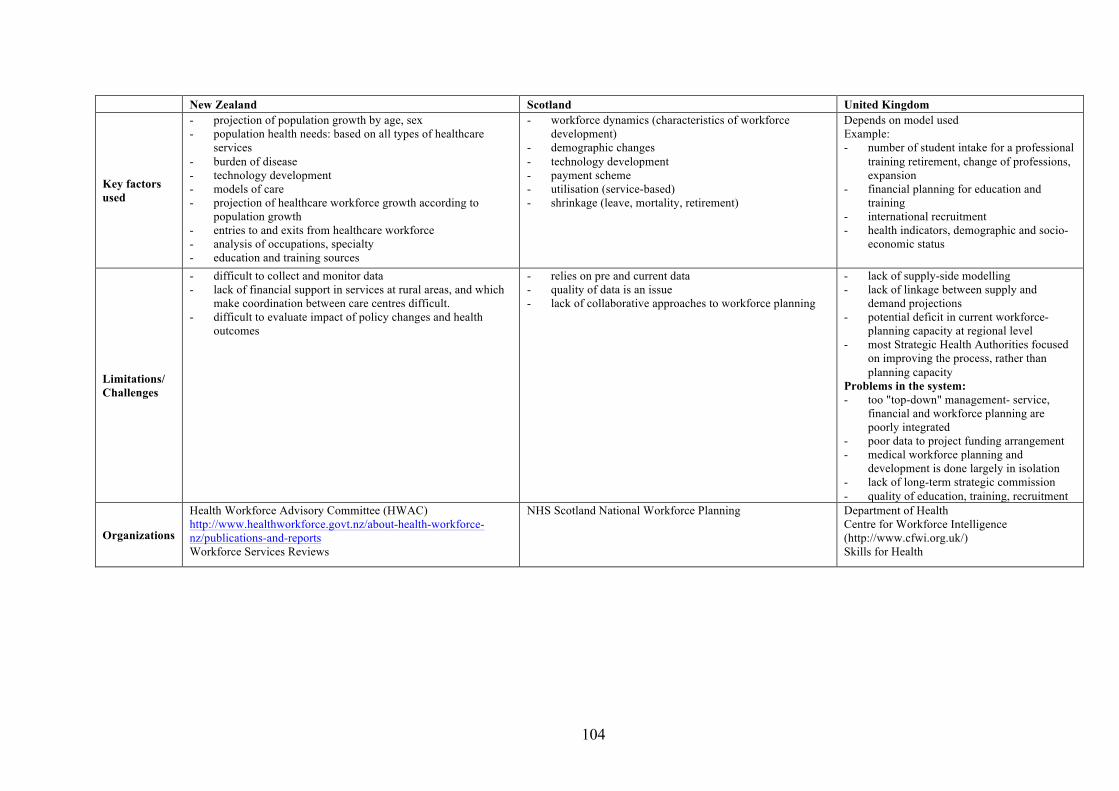
235 New Zealand In New Zealand Health Workforce New Zealand (HWNZ) has the overall responsibility for
planning and development of the health workforce ensuring that staffing issues are aligned
with planning on the delivery of services and that New Zealandrsquos healthcare workforce is fit
for purpose (50) Currently HWNZ is undergoing workforce service review with the
objective of determining future health workforce requirements in 13 areas aged care
anaesthesia eye health palliative care musculoskeletal diseases gastroenterology youth
health diabetes mental health rehabilitation mother and baby healthcare for the Maori and
healthcare for Pacific Islanders (50) The HWNZ has used trend analysis and predicted
service utilisation to determine future requirements
The HWNZ has projected healthcare manpower (51) from the Health Workforce Information
Programme The supply model projection used a dynamic supply model to calculate
9
headcount and FTE from historical trends of new graduates return rates and retirements
rates Model parameters included current workforce inflow and outflow age sex ethnicity
and occupation (51) The demand model included the following parameters population
growth age sex ethnicity change in service change in the care model and the impact of
current and emerging technologies (51) HWNZ contends that due to the shift toward
population based healthcare delivery the total population health needs and achievements are
of particular importance in the forecast for demand
The projection models rely heavily on trend analysis and linear regression to estimate
manpower requirements While simple models can provide a quick snapshot of current needs
of population they lack the dynamic variation in scenarios and may misrepresent the demand
for healthcare
236 Scotland NHS Scotland Workforce section of Information Services Division has used trend analysis to
assess the supply and demand of medical dental nursing and midwifery allied health
professions health science ambulance staff psychology and pharmacy workforce (52)
Parameters such as changing demography and service utilisation were used for the demand
models and workforce dynamics workforce inflows and outflows for the supply models
(53)
Three methods dynamic models (stock and flow) healthcare professional-to-population ratio
demandutilisation-based models were used to project healthcare professional supply and
demand The model parameters included service utilisation service delivery changing
models of care workforce skill mix (roles and competencies) integration and engagement of
the workforce across the professions health and social care and care by sector (primary
secondary and tertiary) attendance rate treatment rates and for dentists average quantity of
treatment per dentist per year (54 55)
The supply model adopts stock and flow methods that are commonly used by many other
countries The demandutilisation-based models while more sophisticated require extensive
and complex data are susceptible to larger measurement error than projections based on
population ratios (53)
10
237 Singapore The National Manpower Council of the Singapore Ministry of Manpower is the decision-
making body for the National Manpower Planning Framework (56) The Council has adopted
an approach where the future demand for healthcare manpower is based on trend analysis of
population demographics and current healthcare workforce supply (57) In 2009-2011 the
overall supply of doctors registered nurses enrolled nurses dentists pharmacists and
optometrists increased across the board (58) As at 2012 Singapore had 10225 doctors
(doctor-to-population ratio of 1520) 60 of whom work in the public sector (58) 34507
nurses and midwives (nurse-to-population ratio of 1150) Strategies to manage the in- and
out-flows of healthcare professionals (ie doctor specialist nurse) and to recruit more
internationally qualified healthcare professionals from developed countries have been put in
place to reduce workload demand Included in this approach is the talent outreach programme
(36) The Healthcare 2020 Masterplan healthcare demand and workforce planning projection
parameters (57) included population growth and ageing education healthcare sector
productivity and change in healthcare worker role (ie role extension) immigration of
foreign healthcare workers and changes in the service delivery model The supply model
includes education and training of local professionals and the recruitment of non-local
graduates
The available data from the Ministry of Health are total number of healthcare professionals
by sectors (ie private and public sectors) and the professional-to-population ratio or vice
versa (58) No full-time equivalent information was considered are given For some
healthcare professionals professional-to-doctors ratio was used in the trend analysis
238 United Kingdom The Centre for Workforce Intelligence (CWI) provides advice and information to health and
social care systems on workforce planning and development in the United Kingdom (37)
CWI works closely with various organisations such as the NHS Information Centre the
medical Royal Colleges and other regulatory bodies to access the highest quality accurate
and timely data for healthcare manpower planning (37) The CWI has focused on the supply
of various health professions (medical dental nursing midwifery and other allied health
professionals) CWI released several reports in 2012 on technological economic
environmental political social and ethical factors that they consideruse in their supply and
demand projection models (59 60) Parameters used in the stock and flow model for medical
11
and dental supply include current workforce workforce participation working time spent
delivering service active workforce number of entering and returning to workforce
immigration attrition emigration those not available for work at present and retirement or
other attrition Parameters for the demand models include population size and characteristics
disease prevalence level of need and amount of service delivered by doctors and dentists
(61) Baseline need was measured by types of care (acute long-term or primary) and age sex
subgroups Population need was projected for each type of care using indicators such as
number of general practitioner (GP) visits per type of care or bed-days per type of care (61)
The CWI has adopted a need-based model where need was proxied by type of care This
approach assumes that lsquotype of carersquo appropriately reflects manpower requirements and that
all care is in the lsquoformalrsquo care sector However such a model cannot account for the
multidisciplinary nature of patient care or for the complex determinants of the location of or
patient placement for care (eg patients not discharged due to insufficient home care places
or social services)
239 United States The Health Resources and Services Administration (HRSA) and the National Center for
Health Workforce Analysis of the US Department of Health and Human Services are the
primary federal agencies for developing the tools to project the supply and demand for
healthcare professionals in the US (62 63) HRSA has released reports for doctors (by sub-
specialty) registered nurses (RN) licensed practical nurses (LPN) pharmacy dentistry
public health and clinical laboratory workforce (64) The stock and flow supply model
parameters included licence renewal retirement death disability local and international
graduates productivity career change and projected FTE Specific to RNs the model
captures the progression from one educational level to another and their interstate migration
(65)
The demand model used a utilisation-based approach and included parameters such as service
utilisation demographics insurance coveragehealthcare payment system patterns of care
delivery technology healthcare regulation and workload measures such as inpatient days
visits and nursing facility residents Care delivery patterns were expressed as healthcare
professional-to-population ratios by specialty and population segment defined by age sex
geographical location and insurance type The demand model projected FTErsquos by service
12
sector (65) The manpower gap between the supply and demand was expressed as an FTE
ratio (65) The supply models used trend analysis and stock and flow methods Supply model
parameters included graduates male-female ratio death retirement and projected FTE or
FTE-to-population ratio
HRSA has developed numerous models by healthcare professional groups and identified the
core model parameters The HRSA models could be improved by incorporating explicit
measures of externalities in the model parameters
24 Learning from commonly adopted technical approaches Although a demandutilisation-based approach was the most frequently used manpower
projection method need-based methods trend analysis and benchmarking (healthcare
professional to population ratio) were also used Demandutilisation-based models for
doctors dentists nurses and pharmacists project FTE based on service utilisation and have
usually included the following parameters hospital admissions and patient visits utilisation
weighted patient diagnosis outpatient visits treatment population growth and age
distribution economic indicators geographic factors insurance status and staffing intensity
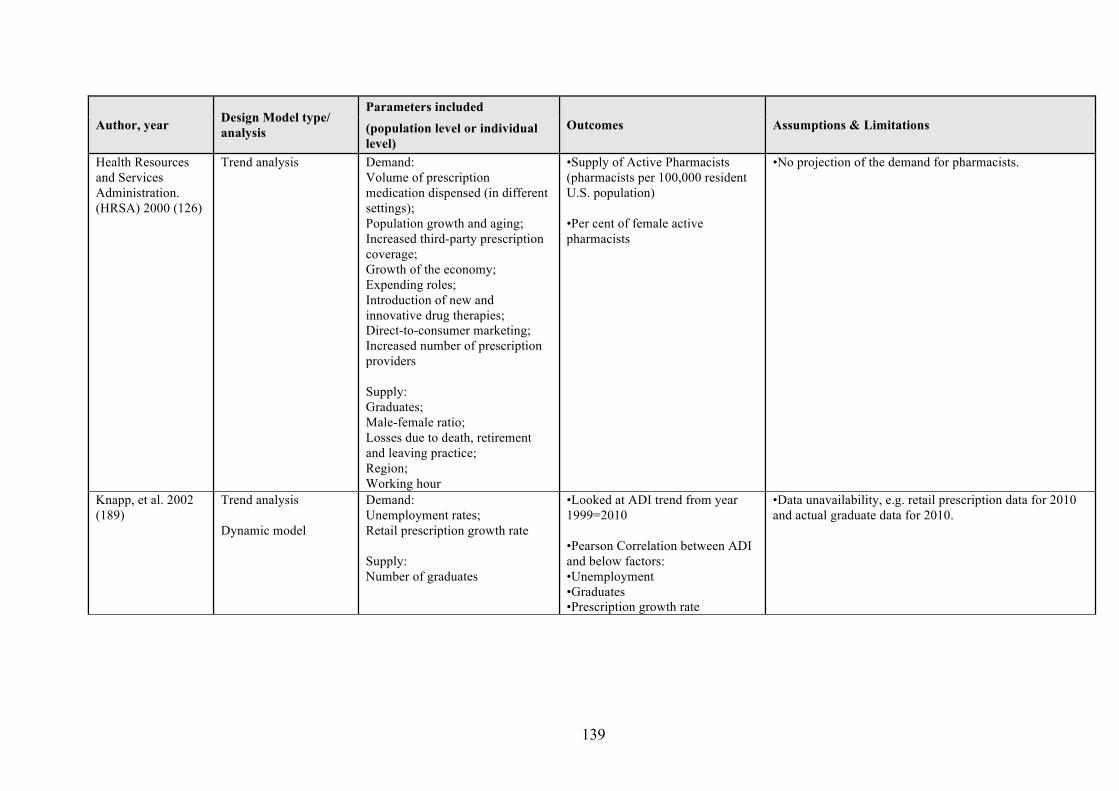
For pharmacists the parameters have included the number of prescriptions filled growth in
prescription volume for pharmacists direct-to-consumer marketing and Aggregate Demand
Index (a measure of unmet demand at the population level) Many of the projection models
were stratified by service sector Data was derived from aggregate data from annual reports
historical utilisation data and doctor ndash population ratios Model validity and reliability was
compromised by data availability and quantity A positive linear relationship between
population and economic growth healthcare utilisation and demand was assumed by most
Model assumptions were often tested by scenario analysis including change in 1) supply (eg
number of graduates registered practitioners or entrants to higher education number of
training places migration retirement rates changes in funding reimbursement and
recruitment) 2) productivity and efficiency (activity rates) 3) population demographics 4)
burden of disease health and healthcare utilisation 5) economic development and 6)
patientstaff satisfaction The lack of normative standards defining work and productivity was
a major impediment to workload analysis Manpower requirements were most often
expressed in FTE
13
While methods for modelling manpower demand for other healthcare professionals (ie not
doctors) are not as well developed utilisation service delivery expected service growth and
number of vacant positions were used to project FTE requirements Some models based
demand projections on subjective assessment of demand workload and productivity
Scenarios testing change in population demographics service utilisation service provision or
practice structure disease incidence and prevalence and norms of care were used to assess
the projection performance
Existing supply models have used stock and flow methods to project headcount or FTE
These models have included parameters also used by supranational agencies (WHO and
OECD) and national models These included age sex number of graduates number of
registered doctors attrition (retirement immigration or emigration) and practice location
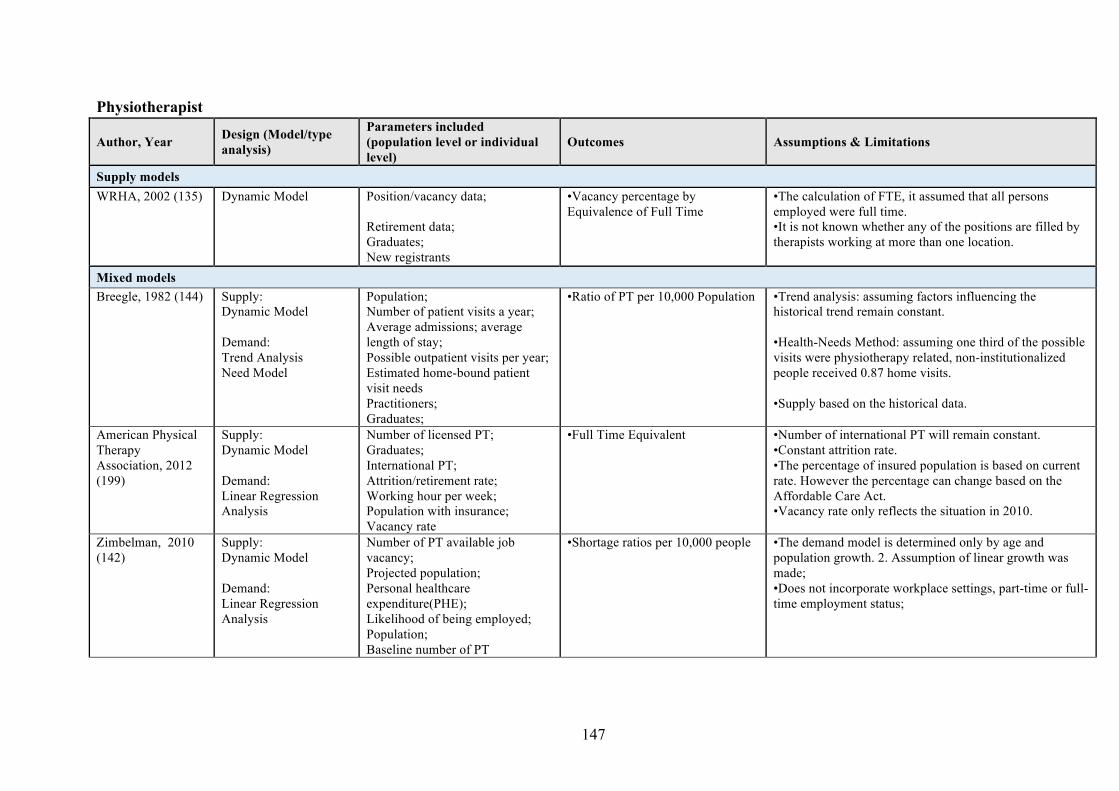
Adjusted trend analysis and straight-line projections have been used for physiotherapist
manpower supply projections The models projected manpower requirements by headcount
FTE or by healthcare professional-to-population ratio
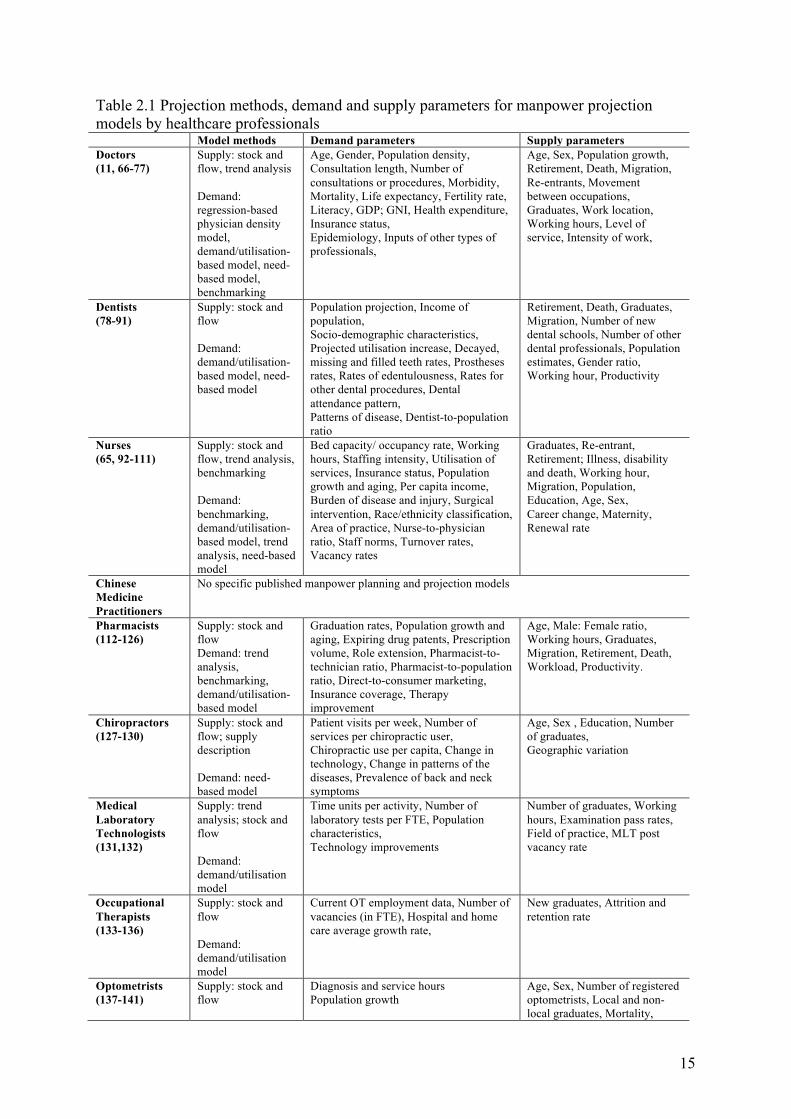
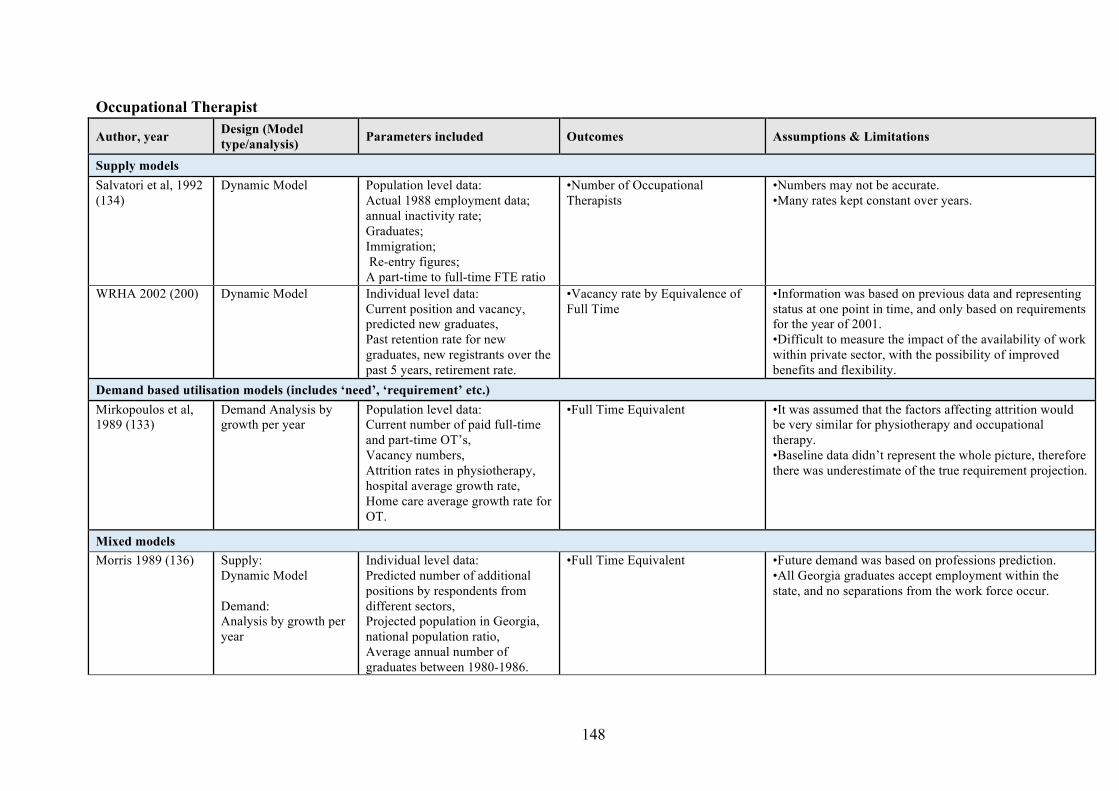
Table 21 summarises projection methods demand and supply parameters for manpower
projection models by healthcare professionals (doctors dentists nurses Chinese Medicine
Practitioners (CMP) pharmacists (Pharm) chiropractors (Chiro) medical laboratory
technologists (MLT) occupational therapists (OT) optometrists (Opt) physiotherapists (PT)
radiographers (Radio) and dental hygienists (DentH) See Appendix B for the full list of
healthcare manpower planning and forecasting publications
14
Table 21 Projection methods demand and supply parameters for manpower projection models by healthcare professionals
Model methods Demand parameters Supply parameters Doctors Supply stock and Age Gender Population density Age Sex Population growth (11 66-77) flow trend analysis
Demand regression-based physician density model demandutilisation-based model need-based model benchmarking
Consultation length Number of consultations or procedures Morbidity Mortality Life expectancy Fertility rate Literacy GDP GNI Health expenditure Insurance status Epidemiology Inputs of other types of professionals
Retirement Death Migration Re-entrants Movement between occupations Graduates Work location Working hours Level of service Intensity of work
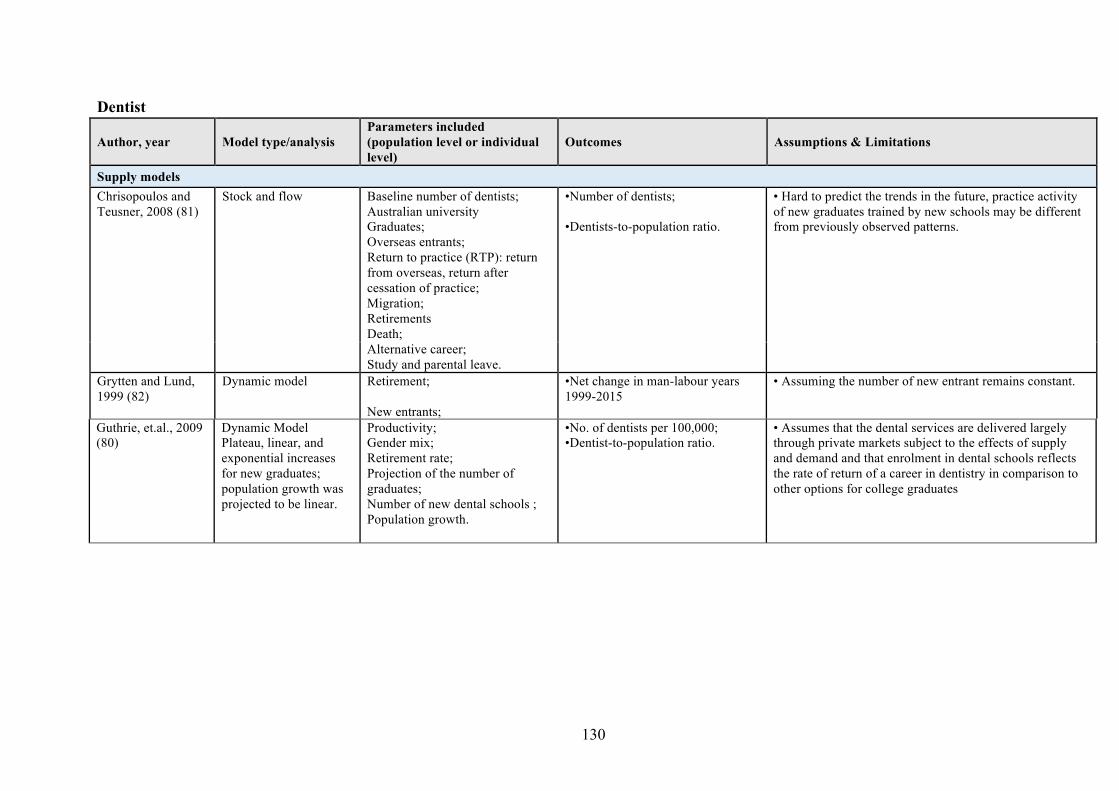
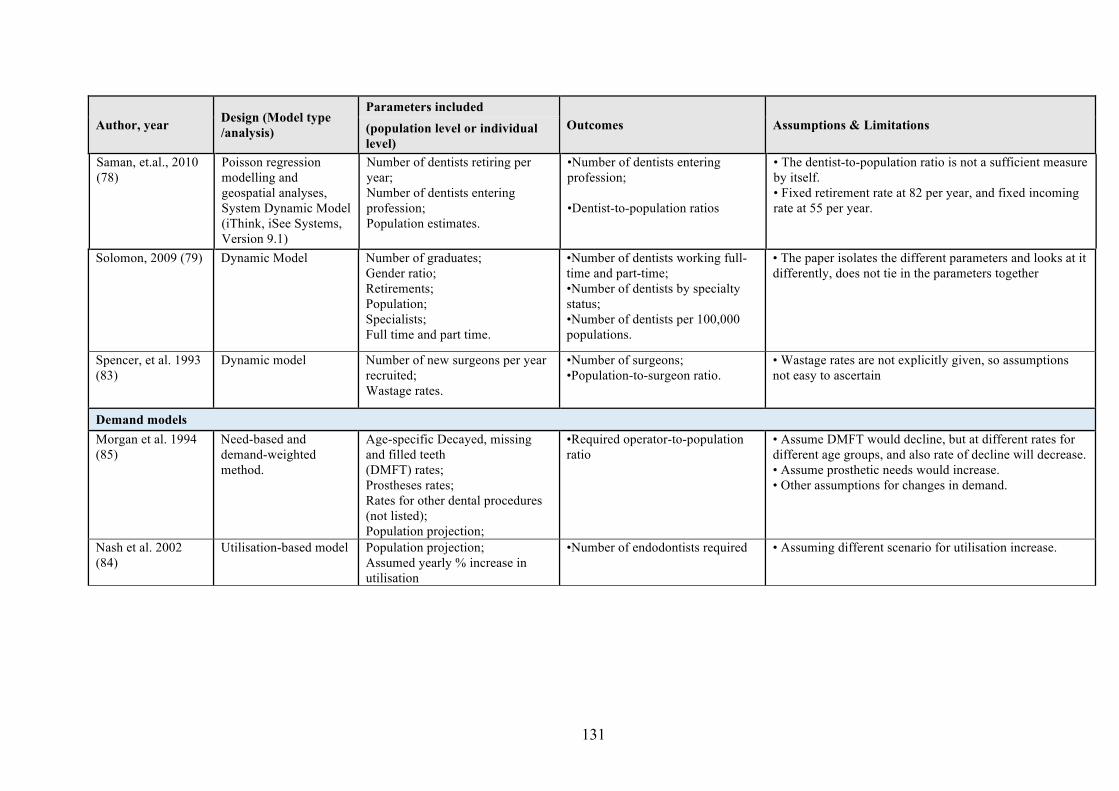
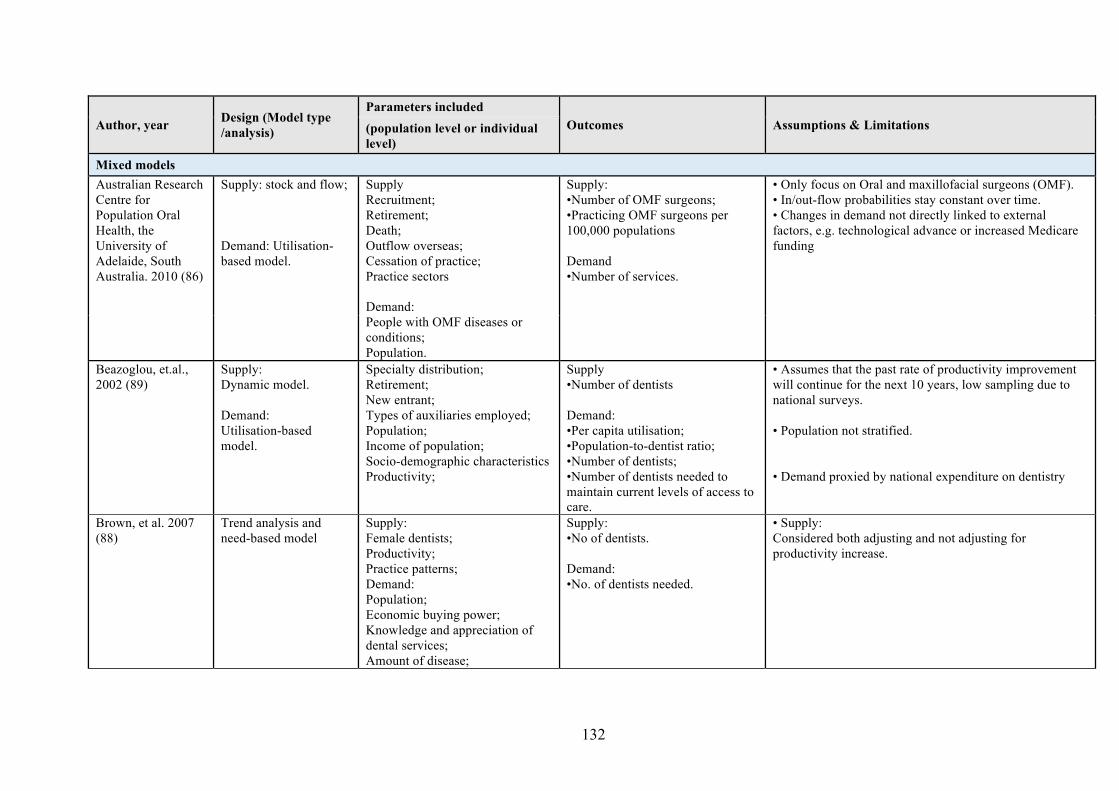
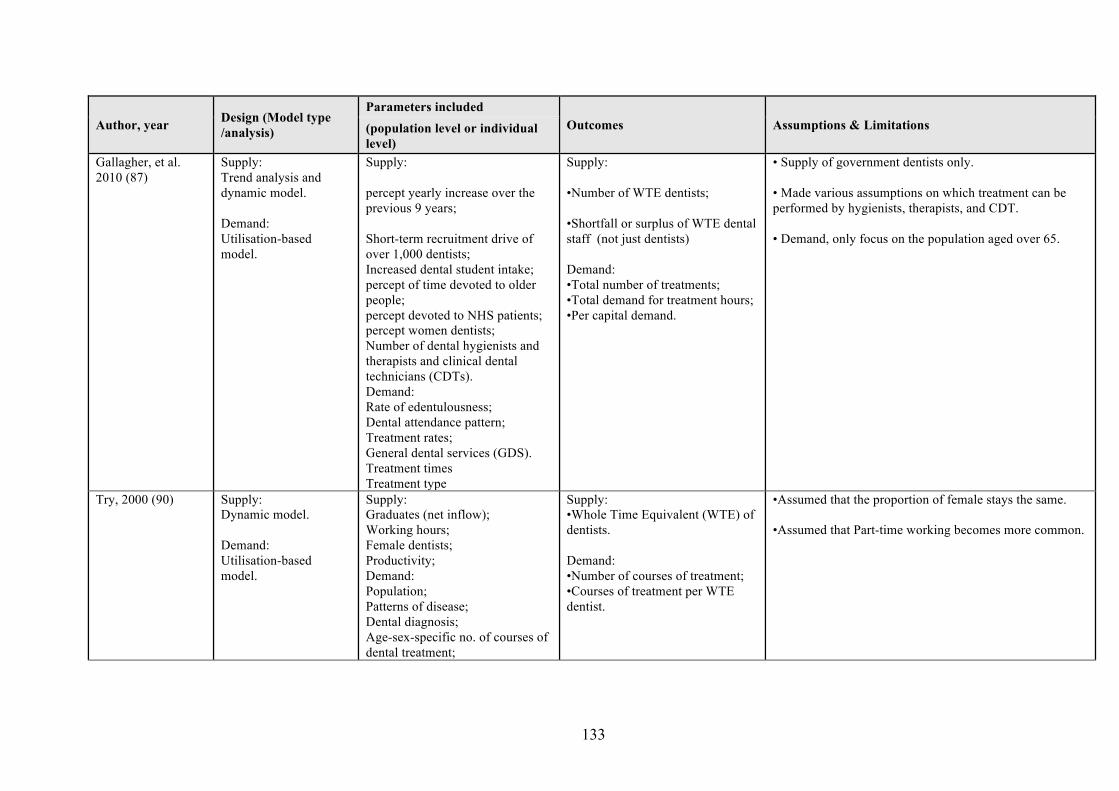
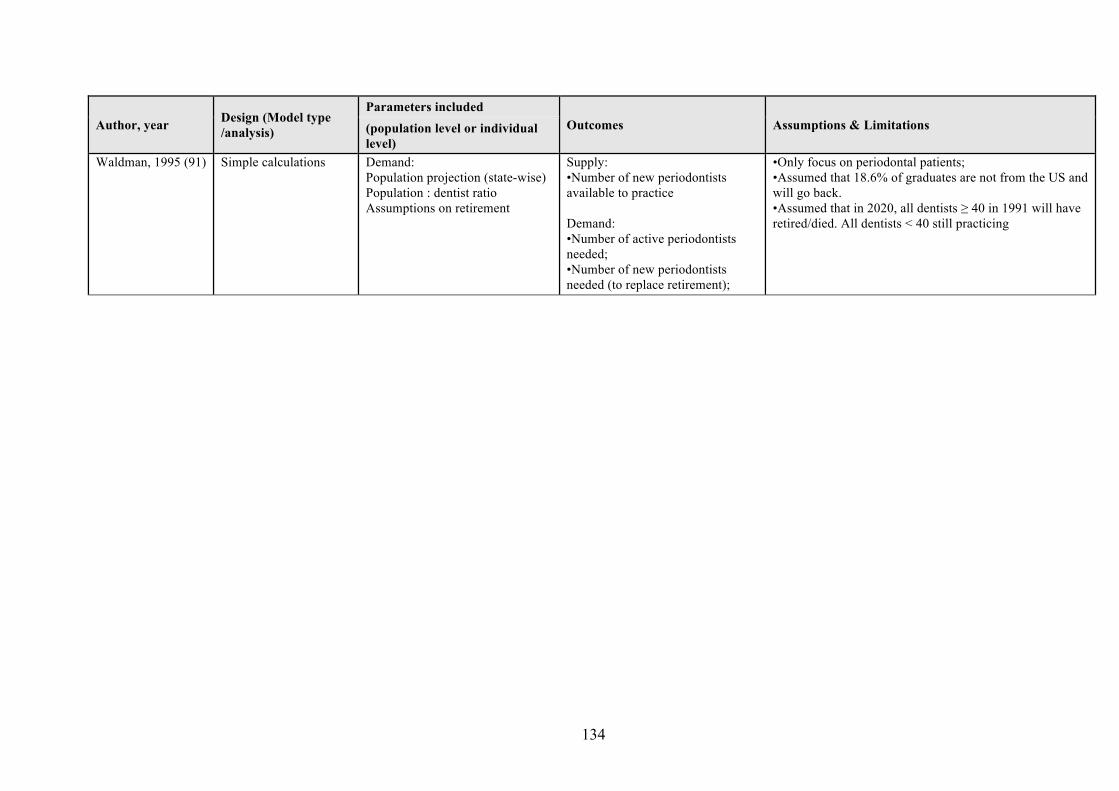
Dentists Supply stock and Population projection Income of Retirement Death Graduates (78-91) flow
Demand demandutilisation-based model need-based model
population Socio-demographic characteristics Projected utilisation increase Decayed missing and filled teeth rates Prostheses rates Rates of edentulousness Rates for other dental procedures Dental attendance pattern Patterns of disease Dentist-to-population ratio
Migration Number of new dental schools Number of other dental professionals Population estimates Gender ratio Working hour Productivity
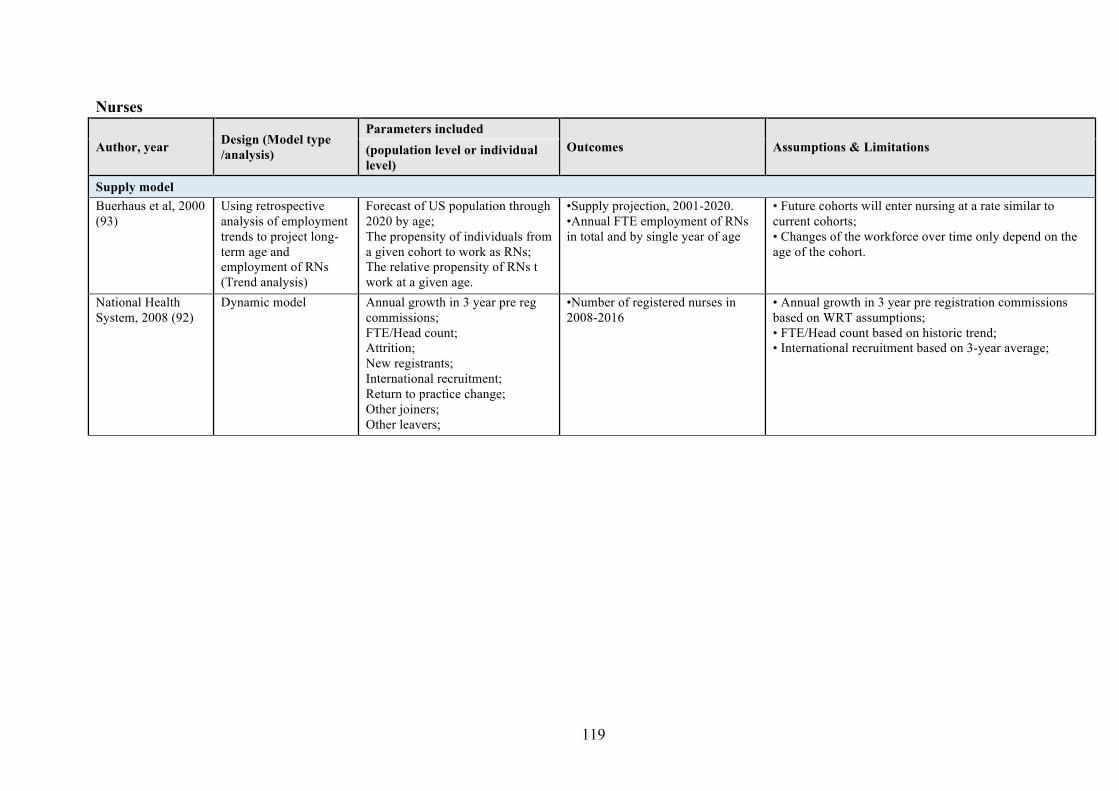
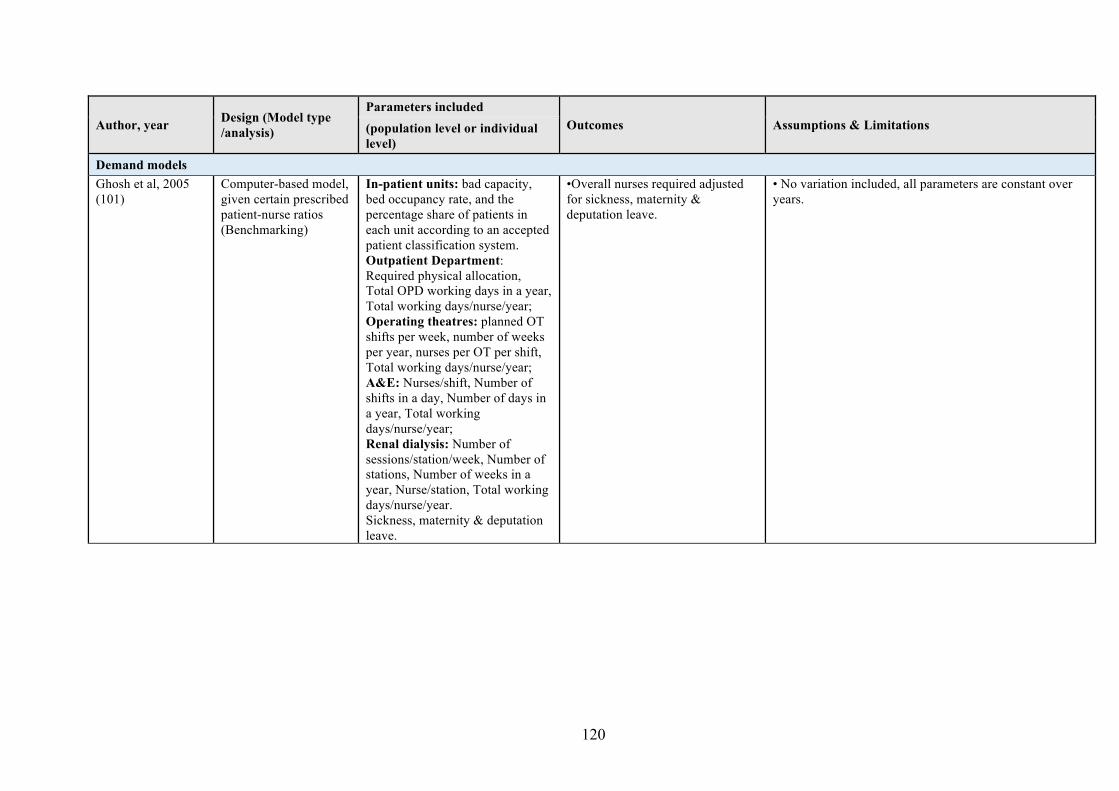
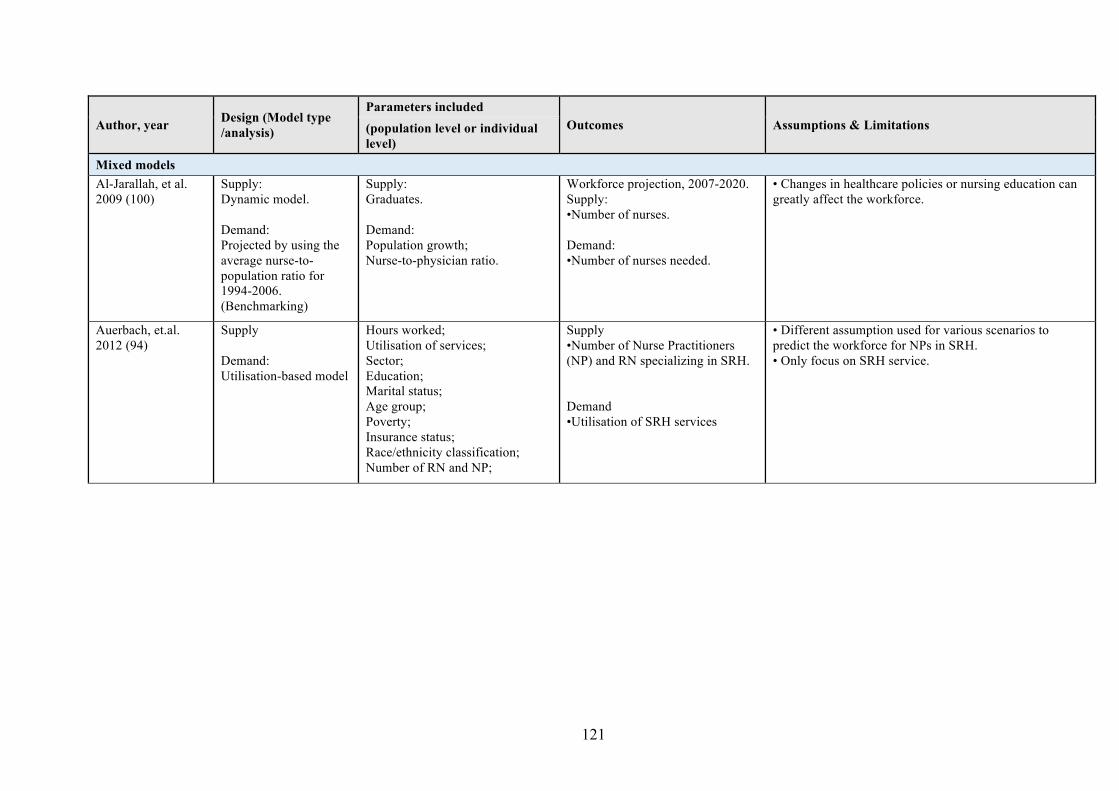
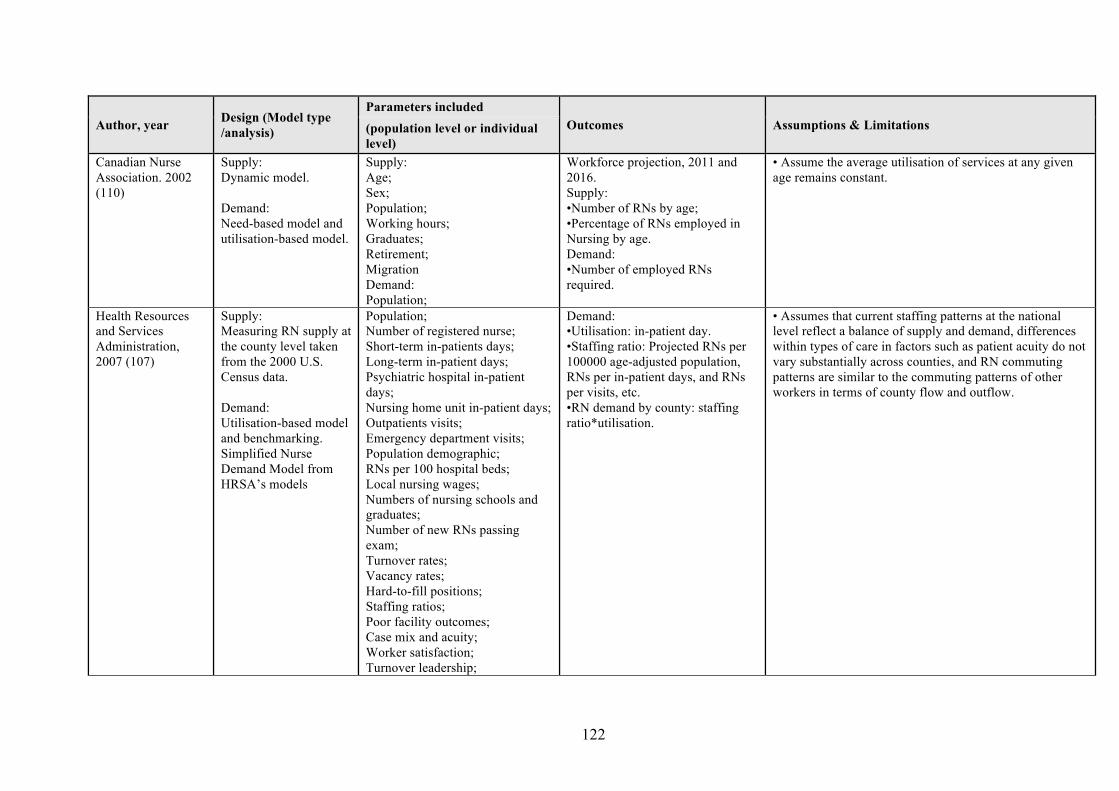
Nurses Supply stock and Bed capacity occupancy rate Working Graduates Re-entrant (65 92-111) flow trend analysis
benchmarking
Demand benchmarking demandutilisation-based model trend analysis need-based model
hours Staffing intensity Utilisation of services Insurance status Population growth and aging Per capita income Burden of disease and injury Surgical intervention Raceethnicity classification Area of practice Nurse-to-physician ratio Staff norms Turnover rates Vacancy rates
Retirement Illness disability and death Working hour Migration Population Education Age Sex Career change Maternity Renewal rate
Chinese Medicine Practitioners
No specific published manpower planning and projection models
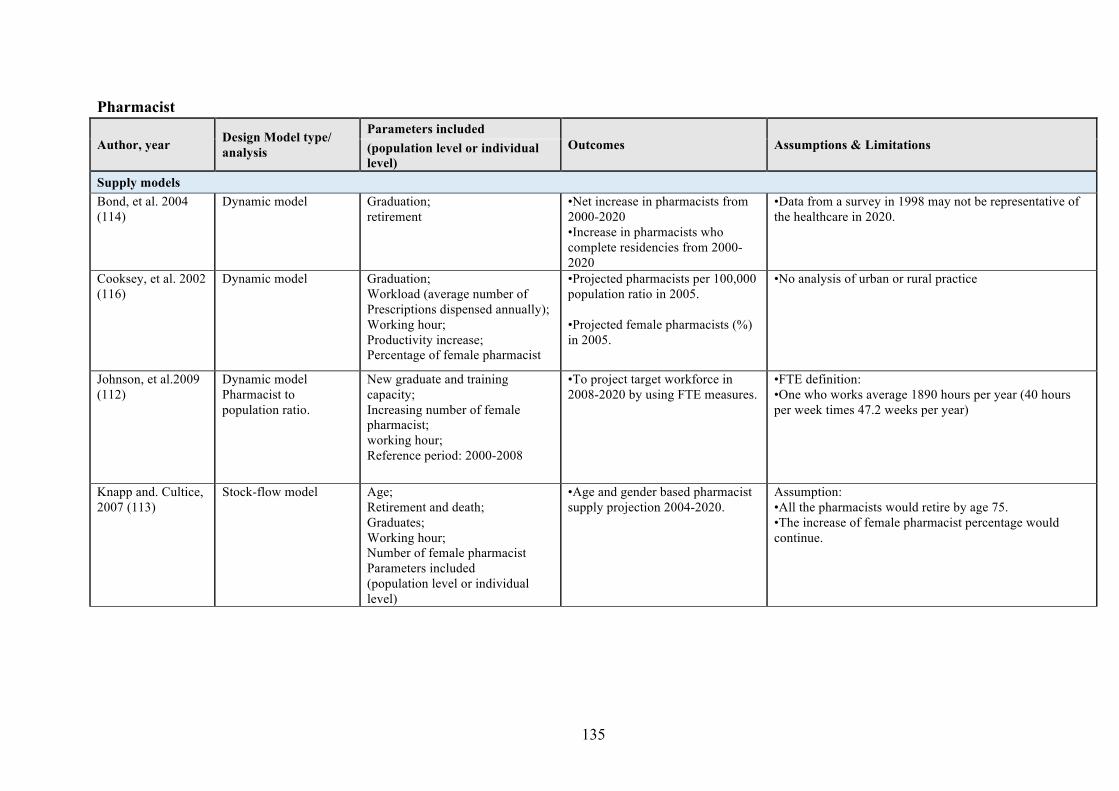
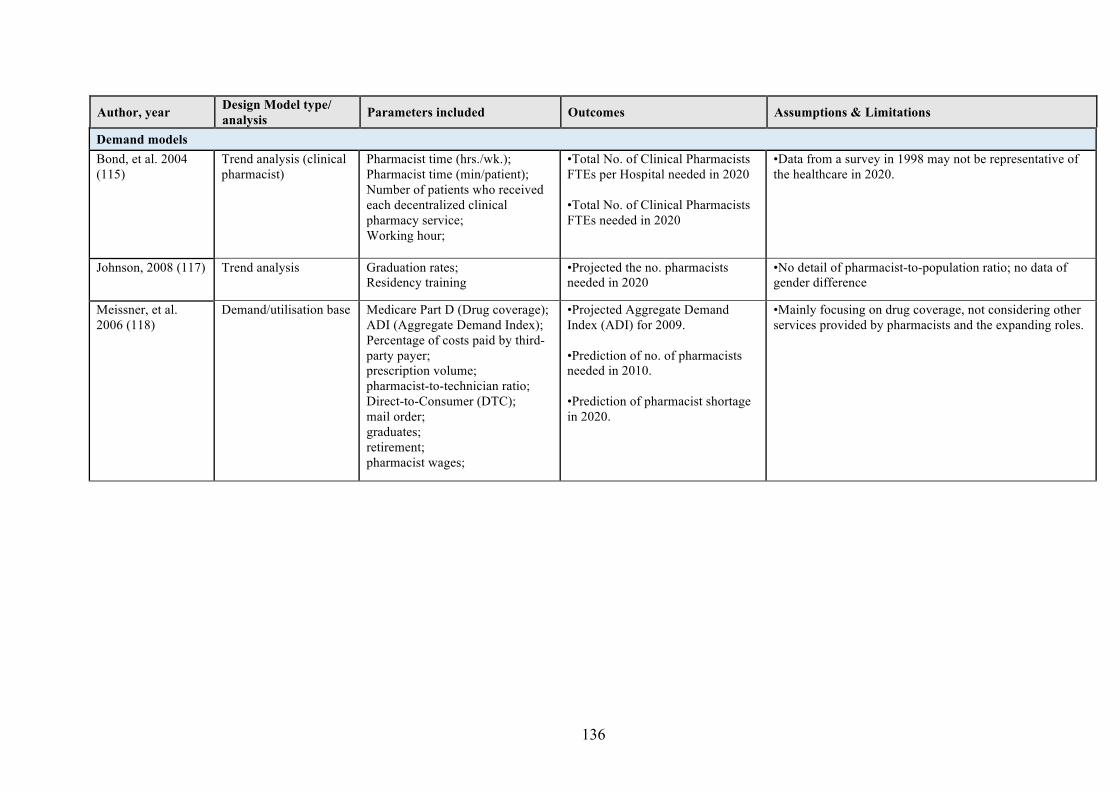
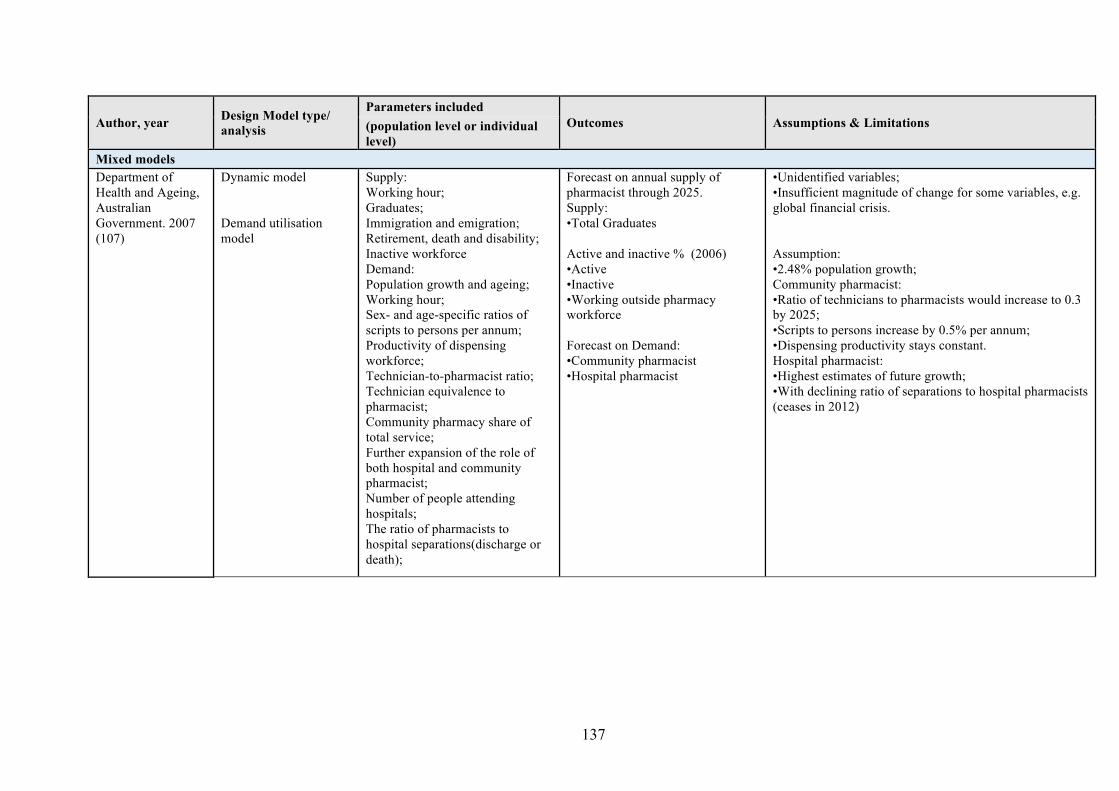
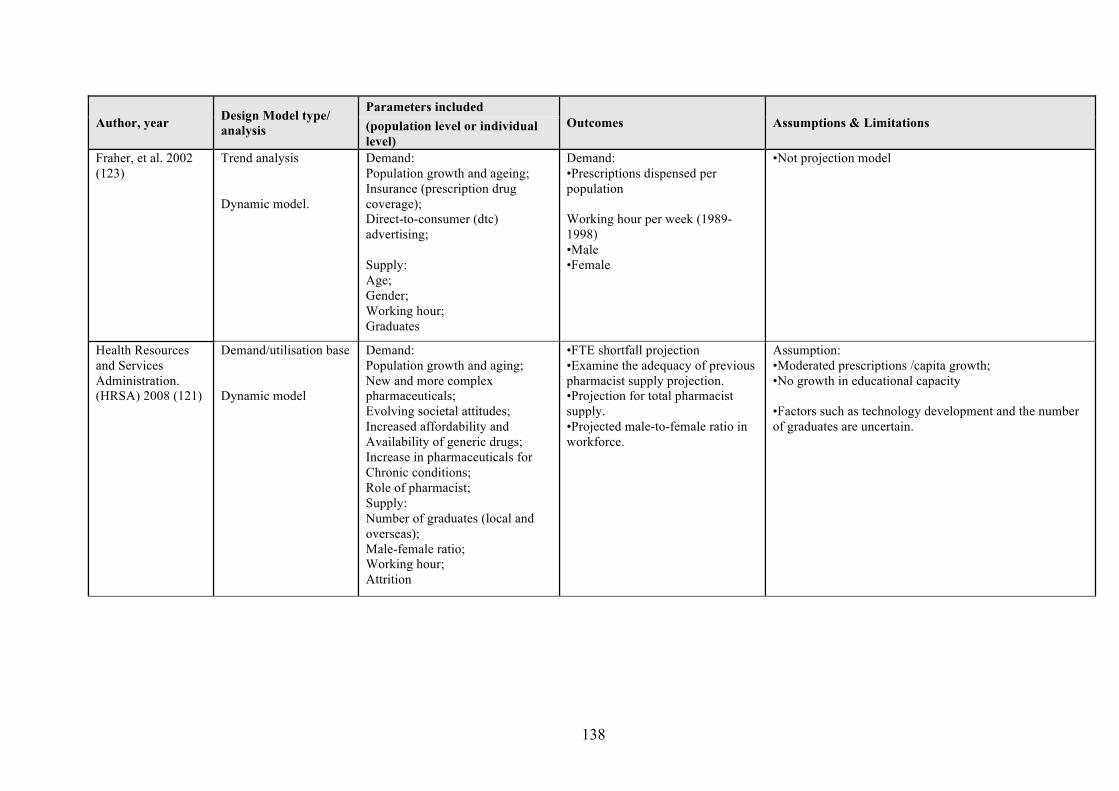
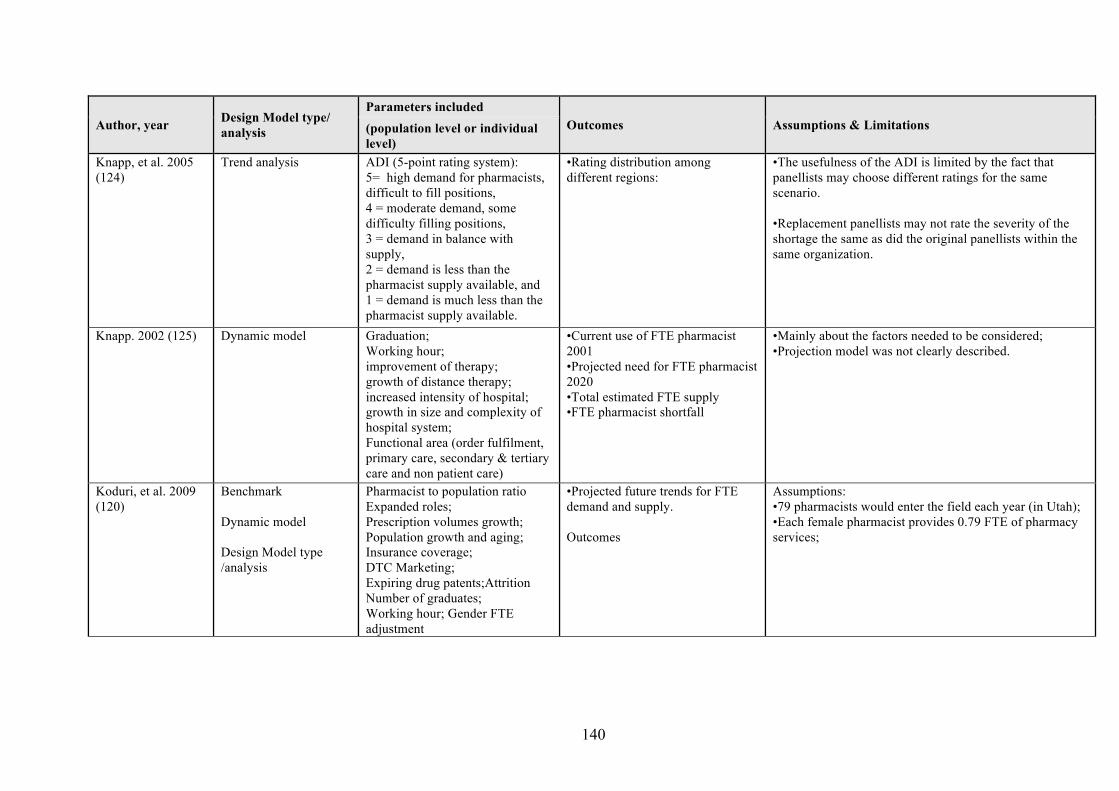
Pharmacists Supply stock and Graduation rates Population growth and Age Male Female ratio (112-126) flow
Demand trend analysis benchmarking demandutilisation-based model
aging Expiring drug patents Prescription volume Role extension Pharmacist-to-technician ratio Pharmacist-to-population ratio Direct-to-consumer marketing Insurance coverage Therapy improvement
Working hours Graduates Migration Retirement Death Workload Productivity
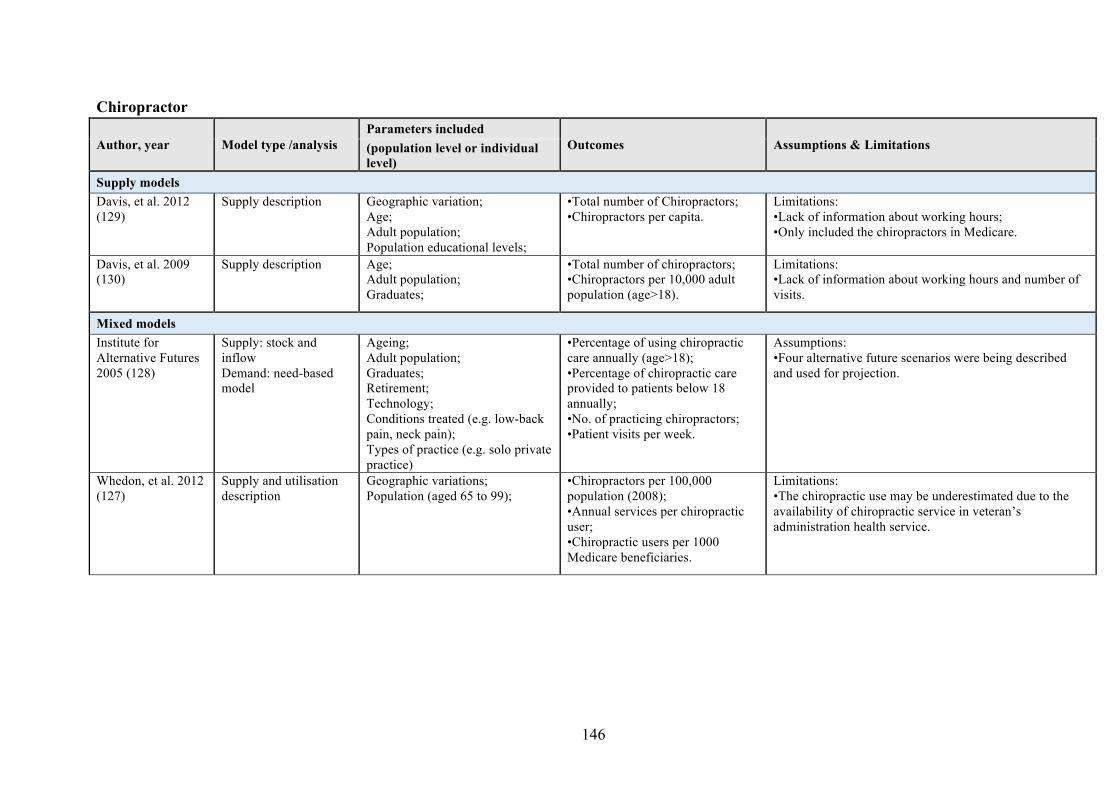
Chiropractors Supply stock and Patient visits per week Number of Age Sex Education Number (127-130) flow supply
description
Demand need-based model
services per chiropractic user Chiropractic use per capita Change in technology Change in patterns of the diseases Prevalence of back and neck symptoms
of graduates Geographic variation
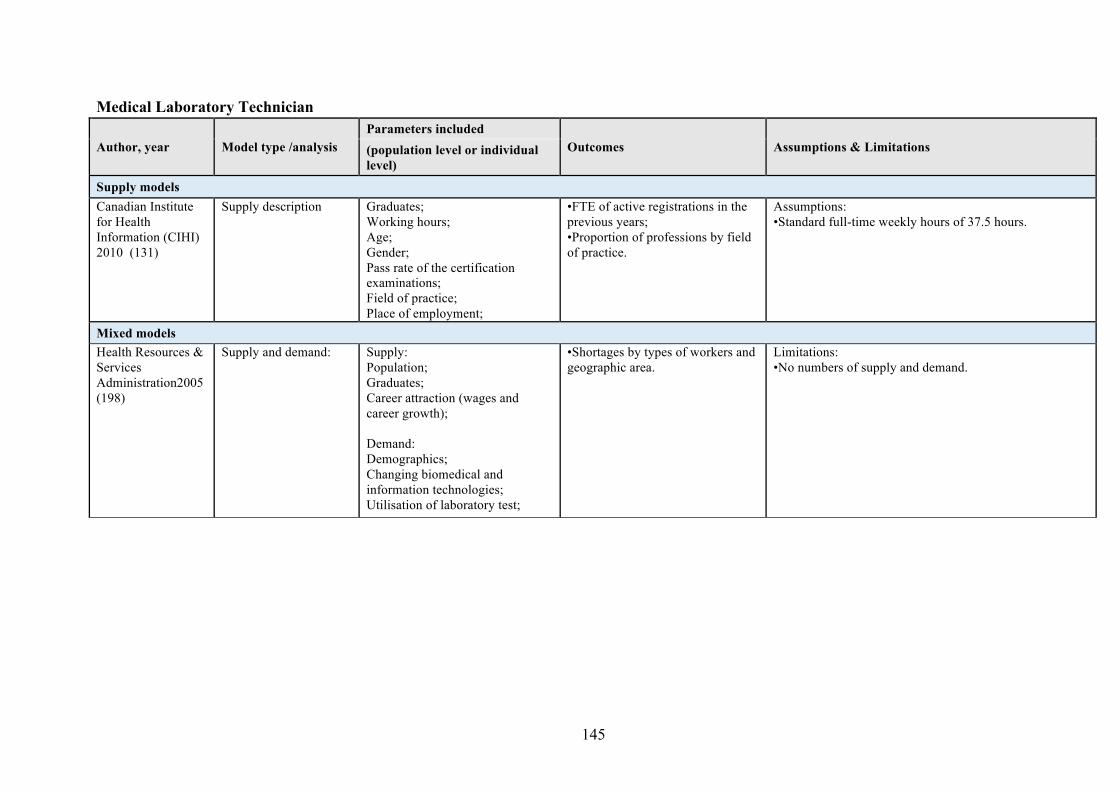
Medical Supply trend Time units per activity Number of Number of graduates Working Laboratory analysis stock and laboratory tests per FTE Population hours Examination pass rates Technologists flow characteristics Field of practice MLT post (131132)
Demand demandutilisation model
Technology improvements vacancy rate
Occupational Supply stock and Current OT employment data Number of New graduates Attrition and Therapists flow vacancies (in FTE) Hospital and home retention rate (133-136)
Demand demandutilisation model
care average growth rate
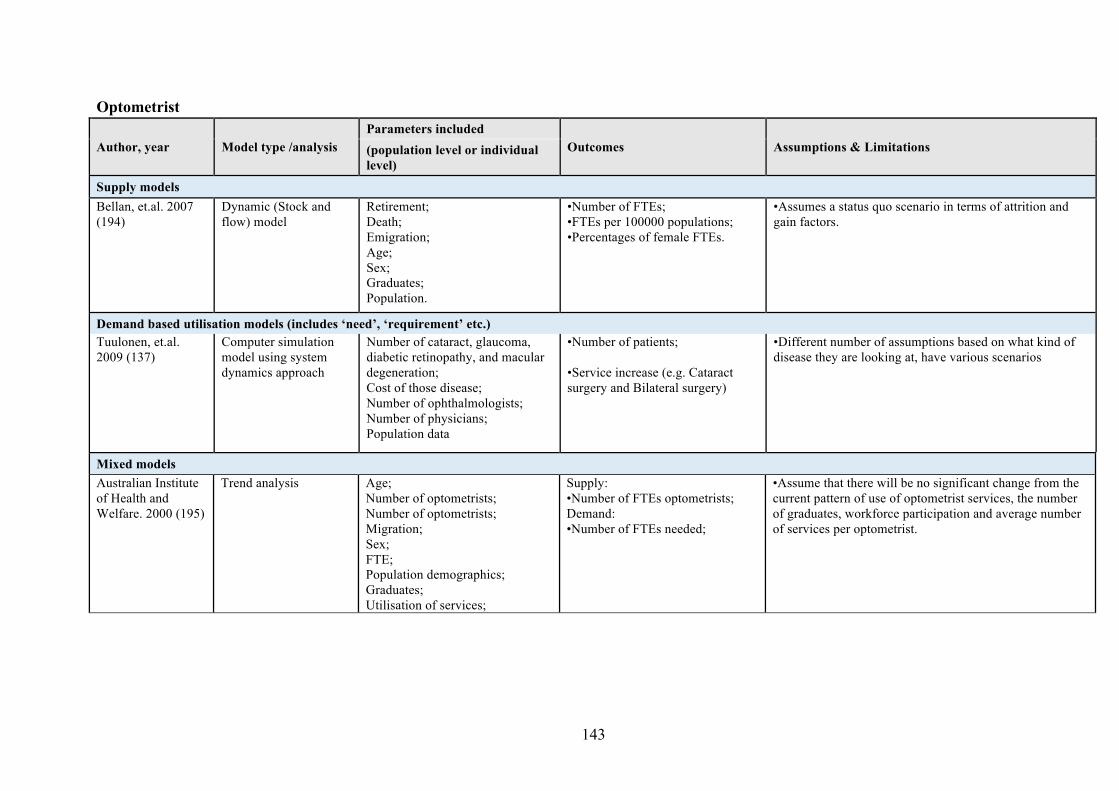
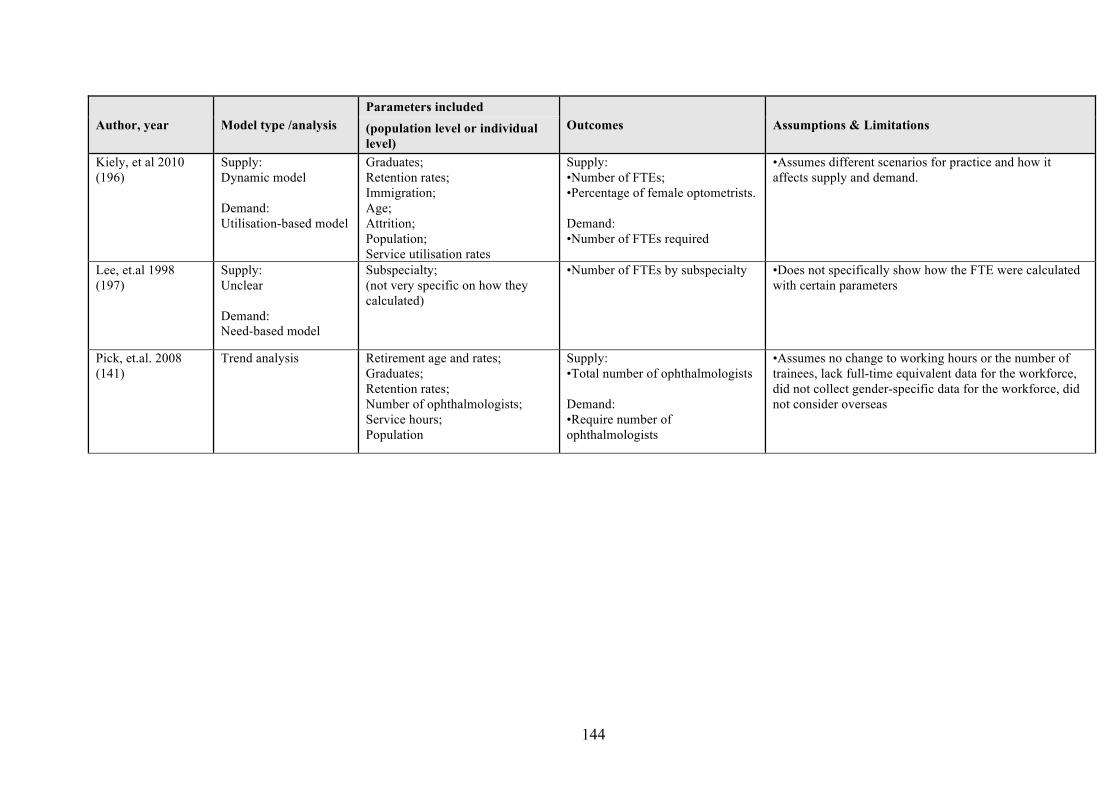
Optometrists (137-141)
Supply stock and flow
Diagnosis and service hours Population growth
Age Sex Number of registered optometrists Local and non-local graduates Mortality
15
Demand trend analysis demandutilisation model
retirement or emigration
Physiotherapists Supply stock and Population growth Increase in personal Number of current vacant posts (142-145) flow
Demand trend analysis need-based model
healthcare expenditure Personal health insurance Number of in-patient outpatient and home-bound Patient visits
Retirement and attrition New graduates New registrants Registration renewals
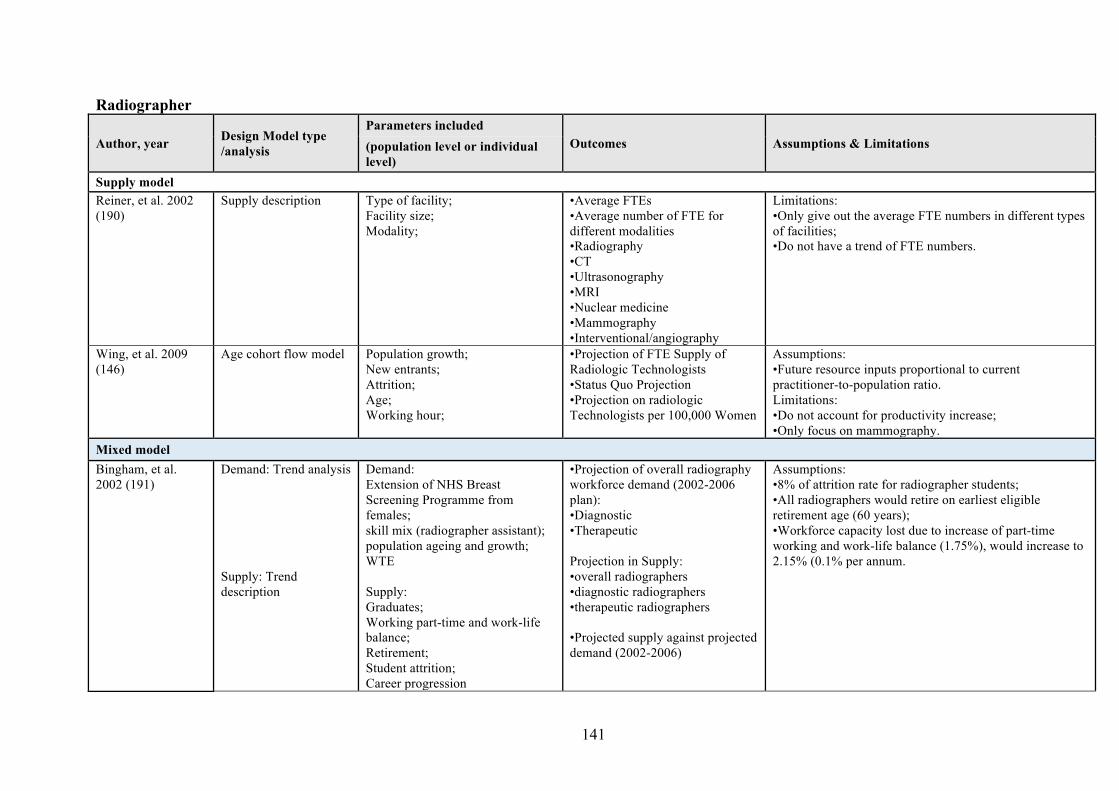
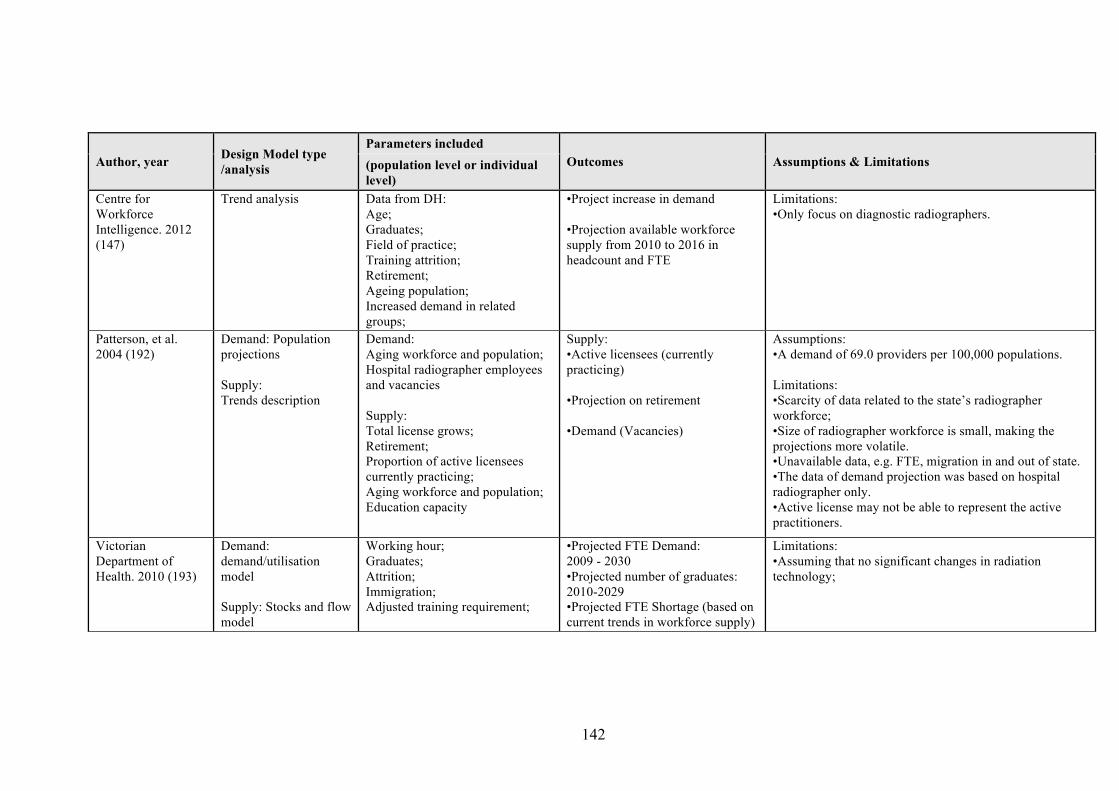
Radiographers Supply stock and Service utilisation By procedures Age Number of graduates (146147) flow
Demand trend analysis demandutilisation
By modality (eg CT MRI ultrasound and therapeutic procedures) Population demographics and growth
Retirement and other attrition Training attrition Working hours (full-time or part-time) Field of practice
Dental Hygienists
No specific published manpower planning and projection models
25 Learning from local experience in workforce planning
251 Department of Health The Department of Health (DH) has conducted Health Manpower Surveys (HMS) for
healthcare professional groups with registration in Hong Kong since 1980 The surveys aim
to provide up-to-date information on the characteristics and employment status of healthcare
personnel working in Hong Kong The data compiled into aggregate health manpower
statistics aids the understanding the dynamics of healthcare professional manpower supply
However these are essentially repeated cross sectional surveys with no prospective predictive
function or objective thus cannot inform future needs without further analytical processing
252 Hospital Authority In Hong Kong much of the current manpower planning and forecasting for public sector has
been planned within the HA which adopted an integrated approach in projecting its future
healthcare workforce requirement The process starts with an overall assessment on the
future service demand which covers a comprehensive spectrum of HA services ranging from
in-patient day-patient to outpatient ambulatory and community services as well as clinical
supporting specialty services The service demand projection uses age- and specialty-specific
service utilisation rates in a given year as the base year and took into account anticipated
changes resulting from various factors The HA model included population growth and
ageing changes in the service delivery model and utilisation pattern medical technology
advancement and the development of new services
16
To estimate the required doctor manpower the projected service demand by specialty is
translated into work-related time units (man-hours) for doctors Together with respective
specialty-specific clinical coordinating committees the average time required for doctors to
carry out other work-related tasks is estimated Future doctor manpower requirement is then
determined by assuming some specialty-specific parameters such as on- and off-site call
coaching training and documentation and community service A similar work profile
analysis is conducted for nurses in close collaboration with nurse representatives and
identified key nursing components of general and psychiatric work within different clinical
settings
Besides the additional demand generated by projected service growth the future manpower
requirement also considers replacement demand generated by staff turnover including
retirement Additional demand also takes into account manpower shortfall at the baseline
The HA manpower planning and projection model has provided a service level model based
on historical data The model incorporates the impact of realised change in service delivery
on future manpower requirements While the HA provides a substantial proportion of in-
patient and outpatient care to the population the model cannot represent all healthcare need
(as proxied by utilisation) within the population A comparison of the HA model and the
territory wide model as presented in the report is not possible at this juncture
253 Hong Kong Academy of Medicine During the past decade the Hong Kong Academy of Medicine through the respective
specialist Colleges has reviewed medical manpower planning to determine the demand for
different medical specialities and the requirements for training posts Throughout the review
a number of important externalities pertinent to manpower planning including the dynamics
of the private and public interface patient culture and expectations and healthcare policy
were identified Individual colleges submitted estimates for manpower demand based on
caseload or overseas benchmarks and provided input on the specific factors expected to
influence future manpower need in their subspecialty (148) Individual colleges have found it
difficult to project specialist manpower demand primarily due to difficulties in estimating the
impact of the shift in practice location between the public and private sectors medical
tourism changing technology and areas of practice The Academy acknowledges the
limitation of assessing need from the medical perspective only and the difficulties in
17
accurately determining demand however the recommendations put forward provide valuable
input to manpower planning and forecasting in Hong Kong
254 Independent manpower planning and policy reviews The Business Professionals Federation of Hong Kong (BPF) healthcare manpower planning
report of September 2010 recommends a more scientifically based and inclusive approach to
manpower planning than what had been done previously (149) The report lists three
essential planning ingredients for effective planning 1) administrative data of past and
present manpower resources 2) research personnel equipped with skills and modelling tools
to undertake dynamic projections and 3) collaboration of all stakeholders
In June 2012 HKGolden50 an independent not-for-profit research organisation published
their fourth report ldquoHow to Create A World-Class Medical Systemrdquo with the aim to ldquoalert our
community that despite our World Class standard in Western and Chinese medicine our
healthcare system is on the brink of breaking down due to insufficient hardware and
personnel coupled with surging local and foreign demand for our quality medical servicesrdquo
(150) Based on HA data (ie public in-patient data only) the authors predicted a rapidly
increasing (2 a year) shortage in doctors (150) Factors influencing this shortage are
suggested to include 1) surging healthcare service demand deriving from population ageing
population growth and medical tourism (demand for private healthcare from mainland
China) and 2) stagnation supply due to retirement declining competency due to the loss of
senior staff generation gap feminisation of the work force high entry barriers for overseas-
qualified doctors and insufficient support staff (nurses and administrative staff)
26 Implications for the Hong Kong manpower project Many manpower-planning challenges have been previously identified in our review of work
already completed These include 1) persistent manpower shortages and mal-distribution of
the healthcare workforce 2) population ageing 3) rising incidence of chronic diseases 4)
lack of resources for medical training 5) lack of cooperation within and between institutions
and 6) poor reliability and credibility of current manpower forecasting models
The country level models identified lack consensus on the methodological approach for
healthcare manpower planning and forecasting and illustrated data-related problems
including a lack of standardisation in variable parameterising limited access to the quantity
and quality of the data required limited information on productivity workload and
18
utilisation and limited information on treatment efficacy and effectiveness These models
used routine administrative data (utilisation or financial data) or data from specialised
surveys andor applied a predetermined set of assumptions in the demandutilisation models
Many country level models were deterministic and lacked the flexibility to examine the
dynamic relationships between manpower supply and patient outcomes In addition the
linear analysis adopted by many was problematic due to the underlying non-linearity of the
data More current manpower planning models used system dynamic methods considered
need supply and demand simultaneously projected manpower requirements from multiple
perspectives and provided a more complete estimate of future manpower requirements There
was little evidence (in both qualitative and quantitative terms) of the impact (or evaluation) of
these human resource-planning strategies on healthcare practice
Models that did not specify benchmark standards or methods to determine the relationship
between the volume of service number of patients and the number of staff were unable to
robustly estimate the number of staff required for specific activities Induced demand (as
measured by utilisation data and doctor defined diagnosis in demand models) was a
characteristic problem of manpower planning and forecasting and was a major limitation of
the current country level manpower planning and forecasting models world-wide and locally
In Hong Kong population ageing rising incidence of non-communicable disease and
historical healthcare utilisation patterns is related to rapidly increasing demand for healthcare
service Elsewhere changing patterns of referral location of service delivery (public and
private) technology scope of practice (including complementarity and substitution between
healthcare professionals) feminisation of the workforce and healthcare policy (such as
extended personal insurance coverage increased in public healthcare benefits) and service
delivery regulation (such as the recommendations of the Review Committee on Regulation of
Pharmaceutical Products) have been implicated with increased demand for healthcare service
(151) The increased demand arising from the mainland visa-free tourist policy are expected
to increase future manpower demand Economic and healthcare policy (ie Closer Economic
Partnership Arrangement II (CEPA)) changing population demography inter-regional and
inter-sectoral (publicprivate) movement of healthcare professionals and patients and
medical tourism are expected to increase future healthcare demand and further complicate
manpower projection
19
Manpower projection is a highly data intense activity Although public sector in-patient and
outpatient data suitable for manpower projections is readily available a substantial
proportion of patient care occurs in the private sector where data is less complete more
complex or simply unavailable Such an environment necessitates manpower projection
models that are adaptable to changing parameters and model structures
20
3 Projecting demand
The overall model for Hong Kong manpower projection comprises two sub models the
utilisation model and the supply model Building on an endogenous historically-informed
base case scenario (where current utilisation (proxying demand) and supply are assumed to
be in equilibrium) This model can be adopted to adjust for the impact of externalities and
policy options The difference between the demand and supply projections (in terms of total
FTE numbers year-on-year and annual incremental FTE from 2012 -2041) is the manpower
lsquogaprsquo or lsquosurplusshortfallrsquo
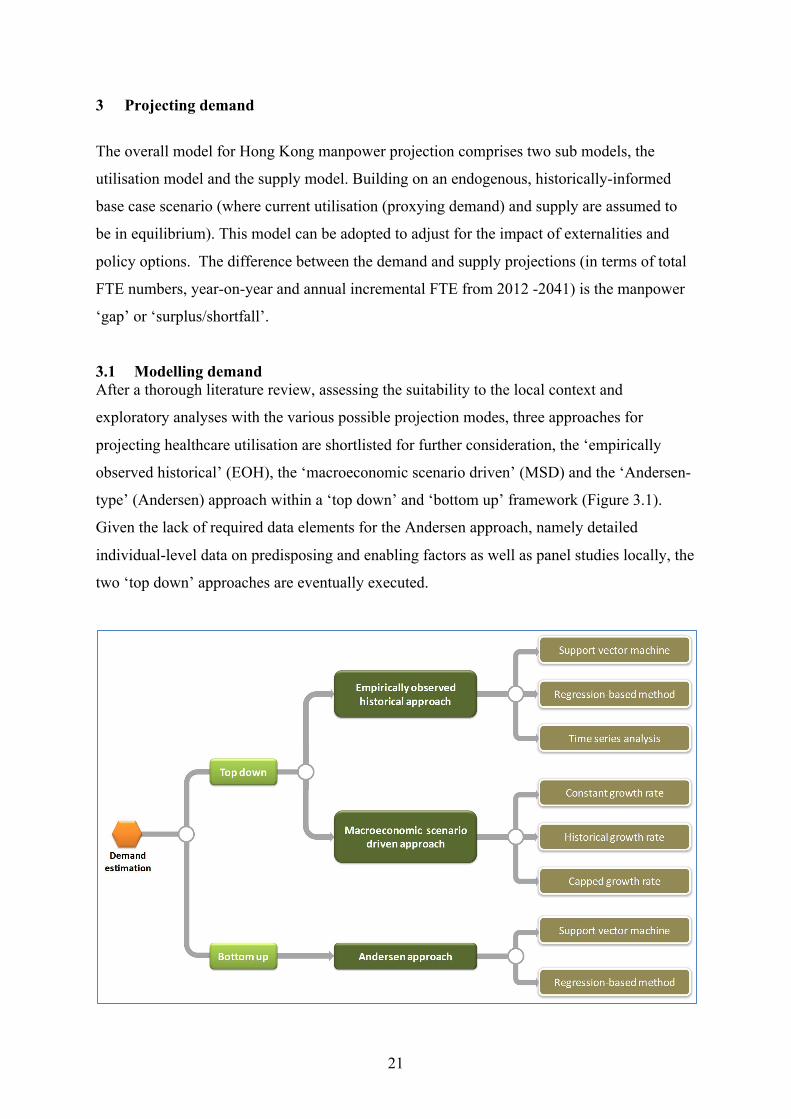
31 Modelling demand After a thorough literature review assessing the suitability to the local context and
exploratory analyses with the various possible projection modes three approaches for
projecting healthcare utilisation are shortlisted for further consideration the lsquoempirically
observed historicalrsquo (EOH) the lsquomacroeconomic scenario drivenrsquo (MSD) and the lsquoAndersen-
typersquo (Andersen) approach within a lsquotop downrsquo and lsquobottom uprsquo framework (Figure 31)
Given the lack of required data elements for the Andersen approach namely detailed
individual-level data on predisposing and enabling factors as well as panel studies locally the
two lsquotop downrsquo approaches are eventually executed
21
Figure 31 Approaches to estimating demand
311 Empirically observed historical (EOH) approach The EOH projection model expresses utilisation as the product of population P and utilisation
rate R
Utilisation z(y) at year y = ( amp)times)( amp)+
where P(asy) is the population age- sex-specific groups (as) at year y and R(asy) is the
utilisation rate by age- sex-specific groups (as) at year y Census and Statistics Department
population projections are used for the projected P(asy) historical data inform the
computation of R(asy)
3111 Support vector machine (SVM) SVM2 is used to estimate the utilisation rate of each age- sex-specific group at a given year
SVM is a kernel-based neural network that maps an input x to an output y where wi is the
weight and B is the bias term by the following expression
y = wκ(1 1) + B
As compared with linear and exponential regression models SVM has the flexibility to
lsquoevolversquo an optimal structure according to historical data A Gaussian radial basis kernel ie
κ 1 4 = exp (C 1 minus 4 ) is used as it is the lsquouniversal approximatorrsquo The structure is well
regularised and the generalisation ability of the network is maximized
SVM learn the utilisation rate pattern from historical data expressed as
amp|=gt gt ampgt|=gt amp|=
⋮ where ri is the utilisation rate of age- sex-specific group (ai si) at year yi A specific network
construction algorithm is designed to evolve the structural parameters wi and B The trained
2 Artificial neural networks (ANN) and specifically the Support Vector Machine (SVM) used for these projections are able to predict the complex relationships driving utilisation Support vector machine (SVM) is a supervised learning method that analyses data and recognizes data patterns in the historical data As such this artificial intelligence predicts for each given variable the corresponding outcome SVM was chosen for the projection as it will lsquoevolversquo an optimal structure and estimate the service utilisation of a given individual based on characteristics such as age and sex
22
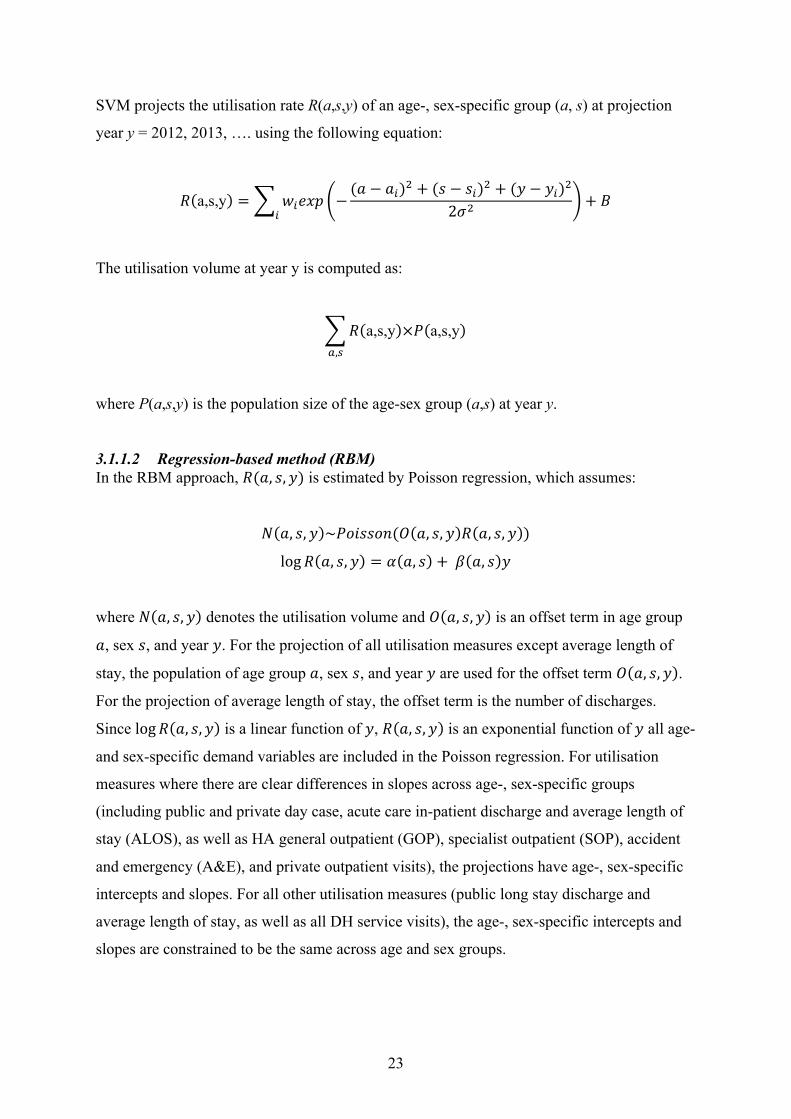
SVM projects the utilisation rate R(asy) of an age- sex-specific group (a s) at projection
year y = 2012 2013 hellip using the following equation
) asy = ABCDE minus( minus B)gt + (
2minusGgtB)gt + (amp minus ampB)gt
+ H B
The utilisation volume at year y is computed as
) asy times asy +
where P(asy) is the population size of the age-sex group (as) at year y
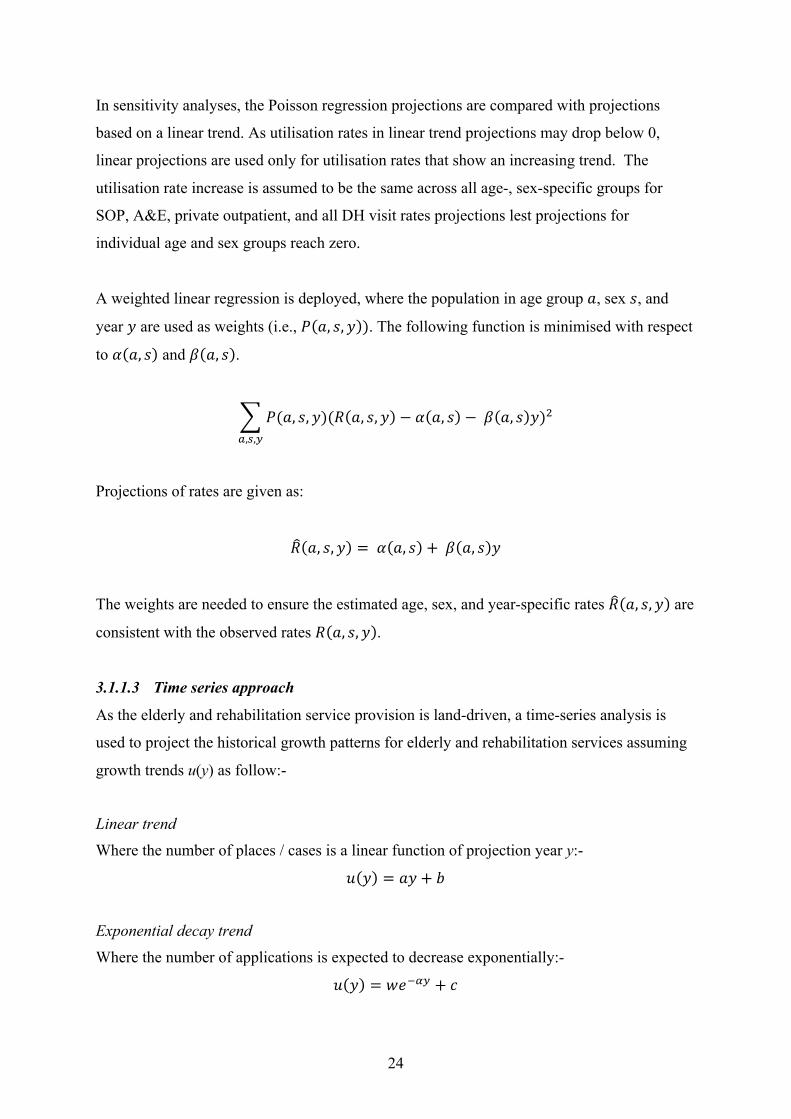
3112 Regression-based method (RBM) In the RBM approach )( amp) is estimated by Poisson regression which assumes
I amp ~KLKM(N amp ) amp )
log ) amp = R + S amp
where I amp denotes the utilisation volume and N amp is an offset term in age group
sex and year amp For the projection of all utilisation measures except average length of
stay the population of age group sex and year amp are used for the offset term N amp
For the projection of average length of stay the offset term is the number of discharges
Since log ) amp is a linear function of amp ) amp is an exponential function of amp all age-
and sex-specific demand variables are included in the Poisson regression For utilisation
measures where there are clear differences in slopes across age- sex-specific groups
(including public and private day case acute care in-patient discharge and average length of
stay (ALOS) as well as HA general outpatient (GOP) specialist outpatient (SOP) accident
and emergency (AampE) and private outpatient visits) the projections have age- sex-specific
intercepts and slopes For all other utilisation measures (public long stay discharge and
average length of stay as well as all DH service visits) the age- sex-specific intercepts and
slopes are constrained to be the same across age and sex groups
23
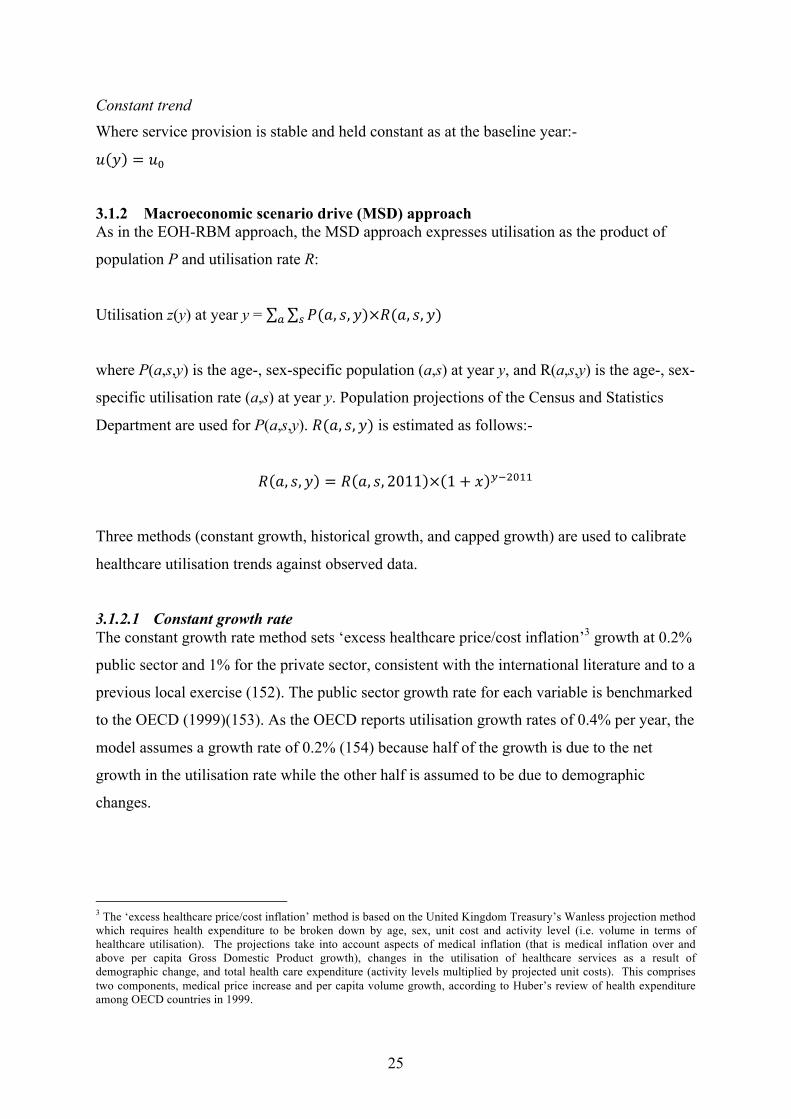
In sensitivity analyses the Poisson regression projections are compared with projections
based on a linear trend As utilisation rates in linear trend projections may drop below 0
linear projections are used only for utilisation rates that show an increasing trend The
utilisation rate increase is assumed to be the same across all age- sex-specific groups for
SOP AampE private outpatient and all DH visit rates projections lest projections for
individual age and sex groups reach zero
A weighted linear regression is deployed where the population in age group sex and
year amp are used as weights (ie amp ) The following function is minimised with respect
to R and S
( amp)() amp minus R minus S amp)gt
+T
Projections of rates are given as
) amp = R + S amp
The weights are needed to ensure the estimated age sex and year-specific rates ) amp are
consistent with the observed rates ) amp
3113 Time series approach
As the elderly and rehabilitation service provision is land-driven a time-series analysis is
used to project the historical growth patterns for elderly and rehabilitation services assuming
growth trends u(y) as follow-
Linear trend Where the number of places cases is a linear function of projection year y-
U amp = amp + V
Exponential decay trend Where the number of applications is expected to decrease exponentially-
= ACWXT + YU amp
24
Constant trend Where service provision is stable and held constant as at the baseline year-
U amp = UZ
312 Macroeconomic scenario drive (MSD) approach As in the EOH-RBM approach the MSD approach expresses utilisation as the product of
population P and utilisation rate R
Utilisation z(y) at year y = ( amp)times)( amp)+
where P(asy) is the age- sex-specific population (as) at year y and R(asy) is the age- sex-
specific utilisation rate (as) at year y Population projections of the Census and Statistics
Department are used for P(asy) )( amp) is estimated as follows-
= ) 2011 times 1 + D TWgtZ) amp
Three methods (constant growth historical growth and capped growth) are used to calibrate
healthcare utilisation trends against observed data
3121 Constant growth rate The constant growth rate method sets lsquoexcess healthcare pricecost inflationrsquo3 growth at 02
public sector and 1 for the private sector consistent with the international literature and to a
previous local exercise (152) The public sector growth rate for each variable is benchmarked
to the OECD (1999)(153) As the OECD reports utilisation growth rates of 04 per year the
model assumes a growth rate of 02 (154) because half of the growth is due to the net
growth in the utilisation rate while the other half is assumed to be due to demographic
changes
3 The lsquoexcess healthcare pricecost inflationrsquo method is based on the United Kingdom Treasuryrsquos Wanless projection method which requires health expenditure to be broken down by age sex unit cost and activity level (ie volume in terms of healthcare utilisation) The projections take into account aspects of medical inflation (that is medical inflation over and above per capita Gross Domestic Product growth) changes in the utilisation of healthcare services as a result of demographic change and total health care expenditure (activity levels multiplied by projected unit costs) This comprises two components medical price increase and per capita volume growth according to Huberrsquos review of health expenditure among OECD countries in 1999
25
Private sector growth rates are benchmarked to OECD (1999)(153) data for the United States
and Switzerland as these two countries predominantly provide healthcare in the private
albeit regulated sector The OECD reports an annual growth of 27 and 24 for the
United States and Switzerland respectively As the healthcare in Hong Kong is equally shared
between the public and private sector the utilisation growth rate in the private sector is
assumed to be 1 (154)
3122 Historical growth rate For the historical growth rate method lsquoexcess healthcare pricecost inflationrsquo D is estimated
from the public and private hospital in-patient discharges and outpatient visits in Hong Kong
To estimate D the following function is minimised
|I amp minus ] amp | T
where I amp is the utilisation volume (number of public and private sector in-patient
discharge and outpatient visits) and ] amp is the estimated utilisation volume for that year
] amp = amp times) amp +
) amp = ) 2011 times 1 + D TWgtZ
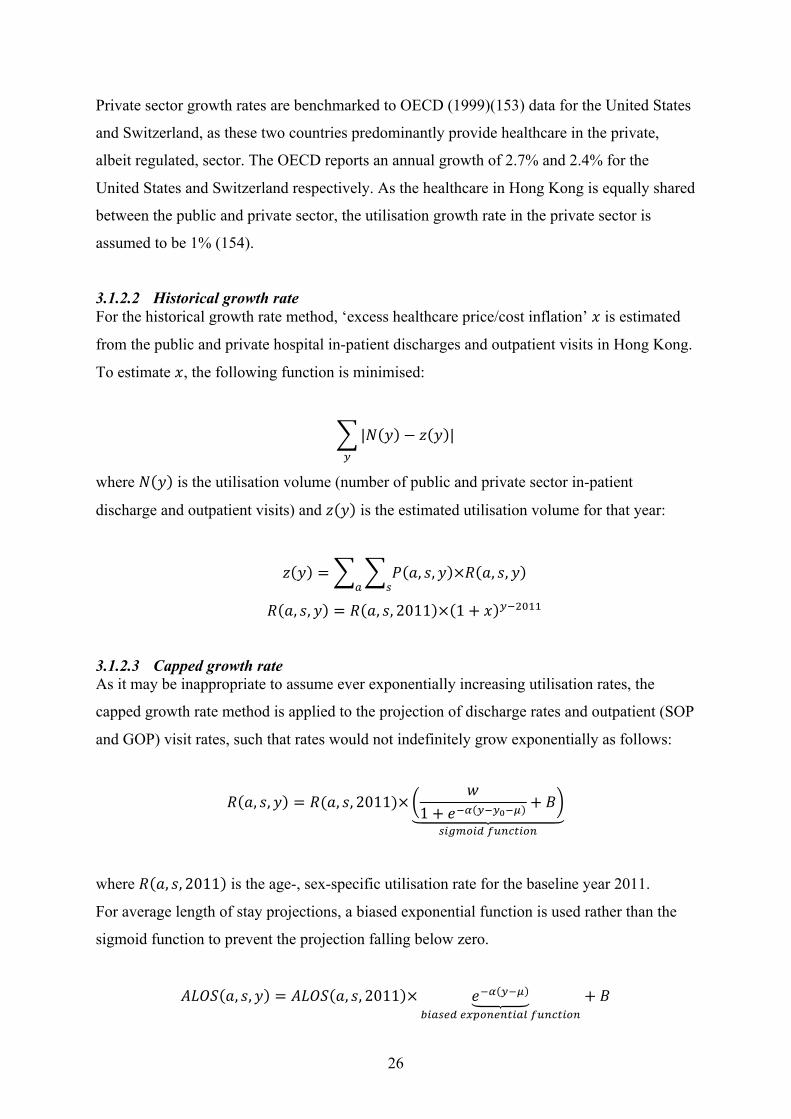
3123 Capped growth rate As it may be inappropriate to assume ever exponentially increasing utilisation rates the
capped growth rate method is applied to the projection of discharge rates and outpatient (SOP
and GOP) visit rates such that rates would not indefinitely grow exponentially as follows
A) amp = )( 2011)times + H
1 + CWX TWT^W_
B`abBc defghBbf
where ) 2011 is the age- sex-specific utilisation rate for the baseline year 2011
For average length of stay projections a biased exponential function is used rather than the
sigmoid function to prevent the projection falling below zero
ijNk amp = ijNk 2011 times CWX TW_ + H lB+mc mnobfmfhB+p defghBbf
26
The parameters w α micro and B are estimated by optimising the objective function
|I amp minus ] amp | T
as in the historical growth rate model
32 Model comparison The top down methods (EOH and MSD) with relatively fewer data requirements are based
on the expectation that simple aggregate models provide more reliable and reproducible
healthcare utilisation projections Further consistent comprehensive data (number of
observations and data-points) are available for the public sector Much less reliable data are
available for the private sector The performance of a model is represented by the sum of
absolute rate error q r U
q r U = se amp r minus )e( amp) +T
where q r U is the sum of absolute rate error of model θ isin EOH-SVM MSD-constant
growth rate MSD-historical growth rate on utilisation rate u
amp r is the estimated utilisation rate on u of age-sex group (as) at year y by
model θ
Ru(asy) is the actual utilisation rate on u of age-sex group (as) at year y
se
Note that the index y in the formulate of E(θ u) has different range for different utilisation
measures y isin 2005 2006 hellip 2011 for public sector and private outpatient utilisation and
y isin 2007 2008 hellip 2011 for private sector inpatient utilisation Table 31 lists the
estimation error of EOH-SVM MSD-constant growth rate and MSD-historical growth rate
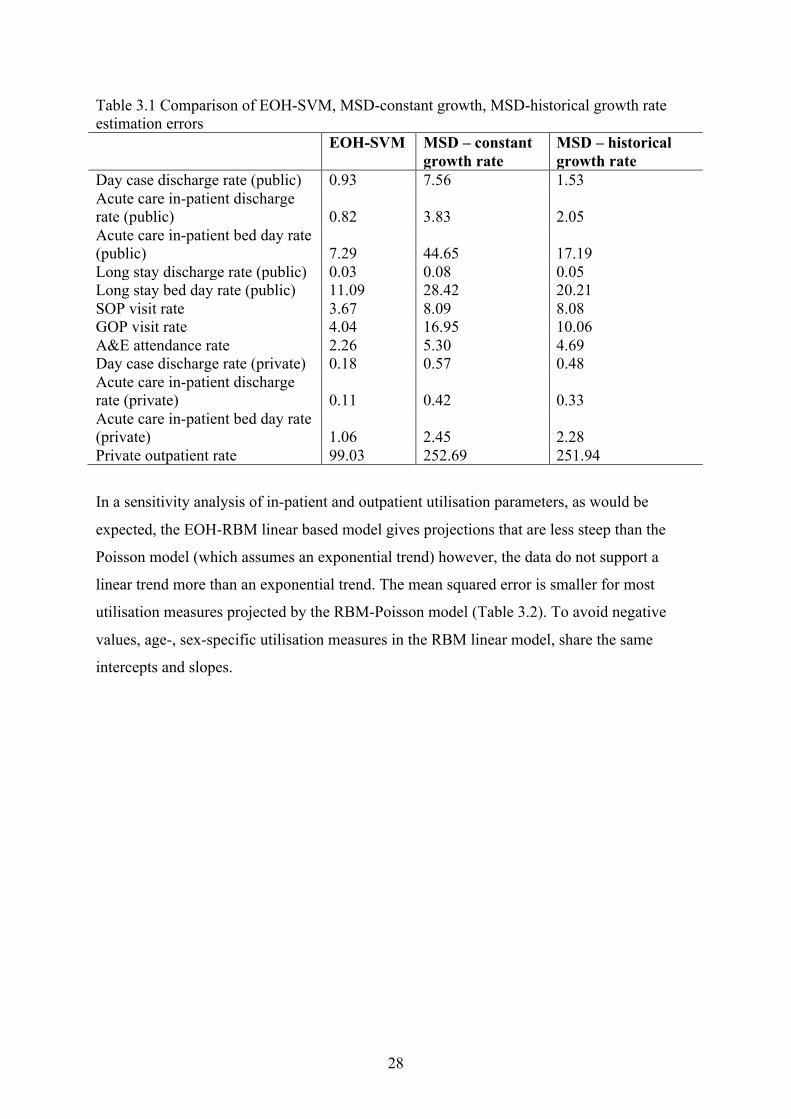
for in-patient and outpatient utilisation parameters The EOH-SVM models give a better
model fit than the MSD models (Table 31) The EOH-SVM estimation errors are smaller
than those for the MSD-constant growth or MSD-historical growth rate models
27
Table 31 Comparison of EOH-SVM MSD-constant growth MSD-historical growth rate estimation errors
EOH-SVM MSD ndash constant growth rate
MSD ndash historical growth rate
Day case discharge rate (public) 093 756 153 Acute care in-patient discharge rate (public) 082 383 205 Acute care in-patient bed day rate (public) 729 4465 1719 Long stay discharge rate (public) 003 008 005 Long stay bed day rate (public) 1109 2842 2021 SOP visit rate 367 809 808 GOP visit rate 404 1695 1006 AampE attendance rate 226 530 469 Day case discharge rate (private) 018 057 048 Acute care in-patient discharge rate (private) 011 042 033 Acute care in-patient bed day rate (private) 106 245 228 Private outpatient rate 9903 25269 25194
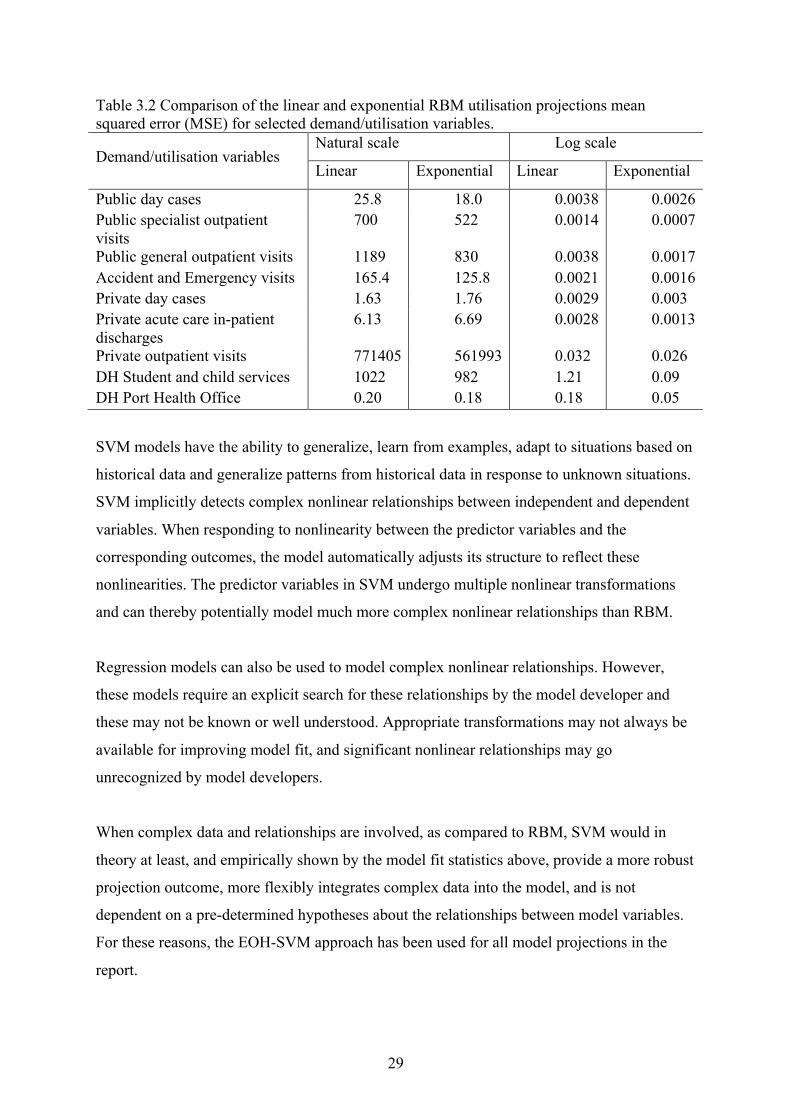
In a sensitivity analysis of in-patient and outpatient utilisation parameters as would be
expected the EOH-RBM linear based model gives projections that are less steep than the
Poisson model (which assumes an exponential trend) however the data do not support a
linear trend more than an exponential trend The mean squared error is smaller for most
utilisation measures projected by the RBM-Poisson model (Table 32) To avoid negative
values age- sex-specific utilisation measures in the RBM linear model share the same
intercepts and slopes
28
Table 32 Comparison of the linear and exponential RBM utilisation projections mean squared error (MSE) for selected demandutilisation variables
Demandutilisation variables Natural scale Log scale
Linear Exponential Linear Exponential
Public day cases 258 180 00038 00026 Public specialist outpatient 700 522 00014 00007 visits Public general outpatient visits 1189 830 00038 00017 Accident and Emergency visits 1654 1258 00021 00016 Private day cases 163 176 00029 0003 Private acute care in-patient 613 669 00028 00013 discharges Private outpatient visits 771405 561993 0032 0026 DH Student and child services 1022 982 121 009 DH Port Health Office 020 018 018 005
SVM models have the ability to generalize learn from examples adapt to situations based on
historical data and generalize patterns from historical data in response to unknown situations
SVM implicitly detects complex nonlinear relationships between independent and dependent
variables When responding to nonlinearity between the predictor variables and the
corresponding outcomes the model automatically adjusts its structure to reflect these
nonlinearities The predictor variables in SVM undergo multiple nonlinear transformations
and can thereby potentially model much more complex nonlinear relationships than RBM
Regression models can also be used to model complex nonlinear relationships However
these models require an explicit search for these relationships by the model developer and
these may not be known or well understood Appropriate transformations may not always be
available for improving model fit and significant nonlinear relationships may go
unrecognized by model developers
When complex data and relationships are involved as compared to RBM SVM would in
theory at least and empirically shown by the model fit statistics above provide a more robust
projection outcome more flexibly integrates complex data into the model and is not
dependent on a pre-determined hypotheses about the relationships between model variables
For these reasons the EOH-SVM approach has been used for all model projections in the
report
29
Support vector machine (neural network analysis) time series and stock and flow method
are variously deployed to project the required number of dentists as a function of healthcare
demandutilisation and dentist supply to 2041 The projections are stratified by service type
(in-patient outpatient academic) and by service location (public or private sector)
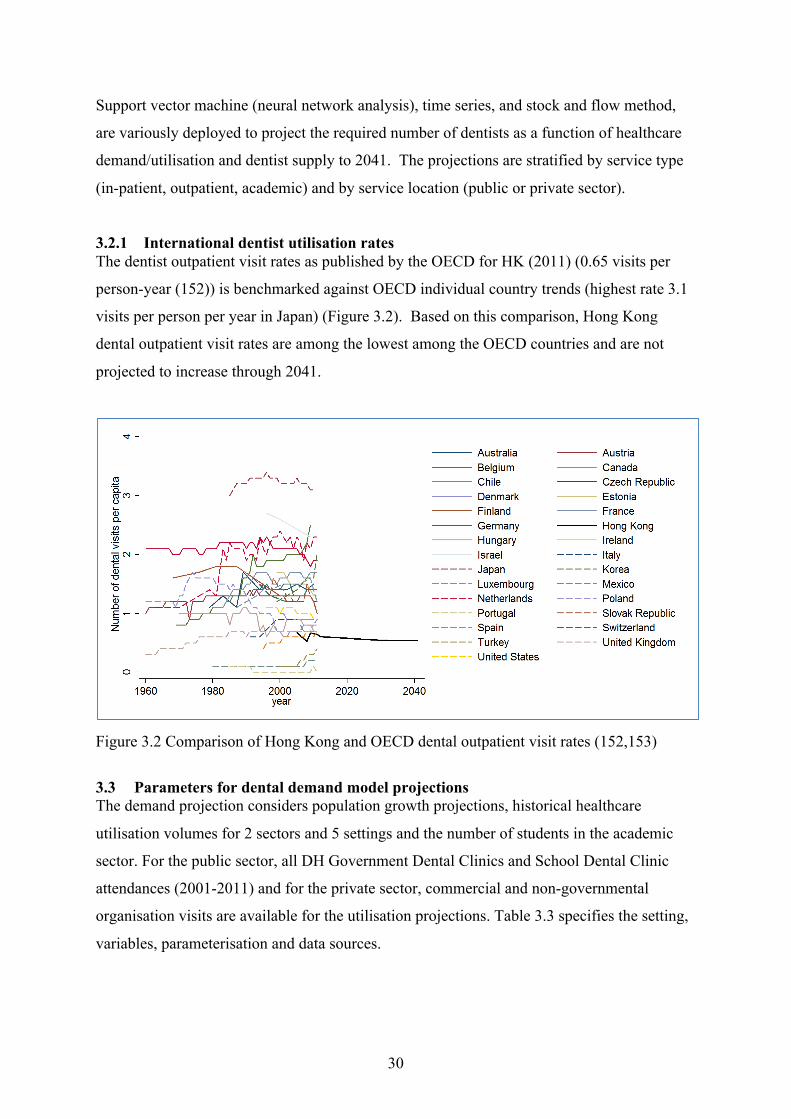
321 International dentist utilisation rates The dentist outpatient visit rates as published by the OECD for HK (2011) (065 visits per
person-year (152)) is benchmarked against OECD individual country trends (highest rate 31
visits per person per year in Japan) (Figure 32) Based on this comparison Hong Kong
dental outpatient visit rates are among the lowest among the OECD countries and are not
projected to increase through 2041
Figure 32 Comparison of Hong Kong and OECD dental outpatient visit rates (152153)
33 Parameters for dental demand model projections The demand projection considers population growth projections historical healthcare
utilisation volumes for 2 sectors and 5 settings and the number of students in the academic
sector For the public sector all DH Government Dental Clinics and School Dental Clinic
attendances (2001-2011) and for the private sector commercial and non-governmental
organisation visits are available for the utilisation projections Table 33 specifies the setting
variables parameterisation and data sources
30
Table 33 Demand model variables parameterisation and data sources Variables Parameterisation Data source
Population to be served Resident population Population forecast
Age- sex-stratified1
Age- sex-stratified1 CampSD 1999 through 2011 CampSD population projections 2012 - 2041
Outpatient Government Dental Clinic (GDC) Number of dental visits
Civil servants pensioners and dependents HA staff and dependents General public
Age- sex-stratified1 Department of Health 2001-2011 THS 2002 2005 2009 and 2011
School Dental Clinic (SDC) Number of dental visits Age- sex-stratified1 Department of Health 2001-2011
Commercial sector (private and non-governmental organisations) Number of dental visits
Age- sex-stratified1 THS 2002 2005 2009 and 2011
Academic Aggregated student intake and graduates
UGC-funded dental programme 2002 -2013
1All data were stratified by age and sex groups in 5-year age categories
331 Adjusting for under-reporting THS under-reporting rates for private dental clinic utilisation are estimated for the THS 2002
2005 2009 and 2011 and the difference between the numbers of Government Dental Clinic
(GDC) visits reported in the THSs and those provided by the DH The DH provides both the
aggregated number of GDC visits and age-sex specific number of GDC visits where the age-
sex distribution is estimated from one of the 42 dental clinics4
Instead of applying an age-sex specific under-reporting adjustment to the commercial dental
clinic visits the data is only adjusted for the total number of visits
t+cu( amp) = tvwx( amp)timesi(amp)
yz|z~(T)where A(y) is the under-reporting adjustment factor of year y ie i(amp) = z Ccedil yAumlAring(+T)
Vadj(asy) adjusted number of commercial dental clinic visits of age-sex group (as)
at year y
VTHS(asy) number of commercial dental clinic visits of age-sex group (as) at year y
reported in THS
DTHS(asy) number of DH dental clinic visits of age-sex group (as) at year y reported
in THS and
Dactual(y) actual number of DH dental clinic visits at year y reported by DH
4 httpwwwdhgovhkenglishclinictimetabledchtm
31
34 Demand indicators
341 Private dental sector For the private dental sector commercial dental clinics and non-governmental organisation
(lsquoCharitable organisation dental clinic visitsrsquo or a lsquoDental clinic under Charitable
organisationrsquo) age- sex- specific dental visits are estimated from the THS 2002 2005 2009
and 2011 and adjusted for under-reporting Due to the confounding impact of the economic
crisis dental visit data from THS 2008 have been excluded from the analysis After adjusting
for population demographics private sector dental clinic visits and visit rates are projected to
rise gradually throughout the period (Figure 33(a) and 34(a)) Dental clinic visits by sex are
highest during the working years falling at retirement and rising again for the elderly in the
later years of the projection (Figure 33(b)) While the number of visits increased for middle-
aged females utilisation rates by sex remain relatively consistent through out however
increased rates are noted for younger females (Figure 33(c) 34(b) and 34(c))
num
ber o
f priv
ate
dent
al c
linic
visits
4500000
4000000
3500000
3000000
2500000
2000000
1500000
1000000
500000
0 2005 2010 2015 2020 2025 2030 2035 2040
year
Historical Projection all historical utilisationProjection all except 2008 historical utilisation (best guestimate)
Figure 33(a) Historical and projected number of private sector dental visits (2002-2041 excluding 2008)
32
Figure 33(b) Projected number of private sector age-specific dental visitsndash male (2002-2041 excluding 2008)
Figure 33(c) Projected number of private sector age-specific dental visits ndash female (2002-2041 excluding 2008)
33
0
01
02
03
04
05
06
07
age-
sex
stan
dard
ized
annu
al d
enta
l visi
t rat
e (p
rivat
e de
ntal
clin
ic)
Historical Projection
2000 2005 2010 2015 2020 2025 2030 2035 2040 year
Figure 34(a) Historical and projected annual age-sex standardized private sector dental visit rates (2002-2041 excluding 2008)
Figure 34(b) Projected annual age specific private sector dental visit rates - male (2002-2041 excluding 2008)
34
Figure 34(c) Projected annual age specific private sector dental visit rates ndash female (2002-2041 excluding 2008)
35
342 School Dental Clinic As the historical number of dentists in the DH School Dental Clinic (SDS) shows a constant
trend (ie 29 dentists each year between 2005 and 2011) the corresponding constant trend
projection from the baseline year (ie 29 dentists) is illustrated in Figure 35
Historical 35 Projection
30
25
20
15
10
5
0 2005 2010 2015 2020 2025 2030 2035 2040
year
Figure 35 Historical and projected number of FTE dentists in the School Dental Clinics (2005-2041)
343 Government Dental Clinic Dental visits5 (by civil servants pensioners and dependents HA staff and dependents and
the general public) to the 42 DH Government Dental Clinics (GDC) (11 of which provide
dental service to the general public) under the Department of Health declined from 1999 to
2011 (Figure 36)
num
ber o
f den
tist F
TEs
in S
choo
l Den
tal C
linic
of D
epar
tmen
t of H
ealth
5 Hong Kong Annual Digest of Statistics 2005 and 2013
36
635370
669060
702760
736450
num
ber o
f GD
C v
isits
exc
ludi
ng g
ener
al p
ublic
ses
sion
s
600
214080
224550
235020
num
ber o
f civ
il se
rvan
ts a
nd H
A st
affs
19981998 20002000 20022002 20042004 20062006 20082008 20102010 20122012year
203
Figure 36 Number of HA and civil servant Government Dental Clinic visits (excluding general public sessions) (1999-2011)
The number of GDC visits by civil servants (active civil servants civil servant pensioners
and their dependants) HA staff and dependents and the general public is projected using an
EOH-SVM approach as follows
IUEacuteVC= KNtilde OumlUumlaacute agraveLLacirc Vamp YLagraveLauml C=agraveMacirc ECMLKMC= Matilde atildeCECMatildeCMacirc
= L]C KNtilde YLagraveLauml C=agraveMacirc ECMLKMC= Matilde atildeCECMatildeCMacirc EKEUaumlacircLKM
times OumlUumlaacute agraveLLacirc =acircC KNtilde YLagraveLauml C=agraveMacirc ECMLKMC= Matilde atildeCECMatildeCMacirc EKEUaumlacircLKM
IUEacuteVC= KNtilde OumlUumlaacute agraveLLacirc Vamp aringi acircNtildeNtilde Matilde atildeCECMatildeCMacirc
= L]C KNtilde aringi acircNtildeNtilde Matilde atildeCECMatildeCMacirc EKEUaumlacircLKM
times OumlUumlaacute agraveLLacirc =acircC KNtilde aringi acircNtildeNtilde Matilde atildeCECMatildeCMacirc EKEUaumlacircLKM
IUEacuteVC= KNtilde OumlUumlaacute agraveLLacirc Vamp acircℎC eacuteCMC=auml EUVaumlLY
= EKEaumlUacircLKM times OumlUumlaacute agraveLLacirc =acircC KNtilde acircℎC eacuteCM=auml EUVaumlLY
As these population groups have different growth trajectories (HA staff HA staff
dependents active civil servants civil servant pensioners and civil servant dependents) each
is projected independently as follows
37
A Hospital Authority staff
A staff inter-proportion approach is used to project the number of HA lsquootherrsquo staff by
professional group relative to the doctor-nurse-other staff historical ratio and the doctor and
nurse projections undertaken previously (Figure 37 - 310) as follows
doctor (D) nurse (N) rsquootherrsquo staff (O)
or
Normalized ratio 1 ecirc euml
y y
The historical ecirc
y euml
y pairs are used in a linear regression model as follows
N(amp)Uuml(amp) = j
I(amp)Uuml(amp) = Eacute
I(amp)Uuml(amp) + Y
and then applied to project the number of lsquootherrsquo staff
= Uuml(amp)timesj I(amp)
N amp Uuml(amp)
2 25 3 35 4 45 5
62
64
66
68
7
72
74
76
78
8
oth
er s
taff-
to-D
octo
r rat
io
Historical 1998 - 2003 Historical 2004 - 2012 Projection 2013 - 2041
Nurse-to-Doctor ratio
Figure 37 Historical and projected N-O pairs
38
2000 2005 2010 2015 2020 2025 2030 2035 20400
1
2
3
4
5
6
7
8 o
ther
sta
ff-to
-Doc
tor r
atio
Historical 1998 - 2003 Historical 2004 - 2012 Projection 2013 - 2041
year
Figure 38 Historical and projected lsquootherrsquo staffndashto-doctor ratio (1999-2041)
Relative to the previous doctor and nurse projections the projected number of lsquootherrsquo staff
grows slowly throughout the period (Figure 39)
0
10000
20000
30000
40000
50000
60000
num
ber o
f HA
staf
f
Doctor Historical Doctor ProjectionNurse Historical Nurse ProjectionOther staffs Historical Other staffs Projection
2000 2005 2010 2015 2020 2025 2030 2035 2040 year
Figure 39 Historical and projected number of doctors (black) nurses (blue) and other staff (magenta) (1999-2041)
39
nu
mbe
r of H
A st
aff
100000
90000
80000
70000
60000
50000
40000
30000
20000
10000
0 2000 2005 2010 2015 2020 2025 2030 2035 2040
year
Historical Projection
Figure 310 Historical and projected number of HA staff (1999-2041)6
B HA staff dependants
As the projected number of HA staff is neither age- nor sex-specific the number of HA staff
dependants (as reported in the THS 2002 2005 2008 2009 and 2011) is expressed as a
linear proportion (where βHA is the average of the five historical ratios (βHA = 099)) of the
number of HA staff
IUEacuteVC= KNtilde aringi acircNtildeNtilde atildeCECMatildeMacirc
= IUEacuteVC= KNtilde aringi acircNtildeNtilde
times IUEacuteVC= KNtilde atildeCECMatildeMacirc agraveLLacirc EC= aringi acircNtildeNtilde (Swiacute)
The projected number of HA dependents increases sharply throughout the period (Figure
311)
6 Note This scenario which is used to project the number of HA staff for the dentist demand model is not intended to suggest HA staffing requirements
40
0
10000
20000
30000
40000
50000
60000
70000
80000
90000
100000 nu
mbe
r of d
epen
dant
s of
HA
staf
f
2015 2020 2025 2030 2035 2040 year
Figure 311 Projected number of HA staff dependants (1999-2041)
C Civil servant
The number of civil servants is projected as linearly proportional to Hong Kong population as
follows
ampiigravex = iwicirc amp timesS
where ACS(y) is the aggregated number of civil servants at year y
AHK(y) is the aggregated Hong Kong population size at year y and
S is the number of civil servants per Hong Kong resident
The number of civil servants are projected to increase gradually throughout the period
(Figure 312)
41
0
20000
40000
60000
80000
100000
120000
140000
160000
180000
200000 Nu
mbe
r of c
ivil s
erva
nts
Historical Projection
1995 2000 2005 2010 2015 2020 2025 2030 2035 2040 year
Figure 312 Historical and projected number of civil servants per Hong Kong population (1999-2041)7
Using a stock and flow model the age- sex-specific (as) number of civil servants by year y
is estimated as follows
aacute( amp) lt 60aacuteiumlntildeZ( amp) = 0 KacircℎC=ALC
The number of new recruits ΔC(y+1) at year y+1 is estimated as the difference between
A(y+1) (the aggregated estimated number of civil servants) and the total number civil
servants at the end of year y
∆aacute amp + 1 = iigravex amp + 1 minus aacuteiumlntildeZ( amp) +
The relative age- sex-specific distribution of new civil servant recruits at year y (2010)
aacutefmouml amp is expressed as
7 This scenario which is used to project the number of civil servants for the dentist demand model is not intended to suggest civil servant staffing requirements
42
aacutefmouml 2010 =aacutefmouml aacutefmouml 2010+
and the age- sex-specific number of new civil servant recruits is
aacutefmouml amp + 1 = ∆aacute amp + 1 aacutefmouml
The age- sex-specific number of civil servants at year y+1 is expressed as
aacute amp + 1 = aacuteiumlntildeZ amp + aacutefmouml amp + 1
D Civil servant pensioner
A stock and flow model is used to project the age-specific number of civil servant pensioners
from 2012 as follows
aacuteU==CMacirc acircKYotilde = EC=agraveLKU acircKYotilde minus KUacircNtildeaumlKA + LMNtildeaumlKA
where the stock is the number of pensioners at the current and previous year the outflow are
those pensioners who are older than 85 years of age or have passed away and the inflow is
the number of civil servants who are 60 years of age Both the number and advancing age of
civil servant pensioners is as expected increasing sharply throughout the period (Figure 313
and 314)
43
0
20000
40000
60000
80000
100000
120000
140000
160000
180000
200000 nu
mbe
r of c
ivil s
erva
nt p
ensio
ners
2015 2020 2025 2030 2035 2040 year
Figure 313 Projected number of civil servant pensioners (2013 to 2041)
Figure 314 Projected age-specific number of civil servant pensioners (2013-2041)
E Civil servant dependents
Civil servant and pensioner dependents are categorized as children aged below 19 and the
spouse of the civil servant or pensioner as illustrated in Figure 315
44
Children Age 0 - 18
Active civil servant Spouse
Civil servant pensioner Spouse
Age 17 - 59
Age 60+
Figure 315 Civil servant and pensioner dependents by age group
iumlntildeZA population approach is used to project each category of dependents where RguacuteBpc RobemntildeZugraveand Robem are calibrated from the age-specific number of dependants (as at 2822010)
iumlntildeZ ntildeZugraveprovided by Civil Service Bureau8 ( RguacuteBpc = 0661 Robem = 0673 and Robem = 0658)
as follows
poundKacircauml MUEacuteVC= KNtilde YℎLaumlatilde=CM KNtilde YLagraveLauml C=agraveMacirc
= RguacuteBpctimes MUEacuteVC= KNtilde YLagraveLauml C=agraveMacirc Matilde ECMLKMC= eacuteCatilde VCaumlKA 60
poundKacircauml MUEacuteVC= KNtilde EKUC KNtilde YLagraveLauml C=agraveMacirc eacuteCatilde VCaumlKA 60
iumlntildeZ= Robemtimes MUEacuteVC= KNtilde YLagraveLauml C=agraveMacirc Matilde ECMLKMC= eacuteCatilde VCaumlKA 60
poundKacircauml MUEacuteVC= KNtilde EKUC KNtilde YLagraveLauml C=agraveMacirc eacuteCatilde 60+
ntildeZugrave= Robemtimes MUEacuteVC= KNtilde YLagraveLauml C=agraveMacirc Matilde ECMLKMC= eacuteCatilde 60 +
The number of civil servant dependents (children under 19 and spouses of active civil
servants) are relatively stable whereas the number of spouses of civil servant pensioners
increase sharply throughout the period (Figure 316)
8 There are 38496 dependants with unknown date-of-birth (DOB) These are spread across different age groups according to the relative age distribution of the dependants with known DOB
45
num
ber o
f civi
l ser
vant
dep
enda
nts
120000
100000
80000
60000
40000
20000
0 2015 2020 2025 2030 2035 2040
year
children aged 0-18spouses aged 19-59spouses aged 60+
Figure 316 Projected number of civil servant dependants less than 19 years of age spouses aged 19 - 59 and spouses aged 60 or older (2012-2041)
GDC Utilisation projection
The populations (civil servants and dependents HA staff and dependents and general public)
using the GDC do so with different utilisation rates GDC visits are projected using the
historical population specific GDC utilisation by stratifying THS visits by population group
proportion as follows
tsectyigrave amp minus to amptg amp = tg amp times tg amp ++ + tuacute amp
tsectyigrave amp minus to amptuacute amp = tuacute amp times tg amp ++ + tuacute amp
amptoto amp = to amp times amp+ to
where tsectyigrave amp is the aggregated number of GDC visits at year y
amp is the aggregated number of GDC visits by the general public at year yto
46
is the age- sex-specific self-reported number of GDC visits by active and
pensioner civil servants and their dependents at year y
tg amp
is the age- sex-specific self-reported number of GDC visits by Hospital
Authority staff and their dependents at year y
tuacute amp
amp is the age- sex-specific self-reported number of GDC visits by general
public at year y
to
A U shaped curve is noted for civil servant pensioners and dependents GDC visits throughout
the period GDC visits for other groups remains stable (Figure 317) As expected visit rates
increase by age for active and pensioner civil servants civil servant dependents (Figure 318
ndash 321) For the general public visit rates increase for men but not women with age (Figure
322 ndash 323)
0
100000
200000
300000
400000
500000
600000
700000
800000
Num
ber o
f GD
C v
isits
Historical civil servant related populationHistorical HA related populationHistorical general public Historical total Projection civil servant related population Projection HA related population Projection general public Projection total
2005 2010 2015 2020 2025 2030 2035 2040 year
Figure 317 Historical and projected number of GDC visits by general public civil servants pensioners and dependents and HA staff and dependents (2001 -2041)
47
Figure 318 Projected age-specific GDC visit rate for civil servants - male (2002ndash2041)
Figure 319 Projected age-specific GDC visit rate for civil servants - female (2002ndash2041)
48
Figure 320 Projected age-specific GDC visit rate for civil servant pensioners (2002ndash2041)
Figure 321 Projected age-specific GDC visit rate for civil servant dependents (2002ndash2041)
49
Figure 322 Projected age-specific GDC visit rate for general public ndash male (2002ndash2041)
Figure 323 Projected age-specific GDC visit rate for general public ndash female (2002ndash2041)
50
344 Public inpatient setting Inpatient dental specialty discharges are based on HA (2005-2011) inpatient discharge
records The number of dental specialty discharges increased sharply throughout the period
(Figure 324(a)) Increased utilization volumes in inpatient discharges are observed for both
sexes with large increases in women most notable in the 19-39 60ndash69 and over 75 age
groups (Figure 324(c)) While the age-standardised inpatient discharge rates remain
relatively stable throughout the period (Figure 325(a)) rates for women are higher than for
men in the 19-39 and over 60 age groups (Figure 325(c))
Figure 324 (a) Historical and projected number of inpatient dental specialty discharges (2005-2041)
51
Figure 324(b) Projected number of inpatient dental specialty discharges - male (2005-2041)
Figure 324(c) Projected number of inpatient dental specialty discharges - female (2005-2041)
52
0
0000020
0000040
0000060
0000080
000010
000012
000014 ag
e-se
x st
anda
rdize
d an
nual
inpa
tient
disc
harg
e ra
te
Historical Projection
2005 2010 2015 2020 2025 2030 2035 2040 year
Figure 325(a) Projected annual age-sex standardised inpatient dental specialty discharge rates (2005-2041)
Figure 325(b) Projected annual age-specific inpatient dental specialty discharge rates - male (2005-2041)
53
Figure 325(c) Projected annual age-specific inpatient dental specialty discharge rates -female (2005-2041)
345 Academic sector The dentist demand projection for the academic sector is based the number of dental students
(2001 ndash 2011) enrolled in dental education at the Faculty of Dentistry the University of Hong
Kong (Figure 326) As the program duration changed from 5 years to 6 years from 2012
there is a sharp increase in the number of students in the dental school per year The number
of students in dental education are projected to remain constant from 2018 to 2041
54
Nu
mbe
r of d
enta
l stu
dent
s
350
300
250
200
150
100
50
0
Historical Projection
2005 2010 2015 2020 2025 2030 2035 2040 year
Figure 326 Historical and projected number of dental students Faculty of Dentistry HKU (2001-2041)
35 Converting healthcare utilisation to full time equivalents (FTEs) Two regression-based approaches are used to convert healthcare demandutilisation to dentist
FTEs by service sector (public (HA and DH) and the commercial sector (private and non-
governmental organisations)) and independently projected to adjust for work-related
differences FTE is expressed as a linear combination of the utilisation measures
351 Private sector The number of private FTE dentists (Figure 327) is expressed as a linear proportion of
number of private dental visits
IUEacuteVC= KNtilde E=LagraveacircC atildeCMacircLacirc bullpoundq = IUEacuteVC= KNtilde E=LagraveacircC atildeCMacircauml agraveLLacirc timesRoparaBszlig+hm
where αprivate is the number of private dentist FTEs per private sector dental visit
As there are only two overlapping THS and HMS survey years (2005 and 2009) the
calibrated αprivate is 0000441
55
nu
mbe
r of d
entis
t FTE
s in
priv
ate
sect
or
2000
1500
1000
500
0 2005 2010 2015 2020 2025 2030 2035 2040
year
Historical Projection SupplyProjection Demand
Figure 327 Historical and projected number of private sector FTE dentists (2005-2041)
352 Public sector ndash Government Dental Clinics The number of FTE dentists in GDC is expressed as a linear proportion of the number of
GDC visits
IUEacuteVC= KNtilde bullpoundq atildeCMacircLacirc LM OumlUumlaacute = IUEacuteVC= KNtilde OumlUumlaacute agraveLLacirc times Rsectyigrave
where αGDC is the number of FTE dentists in GDC per GDC visit
The historical αGDC increased from 0000284 at year 2005 to 00003391 at year 2011 (Figure
328) The optimal projection of αGDC the average of Rsectyigrave and the αGDC at the baseline year
is used for the GDC FTE dentist projection
The projected number of GDC FTE dentists shows a U shaped curve increasing gradually
from 2025 throughout the period Figure 329
56
2005 2010 2015 2020 2025 2030 2035 20400
0000050
000010
000016
000020
000025
000031
000035
000040 α
GD
C
Historical Projection historical trendProjection optimal
year
Figure 328 Historical and projected αGDC from 2012 to 2041
0
50
100
150
200
250
num
ber o
f den
tist F
TEs
in D
epar
tmen
t of H
ealth
Historical Projection SupplyProjection Demand
2005 2010 2015 2020 2025 2030 2035 2040 year
Figure 329 Historical and projected number of FTE dentists in the Department of Health
57
353 Public inpatient setting The number of FTE dentists in public inpatient setting is estimated as follows
IUEacuteVC= KNtilde bullpoundq atildeCMacircLacirc LM EUVaumlLY LMEacircLCMacirc CacircacircLMeacute
= IUEacuteVC= KNtilde atildeCMacircauml ECYLaumlacircamp atildeLYℎ=eacuteCtimesRBfo+hBmfh
where αinpatient is the number of FTE dentists in public inpatient setting per dental specialty
discharge
The number of FTE dentists in the HA is projected to increase sharply throughout the period
Figure 330
0
2
4
6
8
10
12
num
ber o
f FTE
den
tists
(Hos
pita
l Aut
horit
y)
Historical Projection
2005 2010 2015 2020 2025 2030 2035 2040 year
Figure 330 Historical and projected number of FTE HA dentists (2005-2041)
58
354 Academic sector The academic sector dentist demand projection is based on the number of dental students in
Hong Kong
IUEacuteVC=KNtilde bullpoundq atildeCMacircLacirc LM YatildeCEacuteLY CYacircK=
= IUEacuteVC=KNtilde atildeCMacircauml acircUatildeCMacirc times R+g+cmaBg
gt = 00833) is the number of FTE dentists working in academic sector per where αacademic (
gtntilde
dental student
The historical data is backward projected from historical number of students and the αacademic
calibrated for 2013 data The number of FTE dentists in the academic sector is projected to
remain stable throughout the period Figure 331
0
5
10
15
20
25
num
ber o
f FTE
den
tist (
acad
emic
sect
or)
Historical Projection
2005 2010 2015 2020 2025 2030 2035 2040 year
Figure 331 Historical and projected number of dentists in academic sector (2005-2041)
59
4 Projecting dental supply
The Dental Council of Hong Kong (DCHK) dental data (age- sex-specific) for 2012 is used
for the dental supply base case Data (for past and projected number of dental graduates)
from the Faculty of Dentistry the University of Hong Kong the DCHK and from the DH
Healthcare Manpower Survey (HMS) on Dentists 2004-2007 amp 2009 are used for the supply
projections
41 Models for dental supply The overall dental supply model is a non-homogenous Markov Chain Model where
workforce systems are represented as ldquostocks and flowrsquosrdquo (Figure 41) Flow refers to
manpower supply over a period of time Stock denotes manpower supply at a particular point
in time
Figure 41 Dental supply model for Hong Kong
There are five age- sex-specific stocks by year (asy) in the model
npre number of pre-existing registrants
nlocal number of local graduates
nnon-local number of non-local graduates
ncurrent number of current registrants
60
nactive number of active and available registrants
Flow in the supply model represents change in the stocks and is projected by determining the
number of
a) current registrants (total number of local graduates non-local graduates and pre-
existing registrants)
ncurrent(asy) = prenewal(y) times npre(asy) + nlocal(asy) + nnon-local(asy)
where prenewal(y) is the licence renewal proportion at year y
b) active and available registrants
nactive(asy) = ncurrent(asy) times pactive(asy)
where pactive(asy)is the active proportion
FTEs by service sector c at year y are calculated as
ne yen nneAEligOslashinfinplusmn a s y timespyenplusmnAEligOslashmicropart(a s y c)timesh(a s y c)FTE y c = Median working hours per week per FTE
where psector(asyc) is the proportion of dentists working in the service sector c at year y and
h(asyc) is the average number of working hours per dentist
The supply projection is based on the stocks and also the parameters prenewal(y) pactive(asy)
psector(asyc) and h(asyc) The average is used to project the parameters
42 Determinants of supply projecting stock and flow
421 Baseline adjustments The age- and sex-specific number of dentists in 2012 provided by the DCHK includes
dentists resident in and outside Hong Kong To separate these two sub-groups the age- and
sex- specific average proportion resident in and outside Hong Kong is estimated for 2002-
2010 from the DCHK Annual Reports
61
422 Movement of dentists into and out of Hong Kong As some dentists may change their residency the movement of Dentists in and out of HK
from 2008 to 2012 as identified in the Gazette lists for dentists 2007-2012 (Table 42) are
used to calculate the average transition proportion This proportion is used to redistribute the
dentists in the two sub-groups (ie 032 of the dentists resident in Hong Kong will leave
Hong Kong and 123 of the dentists resident outside Hong Kong return to Hong Kong each
year from 2012 to 2041)
Table 41 The number and proportion of newly transition 2008-2012
2008 2009 2010 2011 2012 Average proportion
In HK agrave Out of HK 4 (022) 6 (032) 9 (047) 4 (020) 8 (040) 032
Out of HK agraveIn HK 2 (109) 2 (107) 2 (104) 6 (297) 0 (000) 123
According to the Gazette lists for 2007-2012 only one new graduate was out of Hong Kong
in the year graduated The model assumes that all the graduates remain in Hong Kong for the
first year of graduation
423 Total number of registrants The total number of registrants is defined as the number of pre-existing registrants (pool of
dentists multiplied by the registration renewal proportion [as provided by the DCHK]) and
the newly eligible registrants (new dental graduates from the Faculty of Dentistry HKU) and
non-local graduates entering the pool by year
Table 43 lists the projected number of local graduates for 2013-2018 as provided by the
Faculty of Dentistry HKU The estimated number of local graduates is held constant after
2018 As all dentists renew their license to practise every year the average renewal
proportion rate of 2005-2010 is used to estimate the annual registration renewal proportion
which is 992
Table 42 Projected number of local dental graduates (2013-2018) Local Projected Graduates Graduates 2013 2014 2015 2016 2017 2018 2019 2020 2021 2022 Faculty of Dentistry HKU
51 49 55 55 56 52 52 52 52 52
62
424 Number clinically active The number of clinically activeavailable registrants is more relevant for workforce
projection than the total number of registrants in the dentist pool The supply model stratifies
clinically inactiveunavailable dentists by age into four categories no longer practicing in the
dental profession but not retired natural attritionretirement otherwise unavailable and
otherwise deregistered The estimated proportion of clinically inactiveunavailable is derived
from the DH HMS on Dentists 2004-2007 and 2009 The age- sex-specific five year average
proportion is applied to the projection
4241 No longer practicing in the dental profession but not retired Using data from the HMS on Dentists the proportion of dentists lsquono longer practicing in the
dental profession but not retiredrsquo by sex (clinically trained qualified and registeredenrolled
dentists who are no longer practicing clinically) is projected to 2025 (Figure 42)
Figure 42 lsquoNo longer practicing in the dental profession but not retiredrsquo projections by sex (2012-2025) (DH HMS for Dentists)
4242 Natural attritionretirement The projection for lsquonatural attritionretirementrsquo is age- and sex-specific (Figure 43) Women
who remain in the workforce retire at an earlier age than their male counterparts
63
Figure 43 The proportion of dentists lsquonatural attritionretiredrsquo by age - male (2012-2025)
Figure 44 The proportion of dentists lsquonatural attritionretiredrsquo by age - female (2012-2025)
4243 Otherwise unavailable ldquoOtherwise unavailablerdquo (those who have moved away from Hong Kong) dentists are
projected from the HMS on dentists by sex (Figure 14)
64
Figure 45 lsquoOtherwise unavailablersquo projections by sex (2012-2025)
43 Supply externalities
431 Workforce participation and differential work capacity The supply model stratifies the dentist population by four service sectors (private public
[Government Hospital Authority] and academic and subvented) as each has different work
patterns and female-male ratios (Figure 46)
The supply model estimates the age- sex-specific proportion of clinically active dentists by
service sector and location differential work capacity work pattern and standard working
hours from the HMS for Dentist 2004-2007 amp 2009
65
0
10
20
30
40
50
60
70
80
90
100
2004 2005 2006 2007 2009 2012
Prop
ortio
n
Year
Private Public (Government Hospital Authority) Academic Subvented
Figure 46 Distribution of dentists by sector 2004-2007 2009 amp 2012
44 Converting workforce supply to full time equivalents (FTEs) The model uses the age- sex-specific stratified average working hours to determine the total
hours worked by sector The average working hours in lsquoprivatersquo is capped at 46 hours per
week and in lsquopublicrsquo lsquoacademicrsquo and lsquosubventedrsquo working hours are capped at 44 hours per
week (equivalent to 1 FTE)
66
45 Dentist supply projection from 2012-2041 Table 45 presents the detailed projection outcomes for each of the variables in the supply
model and the total FTE supply projection from 2015-2040 The public sector FTE
represents the lsquoGovernment and Hospital Authorityrsquo FTE projections
Table 43 Dentist supply projection for 2012-2040 Year 2012 2015 2020 2025 2030 2035 2040 Pre-existing registrants 2237 2359 2574 2768 2951 3113 3261
Number of registrants resident in Hong Kong1 2030 2146 2346 2526 2692 2840 2972
Number of registrants after renewal2 2011 2124 2323 2501 2666 2811 2943
Number of graduates Local3 52 55 52 52 52 52 52
Non-local4 8 8 8 8 8 8 8
Newly eligible registrants 60 63 60 60 60 60 60
Total number of registrants 2071 2188 2383 2561 2726 2872 3003
Clinically inactiveunavailable No longer practising in the dental profession but not retired5
30 32 34 35 36 35 35
Natural attritionretirement5 87 111 223 385 553 804 942
Otherwise unavailable5 21 22 23 23 22 21 21
Otherwise deregistered6 1 1 1 1 1 1 1
Number of inactive registrants7 139 166 281 444 612 861 1000
Number of clinically activeavailable registrants8 1932 2022 2103 2117 2114 2010 2004
Total FTE9 1849 1936 2013 2027 2024 1925 1918
1 The proportion of dentists resident in Hong Kong is based on the data provided by DCHK 2 The renewal rate is based on the data provided by DCHK 3 The number of local graduates are from the Faculty of Dentistry HKU number of expected graduates are
held constant from 2018 4 The average number of candidates that passed Part III license examination from 1986-2010 is used as the
number of non-local graduates in the projection 5 Proportion of clinically inactiveunavailable from the DH HMS for Dentists (2004-2007 and 2009) 6 Assume 1 permanent dentist deregistration per year 7 The total number of clinically inactiveunavailable dentists is calculated by summing the number of dentists in
the categories of ldquoNo longer practising in the dental profession but not retiredrdquo ldquoNatural attritionretirementrdquo ldquoOtherwise unavailablerdquo and ldquoOtherwise deregisteredrdquo
8 Total number of clinically activeavailable dentists 9 Total projected FTE
67
5 Gap analysis
The gap analysis quantified the difference between the projected demand for and supply of
dentists for the base case (assumed demand and supply was at equilibrium from 2005 - 2011)
The base case is further adjusted for the impact of policy options (service enhancements in
the Government Dental Service dental service for patients with intellectual disabilities
Community Care Fund Elderly Dental Assistance Programme and outreach dental service for
the elderly) and is jointly presented in the lsquopolicy optionrsquo scenario Finally the base case best
guestimate and policy option scenarios are combined for the best guestimate projections The
supply base case projects dentist FTE supply
68
51 Method Three methods (annual number of FTEs year-on-year FTE and the annual incremental FTE)
were used to quantify FTE dentist demand and compared to the base case supply projections
for Hong Kong
52 Annual number of FTE The number of FTE dentists (by SVM) required in year amp was as a function of the various
utilisation measures in year amp as described in the previous sections where -
Number of FTE amp = M(B) amp Y(B) B
was the projected utilisation measure L in year amp and the Y(B) the estimated FTE M(B) ratio M(B) amp
53 Year-on-Year FTE The year-on-year FTE method quantified the year-on-year difference between demand and
supply as follows -
amp = UumlCEacuteMatilde amp minus kUEEaumlamp(amp)
where (amp) was the year-on-year FTE at year amp UumlCEacuteMatilde(amp) was the FTE demand at year amp
and kUEEaumlamp(amp) is the FTE supply at year amp
54 Annual incremental FTE The annual incremental FTE method quantified the change in the demand supply gap from
the previous year as follow -
aelig amp = amp minus (amp minus 1)
where aelig amp was the annual incremental FTE at year amp amp was the year-on-year FTE at year
amp and (amp minus 1) is the year-on-year FTE from the previous year
69
55 Base case scenario For the base case scenario the FTE demand supply gap analysis projects a growing shortfall
of dentists (Figure 51 ndash 53) through 2040 The on average year-on-year projected FTE
shortfall at 2040 was 360 (Table 52 ndash 53) The Hong Kong dental service is dominated by
the private sector (around 75 of dentist working in private sector) demand growth is slower
in the later years of the projection However as a large proportion of dentists will retire
within this period the decreasing rate of dentist supply is greater than the increasing rate of
dental demand
0
500
1000
1500
2000
2500
3000
S
D1
num
ber o
f FTE
den
tists
Historical (S) Projected supply Base case(D1) Projected demand Base case
2005 2010 2015 2020 2025 2030 2035 2040 year
Figure 51 Projected number of dentists FTEs Base case supply and demand (Shaded area 5th-95th percentile)
70
2015 2020 2025 2030 2035 2040
-400
-200
0
200
400
600
800
D1
Year
-on-
year
FTE
gap
(Y1) Supply (Base case) + Demand (Base case)
year
Figure 52 Year-on-year FTE gap Base case demand model (Shaded area 5th-95th percentile)
D1
(Z1) Supply (Base case) + Demand (Base case)
2015 2020 2025 2030 2035 2040
Annu
al in
crem
enta
l FTE
gap
40
20
0
-20
-40
-60
year
Figure 53 Annual incremental FTE gap Base case demand model (Shaded area 5th-95th percentile)
71
Table 51 Base case projected year-on-year supply-demand gap [a negative number indicates surplus]
Best estimate 5th percentile 95th percentile 2015 2020
0 20
-169 -267
52 104
2025 2030
93 161
-301 -301
211 308
2035 2040
309 362
-188 -155
467 526
Table 52 Base case projected annual incremental supply-demand gap [a negative number indicates surplus]
Best estimate 5th percentile 95th percentile 2015 2020
-6 13
-31 -11
2 18
2025 2030
14 25
-4 14
21 27
2035 2040
20 6
14 -1
23 7
72
6 Policy options
The projection models took an empirical approach rather than asserting any normative level
of demand or supply assuming that supply and demand were in balance (no shortfall or
surplus of human resources) historically Because of this conservative assumption in the base
case projections different sensitivity scenarios are simulated to test alternative normative
preferences or policy actions The proposed policy options scenarios include-
a) Dental care support
b) Service enhancement - Government Dental Clinic
61 Dental care support The modelling approach for the policy initiatives vis Community Care Fund - Elderly Dental
Assistance Programme (Policy 1) Dental Service for Patients with Intellectual Disability
(ID) (Policy 2) and the Outreach Dental Service for the Elderly (Policy 3) used in the
projections follow
73
Modelling approach for policy initiatives
Policy 1
For the Community Care Fund - Elderly Dental Assistance Programme (Policy 1) the number
of dental visits induced by the referral of recipients of Old Age Living Allowance (OALA) to
the participating dentists is projected as follows
IUEacuteVC= KNtilde bullpoundq atildeCMacircLacirc LMatildeUYCatilde Vamp atildeCEacuteMatilde CDacircC=MaumlLacircamp 3 bullm
= IUEacuteVC= KNtilde Niji =CYLELCMacirc Ieumliacuteoslashiacute timesUEacircotildeC =acircC =eoh+iquestm
times IUEacuteVC= KNtilde bullpoundq atildeCMacircLacirc EC= Niji =CYLELCMacirc AℎK UC acircℎC C=agraveLYC(Am)
ecircealmpara bd eumliacuteoslashiacute paramgBoBmfh The proportion of OALA recipient ϒOALA = remains constant from ecircealmpara bd mpcmparapT +`mc ntildeiexclnot
2012 to 2014 such that the number of OALA recipients is expressed
IUEacuteVC= KNtilde Niji =CYLELCMacirc
= IUEacuteVC= KNtilde CaumlatildeC=aumlamp eacuteCatilde 65ugrave
times =KEK=acircLKM KNtilde Niji =CYLEacircLCMacirc radiceumliacuteoslashiacute
The proportion of OALA recipients ϒOALA is estimated using 2014 data
Age group Number of OALA recipients Number of elderly Proportion of OALA recipient
(as at end-Feb 2014) (as at end-Dec 2013) γOALA
65 ndash 69 109000 294900 03696
70 ndash 74 87000 213100 04083
75 ndash 79 90000 210300 04280
80 ndash 84 78000 157500 04952
85+ 51000 142600 03576
The uptake rate ruptake and the number of FTE dentists per OALA recipient who use the
service we3 are estimated as
ruptake = 025 100
Am = 415000
74
num
ber o
f den
tists
due
to C
omm
unity
Car
e Fu
nd E
lder
ly De
ntal
Ass
istan
ce P
rogr
amm
e 120
100
80
60
40
20
0 2015 2020 2025 2030 2035 2040
year
Figure 61 Number of dentists induced by policy 1
Policy 2
The number of dental visits induced by policy 2 is linearly proportional to the number of
eligible patients (CSSA recipients who are aged 18 or above and are with moderate ID) as
follows
IUEacuteVC= KNtilde atildeCMacircauml agraveLLacirc LMatildeUYCatilde Vamp KaumlLYamp 2 Iogt
= IUEacuteVC= KNtilde CaumleacuteLVaumlC EacircLCMacirc Iasympy times iEE=KagraveC =acircC S+ooparabszligm
times IUEacuteVC= KNtilde atildeCMacircauml agraveLLacirc EC= CaumlLeacuteLVaumlC EacircLCMacirc agraveasympy
A population rate approach is used to estimate the number of eligible patients
IUEacuteVC= KNtilde CaumleacuteLVaumlC EacircLCMacirc Iasympy
= aringKMeacute ∆KMeacute EKEUaumlacircLKM eacuteCatilde 18 K= VKagraveC times =KEK=acircLKM KNtilde aeligUuml Rasympy
The number of dental visits induced is expressed as
75
IUEacuteVC= KNtilde atildeCMacircauml agraveLLacirc LMatildeUYCatilde Vamp EKaumlLYamp 2 Iogt
= aringKMeacute ∆KMeacute EKEUaumlacircLKM eacuteCatilde 18 K= VKagraveC Ilaquougrave
times =KEK=acircLKM KNtilde EE=KagraveC R+ooparabszligm
times IUEacuteVC= KNtilde atildeCMacircauml agraveLLacirc EC= CaumlLeacuteLVaumlC EacircLCMacirc agraveasympy
where
=KEK=acircLKM KNtilde EE=KagraveC R+ooparabszligm
= =KEK=acircLKM KNtilde aeligUuml Rasympy timesiEE=KagraveC =acircC (S+ooparabszligm)
The proportion approved αapprove is fixed as at 2013 ie αapprove = 400 10242600 =
00000391 and projected in Figure 62
25
20
15
10
5
0 2015 2020 2025 2030 2035 2040
year
Figure 62 Number of private dental visits induced by policy 2
Policy 3
The number of FTE dentists for the Outreach Dental Service for the Elderly is assumed to be
linearly proportional to the number of patients in Residential Care Homes for the Elderly
DEs
num
ber o
f den
tist F
TEs
indu
ced
byPi
lot P
roje
ct o
n De
ntal
Ser
vice
for P
atie
nts
with
Inte
llect
ual D
isabi
lity
76
IUEacuteVC= KNtilde bullpoundq atildeCMacircLacirc LM Outreach Dental Service for the Elderly bullo
= IUEacuteVC= KNtilde EacircLCMacirc LM RCHEsDEs Io+hBmfh timesUumlCMacircLacirc-acircK-EacircLCMacirc E=KEK=acircLKM (Rhm+a)
IUEacuteVC= KNtilde EacircLCMacircLM RCHEsDEs Io+hBmfh )aacutearingq
= IUEacuteVC= KNtilde EaumlYC E=KagraveLatildeCatilde Vamp Uumlq IldquordquoAumllsquo
rsquolsquo
timesNYYUEMYamp =acircC Sbggeo+fgT timesCMCacirc=acircLKM =acircC Somf
where the penetration rate βpen is assumed to be 08 and the occupancy rate βoccupancy is 66000
82000 = 0805 As the outreach dental team normally comprises a dentist and a dental
surgery assistant the dentist-to-patient proportion αteam is 24 56000 = 000043 The
projected number of FTE dentists for the outreach pilot project is shown in Figure 63
0
5
10
15
20
25
30
35
40
45
num
ber o
f den
tist F
TEs
indu
ced
byO
utre
ach
Dent
al C
are
Prog
ram
me
for t
he E
lder
ly
2015 2020 2025 2030 2035 2040 year
Figure 63 Number of FTE dentists induced by the outreach pilot project
The solid lines in Figures 64 ndash 66 for the projected number of dentist FTEs year-on-year
FTE gap and annual incremental FTE gap represent the additive impact to the best
guestimate scenario of increased dental care support The on average year-on-year projected
dentist FTE shortfall for 2025 was 177 (on average annual incremental shortfall of 18)
77
(Tables 61-62) The on average year-on-year projected dentist FTE shortfall for 2040 was
499 (on average annual incremental shortfall of 8) The three dental care support initiatives as
compared to the base case increases the overall dentist FTE shortfall throughout the
projection period
num
ber o
f FTE
den
tists
3000
2500
2000
1500
1000
500
0 2005 2010 2015 2020 2025 2030 2035 2040
S
D1
D2
year
Historical (S) Projected supply Base case(D1) Projected demand Base case(D2) Projected demand Base case adjusted for Dental care support
Figure 64 Projected number of dentist FTEs lsquoDental care supportrsquo (Shaded area 5th-95th percentile)
78
2015 2020 2025 2030 2035 2040
-400
-200
0
200
400
600
800
D1
D2
Year
-on-
year
FTE
gap
(Y1) Supply (Base case) + Demand (Base case)(Y2) Supply (Base case) + Demand (Base case adjusted for Dental care support)
year
Figure 65 Year-on-year dentist FTE gap lsquoDental care supportrsquo (Shaded area 5th-95th percentile)
60
Annu
al in
crem
enta
l FTE
gap
40
20
0
-20
-40
-60
year
D1D2
(Z1) Supply (Base case) + Demand (Base case)(Z2) Supply (Base case) + Demand (Base case adjusted for Dental care support)
2015 2020 2025 2030 2035 2040
Figure 66 Annual incremental dentist FTE gap lsquoDental carersquo (Shaded area 5th-95th percentile)
79
Table 61 Staffing ratio projected year-on-year supply-demand gap [a negative number indicates surplus]
Best estimate 5th percentile 95th percentile 2015 2020
65 83
-108 -206
134 178
2025 2030
177 268
-219 -196
304 422
2035 2040
434 499
-65 -12
597 669
Table 62 Staffing ratio projected annual incremental supply-demand gap [a negative number indicates surplus]
Best estimate 5th percentile 95th percentile 2015 2020
-8 17
-33 -7
1 22
2025 2030
18 29
0 18
26 31
2035 2040
24 8
18 1
26 9
62 Service enhancement - Government Dental Clinic (GDC) As GDC dental service volume is supply driven the lsquoservice improvement in GDCrsquo model
assumed a predefined utilisation growth as estimated by the Department of Health Dental
Service The on average year-on-year projected FTE shortfall for 2015 2025 and 2040 for
dentists was 35 146 and 415 respectively (on average annual incremental shortfall for 2015
2025 and 2040 of -2 14 and 6 respectively) (Figure 67 ndash 69 Tables 63 ndash 64) lsquoService
improvement in GDCrsquo as compared to the dental care support had a smalerl net impact on the
overall FTE shortfall
80
num
ber o
f FTE
den
tists
3000
2500
2000
1500
1000
500
0
Historical (S) Projected supply Base case(D1) Projected demand Base case(D3) Projected demand Base case adjusted for service enhancement on Government Dental Clinic
D3
D1
S
2005 2010 2015 2020 2025 2030 2035 2040 year
Figure 67 Projected number of dentist FTEs Service enhancement - GDC (Shaded area 5th-95th percentile)
Year
-on-
year
FTE
gap
800
600
400
200
0
-200
-400
(Y1) Supply (Base case) + Demand (Base case)(Y3) Supply (Base case) + Demand (Base case adjusted for service enhancement on Government Dental Clinic)
D3 D1
2015 2020 2025 2030 2035 2040 year
Figure 68 Year-on-year FTE gap Service enhancement ndash GDC (Shaded area 5th-95th percentile)
81
40
20
0
-20
-40
-60
(Z1) Supply (Base case) + Demand (Base case)(Z3) Supply (Base case) + Demand (Base case adjusted for service enhancement on Government Dental Clinic)
D1 D3
2015 2020 2025 2030 2035 2040 year
Figure 69 Annual incremental FTE gap Service enhancement - GDC (Shaded area 5th-95th percentile)
Table 63 Service enhancement in GDC projected year-on-year supply-demand gap [a negative number indicates surplus]
Annu
al in
crem
enta
l FTE
gap
Best estimate 5th percentile 95th percentile 2015 2020
35 73
-140 -216
89 160
2025 2030
146 214
-250 -251
267 362
2035 2040
362 415
-139 -104
523 580
Table 64 Service enhancement in GDC projected annual incremental supply-demand gap [a negative number indicates surplus]
Best estimate 5th percentile 95th percentile 2015 2020
-2 13
-26 -11
7 18
2025 2030
14 25
-4 14
21 27
2035 2040
20 6
14 -1
23 7
82
7 Recommendations ndash Best Guestimate
The overall FTE accumulated FTE gap and annual incremental FTE gap for the demand
model best guestimate (demand base case and policy options) and the supply model base case
are presented in Figures 71 ndash 73 and Tables 71- 72 The on average year-on-year projected
FTE shortfall for dentists in 2015 2025 and 2040 was respectively 100 230 and 552 (on
average annual incremental shortfall of -3 18 and 8 respectively)
num
ber o
f FTE
den
tists
3000
2500
2000
1500
1000
500
0 2005 2010 2015 2020 2025 2030 2035 2040
year
Historical (S) Projected supply Base case(D1) Projected demand Base case(D4) Projected demand Best guestimate
D4
D1
S
Figure 71 Projected overall FTE dentist demand (Best guestimate) and FTE dentist supply (base case)
83
2015 2020 2025 2030 2035 2040
-400
-200
0
200
400
600
800
D1
D4
Year
-on-
year
FTE
gap
(Y1) Supply (Base case) + Demand (Base case)(Y4) Supply (Base case) + Demand (Best guestimate)
year
Figure 72 Year-on-year FTE gap (Best guestimate) and FTE dentist supply (base case)
60
2015 2020 2025 2030 2035 2040
-60
-40
-20
0
20
40
D1D4
Annu
al in
crem
enta
l FTE
gap
(Z1) Supply (Base case) + Demand (Base case)(Z4) Supply (Base case) + Demand (Best guestimate)
year
Figure 73 Annual incremental FTE gap (Best guestimate) and FTE dentist supply (base case)
84
Table 71 Best guestimate model projected year-on-year supply-demand gap [a negative number indicates surplus]
Best estimate 5th percentile 95th percentile 2015 2020
100 136
-69 -154
159 228
2025 2030
230 321
-167 -145
355 471
2035 2040
487 552
-15 43
650 719
Table 72 Best guestimate model projected annual incremental supply-demand gap [a negative number indicates surplus]
Best estimate 5th percentile 95th percentile 2015 2020
-3 17
-28 -7
5 22
2025 2030
18 29
0 18
26 31
2035 2040
24 8
18 1
26 9
85
8 Comparison of 2012-2041 and 2015-2064 projections
The final model presents two demand best guestimate scenario (based on the 2012-2041 and
the 2015-2064 CSampD demographic projections respectively) and the supply base case FTE
projections as well as the year-on-year and annual incremental FTE gap (Figure 61 ndash 63
Tables 61 ndash 62) The demand best guestimates adopting the 2015-2064 vs 2012-2041
CSampD demographic projections on average year-on-year FTE shortfall are similar across the
projection period
num
ber o
f den
tist F
TEs
2500
2000
1500
1000
500
0 2005 2010 2015 2020 2025 2030 2035 2040
year
(D)
(D)
(S)
Historical (S) Supply Base case(D) Demand Best guestimate using 2012 - 2041 demographic projection (D) Demand Best guestimate using 2015 - 2064 demographic projection
Figure 81 Historical and projected number of doctor FTEs Base case supply and demand (Shaded area 5th-95th percentile)
86
2015 2020 2025 2030 2035 2040
-200
0
200
400
600 (Y)
(Y)
num
ber o
f den
tist F
TEs
(Y) FTE gap using 2012 - 2041 demographic projection (Y) FTE gap using 2015 - 2064 demographic projection
year
Figure 82 Year-on-year FTE gap Base case demand model (Shaded area 5th-95th percentile)
50
num
ber o
f den
tist F
TEs
0
-50
2015 2020 2025 2030 2035 2040
(Y)
(Y)
(Y) Annual incremental FTE gap using 2012 - 2041 demographic projection (Y) Annual incremental FTE gap using 2015 - 2064 demographic projection
year
Figure 83 Annual incremental FTE gap Base case demand model (Shaded area 5th-95th percentile)
87
Table 81 Best guestimate projected year-on-year supply-demand gap (assuming retirement =gt65 years of age) [a negative number indicates surplus]
Best estimate (2012-2041
demographic projection)
5th
percentile 95th
percentile
Best estimate (2015-2064
demographic projection)
5th
percentile 95th
percentile
2015 2020
100 136
-69 -154
159 228
92 122
-76 -162
145 204
2025 2030
230 321
-167 -145
355 471
198 265
-186 -181
309 399
2035 2040
487 552
-15 43
650 719
446 532
-37 34
594 685
Table 82 Best guestimate projected annual incremental supply-demand gap (assuming retirement =gt65 years of age) [a negative number indicates surplus]
Best estimate (2012-2041
demographic projection)
5th
percentile 95th
percentile
Best estimate (2015-2064
demographic projection)
5th
percentile 95th
percentile
2015 2020
-3 17
-28 -7
5 22
-4 14
-25 -8
4 19
2025 2030
18 29
0 18
26 31
14 26
-2 17
21 28
2035 2040
24 8
18 1
26 9
27 11
23 8
30 11
88
9 References
1 Birch S Kephart G Murphy GT OBrien-Pallas L Alder R MacKenzie A Health human resources planning and the production of health Development of an extended analytical framework for need-based health human resources planning J Public Health Manag Pract 200956-61
2 Maynard A Policy forum Australiarsquos health workforce medical workforce planning Some forecasting challenges Social Research 200639(3)
3 OBrien-Pallas L Baumann A Donner G Tomblin-Murphy G Lochhaas-Gerlach J Luba M Forecasting models for human resources in health care J Adv Nurs 200033(1)120-9
4 OBrien-pallas L Birch S Baumann A Integrating workforce planning human resources and service planning Policy Anal 2001 (December 2000)9-12
5 Bloor K Maynard A Planning human resources in health care Towards an economic approach an international comparative review 2003
6 Chung SH Jung DC Yoon SN Lee D A dynamic forecasting model for nursing manpower requirements in the medical service industry Service Business 20094(3-4)225-36
7 World Health Organisation Models and tools for health workforce planning and projections 2010
8 Roberfroid D Leonard C Stordeur S Physician supply forecast Better than peering in a crystal ball Hum Resour Health 2009710-22
9 Etzioni DA Finlayson SR Ricketts TC Lynge DC Dimick JB Getting the science right on the surgeon workforce issue Arch Surg 2011146(4)381-4
10 Cooper R Adjusted needs Modeling the specialty physician workforce AANS Bulletin 2000 Spring 200013-4
11 Etzioni DA Liu JH Maggard MA Ko CY The aging population and its impact on the surgery workforce Ann Surg 2003 Aug238(2)170-7
12 World Health Organisation 2012 Available from httpwwwwhointhrh 13 World Health Organisation Coordinated health and human resources development
Report of WHO Study Group 1990 14 World Health Organisation Health workforce supply and requirements projection
models 1999 15 World Health Organisation Assessment of human resources for health 2002 16 World Health Organisation Scaling up HIVAIDS care service delivery amp human
resources perspectives 2004 17 World Health Organisation A guide to rapid assessment of human resources for health
2004 18 World Health Organisation Assessing financing education management and policy
context for strategic planning of human resources for health 2007 19 World Health Organisation Human resources 2009 20 World Health Organisation Measuring health workforce inequalities methods and
application to China and India 2010 21 World Health Organisation Monitoring the building blocks of health systems A
handbook of indicators and publications 2010 22 Tools and Guidelines Committee GHWA Human Resources for Health Action
Framework Cambridge MA USA 2009 23 Organization for Economic Cooperation and Development (OECD) 2012 [cited 2012
Dec 13] Available from httpwwwoecdorghealthheathpoliciesanddata 24 Simoens S Hurst J The Supply of Physician Services in OECD Countries 2006
89
25 OECD OECD Reviews of Health Systems OECD Publishing2012 26 OECD Health Workforce Demographics An overview The Looming Crisis in the
Health Workforce How Can OECD Countries Respond OECD Publishing 2008 27 Buchan J Calman L Skill-mix and policy change in the health workforce Nurses in
advanced roles 2005 28 Simoens S Villeneuve M Hurst J Tackling nurse shortages in OECD countries 2005
p 1-58 29 Fujisawa R Colombo F The Long-Term Care Workforce Overview and Strategies to
Adapt Supply to a Growing Demand OECD 2009 30 Health Workforce Australia httpwwwhwagovau 2012 31 Health Canada [cited 2012 Nov 28] Available from wwwhc-scgcca 32 Ministry of Health Labour and Welfare HR Development [cited 2012 Nov 28]
Available from httpwwwmhlwgojpenglishpolicyemploy-labourhuman-resourcesindexhtml
33 Netherlands Institute for Health Services Research [cited 2012 Nov 28] Available from httpnivelnl
34 Health Workforce Advisory Committee [cited 2012 Nov 28] Available from httpwwwhealthworkforcegovtnzabout-health-workforce-nzpublications-and-reports
35 Planning NSNW httpwwwworkforceplanningscotnhsukworkforce-planning-resourcesaspx [cited 2012 Nov 28]
36 Ministry of Health Singapore Healthcare 2020 Improving accessibility quality and affordability Health Scope 2012 July-August
37 Department of Health Centre for Workforce Intelligence (CWI) [cited 2012 Nov 28] Available from httpwwwcfwiorguk
38 US Department of Health and Human Services 2012 [cited 2012 Nov 28] Available from httpwwwhrsagovindexhtml
39 American Society for Human Healthcare Resources Administration httpwwwashhraorg [cited 2012 Nov 28]
40 Health Workforce Australia Health Workforce 2025 Doctors Nurses and Midwives Volume 2 Health Workforce Australia 2012
41 Health Workforce Australia Health Workforce 2025 Medical Specialties Volume 3 Health Workforce Australia 2012
42 Health Canada Health Human Resource Strategy Canada 2011 Available from httpwwwhc-scgccahcs-ssshhr-rhsstrategindex-engphp
43 McIntosh T Provincial health human resource plans Canada 2006 44 Cameron Health Strategies Group Limited An Inventory of Health Human resource
Forecasting Models In Canada Canada 2009 45 Ministry of Health Labour and Welfare Annual health labour and welfare report 2009-
2010 Japan 2010 Available from httpwwwmhlwgojpenglishwpwp-hw402html 46 Ministry of Health Labour and Welfare Annual health labour and welfare report 2010-
2011 medical professionals Available from httpwwwmhlwgojpenglishwpwp-hw5dl23010209epdf
47 Netherlands Institute for Health Services Research Mission and activities 2012 Available from httpwwwnivelnlenmission-and-activities
48 Netherlands Institute for Health Services Research Manpower planning 2012 Available from httpwwwnivelnlenmanpower-planning
49 Greuningen MV Batenburg R Velden LVD Ten years of health workforce planning in the Netherlands a tentative evaluation of GP planning as an example Human Resources for Health 201210(21)1-15
90
50 Health Workforce New Zealand Workforce Service Forecasts New Zealand 2012 Available from httpwwwhealthworkforcegovtnzour-workworkforce-service-forecasts
51 Health Workforce New Zealand Health workfroce projections modelling 2010 Primary health care nursing workforce New Zealand Health Workforce New Zealand 2010
52 National Health Service Scotland Workforce NHS Scotland 2012 Available from httpwwwisdscotlandorgworkforce
53 NHS Scotland Scottish Health Workforce Plan 2004 Baseline Scotland National Health Service Scotland 2004
54 Wright M An update on the analysis and modelling of dental workforce in Scotland Scotland 2006
55 Wright M Crichton I An analysis of dental workforce in Scotland 2008 56 Ministry of Health Singapore About Us Singapore 2012 Available from
httpwwwmohgovsgcontentmoh_webhomeabout-ushtml 57 Ministry of Health Singapore Committee of Supply Speech Healthcare 2020
Improving Accessibility Quality and Affordability for Tomorrows Challenges Singapore 2012 Available from httpwwwmohgovsgcontentmoh_webhomepressRoomspeeches_d2012moh_20 12_committeeofsupplyspeechhealthcare2020improvingaccessibihtml
58 Ministry of Health Singapore Health Manpower Available from httpwwwmohgovsgcontentmoh_webhomestatisticsHealth_Facts_SingaporeHea lth_Manpowerhtml
59 Centre for Workforce Intelligence Horizon scanning report Medical - Informing medical and dental student intakes Centre for Workforce Intelligence 2012
60 Centre for Workforce Intelligence Horizon scanning report Dental - Informing medical and dental student intakes Centre for Workforce Intelligence 2012
61 Centre for Workforce Intelligence A Technical Report(Part 2) for a strategic review of the future healthcare workforce informing medical and dental student intakes Centre for Workforce Intelligence 2012
62 Health Resources and Services Administration Health Professions 2012 Available from httpbhprhrsagovaboutindexhtml
63 Human Resources and Services Administration The physician workforce Projections and research into current issues affecting supply and demand US Department of Health and Human Services Health Resources and Services Administartion Bureau of Health Professions 2008
64 Health Resources and Services Administration National center for health workforce analysis health workforce reports 2012 Available from httpbhprhrsagovhealthworkforceallreportshtml
65 Health Resources and Services Administration Projected supply demand and shortages of registered nurses 2000-2020 USA 2002
66 Lee PP Jackson CA Relles DA Demand-based assessment of workforce requirements for orthopaedic services The Journal of Bone and Joint Surgery 199880-A(3)313-26
67 Joyce CM McNeil JJ Stoelwinder JU More doctors but not enough Australian medical workforce supply 2001-2012 Med J Aust 2006184(9)441-6
68 Chang H-C Liou Y-M Yen AM-F Chen TH-H Projection of the supply of and demand for board-certified nephrologists for ESRD in Taiwan J Eval Clin Pract 2008 Apr14(2)305-15
69 Barber P Lopez-Valcarcel BG Forecasting the need for medical specialists in Spain Application of a system dynamics model Human resources for health 20108(24)1-9
91
70 Health Resources and Services Administration The physician workforce Projections and research into current issues affecting supply and demand Services USDoHaH 2008
71 Fehring TK Odum SM Troyer JL Ioria R Kurtz SM Lau EC Joint replacement access in 2016 A supply side crisis The Journal of Arthroplasty 2010 Dec25(8)1175-81
72 Koike S Matsumoto S Kodama T Ide H Yasunaga H Imamura T Estimation of physician supply by specialty and the distribution impact of increasing female physicians in Japan BMC Health Serv Res 20099180
73 Satiani B Williams TE Go MR Predicted shortage of vascular surgeons in the United States population and workload analysis J Vasc Surg 2009 Oct50(4)946-52
74 Craig D Byrick R Carli F A physician workforce planning model applied to Canadian anesthesiology Planning the future supply of anesthesiologists Can J Anaesth 200249(7)671-7
75 Hilton CW Plauche WC Rigby PG Projecting physician supply at a state level Physicians in Louisiana in 2001 and 2006 South Med J 199891(10)914-8
76 Miller RH Otolaryngology manpower in the year 2010 Laryngoscope 1993103750-3
77 Department of Health Education and Welfare US Physicians for a growning America Report of the surgeon generals consultant group on medical education Public Health Service 1959
78 Saman DM Arevalo O Johnson AO The dental workforce in Kentucky Current status and future needs J Public Health Dent 201070(3)188-96
79 Solomon ES Dental workforce Dent Clin North Am 200953(3)435-49 80 Guthrie D Valachovic RW Brown LJ The impact of new dental schools on the dental
workforce through 2022 J Dent Educ 200973(12)1353-60 81 Chrisopoulos S Teusner D Dentist labour force projections 2005 to 2020 the impact
of new regional dental schools Aust Dent J 2008 Sep53(3)292-6 82 Grytten J Lund E Future demand for dental care in Norway A macro-economic
perspective Community Dent Oral Epidemiol 199927321-30 83 Spencer AJ Szuster FSP Brennan DS Goss AN A consensus approach to projections
of the supply of oral and maxillofacial surgeons in Australia Int J Oral Maxillofac Surg 199322314-7
84 Nash KD Brown LJ Hicks ML Private practicing endodontists Production of endodontic services and implications for workforce policy J Endod 200228(10)699-705
85 Morgan MV Wright FAC Lawrence AJ Laslett AM Workforce predictions a situational analysis and critique of the World Health Organistaion model Int Dent J 199444(1)27-32
86 Australian Research Centre for Population Oral Health Supply and demand for oral and maxillofacial surgeons and services in Australia Aust Dent J 201055(3)346-50
87 Gallagher JE Kleinman ER Harper PR Modelling workforce skill-mix How can dental professionals meet the needs and demands of older people in England Br Dent J 2010208(E6)1-9
88 Brown J Grimes L Davis DA ODA council on dental care special report - Oklahoma dentists workforce 2007
89 Beazoglou T Bailit H Heffley D The dental work force in Wisconsin Ten - year projections J Am Dent Assoc 20021331097-104
90 Try G Too few dentists Workforce planning 1996-2036 Economics and Primary Dental Care 20007(1)9-13
92
91 Waldman HB Planning for the manpower needs for the next generation of periodontal patients J Periodontol 199566599-604
92 Workforce review team NHS Workforce summary - nursing 2008 93 Buerhaus PI Staiger DO Auerbach DI Implications of an aging registered nurse
workforce JAMA 2000283(22)2948-54 94 Auerbach DI Pearson ML Taylor D Battistelli M Sussell J Hunter LE et al Nurse
practitioners and sexual and reporductive health services an analysis of supply and demand Rand Corporation 2012
95 HealthWorkforce Australia Health workforce 2025 Doctors nurses and midwives 2012
96 Wisconsin Health Workforce Wisconsin registered nurse supply and demand forecasting model technical report 2011
97 Juraschek SP Zhang X Ranganathan V Lin VW United States registered nurse workforce report card and shortage forecast Am J Med Qual 201127(3)241-9
98 Malyon R Zhao Y Guthridge S Health workforce modelling Northern Territory technical report for the nursing workforce model In families Doha editor Northern Territory Government Australia2010
99 Murray J Forecasting supply demand and shortage of nurses in Tennesse Tennessee Center for Nursing Nursing TCf 2009
100 Al-Jarallah KF Hakeem SK Al-Khanfar FK The nursing workforce in Kuwait to the year 2020 Int Nurs Rev 200965-72
101 Ghosh B Cruz G Nurse requirement planning A computer-based model J Nurs Manag 200513363-71
102 Spetz J Forecasts of the registered nurse workforce in California University of California San Francisco 2009
103 Tomblin-Murphy G MacKenzie A Alder R Birch S Kephart G OBrien-Pallas L An applied simulation model for estimating the supply of and requirements for registered nurses based on population health needs Policy Polit Nurs Pract 2009 Nov10(4)240-51
104 Health Workforce Information Programme Health workforce projections modelling 2010 perioperative nursing workforce 2009
105 Moulton P Lang T North Dakota nursing supply and demand projections University of North Dakota 2008
106 LeVasseur SA Projected registered nurse workforce in Hawaii 2005-2020 2007 107 Health Resources and Services Administration Methods for Identifying Facilities and
Communities with Shortages of Nurses US Department of Health and Human Services 20071-20
108 Rosenbaum DI Ramirez JP The supply and demand for registered nurses and licensed practical nurses in Nebraska 2006
109 Moulton PL North Dakota nursing needs study Direct care supply and demand projections University of North Dakota 2003
110 Canadian Nurses Association Planning for the future Nursing human resource projections 2002
111 Srisuphan W Senaratana W Kunaviktikul W Tonmukayakul O Charoenyuth C Sirikanokwilai N Supply and requirement projection of professional nurses in Thailand over the next two decades (1995-2015 AD) 19971-12
112 Johnson WG Wilson B Edge M Qiu Y Oliver EL Russell K The Arizona health care workforce nurses pharmacists amp physician assistants Arizona state University 2009
93
113 Knapp KK Cultice JM New pharmacist supply projections Lower separation rates and increased graduates boost supply estimates J Am Pharm Assoc (2003) 2007 Jul-Aug47(4)463-70
114 Bond CA Raehl CL Patry R The feasibility of implementing an evidence-based core set of clinical pharmacy services in 2020 manpower marketplace factors and pharmacy leadership Pharmacotherapy 200424(4)441-52
115 Bond CA Raehl CL Patry R Evidence-based core clinical pharmacy services in United States hospitals in 2020 Services and staffing Pharmacotherapy 200424(4)427-40
116 Cooksey JA Knapp KK Walton SM Cultice JM Challenges To The Pharmacist Profession From Escalating Pharmaceutical Demand Health Affairs 200221(5)182-8
117 Johnson TJ Pharmacist work force in 2020 implications of requiring residency training for practice Am J Health Syst Pharm 2008 Jan 1565(2)166-70
118 Meissner B Harrison D Carter J Borrego M Predicting the impact of Medicare Part D implementation on the pharmacy workforce Res Social Adm Pharm 2006 Sep2(3)315-28
119 Knapp KK Shah BM Bamett MJ The pharmacist aggregate demand index to explain changing pharmacist demand over a ten-year period Am J Pharm Educ 201074(10)1-8
120 Koduri S Shah G Baranowski BA Utahs pharmacist workforce Utah 2009 121 Health Resources and Services Administration The adequacy of pharmacist supply
2004 to 2030 In services Dohah editor USA2008 p 1-61 122 Department of Health and Ageing Pharmacy workforce planning study Australia
Australian Government Ageing DoHa 2008 123 Fraher EP Smith LM Dyson S Ricketts TC The pharmacist workforce in North
Carolina University of North Caroline at Chapel Hill 2002 124 Knapp KK Quist RM Walton SM Miller LM Update on the pharmacist shortage
National and state data through 2003 Am J Health Syst Pharm 200562492-9 125 Knapp DA Professionally determinded need for pharmacy services in 2020 Am J
Pharm Educ 2002661-9 126 Health Resources and Services Administration The Pharmacist workforce a study of
the supply and demand for pharmacists In services Dohah editor USA2000 p 1-100
127 Whedon JM Song Y Davis MA Lurie JD Use of chiropractic spinal manipulation in older adults is strongly correlated with supply Spine (Phila Pa 1976) 2012 Sep 1537(20)1771-7
128 The future of chiropractic revisted 2005 to 2015 Institute for Alternative Futures 2005
129 Davis MA Mackenzie TA Coulter ID Whedon JM Weeks WB The United States Chiropractic Workforce An alternative or complement to primary care Chiropractic amp manual therapies 2012 Nov 2120(1)35
130 Davis MA Davis AM Luan J Weeks WB The supply and demand of chiropractors in the United States from 1996 to 2005 Altern Ther Health Med 2009
131 Medical laboratory technologists in Canada Canadian Institute for Health Information 2010
132 Laboratory medicine A national status report The Lewin Group 2008 133 Mirkopoulos C Quinn B Occupational therapy manpower Ontarios critical shortage
Can Assoc Occu Therap 198956(2)73-9 134 Salvatori P Williams R Polatajko H MacKinnon J The manpower shortage in
occupational therapy implications for Ontario Can J Occup Ther 199259(1)40-51
94
135 WRHA Occupational Therapy Workforce Analysis Winnipeg Winnipeg Regional Health Authority 2002 November 2002 Report No
136 Morris LV Occupational Therapy A study of supply and demand in Georgia The American Journal of Occupational Therapy 198943(4)234-9
137 Tuulonen A Salminen H Linna M Perkola M The need and total cost of Finnish eyecare services A simulation model for 2005-2040 Acta Ophthalmol (Copenh) 2009 Nov87(8)820-9
138 Kiely PM Healy E Horton P Chakman J Optometric supply and demand in Australia 2001-2031 Clin Exp Optom 2008 Jul91(4)341-52
139 Australian Institue of Health and Welfare Optometrist labour force 1999 Australian Institue of Health and Welfare 2000
140 Bellan L Luske L Ophthalmology human resource projections are we heading for a crisis in the next 15 years Can J Ophthalmol 20074234-8
141 Pick ZS Stewart J Elder MJ The New Zealand ophthalmology workforce 2008 Clin Experiment Ophthalmol 2008 Nov36(8)762-6
142 Zimbelman JL Juraschek SP Zhang X Lin VWH Physical Therapy Workforce in the United States Forecasting Nationwide Shortages PMampampR 20102(11)1021-9
143 APTA A model to project the supply and demand of physical therapist 2010-2020 Alexandria American Physical Therapy Association 2012 May 32012 Report No
144 Breegle GG King E Physical therapy manpower planning Projection models and scenarios of 1985 Phys Ther 198262(9)1297-306
145 Winnipeg Regional Health Authority Physiotherapy Workforce Analysis Winnipeg Winnipeg Regional Health Authority 2002
146 Wing P Langelier MH Workforce shortages in breast imaging Impact on mammography utilization Am J Roentgenol Radium Ther 2009 Feb192(2)370-8
147 Workforce risks and opportunities 2012 diagnostic radiographers Centre for Workforce Intelligence 2012
148 Medical manpower planning committee Hong Kong academy of medicine Minutes of the 10th Meeting of Committee 2011 18102011
149 Business Professionals Federation Hong Kong Health care manpower planning 2010 150 Dunn A Ng Annora Liem Kevin et al How to create a world-class medical system
2012 HKGolden50 151 Review on the regulation of pharmaceutical products in Hong Kong Legislative
Council Panel on Health Services 2010 152 Leung GM Tin KYK Chan W-S Hong Kongs health spending projections through
2033 Health Policy 2007 Apr81(1)93-101 153 Bartholomew DJ Forbes AF McClean SI Statistical techniques for manpower
planning John Wiley amp Sons 1991 154 Huber M Health Expenditure Trends in OECD Countries 1970-1997 Health Care
Financ Rev 19992199-117 155 Medical Council of Hong Kong Annual Reports Medical Council of Hong Kong
2012 Available from httpwwwmchkorghkannualreportshtm 156 The Medical Council of Hong Kong [cited 2012] Available from
httpwwwmchkorghk 157 Department of Health HK Health manpower survey on doctors Hong Kong 2004 158 Department of Health HK Health manpower survey on doctors Hong Kong 2005 159 Department of Health HK Health manpower survey on doctors Hong Kong 2006 160 Department of Health HK Health manpower survey on doctors Hong Kong 2007 161 Department of Health HK Health manpower survey on doctors Hong Kong 2009
95
162 Statistics and Workforce Planning Department Hospital Authority Statistical Report (2011-2012) Hospital Authority 20121-200
163 Bane F Physicians for a growing America Report of the surgeon generalrsquos consultant groups on medical education US Department of Health Education and Welfare 19591-95
164 Fraher EP Knapton A Sheldon GF Meyer A Richetts TC Projecting surgeon supply using a dynamic model Ann Surg 2013257(5)867-872
165 Greenberg L Cultice J Forecasting the need for physicians in the United States The health resources and services administrations physician requirements model Health Serv Res 199731(6)723-37
166 Harrison C Britt H General practice workforce gaps now and in 2020 Aust Fam Physician 201140(12)12-5
167 Tsai T-C Eliasziw M Chen D-F Predicting the demand of physician workforce An international model based on crowd behaviors BioMed Central Health Services Research 20121279
168 Al-Jarallah K Moussa M Al-Khanfar KF The physician workforce in Kuwait to the year 2020 The International Journal of health Planning and Management 2010 Jan-Mar25(1)49-62
169 Birch S Kephart G Tomblin-Murphy G OBrien-Pallas L Alder R MacKenzie A Human resources planning an the production of health A needs-based analytical framework Canadian Public Policy 2007331-16
170 Blinman PL Grimison P Barton MB Crossing S Walpole ET Wong N et al The shortage of medical oncologists The Australian medical oncologist workforce study The Medical Journal of Australia 2011196(1)58-61
171 Cooper R Perspectives on the Physician Workforce to the Year 2020 Journal of the American Medical Association 1995274(19)1534-43
172 Deal CL Hooker R Harrington T Birnbaum N Hogan P Bouchery E et al The United States rheumatology workforce supply and demand 2005-2025 Arthritis Rheum 2007 Mar56(3)722-9
173 Douglass A Hinz CJ Projections of physician supply in internal medicine a single-state analysis as a basis for planning Am J Med 199598(4)399-405
174 Van Greuningen M Batenburg RS Van der Velden LFJ Ten years of health workforce planning in the Netherlands a tentative evaluation of GP planning as an example Hum Resour Heal 20121021
175 Health Workforce Australia Health Workforce 2025 Doctors Nurses and Midwives Volume 1 Health Workforce Australia 2012
176 Lee P Jackson C Relles D Demand-Based assessment of workforce requirements for orthopaedic services The Journal of Bone and Joint Surgery 199880(A)313-26
177 McNutt R GMENAC Its manpower forecasting framework Am J Public Health 1981711116-24
178 Scarborough JE Pietrobon R Bennett KM Clary BM Kuo PC Tyler DS et al Workforce projections for hepato-pancreato-biliary surgery J Am Coll Surg 2008 Apr206(4)678-84
179 Scheffler RM Mahoney CB Fulton BD Dal Poz MR Preker AS Estimates of health care professional shortages in sub-Saharan Africa by 2015 Health Aff (Millwood) 2009 Sep-Oct28(5)w849-62
180 Scheffler RM Liu JX Kinfu Y Poz MRD Forecasting the global shortage of physicians An economic- and needs-based approach Bull WHO 200886(7)516-23
181 Shipman S Lurie J Goodman D The general pediatrician Projecting future workforce supply and requirements Pediatrics 2004113435-42
96
182 Smith BD Haffty BG Wilson LD Smith GL Patel AN Buchholz TA The future of radiation oncology in the United States from 2010 to 2020 Will supply keep pace with demand J Clin Oncol 2010 Dec 1028(35)5160-5
183 Starkiene L Smigelskas K Padaiga Z Reamy J The future prospects of Lithuanian family physicians A 10-year forecasting study BioMed Central Family Practice 2005 Oct 4641
184 Teljeur C Thomas S OKelly FD ODowd T General practitioner workforce planning assessment of four policy directions BioMed Central Health Services Research 201010148
185 Weissman C Eidelman L Pizov R Matot I Klien N Cohn R The Israeli anesthesiology physician workforce The Israel Medical Association Journal 20068255-9
186 Yang J Jayanti MK Taylor A Williams TE Tiwari P The impending shortage and cost of training the future place surgical workforce Ann Plast Surg 2013 (Epub ahead of print)
187 Health Workforce Information Programme (HWIP) Health workforce projections modelling 2010 perioperative nursing workforce 2009
188 Juraschek SP Zhang X Ranganathan VK Lin VW United States registered nurse workforce report card and shortage forecast Am J Med Qual 2011 May-Jun27(3)241-9
189 Knapp K Livesey J The aggregate demand index measuring the balance between pharmacist supply and demand 1999-2001 Journal of American Pharmacists Association 200242(3)391-8
190 Reiner B Siegel E Carrino JA McElveny C SCAR Radiologic Technologist Survey Analysis of technologist workforce and staffing J Digit Imaging 2002
191 Bingham D Thompson J McArdle N McMillan M Cathcart J Hodges G et al Comprehensive review of the radiography workforce Department of Health NI 2002
192 Patterson DG Skillman SM Hart LG Washington Statersquos radiographer workforce through 2020 Influential factors and available data 2004
193 Victorian medical radiations Workfroce supply and demand projections 2010-2030 Victorian Department of Health 2010
194 Bellan L Buske L Ophthalomology human resource projections are we heading for a crisis in the next 15 years Ophthalomology Human Resources 20074234-8
195 Australian Institute of Health and Welfare Optometrist labour force 1999 Canberra Australian Institute of Health and Welfare 2000
196 Kiely PM Horton P Chakman J The Australian optometric workforce 2009 Clinical amp Experimental Optometry 2010 Sep93(5)330-40
197 Lee PP Relles DA Jackson CA Subspecialty distributions of ophthalmologists in the workforce Arch Ophthalmol 1998116917-20
198 The clinical laboratory workforce The changing picture of supply demand education and practice Health Resources and Services Administration 2005
199 American Physical Therapy Association A model to project the supply and demand of physcial therapists 2010-2020 US American Physical Therapy Association 2012
200 Winnipeg Regional Health Authority Occupational Therapy Workforce Analysis 2002
97
Appendix A(i) Summary of manpower planning and forecasting models (Australia Canada Netherlands) Australia Canada Netherland
Context
- shorter working hours for all healthcare professionals - ageing population - increasing demand for services - workforce distribution
-
- utilisation-based planning failed to inform long-term workforce planning
- planning has been done in isolation which resulted in unintended impacts mismatch between need supply and demand
- costly duplication and inability to respond effectively to international issuespressure
- shortage of medical specialist and nursing personal
- steady growth in the healthcare workforce - increased feminization of the workforce and
contracted GPs - impact of migration on health manpower
planning
Objectives Strategic Directions
- ensure and sustain supply - optimise workforce and healthcare access - improve the healthcare work environment - enhance and coordinate health education vocational
training and regulatory sectors - optimise use of workforce skills and ensure the best
health outcomes - improve policy and planning to support the provision
of staff - improve collaborative effort between all stakeholders
- increase the number of qualified healthcare trainees - focus on productivity and effective use of skills - improve access to healthcare services address inappropriate
variation of health human resources - create healthy safe supportive and learning workplace - maintain an skilled experienced and dedicated workforce - more effective manpower planning and forecasting
- increase professional training - increase recruitment both to encourage staff to
return to healthcare workforce and to recruit from overseas
- retain staff by increasing support for staff and flexible working arrangements
- change skill-mix
Framework
- align education and training supply with workforce requirements
- improve workforce re-entry and ethical overseas recruitment
- support work culture and develop flexible working environments
- promote skills and competence initiatives - establish shared health workforce planning research
information sharing improve data collection - establish monitoring evaluation and reporting
processes - promote discussion and awareness amongst the
stakeholders and community
- assess population health needs demand for services including Aboriginal health needs
- develop implement and evaluate population need-based innovative service delivery and health human resource models
- enhance collaboration and provide evidence for HHR planning information
- align education curricula with health system needs and health policy
- provide opportunities for to life-long learning - develop a locally culturally and linguistically diverse workforce - accelerate and expand the assessment and integration of
internationally educated health professionals - enhance healthcare career attractiveness - address health and safety issues reduce work-related illnesses
injuries and absenteeism
- increase collaboration between local and international institution in medical training programmes
- increase training capacity staff retention and recruitment
- recruit healthcare professionals from within and outside EU
- develop flexible and family-friendly working patterns
- adjust the workloads for the older staff and retirement age
- provide learning and development opportunities
- improve skill mix use and transfer of function between different professional groups
- develop new roles and extend the range of work
Duration since 2004 (reviewed in 2011) since 2005 Since 2000s
98
Australia Canada Netherland
Method for supply demand
Supply and need-based model Demand - utilisation of health services Supply - number of hours worked per year by the number of male
and female health professionals in each age group - proportion of leavers and entries (graduates and migrants)
into the health professional field
Collaborative system design and population health need-based approach to planning Supply - actual number type and geographical distribution of regulated and
unregulated providers productivity and scope of practiceservice provided
- labour market indicators participation rate provider-to-population ratios demographic and educational characteristics of providers employment status and sectors
- death retirement emigration replacement general economic trends work incentives life-style choices
Demand - population health needs for both curative and preventive health
services
The Dutch Simulation and Forecasting Model (supply-based) confronted with 4 scenarios - Scenario 0 unfulfilled demand for
care + demographical developments - Scenario 1 Scenario 0 + non-
demographical developments - Scenario 2 Scenario 1 +
developments in working hour - Scenario 3 Scenario 2 + vertical
substitution
The Dutch Policy and Planning Model - a multi-stakeholder and multi-
process consensus model - based on simulation model that
generates GP training inflow advice yearly allocation of funding and resources and unplanned external factors to project GP workforce in coming years
Assumptions
Demand - time required for treating different conditions is binary - linear growth in demand - demand model ignores labour substitution Supply - no change in technology - workforce entrance and exits hours worked are
disaggregated by age and sex groups General - no interactions between the supply and demand models - no supplier-induced demand
- current supply of providers meet the current demand - observed trends are used to project future population size and
demographic profile - future age and sex-specific resources remain constant
- historical trend continues - other projection of population
growth political and technical changes is on the right direction
99
Australia Canada Netherland
Formulae
Demand Dt = βstactivitysimplet + βctactivitycomplext Dt Demand at a specific time activitysimple simple utilisation activitycomplex complex utilisation Each activity has a coefficient βst and βct with βst lt βct relating activity into demand for full-time equivalent health professional hours at time t Dt Supply St = Σg[βgmalemaletg + βgfemalefemaletg]maletg = (1-βloss
gmale) malet-1g + malegradstg + malemigrantstgfemaletg = (1-βloss
gfemale) femalet-1g + femalegradstg + femalemigrantstg St supply of labour hours in year tg age groups βgmale and βgfemale coefficients that represent the number of hours worked βloss
gmale and βloss gfemale proportion of the workforce loss every
year malegradstg and femalegradstg number of graduates malemigrantstg and femalemigrantstg number of migrants
Modelling utilisation and predicted used based on needs
Allocation of resources
yi utilisation for individual i Aij vector of age-sex dummies Xik vector of additional needs indicators Zil vector of non-need determinants of utilisation Rim dummy variables for regions β λ γ δ oslash estimated coefficient vectors Nr per capita resource need for residents of each allocation regionw the survey sample weight for each individual i wi survey sample weight for individual
- Required supply in year T vs Required supply in year X =gt development required supply until T+X
- Available supply in year T + Development available supply until T+X =gt Available supply in year T+X
100
Australia Canada Netherland
Key factors used
- numbers in the workforce in a given year (by age and sex)
- proportion of individuals leaving workforce by sex
- number of graduates and migrants - utilisation of healthcare services
- actual and perceived population health status socio-economic status - demographics - health behaviours - social cultural political contextual geographical environmental - financial factors - categoriesrolescharacteristics of health workers and services source
of supply - production (education + training) target vs actual needs projected - management organization and delivery of health services (indirectly
contribute to outcomes) formalizationcentralization environmental complexity amount and quality of care provided costs associated with delivery of services and outcomes
- resource deployment and utilisation - health outcomes eg mortality data hospital discharge life
expectancy and disease incidence (depends on communitys situation)
- available supply of GPs (total full-time equivalent)
- unfulfilled demand for care - number of GP in training - inflow from abroad - outflow (malefemale amp projection year) - return on training - labour market return - epidemiological developments - socio-cultural developments - technical developments - substitution
Limitations Challenges
Demand - binary case-mix - linear demand growth - constant returns - no labour substitution Supply - no changes in technology - disaggregated by age and sex General - independent supply and demand - no supplier-induced demand
- require extensive data =gt difficulties in management and maintenance of data collection delivery system
- lack of consistent information on health human resource productivity workload utilisation demand and efficacy and information about educational facilities
- capacity to assess health needs and forecast demand for health human resources- funding for ongoing data and modelling initiatives
- compliance vs flexibility and autonomy of localregional planner with national strategies
- updating model is difficult - the model is more likely to project unattainable service and staff
targets
- technically complex many parameters heuristics sub-models and data source
- politically complex multiple policy discussions and stakeholder involvement
- intentionally complex long-term planning short-term acting frequent updating
Organisation
National Health Workforce Taskforce Australian Health Ministries Advisory Council (httpwwwahwogovauindexasp)
wwwhc-scgcca (Health Canada) NIVEL (the Netherlands Institute for Health Services Research ) httpwwwnivelnl Dutch Ministry of Health Welfare and Sport Dutch Health professional organizations and labour unions
101
Appendix A(ii) Summary of manpower planning and forecasting models (New Zealand Scotland United Kingdom) New Zealand Scotland United Kingdom
Context
- increasing burden of chronic diseases - lack of collaboration in planning and implementation of health
workforce - mental health rehabilitation and aged care are an emerging a
problem
- increase the size of healthcare workforce - aging healthcare workforce - workforce is predominately female and predominately
working fulltime
A number of changes in the UK population service delivery model and healthcare workforce
- demographic - a growing aging population - NHS funding and budgets - service plans and reconfiguration - policy (locus of care from hospital to community
from NHS to non-NHS) - legislative and regulatory framework - professional education - role definition for each of the professions
Objectives Strategic directions
- innovative approaches to workforce development - enhance communication - sector relationships - build a responsible and rational workforce development
investment plan (set workforce development priority for mental health rehabilitation and aged care)
- support the healthcare workforce boards and policy makers
- develop and implement multi-disciplinary and multi-agency models of care which are more responsive accessible and joined up to meet the needs of local communities and ensure efficient utilisation of skills and resources
- motivate employees to improve their performance provide opportunities for them to develop and contribute more
- promote the benefits of preventative action and measures of self-care for patients and public across a range of health issues
- maximise and wider access to education and training especially for those at underserved areas
- engage with health sector employers to ensure the authoritative sector voice on skills and workforce development for the whole sector
- inform the development and application of workforce policy through research and the provision of robust labour market intelligence
- implement solutions which deliver a skilled flexible and modernised workforce capable of improving productivity performance and reducing health inequalities
- champion an approach to workforce planning and development that is based on the common currency of national workforce competences
Framework
- increase number of healthcare professionals - train and recruit more health professionals with generic skills
to increase flexibility and respond to the increasing shift towards primary and community-based models of care and integration between institutional and community settings
- improve workforce activity linkages in health system collaboration and economies of scales
- develop regionally aligned approaches to professional training and career planning
- enable health professionals to take on new tasks responsibilities opportunities for further development and career satisfaction
- partnership with professional groups to support delivery and development of services
- support professional groups to achieve their full personal and professional potential
- funding arrangement for professional development and continuing education
- encourage sharing between professional groups and learning from each others across national regional sectors
- provide guideline for better care delivery models encourage innovative approaches
- fund professional development courses - develop better evidence base to inform policies and
strategies to help promote retention of staff
- develop workforce plans and strategies for investment
- commission undergraduate training and clinical placements
- manage post registration and post graduate training - invest in continuing professional development - train and develop wider healthcare workforce esp
nurse and other ancillary team - allocate and monitor investment of education and
training funds - collaborate at all levels of the system to plan and
develop the workforce for quality
Duration HWAC since 2000 HWNZ since 2009
since 2000s since 2000s
102
New Zealand Scotland United Kingdom
Method for supply demand
Primary Healthcare Nursing projection modelling (demand-based) Supply - projected proportion and distribution of healthcare
professionals by age sex geographic - entrants to and graduates from education and training
programme - retirement mortality career change disability of healthcare
workforce Demand - population growth projections by age gender and ethnicity - population health needs - historical current and future changes of services provided - anticipated development of and changes in-patient care
practice
Demand and supply-based plan Demand - rate of general practitioners - patients contact by sex and
age (estimated by changes of characteristics of population)
- working time targets and standards and real practice - working time regulations - service utilisation - service levels Supply - destination of GP registrants (age profile gender profile) - growth of GPs training
No single modelmethod used but various in term of regional and local level Example England - NHS Workforce Review Team conduct a pilot
study to develop demand-side modelling (initially for mental health service) (England)
- London Strategic Health Authority used scenario-based workforce modelling (demand-based)
- 6-step Workforce Planning Model (NHS South West) (supply and demand)
Northern Ireland - review of each professional group every three
years planstrategies were made based on supply and demand
- impact of current and emerging technologies Scotland - based on Student Nurse Intake Planning project
aligned with NHS and non-NHS employers projection (supply)
- utilisation of service from Management Information and Dental Accounting System database (demand)
Wales - annual approach will be based on national unit
linked to local planning process (supply)
Assumptions
- past trends define future trends - demand will increase at twice the rate of population growth
- estimated numbers based on average calculation of past trend and prediction of change of care delivery models technology
- significant work has been undertaken to ensure that workforce targets are consistent with the available resources
- each model applied holds different assumptions
Formulae
Supply = Headcounts + net inflow (inflow less outflow) (calculated for each workforce areas)
Demand = [population growth] [type of service] [care delivery models] [impact of current and future technologies]
Projected demand (Whole time equivalent) = current demand yearly growth rate
Required supply = estimated adequate ratio of supply to demand projected demand
Supply=current headcounts + net inflow Demand = population dentist-to-population ratio
103
New Zealand Scotland United Kingdom
Key factors used
- projection of population growth by age sex - population health needs based on all types of healthcare
services - burden of disease - technology development - models of care - projection of healthcare workforce growth according to
- workforce dynamics (characteristics of workforce development)
- demographic changes - technology development - payment scheme - utilisation (service-based) - shrinkage (leave mortality retirement)
Depends on model used Example - number of student intake for a professional
training retirement change of professions expansion
- financial planning for education and training
population growth - entries to and exits from healthcare workforce - analysis of occupations specialty - education and training sources
- international recruitment - health indicators demographic and socio-
economic status
Limitations Challenges
- difficult to collect and monitor data - lack of financial support in services at rural areas and which
make coordination between care centres difficult - difficult to evaluate impact of policy changes and health
outcomes
- relies on pre and current data - quality of data is an issue - lack of collaborative approaches to workforce planning
- lack of supply-side modelling - lack of linkage between supply and
demand projections - potential deficit in current workforce-
planning capacity at regional level - most Strategic Health Authorities focused
on improving the process rather than planning capacity
Problems in the system - too top-down management- service
financial and workforce planning are poorly integrated
- poor data to project funding arrangement - medical workforce planning and
development is done largely in isolation - lack of long-term strategic commission - quality of education training recruitment
Organizations
Health Workforce Advisory Committee (HWAC) httpwwwhealthworkforcegovtnzabout-health-workforce-nzpublications-and-reports Workforce Services Reviews
NHS Scotland National Workforce Planning Department of Health Centre for Workforce Intelligence (httpwwwcfwiorguk) Skills for Health
104
Appendix A(iii) Summary of manpower planning and forecasting models (Japan Singapore USA) Japan Singapore USA
Context
- shortage of physicians - mal-distribution of medical
practitioners in some areas - ageing population - ageing workforce - mismatch of supply-demand
in some areas
- high density of doctors but reported shortages in the public sector due to the low pay and long working hours compared with the private sector
- promote medical tourism - import medical workforce esp nurses and doctors from
Philippine and Indonesia - most of doctors in Singapore are foreign-trained
- shortage in primary care service and staff - nursing shortage - geographical variation in service - inappropriate funding plan - increased demand professional training program
Objectives Strategic directions
- to project the demand and supply of healthcare professionals
- increase medical and other healthcare professional training
- improve working environment and benefits to attract more overseas healthcare workers
- develop programmes to recruit and retain healthcare workforce (esp professional Development)
- strengthen the Nations Health and Human Services Infrastructure and workforce
- invest in the HHS workforce to meet Americans health and human service needs today and tomorrow
- ensure that the Nations healthcare workforce can meet increased demands
- enhance the ability of the public health workforce to improve public health at home and abroad
- strengthen the Nations human service workforce
Framework
- train and recruit more health professionals to respond to the increasing shift towards elderly care and integration between institutional and community settings
- enable health professionals to take on new tasks responsibilities opportunities
- Healthcare Manpower Development Programme for Intermediate and Long-term Care (since 1980)
- funding for advanced training skill of local staff (local or overseas institution)
- funding for visiting experts lecture fellowship programme
- set up websites to attract more foreign healthcare workers
- fund medical training scholarships and loan repayment programmes - focus on human capital development - innovative approaches to recruiting training develop retain and
support a competent workforce - monitor and assess the adequacy of the Nations health professions
workforce - work with states to develop systems for the training and ongoing
professional development and opportunities for developing professional skills
- improve the cultural competence of the healthcare workforce - foster the use of evidence-based practices in human services to
professionalize the field - establish regular evaluation supervision of supply and demand of
healthcare workforce to inform professional development and future action
Duration since 2000 since 2006 since 2006
105
Japan Singapore USA
Method for Supply Demand
Utilisation and supply-based approach
- current and past trend of utilisation (esp for aging care)
- expenses related to healthcare
- education and training sources
- healthcare professionals to population ratio Doctors to population ratio 1620 (2008) 1600 (2009) 1580 (2010) 1550 (2011)
Nurse to population ratio 1200 (2008) 1190 (2009) 1170 (2010) 1160 (2011)
- supply-based model was used to project healthcare workforce
Utilisation and supply-based model Supply - size and characteristics of current workforce (age gender work-hours retirement
distribution active in-patient care or other activities such as teaching research) - new entrants and choice of medical specialty - separation from the physician workforce (retirement mortality disability career
change) - physicians productivity hours spent providing patient care number of patients
seen resource-based relative value scale Demand
- population development - advancing medical
technology - changing treatment
patterns - labour market trends
- population growth - medical insurance trends - economic factors - physician to population ratio - technology policy changes
Assumptions
- population projections current patterns of employment and supply
- models used are susceptible to measurement error
- assumption current patterns of new local and non-local graduates
- rates of demand will remain
- baseline assumption current patterns of new graduates specialty choice and practice behaviour continue
- distribution of physicians in-patient-care and other activities remains constant
Formulae stock and flow methods
- The healthcare workforce (doctors nurses pharmacists dentists and allied health professionals) will need to be increased by more than 50 by 2020
- Factors being considered include ageing and growing population and increasing number of healthcare infrastructure On the supply side local and overseas graduates and role extension of healthcare professionals were considered
Physician Supply Model P(y+1) = P(y) + Pa - Pi + Pn P(y+1) physicians supply in the year y+1 P(y) physicians supply in the year yPa physicians remain active Pi physicians inactive retired dead or disable Pn new physicians graduated from US medical school or international institutions The model also generates Full-time equivalent (FTE) physicians which is defined as the average hour annual hours worked in-patient care per physician in baseline year Physician Requirement Model - Physicians Requirements = [Population projections by age sex and metronon-
metro] x [Insurance distribution by age sex and metronon-metro] x [physicians per population ratio by age sex and metronon-metro insurance and specialty]
106
Japan Singapore USA
Key factors used
- population growth rate - healthcare workers to
population ratio - utilisation indicators
- number of physiciansnurses - inflow and outflow of healthcare workforce - population growth rate - medical education and training registrants
Physician Supply Model - number of physicians in the preceding years (starting with the base year
2000) - number of new US medical students International medical students - attrition due to retirement death and disability Physician Requirement Model - population projections by age sex and metropolitannon-metropolitan
location - projected insurance distribution by insurance type age sex
metropolitannon-metropolitan location - detailed physician-to-population ratio
Limitations Challenges
- slow adoption of new approaches across healthcare systems
- loose control over supply and demand factors due to no central authority
- difficulty in funding allocation
- past history may not adequately reflect future requirements - limited variables include in the analysis - overly reliant on ability to recruit non-local professionals
- numerous variables included in the analysis =gt difficult to control =gt uncertainty about adequacy of the analysis
- no single entity in US in charge of workforce planning-- lack a cohesive approach to workforce shortage
Organisation
Ministry of Health Labour and Welfare Human Resource Development Bureau
Ministry of Health Human Resource Advisory Board
US Department of Health and Human Services (httpwwwhrsagovindexhtml) American Society for Healthcare Human Resources Administration (ASHHRA httpwwwashhraorg)
107
Appendix B Manpower planning literature by healthcare professional group
Doctors
Author year Design model type analysis
Parameters included (population level or individual level)
Outcomes Assumptions amp Limitations
Supply models Bane et al 1959 Stock and flow Graduates bullNumber of physicians per 100000 bull Estimates of future needs were projected through (163) approach Number of physicians
Retirees Work locations
people bullTotal output
analysing the utilisation of services growth of new types of services
Craig et al 2002 (74)
Trend analysis Number of specialist anaesthesiologists by age as of January 1 2000 Annual certificate numbers 1971-2000 Estimated needs for anesthesia provider 1999 amp 2006
bullNumber of required FTEs bullNumber of FTE deficits
bull Assumption that each anaesthesiologist provides 1 FTE to anaesthesiology workforce underestimates requirement bull Does not account for anaesthetic service provided by non-specialist practitioners
Fraher et al 2013 (164)
Stock and flow approach
Graduate medical education pipeline Length of training by specialty Re-entry Attrition (Death retirement and career breaks) Age Sex Hours worked in-patient care by age and sex
bullHeadcount of surgeons by age sex and specialty in the United States from 2009 to 2028 FTE of surgeons by age sex and specialty in the United States from 2009 to 2028
bull Does not cover the complementary of physician assistant and nurses bull FTE contributions to patient care were adjusted downward significantly after the age of 65 years bull FTE by age and sex retirement rates workforce re-entry patterns and attrition from training stay the same in different specialties bull Only focus on overall supply
108
Author year Design model type analysis
Parameters included (population level or individual level)
Outcomes Assumptions amp Limitations
Fehring et al 2010 Stock and flow Age bullProcedural shortfall bull Selection and information bias through the use of (71) approach Retirement
Graduates Number of total knee and total hip arthroplasties performed per month Historical incidence of arthroplasty
estimates that are based on survey data bull Assumption of baseline scenario and conservative scenario for retirement bull Assumption of baseline scenario and conservative scenario for incidence bull The number of residents entering the workforce will be stable bull All the surgeons will perform joint arthroplasty at the same rate no matter their experience
Hilton et al 1998 Stock and flow Number of current supply of bullTotal number of office-based bull Limited effect of growth in demand on current number of (75) approach physicians
Number of new trainees Number of licensees expected Retirement Population Number of office-based physicians Hospital-based physicians Specialties vs primary care physicians Other activities
physicians per 100000 population in 2001 amp 2006 bullThe number of primary care physicians per 100000 population in 2001 amp 2006 bullThe number of specialist per 100000 population in 2001 amp 2006
physicians to 1year bull Limited retirement and other losses to 3year Assume 70 retention rate of trainees bull 12 of population increase annually
Joyce et al 2006 Stock and flow Current supply in baseline bullFTE clinicians (per 100000) bull Estimate of parameters used in the model might not be (67) approach New graduates
Immigrants Re-entrants Death Retirements Attrition exits Movement between occupations Number of hours worked per week by age (5-year bands) and sex
bullFTE GP (per 100000) bullFTE Specialist workforce (per 100000)
accurate ndash question of data quality
109
Author year Design model type analysis
Parameters included (population level or individual level)
Outcomes Assumptions amp Limitations
Koike et al 2009 (72)
Trend analysis using multistate life table
Specialty Impact of further increase of female physicians Age groups Place of work
bullHeadcount of estimated numbers of physicians by specialty
bull The characteristics and status of physicians will continue in the future bull Does not project the FTE number
Miller 1993 (76) Stock and flow approach
Age distribution Number of otolaryngologists Number of otolaryngologists entering practice Death rates Retirements Current production of residents
bullHeadcount of otolaryngologists bull Older-than-65 group was excluded from further analysis
Satiani et al 2009 (73)
Stock and flow approach using population and workload analysis
Current number of certified Vascular surgeons Number of newly certified per year Retired numbers per year Operations needed per 100000 people Average number of procedures performed per VSN
bullPopulation analysis Shortage of surgeons in percentage bullWorkload analysis Shortage of surgeons in percentage
bull Surgeon to population ratio maintained for the 40-year period number of operations performed annually remain the same number of years in training remain unchanged
Demand models Craig et al 2002 (74)
Needs-based model Per capita utilisation by age and sex Population projection by age and sex Time spent on providing clinical anaesthesia services
bullFTE of physicians bull Lack of direct data on non-clinical anaesthesiologists bull Assume that one full-time full-year anaesthesiologist equals to 175000 units of demand bull Assume that the supply meets the demand in the base year
110
Author year Design model type analysis
Parameters included (population level or individual level)
Outcomes Assumptions amp Limitations
Etzioni et al 2003 (11)
Demandutilisation based model
Population by age Age-specific rates of surgical procedures Relative value units (RVUs)
bullForecasted percept increases in Work RVUs by specialty
bull Estimate workloadproductivity bull Assume that the surgical demand by age and sex will be stable
Greenberg et al 1997 (165)
Demandutilisation-based model
Current utilisation rates for ambulatory and in-patient medical Specialty services by gender race age group insurance status Population by gender race and age
bullPhysician headcount required in 2020
bull Recent trends will continue into the future
Harrison et al 2011 (166)
DemandUtilisation-based model
Number of general practice consultations by age and gender Length consultations Population projection
bullIncrease in GP utilisation bullAdditional GPs required
bull Assume that GPs would work similar average hours per week bull Assume that current primary care model and structure of general practice will remain the same
Tsai et al 2012 (167)
Regression-based physician density model
Mortality rate (under age 5) Adult mortality rate Life expectancy Fertility rate Literacy Population density Age structure Economic growth Expenditure on health
bullUnder the model countries were labelled as Negative discrepancy or Positive discrepancy
bull Cannot use the absolute number to suggest for correction in the healthcare workforce bull Only be used for warning signs of workforce discrepancy
Mixed models Al-Jarallah et al 2009 (168)
Supply trend analysis Demand benchmark
Population projections Physician-to-population ratios The average rate per annum for Kuwaiti physicians and non-Kuwaiti physicians
bullNumber of indigenous physician and non-native expatriate physician bullProjected requirement for physician bullDisparity between need and actual number of physicians
bull Projecting demand and supply over a long period leads to uncertainty did not study age and structure of the physician workforce due the lack of data
111
Author year Design model type analysis
Parameters included (population level or individual level)
Outcomes Assumptions amp Limitations
Barber et al 2010 Supply stock and flow Number of students admitted to bullTotal FTE of medical specialists bull Supply model realistic entry parameters (69) approach
Demand demandutilization-based model
medical school Number of residencies available for each specialty The mandatory retirement age Immigration rate by specialty Growth rate for specialists demand Growth in population
needed bullRatio specialists100 000 inhabitants bullDeficitsurplus specialists in percent
bull Demand model lack normative standards assume appropriate staff number
Birch et al 2007 Supply stock and flow Number of provider by age and sex bullHeadcount of the providers bull Assumption of different needs scenarios to look at how it (169) approach
Demand needs-based framework using Vensim 2002 simulation model
Time spent in the production of services Size of population by age and sex Provider-to-population ratio by age and sex of population group Number of services required by age and sex Demography Level of service Epidemiology Intensity of work Technological inputs Inputs of other types of professionals
bullFTE of the providers bullNeed follows observed trends by different policy changes
will affect the physician workforce
112
Author year Design model type analysis
Parameters included (population level or individual level)
Outcomes Assumptions amp Limitations
Blinman et al 2012 Supply stock and flow Headcount by nature of practice bullSupply demand and shortfall of bull Only the clinical workload of MOs related to (170) approach
Demand demand-based model
Current supply Population National chemotherapy utilisation rate Optimal workload of new patients seen per FTE MO per year Number of retirement Overseas and local training MOs
FTE medical oncologists (MOs) bullChemotherapy utilisation rate
chemotherapy was included some responses were estimated than counted lead clinicians were surveyed rather than individual MOs
Chang et al 2008 Supply stock and flow Number of new entrants bullFTE supply demand bull Assume the probability of wastage for general doctors (68) approach
Demand needs-based model
Current manpower and demographics Withdrawals by nephrologists (eg retirement death and turnover to other subspecialties) Population Incidence and prevalence of ESRD and treatment modalities
and internists are small and therefore ignored
Cooper 1995 (171) Supply dynamic model Demand demandutilisation-based model
Medical students Retirement Size of workforce Utilisation from HMOs Aging Technology Productivity Demographic factors Population
bullFTE physician100000 population (supply and demand)
bull Supply limited by predictions concerning the future number of USMGs and IMGs bull Demand uncertainty of technology data reliability from HMOs HMOs data not representative of the nation as a whole
Deal et al 2007 Supply stock and flow Healthcare utilisation - age amp sex bullNumber of rheumatologists bull Supply and demand for rheumatology services are in (172) approach
Demand demandutilisation-based model
Population projections Retirement Mortality rates Hours of work Number and fill rates of fellowship slots
supplied and needed by sex age and specialty
equilibrium the number of fellow position will remain static gender differences will remain static
113
Author year Design model type analysis
Parameters included (population level or individual level)
Outcomes Assumptions amp Limitations
Douglass et al Supply dynamic Past and current Connecticut non- bullFTE supply bull Currently available data for specific specialties 1995 (173) model
Demand needs-based model
federal internist supply Present and future Connecticut internists supply and need Contribution of non-physician providers
bullFTE need bull Uncertain flow of physicians in and out of the province bull Classifying specialty based on service provision bull Calculate the supply and need in Connecticut base on the share of US supply and need
Greuningen et al Supply stock and flow Graduates Attrition bullNumber of health professionals bull The basic scenario assumed that the demand will increase 2012 (174) approach
Demand estimation Demographic developments Epidemiological developments Socio-cultural developments Change of working hours Technical developments Developments regarding efficiency Developments regarding substitution
bullTotal FTE of health professionals by 60 due to the demographic developments from 2009-2019 bull The parameters on the demand side were estimated by experts however it was not clearly explained how they were being estimated
Health Workforce Supply stock and flow Graduates bullHeadcount of supply demand and bull Different assumption based on demand scenario 2025 Volume 1 approach Re-entry gap 2012 (175) Demand
demandutilisation-based model
Working hours Migration Attrition (Death retirement amp career change) Age Gender Utilisation rates
bullFTE of supply demand and gap
HRSA 2008 (63) Supply stock and flow model Demand Demandutilisation-based approach
Number of physicians age amp sex Graduates Retirement and mortality by age and sex Disability and career change Direct patient care hours Population projections Insurance distribution
bullFTE active physician bullIncrease in demand due to aging and growth
bull Limitations include using historical data to estimate future trends bull Assume insurance coverage and type economic growth and the increased use of NPCs
114
Author year Design model type analysis
Parameters included (population level or individual level)
Outcomes Assumptions amp Limitations
Lee et al 1998 Supply dynamic Surgeon population bullFTE supply bull Need for large amounts of data (176) model
Demand needs-based model
Time spent in direct care Entry rates of residents Retirement and mortality rate Number of office visits Duration of office visit Number of procedures Duration of procedures
bullFTE demand bull Accuracy of estimation bull Time and FTEs used as common measure for both supply and demand might be vulnerable to changes in real-life practice and structure of work bull Not able to address distributional issues
McNutt 1981 (177) Supply dynamic model Demand demandutilisation-based model
Medical graduates Practitioner supply Attrition rates Morbidity Prevention Delphi panel rates
bullHead count of physicians supplied and required by each specialty (Only talked about the concept and analytic framework of the GMENAC model)
bull Relied heavily on the Delphi panel to project future demandutilisation
Scarbrough et al Supply stock and flow Attrition (Death and retirement) bullAnnual volume of HPB bull Reliance on a series of assumptions to determine the 2008 (178) approach
Demand needs-based model
Annual volume of Hepatic-Pancreatic-Biliary (HPB) procedures Annual number of new HPB subspecialist Level of fellowship training Practice patterns of graduating fellows
procedures per subspecialist in 2020 bullAnnual HPB procedure volume per subspecialist in 2020 at current level of fellowship training bullNumber of fellows needed to train each year to meet demand for HPB surgery
current number of practicing HPB subspecialists and the current level of fellowship training bull Assume that none of the fellowship-trained HPB subspecialists first entering the workforce in 2007 would retire die or change fields before 2020 bull Different scenarios for the projected number of fellows needed to train per year to meet the demand for HPB procedures
Scheffler et al Supply trend analysis Number of physicians by country bullHeadcount supply demand bull Poor data quality in Africa which could undercount 2009 (179) Demand needs-based
model Projected population shortage healthcare professionals especially in the private sector
bull Supply of physicians is provided from previous estimates and data (Scheffler et al 2008)
Scheffler et al Supply trend analysis Historical data on physician bullSupply - per capita physicians bull Need estimated only reflects one aspect of healthcare 2008 (180) Demand needs-based
model and demand-based model
numbers 1980-2001 Updated physicians numbers Economic growth Historical and projected population Need-based benchmark live births
bullThe required headcount of physicians to reach the world health report 2006 goal bullDemand for physicians in each country by headcount bullDeficit or surplus by headcount
delivery bull Projection of demand and supply rely on trends of either economic growth or physician per capita
115
Author year Design model type analysis
Parameters included (population level or individual level)
Outcomes Assumptions amp Limitations
Shipman et al 2004 Supply stock and flow Number of paediatricians by age bullFTE General paediatricians bull Uses different key assumptions for projection mainly (181) approach
Demand benchmark and sex Annual number of graduating trainees by age and sex International medical graduates (IMGs) Death and retirements Population Current proportion of outpatient office visit by children to paediatricians Productivity Change in work effort
bullChild population have a set rate for different variables bull Assume that 25 of noncitizen IMGs will not stay in the US workforce after completing training
Smith et al 2010 Supply stock and flow Age- sex- race- population bullTotal number of patients receiving bull Extent the current supply of oncologists can (182) approach
Demand demandutilisation-based approach
projections Age- sex- race- radiotherapy utilisation rates Age-stratified and sex-stratified life-tables Number of current board-certified radiation oncologists 2009 residency graduates and 2010 to 2013 expected to graduates Age- and sex-stratified proportion of radiation oncologists practicing full time part time and not practicing
radiation therapy in 2020 bullFTE radiation oncologists in 2020 bullSize of residency training classes to have supply equal demand
accommodate increased patient volume bull Estimate of modest changes in radiation therapy practice patterns may impact patient throughout without compromising quality future technologies
116
Author year Design model type analysis
Parameters included (population level or individual level)
Outcomes Assumptions amp Limitations
Starkiene et al Supply stock and flow Population projections bullFTE-to-population ratio by bull Used different assumptions to manipulate supply and 2005 (183) approach
Demand needs-based model and demandutilisation-based model
Mortality Retirement Migration Drop out from training Enrolment numbers of trainee
different scenarios in supply and demand
demand scenarios bull Retirement Scenario 1 The retirement age was set to be 66 years and it was assumed that one fifteenth of the group of FPs aged more than 50 years would retire annually bull Retirement Scenario 2 The retirement age was set to be 71 years and it was assumed that one fifteenth of the group of FPs aged more than 55 years would retire annually
Teljeur et al 2010 (184)
Supply stock and flow approach Demand demandutilisation-based approach
GP visit rates Age-sex rates of GP attendance Population projection 2009-2021 Mortality rate for higher professionals Work practice Services provided Practice structure Overseas graduates Educationtraining Retirement Nurse substitution
bullGPs needed to meet population demand bullGP numbers by different supply scenarios
bull Nurse substitution Scenario 1 Nurses were equivalent to 025 FTE GPs bull Nurse substitution Scenario 2 Nurses were equivalent to 05 FTE GPs bull Assume that the number of GP vocational training places would increase by 20 in 2011 bull Later retirement has been considered bull Lack of regional data resulted in failing to test potential impact of each intervention on geographical differences
117
Author year Design model type analysis
Parameters included (population level or individual level)
Outcomes Assumptions amp Limitations
Weissman et al Supply stock and flow Age and sex distribution of bullAnaesthesiologists per 100000 bull Based on status quo of 108 anaesthesiologists per 2006 (185) approach
Demand needs-based model and demand-based model
anaesthesiologist population Employment status (full-timepart-time) Country of medical school education Last anaesthesiologist residency Professional status (resident certified specialist anaesthesiologist) Medical school academic appointment Historical and projected age distribution and birth rate of the Israeli population Immigration data on physicians Physicians required per capita Number of surgeries per anaesthesiologist
population bullNew anaesthesiologists needed
100000 population
Yang et al 2013 (186)
Supply stock and flow approach Demand population-based analysis
Population growth Number of plastic surgeons certified in 2010 Retirement Graduate Growth of the number of invasive and non-invasive cosmetic procedures
bullHeadcount of practicing plastic surgeons bullHeadcount of plastic surgeons needed
bull Only focus on plastic surgeons in US bull The number of new graduates would be constant bull The number of trainee positions would be static bull All practicing plastic surgeons would retire after 35 years post residency work
118
Nurses
Author year Design (Model type analysis)
Parameters included (population level or individual level)
Outcomes Assumptions amp Limitations
Supply model Buerhaus et al 2000 Using retrospective Forecast of US population through bullSupply projection 2001-2020 bull Future cohorts will enter nursing at a rate similar to (93) analysis of employment
trends to project long-term age and employment of RNs (Trend analysis)
2020 by age The propensity of individuals from a given cohort to work as RNs The relative propensity of RNs t work at a given age
bullAnnual FTE employment of RNs in total and by single year of age
current cohorts bull Changes of the workforce over time only depend on the age of the cohort
National Health Dynamic model Annual growth in 3 year pre reg bullNumber of registered nurses in bull Annual growth in 3 year pre registration commissions System 2008 (92) commissions
FTEHead count Attrition New registrants International recruitment Return to practice change Other joiners Other leavers
2008-2016 based on WRT assumptions bull FTEHead count based on historic trend bull International recruitment based on 3-year average
119
Author year Design (Model type analysis)
Parameters included (population level or individual level)
Outcomes Assumptions amp Limitations
Demand models Ghosh et al 2005 Computer-based model In-patient units bad capacity bullOverall nurses required adjusted bull No variation included all parameters are constant over (101) given certain prescribed
patient-nurse ratios (Benchmarking)
bed occupancy rate and the percentage share of patients in each unit according to an accepted patient classification system Outpatient Department Required physical allocation Total OPD working days in a year Total working daysnurseyear Operating theatres planned OT shifts per week number of weeks per year nurses per OT per shift Total working daysnurseyear AampE Nursesshift Number of shifts in a day Number of days in a year Total working daysnurseyear Renal dialysis Number of sessionsstationweek Number of stations Number of weeks in a year Nursestation Total working daysnurseyear Sickness maternity amp deputation leave
for sickness maternity amp deputation leave
years
120
Author year Design (Model type analysis)
Parameters included (population level or individual level)
Outcomes Assumptions amp Limitations
Mixed models Al-Jarallah et al Supply Supply Workforce projection 2007-2020 bull Changes in healthcare policies or nursing education can 2009 (100) Dynamic model
Demand Projected by using the average nurse-to-population ratio for 1994-2006 (Benchmarking)
Graduates
Demand Population growth Nurse-to-physician ratio
Supply bullNumber of nurses
Demand bullNumber of nurses needed
greatly affect the workforce
Auerbach etal Supply Hours worked Supply bull Different assumption used for various scenarios to 2012 (94)
Demand Utilisation-based model
Utilisation of services Sector Education Marital status Age group Poverty Insurance status Raceethnicity classification Number of RN and NP
bullNumber of Nurse Practitioners (NP) and RN specializing in SRH
Demand bullUtilisation of SRH services
predict the workforce for NPs in SRH bull Only focus on SRH service
121
Author year Design (Model type analysis)
Parameters included (population level or individual level)
Outcomes Assumptions amp Limitations
Canadian Nurse Supply Supply Workforce projection 2011 and bull Assume the average utilisation of services at any given Association 2002 Dynamic model Age 2016 age remains constant (110)
Demand Need-based model and utilisation-based model
Sex Population Working hours Graduates Retirement Migration Demand Population
Supply bullNumber of RNs by age bullPercentage of RNs employed in Nursing by age Demand bullNumber of employed RNs required
Health Resources Supply Population Demand bull Assumes that current staffing patterns at the national and Services Measuring RN supply at Number of registered nurse bullUtilisation in-patient day level reflect a balance of supply and demand differences Administration the county level taken Short-term in-patients days bullStaffing ratio Projected RNs per within types of care in factors such as patient acuity do not 2007 (107) from the 2000 US
Census data
Demand Utilisation-based model and benchmarking Simplified Nurse Demand Model from HRSArsquos models
Long-term in-patient days Psychiatric hospital in-patient days Nursing home unit in-patient days Outpatients visits Emergency department visits Population demographic RNs per 100 hospital beds Local nursing wages Numbers of nursing schools and graduates Number of new RNs passing exam Turnover rates Vacancy rates Hard-to-fill positions Staffing ratios Poor facility outcomes Case mix and acuity Worker satisfaction Turnover leadership
100000 age-adjusted population RNs per in-patient days and RNs per visits etc bullRN demand by county staffing ratioutilisation
vary substantially across counties and RN commuting patterns are similar to the commuting patterns of other workers in terms of county flow and outflow
122
Author year Design (Model type analysis)
Parameters included (population level or individual level)
Outcomes Assumptions amp Limitations
Health Resources Supply Supply Workforce projection 2000-2020 bull Applying national estimate to the State level and Services Dynamic model Graduates Administration Attrition Supply 2002 (65) Demand
Project the required nursing services by forecasting the future staffing intensity (Benchmarking)
Aging of RN workforce Decline in relative earnings Alternative job opportunities
Demand Population growth and aging Per capita demand for healthcare Trend in healthcare financing (health insurance) Workload by settings Staffing intensity
bullNumber of FTE RNs by states bullEmployment distribution by settings
Demand bullNumber of FTE RNs by states
Health Workforce Supply Supply Workforce projection 2009-2025 bull Only headcount numbers were presented in the report Australia 2012 (95) Dynamic model
Demand Utilisation-based model and benchmarking
Graduates Migration Retirement Illness and death Career change Working hours
Demand Area of practice Productivity Working hours
Supply bullProjected Number of nurse headcount
Demand bullAcute care nursing number of bed-days bullEmergency care nursing number of attendances at emergency departments bullMidwives calculated from the total number of projected births based on the actual number of births from 2006 to 2008 by population projection ratio from 2009 to 2021
123
Author year Design (Model type analysis)
Parameters included (population level or individual level)
Outcomes Assumptions amp Limitations
Health Workforce Supply Population growth Workforce projection of bull Only focus on perioperative nursing Information Dynamic model Age perioperative nurse (PN) 2009- bull Assumes there will be an increase in the scope of practice Programme 2009 Surgical intervention 2031 for nurses Also assumes that more non-nursing occupation (187) Demand
Need-based model Career changes Job patterns Education Outflows Sectors (public and private)
Supply bullNumber of PN by sectors
Demand bullNumber of PN by sectors
groups will perform support roles for both medicine and nursing
Juraschek etal Supply Population Workforce projection 2008-2020 bull Supply the current RN utilisation the education of new 2011 (188) Trend analysis
Demand Linear Regression Model and Trend Analysis
Age Personal health expenditure FTE RN job shortage ratios RNs per 100000 population
Supply bullNumber of RN jobs
Demand bullNumber of RN jobs needed
RNs and the national propensity of an individual to choose nursing as a career is the same across states in coming decades
bull Demand Used 2009 national mean as a baseline of demand model means there is no shortage in 2009 but in fact most studies consider the nation to already experience a large shortage
bull Using RN jobs as measurement cannot take working hours into account
124
Author year Design (Model type analysis)
Parameters included (population level or individual level)
Outcomes Assumptions amp Limitations
LeVasseur 2007 Supply Supply Workforce projection 2005-2020 bull The supply and demand sides are independent of each (106) Dynamic model
Demand Estimating the demand for FTE RNs by calculating the RN staffing intensity by healthcare setting eg RNs1000 in-patient days in in-patient setting and RNs10000 population in the physiciansrsquo office (Benchmarking)
Based RN population (2000) Migration Highest level of education Attrition State population and potential pool of applicants to nursing programs
Demand Population uninsured Medicaid eligible Per capita income Demographics Geographic location RN staffing intensity by healthcare setting
Supply bullEstimated number of licensed RNs bullActive RN supply bullFTE RN supply
Demand bullNumber of FTE RNs
other
bull The demand model cannot model the substitution between different types of nurses and between nurses and other healthcare professions
bull The demand model cannot capture the interaction between settings
Author year Design (Model type analysis)
Parameters included (population level or individual level)
Outcomes Assumptions amp Limitations
Malyon et al 2010 Supply Supply Workforce projection 2006-2022 bull Assumption of no productivity changes (98) Dynamic model
Demand Need-based model and trend analysis
Age Working hours Graduates Migration Retirements Maternity Productivity
Demand Population Burden of disease and injury Technology impacts
Supply bullNumber of Nurse Headcount bullNumber of Nurse FTE
Demand bullNumber of Nurse Headcount
bull Assumption of no technology impacts
125
Author year Design (Model type analysis)
Parameters included (population level or individual level)
Outcomes Assumptions amp Limitations
Moulton etal 2008 Supply Age Workforce projection 2008-2020 bull Assumed that the number of new RN graduates will (105) Trend analysis
Nursing Supply Model (HRSA)
Demand Trend analysis Nursing Demand Model (HRSA)
Sex Education Graduates Retirements Population
Supply bullNumber of FTE RNs
Demand bullNumber of FTE RNs
remain constant over time Trend and rates remain constant throughout
Moulton 2003 Supply and Demand Licensed nurses Workforce projection for direct bull Trend analysis that means the report assumes the trend (109) Trend Analysis Graduates
New license by exam endorsement Age Aging population Variation in strength of the economy Part-timefull-time nurses
care nursing 2003-2013 Supply bullNumber of RNs and Licensed practical nurses (LPNs) Demand bullNumber of RNs and (LPNs)
will be the same rate though 2013
Murray 2009 (99) The HRSA Nurse Supply and Demand Models revised and updated in 2004 were used to create the Tennesseersquos projection Supply Dynamic model
Demand Project the required nursing services by forecasting the future staffing intensity (Benchmarking)
Supply Graduates Retirement Migration Working hours Renew rate
Demand Population Healthcare market conditions Economic conditions Patient acuity in different settings Working hours
Workforce projection 2008-2020 Supply bullNumber of RN FTE bullNumber of Licensed Practical Nurse (LPN) FTE
Demand bullNumber of RN FTE bullNumber of Licensed Practical Nurse (LPN) FTE
bull The supply and demand sides are independent of each other eg the projection of demand didnrsquot consider the potential supply of nurses
126
Author year Design (Model type analysis)
Parameters included (population level or individual level)
Outcomes Assumptions amp Limitations
Rosenbaum and Supply Supply Workforce projection 2006-2020 Ramirez 2006 (108) Dynamic model
Demand Convert the population projection into numbers of people needing care (Need-based model) Calculate the required FTE RNs per capita (Benchmarking)
Working hours Migration Nurse education Attrition Graduates
Demand Aging population Working hours
Supply bullFTE Nursing supply
Demand bullEstimated FTE RN demand = the units of healthcare usage in each setting FTE RNs per unit of healthcare usage
Spetz 2009 (102) Supply Dynamic model
Demand RN-to-population ratio (Benchmarking) and future hospital utilisation (utilisation-based model)
Supply Graduates Retirement Migration Working hours Population
Demand Population growth and aging Working hours Proportion of RNs who worked in hospital setting
Workforce projection of RNs 2009-2030 Supply bullForecasted FTE supply of RNs bullForecasted employed RNs per 100000 population
Demand bullForecasted FTE demand for RNs bullRNs per capita bullRNs per patient day
bull Do not account for short-term changes eg economic conditions
bull The utilisation-based model was only for hospital setting The total demand was calculated by dividing the Hospital FTE by the proportion of RNs who worked in hospital setting
127
Author year Design (Model type analysis)
Parameters included (population level or individual level)
Outcomes Assumptions amp Limitations
Srisuphan et al 1997 (111)
Supply Dynamic model
Requirement Health demand analysis Demand-based model determined by econometric projections
Health service development analysis Demand-based model for public sector and trend analysis for private sector
Nurse population ratio Demand-based model projected by estimating future economic and population growth
Supply Graduates Attrition
Demand Future economic Population Staff norms Death rate Urbanization Health insurance coverage Demand components (eg nursing services teaching and management)
Workforce projection 1995-2015 Requirements bullNurse-Population ratio bullProjected demand for nurses by units bullProjected demand for nurses by fields of practice
Supply bullExpected graduates bullExpected number of RNs
128
Author year Design (Model type analysis)
Parameters included (population level or individual level)
Outcomes Assumptions amp Limitations
Tomblin Murphy et Simulation model for Supply Workforce projection 2005-2020 bull The efforts to support the projection would be al 2009 (103) supply and requirement
Supply Stock and flow approach
Requirement Need-based model
Graduates Migration Attrition (Death and Retirement) Relocation Change of profession
Requirement Population size and profile Level and distribution of health and illness in the population Risk factors of illness in the population Level of service Productivity Sectors
Supply bullNumber of new RNs entrants bullNumber of exits from the stock over time
Requirements bullEstimates of RN productivity (eg number of acuity-adjusted episodes of care per RN FTE per year) bullEstimates of the number of RN required
significantly hindered by the data reliability and availability relevant to the work of RNs
bull Sectors included acute care long-term care home care community and public health
Wisconsin Supply constant RN-to- Supply bullWorkforce projection 2010 2015 bull Assumed that the 2010 RN-to-population ratios would Department of population ratios Graduates 2020 2025 2030 2035 remain constant Workforce (Benchmark) Change in labour force bullHeadcount and FTE of RNs for bull Better data required to determine quality of RN FTE Development 2011 participation direct patient care broad nursing bull Severity of illness or demand by diagnosis (96) Demand constant nurse
staffing intensity and healthcare usage by employment setting and by age (Benchmark)
Retirement Death and disability Migration
Demand Staffing intensity Healthcare use by setting and by age
workforce
129
Dentist
Author year Model typeanalysis Parameters included (population level or individual level)
Outcomes Assumptions amp Limitations
Supply models Chrisopoulos and Teusner 2008 (81)
Stock and flow Baseline number of dentists Australian university Graduates Overseas entrants Return to practice (RTP) return from overseas return after cessation of practice Migration Retirements Death Alternative career Study and parental leave
bullNumber of dentists
bullDentists-to-population ratio
bull Hard to predict the trends in the future practice activity of new graduates trained by new schools may be different from previously observed patterns
Grytten and Lund 1999 (82)
Dynamic model Retirement
New entrants
bullNet change in man-labour years 1999-2015
bull Assuming the number of new entrant remains constant
Guthrie etal 2009 (80)
Dynamic Model Plateau linear and exponential increases for new graduates population growth was projected to be linear
Productivity Gender mix Retirement rate Projection of the number of graduates Number of new dental schools Population growth
bullNo of dentists per 100000 bullDentist-to-population ratio
bull Assumes that the dental services are delivered largely through private markets subject to the effects of supply and demand and that enrolment in dental schools reflects the rate of return of a career in dentistry in comparison to other options for college graduates
130
Author year Design (Model type analysis)
Parameters included (population level or individual level)
Outcomes Assumptions amp Limitations
Saman etal 2010 (78)
Poisson regression modelling and geospatial analyses System Dynamic Model (iThink iSee Systems Version 91)
Number of dentists retiring per year Number of dentists entering profession Population estimates
bullNumber of dentists entering profession
bullDentist-to-population ratios
bull The dentist-to-population ratio is not a sufficient measure by itself bull Fixed retirement rate at 82 per year and fixed incoming rate at 55 per year
Solomon 2009 (79) Dynamic Model Number of graduates Gender ratio Retirements Population Specialists Full time and part time
bullNumber of dentists working full-time and part-time bullNumber of dentists by specialty status bullNumber of dentists per 100000 populations
bull The paper isolates the different parameters and looks at it differently does not tie in the parameters together
Spencer et al 1993 (83)
Dynamic model Number of new surgeons per year recruited Wastage rates
bullNumber of surgeons bullPopulation-to-surgeon ratio
bull Wastage rates are not explicitly given so assumptions not easy to ascertain
Demand models Morgan et al 1994 (85)
Need-based and demand-weighted method
Age-specific Decayed missing and filled teeth (DMFT) rates Prostheses rates Rates for other dental procedures (not listed) Population projection
bullRequired operator-to-population ratio
bull Assume DMFT would decline but at different rates for different age groups and also rate of decline will decrease bull Assume prosthetic needs would increase bull Other assumptions for changes in demand
Nash et al 2002 (84)
Utilisation-based model Population projection Assumed yearly increase in utilisation
bullNumber of endodontists required bull Assuming different scenario for utilisation increase
131
Author year Design (Model type analysis)
Parameters included (population level or individual level)
Outcomes Assumptions amp Limitations
Mixed models Australian Research Supply stock and flow Supply Supply bull Only focus on Oral and maxillofacial surgeons (OMF) Centre for Recruitment bullNumber of OMF surgeons bull Inout-flow probabilities stay constant over time Population Oral Retirement bullPracticing OMF surgeons per bull Changes in demand not directly linked to external Health the Death 100000 populations factors eg technological advance or increased Medicare University of Demand Utilisation- Outflow overseas funding Adelaide South based model Cessation of practice Demand Australia 2010 (86) Practice sectors
Demand People with OMF diseases or conditions Population
bullNumber of services
Beazoglou etal Supply Specialty distribution Supply bull Assumes that the past rate of productivity improvement 2002 (89) Dynamic model
Demand Utilisation-based model
Retirement New entrant Types of auxiliaries employed Population Income of population Socio-demographic characteristics Productivity
bullNumber of dentists
Demand bullPer capita utilisation bullPopulation-to-dentist ratio bullNumber of dentists bullNumber of dentists needed to maintain current levels of access to care
will continue for the next 10 years low sampling due to national surveys
bull Population not stratified
bull Demand proxied by national expenditure on dentistry
Brown et al 2007 Trend analysis and Supply Supply bull Supply (88) need-based model Female dentists
Productivity Practice patterns Demand Population Economic buying power Knowledge and appreciation of dental services Amount of disease
bullNo of dentists
Demand bullNo of dentists needed
Considered both adjusting and not adjusting for productivity increase
132
Author year Design (Model type analysis)
Parameters included (population level or individual level)
Outcomes Assumptions amp Limitations
Gallagher et al 2010 (87)
Supply Trend analysis and dynamic model
Demand Utilisation-based model
Supply
percept yearly increase over the previous 9 years
Short-term recruitment drive of over 1000 dentists Increased dental student intake percept of time devoted to older people percept devoted to NHS patients percept women dentists Number of dental hygienists and therapists and clinical dental technicians (CDTs) Demand Rate of edentulousness Dental attendance pattern Treatment rates General dental services (GDS) Treatment times Treatment type
Supply
bullNumber of WTE dentists
bullShortfall or surplus of WTE dental staff (not just dentists)
Demand bullTotal number of treatments bullTotal demand for treatment hours bullPer capital demand
bull Supply of government dentists only
bull Made various assumptions on which treatment can be performed by hygienists therapists and CDT
bull Demand only focus on the population aged over 65
Try 2000 (90) Supply Dynamic model
Demand Utilisation-based model
Supply Graduates (net inflow) Working hours Female dentists Productivity Demand Population Patterns of disease Dental diagnosis Age-sex-specific no of courses of dental treatment
Supply bullWhole Time Equivalent (WTE) of dentists
Demand bullNumber of courses of treatment bullCourses of treatment per WTE dentist
bullAssumed that the proportion of female stays the same
bullAssumed that Part-time working becomes more common
133
Author year Design (Model type analysis)
Parameters included (population level or individual level)
Outcomes Assumptions amp Limitations
Waldman 1995 (91) Simple calculations Demand Population projection (state-wise) Population dentist ratio Assumptions on retirement
Supply bullNumber of new periodontists available to practice
Demand bullNumber of active periodontists needed bullNumber of new periodontists needed (to replace retirement)
bullOnly focus on periodontal patients bullAssumed that 186 of graduates are not from the US and will go back bullAssumed that in 2020 all dentists ge 40 in 1991 will have retireddied All dentists lt 40 still practicing
134
Pharmacist
Author year Design Model type analysis
Parameters included (population level or individual level)
Outcomes Assumptions amp Limitations
Supply models Bond et al 2004 (114)
Dynamic model Graduation retirement
bullNet increase in pharmacists from 2000-2020 bullIncrease in pharmacists who complete residencies from 2000-2020
bullData from a survey in 1998 may not be representative of the healthcare in 2020
Cooksey et al 2002 (116)
Dynamic model Graduation Workload (average number of Prescriptions dispensed annually) Working hour Productivity increase Percentage of female pharmacist
bullProjected pharmacists per 100000 population ratio in 2005
bullProjected female pharmacists () in 2005
bullNo analysis of urban or rural practice
Johnson et al2009 (112)
Dynamic model Pharmacist to population ratio
New graduate and training capacity Increasing number of female pharmacist working hour Reference period 2000-2008
bullTo project target workforce in 2008-2020 by using FTE measures
bullFTE definition bullOne who works average 1890 hours per year (40 hours per week times 472 weeks per year)
Knapp and Cultice 2007 (113)
Stock-flow model Age Retirement and death Graduates Working hour Number of female pharmacist Parameters included (population level or individual level)
bullAge and gender based pharmacist supply projection 2004-2020
Assumption bullAll the pharmacists would retire by age 75 bullThe increase of female pharmacist percentage would continue
135
Author year Design Model type analysis Parameters included Outcomes Assumptions amp Limitations
Demand models Bond et al 2004 (115)
Trend analysis (clinical pharmacist)
Pharmacist time (hrswk) Pharmacist time (minpatient) Number of patients who received each decentralized clinical pharmacy service Working hour
bullTotal No of Clinical Pharmacists FTEs per Hospital needed in 2020
bullTotal No of Clinical Pharmacists FTEs needed in 2020
bullData from a survey in 1998 may not be representative of the healthcare in 2020
Johnson 2008 (117) Trend analysis Graduation rates Residency training
bullProjected the no pharmacists needed in 2020
bullNo detail of pharmacist-to-population ratio no data of gender difference
Meissner et al 2006 (118)
Demandutilisation base Medicare Part D (Drug coverage) ADI (Aggregate Demand Index) Percentage of costs paid by third-party payer prescription volume pharmacist-to-technician ratio Direct-to-Consumer (DTC) mail order graduates retirement pharmacist wages
bullProjected Aggregate Demand Index (ADI) for 2009
bullPrediction of no of pharmacists needed in 2010
bullPrediction of pharmacist shortage in 2020
bullMainly focusing on drug coverage not considering other services provided by pharmacists and the expanding roles
136
Author year Design Model type analysis
Parameters included (population level or individual level)
Outcomes Assumptions amp Limitations
Mixed models Department of Health and Ageing Australian Government 2007 (107)
Dynamic model
Demand utilisation model
Supply Working hour Graduates Immigration and emigration Retirement death and disability Inactive workforce Demand Population growth and ageing Working hour Sex- and age-specific ratios of scripts to persons per annum Productivity of dispensing workforce Technician-to-pharmacist ratio Technician equivalence to pharmacist Community pharmacy share of total service Further expansion of the role of both hospital and community pharmacist Number of people attending hospitals The ratio of pharmacists to hospital separations(discharge or death)
Forecast on annual supply of pharmacist through 2025 Supply bullTotal Graduates
Active and inactive (2006) bullActive bullInactive bullWorking outside pharmacy workforce
Forecast on Demand bullCommunity pharmacist bullHospital pharmacist
bullUnidentified variables bullInsufficient magnitude of change for some variables eg global financial crisis
Assumption bull248 population growth Community pharmacist bullRatio of technicians to pharmacists would increase to 03 by 2025 bullScripts to persons increase by 05 per annum bullDispensing productivity stays constant Hospital pharmacist bullHighest estimates of future growth bullWith declining ratio of separations to hospital pharmacists (ceases in 2012)
137
Author year Design Model type analysis
Parameters included (population level or individual level)
Outcomes Assumptions amp Limitations
Fraher et al 2002 (123)
Trend analysis
Dynamic model
Demand Population growth and ageing Insurance (prescription drug coverage) Direct-to-consumer (dtc) advertising
Supply Age Gender Working hour Graduates
Demand bullPrescriptions dispensed per population
Working hour per week (1989-1998) bullMale bullFemale
bullNot projection model
Health Resources Demandutilisation base Demand bullFTE shortfall projection Assumption and Services Population growth and aging bullExamine the adequacy of previous bullModerated prescriptions capita growth Administration New and more complex pharmacist supply projection bullNo growth in educational capacity (HRSA) 2008 (121) Dynamic model pharmaceuticals
Evolving societal attitudes Increased affordability and Availability of generic drugs Increase in pharmaceuticals for Chronic conditions Role of pharmacist Supply Number of graduates (local and overseas) Male-female ratio Working hour Attrition
bullProjection for total pharmacist supply bullProjected male-to-female ratio in workforce
bullFactors such as technology development and the number of graduates are uncertain
138
Author year Design Model type analysis
Parameters included (population level or individual level)
Outcomes Assumptions amp Limitations
Health Resources Trend analysis Demand bullSupply of Active Pharmacists bullNo projection of the demand for pharmacists and Services Volume of prescription (pharmacists per 100000 resident Administration medication dispensed (in different US population) (HRSA) 2000 (126) settings)
Population growth and aging Increased third-party prescription coverage Growth of the economy Expending roles Introduction of new and innovative drug therapies Direct-to-consumer marketing Increased number of prescription providers
Supply Graduates Male-female ratio Losses due to death retirement and leaving practice Region Working hour
bullPer cent of female active pharmacists
Knapp et al 2002 Trend analysis Demand bullLooked at ADI trend from year bullData unavailability eg retail prescription data for 2010 (189)
Dynamic model Unemployment rates Retail prescription growth rate
Supply Number of graduates
1999=2010
bullPearson Correlation between ADI and below factors bullUnemployment bullGraduates bullPrescription growth rate
and actual graduate data for 2010
139
Author year Design Model type analysis
Parameters included (population level or individual level)
Outcomes Assumptions amp Limitations
Knapp et al 2005 Trend analysis ADI (5-point rating system) bullRating distribution among bullThe usefulness of the ADI is limited by the fact that (124) 5= high demand for pharmacists
difficult to fill positions 4 = moderate demand some difficulty filling positions 3 = demand in balance with supply 2 = demand is less than the pharmacist supply available and 1 = demand is much less than the pharmacist supply available
different regions panellists may choose different ratings for the same scenario
bullReplacement panellists may not rate the severity of the shortage the same as did the original panellists within the same organization
Knapp 2002 (125) Dynamic model Graduation Working hour improvement of therapy growth of distance therapy increased intensity of hospital growth in size and complexity of hospital system Functional area (order fulfilment primary care secondary amp tertiary care and non patient care)
bullCurrent use of FTE pharmacist 2001 bullProjected need for FTE pharmacist 2020 bullTotal estimated FTE supply bullFTE pharmacist shortfall
bullMainly about the factors needed to be considered bullProjection model was not clearly described
Koduri et al 2009 Benchmark Pharmacist to population ratio bullProjected future trends for FTE Assumptions (120)
Dynamic model
Design Model type analysis
Expanded roles Prescription volumes growth Population growth and aging Insurance coverage DTC Marketing Expiring drug patentsAttrition Number of graduates Working hour Gender FTE adjustment
demand and supply
Outcomes
bull79 pharmacists would enter the field each year (in Utah) bullEach female pharmacist provides 079 FTE of pharmacy services
140
Radiographer
Author year Design Model type analysis
Parameters included (population level or individual level)
Outcomes Assumptions amp Limitations
Supply model Reiner et al 2002 Supply description Type of facility bullAverage FTEs Limitations (190) Facility size
Modality bullAverage number of FTE for different modalities bullRadiography bullCT bullUltrasonography bullMRI bullNuclear medicine bullMammography bullInterventionalangiography
bullOnly give out the average FTE numbers in different types of facilities bullDo not have a trend of FTE numbers
Wing et al 2009 Age cohort flow model Population growth bullProjection of FTE Supply of Assumptions (146) New entrants
Attrition Age Working hour
Radiologic Technologists bullStatus Quo Projection bullProjection on radiologic Technologists per 100000 Women
bullFuture resource inputs proportional to current practitioner-to-population ratio Limitations bullDo not account for productivity increase bullOnly focus on mammography
Mixed model Bingham et al Demand Trend analysis Demand bullProjection of overall radiography Assumptions 2002 (191)
Supply Trend description
Extension of NHS Breast Screening Programme from females skill mix (radiographer assistant) population ageing and growth WTE
Supply Graduates Working part-time and work-life balance Retirement Student attrition Career progression
workforce demand (2002-2006 plan) bullDiagnostic bullTherapeutic
Projection in Supply bulloverall radiographers bulldiagnostic radiographers bulltherapeutic radiographers
bullProjected supply against projected demand (2002-2006)
bull8 of attrition rate for radiographer students bullAll radiographers would retire on earliest eligible retirement age (60 years) bullWorkforce capacity lost due to increase of part-time working and work-life balance (175) would increase to 215 (01 per annum
141
Author year Design Model type analysis
Parameters included (population level or individual level)
Outcomes Assumptions amp Limitations
Centre for Trend analysis Data from DH bullProject increase in demand Limitations Workforce Age bullOnly focus on diagnostic radiographers Intelligence 2012 Graduates bullProjection available workforce (147) Field of practice
Training attrition Retirement Ageing population Increased demand in related groups
supply from 2010 to 2016 in headcount and FTE
Patterson et al Demand Population Demand Supply Assumptions 2004 (192) projections
Supply Trends description
Aging workforce and population Hospital radiographer employees and vacancies
Supply Total license grows Retirement Proportion of active licensees currently practicing Aging workforce and population Education capacity
bullActive licensees (currently practicing)
bullProjection on retirement
bullDemand (Vacancies)
bullA demand of 690 providers per 100000 populations
Limitations bullScarcity of data related to the statersquos radiographer workforce bullSize of radiographer workforce is small making the projections more volatile bullUnavailable data eg FTE migration in and out of state bullThe data of demand projection was based on hospital radiographer only bullActive license may not be able to represent the active practitioners
Victorian Demand Working hour bullProjected FTE Demand Limitations Department of demandutilisation Graduates 2009 - 2030 bullAssuming that no significant changes in radiation Health 2010 (193) model
Supply Stocks and flow model
Attrition Immigration Adjusted training requirement
bullProjected number of graduates 2010-2029 bullProjected FTE Shortage (based on current trends in workforce supply)
technology
142
Optometrist
Author year Model type analysis Parameters included (population level or individual level)
Outcomes Assumptions amp Limitations
Supply models Bellan etal 2007 (194)
Dynamic (Stock and flow) model
Retirement Death Emigration Age Sex Graduates Population
bullNumber of FTEs bullFTEs per 100000 populations bullPercentages of female FTEs
bullAssumes a status quo scenario in terms of attrition and gain factors
Demand based utilisation models (includes lsquoneedrsquo lsquorequirementrsquo etc) Tuulonen etal 2009 (137)
Computer simulation model using system dynamics approach
Number of cataract glaucoma diabetic retinopathy and macular degeneration Cost of those disease Number of ophthalmologists Number of physicians Population data
bullNumber of patients
bullService increase (eg Cataract surgery and Bilateral surgery)
bullDifferent number of assumptions based on what kind of disease they are looking at have various scenarios
Mixed models Australian Institute Trend analysis Age Supply bullAssume that there will be no significant change from the of Health and Number of optometrists bullNumber of FTEs optometrists current pattern of use of optometrist services the number Welfare 2000 (195) Number of optometrists
Migration Sex FTE Population demographics Graduates Utilisation of services
Demand bullNumber of FTEs needed
of graduates workforce participation and average number of services per optometrist
143
Author year Model type analysis Parameters included (population level or individual level)
Outcomes Assumptions amp Limitations
Kiely et al 2010 (196)
Supply Dynamic model
Demand Utilisation-based model
Graduates Retention rates Immigration Age Attrition Population Service utilisation rates
Supply bullNumber of FTEs bullPercentage of female optometrists
Demand bullNumber of FTEs required
bullAssumes different scenarios for practice and how it affects supply and demand
Lee etal 1998 (197)
Supply Unclear
Demand Need-based model
Subspecialty (not very specific on how they calculated)
bullNumber of FTEs by subspecialty bullDoes not specifically show how the FTE were calculated with certain parameters
Pick etal 2008 (141)
Trend analysis Retirement age and rates Graduates Retention rates Number of ophthalmologists Service hours Population
Supply bullTotal number of ophthalmologists
Demand bullRequire number of ophthalmologists
bullAssumes no change to working hours or the number of trainees lack full-time equivalent data for the workforce did not collect gender-specific data for the workforce did not consider overseas
144
Medical Laboratory Technician
Author year Model type analysis Parameters included (population level or individual level)
Outcomes Assumptions amp Limitations
Supply models Canadian Institute for Health Information (CIHI) 2010 (131)
Supply description Graduates Working hours Age Gender Pass rate of the certification examinations Field of practice Place of employment
bullFTE of active registrations in the previous years bullProportion of professions by field of practice
Assumptions bullStandard full-time weekly hours of 375 hours
Mixed models Health Resources amp Services Administration2005 (198)
Supply and demand Supply Population Graduates Career attraction (wages and career growth)
Demand Demographics Changing biomedical and information technologies Utilisation of laboratory test
bullShortages by types of workers and geographic area
Limitations bullNo numbers of supply and demand
145
Chiropractor
Author year Model type analysis Parameters included (population level or individual level)
Outcomes Assumptions amp Limitations
Supply models Davis et al 2012 (129)
Supply description Geographic variation Age Adult population Population educational levels
bullTotal number of Chiropractors bullChiropractors per capita
Limitations bullLack of information about working hours bullOnly included the chiropractors in Medicare
Davis et al 2009 (130)
Supply description Age Adult population Graduates
bullTotal number of chiropractors bullChiropractors per 10000 adult population (agegt18)
Limitations bullLack of information about working hours and number of visits
Mixed models Institute for Alternative Futures 2005 (128)
Supply stock and inflow Demand need-based model
Ageing Adult population Graduates Retirement Technology Conditions treated (eg low-back pain neck pain) Types of practice (eg solo private practice)
bullPercentage of using chiropractic care annually (agegt18) bullPercentage of chiropractic care provided to patients below 18 annually bullNo of practicing chiropractors bullPatient visits per week
Assumptions bullFour alternative future scenarios were being described and used for projection
Whedon et al 2012 (127)
Supply and utilisation description
Geographic variations Population (aged 65 to 99)
bullChiropractors per 100000 population (2008) bullAnnual services per chiropractic user bullChiropractic users per 1000 Medicare beneficiaries
Limitations bullThe chiropractic use may be underestimated due to the availability of chiropractic service in veteranrsquos administration health service
146
Physiotherapist
Author Year Design (Modeltype analysis)
Parameters included (population level or individual level)
Outcomes Assumptions amp Limitations
Supply models WRHA 2002 (135) Dynamic Model Positionvacancy data
Retirement data Graduates New registrants
bullVacancy percentage by Equivalence of Full Time
bullThe calculation of FTE it assumed that all persons employed were full time bullIt is not known whether any of the positions are filled by therapists working at more than one location
Mixed models Breegle 1982 (144) Supply
Dynamic Model
Demand Trend Analysis Need Model
Population Number of patient visits a year Average admissions average length of stay Possible outpatient visits per year Estimated home-bound patient visit needs Practitioners Graduates
bullRatio of PT per 10000 Population bullTrend analysis assuming factors influencing the historical trend remain constant
bullHealth-Needs Method assuming one third of the possible visits were physiotherapy related non-institutionalized people received 087 home visits
bullSupply based on the historical data
American Physical Therapy Association 2012 (199)
Supply Dynamic Model
Demand Linear Regression Analysis
Number of licensed PT Graduates International PT Attritionretirement rate Working hour per week Population with insurance Vacancy rate
bullFull Time Equivalent bullNumber of international PT will remain constant bullConstant attrition rate bullThe percentage of insured population is based on current rate However the percentage can change based on the Affordable Care Act bullVacancy rate only reflects the situation in 2010
Zimbelman 2010 (142)
Supply Dynamic Model
Demand Linear Regression Analysis
Number of PT available job vacancy Projected population Personal healthcare expenditure(PHE) Likelihood of being employed Population Baseline number of PT
bullShortage ratios per 10000 people bullThe demand model is determined only by age and population growth 2 Assumption of linear growth was made bullDoes not incorporate workplace settings part-time or full-time employment status
147
Occupational Therapist
Author year Design (Model typeanalysis) Parameters included Outcomes Assumptions amp Limitations
Supply models Salvatori et al 1992 (134)
Dynamic Model Population level data Actual 1988 employment data annual inactivity rate Graduates Immigration Re-entry figures
A part-time to full-time FTE ratio
bullNumber of Occupational Therapists
bullNumbers may not be accurate bullMany rates kept constant over years
WRHA 2002 (200) Dynamic Model Individual level data Current position and vacancy predicted new graduates Past retention rate for new graduates new registrants over the past 5 years retirement rate
bullVacancy rate by Equivalence of Full Time
bullInformation was based on previous data and representing status at one point in time and only based on requirements for the year of 2001 bullDifficult to measure the impact of the availability of work within private sector with the possibility of improved benefits and flexibility
Demand based utilisation models (includes lsquoneedrsquo lsquorequirementrsquo etc) Mirkopoulos et al 1989 (133)
Demand Analysis by growth per year
Population level data Current number of paid full-time and part-time OTrsquos Vacancy numbers Attrition rates in physiotherapy hospital average growth rate Home care average growth rate for OT
bullFull Time Equivalent bullIt was assumed that the factors affecting attrition would be very similar for physiotherapy and occupational therapy bullBaseline data didnrsquot represent the whole picture therefore there was underestimate of the true requirement projection
Mixed models Morris 1989 (136) Supply
Dynamic Model
Demand Analysis by growth per year
Individual level data Predicted number of additional positions by respondents from different sectors Projected population in Georgia national population ratio Average annual number of graduates between 1980-1986
bullFull Time Equivalent bullFuture demand was based on professions prediction bullAll Georgia graduates accept employment within the state and no separations from the work force occur
148
149
31 MODELLING DEMAND 21
311 Empirically observed historical (EOH) approach 22
3111 Support vector machine (SVM)22
3112 Regression-based method (RBM)23
3113 Time series approach 24
312 Macroeconomic scenario drive (MSD) approach25
3121 Constant growth rate 25
3122 Historical growth rate 26
3123 Capped growth rate 26
32 MODEL COMPARISON27
321 International dentist utilisation rates30
33 PARAMETERS FOR DENTAL DEMAND MODEL PROJECTIONS 30
331 Adjusting for under-reporting 31
34 DEMAND INDICATORS32
341 Private dental sector 32
342 School Dental Clinic 36
343 Government Dental Clinic 36
344 Public inpatient setting51
345 Academic sector 54
35 CONVERTING HEALTHCARE UTILISATION TO FULL TIME EQUIVALENTS (FTES) 55
351 Private sector 55
352 Public sector ndash Government Dental Clinics56
353 Public inpatient setting58
354 Academic sector 59
4 PROJECTING DENTAL SUPPLY 60
41 MODELS FOR DENTAL SUPPLY 60
42 DETERMINANTS OF SUPPLY PROJECTING STOCK AND FLOW 61
421 Baseline adjustments 61
422 Movement of dentists into and out of Hong Kong62
423 Total number of registrants62
424 Number clinically active63
4241 No longer practicing in the dental profession but not retired 63
4242 Natural attritionretirement 63
iii
4243 Otherwise unavailable64
43 SUPPLY EXTERNALITIES65
431 Workforce participation and differential work capacity65
44 CONVERTING WORKFORCE SUPPLY TO FULL TIME EQUIVALENTS (FTES) 66
45 DENTIST SUPPLY PROJECTION FROM 2012-2041 67
5 GAP ANALYSIS68
51 METHOD 69
52 ANNUAL NUMBER OF FTE 69
53 YEAR-ON-YEAR FTE69
54 ANNUAL INCREMENTAL FTE69
55 BASE CASE SCENARIO 70
6 POLICY OPTIONS73
61 DENTAL CARE SUPPORT 73
62 SERVICE ENHANCEMENT - GOVERNMENT DENTAL CLINIC (GDC) 80
7 RECOMMENDATIONS ndash BEST GUESTIMATE 83
8 COMPARISON OF 2012-2041 AND 2015-2064 PROJECTIONS 86
9 REFERENCES89
iv
List of Tables
Table 21 Projection methods demand and supply parameters for manpower projection models by healthcare professionals 15
Table 31 Comparison of EOH-SVM MSD-constant growth MSD-historical growth rate
Table 32 Comparison of the linear and exponential RBM utilisation projections mean
Table 51 Base case projected year-on-year supply-demand gap [a negative number
Table 52 Base case projected annual incremental supply-demand gap [a negative number
Table 61 Staffing ratio projected year-on-year supply-demand gap [a negative number
Table 62 Staffing ratio projected annual incremental supply-demand gap [a negative
Table 63 Service enhancement in GDC projected year-on-year supply-demand gap [a
Table 64 Service enhancement in GDC projected annual incremental supply-demand gap
Table 71 Best guestimate model projected year-on-year supply-demand gap [a negative
Table 72 Best guestimate model projected annual incremental supply-demand gap [a
Table 81 Best guestimate projected year-on-year supply-demand gap (assuming retirement
Table 82 Best guestimate projected annual incremental supply-demand gap (assuming
estimation errors28
squared error (MSE) for selected demandutilisation variables29
Table 33 Demand model variables parameterisation and data sources 31
Table 41 The number and proportion of newly transition 2008-201262
Table 42 Projected number of local dental graduates (2013-2018)62
Table 43 Dentist supply projection for 2012-2040 67
indicates surplus] 72
indicates surplus] 72
indicates surplus] 80
number indicates surplus] 80
negative number indicates surplus]82
[a negative number indicates surplus]82
number indicates surplus] 85
negative number indicates surplus]85
=gt65 years of age) [a negative number indicates surplus] 88
retirement =gt65 years of age) [a negative number indicates surplus] 88
v
List of Figures Figure 21 (reproduced from WHO original) WHO concepts for linking healthcare workforce
requirements and supply projections (7)5
Figure 33(a) Historical and projected number of private sector dental visits (2002-2041
Figure 34(a) Historical and projected annual age-sex standardized private sector dental visit
Figure 35 Historical and projected number of FTE dentists in the School Dental Clinics
Figure 36 Number of HA and civil servant Government Dental Clinic visits (excluding
Figure 39 Historical and projected number of doctors (black) nurses (blue) and other staff
Figure 312 Historical and projected number of civil servants per Hong Kong population
Figure 316 Projected number of civil servant dependants less than 19 years of age spouses
Figure 317 Historical and projected number of GDC visits by general public civil servants
Figure 321 Projected age-specific GDC visit rate for civil servant dependents (2002ndash2041)49
Figure 324 (a) Historical and projected number of inpatient dental specialty discharges
Figure 325(a) Projected annual age-sex standardised inpatient dental specialty discharge
Figure 31 Approaches to estimating demand22
Figure 32 Comparison of Hong Kong and OECD dental outpatient visit rates (152153)30
excluding 2008) 32
rates (2002-2041 excluding 2008) 34
(2005-2041)36
general public sessions) (1999-2011) 37
Figure 37 Historical and projected N-O pairs38
Figure 38 Historical and projected lsquootherrsquo staffndashto-doctor ratio (1999-2041)39
(magenta) (1999-2041) 39
Figure 310 Historical and projected number of HA staff (1999-2041) 40
Figure 311 Projected number of HA staff dependants (1999-2041)41
(1999-2041)42
Figure 313 Projected number of civil servant pensioners (2013 to 2041)44
Figure 314 Projected age-specific number of civil servant pensioners (2013-2041) 44
Figure 315 Civil servant and pensioner dependents by age group 45
aged 19 - 59 and spouses aged 60 or older (2012-2041) 46
pensioners and dependents and HA staff and dependents (2001 -2041) 47
Figure 318 Projected age-specific GDC visit rate for civil servants - male (2002ndash2041)48
Figure 319 Projected age-specific GDC visit rate for civil servants - female (2002ndash2041)48
Figure 320 Projected age-specific GDC visit rate for civil servant pensioners (2002ndash2041) 49
Figure 322 Projected age-specific GDC visit rate for general public ndash male (2002ndash2041) 50
Figure 323 Projected age-specific GDC visit rate for general public ndash female (2002ndash2041) 50
(2005-2041)51
rates (2005-2041) 53
vi
Figure 326 Historical and projected number of dental students Faculty of Dentistry HKU (2001-2041)55
Figure 42 lsquoNo longer practicing in the dental profession but not retiredrsquo projections by sex
Figure 44 The proportion of dentists lsquonatural attritionretiredrsquo by age - female (2012-2025)64
Figure 51 Projected number of dentists FTEs Base case supply and demand (Shaded area
Figure 52 Year-on-year FTE gap Base case demand model (Shaded area 5th-95th
Figure 53 Annual incremental FTE gap Base case demand model (Shaded area 5th-95th
Figure 64 Projected number of dentist FTEs lsquoDental care supportrsquo (Shaded area 5th-95th
Figure 65 Year-on-year dentist FTE gap lsquoDental care supportrsquo (Shaded area 5th-95th
Figure 66 Annual incremental dentist FTE gap lsquoDental carersquo (Shaded area 5th-95th
Figure 67 Projected number of dentist FTEs Service enhancement - GDC (Shaded area 5th-
Figure 68 Year-on-year FTE gap Service enhancement ndash GDC (Shaded area 5th-95th
Figure 69 Annual incremental FTE gap Service enhancement - GDC (Shaded area 5th-95th
Figure 71 Projected overall FTE dentist demand (Best guestimate) and FTE dentist supply
Figure 327 Historical and projected number of private sector FTE dentists (2005-2041) 56
Figure 328 Historical and projected αGDC from 2012 to 204157
Figure 329 Historical and projected number of FTE dentists in the Department of Health57
Figure 330 Historical and projected number of FTE HA dentists (2005-2041) 58
Figure 331 Historical and projected number of dentists in academic sector (2005-2041) 59
Figure 41 Dental supply model for Hong Kong 60
(2012-2025) (DH HMS for Dentists)63
Figure 43 The proportion of dentists lsquonatural attritionretiredrsquo by age - male (2012-2025)64
Figure 45 lsquoOtherwise unavailablersquo projections by sex (2012-2025) 65
Figure 46 Distribution of dentists by sector 2004-2007 2009 amp 2012 66
5th-95th percentile) 70
percentile) 71
percentile) 71
Figure 61 Number of dentists induced by policy 175
Figure 62 Number of private dental visits induced by policy 276
Figure 63 Number of FTE dentists induced by the outreach pilot project77
percentile) 78
percentile) 79
percentile) 79
95th percentile) 81
percentile) 81
percentile) 82
(base case)83
Figure 72 Year-on-year FTE gap (Best guestimate) and FTE dentist supply (base case)84
vii
Figure 73 Annual incremental FTE gap (Best guestimate) and FTE dentist supply (base case) 84
Figure 81 Historical and projected number of doctor FTEs Base case supply and demand (Shaded area 5th-95th percentile) 86
Figure 81 Year-on-year FTE gap Base case demand model (Shaded area 5th-95th percentile) 87
Figure 81 Annual incremental FTE gap Base case demand model (Shaded area 5th-95th percentile) 87
viii
List of Appendices
Appendix A(i) Summary of manpower planning and forecasting models (Australia Canada Netherlands)98 Appendix A(ii) Summary of manpower planning and forecasting models (New Zealand
Appendix A(iii) Summary of manpower planning and forecasting models (Japan Singapore Scotland United Kingdom) 102
USA) 105 Appendix B Manpower planning literature by healthcare professional group108
ix
1 Introduction
Manpower or workforce planning which is defined as ldquoensuring that the right people are
available to deliver the right services to the right people at the right timerdquo (1) is believed to
be the appropriate approach to tackling the allocative and technical efficiency issues
associated with the lsquoproductionrsquo function of healthcare Human resources for health (HRH)
planning and forecasting is an important strategic objective in many countries and often
reflects an increasing mismatch between the needdemand for and supply of healthcare
professionals at regional as well as national levels
Historically HRH forecasting has been weakly linked to national health policies and
population health needs It was based on the assumption that more healthcare input produced
better health and was done by modelling supply demand and need for manpower
independently (2-4)
HRH forecasting is extremely complex and often framed by healthcare financing models and
resources allocated to healthcare service delivery models the level and mix of healthcare
services controls on the volume and appropriateness of clinical activity productivity
elasticity of supply work-force complementarity and substitution (3 5) Comprehensive
forecasting models combine economic concepts with determinants of health the peculiarities
of the medical environment and training time lags (6)
Modelling is an essential tool for manpower projections Depending on the underlying
assumptions the models adopted may be deterministic or stochastic Deterministic models
are used when the outcome is certain whereas stochastic models allow for uncertainty and
flexibility in the model and deliver different results over multiple runs Over time stochastic
models are believed to reveal the most likely outcome but they are more computational
involved use complex programming and present analytical challenges There are however
also methodological limitations in these stochastic models including the lack of easily
accessible clinical administrative and provider databases for modelling as well as conceptual
challenges Many of these models are of variable quality andor project only for (a) specific
diseases(s) or professional group only The quantity and quality of the data will directly
determine how accurately the model reflects the real situation and therefore the reliability of
the projections (7)
1
Considering the many factors that shape projection models (eg availability and quality of
data assumptions regarding characteristics of population change and growth developments
in medical technology andor clinical practice) selecting the model structure and attributes
most suitable for the setting is essential A number of projection models are described in the
formal academic and grey literature however a comprehensive ldquogold standardrdquo that fits all
situations equally well remains elusive There is little consensus on the best methods for
estimating healthcare manpower in the literature The most common approaches include
workforce-population ratios need-based demandutilisation-based and supply models (8)
Each method has its strengths and limitations and requires many compromises
simplifications and assumptions
2 Setting the scene
21 Models for policy level planning
211 Need-based models Need-based models allow for estimates of true population need by considering changes in
health status and efficacy of healthcare services (3 8 9) while adjusting for population size
and characteristics including age sex household income risk behaviour and self-perceived
health These models project healthcare deficits as well as healthcare service need (both
professional staff or quality of service to an optimum standard) As need-based approaches
have greater data demands than approaches based on supply or utilisation epidemiological
data is an important limiting factor For these models detailed information on the efficacy of
individual medical services for specific medical conditions is required (8) Although need-
based models usually cannot account for historically unmet need they can avoid perpetuating
existing inequity and inefficiency within the healthcare delivery system a common problem
with other forecasting models however the assumption that healthcare resources will be
used in accordance with relative levels of need is seldom verified
212 Demandutilisation-based models Demandutilisation models are built on service utilisation data (8) under the assumption that
healthcare workload remains constant over time and population growth directly leads to
increased workload (4 9) Demand models commonly include 1) estimates of healthcare
demand or at least historical utilisation patterns (most frequently by diagnosis) 2) anticipated
change in practice patterns 3) the impact of current and emerging technologies and 4) policy
2
change The projections are often limited to age and sex although other characteristics of the
population market conditions institutional arrangements and patterns of morbidity may be
included Previous demand models have often assumed that doctors were required for all
demanded service current demand was appropriate age and sex specific resource
requirements were constant and demographic change was predictable over time (8)
213 Benchmarking Benchmarks refer to a current best estimate of a reasonable workforce These estimates are
valid for comparison only if communities and healthcare planning are comparable ie
adjusted for key demographic health and health system parameters Estimates of manpower
requirements are based on healthcare worker-to-population ratios and current healthcare
services For such models to be relevant adjustments for differences in population
demography population health health insurance productivity and health system organization
are important (8)
214 Trend analysis Based on aggregate level and time series historical data trend analysis uses observed
historical population growth and ageing trends for predicting future trends It is a macro
simulation based on the extrapolation of past trends Trend analysis is often useful for
projecting likely growth particularly in the private sector (7 10) These models assume 1) a
causal relationship between economic growth and the number of doctors per capita 2) that
future requirements will reflect current requirements (eg the current level mix and
distribution of providers are sufficient) 3) productivity remains constant and 4) demographic
profiles (such as population growth) are consistent with observed trends (8 11) Some argue
these models have lsquolabour myopiarsquo and should be revised to include determinants of doctor
productivity and elasticity of labour supply for different provider groups (5) These models
do not consider the evolution of the demand for care
22 Learning from international organisations
221 World Health Organisation The mission of the Department of Human Resources for Health World Health Organisation
(WHO) is to ldquoprovide equitable access for all people to an adequately trained skilled and
supported health workforce to contribute towards the attainment of the highest possible level
of healthrdquo (12) The strategic direction of the department is to provide technical and
3
administrative coordination through several priority programmes one of which is the Health
Workforce Information and Governance team This team provides countries and other
healthcare partners policy and planning advice and technical support in the form of tools
guidelines norms and standards on health workforce assessment planning monitoring and
evaluation (7 13-21) The WHO has identified three fundamental principles associated with
the integration of healthcare service and the development of health personnel (13) First the
planning production and management functions for HRH must go together Second human
resources are to serve the needs of the health system Third the health system must serve the
peoplersquos needs The WHO has developed a conceptual framework for HRH projection which
pulls all these activities together It consists of 4 different phases including 1) situation
analysis 2) planning 3) implementation and 4) monitoring and evaluation (22) While the
HRH framework is applicable in all countries its application will be influenced by elements
specific to the country context Figure 21 provides the outline adopted by the WHO to
identify the mechanism by which balance in the requirements (demand for healthcare
provision) and the supply can be achieved
The WHO uses simulation as the tool to assess the potential impact of various strategies on
change in the model outcomes Both deterministic and stochastic processes can be applied to
this model Typically the variables included in these models are demographic growth and
change health policy and related legislation technological change burden of disease service
and provider utilisation relevant service quality standards organisational efficiency skills
mix individual provider performance public demand and expectations and availability and
means of financing The most commonly used approaches to project workforce requirements
are workforce-to-population health-needs service-demand and service targets methods
Each has its advantages and disadvantages Although supply side projections are relatively
less complex and simpler careful accounting is needed to ensure all relevant and available
workers are included in the estimates Aspects to consider are the capacity to produce
healthcare workers the different types of healthcare workers needed for future work loss
rates due to retirement and emigration death or pre-retirement leaving
4
Figure 21 (reproduced from WHO original) WHO concepts for linking healthcare workforce requirements and supply projections (7)
222 Organisation for Economic Cooperation and Development (OECD) The Health Division of the Directorate for Employment Labor and Social Affairs of the
OECD advises countries on how to meet future demand for health professionals and help
countries improve health workforce planning (23) With a focus on doctors and nurses the
OECD has identified trends shaping the current and future health workforce in member states
over the past decades in cross-country reports (24) and country-specific health system
reviews (25) Both a prolonged increase in the supply of doctors and nurses across member
states was identified Factors identified as influencing the change in demand for doctors and
nurses were increasing incomes changing medical technology and population ageing
Supply factors influencing the growth rate for doctors were controls on entry into medical
school for nurses capping the number of hospital beds and for both professions
immigration emigration and changes in productivity (26) Factors likely to impact the shape
and potential shortage of the future health workforce were workforce ageing feminisation
expectations of younger generations in terms of work-life balance increasing specialisation
5
and changes in delivery of service such as an increase in day case treatment and overall
declining length of stay (26)
The OECD has also explored specific issues such as the impact of skill-mix and policy
change on the health workforce (27) staff shortages (28) and strategies on how to adapt
supply to a growing demand within particular workforce specialties (29)
The extensive work undertaken by the WHO and the OECD and the development of
manpower planning and forecasting tools by these organisations are useful guides for
manpower projections in Hong Kong They provide an excellent source of benchmarking
tools in the area of health manpower planning for both developing and developed countries
23 Learning from overseas jurisdictions To learn from international approaches to workforce planning nine jurisdictions were
selected for review ndash Australia (30) Canada (31) Japan (32) The Netherlands (33) New
Zealand (34) Scotland (35) Singapore (36) United Kingdom (37) and the United States (38
39) to determine 1) strategies for national level manpower planning and forecasting 2)
methods used to project population level healthcare professional demand and supply and 3)
methods to improve workforce productivity and capability Appendix A (i) (ii) and (iii)
illustrates the context framework methods and assumptions guiding these manpower
planning and forecasting models These jurisdictions were selected for the maturity of their
manpower planning models and comparability of workforce issues to Hong Kong
231 Australia Set up by the Council of Australian Governments and reporting to the Australian Health
Ministersrsquo Advisory Council Health Workforce Australia (HWA) is responsible for
projecting the healthcare manpower requirements in Australia and advising and informing
governing bodies on the dynamic changes in the healthcare workforce (30) HWA has
adopted a lsquomodels of carersquo approach based on competencies required for the delivery of the
best healthcare The HWA projects manpower requirements based on the expected change in
model parameters (such as changes in immigration innovationtechnology healthcare and
health system reform as well as skills or roles or healthcare professionals) through scenarios
analyses
6
The HWA 2025 healthcare workforce projection for midwives registered and enrolled nurses
used a stock and flow supply model and applied a constant linear growth rate model to
calculate demand (40) Supply model parameters included graduates immigration of nurses
no longer available for nursing practice training time and hours worked The demand model
parameters included total hospital bed-days by population growth service related groups
(similar to Diagnostic Related Groups) total number of aged care packages by population
growth aged 70 years and over service utilisation total number of projected births and total
number of projected Registered Nurse (RN) Enrolled Nurse (EN) full time equivalent (FTE)1
by population ratio (40)
The HWA adopted a similar model for the November 2012 projection of medical specialties
The stock and flow supply model parameters included workforce headcount demographic
characteristics number of graduates and medical fellows immigration of overseas specialists
lost to medical practice FTE benchmarks training time and number of hours worked (40)
The demand model parameters were service utilisation by sex and five-year age cohort
publicprivate hours worked services related groups and enhanced service related groups
Diagnosis groups were used to assign medical services to medical specialties and sub-
specialties (41) and to adjust for complexity of care (proxy for severity of illness) The
assumption being that higher complexity inherently drives manpower requirements These
models derive estimates from a baseline year and assume a consistent linear future trend in
healthcare need and technological change
232 Canada Prior to 2003 healthcare workforce planning in Canada was undertaken by each jurisdiction
or province independently and did not address pan-Canadian supply and demand In seven of
the ten provinces historical patterns of health service utilisation and health human resource
supply as proxies for public sector demand and supply were used to project healthcare
manpower requirements The remaining three provinces adopted a need-based approach
Since 2003 Health Canada (a department of the federal government) has worked with the
provinces and territories to improve coordination in and develop a conceptual model for
human health resource planning (42) The proposal includes a stock and flow model for
supply and a need-based model using utilisation of curative and preventive services (43)
1 Full-time equivalent (FTE) is a standardized measure of time at work for an employed person An FTE of 10 indicates a full-time worker whereas FTE of 05 signals half-time
7
More specifically most jurisdictions calculated health workforce supply using parameters
such as new local and non-local registrants attrition and employment status (44) Although
many parameters were available to project manpower demand and supply most of the
provinces used historical trends (age and sex stratified) to project future healthcare workforce
requirements (44) The newer projection models adopt additional supply-side parameters
such as education immigration and career patterns (44) Overall Canadian healthcare
manpower demand models project FTE requirements on current utilisation patterns including
parameters such as changes in the total population size and age-sex structure Only two
jurisdictions report including parameters such as socio-economic characteristics in the
models or addressing the impact of externalities such as change in healthcare policy
Although Health Canada is coordinating healthcare manpower planning and forecasting as
with most other health care issues healthcare manpower regulation and registration planning
and forecasting remains the jurisdiction of the provinces While there are similarities and
commonalities between provinces the models as developed and applied are broadly
applicable only to the province of origin
233 Japan The Ministry of Health Labour and Welfare (Japan) projects the supply and demand for
healthcare personnel (45) The 7th Projection of Estimated Supply and Demand for Nursing
Personnel was prepared in 2010 estimated a shortfall of 15000 nurses in 2016 (46) The
supply parameters included current employment status by year local and international
graduates re-employment and retirement The demand parameters included service
utilisation by hospitals clinics maternity clinics long-term care facilities social welfare
facilities health centres and municipal facilities educational institutions workplaces and
schools (46) Currently the full report of the 7th Projection of Estimated Supply and Demand
for Nursing Personnel is not released thus more specific methods are not publicly available
Historical trends were used to quantify but not project the demand for other healthcare
professionals such as doctors dentists and pharmacists (46)
234 The Netherlands The Netherlands Institute for Health Services Research (NIVEL) is an independent
organisation with manpower planning as a particular area of research (47) NIVEL deployed
stock and flow methods to project supply and demand for healthcare professionals (48)
8
Parameters used in their supply model included working capacity primary activity
graduates drop-out rates expected age of retirement working hours and task delegation (48)
The supply model also incorporated the flow of medical professionals by sex in and out of
the healthcare market and projected total FTE The demand model (a three-part model) used
simulation methods to project service utilisation on demographic and epidemiological
developments (48) Part 1 established the baseline supply and demand of healthcare
professionals by FTE adjusted by gender (49) The manpower gap between the supply and
demand was then estimated Part 2 projected supply and demand FTE requirements for the
target year by projecting parameters such as demographic change and the inflow and outflow
of health professionals (49) Part 3 compared the expected manpower supply by FTE from
labour market returns with projected FTE supply in three scenarios (49) The base scenario
used trend analysis to forecast the impact of demographic change on the demand for
healthcare The first scenario included parameters such as epidemiological socio-cultural and
technical developments as well as efficiency change horizontal substitution and working
hours per FTE in the demand model The second scenario considered the impact of vertical
substitution on demand (49)
Although a comprehensive methodology has been used for healthcare manpower planning in
the Netherlands the models generally draw on a subjective interpretation of the demand
(expert opinion determines unmet demand)
235 New Zealand In New Zealand Health Workforce New Zealand (HWNZ) has the overall responsibility for
planning and development of the health workforce ensuring that staffing issues are aligned
with planning on the delivery of services and that New Zealandrsquos healthcare workforce is fit
for purpose (50) Currently HWNZ is undergoing workforce service review with the
objective of determining future health workforce requirements in 13 areas aged care
anaesthesia eye health palliative care musculoskeletal diseases gastroenterology youth
health diabetes mental health rehabilitation mother and baby healthcare for the Maori and
healthcare for Pacific Islanders (50) The HWNZ has used trend analysis and predicted
service utilisation to determine future requirements
The HWNZ has projected healthcare manpower (51) from the Health Workforce Information
Programme The supply model projection used a dynamic supply model to calculate
9
headcount and FTE from historical trends of new graduates return rates and retirements
rates Model parameters included current workforce inflow and outflow age sex ethnicity
and occupation (51) The demand model included the following parameters population
growth age sex ethnicity change in service change in the care model and the impact of
current and emerging technologies (51) HWNZ contends that due to the shift toward
population based healthcare delivery the total population health needs and achievements are
of particular importance in the forecast for demand
The projection models rely heavily on trend analysis and linear regression to estimate
manpower requirements While simple models can provide a quick snapshot of current needs
of population they lack the dynamic variation in scenarios and may misrepresent the demand
for healthcare
236 Scotland NHS Scotland Workforce section of Information Services Division has used trend analysis to
assess the supply and demand of medical dental nursing and midwifery allied health
professions health science ambulance staff psychology and pharmacy workforce (52)
Parameters such as changing demography and service utilisation were used for the demand
models and workforce dynamics workforce inflows and outflows for the supply models
(53)
Three methods dynamic models (stock and flow) healthcare professional-to-population ratio
demandutilisation-based models were used to project healthcare professional supply and
demand The model parameters included service utilisation service delivery changing
models of care workforce skill mix (roles and competencies) integration and engagement of
the workforce across the professions health and social care and care by sector (primary
secondary and tertiary) attendance rate treatment rates and for dentists average quantity of
treatment per dentist per year (54 55)
The supply model adopts stock and flow methods that are commonly used by many other
countries The demandutilisation-based models while more sophisticated require extensive
and complex data are susceptible to larger measurement error than projections based on
population ratios (53)
10
237 Singapore The National Manpower Council of the Singapore Ministry of Manpower is the decision-
making body for the National Manpower Planning Framework (56) The Council has adopted
an approach where the future demand for healthcare manpower is based on trend analysis of
population demographics and current healthcare workforce supply (57) In 2009-2011 the
overall supply of doctors registered nurses enrolled nurses dentists pharmacists and
optometrists increased across the board (58) As at 2012 Singapore had 10225 doctors
(doctor-to-population ratio of 1520) 60 of whom work in the public sector (58) 34507
nurses and midwives (nurse-to-population ratio of 1150) Strategies to manage the in- and
out-flows of healthcare professionals (ie doctor specialist nurse) and to recruit more
internationally qualified healthcare professionals from developed countries have been put in
place to reduce workload demand Included in this approach is the talent outreach programme
(36) The Healthcare 2020 Masterplan healthcare demand and workforce planning projection
parameters (57) included population growth and ageing education healthcare sector
productivity and change in healthcare worker role (ie role extension) immigration of
foreign healthcare workers and changes in the service delivery model The supply model
includes education and training of local professionals and the recruitment of non-local
graduates
The available data from the Ministry of Health are total number of healthcare professionals
by sectors (ie private and public sectors) and the professional-to-population ratio or vice
versa (58) No full-time equivalent information was considered are given For some
healthcare professionals professional-to-doctors ratio was used in the trend analysis
238 United Kingdom The Centre for Workforce Intelligence (CWI) provides advice and information to health and
social care systems on workforce planning and development in the United Kingdom (37)
CWI works closely with various organisations such as the NHS Information Centre the
medical Royal Colleges and other regulatory bodies to access the highest quality accurate
and timely data for healthcare manpower planning (37) The CWI has focused on the supply
of various health professions (medical dental nursing midwifery and other allied health
professionals) CWI released several reports in 2012 on technological economic
environmental political social and ethical factors that they consideruse in their supply and
demand projection models (59 60) Parameters used in the stock and flow model for medical
11
and dental supply include current workforce workforce participation working time spent
delivering service active workforce number of entering and returning to workforce
immigration attrition emigration those not available for work at present and retirement or
other attrition Parameters for the demand models include population size and characteristics
disease prevalence level of need and amount of service delivered by doctors and dentists
(61) Baseline need was measured by types of care (acute long-term or primary) and age sex
subgroups Population need was projected for each type of care using indicators such as
number of general practitioner (GP) visits per type of care or bed-days per type of care (61)
The CWI has adopted a need-based model where need was proxied by type of care This
approach assumes that lsquotype of carersquo appropriately reflects manpower requirements and that
all care is in the lsquoformalrsquo care sector However such a model cannot account for the
multidisciplinary nature of patient care or for the complex determinants of the location of or
patient placement for care (eg patients not discharged due to insufficient home care places
or social services)
239 United States The Health Resources and Services Administration (HRSA) and the National Center for
Health Workforce Analysis of the US Department of Health and Human Services are the
primary federal agencies for developing the tools to project the supply and demand for
healthcare professionals in the US (62 63) HRSA has released reports for doctors (by sub-
specialty) registered nurses (RN) licensed practical nurses (LPN) pharmacy dentistry
public health and clinical laboratory workforce (64) The stock and flow supply model
parameters included licence renewal retirement death disability local and international
graduates productivity career change and projected FTE Specific to RNs the model
captures the progression from one educational level to another and their interstate migration
(65)
The demand model used a utilisation-based approach and included parameters such as service
utilisation demographics insurance coveragehealthcare payment system patterns of care
delivery technology healthcare regulation and workload measures such as inpatient days
visits and nursing facility residents Care delivery patterns were expressed as healthcare
professional-to-population ratios by specialty and population segment defined by age sex
geographical location and insurance type The demand model projected FTErsquos by service
12
sector (65) The manpower gap between the supply and demand was expressed as an FTE
ratio (65) The supply models used trend analysis and stock and flow methods Supply model
parameters included graduates male-female ratio death retirement and projected FTE or
FTE-to-population ratio
HRSA has developed numerous models by healthcare professional groups and identified the
core model parameters The HRSA models could be improved by incorporating explicit
measures of externalities in the model parameters
24 Learning from commonly adopted technical approaches Although a demandutilisation-based approach was the most frequently used manpower
projection method need-based methods trend analysis and benchmarking (healthcare
professional to population ratio) were also used Demandutilisation-based models for
doctors dentists nurses and pharmacists project FTE based on service utilisation and have
usually included the following parameters hospital admissions and patient visits utilisation
weighted patient diagnosis outpatient visits treatment population growth and age
distribution economic indicators geographic factors insurance status and staffing intensity
For pharmacists the parameters have included the number of prescriptions filled growth in
prescription volume for pharmacists direct-to-consumer marketing and Aggregate Demand
Index (a measure of unmet demand at the population level) Many of the projection models
were stratified by service sector Data was derived from aggregate data from annual reports
historical utilisation data and doctor ndash population ratios Model validity and reliability was
compromised by data availability and quantity A positive linear relationship between
population and economic growth healthcare utilisation and demand was assumed by most
Model assumptions were often tested by scenario analysis including change in 1) supply (eg
number of graduates registered practitioners or entrants to higher education number of
training places migration retirement rates changes in funding reimbursement and
recruitment) 2) productivity and efficiency (activity rates) 3) population demographics 4)
burden of disease health and healthcare utilisation 5) economic development and 6)
patientstaff satisfaction The lack of normative standards defining work and productivity was
a major impediment to workload analysis Manpower requirements were most often
expressed in FTE
13
While methods for modelling manpower demand for other healthcare professionals (ie not
doctors) are not as well developed utilisation service delivery expected service growth and
number of vacant positions were used to project FTE requirements Some models based
demand projections on subjective assessment of demand workload and productivity
Scenarios testing change in population demographics service utilisation service provision or
practice structure disease incidence and prevalence and norms of care were used to assess
the projection performance
Existing supply models have used stock and flow methods to project headcount or FTE
These models have included parameters also used by supranational agencies (WHO and
OECD) and national models These included age sex number of graduates number of
registered doctors attrition (retirement immigration or emigration) and practice location
Adjusted trend analysis and straight-line projections have been used for physiotherapist
manpower supply projections The models projected manpower requirements by headcount
FTE or by healthcare professional-to-population ratio
Table 21 summarises projection methods demand and supply parameters for manpower
projection models by healthcare professionals (doctors dentists nurses Chinese Medicine
Practitioners (CMP) pharmacists (Pharm) chiropractors (Chiro) medical laboratory
technologists (MLT) occupational therapists (OT) optometrists (Opt) physiotherapists (PT)
radiographers (Radio) and dental hygienists (DentH) See Appendix B for the full list of
healthcare manpower planning and forecasting publications
14
Table 21 Projection methods demand and supply parameters for manpower projection models by healthcare professionals
Model methods Demand parameters Supply parameters Doctors Supply stock and Age Gender Population density Age Sex Population growth (11 66-77) flow trend analysis
Demand regression-based physician density model demandutilisation-based model need-based model benchmarking
Consultation length Number of consultations or procedures Morbidity Mortality Life expectancy Fertility rate Literacy GDP GNI Health expenditure Insurance status Epidemiology Inputs of other types of professionals
Retirement Death Migration Re-entrants Movement between occupations Graduates Work location Working hours Level of service Intensity of work
Dentists Supply stock and Population projection Income of Retirement Death Graduates (78-91) flow
Demand demandutilisation-based model need-based model
population Socio-demographic characteristics Projected utilisation increase Decayed missing and filled teeth rates Prostheses rates Rates of edentulousness Rates for other dental procedures Dental attendance pattern Patterns of disease Dentist-to-population ratio
Migration Number of new dental schools Number of other dental professionals Population estimates Gender ratio Working hour Productivity
Nurses Supply stock and Bed capacity occupancy rate Working Graduates Re-entrant (65 92-111) flow trend analysis
benchmarking
Demand benchmarking demandutilisation-based model trend analysis need-based model
hours Staffing intensity Utilisation of services Insurance status Population growth and aging Per capita income Burden of disease and injury Surgical intervention Raceethnicity classification Area of practice Nurse-to-physician ratio Staff norms Turnover rates Vacancy rates
Retirement Illness disability and death Working hour Migration Population Education Age Sex Career change Maternity Renewal rate
Chinese Medicine Practitioners
No specific published manpower planning and projection models
Pharmacists Supply stock and Graduation rates Population growth and Age Male Female ratio (112-126) flow
Demand trend analysis benchmarking demandutilisation-based model
aging Expiring drug patents Prescription volume Role extension Pharmacist-to-technician ratio Pharmacist-to-population ratio Direct-to-consumer marketing Insurance coverage Therapy improvement
Working hours Graduates Migration Retirement Death Workload Productivity
Chiropractors Supply stock and Patient visits per week Number of Age Sex Education Number (127-130) flow supply
description
Demand need-based model
services per chiropractic user Chiropractic use per capita Change in technology Change in patterns of the diseases Prevalence of back and neck symptoms
of graduates Geographic variation
Medical Supply trend Time units per activity Number of Number of graduates Working Laboratory analysis stock and laboratory tests per FTE Population hours Examination pass rates Technologists flow characteristics Field of practice MLT post (131132)
Demand demandutilisation model
Technology improvements vacancy rate
Occupational Supply stock and Current OT employment data Number of New graduates Attrition and Therapists flow vacancies (in FTE) Hospital and home retention rate (133-136)
Demand demandutilisation model
care average growth rate
Optometrists (137-141)
Supply stock and flow
Diagnosis and service hours Population growth
Age Sex Number of registered optometrists Local and non-local graduates Mortality
15
Demand trend analysis demandutilisation model
retirement or emigration
Physiotherapists Supply stock and Population growth Increase in personal Number of current vacant posts (142-145) flow
Demand trend analysis need-based model
healthcare expenditure Personal health insurance Number of in-patient outpatient and home-bound Patient visits
Retirement and attrition New graduates New registrants Registration renewals
Radiographers Supply stock and Service utilisation By procedures Age Number of graduates (146147) flow
Demand trend analysis demandutilisation
By modality (eg CT MRI ultrasound and therapeutic procedures) Population demographics and growth
Retirement and other attrition Training attrition Working hours (full-time or part-time) Field of practice
Dental Hygienists
No specific published manpower planning and projection models
25 Learning from local experience in workforce planning
251 Department of Health The Department of Health (DH) has conducted Health Manpower Surveys (HMS) for
healthcare professional groups with registration in Hong Kong since 1980 The surveys aim
to provide up-to-date information on the characteristics and employment status of healthcare
personnel working in Hong Kong The data compiled into aggregate health manpower
statistics aids the understanding the dynamics of healthcare professional manpower supply
However these are essentially repeated cross sectional surveys with no prospective predictive
function or objective thus cannot inform future needs without further analytical processing
252 Hospital Authority In Hong Kong much of the current manpower planning and forecasting for public sector has
been planned within the HA which adopted an integrated approach in projecting its future
healthcare workforce requirement The process starts with an overall assessment on the
future service demand which covers a comprehensive spectrum of HA services ranging from
in-patient day-patient to outpatient ambulatory and community services as well as clinical
supporting specialty services The service demand projection uses age- and specialty-specific
service utilisation rates in a given year as the base year and took into account anticipated
changes resulting from various factors The HA model included population growth and
ageing changes in the service delivery model and utilisation pattern medical technology
advancement and the development of new services
16
To estimate the required doctor manpower the projected service demand by specialty is
translated into work-related time units (man-hours) for doctors Together with respective
specialty-specific clinical coordinating committees the average time required for doctors to
carry out other work-related tasks is estimated Future doctor manpower requirement is then
determined by assuming some specialty-specific parameters such as on- and off-site call
coaching training and documentation and community service A similar work profile
analysis is conducted for nurses in close collaboration with nurse representatives and
identified key nursing components of general and psychiatric work within different clinical
settings
Besides the additional demand generated by projected service growth the future manpower
requirement also considers replacement demand generated by staff turnover including
retirement Additional demand also takes into account manpower shortfall at the baseline
The HA manpower planning and projection model has provided a service level model based
on historical data The model incorporates the impact of realised change in service delivery
on future manpower requirements While the HA provides a substantial proportion of in-
patient and outpatient care to the population the model cannot represent all healthcare need
(as proxied by utilisation) within the population A comparison of the HA model and the
territory wide model as presented in the report is not possible at this juncture
253 Hong Kong Academy of Medicine During the past decade the Hong Kong Academy of Medicine through the respective
specialist Colleges has reviewed medical manpower planning to determine the demand for
different medical specialities and the requirements for training posts Throughout the review
a number of important externalities pertinent to manpower planning including the dynamics
of the private and public interface patient culture and expectations and healthcare policy
were identified Individual colleges submitted estimates for manpower demand based on
caseload or overseas benchmarks and provided input on the specific factors expected to
influence future manpower need in their subspecialty (148) Individual colleges have found it
difficult to project specialist manpower demand primarily due to difficulties in estimating the
impact of the shift in practice location between the public and private sectors medical
tourism changing technology and areas of practice The Academy acknowledges the
limitation of assessing need from the medical perspective only and the difficulties in
17
accurately determining demand however the recommendations put forward provide valuable
input to manpower planning and forecasting in Hong Kong
254 Independent manpower planning and policy reviews The Business Professionals Federation of Hong Kong (BPF) healthcare manpower planning
report of September 2010 recommends a more scientifically based and inclusive approach to
manpower planning than what had been done previously (149) The report lists three
essential planning ingredients for effective planning 1) administrative data of past and
present manpower resources 2) research personnel equipped with skills and modelling tools
to undertake dynamic projections and 3) collaboration of all stakeholders
In June 2012 HKGolden50 an independent not-for-profit research organisation published
their fourth report ldquoHow to Create A World-Class Medical Systemrdquo with the aim to ldquoalert our
community that despite our World Class standard in Western and Chinese medicine our
healthcare system is on the brink of breaking down due to insufficient hardware and
personnel coupled with surging local and foreign demand for our quality medical servicesrdquo
(150) Based on HA data (ie public in-patient data only) the authors predicted a rapidly
increasing (2 a year) shortage in doctors (150) Factors influencing this shortage are
suggested to include 1) surging healthcare service demand deriving from population ageing
population growth and medical tourism (demand for private healthcare from mainland
China) and 2) stagnation supply due to retirement declining competency due to the loss of
senior staff generation gap feminisation of the work force high entry barriers for overseas-
qualified doctors and insufficient support staff (nurses and administrative staff)
26 Implications for the Hong Kong manpower project Many manpower-planning challenges have been previously identified in our review of work
already completed These include 1) persistent manpower shortages and mal-distribution of
the healthcare workforce 2) population ageing 3) rising incidence of chronic diseases 4)
lack of resources for medical training 5) lack of cooperation within and between institutions
and 6) poor reliability and credibility of current manpower forecasting models
The country level models identified lack consensus on the methodological approach for
healthcare manpower planning and forecasting and illustrated data-related problems
including a lack of standardisation in variable parameterising limited access to the quantity
and quality of the data required limited information on productivity workload and
18
utilisation and limited information on treatment efficacy and effectiveness These models
used routine administrative data (utilisation or financial data) or data from specialised
surveys andor applied a predetermined set of assumptions in the demandutilisation models
Many country level models were deterministic and lacked the flexibility to examine the
dynamic relationships between manpower supply and patient outcomes In addition the
linear analysis adopted by many was problematic due to the underlying non-linearity of the
data More current manpower planning models used system dynamic methods considered
need supply and demand simultaneously projected manpower requirements from multiple
perspectives and provided a more complete estimate of future manpower requirements There
was little evidence (in both qualitative and quantitative terms) of the impact (or evaluation) of
these human resource-planning strategies on healthcare practice
Models that did not specify benchmark standards or methods to determine the relationship
between the volume of service number of patients and the number of staff were unable to
robustly estimate the number of staff required for specific activities Induced demand (as
measured by utilisation data and doctor defined diagnosis in demand models) was a
characteristic problem of manpower planning and forecasting and was a major limitation of
the current country level manpower planning and forecasting models world-wide and locally
In Hong Kong population ageing rising incidence of non-communicable disease and
historical healthcare utilisation patterns is related to rapidly increasing demand for healthcare
service Elsewhere changing patterns of referral location of service delivery (public and
private) technology scope of practice (including complementarity and substitution between
healthcare professionals) feminisation of the workforce and healthcare policy (such as
extended personal insurance coverage increased in public healthcare benefits) and service
delivery regulation (such as the recommendations of the Review Committee on Regulation of
Pharmaceutical Products) have been implicated with increased demand for healthcare service
(151) The increased demand arising from the mainland visa-free tourist policy are expected
to increase future manpower demand Economic and healthcare policy (ie Closer Economic
Partnership Arrangement II (CEPA)) changing population demography inter-regional and
inter-sectoral (publicprivate) movement of healthcare professionals and patients and
medical tourism are expected to increase future healthcare demand and further complicate
manpower projection
19
Manpower projection is a highly data intense activity Although public sector in-patient and
outpatient data suitable for manpower projections is readily available a substantial
proportion of patient care occurs in the private sector where data is less complete more
complex or simply unavailable Such an environment necessitates manpower projection
models that are adaptable to changing parameters and model structures
20
3 Projecting demand
The overall model for Hong Kong manpower projection comprises two sub models the
utilisation model and the supply model Building on an endogenous historically-informed
base case scenario (where current utilisation (proxying demand) and supply are assumed to
be in equilibrium) This model can be adopted to adjust for the impact of externalities and
policy options The difference between the demand and supply projections (in terms of total
FTE numbers year-on-year and annual incremental FTE from 2012 -2041) is the manpower
lsquogaprsquo or lsquosurplusshortfallrsquo
31 Modelling demand After a thorough literature review assessing the suitability to the local context and
exploratory analyses with the various possible projection modes three approaches for
projecting healthcare utilisation are shortlisted for further consideration the lsquoempirically
observed historicalrsquo (EOH) the lsquomacroeconomic scenario drivenrsquo (MSD) and the lsquoAndersen-
typersquo (Andersen) approach within a lsquotop downrsquo and lsquobottom uprsquo framework (Figure 31)
Given the lack of required data elements for the Andersen approach namely detailed
individual-level data on predisposing and enabling factors as well as panel studies locally the
two lsquotop downrsquo approaches are eventually executed
21
Figure 31 Approaches to estimating demand
311 Empirically observed historical (EOH) approach The EOH projection model expresses utilisation as the product of population P and utilisation
rate R
Utilisation z(y) at year y = ( amp)times)( amp)+
where P(asy) is the population age- sex-specific groups (as) at year y and R(asy) is the
utilisation rate by age- sex-specific groups (as) at year y Census and Statistics Department
population projections are used for the projected P(asy) historical data inform the
computation of R(asy)
3111 Support vector machine (SVM) SVM2 is used to estimate the utilisation rate of each age- sex-specific group at a given year
SVM is a kernel-based neural network that maps an input x to an output y where wi is the
weight and B is the bias term by the following expression
y = wκ(1 1) + B
As compared with linear and exponential regression models SVM has the flexibility to
lsquoevolversquo an optimal structure according to historical data A Gaussian radial basis kernel ie
κ 1 4 = exp (C 1 minus 4 ) is used as it is the lsquouniversal approximatorrsquo The structure is well
regularised and the generalisation ability of the network is maximized
SVM learn the utilisation rate pattern from historical data expressed as
amp|=gt gt ampgt|=gt amp|=
⋮ where ri is the utilisation rate of age- sex-specific group (ai si) at year yi A specific network
construction algorithm is designed to evolve the structural parameters wi and B The trained
2 Artificial neural networks (ANN) and specifically the Support Vector Machine (SVM) used for these projections are able to predict the complex relationships driving utilisation Support vector machine (SVM) is a supervised learning method that analyses data and recognizes data patterns in the historical data As such this artificial intelligence predicts for each given variable the corresponding outcome SVM was chosen for the projection as it will lsquoevolversquo an optimal structure and estimate the service utilisation of a given individual based on characteristics such as age and sex
22
SVM projects the utilisation rate R(asy) of an age- sex-specific group (a s) at projection
year y = 2012 2013 hellip using the following equation
) asy = ABCDE minus( minus B)gt + (
2minusGgtB)gt + (amp minus ampB)gt
+ H B
The utilisation volume at year y is computed as
) asy times asy +
where P(asy) is the population size of the age-sex group (as) at year y
3112 Regression-based method (RBM) In the RBM approach )( amp) is estimated by Poisson regression which assumes
I amp ~KLKM(N amp ) amp )
log ) amp = R + S amp
where I amp denotes the utilisation volume and N amp is an offset term in age group
sex and year amp For the projection of all utilisation measures except average length of
stay the population of age group sex and year amp are used for the offset term N amp
For the projection of average length of stay the offset term is the number of discharges
Since log ) amp is a linear function of amp ) amp is an exponential function of amp all age-
and sex-specific demand variables are included in the Poisson regression For utilisation
measures where there are clear differences in slopes across age- sex-specific groups
(including public and private day case acute care in-patient discharge and average length of
stay (ALOS) as well as HA general outpatient (GOP) specialist outpatient (SOP) accident
and emergency (AampE) and private outpatient visits) the projections have age- sex-specific
intercepts and slopes For all other utilisation measures (public long stay discharge and
average length of stay as well as all DH service visits) the age- sex-specific intercepts and
slopes are constrained to be the same across age and sex groups
23
In sensitivity analyses the Poisson regression projections are compared with projections
based on a linear trend As utilisation rates in linear trend projections may drop below 0
linear projections are used only for utilisation rates that show an increasing trend The
utilisation rate increase is assumed to be the same across all age- sex-specific groups for
SOP AampE private outpatient and all DH visit rates projections lest projections for
individual age and sex groups reach zero
A weighted linear regression is deployed where the population in age group sex and
year amp are used as weights (ie amp ) The following function is minimised with respect
to R and S
( amp)() amp minus R minus S amp)gt
+T
Projections of rates are given as
) amp = R + S amp
The weights are needed to ensure the estimated age sex and year-specific rates ) amp are
consistent with the observed rates ) amp
3113 Time series approach
As the elderly and rehabilitation service provision is land-driven a time-series analysis is
used to project the historical growth patterns for elderly and rehabilitation services assuming
growth trends u(y) as follow-
Linear trend Where the number of places cases is a linear function of projection year y-
U amp = amp + V
Exponential decay trend Where the number of applications is expected to decrease exponentially-
= ACWXT + YU amp
24
Constant trend Where service provision is stable and held constant as at the baseline year-
U amp = UZ
312 Macroeconomic scenario drive (MSD) approach As in the EOH-RBM approach the MSD approach expresses utilisation as the product of
population P and utilisation rate R
Utilisation z(y) at year y = ( amp)times)( amp)+
where P(asy) is the age- sex-specific population (as) at year y and R(asy) is the age- sex-
specific utilisation rate (as) at year y Population projections of the Census and Statistics
Department are used for P(asy) )( amp) is estimated as follows-
= ) 2011 times 1 + D TWgtZ) amp
Three methods (constant growth historical growth and capped growth) are used to calibrate
healthcare utilisation trends against observed data
3121 Constant growth rate The constant growth rate method sets lsquoexcess healthcare pricecost inflationrsquo3 growth at 02
public sector and 1 for the private sector consistent with the international literature and to a
previous local exercise (152) The public sector growth rate for each variable is benchmarked
to the OECD (1999)(153) As the OECD reports utilisation growth rates of 04 per year the
model assumes a growth rate of 02 (154) because half of the growth is due to the net
growth in the utilisation rate while the other half is assumed to be due to demographic
changes
3 The lsquoexcess healthcare pricecost inflationrsquo method is based on the United Kingdom Treasuryrsquos Wanless projection method which requires health expenditure to be broken down by age sex unit cost and activity level (ie volume in terms of healthcare utilisation) The projections take into account aspects of medical inflation (that is medical inflation over and above per capita Gross Domestic Product growth) changes in the utilisation of healthcare services as a result of demographic change and total health care expenditure (activity levels multiplied by projected unit costs) This comprises two components medical price increase and per capita volume growth according to Huberrsquos review of health expenditure among OECD countries in 1999
25
Private sector growth rates are benchmarked to OECD (1999)(153) data for the United States
and Switzerland as these two countries predominantly provide healthcare in the private
albeit regulated sector The OECD reports an annual growth of 27 and 24 for the
United States and Switzerland respectively As the healthcare in Hong Kong is equally shared
between the public and private sector the utilisation growth rate in the private sector is
assumed to be 1 (154)
3122 Historical growth rate For the historical growth rate method lsquoexcess healthcare pricecost inflationrsquo D is estimated
from the public and private hospital in-patient discharges and outpatient visits in Hong Kong
To estimate D the following function is minimised
|I amp minus ] amp | T
where I amp is the utilisation volume (number of public and private sector in-patient
discharge and outpatient visits) and ] amp is the estimated utilisation volume for that year
] amp = amp times) amp +
) amp = ) 2011 times 1 + D TWgtZ
3123 Capped growth rate As it may be inappropriate to assume ever exponentially increasing utilisation rates the
capped growth rate method is applied to the projection of discharge rates and outpatient (SOP
and GOP) visit rates such that rates would not indefinitely grow exponentially as follows
A) amp = )( 2011)times + H
1 + CWX TWT^W_
B`abBc defghBbf
where ) 2011 is the age- sex-specific utilisation rate for the baseline year 2011
For average length of stay projections a biased exponential function is used rather than the
sigmoid function to prevent the projection falling below zero
ijNk amp = ijNk 2011 times CWX TW_ + H lB+mc mnobfmfhB+p defghBbf
26
The parameters w α micro and B are estimated by optimising the objective function
|I amp minus ] amp | T
as in the historical growth rate model
32 Model comparison The top down methods (EOH and MSD) with relatively fewer data requirements are based
on the expectation that simple aggregate models provide more reliable and reproducible
healthcare utilisation projections Further consistent comprehensive data (number of
observations and data-points) are available for the public sector Much less reliable data are
available for the private sector The performance of a model is represented by the sum of
absolute rate error q r U
q r U = se amp r minus )e( amp) +T
where q r U is the sum of absolute rate error of model θ isin EOH-SVM MSD-constant
growth rate MSD-historical growth rate on utilisation rate u
amp r is the estimated utilisation rate on u of age-sex group (as) at year y by
model θ
Ru(asy) is the actual utilisation rate on u of age-sex group (as) at year y
se
Note that the index y in the formulate of E(θ u) has different range for different utilisation
measures y isin 2005 2006 hellip 2011 for public sector and private outpatient utilisation and
y isin 2007 2008 hellip 2011 for private sector inpatient utilisation Table 31 lists the
estimation error of EOH-SVM MSD-constant growth rate and MSD-historical growth rate
for in-patient and outpatient utilisation parameters The EOH-SVM models give a better
model fit than the MSD models (Table 31) The EOH-SVM estimation errors are smaller
than those for the MSD-constant growth or MSD-historical growth rate models
27
Table 31 Comparison of EOH-SVM MSD-constant growth MSD-historical growth rate estimation errors
EOH-SVM MSD ndash constant growth rate
MSD ndash historical growth rate
Day case discharge rate (public) 093 756 153 Acute care in-patient discharge rate (public) 082 383 205 Acute care in-patient bed day rate (public) 729 4465 1719 Long stay discharge rate (public) 003 008 005 Long stay bed day rate (public) 1109 2842 2021 SOP visit rate 367 809 808 GOP visit rate 404 1695 1006 AampE attendance rate 226 530 469 Day case discharge rate (private) 018 057 048 Acute care in-patient discharge rate (private) 011 042 033 Acute care in-patient bed day rate (private) 106 245 228 Private outpatient rate 9903 25269 25194
In a sensitivity analysis of in-patient and outpatient utilisation parameters as would be
expected the EOH-RBM linear based model gives projections that are less steep than the
Poisson model (which assumes an exponential trend) however the data do not support a
linear trend more than an exponential trend The mean squared error is smaller for most
utilisation measures projected by the RBM-Poisson model (Table 32) To avoid negative
values age- sex-specific utilisation measures in the RBM linear model share the same
intercepts and slopes
28
Table 32 Comparison of the linear and exponential RBM utilisation projections mean squared error (MSE) for selected demandutilisation variables
Demandutilisation variables Natural scale Log scale
Linear Exponential Linear Exponential
Public day cases 258 180 00038 00026 Public specialist outpatient 700 522 00014 00007 visits Public general outpatient visits 1189 830 00038 00017 Accident and Emergency visits 1654 1258 00021 00016 Private day cases 163 176 00029 0003 Private acute care in-patient 613 669 00028 00013 discharges Private outpatient visits 771405 561993 0032 0026 DH Student and child services 1022 982 121 009 DH Port Health Office 020 018 018 005
SVM models have the ability to generalize learn from examples adapt to situations based on
historical data and generalize patterns from historical data in response to unknown situations
SVM implicitly detects complex nonlinear relationships between independent and dependent
variables When responding to nonlinearity between the predictor variables and the
corresponding outcomes the model automatically adjusts its structure to reflect these
nonlinearities The predictor variables in SVM undergo multiple nonlinear transformations
and can thereby potentially model much more complex nonlinear relationships than RBM
Regression models can also be used to model complex nonlinear relationships However
these models require an explicit search for these relationships by the model developer and
these may not be known or well understood Appropriate transformations may not always be
available for improving model fit and significant nonlinear relationships may go
unrecognized by model developers
When complex data and relationships are involved as compared to RBM SVM would in
theory at least and empirically shown by the model fit statistics above provide a more robust
projection outcome more flexibly integrates complex data into the model and is not
dependent on a pre-determined hypotheses about the relationships between model variables
For these reasons the EOH-SVM approach has been used for all model projections in the
report
29
Support vector machine (neural network analysis) time series and stock and flow method
are variously deployed to project the required number of dentists as a function of healthcare
demandutilisation and dentist supply to 2041 The projections are stratified by service type
(in-patient outpatient academic) and by service location (public or private sector)
321 International dentist utilisation rates The dentist outpatient visit rates as published by the OECD for HK (2011) (065 visits per
person-year (152)) is benchmarked against OECD individual country trends (highest rate 31
visits per person per year in Japan) (Figure 32) Based on this comparison Hong Kong
dental outpatient visit rates are among the lowest among the OECD countries and are not
projected to increase through 2041
Figure 32 Comparison of Hong Kong and OECD dental outpatient visit rates (152153)
33 Parameters for dental demand model projections The demand projection considers population growth projections historical healthcare
utilisation volumes for 2 sectors and 5 settings and the number of students in the academic
sector For the public sector all DH Government Dental Clinics and School Dental Clinic
attendances (2001-2011) and for the private sector commercial and non-governmental
organisation visits are available for the utilisation projections Table 33 specifies the setting
variables parameterisation and data sources
30
Table 33 Demand model variables parameterisation and data sources Variables Parameterisation Data source
Population to be served Resident population Population forecast
Age- sex-stratified1
Age- sex-stratified1 CampSD 1999 through 2011 CampSD population projections 2012 - 2041
Outpatient Government Dental Clinic (GDC) Number of dental visits
Civil servants pensioners and dependents HA staff and dependents General public
Age- sex-stratified1 Department of Health 2001-2011 THS 2002 2005 2009 and 2011
School Dental Clinic (SDC) Number of dental visits Age- sex-stratified1 Department of Health 2001-2011
Commercial sector (private and non-governmental organisations) Number of dental visits
Age- sex-stratified1 THS 2002 2005 2009 and 2011
Academic Aggregated student intake and graduates
UGC-funded dental programme 2002 -2013
1All data were stratified by age and sex groups in 5-year age categories
331 Adjusting for under-reporting THS under-reporting rates for private dental clinic utilisation are estimated for the THS 2002
2005 2009 and 2011 and the difference between the numbers of Government Dental Clinic
(GDC) visits reported in the THSs and those provided by the DH The DH provides both the
aggregated number of GDC visits and age-sex specific number of GDC visits where the age-
sex distribution is estimated from one of the 42 dental clinics4
Instead of applying an age-sex specific under-reporting adjustment to the commercial dental
clinic visits the data is only adjusted for the total number of visits
t+cu( amp) = tvwx( amp)timesi(amp)
yz|z~(T)where A(y) is the under-reporting adjustment factor of year y ie i(amp) = z Ccedil yAumlAring(+T)
Vadj(asy) adjusted number of commercial dental clinic visits of age-sex group (as)
at year y
VTHS(asy) number of commercial dental clinic visits of age-sex group (as) at year y
reported in THS
DTHS(asy) number of DH dental clinic visits of age-sex group (as) at year y reported
in THS and
Dactual(y) actual number of DH dental clinic visits at year y reported by DH
4 httpwwwdhgovhkenglishclinictimetabledchtm
31
34 Demand indicators
341 Private dental sector For the private dental sector commercial dental clinics and non-governmental organisation
(lsquoCharitable organisation dental clinic visitsrsquo or a lsquoDental clinic under Charitable
organisationrsquo) age- sex- specific dental visits are estimated from the THS 2002 2005 2009
and 2011 and adjusted for under-reporting Due to the confounding impact of the economic
crisis dental visit data from THS 2008 have been excluded from the analysis After adjusting
for population demographics private sector dental clinic visits and visit rates are projected to
rise gradually throughout the period (Figure 33(a) and 34(a)) Dental clinic visits by sex are
highest during the working years falling at retirement and rising again for the elderly in the
later years of the projection (Figure 33(b)) While the number of visits increased for middle-
aged females utilisation rates by sex remain relatively consistent through out however
increased rates are noted for younger females (Figure 33(c) 34(b) and 34(c))
num
ber o
f priv
ate
dent
al c
linic
visits
4500000
4000000
3500000
3000000
2500000
2000000
1500000
1000000
500000
0 2005 2010 2015 2020 2025 2030 2035 2040
year
Historical Projection all historical utilisationProjection all except 2008 historical utilisation (best guestimate)
Figure 33(a) Historical and projected number of private sector dental visits (2002-2041 excluding 2008)
32
Figure 33(b) Projected number of private sector age-specific dental visitsndash male (2002-2041 excluding 2008)
Figure 33(c) Projected number of private sector age-specific dental visits ndash female (2002-2041 excluding 2008)
33
0
01
02
03
04
05
06
07
age-
sex
stan
dard
ized
annu
al d
enta
l visi
t rat
e (p
rivat
e de
ntal
clin
ic)
Historical Projection
2000 2005 2010 2015 2020 2025 2030 2035 2040 year
Figure 34(a) Historical and projected annual age-sex standardized private sector dental visit rates (2002-2041 excluding 2008)
Figure 34(b) Projected annual age specific private sector dental visit rates - male (2002-2041 excluding 2008)
34
Figure 34(c) Projected annual age specific private sector dental visit rates ndash female (2002-2041 excluding 2008)
35
342 School Dental Clinic As the historical number of dentists in the DH School Dental Clinic (SDS) shows a constant
trend (ie 29 dentists each year between 2005 and 2011) the corresponding constant trend
projection from the baseline year (ie 29 dentists) is illustrated in Figure 35
Historical 35 Projection
30
25
20
15
10
5
0 2005 2010 2015 2020 2025 2030 2035 2040
year
Figure 35 Historical and projected number of FTE dentists in the School Dental Clinics (2005-2041)
343 Government Dental Clinic Dental visits5 (by civil servants pensioners and dependents HA staff and dependents and
the general public) to the 42 DH Government Dental Clinics (GDC) (11 of which provide
dental service to the general public) under the Department of Health declined from 1999 to
2011 (Figure 36)
num
ber o
f den
tist F
TEs
in S
choo
l Den
tal C
linic
of D
epar
tmen
t of H
ealth
5 Hong Kong Annual Digest of Statistics 2005 and 2013
36
635370
669060
702760
736450
num
ber o
f GD
C v
isits
exc
ludi
ng g
ener
al p
ublic
ses
sion
s
600
214080
224550
235020
num
ber o
f civ
il se
rvan
ts a
nd H
A st
affs
19981998 20002000 20022002 20042004 20062006 20082008 20102010 20122012year
203
Figure 36 Number of HA and civil servant Government Dental Clinic visits (excluding general public sessions) (1999-2011)
The number of GDC visits by civil servants (active civil servants civil servant pensioners
and their dependants) HA staff and dependents and the general public is projected using an
EOH-SVM approach as follows
IUEacuteVC= KNtilde OumlUumlaacute agraveLLacirc Vamp YLagraveLauml C=agraveMacirc ECMLKMC= Matilde atildeCECMatildeCMacirc
= L]C KNtilde YLagraveLauml C=agraveMacirc ECMLKMC= Matilde atildeCECMatildeCMacirc EKEUaumlacircLKM
times OumlUumlaacute agraveLLacirc =acircC KNtilde YLagraveLauml C=agraveMacirc ECMLKMC= Matilde atildeCECMatildeCMacirc EKEUaumlacircLKM
IUEacuteVC= KNtilde OumlUumlaacute agraveLLacirc Vamp aringi acircNtildeNtilde Matilde atildeCECMatildeCMacirc
= L]C KNtilde aringi acircNtildeNtilde Matilde atildeCECMatildeCMacirc EKEUaumlacircLKM
times OumlUumlaacute agraveLLacirc =acircC KNtilde aringi acircNtildeNtilde Matilde atildeCECMatildeCMacirc EKEUaumlacircLKM
IUEacuteVC= KNtilde OumlUumlaacute agraveLLacirc Vamp acircℎC eacuteCMC=auml EUVaumlLY
= EKEaumlUacircLKM times OumlUumlaacute agraveLLacirc =acircC KNtilde acircℎC eacuteCM=auml EUVaumlLY
As these population groups have different growth trajectories (HA staff HA staff
dependents active civil servants civil servant pensioners and civil servant dependents) each
is projected independently as follows
37
A Hospital Authority staff
A staff inter-proportion approach is used to project the number of HA lsquootherrsquo staff by
professional group relative to the doctor-nurse-other staff historical ratio and the doctor and
nurse projections undertaken previously (Figure 37 - 310) as follows
doctor (D) nurse (N) rsquootherrsquo staff (O)
or
Normalized ratio 1 ecirc euml
y y
The historical ecirc
y euml
y pairs are used in a linear regression model as follows
N(amp)Uuml(amp) = j
I(amp)Uuml(amp) = Eacute
I(amp)Uuml(amp) + Y
and then applied to project the number of lsquootherrsquo staff
= Uuml(amp)timesj I(amp)
N amp Uuml(amp)
2 25 3 35 4 45 5
62
64
66
68
7
72
74
76
78
8
oth
er s
taff-
to-D
octo
r rat
io
Historical 1998 - 2003 Historical 2004 - 2012 Projection 2013 - 2041
Nurse-to-Doctor ratio
Figure 37 Historical and projected N-O pairs
38
2000 2005 2010 2015 2020 2025 2030 2035 20400
1
2
3
4
5
6
7
8 o
ther
sta
ff-to
-Doc
tor r
atio
Historical 1998 - 2003 Historical 2004 - 2012 Projection 2013 - 2041
year
Figure 38 Historical and projected lsquootherrsquo staffndashto-doctor ratio (1999-2041)
Relative to the previous doctor and nurse projections the projected number of lsquootherrsquo staff
grows slowly throughout the period (Figure 39)
0
10000
20000
30000
40000
50000
60000
num
ber o
f HA
staf
f
Doctor Historical Doctor ProjectionNurse Historical Nurse ProjectionOther staffs Historical Other staffs Projection
2000 2005 2010 2015 2020 2025 2030 2035 2040 year
Figure 39 Historical and projected number of doctors (black) nurses (blue) and other staff (magenta) (1999-2041)
39
nu
mbe
r of H
A st
aff
100000
90000
80000
70000
60000
50000
40000
30000
20000
10000
0 2000 2005 2010 2015 2020 2025 2030 2035 2040
year
Historical Projection
Figure 310 Historical and projected number of HA staff (1999-2041)6
B HA staff dependants
As the projected number of HA staff is neither age- nor sex-specific the number of HA staff
dependants (as reported in the THS 2002 2005 2008 2009 and 2011) is expressed as a
linear proportion (where βHA is the average of the five historical ratios (βHA = 099)) of the
number of HA staff
IUEacuteVC= KNtilde aringi acircNtildeNtilde atildeCECMatildeMacirc
= IUEacuteVC= KNtilde aringi acircNtildeNtilde
times IUEacuteVC= KNtilde atildeCECMatildeMacirc agraveLLacirc EC= aringi acircNtildeNtilde (Swiacute)
The projected number of HA dependents increases sharply throughout the period (Figure
311)
6 Note This scenario which is used to project the number of HA staff for the dentist demand model is not intended to suggest HA staffing requirements
40
0
10000
20000
30000
40000
50000
60000
70000
80000
90000
100000 nu
mbe
r of d
epen
dant
s of
HA
staf
f
2015 2020 2025 2030 2035 2040 year
Figure 311 Projected number of HA staff dependants (1999-2041)
C Civil servant
The number of civil servants is projected as linearly proportional to Hong Kong population as
follows
ampiigravex = iwicirc amp timesS
where ACS(y) is the aggregated number of civil servants at year y
AHK(y) is the aggregated Hong Kong population size at year y and
S is the number of civil servants per Hong Kong resident
The number of civil servants are projected to increase gradually throughout the period
(Figure 312)
41
0
20000
40000
60000
80000
100000
120000
140000
160000
180000
200000 Nu
mbe
r of c
ivil s
erva
nts
Historical Projection
1995 2000 2005 2010 2015 2020 2025 2030 2035 2040 year
Figure 312 Historical and projected number of civil servants per Hong Kong population (1999-2041)7
Using a stock and flow model the age- sex-specific (as) number of civil servants by year y
is estimated as follows
aacute( amp) lt 60aacuteiumlntildeZ( amp) = 0 KacircℎC=ALC
The number of new recruits ΔC(y+1) at year y+1 is estimated as the difference between
A(y+1) (the aggregated estimated number of civil servants) and the total number civil
servants at the end of year y
∆aacute amp + 1 = iigravex amp + 1 minus aacuteiumlntildeZ( amp) +
The relative age- sex-specific distribution of new civil servant recruits at year y (2010)
aacutefmouml amp is expressed as
7 This scenario which is used to project the number of civil servants for the dentist demand model is not intended to suggest civil servant staffing requirements
42
aacutefmouml 2010 =aacutefmouml aacutefmouml 2010+
and the age- sex-specific number of new civil servant recruits is
aacutefmouml amp + 1 = ∆aacute amp + 1 aacutefmouml
The age- sex-specific number of civil servants at year y+1 is expressed as
aacute amp + 1 = aacuteiumlntildeZ amp + aacutefmouml amp + 1
D Civil servant pensioner
A stock and flow model is used to project the age-specific number of civil servant pensioners
from 2012 as follows
aacuteU==CMacirc acircKYotilde = EC=agraveLKU acircKYotilde minus KUacircNtildeaumlKA + LMNtildeaumlKA
where the stock is the number of pensioners at the current and previous year the outflow are
those pensioners who are older than 85 years of age or have passed away and the inflow is
the number of civil servants who are 60 years of age Both the number and advancing age of
civil servant pensioners is as expected increasing sharply throughout the period (Figure 313
and 314)
43
0
20000
40000
60000
80000
100000
120000
140000
160000
180000
200000 nu
mbe
r of c
ivil s
erva
nt p
ensio
ners
2015 2020 2025 2030 2035 2040 year
Figure 313 Projected number of civil servant pensioners (2013 to 2041)
Figure 314 Projected age-specific number of civil servant pensioners (2013-2041)
E Civil servant dependents
Civil servant and pensioner dependents are categorized as children aged below 19 and the
spouse of the civil servant or pensioner as illustrated in Figure 315
44
Children Age 0 - 18
Active civil servant Spouse
Civil servant pensioner Spouse
Age 17 - 59
Age 60+
Figure 315 Civil servant and pensioner dependents by age group
iumlntildeZA population approach is used to project each category of dependents where RguacuteBpc RobemntildeZugraveand Robem are calibrated from the age-specific number of dependants (as at 2822010)
iumlntildeZ ntildeZugraveprovided by Civil Service Bureau8 ( RguacuteBpc = 0661 Robem = 0673 and Robem = 0658)
as follows
poundKacircauml MUEacuteVC= KNtilde YℎLaumlatilde=CM KNtilde YLagraveLauml C=agraveMacirc
= RguacuteBpctimes MUEacuteVC= KNtilde YLagraveLauml C=agraveMacirc Matilde ECMLKMC= eacuteCatilde VCaumlKA 60
poundKacircauml MUEacuteVC= KNtilde EKUC KNtilde YLagraveLauml C=agraveMacirc eacuteCatilde VCaumlKA 60
iumlntildeZ= Robemtimes MUEacuteVC= KNtilde YLagraveLauml C=agraveMacirc Matilde ECMLKMC= eacuteCatilde VCaumlKA 60
poundKacircauml MUEacuteVC= KNtilde EKUC KNtilde YLagraveLauml C=agraveMacirc eacuteCatilde 60+
ntildeZugrave= Robemtimes MUEacuteVC= KNtilde YLagraveLauml C=agraveMacirc Matilde ECMLKMC= eacuteCatilde 60 +
The number of civil servant dependents (children under 19 and spouses of active civil
servants) are relatively stable whereas the number of spouses of civil servant pensioners
increase sharply throughout the period (Figure 316)
8 There are 38496 dependants with unknown date-of-birth (DOB) These are spread across different age groups according to the relative age distribution of the dependants with known DOB
45
num
ber o
f civi
l ser
vant
dep
enda
nts
120000
100000
80000
60000
40000
20000
0 2015 2020 2025 2030 2035 2040
year
children aged 0-18spouses aged 19-59spouses aged 60+
Figure 316 Projected number of civil servant dependants less than 19 years of age spouses aged 19 - 59 and spouses aged 60 or older (2012-2041)
GDC Utilisation projection
The populations (civil servants and dependents HA staff and dependents and general public)
using the GDC do so with different utilisation rates GDC visits are projected using the
historical population specific GDC utilisation by stratifying THS visits by population group
proportion as follows
tsectyigrave amp minus to amptg amp = tg amp times tg amp ++ + tuacute amp
tsectyigrave amp minus to amptuacute amp = tuacute amp times tg amp ++ + tuacute amp
amptoto amp = to amp times amp+ to
where tsectyigrave amp is the aggregated number of GDC visits at year y
amp is the aggregated number of GDC visits by the general public at year yto
46
is the age- sex-specific self-reported number of GDC visits by active and
pensioner civil servants and their dependents at year y
tg amp
is the age- sex-specific self-reported number of GDC visits by Hospital
Authority staff and their dependents at year y
tuacute amp
amp is the age- sex-specific self-reported number of GDC visits by general
public at year y
to
A U shaped curve is noted for civil servant pensioners and dependents GDC visits throughout
the period GDC visits for other groups remains stable (Figure 317) As expected visit rates
increase by age for active and pensioner civil servants civil servant dependents (Figure 318
ndash 321) For the general public visit rates increase for men but not women with age (Figure
322 ndash 323)
0
100000
200000
300000
400000
500000
600000
700000
800000
Num
ber o
f GD
C v
isits
Historical civil servant related populationHistorical HA related populationHistorical general public Historical total Projection civil servant related population Projection HA related population Projection general public Projection total
2005 2010 2015 2020 2025 2030 2035 2040 year
Figure 317 Historical and projected number of GDC visits by general public civil servants pensioners and dependents and HA staff and dependents (2001 -2041)
47
Figure 318 Projected age-specific GDC visit rate for civil servants - male (2002ndash2041)
Figure 319 Projected age-specific GDC visit rate for civil servants - female (2002ndash2041)
48
Figure 320 Projected age-specific GDC visit rate for civil servant pensioners (2002ndash2041)
Figure 321 Projected age-specific GDC visit rate for civil servant dependents (2002ndash2041)
49
Figure 322 Projected age-specific GDC visit rate for general public ndash male (2002ndash2041)
Figure 323 Projected age-specific GDC visit rate for general public ndash female (2002ndash2041)
50
344 Public inpatient setting Inpatient dental specialty discharges are based on HA (2005-2011) inpatient discharge
records The number of dental specialty discharges increased sharply throughout the period
(Figure 324(a)) Increased utilization volumes in inpatient discharges are observed for both
sexes with large increases in women most notable in the 19-39 60ndash69 and over 75 age
groups (Figure 324(c)) While the age-standardised inpatient discharge rates remain
relatively stable throughout the period (Figure 325(a)) rates for women are higher than for
men in the 19-39 and over 60 age groups (Figure 325(c))
Figure 324 (a) Historical and projected number of inpatient dental specialty discharges (2005-2041)
51
Figure 324(b) Projected number of inpatient dental specialty discharges - male (2005-2041)
Figure 324(c) Projected number of inpatient dental specialty discharges - female (2005-2041)
52
0
0000020
0000040
0000060
0000080
000010
000012
000014 ag
e-se
x st
anda
rdize
d an
nual
inpa
tient
disc
harg
e ra
te
Historical Projection
2005 2010 2015 2020 2025 2030 2035 2040 year
Figure 325(a) Projected annual age-sex standardised inpatient dental specialty discharge rates (2005-2041)
Figure 325(b) Projected annual age-specific inpatient dental specialty discharge rates - male (2005-2041)
53
Figure 325(c) Projected annual age-specific inpatient dental specialty discharge rates -female (2005-2041)
345 Academic sector The dentist demand projection for the academic sector is based the number of dental students
(2001 ndash 2011) enrolled in dental education at the Faculty of Dentistry the University of Hong
Kong (Figure 326) As the program duration changed from 5 years to 6 years from 2012
there is a sharp increase in the number of students in the dental school per year The number
of students in dental education are projected to remain constant from 2018 to 2041
54
Nu
mbe
r of d
enta
l stu
dent
s
350
300
250
200
150
100
50
0
Historical Projection
2005 2010 2015 2020 2025 2030 2035 2040 year
Figure 326 Historical and projected number of dental students Faculty of Dentistry HKU (2001-2041)
35 Converting healthcare utilisation to full time equivalents (FTEs) Two regression-based approaches are used to convert healthcare demandutilisation to dentist
FTEs by service sector (public (HA and DH) and the commercial sector (private and non-
governmental organisations)) and independently projected to adjust for work-related
differences FTE is expressed as a linear combination of the utilisation measures
351 Private sector The number of private FTE dentists (Figure 327) is expressed as a linear proportion of
number of private dental visits
IUEacuteVC= KNtilde E=LagraveacircC atildeCMacircLacirc bullpoundq = IUEacuteVC= KNtilde E=LagraveacircC atildeCMacircauml agraveLLacirc timesRoparaBszlig+hm
where αprivate is the number of private dentist FTEs per private sector dental visit
As there are only two overlapping THS and HMS survey years (2005 and 2009) the
calibrated αprivate is 0000441
55
nu
mbe
r of d
entis
t FTE
s in
priv
ate
sect
or
2000
1500
1000
500
0 2005 2010 2015 2020 2025 2030 2035 2040
year
Historical Projection SupplyProjection Demand
Figure 327 Historical and projected number of private sector FTE dentists (2005-2041)
352 Public sector ndash Government Dental Clinics The number of FTE dentists in GDC is expressed as a linear proportion of the number of
GDC visits
IUEacuteVC= KNtilde bullpoundq atildeCMacircLacirc LM OumlUumlaacute = IUEacuteVC= KNtilde OumlUumlaacute agraveLLacirc times Rsectyigrave
where αGDC is the number of FTE dentists in GDC per GDC visit
The historical αGDC increased from 0000284 at year 2005 to 00003391 at year 2011 (Figure
328) The optimal projection of αGDC the average of Rsectyigrave and the αGDC at the baseline year
is used for the GDC FTE dentist projection
The projected number of GDC FTE dentists shows a U shaped curve increasing gradually
from 2025 throughout the period Figure 329
56
2005 2010 2015 2020 2025 2030 2035 20400
0000050
000010
000016
000020
000025
000031
000035
000040 α
GD
C
Historical Projection historical trendProjection optimal
year
Figure 328 Historical and projected αGDC from 2012 to 2041
0
50
100
150
200
250
num
ber o
f den
tist F
TEs
in D
epar
tmen
t of H
ealth
Historical Projection SupplyProjection Demand
2005 2010 2015 2020 2025 2030 2035 2040 year
Figure 329 Historical and projected number of FTE dentists in the Department of Health
57
353 Public inpatient setting The number of FTE dentists in public inpatient setting is estimated as follows
IUEacuteVC= KNtilde bullpoundq atildeCMacircLacirc LM EUVaumlLY LMEacircLCMacirc CacircacircLMeacute
= IUEacuteVC= KNtilde atildeCMacircauml ECYLaumlacircamp atildeLYℎ=eacuteCtimesRBfo+hBmfh
where αinpatient is the number of FTE dentists in public inpatient setting per dental specialty
discharge
The number of FTE dentists in the HA is projected to increase sharply throughout the period
Figure 330
0
2
4
6
8
10
12
num
ber o
f FTE
den
tists
(Hos
pita
l Aut
horit
y)
Historical Projection
2005 2010 2015 2020 2025 2030 2035 2040 year
Figure 330 Historical and projected number of FTE HA dentists (2005-2041)
58
354 Academic sector The academic sector dentist demand projection is based on the number of dental students in
Hong Kong
IUEacuteVC=KNtilde bullpoundq atildeCMacircLacirc LM YatildeCEacuteLY CYacircK=
= IUEacuteVC=KNtilde atildeCMacircauml acircUatildeCMacirc times R+g+cmaBg
gt = 00833) is the number of FTE dentists working in academic sector per where αacademic (
gtntilde
dental student
The historical data is backward projected from historical number of students and the αacademic
calibrated for 2013 data The number of FTE dentists in the academic sector is projected to
remain stable throughout the period Figure 331
0
5
10
15
20
25
num
ber o
f FTE
den
tist (
acad
emic
sect
or)
Historical Projection
2005 2010 2015 2020 2025 2030 2035 2040 year
Figure 331 Historical and projected number of dentists in academic sector (2005-2041)
59
4 Projecting dental supply
The Dental Council of Hong Kong (DCHK) dental data (age- sex-specific) for 2012 is used
for the dental supply base case Data (for past and projected number of dental graduates)
from the Faculty of Dentistry the University of Hong Kong the DCHK and from the DH
Healthcare Manpower Survey (HMS) on Dentists 2004-2007 amp 2009 are used for the supply
projections
41 Models for dental supply The overall dental supply model is a non-homogenous Markov Chain Model where
workforce systems are represented as ldquostocks and flowrsquosrdquo (Figure 41) Flow refers to
manpower supply over a period of time Stock denotes manpower supply at a particular point
in time
Figure 41 Dental supply model for Hong Kong
There are five age- sex-specific stocks by year (asy) in the model
npre number of pre-existing registrants
nlocal number of local graduates
nnon-local number of non-local graduates
ncurrent number of current registrants
60
nactive number of active and available registrants
Flow in the supply model represents change in the stocks and is projected by determining the
number of
a) current registrants (total number of local graduates non-local graduates and pre-
existing registrants)
ncurrent(asy) = prenewal(y) times npre(asy) + nlocal(asy) + nnon-local(asy)
where prenewal(y) is the licence renewal proportion at year y
b) active and available registrants
nactive(asy) = ncurrent(asy) times pactive(asy)
where pactive(asy)is the active proportion
FTEs by service sector c at year y are calculated as
ne yen nneAEligOslashinfinplusmn a s y timespyenplusmnAEligOslashmicropart(a s y c)timesh(a s y c)FTE y c = Median working hours per week per FTE
where psector(asyc) is the proportion of dentists working in the service sector c at year y and
h(asyc) is the average number of working hours per dentist
The supply projection is based on the stocks and also the parameters prenewal(y) pactive(asy)
psector(asyc) and h(asyc) The average is used to project the parameters
42 Determinants of supply projecting stock and flow
421 Baseline adjustments The age- and sex-specific number of dentists in 2012 provided by the DCHK includes
dentists resident in and outside Hong Kong To separate these two sub-groups the age- and
sex- specific average proportion resident in and outside Hong Kong is estimated for 2002-
2010 from the DCHK Annual Reports
61
422 Movement of dentists into and out of Hong Kong As some dentists may change their residency the movement of Dentists in and out of HK
from 2008 to 2012 as identified in the Gazette lists for dentists 2007-2012 (Table 42) are
used to calculate the average transition proportion This proportion is used to redistribute the
dentists in the two sub-groups (ie 032 of the dentists resident in Hong Kong will leave
Hong Kong and 123 of the dentists resident outside Hong Kong return to Hong Kong each
year from 2012 to 2041)
Table 41 The number and proportion of newly transition 2008-2012
2008 2009 2010 2011 2012 Average proportion
In HK agrave Out of HK 4 (022) 6 (032) 9 (047) 4 (020) 8 (040) 032
Out of HK agraveIn HK 2 (109) 2 (107) 2 (104) 6 (297) 0 (000) 123
According to the Gazette lists for 2007-2012 only one new graduate was out of Hong Kong
in the year graduated The model assumes that all the graduates remain in Hong Kong for the
first year of graduation
423 Total number of registrants The total number of registrants is defined as the number of pre-existing registrants (pool of
dentists multiplied by the registration renewal proportion [as provided by the DCHK]) and
the newly eligible registrants (new dental graduates from the Faculty of Dentistry HKU) and
non-local graduates entering the pool by year
Table 43 lists the projected number of local graduates for 2013-2018 as provided by the
Faculty of Dentistry HKU The estimated number of local graduates is held constant after
2018 As all dentists renew their license to practise every year the average renewal
proportion rate of 2005-2010 is used to estimate the annual registration renewal proportion
which is 992
Table 42 Projected number of local dental graduates (2013-2018) Local Projected Graduates Graduates 2013 2014 2015 2016 2017 2018 2019 2020 2021 2022 Faculty of Dentistry HKU
51 49 55 55 56 52 52 52 52 52
62
424 Number clinically active The number of clinically activeavailable registrants is more relevant for workforce
projection than the total number of registrants in the dentist pool The supply model stratifies
clinically inactiveunavailable dentists by age into four categories no longer practicing in the
dental profession but not retired natural attritionretirement otherwise unavailable and
otherwise deregistered The estimated proportion of clinically inactiveunavailable is derived
from the DH HMS on Dentists 2004-2007 and 2009 The age- sex-specific five year average
proportion is applied to the projection
4241 No longer practicing in the dental profession but not retired Using data from the HMS on Dentists the proportion of dentists lsquono longer practicing in the
dental profession but not retiredrsquo by sex (clinically trained qualified and registeredenrolled
dentists who are no longer practicing clinically) is projected to 2025 (Figure 42)
Figure 42 lsquoNo longer practicing in the dental profession but not retiredrsquo projections by sex (2012-2025) (DH HMS for Dentists)
4242 Natural attritionretirement The projection for lsquonatural attritionretirementrsquo is age- and sex-specific (Figure 43) Women
who remain in the workforce retire at an earlier age than their male counterparts
63
Figure 43 The proportion of dentists lsquonatural attritionretiredrsquo by age - male (2012-2025)
Figure 44 The proportion of dentists lsquonatural attritionretiredrsquo by age - female (2012-2025)
4243 Otherwise unavailable ldquoOtherwise unavailablerdquo (those who have moved away from Hong Kong) dentists are
projected from the HMS on dentists by sex (Figure 14)
64
Figure 45 lsquoOtherwise unavailablersquo projections by sex (2012-2025)
43 Supply externalities
431 Workforce participation and differential work capacity The supply model stratifies the dentist population by four service sectors (private public
[Government Hospital Authority] and academic and subvented) as each has different work
patterns and female-male ratios (Figure 46)
The supply model estimates the age- sex-specific proportion of clinically active dentists by
service sector and location differential work capacity work pattern and standard working
hours from the HMS for Dentist 2004-2007 amp 2009
65
0
10
20
30
40
50
60
70
80
90
100
2004 2005 2006 2007 2009 2012
Prop
ortio
n
Year
Private Public (Government Hospital Authority) Academic Subvented
Figure 46 Distribution of dentists by sector 2004-2007 2009 amp 2012
44 Converting workforce supply to full time equivalents (FTEs) The model uses the age- sex-specific stratified average working hours to determine the total
hours worked by sector The average working hours in lsquoprivatersquo is capped at 46 hours per
week and in lsquopublicrsquo lsquoacademicrsquo and lsquosubventedrsquo working hours are capped at 44 hours per
week (equivalent to 1 FTE)
66
45 Dentist supply projection from 2012-2041 Table 45 presents the detailed projection outcomes for each of the variables in the supply
model and the total FTE supply projection from 2015-2040 The public sector FTE
represents the lsquoGovernment and Hospital Authorityrsquo FTE projections
Table 43 Dentist supply projection for 2012-2040 Year 2012 2015 2020 2025 2030 2035 2040 Pre-existing registrants 2237 2359 2574 2768 2951 3113 3261
Number of registrants resident in Hong Kong1 2030 2146 2346 2526 2692 2840 2972
Number of registrants after renewal2 2011 2124 2323 2501 2666 2811 2943
Number of graduates Local3 52 55 52 52 52 52 52
Non-local4 8 8 8 8 8 8 8
Newly eligible registrants 60 63 60 60 60 60 60
Total number of registrants 2071 2188 2383 2561 2726 2872 3003
Clinically inactiveunavailable No longer practising in the dental profession but not retired5
30 32 34 35 36 35 35
Natural attritionretirement5 87 111 223 385 553 804 942
Otherwise unavailable5 21 22 23 23 22 21 21
Otherwise deregistered6 1 1 1 1 1 1 1
Number of inactive registrants7 139 166 281 444 612 861 1000
Number of clinically activeavailable registrants8 1932 2022 2103 2117 2114 2010 2004
Total FTE9 1849 1936 2013 2027 2024 1925 1918
1 The proportion of dentists resident in Hong Kong is based on the data provided by DCHK 2 The renewal rate is based on the data provided by DCHK 3 The number of local graduates are from the Faculty of Dentistry HKU number of expected graduates are
held constant from 2018 4 The average number of candidates that passed Part III license examination from 1986-2010 is used as the
number of non-local graduates in the projection 5 Proportion of clinically inactiveunavailable from the DH HMS for Dentists (2004-2007 and 2009) 6 Assume 1 permanent dentist deregistration per year 7 The total number of clinically inactiveunavailable dentists is calculated by summing the number of dentists in
the categories of ldquoNo longer practising in the dental profession but not retiredrdquo ldquoNatural attritionretirementrdquo ldquoOtherwise unavailablerdquo and ldquoOtherwise deregisteredrdquo
8 Total number of clinically activeavailable dentists 9 Total projected FTE
67
5 Gap analysis
The gap analysis quantified the difference between the projected demand for and supply of
dentists for the base case (assumed demand and supply was at equilibrium from 2005 - 2011)
The base case is further adjusted for the impact of policy options (service enhancements in
the Government Dental Service dental service for patients with intellectual disabilities
Community Care Fund Elderly Dental Assistance Programme and outreach dental service for
the elderly) and is jointly presented in the lsquopolicy optionrsquo scenario Finally the base case best
guestimate and policy option scenarios are combined for the best guestimate projections The
supply base case projects dentist FTE supply
68
51 Method Three methods (annual number of FTEs year-on-year FTE and the annual incremental FTE)
were used to quantify FTE dentist demand and compared to the base case supply projections
for Hong Kong
52 Annual number of FTE The number of FTE dentists (by SVM) required in year amp was as a function of the various
utilisation measures in year amp as described in the previous sections where -
Number of FTE amp = M(B) amp Y(B) B
was the projected utilisation measure L in year amp and the Y(B) the estimated FTE M(B) ratio M(B) amp
53 Year-on-Year FTE The year-on-year FTE method quantified the year-on-year difference between demand and
supply as follows -
amp = UumlCEacuteMatilde amp minus kUEEaumlamp(amp)
where (amp) was the year-on-year FTE at year amp UumlCEacuteMatilde(amp) was the FTE demand at year amp
and kUEEaumlamp(amp) is the FTE supply at year amp
54 Annual incremental FTE The annual incremental FTE method quantified the change in the demand supply gap from
the previous year as follow -
aelig amp = amp minus (amp minus 1)
where aelig amp was the annual incremental FTE at year amp amp was the year-on-year FTE at year
amp and (amp minus 1) is the year-on-year FTE from the previous year
69
55 Base case scenario For the base case scenario the FTE demand supply gap analysis projects a growing shortfall
of dentists (Figure 51 ndash 53) through 2040 The on average year-on-year projected FTE
shortfall at 2040 was 360 (Table 52 ndash 53) The Hong Kong dental service is dominated by
the private sector (around 75 of dentist working in private sector) demand growth is slower
in the later years of the projection However as a large proportion of dentists will retire
within this period the decreasing rate of dentist supply is greater than the increasing rate of
dental demand
0
500
1000
1500
2000
2500
3000
S
D1
num
ber o
f FTE
den
tists
Historical (S) Projected supply Base case(D1) Projected demand Base case
2005 2010 2015 2020 2025 2030 2035 2040 year
Figure 51 Projected number of dentists FTEs Base case supply and demand (Shaded area 5th-95th percentile)
70
2015 2020 2025 2030 2035 2040
-400
-200
0
200
400
600
800
D1
Year
-on-
year
FTE
gap
(Y1) Supply (Base case) + Demand (Base case)
year
Figure 52 Year-on-year FTE gap Base case demand model (Shaded area 5th-95th percentile)
D1
(Z1) Supply (Base case) + Demand (Base case)
2015 2020 2025 2030 2035 2040
Annu
al in
crem
enta
l FTE
gap
40
20
0
-20
-40
-60
year
Figure 53 Annual incremental FTE gap Base case demand model (Shaded area 5th-95th percentile)
71
Table 51 Base case projected year-on-year supply-demand gap [a negative number indicates surplus]
Best estimate 5th percentile 95th percentile 2015 2020
0 20
-169 -267
52 104
2025 2030
93 161
-301 -301
211 308
2035 2040
309 362
-188 -155
467 526
Table 52 Base case projected annual incremental supply-demand gap [a negative number indicates surplus]
Best estimate 5th percentile 95th percentile 2015 2020
-6 13
-31 -11
2 18
2025 2030
14 25
-4 14
21 27
2035 2040
20 6
14 -1
23 7
72
6 Policy options
The projection models took an empirical approach rather than asserting any normative level
of demand or supply assuming that supply and demand were in balance (no shortfall or
surplus of human resources) historically Because of this conservative assumption in the base
case projections different sensitivity scenarios are simulated to test alternative normative
preferences or policy actions The proposed policy options scenarios include-
a) Dental care support
b) Service enhancement - Government Dental Clinic
61 Dental care support The modelling approach for the policy initiatives vis Community Care Fund - Elderly Dental
Assistance Programme (Policy 1) Dental Service for Patients with Intellectual Disability
(ID) (Policy 2) and the Outreach Dental Service for the Elderly (Policy 3) used in the
projections follow
73
Modelling approach for policy initiatives
Policy 1
For the Community Care Fund - Elderly Dental Assistance Programme (Policy 1) the number
of dental visits induced by the referral of recipients of Old Age Living Allowance (OALA) to
the participating dentists is projected as follows
IUEacuteVC= KNtilde bullpoundq atildeCMacircLacirc LMatildeUYCatilde Vamp atildeCEacuteMatilde CDacircC=MaumlLacircamp 3 bullm
= IUEacuteVC= KNtilde Niji =CYLELCMacirc Ieumliacuteoslashiacute timesUEacircotildeC =acircC =eoh+iquestm
times IUEacuteVC= KNtilde bullpoundq atildeCMacircLacirc EC= Niji =CYLELCMacirc AℎK UC acircℎC C=agraveLYC(Am)
ecircealmpara bd eumliacuteoslashiacute paramgBoBmfh The proportion of OALA recipient ϒOALA = remains constant from ecircealmpara bd mpcmparapT +`mc ntildeiexclnot
2012 to 2014 such that the number of OALA recipients is expressed
IUEacuteVC= KNtilde Niji =CYLELCMacirc
= IUEacuteVC= KNtilde CaumlatildeC=aumlamp eacuteCatilde 65ugrave
times =KEK=acircLKM KNtilde Niji =CYLEacircLCMacirc radiceumliacuteoslashiacute
The proportion of OALA recipients ϒOALA is estimated using 2014 data
Age group Number of OALA recipients Number of elderly Proportion of OALA recipient
(as at end-Feb 2014) (as at end-Dec 2013) γOALA
65 ndash 69 109000 294900 03696
70 ndash 74 87000 213100 04083
75 ndash 79 90000 210300 04280
80 ndash 84 78000 157500 04952
85+ 51000 142600 03576
The uptake rate ruptake and the number of FTE dentists per OALA recipient who use the
service we3 are estimated as
ruptake = 025 100
Am = 415000
74
num
ber o
f den
tists
due
to C
omm
unity
Car
e Fu
nd E
lder
ly De
ntal
Ass
istan
ce P
rogr
amm
e 120
100
80
60
40
20
0 2015 2020 2025 2030 2035 2040
year
Figure 61 Number of dentists induced by policy 1
Policy 2
The number of dental visits induced by policy 2 is linearly proportional to the number of
eligible patients (CSSA recipients who are aged 18 or above and are with moderate ID) as
follows
IUEacuteVC= KNtilde atildeCMacircauml agraveLLacirc LMatildeUYCatilde Vamp KaumlLYamp 2 Iogt
= IUEacuteVC= KNtilde CaumleacuteLVaumlC EacircLCMacirc Iasympy times iEE=KagraveC =acircC S+ooparabszligm
times IUEacuteVC= KNtilde atildeCMacircauml agraveLLacirc EC= CaumlLeacuteLVaumlC EacircLCMacirc agraveasympy
A population rate approach is used to estimate the number of eligible patients
IUEacuteVC= KNtilde CaumleacuteLVaumlC EacircLCMacirc Iasympy
= aringKMeacute ∆KMeacute EKEUaumlacircLKM eacuteCatilde 18 K= VKagraveC times =KEK=acircLKM KNtilde aeligUuml Rasympy
The number of dental visits induced is expressed as
75
IUEacuteVC= KNtilde atildeCMacircauml agraveLLacirc LMatildeUYCatilde Vamp EKaumlLYamp 2 Iogt
= aringKMeacute ∆KMeacute EKEUaumlacircLKM eacuteCatilde 18 K= VKagraveC Ilaquougrave
times =KEK=acircLKM KNtilde EE=KagraveC R+ooparabszligm
times IUEacuteVC= KNtilde atildeCMacircauml agraveLLacirc EC= CaumlLeacuteLVaumlC EacircLCMacirc agraveasympy
where
=KEK=acircLKM KNtilde EE=KagraveC R+ooparabszligm
= =KEK=acircLKM KNtilde aeligUuml Rasympy timesiEE=KagraveC =acircC (S+ooparabszligm)
The proportion approved αapprove is fixed as at 2013 ie αapprove = 400 10242600 =
00000391 and projected in Figure 62
25
20
15
10
5
0 2015 2020 2025 2030 2035 2040
year
Figure 62 Number of private dental visits induced by policy 2
Policy 3
The number of FTE dentists for the Outreach Dental Service for the Elderly is assumed to be
linearly proportional to the number of patients in Residential Care Homes for the Elderly
DEs
num
ber o
f den
tist F
TEs
indu
ced
byPi
lot P
roje
ct o
n De
ntal
Ser
vice
for P
atie
nts
with
Inte
llect
ual D
isabi
lity
76
IUEacuteVC= KNtilde bullpoundq atildeCMacircLacirc LM Outreach Dental Service for the Elderly bullo
= IUEacuteVC= KNtilde EacircLCMacirc LM RCHEsDEs Io+hBmfh timesUumlCMacircLacirc-acircK-EacircLCMacirc E=KEK=acircLKM (Rhm+a)
IUEacuteVC= KNtilde EacircLCMacircLM RCHEsDEs Io+hBmfh )aacutearingq
= IUEacuteVC= KNtilde EaumlYC E=KagraveLatildeCatilde Vamp Uumlq IldquordquoAumllsquo
rsquolsquo
timesNYYUEMYamp =acircC Sbggeo+fgT timesCMCacirc=acircLKM =acircC Somf
where the penetration rate βpen is assumed to be 08 and the occupancy rate βoccupancy is 66000
82000 = 0805 As the outreach dental team normally comprises a dentist and a dental
surgery assistant the dentist-to-patient proportion αteam is 24 56000 = 000043 The
projected number of FTE dentists for the outreach pilot project is shown in Figure 63
0
5
10
15
20
25
30
35
40
45
num
ber o
f den
tist F
TEs
indu
ced
byO
utre
ach
Dent
al C
are
Prog
ram
me
for t
he E
lder
ly
2015 2020 2025 2030 2035 2040 year
Figure 63 Number of FTE dentists induced by the outreach pilot project
The solid lines in Figures 64 ndash 66 for the projected number of dentist FTEs year-on-year
FTE gap and annual incremental FTE gap represent the additive impact to the best
guestimate scenario of increased dental care support The on average year-on-year projected
dentist FTE shortfall for 2025 was 177 (on average annual incremental shortfall of 18)
77
(Tables 61-62) The on average year-on-year projected dentist FTE shortfall for 2040 was
499 (on average annual incremental shortfall of 8) The three dental care support initiatives as
compared to the base case increases the overall dentist FTE shortfall throughout the
projection period
num
ber o
f FTE
den
tists
3000
2500
2000
1500
1000
500
0 2005 2010 2015 2020 2025 2030 2035 2040
S
D1
D2
year
Historical (S) Projected supply Base case(D1) Projected demand Base case(D2) Projected demand Base case adjusted for Dental care support
Figure 64 Projected number of dentist FTEs lsquoDental care supportrsquo (Shaded area 5th-95th percentile)
78
2015 2020 2025 2030 2035 2040
-400
-200
0
200
400
600
800
D1
D2
Year
-on-
year
FTE
gap
(Y1) Supply (Base case) + Demand (Base case)(Y2) Supply (Base case) + Demand (Base case adjusted for Dental care support)
year
Figure 65 Year-on-year dentist FTE gap lsquoDental care supportrsquo (Shaded area 5th-95th percentile)
60
Annu
al in
crem
enta
l FTE
gap
40
20
0
-20
-40
-60
year
D1D2
(Z1) Supply (Base case) + Demand (Base case)(Z2) Supply (Base case) + Demand (Base case adjusted for Dental care support)
2015 2020 2025 2030 2035 2040
Figure 66 Annual incremental dentist FTE gap lsquoDental carersquo (Shaded area 5th-95th percentile)
79
Table 61 Staffing ratio projected year-on-year supply-demand gap [a negative number indicates surplus]
Best estimate 5th percentile 95th percentile 2015 2020
65 83
-108 -206
134 178
2025 2030
177 268
-219 -196
304 422
2035 2040
434 499
-65 -12
597 669
Table 62 Staffing ratio projected annual incremental supply-demand gap [a negative number indicates surplus]
Best estimate 5th percentile 95th percentile 2015 2020
-8 17
-33 -7
1 22
2025 2030
18 29
0 18
26 31
2035 2040
24 8
18 1
26 9
62 Service enhancement - Government Dental Clinic (GDC) As GDC dental service volume is supply driven the lsquoservice improvement in GDCrsquo model
assumed a predefined utilisation growth as estimated by the Department of Health Dental
Service The on average year-on-year projected FTE shortfall for 2015 2025 and 2040 for
dentists was 35 146 and 415 respectively (on average annual incremental shortfall for 2015
2025 and 2040 of -2 14 and 6 respectively) (Figure 67 ndash 69 Tables 63 ndash 64) lsquoService
improvement in GDCrsquo as compared to the dental care support had a smalerl net impact on the
overall FTE shortfall
80
num
ber o
f FTE
den
tists
3000
2500
2000
1500
1000
500
0
Historical (S) Projected supply Base case(D1) Projected demand Base case(D3) Projected demand Base case adjusted for service enhancement on Government Dental Clinic
D3
D1
S
2005 2010 2015 2020 2025 2030 2035 2040 year
Figure 67 Projected number of dentist FTEs Service enhancement - GDC (Shaded area 5th-95th percentile)
Year
-on-
year
FTE
gap
800
600
400
200
0
-200
-400
(Y1) Supply (Base case) + Demand (Base case)(Y3) Supply (Base case) + Demand (Base case adjusted for service enhancement on Government Dental Clinic)
D3 D1
2015 2020 2025 2030 2035 2040 year
Figure 68 Year-on-year FTE gap Service enhancement ndash GDC (Shaded area 5th-95th percentile)
81
40
20
0
-20
-40
-60
(Z1) Supply (Base case) + Demand (Base case)(Z3) Supply (Base case) + Demand (Base case adjusted for service enhancement on Government Dental Clinic)
D1 D3
2015 2020 2025 2030 2035 2040 year
Figure 69 Annual incremental FTE gap Service enhancement - GDC (Shaded area 5th-95th percentile)
Table 63 Service enhancement in GDC projected year-on-year supply-demand gap [a negative number indicates surplus]
Annu
al in
crem
enta
l FTE
gap
Best estimate 5th percentile 95th percentile 2015 2020
35 73
-140 -216
89 160
2025 2030
146 214
-250 -251
267 362
2035 2040
362 415
-139 -104
523 580
Table 64 Service enhancement in GDC projected annual incremental supply-demand gap [a negative number indicates surplus]
Best estimate 5th percentile 95th percentile 2015 2020
-2 13
-26 -11
7 18
2025 2030
14 25
-4 14
21 27
2035 2040
20 6
14 -1
23 7
82
7 Recommendations ndash Best Guestimate
The overall FTE accumulated FTE gap and annual incremental FTE gap for the demand
model best guestimate (demand base case and policy options) and the supply model base case
are presented in Figures 71 ndash 73 and Tables 71- 72 The on average year-on-year projected
FTE shortfall for dentists in 2015 2025 and 2040 was respectively 100 230 and 552 (on
average annual incremental shortfall of -3 18 and 8 respectively)
num
ber o
f FTE
den
tists
3000
2500
2000
1500
1000
500
0 2005 2010 2015 2020 2025 2030 2035 2040
year
Historical (S) Projected supply Base case(D1) Projected demand Base case(D4) Projected demand Best guestimate
D4
D1
S
Figure 71 Projected overall FTE dentist demand (Best guestimate) and FTE dentist supply (base case)
83
2015 2020 2025 2030 2035 2040
-400
-200
0
200
400
600
800
D1
D4
Year
-on-
year
FTE
gap
(Y1) Supply (Base case) + Demand (Base case)(Y4) Supply (Base case) + Demand (Best guestimate)
year
Figure 72 Year-on-year FTE gap (Best guestimate) and FTE dentist supply (base case)
60
2015 2020 2025 2030 2035 2040
-60
-40
-20
0
20
40
D1D4
Annu
al in
crem
enta
l FTE
gap
(Z1) Supply (Base case) + Demand (Base case)(Z4) Supply (Base case) + Demand (Best guestimate)
year
Figure 73 Annual incremental FTE gap (Best guestimate) and FTE dentist supply (base case)
84
Table 71 Best guestimate model projected year-on-year supply-demand gap [a negative number indicates surplus]
Best estimate 5th percentile 95th percentile 2015 2020
100 136
-69 -154
159 228
2025 2030
230 321
-167 -145
355 471
2035 2040
487 552
-15 43
650 719
Table 72 Best guestimate model projected annual incremental supply-demand gap [a negative number indicates surplus]
Best estimate 5th percentile 95th percentile 2015 2020
-3 17
-28 -7
5 22
2025 2030
18 29
0 18
26 31
2035 2040
24 8
18 1
26 9
85
8 Comparison of 2012-2041 and 2015-2064 projections
The final model presents two demand best guestimate scenario (based on the 2012-2041 and
the 2015-2064 CSampD demographic projections respectively) and the supply base case FTE
projections as well as the year-on-year and annual incremental FTE gap (Figure 61 ndash 63
Tables 61 ndash 62) The demand best guestimates adopting the 2015-2064 vs 2012-2041
CSampD demographic projections on average year-on-year FTE shortfall are similar across the
projection period
num
ber o
f den
tist F
TEs
2500
2000
1500
1000
500
0 2005 2010 2015 2020 2025 2030 2035 2040
year
(D)
(D)
(S)
Historical (S) Supply Base case(D) Demand Best guestimate using 2012 - 2041 demographic projection (D) Demand Best guestimate using 2015 - 2064 demographic projection
Figure 81 Historical and projected number of doctor FTEs Base case supply and demand (Shaded area 5th-95th percentile)
86
2015 2020 2025 2030 2035 2040
-200
0
200
400
600 (Y)
(Y)
num
ber o
f den
tist F
TEs
(Y) FTE gap using 2012 - 2041 demographic projection (Y) FTE gap using 2015 - 2064 demographic projection
year
Figure 82 Year-on-year FTE gap Base case demand model (Shaded area 5th-95th percentile)
50
num
ber o
f den
tist F
TEs
0
-50
2015 2020 2025 2030 2035 2040
(Y)
(Y)
(Y) Annual incremental FTE gap using 2012 - 2041 demographic projection (Y) Annual incremental FTE gap using 2015 - 2064 demographic projection
year
Figure 83 Annual incremental FTE gap Base case demand model (Shaded area 5th-95th percentile)
87
Table 81 Best guestimate projected year-on-year supply-demand gap (assuming retirement =gt65 years of age) [a negative number indicates surplus]
Best estimate (2012-2041
demographic projection)
5th
percentile 95th
percentile
Best estimate (2015-2064
demographic projection)
5th
percentile 95th
percentile
2015 2020
100 136
-69 -154
159 228
92 122
-76 -162
145 204
2025 2030
230 321
-167 -145
355 471
198 265
-186 -181
309 399
2035 2040
487 552
-15 43
650 719
446 532
-37 34
594 685
Table 82 Best guestimate projected annual incremental supply-demand gap (assuming retirement =gt65 years of age) [a negative number indicates surplus]
Best estimate (2012-2041
demographic projection)
5th
percentile 95th
percentile
Best estimate (2015-2064
demographic projection)
5th
percentile 95th
percentile
2015 2020
-3 17
-28 -7
5 22
-4 14
-25 -8
4 19
2025 2030
18 29
0 18
26 31
14 26
-2 17
21 28
2035 2040
24 8
18 1
26 9
27 11
23 8
30 11
88
9 References
1 Birch S Kephart G Murphy GT OBrien-Pallas L Alder R MacKenzie A Health human resources planning and the production of health Development of an extended analytical framework for need-based health human resources planning J Public Health Manag Pract 200956-61
2 Maynard A Policy forum Australiarsquos health workforce medical workforce planning Some forecasting challenges Social Research 200639(3)
3 OBrien-Pallas L Baumann A Donner G Tomblin-Murphy G Lochhaas-Gerlach J Luba M Forecasting models for human resources in health care J Adv Nurs 200033(1)120-9
4 OBrien-pallas L Birch S Baumann A Integrating workforce planning human resources and service planning Policy Anal 2001 (December 2000)9-12
5 Bloor K Maynard A Planning human resources in health care Towards an economic approach an international comparative review 2003
6 Chung SH Jung DC Yoon SN Lee D A dynamic forecasting model for nursing manpower requirements in the medical service industry Service Business 20094(3-4)225-36
7 World Health Organisation Models and tools for health workforce planning and projections 2010
8 Roberfroid D Leonard C Stordeur S Physician supply forecast Better than peering in a crystal ball Hum Resour Health 2009710-22
9 Etzioni DA Finlayson SR Ricketts TC Lynge DC Dimick JB Getting the science right on the surgeon workforce issue Arch Surg 2011146(4)381-4
10 Cooper R Adjusted needs Modeling the specialty physician workforce AANS Bulletin 2000 Spring 200013-4
11 Etzioni DA Liu JH Maggard MA Ko CY The aging population and its impact on the surgery workforce Ann Surg 2003 Aug238(2)170-7
12 World Health Organisation 2012 Available from httpwwwwhointhrh 13 World Health Organisation Coordinated health and human resources development
Report of WHO Study Group 1990 14 World Health Organisation Health workforce supply and requirements projection
models 1999 15 World Health Organisation Assessment of human resources for health 2002 16 World Health Organisation Scaling up HIVAIDS care service delivery amp human
resources perspectives 2004 17 World Health Organisation A guide to rapid assessment of human resources for health
2004 18 World Health Organisation Assessing financing education management and policy
context for strategic planning of human resources for health 2007 19 World Health Organisation Human resources 2009 20 World Health Organisation Measuring health workforce inequalities methods and
application to China and India 2010 21 World Health Organisation Monitoring the building blocks of health systems A
handbook of indicators and publications 2010 22 Tools and Guidelines Committee GHWA Human Resources for Health Action
Framework Cambridge MA USA 2009 23 Organization for Economic Cooperation and Development (OECD) 2012 [cited 2012
Dec 13] Available from httpwwwoecdorghealthheathpoliciesanddata 24 Simoens S Hurst J The Supply of Physician Services in OECD Countries 2006
89
25 OECD OECD Reviews of Health Systems OECD Publishing2012 26 OECD Health Workforce Demographics An overview The Looming Crisis in the
Health Workforce How Can OECD Countries Respond OECD Publishing 2008 27 Buchan J Calman L Skill-mix and policy change in the health workforce Nurses in
advanced roles 2005 28 Simoens S Villeneuve M Hurst J Tackling nurse shortages in OECD countries 2005
p 1-58 29 Fujisawa R Colombo F The Long-Term Care Workforce Overview and Strategies to
Adapt Supply to a Growing Demand OECD 2009 30 Health Workforce Australia httpwwwhwagovau 2012 31 Health Canada [cited 2012 Nov 28] Available from wwwhc-scgcca 32 Ministry of Health Labour and Welfare HR Development [cited 2012 Nov 28]
Available from httpwwwmhlwgojpenglishpolicyemploy-labourhuman-resourcesindexhtml
33 Netherlands Institute for Health Services Research [cited 2012 Nov 28] Available from httpnivelnl
34 Health Workforce Advisory Committee [cited 2012 Nov 28] Available from httpwwwhealthworkforcegovtnzabout-health-workforce-nzpublications-and-reports
35 Planning NSNW httpwwwworkforceplanningscotnhsukworkforce-planning-resourcesaspx [cited 2012 Nov 28]
36 Ministry of Health Singapore Healthcare 2020 Improving accessibility quality and affordability Health Scope 2012 July-August
37 Department of Health Centre for Workforce Intelligence (CWI) [cited 2012 Nov 28] Available from httpwwwcfwiorguk
38 US Department of Health and Human Services 2012 [cited 2012 Nov 28] Available from httpwwwhrsagovindexhtml
39 American Society for Human Healthcare Resources Administration httpwwwashhraorg [cited 2012 Nov 28]
40 Health Workforce Australia Health Workforce 2025 Doctors Nurses and Midwives Volume 2 Health Workforce Australia 2012
41 Health Workforce Australia Health Workforce 2025 Medical Specialties Volume 3 Health Workforce Australia 2012
42 Health Canada Health Human Resource Strategy Canada 2011 Available from httpwwwhc-scgccahcs-ssshhr-rhsstrategindex-engphp
43 McIntosh T Provincial health human resource plans Canada 2006 44 Cameron Health Strategies Group Limited An Inventory of Health Human resource
Forecasting Models In Canada Canada 2009 45 Ministry of Health Labour and Welfare Annual health labour and welfare report 2009-
2010 Japan 2010 Available from httpwwwmhlwgojpenglishwpwp-hw402html 46 Ministry of Health Labour and Welfare Annual health labour and welfare report 2010-
2011 medical professionals Available from httpwwwmhlwgojpenglishwpwp-hw5dl23010209epdf
47 Netherlands Institute for Health Services Research Mission and activities 2012 Available from httpwwwnivelnlenmission-and-activities
48 Netherlands Institute for Health Services Research Manpower planning 2012 Available from httpwwwnivelnlenmanpower-planning
49 Greuningen MV Batenburg R Velden LVD Ten years of health workforce planning in the Netherlands a tentative evaluation of GP planning as an example Human Resources for Health 201210(21)1-15
90
50 Health Workforce New Zealand Workforce Service Forecasts New Zealand 2012 Available from httpwwwhealthworkforcegovtnzour-workworkforce-service-forecasts
51 Health Workforce New Zealand Health workfroce projections modelling 2010 Primary health care nursing workforce New Zealand Health Workforce New Zealand 2010
52 National Health Service Scotland Workforce NHS Scotland 2012 Available from httpwwwisdscotlandorgworkforce
53 NHS Scotland Scottish Health Workforce Plan 2004 Baseline Scotland National Health Service Scotland 2004
54 Wright M An update on the analysis and modelling of dental workforce in Scotland Scotland 2006
55 Wright M Crichton I An analysis of dental workforce in Scotland 2008 56 Ministry of Health Singapore About Us Singapore 2012 Available from
httpwwwmohgovsgcontentmoh_webhomeabout-ushtml 57 Ministry of Health Singapore Committee of Supply Speech Healthcare 2020
Improving Accessibility Quality and Affordability for Tomorrows Challenges Singapore 2012 Available from httpwwwmohgovsgcontentmoh_webhomepressRoomspeeches_d2012moh_20 12_committeeofsupplyspeechhealthcare2020improvingaccessibihtml
58 Ministry of Health Singapore Health Manpower Available from httpwwwmohgovsgcontentmoh_webhomestatisticsHealth_Facts_SingaporeHea lth_Manpowerhtml
59 Centre for Workforce Intelligence Horizon scanning report Medical - Informing medical and dental student intakes Centre for Workforce Intelligence 2012
60 Centre for Workforce Intelligence Horizon scanning report Dental - Informing medical and dental student intakes Centre for Workforce Intelligence 2012
61 Centre for Workforce Intelligence A Technical Report(Part 2) for a strategic review of the future healthcare workforce informing medical and dental student intakes Centre for Workforce Intelligence 2012
62 Health Resources and Services Administration Health Professions 2012 Available from httpbhprhrsagovaboutindexhtml
63 Human Resources and Services Administration The physician workforce Projections and research into current issues affecting supply and demand US Department of Health and Human Services Health Resources and Services Administartion Bureau of Health Professions 2008
64 Health Resources and Services Administration National center for health workforce analysis health workforce reports 2012 Available from httpbhprhrsagovhealthworkforceallreportshtml
65 Health Resources and Services Administration Projected supply demand and shortages of registered nurses 2000-2020 USA 2002
66 Lee PP Jackson CA Relles DA Demand-based assessment of workforce requirements for orthopaedic services The Journal of Bone and Joint Surgery 199880-A(3)313-26
67 Joyce CM McNeil JJ Stoelwinder JU More doctors but not enough Australian medical workforce supply 2001-2012 Med J Aust 2006184(9)441-6
68 Chang H-C Liou Y-M Yen AM-F Chen TH-H Projection of the supply of and demand for board-certified nephrologists for ESRD in Taiwan J Eval Clin Pract 2008 Apr14(2)305-15
69 Barber P Lopez-Valcarcel BG Forecasting the need for medical specialists in Spain Application of a system dynamics model Human resources for health 20108(24)1-9
91
70 Health Resources and Services Administration The physician workforce Projections and research into current issues affecting supply and demand Services USDoHaH 2008
71 Fehring TK Odum SM Troyer JL Ioria R Kurtz SM Lau EC Joint replacement access in 2016 A supply side crisis The Journal of Arthroplasty 2010 Dec25(8)1175-81
72 Koike S Matsumoto S Kodama T Ide H Yasunaga H Imamura T Estimation of physician supply by specialty and the distribution impact of increasing female physicians in Japan BMC Health Serv Res 20099180
73 Satiani B Williams TE Go MR Predicted shortage of vascular surgeons in the United States population and workload analysis J Vasc Surg 2009 Oct50(4)946-52
74 Craig D Byrick R Carli F A physician workforce planning model applied to Canadian anesthesiology Planning the future supply of anesthesiologists Can J Anaesth 200249(7)671-7
75 Hilton CW Plauche WC Rigby PG Projecting physician supply at a state level Physicians in Louisiana in 2001 and 2006 South Med J 199891(10)914-8
76 Miller RH Otolaryngology manpower in the year 2010 Laryngoscope 1993103750-3
77 Department of Health Education and Welfare US Physicians for a growning America Report of the surgeon generals consultant group on medical education Public Health Service 1959
78 Saman DM Arevalo O Johnson AO The dental workforce in Kentucky Current status and future needs J Public Health Dent 201070(3)188-96
79 Solomon ES Dental workforce Dent Clin North Am 200953(3)435-49 80 Guthrie D Valachovic RW Brown LJ The impact of new dental schools on the dental
workforce through 2022 J Dent Educ 200973(12)1353-60 81 Chrisopoulos S Teusner D Dentist labour force projections 2005 to 2020 the impact
of new regional dental schools Aust Dent J 2008 Sep53(3)292-6 82 Grytten J Lund E Future demand for dental care in Norway A macro-economic
perspective Community Dent Oral Epidemiol 199927321-30 83 Spencer AJ Szuster FSP Brennan DS Goss AN A consensus approach to projections
of the supply of oral and maxillofacial surgeons in Australia Int J Oral Maxillofac Surg 199322314-7
84 Nash KD Brown LJ Hicks ML Private practicing endodontists Production of endodontic services and implications for workforce policy J Endod 200228(10)699-705
85 Morgan MV Wright FAC Lawrence AJ Laslett AM Workforce predictions a situational analysis and critique of the World Health Organistaion model Int Dent J 199444(1)27-32
86 Australian Research Centre for Population Oral Health Supply and demand for oral and maxillofacial surgeons and services in Australia Aust Dent J 201055(3)346-50
87 Gallagher JE Kleinman ER Harper PR Modelling workforce skill-mix How can dental professionals meet the needs and demands of older people in England Br Dent J 2010208(E6)1-9
88 Brown J Grimes L Davis DA ODA council on dental care special report - Oklahoma dentists workforce 2007
89 Beazoglou T Bailit H Heffley D The dental work force in Wisconsin Ten - year projections J Am Dent Assoc 20021331097-104
90 Try G Too few dentists Workforce planning 1996-2036 Economics and Primary Dental Care 20007(1)9-13
92
91 Waldman HB Planning for the manpower needs for the next generation of periodontal patients J Periodontol 199566599-604
92 Workforce review team NHS Workforce summary - nursing 2008 93 Buerhaus PI Staiger DO Auerbach DI Implications of an aging registered nurse
workforce JAMA 2000283(22)2948-54 94 Auerbach DI Pearson ML Taylor D Battistelli M Sussell J Hunter LE et al Nurse
practitioners and sexual and reporductive health services an analysis of supply and demand Rand Corporation 2012
95 HealthWorkforce Australia Health workforce 2025 Doctors nurses and midwives 2012
96 Wisconsin Health Workforce Wisconsin registered nurse supply and demand forecasting model technical report 2011
97 Juraschek SP Zhang X Ranganathan V Lin VW United States registered nurse workforce report card and shortage forecast Am J Med Qual 201127(3)241-9
98 Malyon R Zhao Y Guthridge S Health workforce modelling Northern Territory technical report for the nursing workforce model In families Doha editor Northern Territory Government Australia2010
99 Murray J Forecasting supply demand and shortage of nurses in Tennesse Tennessee Center for Nursing Nursing TCf 2009
100 Al-Jarallah KF Hakeem SK Al-Khanfar FK The nursing workforce in Kuwait to the year 2020 Int Nurs Rev 200965-72
101 Ghosh B Cruz G Nurse requirement planning A computer-based model J Nurs Manag 200513363-71
102 Spetz J Forecasts of the registered nurse workforce in California University of California San Francisco 2009
103 Tomblin-Murphy G MacKenzie A Alder R Birch S Kephart G OBrien-Pallas L An applied simulation model for estimating the supply of and requirements for registered nurses based on population health needs Policy Polit Nurs Pract 2009 Nov10(4)240-51
104 Health Workforce Information Programme Health workforce projections modelling 2010 perioperative nursing workforce 2009
105 Moulton P Lang T North Dakota nursing supply and demand projections University of North Dakota 2008
106 LeVasseur SA Projected registered nurse workforce in Hawaii 2005-2020 2007 107 Health Resources and Services Administration Methods for Identifying Facilities and
Communities with Shortages of Nurses US Department of Health and Human Services 20071-20
108 Rosenbaum DI Ramirez JP The supply and demand for registered nurses and licensed practical nurses in Nebraska 2006
109 Moulton PL North Dakota nursing needs study Direct care supply and demand projections University of North Dakota 2003
110 Canadian Nurses Association Planning for the future Nursing human resource projections 2002
111 Srisuphan W Senaratana W Kunaviktikul W Tonmukayakul O Charoenyuth C Sirikanokwilai N Supply and requirement projection of professional nurses in Thailand over the next two decades (1995-2015 AD) 19971-12
112 Johnson WG Wilson B Edge M Qiu Y Oliver EL Russell K The Arizona health care workforce nurses pharmacists amp physician assistants Arizona state University 2009
93
113 Knapp KK Cultice JM New pharmacist supply projections Lower separation rates and increased graduates boost supply estimates J Am Pharm Assoc (2003) 2007 Jul-Aug47(4)463-70
114 Bond CA Raehl CL Patry R The feasibility of implementing an evidence-based core set of clinical pharmacy services in 2020 manpower marketplace factors and pharmacy leadership Pharmacotherapy 200424(4)441-52
115 Bond CA Raehl CL Patry R Evidence-based core clinical pharmacy services in United States hospitals in 2020 Services and staffing Pharmacotherapy 200424(4)427-40
116 Cooksey JA Knapp KK Walton SM Cultice JM Challenges To The Pharmacist Profession From Escalating Pharmaceutical Demand Health Affairs 200221(5)182-8
117 Johnson TJ Pharmacist work force in 2020 implications of requiring residency training for practice Am J Health Syst Pharm 2008 Jan 1565(2)166-70
118 Meissner B Harrison D Carter J Borrego M Predicting the impact of Medicare Part D implementation on the pharmacy workforce Res Social Adm Pharm 2006 Sep2(3)315-28
119 Knapp KK Shah BM Bamett MJ The pharmacist aggregate demand index to explain changing pharmacist demand over a ten-year period Am J Pharm Educ 201074(10)1-8
120 Koduri S Shah G Baranowski BA Utahs pharmacist workforce Utah 2009 121 Health Resources and Services Administration The adequacy of pharmacist supply
2004 to 2030 In services Dohah editor USA2008 p 1-61 122 Department of Health and Ageing Pharmacy workforce planning study Australia
Australian Government Ageing DoHa 2008 123 Fraher EP Smith LM Dyson S Ricketts TC The pharmacist workforce in North
Carolina University of North Caroline at Chapel Hill 2002 124 Knapp KK Quist RM Walton SM Miller LM Update on the pharmacist shortage
National and state data through 2003 Am J Health Syst Pharm 200562492-9 125 Knapp DA Professionally determinded need for pharmacy services in 2020 Am J
Pharm Educ 2002661-9 126 Health Resources and Services Administration The Pharmacist workforce a study of
the supply and demand for pharmacists In services Dohah editor USA2000 p 1-100
127 Whedon JM Song Y Davis MA Lurie JD Use of chiropractic spinal manipulation in older adults is strongly correlated with supply Spine (Phila Pa 1976) 2012 Sep 1537(20)1771-7
128 The future of chiropractic revisted 2005 to 2015 Institute for Alternative Futures 2005
129 Davis MA Mackenzie TA Coulter ID Whedon JM Weeks WB The United States Chiropractic Workforce An alternative or complement to primary care Chiropractic amp manual therapies 2012 Nov 2120(1)35
130 Davis MA Davis AM Luan J Weeks WB The supply and demand of chiropractors in the United States from 1996 to 2005 Altern Ther Health Med 2009
131 Medical laboratory technologists in Canada Canadian Institute for Health Information 2010
132 Laboratory medicine A national status report The Lewin Group 2008 133 Mirkopoulos C Quinn B Occupational therapy manpower Ontarios critical shortage
Can Assoc Occu Therap 198956(2)73-9 134 Salvatori P Williams R Polatajko H MacKinnon J The manpower shortage in
occupational therapy implications for Ontario Can J Occup Ther 199259(1)40-51
94
135 WRHA Occupational Therapy Workforce Analysis Winnipeg Winnipeg Regional Health Authority 2002 November 2002 Report No
136 Morris LV Occupational Therapy A study of supply and demand in Georgia The American Journal of Occupational Therapy 198943(4)234-9
137 Tuulonen A Salminen H Linna M Perkola M The need and total cost of Finnish eyecare services A simulation model for 2005-2040 Acta Ophthalmol (Copenh) 2009 Nov87(8)820-9
138 Kiely PM Healy E Horton P Chakman J Optometric supply and demand in Australia 2001-2031 Clin Exp Optom 2008 Jul91(4)341-52
139 Australian Institue of Health and Welfare Optometrist labour force 1999 Australian Institue of Health and Welfare 2000
140 Bellan L Luske L Ophthalmology human resource projections are we heading for a crisis in the next 15 years Can J Ophthalmol 20074234-8
141 Pick ZS Stewart J Elder MJ The New Zealand ophthalmology workforce 2008 Clin Experiment Ophthalmol 2008 Nov36(8)762-6
142 Zimbelman JL Juraschek SP Zhang X Lin VWH Physical Therapy Workforce in the United States Forecasting Nationwide Shortages PMampampR 20102(11)1021-9
143 APTA A model to project the supply and demand of physical therapist 2010-2020 Alexandria American Physical Therapy Association 2012 May 32012 Report No
144 Breegle GG King E Physical therapy manpower planning Projection models and scenarios of 1985 Phys Ther 198262(9)1297-306
145 Winnipeg Regional Health Authority Physiotherapy Workforce Analysis Winnipeg Winnipeg Regional Health Authority 2002
146 Wing P Langelier MH Workforce shortages in breast imaging Impact on mammography utilization Am J Roentgenol Radium Ther 2009 Feb192(2)370-8
147 Workforce risks and opportunities 2012 diagnostic radiographers Centre for Workforce Intelligence 2012
148 Medical manpower planning committee Hong Kong academy of medicine Minutes of the 10th Meeting of Committee 2011 18102011
149 Business Professionals Federation Hong Kong Health care manpower planning 2010 150 Dunn A Ng Annora Liem Kevin et al How to create a world-class medical system
2012 HKGolden50 151 Review on the regulation of pharmaceutical products in Hong Kong Legislative
Council Panel on Health Services 2010 152 Leung GM Tin KYK Chan W-S Hong Kongs health spending projections through
2033 Health Policy 2007 Apr81(1)93-101 153 Bartholomew DJ Forbes AF McClean SI Statistical techniques for manpower
planning John Wiley amp Sons 1991 154 Huber M Health Expenditure Trends in OECD Countries 1970-1997 Health Care
Financ Rev 19992199-117 155 Medical Council of Hong Kong Annual Reports Medical Council of Hong Kong
2012 Available from httpwwwmchkorghkannualreportshtm 156 The Medical Council of Hong Kong [cited 2012] Available from
httpwwwmchkorghk 157 Department of Health HK Health manpower survey on doctors Hong Kong 2004 158 Department of Health HK Health manpower survey on doctors Hong Kong 2005 159 Department of Health HK Health manpower survey on doctors Hong Kong 2006 160 Department of Health HK Health manpower survey on doctors Hong Kong 2007 161 Department of Health HK Health manpower survey on doctors Hong Kong 2009
95
162 Statistics and Workforce Planning Department Hospital Authority Statistical Report (2011-2012) Hospital Authority 20121-200
163 Bane F Physicians for a growing America Report of the surgeon generalrsquos consultant groups on medical education US Department of Health Education and Welfare 19591-95
164 Fraher EP Knapton A Sheldon GF Meyer A Richetts TC Projecting surgeon supply using a dynamic model Ann Surg 2013257(5)867-872
165 Greenberg L Cultice J Forecasting the need for physicians in the United States The health resources and services administrations physician requirements model Health Serv Res 199731(6)723-37
166 Harrison C Britt H General practice workforce gaps now and in 2020 Aust Fam Physician 201140(12)12-5
167 Tsai T-C Eliasziw M Chen D-F Predicting the demand of physician workforce An international model based on crowd behaviors BioMed Central Health Services Research 20121279
168 Al-Jarallah K Moussa M Al-Khanfar KF The physician workforce in Kuwait to the year 2020 The International Journal of health Planning and Management 2010 Jan-Mar25(1)49-62
169 Birch S Kephart G Tomblin-Murphy G OBrien-Pallas L Alder R MacKenzie A Human resources planning an the production of health A needs-based analytical framework Canadian Public Policy 2007331-16
170 Blinman PL Grimison P Barton MB Crossing S Walpole ET Wong N et al The shortage of medical oncologists The Australian medical oncologist workforce study The Medical Journal of Australia 2011196(1)58-61
171 Cooper R Perspectives on the Physician Workforce to the Year 2020 Journal of the American Medical Association 1995274(19)1534-43
172 Deal CL Hooker R Harrington T Birnbaum N Hogan P Bouchery E et al The United States rheumatology workforce supply and demand 2005-2025 Arthritis Rheum 2007 Mar56(3)722-9
173 Douglass A Hinz CJ Projections of physician supply in internal medicine a single-state analysis as a basis for planning Am J Med 199598(4)399-405
174 Van Greuningen M Batenburg RS Van der Velden LFJ Ten years of health workforce planning in the Netherlands a tentative evaluation of GP planning as an example Hum Resour Heal 20121021
175 Health Workforce Australia Health Workforce 2025 Doctors Nurses and Midwives Volume 1 Health Workforce Australia 2012
176 Lee P Jackson C Relles D Demand-Based assessment of workforce requirements for orthopaedic services The Journal of Bone and Joint Surgery 199880(A)313-26
177 McNutt R GMENAC Its manpower forecasting framework Am J Public Health 1981711116-24
178 Scarborough JE Pietrobon R Bennett KM Clary BM Kuo PC Tyler DS et al Workforce projections for hepato-pancreato-biliary surgery J Am Coll Surg 2008 Apr206(4)678-84
179 Scheffler RM Mahoney CB Fulton BD Dal Poz MR Preker AS Estimates of health care professional shortages in sub-Saharan Africa by 2015 Health Aff (Millwood) 2009 Sep-Oct28(5)w849-62
180 Scheffler RM Liu JX Kinfu Y Poz MRD Forecasting the global shortage of physicians An economic- and needs-based approach Bull WHO 200886(7)516-23
181 Shipman S Lurie J Goodman D The general pediatrician Projecting future workforce supply and requirements Pediatrics 2004113435-42
96
182 Smith BD Haffty BG Wilson LD Smith GL Patel AN Buchholz TA The future of radiation oncology in the United States from 2010 to 2020 Will supply keep pace with demand J Clin Oncol 2010 Dec 1028(35)5160-5
183 Starkiene L Smigelskas K Padaiga Z Reamy J The future prospects of Lithuanian family physicians A 10-year forecasting study BioMed Central Family Practice 2005 Oct 4641
184 Teljeur C Thomas S OKelly FD ODowd T General practitioner workforce planning assessment of four policy directions BioMed Central Health Services Research 201010148
185 Weissman C Eidelman L Pizov R Matot I Klien N Cohn R The Israeli anesthesiology physician workforce The Israel Medical Association Journal 20068255-9
186 Yang J Jayanti MK Taylor A Williams TE Tiwari P The impending shortage and cost of training the future place surgical workforce Ann Plast Surg 2013 (Epub ahead of print)
187 Health Workforce Information Programme (HWIP) Health workforce projections modelling 2010 perioperative nursing workforce 2009
188 Juraschek SP Zhang X Ranganathan VK Lin VW United States registered nurse workforce report card and shortage forecast Am J Med Qual 2011 May-Jun27(3)241-9
189 Knapp K Livesey J The aggregate demand index measuring the balance between pharmacist supply and demand 1999-2001 Journal of American Pharmacists Association 200242(3)391-8
190 Reiner B Siegel E Carrino JA McElveny C SCAR Radiologic Technologist Survey Analysis of technologist workforce and staffing J Digit Imaging 2002
191 Bingham D Thompson J McArdle N McMillan M Cathcart J Hodges G et al Comprehensive review of the radiography workforce Department of Health NI 2002
192 Patterson DG Skillman SM Hart LG Washington Statersquos radiographer workforce through 2020 Influential factors and available data 2004
193 Victorian medical radiations Workfroce supply and demand projections 2010-2030 Victorian Department of Health 2010
194 Bellan L Buske L Ophthalomology human resource projections are we heading for a crisis in the next 15 years Ophthalomology Human Resources 20074234-8
195 Australian Institute of Health and Welfare Optometrist labour force 1999 Canberra Australian Institute of Health and Welfare 2000
196 Kiely PM Horton P Chakman J The Australian optometric workforce 2009 Clinical amp Experimental Optometry 2010 Sep93(5)330-40
197 Lee PP Relles DA Jackson CA Subspecialty distributions of ophthalmologists in the workforce Arch Ophthalmol 1998116917-20
198 The clinical laboratory workforce The changing picture of supply demand education and practice Health Resources and Services Administration 2005
199 American Physical Therapy Association A model to project the supply and demand of physcial therapists 2010-2020 US American Physical Therapy Association 2012
200 Winnipeg Regional Health Authority Occupational Therapy Workforce Analysis 2002
97
Appendix A(i) Summary of manpower planning and forecasting models (Australia Canada Netherlands) Australia Canada Netherland
Context
- shorter working hours for all healthcare professionals - ageing population - increasing demand for services - workforce distribution
-
- utilisation-based planning failed to inform long-term workforce planning
- planning has been done in isolation which resulted in unintended impacts mismatch between need supply and demand
- costly duplication and inability to respond effectively to international issuespressure
- shortage of medical specialist and nursing personal
- steady growth in the healthcare workforce - increased feminization of the workforce and
contracted GPs - impact of migration on health manpower
planning
Objectives Strategic Directions
- ensure and sustain supply - optimise workforce and healthcare access - improve the healthcare work environment - enhance and coordinate health education vocational
training and regulatory sectors - optimise use of workforce skills and ensure the best
health outcomes - improve policy and planning to support the provision
of staff - improve collaborative effort between all stakeholders
- increase the number of qualified healthcare trainees - focus on productivity and effective use of skills - improve access to healthcare services address inappropriate
variation of health human resources - create healthy safe supportive and learning workplace - maintain an skilled experienced and dedicated workforce - more effective manpower planning and forecasting
- increase professional training - increase recruitment both to encourage staff to
return to healthcare workforce and to recruit from overseas
- retain staff by increasing support for staff and flexible working arrangements
- change skill-mix
Framework
- align education and training supply with workforce requirements
- improve workforce re-entry and ethical overseas recruitment
- support work culture and develop flexible working environments
- promote skills and competence initiatives - establish shared health workforce planning research
information sharing improve data collection - establish monitoring evaluation and reporting
processes - promote discussion and awareness amongst the
stakeholders and community
- assess population health needs demand for services including Aboriginal health needs
- develop implement and evaluate population need-based innovative service delivery and health human resource models
- enhance collaboration and provide evidence for HHR planning information
- align education curricula with health system needs and health policy
- provide opportunities for to life-long learning - develop a locally culturally and linguistically diverse workforce - accelerate and expand the assessment and integration of
internationally educated health professionals - enhance healthcare career attractiveness - address health and safety issues reduce work-related illnesses
injuries and absenteeism
- increase collaboration between local and international institution in medical training programmes
- increase training capacity staff retention and recruitment
- recruit healthcare professionals from within and outside EU
- develop flexible and family-friendly working patterns
- adjust the workloads for the older staff and retirement age
- provide learning and development opportunities
- improve skill mix use and transfer of function between different professional groups
- develop new roles and extend the range of work
Duration since 2004 (reviewed in 2011) since 2005 Since 2000s
98
Australia Canada Netherland
Method for supply demand
Supply and need-based model Demand - utilisation of health services Supply - number of hours worked per year by the number of male
and female health professionals in each age group - proportion of leavers and entries (graduates and migrants)
into the health professional field
Collaborative system design and population health need-based approach to planning Supply - actual number type and geographical distribution of regulated and
unregulated providers productivity and scope of practiceservice provided
- labour market indicators participation rate provider-to-population ratios demographic and educational characteristics of providers employment status and sectors
- death retirement emigration replacement general economic trends work incentives life-style choices
Demand - population health needs for both curative and preventive health
services
The Dutch Simulation and Forecasting Model (supply-based) confronted with 4 scenarios - Scenario 0 unfulfilled demand for
care + demographical developments - Scenario 1 Scenario 0 + non-
demographical developments - Scenario 2 Scenario 1 +
developments in working hour - Scenario 3 Scenario 2 + vertical
substitution
The Dutch Policy and Planning Model - a multi-stakeholder and multi-
process consensus model - based on simulation model that
generates GP training inflow advice yearly allocation of funding and resources and unplanned external factors to project GP workforce in coming years
Assumptions
Demand - time required for treating different conditions is binary - linear growth in demand - demand model ignores labour substitution Supply - no change in technology - workforce entrance and exits hours worked are
disaggregated by age and sex groups General - no interactions between the supply and demand models - no supplier-induced demand
- current supply of providers meet the current demand - observed trends are used to project future population size and
demographic profile - future age and sex-specific resources remain constant
- historical trend continues - other projection of population
growth political and technical changes is on the right direction
99
Australia Canada Netherland
Formulae
Demand Dt = βstactivitysimplet + βctactivitycomplext Dt Demand at a specific time activitysimple simple utilisation activitycomplex complex utilisation Each activity has a coefficient βst and βct with βst lt βct relating activity into demand for full-time equivalent health professional hours at time t Dt Supply St = Σg[βgmalemaletg + βgfemalefemaletg]maletg = (1-βloss
gmale) malet-1g + malegradstg + malemigrantstgfemaletg = (1-βloss
gfemale) femalet-1g + femalegradstg + femalemigrantstg St supply of labour hours in year tg age groups βgmale and βgfemale coefficients that represent the number of hours worked βloss
gmale and βloss gfemale proportion of the workforce loss every
year malegradstg and femalegradstg number of graduates malemigrantstg and femalemigrantstg number of migrants
Modelling utilisation and predicted used based on needs
Allocation of resources
yi utilisation for individual i Aij vector of age-sex dummies Xik vector of additional needs indicators Zil vector of non-need determinants of utilisation Rim dummy variables for regions β λ γ δ oslash estimated coefficient vectors Nr per capita resource need for residents of each allocation regionw the survey sample weight for each individual i wi survey sample weight for individual
- Required supply in year T vs Required supply in year X =gt development required supply until T+X
- Available supply in year T + Development available supply until T+X =gt Available supply in year T+X
100
Australia Canada Netherland
Key factors used
- numbers in the workforce in a given year (by age and sex)
- proportion of individuals leaving workforce by sex
- number of graduates and migrants - utilisation of healthcare services
- actual and perceived population health status socio-economic status - demographics - health behaviours - social cultural political contextual geographical environmental - financial factors - categoriesrolescharacteristics of health workers and services source
of supply - production (education + training) target vs actual needs projected - management organization and delivery of health services (indirectly
contribute to outcomes) formalizationcentralization environmental complexity amount and quality of care provided costs associated with delivery of services and outcomes
- resource deployment and utilisation - health outcomes eg mortality data hospital discharge life
expectancy and disease incidence (depends on communitys situation)
- available supply of GPs (total full-time equivalent)
- unfulfilled demand for care - number of GP in training - inflow from abroad - outflow (malefemale amp projection year) - return on training - labour market return - epidemiological developments - socio-cultural developments - technical developments - substitution
Limitations Challenges
Demand - binary case-mix - linear demand growth - constant returns - no labour substitution Supply - no changes in technology - disaggregated by age and sex General - independent supply and demand - no supplier-induced demand
- require extensive data =gt difficulties in management and maintenance of data collection delivery system
- lack of consistent information on health human resource productivity workload utilisation demand and efficacy and information about educational facilities
- capacity to assess health needs and forecast demand for health human resources- funding for ongoing data and modelling initiatives
- compliance vs flexibility and autonomy of localregional planner with national strategies
- updating model is difficult - the model is more likely to project unattainable service and staff
targets
- technically complex many parameters heuristics sub-models and data source
- politically complex multiple policy discussions and stakeholder involvement
- intentionally complex long-term planning short-term acting frequent updating
Organisation
National Health Workforce Taskforce Australian Health Ministries Advisory Council (httpwwwahwogovauindexasp)
wwwhc-scgcca (Health Canada) NIVEL (the Netherlands Institute for Health Services Research ) httpwwwnivelnl Dutch Ministry of Health Welfare and Sport Dutch Health professional organizations and labour unions
101
Appendix A(ii) Summary of manpower planning and forecasting models (New Zealand Scotland United Kingdom) New Zealand Scotland United Kingdom
Context
- increasing burden of chronic diseases - lack of collaboration in planning and implementation of health
workforce - mental health rehabilitation and aged care are an emerging a
problem
- increase the size of healthcare workforce - aging healthcare workforce - workforce is predominately female and predominately
working fulltime
A number of changes in the UK population service delivery model and healthcare workforce
- demographic - a growing aging population - NHS funding and budgets - service plans and reconfiguration - policy (locus of care from hospital to community
from NHS to non-NHS) - legislative and regulatory framework - professional education - role definition for each of the professions
Objectives Strategic directions
- innovative approaches to workforce development - enhance communication - sector relationships - build a responsible and rational workforce development
investment plan (set workforce development priority for mental health rehabilitation and aged care)
- support the healthcare workforce boards and policy makers
- develop and implement multi-disciplinary and multi-agency models of care which are more responsive accessible and joined up to meet the needs of local communities and ensure efficient utilisation of skills and resources
- motivate employees to improve their performance provide opportunities for them to develop and contribute more
- promote the benefits of preventative action and measures of self-care for patients and public across a range of health issues
- maximise and wider access to education and training especially for those at underserved areas
- engage with health sector employers to ensure the authoritative sector voice on skills and workforce development for the whole sector
- inform the development and application of workforce policy through research and the provision of robust labour market intelligence
- implement solutions which deliver a skilled flexible and modernised workforce capable of improving productivity performance and reducing health inequalities
- champion an approach to workforce planning and development that is based on the common currency of national workforce competences
Framework
- increase number of healthcare professionals - train and recruit more health professionals with generic skills
to increase flexibility and respond to the increasing shift towards primary and community-based models of care and integration between institutional and community settings
- improve workforce activity linkages in health system collaboration and economies of scales
- develop regionally aligned approaches to professional training and career planning
- enable health professionals to take on new tasks responsibilities opportunities for further development and career satisfaction
- partnership with professional groups to support delivery and development of services
- support professional groups to achieve their full personal and professional potential
- funding arrangement for professional development and continuing education
- encourage sharing between professional groups and learning from each others across national regional sectors
- provide guideline for better care delivery models encourage innovative approaches
- fund professional development courses - develop better evidence base to inform policies and
strategies to help promote retention of staff
- develop workforce plans and strategies for investment
- commission undergraduate training and clinical placements
- manage post registration and post graduate training - invest in continuing professional development - train and develop wider healthcare workforce esp
nurse and other ancillary team - allocate and monitor investment of education and
training funds - collaborate at all levels of the system to plan and
develop the workforce for quality
Duration HWAC since 2000 HWNZ since 2009
since 2000s since 2000s
102
New Zealand Scotland United Kingdom
Method for supply demand
Primary Healthcare Nursing projection modelling (demand-based) Supply - projected proportion and distribution of healthcare
professionals by age sex geographic - entrants to and graduates from education and training
programme - retirement mortality career change disability of healthcare
workforce Demand - population growth projections by age gender and ethnicity - population health needs - historical current and future changes of services provided - anticipated development of and changes in-patient care
practice
Demand and supply-based plan Demand - rate of general practitioners - patients contact by sex and
age (estimated by changes of characteristics of population)
- working time targets and standards and real practice - working time regulations - service utilisation - service levels Supply - destination of GP registrants (age profile gender profile) - growth of GPs training
No single modelmethod used but various in term of regional and local level Example England - NHS Workforce Review Team conduct a pilot
study to develop demand-side modelling (initially for mental health service) (England)
- London Strategic Health Authority used scenario-based workforce modelling (demand-based)
- 6-step Workforce Planning Model (NHS South West) (supply and demand)
Northern Ireland - review of each professional group every three
years planstrategies were made based on supply and demand
- impact of current and emerging technologies Scotland - based on Student Nurse Intake Planning project
aligned with NHS and non-NHS employers projection (supply)
- utilisation of service from Management Information and Dental Accounting System database (demand)
Wales - annual approach will be based on national unit
linked to local planning process (supply)
Assumptions
- past trends define future trends - demand will increase at twice the rate of population growth
- estimated numbers based on average calculation of past trend and prediction of change of care delivery models technology
- significant work has been undertaken to ensure that workforce targets are consistent with the available resources
- each model applied holds different assumptions
Formulae
Supply = Headcounts + net inflow (inflow less outflow) (calculated for each workforce areas)
Demand = [population growth] [type of service] [care delivery models] [impact of current and future technologies]
Projected demand (Whole time equivalent) = current demand yearly growth rate
Required supply = estimated adequate ratio of supply to demand projected demand
Supply=current headcounts + net inflow Demand = population dentist-to-population ratio
103
New Zealand Scotland United Kingdom
Key factors used
- projection of population growth by age sex - population health needs based on all types of healthcare
services - burden of disease - technology development - models of care - projection of healthcare workforce growth according to
- workforce dynamics (characteristics of workforce development)
- demographic changes - technology development - payment scheme - utilisation (service-based) - shrinkage (leave mortality retirement)
Depends on model used Example - number of student intake for a professional
training retirement change of professions expansion
- financial planning for education and training
population growth - entries to and exits from healthcare workforce - analysis of occupations specialty - education and training sources
- international recruitment - health indicators demographic and socio-
economic status
Limitations Challenges
- difficult to collect and monitor data - lack of financial support in services at rural areas and which
make coordination between care centres difficult - difficult to evaluate impact of policy changes and health
outcomes
- relies on pre and current data - quality of data is an issue - lack of collaborative approaches to workforce planning
- lack of supply-side modelling - lack of linkage between supply and
demand projections - potential deficit in current workforce-
planning capacity at regional level - most Strategic Health Authorities focused
on improving the process rather than planning capacity
Problems in the system - too top-down management- service
financial and workforce planning are poorly integrated
- poor data to project funding arrangement - medical workforce planning and
development is done largely in isolation - lack of long-term strategic commission - quality of education training recruitment
Organizations
Health Workforce Advisory Committee (HWAC) httpwwwhealthworkforcegovtnzabout-health-workforce-nzpublications-and-reports Workforce Services Reviews
NHS Scotland National Workforce Planning Department of Health Centre for Workforce Intelligence (httpwwwcfwiorguk) Skills for Health
104
Appendix A(iii) Summary of manpower planning and forecasting models (Japan Singapore USA) Japan Singapore USA
Context
- shortage of physicians - mal-distribution of medical
practitioners in some areas - ageing population - ageing workforce - mismatch of supply-demand
in some areas
- high density of doctors but reported shortages in the public sector due to the low pay and long working hours compared with the private sector
- promote medical tourism - import medical workforce esp nurses and doctors from
Philippine and Indonesia - most of doctors in Singapore are foreign-trained
- shortage in primary care service and staff - nursing shortage - geographical variation in service - inappropriate funding plan - increased demand professional training program
Objectives Strategic directions
- to project the demand and supply of healthcare professionals
- increase medical and other healthcare professional training
- improve working environment and benefits to attract more overseas healthcare workers
- develop programmes to recruit and retain healthcare workforce (esp professional Development)
- strengthen the Nations Health and Human Services Infrastructure and workforce
- invest in the HHS workforce to meet Americans health and human service needs today and tomorrow
- ensure that the Nations healthcare workforce can meet increased demands
- enhance the ability of the public health workforce to improve public health at home and abroad
- strengthen the Nations human service workforce
Framework
- train and recruit more health professionals to respond to the increasing shift towards elderly care and integration between institutional and community settings
- enable health professionals to take on new tasks responsibilities opportunities
- Healthcare Manpower Development Programme for Intermediate and Long-term Care (since 1980)
- funding for advanced training skill of local staff (local or overseas institution)
- funding for visiting experts lecture fellowship programme
- set up websites to attract more foreign healthcare workers
- fund medical training scholarships and loan repayment programmes - focus on human capital development - innovative approaches to recruiting training develop retain and
support a competent workforce - monitor and assess the adequacy of the Nations health professions
workforce - work with states to develop systems for the training and ongoing
professional development and opportunities for developing professional skills
- improve the cultural competence of the healthcare workforce - foster the use of evidence-based practices in human services to
professionalize the field - establish regular evaluation supervision of supply and demand of
healthcare workforce to inform professional development and future action
Duration since 2000 since 2006 since 2006
105
Japan Singapore USA
Method for Supply Demand
Utilisation and supply-based approach
- current and past trend of utilisation (esp for aging care)
- expenses related to healthcare
- education and training sources
- healthcare professionals to population ratio Doctors to population ratio 1620 (2008) 1600 (2009) 1580 (2010) 1550 (2011)
Nurse to population ratio 1200 (2008) 1190 (2009) 1170 (2010) 1160 (2011)
- supply-based model was used to project healthcare workforce
Utilisation and supply-based model Supply - size and characteristics of current workforce (age gender work-hours retirement
distribution active in-patient care or other activities such as teaching research) - new entrants and choice of medical specialty - separation from the physician workforce (retirement mortality disability career
change) - physicians productivity hours spent providing patient care number of patients
seen resource-based relative value scale Demand
- population development - advancing medical
technology - changing treatment
patterns - labour market trends
- population growth - medical insurance trends - economic factors - physician to population ratio - technology policy changes
Assumptions
- population projections current patterns of employment and supply
- models used are susceptible to measurement error
- assumption current patterns of new local and non-local graduates
- rates of demand will remain
- baseline assumption current patterns of new graduates specialty choice and practice behaviour continue
- distribution of physicians in-patient-care and other activities remains constant
Formulae stock and flow methods
- The healthcare workforce (doctors nurses pharmacists dentists and allied health professionals) will need to be increased by more than 50 by 2020
- Factors being considered include ageing and growing population and increasing number of healthcare infrastructure On the supply side local and overseas graduates and role extension of healthcare professionals were considered
Physician Supply Model P(y+1) = P(y) + Pa - Pi + Pn P(y+1) physicians supply in the year y+1 P(y) physicians supply in the year yPa physicians remain active Pi physicians inactive retired dead or disable Pn new physicians graduated from US medical school or international institutions The model also generates Full-time equivalent (FTE) physicians which is defined as the average hour annual hours worked in-patient care per physician in baseline year Physician Requirement Model - Physicians Requirements = [Population projections by age sex and metronon-
metro] x [Insurance distribution by age sex and metronon-metro] x [physicians per population ratio by age sex and metronon-metro insurance and specialty]
106
Japan Singapore USA
Key factors used
- population growth rate - healthcare workers to
population ratio - utilisation indicators
- number of physiciansnurses - inflow and outflow of healthcare workforce - population growth rate - medical education and training registrants
Physician Supply Model - number of physicians in the preceding years (starting with the base year
2000) - number of new US medical students International medical students - attrition due to retirement death and disability Physician Requirement Model - population projections by age sex and metropolitannon-metropolitan
location - projected insurance distribution by insurance type age sex
metropolitannon-metropolitan location - detailed physician-to-population ratio
Limitations Challenges
- slow adoption of new approaches across healthcare systems
- loose control over supply and demand factors due to no central authority
- difficulty in funding allocation
- past history may not adequately reflect future requirements - limited variables include in the analysis - overly reliant on ability to recruit non-local professionals
- numerous variables included in the analysis =gt difficult to control =gt uncertainty about adequacy of the analysis
- no single entity in US in charge of workforce planning-- lack a cohesive approach to workforce shortage
Organisation
Ministry of Health Labour and Welfare Human Resource Development Bureau
Ministry of Health Human Resource Advisory Board
US Department of Health and Human Services (httpwwwhrsagovindexhtml) American Society for Healthcare Human Resources Administration (ASHHRA httpwwwashhraorg)
107
Appendix B Manpower planning literature by healthcare professional group
Doctors
Author year Design model type analysis
Parameters included (population level or individual level)
Outcomes Assumptions amp Limitations
Supply models Bane et al 1959 Stock and flow Graduates bullNumber of physicians per 100000 bull Estimates of future needs were projected through (163) approach Number of physicians
Retirees Work locations
people bullTotal output
analysing the utilisation of services growth of new types of services
Craig et al 2002 (74)
Trend analysis Number of specialist anaesthesiologists by age as of January 1 2000 Annual certificate numbers 1971-2000 Estimated needs for anesthesia provider 1999 amp 2006
bullNumber of required FTEs bullNumber of FTE deficits
bull Assumption that each anaesthesiologist provides 1 FTE to anaesthesiology workforce underestimates requirement bull Does not account for anaesthetic service provided by non-specialist practitioners
Fraher et al 2013 (164)
Stock and flow approach
Graduate medical education pipeline Length of training by specialty Re-entry Attrition (Death retirement and career breaks) Age Sex Hours worked in-patient care by age and sex
bullHeadcount of surgeons by age sex and specialty in the United States from 2009 to 2028 FTE of surgeons by age sex and specialty in the United States from 2009 to 2028
bull Does not cover the complementary of physician assistant and nurses bull FTE contributions to patient care were adjusted downward significantly after the age of 65 years bull FTE by age and sex retirement rates workforce re-entry patterns and attrition from training stay the same in different specialties bull Only focus on overall supply
108
Author year Design model type analysis
Parameters included (population level or individual level)
Outcomes Assumptions amp Limitations
Fehring et al 2010 Stock and flow Age bullProcedural shortfall bull Selection and information bias through the use of (71) approach Retirement
Graduates Number of total knee and total hip arthroplasties performed per month Historical incidence of arthroplasty
estimates that are based on survey data bull Assumption of baseline scenario and conservative scenario for retirement bull Assumption of baseline scenario and conservative scenario for incidence bull The number of residents entering the workforce will be stable bull All the surgeons will perform joint arthroplasty at the same rate no matter their experience
Hilton et al 1998 Stock and flow Number of current supply of bullTotal number of office-based bull Limited effect of growth in demand on current number of (75) approach physicians
Number of new trainees Number of licensees expected Retirement Population Number of office-based physicians Hospital-based physicians Specialties vs primary care physicians Other activities
physicians per 100000 population in 2001 amp 2006 bullThe number of primary care physicians per 100000 population in 2001 amp 2006 bullThe number of specialist per 100000 population in 2001 amp 2006
physicians to 1year bull Limited retirement and other losses to 3year Assume 70 retention rate of trainees bull 12 of population increase annually
Joyce et al 2006 Stock and flow Current supply in baseline bullFTE clinicians (per 100000) bull Estimate of parameters used in the model might not be (67) approach New graduates
Immigrants Re-entrants Death Retirements Attrition exits Movement between occupations Number of hours worked per week by age (5-year bands) and sex
bullFTE GP (per 100000) bullFTE Specialist workforce (per 100000)
accurate ndash question of data quality
109
Author year Design model type analysis
Parameters included (population level or individual level)
Outcomes Assumptions amp Limitations
Koike et al 2009 (72)
Trend analysis using multistate life table
Specialty Impact of further increase of female physicians Age groups Place of work
bullHeadcount of estimated numbers of physicians by specialty
bull The characteristics and status of physicians will continue in the future bull Does not project the FTE number
Miller 1993 (76) Stock and flow approach
Age distribution Number of otolaryngologists Number of otolaryngologists entering practice Death rates Retirements Current production of residents
bullHeadcount of otolaryngologists bull Older-than-65 group was excluded from further analysis
Satiani et al 2009 (73)
Stock and flow approach using population and workload analysis
Current number of certified Vascular surgeons Number of newly certified per year Retired numbers per year Operations needed per 100000 people Average number of procedures performed per VSN
bullPopulation analysis Shortage of surgeons in percentage bullWorkload analysis Shortage of surgeons in percentage
bull Surgeon to population ratio maintained for the 40-year period number of operations performed annually remain the same number of years in training remain unchanged
Demand models Craig et al 2002 (74)
Needs-based model Per capita utilisation by age and sex Population projection by age and sex Time spent on providing clinical anaesthesia services
bullFTE of physicians bull Lack of direct data on non-clinical anaesthesiologists bull Assume that one full-time full-year anaesthesiologist equals to 175000 units of demand bull Assume that the supply meets the demand in the base year
110
Author year Design model type analysis
Parameters included (population level or individual level)
Outcomes Assumptions amp Limitations
Etzioni et al 2003 (11)
Demandutilisation based model
Population by age Age-specific rates of surgical procedures Relative value units (RVUs)
bullForecasted percept increases in Work RVUs by specialty
bull Estimate workloadproductivity bull Assume that the surgical demand by age and sex will be stable
Greenberg et al 1997 (165)
Demandutilisation-based model
Current utilisation rates for ambulatory and in-patient medical Specialty services by gender race age group insurance status Population by gender race and age
bullPhysician headcount required in 2020
bull Recent trends will continue into the future
Harrison et al 2011 (166)
DemandUtilisation-based model
Number of general practice consultations by age and gender Length consultations Population projection
bullIncrease in GP utilisation bullAdditional GPs required
bull Assume that GPs would work similar average hours per week bull Assume that current primary care model and structure of general practice will remain the same
Tsai et al 2012 (167)
Regression-based physician density model
Mortality rate (under age 5) Adult mortality rate Life expectancy Fertility rate Literacy Population density Age structure Economic growth Expenditure on health
bullUnder the model countries were labelled as Negative discrepancy or Positive discrepancy
bull Cannot use the absolute number to suggest for correction in the healthcare workforce bull Only be used for warning signs of workforce discrepancy
Mixed models Al-Jarallah et al 2009 (168)
Supply trend analysis Demand benchmark
Population projections Physician-to-population ratios The average rate per annum for Kuwaiti physicians and non-Kuwaiti physicians
bullNumber of indigenous physician and non-native expatriate physician bullProjected requirement for physician bullDisparity between need and actual number of physicians
bull Projecting demand and supply over a long period leads to uncertainty did not study age and structure of the physician workforce due the lack of data
111
Author year Design model type analysis
Parameters included (population level or individual level)
Outcomes Assumptions amp Limitations
Barber et al 2010 Supply stock and flow Number of students admitted to bullTotal FTE of medical specialists bull Supply model realistic entry parameters (69) approach
Demand demandutilization-based model
medical school Number of residencies available for each specialty The mandatory retirement age Immigration rate by specialty Growth rate for specialists demand Growth in population
needed bullRatio specialists100 000 inhabitants bullDeficitsurplus specialists in percent
bull Demand model lack normative standards assume appropriate staff number
Birch et al 2007 Supply stock and flow Number of provider by age and sex bullHeadcount of the providers bull Assumption of different needs scenarios to look at how it (169) approach
Demand needs-based framework using Vensim 2002 simulation model
Time spent in the production of services Size of population by age and sex Provider-to-population ratio by age and sex of population group Number of services required by age and sex Demography Level of service Epidemiology Intensity of work Technological inputs Inputs of other types of professionals
bullFTE of the providers bullNeed follows observed trends by different policy changes
will affect the physician workforce
112
Author year Design model type analysis
Parameters included (population level or individual level)
Outcomes Assumptions amp Limitations
Blinman et al 2012 Supply stock and flow Headcount by nature of practice bullSupply demand and shortfall of bull Only the clinical workload of MOs related to (170) approach
Demand demand-based model
Current supply Population National chemotherapy utilisation rate Optimal workload of new patients seen per FTE MO per year Number of retirement Overseas and local training MOs
FTE medical oncologists (MOs) bullChemotherapy utilisation rate
chemotherapy was included some responses were estimated than counted lead clinicians were surveyed rather than individual MOs
Chang et al 2008 Supply stock and flow Number of new entrants bullFTE supply demand bull Assume the probability of wastage for general doctors (68) approach
Demand needs-based model
Current manpower and demographics Withdrawals by nephrologists (eg retirement death and turnover to other subspecialties) Population Incidence and prevalence of ESRD and treatment modalities
and internists are small and therefore ignored
Cooper 1995 (171) Supply dynamic model Demand demandutilisation-based model
Medical students Retirement Size of workforce Utilisation from HMOs Aging Technology Productivity Demographic factors Population
bullFTE physician100000 population (supply and demand)
bull Supply limited by predictions concerning the future number of USMGs and IMGs bull Demand uncertainty of technology data reliability from HMOs HMOs data not representative of the nation as a whole
Deal et al 2007 Supply stock and flow Healthcare utilisation - age amp sex bullNumber of rheumatologists bull Supply and demand for rheumatology services are in (172) approach
Demand demandutilisation-based model
Population projections Retirement Mortality rates Hours of work Number and fill rates of fellowship slots
supplied and needed by sex age and specialty
equilibrium the number of fellow position will remain static gender differences will remain static
113
Author year Design model type analysis
Parameters included (population level or individual level)
Outcomes Assumptions amp Limitations
Douglass et al Supply dynamic Past and current Connecticut non- bullFTE supply bull Currently available data for specific specialties 1995 (173) model
Demand needs-based model
federal internist supply Present and future Connecticut internists supply and need Contribution of non-physician providers
bullFTE need bull Uncertain flow of physicians in and out of the province bull Classifying specialty based on service provision bull Calculate the supply and need in Connecticut base on the share of US supply and need
Greuningen et al Supply stock and flow Graduates Attrition bullNumber of health professionals bull The basic scenario assumed that the demand will increase 2012 (174) approach
Demand estimation Demographic developments Epidemiological developments Socio-cultural developments Change of working hours Technical developments Developments regarding efficiency Developments regarding substitution
bullTotal FTE of health professionals by 60 due to the demographic developments from 2009-2019 bull The parameters on the demand side were estimated by experts however it was not clearly explained how they were being estimated
Health Workforce Supply stock and flow Graduates bullHeadcount of supply demand and bull Different assumption based on demand scenario 2025 Volume 1 approach Re-entry gap 2012 (175) Demand
demandutilisation-based model
Working hours Migration Attrition (Death retirement amp career change) Age Gender Utilisation rates
bullFTE of supply demand and gap
HRSA 2008 (63) Supply stock and flow model Demand Demandutilisation-based approach
Number of physicians age amp sex Graduates Retirement and mortality by age and sex Disability and career change Direct patient care hours Population projections Insurance distribution
bullFTE active physician bullIncrease in demand due to aging and growth
bull Limitations include using historical data to estimate future trends bull Assume insurance coverage and type economic growth and the increased use of NPCs
114
Author year Design model type analysis
Parameters included (population level or individual level)
Outcomes Assumptions amp Limitations
Lee et al 1998 Supply dynamic Surgeon population bullFTE supply bull Need for large amounts of data (176) model
Demand needs-based model
Time spent in direct care Entry rates of residents Retirement and mortality rate Number of office visits Duration of office visit Number of procedures Duration of procedures
bullFTE demand bull Accuracy of estimation bull Time and FTEs used as common measure for both supply and demand might be vulnerable to changes in real-life practice and structure of work bull Not able to address distributional issues
McNutt 1981 (177) Supply dynamic model Demand demandutilisation-based model
Medical graduates Practitioner supply Attrition rates Morbidity Prevention Delphi panel rates
bullHead count of physicians supplied and required by each specialty (Only talked about the concept and analytic framework of the GMENAC model)
bull Relied heavily on the Delphi panel to project future demandutilisation
Scarbrough et al Supply stock and flow Attrition (Death and retirement) bullAnnual volume of HPB bull Reliance on a series of assumptions to determine the 2008 (178) approach
Demand needs-based model
Annual volume of Hepatic-Pancreatic-Biliary (HPB) procedures Annual number of new HPB subspecialist Level of fellowship training Practice patterns of graduating fellows
procedures per subspecialist in 2020 bullAnnual HPB procedure volume per subspecialist in 2020 at current level of fellowship training bullNumber of fellows needed to train each year to meet demand for HPB surgery
current number of practicing HPB subspecialists and the current level of fellowship training bull Assume that none of the fellowship-trained HPB subspecialists first entering the workforce in 2007 would retire die or change fields before 2020 bull Different scenarios for the projected number of fellows needed to train per year to meet the demand for HPB procedures
Scheffler et al Supply trend analysis Number of physicians by country bullHeadcount supply demand bull Poor data quality in Africa which could undercount 2009 (179) Demand needs-based
model Projected population shortage healthcare professionals especially in the private sector
bull Supply of physicians is provided from previous estimates and data (Scheffler et al 2008)
Scheffler et al Supply trend analysis Historical data on physician bullSupply - per capita physicians bull Need estimated only reflects one aspect of healthcare 2008 (180) Demand needs-based
model and demand-based model
numbers 1980-2001 Updated physicians numbers Economic growth Historical and projected population Need-based benchmark live births
bullThe required headcount of physicians to reach the world health report 2006 goal bullDemand for physicians in each country by headcount bullDeficit or surplus by headcount
delivery bull Projection of demand and supply rely on trends of either economic growth or physician per capita
115
Author year Design model type analysis
Parameters included (population level or individual level)
Outcomes Assumptions amp Limitations
Shipman et al 2004 Supply stock and flow Number of paediatricians by age bullFTE General paediatricians bull Uses different key assumptions for projection mainly (181) approach
Demand benchmark and sex Annual number of graduating trainees by age and sex International medical graduates (IMGs) Death and retirements Population Current proportion of outpatient office visit by children to paediatricians Productivity Change in work effort
bullChild population have a set rate for different variables bull Assume that 25 of noncitizen IMGs will not stay in the US workforce after completing training
Smith et al 2010 Supply stock and flow Age- sex- race- population bullTotal number of patients receiving bull Extent the current supply of oncologists can (182) approach
Demand demandutilisation-based approach
projections Age- sex- race- radiotherapy utilisation rates Age-stratified and sex-stratified life-tables Number of current board-certified radiation oncologists 2009 residency graduates and 2010 to 2013 expected to graduates Age- and sex-stratified proportion of radiation oncologists practicing full time part time and not practicing
radiation therapy in 2020 bullFTE radiation oncologists in 2020 bullSize of residency training classes to have supply equal demand
accommodate increased patient volume bull Estimate of modest changes in radiation therapy practice patterns may impact patient throughout without compromising quality future technologies
116
Author year Design model type analysis
Parameters included (population level or individual level)
Outcomes Assumptions amp Limitations
Starkiene et al Supply stock and flow Population projections bullFTE-to-population ratio by bull Used different assumptions to manipulate supply and 2005 (183) approach
Demand needs-based model and demandutilisation-based model
Mortality Retirement Migration Drop out from training Enrolment numbers of trainee
different scenarios in supply and demand
demand scenarios bull Retirement Scenario 1 The retirement age was set to be 66 years and it was assumed that one fifteenth of the group of FPs aged more than 50 years would retire annually bull Retirement Scenario 2 The retirement age was set to be 71 years and it was assumed that one fifteenth of the group of FPs aged more than 55 years would retire annually
Teljeur et al 2010 (184)
Supply stock and flow approach Demand demandutilisation-based approach
GP visit rates Age-sex rates of GP attendance Population projection 2009-2021 Mortality rate for higher professionals Work practice Services provided Practice structure Overseas graduates Educationtraining Retirement Nurse substitution
bullGPs needed to meet population demand bullGP numbers by different supply scenarios
bull Nurse substitution Scenario 1 Nurses were equivalent to 025 FTE GPs bull Nurse substitution Scenario 2 Nurses were equivalent to 05 FTE GPs bull Assume that the number of GP vocational training places would increase by 20 in 2011 bull Later retirement has been considered bull Lack of regional data resulted in failing to test potential impact of each intervention on geographical differences
117
Author year Design model type analysis
Parameters included (population level or individual level)
Outcomes Assumptions amp Limitations
Weissman et al Supply stock and flow Age and sex distribution of bullAnaesthesiologists per 100000 bull Based on status quo of 108 anaesthesiologists per 2006 (185) approach
Demand needs-based model and demand-based model
anaesthesiologist population Employment status (full-timepart-time) Country of medical school education Last anaesthesiologist residency Professional status (resident certified specialist anaesthesiologist) Medical school academic appointment Historical and projected age distribution and birth rate of the Israeli population Immigration data on physicians Physicians required per capita Number of surgeries per anaesthesiologist
population bullNew anaesthesiologists needed
100000 population
Yang et al 2013 (186)
Supply stock and flow approach Demand population-based analysis
Population growth Number of plastic surgeons certified in 2010 Retirement Graduate Growth of the number of invasive and non-invasive cosmetic procedures
bullHeadcount of practicing plastic surgeons bullHeadcount of plastic surgeons needed
bull Only focus on plastic surgeons in US bull The number of new graduates would be constant bull The number of trainee positions would be static bull All practicing plastic surgeons would retire after 35 years post residency work
118
Nurses
Author year Design (Model type analysis)
Parameters included (population level or individual level)
Outcomes Assumptions amp Limitations
Supply model Buerhaus et al 2000 Using retrospective Forecast of US population through bullSupply projection 2001-2020 bull Future cohorts will enter nursing at a rate similar to (93) analysis of employment
trends to project long-term age and employment of RNs (Trend analysis)
2020 by age The propensity of individuals from a given cohort to work as RNs The relative propensity of RNs t work at a given age
bullAnnual FTE employment of RNs in total and by single year of age
current cohorts bull Changes of the workforce over time only depend on the age of the cohort
National Health Dynamic model Annual growth in 3 year pre reg bullNumber of registered nurses in bull Annual growth in 3 year pre registration commissions System 2008 (92) commissions
FTEHead count Attrition New registrants International recruitment Return to practice change Other joiners Other leavers
2008-2016 based on WRT assumptions bull FTEHead count based on historic trend bull International recruitment based on 3-year average
119
Author year Design (Model type analysis)
Parameters included (population level or individual level)
Outcomes Assumptions amp Limitations
Demand models Ghosh et al 2005 Computer-based model In-patient units bad capacity bullOverall nurses required adjusted bull No variation included all parameters are constant over (101) given certain prescribed
patient-nurse ratios (Benchmarking)
bed occupancy rate and the percentage share of patients in each unit according to an accepted patient classification system Outpatient Department Required physical allocation Total OPD working days in a year Total working daysnurseyear Operating theatres planned OT shifts per week number of weeks per year nurses per OT per shift Total working daysnurseyear AampE Nursesshift Number of shifts in a day Number of days in a year Total working daysnurseyear Renal dialysis Number of sessionsstationweek Number of stations Number of weeks in a year Nursestation Total working daysnurseyear Sickness maternity amp deputation leave
for sickness maternity amp deputation leave
years
120
Author year Design (Model type analysis)
Parameters included (population level or individual level)
Outcomes Assumptions amp Limitations
Mixed models Al-Jarallah et al Supply Supply Workforce projection 2007-2020 bull Changes in healthcare policies or nursing education can 2009 (100) Dynamic model
Demand Projected by using the average nurse-to-population ratio for 1994-2006 (Benchmarking)
Graduates
Demand Population growth Nurse-to-physician ratio
Supply bullNumber of nurses
Demand bullNumber of nurses needed
greatly affect the workforce
Auerbach etal Supply Hours worked Supply bull Different assumption used for various scenarios to 2012 (94)
Demand Utilisation-based model
Utilisation of services Sector Education Marital status Age group Poverty Insurance status Raceethnicity classification Number of RN and NP
bullNumber of Nurse Practitioners (NP) and RN specializing in SRH
Demand bullUtilisation of SRH services
predict the workforce for NPs in SRH bull Only focus on SRH service
121
Author year Design (Model type analysis)
Parameters included (population level or individual level)
Outcomes Assumptions amp Limitations
Canadian Nurse Supply Supply Workforce projection 2011 and bull Assume the average utilisation of services at any given Association 2002 Dynamic model Age 2016 age remains constant (110)
Demand Need-based model and utilisation-based model
Sex Population Working hours Graduates Retirement Migration Demand Population
Supply bullNumber of RNs by age bullPercentage of RNs employed in Nursing by age Demand bullNumber of employed RNs required
Health Resources Supply Population Demand bull Assumes that current staffing patterns at the national and Services Measuring RN supply at Number of registered nurse bullUtilisation in-patient day level reflect a balance of supply and demand differences Administration the county level taken Short-term in-patients days bullStaffing ratio Projected RNs per within types of care in factors such as patient acuity do not 2007 (107) from the 2000 US
Census data
Demand Utilisation-based model and benchmarking Simplified Nurse Demand Model from HRSArsquos models
Long-term in-patient days Psychiatric hospital in-patient days Nursing home unit in-patient days Outpatients visits Emergency department visits Population demographic RNs per 100 hospital beds Local nursing wages Numbers of nursing schools and graduates Number of new RNs passing exam Turnover rates Vacancy rates Hard-to-fill positions Staffing ratios Poor facility outcomes Case mix and acuity Worker satisfaction Turnover leadership
100000 age-adjusted population RNs per in-patient days and RNs per visits etc bullRN demand by county staffing ratioutilisation
vary substantially across counties and RN commuting patterns are similar to the commuting patterns of other workers in terms of county flow and outflow
122
Author year Design (Model type analysis)
Parameters included (population level or individual level)
Outcomes Assumptions amp Limitations
Health Resources Supply Supply Workforce projection 2000-2020 bull Applying national estimate to the State level and Services Dynamic model Graduates Administration Attrition Supply 2002 (65) Demand
Project the required nursing services by forecasting the future staffing intensity (Benchmarking)
Aging of RN workforce Decline in relative earnings Alternative job opportunities
Demand Population growth and aging Per capita demand for healthcare Trend in healthcare financing (health insurance) Workload by settings Staffing intensity
bullNumber of FTE RNs by states bullEmployment distribution by settings
Demand bullNumber of FTE RNs by states
Health Workforce Supply Supply Workforce projection 2009-2025 bull Only headcount numbers were presented in the report Australia 2012 (95) Dynamic model
Demand Utilisation-based model and benchmarking
Graduates Migration Retirement Illness and death Career change Working hours
Demand Area of practice Productivity Working hours
Supply bullProjected Number of nurse headcount
Demand bullAcute care nursing number of bed-days bullEmergency care nursing number of attendances at emergency departments bullMidwives calculated from the total number of projected births based on the actual number of births from 2006 to 2008 by population projection ratio from 2009 to 2021
123
Author year Design (Model type analysis)
Parameters included (population level or individual level)
Outcomes Assumptions amp Limitations
Health Workforce Supply Population growth Workforce projection of bull Only focus on perioperative nursing Information Dynamic model Age perioperative nurse (PN) 2009- bull Assumes there will be an increase in the scope of practice Programme 2009 Surgical intervention 2031 for nurses Also assumes that more non-nursing occupation (187) Demand
Need-based model Career changes Job patterns Education Outflows Sectors (public and private)
Supply bullNumber of PN by sectors
Demand bullNumber of PN by sectors
groups will perform support roles for both medicine and nursing
Juraschek etal Supply Population Workforce projection 2008-2020 bull Supply the current RN utilisation the education of new 2011 (188) Trend analysis
Demand Linear Regression Model and Trend Analysis
Age Personal health expenditure FTE RN job shortage ratios RNs per 100000 population
Supply bullNumber of RN jobs
Demand bullNumber of RN jobs needed
RNs and the national propensity of an individual to choose nursing as a career is the same across states in coming decades
bull Demand Used 2009 national mean as a baseline of demand model means there is no shortage in 2009 but in fact most studies consider the nation to already experience a large shortage
bull Using RN jobs as measurement cannot take working hours into account
124
Author year Design (Model type analysis)
Parameters included (population level or individual level)
Outcomes Assumptions amp Limitations
LeVasseur 2007 Supply Supply Workforce projection 2005-2020 bull The supply and demand sides are independent of each (106) Dynamic model
Demand Estimating the demand for FTE RNs by calculating the RN staffing intensity by healthcare setting eg RNs1000 in-patient days in in-patient setting and RNs10000 population in the physiciansrsquo office (Benchmarking)
Based RN population (2000) Migration Highest level of education Attrition State population and potential pool of applicants to nursing programs
Demand Population uninsured Medicaid eligible Per capita income Demographics Geographic location RN staffing intensity by healthcare setting
Supply bullEstimated number of licensed RNs bullActive RN supply bullFTE RN supply
Demand bullNumber of FTE RNs
other
bull The demand model cannot model the substitution between different types of nurses and between nurses and other healthcare professions
bull The demand model cannot capture the interaction between settings
Author year Design (Model type analysis)
Parameters included (population level or individual level)
Outcomes Assumptions amp Limitations
Malyon et al 2010 Supply Supply Workforce projection 2006-2022 bull Assumption of no productivity changes (98) Dynamic model
Demand Need-based model and trend analysis
Age Working hours Graduates Migration Retirements Maternity Productivity
Demand Population Burden of disease and injury Technology impacts
Supply bullNumber of Nurse Headcount bullNumber of Nurse FTE
Demand bullNumber of Nurse Headcount
bull Assumption of no technology impacts
125
Author year Design (Model type analysis)
Parameters included (population level or individual level)
Outcomes Assumptions amp Limitations
Moulton etal 2008 Supply Age Workforce projection 2008-2020 bull Assumed that the number of new RN graduates will (105) Trend analysis
Nursing Supply Model (HRSA)
Demand Trend analysis Nursing Demand Model (HRSA)
Sex Education Graduates Retirements Population
Supply bullNumber of FTE RNs
Demand bullNumber of FTE RNs
remain constant over time Trend and rates remain constant throughout
Moulton 2003 Supply and Demand Licensed nurses Workforce projection for direct bull Trend analysis that means the report assumes the trend (109) Trend Analysis Graduates
New license by exam endorsement Age Aging population Variation in strength of the economy Part-timefull-time nurses
care nursing 2003-2013 Supply bullNumber of RNs and Licensed practical nurses (LPNs) Demand bullNumber of RNs and (LPNs)
will be the same rate though 2013
Murray 2009 (99) The HRSA Nurse Supply and Demand Models revised and updated in 2004 were used to create the Tennesseersquos projection Supply Dynamic model
Demand Project the required nursing services by forecasting the future staffing intensity (Benchmarking)
Supply Graduates Retirement Migration Working hours Renew rate
Demand Population Healthcare market conditions Economic conditions Patient acuity in different settings Working hours
Workforce projection 2008-2020 Supply bullNumber of RN FTE bullNumber of Licensed Practical Nurse (LPN) FTE
Demand bullNumber of RN FTE bullNumber of Licensed Practical Nurse (LPN) FTE
bull The supply and demand sides are independent of each other eg the projection of demand didnrsquot consider the potential supply of nurses
126
Author year Design (Model type analysis)
Parameters included (population level or individual level)
Outcomes Assumptions amp Limitations
Rosenbaum and Supply Supply Workforce projection 2006-2020 Ramirez 2006 (108) Dynamic model
Demand Convert the population projection into numbers of people needing care (Need-based model) Calculate the required FTE RNs per capita (Benchmarking)
Working hours Migration Nurse education Attrition Graduates
Demand Aging population Working hours
Supply bullFTE Nursing supply
Demand bullEstimated FTE RN demand = the units of healthcare usage in each setting FTE RNs per unit of healthcare usage
Spetz 2009 (102) Supply Dynamic model
Demand RN-to-population ratio (Benchmarking) and future hospital utilisation (utilisation-based model)
Supply Graduates Retirement Migration Working hours Population
Demand Population growth and aging Working hours Proportion of RNs who worked in hospital setting
Workforce projection of RNs 2009-2030 Supply bullForecasted FTE supply of RNs bullForecasted employed RNs per 100000 population
Demand bullForecasted FTE demand for RNs bullRNs per capita bullRNs per patient day
bull Do not account for short-term changes eg economic conditions
bull The utilisation-based model was only for hospital setting The total demand was calculated by dividing the Hospital FTE by the proportion of RNs who worked in hospital setting
127
Author year Design (Model type analysis)
Parameters included (population level or individual level)
Outcomes Assumptions amp Limitations
Srisuphan et al 1997 (111)
Supply Dynamic model
Requirement Health demand analysis Demand-based model determined by econometric projections
Health service development analysis Demand-based model for public sector and trend analysis for private sector
Nurse population ratio Demand-based model projected by estimating future economic and population growth
Supply Graduates Attrition
Demand Future economic Population Staff norms Death rate Urbanization Health insurance coverage Demand components (eg nursing services teaching and management)
Workforce projection 1995-2015 Requirements bullNurse-Population ratio bullProjected demand for nurses by units bullProjected demand for nurses by fields of practice
Supply bullExpected graduates bullExpected number of RNs
128
Author year Design (Model type analysis)
Parameters included (population level or individual level)
Outcomes Assumptions amp Limitations
Tomblin Murphy et Simulation model for Supply Workforce projection 2005-2020 bull The efforts to support the projection would be al 2009 (103) supply and requirement
Supply Stock and flow approach
Requirement Need-based model
Graduates Migration Attrition (Death and Retirement) Relocation Change of profession
Requirement Population size and profile Level and distribution of health and illness in the population Risk factors of illness in the population Level of service Productivity Sectors
Supply bullNumber of new RNs entrants bullNumber of exits from the stock over time
Requirements bullEstimates of RN productivity (eg number of acuity-adjusted episodes of care per RN FTE per year) bullEstimates of the number of RN required
significantly hindered by the data reliability and availability relevant to the work of RNs
bull Sectors included acute care long-term care home care community and public health
Wisconsin Supply constant RN-to- Supply bullWorkforce projection 2010 2015 bull Assumed that the 2010 RN-to-population ratios would Department of population ratios Graduates 2020 2025 2030 2035 remain constant Workforce (Benchmark) Change in labour force bullHeadcount and FTE of RNs for bull Better data required to determine quality of RN FTE Development 2011 participation direct patient care broad nursing bull Severity of illness or demand by diagnosis (96) Demand constant nurse
staffing intensity and healthcare usage by employment setting and by age (Benchmark)
Retirement Death and disability Migration
Demand Staffing intensity Healthcare use by setting and by age
workforce
129
Dentist
Author year Model typeanalysis Parameters included (population level or individual level)
Outcomes Assumptions amp Limitations
Supply models Chrisopoulos and Teusner 2008 (81)
Stock and flow Baseline number of dentists Australian university Graduates Overseas entrants Return to practice (RTP) return from overseas return after cessation of practice Migration Retirements Death Alternative career Study and parental leave
bullNumber of dentists
bullDentists-to-population ratio
bull Hard to predict the trends in the future practice activity of new graduates trained by new schools may be different from previously observed patterns
Grytten and Lund 1999 (82)
Dynamic model Retirement
New entrants
bullNet change in man-labour years 1999-2015
bull Assuming the number of new entrant remains constant
Guthrie etal 2009 (80)
Dynamic Model Plateau linear and exponential increases for new graduates population growth was projected to be linear
Productivity Gender mix Retirement rate Projection of the number of graduates Number of new dental schools Population growth
bullNo of dentists per 100000 bullDentist-to-population ratio
bull Assumes that the dental services are delivered largely through private markets subject to the effects of supply and demand and that enrolment in dental schools reflects the rate of return of a career in dentistry in comparison to other options for college graduates
130
Author year Design (Model type analysis)
Parameters included (population level or individual level)
Outcomes Assumptions amp Limitations
Saman etal 2010 (78)
Poisson regression modelling and geospatial analyses System Dynamic Model (iThink iSee Systems Version 91)
Number of dentists retiring per year Number of dentists entering profession Population estimates
bullNumber of dentists entering profession
bullDentist-to-population ratios
bull The dentist-to-population ratio is not a sufficient measure by itself bull Fixed retirement rate at 82 per year and fixed incoming rate at 55 per year
Solomon 2009 (79) Dynamic Model Number of graduates Gender ratio Retirements Population Specialists Full time and part time
bullNumber of dentists working full-time and part-time bullNumber of dentists by specialty status bullNumber of dentists per 100000 populations
bull The paper isolates the different parameters and looks at it differently does not tie in the parameters together
Spencer et al 1993 (83)
Dynamic model Number of new surgeons per year recruited Wastage rates
bullNumber of surgeons bullPopulation-to-surgeon ratio
bull Wastage rates are not explicitly given so assumptions not easy to ascertain
Demand models Morgan et al 1994 (85)
Need-based and demand-weighted method
Age-specific Decayed missing and filled teeth (DMFT) rates Prostheses rates Rates for other dental procedures (not listed) Population projection
bullRequired operator-to-population ratio
bull Assume DMFT would decline but at different rates for different age groups and also rate of decline will decrease bull Assume prosthetic needs would increase bull Other assumptions for changes in demand
Nash et al 2002 (84)
Utilisation-based model Population projection Assumed yearly increase in utilisation
bullNumber of endodontists required bull Assuming different scenario for utilisation increase
131
Author year Design (Model type analysis)
Parameters included (population level or individual level)
Outcomes Assumptions amp Limitations
Mixed models Australian Research Supply stock and flow Supply Supply bull Only focus on Oral and maxillofacial surgeons (OMF) Centre for Recruitment bullNumber of OMF surgeons bull Inout-flow probabilities stay constant over time Population Oral Retirement bullPracticing OMF surgeons per bull Changes in demand not directly linked to external Health the Death 100000 populations factors eg technological advance or increased Medicare University of Demand Utilisation- Outflow overseas funding Adelaide South based model Cessation of practice Demand Australia 2010 (86) Practice sectors
Demand People with OMF diseases or conditions Population
bullNumber of services
Beazoglou etal Supply Specialty distribution Supply bull Assumes that the past rate of productivity improvement 2002 (89) Dynamic model
Demand Utilisation-based model
Retirement New entrant Types of auxiliaries employed Population Income of population Socio-demographic characteristics Productivity
bullNumber of dentists
Demand bullPer capita utilisation bullPopulation-to-dentist ratio bullNumber of dentists bullNumber of dentists needed to maintain current levels of access to care
will continue for the next 10 years low sampling due to national surveys
bull Population not stratified
bull Demand proxied by national expenditure on dentistry
Brown et al 2007 Trend analysis and Supply Supply bull Supply (88) need-based model Female dentists
Productivity Practice patterns Demand Population Economic buying power Knowledge and appreciation of dental services Amount of disease
bullNo of dentists
Demand bullNo of dentists needed
Considered both adjusting and not adjusting for productivity increase
132
Author year Design (Model type analysis)
Parameters included (population level or individual level)
Outcomes Assumptions amp Limitations
Gallagher et al 2010 (87)
Supply Trend analysis and dynamic model
Demand Utilisation-based model
Supply
percept yearly increase over the previous 9 years
Short-term recruitment drive of over 1000 dentists Increased dental student intake percept of time devoted to older people percept devoted to NHS patients percept women dentists Number of dental hygienists and therapists and clinical dental technicians (CDTs) Demand Rate of edentulousness Dental attendance pattern Treatment rates General dental services (GDS) Treatment times Treatment type
Supply
bullNumber of WTE dentists
bullShortfall or surplus of WTE dental staff (not just dentists)
Demand bullTotal number of treatments bullTotal demand for treatment hours bullPer capital demand
bull Supply of government dentists only
bull Made various assumptions on which treatment can be performed by hygienists therapists and CDT
bull Demand only focus on the population aged over 65
Try 2000 (90) Supply Dynamic model
Demand Utilisation-based model
Supply Graduates (net inflow) Working hours Female dentists Productivity Demand Population Patterns of disease Dental diagnosis Age-sex-specific no of courses of dental treatment
Supply bullWhole Time Equivalent (WTE) of dentists
Demand bullNumber of courses of treatment bullCourses of treatment per WTE dentist
bullAssumed that the proportion of female stays the same
bullAssumed that Part-time working becomes more common
133
Author year Design (Model type analysis)
Parameters included (population level or individual level)
Outcomes Assumptions amp Limitations
Waldman 1995 (91) Simple calculations Demand Population projection (state-wise) Population dentist ratio Assumptions on retirement
Supply bullNumber of new periodontists available to practice
Demand bullNumber of active periodontists needed bullNumber of new periodontists needed (to replace retirement)
bullOnly focus on periodontal patients bullAssumed that 186 of graduates are not from the US and will go back bullAssumed that in 2020 all dentists ge 40 in 1991 will have retireddied All dentists lt 40 still practicing
134
Pharmacist
Author year Design Model type analysis
Parameters included (population level or individual level)
Outcomes Assumptions amp Limitations
Supply models Bond et al 2004 (114)
Dynamic model Graduation retirement
bullNet increase in pharmacists from 2000-2020 bullIncrease in pharmacists who complete residencies from 2000-2020
bullData from a survey in 1998 may not be representative of the healthcare in 2020
Cooksey et al 2002 (116)
Dynamic model Graduation Workload (average number of Prescriptions dispensed annually) Working hour Productivity increase Percentage of female pharmacist
bullProjected pharmacists per 100000 population ratio in 2005
bullProjected female pharmacists () in 2005
bullNo analysis of urban or rural practice
Johnson et al2009 (112)
Dynamic model Pharmacist to population ratio
New graduate and training capacity Increasing number of female pharmacist working hour Reference period 2000-2008
bullTo project target workforce in 2008-2020 by using FTE measures
bullFTE definition bullOne who works average 1890 hours per year (40 hours per week times 472 weeks per year)
Knapp and Cultice 2007 (113)
Stock-flow model Age Retirement and death Graduates Working hour Number of female pharmacist Parameters included (population level or individual level)
bullAge and gender based pharmacist supply projection 2004-2020
Assumption bullAll the pharmacists would retire by age 75 bullThe increase of female pharmacist percentage would continue
135
Author year Design Model type analysis Parameters included Outcomes Assumptions amp Limitations
Demand models Bond et al 2004 (115)
Trend analysis (clinical pharmacist)
Pharmacist time (hrswk) Pharmacist time (minpatient) Number of patients who received each decentralized clinical pharmacy service Working hour
bullTotal No of Clinical Pharmacists FTEs per Hospital needed in 2020
bullTotal No of Clinical Pharmacists FTEs needed in 2020
bullData from a survey in 1998 may not be representative of the healthcare in 2020
Johnson 2008 (117) Trend analysis Graduation rates Residency training
bullProjected the no pharmacists needed in 2020
bullNo detail of pharmacist-to-population ratio no data of gender difference
Meissner et al 2006 (118)
Demandutilisation base Medicare Part D (Drug coverage) ADI (Aggregate Demand Index) Percentage of costs paid by third-party payer prescription volume pharmacist-to-technician ratio Direct-to-Consumer (DTC) mail order graduates retirement pharmacist wages
bullProjected Aggregate Demand Index (ADI) for 2009
bullPrediction of no of pharmacists needed in 2010
bullPrediction of pharmacist shortage in 2020
bullMainly focusing on drug coverage not considering other services provided by pharmacists and the expanding roles
136
Author year Design Model type analysis
Parameters included (population level or individual level)
Outcomes Assumptions amp Limitations
Mixed models Department of Health and Ageing Australian Government 2007 (107)
Dynamic model
Demand utilisation model
Supply Working hour Graduates Immigration and emigration Retirement death and disability Inactive workforce Demand Population growth and ageing Working hour Sex- and age-specific ratios of scripts to persons per annum Productivity of dispensing workforce Technician-to-pharmacist ratio Technician equivalence to pharmacist Community pharmacy share of total service Further expansion of the role of both hospital and community pharmacist Number of people attending hospitals The ratio of pharmacists to hospital separations(discharge or death)
Forecast on annual supply of pharmacist through 2025 Supply bullTotal Graduates
Active and inactive (2006) bullActive bullInactive bullWorking outside pharmacy workforce
Forecast on Demand bullCommunity pharmacist bullHospital pharmacist
bullUnidentified variables bullInsufficient magnitude of change for some variables eg global financial crisis
Assumption bull248 population growth Community pharmacist bullRatio of technicians to pharmacists would increase to 03 by 2025 bullScripts to persons increase by 05 per annum bullDispensing productivity stays constant Hospital pharmacist bullHighest estimates of future growth bullWith declining ratio of separations to hospital pharmacists (ceases in 2012)
137
Author year Design Model type analysis
Parameters included (population level or individual level)
Outcomes Assumptions amp Limitations
Fraher et al 2002 (123)
Trend analysis
Dynamic model
Demand Population growth and ageing Insurance (prescription drug coverage) Direct-to-consumer (dtc) advertising
Supply Age Gender Working hour Graduates
Demand bullPrescriptions dispensed per population
Working hour per week (1989-1998) bullMale bullFemale
bullNot projection model
Health Resources Demandutilisation base Demand bullFTE shortfall projection Assumption and Services Population growth and aging bullExamine the adequacy of previous bullModerated prescriptions capita growth Administration New and more complex pharmacist supply projection bullNo growth in educational capacity (HRSA) 2008 (121) Dynamic model pharmaceuticals
Evolving societal attitudes Increased affordability and Availability of generic drugs Increase in pharmaceuticals for Chronic conditions Role of pharmacist Supply Number of graduates (local and overseas) Male-female ratio Working hour Attrition
bullProjection for total pharmacist supply bullProjected male-to-female ratio in workforce
bullFactors such as technology development and the number of graduates are uncertain
138
Author year Design Model type analysis
Parameters included (population level or individual level)
Outcomes Assumptions amp Limitations
Health Resources Trend analysis Demand bullSupply of Active Pharmacists bullNo projection of the demand for pharmacists and Services Volume of prescription (pharmacists per 100000 resident Administration medication dispensed (in different US population) (HRSA) 2000 (126) settings)
Population growth and aging Increased third-party prescription coverage Growth of the economy Expending roles Introduction of new and innovative drug therapies Direct-to-consumer marketing Increased number of prescription providers
Supply Graduates Male-female ratio Losses due to death retirement and leaving practice Region Working hour
bullPer cent of female active pharmacists
Knapp et al 2002 Trend analysis Demand bullLooked at ADI trend from year bullData unavailability eg retail prescription data for 2010 (189)
Dynamic model Unemployment rates Retail prescription growth rate
Supply Number of graduates
1999=2010
bullPearson Correlation between ADI and below factors bullUnemployment bullGraduates bullPrescription growth rate
and actual graduate data for 2010
139
Author year Design Model type analysis
Parameters included (population level or individual level)
Outcomes Assumptions amp Limitations
Knapp et al 2005 Trend analysis ADI (5-point rating system) bullRating distribution among bullThe usefulness of the ADI is limited by the fact that (124) 5= high demand for pharmacists
difficult to fill positions 4 = moderate demand some difficulty filling positions 3 = demand in balance with supply 2 = demand is less than the pharmacist supply available and 1 = demand is much less than the pharmacist supply available
different regions panellists may choose different ratings for the same scenario
bullReplacement panellists may not rate the severity of the shortage the same as did the original panellists within the same organization
Knapp 2002 (125) Dynamic model Graduation Working hour improvement of therapy growth of distance therapy increased intensity of hospital growth in size and complexity of hospital system Functional area (order fulfilment primary care secondary amp tertiary care and non patient care)
bullCurrent use of FTE pharmacist 2001 bullProjected need for FTE pharmacist 2020 bullTotal estimated FTE supply bullFTE pharmacist shortfall
bullMainly about the factors needed to be considered bullProjection model was not clearly described
Koduri et al 2009 Benchmark Pharmacist to population ratio bullProjected future trends for FTE Assumptions (120)
Dynamic model
Design Model type analysis
Expanded roles Prescription volumes growth Population growth and aging Insurance coverage DTC Marketing Expiring drug patentsAttrition Number of graduates Working hour Gender FTE adjustment
demand and supply
Outcomes
bull79 pharmacists would enter the field each year (in Utah) bullEach female pharmacist provides 079 FTE of pharmacy services
140
Radiographer
Author year Design Model type analysis
Parameters included (population level or individual level)
Outcomes Assumptions amp Limitations
Supply model Reiner et al 2002 Supply description Type of facility bullAverage FTEs Limitations (190) Facility size
Modality bullAverage number of FTE for different modalities bullRadiography bullCT bullUltrasonography bullMRI bullNuclear medicine bullMammography bullInterventionalangiography
bullOnly give out the average FTE numbers in different types of facilities bullDo not have a trend of FTE numbers
Wing et al 2009 Age cohort flow model Population growth bullProjection of FTE Supply of Assumptions (146) New entrants
Attrition Age Working hour
Radiologic Technologists bullStatus Quo Projection bullProjection on radiologic Technologists per 100000 Women
bullFuture resource inputs proportional to current practitioner-to-population ratio Limitations bullDo not account for productivity increase bullOnly focus on mammography
Mixed model Bingham et al Demand Trend analysis Demand bullProjection of overall radiography Assumptions 2002 (191)
Supply Trend description
Extension of NHS Breast Screening Programme from females skill mix (radiographer assistant) population ageing and growth WTE
Supply Graduates Working part-time and work-life balance Retirement Student attrition Career progression
workforce demand (2002-2006 plan) bullDiagnostic bullTherapeutic
Projection in Supply bulloverall radiographers bulldiagnostic radiographers bulltherapeutic radiographers
bullProjected supply against projected demand (2002-2006)
bull8 of attrition rate for radiographer students bullAll radiographers would retire on earliest eligible retirement age (60 years) bullWorkforce capacity lost due to increase of part-time working and work-life balance (175) would increase to 215 (01 per annum
141
Author year Design Model type analysis
Parameters included (population level or individual level)
Outcomes Assumptions amp Limitations
Centre for Trend analysis Data from DH bullProject increase in demand Limitations Workforce Age bullOnly focus on diagnostic radiographers Intelligence 2012 Graduates bullProjection available workforce (147) Field of practice
Training attrition Retirement Ageing population Increased demand in related groups
supply from 2010 to 2016 in headcount and FTE
Patterson et al Demand Population Demand Supply Assumptions 2004 (192) projections
Supply Trends description
Aging workforce and population Hospital radiographer employees and vacancies
Supply Total license grows Retirement Proportion of active licensees currently practicing Aging workforce and population Education capacity
bullActive licensees (currently practicing)
bullProjection on retirement
bullDemand (Vacancies)
bullA demand of 690 providers per 100000 populations
Limitations bullScarcity of data related to the statersquos radiographer workforce bullSize of radiographer workforce is small making the projections more volatile bullUnavailable data eg FTE migration in and out of state bullThe data of demand projection was based on hospital radiographer only bullActive license may not be able to represent the active practitioners
Victorian Demand Working hour bullProjected FTE Demand Limitations Department of demandutilisation Graduates 2009 - 2030 bullAssuming that no significant changes in radiation Health 2010 (193) model
Supply Stocks and flow model
Attrition Immigration Adjusted training requirement
bullProjected number of graduates 2010-2029 bullProjected FTE Shortage (based on current trends in workforce supply)
technology
142
Optometrist
Author year Model type analysis Parameters included (population level or individual level)
Outcomes Assumptions amp Limitations
Supply models Bellan etal 2007 (194)
Dynamic (Stock and flow) model
Retirement Death Emigration Age Sex Graduates Population
bullNumber of FTEs bullFTEs per 100000 populations bullPercentages of female FTEs
bullAssumes a status quo scenario in terms of attrition and gain factors
Demand based utilisation models (includes lsquoneedrsquo lsquorequirementrsquo etc) Tuulonen etal 2009 (137)
Computer simulation model using system dynamics approach
Number of cataract glaucoma diabetic retinopathy and macular degeneration Cost of those disease Number of ophthalmologists Number of physicians Population data
bullNumber of patients
bullService increase (eg Cataract surgery and Bilateral surgery)
bullDifferent number of assumptions based on what kind of disease they are looking at have various scenarios
Mixed models Australian Institute Trend analysis Age Supply bullAssume that there will be no significant change from the of Health and Number of optometrists bullNumber of FTEs optometrists current pattern of use of optometrist services the number Welfare 2000 (195) Number of optometrists
Migration Sex FTE Population demographics Graduates Utilisation of services
Demand bullNumber of FTEs needed
of graduates workforce participation and average number of services per optometrist
143
Author year Model type analysis Parameters included (population level or individual level)
Outcomes Assumptions amp Limitations
Kiely et al 2010 (196)
Supply Dynamic model
Demand Utilisation-based model
Graduates Retention rates Immigration Age Attrition Population Service utilisation rates
Supply bullNumber of FTEs bullPercentage of female optometrists
Demand bullNumber of FTEs required
bullAssumes different scenarios for practice and how it affects supply and demand
Lee etal 1998 (197)
Supply Unclear
Demand Need-based model
Subspecialty (not very specific on how they calculated)
bullNumber of FTEs by subspecialty bullDoes not specifically show how the FTE were calculated with certain parameters
Pick etal 2008 (141)
Trend analysis Retirement age and rates Graduates Retention rates Number of ophthalmologists Service hours Population
Supply bullTotal number of ophthalmologists
Demand bullRequire number of ophthalmologists
bullAssumes no change to working hours or the number of trainees lack full-time equivalent data for the workforce did not collect gender-specific data for the workforce did not consider overseas
144
Medical Laboratory Technician
Author year Model type analysis Parameters included (population level or individual level)
Outcomes Assumptions amp Limitations
Supply models Canadian Institute for Health Information (CIHI) 2010 (131)
Supply description Graduates Working hours Age Gender Pass rate of the certification examinations Field of practice Place of employment
bullFTE of active registrations in the previous years bullProportion of professions by field of practice
Assumptions bullStandard full-time weekly hours of 375 hours
Mixed models Health Resources amp Services Administration2005 (198)
Supply and demand Supply Population Graduates Career attraction (wages and career growth)
Demand Demographics Changing biomedical and information technologies Utilisation of laboratory test
bullShortages by types of workers and geographic area
Limitations bullNo numbers of supply and demand
145
Chiropractor
Author year Model type analysis Parameters included (population level or individual level)
Outcomes Assumptions amp Limitations
Supply models Davis et al 2012 (129)
Supply description Geographic variation Age Adult population Population educational levels
bullTotal number of Chiropractors bullChiropractors per capita
Limitations bullLack of information about working hours bullOnly included the chiropractors in Medicare
Davis et al 2009 (130)
Supply description Age Adult population Graduates
bullTotal number of chiropractors bullChiropractors per 10000 adult population (agegt18)
Limitations bullLack of information about working hours and number of visits
Mixed models Institute for Alternative Futures 2005 (128)
Supply stock and inflow Demand need-based model
Ageing Adult population Graduates Retirement Technology Conditions treated (eg low-back pain neck pain) Types of practice (eg solo private practice)
bullPercentage of using chiropractic care annually (agegt18) bullPercentage of chiropractic care provided to patients below 18 annually bullNo of practicing chiropractors bullPatient visits per week
Assumptions bullFour alternative future scenarios were being described and used for projection
Whedon et al 2012 (127)
Supply and utilisation description
Geographic variations Population (aged 65 to 99)
bullChiropractors per 100000 population (2008) bullAnnual services per chiropractic user bullChiropractic users per 1000 Medicare beneficiaries
Limitations bullThe chiropractic use may be underestimated due to the availability of chiropractic service in veteranrsquos administration health service
146
Physiotherapist
Author Year Design (Modeltype analysis)
Parameters included (population level or individual level)
Outcomes Assumptions amp Limitations
Supply models WRHA 2002 (135) Dynamic Model Positionvacancy data
Retirement data Graduates New registrants
bullVacancy percentage by Equivalence of Full Time
bullThe calculation of FTE it assumed that all persons employed were full time bullIt is not known whether any of the positions are filled by therapists working at more than one location
Mixed models Breegle 1982 (144) Supply
Dynamic Model
Demand Trend Analysis Need Model
Population Number of patient visits a year Average admissions average length of stay Possible outpatient visits per year Estimated home-bound patient visit needs Practitioners Graduates
bullRatio of PT per 10000 Population bullTrend analysis assuming factors influencing the historical trend remain constant
bullHealth-Needs Method assuming one third of the possible visits were physiotherapy related non-institutionalized people received 087 home visits
bullSupply based on the historical data
American Physical Therapy Association 2012 (199)
Supply Dynamic Model
Demand Linear Regression Analysis
Number of licensed PT Graduates International PT Attritionretirement rate Working hour per week Population with insurance Vacancy rate
bullFull Time Equivalent bullNumber of international PT will remain constant bullConstant attrition rate bullThe percentage of insured population is based on current rate However the percentage can change based on the Affordable Care Act bullVacancy rate only reflects the situation in 2010
Zimbelman 2010 (142)
Supply Dynamic Model
Demand Linear Regression Analysis
Number of PT available job vacancy Projected population Personal healthcare expenditure(PHE) Likelihood of being employed Population Baseline number of PT
bullShortage ratios per 10000 people bullThe demand model is determined only by age and population growth 2 Assumption of linear growth was made bullDoes not incorporate workplace settings part-time or full-time employment status
147
Occupational Therapist
Author year Design (Model typeanalysis) Parameters included Outcomes Assumptions amp Limitations
Supply models Salvatori et al 1992 (134)
Dynamic Model Population level data Actual 1988 employment data annual inactivity rate Graduates Immigration Re-entry figures
A part-time to full-time FTE ratio
bullNumber of Occupational Therapists
bullNumbers may not be accurate bullMany rates kept constant over years
WRHA 2002 (200) Dynamic Model Individual level data Current position and vacancy predicted new graduates Past retention rate for new graduates new registrants over the past 5 years retirement rate
bullVacancy rate by Equivalence of Full Time
bullInformation was based on previous data and representing status at one point in time and only based on requirements for the year of 2001 bullDifficult to measure the impact of the availability of work within private sector with the possibility of improved benefits and flexibility
Demand based utilisation models (includes lsquoneedrsquo lsquorequirementrsquo etc) Mirkopoulos et al 1989 (133)
Demand Analysis by growth per year
Population level data Current number of paid full-time and part-time OTrsquos Vacancy numbers Attrition rates in physiotherapy hospital average growth rate Home care average growth rate for OT
bullFull Time Equivalent bullIt was assumed that the factors affecting attrition would be very similar for physiotherapy and occupational therapy bullBaseline data didnrsquot represent the whole picture therefore there was underestimate of the true requirement projection
Mixed models Morris 1989 (136) Supply
Dynamic Model
Demand Analysis by growth per year
Individual level data Predicted number of additional positions by respondents from different sectors Projected population in Georgia national population ratio Average annual number of graduates between 1980-1986
bullFull Time Equivalent bullFuture demand was based on professions prediction bullAll Georgia graduates accept employment within the state and no separations from the work force occur
148
149
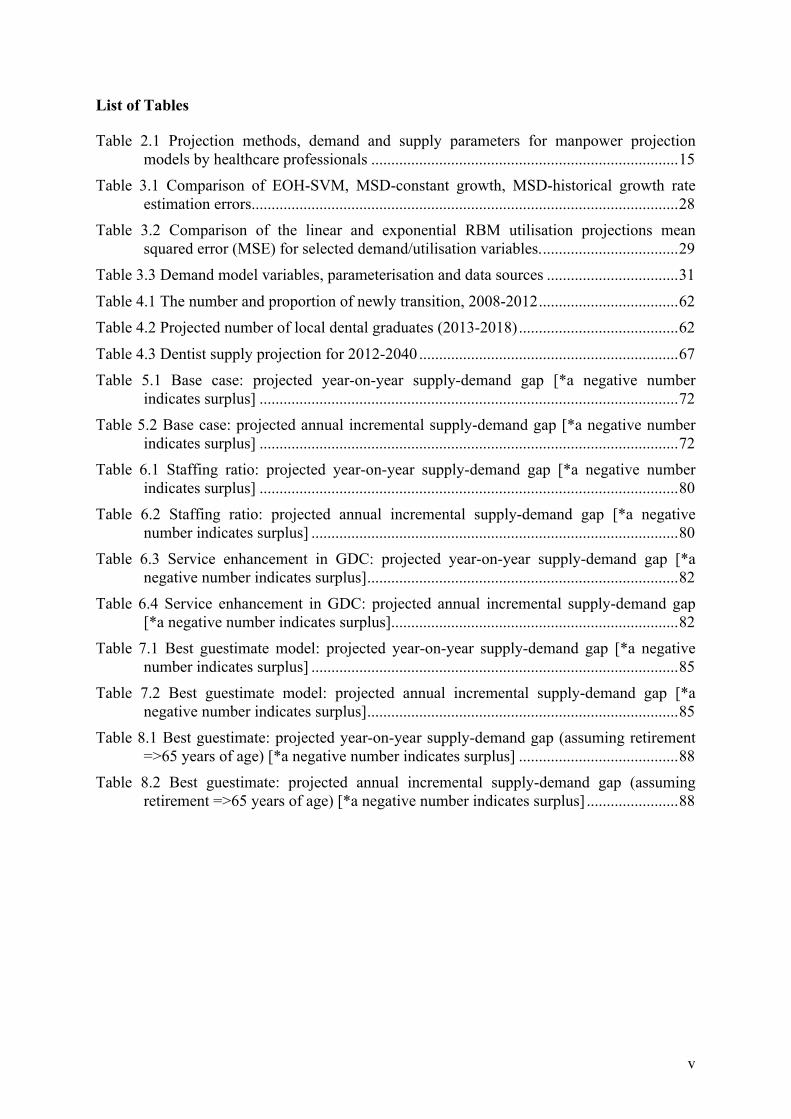