DENSO in Figures –Consolidated (DENSO Group). DENSO Corporation Established: Dec. 16, 1949...
15
DENSO in Figures –Consolidated (DENSO Group)
-
Upload
rodger-hart -
Category
Documents
-
view
223 -
download
0
Transcript of DENSO in Figures –Consolidated (DENSO Group). DENSO Corporation Established: Dec. 16, 1949...
DENSO in Figures
–Consolidated (DENSO Group)
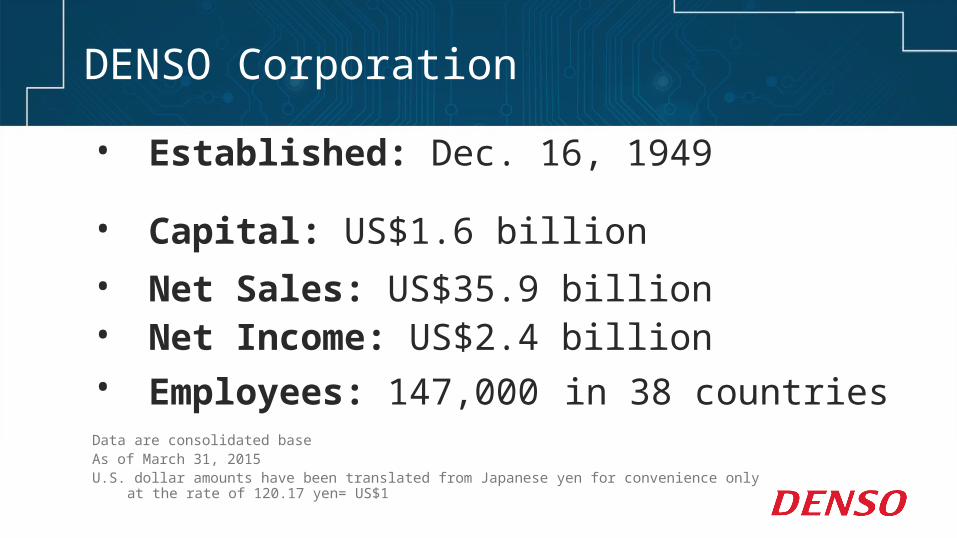
DENSO Corporation
• Established: Dec. 16, 1949
• Capital: US$1.6 billion
• Net Sales: US$35.9 billion• Net Income: US$2.4 billion• Employees: 147,000 in 38 countries Data are consolidated baseAs of March 31, 2015U.S. dollar amounts have been translated from Japanese yen for convenience only
at the rate of 120.17 yen= US$1
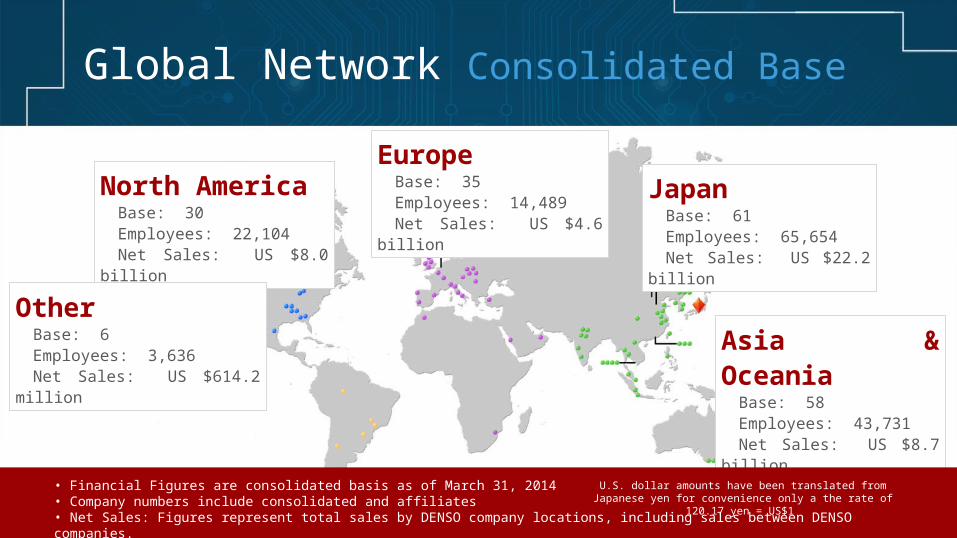
North AmericaBase: 30Employees: 22,104Net Sales: US $8.0 billion
EuropeBase: 35Employees: 14,489Net Sales: US $4.6 billion
OtherBase: 6Employees: 3,636Net Sales: US $614.2 million
Asia & OceaniaBase: 58Employees: 43,731Net Sales: US $8.7 billion
JapanBase: 61Employees: 65,654Net Sales: US $22.2
billion
• Financial Figures are consolidated basis as of March 31, 2014• Company numbers include consolidated and affiliates• Net Sales: Figures represent total sales by DENSO company locations, including sales between DENSO companies.
U.S. dollar amounts have been translated from Japanese yen for convenience only a the rate of 120.17 yen = US$1
Global Network Consolidated Base
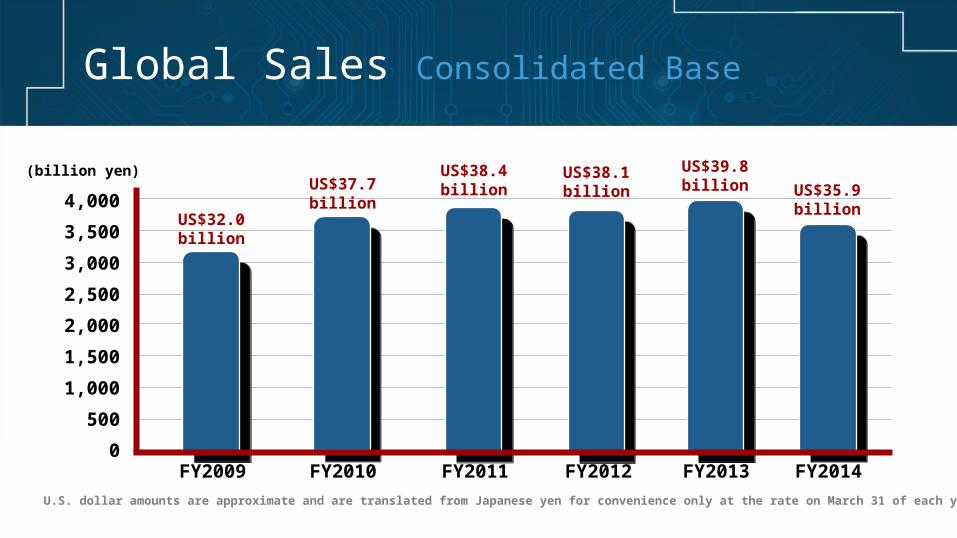
Global Sales Consolidated Base
(billion yen)
4,000
3,500
3,000
2,500
2,000
1,500
1,000
500
0FY2009 FY2010 FY2011 FY2012 FY2013
U.S. dollar amounts are approximate and are translated from Japanese yen for convenience only at the rate on March 31 of each year.
US$32.0billion
US$37.7billion
US$38.4billion
US$38.1billion
US$39.8billion
FY2014
US$35.9billion
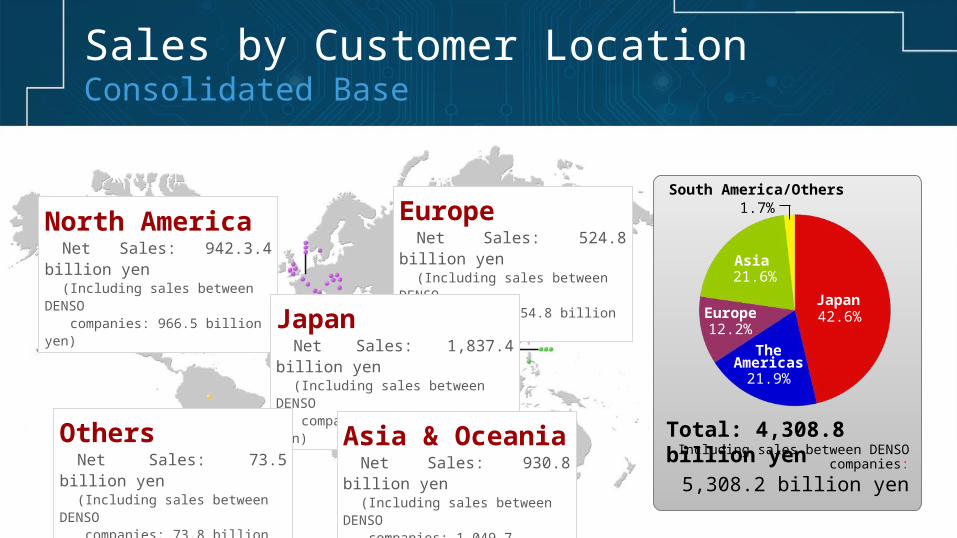
Total: 4,308.8 billion yenIncluding sales between DENSO
companies:
5,308.2 billion yen
42.6%Japan
21.9%
The Americas
12.2%Europe
21.6%Asia
1.7%South America/Others
EuropeNet Sales: 524.8 billion
yen(Including sales between
DENSO companies: 554.8 billion yen)
North AmericaNet Sales: 942.3.4 billion
yen(Including sales between
DENSO companies: 966.5 billion yen) Japan
Net Sales: 1,837.4 billion yen
(Including sales between DENSO companies: 2,663.5 billion yen)
OthersNet Sales: 73.5 billion yen(Including sales between
DENSO companies: 73.8 billion yen)
Asia & OceaniaNet Sales: 930.8 billion
yen(Including sales between
DENSO companies: 1,049.7 billion
yen)
Sales by Customer Location Consolidated Base

Powertrain Control Systems 35.5%
Thermal Systems 28.5%
Information and Safety Systems 14.5%
Electronic Systems 8.7%
Small Motors 7%
Other Automotive 1.6%
Industrial Systems/Consumer Products 1.2%
Others .3%
35.5%
28.5%
14.5%
8.7%
1.6%1.2%
.3%
4,308.8 billion yen
Sales by Business Groups Consolidated Base
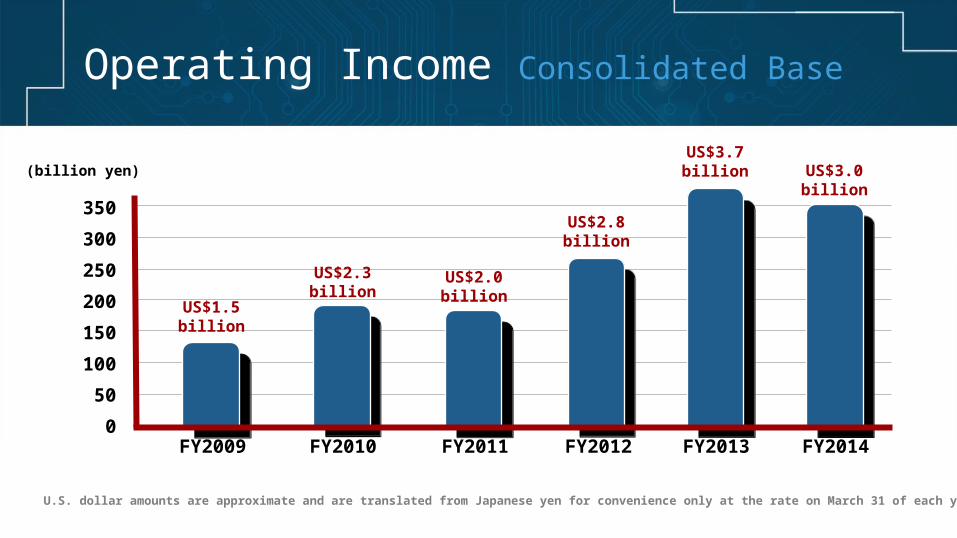
Operating Income Consolidated Base
(billion yen)
350
300
250
200
150
100
50
0FY2009 FY2010 FY2011 FY2012 FY2013
U.S. dollar amounts are approximate and are translated from Japanese yen for convenience only at the rate on March 31 of each year.
US$1.5billion
US$2.3billion
US$2.0billion
US$2.8billion
US$3.7billion
FY2014
US$3.0billion
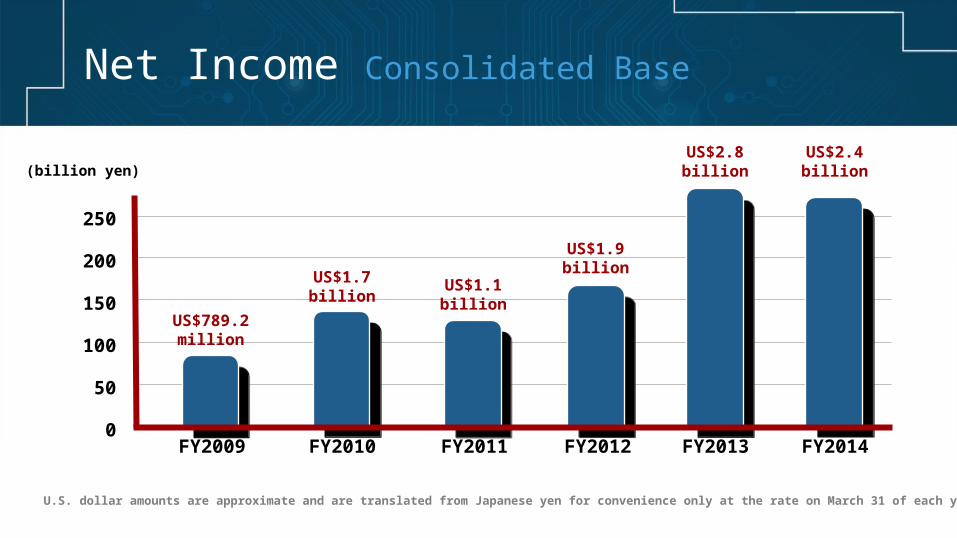
Net Income Consolidated Base
(billion yen)
250
200
150
100
50
0FY2009 FY2010 FY2011 FY2012 FY2013
U.S. dollar amounts are approximate and are translated from Japanese yen for convenience only at the rate on March 31 of each year.
US$789.2million
US$1.7billion
US$1.1billion
US$1.9billion
US$2.8billion
FY2014
US$2.4billion
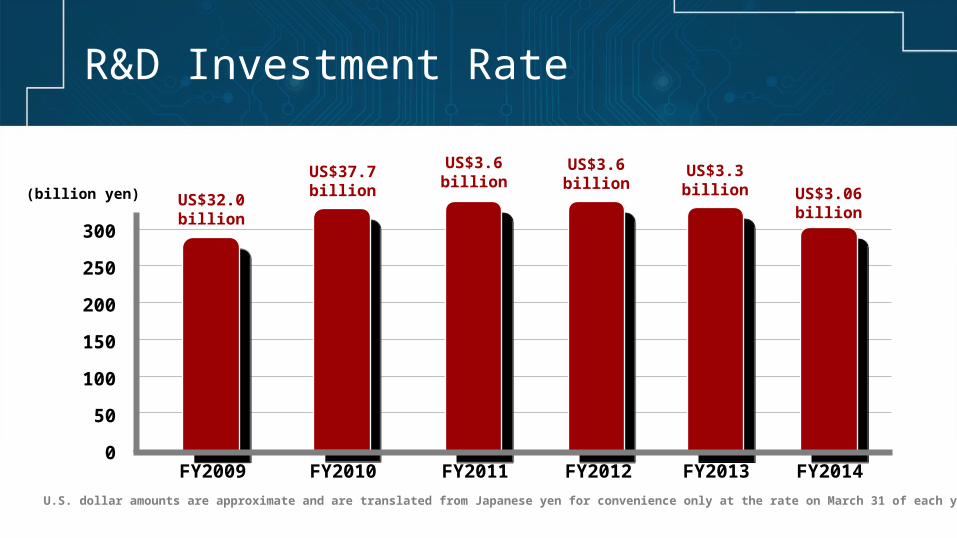
R&D Investment Rate
(billion yen)
FY2014FY2009 FY2010 FY2011 FY2012 FY2013
U.S. dollar amounts are approximate and are translated from Japanese yen for convenience only at the rate on March 31 of each year.
US$3.06billion
US$32.0billion
US$37.7billion
US$3.6billion
US$3.6billion
US$3.3billion
300
250
200
150
100
50
0

Global Employee Number Consolidated Base
(People)
140,000
120,000
100,000
80,000
60,000
40,000
20,000
0FY2009 FY2010 FY2011 FY2012 FY2013
120,812 123,165 126,036
144,567139,842
FY2014
146,714
DENSO in Figures
-North America
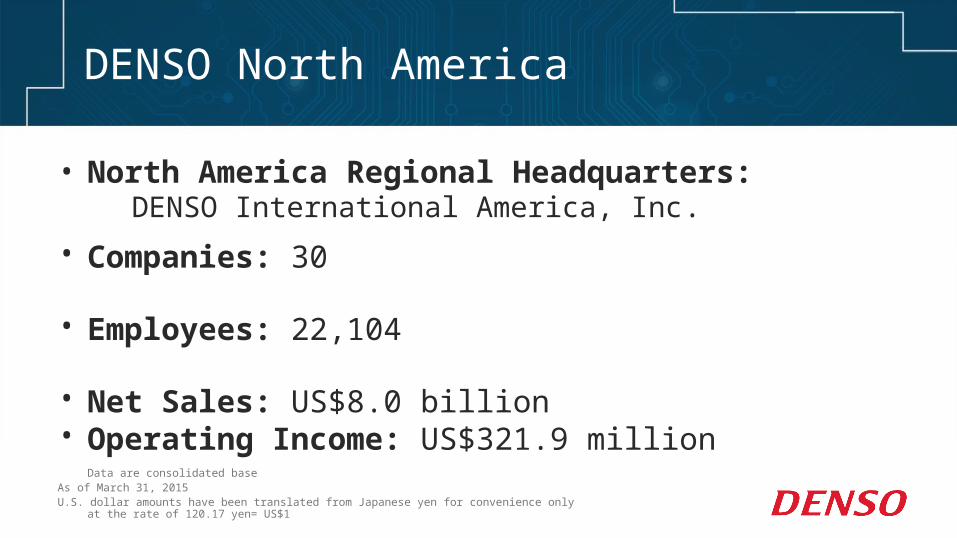
DENSO North America
• North America Regional Headquarters: DENSO International America, Inc.
• Companies: 30
• Employees: 22,104
• Net Sales: US$8.0 billion • Operating Income: US$321.9 million
Data are consolidated baseAs of March 31, 2015U.S. dollar amounts have been translated from Japanese yen for convenience only
at the rate of 120.17 yen= US$1

Sales North America
(billion yen)
FY2009 FY2010 FY2011 FY2012 FY2013
• Sales figures represent total sales by DENSO company locations, including sales between DENSO companies• U.S. dollar amounts are approximate and are translated from Japanese yen for convenience only at the rate on March 31 of each year.
US$5.7billion
US$6.4billion
US$6.2billion
US$6.8billion
US$7.9billion
800
700
600
500
400
300
200
100
0FY2014
US$8.0billion
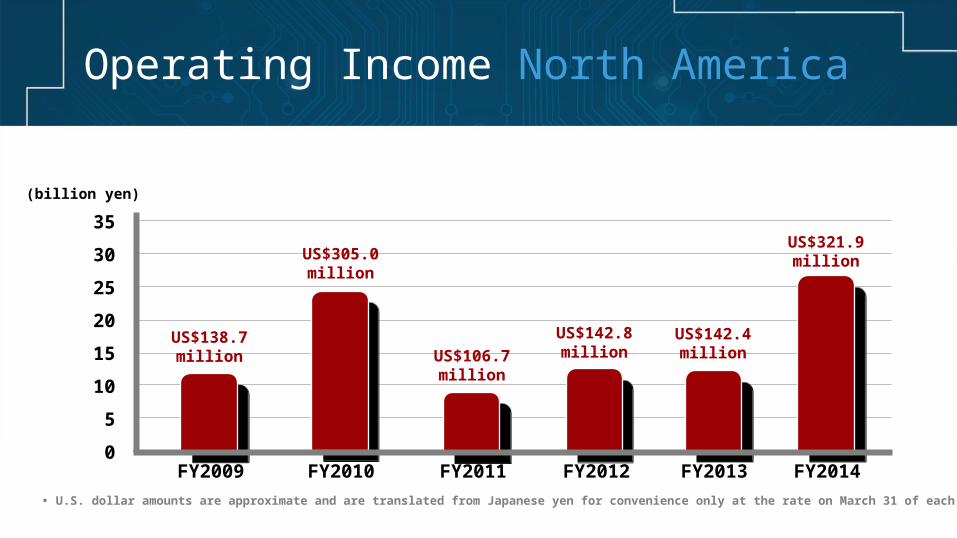
Operating Income North America
(billion yen)
FY2009 FY2010 FY2011 FY2012 FY2013
• U.S. dollar amounts are approximate and are translated from Japanese yen for convenience only at the rate on March 31 of each year.
US$138.7million
US$305.0million
US$106.7million
US$142.8million
US$142.4million
35
30
25
20
15
10
5
0FY2014
US$321.9million

Employee Number North America
(People)
FY2009 FY2010 FY2011 FY2012 FY2013
• U.S. dollar amounts are approximate and are translated from Japanese yen for convenience only at the rate on March 31 of each year.
16,000
13,00014,000 15,000
17,00020,000
15,000
10,000
5,000
0FY2014
22,000