Density dependent diffusion - UdGima.udg.edu/~martap/SlidesErice2015.pdf · Density-dependent...
24
Erice (Italy) August 30 2015 – September 5 2015. Density dependent diffusion and spread of epidemics in a metapopulation model. Marta Pellicer UNIVERSITAT DE GIRONA Catalunya (Spain) Joint work with A. Avinyó, J. Ripoll and J. Saldaña
-
Upload
nguyenthuan -
Category
Documents
-
view
218 -
download
0
Transcript of Density dependent diffusion - UdGima.udg.edu/~martap/SlidesErice2015.pdf · Density-dependent...

Erice (Italy) August 30 2015 – September 5 2015.
Density dependent diffusion and spread of epidemics in a metapopulation model.
Marta PellicerUNIVERSITAT DE GIRONACatalunya (Spain)
Joint work with A. Avinyó, J. Ripoll and J. Saldaña
Outline
The model: density-dependent diffusion on a metapopulation.
Migratory flows without epidemics.
• Heavily versus lightly populated areas.
Early stage of the epidemic.
• Local epidemic outbreaks.
[Ripoll, Avinyó, Pellicer, Saldaña: PRE 2015]

The model

Metapopulation: complex network
★ Nodes are local populations as cities (metropolitan areas)or regions or habitats in patchy landscapes, pair-wiseconnected by a non-trivial pattern of migratory flows.
★ Spatial description of patches given by the connectivitydistribution p(k) and conditional probability P(k’|k).
Approach based on the degree (k) of the nodes.
★ Individuals move randomly over the network at a certaindiffusion rate.
9

10
Processes taking place within each node: infection, recovery and demographic turnover.Process taking place on the network: migratory diffusion.
…
fixed connections
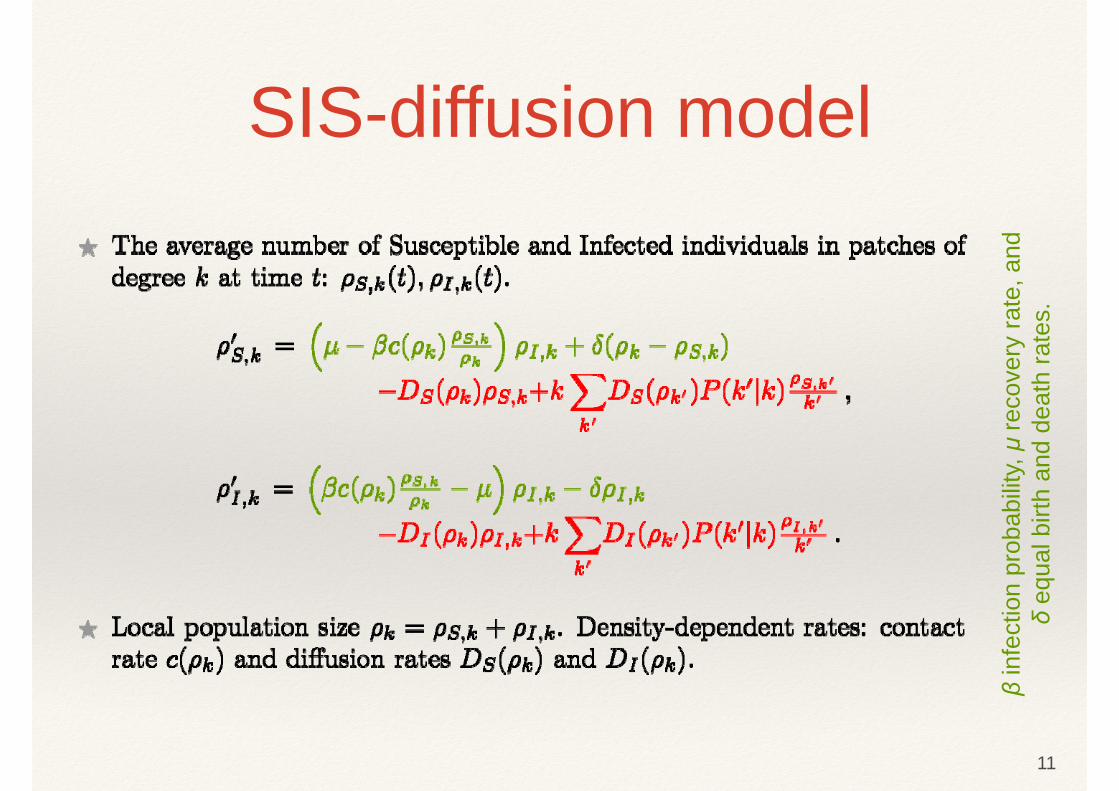
SIS-diffusion model
11
βin
fect
ion
prob
abilit
y, μ
reco
very
rate
, and
δeq
ual b
irth
and
deat
h ra
tes.

Other dispersal processes★ Gravity models (D. Brockmann (2010) , … )
★ V. Colizza, A. Vespignani (JTB 2008): diffusion depending on k, k’
★ …
Ours: dependence on the population density
of departure patch.

Study the impact of these migration patterns (1 mechanism)
❖ on the population distribution among heavily andlightly populated areas (HP and LP) withoutepidemics.
❖ on the epidemic growth.
❖ on the epidemic spreading (contribution of each local population to the propagation of the infection)
13
Goal:

Density-dependent diffusion★ F(DS (total outflow of individuals
Hypothesis: strictly increasing, F(0) = 0, continuous
★ Special case: DS) ~ (on the departure patch)
❖ = 0: constant diffusion rate (previous work [PRE 2009])
❖ > 0: positive dependence or conspecific competitionemigration from heavily populated patches
❖ < 0: negative dependence or conspecific attractionemigration from lightly populated patches
Diffusion without epidemics(I =0)

DF or migration-driven equilibrium
★Existence and uniqueness of DF equilibrium *k:
(M: normalizing constant such that *k = 0)
Rmks:
❖ Increases with k
❖ Independent of the network topology (driven by diffusionprocess)
18
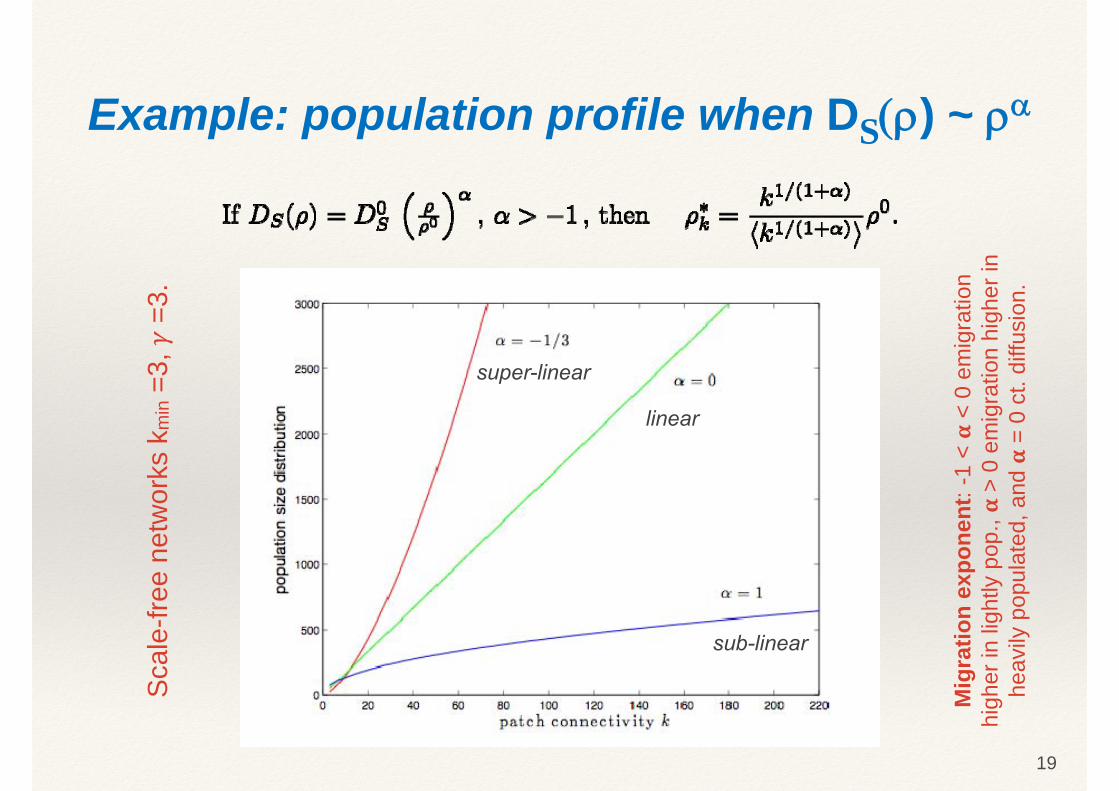
Example: population profile when DS) ~
19
Mig
ratio
n ex
pone
nt: -
1 <
< 0
emig
ratio
n hi
gher
in li
ghtly
pop
., >
0 em
igra
tion
high
er in
he
avily
pop
ulat
ed, a
nd
= 0
ct. d
iffus
ion.
Sca
le-fr
ee n
etw
orks
km
in=3
, =3
.
super-linear
linear
sub-linear
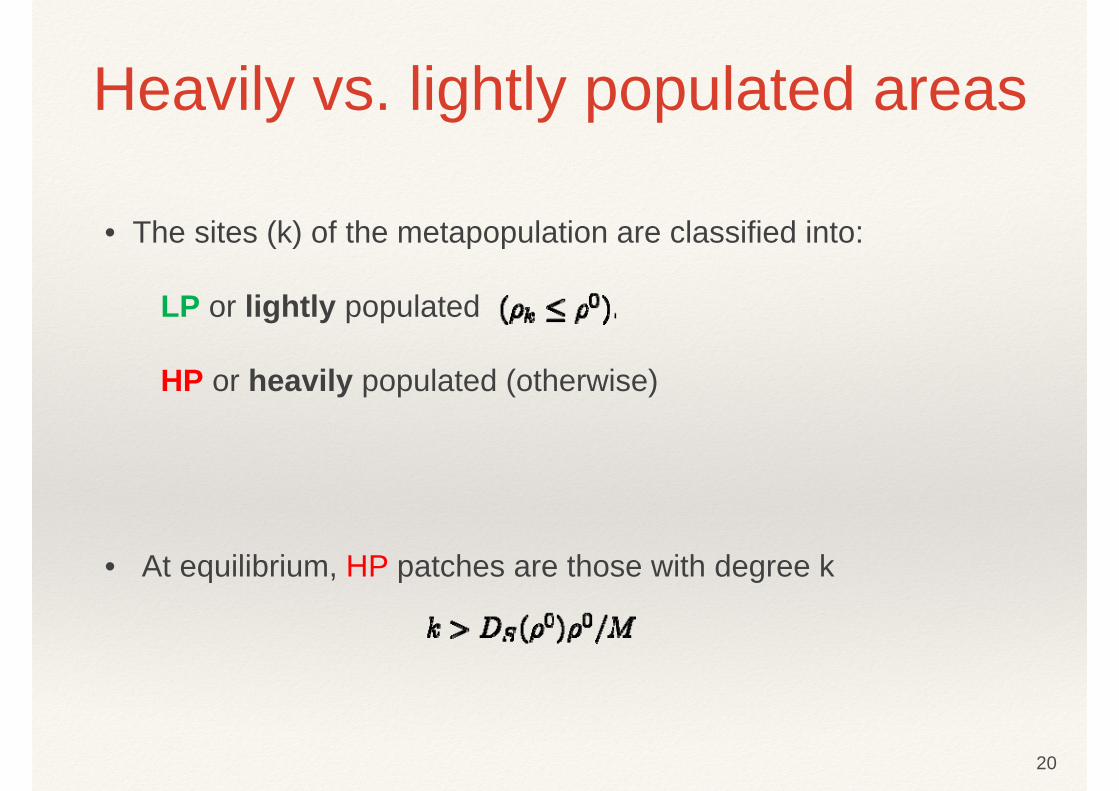
• The sites (k) of the metapopulation are classified into:
LP or lightly populated
HP or heavily populated (otherwise)
• At equilibrium, HP patches are those with degree k
Heavily vs. lightly populated areas
20

HP and LP when DS) ~ and scale-free network ()
21
• % HP =
decreasing in
% HP in [36.79%,100%]
() ()
In particular, higher implies lower HP
Consequences in epidemic spreading.
= 2: 50% (=3, =0)> 2: mostly LP (=3, 0)mostly HP (=3, 0)

22
with =3
% of individuals of the metapopulation living in HP areas.
Exp
onen
t ca
n be
use
d as
a tu
ning
par
amet
er to
sh
ape
the
prof
ile to
a s
peci
fic %
of
HP
popu
latio
n.
Ana
logo
us re
sults
for o
ther
val
ues
of th
e ex
pone
nt.
Dot
s: 3
diff
eren
t dem
ogra
phic
sce
nario
s.
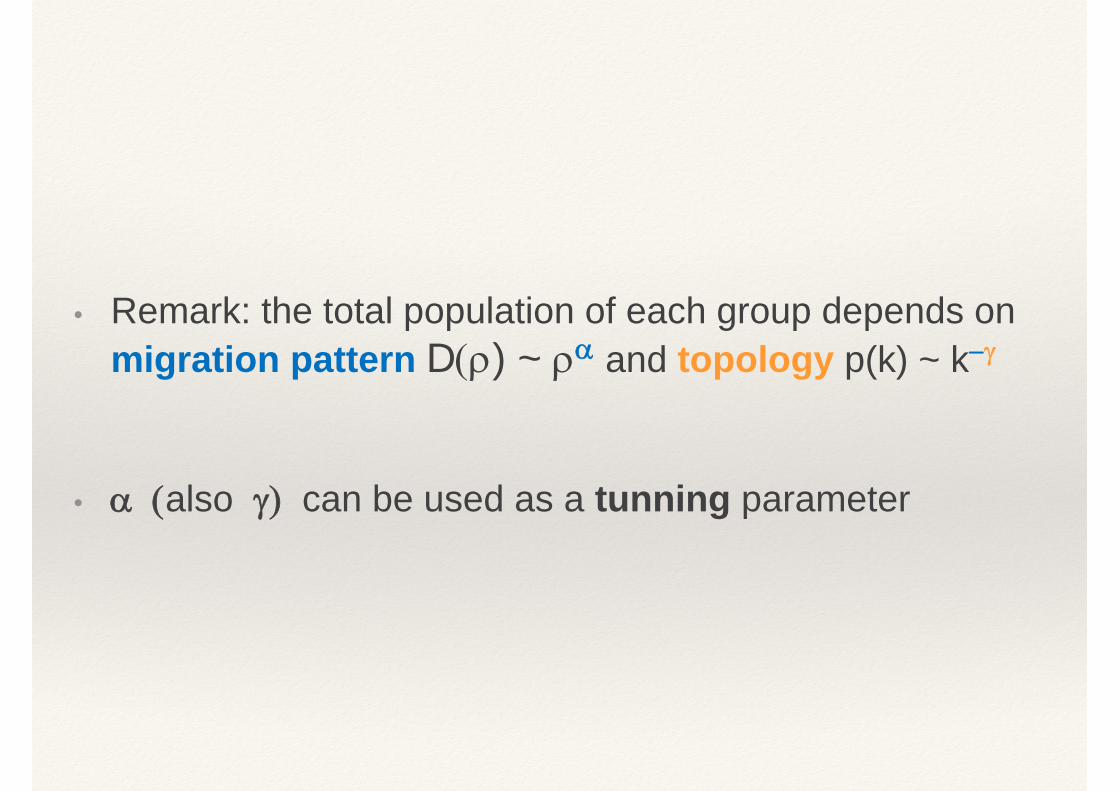
• Remark: the total population of each group depends on migration pattern D) ~ and topology p(k) ~ k
• also can be used as a tunning parameter

Early stage of the epidemic
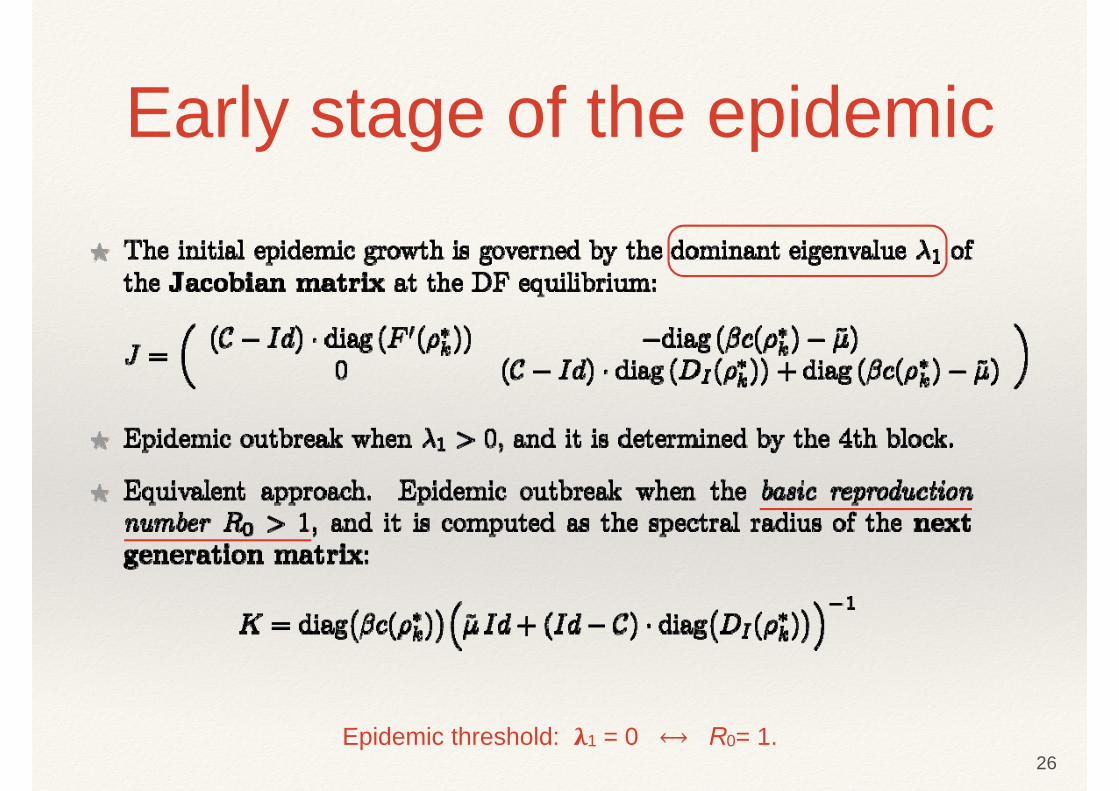
Early stage of the epidemic
26Epidemic threshold: 1 = 0 ⟷ R0= 1.

Meaningful condition
27This formula is general.
( cdensity dependent )

Local epidemic outbreaks
28
3 different migration exponents showing 3 different epidemic scenarios.
uncorrelated scale-free network ( =3)
max in big cities in mid towns in villages
Filled contour plot showing that the maximum in the ratio decreases as the migration exponent increases.
,
= 1 = 1.7 = 3
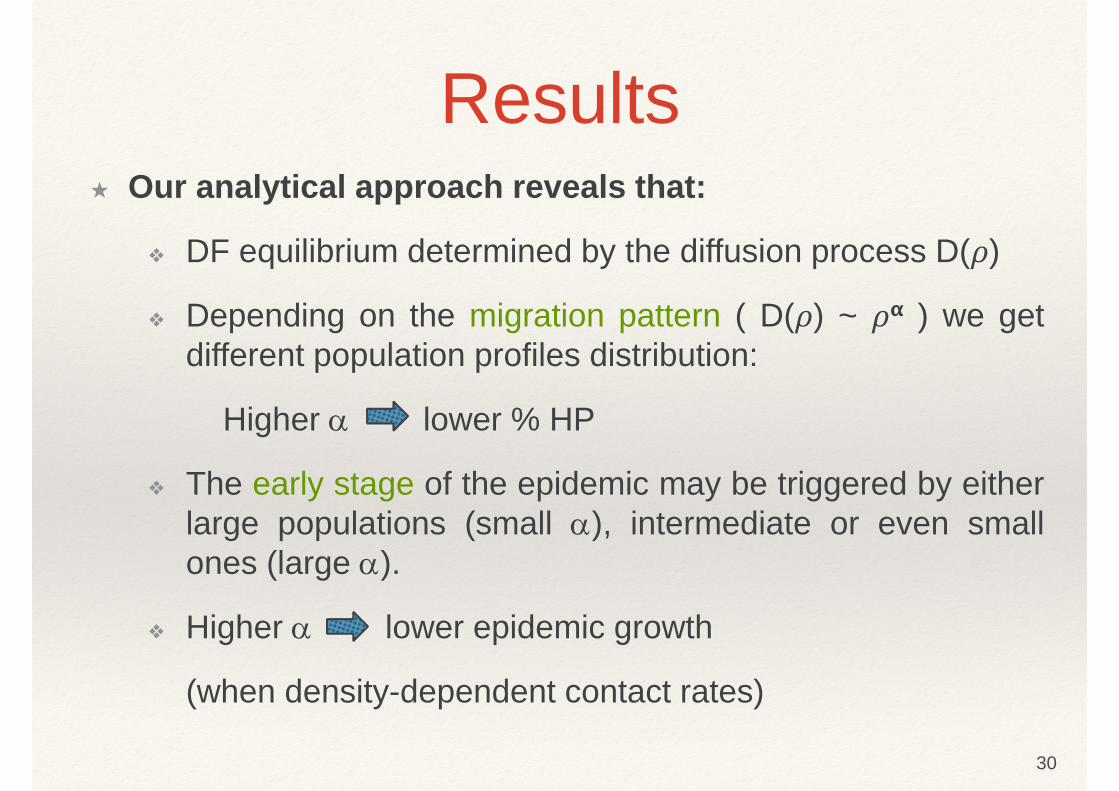
Results★ Our analytical approach reveals that:
❖ DF equilibrium determined by the diffusion process D( )
❖ Depending on the migration pattern ( D( ) ~ ) we getdifferent population profiles distribution:
Higher lower % HP
❖ The early stage of the epidemic may be triggered by eitherlarge populations (small ), intermediate or even smallones (large ).
❖ Higher lower epidemic growth
(when density-dependent contact rates)
30
Conclusions
★ Our results are based on one main assumption: the total flowof individuals leaving a site is increasing in its population size.
★ Migration patterns play a crucial role in the spread of infectiousdiseases:
❖ Migration patterns determine where epidemic outbreakstake place. Outbreaks do not always happen in big cities,as expected, but rather in mid-size towns or small villages.
❖ The strengthening of the emigration from large populationareas to small villages can contain the infection at the earlystage.
31

Erice MathComEpi 2015.Erice (Italy) August 30 2015 – September 5 2015
Density dependent diffusion and spread of epidemics in a metapopulation model
Marta [email protected]
Universitat de Girona Catalunya (Spain).
References
J.Ripoll, A.Avinyó, M.Pellicer, J.Saldaña. Impact of nonlinearmigration flows on epidemic outbreaks in heterogeneousmetapopulations. Phys. Rev. E (2015).
D.Juher, J.Ripoll, J.Saldaña. Analysis and Monte Carlosimulations of a model for the spread of infectious diseases inheterogeneous metapopulations.Phys.Rev.E 80, 2009.
J. Saldaña. Continuous-time formulation of reaction-diffusionprocesses on heterogeneous metapopulations. Phys. Rev. E78, 2008.
33


![A FILM-PORE-SURFACE CONCENTRATION DEPENDENT MODEL …eprints.utm.my/id/eprint/1898/1/JTJUN42F[5].pdfconcentration dependent surface diffusion (FPCDSD) model. The governing partial](https://static.fdocuments.in/doc/165x107/5d6636c888c99363078b88d9/a-film-pore-surface-concentration-dependent-model-5pdfconcentration-dependent.jpg)