Densities of Molten and Solid Alloys of (Fe, Cu, Ni, Co ...
34
Aalto University Publications in Materials Science and Engineering Aalto-yliopiston materiaalitekniikan julkaisuja Espoo 2010 TKK-MT-215 Densities of Molten and Solid Alloys of (Fe, Cu, Ni, Co) - S at Elevated Temperatures - Literature Review and Analysis F. Tesfaye Firdu, P. Taskinen Aalto-yliopisto Teknillinen korkeakoulu Aalto-universitetet Tekniska högskolan Aalto University School of Science and Technology
Transcript of Densities of Molten and Solid Alloys of (Fe, Cu, Ni, Co ...

Aalto University Publications in Materials Science and Engineering Aalto-yliopiston materiaalitekniikan julkaisuja
Espoo 2010 TKK-MT-215
Densities of Molten and Solid Alloys of (Fe, Cu, Ni, Co) - S at
Elevated Temperatures - Literature Review and Analysis
F. Tesfaye Firdu, P. Taskinen
Aalto-yliopisto Teknillinen korkeakoulu
Aalto-universitetet Tekniska högskolan
Aalto University School of Science and Technology

2
Aalto University Publications in Materials Science and Engineering Aalto-yliopiston materiaalitekniikan julkaisuja
Espoo 2010 TKK-MT-215
Densities of Molten and Solid Alloys of (Fe, Cu, Ni, Co) - S at Elevated
Temperatures - Literature Review and Analysis
F. Tesfaye Firdu, P. Taskinen
Aalto University School of Science and Technology
Department of Materials Science and Engineering
Thermodynamics and Modeling of Metallurgical Processes (TDM)
Aalto-Yliopiston Teknillinen korkeakoulu
Materiaalitekniikan Laitos
Metallurgisten Prosessien Termodynamiikka ja Mallinnus (TDM)

3
Research program: ELEMET (Energy & Lifecycle Efficient Metal Processes)
Project: ISS (Improved Sulfide Smelting)
Financers: Boliden Harjavalta Oy, Boliden Kokkola Oy, Norilsk Nickel Finland
Oy, Outotec Oyj and the Finnish Funding Agency for Technology and
Innovation (Tekes)
Keywords: Density, thermal expansion coefficient, molar volume, alloy, Fe-S,
Co-S, Ni-S, Cu-S
Distribution:
Aalto University School of Science and Technology
Department of Materials Science and Engineering
P.O. Box 16200
FI-00076 Aalto, Finland
Tel. +358 9 470 22796
Fax. +358 9 470 22798
E-mail: [email protected]
© TDM
ISBN 978-952-60-3272-6
ISSN 1455-2329
Multiprint Oy
Espoo 2010

4
Abstract
Densities of solid and liquid Fe, Cu, Ni and Co, and their alloys both at the presence and
absence of sulfur are reviewed. Volumetric thermal expansions were used to estimate the
densities at different temperatures. Densities of the alloys generally decrease with
increasing temperature. For the pure metals the reduction in density as temperature rises
from 25oC to their respective melting point may be generalized to be about 7.05 ± 0.4%
just before melting and about 11.63 ± 0.92 on complete melting.
According to the literature data and analytic results, at ambient pressure, density of the
stoichiometric FeS changes from 4.615 g/cm3 at 25oC to 3.8 g/cm3 at 1200oC (~17.7%),
density of the stoichiometric Cu2S changes from 5.65 g/cm3 at 25oC to ~5.18 g/cm3 at
1200oC ( ~8.3%), density of the stoichiometric NiS changes from 5.5 g/cm3 at 25oC to 5.025
g/cm3 at 1027oC (~8.5 ± 1.8 %) and density of the stoichiometric CoS changes from 5.45
g/cm3 at 25oC to 4.88 g/cm3 at 1100oC (~10.45%).
A study on the Fe-S melts at 4GPa suggests that in S-poor compositions, where solubility of sulfur is less likely to be affected by pressure, the density of the sulfides at isothermal conditions decreases in a similar fashion as under 1 bar, i.e., density decreases non-linearly with increasing sulfur.
Table of Contents
Abstract .......................................................................................................................... 4
Table of Contents ........................................................................................................... 4
Symbols, Abbreviations, Units ..................................................................................... 6
1 Introduction ........................................................................................................... 8
1.1 Estimation of Densities of Mixtures at Elevated Temperatures ........................ 8
1.2 High Temperature Densities of Fe, Co, Ni and Cu and Their Alloys ................. 10
2 Densities of Solid Fe-, Co-, Ni- and Cu-Sulfides .................................................... 15
3 Densities of Liquid Fe-, Co-, Ni- and Cu-Sulfides .................................................. 19
3.1 Densities of Fe-S Melts ..................................................................................... 20
3.2 Densities of Ni-S Melts ..................................................................................... 23
3.3 Densities of Co-S Melts .................................................................................... 24
3.4 Densities of Cu-S Melts .................................................................................... 25
3.5 Densities of Melts in the Fe-Ni-Cu-S-(O) System ............................................. 25
4 Effect of Pressure on Densities of the Sulfide Melts ............................................ 28
5 Summary and Conclusions ................................................................................... 29
Acknowledgements ...................................................................................................... 29
5
References ................................................................................................................... 30
Appendix A ................................................................................................................... 32
Appendix B ................................................................................................................... 33
6
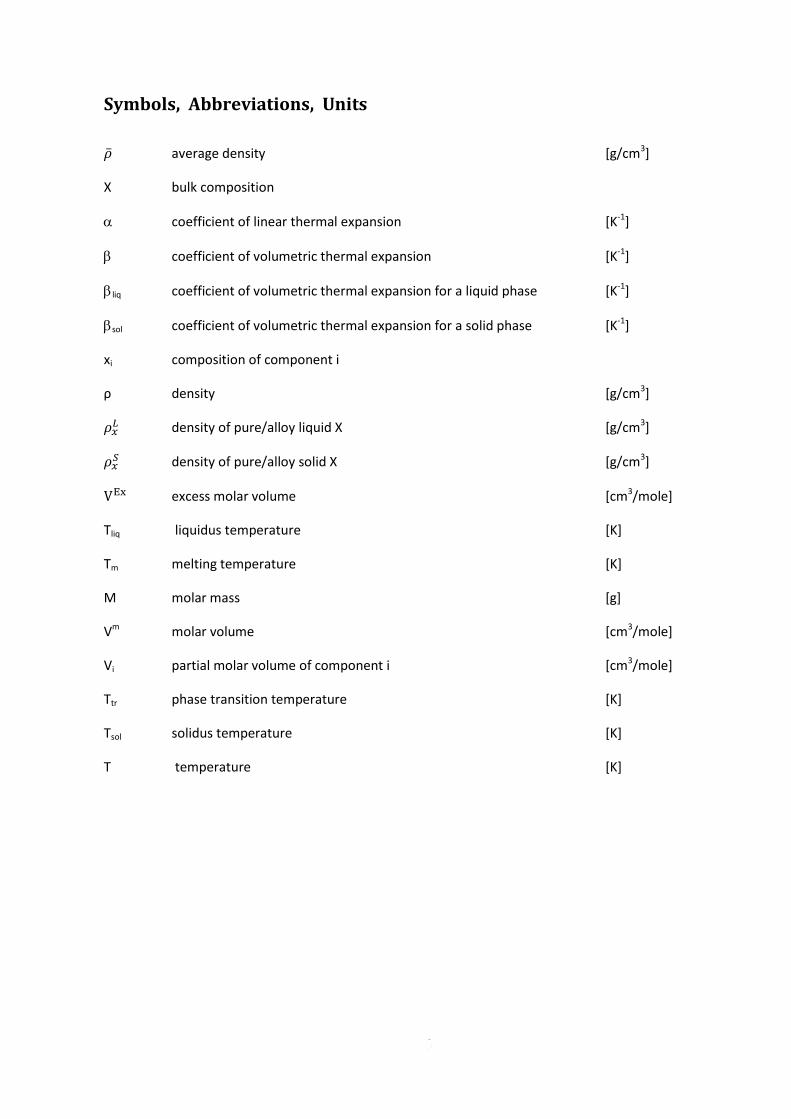
Symbols, Abbreviations, Units
average density [g/cm3]
X bulk composition
coefficient of linear thermal expansion [K-1]
coefficient of volumetric thermal expansion [K-1]
liq coefficient of volumetric thermal expansion for a liquid phase [K-1]
sol coefficient of volumetric thermal expansion for a solid phase [K-1]
xi composition of component i
ρ density [g/cm3]
density of pure/alloy liquid X [g/cm3]
density of pure/alloy solid X [g/cm3]
excess molar volume [cm3/mole]
Tliq liquidus temperature [K]
Tm melting temperature [K]
M molar mass [g]
Vm molar volume [cm3/mole]
Vi partial molar volume of component i [cm3/mole]
Ttr phase transition temperature [K]
Tsol solidus temperature [K]
T temperature [K]

7
8
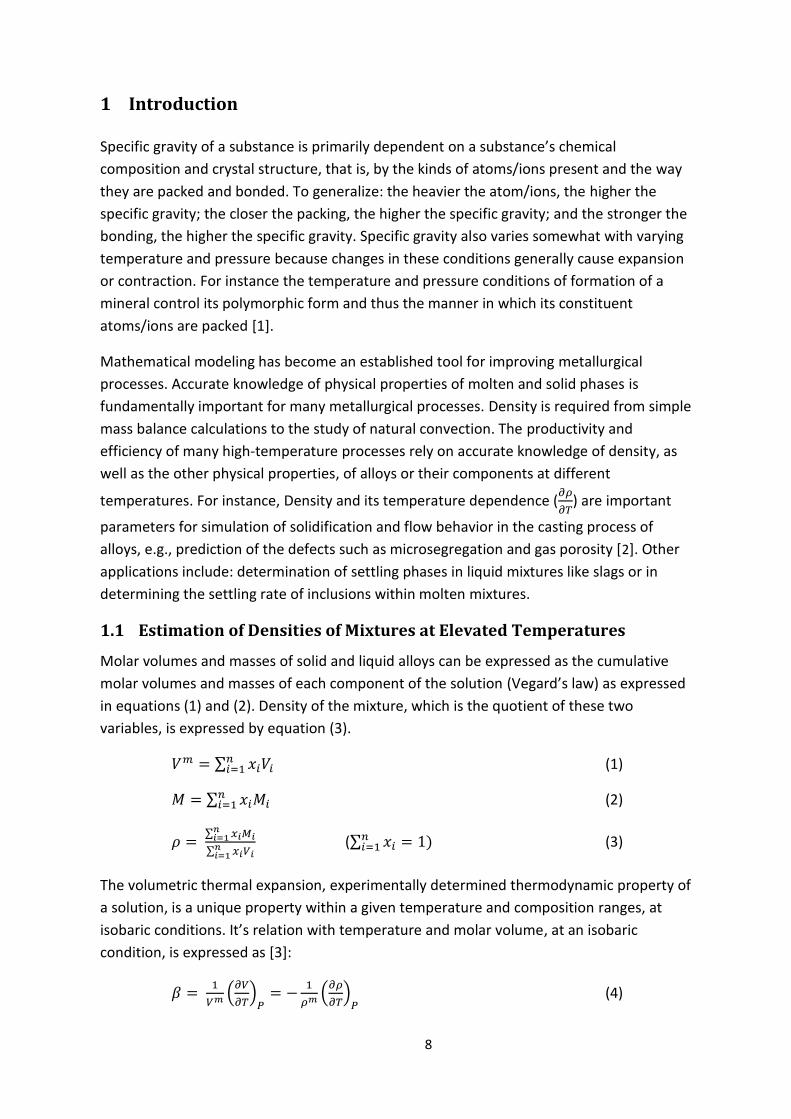
1 Introduction
Specific gravity of a substance is primarily dependent on a substance’s chemical
composition and crystal structure, that is, by the kinds of atoms/ions present and the way
they are packed and bonded. To generalize: the heavier the atom/ions, the higher the
specific gravity; the closer the packing, the higher the specific gravity; and the stronger the
bonding, the higher the specific gravity. Specific gravity also varies somewhat with varying
temperature and pressure because changes in these conditions generally cause expansion
or contraction. For instance the temperature and pressure conditions of formation of a
mineral control its polymorphic form and thus the manner in which its constituent
atoms/ions are packed [1].
Mathematical modeling has become an established tool for improving metallurgical
processes. Accurate knowledge of physical properties of molten and solid phases is
fundamentally important for many metallurgical processes. Density is required from simple
mass balance calculations to the study of natural convection. The productivity and
efficiency of many high-temperature processes rely on accurate knowledge of density, as
well as the other physical properties, of alloys or their components at different
temperatures. For instance, Density and its temperature dependence (
) are important
parameters for simulation of solidification and flow behavior in the casting process of
alloys, e.g., prediction of the defects such as microsegregation and gas porosity [2]. Other
applications include: determination of settling phases in liquid mixtures like slags or in
determining the settling rate of inclusions within molten mixtures.
1.1 Estimation of Densities of Mixtures at Elevated Temperatures
Molar volumes and masses of solid and liquid alloys can be expressed as the cumulative
molar volumes and masses of each component of the solution (Vegard’s law) as expressed
in equations (1) and (2). Density of the mixture, which is the quotient of these two
variables, is expressed by equation (3).
(1)
(2)
( (3)
The volumetric thermal expansion, experimentally determined thermodynamic property of
a solution, is a unique property within a given temperature and composition ranges, at
isobaric conditions. It’s relation with temperature and molar volume, at an isobaric
condition, is expressed as [3]:
(4)

9
For exactly isotropic solid materials, the volumetric thermal expansion coefficient can be
calculated from the linear thermal expansion coefficient () according to the relation in
equation (5) [3].
≈ 3· (5)
Knowledge of the value of β would lead the determination of a new volume according to
equations (6) and (7) [3].
(for solids) (6)
(for liquids) (7)
Using relations through (1) - (7) density of a material at a given temperature can be
expressed as equations (8) and (9).
(for solids) (8)
(For liquids) (9)
where Vsolid, Vliquid, ρsolid, ρliquid are volume and density of solids and liquids, respectively, sol
and liq are coefficients of volumetric thermal expansion of solid and liquid phases,
respectively. The density of materials as a function of temperature can also be estimated
from experimentally determined coefficients A and B, as expressed in equation (10) [3].
(10)
Gibbs free energy change of a system generally expressed as [4]:
(11)
For a closed system at an isothermal condition equation (11) can be written as:
(12)
which implies that,
Based on the nature of their compressibility, solids experience only a small change in their
bulk volume for a pressure change ranging up to thousands of bars. For instance, most
minerals’ molar volume changes 3 – 4 % for pressure changes up to 40Kbar. That’s why
molar volume changes in industrial processes for certain pressure ranges are usually
assumed to be zero. Increase in volume of the same amount can be expected for a change
in temperature from 25 to 1000oC [4].
10
molar volume of condensed phases’, Vm(T,P), can be generally expressed by the
Murnaghan-equation [4]:
(13)
where Vm(T, 0) is molar volume at P = 0 (i.e., in a vacuum), K(T, 0) is isothermal
compressibility at P = 0 and n is a constant which is obtained from isothermal bulk module
as a function of pressure, according to equation (14) below [4].
B(T, P) = B(T, 0) + n∙P (14)
where B(T, 0) is isothermal bulk module at P = 0 and P is the pressure condition under
consideration.
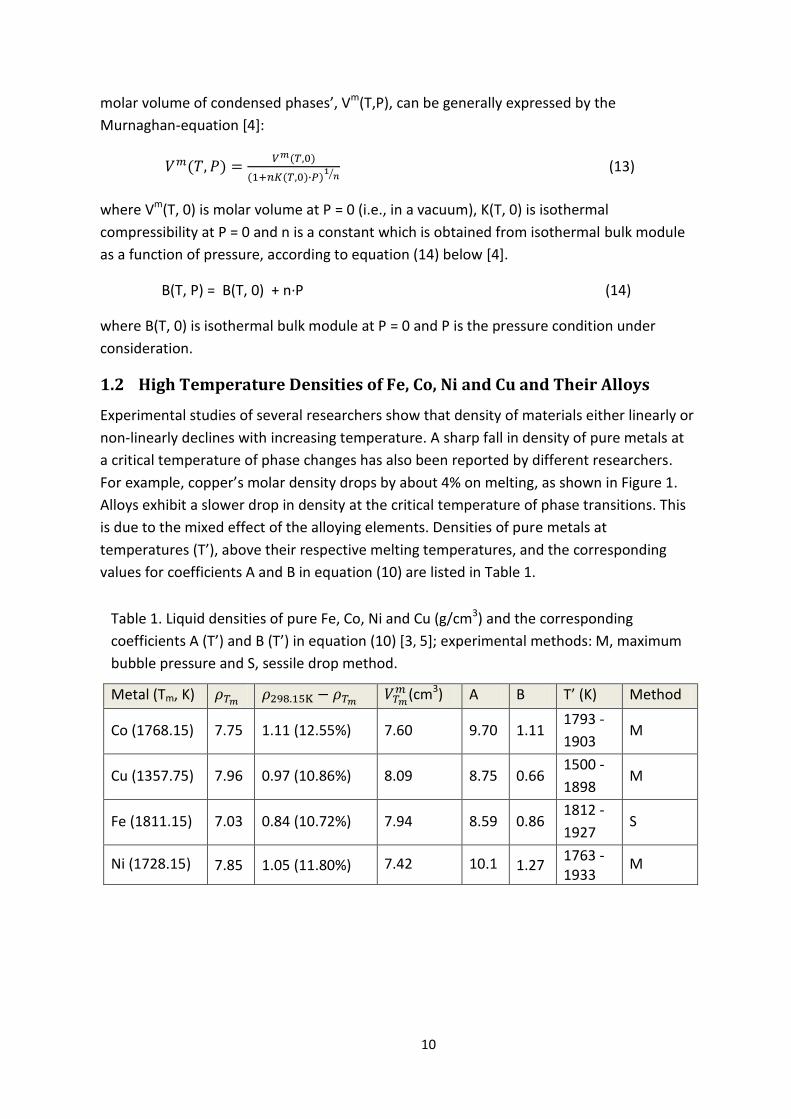
1.2 High Temperature Densities of Fe, Co, Ni and Cu and Their Alloys
Experimental studies of several researchers show that density of materials either linearly or
non-linearly declines with increasing temperature. A sharp fall in density of pure metals at
a critical temperature of phase changes has also been reported by different researchers.
For example, copper’s molar density drops by about 4% on melting, as shown in Figure 1.
Alloys exhibit a slower drop in density at the critical temperature of phase transitions. This
is due to the mixed effect of the alloying elements. Densities of pure metals at
temperatures (T’), above their respective melting temperatures, and the corresponding
values for coefficients A and B in equation (10) are listed in Table 1.
Table 1. Liquid densities of pure Fe, Co, Ni and Cu (g/cm3) and the corresponding
coefficients A (T’) and B (T’) in equation (10) [3, 5]; experimental methods: M, maximum
bubble pressure and S, sessile drop method.
Metal (Tm, K) (cm3) A B T’ (K) Method
Co (1768.15) 7.75 1.11 (12.55%) 7.60 9.70 1.11 1793 -
1903 M
Cu (1357.75) 7.96 0.97 (10.86%) 8.09 8.75 0.66 1500 -
1898 M
Fe (1811.15) 7.03 0.84 (10.72%) 7.94 8.59 0.86 1812 -
1927 S
Ni (1728.15) 7.85 1.05 (11.80%) 7.42 10.1 1.27 1763 - 1933
M

11
Figure 1. Densities of Fe, Co, Ni and Cu and their alloys as a function of temperature. Data
adapted from [3].
T
t
r
T
m T
m
T
m
T
m
Ttr
Ttr
Ttr
Ttr
Ttr
Ttr Ttr
Ttr

12
Figure 2. Density versus temperature diagram of liquid binary alloys of Fe, Co, Ni and Cu.
Data (Appendix A) adapted from [5].
(
a
)
(
b
)
(
c
)
(
d
)
(
e
)
(
f
)

13
As shown in Figure 2 (a) - (f) density of the Cu-Fe-Co-Ni alloys increases with increasing
amount of the heavier metal. For example, the density of the Cu-Fe alloys decreases
with increasing fraction of Fe in the alloy.
Chemical elements in the Co-Ni-Cu system interacts in such a way that their alloys’
density do not submit to the ideal condition in equation (3), as shown in Figure 2.
Interaction of Fe with Co and Ni seems to have less effect on the density of the binary
alloys. A similar effect has been reported by Birllo et al. [6], as illustrated in Figure 3 (a)
and (b).
For a regular ternary solution with components i, each having the bulk concentration Ci,
V is usually written as a function of temperature and concentrations [6]:
(15)
For an ideal mixing the second term in equation (15) vanishes and, thus, similar to the
Vegard’s law in equation (1). In the real case the excess term as a function of
concentration and temperature is expressed as [6]:
(16)
The binary interaction parameter ( ) for Fe-Ni, Cu-Ni and Fe-Cu, at 1772K are 0, -0.85
and 0.6, respectively [6].
Table 2. Fitted parameters for density (g/cm3), excess molar volumes (cm3) and volumetric thermal expansion coefficients of Fe-Ni–Cu samples [7].
Composition T (K) *10-5 (oC-1) ρL(T) ρ(1773K) VEx
Ni40Fe60 1725 1.6 7.43 7.39 ~0
Ni33Cu13Fe54 1692 0.4 7.11 7.09 0.34
Ni25Cu40Fe35 1610 1.1 7.14 7.01 0.53
Ni20Cu50Fe30 1591 0.5 7.20 7.14 0.39
Ni16Cu60Fe24 1580 2.6 7.53 7.16 0.4
Ni17Cu70Fe13 1546 1.5 7.76 7.51 0.06
Cu 1358 1 7.89 7.58 -
Ni15Cu20Fe65 1701 2 7.16 7.05 0.28
Ni32Cu20Fe48 1669 2.3 7.40 7.23 0.22
Ni45Cu20Fe35 1663 1.4 7.42 7.3 0.25
Ni60Cu20Fe20 1668 1.1 7.56 7.47 0.19
Ni70Cu20Fe10 1673 1.1 7.79 7.71 0.02
14
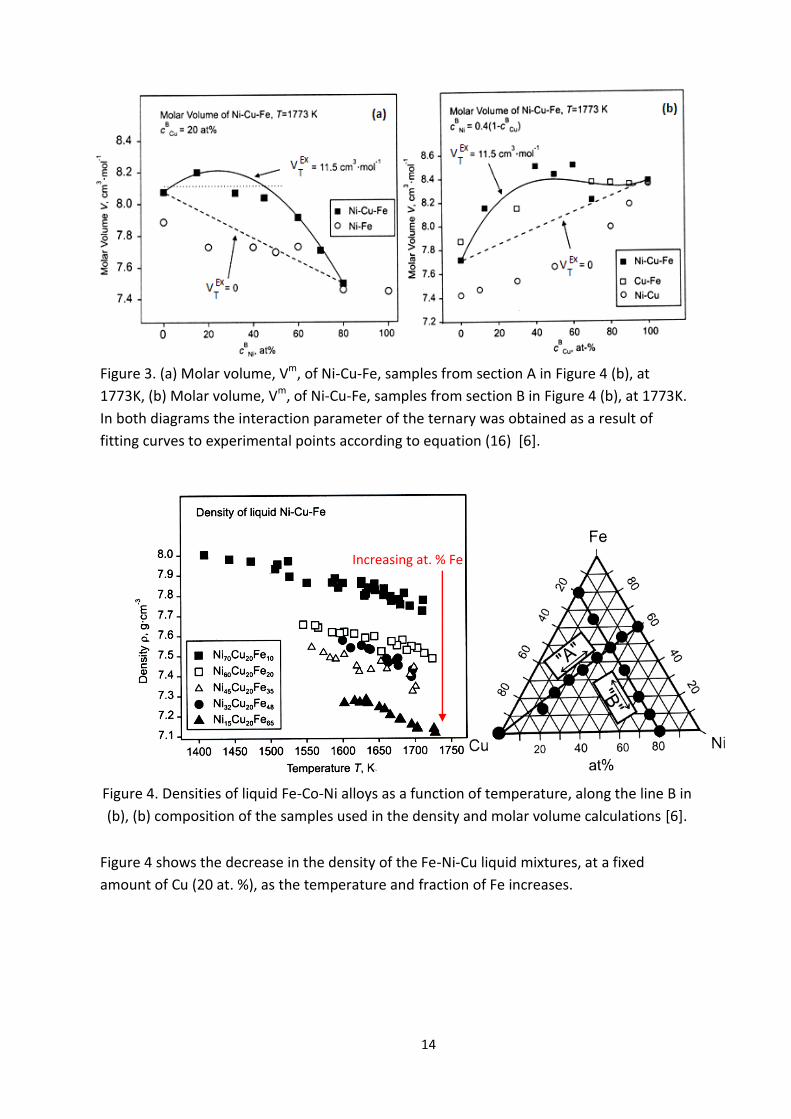
Figure 3. (a) Molar volume, Vm, of Ni-Cu-Fe, samples from section A in Figure 4 (b), at
1773K, (b) Molar volume, Vm, of Ni-Cu-Fe, samples from section B in Figure 4 (b), at 1773K.
In both diagrams the interaction parameter of the ternary was obtained as a result of
fitting curves to experimental points according to equation (16) [6].
Figure 4. Densities of liquid Fe-Co-Ni alloys as a function of temperature, along the line B in
(b), (b) composition of the samples used in the density and molar volume calculations [6].
Figure 4 shows the decrease in the density of the Fe-Ni-Cu liquid mixtures, at a fixed
amount of Cu (20 at. %), as the temperature and fraction of Fe increases.
Increasing at. % Fe
15
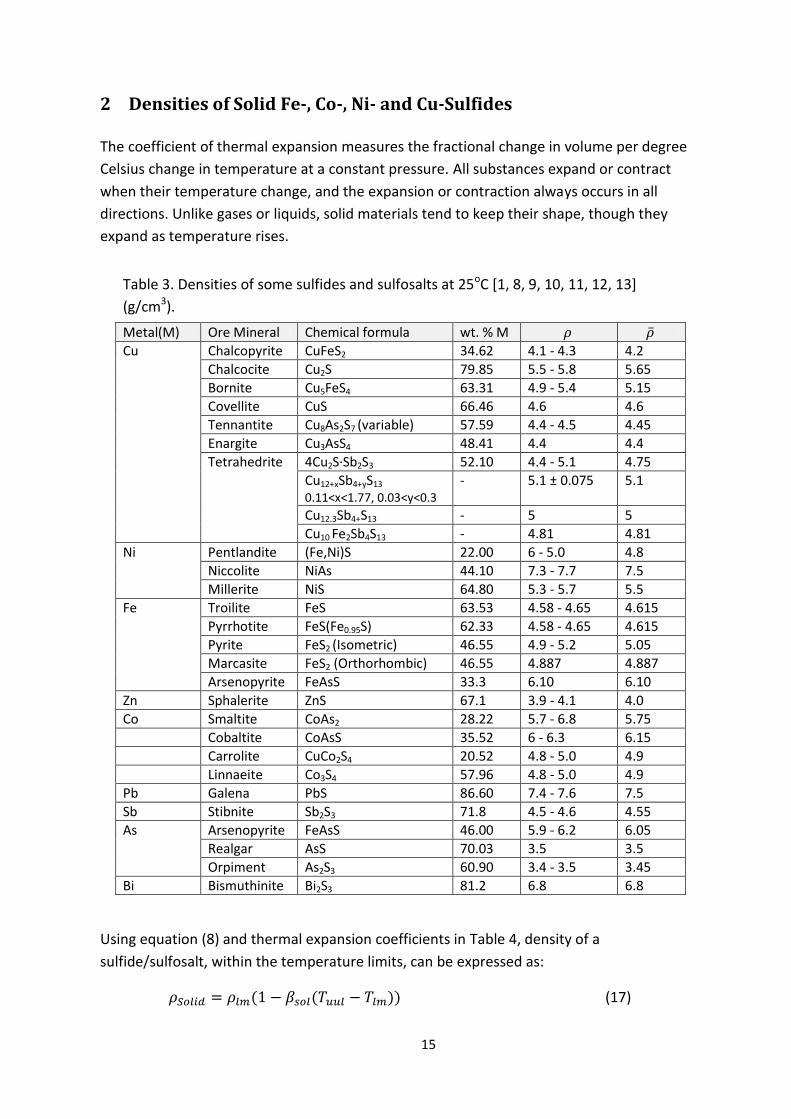
2 Densities of Solid Fe-, Co-, Ni- and Cu-Sulfides
The coefficient of thermal expansion measures the fractional change in volume per degree
Celsius change in temperature at a constant pressure. All substances expand or contract
when their temperature change, and the expansion or contraction always occurs in all
directions. Unlike gases or liquids, solid materials tend to keep their shape, though they
expand as temperature rises.
Using equation (8) and thermal expansion coefficients in Table 4, density of a
sulfide/sulfosalt, within the temperature limits, can be expressed as:
(17)
Table 3. Densities of some sulfides and sulfosalts at 25oC [1, 8, 9, 10, 11, 12, 13]
(g/cm3).
Metal(M) Ore Mineral Chemical formula wt. % M Cu Chalcopyrite CuFeS2 34.62 4.1 - 4.3 4.2
Chalcocite Cu2S 79.85 5.5 - 5.8 5.65
Bornite Cu5FeS4 63.31 4.9 - 5.4 5.15
Covellite CuS 66.46 4.6 4.6
Tennantite Cu8As2S7 (variable) 57.59 4.4 - 4.5 4.45
Enargite Cu3AsS4 48.41 4.4 4.4
Tetrahedrite
4Cu2S·Sb2S3 52.10 4.4 - 5.1 4.75
Cu12+xSb4+yS13
0.11<x<1.77, 0.03<y<0.3
- 5.1 ± 0.075 5.1
Cu12.3Sb4+S13 - 5 5
Cu10 Fe2Sb4S13 - 4.81 4.81
Ni Pentlandite (Fe,Ni)S 22.00 6 - 5.0 4.8
Niccolite NiAs 44.10 7.3 - 7.7 7.5
Millerite NiS 64.80 5.3 - 5.7 5.5
Fe Troilite FeS 63.53 4.58 - 4.65 4.615
Pyrrhotite FeS(Fe0.95S) 62.33 4.58 - 4.65 4.615
Pyrite FeS2 (Isometric) 46.55 4.9 - 5.2 5.05
Marcasite FeS2 (Orthorhombic) 46.55 4.887 4.887
Arsenopyrite FeAsS 33.3 6.10 6.10
Zn Sphalerite ZnS 67.1 3.9 - 4.1 4.0
Co Smaltite CoAs2 28.22 5.7 - 6.8 5.75
Cobaltite CoAsS 35.52 6 - 6.3 6.15
Carrolite CuCo2S4 20.52 4.8 - 5.0 4.9
Linnaeite Co3S4 57.96 4.8 - 5.0 4.9
Pb Galena PbS 86.60 7.4 - 7.6 7.5
Sb Stibnite Sb2S3 71.8 4.5 - 4.6 4.55
As Arsenopyrite FeAsS 46.00 5.9 - 6.2 6.05
Realgar AsS 70.03 3.5 3.5
Orpiment As2S3 60.90 3.4 - 3.5 3.45
Bi Bismuthinite Bi2S3 81.2 6.8 6.8

16
where , , are density at the lower temperature limit, temperatures under the
upper limit and the lower temperature limit, respectively.
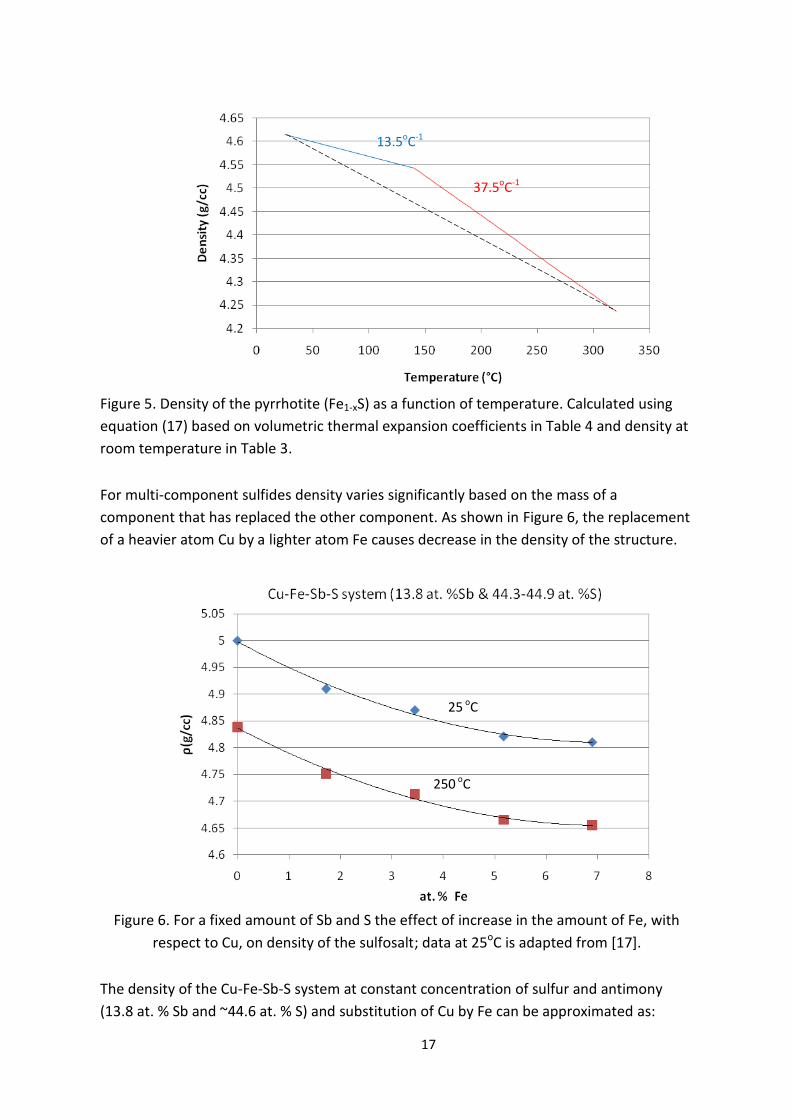
Using the thermal expansion coefficients in Table 4 the density of the pyrrhotite (FeS),
according to equation (17), varies from 4.615 at 25oC to 4.543 at 140 oC and 4.237 at 320oC,
as illustrated in Figure 5.
Table 4. Thermal expansion coefficients of some sulfides (oC-1), ( = 3∙).
Mineral Composition T (oC) *10-5(oC-1) *10-5 Ref.
Troilite FeS 300 – 600 7.4 22.2 [14]
100 – 300 14.1 42.3 [14]
Pyrite FeS2 20 – 100 2.1 6.3 [15]
20 – 200 2.9 8.7 [15]
20 – 300 1.1 3.3 [15]
Pyrrhotite FeS 25 – 140 4.5 13.5 [15]
FeS 140 – 320 12.5 37.5 [15]
Fe0.923S 75 – 320 12.6 37.8 [15]
Fe0.875S 25 – 292 9.0 27 [15]
Ni-rich pyrrhotite Fe0.84Ni0.11S 300 – 600 8.0 24 [14]
100 – 300 9.3 27.9 [14]
Ni-poor pyrrhotite Fe0.87Ni0.02S 300 – 600 8.5 25.5 [14]
100 – 300 8.4 25.2 [14]
Pentlandite (Outokumpu) - 24 – 235 3.9 11.7 [15]
- 24 – 350 5.8 17.4 [15]
Pentlandite (Frood) - 24 – 200 20.6 61.8 [15]
- 24 – 200 11.1 33.3 [15]
Pentlandite (Synthetic) - 25 – 220 15.1 45.3 [15]
Digenite Cu1.8 + X:(0 – 0.2)S 409.85 – 654.85 - 3.2-5.49 [16]
Covellite CuS 119.85 - 339.85 - 2.42 [16]
Tetrahedrite (synthetic) Cu12(..13.9)Sb4S13 100-250 ~14.3 42.9 [11]
17
Figure 5. Density of the pyrrhotite (Fe1-xS) as a function of temperature. Calculated using
equation (17) based on volumetric thermal expansion coefficients in Table 4 and density at
room temperature in Table 3.
For multi-component sulfides density varies significantly based on the mass of a
component that has replaced the other component. As shown in Figure 6, the replacement
of a heavier atom Cu by a lighter atom Fe causes decrease in the density of the structure.
Figure 6. For a fixed amount of Sb and S the effect of increase in the amount of Fe, with
respect to Cu, on density of the sulfosalt; data at 25oC is adapted from [17].
The density of the Cu-Fe-Sb-S system at constant concentration of sulfur and antimony
(13.8 at. % Sb and ~44.6 at. % S) and substitution of Cu by Fe can be approximated as:
37.5oC-1
1
3
.
5o
C-
1
250 oC
13.5oC-1
25 oC
18
(18)
Using the volumetric thermal expansion of tetrahedrite (Cu12(..13.9)Sb4S13) in Table 4 and
extending the lower temperature limit to the room temperature (since nearly the same α
was reported by Karen et al. [18] for Cu11.4Fe0.6Sb4S13 in the temperature rage 25-250oC),
density of the sulfosalt at 250oC can be expressed by equation (19).
(19)
19
3 Densities of Liquid Fe-, Co-, Ni- and Cu-Sulfides
By measuring the densities of metallic alloys, Zushu et al. [19] reported that they observed
about 6 % difference from calculated values, which assumed ideal mixing. Highly negative
departure from the ideality (Raonalt’s law) would mean tighter bond among the alloying
elements and a denser structure for the bulk. Thus, molar volume of the alloys should be
expressed as equation (20) [19].
Vm = xiVi + VEx (20)
where VEx is the excess molar volume that results in deviation from the ideal one. Density
can also be re-expressed as:
m = xii + Ex (21)
Density measurements of metallic sulfides, at the presence of oxygen, indicate both
positive and negative deviations from linear mixing of partial molar volumes [20]. Thus, the
excess term can be a positive or negative based on the interactions among the solution
making components.
The partial molar volume of components depends on the condition of the solution. As a
result of least square fitting, Nagamori [21] obtained parameters in Table 6 and 7 and
equations (22) and (23) to estimate partial molar volumes and molar volumes of the Cu-S,
Fe-S and Ni-S melts, respectively.
(22)
(23)
Table 5. Partial molar volumes in the Fe-S, Ni-S and Cu-S melts at infinite dilution [21].
System T(K) VS(cm3/mol) VM(cm3/mol)
Fe-S 1473.15 12.1 7.7
Ni-S 1373.15 10.6 7.1
Cu-S 1473.15 14.8 8.0
Table 6. Values of parameters a, b and c in equation (23) for molar volume calculation of the Fe-S, Ni-S and Cu-S melts [21].
System T(K) Composition a b c Accuracy
Fe-S 1473.15 0.40 < XS < 0.51 13.69 -28.99 49.38 ± 0.6
Ni-S 1373.15 0.28 < XS < 0.44 9.96 -16.09 34.05 ± 0.5
Cu-S 1473.15 0.326 < XS < 0.343 8.01 6.67 - ± 0.5
20
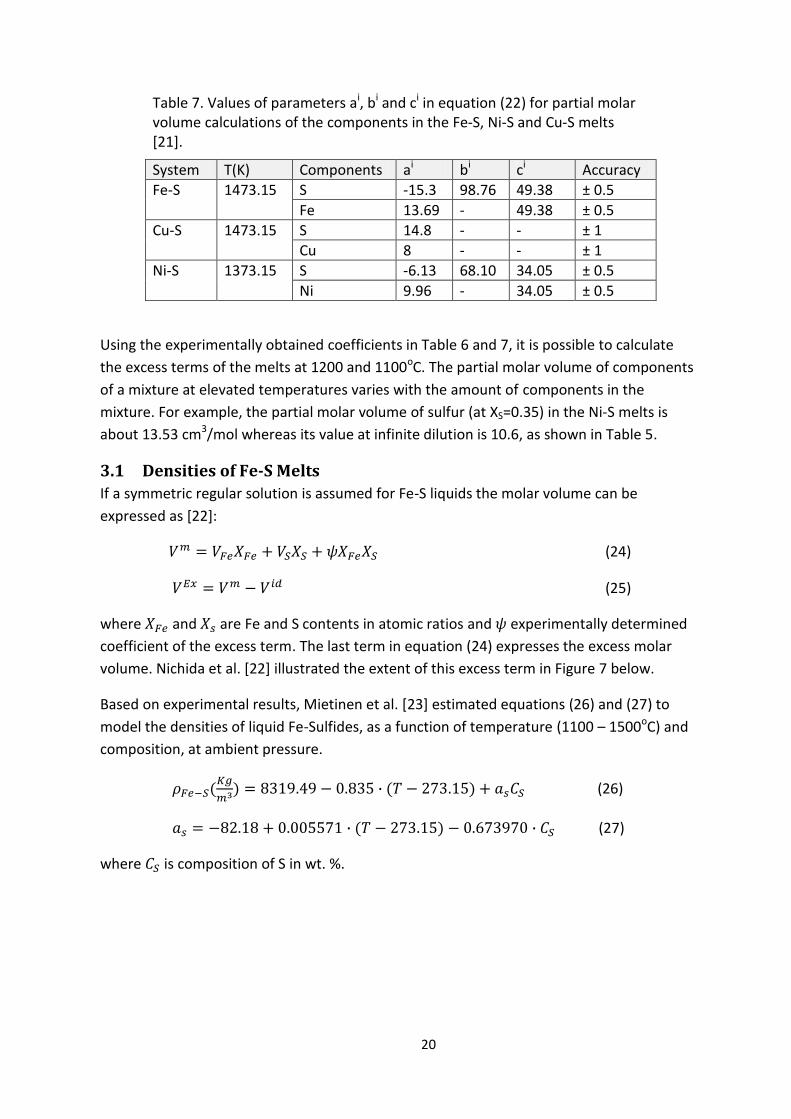
Table 7. Values of parameters ai, bi and ci in equation (22) for partial molar volume calculations of the components in the Fe-S, Ni-S and Cu-S melts [21].
System T(K) Components ai bi ci Accuracy
Fe-S 1473.15 S -15.3 98.76 49.38 ± 0.5
Fe 13.69 - 49.38 ± 0.5
Cu-S 1473.15 S 14.8 - - ± 1
Cu 8 - - ± 1
Ni-S 1373.15 S -6.13 68.10 34.05 ± 0.5
Ni 9.96 - 34.05 ± 0.5
Using the experimentally obtained coefficients in Table 6 and 7, it is possible to calculate
the excess terms of the melts at 1200 and 1100oC. The partial molar volume of components
of a mixture at elevated temperatures varies with the amount of components in the
mixture. For example, the partial molar volume of sulfur (at XS=0.35) in the Ni-S melts is
about 13.53 cm3/mol whereas its value at infinite dilution is 10.6, as shown in Table 5.
3.1 Densities of Fe-S Melts
If a symmetric regular solution is assumed for Fe-S liquids the molar volume can be
expressed as [22]:
(24)
(25)
where and are Fe and S contents in atomic ratios and experimentally determined
coefficient of the excess term. The last term in equation (24) expresses the excess molar
volume. Nichida et al. [22] illustrated the extent of this excess term in Figure 7 below.
Based on experimental results, Mietinen et al. [23] estimated equations (26) and (27) to
model the densities of liquid Fe-Sulfides, as a function of temperature (1100 – 1500oC) and
composition, at ambient pressure.
(26)
(27)
where is composition of S in wt. %.

21
Figure 7. Variation of Vm with sulfur content at 1925K and 4Gpa; the open circles represent
molar volumes at 1923K (at ambient pressure) [22].
Figure 8. Excess molar volume of Fe and S at 4 Gpa; each crossed point represents the
excess molar volume calculated using equation (24), the solid curve shows VEx at ψ = -15.24
[22].
Extrapolated
1923K
Nishida et al. [22]
22
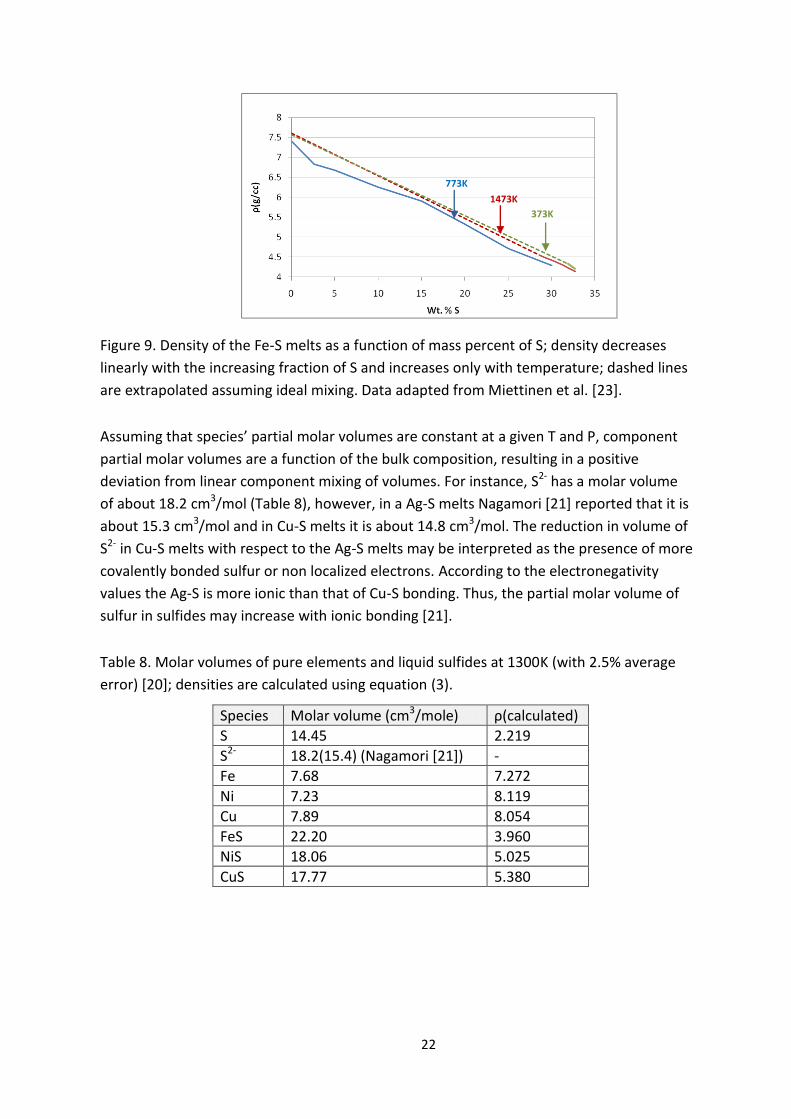
Figure 9. Density of the Fe-S melts as a function of mass percent of S; density decreases
linearly with the increasing fraction of S and increases only with temperature; dashed lines
are extrapolated assuming ideal mixing. Data adapted from Miettinen et al. [23].
Assuming that species’ partial molar volumes are constant at a given T and P, component
partial molar volumes are a function of the bulk composition, resulting in a positive
deviation from linear component mixing of volumes. For instance, S2- has a molar volume
of about 18.2 cm3/mol (Table 8), however, in a Ag-S melts Nagamori [21] reported that it is
about 15.3 cm3/mol and in Cu-S melts it is about 14.8 cm3/mol. The reduction in volume of
S2- in Cu-S melts with respect to the Ag-S melts may be interpreted as the presence of more
covalently bonded sulfur or non localized electrons. According to the electronegativity
values the Ag-S is more ionic than that of Cu-S bonding. Thus, the partial molar volume of
sulfur in sulfides may increase with ionic bonding [21].
Table 8. Molar volumes of pure elements and liquid sulfides at 1300K (with 2.5% average
error) [20]; densities are calculated using equation (3).
Species Molar volume (cm3/mole) ρ(calculated)
S 14.45 2.219
S2- 18.2(15.4) (Nagamori [21]) -
Fe 7.68 7.272
Ni 7.23 8.119
Cu 7.89 8.054
FeS 22.20 3.960
NiS 18.06 5.025
CuS 17.77 5.380
773K
1473K
373K
23
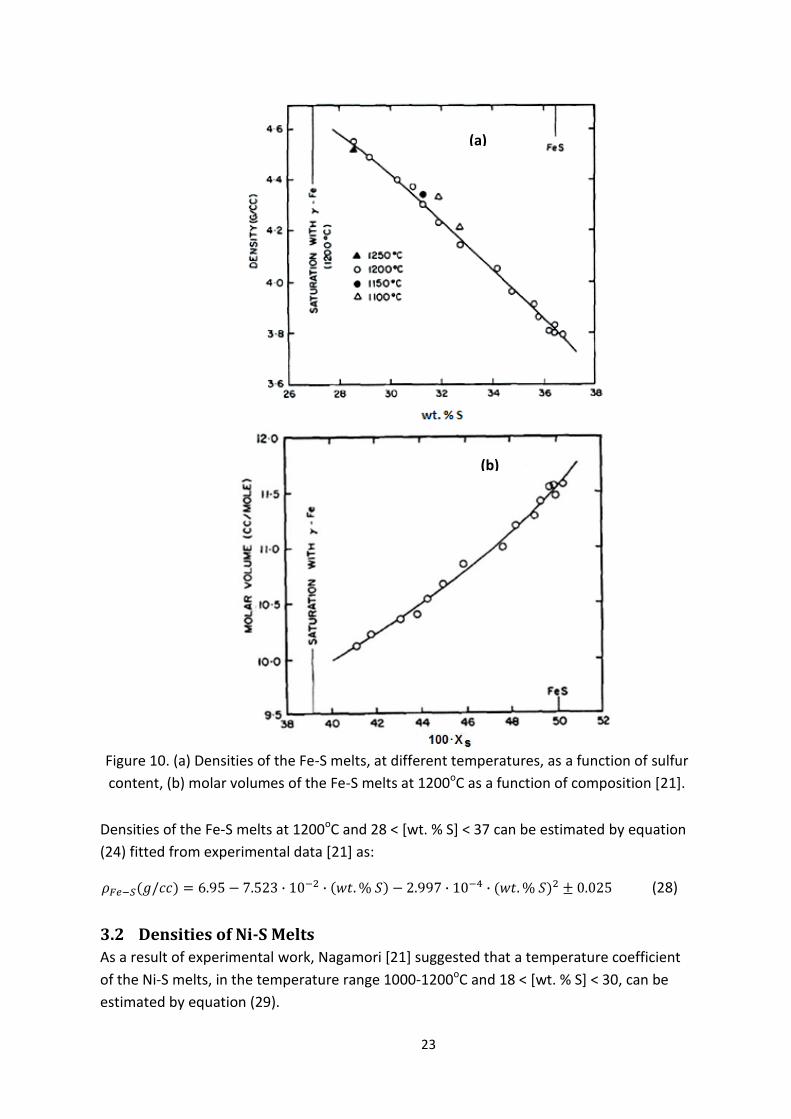
Figure 10. (a) Densities of the Fe-S melts, at different temperatures, as a function of sulfur
content, (b) molar volumes of the Fe-S melts at 1200oC as a function of composition [21].
Densities of the Fe-S melts at 1200oC and 28 < [wt. % S] < 37 can be estimated by equation
(24) fitted from experimental data [21] as:
(28)
3.2 Densities of Ni-S Melts
As a result of experimental work, Nagamori [21] suggested that a temperature coefficient
of the Ni-S melts, in the temperature range 1000-1200oC and 18 < [wt. % S] < 30, can be
estimated by equation (29).
(a)
(b)
24
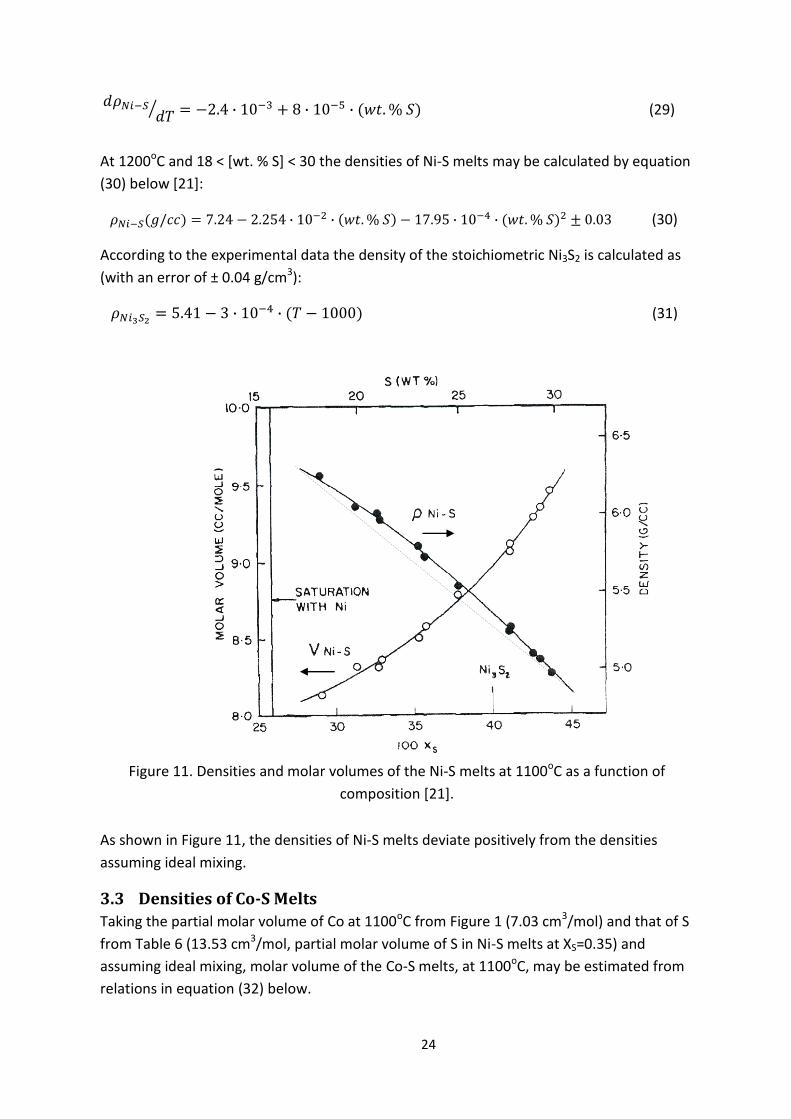
(29)
At 1200oC and 18 < [wt. % S] < 30 the densities of Ni-S melts may be calculated by equation
(30) below [21]:
(30)
According to the experimental data the density of the stoichiometric Ni3S2 is calculated as
(with an error of ± 0.04 g/cm3):
(31)
Figure 11. Densities and molar volumes of the Ni-S melts at 1100oC as a function of
composition [21].
As shown in Figure 11, the densities of Ni-S melts deviate positively from the densities
assuming ideal mixing.
3.3 Densities of Co-S Melts
Taking the partial molar volume of Co at 1100oC from Figure 1 (7.03 cm3/mol) and that of S
from Table 6 (13.53 cm3/mol, partial molar volume of S in Ni-S melts at XS=0.35) and
assuming ideal mixing, molar volume of the Co-S melts, at 1100oC, may be estimated from
relations in equation (32) below.

25
(32)
Using equation (32), the density of the CoS melt, at 1100oC, is about 5.31 g/cm3 (5.45 at
25oC [10]). Considering the excess term to be equal to that of the Ni-S melts (at 1100oC and
XS=0.35) density of CoS is about 4.88 g/cm3.
3.4 Densities of Cu-S Melts
The experimental work of Nagamori [21] shows that the density and molar volume of
molten Cu-S melts, at 1200oC, can be expressed as:
(For 19.6 < [wt. % S] < 20.6) (33)
(34)
According to equation (34), the density of Cu2S at 1200oC is 5.184 ± 0.15, which is in
agreement with the value listed in Table 9.
3.5 Densities of Melts in the Fe-Ni-Cu-S-(O) System
Figure 12 includes three plots of the density versus sulfur content for sulfide liquids, close
to the Fe–S, Ni–S and Cu – S binaries.
Figure 12. Densities of liquids in the Fe–S, Ni–S and Cu–S binaries; experimental results
between 1201oC and 1299oC in which mol. % O is less than 5 are included [20].
26
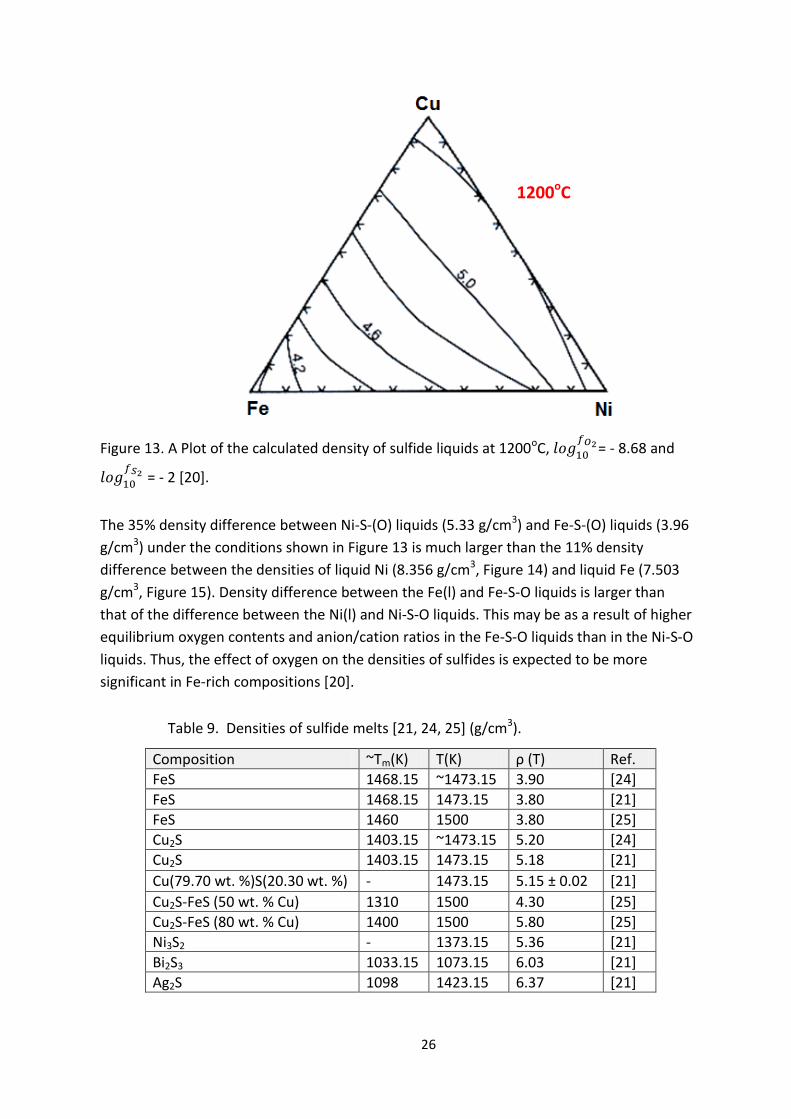
Figure 13. A Plot of the calculated density of sulfide liquids at 1200oC,
= - 8.68 and
= - 2 [20].
The 35% density difference between Ni-S-(O) liquids (5.33 g/cm3) and Fe-S-(O) liquids (3.96
g/cm3) under the conditions shown in Figure 13 is much larger than the 11% density
difference between the densities of liquid Ni (8.356 g/cm3, Figure 14) and liquid Fe (7.503
g/cm3, Figure 15). Density difference between the Fe(l) and Fe-S-O liquids is larger than
that of the difference between the Ni(l) and Ni-S-O liquids. This may be as a result of higher
equilibrium oxygen contents and anion/cation ratios in the Fe-S-O liquids than in the Ni-S-O
liquids. Thus, the effect of oxygen on the densities of sulfides is expected to be more
significant in Fe-rich compositions [20].
Table 9. Densities of sulfide melts [21, 24, 25] (g/cm3).
Composition ~Tm(K) T(K) ρ (T) Ref.
FeS 1468.15 ~1473.15 3.90 [24]
FeS 1468.15 1473.15 3.80 [21]
FeS 1460 1500 3.80 [25]
Cu2S 1403.15 ~1473.15 5.20 [24]
Cu2S 1403.15 1473.15 5.18 [21]
Cu(79.70 wt. %)S(20.30 wt. %) - 1473.15 5.15 ± 0.02 [21]
Cu2S-FeS (50 wt. % Cu) 1310 1500 4.30 [25]
Cu2S-FeS (80 wt. % Cu) 1400 1500 5.80 [25]
Ni3S2 - 1373.15 5.36 [21]
Bi2S3 1033.15 1073.15 6.03 [21]
Ag2S 1098 1423.15 6.37 [21]
1200oC
27
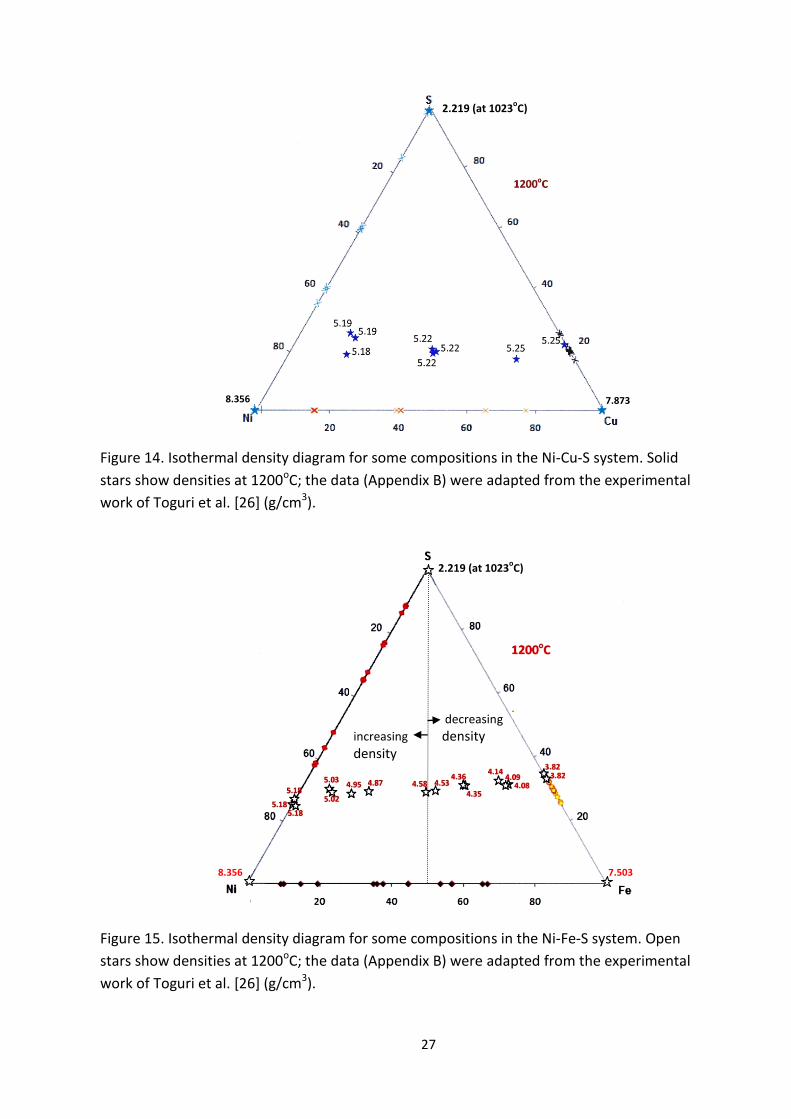
Figure 14. Isothermal density diagram for some compositions in the Ni-Cu-S system. Solid
stars show densities at 1200oC; the data (Appendix B) were adapted from the experimental
work of Toguri et al. [26] (g/cm3).
Figure 15. Isothermal density diagram for some compositions in the Ni-Fe-S system. Open
stars show densities at 1200oC; the data (Appendix B) were adapted from the experimental
work of Toguri et al. [26] (g/cm3).
7.503 8.356
8.356 7.873
decreasing
density increasing
density
2.219 (at 1023oC)
2.219 (at 1023oC)

28
4 Effect of Pressure on Densities of the Sulfide Melts
Conditions of high pressure favor formation of polymorphic forms with high densities,
whereas conditions of high temperature favor looser packing and formation of
polymorphic forms with relatively low densities [1]. As in the case of ambient pressure
conditions, the densities of Fe–S melts decrease non-linearly with increasing sulfur content
at 4 GPa and 1923 K, as depicted in Figure 16. The excess molar volumes of Fe and S at 4
GPa deviate negatively from the ideal molar volume. In general, the change in the molar
volumes (Vm) and the excess molar volumes (VEx) with sulfur content at high pressures, at
least up to 4 GPa, is similar to that of ambient pressure conditions [22]. As Figure 16 shows,
however, at higher sulfur content the variation in the densities at 4GPa and 1atm grows.
Figure 16. A modified sulfur content versus density of liquid Fe–S diagram, originally
calculated by Nishida et al. [22]. The open diamonds represent the density of liquid Fe–S at
ambient pressure and 1923 K derivative (dq/dT) of 8∙10-4 from 1473 K (Nagamori (1969)
[21]). The open squares represent the density at ambient pressure and 1923 K (Nasch and
Steinemann 1995). Black downward- and upward-pointing triangles represent measured
densities of the Fe–S samples. The dotted bold line in this area shows the density of Fe–S
liquids with various sulfur contents decreasing monotonically. The gray square represents
the calculated values at 4 GPa and 1923 K based on the elastic parameters of liquid Fe
obtained by Nasch and Steinemann (1995). The gray diamod represents the density of
liquid FeS at 4.1 GPa (measured by Chen (2005) and using Nagamori’s [18] data: dq/dT =
8∙10-4).
Fe
Extrapolated
4
G
P
a
1atm
.
4Gpa

29
5 Summary and Conclusions
Densities of solid and liquid Fe, Cu, Ni and Co, and their alloys both at the presence and
absence of sulfur are reviewed. Volumetric thermal expansions were used to estimate the
densities at different temperatures. Densities of the alloys generally decrease with
increasing temperature. For the pure metals the reduction in density as temperature rises
from 25oC to their respective melting point may be generalized to be about 7.05 ± 0.4% just
before melting and about 11.63 ± 0.92 on complete melting.
According to the literature data and analytic results, at ambient pressure, density of the
stoichiometric FeS changes from 4.615 g/cm3 at 25oC to 3.8 g/cm3 at 1200oC (~17.7%),
density of the stoichiometric Cu2S changes from 5.65 g/cm3 at 25oC to ~5.18 g/cm3 at
1200oC ( ~8.3%), density of the stoichiometric NiS changes from 5.5 g/cm3 at 25oC to 5.025
g/cm3 at 1027oC (~8.5 ± 1.8 %), and density of the stoichiometric CoS changes from 5.45
g/cm3 at 25oC to 4.88 g/cm3 at 1100oC ( ~10.45%).
At isothermal and isobaric conditions, densities of the sulfides decrease with increasing fraction of sulfur. If a sulfide contains more than one metal, the density decreases with increasing concentration of the lighter metal, at fixed amount of sulfur. Interaction of the alloy forming components determine the excess terms in the molar volume alloys. The molar volume may deviate positively or negatively from the ideal molar volume resulting in nonlinear ρ-X-T relations. As the fraction of sulfur increases the Vm(sulfides) deviate negatively from ideal-mixing and/or the respective ρm values deviate positively from the ideal-mixing. However, at the presence of oxygen this might not hold. A study on the Fe-S melts at 4GPa suggests that in S-poor compositions, where solubility of sulfur is less likely to be affected by pressure, the density of the sulfides at isothermal conditions decreases in a similar fashion as under 1 bar, i.e., density decreases non-linearly with increasing sulfur.
Acknowledgements
The authors are grateful to Improved Sulfide Smelting (ISS) project of the ELEMET program
and Tekes, the Finnish Funding Agency for Technology and Innovation, for financial
support. This work was made as a sub task of ISS, supported financially by Boliden
Harjavalta Oy, Boliden Kokkola Oy, Norilsk Nickel Finland Oy and Outotec Oyj.

30
References
1. Berry, Mason D. Mineralogy, 2nd edition. 1983. 551 p. ISBN 0-7167-1424-8.
2. Fang, L., Xiao, F., Wang, Y.F., Tao, Z.N., MuKaic, K. Density and molar volume of liquid
Ni-Co binary alloys. Materials Science and Engineering B 132. 2006. pp. 174 – 178.
3. Mills, Kenneth C. Recommended values of Thermophysical Properties for Selected
Commercial Alloys. NPL & ASM International. 2002. 244 p.
4. Taskinen, P. Realisystemien termodynamiikka, KE-31.5510. Aalto-yliopiston teknillinen
korkeakoulu, Kemian laitos. Kurssimateriaali. 2010. 86 p.
5. Kawai, Y and Shiraishi, Y. Hand book of Physico-chemical Properties at High
Temperature. The Iron and Steel Institute of Japan, Special Issue (ISIJ) No. 41. 1988.
255 p.
6. Brillo, J., Egry, I. & Matsushita, T. Density and Surface Tension of Liquid Ternary Ni–Cu–
Fe Alloys. International Journal of Thermophysics, Vol. 27, No. 6. 2006. pp. 1778-1791.
7. Egry, I., Brillo, J. & Matsushita, T. Thermophysical Properties of Liquid Cu-Fe-Ni alloys.
Materials Science and Engineering A 413–414. 2005. pp. 460 - 464.
8. Smyth, J. Descriptive Mineralogy Sulfides. 2009 (online accessed 2010). URL address:
http://ruby.colorado.edu/~smyth/G3010/15Sulfides.pdf
9. Wills, B.A. and Napier-Munn, T.J. Wills’ Mineral Processing Technology, An
Introduction to the Practical Aspects of Ore Treatment And Mineral Recovery. 7th
edition. 2006. 444 p.
10. Roine, A. HSC Chemistry 7. Outotec Research Oy. 2010.
11. Makovicky, Emil & Brian, J. Skinner. Studies of the Sulfosalts of Copper. VI. Low-
Temperature Exsolution in Synthetic Tetrahedrite Solid Solution, Cu12+xSb4+yS13.
Canadian Mineralogist. 1978. Vol. 16. pp. 611-623.
12. Tatsuka, K. and Morimoto, N. Tetrahedrite Stability Relations in the Cu-Fe-Sb-S System.
American Mineralogist. Vo. 62. 1977. pp. 1101-1109.
13. Tatsuka, Kiyoaki & Morimoto, Nobuo. Composition Variation and Polymorphism of
Tetrahedrite in the Cu-Sb-S System below 400oC. American Mineralogist. Vol. 58. 1973.
pp. 425-434.
14. Tenailleau, C., Etschmann, B., Wang, H., A. Pring, Grguric, B. A. and Studer, A.Thermal
expansion of troilite and pyrrhotite determined by in situ cooling (873 to 373 K)
neutron powder diffraction measurements (Abstract). Mineralogical Magazine, v. 69,
no. 2. 2005. pp. 205-216.
15. Rajamani, V. and Prewitt, C.T. Thermal Expansion of the Pentlandite Structure.
American Mineralogist, Volume 60. 1975. pp. 39 - 48.

31
16. Selivanov, E. N., Gulyaeva, R. I. and Vershinin, A. D. Thermal Expansion and Phase
Transformations of Copper Sulfides. ISSN 0020-1685, Inorganic Materials. Vol. 43, No.
6. 2007. pp. 573 – 578.
17. Tatsuka, K. and Morimoto, N. Tetrahedrite Stability Relations in the Cu-Fe-Sb-S System.
American Mineralogist. Vo. 62. 1977. pp. 1101-1109.
18. Friese, Karen, Grzechnik, Andrzej, Makovicky, Emil, Balic-Z unic, ToncˇI & Karup-
Møller, Sven. Crystal Structures of Iron Bearing Tetrahedrite and Tennantite at 25 and
250oC by Means of Rietveld Refinement of Synchrotron Data. Phys Chem Minerals.
2008. pp. 455–465.
19. Zushu Li, Kenneth C. Mills, Malcolm McLean & Kusuhiro Mukai. Measurement of the
Density and Surface Tension of Ni-Based Superalloys in the Liquid and Mushy States.
Metallurgical and Materials Transactions B. Volume 36B. 2005. pp. 247-269.
20. Victor, Kress, Lori, E. Greene, Matthew, D. Ortiz, Luke Mioduszewski. Thermochemistry
of Sulfide Liquids IV: Density Measurements and the Thermodynamics of O–S–Fe–Ni-
Cu Liquids at low to Moderate Pressures. 2008. Contrib Mineral Petrol 156. 2008. pp.
785 – 797.
21. Nagamori, M. Density of Molten Ag-S, Cu-S, Fe-S, and Ni-S Systems. 1968. Transactions
of the Metallurgical Society of AlME. Vol. 245. pp. 1897- 1902.
22. Nishida, K., Terasaki, H., Ohtani, E. and Suzuki, A.The effect of Sulfur Content on
Density of the Liquid Fe–S at High Pressure. Phys Chem Minerals. 2008. pp. 417–423.
23. Miettinen, J. & Kytönen, H. Calculatin of Density in liquid Steels.Helsinki University of
Technology Publications in Materials Science and Engineering. TKK-MT-187. 2006. 41
p.
24. Davenport, W.G., King, M., Schlesinger, M. and Biswas, A.K. Extractive Metallurgy of
Copper. 4th edition. Elsevier Science Ltd. 2002. 412 p.
25. Davenport, W.G. and Partelpoeg, E. H. Flash Smelting, Analysis, control and
Optimization. 2nd edition. Pergamon Press.1987. 324 P.
26. Toguri, J.M. and Ip, S.W. Surface and Interfacial Tension of the Ni-Fe-S, Ni-Cu-S, and
Fayalite Slag Systems. Metallurgical Transactions B, Vol. 24B. 1993. pp. 657 – 668.

32
Appendix A
Table 1. High temperature densities of alloys of Co, Cu, Ni and Fe, using the maximum bubble method [Error! Reference source not found.].
Co - Ni alloy Co - Cu alloy
at. % Ni A B T(K) at. % Co A B T(K)
0 9.71 1.11
1793-1903 0 8.75 0.657
1500-1898
20 9.29 0.857
1798-1928 20 8.35 0.473
1653-1873
40 8.35 0.337
1798-1938 40 8.87 0.770
1698-1903
60 7.82
0.089
1783-1938 60 8.67 0.619
1703-1898
80 9.11
0.756
1788-1948 80 8.56 0.531
1748-1913
100 10.10 1.27
1763-1933 100 9.71 1.11 1793-1898
Co - Fe alloy Cu - Fe alloy
at. % Co A B T(K) at. % Fe A B T(K)
0 8.78 0.958
1828-1938 0 8.75 0.657
1500-1898
20 9.28 1.14
1798-1913 20 8.90 0.847
1708-1898
40 9.44 1.15
1798-1913 40 9.20 1.104
1728-1918
60 9.58 1.13
1783-1903 60 7.88 0.438
1768-1923
80 9.56 1.07
1788-1918 80 8.81 1.016
1778- 1923
100 9.71 1.11
1793-1903 100 8.78 0.958
1833-1938
Cu - Ni alloy Fe - Ni alloy
at. % Ni A B T(K) at. % Ni A B T(K)
0 8.75 0.657
1500-1898 0 8.78 0.958
1828-1938
20 8.36 0.400
1638 – 1873 20 9.08 1.03 1798-1923
40 8.12 0.278
1643-1888 40 8.73 0.806
1803-1913
60 8.00 0.203
1678-1918 60 7.57 0.100
1748-1923
80 8.32 0.341
1793-1918 80 9.38 0.933
1778-1918
100 10.10 1.27
1773-1928 100 10.10
1.27 1763-1933
Experimental data for densities and coefficients A and B (in equation (10))
of the binary alloys in the Co-Cu-Ni-Fe system [5].
33
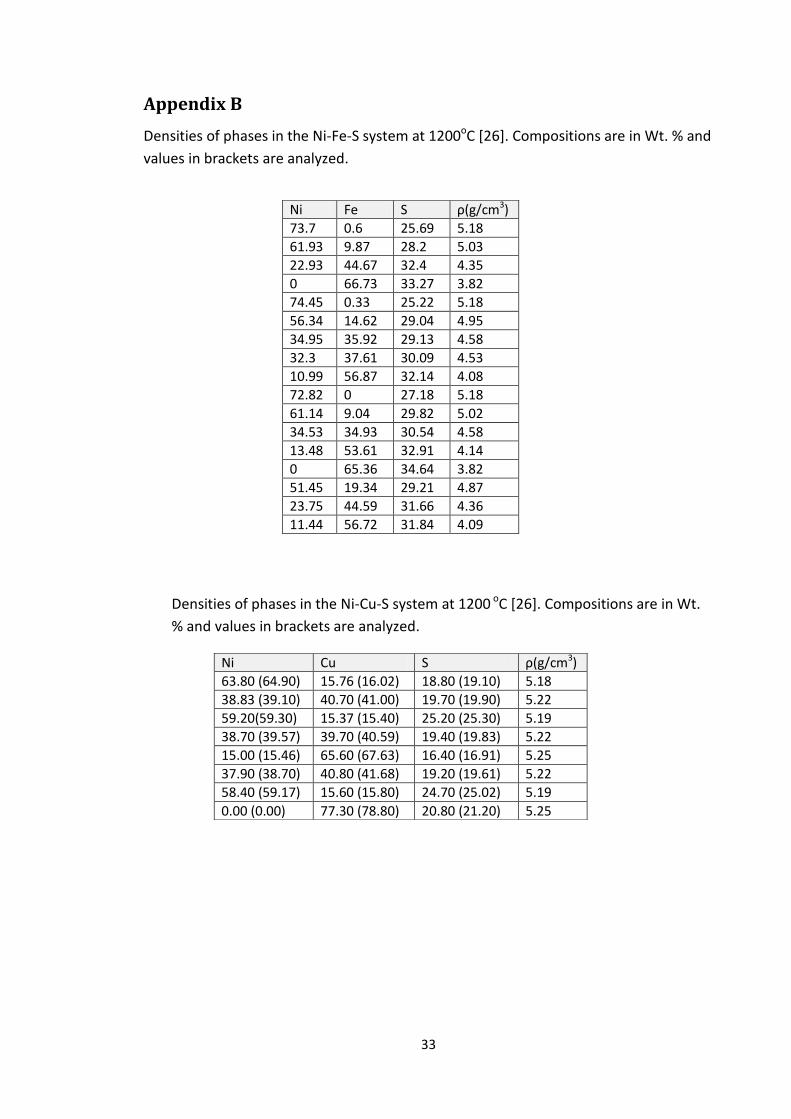
Appendix B
Densities of phases in the Ni-Fe-S system at 1200oC [26]. Compositions are in Wt. % and
values in brackets are analyzed.
Densities of phases in the Ni-Cu-S system at 1200 oC [26]. Compositions are in Wt.
% and values in brackets are analyzed.
Ni Fe S ρ(g/cm3)
73.7 0.6 25.69 5.18
61.93 9.87 28.2 5.03
22.93 44.67 32.4 4.35
0 66.73 33.27 3.82
74.45 0.33 25.22 5.18
56.34 14.62 29.04 4.95
34.95 35.92 29.13 4.58
32.3 37.61 30.09 4.53
10.99 56.87 32.14 4.08
72.82 0 27.18 5.18
61.14 9.04 29.82 5.02
34.53 34.93 30.54 4.58
13.48 53.61 32.91 4.14
0 65.36 34.64 3.82
51.45 19.34 29.21 4.87
23.75 44.59 31.66 4.36
11.44 56.72 31.84 4.09
Ni Cu S ρ(g/cm3)
63.80 (64.90) 15.76 (16.02) 18.80 (19.10) 5.18
38.83 (39.10) 40.70 (41.00) 19.70 (19.90) 5.22
59.20(59.30) 15.37 (15.40) 25.20 (25.30) 5.19
38.70 (39.57) 39.70 (40.59) 19.40 (19.83) 5.22
15.00 (15.46) 65.60 (67.63) 16.40 (16.91) 5.25
37.90 (38.70) 40.80 (41.68) 19.20 (19.61) 5.22
58.40 (59.17) 15.60 (15.80) 24.70 (25.02) 5.19
0.00 (0.00) 77.30 (78.80) 20.80 (21.20) 5.25

34
HELSINKI UNIVERSITY OF TECHNOLOGY PUBLICATIONS IN MATERIALS SCIENCE AND ENGINEERING
TKK-MT-201 Heikinheimo,E.,Selin,L.,(ed.), Possibilities of electron excited microbeam analysis in materials science. Graduated School Seminar, 2008 at TKK, Espoo, Finland
TKK-MT-202 Miettinen, J., Tentative thermodynamic description of ternary Fe-Mo-B, Fe-Nb-B, Fe-Ti-B and Fe-V-B systems. 2008
TKK-MT-203 Kekkonen, M. (ed.), Materials production and synthesis / 2008
TKK-MT-204 Heikinheimo, E., Selin, L. (editors), Defect Structure and Reactivity of Solids. 2009
TKK-MT-205 Miettinen, J., Thermodynamic description of the Fe-Nb-Ti-V-C-N system. 2009
TKK-MT-206 Miettinen, J., Kytönen, H., Thermodynamic descriptions of Fe-Mn-Si, Fe-Mn-B and Fe-Si-B systems. 2009
TKK-MT-207 Huitu, K., Kekkonen, M., Holappa, L., Novel Steelmaking Processes. 2009
TKK-MT-208 Bunjaku, A., Holappa, L., Thermodynamic properties of NICKEL laterite ores. 2009
TKK-MT-209 Heikinheimo, E., Selin, L. (editors), Quantitative electron probe microanalysis in materials science. Graduate School Seminar, September 25, 2009 at TKK, Espoo, Finland
TKK-MT-210 Keski-Honkola A., Vaajoki, A., Oksanen, J., Hämäläinen, M., Ag-Bi-Cu-Sn seoksen termodynaaminen mallintaminen FactSage-ohjelmalla. 2009
TKK-MT-211 Kekkonen, M., (ed.), Materials Production and Synthesis / 2009 MT-0.3201
TKK-MT-212 Isomäki, I., Hämäläinen, M., Pirso, J., Ferreira, J., Braga, H. Thermodynamic and Structural Study of Quaternary Ni-rich Fe-Ni-Ti-W Phase Diagram. 2009
TKK-MT-213 Heikinheimo, E., (ed.), Activity Report 2007 – 2009. Department of Materials Science and Engineering. 2010
TKK-MT-214 Tesfaye Firdu, F., Taskinen, P., Sulfide Mineralogy – Literature Review. 2010
ISBN 978 952-60-3272-6
ISSN 1455-2329


![[29] Review Durability of Materials in Molten Aluminum Alloys](https://static.fdocuments.in/doc/165x107/55cf9804550346d0339505c0/29-review-durability-of-materials-in-molten-aluminum-alloys.jpg)