DENMAN Fasor CfAO 2-Freq edited version for...
33
1 1 Craig Denman Paul Hillman Gerald Moore John Telle Jack Drummond Steven Novotny Mark Eickhoff Robert Fugate Starfire Optical Range Directed Energy Directorate Air Force Research Laboratory Two-Frequency Sodium Guidestar Excitation at the Starfire Optical Range FASOR: F requency-A ddition S ource of O ptical R adiation Center for Adaptive Optics Fall Retreat 2006 Fish Camp, California Sunday 19 November 2006 The following slide presentation provides a top-level update on the AFRL 50-watt facility-class sodium guidestar pump FASOR at the Starfire Optical Range. Adaptive Optics allow large telescopes to reach their theoretical resolution by correcting for atmospheric distortion. A portion of the light from the telescope is directed to a wavefront sensor which measures the distortion caused by the atmosphere. These measurements control a deformable mirror in the telescope beam train to remove the atmospheric distortions, yielding high resolution images. Guidestar brightness must be sufficient to operate the wavefront sensor at rates faster than changes in the atmospheric turbulence. An artificial guidestar can be produced through excitation of the mesospheric sodium layer at about 90km altitude through resonant pumping of the D2a transition. A laser guidestar allows an adaptive optical telescope whole sky coverage. COVER SLIDE
-
Upload
phamnguyet -
Category
Documents
-
view
221 -
download
2
Transcript of DENMAN Fasor CfAO 2-Freq edited version for...

11
Craig Denman Paul HillmanGerald Moore John TelleJack Drummond Steven NovotnyMark Eickhoff Robert Fugate
Starfire Optical RangeDirected Energy Directorate
Air Force Research Laboratory
Two-Frequency Sodium Guidestar Excitationat the
Starfire Optical Range
FASOR: Frequency-Addition Source of Optical Radiation
Center for Adaptive OpticsFall Retreat 2006
Fish Camp, CaliforniaSunday 19 November 2006
The following slide presentation provides a top-level update on the AFRL 50-watt facility-class sodium guidestar pump FASOR at the Starfire Optical Range.
Adaptive Optics allow large telescopes to reach their theoretical resolution by correcting for atmospheric distortion. A portion of the light from the telescope is directed to a wavefront sensor which measures the distortion caused by the atmosphere. These measurements control a deformable mirror in the telescope beam train to remove the atmospheric distortions, yielding high resolution images. Guidestar brightness must be sufficient to operate the wavefront sensor at rates faster than changes in the atmospheric turbulence. An artificial guidestar can be produced through excitation of the mesospheric sodium layer at about 90km altitude through resonant pumping of the D2a transition. A laser guidestar allows an adaptive optical telescope whole sky coverage.
COVER SLIDE
22
2
Sodium Guidestar Fasor the SOR 3.5-m telescope
Photo by Robert Fugate
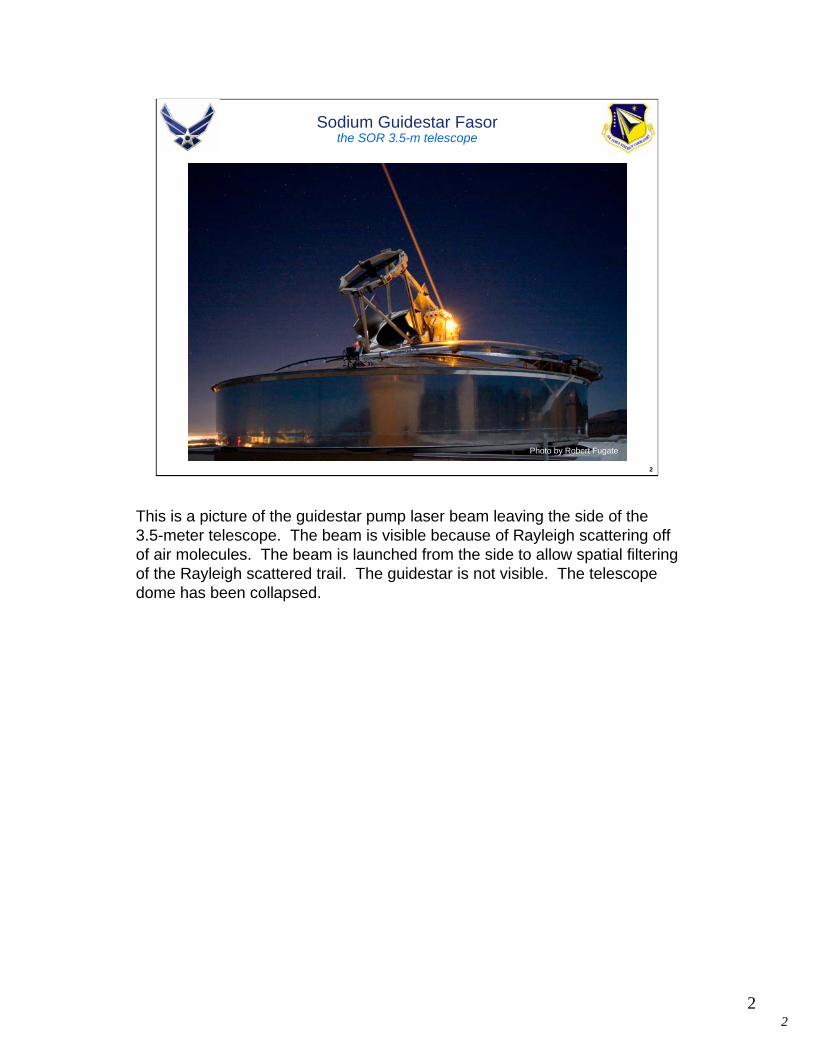
This is a picture of the guidestar pump laser beam leaving the side of the 3.5-meter telescope. The beam is visible because of Rayleigh scattering off of air molecules. The beam is launched from the side to allow spatial filtering of the Rayleigh scattered trail. The guidestar is not visible. The telescope dome has been collapsed.

33
3
All-solid-state Sodium Guidestar Excitation Sourcetimeline and laser concept
Injection Laser1.064μ
Injection Laser1.319μ
To NPRO PZTfor Locking toSFG Cavity
To NPRO PZT
Sodium Cell/Wavemeter
SFG Cavity589nm
(Cavity Lockedto 1.319μ)
Jan 2001 Jan 2002 Jan 2003 Jan 2005
50w first light after install on
3.5m telescope
AFRL sodium guidestar team formed
Jan 2004
6 W first light laser concept
20w sky tests
conducted
20W begin 50W system
Jan 2006
50w FASOR
sky tests
Two strongest lines in Nd:YAG•1064 nm•1319 nm
Sum Frequency Generation (SFG)•Doubly Resonant•Lithium Triborate (LBO)
589nmContinuous WaveSingle Frequency (10kHz linewidth)Frequency Tunable by <60fm steps
System layout in a block diagram showing the two injection lasers and the SFG cavity. Control signals shown in black include: 1064nm injection laser locked to the SFG cavity and the 1319nm laser tuned to the sodium D2a line. The SFG cavity itself is locked to the 1319nm laser. Our experimental sky tests, to date, include guidestar irradiance measured at various laser power levels for linear and circular polarizations to determine optical pumping enhancement of the return photon flux. Other experiments include the guidestar dynamics to determine possible slew rate and guidestar radiance distribution.

44
4
Doubly-Resonant SFG Cavity in Operation – Spring 2002diffraction-limited beam quality, quantum limited beam jitter at SFG
Beam Radius in LBO Crystal
1064nm 46.7-microns1319nm 52.0-microns589nm 34.7-microns
(measured 33.7μ)
18cm
mode sizevs.position in SFG cavity FSR = 492 MHz
SFG cavity drawn to scale
LBO crystal5x5x20mm
589nm ½-inch diameter Brewster-angled output coupler
PZT
R = 10cmRoC mirrors
θ = 7deg(full fold angle)
I/O
This slide shows a schematic diagram and a picture of the sum-frequency generator (SFG). The picture shows the SFG in operation. The yellow light is coupled out of the cavity by a scraper mirror just after the LBO crystal. The figure on the lower right shows the mode size vs. position inside the SFG. Optimal IR beam radius is about 30-micrometers for Boyd-Kleinman focusing.
55
5
Proof of Concept “20 Watt” Sodium Guidestar System – Fall 2002cw, single-frequency, 589nm guidestar fasor
1319nm Injection Laser
1064nm Injection Laser
Sodium Transition Lock
Sum Frequency Generator
Instrumentation Racks
589nm Beam
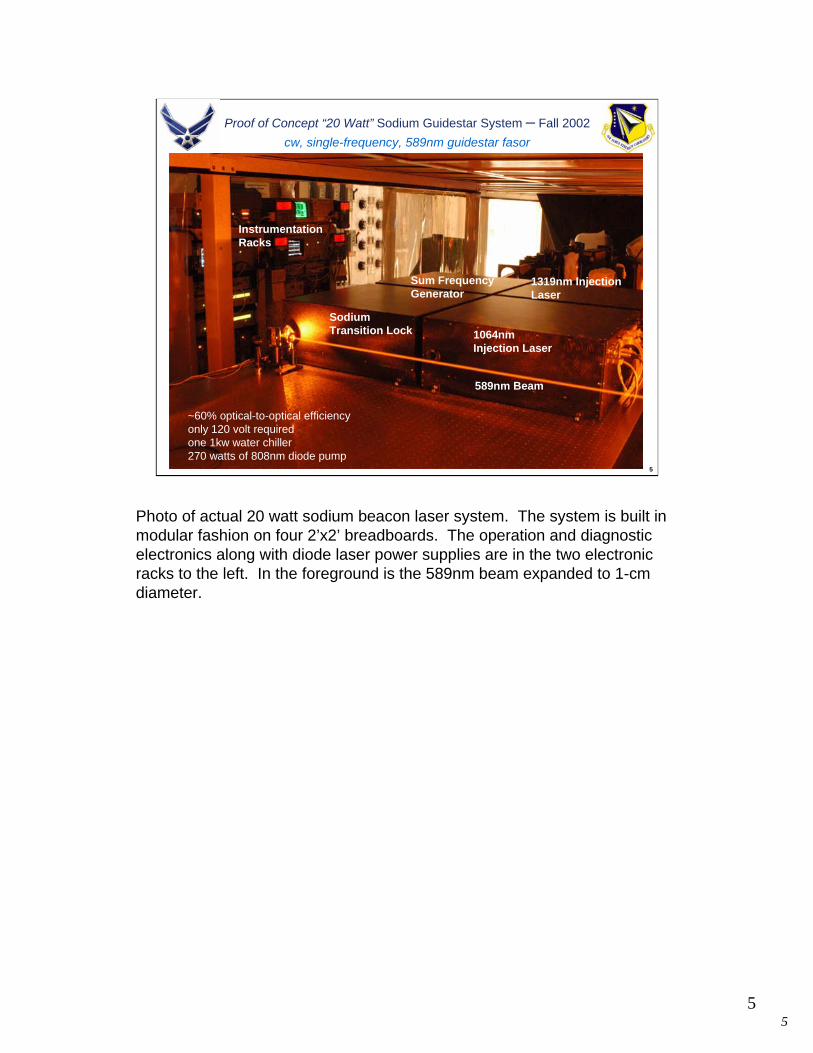
~60% optical-to-optical efficiencyonly 120 volt requiredone 1kw water chiller270 watts of 808nm diode pump
Photo of actual 20 watt sodium beacon laser system. The system is built in modular fashion on four 2’x2’ breadboards. The operation and diagnostic electronics along with diode laser power supplies are in the two electronic racks to the left. In the foreground is the 589nm beam expanded to 1-cm diameter.

66
6
Launch Coelostat and 3.5m Telescope – Fall 2002used to view LGS and determine photon return flux
Photo by Robert Fugate
Photo of the 589 nm beam propagating toward the mesosphere on the right and the 3.5-m telescope used to detect the photon return signal in the foreground. The top of the launch Coelostat, an optical device used to follow the path of a celestial body and reflect its light into a telescope, is just visible in the background.

77
7
Sodium Guidestar in Mesosphere at 90km – Fall 2002timed-exposure, 400mm telephoto, Nikon digital camera
Photo by Art Goodman
V=7.5*
Image by Jack Drummond3.5-m telescope, Starfire Optical Range
V=12.2 V=11.9 V=13.1
0
20
40A
rc S
ec
60 80 100 1200 20 40
Arc Sec
11.5w, Lin. Pol.50m off-axis baseline
Publications of the Astronomical Society of the PacificJack Drummond, et al, PASP, 116:952–964, 2004 OctoberPASP, 116:278–289, 2004 March
This slide shows a photograph of the 589 nm beam propagating to the mesosphere taken with a 400mm telephoto lens on a Nikon D100 digital camera. The timed exposure shows the Rayleigh scattering decreasing as it leaves the atmosphere and the spot in the mesospheric sodium layer in the upper right. The object is foreshortened by the camera position. The Rayleigh trail ends at about 20 km and the sodium guidestar is at about 90 km.

88
8
Power Supply Rack
Telescope Mounted Racks
Laser Enclosure
50W Facility-Class Guidestar Excitation Source – Started Spring 20033.5m telescope at Starfire Optical Range
This chart shows the design for integrating the 50-W sodium beacon laser with the 3.5-m telescope at the SOR. The laser subsystems are shown in red and include the laser diode power supplies in the tall rack next to the pier below the dome floor, the water chiller next to the rack, the computer control console shown in the telescope control room, the electronics in 3 short racks on the azimuthal base of the telescope, the laser in the 2ft x 6ft x 10 in high sealed box, and the beam expander and pointing control on the side of the telescope. The cables and coolant for the laser pass through the telescope’s ‘maypole’ cable drape as shown in the diagram.
99
9
50 watts at 589nm -- Fall 2004M2=1, single-frequency, circular or linear polarization
Photo by Robert Fugate
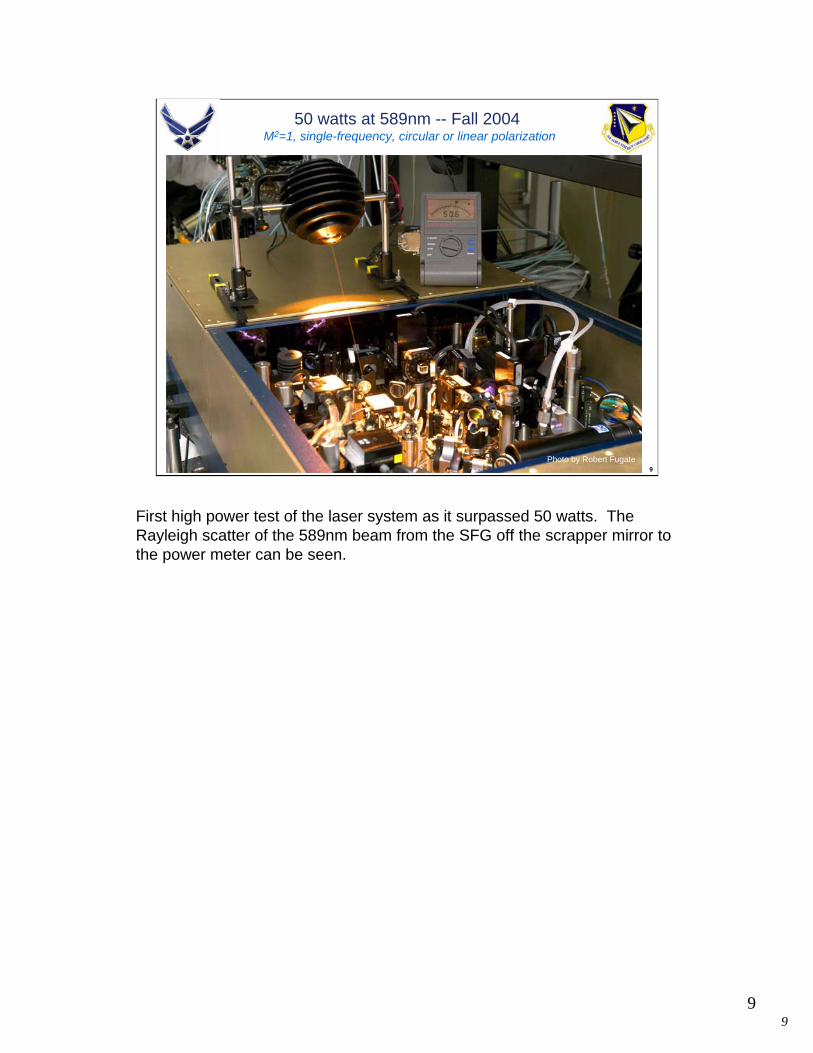
First high power test of the laser system as it surpassed 50 watts. The Rayleigh scatter of the 589nm beam from the SFG off the scrapper mirror to the power meter can be seen.
1010
10
Optical-to-Optical SFG Efficiency50-w fasor (assumes perfect mode-match)
59.7% max. efficiency
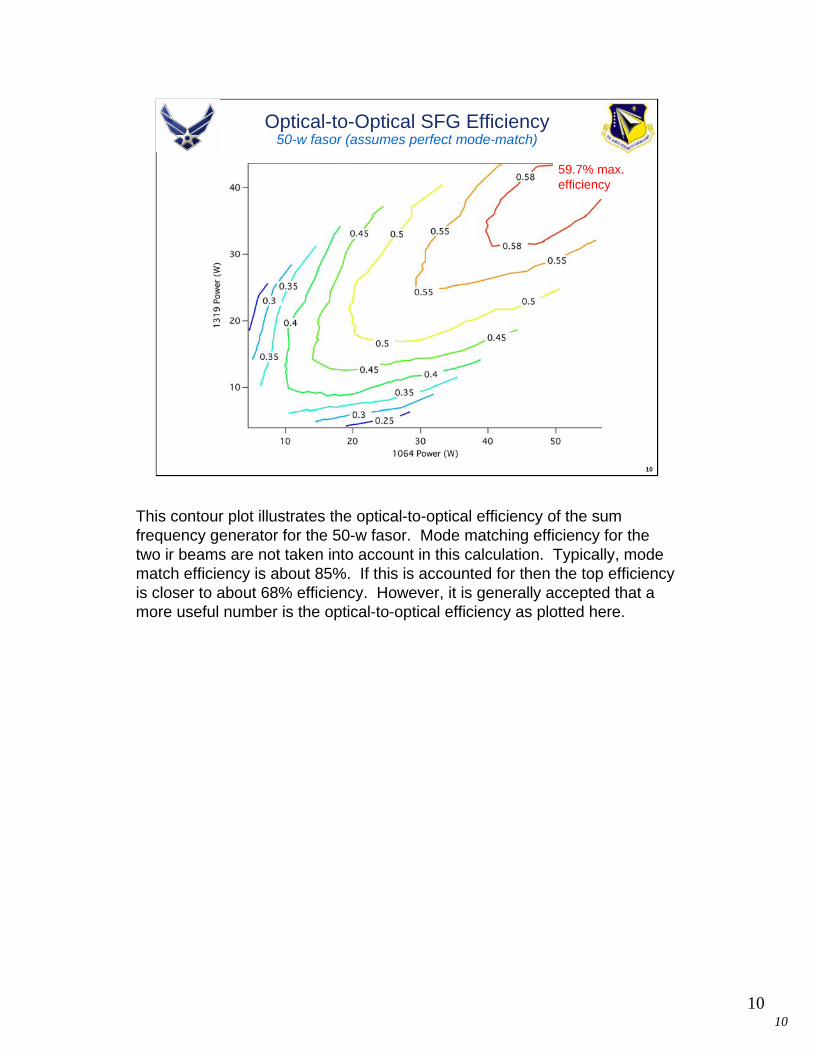
This contour plot illustrates the optical-to-optical efficiency of the sum frequency generator for the 50-w fasor. Mode matching efficiency for the two ir beams are not taken into account in this calculation. Typically, mode match efficiency is about 85%. If this is accounted for then the top efficiency is closer to about 68% efficiency. However, it is generally accepted that a more useful number is the optical-to-optical efficiency as plotted here.
1111
11
Fully-Automated, GUI System Controlcommands, diagnostics, alignment, status
four-screen system console station
Control Status System Operations
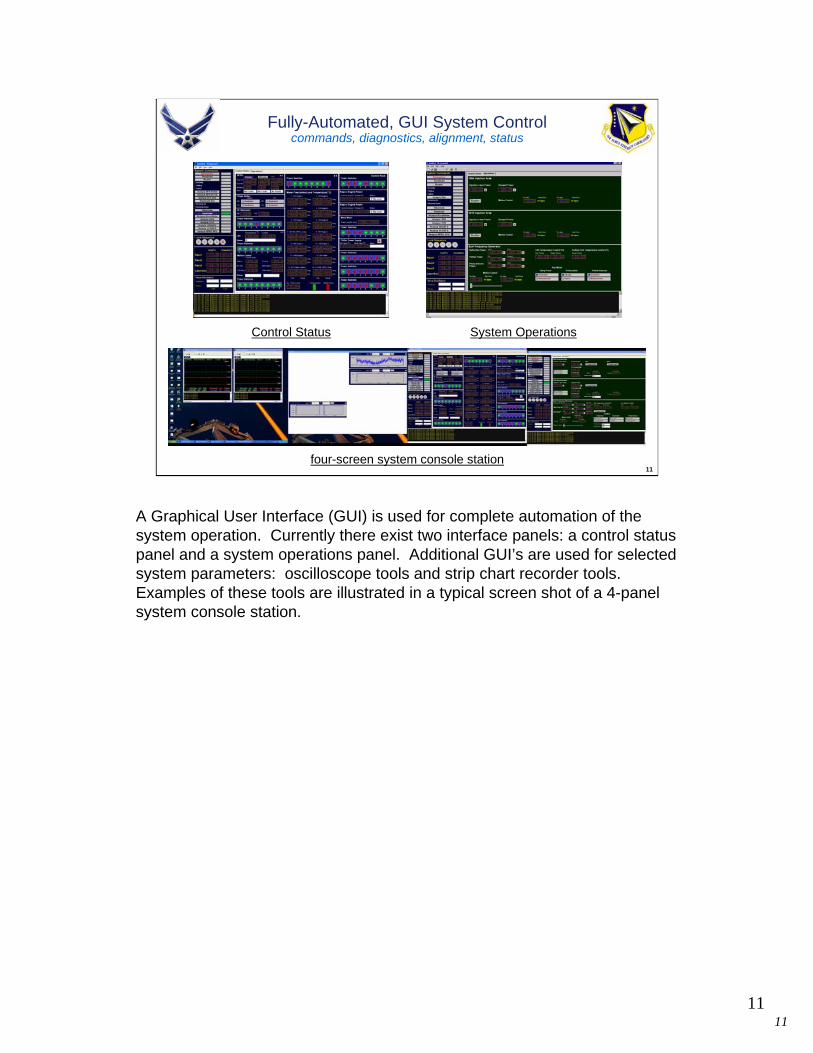
A Graphical User Interface (GUI) is used for complete automation of the system operation. Currently there exist two interface panels: a control status panel and a system operations panel. Additional GUI’s are used for selected system parameters: oscilloscope tools and strip chart recorder tools. Examples of these tools are illustrated in a typical screen shot of a 4-panel system console station.

1212
12
+/- 1.25% 589nm stability
17 minute strip-chart recorders (~5 hour locks observed)
1064nm Injection-Locked Laser•Scale 0-50 watts
1319nm Injection-Locked Laser•Scale 0-45 watts
SFG 589nm Output Power•Scale 20-21 watts
Sodium Guidestar Fasor output power stability
This slide illustrates the Fasor output stability. Charts represent 17 minute period measurements to illustrate power stability. Yellow output at 589nm has a power stability of better than +/- 1.25%.

1313
13
Precision Wavelength Tuningcontinuously tunable, 10fm resolution, 60fm accuracy
0
1
2
3
4
5
589.1560589.1570589.1580589.1590589.1600
wavelength (nm)
cell
fluor
esce
nce
D2a 589.158760 nm
D2b 589.156770 nm
Crossover 589.157760 nm
Doppler-free saturation spectroscopyfrom sodium cell side-port fluorescenceheated to 75-deg C, density normalized
This slide demonstrates the precision of wavelength tunability of the system. Data were obtained through measurement of side-port fluorescence from a heated sodium cell. Density normalization to 75-deg C was done as some data were taken at differing temperatures. The D2a and D2b dips and the crossover peaks were calibrated based upon the paper by C.Y. She, et al, “High-spectral-resolution fluorescence light detection and ranging for mesospheric sodium temperature measurements”, 20 April 1992 / Vol. 31, No. 12 / APPLIED OPTICS. The wavemeter used has a resolution of 60fm yet tuning for the laser system is continuous and the wavemeter indicates a change in wavelength by 10fm steps. Assuming the absolute wavelength for the D2-line weighted mean is 589.158nm then D2a is 589.158760 nm – and the other features in the plot above are labeled using this mean value. However, a better value that is accepted by NIST standards is 589.158326nm and results in D2a at 589.15908nm.

1414
14
50W Fasor on 3.5m Telescope – Fall 2004
Photograph of the 50-watt fasor as mounted to the Starfire Optical Range 3.5-m telescope to illustrate the functional layout. Note the white tube directly above the gold/blue laser box is the laser beam projection optics. The beam is expanded to 20cm diameter through a transmission refractive telescope design. A fast gimbal mirror prior to the final beam expansion can accurately steer the beam in the mesosphere.
1515
15
Sodium Guidestar Fasorthe Starfire Optical Range
Photo by Robert Fugate
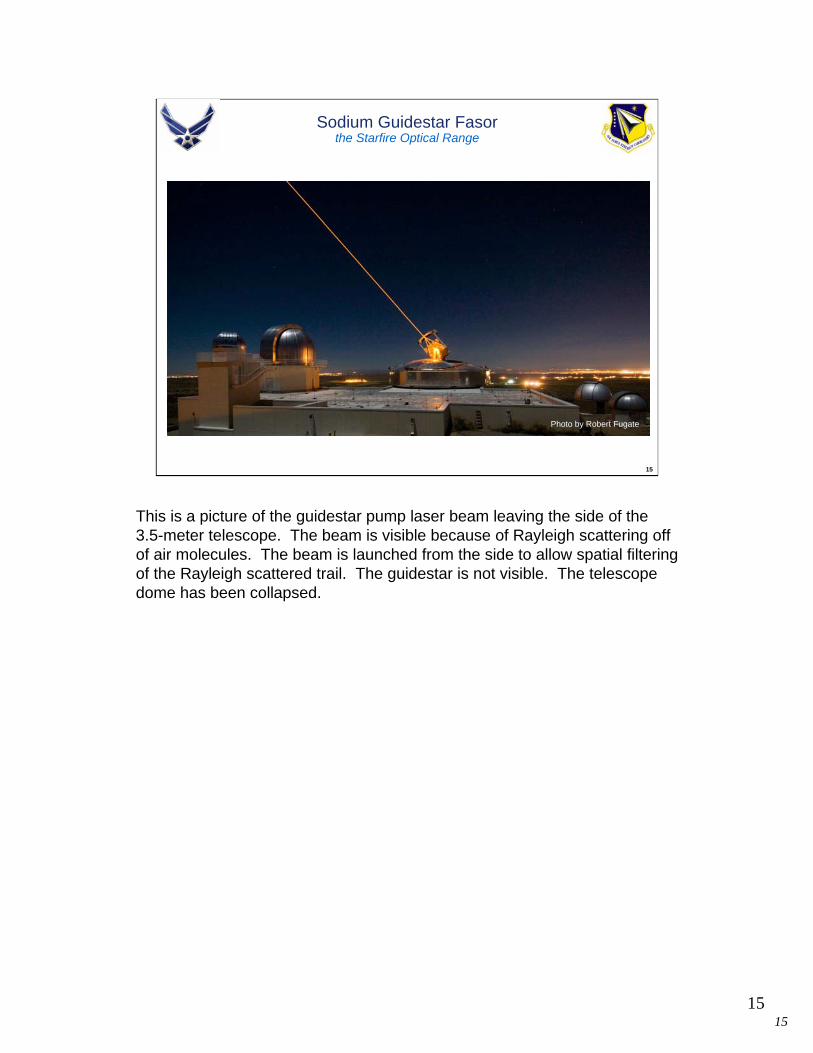
This is a picture of the guidestar pump laser beam leaving the side of the 3.5-meter telescope. The beam is visible because of Rayleigh scattering off of air molecules. The beam is launched from the side to allow spatial filtering of the Rayleigh scattered trail. The guidestar is not visible. The telescope dome has been collapsed.
1616
16
Guidestar Spot Sizetypical 20-w spot size: V=6.0, 2.4” uncompensated (1.9” recon.)
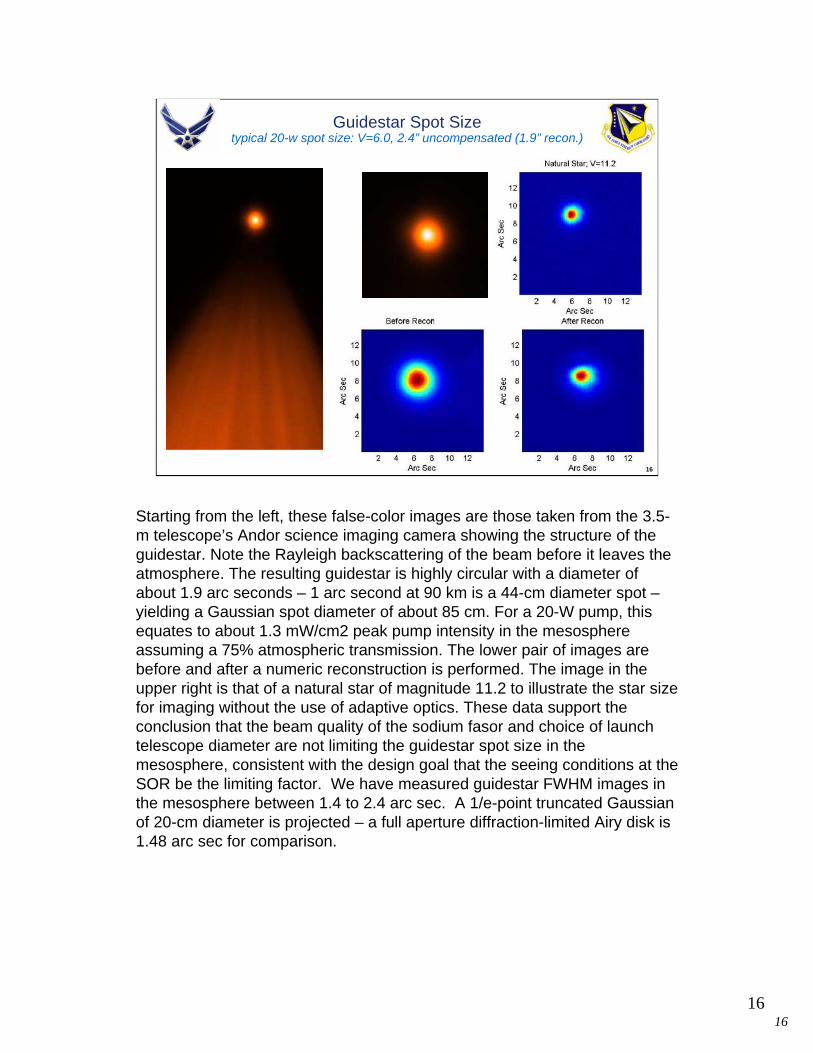
Starting from the left, these false-color images are those taken from the 3.5-m telescope’s Andor science imaging camera showing the structure of the guidestar. Note the Rayleigh backscattering of the beam before it leaves the atmosphere. The resulting guidestar is highly circular with a diameter of about 1.9 arc seconds – 1 arc second at 90 km is a 44-cm diameter spot –yielding a Gaussian spot diameter of about 85 cm. For a 20-W pump, this equates to about 1.3 mW/cm2 peak pump intensity in the mesosphere assuming a 75% atmospheric transmission. The lower pair of images are before and after a numeric reconstruction is performed. The image in the upper right is that of a natural star of magnitude 11.2 to illustrate the star size for imaging without the use of adaptive optics. These data support the conclusion that the beam quality of the sodium fasor and choice of launch telescope diameter are not limiting the guidestar spot size in the mesosphere, consistent with the design goal that the seeing conditions at the SOR be the limiting factor. We have measured guidestar FWHM images in the mesosphere between 1.4 to 2.4 arc sec. A 1/e-point truncated Gaussian of 20-cm diameter is projected – a full aperture diffraction-limited Airy disk is 1.48 arc sec for comparison.
1717
17
Atomic States of the Sodium D2 Line2x photon return enhancement for circular vs linear polarization
RightRight--Handed Circular Handed Circular PolarizationPolarization
ΔF = 0, ±1 ΔM = +1
Linear PolarizationLinear Polarization
ΔF = 0, ±1 ΔM = 0
ΔF = 0, ±1 ΔM = 0, or ΔM = ±1
3S3S1/21/2 ↔↔ 3P3P3/23/2 ExcitationExcitation
Spontaneous Emission TransitionsSpontaneous Emission Transitions
• thermally distributed multi-level ∼ 19 mW/cm2
• 2-level saturation intensity 6.4 mW/cm2
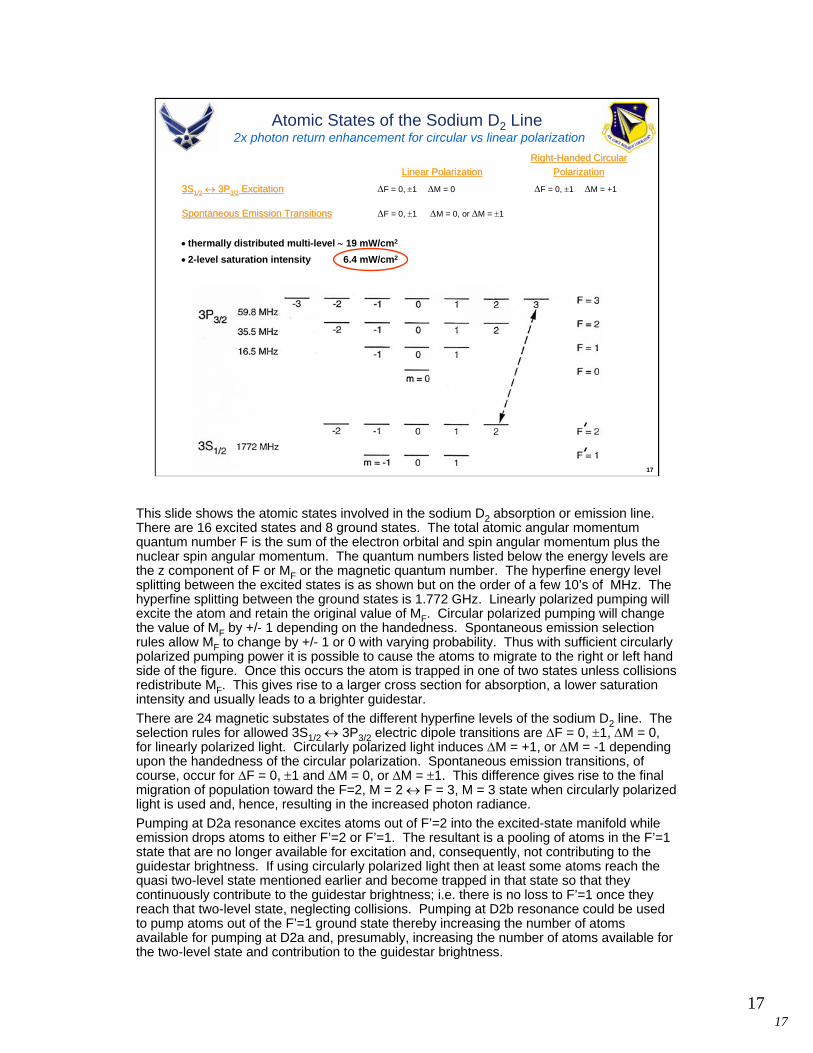
This slide shows the atomic states involved in the sodium D2 absorption or emission line. There are 16 excited states and 8 ground states. The total atomic angular momentum quantum number F is the sum of the electron orbital and spin angular momentum plus the nuclear spin angular momentum. The quantum numbers listed below the energy levels are the z component of F or MF or the magnetic quantum number. The hyperfine energy level splitting between the excited states is as shown but on the order of a few 10’s of MHz. The hyperfine splitting between the ground states is 1.772 GHz. Linearly polarized pumping will excite the atom and retain the original value of MF. Circular polarized pumping will change the value of MF by +/- 1 depending on the handedness. Spontaneous emission selection rules allow MF to change by +/- 1 or 0 with varying probability. Thus with sufficient circularly polarized pumping power it is possible to cause the atoms to migrate to the right or left hand side of the figure. Once this occurs the atom is trapped in one of two states unless collisions redistribute MF. This gives rise to a larger cross section for absorption, a lower saturation intensity and usually leads to a brighter guidestar.There are 24 magnetic substates of the different hyperfine levels of the sodium D2 line. The selection rules for allowed 3S1/2 ↔ 3P3/2 electric dipole transitions are ΔF = 0, ±1, ΔM = 0, for linearly polarized light. Circularly polarized light induces ΔM = +1, or ΔM = -1 depending upon the handedness of the circular polarization. Spontaneous emission transitions, of course, occur for ΔF = 0, ±1 and ΔM = 0, or ΔM = ±1. This difference gives rise to the final migration of population toward the F=2, M = 2 ↔ F = 3, M = 3 state when circularly polarized light is used and, hence, resulting in the increased photon radiance.Pumping at D2a resonance excites atoms out of F’=2 into the excited-state manifold while emission drops atoms to either F’=2 or F’=1. The resultant is a pooling of atoms in the F’=1 state that are no longer available for excitation and, consequently, not contributing to the guidestar brightness. If using circularly polarized light then at least some atoms reach the quasi two-level state mentioned earlier and become trapped in that state so that they continuously contribute to the guidestar brightness; i.e. there is no loss to F’=1 once they reach that two-level state, neglecting collisions. Pumping at D2b resonance could be used to pump atoms out of the F’=1 ground state thereby increasing the number of atoms available for pumping at D2a and, presumably, increasing the number of atoms available for the two-level state and contribution to the guidestar brightness.

1818
18
Guidestar Radiance vs. Fasor wavelength scanbest result -- November 2005, V=5.1, 7000 ph/s/cm2
Circularly Polarized Linearly Polarized
D2b
D2b
D2aD2a
•approaches 5:3 ratio with lower power
~ 12:1 D2a:D2b
This slide shows the results of 8 scans of guidestar radiance vs. pump fasor wavelength in August, October, November and December of 2005. On the left the guidestar radiance corresponds to pumping with circular polarization and is given in photons/sec/cm2; the wavelength is given in nanometers. We believe the fasor atlaunch is about 80% circularly polarized but the polarization has not been measured at the output of the launch optics. The radiance plotted is at the “top of the telescope” or the value after attenuation by the atmosphere. Also shown in the figure is the fasor power out the fasor box and the V1 magnitude of the guidestar at the peak of the radiance curve. V1 is the V magnitude of the guidestar “above the atmosphere” (before atmospheric attenuation) corrected for the transmission of a normalized astronomical V filter with a FWHM of 78.5 nm mounted in front of the radiometry camera. Our maximum return to date is about 7000 photons/sec/cm2
obtained on November 16, 2005. Note this value was obtained with 30 watts of fasor power. We believe the variation in maximum return is mostly due to variations in column density and not saturation. The larger peak in each scan is the D2a line. The figure on the right shows the results for linear polarization. We believe the fasor was about 100 % linearly polarized but it has not been measured at the output of the launch telescope. The results for linear polarization are about 2 times lower than the results for circular polarization. We believe this is primarily due to atoms becoming trapped in F′= 1.

1919
19
Slope of Guidestar Radiance vs. Fasor Powerslope at zero power per watt – seasonal variation
column density is at seasonal maximum during Fall
typicalguidestar radiance110 ph/s/cm2/w
seasonal minimum
+\- 2x seasonal change from typical value
… don’t forget the 2x nightly variation
This slide gives an indication of the column density variation throughout the year with data taken in November of 2002, March and July of 2003, and August through December of 2005. The slopes at zero power from fits to linear and natural logarithm functions are plotted for circular and linear polarization. The error bars for many of the fits to linear functions (single parameter fits) were the size of the plotted symbol. The plot indicates we can expect about a factor of 2 increase in column density in November compared to July and agrees qualitatively with the lidar results of Hu and Gardner.

2020
20
Guidestar Radiance vs. Fasor Power – Dec 2005circular and linear polarization -- 75cm spot size in mesosphere
Circular PolarizationIsat = 4.2 mW/cm2
Linear PolarizationIsat = 2.1 mW/cm2
Dec 2005
Isat = 26 mW/cm2
May 2006
Isat = 16 mW/cm2
May 2006
Modeling: slopes for circular and linear polarizations are not the same until less than 0.01 mW/cm2
This slide shows the guidestar radiance vs. pump fasor power for circular and linear polarization on December 22, 2005. For these results the fasor was tuned to the peak of D2a. The plot shows a fit to a natural logarithm (ln) function. Our goal is to use the fits to determine the slope of the guidestar radiance vs. fasor power at zero power. This is related to the column density of the sodium in the mesosphere. The slope at zero power for circular polarization should equal the slope at zero power for linear polarization. Since they are not equal for the plots we feel not enough data was taken at low power. Another way to obtain the atomic response in the small-signal regime is to increase the spot size in the mesosphere. In the small-signal regime the atoms remain in thermal equilibrium in their lowest energy states.Note that the response for linear polarization saturates more than the response for circular polarization. We believe this is due to atoms decaying into F′=1 which shifts their absorption peak off the fasor line by 1.772 GHz. This causes them to become trapped in F′=1. Circular polarization tends to trap atoms in a pair of states where decay into F′=1 is forbidden by selection rules. This is called optical pumping and gives rise to greater guidestar radiance.The second scale converts the fasor power scale to mesospheric intensity. We determined the guidestar size in the mesosphere using multi-frame blind deconvolution of images taken with the fasor tuned to the peak of D2a. We saw no obvious correlation of image size with fasor power. The average FWHM of the fits to a Gaussian distribution for December 22, 2005 was 75.6 cm +/- 2.3 cm. Using this value the fasor power was converted to intensity by dividing by π w2 / 2 where w = FWHM / √(2 ln2). This produces the peak intensity of a Gaussian beam (I = (2 Pf / π w2) exp(-2 r2 / w2)), or a “top-hat” (uniform intensity profile) beam with a diameter equal to √2 w. The actual intensity distribution in the mesosphere probably exhibits some speckle due to atmospheric turbulence.
The saturation intensity for the upper plot was 4.2 +/- 1.7 mW/cm2 (2.1 +/-0.7 mW/cm2) for circular (linear) pump fasor polarization. The theoretical saturation intensity for the optically pumped pair of states is 6.4 mW/cm2. Again, linear polarization will not produce optical pumping. For a thermal distribution of atomic states the saturation intensity is about 10-20 mW/cm2. Thus, the low saturation intensity for circular polarization, and even lower value for linear polarization indicate some process like trapping in F′=1 or atomic recoil off the pump fasor line may be involved.
2121
21
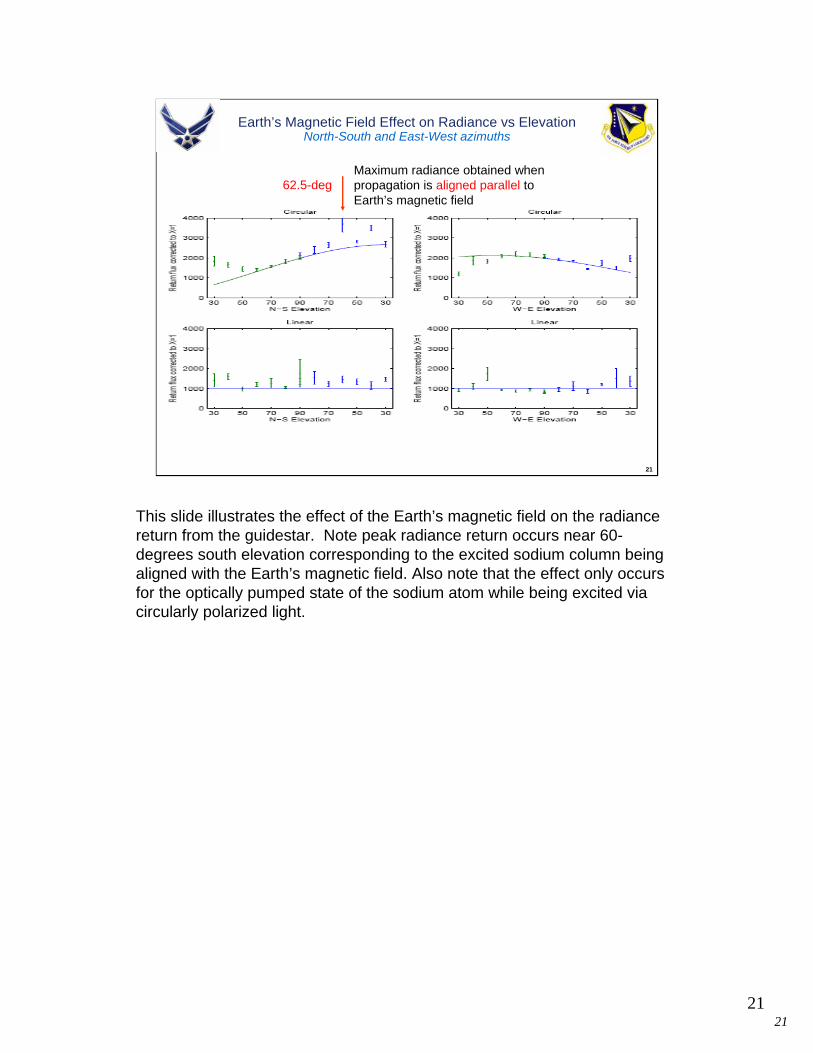
Earth’s Magnetic Field Effect on Radiance vs ElevationNorth-South and East-West azimuths
Maximum radiance obtained when propagation is aligned parallel to Earth’s magnetic field
62.5-deg
This slide illustrates the effect of the Earth’s magnetic field on the radiance return from the guidestar. Note peak radiance return occurs near 60-degrees south elevation corresponding to the excited sodium column being aligned with the Earth’s magnetic field. Also note that the effect only occurs for the optically pumped state of the sodium atom while being excited via circularly polarized light.
2222
22
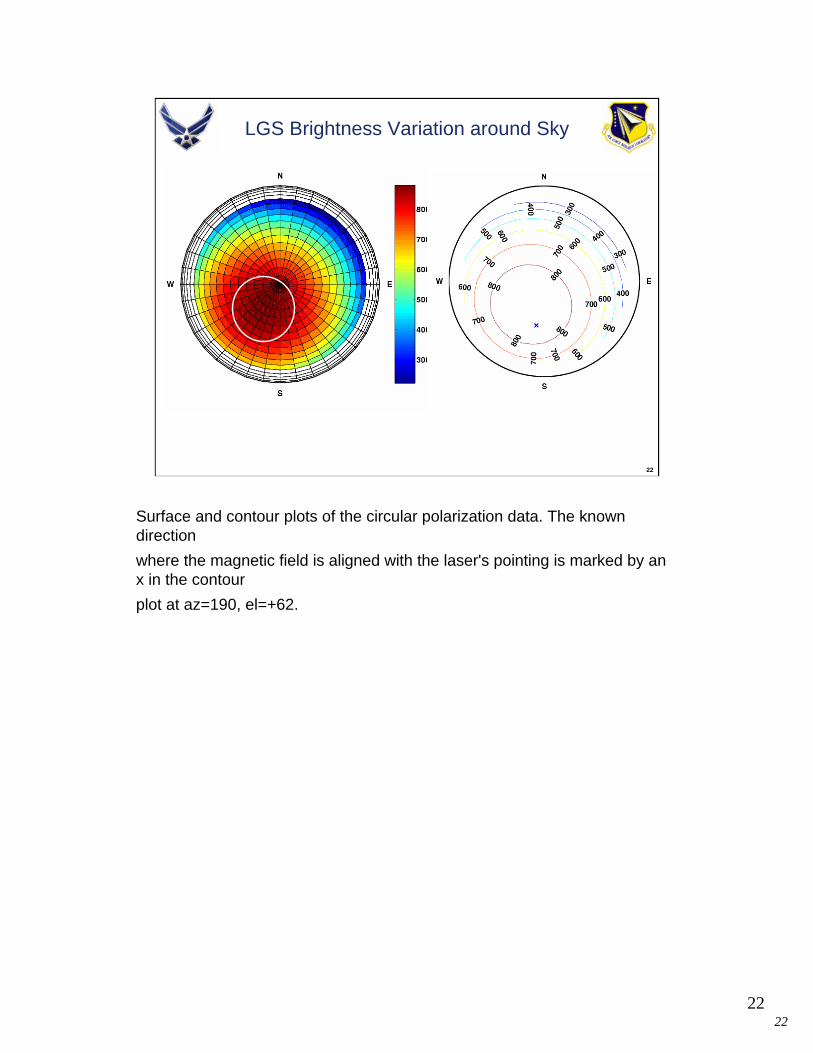
LGS Brightness Variation around Sky
Surface and contour plots of the circular polarization data. The known directionwhere the magnetic field is aligned with the laser's pointing is marked by an x in the contourplot at az=190, el=+62.

2323
23
Binary ADS 10871measured Strehl 0.03 at 850nm
850-nm images of binary star ADS 10871 (0.14 arc second separation) with tracking only, and tracking plus LGS AO operating at 500 Hz update rate. Exposure time was one second, elevation angle was 80 deg, and the Strehl ratio of the compensated image is 0.03; seeing conditions were unknown but the long term average for r0 at the SOR is 7.85 cm (500 nm at zenith).
2424
24
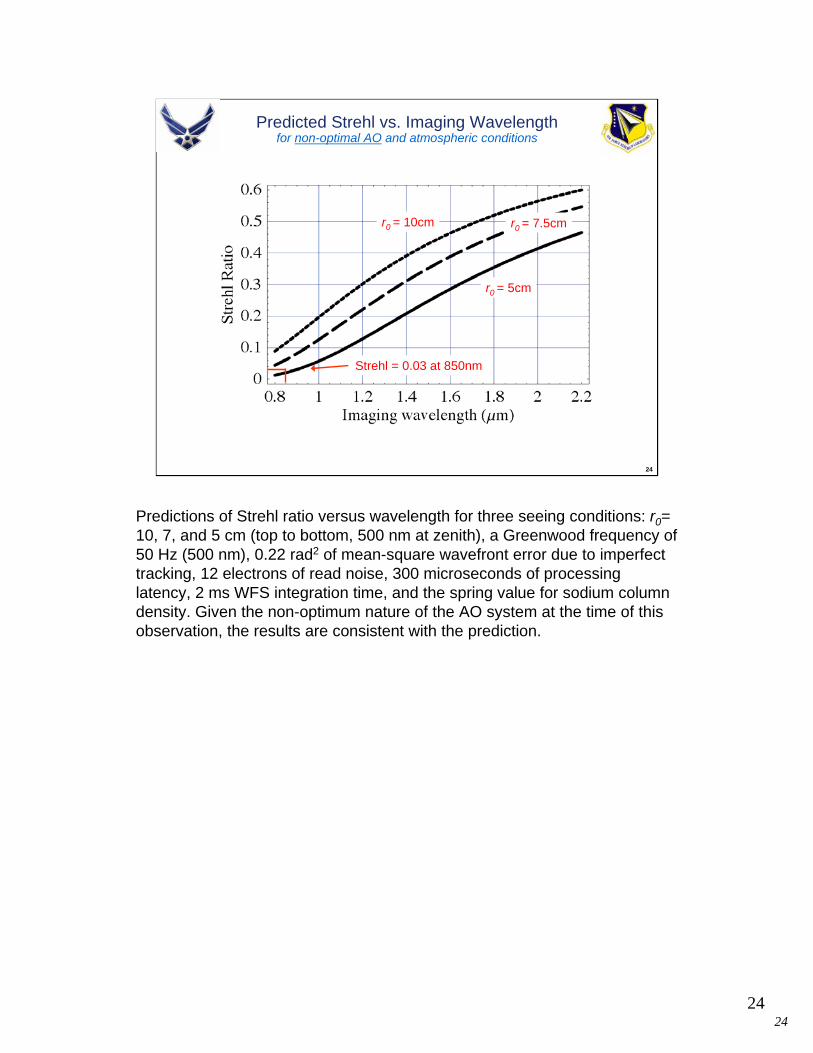
Predicted Strehl vs. Imaging Wavelengthfor non-optimal AO and atmospheric conditions
r0 = 10cm r0 = 7.5cm
r0 = 5cm
Strehl = 0.03 at 850nm
Predictions of Strehl ratio versus wavelength for three seeing conditions: r0= 10, 7, and 5 cm (top to bottom, 500 nm at zenith), a Greenwood frequency of 50 Hz (500 nm), 0.22 rad2 of mean-square wavefront error due to imperfect tracking, 12 electrons of read noise, 300 microseconds of processing latency, 2 ms WFS integration time, and the spring value for sodium column density. Given the non-optimum nature of the AO system at the time of this observation, the results are consistent with the prediction.

2525
25
Two-Frequency F = 2 Re-Pump Experiments
Photo by Robert FugatePhoto by Art Goodman
During September 17-28 2006, scientists at the Starfire Optical Range performed two-frequency guidestar excitation experiments to demonstrate enhanced radiance due to sodium atom re-pumping from the lower-to-upper groundstate. These experiments can be referred to as F’=1 groundstate “depopulation” or F’=2 groundstate “repopulation” pumping experiments. The primary guidestar pumping source is the 50-w fasor mounted to the 3.5-m telescope. It was always tuned to D2a transition resonance and powers were available up to 40 watts. The secondary guidestar pumping source was the 10-w fasor prototype system built in 2002 and used in the initial sky test campaigns (2002-2003) to characterize cw-pumped guidestars. This secondary fasor was placed within a laboratory 3-floors below the 3.5-m telescope and about 10-m offset. The secondary fasor exited through a port window from the side of the laboratory to a nearby beam director mirror where the beam was pointed straight up into the sky. The 3.5-m telescope was then used to point the 50-w fasor for best overlap of the two beams while aided with images from the Andor science camera. The 50-w fasor beam launch diameter is 20-cm FWHM and the 10-w fasor beam is 4-cm FWHM. Beam overlap was limited due to difference in launch diameters and atmospheric turbulence. Average spot size diameters in the mesosphere were measured as 1.5 and 2.0 arc seconds, approximately. The 10-w fasor was tuned to D2b transition resonance using reference to the 50-w fasor through measurement of the heterodyne beatnote and a wavemeter. A portion of the 50-w fasor was delivered to the 10-w fasor laboratory using a single-mode fiber and then combined with a portion of the 10-w fasor through a fiber-coupled beam splitter/combiner. The heterodyne beatnote was monitored using an rf spectrum analyzer and measurements were made to ~1-10MHz resolution.

2626
26
Beatnote Frequency Tuning
Radiance return from the two-frequency sodium guidestar as a function of frequency difference. In this example, the 50-w fasor is operating at 40 watts while centered at D2a and the 10-w fasor is operating at 10 watts near D2b resonance. The plot illustrates the frequency tuning of the 10-w fasor relative to the D2a fasor. Note that over 10,000 photons/s/cm2 were obtained.The figure is the measured guidestar radiance at the top of the telescope taking into account atmospheric transmission and a 78-nm wide V filter centered at 589nm as a function of the heterodyne beatnote frequency of a 40-w pump at D2a and a 10-w pump at D2b. The measured star magnitude of V1 = 4.7 is a record setting radiance for only 50 watts of total pump power, a radiance of 10,000 Ph/s/cm2. Note that the 1.70 GHz frequency beatnoteis not a measure of the groundstate splitting but instead a measure of the difference between the D2b resonance to the mean upper-level manifold of states to the spin polarized 2-state atom resonance obtained when pumping with circularly polarized light. The groundstate splitting difference is well established and is 1.772 GHz.
2727
27
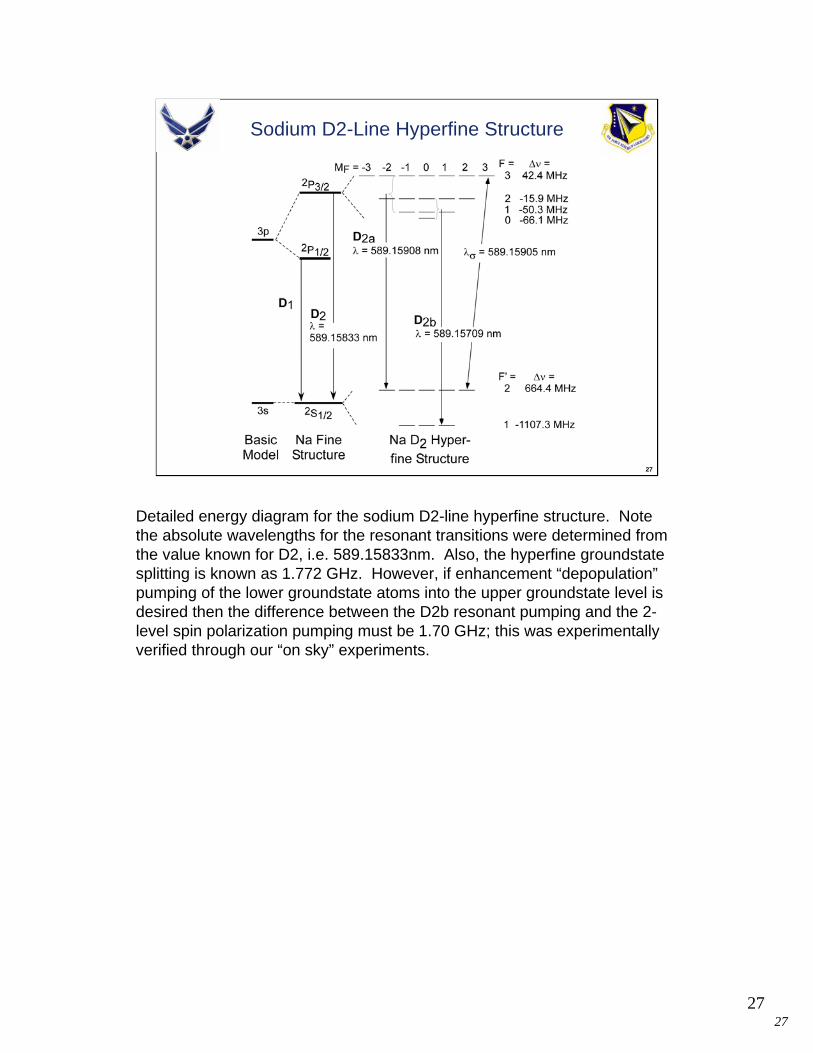
Sodium D2-Line Hyperfine Structure
Detailed energy diagram for the sodium D2-line hyperfine structure. Note the absolute wavelengths for the resonant transitions were determined from the value known for D2, i.e. 589.15833nm. Also, the hyperfine groundstatesplitting is known as 1.772 GHz. However, if enhancement “depopulation”pumping of the lower groundstate atoms into the upper groundstate level is desired then the difference between the D2b resonant pumping and the 2-level spin polarization pumping must be 1.70 GHz; this was experimentally verified through our “on sky” experiments.

2828
28
Radiance from D2a, D2b, and Overlap
This figure illustrates photon returns for D2b fasor alone (lower red curve), D2a fasor alone (solid blue curve and circle data points), and return for combined beams of varying powers of the D2b fasor versus the D2a fasor power.

2929
29
Functional Form for Overlap Radiance
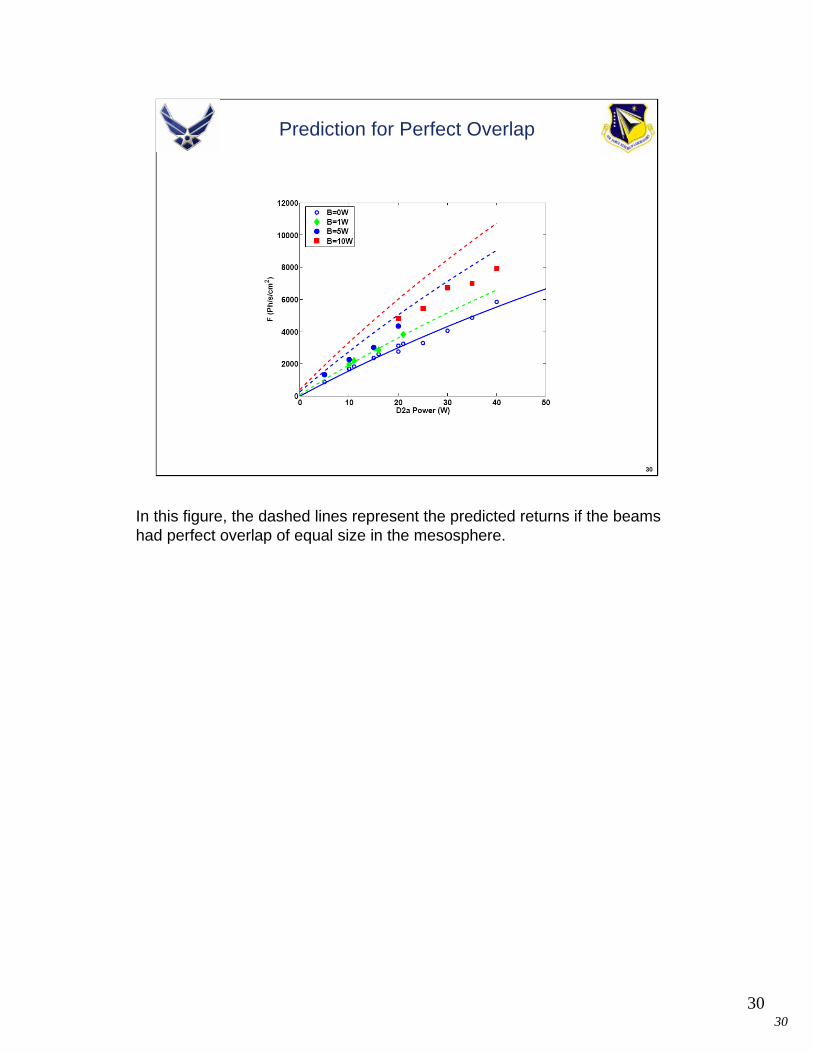
The functional form for the enhanced radiance (the overlapped portion of the two beams) was obtained and plotted. It was determined that theenhancement was directly proportional to the overlap integral of the product of the Gaussians of the beam tuned to D2a and D2b. The total radiance is then the sum of the contribution from D2a pumping plus the contribution from D2b pumping plus the contribution from the overlap; FA + FB + FAB.
3030
30
Prediction for Perfect Overlap
In this figure, the dashed lines represent the predicted returns if the beams had perfect overlap of equal size in the mesosphere.
3131
31
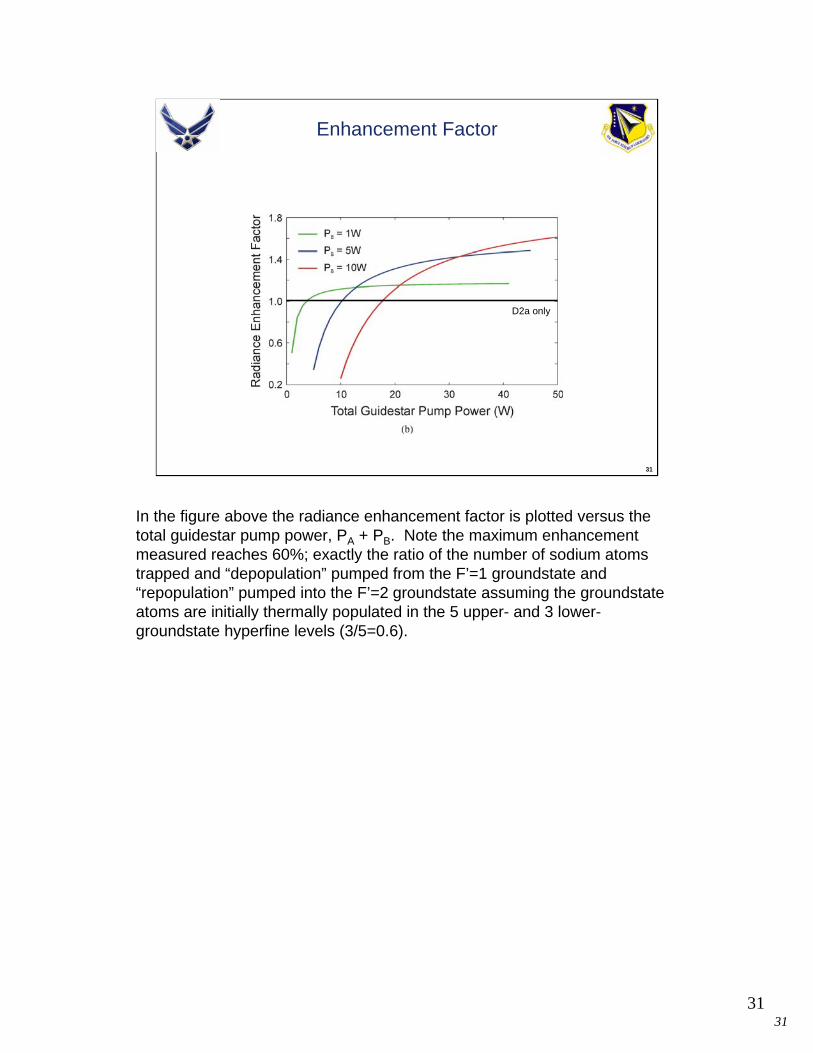
Enhancement Factor
D2a only
In the figure above the radiance enhancement factor is plotted versus the total guidestar pump power, PA + PB. Note the maximum enhancement measured reaches 60%; exactly the ratio of the number of sodium atoms trapped and “depopulation” pumped from the F’=1 groundstate and “repopulation” pumped into the F’=2 groundstate assuming the groundstateatoms are initially thermally populated in the 5 upper- and 3 lower-groundstate hyperfine levels (3/5=0.6).

3232
32
Perfect Overlap Performance
The figure above represents the “thought” experiment for the design of the optimal two-frequency fasor for sodium guidestar excitation. Radiance is plotted as a function of the total pump power and the legend shows the curves for various D2b pump power, PB. For PB=0, this curve is for pumping at D2a only. While the other curves are for different D2b pumping levels with the D2a pump power being determined by PT-PB=PA. Note that for D2a pump powers of 30 watts or less, optimal guidestar radiance efficiency is obtained using only 5 watts at D2b; however, if a D2a fasor of 50 watts or more is designed then a supplemental D2b pump power of 10 watts would optimize the radiance return efficiency.

3333
33
Conclusions
High Power Injection Lasers– 1064nm -- 80-100 watt, M2<1.1– 1319nm -- record power levels achieved -- 60 watts, M2<1.1
Sum Frequency Generation– 589nm -- operational power levels available “out the box” -- 50 watts, M2=1 – 589 nm linewidth <10 kHz– current system has 14% loss from SFG to “out of the box” (58 watts out of SFG)
50 Watt Facility-Class Laser– fully-automated operation, computer-assisted PLL locking– capable of testing fast switching on and off the sodium resonance– wavelength calibration to sodium vapor cell – wavelength measurements to accuracy of 60 femtometers (±0.00003nm, ±25MHz)
Sodium Guidestar– max. photon return measured – 7000 photons/cm2/sec – pumping at D2a only– D2a pump V=5.1 guidestar magnitude– circularly polarized light yields ~ 2x more photon return– Earth’s magnetic field affects radiance by ~2x variation across sky– guidestar radiance may be saturated by atoms trapped in F = 1
Two-Frequency Re-Pump Experiments– re-pump of atoms to F = 2 using second frequency demonstrated up to 60% enhancement– 40w D2a and 10w D2b pump V = 4.7 guidestar magnitude – over 10,000 Ph/s/cm2
This slide shows the primary conclusions of our work to date. Other notable results include producing 60 watts of single frequency 1319nm power, 100 watts of single frequency 1064nm power, and 50 watts of single frequency 589nm power.
Sodium guidestars are needed on all telescopes whose diameter is greater than about 2 meters. For astronomical imaging, only 150-300 photons/cm2/s are required. There are about 15 telescopes world wide with diameters greater than or equal to 8 meters. For multiconjugate adaptive optics 5 lasers per 8-meter telescope may be needed.
Mesospheric sodium guidestar radiance has been plotted vs. wavelength, fasor power, fasor polarization and date. Peak radiance for circular polarization was about 7000 photons/sec/cm2 (V1 magnitude = 5.1) for 30 watts of pump power in November of 2005. Pumping with circular polarization at high power produces about 2 times more return than linear polarization. Guidestar radiance may be saturated by atoms becoming trapped in F’=1 groundstate, and atomic recoil.
Two-frequency “depopulation” pumping experiments were performed through “on sky”guidestar radiance measurements yielding a 60% radiance enhancement. The radiance returns measured for a 40-w D2a pump with a 10-w D2b pump resulted in a 4.7 guidestar magnitude at approx. 10,000 Ph/s/cm2.