Denitrification of Anthropogenic Nitrogen in Groundwater ...
188
Denitrification of Anthropogenic Nitrogen in Groundwater: Measurement and Modeling Using Stable Isotopic and Mass Balance Approaches by Wendy Jeanne Pabich B.A., Geography (1988) Dartmouth College M.S., Geology (1995) Duke University M.S., Urban Studies and Planning (1995) Massachusetts Institute of Technology Submitted to the Department of Civil and Environmental Engineering in Partial Fulfillment of the Requirements for the Degree of Doctor of Philosophy in Environmental Engineering at the Massachusetts Institute of Technology February 2001 0 2001 Massachusetts Institute of Technology Signature of Author Z7' Department of Civil and Environmental Engineering October 31, 2000 Certified by Harold F. Hemond Professor of Civil and Environmental Engineering Thesis Supervisor Accepted by Oral Buyukozturk Chai an, Department Committee on Graduate Students MASSACHUSETTS INSTITUTE OF TECHNOLOGY ENG FEB 2 2 2001 LIBRARIES
Transcript of Denitrification of Anthropogenic Nitrogen in Groundwater ...
Denitrification of Anthropogenic Nitrogen in Groundwater:Measurement and Modeling Using Stable Isotopic and Mass
Balance Approaches
by
Wendy Jeanne Pabich
B.A., Geography (1988)Dartmouth College
M.S., Geology (1995)Duke University
M.S., Urban Studies and Planning (1995)Massachusetts Institute of Technology
Submitted to the Department of Civil and Environmental Engineeringin Partial Fulfillment of the Requirements for the Degree of
Doctor of Philosophy in Environmental Engineering
at the
Massachusetts Institute of Technology
February 2001
0 2001 Massachusetts Institute of Technology
Signature ofAuthor
Z7' Department of Civil and Environmental EngineeringOctober 31, 2000
Certified byHarold F. Hemond
Professor of Civil and Environmental EngineeringThesis Supervisor
Accepted byOral Buyukozturk
Chai an, Department Committee on Graduate Students
MASSACHUSETTS INSTITUTEOF TECHNOLOGY ENG
FEB 2 2 2001
LIBRARIES

a
Denitrification of Anthropogenic Nitrogen in Groundwater:Measurement and Modeling Using Stable Isotopic and Mass Balance
Approaches
by Wendy Jeanne Pabich
Submitted to the Department of Civil and Environmental Engineeringon October 31, 2000, in Partial Fulfillment of the Requirements for the Degree of
Doctor of Philosophy in Environmental Engineering
ABSTRACT
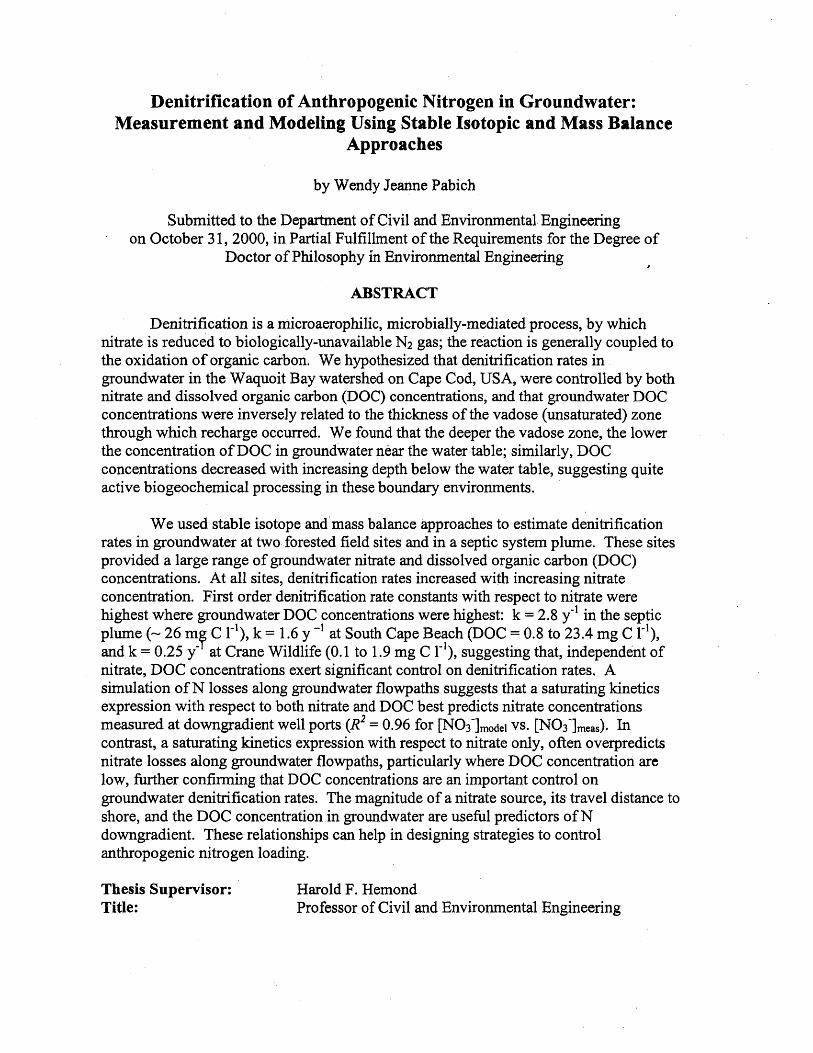
Denitrification is a microaerophilic, microbially-mediated process, by whichnitrate is reduced to biologically-unavailable N2 gas; the reaction is generally coupled tothe oxidation of organic carbon. We hypothesized that denitrification rates ingroundwater in the Waquoit Bay watershed on Cape Cod, USA, were controlled by bothnitrate and dissolved organic carbon (DOC) concentrations, and that groundwater DOCconcentrations were inversely related to the thickness of the vadose (unsaturated) zonethrough which recharge occurred. We found that the deeper the vadose zone, the lowerthe concentration of DOC in groundwater near the water table; similarly, DOCconcentrations decreased with increasing depth below the water table, suggesting quiteactive biogeochemical processing in these boundary environments.
We used stable isotope and mass balance approaches to estimate denitrificationrates in groundwater at two forested field sites and in a septic system plume. These sitesprovided a large range of groundwater nitrate and dissolved organic carbon (DOC)concentrations. At all sites, denitrification rates increased with increasing nitrateconcentration. First order denitrification rate constants with respect to nitrate werehighest where groundwater DOC concentrations were highest: k = 2.8 y-1 in the septicplume (~ 26 mf C 1-1), k = 1.6 y ~' at South Cape Beach (DOC = 0.8 to 23.4 mg C 1~1),and k = 0.25 y at Crane Wildlife (0.1 to 1.9 mg C 1-), suggesting that, independent ofnitrate, DOC concentrations exert significant control on denitrification rates. Asimulation of N losses along groundwater flowpaths suggests that a saturating kineticsexpression with respect to both nitrate and DOC best predicts nitrate concentrationsmeasured at downgradient well ports (R2 = 0.96 for [NO3]model vs. [NC 3 imeas). Incontrast, a saturating kinetics expression with respect to nitrate only, often overpredictsnitrate losses along groundwater flowpaths, particularly where DOC concentration arelow, further confirming that DOC concentrations are an important control ongroundwater denitrification rates. The magnitude of a nitrate source, its travel distance toshore, and the DOC concentration in groundwater are useful predictors of Ndowngradient. These relationships can help in designing strategies to controlanthropogenic nitrogen loading.
Thesis Supervisor: Harold F. HemondTitle: Professor of Civil and Environmental Engineering

+
ACKNOWLEDGMENTSI am thankful for the many people who provided support, encouragement, and
advice during the course of this project. I appreciate the time and efforts of mycommittee: Harry Hemond, Ivan Valiela, and Penny Chisholm. Many thanks go to myadvisor, Harry Hemond, who not only supported my predilection for understandingenvironmental problems in a holistic manner, but also pushed me to develop rigorousanalytical skills and to get my hands dirty in the lab. I am certain these skills will serveme well in the future. I thank him immensely.
Ivan Valiela, at the Boston University Marine Lab opened his laboratory to meand introduced me to the world of "nitrogen loading". His became a second advisor,working closely with me to formulate a dissertation topic, implement a field program,and produce this document. He taught me much about statistics and presented theviewpoint of an ecologist. I can't thank him enough for all his support.
Penny Chisholm provided helpful comments on my thesis, and also stands as aninspiring role model as a successful woman in science.
I am indebted to all the people who provided me with technical assistance. JohnMcFarland helped with DOC analysis. Three MIT UROPs, Vanessa Bhark, AlyssaThorvaldsen, and Amy Watson helped me perform lab work. In Woods Hole, GabbyTomasky and Erica Stieve helped me in the field, and Jim McClelland taught me how toprocess samples for stable isotope analysis; Dave Senn helped me install wells; KevinKroeger and Liz Westgate collected and analyzed samples from my septic system site;and Kathy Regan and Anne Giblin, of MBL, enabled me to analyze nitrate samples.Denis Leblanc at USGS assisted me tremendously in allowing me access to the CraneWildlife Reserve Site, showing me how to construct multi-level samplers, installing wellsfor me, and inviting me to research meetings. Thanks go to Sheila Frankel for a bootcamp experience teaching environmental chemistry lab skills to undergraduates, as wellas for her general support and friendship.
I am grateful for the community offered by MIT. The companionship, support,entertainment, and discussions, both scientific and irrelevant, provided by all my friendsin the Hemond research group, at the Parsons Lab, and in Woods Hole, have made this avery special experience.
Lastly, I thank my great friends, especially the North Shore contingent, forproviding endless entertainment, outrageous athletic and other endeavors, trips to themountains, heart-to-heart discussion, and for keeping me sane during this process. Iespecially thank Tim and Abby for opening their home and their hearts to me, and mostof all, my parents, Diane and Dick, who instilled in me a love of learning, and my family,David, Heather, Jill, Eric, Jeanne, Lenore, Lisa, Irene and Mort for their love and supportduring a seemingly never-ending career as a graduate student.
5
Table of Contents
LIST OF TABLES 9
LIST OF FIGURES 10
CHAPTER 1. Introduction 131. Anthropogenic nitrogen and eutrophication 142. Transformations of nitrogen within aquifers 153. Denitrification 164. Study goals 185. References 23
CHAPTER 2. The effect of vadose zone thicknessand depth below the water table on DOC concentrationin groundwater on Cape Cod, U.S.A. 29Abstract 311. Introduction 322. Materials and methods 34
2.1. Study site 342.2. Groundwater sample collection and analysis 35
3. Results and discussion 364. Acknowledgments 475. References 48
CHAPTER 3. Denitrification rates in groundwater,Cape Cod, U.S.A.: Control by nitrate and dissolvedorganic carbon concentrations. 52Abstract 541. Introduction 552. Approach 573. Nitrogen isotope geochemistry 584. Study sites 595. Methods 63
5.1. Groundwater sample collection 635.2. Chemical analysis 63
6. Modeling framework and assumptions 656.1. Steady state conditions 686.2. Estimating groundwater age (t) 686.3. Rayleigh rarameters and assumptions 76
6.3.1. Soil-derived C5N sourcesignatures at Crane WildlifeManagement Area 80
6
Table of Contents (cont.)
6.3.2. Fertilizer-derived615N-Ammonium sourcesignature at Crane WildlifeManagement Area 83
6.3.3. Fertilizer-derived 6"N-Nitratesource signature at Crane WildlifeManagement Area 84
6.3.4. Soil-derived 3'5N sourcesignatures at South Cape Beach 85
6.3.5. Isotopic enrichment factor fornitrification (eSit) 88
6.3.6. Isotopic enrichment factor fordenitrification (8d.fit) 88
7. Results and discussion 887.1. Crane Wildlife Management Area 88
7.1.1. Geochemistry 887.1.2. Nitrification 977.1.3. 'Apparent 51NO3" model 997.1.4. Denitrification 100
7.2. South Cape Beach 1107.2.1. Geochemistry 1107.2.2. Nitrification 1147.2.3. Denitrification 114
7.3. Sensitivity analysis 1188. Conclusions 1249. Acknowledgements 12710. References 128
CHAPTER 4. Fate of nitrogen from a septic system in anearshore Cape Cod aquifer 135
1. Introduction 1362. Fate of anthropogenic nitrogen in a nearshore Cape Cod
aquifer 1383. Denitrification rates in groundwater containing septic
effluent 1454. Conclusions 1495. References 150
7.
Table of Contents (cont.)
CHAPTER 5: An empirical model to predict groundwaterdenitrification rates, Cape Cod, USA: Substrate limitationby DOC and N0 3~ 151Abstract 1531. Introduction 1542. Saturating Kinetics 156
2.1. Assumption of steady state 1583. Model parameterization 159
3.1. Half-saturation constants for nitrate (KNo3)and DOC (KDoc) 159
3.2. Denitrifying bacterial population 1623.3. Maximum bacterial growth rate (pga) 1663.4. Bacterial yield constant (Y) 166
4. Results and discussion 1685. Acknowledgements 1756. References 176
CHAPTER 6: Conclusions 1821. Conclusions 1832. Controls on groundwater DOC concentrations 1843. Groundwater denitrification rates 1854. Modeling of denitrification using a saturating
kinetics expression 1865. References 188
8
List of Tables
Table 2.1. Analysis of variance for multiple regression of effectof depth below table (Dw) and vadose thickness (Tvad)on DOC concentration. 39
Table 3.1. Vogel groundwater age model. 69Table 3.2. Nitrification model. 70Table 3.3. Rayleigh product formation model. 71Table 3.4. 'Apparent 615N03' model. 72Table 3.5. Denitrification model. 73Table 3.6. Comparison of spatial and temporal variability in
groundwater chemistry at South Cape Beach. 75Table 3.7. Groundwater age and horizontal distance to
upgradient recharge point for Crane WildlifeManagement Area wells. 93
Table 3. 9. First order rate constants for denitrification ingroundwater at three field sites increase with increasingDOC concentration. 117
Table 5.1. Parameters and values used in saturating kineticsmodel for denitrification. 165
Table 5.2. Estimated values for maximum growth rate (ym.)and yield constant (1) from the literature, andfrom our thermodynamic calculations for Y 167
9

List of Figures
2.1. Mean DOC concentration measured at 12 sampling stationsat South Cape Beach on 5 sampling dates between March andAugust 1998. 38
2.2. DOC concentration as a function of depth below water tablefor each of three vadose thickness (T,,d) strata. 40
2.3. DOC concentration plotted as a function of depth below watertable for each of three vadose thickness (Tvad) strata. 42
2.4. Instantaneous DOC loss rate as a function of depth belowwater table for each of three vadose thickness (Tvad) strata. 44
2.5. DOC concentrations in groundwater as a function of depth. 453.1. Location of Crane Wildlife Management Area, South Cape
Beach, and septic system study sites in and near the WaquoitBay watershed, Cape Cod, MA. 60
3.2. Schematic of multi-level sampling wells arranged in a transectParallel to groundwater flow lines at Crane WildlifeManagement Area. 64
3.3. Stable isotope method for calculating average denitrification ratesbetween recharge and point of sampling for each water samplecollected at Crane Wildlife Management Area. 67
3.4. Temporal variability in groundwater chemistry at Crane WildlifeManagement Area. 74
3.5. Pathways by which fertilizer-derived nitrate and ammonium atCrane Wildlife Management Area are delivered to the water table. 77
3.6. Pathways by which soil-derived nitrate and ammonium at CraneWildlife Management Area are delivered to the water table. 78
3.7. Pathways by which soil-derived nitrate and ammonium at SouthCape Beach are delivered to the water table. 79
3.8. Estimation Of 6(5NO3 source and 515NH4+sourcevalues for soil-derived N at Crane Wildlife Management Area. 81
3.9. Frequency plots of measured 615NOi at Crane WildlifeManagement Area and South Cape Beach. 86
3.10. Profiles of dissolved oxygen, DOC, and ammonium with depthbelow water table (Dw) at Crane Wildlife Management Area. 89
3.11. Profiles of nitrate and 615N with depth below water table (D.,) atCrane Wildlife Management Area. 90
3.12. Recharge zones for 3 wells at Crane Wildlife Management Area. 943.13. Schematic of multi-level sampling (MLS) well transect parallel
to groundwater flow lines at Crane Wildlife Management Area. 953.14. 5N of nitrate measured at Crane Wildlife Management Area for
fertilizer-derived and soil-derived nitrate. 101
10
List of Figures (cont.)
3.15. Average denitrification rate versus initial nitrate concentration fortwo forested sites (South Cape Beach and Crane Wildlife), andfor a septic plume. 104
3.16. Denitrification rates decrease with increasing depth below thewater table (Dw) for soil-derived nitrate samples at CraneWildlife Management Area. 107
3.17. Lineweaver-Burke plot using fertilizer-derived nitrate samplesat Crane Wildlife to derive saturating kinetics parameters. 109
3.18. Results of simulation predicting nitrate concentration atdowngradient well port ([NO3]m.I) using a first order rateexpression vs. nitrate concentration measured at that well port([N3Imm..).11
3.19. Results of simulation predicting nitrate concentrations atdowngradient well ports ([NO 3I]mi) using averagedenitrification rates over the flowpaths (calculated fromboth initial and final nitrate concentrations) vs. nitrateconcentrations measured at those well ports ([NOim..). 112
3.20. Results of simulation predicting nitrate concentrations atdowngradient well ports ([NO3imMw) using saturating kineticsexpression with respect to nitrate versus nitrate concentrationsmeasured at those well ports ([N0 3 ]m..). 113
3.21. Results of sensitivity analysis of denitrification model forsoil-derived nitrate. 119
3.22. Results of sensitivity analysis of denitrification model forfertilizer-derived nitrate. 120
4.1. Vertical cross section from the soil surface, water table, andaquifer through our field of multiple sampling wells 143(elevation relative to mean low water (MLW)).
4.2. N0 3 concentration versus B concentration for samplescollected from upper, middle, and lower plumes; N0 3concentration versus K concentration for all three plumes;N0 3 concentration versus age for upper and middle plumes;B concentration versus age for upper and middle plumes;N0 3 to B ratio versus age for upper and middle plumes;and % Loss of NO3 versus age for upper and middle plumes. 144
4.3. Denitrification rates in groundwater containing septic effluentas a function of calculated initial nitrate concentrationcorrected for dilution. 146
4.4. Dissolved organic carbon concentrations (DOC) ingroundwater as a function of septic system plume age. 147
11
List of Figures (cont.)
5.1. Lineweaver-Burke plot fbr forested sites used to estimatethe half-saturation constant for denitrification withrespect to nitrate (KNO3) and the maximum denitrificationrate (Vmax). 160
5.2. Lineweaver-Burke plot for septic system site used toestimate the half-saturation constant for denitrification withrespect to nitrate (KNO3) and the maximum denitrificationrate (Vax). 161
5.3. Denitrifying bacteria as a percentage of total bacterialpopulation versus groundwater nitrate concentrationmeasured in 3 Swedish aquifers. 164
5.4. Nitrate losses by denitrification simulated over groundwaterflowpaths using a saturating kinetics expression withrespect to nitrate and dissolved organic carbon (DOC). 171
5.5. Nitrate losses by denitrification simulated over groundwaterflowpaths using a saturating kinetics expression withrespect to nitrate. 173
12

CHAPTER 1:
INTRODUCTION
13
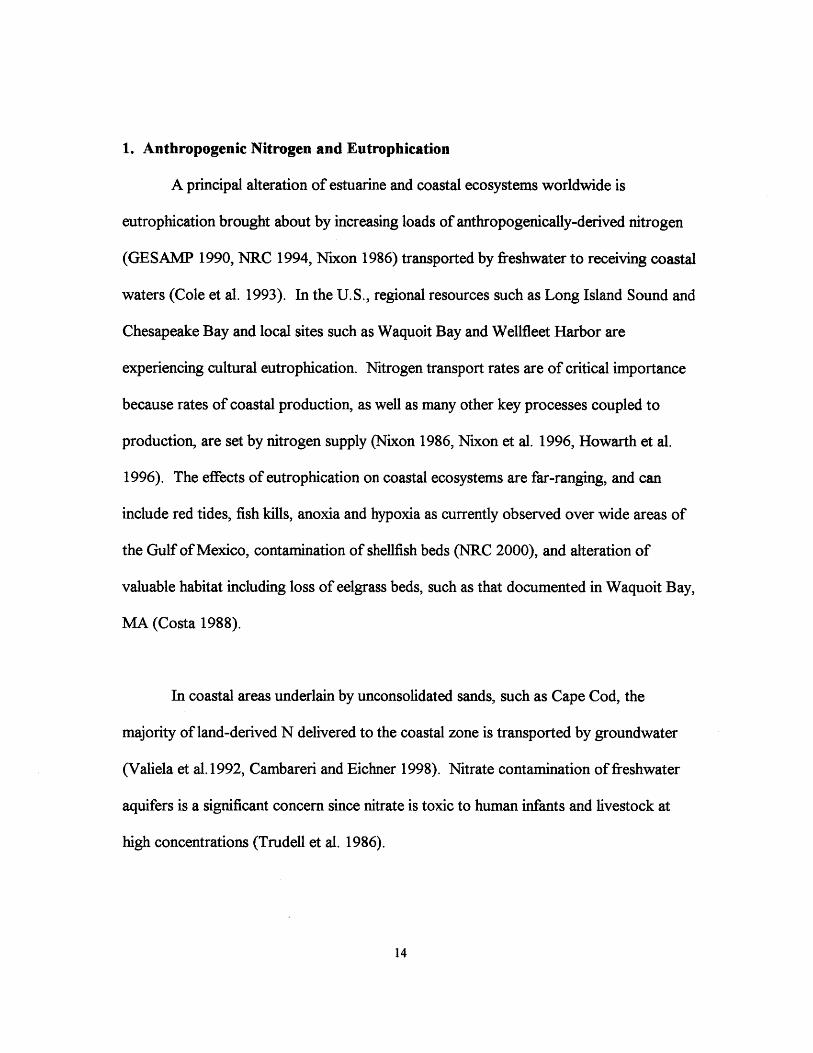
1. Anthropogenic Nitrogen and Eutrophication
A principal alteration of estuarine and coastal ecosystems worldwide is
eutrophication brought about by increasing loads of anthropogenically-derived nitrogen
(GESAMP 1990, NRC 1994, Nixon 1986) transported by freshwater to receiving coastal
waters (Cole et al. 1993). In the U.S., regional resources such as Long Island Sound and
Chesapeake Bay and local sites such as Waquoit Bay and Wellfleet Harbor are
experiencing cultural eutrophication. Nitrogen transport rates are of critical importance
because rates of coastal production, as well as many other key processes coupled to
production, are set by nitrogen supply (Nixon 1986, Nixon et al. 1996, Howarth et al.
1996). The effects of eutrophication on coastal ecosystems are far-ranging, and can
include red tides, fish kills, anoxia and hypoxia as currently observed over wide areas of
the Gulf of Mexico, contamination of shellfish beds (NRC 2000), and alteration of
valuable habitat including loss of eelgrass beds, such as that documented in Waquoit Bay,
MA (Costa 1988).
In coastal areas underlain by unconsolidated sands, such as Cape Cod, the
majority of land-derived N delivered to the coastal zone is transported by groundwater
(Valiela et al. 1992, Cambareri and Eichner 1998). Nitrate contamination of freshwater
aquifers is a significant concern since nitrate is toxic to human infants and livestock at
high concentrations (Trudell et al. 1986).
14
Anthropogenic sources of nitrate to groundwater aquifers and coastal systems
have increased dramatically, particularly over the last 40 years, with the greatest fluxes of
N associated with areas of highest population density. Human activity has increased the
flux of nitrogen in the Mississippi River approximately 4-fold, in the rivers of the
northeastern United States 8-fold, and in the rivers draining the North Sea more than 10-
fold (NRC 2000). The dominant sources of anthropogenic nitrogen are fertilizers,
accounting for more than half of the human alteration of the nitrogen cycle (Vitousek et
al. 1997); atmospheric deposition of NO. from fossil fuel combustion, animal feed lots
and other agricultural sources, which have increased more than 8-fold over pre-industrial
levels (Holland et al. 1999); wastewater, which contributes 12% of the flux of nitrogen
from the North Atlantic landscape to the North Atlantic Ocean (Howarth et al. 1996); and
non-point sources (NRC 1993).
2. Transformations of Nitrogen within Aquifers
Understanding how N is transformed and transported within aquifers is necessary
to calculating watershed N budgets, understanding basic nitrogen biogeochemistry, and
estimating total N delivery to coastal waters. Previous mass balance data suggests that
significant losses of N can occur within watersheds and aquifers (Lee and Olson 1985,
Valiela at al. 1992, Valiela and Costa 1988, Weiskel and Howes 1992). Processes
capable of attenuating mobile N include dilution, adsorption and incorporation in soils
and forest biomass, assimilatory reduction into microbial biomass, dissimilatory nitrate
reduction to (sorbable) ammonium (DNRA), and denitrification (Korom 1992). Of these
15
processes, only denitrification is effectively a permanent sink for biologically available
nitrogen, and is hypothesized to be the most significant sink for N in aquifers (Peterjohn
and Correll 1984, Valiela et al. 2000).
3. Denitrification
Denitrification, which converts biologically available nitrate to essentially inert
N2 (and small amounts of N20) is a microbially-mediated process that uses N0 3-as an
electron acceptor:
5CH 20+4NO3~+4H+ ---> 2N2 +5CO 2 +7 H2 0
where organic carbon is represented as a simplified carbohydrate, CH20. Several
conditions must be met for denitrification to occur, including a viable population of
denitrifying bacteria, sufficient concentration of N oxides (NO3, NO2, NO and N 20) as
terminal e~ receptors, available and suitable e~ donors (e.g. primarily dissolved organic
matter, but also compounds such as reduced manganese (Mn2 +), ferrous iron (Fe2+) or
sulfides, and anaerobic conditions or restricted 02 availability (Firestone 1982). Rates of
denitrification are thought to be governed by the supply of nitrate and carbon compounds,
while suppressed by dissolved oxygen (Tiedje et al. 1982, Keeney 1986).
Some authors have argued that due to the aerobic nature of aquifers and the lack
of suitable concentrations of labile organic substrates (Fisher 1977, Mulholland 1981),
denitrification is unlikely. However, numerous studies suggest that denitrification occurs
16
in soils (Parkin 1987, Parkin and Robinson 1989, Christensen et al. 1990a, Christensen et
al. 1990b, van Kessel et al. 1993, Groffman 1991, Groffman et l. 1996, Groffman and
Tiedje 1989) and shallow groundwater (Jacinthe et al. 1998) in anaerobic "hotspots"
within otherwise oxygenated waters. The existence of heterotrophic bacteria (T.
pantotropha, Robertson et al. 1988, Dalsgaard et al. 1995; Alcaligenes sp., Krul 1976),
and activated sewage sludge (Muller et al. 1995) capable of simultaneous heterotrophic
nitrification and aerobic denitrification suggests another means by which denitrification
in aerobic aquifers is plausible. In addition, denitrification (-28.4 kcal equiv -1) is almost
as energetically favorable as aerobic respiration (-29.9 kcal equiv -1); therefore, it seems
likely that organisms capable of exploiting this niche exist in groundwater. Finally,
recent work suggests that there may be more organic matter in groundwater (0.7-27 mg
DOC 1, Ford and Naiman 1989, Fiebig et al. 1990, Fiebig 1995) than was previously
thought to occur, providing a source of electron donors for denitrification in groundwater.
Many papers use mass balance methods to argue that significant losses of nitrogen
by microbially-mediated denitrification occur in aquifers (Bengtsson and Annadotter
1989, Bottcher et al. 1990, Bragan et al. 1997a, Bragan et al. 1997b, Clay et al. 1996,
Gillham 1991, Gold et al. 1998, Groffiman et al. 1996, Jacinthe et al. 1998, Korom 1992,
Peterjohn and Correll 1984, Valiela et al. 1992, Valiela et al. 2000, Verchot et al. 1997).
Convincing evidence for denitrification in groundwater includes experimental injections
in which N0 3- disappears downgradient faster than conservative tracers, and in which the
loss of N03- is accompanied by increases in bicarbonate believed to be derived from
17
carbon mineralization associated with microbial denitrification (Korom 1991, Trudell et
al. 1986). Other evidence suggests that changes in the ratio of N isotopes (lSN/ 4N) in
ambient N0 3 or in injections of isotopically-enriched tracers, and/or changes in the
concentration of N2, derive from denitrification in groundwater (Fustec et al. 1991,
Mariotti et al. 1988, Smith et al. 1991, Vogel et al. 1981).
Rates of denitrification reported in the literature vary over several orders of
magnitude (.004 to 1.05 mg N kg 1 dry sediment per day in laboratory core incubations;
0.04 to 2.17 pM h7' in aquifers containing N derived from agriculture, Korom 1992), and
likely reflect both the variability in biogeochemical conditions across aquifer settings and
differing experimental approaches. Denitrification rates measured in controlled
laboratory experiments have been modeled using the Michaelis-Menten enzyme kinetic
equation with respect to nitrate concentration (Engberg and Schroeder 1975), and as a
first-order function of organic carbon substrate (Brenner and Argamann 1990). It is our
hypothesis that denitrification rates vary systematically with nitrate and DOC
concentrations in groundwater.
4. Study Goals
The goal of this study was to estimate groundwater denitrification rates in the
Waquoit Bay aquifer on Cape Cod, to examine how they vary as a function of nitrate and
DOC concentrations, and to construct a predictive model that might be used to assess
groundwater denitrification rates across the range of geochemical conditions present in
18
this aquifer. Waquoit Bay, a shallow estuary located on the southwest coast of Cape Cod,
Massachusetts, is experiencing increasing eutrophication from anthropogenic nitrogen.
Nitrogen loads to this system have been measured and modeled as function of land use
patterns in the watershed (Nitrogen Loading Model, NLM, Valiela et al. 1997, Valiela et
al. 2000), and consist primarily of wastewater (50%), fertilizer (17%), and atmospheric
deposition. In NLM, a constant fraction of N reaching the water table (35%) is assumed
to be lost by denitrification during transport through the underlying aquifer en route to
Waquoit Bay.
Nitrate reduction rates, however, are likely to vary as a function of both electron
donor and nitrate concentrations; N loss rates in groundwater, therefore, should be
modeled to reflect variable chemical conditions. On Cape Cod, measured groundwater
nitrate concentrations vary by several orders of magnitude. Concentrations in
groundwater range from 0 to 2.7 pM beneath forested areas (Seely 1997), from < 1 to -
1,000 pM in the suburban subwatersheds of Waquoit Bay (Valiela et al. 2000) and
around a pond in a residential area (Kroeger et al 1999), up to 1,800 pM within the
Massachusetts Military Reservation wastewater plume (Savoie and LeBlanc 1998), and
as high as 4,300 VM in close proximity to a septic tank (our unpublished data).
Denitrification rates within this Cape Cod aquifer are likely to be similarly variable.
In this thesis, we investigated the controls on DOC fluxes $o groundwater (Ch. 2).
We hypothesized that 1) groundwater DOC concentrations decrease as the thickness of
19
the vadose zone (Ta,) through which recharge occurs increases, and 2) DOC
concentrations in the saturated zone decrease with increasing depth below the water table
(Dt). We tested these hypotheses by measuring DOC concentrations in groundwaters
beneath a range of vadose thicknesses and at a range of depths below the water table. We
found that the deeper the vadose zone, the lower the concentration of DOC in
groundwater near the water table; similarly, DOC concentrations decreased rapidly with
increasing depth below the water table, suggesting quite active biogeochemical
processing in these boundary environments.
In Chapter 3, we used a stable isotopic approach to estimate average
denitrification rates occurring along groundwater flowpaths at two forested sites (Crane
Wildlife Management Area and South Cape Beach) in and near the Waquoit Bay
watershed. These sites provided a large range of groundwater nitrate (<1 to 91 pM) and
DOC (0.04 to 23 mg C 1-) concentrations. Denitrification rates increased with both
increasing initial nitrate and DOC concentrations, ranging from 0 to 2.1 x 10³ pM N h-1.
We compared these rates to those that we measured using mass balance of N in a septic
plume (Ch. 4). First order denitrification rate constants with respect to nitrate were
highest where groundwater DOC concentrations were highest: k = 2.8 y4 in the septic
plume (- 26 mg C 17), k = 1.6 y - at South Cape Beach (DOC= 0.8 to 23.4 mg C 1-1),
and k = .25 y4 at Crane Wildlife (0.1 to 1.9 mg C 1-), suggesting that denitrification rates
were controlled by both nitrate and DOC concentration. We sirmulated N losses along
groundwater flowpaths for the Crane Wildlife site; the results of this analysis suggested
20
that for the low DOC conditions at this site, a saturating kinetics expression with respect
to nitrate best predicts nitrate concentrations measured at the downgradient well ports (?2
= 0.96 for [NO3~],(.W vs. [NO3~]...).
In Chapter 5, we present an empirically-based saturating kinetics model
describing groundwater denitrification under carbon and nitrate-limited conditions.
Denitrification rates were described using a kinetic expression with double substrate
limitation (with nitrate as the terminal electron acceptor and dissolved organic carbon
(DOC) as the electron donor). The kinetic parameters were estimated from our field data
(half saturation constant for N0 3 (KNo3)) and USGS field data (bacterial population [B]),
and from data available in the literature (maximum bacterial growth rate (pmax), half
saturation constant for DOC (KDoc), and bacterial yield constant (Y)). The proposed
model is able to reasonably predict N losses along groundwater flow paths, measured at
the two forested sites, where DOC ranged from 0.04 to 23 mg C 1-1 and nitrate ranged
from <1 to 91 pM. Using higher values for the bacterial population ([B]) and the half-
saturation constant (KNo3), we were also able to predict N losses due to denitrification
within the very different biogeochemical conditions of the septic system plume ([N0 3
]max 4,400 pM, [DOC]~ 26 mg C-1, and presumably a larger and more active bacterial
population). The model performs well over the wide range of geochemical conditions
found at the three sites within this watershed (R2 = 0.92, m = 1.0 for measured vs.
modeled).
21
We conclude that the magnitude of the nitrate source, its travel distance to shore,
and the DOC concentration in groundwater are useful predictors of N downgradient. The
saturating kinetics model, with double substrate limitation by nitrate and DOC, developed
here, provides a valuable tool for planners and managers interested in designing
management strategies to control nitrogen loading to coastal waters. Such a model might
be used in the design of setback limits for septic systems, in assessing the value of open
spaces for N load reduction, in regulating wastewater disposal, and in watershed-wide
land use planning.
22
5. References
Bengtsson G.,, & Annadotter H (1989) Nitrate reduction in agroundwater microcosmdetermined by 1N gas chromatography-mass spectrometry. AppL Env. Microbiol. 55:2861-2870.
Bottcher J., Strebel 0, Voerkelius S, & Schmidt H-L (1990) Using isotope fractionationof nitrate-nitrogen and nitrate-oxygen for evaluation of microbial denitrification in asandy aquifer. J. Hydrol. 114: 413-424.
Bragan RJ, Starr JL, & Parkin T (1997a) Acetylene transport in shallow groundwater fordenitrification rate measurement. J. Envir. Qual. 26: 1524-1530.
Bragan RJ, Starr JL, & Parkin TB (1997b) Shallow groundwater denitrification ratesmeasured by acetylene block. J. Envir. Qual. 26: 1531-1538.
Brenner A, & Argamann Y (1990) Effect of feed composition, aerobic volume fractionand recycle rate on nitrogen in the single-sludge system. Wat. Res. 24: 1041-1049.
Cambareri TC, & Eichner EM (1998) Watershed delineation and ground water dischargeto a coastal embayment. Ground Wat. 36(4): 626-634.
Christensen S, Simkins S, & Tiedje JM (1990a) Spatial variation in denitrification:Dependency of activity centers on the soil environment. Soil Sci. Soc. Am. J. 54: 1608-1613.
Christensen S, Simkins S, Tiedje JM (1990b) Temporal patterns of soil denitrifloation;Their stability and causes. Soil Sci. Soc. Am. J. 54: 1614-1618.
Clay DE, Clay SA, Moorman TB, Brix-Davis K, Scholes KA, & Bender AR (1996)Temporal variability of organic C and nitrate in a shallow aquifer. Wat. Res. 30: 559-568.
Cole JJ, Peierls BL, Caraco NF & Pace ML (1993) Nitrogen loading of rivers as ahuman-driven process in McDonnell MJ & Pickett STA (eds.) Humans as Componentsof Ecosystems: The Ecology of Subtle Human Effects and Populated Areas (pp 138-154). Springer-Verlag, New York, New York, U.S.A.
Costa JE (1988) Distribution, production, and historical changes in abundance ofeelgrass (Zostera marina) in southeastern Massachusetts. Ph.D. Thesis. BostonUniversity, 352 p.
23
Dalsgaard T, de Zwart J, Robertson LA, Kuenen JG, & Revsbech NP (1995)Nitrification, denitrification and growth in artificial Thiosphaerapantotropha biofilms asmeasured with a combined microsensor for oxygen and nitrous oxide. FEMS Microb.Ecol. 17: 137-148.
Engberg DJ, & Schroeder ED (1975) Kinetics and stoichiometry of bacterialdenitrification as a function of cell residence time. Wat. Res. 9: 1051-1054.
Fiebig DM, Lock MA, & Neal C (1990) Soil water in the riparian zone as a source ofcarbon for a headwater stream. J. Hydrol. 116:217-237.
Fiebig DM (1995) Groundwater discharge and its contribution of dissolved organiccarbon to an upland stream. Arch. Hydrobiol. 134:129-155.
Firestone MK (1982) Biological denitrification in Nitrogen in Agricultural Soils,Stevenson, F.J., Ed. Agron. Monogr. 22, American Society of Agronomy, Madison, WI,8
Fisher SG, & Likens GE (1973) Energy flow in Bear Brook, New Hampshire: Anintegrative approach to stream ecosystem metabolism. Ecol. Monogr. 48:421-439.
Ford TE, & Naiman RJ (1989) Groundwater-surface water relationships in boreal forestwatersheds: Dissolved organic and inorganic nutrient dynamics. Can. J. Fish. Aquat. Sci.46:41-49.
Fustec E, Mariotti A, Grillo X, & Sajus J (1991) Nitrate removal by denitrification inalluvial groundwater: Role of a former channel. J. of Hydrol. 123: 337-354.
GESAMP (1990) State of the Marine Environment. Rep, Stud. No. 39, Joint Group ofExperts on the Scientific Aspects of Marine Pollution. United Nations EnvironmentProgramme. 111 p.
Gillham RW (1991) Nitrate contamination of ground water in southern Ontario and theevidence for denitrification. pp. 181-198 in Bogardi, I. and R.D. Kuzelka, editors.Nitrate Contamination. NATO ASI Series G, Vol. 30.
Gold AJ, Jacinthe PA, Groffman PM, Wright WR, & Puffer PH (1998) Patchiness ingroundwater nitrate removal in a riparian forest. J. Envir. Qual. 27: 146-155.
Groffman PM (1991) Ecology of nitrification and denitrification in soil evaluated atscales relevant to atmospheric chemistry. p. 201-217, in JE Rogers and WB Whitman(ed.) Microbial production and consumption of greenhouse gases: Methane, nitrogenoxides, and halomethanes. Am. Soc. Microbiol., Washington, D.C.
24
Groffinan PM, Howard G, Gold AJ, & Nelson WM (1996) Microbial nitrate processingin shallow groundwater in a riparian forest. J. Environ. Qual, 25: 1309-1316.
Groffman PM, & Tiedje (1989) Denitrification in north temperate forest soils: Spatial andtemporal patterns at the landscape and seasonal scales. Soil Biol. Biochem. 21:613-620.
Holland EA, Dentener BH, Braswell BH, & Sulzman JM (1999) Contemporary and pre-industrial global reactive nitrogen budgets. Biogeochemistry 46:7-43.
Howarth RW, Billen G, Swaney D, Townsend A, Jaworski N, Lajtha K, Downing JA,Elmgren R, Caraco N, Jordan T, Berendse F, Freney J, Kudeyarov V, Murdoch P, &Zhao-Liang Z (1996) Regional nitrogen budgets and riverine nitrogen and phosphorusfluxes for the drainages to the North Atlantic Ocean: natural and human influences.Biogeochemistry 35:75-79.
Jacinthe PA, Groffinan PM, Gold AJ, & Mosier A (1998) Patchiness in microbialnitrogen transformations in groundwater in a riparian forest. J. Environ. Qual. 27: 156-164.
Keeney D (1986) Sources of nitrate to groundwater. Crit. Rev. Environ. Contain. 6,257-304.
Korom SF (1992) Natural denitrification in the saturated zone: A review. Wat. ResourcesRes. 28: 1657-1668.
Korom SF (1991) Denitrification in the unconsolidated deposits of the Heber Valleyaquifer, Ph. D. thesis, 176 pp., Utah State Univ. Logan, Utah.
Krul JM (1976) Dissimilatory nitrate and nitrite reduction under aerobic conditions by anaerobically and anaerobically grown AIcalgenes sp. and by activated sludge. J. Appl.Bacteriol. 40:245-260.
Lee V, & Olson S (1985) Eutrophication and management initiatives for the control ofnutrient inputs to Rhode Island coastal lagoons. Estuaries 8: 191-202.
Leenheer J, Malcolm RL, McKinley PW, & Eccles LA (1974) Occurrence of dissolvedorganic carbon in selected ground-water samples in the United States. J. Res. U.S. Geol.Surv. 2(3): 361-369.
Mariotti A, Landreau A, & Simon B (1988) 1 5N isotope biogeochemistry and naturaldenitrification process in groundwater: Application to the chalk aquifer of northernFrance. Geochim. Cosmochim. Acta 52: 1869-1878.
25
Muller EB, Stouthamer AH, & van Verseveld HW (1995) Simultaneous NH3 oxidationand N2 production at reduced 02 tensions by sewage sludge subcultured withchemolithotrophic medium. Biodegrad. 6: 339-349.
Mulhulland PJ (1981) Organic carbon flow in a swamp-stream ecosystem. Ecol.Monogr. 51:307-322.
National Research Council (NRC) (2000) Clean Coastal Waters: Understanding andReducing the Effects of Nutrient Pollution. National Academy Press, Washington, D.C.405 p.
National Research Council (NRC) (1994) Priorities for Coastal Science, NationalAcademy Press, Washington D.C. 88 p.
National Research Council (NRC) (1993) Managing Wastewater in Coastal UrbanAreas. National Academy Press, Washington, D.C.
Nixon S, Oviatt CA, Frithsen J, and Sullivan B (1986) Nutrientsand the productivity ofestuarine and coastal marine ecosystems. J. Limnol. Soc. S. Africa, 12: 43-71.
Nixon SW, Ammerman JW, Atkinson LP, Berounsky VM, Billen G, Boicourt WC,Boyton WR, Church TM, DiToro DM, Elmgren R, Qarber JR, Giblin AE, Jahnke RA,Owens NJP, Pilson MEQ, & Seitzinger SP (1996) The fate of nitrogen and phosphorus atthe land-sea margin of the North Atlantic Ocean. Biogeochenistry 35: 141-180.
Parkin TB, & Robinson JA (1989) Stochastic models of soil denitrification. Soil Sci.Soc. Am. J. 49:651-957.
Parkin TB (1987) Soil microsites as a source of denitrification variability. Soil Sci. Soc.Am. J. 51: 1194-1199.
Parkin TB, Starr JL, & Meisinger JJ (1987) Influence of sample size on measurement ofsoil denitrification. Soil Sci. Soc. Am. J., Div. S-3 - Soil Microbiology and Biochemistry,51: 1492-1501.
Peterjohn WT, & DL Correll (1984) Nutrient dynamics in an agricultural watershed:Observations on the role of riparian forest. Ecol. 65: 256-268.
Robertson LA, van Niel EWJ, Torremans RAM, & Kuenen JG (1988) Simultaneousnitrification and denitrification in aerobic chemostat cultures of Thiosphaera pantotropha.Appl. Env. Microbiol. 1988, 54: 2812-2818.
Savoie J, & LeBlanc DR (1998) Water-Quality Data and Methods of Analysis forSamples Collected Near a Plume of Sewage-Contaminated Ground Water, Ashumet
26
Valley, Cape Cod, Massahusetts, 1993-94. 97-4269, U.S. Department of the Interior,U.S. Geological Survey, Marlborough, Massachusetts.
Seely BA (1997) Atmospheric deposition and flux dynamics of nitrogen in the coastalforests of the Waquoit Bay Watershed, Cape Cod, MA. Ph.D. Thesis, Boston University,Boston, MA, 153 pp.
Smith RL, Howes BL, & Duff JH (1991) Denitrification in nitrate-contaminatedgroundwater: Occurence in steep vertical geochemical gradients. Geochim. Cosmochim.Acta 55: 1815-1825.
Tiedje JM, Sextone AJ, Myrold DD, & Robinson A (1982) Denitrification: Ecologicalniches, competition and survival. Antonie van Leeuwenhoek 48:569-583.
Trudell MR, Gillham RW, & Cherry JA. (1986) An in-situ study of the occurence andrate of denitrification in a shallow unconfined sand aquifer. J. Hydrol. 83: 251-268.
Valiela I, Collins G, Kremer J, Lajtha K, Geist M, Seely B, Brawley J, & Sham C.H.(1997) Nitrogen loading from coastal watersheds to receiving estuaries: new method andapplication. Ecol. Appl. 7(2): 358-380.
Valiela I & Costa J (1988) Eutrophication of Buttermilk Bay, a Cape Cod coastalembayment: Concentrations of nutrients and watershed nutrient budgets. Environ.Manag. 12: 539-553.
Valiela I, Foreman K, LaMontagne M, Hersh D, Costa J, Peckol P, DeMeo-Anderson B,D'Avanzo C, Babione M, Sham CH, Brawley J, & Lajtha K (1992) Couplings ofwatersheds and coastal waters: Sources and consequences of nutrient enrichment inWaquoit Bay, Massachusetts. Estuaries 15: 443-457.
Valiela I, Geist, M, McClelland J, & Tomasky G (2000) Nitrogen loading fromwatersheds to estuaries: Verification of the Waquoit Bay Nitrogen Loading Model.Biogeochemistry 49: 277-293.
van Kessel C, Pennock DJ, & Farrell RE (1993) Seasonal variations in denitrification andnitrous oxide evolution at the landscape scale. Soil Sci. Soc. Amer. J. 57: 988-995.
Vitousek PM, Aber J, Howarth RW, Likens GE, Matson PA, Schindler DW, SchlesingerWH, & Tilman GD (1997) Human alternation of the global nitrogen cycle: causes andconsequences. 1, Ecological Society of America, Washington, D.C.
Vogel JC,. Talma AS,, & Heaton THE (1981) Gaseous nitrogen as evidence fordenitrification in groundwater. J. Hydrol. 50: 191-200.
27
Weiskel PK, & Howes BL (1992) Differential transport of sewage-derived nitrogen andphosphorus through a coastal watershed. Environ. Sci. Tech. 26: 352-360.
28
CHAPTER 2:
THE EFFECT OF VADOSE ZONE THICKNESS AND DEPTHBELOW THE WATER TABLE ON DOC CONCENTRATION
IN GROUNDWATER ON CAPE COD, U.S.A
Accepted by Biogeochemistry
29
Running head:
Article type:
Title:
Authors:
Affiliations:
DOC in groundwater
General research
The effect of vadose zone thickness and depth below thewater table on DOC concentration in groundwater on CapeCod, U.S.A.
Wendy J. Pabich*, Ivan Valiela2 , and Harold F. Hemond'.
1) Massachusetts Institute of Technology, Department ofCivil and Environmental Engineering, Ralph M. ParsonsLaboratory, Cambridge, MA 02138, U.S.A.
2) Boston University Marine Program, Marine BiologicalLaboratory, Woods Hqle, MA 02543, U.S.A.
Corresponding author:
Key words:
Wendy J. Pabichc/o Boston University Marine ProgramMarine Biological LaboratoryWoods Hole, MA 02543USATelephone: (508) 289-7615Fax: (508) 289-7949Email: [email protected]
Cape Cod, DOC, groundwater, saturated zone, vadose
30
Abstract. Changes in concentration of dissolved organic carbon (DOC) reflectbiogeochemical processes that determine chemical composition of groundwater and othernatural waters. We found that the deeper the vadose zone, the lower the concentration ofDOC in groundwater near the water table, indicating that considerable attenuation ofsurface-derived DOC occurred in the vadose zone. Under vadose zones <1.25 m, DOCconcentrations at the surface of the water table ranged to >20 mg J7' C, while for vadosezones >5.0 m, DOC never exceeded 2.0 mg r, C. DOC concentrations also decreasedexponentially with increasing depth below the water table, most notably in the upper twometers, implying continued attenuation in the upper layer of the saturated zone. Ninety-nine percent of the DOC was attenuated by the time the water reached a depth of 19 mbelow the water table. DOC concentrations in shallow groundwater show considerablespatial variability, but the concentration of DOC at any one site is surprisingly stable overtime. The largest source of variation in DOC concentration in groundwater therefore isspatial rather than temporal, suggesting that local heterogeneities play an important rolein DOC delivery to shallow groundwater. Our results highlight both the importance ofshallow vadose areas in DOC delivery to groundwater and the need to distinguish wheresamples are collected in relation to flow paths before conclusions are made about meangroundwater DOC concentrations. The substantial losses of DOC in the vadose zone andin shallow depths within the aquifer suggest quite active biogeochemical processes inthese boundary environments.
31
1. Introduction
DOC alters chemical composition of surface and grounl waters by acting as a
substrate for microbial catabolism, an electron acceptor for anaerobic respiration, and a
ligand for metal complexation, and by providing protons for apid/base chemistry, and
nutrients that stimulate biological productivity. DOC is generated in soil organic
horizons by microbial metabolism, root exudates, and leaching of organic matter (Schiff
et al. 1996) and transported by recharge water to the saturated zone (Cronan and Aiken
1985; Thurman 1985; Clay at al. 1996) or by surface runoff (Jordan et al. 1997) to
surface water bodies. Export of DOC from forested catchments depends on a complex,
seasonally and spatially varying interplay of production, decomposition, sorption,
precipitation, and hydrology (Cronan and Aiken 1985; Schiff at el. 1996).
DOC concentrations change as the organic matter is transported from the surface
of a watershed to receiving waters. Cronan and Aiken (1985), McDowell and Likens
(1988), Schiff et al. (1990), Easthouse et al. (1992), and Kookani and Naidu (1998)
demonstrated that DOC in soil solutions decreased as recharge water percolates through
soil horizons, from > 70 mg 1- C in upper soil horizons to 1-2 mg 1- C in lower soil
horizons. Mechanisms that may attenuate organic carbon as it percolates through soils
include sorption and complexation with mineral surfaces (e.g. Fe and Al oxides and
hydroxides) and clay minerals (Thurman 1985), microbial oxidation to CO 2 (Chapelle
1992), precipitation, flocculation and formation of insoluble complexes (Kookana and
Naidu 1998), and filtering of organic colloids (Wan and Tokunaga 1997).
32
Several authors have pointed to the importance of the length or duration of
hydrologic flow paths in controlling DOC delivery (Cronan and Aiken 1985). Easthouse
et al. (1992) contend that work on inorganic constituents (Sullivan et al. 1986, Lawrence
et al. 1988, Neal et al. 1989, Mulder et al. 1990) has demonstrated the importance of
hydrologic flow paths in explaining variations in stream water chemistry. Similarly,
Schiff et al. (1996) highlighted the importance of flow paths when they concluded that
recently-fixed labile DOC leached from the A horizon or litter layer can only reach the
stream via short flow paths that bypass locations where significant soil sorption occurs.
Recharge is often spotty, and preferential flow paths, or fingers are likely to develop even
in relatively homogeneous sandy soils (Parlange et al. 1999), potentially resulting in
variable transport of DOC to groundwater.
Little information is available about the fate and transpqrt of DOC either in the
vadose zone or after it has reached the saturated zone. It seems likely that transport
through the vadose zone and through groundwater aquifers provides additional
opportunity for DOC to be attenuated by mechanisms similar to those thought to
attenuate DOC in the unsaturated zone (e.g., sorption, complexation, microbial oxidation,
precipitation, flocculation, formation of insoluble complexes, and filtering of organic
colloids). Thus we hypothesize that: 1) groundwater DOC concentrations decrease as
the thickness of the vadose zone (Tvad) through which recharge occurs increases, and 2)
DOC concentrations in the saturated zone decrease with increasing depth below the water
table (Dq). We tested these hypotheses by measuring DOC concentrations in
33
groundwaters beneath a range of vadose thicknesses and at a range of depths below the
water table.
2. Materials and methods
2.1 Study site
This work was carried out in the watershed of Waquoit Bay, a shallow estuary on
the southwestern shore of Cape Cod, Massachusetts, subject to increasing eutrophication
from groundwater-transported nitrogen. The watershed is underlain by an unconsolidated
sole-source sand and gravel aquifer (Barlow and Hess 1993, Leblanc et al. 1986). The
aquifer matrix is comprised of primarily quartz and feldspar sand (95%) with some
ferromagnesian aluminosilicates and oxides (5%); sand grains are coated with hydrous
oxides of aluminum and iron (Stollenwerk 1996). Average groundwater velocity is
approximately 0.4 m per day (LeBlanc 1991), and annual recharge is 53 cm yr 1(Barlow
and Hess 1993, LeBlanc 1984). Groundwater discharge to Waquoit Bay and its
tributaries accounts for 89% of the total freshwater input to Waquoit Bay (Cambareri
1998), and is the primary avenue by which land-derived nitrogen is delivered to the
estuary (Valiela et al. 1997).
We sampled groundwater near South Cape Beach and Sage Lot Pond in the
southern part of the watershed (SCB), and in the Crane Wildlife Management Area to the
north (CWMA). Both areas have mixed pitch pine and scrub oak forest cover and are
typical of forested areas throughout Cape Cod. Other data are from USGS wells located
in and near the watershed (Savoie and LeBlanc 1998).
34
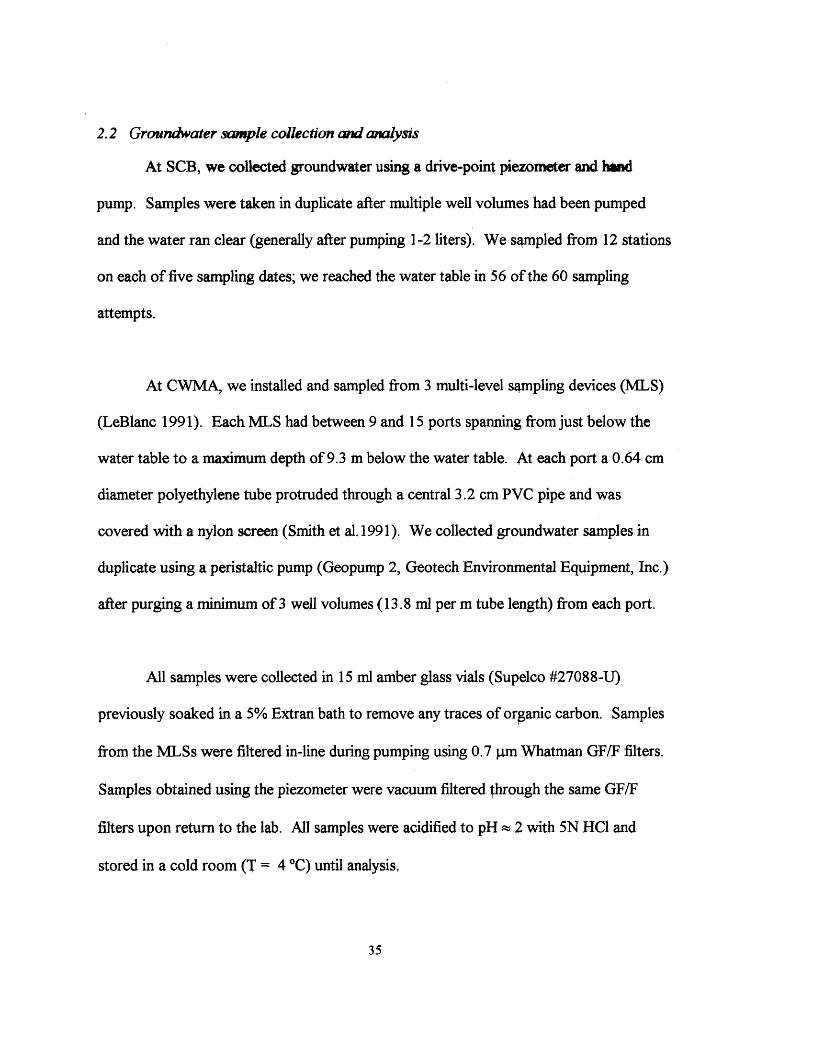
2.2 Groundwater sample collection and analysis
At SCB, we collected groundwater using a drive-point piezometer and hand
pump. Samples were taken in duplicate after multiple well volumes had been pumped
and the water ran clear (generally after pumping 1-2 liters). We sampled from 12 stations
on each of five sampling dates; we reached the water table in 56 of the 60 sampling
attempts.
At CWMA, we installed and sampled from 3 multi-level sampling devices (MLS)
(LeBlanc 1991). Each MLS had between 9 and 15 ports spanning from just below the
water table to a maximum depth of 9.3 m below the water table. At each port a 0.64 cm
diameter polyethylene tube protruded through a central 3.2 cm PVC pipe and was
covered with a nylon screen (Smith et al. 1991). We collected groundwater samples in
duplicate using a peristaltic pump (Geopump 2, Geotech Environmental Equipment, Inc.)
after purging a minimum of 3 well volumes (13.8 ml per m tube length) from each port.
All samples were collected in 15 ml amber glass vials (Supelco #27088-U)
previously soaked in a 5% Extran bath to remove any traces of organic carbon. Samples
from the MLSs were filtered in-line during pumping using 0.7 gm Whatman GF/F filters.
Samples obtained using the piezometer were vacuum filtered ehrough the same GF/F
filters upon return to the lab. All samples were acidified to pH ~ 2 with 5N HCI and
stored in a cold room (T = 4 *C) until analysis,
35
At SCB, we located the surface of the water table by first driving the piezometer
below the water table (verified by drawing water), and then pulling it out of the ground in
0.1 m increments and attempting to pump at each position. We recorded the water table
position as that depth where we could no longer draw water thropgh the piezometer. At
CWMA, we measured the thickness of the vadose zone by lowering a Fisher m-SCOPE
Water Level Indicator into a nearby monitoring well (< 20 m) anc4 measured the distance
of the water table from land surface. Depth to the water table was tabulated for USGS
wells in Savqie and LeBlanc (1998).
We measured DOC concentrations in triplicate Ar-purged samples using high
temperature catalytic oxidation (HTCO) with infrared detection of CO 2 (Shimadzu TOC
5000). DOC data for USGS wells were taken from Savoie and LeBlanc (1998). Many of
the USGS wells were drilled to investigate groundwater pollution emanating from the
Massachusetts Military Reservation. We collected data only from wells located in areas
of clean groundwater, either outside the boundaries of mapped wastewater plumes or
having methyl blue active substances (MBAS) below 0.02 mg 1 .
3. Results and Discussion
Groundwater DOC concentrations varied from 0.04 to 23.38 mg C r' and
averaged 2.31 1 0.30 mg C 1-. The wells provided a range of vadose thicknesses (Tvad)
from 0.5 m to 17.5 m and water table depths (Dq) from 0.01 to 51,8 m. We found, as did
Cronan and Aiken (1985) and Easthouse et al. (1992), that DOC concentrations were
36
quite variable spatially, but more consistent temporally. For example, at the 12 SCB
stations, where the vadose zone was routinely less than 1.5 m, 1)OC ranged from < 1 to
23 mg C 1-, with a coefficient of variation of 77% (Fig. 2.1). Despite this spatial
variability, when we sampled on 5 sampling dates at each of the 12 stations at SCB, we
found that DOC was consistently high at some sampling points and consistently low at
others. The average of the coefficients of variation of the time series data for each of the
12 stations was 37%. These observations suggests that local-scale heterogeneities in
properties such as soil composition and thickness, the position of the water table relative
to the soil organic layer, hydrologic flow paths, and recharge rates may provide more
variation than temporal changes.
Concentrations of DOC were inversely related to both Tyad and D (multiple
regression of log transformed values, R2 = 0.68, p < 0.00 1, Table 2.1). The two variables,
Tad and D,, were relatively independent: the highest variance inflation factor (VIF)
(Sokal and Rohlf 1995) was 1.3, which suggests only minimal correlation between
independent variables. To evaluate the relative influence of Tyag and D., on DOC
concentration, we calculated Kruskal's index of importance (average of squared partial
correlation coefficients) (Sokal and Rohlf 1995); the index was 0.58 for Dw, and 0.23 for
T,,d. This indicates that depth below the water table was relatively more important than
vadose thickness in predicting DOC concentration. These analyses suggest that Tvad and
37
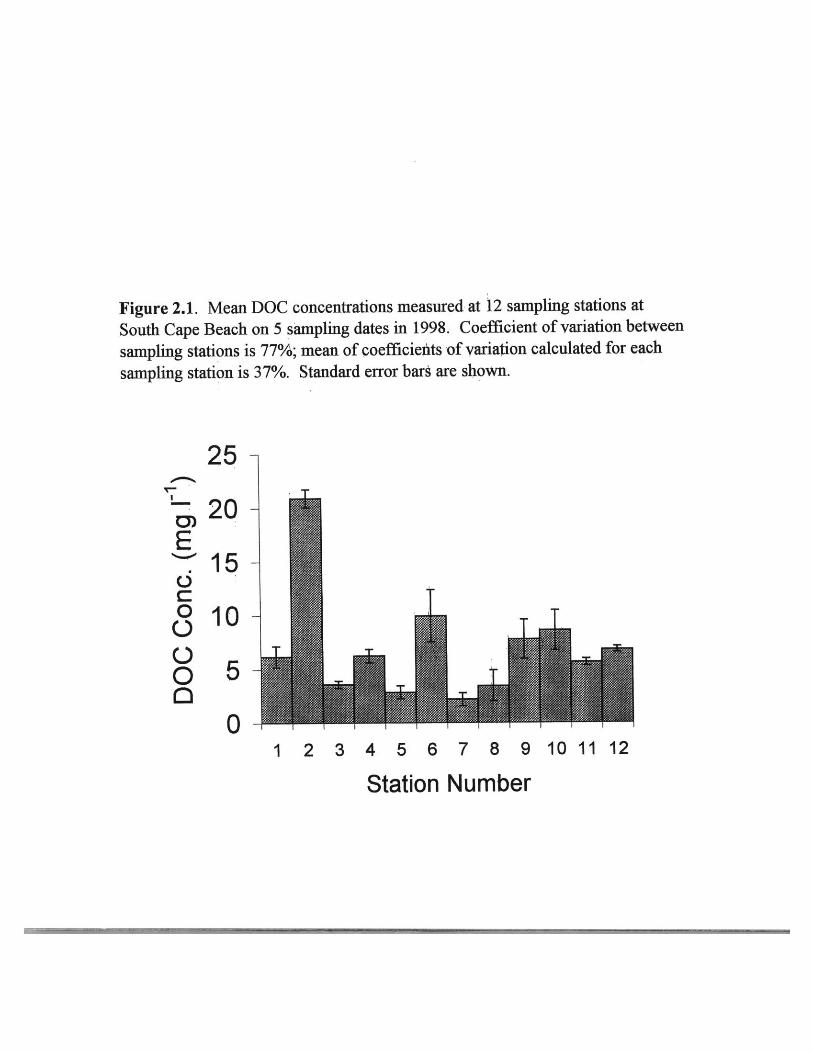
Figure 2.1. Mean DOC concentrations measured at 12 sampling stations at
South Cape Beach on 5 sampling dates in 1998. Coefficient of variation between
sampling stations is 77%; mean of coefficients of variation calculated for each
sampling station is 37%. Standard error bars are shown.
25-
0)
(3
00000
20
15
10
5
TTJ
T
01 2 3 4 5 6 7 8 9 10 11 12
Station Number
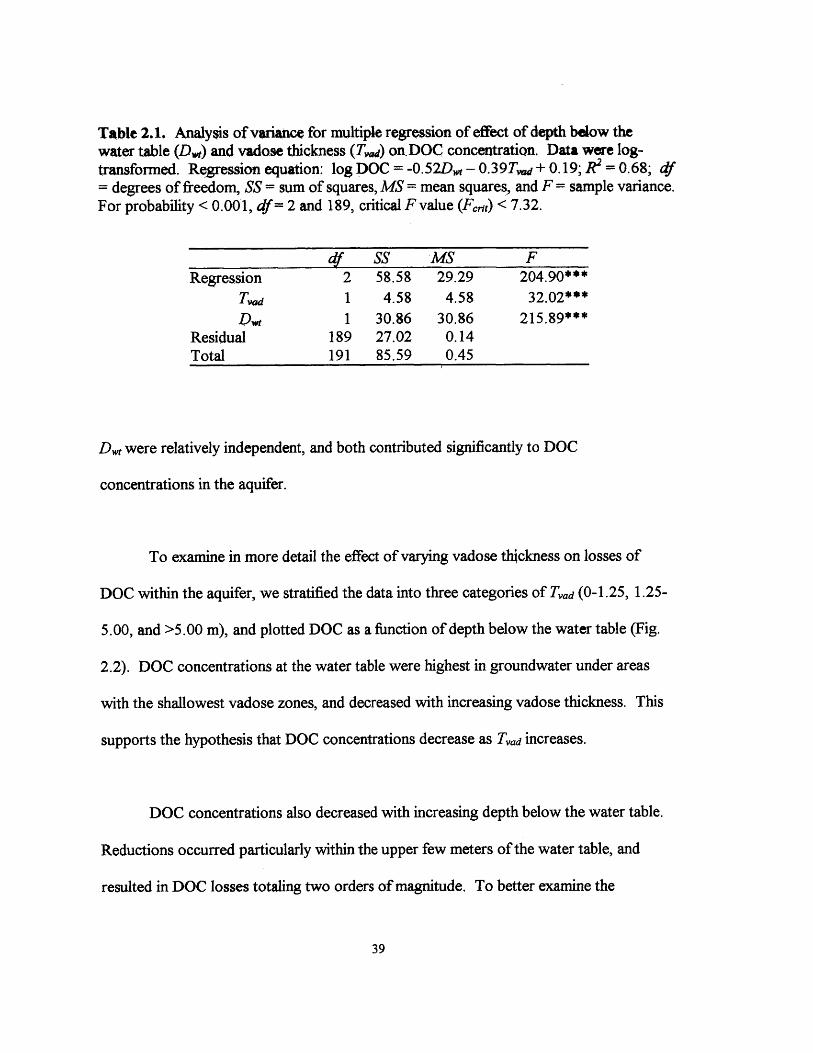
Table 2.1. Analysis of variance for multiple regression of effect of depth below thewater table (Dw) and vadose thickness (T,.) on DOC concentration. Data were log-transformed. Regression equation: log DOC = -0.52Dw - 0.39T,,d+0.19; R2= 0.68; df= degrees of freedom, SS = sum of squares, MS = mean squares, and F = sample variance.For probability < 0.001, df= 2 and 189, critical F value (F,.it) < 7.32.
df SS MS FRegression 2 58.58 29.29 204.90***
Tas 1 4.58 4.58 32.02***
DW 1 30.86 30.86 215.89***Residual 189 27.02 0.14Total 191 85.59 0.45
D. were relatively independent, and both contributed significantly to DOC
concentrations in the aquifer.
To examine in more detail the effect of varying vadose thickness on losses of
DOC within the aquifer, we stratified the data into three categories of Tvad (0-1.25, 1.25-
5.00, and >5.00 m), and plotted DOC as a function of depth below the water table (Fig.
2.2). DOC concentrations at the water table were highest in groundwater under areas
with the shallowest vadose zones, and decreased with increasing vadose thickness. This
supports the hypothesis that DOC concentrations decrease as T 0d increases.
DOC concentrations also decreased with increasing depth below the water table.
Reductions occurred particularly within the upper few meters of the water table, and
resulted in DOC losses totaling two orders of magnitude, To better examine the
39

Figure 2.2. DOC concentration as & function of depth below water table for each of three vadose thickness (Tad) strata: 0 -1.25m, 1.25 - 5.0 m, and > 5.0 In.
DOC conc. (mg F ) DOC conc. (mg F1) DOC conc. (mg F')
8 16III - I Tr
24 0
.1p
)
Tad: 0 - 1.25 m
8I .' . ,
16 24 0. I C7- -
I ~
))
I_Tad: 1.25 - 5.0 m
I-
81.
16I
00
10
20 U
24a
40-
50-Tad: > 5.0 m
40
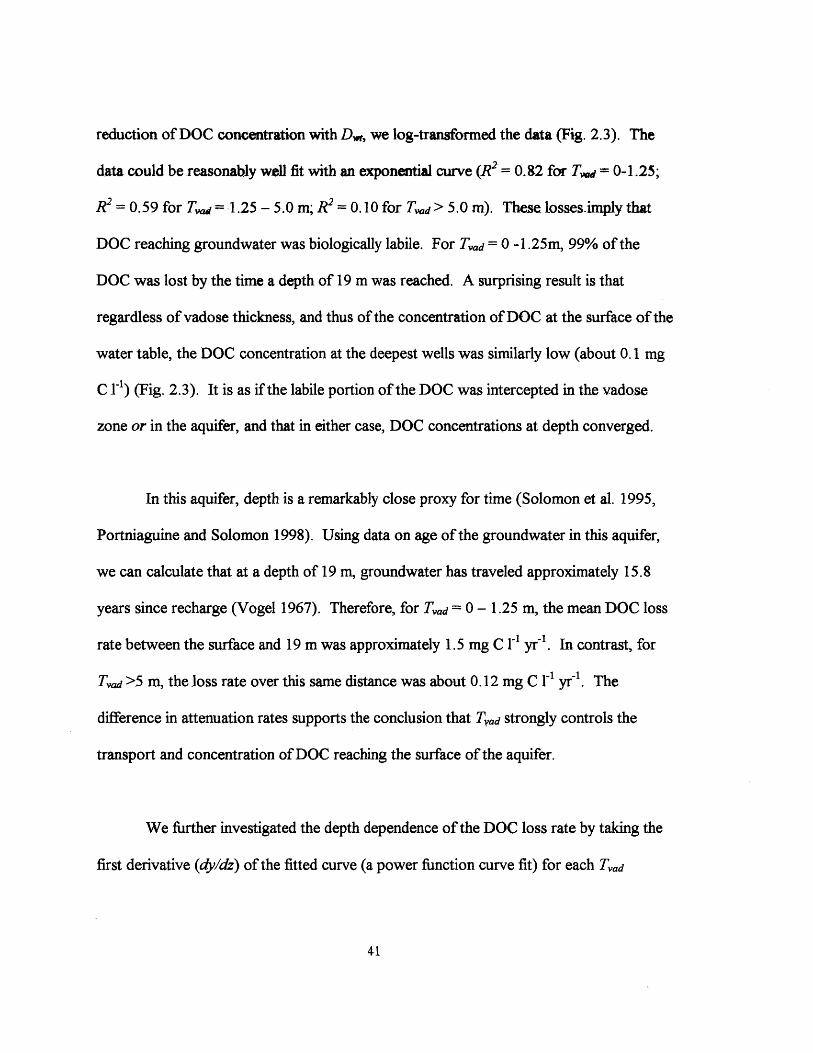
reduction of DOC concentration with Dw, we log-transformed the data (Fig. 2.3). The
data could be reasonably well fit with an exponential curve (R2 = 0.g2 for T=.s 0-1.25;
R2= 0.59 for T, = 1.25 - 5.0 m; R 2 = 0.10 for T.ad> 5.0 in). These losses-imply that
DOC reaching groundwater was biologically labile. For Tad =0 -1.25m, 99% of the
DOC was lost by the time a depth of 19 m was reached. A surprising result is that
regardless of vadose thickness, and thus of the concentration of DOC at the surface of the
water table, the DOC concentration at the deepest wells was similarly low (about 0.1 mg
C 1) (Fig. 2.3). It is as if the labile portion of the DOC was intercepted in the vadose
zone or in the aquifer, and that in either case, DOC concentrations at depth converged.
In this aquifer, depth is a remarkably close proxy for time (Solomon et al. 1995,
Portniaguine and Solomon 1998). Using data on age of the groundwater in this aquifer,
we can calculate that at a depth of 19 m, groundwater has traveled approximately 15.8
years since recharge (Vogel 1967). Therefore, for T,,d = 0 - 1.25 m, the mean DOC loss
rate between the surface and 19 m was approximately 1.5 mg c 4 yfr'. In contrast, for
Ta >5 m, the loss rate over this same distance was about 0.12 mg C F yfr-. The
difference in attenuation rates supports the conclusion that Tyas strongly controls the
transport and concentration of DOC reaching the surface of the aquifer.
We further investigated the depth dependence of the DOC loss rate by taking the
first derivative (dy/dz) of the fitted curve (a power function curve fit) for each Tad
41
Figure 2.3. DOC concentration plotted as a function of depth below water table (D ,) for each of threevadose thickness (Tvad) strata: 0 - 1.25 m, 1.25 - 5.0 m, and > 5.0 m. Axes are logarithmic;*** denotes probability < 0.001, ns = not significant.
DOC Conc. (mg 1-)
0.1 1 10
DOC Conc. (mg 1i)
100
Tvad = 0 -1.25 m
0&
0
00;
@ 0
DOC conc. = 2.13 * D m-0'76
F = 224.6***, R 2 = 0.82
0.01 0.1 1I 10 100
TV.d = 1.25 -5.0 m00
0 0 0 0
0 00
0(909 0
0080 09 000
DOC conc. = 0.94 *Dw~-''6
F = 120.2***, R 2 = 0.59
0.01
DOC Conc. (mg
0.1 1I I
11)
10
t Tac > 5.0 M
0 00 0 000 000
8 0
0
DOC conc. = 0.34 *D W-
F = 5.48"*, R 2 .10
0.00.01 -
0.1 -
10-
100-
__a
1I
category (Fig. 2.4). The DOC loss rate quickly diminished with depth for all Td
categories. At depth (-30 m), where DOC losses were small, the rate of attenuation was
lowest for groundwater beneath the thickest vadose zones. This supports the notion that
processes in the vadose zone affect the quality of the DOC in the saturated zone (and thus
the rate at which it is metabolized). It seems that the more labile forms of DOC are
selectively removed during transport through the unsaturated zone, so that only more
refractory DOC may reach the aquifer in those areas with thick vadose zones.
Our interest in understanding how DOC is distributed in groundwater stems from
the larger question of how nitrogen is transported to receiving waters and to what degree
denitrification in groundwater is limited by the supply of DOC. Research suggests that
many aquifers do not contain sufficient organic matter to produce the anaerobic
conditions required for denitrification (Bryan, 1981; Parkin and Meisinger, 1989;
Thurman, 1985; Barcelona, 1984; Lind and Eiland, 1989; McCarty and Bremner, 1982;
Obenhuber and Lowrence, 1991). Groundwater DOC values reported in the literature
from a wide range of aquifer settings and depths (Fig. 2.5) suggest, first, that there are
many places where groundwater contains significant concentrations of DOC. These
concentrations may be sufficiently high to support denitrification. Our measurements of
DOC concentrations fall within the wide range reported in the literature. The data in
Figure 2.5 can also be used to make a second point: sampling groundwater at depth may
provide underestimates of DOC dynamics in aquifers. The rather steep gradient in DOC
43
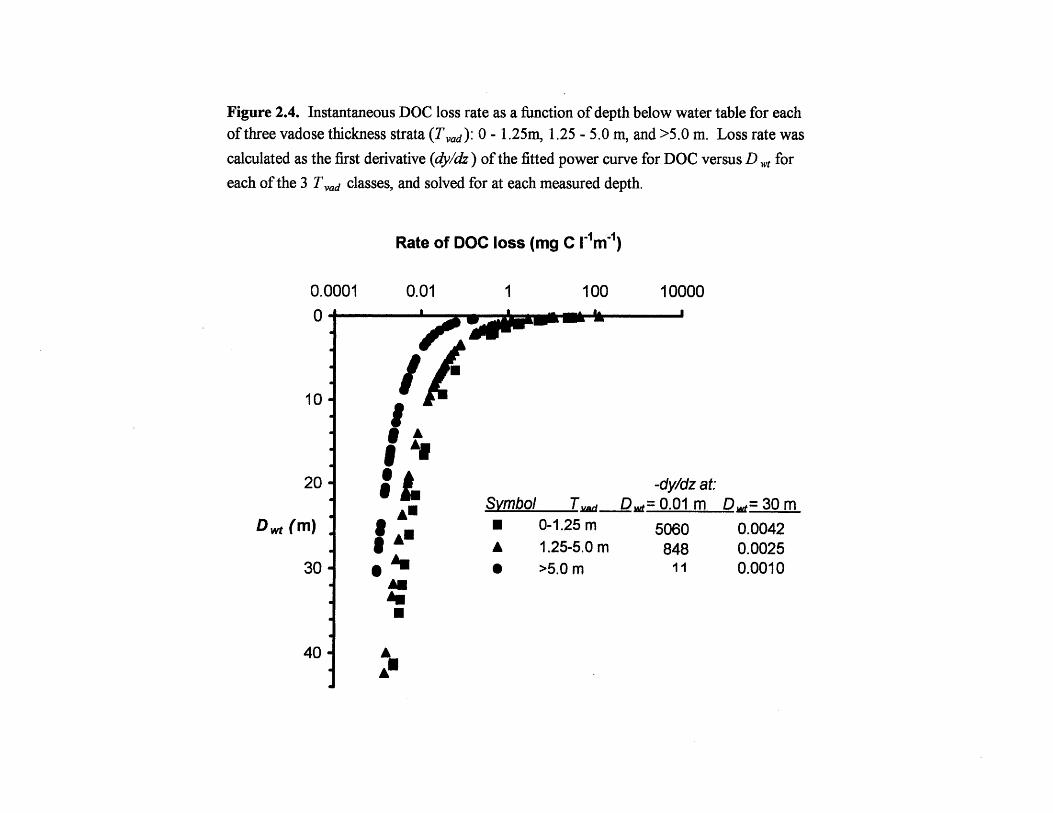
Figure 2.4. Instantaneous DOC loss rate as a function of depth below water table for eachof three vadose thickness strata (Tvad): 0 - 1.25m, 1.25 - 5.0 m, and >5.0 m. Loss rate was
calculated as the first derivative (ly/dz) of the fitted power curve for DOC versus D , for
each of the 3 Tvad classes, and solved for at each measured depth.
Rate of DOC loss (mg C I'm-)
0.0001'
10-
20
D w (m)
30-
40
0.01*1 _____
I
1 100
/ - Uu~
A Symbol TkadM 0-1.25 m
A A 1.25-5.0 mAN 0 >5.0 m
AnA.
0
10000
-dy/dz at:Dm= 0.01 m D= 30 m
5060 0.0042848 0.0025
11 0.0010
AAn
NU
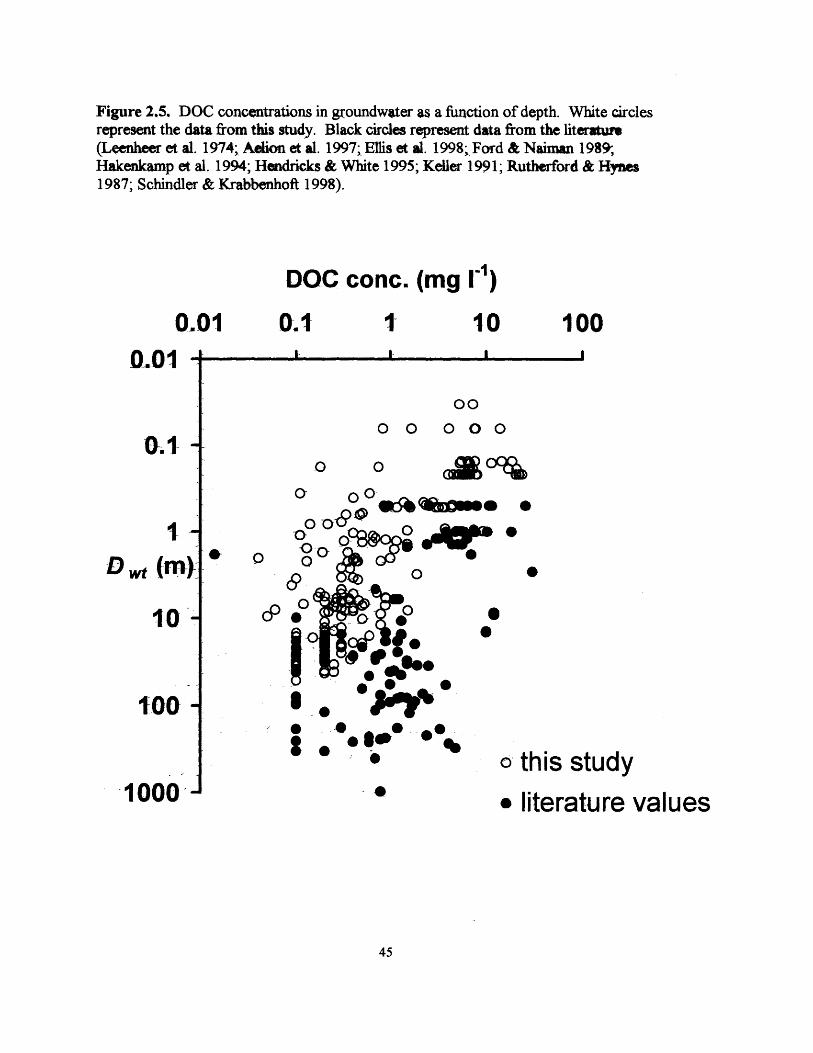
Figure 2.5. DOC concentrations in groundwater as a function of depth. White circlesrepresent the data from this study. Black circles represent data from the literatun(Leenheer et al. 1974; Aelion et al. 1997; Ellis et al. 1998- Ford & Naiman 1989;Hakenkamp et al. 1994; Hendricks & White 1995; Keller 1991; Rutherford & Hynes1987; Schindler & Krabbenhoft 1998).
DOC conc. (mg 11)
0,01 0.1- I 10 1000.01
.1 -
10-
'100-An
1000,-
C. A.
00
0 0 00 0
o 00
G 00-5q~g* 0
00
0p.i% oa this study
o literature values
45
a I
concentration that we found near the water table suggests that measurements of DOC in
samples from deep groundwater wells may not only fail to describe the dynamics of
DOC, but may underestimate mean groundwater DOC concentrations. The strong
attenuation of DOC concentration within the vadose zone and he upper portion of the
water table suggests that these sites are potentially those where biogeochemical
transformations, including denitrification, should be active, and s1tould be measured.
The comparison of published DOC concentrations (black circles, Fig. 2.5) relative
to the values we report here (white circles, Fig. 2.5) also makes 4 third point: in general,
despite the scatter in the data, it appears that DOC concentrations do decrease with
increasing depth below the water table. Of course, the scatter of points from the diverse
sites makes the pattern less obvious, but it is nonetheless true that the larger
concentrations of DOC tend to lie in the shallower layers, as we demonstrate in our own
data in some detail.
The results we include here demonstrate that there are tight biogeochemical
couplings among components of the below-ground ecosystems. Labile DOC is
intercepted near or in boundaries layers, either in the vadosp zone or in the shallow
aquifer, leaving only a small concentration of DOC for transport to open receiving
waters. Such large decreases in DOC must follow significant stoichiometric relationships
linking carbon dynamics to other elements. Investigation of the stoichiometry is the next
step suggested by the large transformations documented in this paper.
46
4. Acknowledgements
MIT Sea Grant (# 65591) and a National Estuarine Research Reserve (NERRS) GraduateFellowship from the National Oceanic and Atmospheric Association (NA770R024)supported this work. We thank Denis LeBlanc of the US Geological Survey,Marlborough, MA for well construction and installation, site access, and worthy advice;John MacFarland at MIT for assistance with the Shimadzu TOC analyzer; Vanessa Bharkalso at MIT, who helped analyze our DOC samples as part of her summer internship; andGabrielle Tomasky, at the Boston University Marine Program, for field and labassistance.
47
5. References
Aelion CM, Shaw JN & Wahl M (1997) Impact of suburbanization on ground waterquality and denitrification in coastal aquifer sediments. J. of Exper. Mar. Biol. Ecol. 213:31-51
Barcelona MJ (1984) TOC determination in groundwater. Ground Water 22: 18-24
Barlow PM & Hess KM (1993) Simulated Hydrologic Responses of the Quashnet RiverStream-Aquifer System to Proposed Ground-Water Withdrawals, Cape Cod,Massachusetts. U.S. Geological Survey, Water-Resources Investigations Report 93-4-64,Marlborough
Bryan BA (1981) Physiology and biochemistry of denitrification, In: Delwiche CC (Ed)Denitrification, Nitrification, and Atmospheric Nitrous Oxide (pp 67-84). Wiley, NewYork
Cambareri TC & Eichner EM (1998) Watershed delineation and ground water dischargeto a coastal embayment. Ground Water 36: 626-634
Chapelle FH (1992) Ground-Water Microbiology & Geochemistry. John Wiley & Sons,Inc., New York
Clay DE, Clay SA, Moorman TB, Brix-Davis K, Scholes KA & Bender AR (1996)Temporal variability of organic C and nitrate in a shallow aquifer. Water Res. 30: 559-568
Cronan CS & Aiken GR (1985) Chemistry and transport of soluble humic substances inforested watersheds of the Adirondack Park, New York. Geochim. Cosmochim. Acta 49:1697-1705
Ellis B, Stanford JA & Ward JV (1998) Microbial assemblages and production in alluvialaquifers of the Flathead River, Montana, USA. J. N. Am. Benthol. Soc. 17: 382-402
Easthouse KB, Mulder J, Christophersen N & Seip HM (1992) Dissolved organic carbonfractions in soil and stream water during variable hydrological conditions at Birkenes,Southern Norway. Water Resources Res, 28: 1585-1596
Ford T & Naiman RJ (1989) Groundwater-surface water relationships in boreal forestwatersheds: dissolved organic carbon and inorganic nutrient dynamics. Can. J. Fish.Aquat. Sci. 46: 41-49
Hakenkamp C, Palmer MA & James BR (1994) Metazoaps from a sandy aquifer:dynamics across a physically and chemically heterogeneous groundwater system.Hydrpbiologia 287: 195-206
48

Hendricks S & White DS (1995) Seasonal biogeochemical patterns in surface water,subsurface hyporheic, and riparian ground water in a temperate stream ecoystem. Arch.Hydrobiol. 134: 459-490
Jordan TE, Correll DL & Weller DE (1997) Relating nutrient disctarges from watershedsto land use and streamflow variability. Water Resources Res. 33: 2579-2590
Keller C (1991) Hydrogeochemistry of a clayey till 2. Sources ofCO2. Water ResourcesRes. 27: 2555-2564
Kookana, RS& Naidu R (1998) Vertical heterogeneity in soil properties and contaminanttransport through soil profiles. In: P Dillon & Simmers I (Eds) InternationalContributions to Hydrology 18: Shallow Groundwater Systems (pp 15-28). A.A.Balkema, Rotterdam
Lawrence GB, Driscoll CT & Fuller RD (1988) Hydrologic control of aluminumchemistry in an acidic headwater stream. Water Resources Res. 24: 659-669
LeBlanc DR (1984) Sewage plume in a sand and gravel aquifer, Cape Cod,Massachusetts. U.S. Geological Survey, Water-supply paper 2218, Washington
LeBlanc DR, Guswa JH, Frimpter MH & Londquist CJ (1986) Ground-water resourcesof Cape Cod, Massachusetts: U.S. Geological Survey Hydrologic Atlas 692
LeBlanc DR, Garabedian SP, Hess KM, Gelhar LW, Quadri RD, Stollenwerk KG &Wood WW (1991) Large-scale natural gradient tracer test in sand and gravel, Cape Cod,Massachusetts 1. Experimental design and observed tracer movement. Water ResourcesRes. 27: 895-910
Leenheer J, Malcolm RL, McKinley PW & Eccles LA (1974) Occurrence of dissolvedorganic carbon in selected ground-water samples in the United States. J. Res.U.S. Geol.Survey 2: 361-369
Lind A & Eiland F (1989) Microbial characterization and nitrate reduction in subsurfacesoils. Biol. Fert. Soils 8: 197-203
McCarty GW & Bremner JM (1992) Availability of organic carbon for denitrification ofnitrate in subsoils. Biol. Fert. Soils 14: 219-222
McDowell WH & Likens GE (1988) Origin, composition, and flux of dissolved organiccarbon in the Hubbard Brook Valley. Ecol. Monogr. 58: 177-195
Mulder J, Pijpers M & Christophersen N (1991) Water flow paths and the spatialdistribution of soils and exchangeable cations in an acid rain impacted and a pristinecatchment (Norway). Water Resources Res. 27: 2919-2928
49
Neal C, Reynolds B, Stevens P & Hornung M (1989) Hydrogeochemical controls forinorganic aluminium in acid stream and soil waters at two upland catchments in Wales.J. Hydrol. 106:155-175
Obenhuber D & Lowrance R (1991) Reduction of nitrate in aquifer microcosms bycarbon additions. J. Environ. Qual. 20: 255-258
Parkin TB & Meisinger JJ (1989) Denitrification below the crop rooting zone asinfluenced by surface tillage. J. Environ. Qual. 18: 12-16
Parlange, J.-Y., Steenhuis TS, Haverkamp R, Barry DA, Culligan PJ, Hogarth WL,Parlange MB, Ross P & Stagnitti F (1999) Soil properties and water movement. In:Parlange MB & JW Hopmans (Eds) Vadose Zone Hydrology. Oxford University Press,New York
Portniaguine 0 & Solomon DK (1998) Parameter estimation using groundwater age andhead data, Cape Cod, Massachusetts. Water Resources Res. 34: 637-645
Rutherford J & Hynes HBN (1987) Dissolved organic carbon in streams andgroundwater. Hydrobiologia 154: 33-48
Savoie J & LeBlanc DR (1998) Water-Quality Data and Methods of Analysis forSamples Collected Near a Plume of Sewage-Contaminated Ground Water, AshumetValley, Cape Cod, Massachusetts, 1993-94. U.S. Geological Survey, Marlborough
Schiff SL, Aravena R, Trumbore SE, Hinton MJ, Elgood R & Dillon PJ (1997) Export ofDOC from forested catchments on the Precambrian Shield of Central Ontario: clues from13 C and 14 C. Biogeochemistry 36:43-65
Schindler J & Krabbenhoft DP (1998) The hyporheic zone as a source of dissolvedorganic carbon and carbon gases to a temperate forested stream. Biogeochemistry 43:157-174
Smith RL, Howes BL & Duff JH (1991) Denitrification in nitrate-contaminatedgroundwater: occurrence in steep vertical geochemical gradients. Geochim. Cosmochim.Acta 55: 1815-1825
Sokal RR & Rohlf FJ (1995) Biometry: The Principles and Practice of Statistics inBiological Research. W.H. Freeman and Company, New York
Solomon DK, Poreda RJ, Cook PG & Hunt A (1995) Site characterization using 3H/3Heground-water ages, Cape Cod, MA. Ground Water 33: 988-996
Stollenwerk KG (1996) Simulation of phosphate transport in sewage-contaminatedgroundwater, Cape Cod, Massachusetts. Appl. Geochem. 11: 317-324
50
Thurman EM (1985) Organic Geochemistry of Natural Waters. Martinus Nijhoff/DR W.Junk Publishers, Dordrecht
Sullivan TJ, Christopherson N, Muniz IP, Seip HM & Sullivan PD (1986) Aqueousaluminium chemistry response to episodic increases in discharge. Nature 323: 324-327
Valiela I, Collins G, Kremer J, Lajtha K, Geist M, Seely B, Brawley J, and Sham CH(1997) Nitrogen loading from coastal watersheds to receiving estuaries: new method andapplication. Ecol. Appl. 7: 358-380
Vogel JC (1967) Investigation of groundwater flow with radiocarbon. In: Isotopes inHydrology (pp. 355-369). IAEA-SM-83/24, Vienna
Wan J & Tokunaga TK (1997) Film straining of colloids in unsaturated porous media:conceptual model and experimental testing. Environ. Sci. Technol. 31: 2413-2420
51
CHAPTER 3:
DENITRIFICATION RATES IN GROUNDWATER, CAPECOD, U.S.A.: CONTROL BY NITRATE AND DISSOLVED
ORGANIC CARBON CONCENTRATIONS
52
Running head:
Article type:
Title:
Authors:
Affiliations:
Corresponding author:
Key words:
Denitrification in groundwater
General research
Denitrification rates in groundwater, Cape Cod, USA:Control by N0 3 apd DOC concentrations
Wendy J. Pabichl*, Harold F. Hemond', and Ivan Valiela2 .
1) Massachusetts Institute of Technology, Department ofCivil and Environmental Engineering, Ralph M. ParsonsLaboratory, Cambridge, MA 02138, U.S.A.
2) Boston University Marine Program, Marine BiologicalLaboratory, Woods Hole, MA 02543, U.S.A.
Wendy J. Pabichc/o Boston University Marine ProgramMarine Biological LaboratoryWoods Hole, MA 02543USATelephone: (508) 289-7615Fax: (508) 289-7949Email: [email protected]
Cape Cod, denitrification, groundwater, nitrogenattpnuation, saturated zone
53
Abstract. Eutrophication by land-derived anthropogenic nitrogen (N) is a major cause ofalterations to coastal systems worldwide. Modeling N delivery to coastal waters istherefore critical to designing appropriate land use and management strategies to controlN loading. Key to calculating watershed N budgets is understanding N losses bydenitrification as groundwater is transported through aquifers en route to receivingestuaries. We used a stable isotope approach to estimate denitrification rates ingroundwater in and near the Waquoit Bay watershed on Cape Cod, USA. Two field sitesprovided a large range of groundwater nitrate and dissolved organic carbon (DOC)concentrations. Nitrification, although understandably important in the soils layer andvadose zone, produced only minimal amounts of nitrate in the saturated zone, evidentlydue to a limited supply of ammonium in the groundwater. Denitrification rates increasedwith both increasing initial nitrate and DOC concentrations, and ranged from 0 to 2.1 x10i pM N Y'. We compared these rates to those measured in a- septic plume (Ch. 4).First order denitrification rate constants with respect to nitrate were highest wheregroundwater DOC concentrations were highest, suggesting that, independent of nitrateconcentration, DOC concentration exerts a significant control on denitrification rates. Inprevious work (Ch. 2) we showed that groundwater DOC concentrations decreased as thethickness of the vadose (unsaturated) zone through which recharge occurred increased.As a result, higher denitrification rates are likely to be found in those areas where thevadose zone is thinnest. A simulation of N losses along groundwater flowpaths at CraneWildlife suggests that a saturating kinetics expression with respect to nitrate best predictsnitrate concentrations measured at the downgradient well ports. We conclude that it iscritical to consider the magnitude of individual N0 3 sources, travel distances to shore,and DOC concentrations in groundwater in assessing the downgradient impact of variousN sources, and in designing strategies to control anthropogenic nitrogen loading.
54
1. Introduction
Eutrophication by land-derived anthropogenic nitrogen (N) is a major case of
alterations to coastal ecosystems worldwide (GESAMP 1990, NRC 1994, Nixon 1986).
In the US, Long Island Sound, NY, and Chesapeake Bay, MD, and sites such as Waquoit
Bay and Wellfleet Harbor on Cape Cod, MA, are experiencing cultural eutrophication. In
these and many other estuaries, excess nutrients, largely N, are inducing loss of
commercially important fish species, contamination of shellfish beds, and alteration of
valuable habitat including eelgrass beds (Costa 1988, GESAMP 1990, NRC 1994, NRC
2000, Nixon et al. 1986, Howarth et al. 1996).
In coastal areas underlain by unconsolidated sands, such as Cape Cod, the
majority of land-derived N delivered to the coastal zone is transported by groundwater
(Valiela et al. 1992). Understanding how N is transformed ano transported within
aquifers is therefore necessary to calculating watershed N budgets, understanding basic
nitrogen biogeochemistry, and estimating total N delivery to cqastal waters. Previous
mass balance data suggests that significant losses of N can occur within watersheds and
aquifers (Lee and Olson 1985, Valiela at al. 1992, Valiela and Costa 1988). Processes
capable of attenuating mobile N include dilution, adsorption and incorporation in soils
and forest biomass, assimilatory reduction into microbial bionass, dissimilatory nitrate
reduction to (sorbable) ammonium (DNRA), and denitrification (Korom 1992).
Denitrification is a significant sink for N in aquifers, as argued in many papers
using mass balance methods (Bengtsson and Annadotter 1989, Bottcher et al. 1990,
55
Bragan et al. 1997, Bragan et al. 1997a, Clay et al. 1996, Gillharn 1991, Gold et al. 1998,
Groffinan et al. 1996, Jacinthe et al. 1998, Korom 1992, Petqrjohn and Correll 1984,
Valiela et al. 1992, Valiela et al. 2000, Verchot et al. 1997). Convincing evidence for
denitrification in groundwater includes experimental injections in which N0 3-disappears
downgradient faster than conservative tracers, and in which the loss of N0 3 is
accompanied by increases in bicarbonate believed to be derived from carbon
mineralization associated with microbial denitrification (Korom 1991, Trudell et al.
1986). Other evidence suggests that changes in the ratio of N isotopes (15 N/14 N) in
ambient N0 3 " or in injections of isotopically-enriched tracers, and/or changes in the
concentration of N2, derive from denitrification in groundwater (Fustec et al. 1991,
Mariotti et al. 1988, Smith et al. 1991, Vogel et al. 1981). Rates of denitrification
reported in the literature span several orders of magnitude (0.004 to 1.05 mg N kg -1 dry
sediment per day in laboratory core incubations; 0.04 to 2.17 M hW in aquifers
containing N derived from agriculture, Korom 1992), arkd likely reflect both the
variability in biogeochemical conditions across aquifer settings and differing
experimental approaches.
Denitrification rates measured in controlled laboratory experiments have been
modeled using the Michaelis-Menten enzyme kinetic equation with respect to nitrate
concentration (Engberg and Schroeder 1975), and as a first-order function of organic
carbon substrate (Brenner and Argamann 1990). Because, in general, reduction rates are
likely to vary as a function of both electron donor and nitrate concentrations, N loss rates
in groundwater should be modeled to reflect variable chemical conditions.
56
Concentrations of organic matter and nitrate in groundwater are patchy and may
result in spatially variable denitrification rates. DOC concentrations in growdwater
range from 0.1-27 mg DOC F1 (Pabich et al. submitted, Ford and Naiman 1989, Fiebig et
al. 1990, Fiebig 1995), and mean concentrations may be higher than previous studies
suggest (e.g. Leenheer et al. 1974). On Cape Cod, measured groundwater nitrate
concentrations vary by several orders of magnitude. Concentrations in groundwater
range from 0 to 2.7 pM beneath forested areas (Seely 1997), from < 1 to ~ 1,000 pM in
the suburban subwatersheds of Waquoit Bay (Valiela et al. 2000) snd around a pond in a
residential area (Kroeger et al 1999), up to 1,800 pM within the Massachusetts Military
Reservation wastewater plume (Savoie and LeBlanc 1998), and as high as 4,300 pM in
close proximity to a septic tank (our unpublished data). Denitrification rates within this
Cape Cod aquifer are likely to be similarly variable. The goal of this study was to
estimate groundwater denitrification rates and to examine how they vary as a function of
nitrate and DOC concentrations.
2. Approach
Stable isotopes of N have been used effectively to study denitrification (Mariotti
et al. 1988, Bottcher et al. 1990, Smith et al. 1991). We used such an approach to
estimate both nitrification and denitrification rates occurring in groundwater after the
time of recharge to the water table. We measured 1 5N natural abundance variations
(Mariotti et al. 1988) in ammonium and nitrate in groundwater samples obtained from
wells installed in locations within the aquifer where N0 3 and DOC concentrations
differed significantly. Using the Rayleigh equation, which expresses the evolution of the
57
isotopic composition of residual nitrate (or ammonium) during denitrification (or
nitrification), we estimated initial ammonium and nitrate concentrations at the water
table, from which losses due to nitrification and denitrification were assessed. Such mass
balance data were coupled with a groundwater age model (Vogel 1967) to estimate
nitrification and denitrification rates, respectively.
3. Nitrogen isotope geochemistry -
Because denitrifying organisms preferentially utilize the lighter isotope of
nitrogen (14N), fractionation of the nitrogen isotopes in the reactants and the products
occurs. The result is a predictable enrichment of '5N in residual substrate N0 3~ and
depletion in the N2 and N20 products of denitrification. This process has been described
as a single-step, unidirectional reaction (Mariotti et al. 1981, 1988), in which the 15 N
content of the N0 3 is a simple function of the progress of the reaction.
Isotopic fractionation occurs as a result of many biological (and abiotic) reactions,
including both nitrification and denitrification. The Rayleigh equation expresses the
evolution of the isotopic composition of the residual (reactant) material, and can be used
to model both nitrification and denitrification. The relationship is expressed as:
(1) 6s = so + e In (C/Co),
where o, represents the isotopic ratio (5'Nor J'N/N) of the reactant at time t, 6so is the
6'SN of the reactant at time = 0, . is the isotope enrichment factor (%o) of the reaction, C
58
is the reactant content at time t, and Co is the initial reactant content. Stable isotopic
ratios are expressed as del (6) values in per mil (%o) deviations from standard
atmospheric nitrogen where:
(2) 15N= [(RsampIw1Rstanar)-1IX 1000, and R = ' 5N/ 4N.
The isotopic composition of the reaction product (N0 3~ for nitrification, N2 for
denitrification) becomes progressively heavier as the reaction proceeds, and can be
calculated for any given amount of substrate consumed, using a modified version of the
Rayleigh expression:
(3) JNproduct = 4 5Nreactant - e[f Inf/(1 -f)]
where cVNproduct is the 5NP of the product of the reaction (e.g., NO3 or N2), P1 Nreacant is
the 6'5N of the reactant (e.g., NH4 or NO3 ), 6 is the isotopic enrichment factor for the
reaction, andf is the unreacted fraction of the substrate (Mariotti Pt al. 1981). We used
the Rayleigh equation (Eq. 1) to assess the rates of both nitrification and denitrification in
our groundwater samples, and the product formation expression (Eq. 3) to calculate the
615N value of N0 3 produced via nitrification beneath the water table.
4. Study Sites
This work was carried out in or near the watershed of Waquoit Bay, a shallow
estuary on the southwestern shore of Cape Cod, Massachusetts (Fig. 3.1), subject to
59
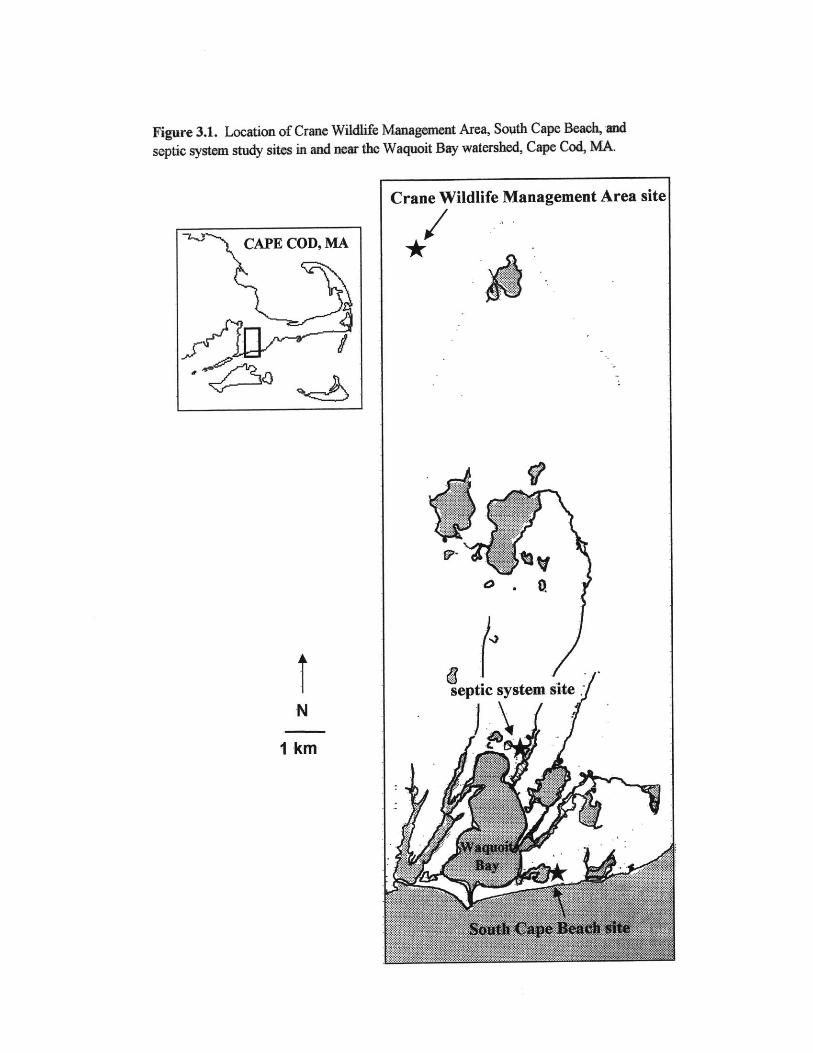
Figure 3.1. Location of Crane Wildlife Management Area, South Cape Beach, -=d
septic system study sites in and near the Waquoit Bay watershed, Cape Cod, MA.
Crane Wildlife Management Area site
septic system site:
'4
.........
02;Y". M
IN WNR 1:
CAPE COD, MA
-. I
N
1 km

increasing eutrophication from groundwater-transported nitrogen. The watershed is
underlain by an unconsolidated sole-source sand and gravel qquifer (Barlow and Hess
1993, Leblanc et al. 1986). The aquifer matrix is comprised primarily of quartz and
feldspar sand (95%) with some ferromagnesian aluminosilicates and oxides (5%); sand
grains are coated with hydrous oxides of aluminum and iron (Stollenwerk 1996).
Average groundwater velocity is approximately 0.4 m per day (LeBlanc 1991), and mean
annual recharge is 53 cm yr-1 (Barlow and Hess 1993, LeBlanc 1984). Groundwater
discharge to Waquoit Bay and its tributaries accounts for 89% of the total freshwater
input to Waquoit Bay (Cambareri 1998), and is the primary avenue by which land-
derived nitrogen is delivered to the estuary (Valiela et al. 1997).
We sampled groundwater at two sites that differed in DOC and N0 3 ~
concentrations: the Crane Wildlife Management Area to the rporth of the Waquoit Bay
watershed, and South Cape Beach near the Bay (Fig. 3.1). DOC concentrations in the
underlying groundwater at these two field sites differed because of differences in the
thickness of their vadose zones. We have shown (Pabich et al. submitted) that
groundwater DOC concentrations at these sites are inversely related to the thickness of
the vadose zone through which recharge occurs, presumably because DOC is attenuated
during transport through the unsaturated zone by sorption to minqral surfaces (e.g. Fe and
Al oxides and hydroxides) and clay minerals (Thurman 1985), microbial oxidation to
CO2 (Chapelle 1992), precipitation, flocculation and formation of insoluble complexes
(Kookana and Naidu 1998), and filtering of organic colloids (Wan and Tokunaga 1997).
DOC concentrations beneath shallow vadose zones also appear to be more spatially
61
variable than beneath thick vadose zones. The vadose zone thickness is generally less
than a meter at South Cape Beach, and, correspondingly, groundwater DOC
concentrations were relatively high and variable (range = 0.8 to 23.4 mg C f1, mean = 7.0
mg C F'). In contrast, at Crane Wildlife, depth to groundwater ranged from 4 to 5.5 m,
and groundwater DOC concentrations were consistently low (range = 0.04 to 1.9 mg C I-
mean = 0.4 mg C 1-).
Groundwater nitrate concentrations differed at the two 4ites as well. The land
cover at South Cape Beach consists of mixed pitch pine and scrub oak forest typical of
forested areas throughout Cape Cod. At this site, the only sources of nitrate are
presumably soil organic matter and precipitation. Measured groundwater nitrate
concentrations at this site ranged from 0 to 4.0 pM, consistent with nitrate concentrations
found beneath other forested areas in the Waquoit Bay watershed (Seely 1997).
Land cover at Crane Wildlife is similar to that at South Cape Beach, except that
the site also contains several abandoned fields, and is downgradient from a golf course on
the Massachusetts Military Reservation; additional sources of nitrate to groundwater
include fertilizers applied regularly to the golf course (John Callahan, manager, Falcon
Golf Course, personal communication) and periodically to the abandoned fields (Richard
Turner, MA Division of Fish & Wildlife, personal communication). The inter- and intra-
site differences in groundwater DOC and nitrate concentrations provided the opportunity
to evaluate the role of both DOC and N0 3" as controls on denitrification rate.
62
5. Methods
5.1. Groundwater sample collection
At Crane Wildlife, we installed and sampled groundwater from three multi-level
sampling wells (MLSs; LeBlanc 1991) arranged in a transect parallel to groundwater
flow (Fig. 3.2). Groundwater flow direction was determined using a MODFLOW model
(Masterson et al. 1997). Each MLS had between 9 and 15 ports spanning from just below
the water table to a maximum depth of 9.3 m below the water table. At each port a 0.64
cm diameter polyethylene tube protruded through a central 3.2 cm PVC pipe and was
covered with a nylon screen (Smith et al. 1991). Samples were taken in duplicate during
June 1998 using a peristaltic pump (Geopump 2, Geotech Environmental Equipment,
Inc.) after purging a minimum of 3 well volumes (13.8 ml per m tube length) from each
port.
At South Cape Beach, we established and sampled from 12 sampling stations
around the perimeter of Sage Lot Pond (Fig. 3.1) in March, June and August 1998.
Groundwater was sampled using a drive-point piezometer and hand pump. Samples were
taken in duplicate after purging groundwater through the piezometer (generally 1-2 liters)
until the water was free of visible turbidity.
5.2. Chemical analysis
All samples were collected in acid-washed 250 ml plastic bottles. Samples from
the MLSs were filtered in-line during pumping using 0.7 prm Whatman GF/F filters.
63
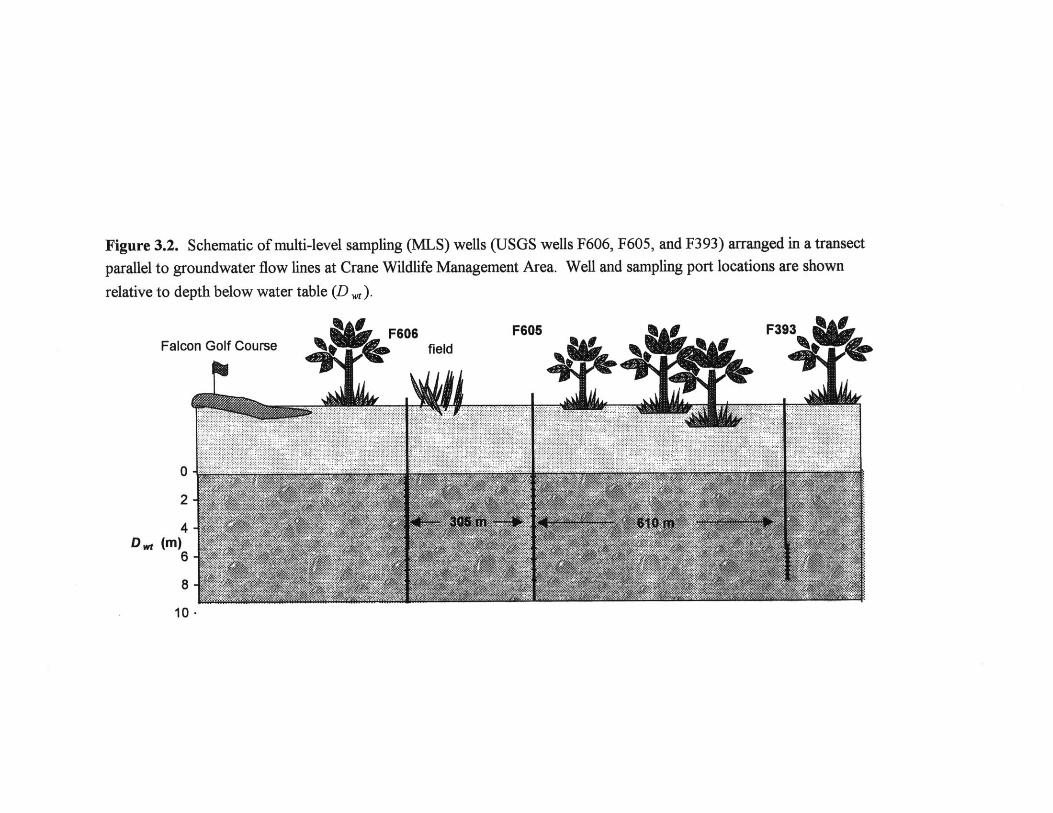
Figure 3.2. Schematic of multi-level sampling (MLS) wells (USGS wells F606, F605, and F393) arranged in a transect
parallel to groundwater flow lines at Crane Wildlife Management Area. Well and sampling port locations are shown
relative to depth below water table (D,).
Falco
I
1 Golf Course
2
4D wt (K
6
8
10.
F606 F605field
TI
IMP
9nrl I. ..............
!N ..... ... ....... ... . - -.e-. K . %%" **........... ................. ....... ..... .. .............. ..................... ...... ................. ... ... ...............
...............-X ............... N.X.......... ....... .. ...
...... ....................... ............... ......
.... .. ....... ...... ............ ................................................. ............................................. ............................... .............. ............ ... ..... . .....
F393qv II&RAIrr
_01k e d.1111111111W
Samples obtained using the piezometer were vacuum filtered through the same filters
upon return to the lab. All samples were acidified to pH w 2 with 5N HCl and stored in a
cold room (T = 4 *C) until analysis.
We measured N0 3~ concentrations using a Dionex ion cbromatograph (DX-120)
with a conductivity detector; for samples with concentrations of N0 3 ~ < 3.2 PM
the ion chromatograph was coupled to a Waters 484 Tunable Absorbance detector (UV).
The UV detector allowed for measurement of N0 3-as low as 0.10 pM. Ammonium was
measured using the OPA fluorescence method of Holmes et al. (1999). We used both
Hydrolab Minisonde and YSI 85 probes to measure dissolved oxygen and specific
conductivity in the field. DOC concentrations in triplicate Ar-purged samples were
measured using high temperature catalytic oxidation (HTCO) with infrared detection of
CO 2 (Shimadzu TOC 5000). Stable isotope analysis of nitrate and ammonium was
conducted by David Harris at University of California, Davis, and by Robert Michener at
the Boston University Stable Isotope Laboratory using Finnigan Delta S isotope ratio
mass spectrometers, and expressed in per mil notation (Eq. 2). Samples were prepared
for analysis using an adaptation of the ammonium diffusion method for oceanic nitrate
(Sigman et al. 1997).
6. Modeling Framework and Assumptions
For each groundwater sample collected at Crane Wildlife, we calculated the
average denitrification rate occurring over the groundwater flowpath, between the point
65
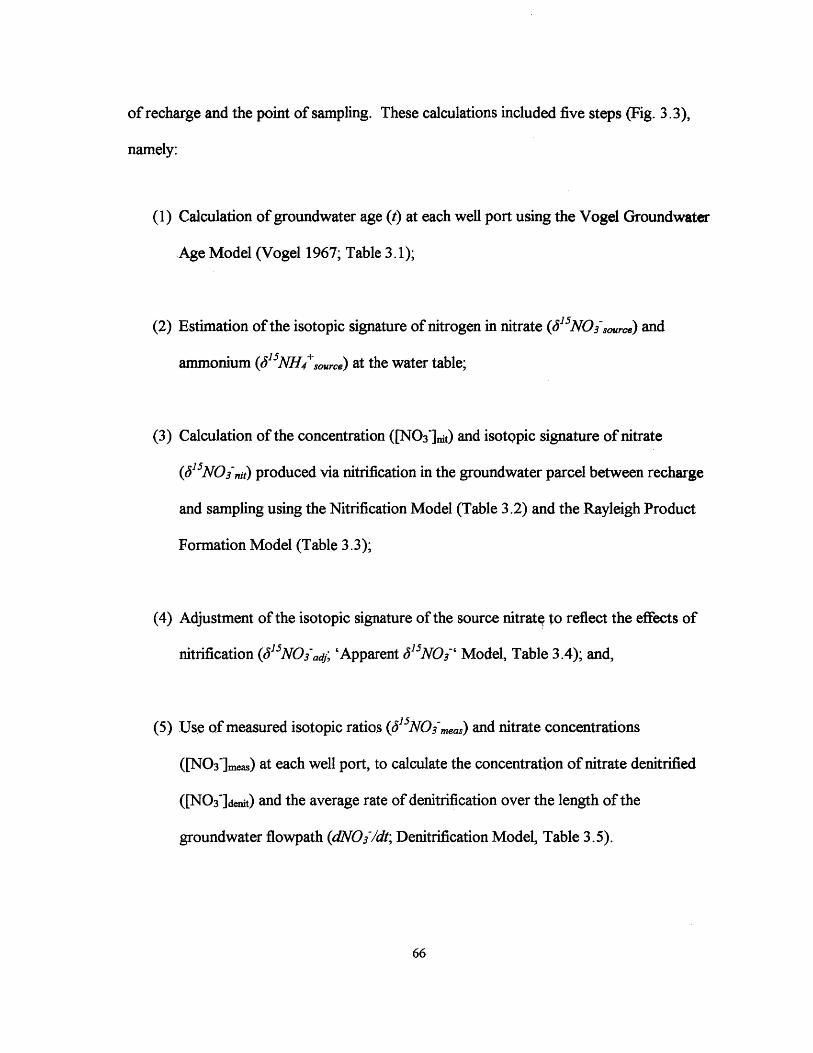
of recharge and the point of sampling. These calculations included five steps (Fig. 3.3),
namely:
(1) Calculation of groundwater age (t) at each well port using the Vogel Groundwater
Age Model (Vogel 1967; Table 3.1);
(2) Estimation of the isotopic signature of nitrogen in nitrate (P 1 NOisourc.) and
ammonium (6' 5NH4+sourc,) at the water table;
(3) Calculation of the concentration ([NO3]fit) and isotopic signature of nitrate
(615NOi 1ni) produced via nitrification in the groundwater parcel between recharge
and sampling using the Nitrification Model (Table 3.2) and the Rayleigh Product
Formation Model (Table 3.3);
(4) Adjustment of the isotopic signature of the source nitratq to reflect the effects of
nitrification ( 15 NOiadj; 'Apparent 615NO1' Model, Table 3.4); and,
(5) Use of measured isotopic ratios (&''NOmeas) and nitrate concentrations
([NO3i]mea,) at each well port, to calculate the concentration of nitrate denitrified
([NO3idAt) and the average rate of denitrification over the length of the
groundwater flowpath (dNO3/dt; Denitrification Model, Table 3.5).
66
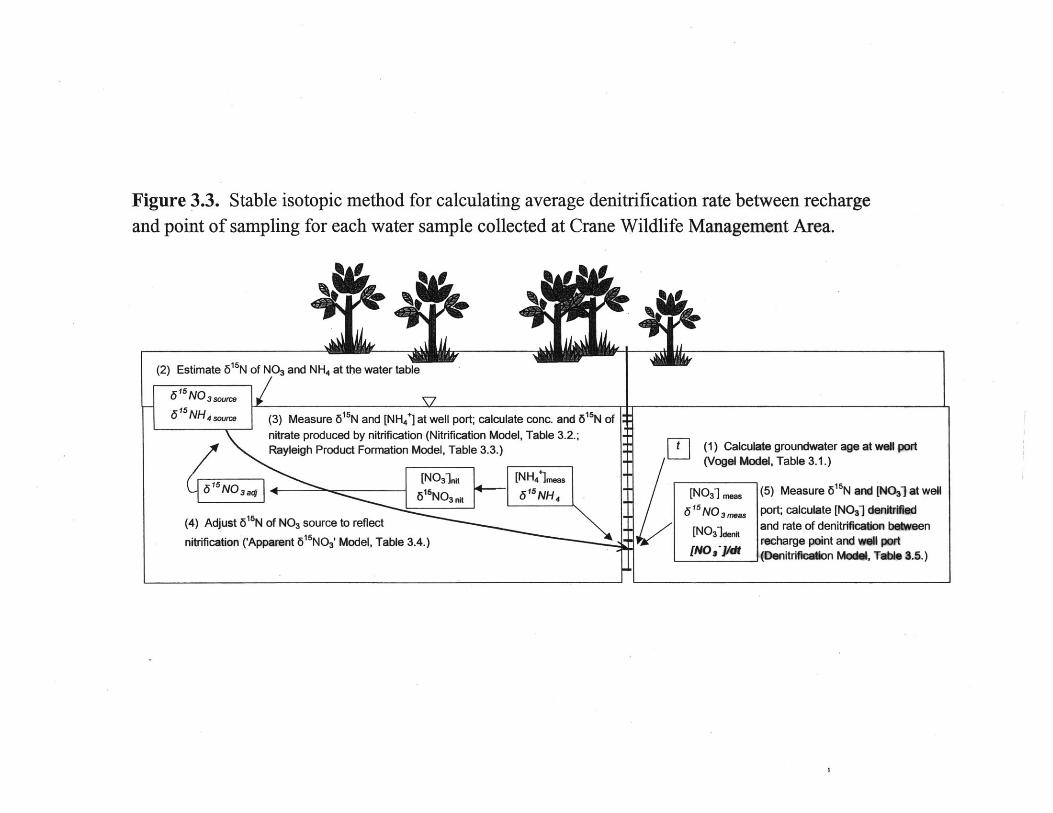
Figure 3.3. Stable isotopic method for calculating average denitrification rate between rechargeand point of sampling for each water sample collected at Crane Wildlife Management Area.
(2) Estimate 615N of NO 3 and NH 4 at the water table
.... 4 N~ sourme6"NH sorce(3) Measure 615N and [NH41] at well port; calculate conc. and 61 N of
nitrate produced by nitrification (Nitrification Model, Table 3.2.;Rayleigh Product Formation Model, Table 3.3.)
[NO3-Lt [NH-41]meas
6"Ns a616N03, 6NH4
(4) Adjust 61rN of N03 source to ref ect
nitrification ('Appairent 6'N03' Model, Table 3.4.)
i&LaAfur
Ij~
Mt (1) Calculate groundwater age at well port(Vogel Model, Table 3.1.)
[N0 31 m (5) Measure 616N and [N031 at well
6'5NO 3 es port; calculate [NO3~ denirmd
[NO31dnit and rate of denitrification bseenrecharge point and well port
[NO sY* Denitriflafon MoW, Tbla 3.5.)
*1
I
% Ff A f
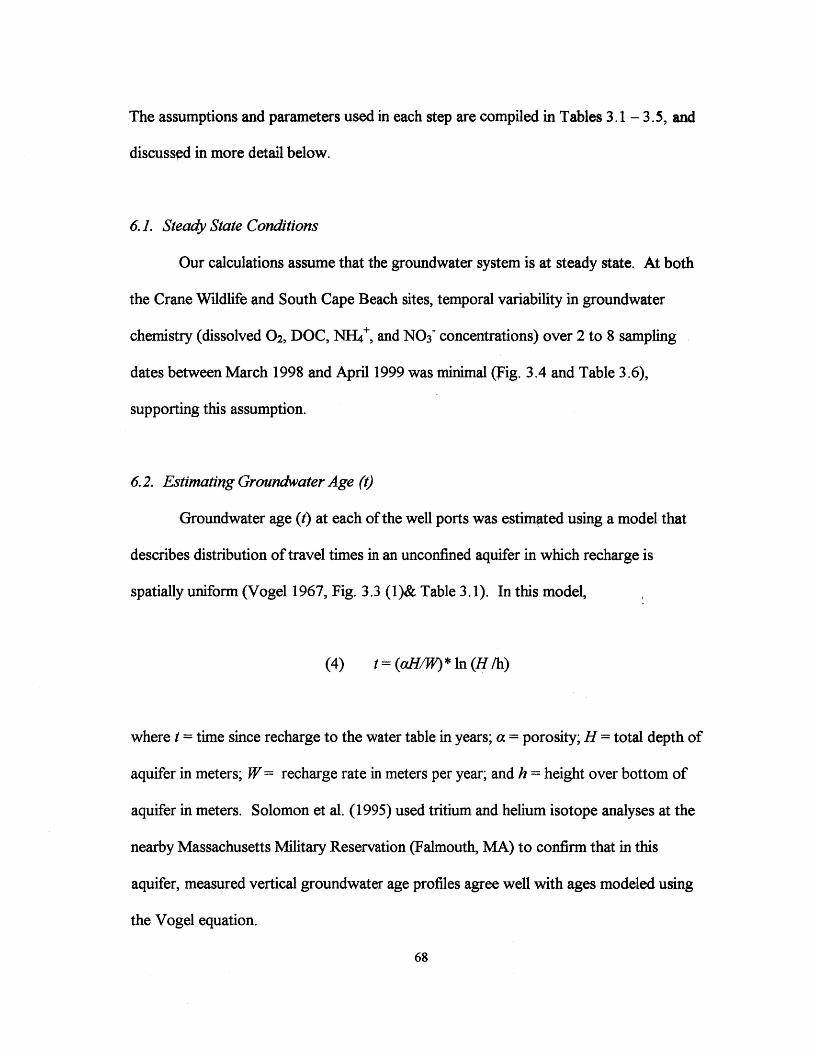
The assumptions and parameters used in each step are compiled in Tables 3.1 - 3.5, and
discussed in more detail below.
6.1. Steady State Conditions
Our calculations assume that the groundwater system is at steady state. At both
the Crane Wildlife and South Cape Beach sites, temporal variability in groundwater
chemistry (dissolved 02, DOC, NH4+, and N0 3 concentrations) over 2 to 8 sampling
dates between March 1998 and April 1999 was minimal (Fig. 3.4 and Table 3.6),
supporting this assumption.
6.2. Estimating Groundwater Age (t)
Groundwater age (t) at each of the well ports was estimgted using a model that
describes distribution of travel times in an unconfined aquifer in which recharge is
spatially uniform (Vogel 1967, Fig. 3.3 (1)& Table 3.1). In this model,
(4) t = (aH/W)* In (H /h)
where t = time since recharge to the water table in years; a = porosity; H = total depth of
aquifer in meters; W= recharge rate in meters per year; and h = height over bottom of
aquifer in meters. Solomon et al. (1995) used tritium and helium isotope analyses at the
nearby Massachusetts Military Reservation (Falmouth, MA) to confirm that in this
aquifer, measured vertical groundwater age profiles agree well with ages modeled using
the Vogel equation.
68
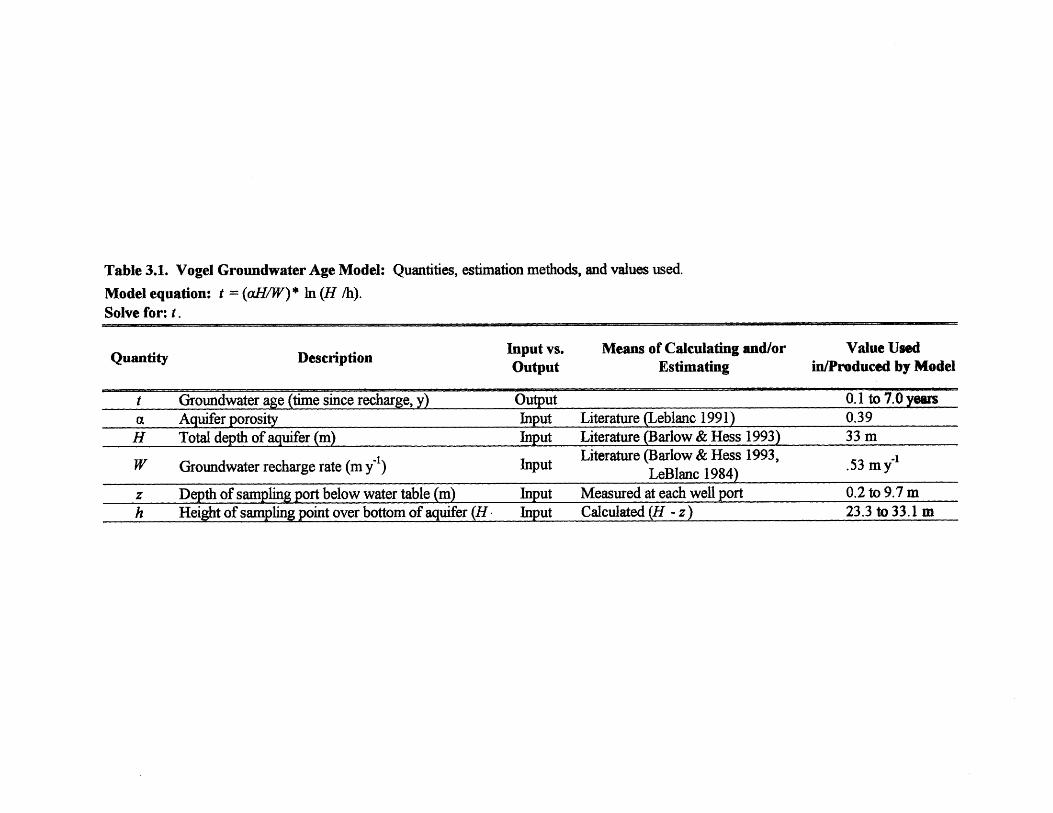
Table 3.1. Vogel Groundwater Age Model: Quantities, estimation methods, and values used.
Model equation: t = (aH/W) * In (H /h).Solve for: t.
Input vs. Means of Calculating and/or Value UsedQuantity Description Output Estimating in/Produced by Model
t Groundwater age (time since recharge, y) Output 0.1 to 7.0 yarsa Aquifer porosity Input Literature (Leblanc 1991) 0.39H Total depth of aquifer (m) Input Literature (Barlow & Hess 1993) 33 m
W Groundwater recharge rate (m y-1 input Literature (Barlow & Hess 1993, .53 my'LeBlanc 1984)
z Depth of sampling port below water table (m) Input Measured at each well port 0.2 to 9.7 mh Height of sampling point over bottom of aquifer (H Input Calculated (H - z) 23.3 to 33.1 m

Table 3.2. Nitrification Model: Quantities, estimation methods, and values used.
Model equations: 5 1NH ,. =. 3'NH4 ource + S * In ([NH4+]. / [H4],);[NO3],i = [NH4*]m,= - [H4]m,; and
Nitrification rate = ([NO3 ],) / t;
Solve for: [NH4],., [NO31,.t and Nitrification rate.
Quantity Description nput vs. Means of Calculating and/or Estimating Value Used in/Produced by ModelOutput
Soil: Measured in upper well ports Soil: +1.6 %.( 4 N oH 6urc '-1 N of NH4 at the water table Input Fertilizer: Literature (Hubner 1986, Kendall & Fertilizer: -1.9 %0
McDonnell 1998)
[NH]. NW concentration at the water table output Soil: .04 to 4.1 sMFertilizer: .01 to 2.4 pM
15 "1 + 4 me, J- 'NH + 4 measured at each well port Input Measured at each well port Soil: -11.2 to +10.0 %oFertilizer: + 5.9 to +14.9 %o
[NH4 ]meas NH4 concentration at each well port Input Measured at each well port Soil: <.01 to 2.9 FMFertilizer: <.01 to 1.8 pM
ni Enrichment factor for nitrification reaction Input Literature (Kendall & McDonnell 1998) -21 %o
[NO 31i Quantity of nitrate produced via nitrification Output Soil: 0 to 1.2 pMFertilizer: 0 to 0.8 pM
t Groundwater age (time since recharge) Input Vogel model (Table 1) 0.1 to 7.0 years
Nitrification rate Average rate of nitrification over flow path Output Soil: mean= 1.0 x 10⁻⁴ sM 'hFertilizer: mean = 5.6 x 10" pM h"'

Table 3.3. Rayleigh Product Formation Model: Quantities, estimation methods, and values used.
Model equation: 15N0 3- nit = 8 1 NI mew - nit* [f * Inf / (1 -f)];
f = ([NIwi] - [N03-1n)/[N 1==;
Solve for: 5'N03it.
Quantity Description Input vs. Means of Calculating and/or Value Used in/Produced byOutput Estimating Model
6' 5NO3,- , 3'-N of NO3 produced via nitrification Output Soil: -15.6 to -21.%Fertilizer: -15.2 to21.6 %.
5,NH4 + m m NH 44 measured at each well port Input Measured at each well port Soil: -11.2 to +10.0 %.
Fertilizer: + 5.9 to + 14.9 %a
8 Enrichment factor for nitrification reaction Input Literature (Kendall & McDonnell 1998) -21 %o
Soil: 0.71 to 0.90f Unreacted fraction of substrate Input Calculated Fertilizer: 0.46 to 0.98
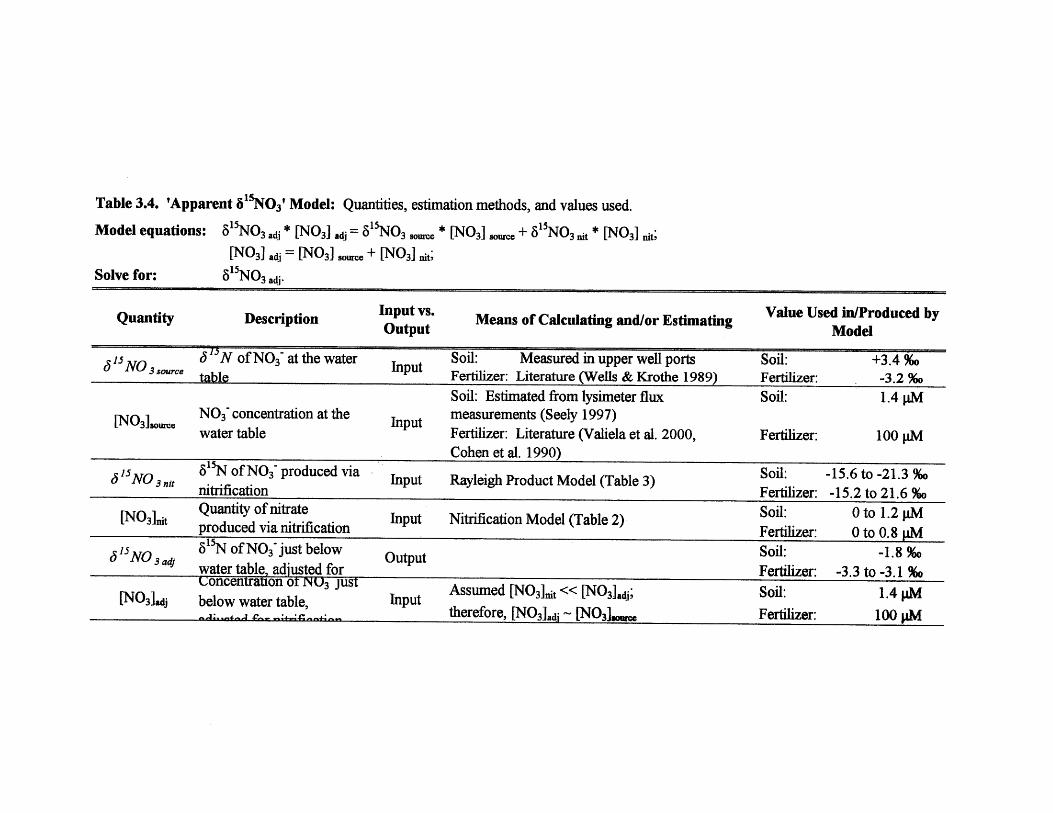
Table 3.4. 'Apparentl 5 0 3' Model: Quantities, estimation methods, and values used.
Model equations: 8sN0 3 adi * [NO 3] ai = 8"N0 3 source
[NO 3] adi = [N 3] source + [NO 3] nit;
Solve for:
* [NO3] s. + 8' 5N0 3nit * [N03] nit;
5 N0 3 ad*
Quantity Description Input vs. Means of Calculating and/or Estimating Value Used in/Produced byOutput Model
5 -NO o "N of N0 3~ at the water Input Soil: Measured in upper well ports Soil: +3.49%o5Ns rce table Fertilizer: Literature (Wells & Krothe 1989) Fertilizer: -3.2 %oSoil: Estimated from lysimeter flux Soil: 1.4 pM
[NO3 ]0 NO3~ concentration at the Input measurements (Seely 1997)water table Fertilizer: Literature (Valiela et al. 2000, Fertilizer: 100 PM
Cohen et al. 1990)
6 'NO 515N of N0 3 produced via Input Rayleigh Product Model (Table 3) Soil: -15.6 to -21.3 %onitrification Fertilizer: -15.2 to 21.6 %o
[NO 3]t Quantity of nitrate Soil: 0 to 1.2 pMproduced via nitrification Input Nitrification Model (Table 2) Fertilizer: 0 to 0.8 pM
'5 NO 3 5Nof N0 3~just below Output Soil: -1.8%o
water table, adjusted for Fertilizer: -3.3 to -3.1 %oUoncentrauon INU3 Just Assumed [NO3]nt << [N 0 3]aj; Soil: 1.4 pM[N03]ad below water table, Input
therefore, [N03]adi ~ [N03".m Fertilizer: 100 PM
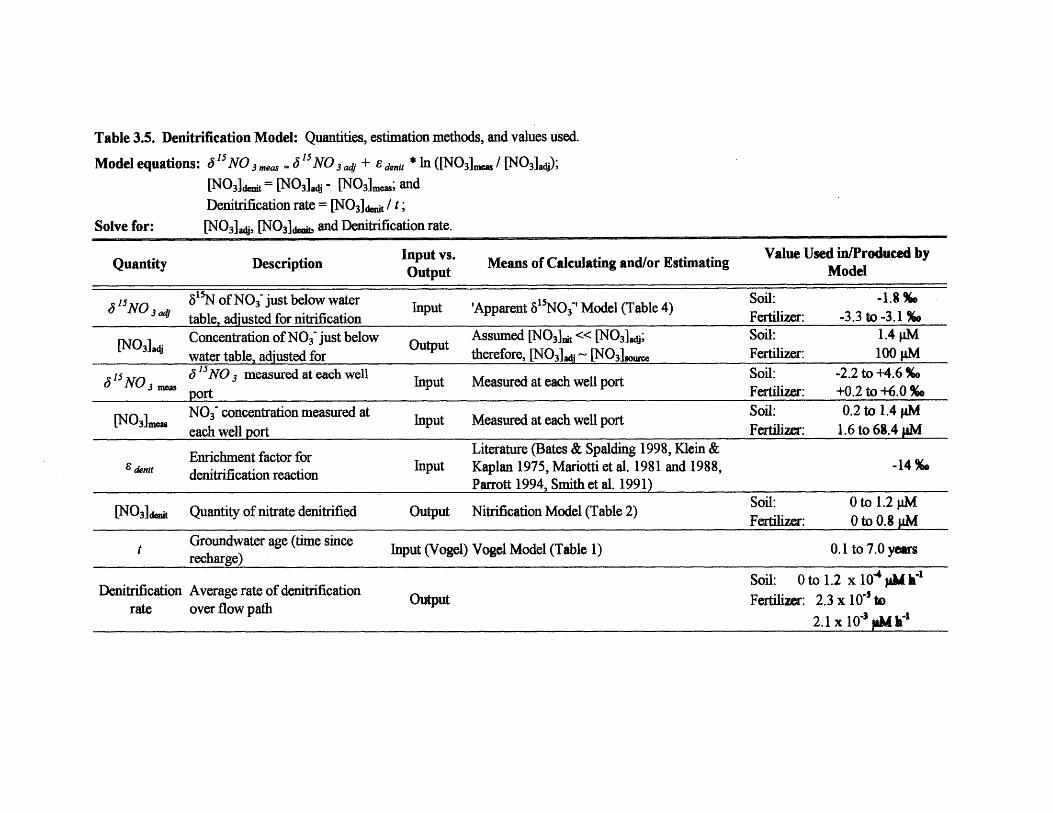
Table 3.5. Denitrification Model: Quantities, estimation methods, and values used.
Model equations: 6 15N03,,,,, = (5'5NO3 j + ,dent * In ([NO 3]1", / [NO3]ad);
[NO31den= [N) 3]ad. - [NO 3 meas; andDenitrification rate= [NO3]d / t;
[NO3a4j, [NO 3 ]o, and Denitrification rate.
Quantity Input vs. en Value Used in/Produced byQuantity Description Input' Means of Calculating and/or Estimating ModeloutputMoe
6 1 5No3 ,, 55of N0 3 just below water Input 'Apparent 8'5N0 3 ' Model (Table 4) Fril:table, adjusted for nitrification Fertilizer: -3.3 to -3.1 %9
[NO]d Concentration of N0 3~just below outut Assumed [NO 3 ,k << [NO 3 adj; Soil: 1.4 pM3 water table, adjusted for therefore, [NO 3]1 ~ [NO31.m) Fertilizer: 100 PM
S lNO3 W 6 "NO3 measured at each well Inpu Mes h well h well port Soil: -2.2 to +4.6 %o, ort port Fertilizer: +0.2 to +6.0 %o
[NO]mon N0 3 concentration measured at Input Measured at each well port Soil: 0.2 to 1.4 sMeach well port Fertilizer: 1.6 to 68.4 pM
Enrichment factor for Literature (Bates & Spalding 1998, Klein &'"t denitification reaction Input Kaplan 1975, Mariotti et al. 1981 and 1988, -14%e
Parrott 1994, Smith et al. 1991)
[N031dei Quantity of nitrate denitrified Output Nitrification Model (Table 2) Soil: 0 to 1.2 pMFertilizer: 0 to 0.8 PM
t Groundwater age (time since Input (Vogel) Vogel Model (Table 1) 0.1 to 7.0 years
Soil: 0 to 1.2 x 10 4 PM hDenitrification Average rate of denitrification output Fertilizer: 2.3xl0'to
rate over flow path 2.1x10 3 pmv
Solve for:
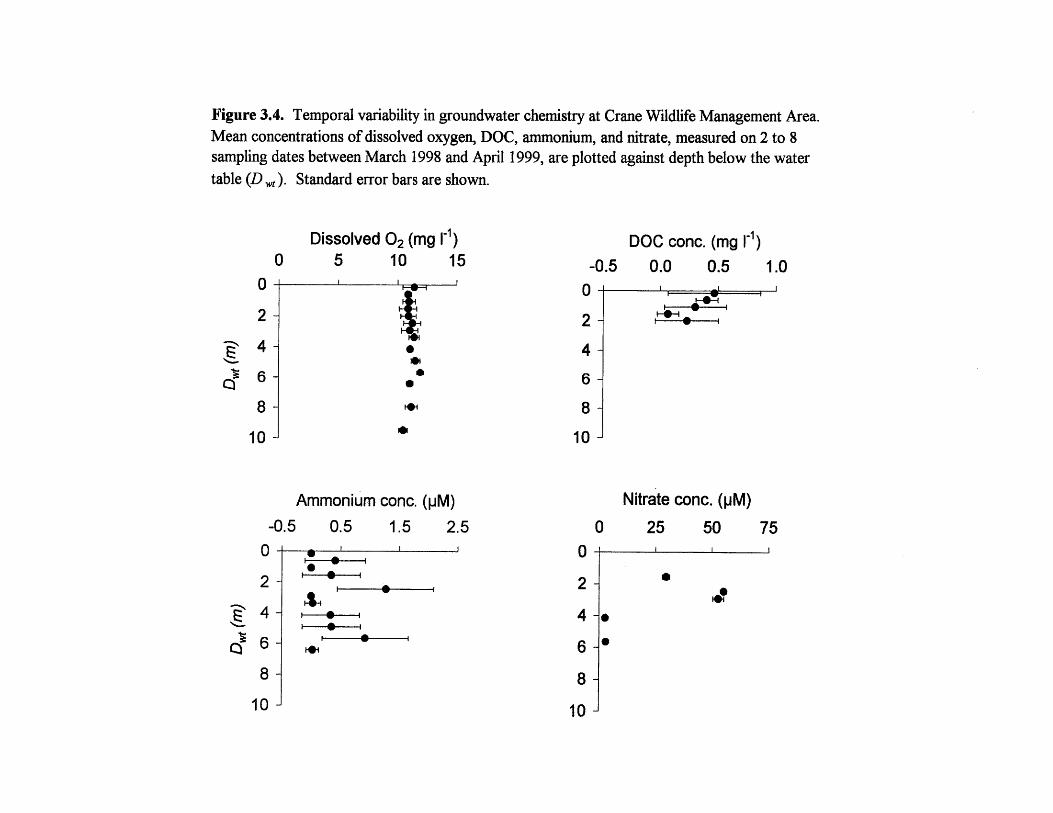
Figure 3.4. Temporal variability in groundwater chemistry at Crane Wildlife Management Area.Mean concentrations of dissolved oxygen, DOC, ammonium, and nitrate, measured on 2 to 8sampling dates between March 1998 and April 1999, are plotted against depth below the watertable (D w). Standard error bars are shown.
2-
4-
6-
8-
10 -
Dissolved0 5
'
02 (mg10I -
0
SS
1-1)
15 -0.50 -
2-
4-
6-
8-
10 -
Ammonium
-0.5 0.50-
2-
4-
6-
8-
10 -
w0
I 0
p
conc. (pM)
1.5 2.5' ' 0
0
2-
4-
6-
8-
DOC conc. (mg [-1)
0.0 0.5
I.'
Nitrate conc. (pM)25 50 75
S
S
10 -
A
I0:
1.0
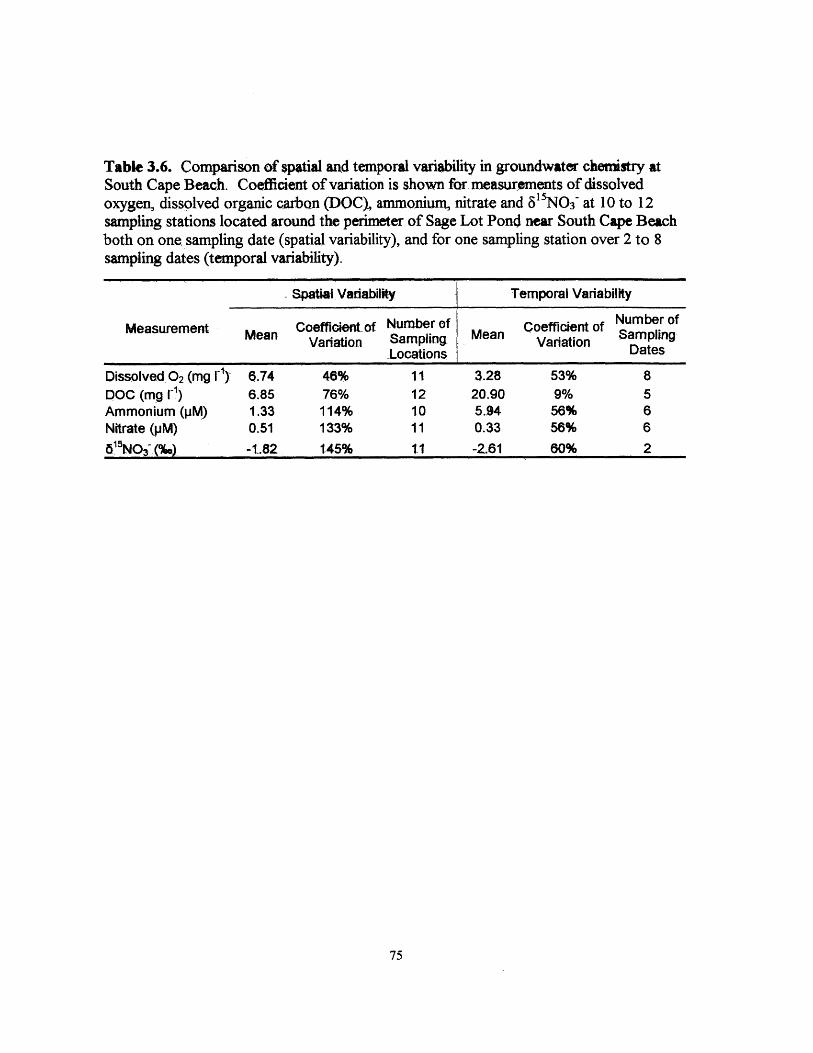
Table 3.6. Comparison of spatial and temporal variability in groundwater chemistry atSouth Cape Beach. Coefficient of variation is shown for measurements of dissolvedoxygen, dissolved organic carbon (DOC), ammonium, nitrate and 61 NO3 at 10 to 12sampling stations located around the perimeter of Sage Lot Pond near South Cape Beachboth on one sampling date (spatial variability), and for one sampling station over 2 to 8sampling dates (temporal variability).
Spatial Variabity Temporal Variability
Measurement MeanCoefficient of Number of Coefficit Number ofMean Variation Sampling Mean Variation Sampling
Locations Dates
Dissolved 02 (mg F'y 6.74 46% 11 3.28 53% 8DOC (mg [') 6.85 76% 12 20.90 9% 5Ammonium (pM) 1.33 114% 10 5.94 56% 6Nitrate (pM) 0.51 133% 11 0.33 56% 6615NO -(%.) -1.82 145% 11 -2.61 60% 2
75
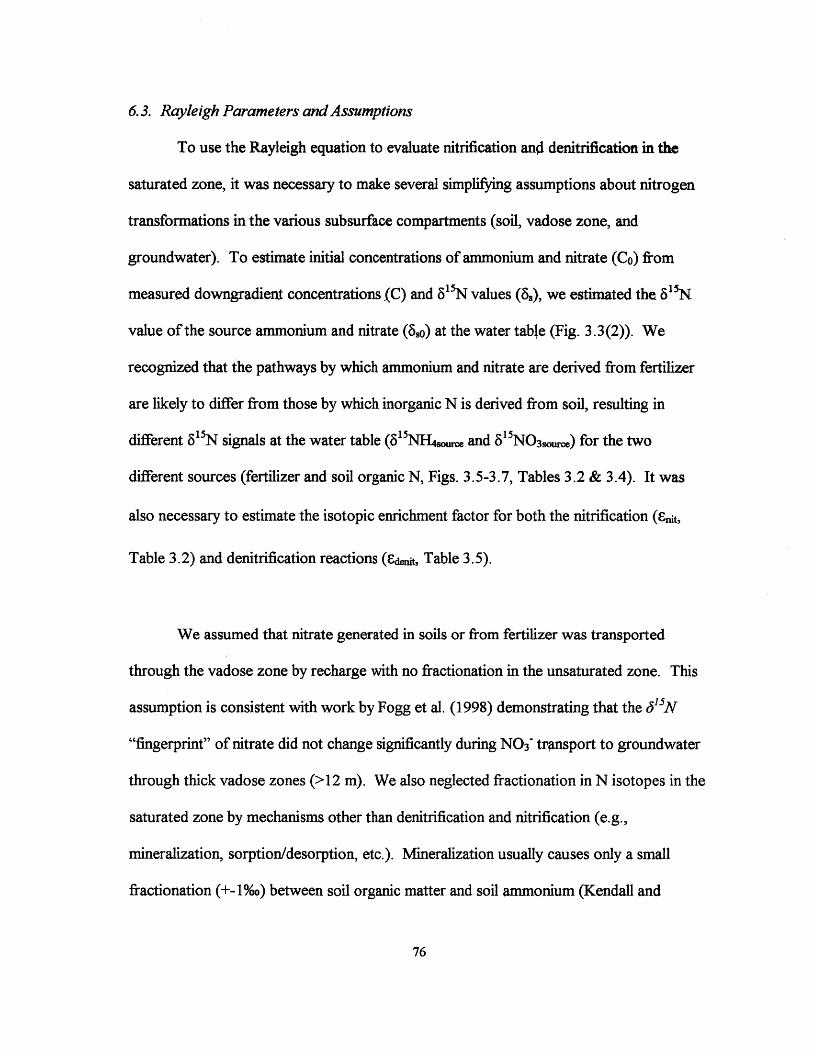
6.3. Rayleigh Parameters and Assumptions
To use the Rayleigh equation to evaluate nitrification and denitrification in the
saturated zone, it was necessary to make several simplifying assumptions about nitrogen
transformations in the various subsurface compartments (soil, vadose zone, and
groundwater). To estimate initial concentrations of ammonium and nitrate (Co) from
measured downgradient concentrations (C) and 85N values (s), we estimated the 51N
value of the source ammonium and nitrate (s,o) at the water table (Fig. 3.3(2)). We
recognized that the pathways by which ammonium and nitrate are derived from fertilizer
are likely to differ from those by which inorganic N is derived from soil, resulting in
different 5 5N signals at the water table (515NH14wurc and 5"NO 3sw=) for the two
different sources (fertilizer and soil organic N, Figs. 3.5-3.7, Tables 3.2 & 3.4). It was
also necessary to estimate the isotopic enrichment factor for both the nitrification (Ct,
Table 3.2) and denitrification reactions (ed.nit, Table 3.5).
We assumed that nitrate generated in soils or from fertilizer was transported
through the vadose zone by recharge with no fractionation in the unsaturated zone. This
assumption is consistent with work by Fogg et al. (1998) demonstrating that the 6'51 N
"fingerprint" of nitrate did not change significantly during N0 3 transport to groundwater
through thick vadose zones (>12 m). We also neglected fractionation in N isotopes in the
saturated zone by mechanisms other than denitrification and nitrification (e.g.,
mineralization, sorption/desorption, etc.). Mineralization usually causes only a small
fractionation (+-1/oo) between soil organic matter and soil ammonium (Kendall and
76
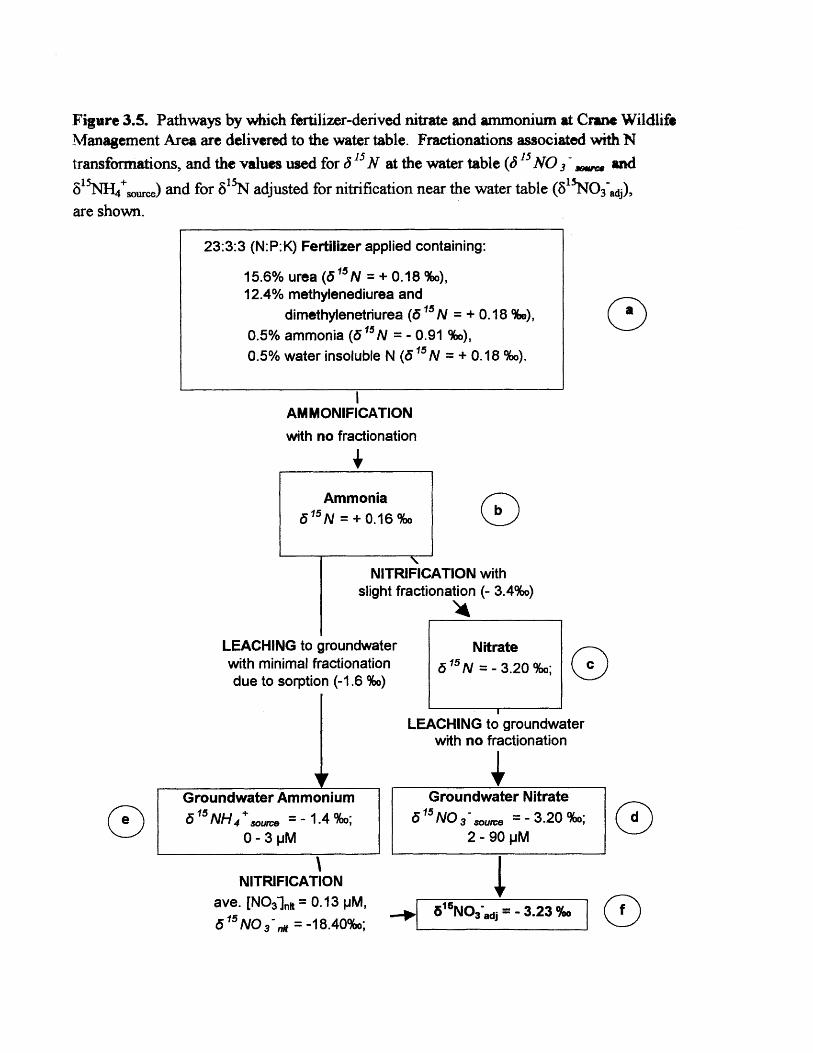
Figure 3.5. Pathways by which fertilizer-derived nitrate and ammonium at Crane WildlifeManagement Area are delivered to the water table. Fractionations associated with N
transformations, and the values used for 6 15 N at the water table (6 I NO3 - and
6 1"NH4*ourc) and for 8 5N adjusted for nitrification near the water table (81 NOiad)
are shown.
AMMONIFICATIONwith no fractionation
Ammonia(5 "N = + 0.16 %o
LEACHING to grounwith minimal fractiodue to sorption (-1.
Groundwater Ammonium6 " NH, ,,,o = - 1.4 %o;
0 - 3 pM
NITRIFICATIONave. [NO31n = 0.13 pM,6 "NO ,,, = -18.40%o;
NITRIFICATION withslight fractionation (- 3.4%o)
dwater Nitrateiation 5 "N -3.20 %o;69%o)
LEACHING to groundwaterwith no fractionation
Groundwater Nitrate6'5 NO,,,,,,= -3.20%o;
2 - 90 pM
-. 5"NO,'adj = - 3 .2 3 %.
a
CD
Q
0
23:3:3 (N: P: K) Fertilizer applied containing:
15.6% urea (6 55N = + 0.18 %o),12.4% methylenediurea and
dimethylenetriurea (65 N = + 0.18 %),0.5% ammonia (6 15 N = - 0.91 %o),0.5% water insoluble N (6'5 N = + 0.18 %o).
Q
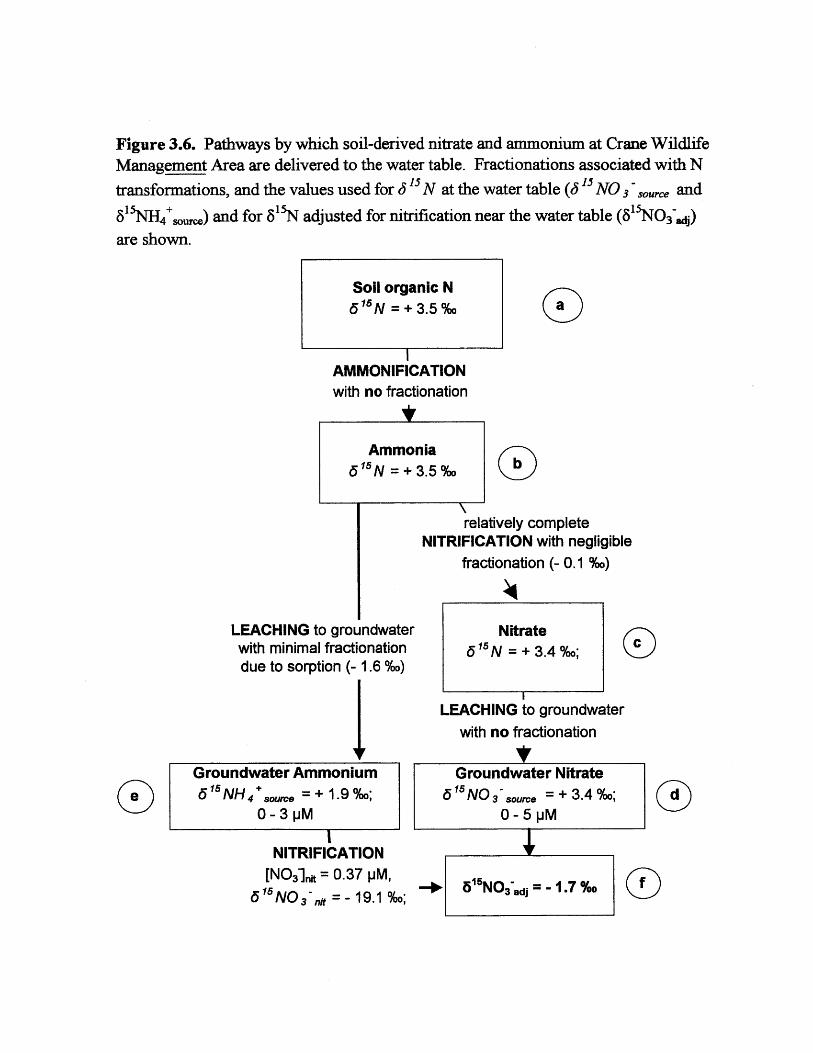
Figure 3.6. Pathways by which soil-derived nitrate and ammonium at Crane WildlifeManagement Area are delivered to the water table. Fractionations associated with N
transformations, and the values used for 6 " N at the water table (5 "NO3 ,so, and
5"N1H 4 .,) and for S"N adjusted for nitrification near the water table (85NO 3 4)
are shown.
Soil organic N6' 5 N = + 3.5%o 0
AMMONIFICATIONwith no fractionation
Ammonia6' 5 N = + 3.5%o
relatively completeNITRIFICATION with negligible
fractionation (- 0.1 %o)
LEACHING to groundwater Nitratewith minimal fractionation 6 15 N = + 3.4 /; 0due to sorption (- 1.6 %o)
LEACHING to groundwaterwith no fractionation
Groundwater Ammonium Groundwater Nitrate
6 NH 4+,u,,, = + 1.9 %o; 6'5 NO s,re = + 3.4 %o;0-3pM 0-5pM
NITRIFICATION[NO31i = 0.37 pM,
6' 5NO 3-,,it= - -19.1%O; -/6 5 NO;adj-7 0

Figure 3.7. Pathways by which soil-derived nitrate and ammonium at South CapeBeach are delivered to the water table. Fractionations associated with Ntransformations, and the values used for 3 1 5N at the water table (3 5'NO s3ource and
3'5 NH4 ,,,.) and for 8"N adjusted for nitrification near the water table (e5" 5NOf3 -)are shown.
Soil organic N6' 5 N =+ 3.5 %o
AMMONIFICATIONwith no fractionation
a
Ammonia
5'N = + 3.5 %
LEACHING to groundwaterwith fractionation
due to sorption (- -1.6 %o)
Groundwater Ammonium
6i5 N ~ + 1.9 %o;0-4 pM
1Qincomplete
NITRIFICATION withfractionation
Nitrate6 15N << + 3.4 %o
incompleteNITRIFICATION with
fractionation
LEACHING to groundwaterwith no fractionation
Groundwater Nitrate
6 1 5 NO 3adj = -4.9%o;0 - 7 pM
0
'
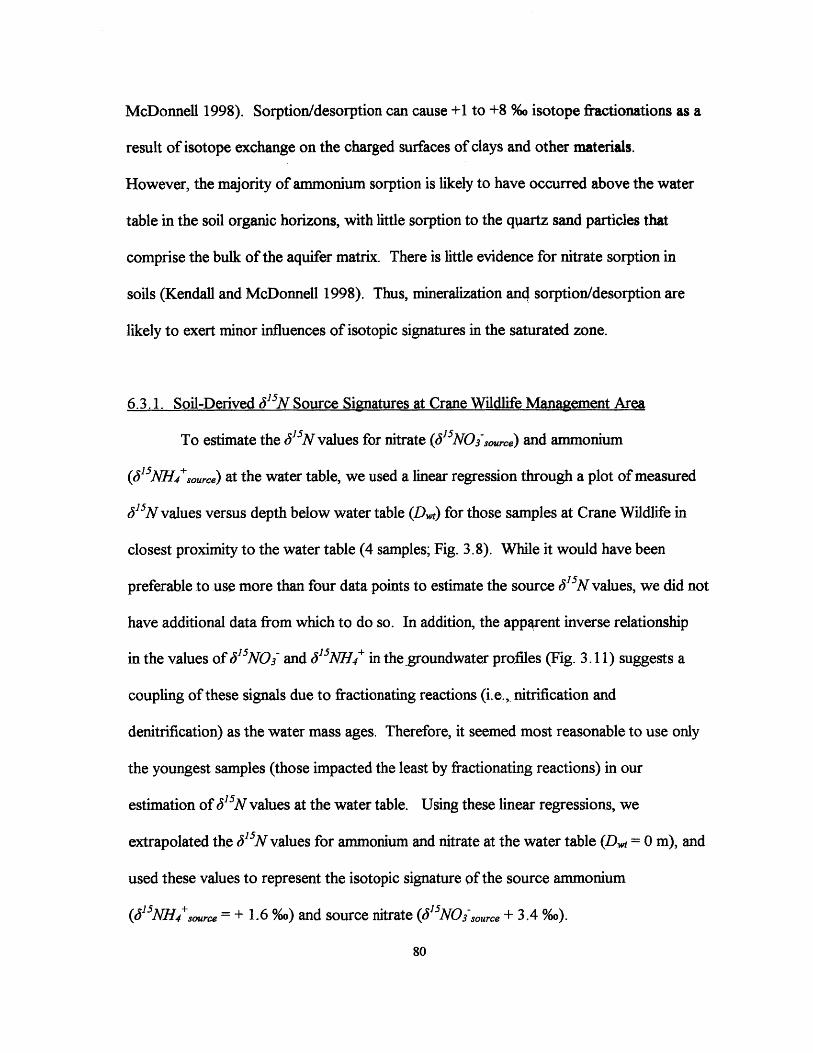
McDonnell 1998). Sorption/desorption can cause +1 to +8 6o isotope fractionations as a
result of isotope exchange on the charged surfaces of clays and other materials.
However, the majority of ammonium sorption is likely to have occurred above the water
table in the soil organic horizons, with little sorption to the qpartz sand particles that
comprise the bulk of the aquifer matrix. There is little evidence for nitrate sorption in
soils (Kendall and McDonnell 1998). Thus, mineralization an4 sorption/desorption are
likely to exert minor influences of isotopic signatures in the saturated zone.
6.3.1. Soil-Derived 6l'N Source Signatures at Crane Wildlife Management Area
To estimate the 65N values for nitrate (PY5NOisource) and ammonium
(65NH4'source) at the water table, we used a linear regression through a plot of measured
6"N values versus depth below water table (D) for those samples at Crane Wildlife in
closest proximity to the water table (4 samples; Fig. 3.8). While it would have been
preferable to use more than four data points to estimate the source '5Nvalues, we did not
have additional data from which to do so. In addition, the appgrent inverse relationship
in the values of 615NOI and c5JNH4+ in the groundwater profiles (Fig. 3.11) suggests a
coupling of these signals due to fractionating reactions (i.e., nitrification and
denitrification) as the water mass ages. Therefore, it seemed most reasonable to use only
the youngest samples (those impacted the least by fractionating reactions) in our
estimation of 615N values at the water table. Using these linear regressions, we
extrapolated the 6' 5N values for ammonium and nitrate at the water table (D. = 0 m), and
used these values to represent the isotopic signature of the source ammonium
(6'5NH4+souc,= + 1.6 o) and source nitrate (JNO 3 source + 3.4 %oo).
80
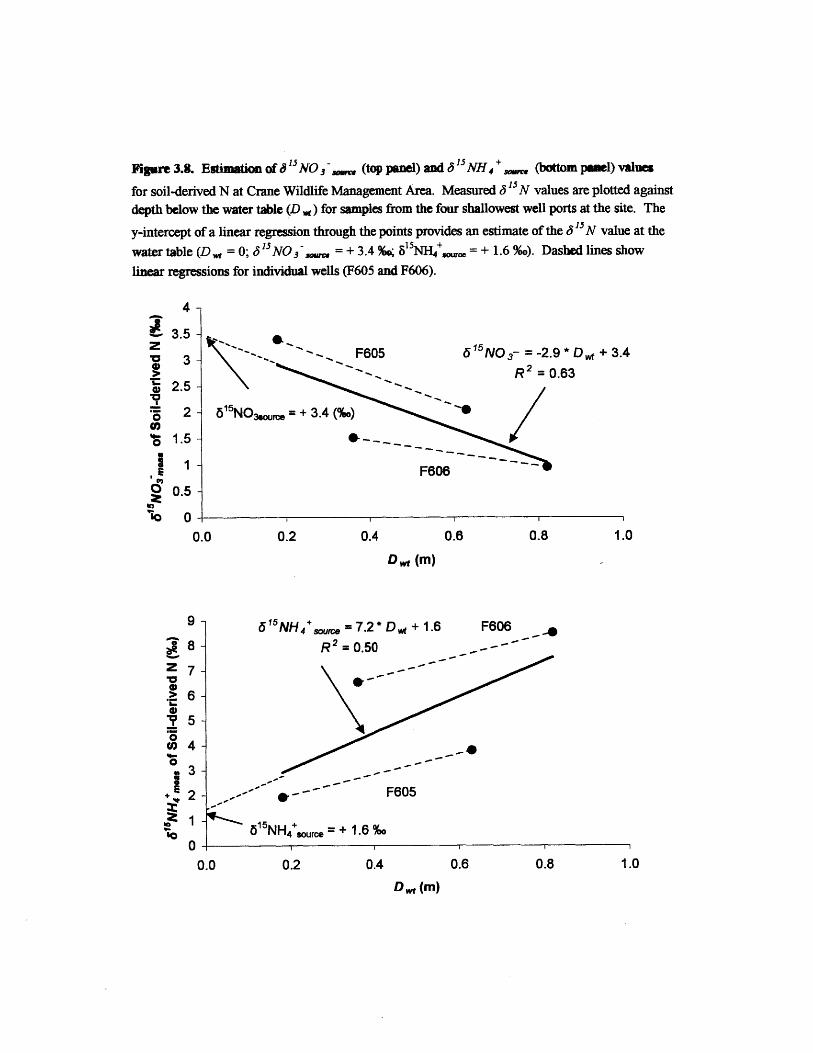
Figure 3.8. Estimation of 8 1 NO3 (top panel) and 8 1 NH4 + + (bottom panel) values
for soil-derived N at Crane Wildlife Management Area. Measured & 15N values are plotted against
depth below the water table (D ,) for samples from the four shallowest well ports at the site. The
y-intercept of a linear regression through the points provides an estimate of the 3 " N value at the
water table (Dw = 0; 61 NOqs =+ 3.4 % H; H surc + 1.6 %o). Dashed lines show
linear regressions for individual wells (F605 and F606).
4-
3.5 -
3-
2.5 -
2-
1.5 -
1
0.5-
00.0
S F605 15N0,3- = -2.
R 2 = 3
6 15N03,,urme + 3.4 (%6)'0
F606
0.2 0.4 0.8
9 * D w + 3.4
.63
1.0
D, w(m)
615NH 4 ,ouc = 7.2* D w + 1.6 F606 .
-- F605
15 NH4 source = + 1.6 %o
0.2 0.4 0.6
D wt (m)
z
0
,
.5
9
8
7
6
5
4
3
2
1
0
z
0
U,0i
+1
0.0 0.8 1.0
O.f
Our (5 N.. . values are consistent with what we might expect to find for
ammonium and nitrate derived from soil, which has '5N values ranging between - 10
and + 1596o, with the majority of soils falling between + 2 and + 5%o (Kendall and
McDonnell 1998). Ammonium derives from soil organic N via ammonification with
minimal fractionation (+ or - 1 %o, Kendall & McDonnell 1998), producing ammonium
with 6' 5N values similar to that of soil organic nitrogen (Koba et al. 1998; Fig. 3.6 a & b,
and 3.7 a & b). Sorption/desorption of ammonium on the charged surfaces of clays and
other material, and other retardation processes, can decrease the 6I5N value of the more
"mobile" ammonium (Delwiche & Stein 1970, Kendall & McDonnell 1998, Hubner
1986). The 65N value we estimated for ammonium at the water table ('NH4+ source- +
1.6 %o) is consistent with ammonification of soil organic N (+ 2 tp + 5 %o; mean ~ 3.5 %o)
followed by slight fractionation during transport through the soil profile and vadose zone
(-1.9 %o).
The 6' 5N value that we estimated for nitrate at the water table (P'NOisourc, +
3.4 %o) is consistent with the literature; measurements of.6'sN of soil water nitrate
derived from soil organic N range from about -10 to +12 %o, wvith mean values ranging
from -3 to +5 %o (Fogg et al. 1998). Further, since fractionation during nitrification is
minimal in N-limited systems (Kendall and McDonnell 1998), we expect that nitrate
produced via nitrification of soil-derived ammonium, with no further fractionation during
transport through the vadose zone, would result in 6'5N of nitrate at the water table
similar to that of soil organic N (- 3.5 %o). In our system, fraQtionation may have been
on the order of -0.1 %o.82
6-3.2. Fertilizer-Derived Y5N-Ammonium Source Signature at Crane Wildlife
Management Area
Fertilizer containing nitrogen (N), phosphorus (P), and potassium (K) at a ratio of
23:3:3 was historically applied to the upgradient golf course (John Callahan, manager,
Falcon Golf Course, personal communication). Discussions with the fertilizer
manufacturer led us to believe that the N content of this particular fertilizer would have
been 0.5% ammonia, 15.6% urea nitrogen, 12.4% water soluble nitrogen
(methylenediurea and dimethylenetriurea nitrogen), and 0.5% water insoluble nitrogen.
Hubner (1986) compiled 6 5N values for numerous fertilizers and reported that the
mean 65N was - 0.91 ± 1.88 %o for ammonium in 39 fertilizer samples, and + 0.2 ± 1.27
%o for urea in 8 fertilizer samples. The fertilizer applied to the golf course was comprised
primarily of organic forms of nitrogen (-98%). If we assume that ammonification of
organic fertilizer N proceeds with essentially zero fractionation (+- 1%o, Kendall &
McDonnell 1998) to produce ammonium with the same 6'"N value as urea (+0.2 %o), the
bulk signal of ammonium derived from this fertilizer would be +0.2 % (2% from
ammonium fertilizer, 98% from urea; Fig. 3.5 b). Assuming that ammonia from fertilizer
undergoes fractionation due to sorption to soils and in the vadose zone to the same degree
as we hypothesize for soil-derived ammonium (-1.9 %o), we calculated that the 515Nvalue
of ammonium at the water table would be -1.7 96o, which we assigned as the source
signature (Fig. 3.5 e).
83
6.3.3. Fertilizer-Derived c5JN-Nitrate Source Signature at Crane Wildlife Management
Area
We assumed that after application, fertilizer ammonium and urea compounds
undergo relatively complete ammonification and nitrification within the soil horizons,
with slight fractionation, and that the nitrate produced is largely leached through the
vadose zone to the water table during recharge, with no further transformations occurring
in the vadose zone. This would result in nitrate at the water table bearing a 615N
signature only slightly more negative than that of the original fertilizer ammonium (+0.2
%o, Fig. 3.5 b) and urea. This is an important distinction, since the isotopic enrichment
factor (c) for nitrification is quite large (-12 and -29 %o, Kendall and McDonnell 1998),
and incomplete nitrification would results in significant fractionation between the
ammonium reactant and the nitrate product.
An assumption of fairly complete nitrification is consistent with work by Wells &
Krothe (1989) who measured 6' 5N values and leachable nitrate and ammonium
concentrations in soil samples beneath several fertilized fields. They demonstrated that
ammonium concentrations in the soil, in all but one case, were below detection limits,
and that nitrate had low 6"SN values (averaging -3.2 %o) reflective of the original
fertilizer. From this evidence, they concluded that complete rgitrification of anhydrous
ammonium fertilizers had occurred with only minimal fractionation. We assumed that
the '5N of the fertilizer-derived nitrate at the water table would be similar to that
measured by Wells & Krothe (1989), or -3.2 %o (Fig. 3.5 c), consistent with the range of
5N values reported in the literature for fertilizer (-8 to +6.2 96o, Freyer and Aly 1974,
84
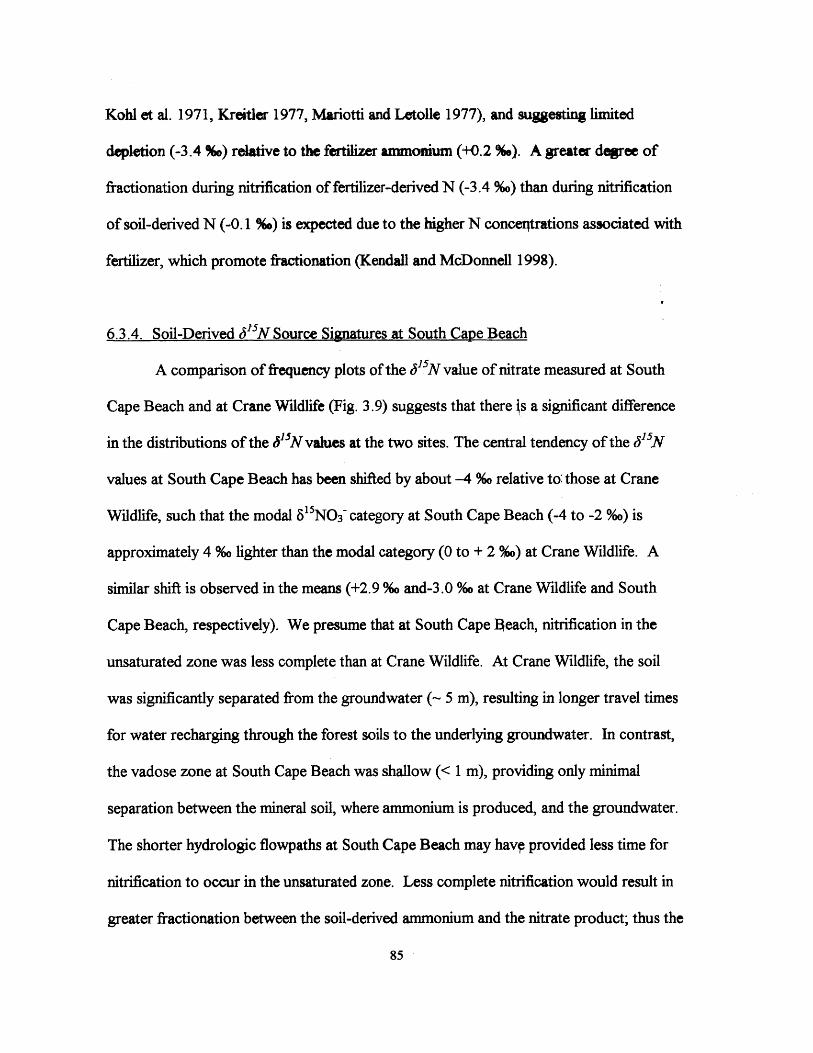
Kohl et al. 1971, Kreitler 1977, Mariotti and Letolle 1977), and suggesting limited
depletion (-3.4 %o) relative to the fertilizer anmonium (+0.2 %). A greater degree of
fractionation during nitrification of fertilizer-derived N (-3.4 96o) than during nitrification
of soil-derived N (-0.1 %o) is expected due to the higher N concentrations associated with
fertilizer, which promote fractionation (Kendall and McDonnell 1998).
6.3.4. Soil-Derived 6 1 N Source Signatures at South Cape Beach
A comparison of frequency plots of the 6I"N value of nitrate measured at South
Cape Beach and at Crane Wildlife (Fig. 3.9) suggests that there s a significant difference
in the distributions of the 6" 5N values at the two sites. The central tendency of the 6"'5N
values at South Cape Beach has been shifted by about -4 %o relative to: those at Crane
Wildlife, such that the modal 5"NO category at South Cape Beach (-4 to -2 %o) is
approximately 4 %o lighter than the modal category (0 to + 2 %o) at Crane Wildlife. A
similar shift is observed in the means (+2.9 96o and-3.0 % at Crane Wildlife and South
Cape Beach, respectively). We presume that at South Cape Beach, nitrification in the
unsaturated zone was less complete than at Crane Wildlife. At Crane Wildlife, the soil
was significantly separated from the groundwater (- 5 m), resulting in longer travel times
for water recharging through the forest soils to the underlying groundwater. In contrast,
the vadose zone at South Cape Beach was shallow (< 1 m), providing only minimal
separation between the mineral soil, where ammonium is produced, and the groundwater.
The shorter hydrologic flowpaths at South Cape Beach may havp provided less time for
nitrification to occur in the unsaturated zone. Less complete nitrification would result in
greater fractionation between the soil-derived ammonium and the nitrate product; thus the
85
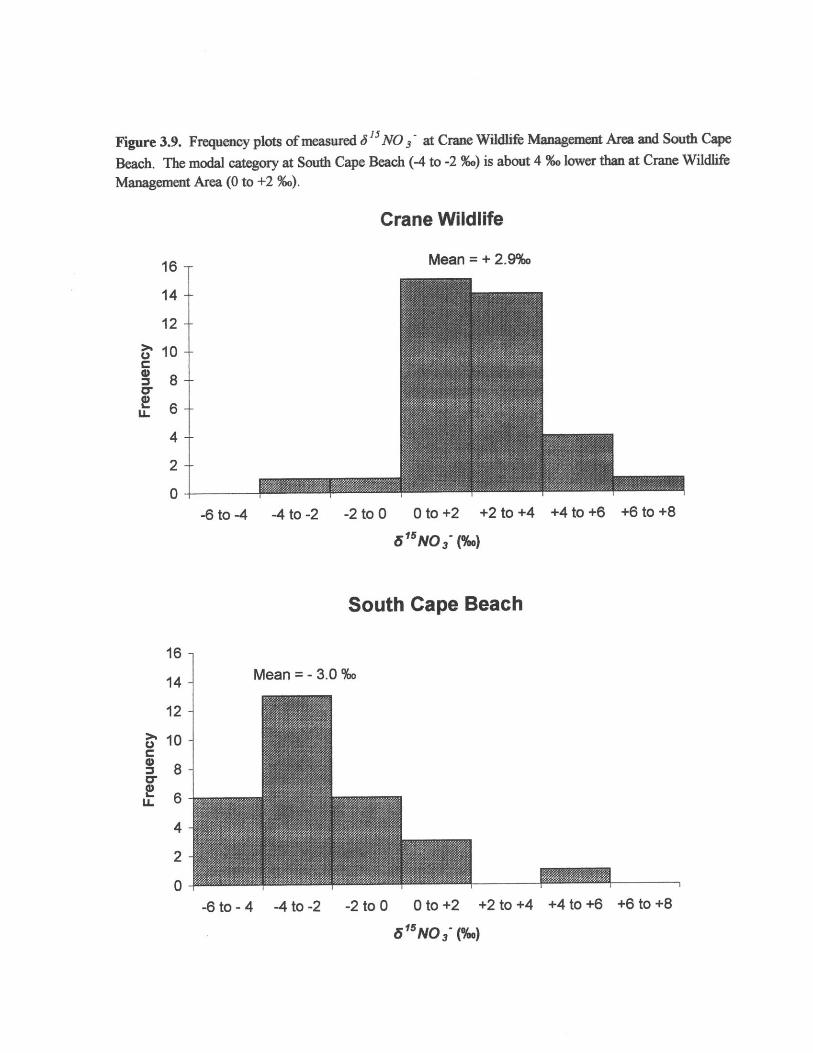
Figure 3.9. Frequency plots of measured 6 15NO - at Crane Wildlife Management Area and South Cape
Beach. The modal category at South Cape Beach (-4 to -2 %o) is about 4 %o lower than at Crane Wildlife
Management Area (0 to +2 %o).
Crane Wildlife
16 -Mean = + 2.9%o
14--
12--
10--
U--
4 --
2
0-6 to -4 -4 to -2 -2 toO O to +2 +2 to +4 +4 to +6 +6 to +8
16 -
14 -
12 -
10 -
8-
6-
515NO (%)
South Cape Beach
Mean =-3.0 %o
4
2J
0-6 to - 4 -4 to -2 -2 toO O to +2 +2 to +4 +4 to +6 +6 to +8
6 15N0j (%)
U
groundwater nitrate at South Cape Beach would bear a lower 15NO1 value than at Crane
Wildlife (UN5s 7 C.. = + 3.4 %e), where longer flowpaths through the unasturated zone
may have allowed for more complete nitrification.
This hypothesis is supported by our measurements of inorganic N at both sites.
At South Cape Beach, ammonium made up a much larger fraction, on average, of the
total inorganic nitrogen (NH 4 + N0 3 -, 57%), than at Crane Wildlife (13 %). Assuming
that nitrate derives primarily from nitrification of ammoniunr, these data suggest that
nitrification at South Cape Beach is less complete than at Crane Wildlife.
Because we did not measure Y 3'NH4 at South Cape Beach, we could not directly
correct the b"5NOWUWCB value to reflect the effects of nitrification taking place beneath the
water table. Instead, we assumed that the lowest 615N value measured in our shallow
groundwater samples (- 4.9 %o) was reflective of the effects on nitrification on the
isotopic signature of the source nitrate, and assigned this value to 651 NOadj. This value
is 3.2 %o lower than the adjusted source value calculated for Crarle Wildlife (-1.7 %o; see
Results), consistent with less complete nitrification at South Cape Beach than at Crane
Wildlife. Use of our lowest measured 6"'N value implies that no denitrification has
occurred in that particular water parcel (since d'5NOjma, = 6 1 5NOjadj) In reality, this
may be a conservative estimate of the impacts of nitrification, since denitrification may
have increased 6' 5N from some lower value to that which we measured (- 4.9 %o). If the
impacts of nitrification are, in fact, greater than what we estimate, then our calculated
87
denitrification rates for South Cape Beach represent a conservative estimate of N
reduction rates at this site.
6.3.5. Isotopic Enrichment Factor for Nitrification (Ei)
Isotopic fractionation during nitrification results in isotopic enrichment (8,i) of
residual ammonium between -12 and -29 %6o (Kendall and McDonnell 1998). We used
the mean of this range, or -21 96o, as e for this analysis (Table 3.2).
6.3.6. Isotopic Enrichment Factor for Denitrification (Edit)
In the literature, values of de,,,t ranged from -4.7 96o in the Chalk aquifer in France
to -30 %o in an aquifer in the Kalahari (Vogel et al., 1981; Heaton, 1986), to as large as -
40 %o in the marine environment (Cline and Kaplan 1975). Enrichment factors measured
in groundwater in the sewage plume at the Massachusetts Military Reservation (MMR)
on Cape Cod averaged -14 %oo (Smith et al. 1991). We chose to use -14 %6o as .6 denit for
our model, since this value was derived from the same aquifer system (Table 3.5) and
falls in the midrange of the literature values.
7. Results and Discussion
7.1. Crane Wildlife Management Area
7.1.1. Geochemistry
Figures 3.10 and 3.11 shows depth profiles of dissolved oxygen (3.1 Oa), dissolved
organic carbon (3.1 Ob), ammonium (3. lc), and nitrate (3.11 a), as well as 15 1_NO3.,a, and
65NHmeas for fertilizer-derived N (>1.5 pM N0 3 ; (3.11 .b)) and soil-derived N (<1.5
88
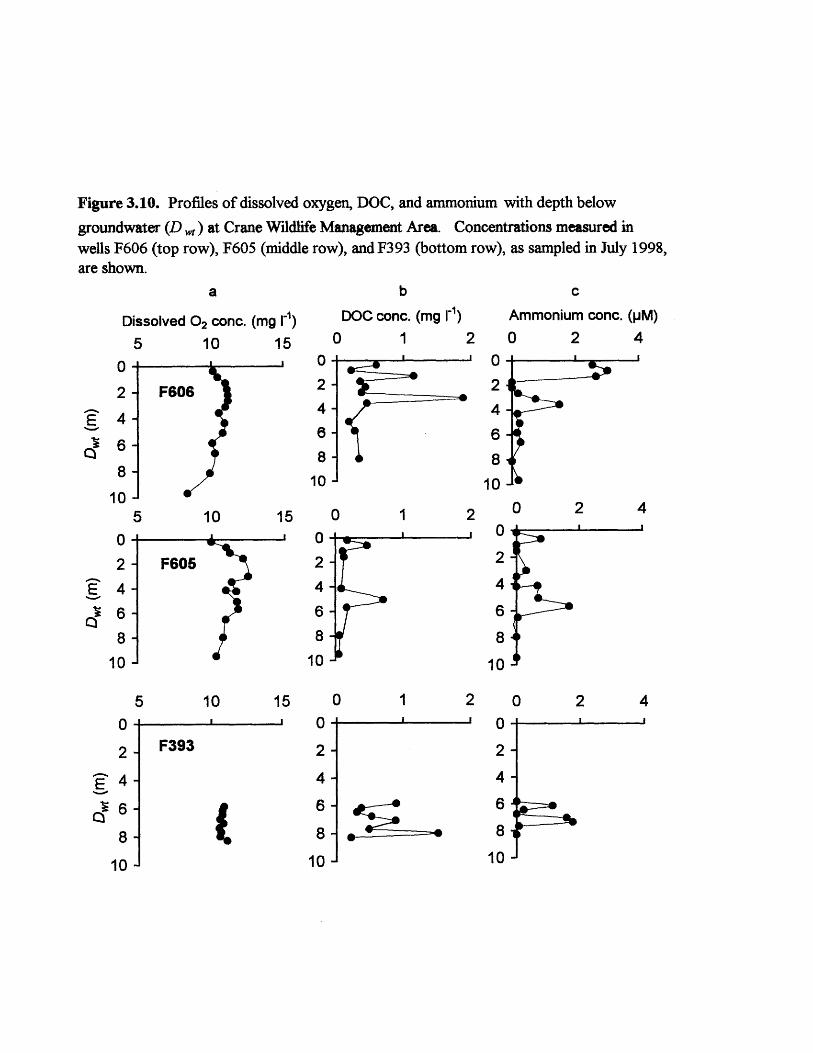
Figure 3.10. Profiles of dissolved oxygen, DOC, and ammonium with depth below
groundwater (D w) at Crane Wildlife Management Area. Concentrations measured inwells F606 (top row), F605 (middle row), and F393 (bottom row), as sampled in July 1998,are shown.
a
Dissolved 02 conc.
5 10
02
4
6
8
10
0
2
4
6
8
10
0
2
4
6
8
10
(mg 1"1)
15
F606
5 10 1
F605
5 10 15'1 I
5
F393
I.
b
DOC conc. (mg 1-1)0 1
0
24
6
8
10
0
2
4
6
8
10
0
2
4
6
8
10
0 1
2
2
0 2
-4I
0
2
4
6
8
10
0
2
4
6
8
10
0
2
4
6
8
10
C
Ammonium conc. (pM)0 2 4
0 2 4
0 2 4
EV
-
-
-
-
-
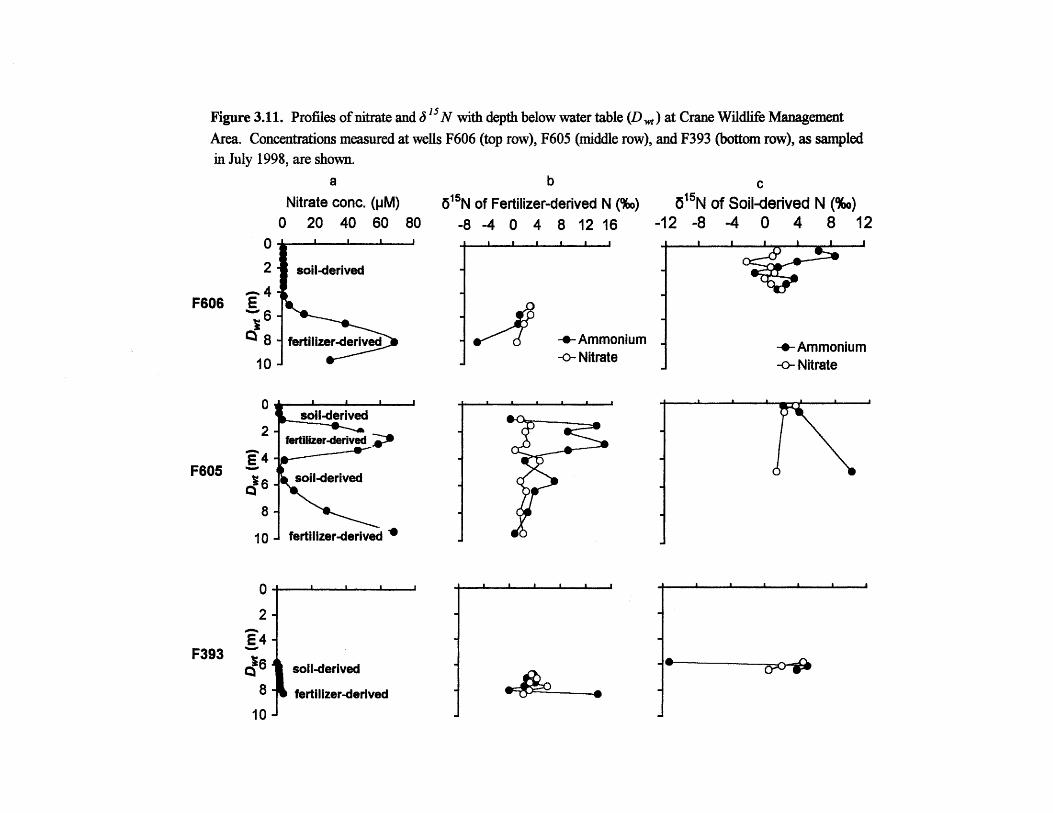
Figure 3.11. Profiles of nitrate and J SN with depth below water table (D ) at Crane Wildlife ManagementArea. Concentrations measured at wells F606 (top row), F605 (middle row), and F393 (bottom row), as sampledin July 1998, are shown.
aNitrate conc. (pM)
0 20 40 60 800-
2-
F606
8 -
10 -
0
2
F605 E
8-
10-
0
2-
~61
8-
10 -
615NN-8
soil-derived
fertilizer-derived
oll-erlved
fertilizer-derived I
soil-derived
fertilizer-derived *
b
of Fertilizer-derived-4 0 4 8 12
a & I a
A"
N (%o)
16-
-0- Ammonium-o- Nitrate
.1 * I p p p p
soil-derived
fertilizer-derived
615 N-12 -8
cof Soil-derived
-4 0 4N (%o)
8 12
-- Ammonium-o- Nitrate
I
p---#F393
i
WAQ -
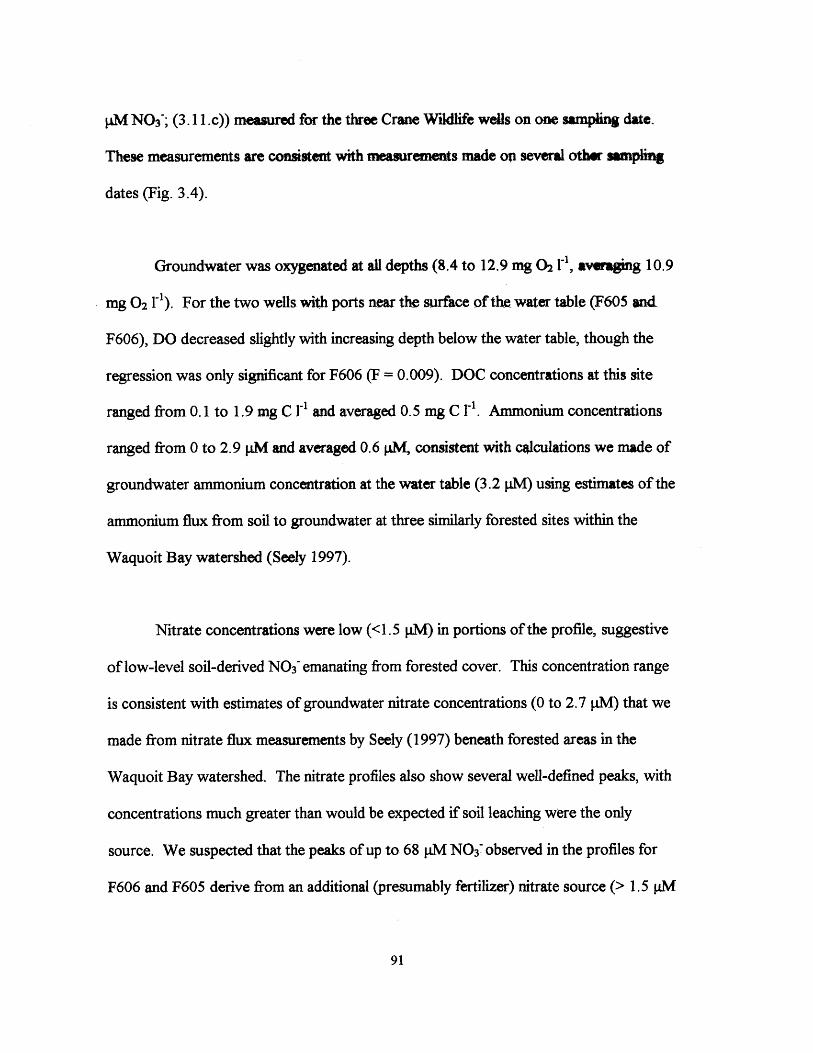
JM N0 3 ~; (3.11.c)) measured for the three Crane Wildlife wells on one sampling date.
These measurements are consistent with measurements made on several other sampling
dates (Fig. 3.4).
Groundwater was oxygenated at all depths (8.4 to 12.9 mg 02 1i, averaging 10.9
mg 02 1-). For the two wells with ports near the surface of the water table (F605 and
F606), DO decreased slightly with increasing depth below the water table, though the
regression was only significant for F606 (F = 0.009). DOC concentrations at this site
ranged from 0.1 to 1.9 mg C F and averaged 0.5 mg C ri. Ammonium concentrations
ranged from 0 to 2.9 pM and averaged 0.6 pM, consistent with calculations we made of
groundwater ammonium concentration at the water table (3.2 pM) using estimates of the
ammonium flux from soil to groundwater at three similarly forested sites within the
Waquoit Bay watershed (Seely 1997).
Nitrate concentrations were low (<1.5 pM) in portions of the profile, suggestive
of low-level soil-derived N0 3~emanating from forested cover. This concentration range
is consistent with estimates of groundwater nitrate concentrations (0 to 2.7 PM) that we
made from nitrate flux measurements by Seely (1997) beneath forested areas in the
Waquoit Bay watershed. The nitrate profiles also show several well-defined peaks, with
concentrations much greater than would be expected if soil leaching were the only
source. We suspected that the peaks of up to 68 pM N03- observed in the profiles for
F606 and F605 derive from an additional (presumably fertilizer) nitrate source (> 1.5 pM
91
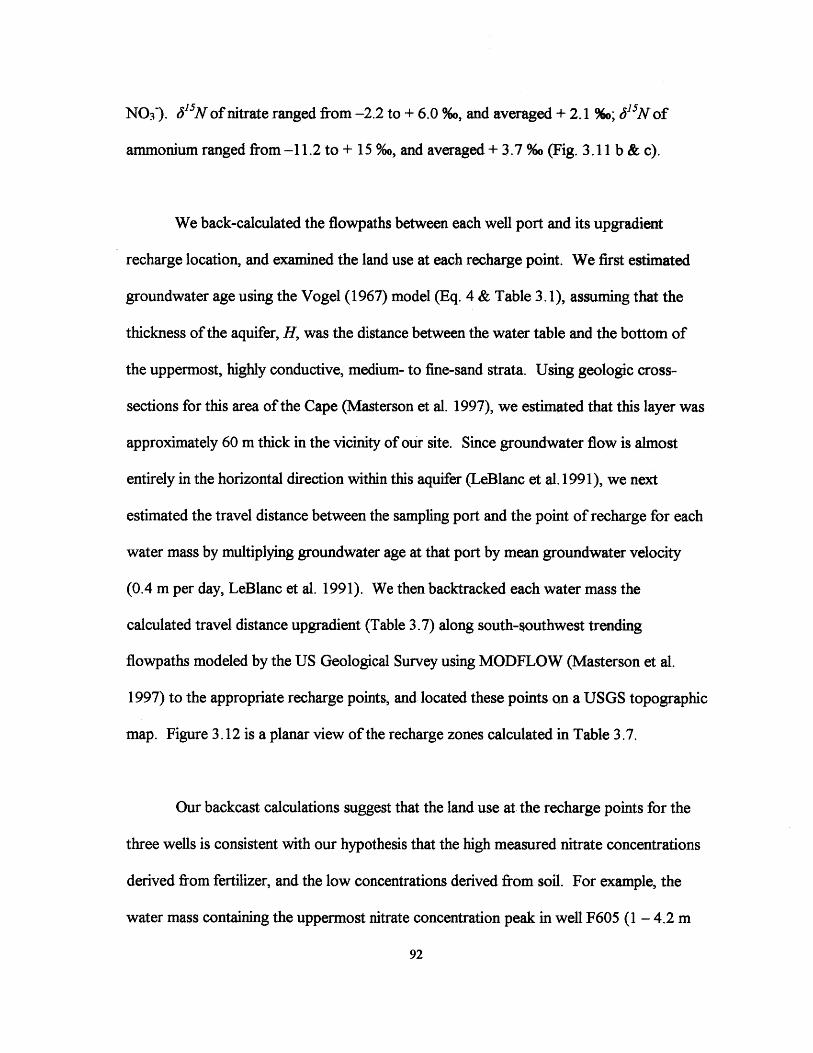
N0 3 ~). 6 1 5N of nitrate ranged from -2.2 to + 6.0 96o, and averaged + 2.1 %o; 6'sNof
ammonium ranged from -11.2 to + 15 %o, and averaged + 3.7 %o (Fig. 3.11 b & c).
We back-calculated the flowpaths between each well port and its upgradient
recharge location, and examined the land use at each recharge point. We first estimated
groundwater age using the Vogel (1967) model (Eq. 4 & Table 3.1), assuming that the
thickness of the aquifer, H, was the distance between the water table and the bottom of
the uppermost, highly conductive, medium- to fine-sand strata. Using geologic cross-
sections for this area of the Cape (Masterson et al. 1997), we estimated that this layer was
approximately 60 m thick in the vicinity of our site. Since groundwater flow is almost
entirely in the horizontal direction within this aquifer (LeBlanc et al. 1991), we next
estimated the travel distance between the sampling port and the point of recharge for each
water mass by multiplying groundwater age at that port by mean groundwater velocity
(0.4 m per day, LeBlanc et al. 1991). We then backtracked each water mass the
calculated travel distance upgradient (Table 3.7) along south-southwest trending
flowpaths modeled by the US Geological Survey using MODFLOW (Masterson et al.
1997) to the appropriate recharge points, and located these points on a USGS topographic
map. Figure 3.12 is a planar view of the recharge zones calculated in Table 3.7.
Our backcast calculations suggest that the land use at the recharge points for the
three wells is consistent with our hypothesis that the high measured nitrate concentrations
derived from fertilizer, and the low concentrations derived from soil. For example, the
water mass containing the uppermost nitrate concentration peak in well F605 (1 - 4.2 m
92
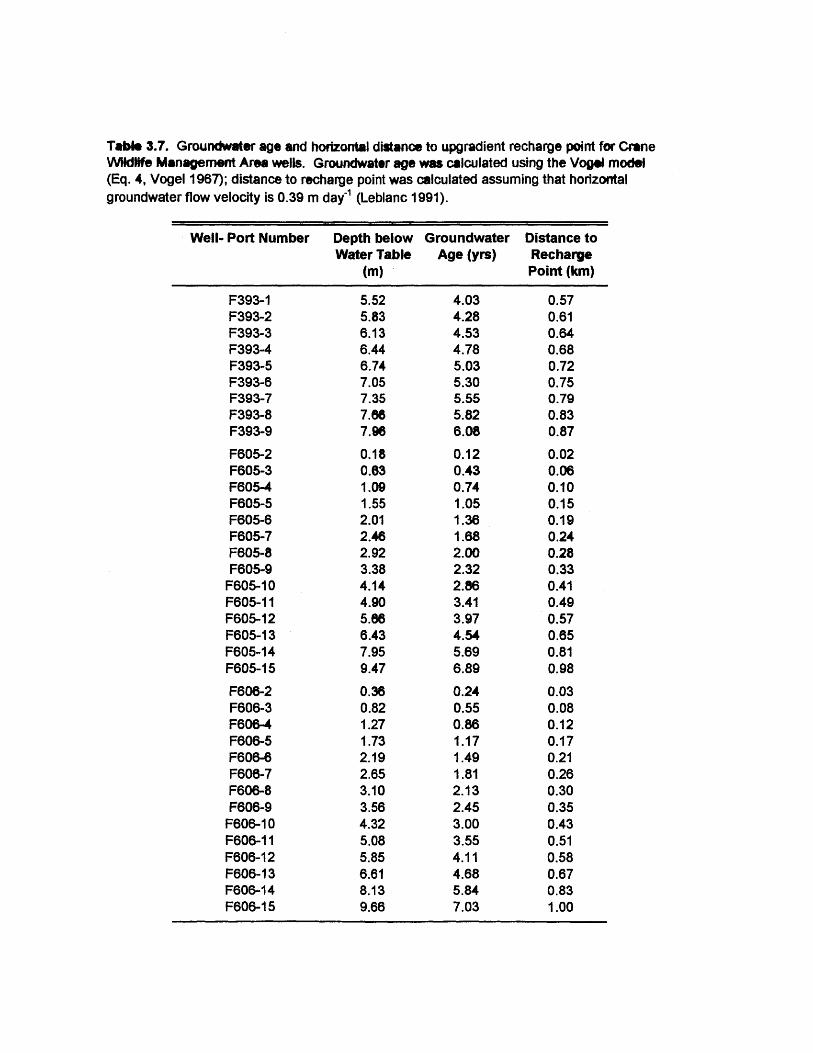
Table 3.7. Groundwater age and horizontal distance to upgradient recharge point for CraneWfldbfe Management Area wells. Groundwater age was calculated using the Vogel model(Eq. 4, Vogel 1967); distance to recharge point was calculated assuming that horizontalgroundwater flow velocity is 0.39 m day-' (Leblanc 1991).
Well- Port Number Depth below Groundwater Distance toWater Table Age (yrs) Recharge
(M) Point (km)
F393-1F393-2F393-3F393-4F393-5F393-6F393-7F393-8F393-9
F605-2F605-3F605-4F605-5F605-6F605-7F605-8F605-9
F605-1 0F605-11F605-12F605-13F605-14F605-15
F606-2F606-3F606-4F606-5F606-6F608-7F606-8F606-9
F606-1 0F606-11F606-12F606-13F606-14F606-15
5.525.836.136.446.747.057.357.67.96
0.180.631.091.552.012.462.923.384.144.905.686.437.959.47
0.360.821.271.732.192.653.103.564.325.085.856.618.139.66
4.034.284.534.785.035.305.555.826.08
0.120.430.741.051.361.682.002.322.863.413.974.545.696.89
0.240.550.861.171.491.812.132.453.003.554.114.685.847.03
0.570.610.640.680.720.750.790.830.87
0.020.060.100.150.190.240.280.330.410.490.570.650.810.98
0.030.080.120.170.210.260.300.350.430.510.580.670.831.00
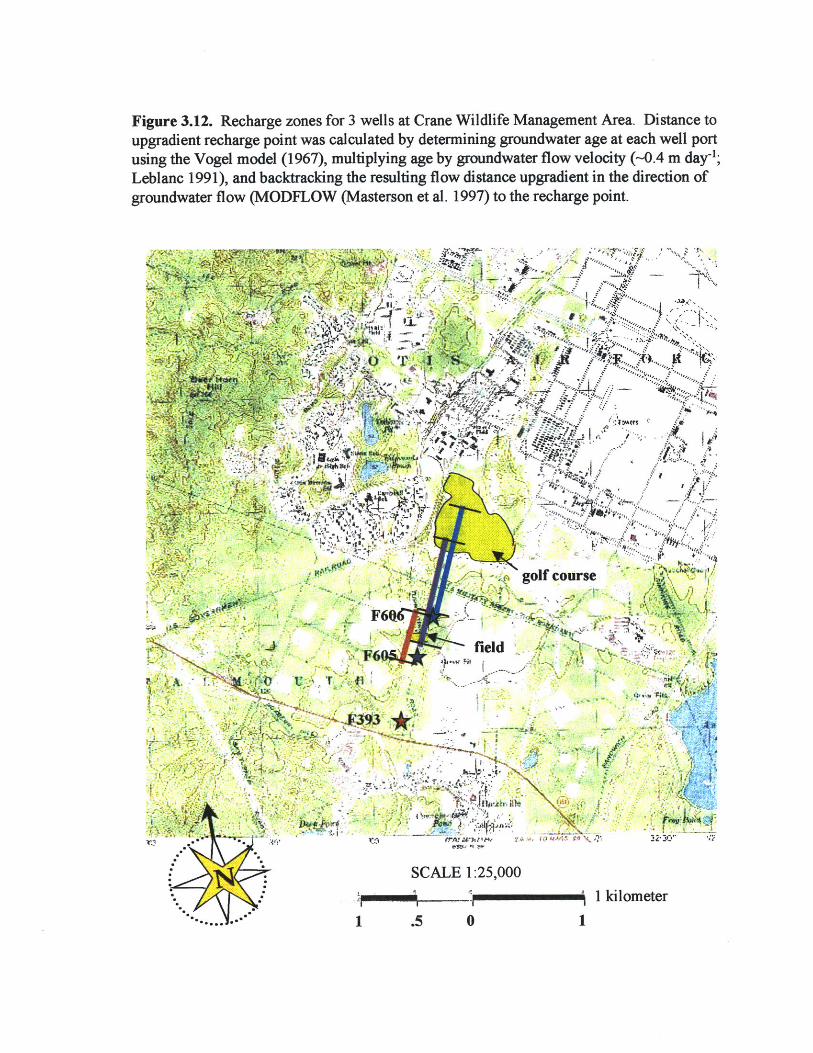
Figure 3.12. Recharge zones for 3 wells at Crane Wildlife Management Area. Distance toupgradient recharge point was calculated by determining groundwater age at each well portusing the Vogel model (1967), multiplying age by groundwater flow velocity (-0.4 m day-;Leblanc 1991), and backtracking the resulting flow distance upgradient in the direction ofgroundwater flow (MODFLOW (Masterson et al. 1997) to the recharge point.
- - -.
- r
-I i ourI
41" 4
I T -, ,U
--.. - 1 5
#A* ski .,.
/ golf course
F6 . ~ ,,field
- ~N/i
SCALE :25,0.
~~ kilometer,
1 .5 0e
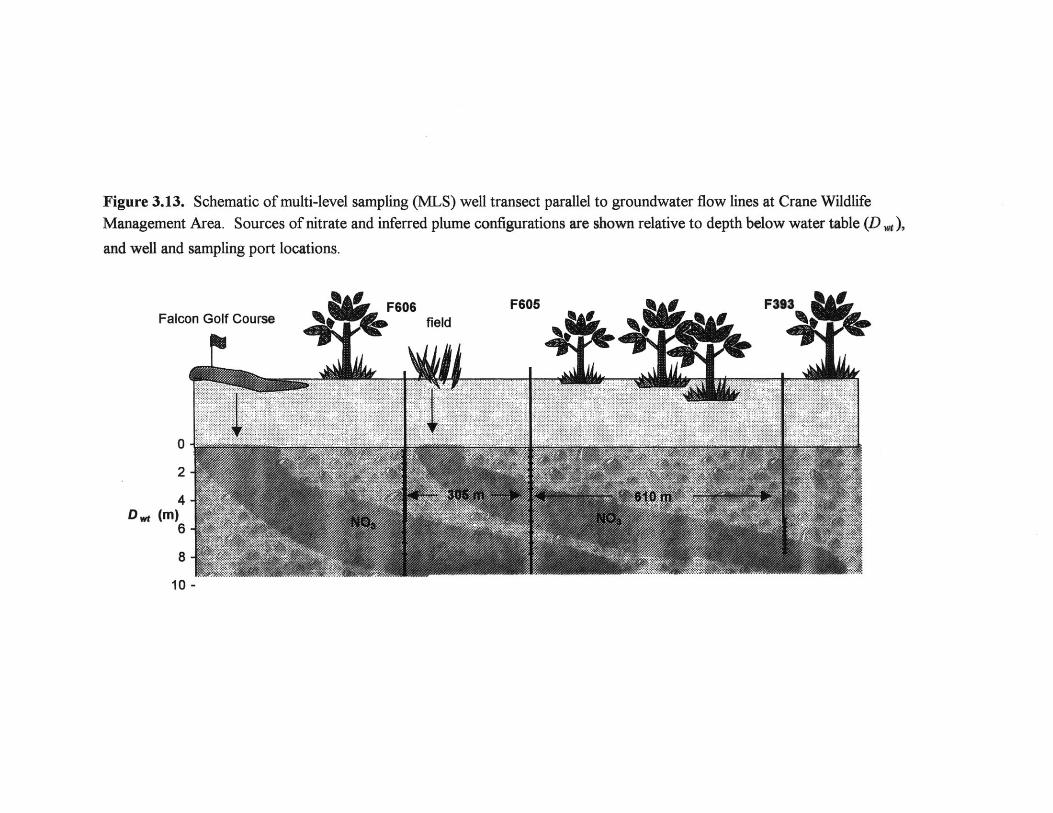
Figure 3.13. Schematic of multi-level sampling (MLS) well transect parallel to groundwater flow fines at Crane WildlifeManagement Area. Sources of nitrate and inferred plume configurations are shown relative to depth below water table (D
and well and sampling port locations.
F606 F606 9% F393qkFalcon Golf Course field
- -----------........ .... ......... ............ ...................... ........ ......... ....... . ......... . .. ........ ..... ........ .............. .. . .................. ............................ ........ ...... ............ ........ . .... ............................... ....... ... .... ...... ....... ................ ............................................ ... ......... ........ ........ . ... ........................... .. ....... .... .............. .............. ............. ...................... ..................... ... ...... ................. ....... % .. ................... ........................... ..... .. ........... ..... ... ....... .................. ....... .. .... %% ......... ............................ .... ................................ ........ ....... ......... ..... ...... ..................... ...... .. ........... ............... .................... .... ....... .. ........ . .... ....................... ....... ... ........... ...................... ..... .......... .. .. ....... ... ... ... .. .... ...... ---- .................................. .. ....... ....................0 % ... .......... .... .. ......... .........
-- ---------- -2
4Dwt %so,,
6
10 -
Ii
below the water table) was 0.7 to 2.9 years old and originated 0.1 to 0.4 km upgradient
(Table 3.7). This recharge point coincides with an abandoned fiqld (Figs. 3.12 & 3.13),
in the midst of primarily forested cover, which is managed by the Massachusetts Division
of Fish and Wildlife to provide habitat for pheasant, bobwhites, and rabbits. Land
management practices here have included plowing and occasional top dressing with
fertilizer and ground limestone (Richard Turner, Massachusetts Division of Fish &
Wildlife, personal communication), which is likely to be the source of the nitrate we
measured downgradient.
The water mass containing the one N03 peak in the upgr;dient well (F606, 5.1 -
9.7 m below the water table) and the lower nitrate concentration peak at well F605 (5.7 -
9.5 m below the water table) was estimated to be 3.6 - 7.0 years old at F606 and 4.0 - 6.9
years old at F605 (Table 3.7). The recharge point for this parcel of water was calculated
to be 0.5 to 1.0 km upstream of F606, corresponding to the position of the Falcon Golf
Course (Figs. 3.12 & 3.13), where 23:3:3 (N:P:K) had been applied during the time
period (1991-2) when recharge of the water we sampled would have occurred. The
recharge points for most other well ports mapped to areas with forested cover. The
schematic in Figure 3.13 shows inferred fertilizer plume configurations relative to depth
below water table (Dw), and well and sampling port locations.
Before estimating denitrification rates for each groundwater sample, we
segregated the samples by nitrate concentration into those containing fertilizer-derived
nitrate (>1.5 pM) and those containing soil-derived nitrate (<1.5 pM), consistent with
96
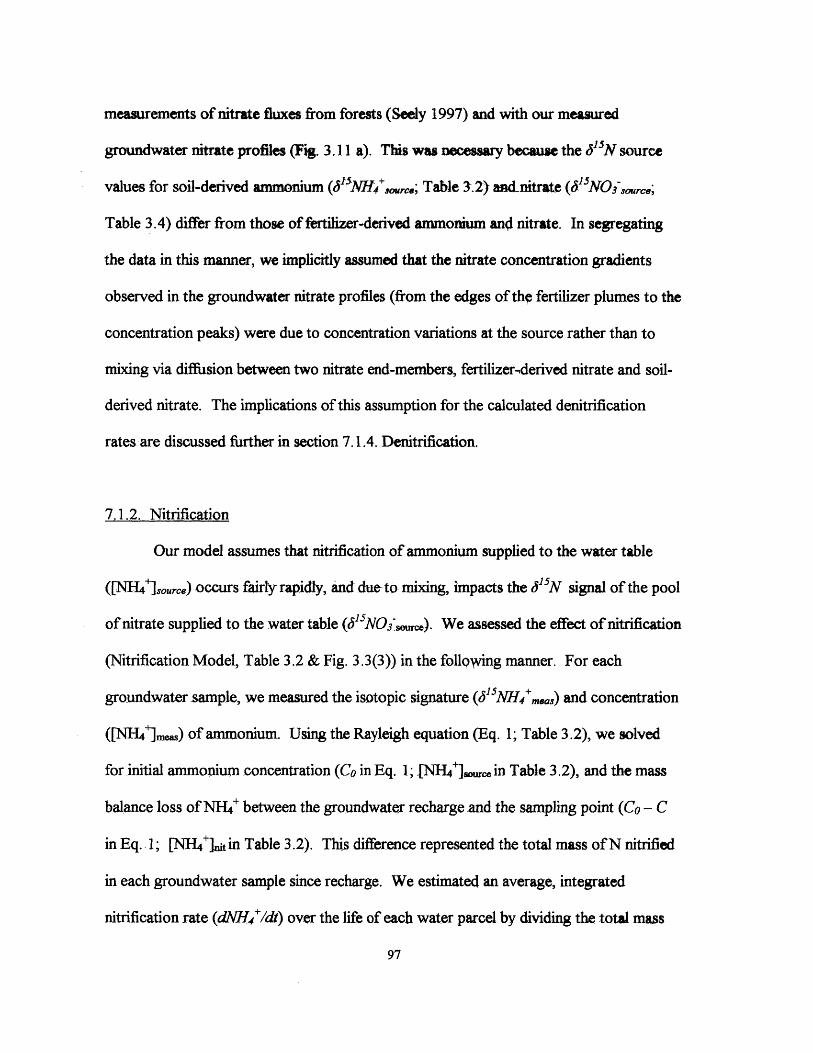
measurements of nitrate fluxes from forests (Seely 1997) and with our measured
groundwater nitrate profles (Fig. 3.11 a). This was necessary because the Q1 5N source
values for soil-derived ammonium (e5'NH4 ,rouc,; Table 3.2) andnitrate (JSNOVNrc ;
Table 3.4) differ from those of fertilizer-derived ammonium and nitrate. In segregating
the data in this manner, we implicitly assumed that the nitrate concentration gradients
observed in the groundwater nitrate profiles (from the edges of thp fertilizer plumes to the
concentration peaks) were due to concentration variations at the source rather than to
mixing via diffusion between two nitrate end-members, fertilizerderived nitrate and soil-
derived nitrate. The implications of this assumption for the calculated denitrification
rates are discussed further in section 7.1.4. Denitrification.
7.1.2. Nitrification
Our model assumes that nitrification of ammonium supplied to the water table
([NH4 sourc,) occurs fairly rapidly, and due- to mixing, impacts the 6I5N signal of the pool
of nitrate supplied to the water table (5'-5NOisoMrce). We assessed the effect of nitrification
(Nitrification Model, Table 3.2 & Fig. 3.3(3)) in the following manner. For each
groundwater sample, we measured the isotopic signature (5 5NHs4',,,as) and concentration
([NH4*]meas) of ammonium. Using the Rayleigh equation (Eq. 1; Table 3.2), we solved
for initial ammonium concentration (Co in Eq. 1; INH4+]wur.in Table 3.2), and the mass
balance loss of NH4 between the groundwater recharge and the sampling point (Co - C
in Eq. 1; [NH4]stin Table 3.2). This difference represented the total mass of N nitrified
in each groundwater sample since recharge. We estimated an average, integrated
nitrification rate (dNH4 /dt) over the life of each water parcel by dividing the total mass
97
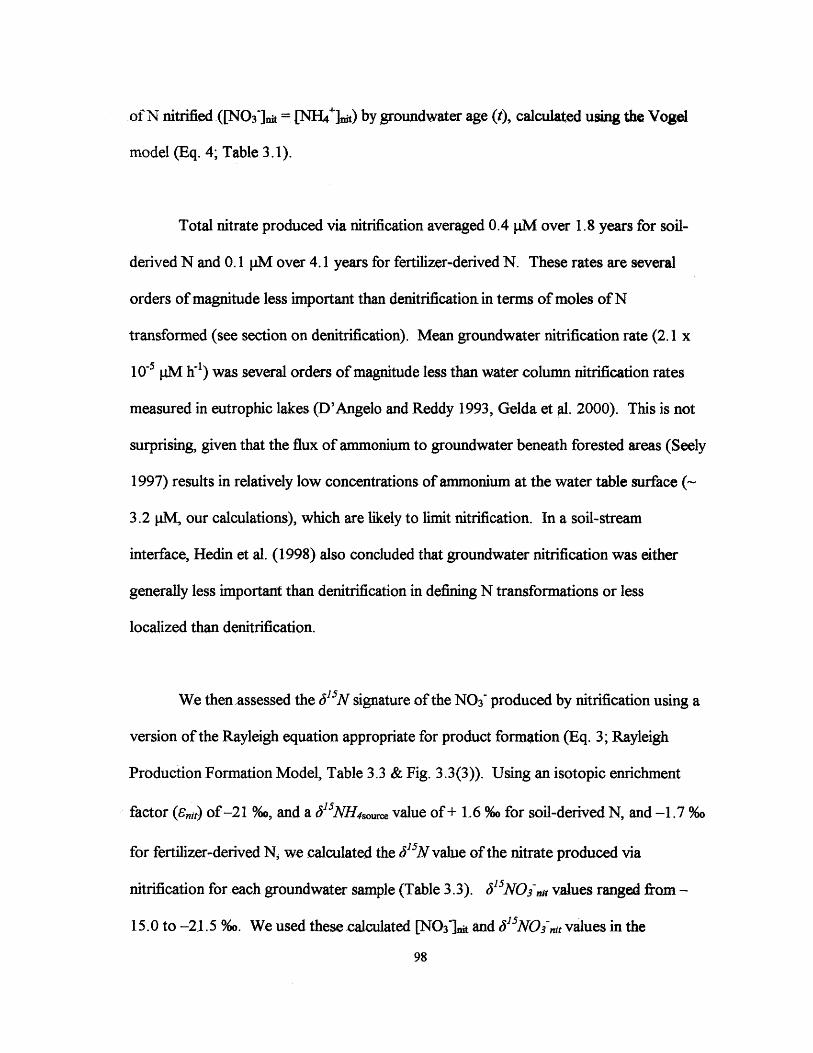
of N nitrified ([NO 3 it =[NH4 ']i 1) by groundwater age (t), calculated using the Vogel
model (Eq. 4; Table 3.1).
Total nitrate produced via nitrification averaged 0.4 pM over 1.8 years for soil-
derived N and 0.1 pM over 4.1 years for fertilizer-derived N. These rates are several
orders of magnitude less important than denitrification in terms of moles of N
transformed (see section on denitrification). Mean groundwater nitrification rate (2.1 x
105 pM hIf) was several orders of magnitude less than water column nitrification rates
measured in eutrophic lakes (D'Angelo and Reddy 1993, Gelda et sl. 2000). This is not
surprising, given that the flux of ammonium to groundwater beneath forested areas (Seely
1997) results in relatively low concentrations of ammonium at the water table surface (~
3.2 M, our calculations), which are likely to limit nitrification. In a soil-stream
interface, Hedin et al. (1998) also concluded that groundwater nitrification was either
generally less important than denitrification in defining N transformations or less
localized than denitrification.
We then assessed the 615N signature of the N03 produced by nitrification using a
version of the Rayleigh equation appropriate for product formation (Eq. 3; Rayleigh
Production Formation Model, Table 3.3 & Fig. 3.3(3)). Using an isotopic enrichment
factor (ena) of -21 %, and a cYSNH4sourc value of+ L6 %o for soil-derived N, and -1.7 %o
for fertilizer-derived N, we calculated the 615N value of the nitrate produced via
nitrification for each groundwater sample (Table 3.3). 6'YNOink values ranged from -
15.0 to -21.5 %o. We used these calculated [NO3iti and 6' 5NOini values in the
98
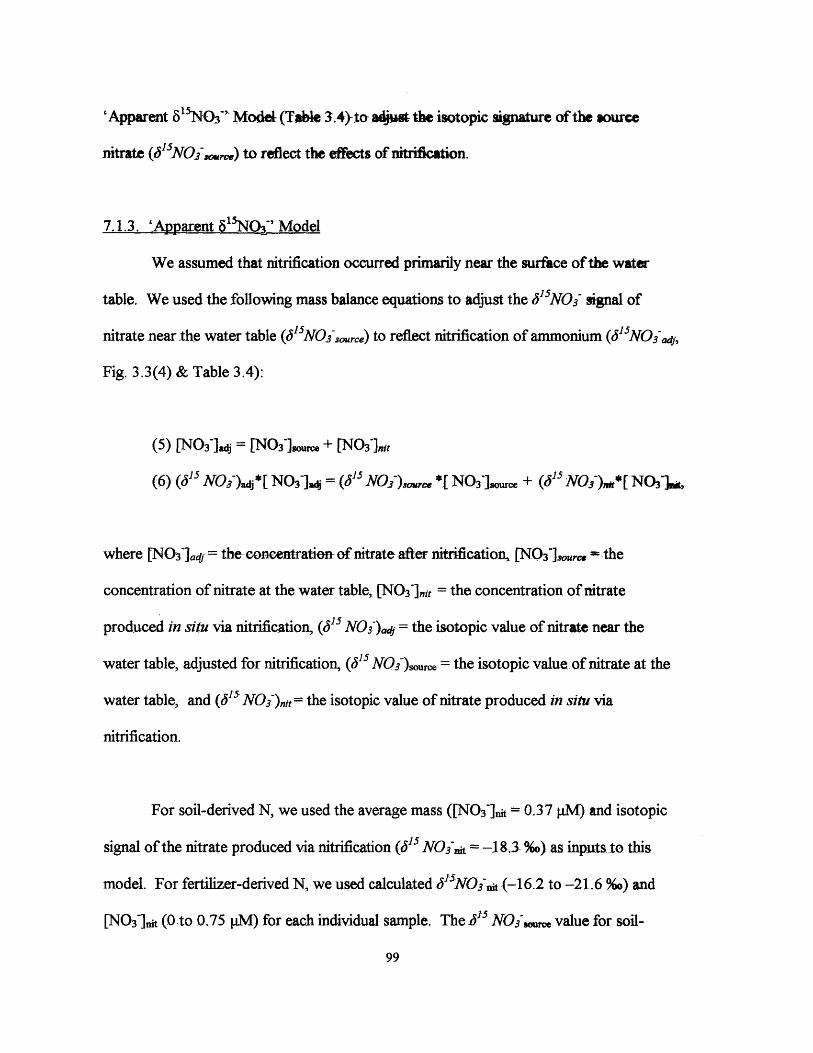
'Apparent 8'NO3"' Mode[ (Tble 3A.4)-to adj"u the isotopic signature of the source
nitrate (PNOie.) to reflect the effects of nitriication.
7.1.3. 'Apparent 6"NOL' Model
We assumed that nitrification occurred primarily near the surface of the water
table. We used the following mass balance equations to adjust the P'NO1 signal of
nitrate near the water table (615JNOasource) to reflect nitrification of ammonium ( 1 5NOi,-,
Fig. 3.3(4) & Table 3.4):
(5) [NOij = [NOi,..e+ [No]ni
(6) (6JS NO3)aj*[ N03iaj =( 6I NOJ)orc*[ N03 m]urce + (tl NOI)nft*[ NO3i,
where [NO3 lad = the concentratim of nitrate after nitrification, [NO3 ~1,,. the
concentration of nitrate at the water table, [NO3]n1 t= the concentration of nitrate
produced in situ via nitrification, (45'5 NOi)a 4 = the isotopic value of nitrate near the
water table, adjusted for nitrification, (61 NOI)source = the isotopic value of nitrate at the
water table, and (65 5 NO). 1 i = the isotopic value of nitrate produced in situ via
nitrification.
For soil-derived N, we used the average mass ([N3~]it = 0.37 pM) and isotopic
signal of the nitrate produced via nitrification (6' NOn =-18.3 %o) as inputs to this
model. For fertilizer-derived N, we used calculated dlsNO3i-i (-16.2 to -21.6 %o) and
[NO31it (0 to 0.75 pM) for each individual sample. The Z' N0I.., value for soil-
99
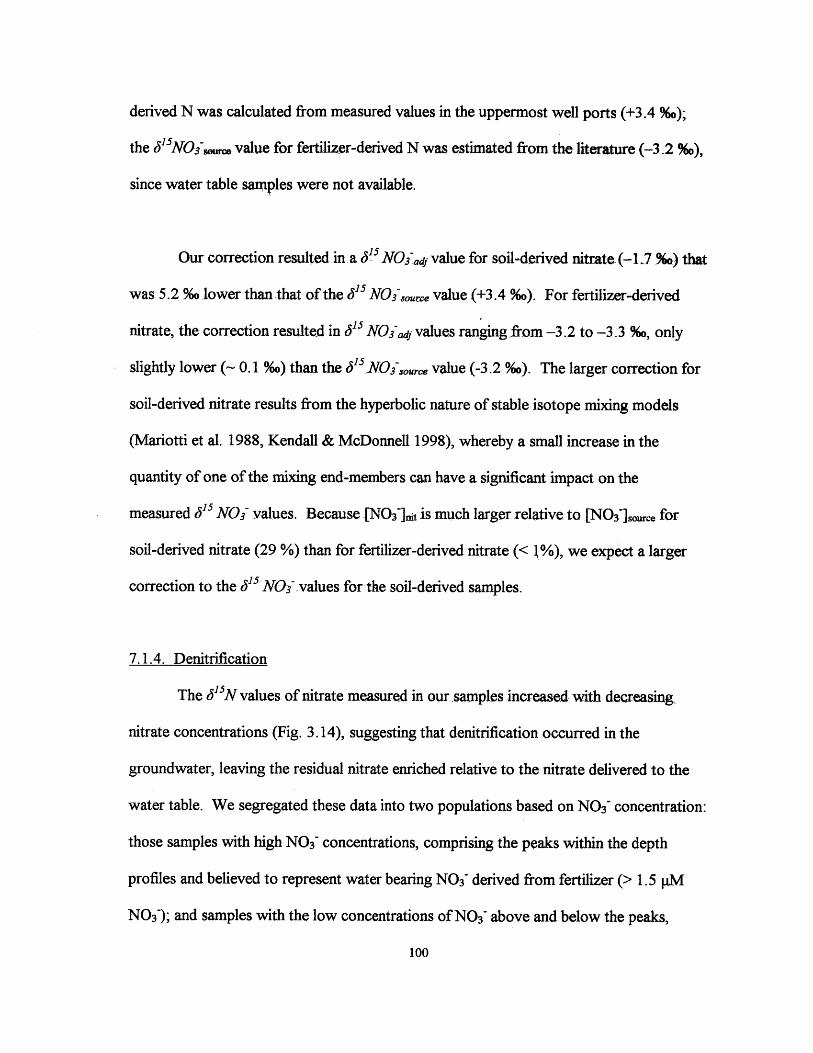
derived N was calculated from measured values in the uppermost well ports (+3.4 %o);
the 5JsNOime value for fertilizer-derived N was estimated from the literature (-3.2 %(),
since water table samples were not available.
Our correction resulted in a . NOiadj value for soil-derived nitrate (-1 -7 %o) that
was 5.2 %o lower than that of the 615 NOIsoure value (+3.4 %o). For fertilizer-derived
nitrate, the correction resulted in 61 NOiadj values ranging from -3.2 to -3.3 %o, only
slightly lower (- 0.1 %o) than the 5 0'JOisource value (-3.2 %o). The larger correction for
soil-derived nitrate results from the hyperbolic nature of stable isotope mixing models
(Mariotti et al. 1988, Kendall & McDonnell 1998), whereby a small increase in the
quantity of one of the mixing end-members can have a significant impact on the
measured PU NOI values. Because [NO3]3it is much larger relative to [NO3-]s}.e for
soil-derived nitrate (29 %) than for fertilizer-derived nitrate (< I%), we expect a larger
correction to the 5 NOI values for the soil-derived samples.
7.1.4. Denitrification
The 615N values of nitrate measured in our -samples increased with decreasing
nitrate concentrations (Fig. 3.14), suggesting that denitrification occurred in the
groundwater, leaving the residual nitrate enriched relative to the nitrate delivered to the
water table. We segregated these data into two populations based on N0 3 concentration:
those samples with high N03 concentrations, comprising the peaks within the depth
profiles and believed to represent water bearing N0 3 derived from fertilizer (> 1.5 pM
N0 3 ); and samples with the low concentrations of N0 3 above and below the peaks,
100
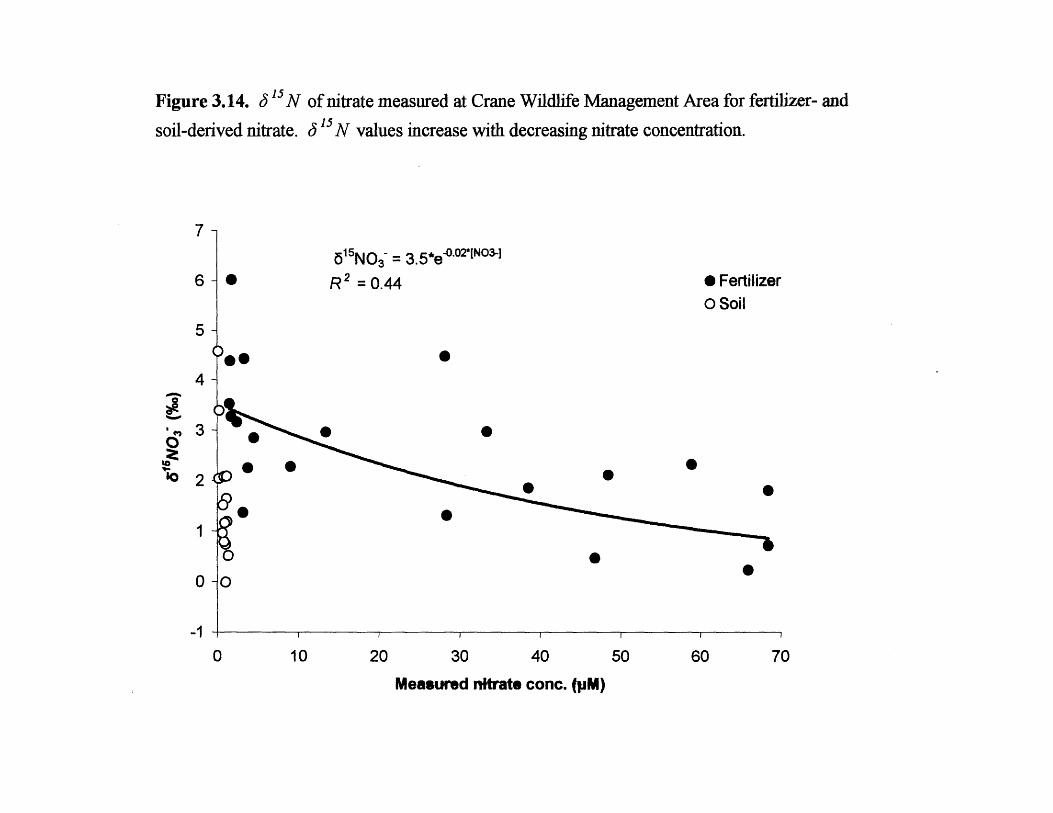
Figure 3.14. b 15 N of nitrate measured at Crane Wildlife Management Area for fertilizer- and
soil-derived nitrate. 6 15 N values increase with decreasing nitrate concentration.
7 -
65"N0 3 = 3.5*e4.02 [NO 3 -]
6 R 2 =0.44 S Fertilizer0 Soil
5
4-
0
0 2
1
00-00
0 10 20 30 40 50 60 70
Measured nitrate conc. (pM)
presumably representing N0 3 originating from soil organic N sources (< 1.5 PM N0 3 ~),
since the isotopic signature of these two nitrate sources is different (Table 3.5).
As we did for nitrification, we used the Rayleigh equation (Eq. 1; Denitrification
Model, Table 3.5 & Fig. 3.3(5)) to solve for initial nitrate concerjtration (Co in Eq. 1, and
[NO3~]aj in Table 3.5), and for mass balance losses of nitrate between the sampling point
and the groundwater recharge point (C - Co in Eq. 1, and [NO3]dph in Table 3.5) for each
groundwater sample. In this calculation, we used the values for 6I"NOfa4 calculated
using the 'Apparent 65NOi' Model. -The calculated nitrate loss ([NO3 ]d.i) was divided
by groundwater age (t) to produce an average denitrification rate (dNOi/dt) for each
groundwater sample over the groundwater flowpath since the time of recharge.
Calculatedinitial nitrate concentrations ([NO3~)aj) for the soil-derived nitrate
samples (0.3 to 1.6 pM N0 3 ~) were consistent with calculations we made of nitrate
concentrations in groundwater beneath forest soils (0 to 2.7 pM N0 3~), using estimates of
nitrate fluxes to groundwater at three sites within the Waquoit Bay watershed (Seely
1997). Initial nitrate concentrations calculated for samples containing fertilizer-derived
nitrate (2.5 to 98.0 pM) fell within the range of nitrate concentrations measured in
groundwater beneath four Cape Cod golf courses (0 to 2,143 pM N, Cohen et al. 1990),
and were somewhat lower than our calculations for mean total nitrogen concentration
delivered to the water table from golf course turf (165 pM N, NLM, Valiela 1997).
102
Average denitrification rates spanned 3 orders of magnitude (2.7 x 10' to 2.1 x
10- M N h"'), and increased with increasing initiatnitrate concentration (0.3 to 98 pM).
The data was fit with a power curve (Fig. 3.15, low DOC site, rate =. 17*iNO3701o, R2
0.76).
To address any issues of circularity associated with using several of the same
points to both parameterize the Rayleigh model (i.e., those points from which we
estimated the 515N values for ammonium (5"NH4source) and nitrate (6'-NOisource) at the
water table) and to estimate denitrification rates using the model, we removed those four
points from the data set and reexamined the results. We found that removing these four
points does not change the calculated range in denitrification rates and increases the mean
denitrification rate only slightly (3.3 x 10' PM N h1 when we exclude the points, versus
3.0 x 10⁴ pM N h' when we include them).
In our analysis, we segregated the data into only two populations, those
containing fertilizer-derived nitrate (>1.5 M; 6"NOisourc, = -3.2 %o) and those
containing soil-derived nitrate (<1.5 M; bt5'NOisource= +3.4 %o). In doing so, we
neglected the impact of mixing between the two nitrate sources, which would result in a
range of jI"N03'source values lying between the two end-member (515NOisource values. To
assess the implications of this assumption, we used the following stable isotope mixing
equations to assign variable 5'NOisource values to the fertilizer-derived nitrate samples:
103
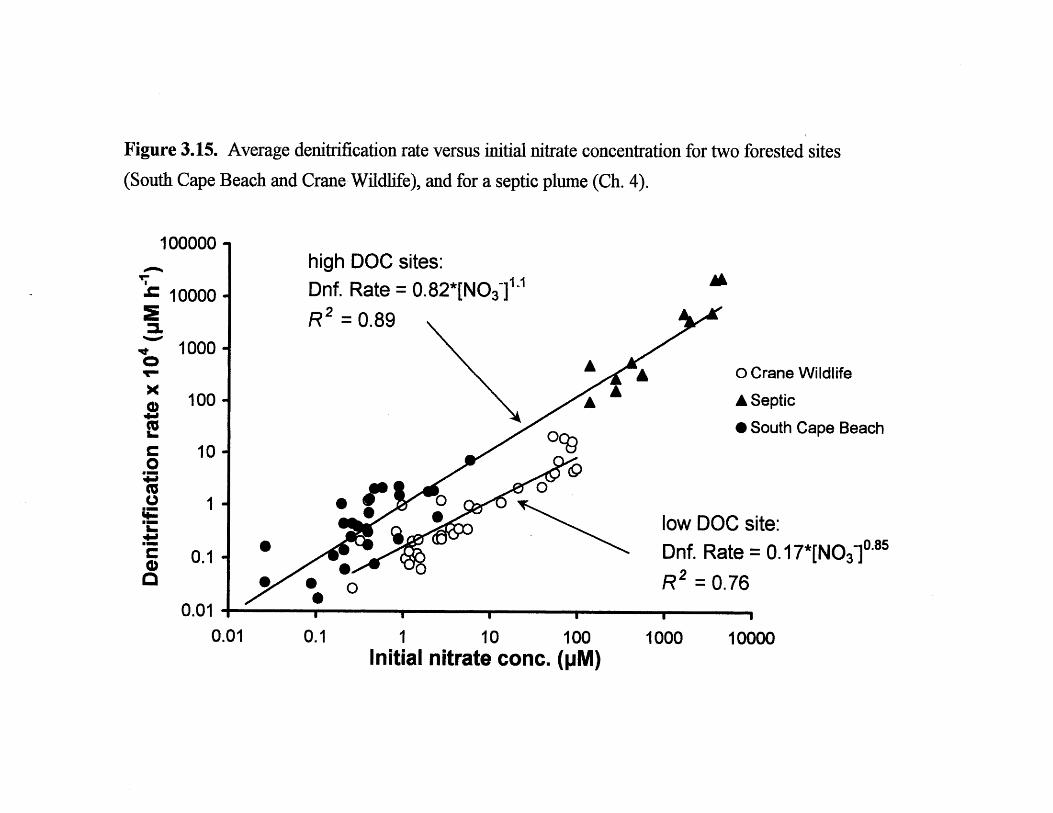
Figure 3.15. Average denitrification rate versus initial nitrate concentration for two forested sites
(South Cape Beach and Crane Wildlife), and for a septic plume (Ch. 4).
100000
10000-
1000-
100-
10-
1
0.1
high DOC sites:Dnf. Rate = 0.82*[NO3~1A
R = 0.89
A A
A A
as oc
e # 0
low DO0 Dnf. Ra
0o R2 = 0.0I
o Crane Wildlife
A Septic
* South Cape Beach
C site:te = 0.17*[NO3~]O.8s76
1 10 100Initial nitrate conc. (pM)
0.
x
0
MU
MEU
0.01 I1
0.01 0.1 1000 10000
[NO3 In.== [NO 3 ].. + [NO 3ifit
c5"5NOi.ource * [NO 3 .1 = 6'5NOi * [NO3 l.d + [NO3 ]u
where [NO 3 ].. is the nitrate concentration measured in thq profile, [NO3J1. is the
concentration of the nitrate derived from soil, [NO] is the concentration of nitrate
derived from fertilizer, 5JNOi, is the 6' 5N value of nitrate derived from the mixture
of fertilizer and soil sources, 6SNOi,,a is the 65'5N source vaue for soil-derived nitrate
(+3.4 %o), and 6"'5NO3 is the 61"N soure value for fertilizer-derived nitrate (-3.2 90).
Recalculating the denitrification rates for the fertilizer-derived nitrate samples using the
variable J"NO .sowo, values resulted, on average, in a 25/6- reduction in the denitrification
rate. Reductions in the calculated denitrification rates were greatest (50-75%) where
nitrate concentrations were lowest (1-2 pM) and negligible (< 8 %) where nitrate
concentrations were higher (>10 pM).
Our calculated average denitrification rates are consistent with groundwater
denitrification rates estimated by Smith and Duff (1988; 1.0 x 10⁻⁶ to 1.2 x 10' pM N h71)
using an acetylene blockage assay on slurried aquifer core material obtained near
wastewater disposal beds, located approximately 1 km to the east of the Crane Wildlife
field site on the Massachusetts Military Reservation. Nitrate concentrations in the
groundwater at the locations where core material was obtained ranged from 0 - 1,760
JM; DOC concentrations were estimated to be - 12 mg C 1-, and were found to be
limiting to denitrification.
105
In this aquifer, DOC concentrations in groundwater decrease with increasing
depth below the water table, with the majority of the attenuation occurring in the first
several meters beneath the water table (Pabich et al. submitted). Based on this previous
work, we hypothesized that the upper portion of the aquifer is a particularly
biogeochemically active zone. If this is the case, we would expect denitrifying activity to
be high near the water table, and decrease with increasing depth below the aquifer
surface, as groundwater ages and labile carbon and nitrate are consumed by
denitrification and other metabolic reactions. To test this hypothesis, we plotted
denitrification rate against depth below the water table for those samples containing soil-
derived nitrate. Denitrification rate indeed decreased with depth below the water table;
R2= 0.84, Fig. 3.16), so that denitrification was fastest in the youngest water and slower
in older waters.
Given the positive relationship between nitrate concentration and denitrification
rate, we investigated whether the data could be modeled using both a first order rate
approximation ([NO3imes= [NO3]adj*e-) and a saturating kinetics expression (d[NOI
dt= (Vmax*([NO3aj(K + [NO-] ad#) where Vma is the maximum reaction velocity and
Km is the half-saturation constant) with respect to nistrate. For the first order
approximation, we calculatedafirst order rate constant (k =[lfl([NO3iadj/[NO3imeas) / t ],
or k = [ln (C/Co)]/t from Rayleigh equation) for each individual groundwater sample, and
averaged the individual values to produce a first order rate congtant for the data set as a
whole (k = 2.9 x 10⁻⁵ h or ,26-y -). Calculating a numerical average of the individual
k's provided a better fit to the data than did a graphical estimatio of k (i.e., the slope of a
106

Figure 3.16. Denitrification rates decrease with increasing depth below the water table
(D Wt) for soil-derived nitrate samples at Crane Wildlife Management Area (R 2= 0.84).Axes are logarithmic.
10-
lffw 1 - 0
Reex
2 0.10
0.820.01 Dnf. Rate = 0.28* Dt-o2
E R 2 = 0.84
0.001 -
0.1 1 10
D, w(m)
plot of ln([NO ]m./[NO 3']jd) vs. time represents k; data not shown). The half-life for
nitrate (ty2) given this first order rate constant, was calculatqd to be 2.7 years. To
parameterize the saturating kinetic expression, we used a Lineweaver-Burke plot (Fig.
3.17; 1/(d[N03 ]/dt) vs. 1/[NOiaj) to calculate the half-saturation constant (Km= 112
pM) and the maximum reaction velocity (Vm = 1.1 x I0- pM N h-1).
To test how well each of these three approximations (average rate over flowpath,
first order rate, and saturating kinetics) represented our data, we ran simulations to
estimate the total N lost in each groundwater sample over the flowpath from recharge to
the downgradient well port. For the first order and saturating kinetics simulations, we
discretized each groundwater flowpath into 4 time steps. FPr the first time step, we
estimated the denitrification rate based on the initial nitrate concentration ([NO 3 ~]-j),
calculated the total mass of N lost to denitrification during thai time band ([NOi]it),
and subtracted the two values ([NO3iaIj - [NO3]dent) to estimate the final nitrate
concentration at the end of the time band. In each sequential tjme band we calculated a
new denitrification rate, N loss, and final N concentration, based on the mass of nitrate
remaining from the previous time band. For the simulation using the average
denitrification rate, we estimated an average denitrification rate over the length of the
flowpath using the power curve fit (Fig. 3.15) and either the initial or the final nitrate
concentration ([NOiaj). We multiplied this denitrification rate by the total groundwater
travel time (from recharge to downgradient well port) to calculate total N lost over the
flowpath [NOfideit); we subtracted this value from the initial nitrate concentration
108
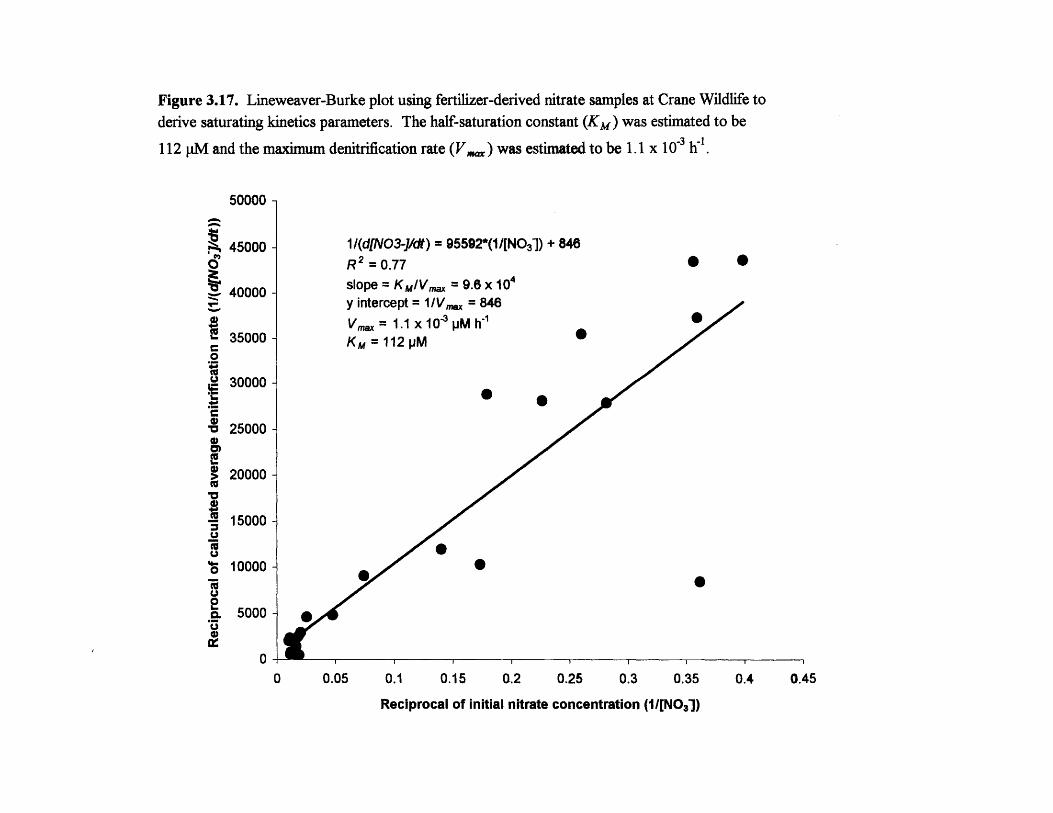
Figure 3.17. Lineweaver-Burke plot using fertilizer-derived nitrate samples at Crane Wildlife to
derive saturating kinetics parameters. The half-saturation constant (Km) was estimated to be
112 pM and the maximum denitrification rate (Vx) was estimated to be 1.1 x 10⁻³ i'.
50000-
; 45000- 1/(d[NO3-J/dt) = 95592*(1/[NO 3-) + 848R 2 = 0.77slope = Km/Vmm = 9.6 x 10⁴
y intercept = 1iVm = 846V l. = 1.1 x 10~ pM h-1
35000- Km= 112 pM0
30000-
- 25000 -
S20000 -ca
15000 -
1 20000-
'U5000 -
00 0.05 0.1 0.15 0.2 0.3 0.35 0.4 0.45
Reciprocal of initial nitrate concentration (1I[N0 31)
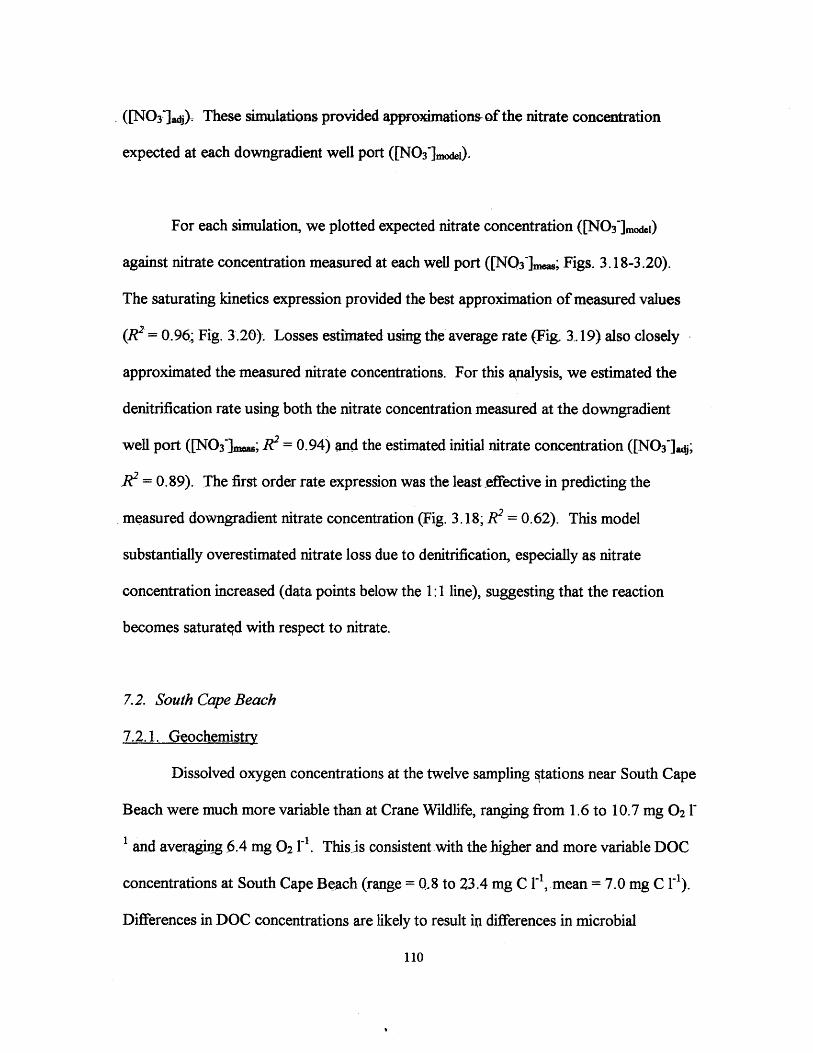
([NO37}4). These simulations provided approximations of the nitrate concentration
expected at each downgradient well port ([N0 3]mci).
For each simulation, we plotted expected nitrate concentration ([NO3~]moI)
against nitrate concentration measured at each well port ([NQ 3 ]u; Figs. 3.18-3.20).
The saturating kinetics expression provided the best approximation of measured values
(R" = 0.96; Fig. 3.20). Losses estimated using the average rate (Fig. 3.19) also closely
approximated the measured nitrate concentrations. For this analysis, we estimated the
denitrification rate using both the nitrate concentration measured at the downgradient
well port ([NO 3 ]m.; R 2 = 0.94) and the estimated initial nitrate concentration ([NO3~]4;
R2= 0.89). The first order rate expression was the least effective in predicting the
measured downgradient nitrate concentration (Fig. 3.18; R2 = 0.62). This model
substantially overestimated nitrate loss due to denitrification, especially as nitrate
concentration increased (data points below the 1:1 line), suggesting that the reaction
becomes saturated with respect to nitrate.
7.2. South Cape Beach
7.2.1. Geochemistry
Dissolved oxygen concentrations at the twelve sampling §tations near South Cape
Beach were much more variable than at Crane Wildlife, ranging from 1.6 to 10.7 mg 02 1
and averaging 6.4 mg 02 11. This-is consistent with the higher and more variable DOC
concentrations at South Cape Beach (range = 0,8 to 23.4 mg C l", mean = 7.0 mg C 1).
Differences in DOC concentrations are likely to result in differences in microbial
110
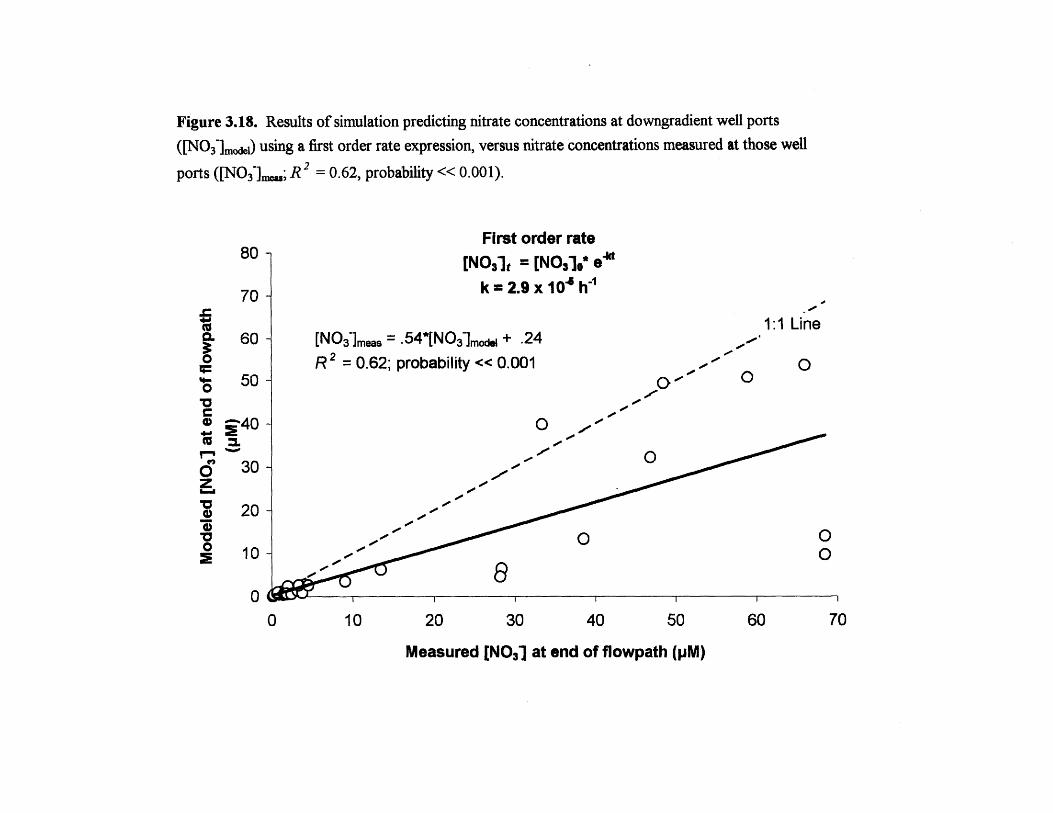
Figure 3.18. Results of simulation predicting nitrate concentrations at downgradient well ports
([NO3lxe) using a first order rate expression, versus nitrate concentrations measured at those well
ports ([NO 3 i-n; R 2 = 0.62, probability << 0.001).
First order rate80 [NO 31t = [N0310* e'
70- k = 2.9 x 10 4 h
3 1:1 Line60 - [NImeas = .54*[NO3-moi + .24 1 1 Lin
02 R= 0.62; probability << 0.001 . /0 050- 0 0
0 -
-
-30 -*00
'e 20 - ----
00
10 - 8 O0
0 (3-0 10 20 30 40 50 60 70
Measured [NO3) at end of flowpath (pM)
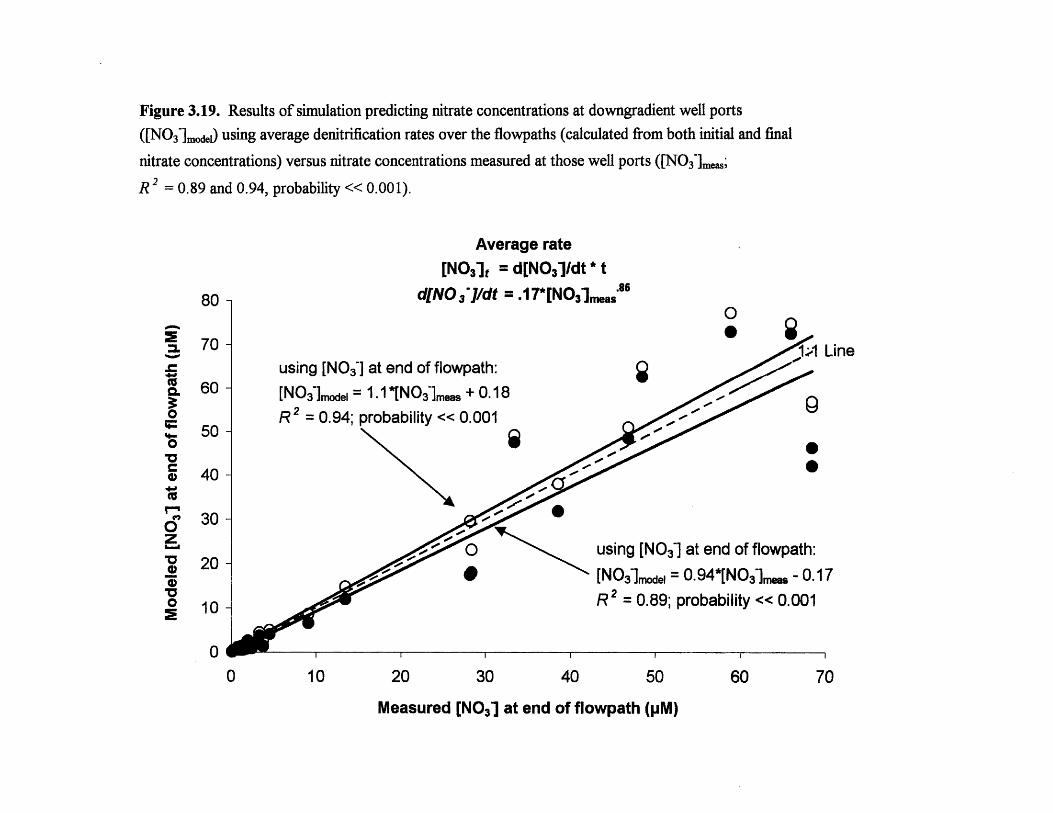
Figure 3.19. Results of simulation predicting nitrate concentrations at downgradient well ports
([NO3 ]mo&) using average denitrification rates over the flowpaths (calculated from both initial and final
nitrate concentrations) versus nitrate concentrations measured at those well ports ([NO3]m;
R 2= 0.89 and 0.94, probability << 0.001).
Average rate
[N0 3]t = d[NO 3]/dt * t
80_ d[NO 3i/dt =.17*[NO3lrnsas86
0
701using [Nm] at end of flowpath:
S60- [NO3imode = 1.1*[N0 3 ]meas + 0.18
=R 2 0.94; probability << 0.00150-
0
40 -
30-2Z - using [NO] at end of flowpath:
[N 3 -Imodei = 0.94*[No 3-1m.s - 0.17
10 R2 = 0.89; probability << 0.001
100 1
0 10 20 30 40 50 60 70
Measured [NO 3] at end of flowpath (pM)
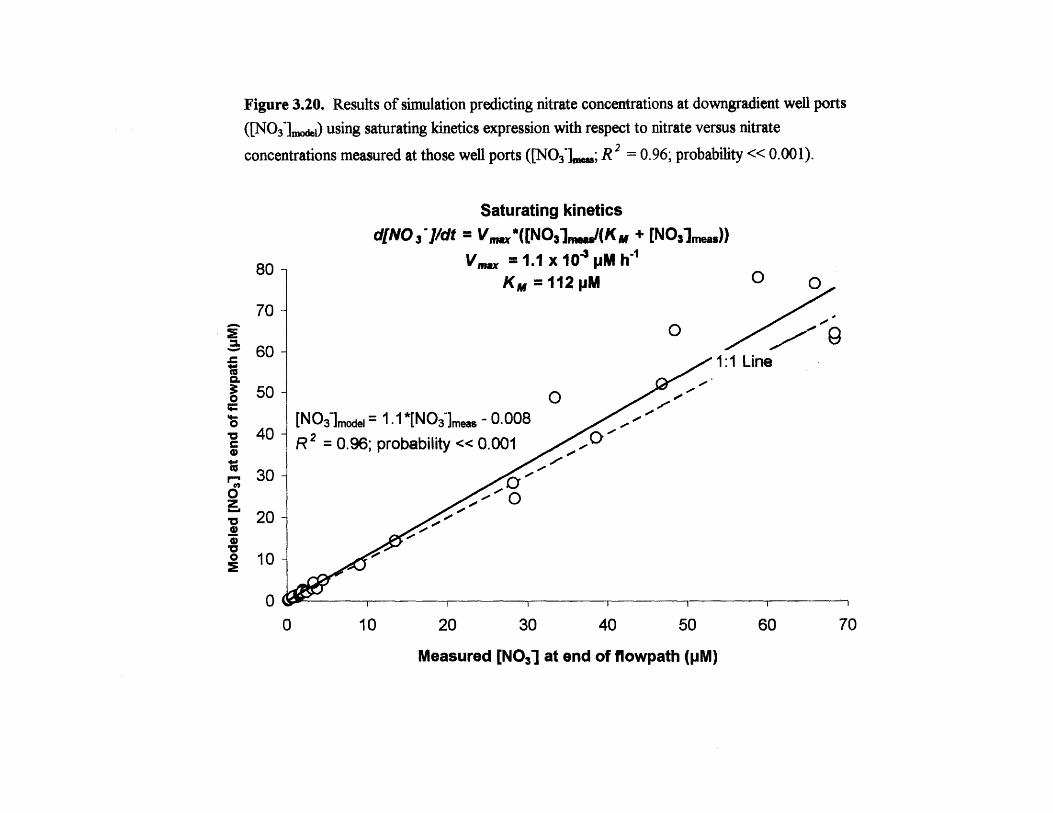
Figure 3.20. Results of simulation predicting nitrate concentrations at downgradient well ports
([NO]3oj&) using saturating kinetics expression with respect to nitrate versus nitrate
concentrations measured at those well ports ([NO3 ].; R 2 = 0.96; probability << 0.001).
Saturating kinetics
d[NO 3'J/dt = Vmx*([NO 3 ma/(K N + [NO]nm))
80_ V. = 1.1 x 10 4 pM hKM=112pM 0 o
70-
i 0'60- 1:1 Line
0.. 500 0
[NO3]moei = 1.1 *[NO 3imen - 0.00840 R2 = 0.96; probability << 0.001 -
300
0 10
0
0 10 20 30 40 50 60 70
Measured [NO 3] at end of flowpath (pM)
metabolism between the two sites; where DOC supply is high, greater microbial activity
is likely to reduce dissolved oxygen concentrations.
Nitrate concentrations at the South Cape Beach stations ranged from 0.01 to 4.0
pM, and averaged 0.6 pM, which were low relative to those at Crane Wildlife and to
other more residential areas in the Waquoit Bay watershed (up to 1000 pM; Kroeger et al.
1999, Valiela et al. 1992). Ammonium concentrations were similarly low, ranging from
0 to 3.9 pM, and averaging 0.8 pM, consistent with inputs of ammonium derived solely
from soil organic matter (Seely 1997). 6'5N of nitrate ranged from -4.9 to +4.5 %o, and
averaged -3.0 %o; the modal 31 sNO1 value (- -2 %o) was ~ 4 %o lower than at Crane
Wildlife Management Area (- +4 %o; Fig. 3.9). Like at Crane Wildlife, temporal
variability in groundwater chemistry was much less than spatial variability (Table 3.6).
7.2.2. Nitrification
Because we did not measure 6 5N of ammonium at South Cape Beach, we could
not estimate nitrification rates directly as we did at the Crane Wildlife site. Instead, we
assumed that the lowest measured 515NOi value (-4.9 %o) was representative of the
impact of nitrification on the stable isotopic signature of nitrate near the water table, and
assigned this value to 65NOiadf.
7.2.3. Denitrification
To model denitrification at South Cape Beach, we used the same enrichment
factor (6) as at Crane Wildlife (-13.9 %o), and -4.9 %6o for the source nitrate adjusted for
114
nitrification (515NOa 4 ), as discussed above. Measured 65N values at South Cape Beach
were consistently lower than those at Crane Wildlife (Fig. 3.9), suggesting that loss
complete nitrification (greater fractionation) occurred at South Cape Beach. Ammonium
made up a much larger fraction, on average, of the total inorganoc nitrogen (NH4 + N03,
57%) than at Crane Wildlife (13 %), supporting the idea that nitrification was less
complete at South Cape Beach, and therefore played a more important role in
determining groundwater 5'5N signals.
Consistent with our findings at Crane Wildlife, average denitrification rates at
South Cape Beach increased with increasing initial nitrate concentration, from 9.2 x 10⁻⁹
pMNO3 h-to 7.2 x 1 0 4 pM NO3I 1 as initial nitrate inereased from 0.2 to 5.9 pM
N0 3 . However, denitrification rates at this site were higher for any given initial nitrate
concentration than in the lower DOC environment of Crane Wildlife. This is illustrated
by a power curve fit through a plot of average denitrification rgte versus initial nitrate
concentration (Fig. 3.15), where the regression slope is similar for both the high and the
low DOC populations, but the curve has been shifted such that the value of the y-
intercept is higher for the higher DOC population. This suggests that DOC concentration
is an important determinant of denitrification rate. In fact, the mean of the first order rate
constants (k = [ln([NQij].W[NO3]jm.)] t ) calculated for the individual samples at South
Cape Beach was 6 times higher (1.8 x I04 h~l or 1.5 y 1; .12,= 0.45 y)than that
calculated for the Crane Wildlife samples. This suggests that, independent of nitrate
concentration, denitrification rates are higher at the higher DOC site.
115
In Chapter 4, we calculated denitrification rates in excess of dilution in a septic
system plume outfitted with 9 multilevel sampling wells along a downgradient transect.
Losses of nitrate were assessed with respect to boron, a conservative tracer; rates were
calculated for each water sample by dividing the mass of nitrate lost between the septic
system leach field and the downgradient well sampling port, by groundwater age at that
port calculated using the Vogel (1967). Denitrification rates in the septic system (0.01 to
2.23 pM N03- h-) also increased with increasing initial nitrate concentration (137 to
4,396 pM). We assumed that DOC concentrations in the septic plume were similar to
those measured in other plumes of this age (Ch. 4, - 26 mg C 1- from Robertson et al.
(1998)).
We add this data here (Fig. 3.15) to illustrate that denitrification rates, both
assessed using a different method (mass balance instead of stable isotopes), and in a very
different system (higher DOC and nitrate concentrations, and presumably a larger and
more active microbial population), follow the same general trend as observed in the
natural forested sites. The addition of the septic system data to Figure 3.15 supports the
conclusion that denitrification rates are higher for any given nitrate concentration in the
two systems with higher DOC concentrations (South Cape Beach (0.8 to 23.4 mg C F),
and the septic plume (-26 mg C I); denitrification rate = 0.82*[N0 3 ]1., R2= 0.89) than
in the system with low DOC (Crane Wildlife (<2 mg C ri); denitrification rate =
0.-17*[NO 3' 5 , Rz = 0.76). Eurther; the mean of the first order rate constants (Table 3.8)
calculated for the individual septic plume samples (k = 3.1 x 10' h7' or 2.7 y1;
116
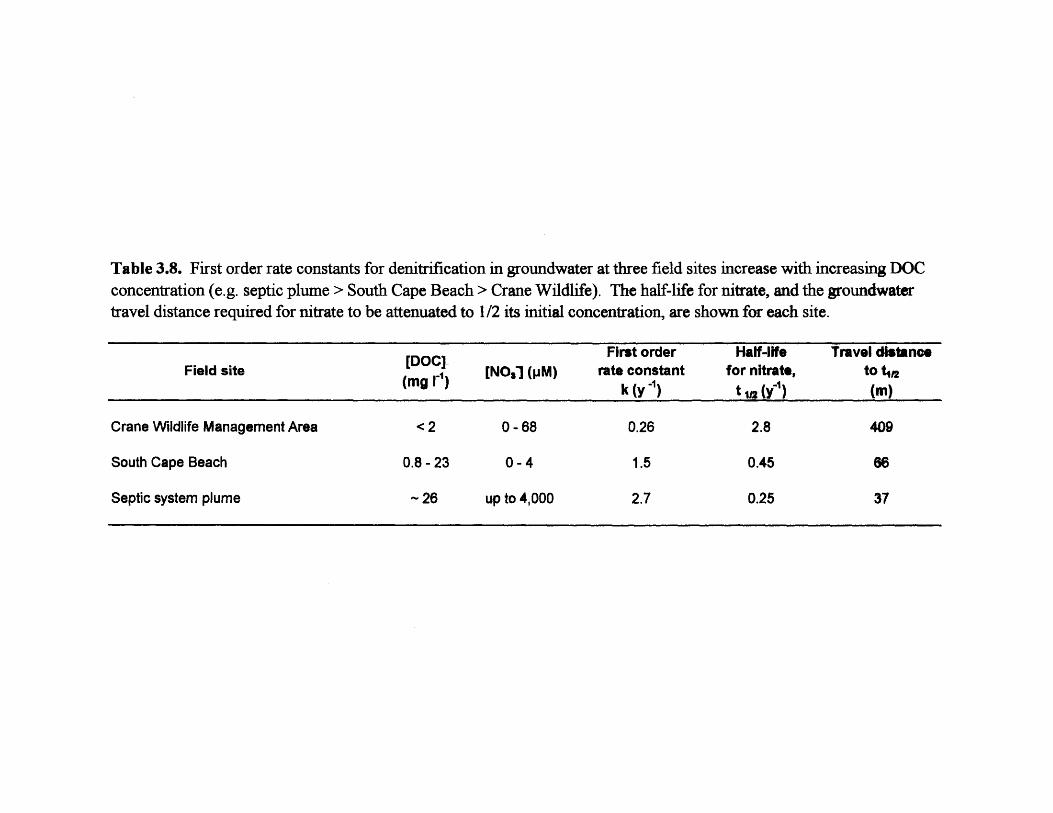
Table 3.8. First order rate constants for denitrification in groundwater at three field sites increase with increasing DOCconcentration (e.g. septic plume > South Cape Beach > Crane Wildlife). The half-life for nitrate, and the groundwatertravel distance required for nitrate to be attenuated to 1/2 its initial concentration, are shown for each site.
[DOC]- First order Half-life Travel distanceField site [DC 11 [NO$] (pM) rate constant for nitrate, to t12
(mg) k (y -) t in (y) (m)
Crane Wildlife Management Area < 2 0 -68 0.26 2.8 409
South Cape Beach 0.8 - 23 0- 4 1.5 0.45 86
Septic system plume ~ 26 up to 4,000 2.7 0.25 37
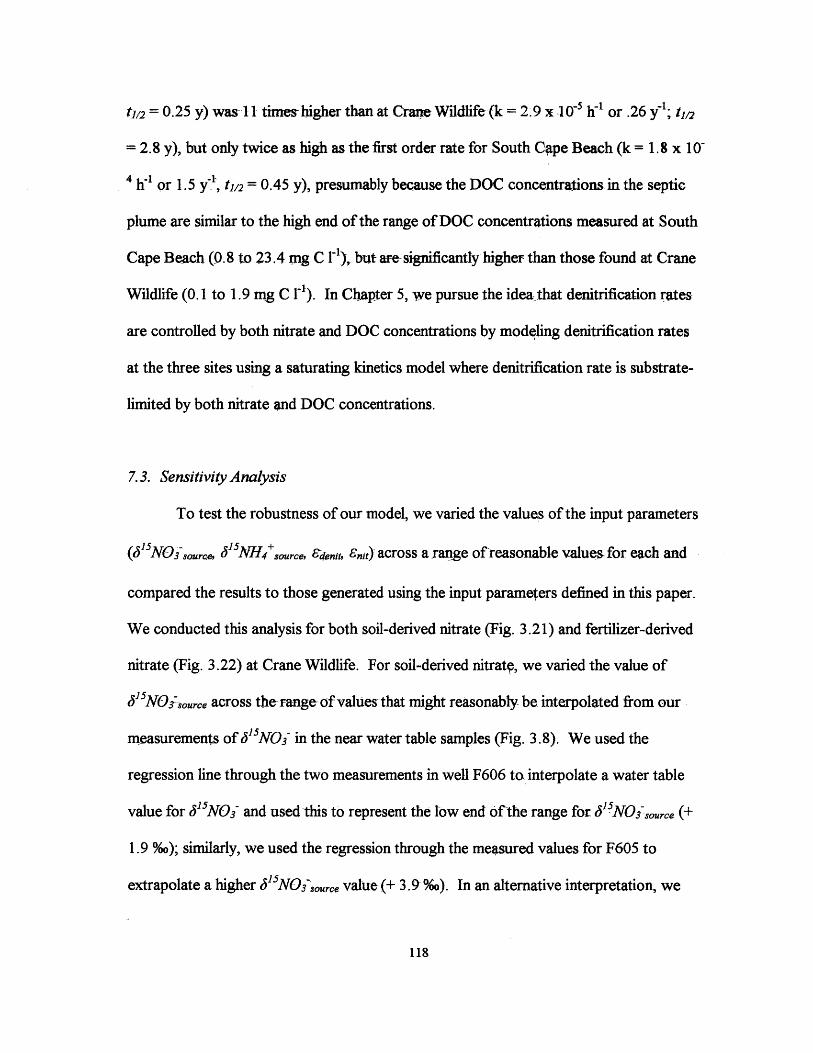
tiI2 = 0.25 y) was 11 times- higher than at CraneWildlife (k = 2.9 x 10~' h~' or .26 y1; tm1
= 2.8 y), but only twice as high as the first order rate for South Cape Beach (k = 1.8 x 10-
h7 h' or 1.5 y7, t, = 0.45 y), presumably because the DOC concentrations in the septic
plume are similar to the high end of the range of DOC concentrations measured at South
Cape Beach (0.8 to 23.4 mg C r'), but are- significantly higher than those found at Crane
Wildlife (0.1 to 1.9 mg C r~). In Chapter 5, we pursue the idea that denitrification rates
are controlled by both nitrate and DOC concentrations by modeling denitrification rates
at the three sites using a saturating kinetics model where denitrification rate is substrate-
limited by both nitrate and DOC concentrations.
7.3. Sensitivity Analysis
To test the robustness of our model, we varied the values of the input parameters
(6i"NOcsource, (51NH4source, denit, Snit) across a range of reasonable values for each and
compared the results to those generated using the input parameters defined in this paper.
We conducted this analysis for both soil-derived nitrate (Fig. 3.21) and fertilizer-derived
nitrate (Fig. 3.22) at Crane Wildlife. For soil-derived nitratp, we varied the value of
5iNO3source across the range- of values that might reasonably be interpolated from our
measurements of 65NO3 in the near water table samples (Fig. 3.8). We used the
regression line through the two measurements in well F606 to interpolate a water table
value for c5iNOI and used this to represent the low end 6fthe range for 1 ,NOisource (+
1.9 %o); similarly, we used the regression through the measured values for F605 to
extrapolate a higher 6iSNOisource value (+ 3 .9,%). In an alternative interpretation, we
118
Figure 3.21. Results of sensitivity anaLysis of denitrification model for soil-
derived nitrate. Input parameters (6 1s NH4 + source' Y (5NO 3 + source C denit, and
c,,, were varied across a reasonable range of values; dashed lines represent themodeled denitrification rates used in this paper.
5-
4-
3-
2-
1-0
0212 0 2 4 6 1 2
6"NH4 *, =,.,(%.)
0
0
0
1 1
3 4
5"NO3%ore(%.)
5
0
- 0 - ~ - ~ - - - - - - - -
-30 -10
Edenit (%.)
D
$12 -zE 10 -
8-
x 6-
* 4-
cc 2 -
0-
-2-,
6
5-12 -
110-C
6 -
4-
.e2
0-5
4
3-
2-
1
0100
-I
-35 -25 -15Enit (%/00)
-5

Figure 3.22. Results of sensitivity analysis of denitrification model for fertilizer-derived nitrate. Input parameters ( 5 NH4 + source, 1 '5 NO + source , 6 denit, and
e6 , were varied across a reasonable range of values: dashed lines retresent themodeled denitrification rates used in this paper.
-0O-----o ------------ ~
130 -
110 -
90 -
70 -
0
0
50 __
30 -
10 -
-10 i I-10 -86
0
I I 1 -
-6 -4 -2 05 NO,, ,c(%0)
0
----------------------
0I.-
-50 -401 1
-30 -20
tdenit (%o)
-10 0
z
x4,~5
.22
0
60-
50 -
40 -
30 -
20-
10 -
0 4---10 -6 -2 2
s NH4 re(%o)
0
2 4
. 250-
-25200
150-
C 100-
50-
o 0
100 -
80 -
60 -
40 -
20-
0 1-35 -25 -15
Enit (%0)
-5
used an average of the two regression lines (as opposed to the regression through all four
points as used in our previous calculations) to interpolate a value for the mean water table
51NO1 (+ 2.9 %o). Since the value used in our model (+ 3.4%o) was near the high end of
the range defined by these other regressions, we tested a higher value (+ 5 %o), placing
our model value in the middle of the range used in the sensitivity analysis.
We used a similar analysis of our measured 5JNH+ values near the water table
(Fig. 3.8) to define a range of bV5NH4 M,, values for the sensitivity analysis. The
regression through the 51"NH4+ measurements for F606 gave usthe high end of the range
(+ 5.0 %o); the regression through the 1 NNJ+ measurements- for F605 produced a lower
value (+ 1.2 %o). The average of these two regressions produced an intermediate value
for & 5 NHV source (+- 3.1 %o). We rounded out the analysis by using another lower value
(-1.8 %o), again placing our model value (+ 1.6 %o) in the middle of the range used in the
sensitivity analysis.
For fertilizer-derived nitrate, we varied the value for 5"NOisource from the low
end of the range of P'Nmeasured forfertilizer reported in the literature (-8.0 %o, Freyer
and Aly 1974, Kohl et al. 1971, Kreitler 1977, Mariotti and LetQlle 1977) through +2 %o,
or 4.8 %o in either direction of our model value (-3.2 96). While fertilizer values can
range as high as + 6.2 %o (Freyer and Aly 1974, Kohl et al. 197, Kreitler 1977, Mariotti
and Letolle 1977), the fertilizer applied on Falcon golfcourse was primarily urea.
Because nitrate in the underlying groundwater was likely produced via nitrification of
urea,-a significantly positive J5NO.rc, signal is unlikely. We similarly varied the
121
5 NH 4 sourc, valuefor fertilizer-derived-N through the full range reported in the literature
(-8 to + 6.2 %o), with our model value falling in between the twp end-members (-3.2 %o).
For both soil-derived and fertilizer-derived N, we varied the enrichment factors
for nitrification and denitrification (denit and Enit, respectively) across the fill range
reported in the literature, or from -5 to -40 %o for ed,,,,, and from -12 to -29 % for en,,it.
In both cases, our model value was the mean of the literature range.
The sensitivity analysis suggested that our results are highly insensitive to the
value used for cnit for both soil-derived (Fig. 3.21) and fertilizer-derived (Fig. 3.22)
nitrate,and to the value used for ('NH4 *,urce in the case of fertilizer-derived N. Mean
denitrification rate calculated for the Crane Wildlife groundwater samples changed, at
most, only 1.4 % over the range of Enwt values used in the sensitivity analysis (lower right
panels in Figs. 3.21 & 3.22). For the fertilizer-derived N samples, mean denitrification
rate changed only 3.9 %, at most, when the value of 65NH4 source was varied across the
entire of the literature range (Fig. 3.22, upper left panel).
Calculated denitrification rates were more sensitive to the values used for
t5 NH4sourc, in the case of-soil-derived N, and to the values used for 5NO3sourc, and
Edenit for both soil-derived and fertilizer-derived N. In all case , the results were within
the same order of magnitude as those used in this paper. In the case of soil-derived N,
mean denitrification rate increasing almost 3 foldwhe- the b"NH4 source value was
decreased to the lowest end of the range (-1.2 %o; Fig. 3.21, uppeT left panel). The model
122
produced negative denitrification rates when the highest 5'SNH4+,mrce value was used (+
5.0 %.). Over the range of input values for 61 5NO,J.., mean denitrification rate
changed by a maximum of+ 54% for soil-derived nitrate (Fig. 3.21, upper right panel),
and + 136% for fertilizer-derived nitrate (Fig. 3.22, upper right panel), when the lowest
65"SNOs,,oce values were used (+1.9 and -8 %o, for soil- and fertilizer-derived N,
respectively).
An interesting result of the sensitivity analysis was that denitrification rates were
only somewhat sensitive to a decrease in the value of the enrichment factor for
denitrification (esd.t) from that used in our calculations, but muqh more sensitive to an
increase in ent. Mean denitrification rate decreased by 69 % when cs,.i was decreased
from -14 to -40 %o (lower left panels in Figs. 3.21 & 3.22). In contrast, mean
denitrification rate increased to a much greater extent (3.5-fold) when the value of Ed,,it
was increased from -14 to -5 %o. The sensitivity of our calculations to the enrichment
factor, particularly as ednit becomes less negative, points to the importance of
understanding what controls the degree of fractionation during denitrification, and to
what degree fractionation in groundwater is site-specific.
Researchers have observed that cenit values measured in qitu (Mariotti et al. 1988,
Smith et al. 1991) are lower than those measured in laboratory incubations (Delwiche and
Steyn 1970). Mariotti et al. (1988) suggested that groundwater denitrification may
proceed in dead-end or "cul-de-sac" pores in the aquifer, within which reduction may go
to completion with no net fractionation; diffusion of nitrate into those pores may then be
123
what controls the degree of fractionation. Thus, what we measure in groundwater may be
an "apparent" enrichment factor. A similar effect might be observed where
denitrification is otherwise transport-limited (i.e., in organic clusters or sediment-water
interfaces, J.K. Bohlke, personal communication), or rate-limited at the enzymatic or
cellular level. In an aquifer system such as ours, characterized by oxygenated
groundwater and relatively low NO3 concentrations, denitrification is likely to proceed
primarily in anaerobic microsites (Koba et al. 1997, Parkin 1987, Hojberg et al. 1994)
within the aquifer matrix or within areas of restricted flow where oxygen concentrations
may be reduced and carbon substrate accumulated. The progress of the denitrification
reaction in such environments would necessarily be diffusion-limited. An interesting
question for future research is to what degree do the physical characteristics of the aquifer
system effect the measured enrichment factor (Sden,,).
8. Conclusions
Our results have important implications for interpretation of natural variability in
groundwater denitrification, and suggest that both DOC and nitrate concentrations exert
important controls on denitrification rates. First order denitrification rate constants with
respect to nitrate were highest where groundwater DOC concentrations were highest: k =
2.8 yl in the-septic plume (- 26 mg C I-), k = 1.6 y - at South Cape Beach (DOC = 0.8
to 23.4 mg C 1 ), and k = .25 y' at Crane Wildlife (0.1 to 1.9 mg C 1-), suggesting that
denitrification rates in all cases increase with increasing nitrate, and that, independent of
nitrate concentration, DOC concentrations exert a significant control on denitrification
rates. A simulation of N losses alonggroundwater flowpaths at Crane Wildlife suggests124
that a saturating kinetics expression with respect to nitrate best predicts nitrate
concentrations measured at the downgradient well ports (R2= 0.96 for [NO3 1.. Vs.
[NO3~m.). In Chapter 5, we further explore the use of a saturating kinetics expression
that incorporates both nitrate and DOC concentrations to model denitrification rates.
Our findings have relevance for land use and planning decisions related to
nitrogen loading. The distance-dependent nature of N losses resulting from aquifer
denitrification suggests that while denitrification occurs at relatiyely low rates within the
Waquoit Bay aquifer, when integrated over long flow path lengths, substantial natural
attenuation of N can occur. In assessing the potential N loads from various sources, it is
critical to consider the magnitude of individual N0 3 ~ sources, travel distances to shore,
and the DOC concentrations in groundwater in determining options for reducing N loads.
For example, if we consider two nitrate sources, both located 100 m from a downgradient
receiving water body, one a fertilizer plume containing 500 PM N0 3- (where DOC <2
mg C 1 and k = 0.26 y'), and the other, a septic system plume containing 4,000 pM
N0 3 ~ (where-DOC ~ 26 mg C r" and k = 2.7 y-), we find that by the time these plumes-
have reached the downgradient water body, nitrate concentrations within the fertilizer
plume have been reduced by denitrification to about 430 M N0 3 ~, while nitrate
concentrations in the plume have been reduced to about 1100 pM. In this case, the
septic-derived N clearly constitutes a larger fraction of the total N load from these two
sources. However, if we then institute a 200 m setback limit from the receiving water
body for all N sources, we find that by the time these two plumes have reached the
downgradient water body, the nitrate concentration in the septic plume has been reduced
125
by groundwater denitrification to approximately 100 pM N0 3 , while the fertilizer plume,
given its lower DOC concentration, still contributes about 350 pM N0 3~, making it the
dominant N source. The principles outlined in this paper should be applied to the design
of setback limits for septic systems, in assessing the value of open spaces for N load
reduction, in regulating wastewater disposal, and in watershed-wide land use planning.
126
9. Acknowledgements
We thank staff at the Waquot Bay National Estuarmne Research Reserve for generalsupport. This work could not have been done without the generous contributions ofexpertise and resources by Denis LeBlanc of the US Geological Survey, Marlborough,MA; his help with well construction, installation, and site access, and his worthy advicewere invaluable. Paul Barlow at the USGS was also an essential contributor by running aMODFLOW simulation of groundwater flow at Crane Wildlife. We thank GabrielleTomasky, at the Boston University Marine Program, for field and lab assistance; AmyWatson at MIT, who helped analyze our NH4 samples as part of her summer internuhip;and Anne Giblin and Kathy Regan at MBL for use of and technical support with an ionchromatograph. MIT Sea Grant (# 65591) and a National Estuarine Research Reserve(NERRS) Graduate Fellowship from the National Oceanic and AtmosphericAdministration (NA770R024) supported this work.
127
10. References
Barlow PM & Hess KM (1993) Simulated Hydrologic Responses of the Quashnet RiverStream-Aquifer System to Proposed Ground-Water Withdrawals, Cape Cod,Massachusetts. U.S. Geological Survey, Water-Resources Investigations Report 93-4-64,Marlborough.
Bengtsson G & Annadotter H (1989) Nitrate reduction in a groundwater microcosmdetermined by '5N gas chromatography-mass spectrometry. Appl. Environ Microbiol.55: 2861-2870.
Bottcher J, Strebel 0, Voerkelius S, & Schmidt HL (1990) Using isotope fractionation ofnitrate-nitrogen and nitrate-oxygen for evaluation of microbial denitrification in a sandyaquifer. J. Hydrol. 114: 413-424.
Bragan RJ, Starr JL, & Parkin TB (1997) Shallow groundwater denitrification ratesmeasured by acetylene block. J. Environ. Qual. 26: 1531-1538.
Bragan RJ, Starr JL & Parkin TB (1 997a) Acetylene transport in shallow groundwater fordenitrification rate measurement. J. Environ. Qual. 26: 1524-1530.
Brenner A & Araman Y (1990) Effect of feed composition, aerobic volume fractionand recycle rate on nitrogen in the single-sludge system. Wat. Res. 24: 1041-1049.
Cambareri TC & Eichner EM (1998) Watershed delineation and ground water dischargeto a coastal embayment. Ground Water 36: 626-634.
Chapelle FH (1992) Ground-Water Microbiology & Geochemistry. John Wiley & Sons,Inc. New York.
Clay DE, Clay SA, Moorman TB, Brix-Davis K, Scholes KA & Bender AR (1996)Temporal variability of organic C and nitrate in a shallow aquifer. Water Res. 30: 559-568.
Cline JD and Kaplan IR (1975) Isotopic fractionation of dissolved nitrate duringdenitrification in the eastern tropical North Pacific Ocean. Mar. Chem. 3:271-299.
Cohen S, Nickerson S, Maxey R, Dupuy A Jr. & Senita JA (1990) A ground watermonitoring- study for pesticides and nitrates associated with golf courses on Cape Cod.Ground Wat. Monit. Rev. Winter 1990: 160-173.
Costa JE (1988) Distribution, production, and historical changes in abundance of eelgrass(Zostera marina) in southeastern Massachusetts. Ph.D. Thesis. Boston University, 352p.
128
D'Angelo EM & Reddy KR (1993) Ammonium oxidation and nitrate reduction insediments of a hypereutrophic lake. Soil Sci. Soc. Amer. J. 57: 1156-1163.
D'Elia CF, Steudler PA and Corwin N (1977) Determination of total nitrogen in aqueoussamples using persulfate digestion. Limnol. Oceanogr. 22:760-764.
Engberg DJ & Schroeder ED (1975) Kinetics and stoichiometry of bacterialdenitrification as a function of cell residence time. Wat. Res. 9: 1051-1054.
Fiebig D, Lock MA & Neal C (1990) Soil water in the riparian zone as a source of carbonfor a headwater stream. J. Hydrol. 116: 217-237.
Fiebig D (1995) Groundwater discharge and its contribution of dissolved organic carbonto an upland stream. Arch. Hydrobiol. 134: 129-155.
Fogg GE, Rolston DE, Decker DL, Louie DT, & Grismer ME (1998) Spatial variation innitrogen isotope values beneath nitrate contamination sources. Ground Water 36:418-426.
Ford T & Naiman RJ (1989) Groundwater-surface water relationships in boreal forestwatersheds: dissolved organic carbon and inorganic nutrient dynamics. Can. J. Fish.Aquat. Sci. 46: 41-49.
Freyer HD & Aly AIM (1974) Nitrogen-15 variations in fertilizer nitrogen. J. of Env.Qual. 3: 405-406.
Fustec E, Mariotti A, Grillo X, & Sajus J (1991) Nitrate rempval by denitrification inalluvial groundwater: Role of a former channel. J. of Hydrol. 123: 337-354.
Garten CT, Jr. (1993) Variability in foliar 1 N abundance and the availability of soilnitrogen on the Walker Branch Watershed. Ecology 74:2098-2113.
Gelda, R., Brooks, CM, Effler SW, & Auer MT (2000). Interannual variations innitrification in a hypereutrophic urban lake: occurrences and implications. Wat. Res. 34:1107-1118.
GESAMP (1990) State of the Marine Environment: Rep. Stud. No. 39, Joint Group ofExperts on the Scientific Aspects of Marine Pollution. United Nations EnvironmentProgramme. I Ip.
Gillham RW (1991) Nitrate contamination of groundwater in Southern Ontario and theevidence for denitrification. NATO ASI SERIES, V G 30 Nitrate Contamination, (editedby Bogardi I and Kuzelka RD) p. 182-198.
Gold AJ, Jacinthe PA, Groffinan PM, Wright WR, & Puffer PH (1998) Patchiness ingroundwater nitrate removal in a riparian forest. J. of Env. Qual. 27: 146-155.
129
Groffinan PM, Howard G, Gold AJ & Nelson WM (1996) Microbial nitrate processing inshallow groundwater in a riparian forest. J. of Env. Qual. 25: 1309-1316.
Heaton THE (1986) Isotopic studies of nitrogen pollution in the hydrosphere andatmosphere: A review. Chem. Geol. (Isot. Geosci. Sect.) 59: 87-102.
Hedin LO, von Fischer JC, Ostrom NE, Kennedy BP, Brown MG, and Robertson GP(1998) Thermodynamic constraints on nitrogen transformations and otherbiogeochemical processes at soil-stream interfaces. Ecology 79: 684-703.
Herbel MJ, & Spalding RF (1993) Vadose zone fertilizer-derived nitrate and 6' 5Nextracts. Groundwater. 31:376-382.
Hojberg 0, Revsbech NP and Tiedje JM (1994) Denitrification in soil aggregate analyzedwith microsensors for nitrous oxide and oxygen. Soil Sci. Soc. Amer. J. 58: 1691-1698.
Holmes RM, Aminot A, Kerouel R, Hooker BA and Peterson BJ (1999) A simple andprecise method for measuring ammonium in marine and fresh water. Can. J. Fish.Aquat. Sci. 56: 1801-1808.
Howarth RW, Billen G, Swaney D, Townsend A, Jaworski N, Lajtha K, Downing JA,Elmgren R, Caraco N, Jordan T, Berendse F, Freney J, Kudeyarov V, Murdoch P, &Zhao-Liang Z (1996) Regional nitrogen budgets and riverine pitrogen and phosphorusfluxes for the drainages to the North Atlantic Ocean: natural and human influences.Biogeochemistry 35:75-79.
Hubner H (1986) Isotope effects of nitrogen in the soil and biosphere. In: Fritz P &Fontes JC (Eds.). Handbook of Environmental Isotope Geochemistry, vol. 2b, TheTerrestrial Environment, Elsevier, pp. 361-425.
Iqbal MZ, Krothe NC, & Spalding, RF (1997) Nitrogen isotope indicators of seasonalsource variability in groundwater. Environmental Geology. 32:210-218.
Jacinthe PA, Groffman PM, Gold AJ, & Mosier A (1998) Patchiness in microbialnitrogen transformations in groundwater in a riparian forest. J. of Env. Qual. 27: 156-164.
Kendell C & McDonnell JJ (eds) (1998) Isotope Tracers in Catchment Hydrology.Elsevier Science B.V., Amsterdam, 839 pp.
Koba K, Tokuchi N, Yoshioka T, Hobbie EA, & Iwatsubo G (1998). Natural abundanceof nitrogen-15 in a forest soil. Soil Sci: Soc. Am. J. 62: 778-781.
Koba K, Tokuchi N, Wada E, Nakajima T, & Iwatsubo G (1997) Intermittentdenitrification: The application of a 'N natural abundance method to a forestedecosystem. Geochim. Cosmochim. Acta 61: 5043-5050.
130
Kohl D, Shearer GB & Commoner B (1971) Fertilizer nitrogen: Contribution to nitrate insurface water in a corn belt watershed. Science 174: 1331-1334.
Kookana RS, & Naidu R (1998) Hydrologic control of aluminum chemistry in an acidicheadwater stream. Water Resources Res. 24: 659-669.
Korom SF (1991) Denitrification in the unconsolidated deposits of the Heber Valleyaquifer, PhD thesis, Utah State University, Logan, Utah. 176 pp.
Korom SF (1992) Natural denitrification in the saturated zone: A review. WaterResources Res. 28: 1657-1668.
Kreitler CW (1977) Nitrogen isotopes of soil and groundwater nitrate, Lockhart andTaylor alluvial fans, central Texas. (Abs.). Geol. Soc. Amer. 97: 1058-1059.
Kroeger KD, Bowen JD, Corcoran D, Moorman J, Michalowski J, Rose C, & Valiela I(1999) Nitrogen loading to Green Pond, Falmouth, MA: Sources and evaluation ofmanagement options. Environ. Cape Cod 2: 15-26.
LeBlanc DR, Garabedian SP, Hess KM, Gelhar LW, Quadri RD, Stollenwerk KG, &Wood WW (1991) Large-scale natural gradient tracer test in sand and gravel, Cape Cod,Massachusetts 1. Experimental design and observed tracer. Water Resources Res.27:895-910.
LeBlanc DR (1984) Sewage plume in a sand and gravel aquifer, Cape Cod,Massachusetts. U.S. Geological Survey, Water-Supply paper 2218, Washington.
LeBlanc DR, Guswa JH, Frimpter MH & Londquist CJ (1986) Ground-water resourcesof Cape Cod, Massachusetts: U.S. Geological Survey Hydrologic Atlas 692.
Ledgard SF, Treney JR & Simpson JR (1984) Variations in natural enrichment of 15N inthe profiles of some Australian pasture soils. Aust. J. Soil Res. 22:155-164.
Lee V & Olson S (1985) Eutrophication and management initiatives for the control ofnutrient inputs to Rhode Island coastal lagoons. Estuaries 8: 191-202.
Leenheer J, Malcolm RL, McKinley PW, & Eccles LA (.1974) 'Occurrence of dissolvedorganic carbon in selected ground-water samples in the United States. J. Res. U.S. Geol.Survey 2: 361-369.
Mariotti A, Pierre D, Vedy JC, & Bruckert S (1980) The abunoance of natural N-15 inthe organic matter of soils along an altitudinal gradient (Chablais, Haute-Savoie). Catena7:293-300.
131
Mariotti A, Germon JC, Hubert P, Kaiser P, Letolle R, Tardieux A, & Tardieux P (1981)Experimental determination of nitrogen kinetic isotope fractionation: some principles;illustration for the denitrification and nitrification processes. Plant and Soil 62: 413-430.
Mariotti A, Landreau A,-& Simon B (1988) 15N isotope biogeochemistry and naturaldenitrification process in groundwater: Application to the chalk aquifer of northernFrance. Geochim. Cosmochim. Acta 52: 1869-1878.
Mariotti A, & Letolle R (1977) Application de l'etude isotopique de l'azote en hydrologieet en hydrogeologie - Analyse des resultants obtenus sur un example precis: Le Bassin deMelarchez (Seine-et-Marne, France). J. Hydrol. 33: 157-172.
Masterson JP, Walter, DA, Savoie, J. (1997) Use of particle tracking to improvenumerical model calibration and to analyze ground-water flow and contaminantmigration, Massachusetts Military Reservation, western Cape Cod, Massachusetts, USGSW 2482, 50 pp.
McClelland JW, & Valiela I (1998) Linking nitrogen in esttwarine producers to land-derived sources. Limnol. Oceanogr. 43: 577-585.
McDonnell K, Rudy M, Valiela I, & Foreman K (1994) The effects of coastal land use oninorganic nutrient concentrations in groundwater entering estuaries of Waquoit Bay,Massachusetts. Biol. Bull. 187:276-277.
Nadelhoffer KJ, & Fry B (1988) Controls on natural nitrogen-15 and carbon-13abundances in forest soil organic matter. Soil Sci. Soc.. Am J. 52:1633-1640.
National Research Council (NRC) (2000) Clean Coastal Waters: Understanding andReducing the Effects of Nutrient Pollution. National Academy Press, Washington D.C.405 p.
National Research Council (NRC) (1994) Priorities for Coastal Science, NationalAcademy Press, Washington D.C. 88 p.
Nixon S, Oviatt CA, Frithsen J, & Sullivan B (1986) Nutrientq and the productivity ofestuarine and coastal marine ecosystems. J. Limnol. Soc. S. Africa 12: 43-71.
Pabich WJ, Valiela I, & Hemond HF (submitted) The effect of vadose thickness anddepth below the water table on DOC concentration in groundwater on Cape Cod, U.S.A.Biogeochemistry.
Parkin TB (1987) Soil microsite as a source of denitrification variability. Soil Sci. Soc.Amer. J. 51: 1194-1199.
132
Peterjohn WT, & DL Correll (1984) Nutrient dynamics in an agricultural watershed:Observations on the role of riparian forest. Ecology 65: 256-268.
Robertson WD, Schiff SL, & Ptacek CJ (1998) Review of phosphate mobility andpersistence in 10 septic system plumes. Ground Water 36:1000-1010.
Savoie J & LeBlanc DR (1998) Water-Quality Data and Methods of Analysis forSamples Collected Near a Plume of Sewage-Contaminated Ground Water, AshumetValley, Cape Cod, Massachusetts, 1993-94. U.S. Geological Survey, Marlborough, MA.
Schulze E -D, Chapin FS, III & Gebauer G (1994) Nitrogen nutrition and isotopedifferences among life forms in the northern treeline of Alaska. Oecologia 100:406-412.
Seely BA (1997) Atmospheric Deposition and Flux Dynamics of Nitrogen in the CoastalForests of the Waquoit Bay Watershed, Cape Cod, MA. PhD dissertation, BostonUniversity.
Short FT, & Burdick DM (1996) Quantifying eelgrass habitat loss in relation to housingdevelopment and nitrogen loading in Waquoit Bay, Massachusetts. Estuaries 19:730-739.
Sigman DM, Altabet MA, Michener RH, McCorkle D, Fry B. & Holmes RM (1997)Natural abundance-level measurement of the nitrogen isotopic composition of oceanicnitrate: An adaptation of the ammonium diffusion method.. Mar. Chem. 57: 227-242.
Smith RL, Howes BL, & Duff JH (1991) Denitrification in nitrate-contaminatedgroundwater: Occurrence in steep vertical geochemical gradients. Geochim. Cosmochim.Acta 55: 1815-1825.
Solomon DK, P.R., Cook PGA Hunt A (1995) Site characterization using 3H/3Heground-water ages, Cape-Cod, MA. Ground Water 33: 988-996.
Spalding RF, Exner ME, Lindau CW, & Eaton DW (1982) Investigation of sources ofgroundwater nitrate contamination in the Burbank-Wallula -are& Qf Washington, U.S.A. J.Hydrol. 58:307-324.
Stollenwerk KG (1996) Simulation of phosphate transport in sewage-contaminatedgroundwater, Cape Cod, Massachusetts. Appl. Geochem. 11: 317-324.
Thurman EM (1985) Organic Geochemistry of Natural Waters Martinus Nijhoff/DR W.Junk Publishers, Dordrecht.
Trudell MR, Gillham RW, & Cherry JA (1986) An in-situ study of the occurence and rateof denitrification in a shallow unconfined sand aquifer. J. Hydrol. 83: 251-268.
133
Valiela I, Geist M, McClelland J, & Tomasky G (2000) Nitrogen loading fromwatersheds to estuaries: Verification of the Waquoit Bay Nitrogen Loading Model.Biogeochemistry 49:277-293.
Valiela I, Collins G, Kremer J, Lajtha K, Geist M, Seely B, Brawley J, & Sham CH(1997) Nitrogen loading from coastal watersheds to receiving estuaries: New method andapplication. Ecol. Appl. 7: 358-380.
Valiela I, & Costa J (1988) Eutrophication of Buttermilk Bay, a Cape Cod coastalembayment: Concentrations of nutrients and watershed nutrient budgets. Environ,Management 12: 539-553.
Valiela I, Foreman K, LaMontagne M, Hersh D, Costa J, Peckol P, DeMeo-Anderson B,D'Avanzo C, Babione M, Sham CH, Brawley J, & Lajtha K (1992) Couplings ofwatersheds and coastal waters: Sources and consequences of nutrient enrichment inWaquoit Bay, Massachusetts. Estuaries 15: 443-457.
Verchot LV, Franklin EC, & Gilliam JW (1997) Nitrogen cycling in Piedmont vegetatedfilter zones: II. Subsurface nitrogen removal. J. Environ. Qual. 26: 337-347.
Vitousek P, Shearer G, & Kohl DH (1989) Foliar 15N natural abundance in Hawaiianrainforest: Patterns and possible mechanisms.- Oecologia 78:383-388.
Vogel JC (1967) Investigation of groundwater flow with radiocarbon. In: Isotopes inHydrology (pp. 355-369). IAEA-SM-83/24, Vienna.
Vogel JC, Talma AS, & Heaton THE (1981) Gaseous nitrogen as evidence fordenitrification in groundwater.. J. Hydrol. 50: 191-200.
Wada E, Imaizumi R, & Takai Y (1984) Natural abundance of 15N in soil organic matterwith special reference to paddy soils in Japan; biogeochemical implications on the Ncycle. Geochem. J. 18:109-123.
Wan J, & Tokunaga TK (1997) Film straining of colloids in urnsaturated porous media:conceptual model and experimental testing. Environ. Sci. Technol. 31: 2413-2420.
Wells ER, & Krother NC (1989) Seasonal fluctuation in 65JSN of groundwater nitrate in amantled karst aquifer due to macropore transport of fertilizer-4rived nitrate. J. Hydrol.112:191-201.
134
CHAPTER 4.
FATE OF NITROGEN FROM A SEPTIC SYSTEM IN ANEARSHORE CAPE COD AQUIFER
135
1. Introduction
The largest source of anthropogenic nitrogen to Cape Cod groundwater is
wastewater (1,2,3). The following paper examines mass balance losses of nitrogen from
a single private septic system, located near the banks of the Moonakis River in Falmouth,
near the head of Waquoit Bay. The septic system had been in operation approximately
twenty years for two household occupants at the time of sampling, and the associated
flows and nutrient concentrations were presumed to be at steady state. The septic tank
and leach field were located approximately 60 m from the bank pf the river. The site was
outfitted with 11 multi-level sampling wells, 9 in the plume downgradient from the septic
tank and leach field, and 2 outside the plume, spanning a 50 m transect.
The high concentration of ions in wastewater make it more conductive than
ambient groundwater. This property of wastewater alloweI us to conduct a ground
conductivity survey using a Geonics EM31 ground conductivity meter to roughly
delineate the contours of the septic plume prior to well installation. We augmented this
data with nitrate and ammonium measurements on groundwater samples obtained at the
seepage face of the site using a piezometer; these measurements showed the location of
the plume as it passed through the seepage face into the Moonakis River, and guided our
placement of multi-level sampling wells upgradient.
In the following paper, we present data on nitrate loss as a function of
groundwater age, and show that 50% of the nitrogen attenuation in the septic plume
occurs within the first 0.2 yrs of travel time, and that reduction rates decline with time. I
136
augment this paper with a presentation of denitrification rates, which range from 0.01 to
2.23 JAM N0 3~ h~'; these reduction rates are 4 to 7 orders of magnitude ligher than those
measured in ambient groundwater using N stable isotopes at lwo forested sites, Crane
Wildlife Management Area and South Cape Beach (Ch. 3). Denitrification rates in the
plume increased with increasing initial nitrate concentration (R2= 0.86, Fig. 4.3) in a
manner similar to what we found at South Cape Beach, suggesting that the higher DOC
concentrations typically found in septic plumes (Robertson et al. 1988) and those found at
South Cape Beach (relative to Crane Wildlife) allow for faster rates of denitrification for
a given nitrate concentration. In Chapter 5, we model these rates using a Monod kinetic
expression, where denitrification rates are both -itrate- and DOC-limited.
137
Accepted by Biological Bulletin
2. Fate of Anthropogenic Nitrogen in a Nearshore Cape Cod Aquifer
Elizabeth J. Westgate", Kevin D. Kroeger, Wendy J. Pabich, and Ivan Valiela (Boston
University Marine Program, Marine Biological Laboratory, Woods Hole, Massachusetts
02543)
Nitrogen loading from land is a principal cause of eutrophication of shallow
estuaries (1,2,3). In regions such as Cape Cod, Massachusetts, which are underlain by
unconsolidated sands, the major mechanism that transports nitrogen to estuaries is
groundwater flow, and the major nitrogen source (primarily in the form of nitrate, N0 3 ~)
is often wastewater from septic systems (1,2,3). Wastewater nitrate concentrations
decrease during travel in groundwater due to dilution with clean groundwater and to loss
by denitrification (4). The loss of nitrogen during flow betyveen a septic tank and
receiving estuary can be calculated by determining the reduction in concentration of
dissolved inorganic nitrogen relative to the change in concentration of a passive tracer
that accounts for dilution.
We investigated losses of nitrate for a domestic septic system in the watershed of
Quashnet River, Cape Cod. Effluent from septic systems moves downgradient, forming
plumes containing high concentrations of nitrate: In addition, the study area has plumes
derived from fertilized turf or fields. To sort out the different plumes, we measured
138' Lafayette College, Easton, PA 18042
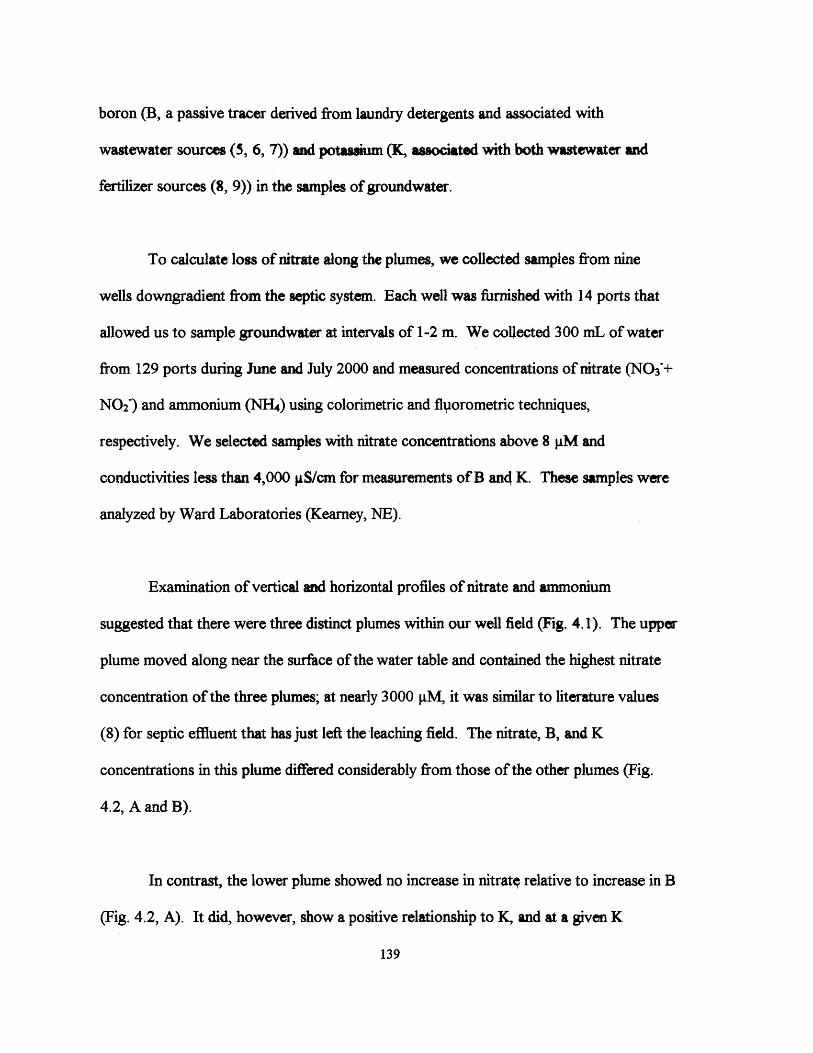
boron (B, a passive tracer derived from laundry detergents and associated with
wastewater sources (5, 6, 7)) and potassium (K, associated with both wastewater and
fertilizer sources (8, 9)) in the samples of groundwater.
To calculate loss of nitrate along the plumes, we collected samples from nine
wells downgradient from the septic system. Each well was furnished with 14 ports that
allowed us to sample groundwater at intervals of 1-2 m. We collected 300 mL of water
from 129 ports during June and July 2000 and measured concentrations of nitrate (N0 3 +
N0 2 ) and ammonium (NH4) using colorimetric and fliorometric techniques,
respectively. We selected samples with nitrate concentrations above 8 sM and
conductivities less than 4,000 pS/cm for measurements of B an4 K. These samples were
analyzed by Ward Laboratories (Kearney, NE).
Examination of vertical and horizontal profiles of nitrate and ammonium
suggested that there were three distinct plumes within our well field (Fig. 4.1). The upper
plume moved along near the surface of the water table and contained the highest nitrate
concentration of the three plumes; at nearly 3000 M, it was similar to literature values
(8) for septic effluent that has just left the leaching field. The nitrate, B, and K
concentrations in this plume differed considerably from those of the other plumes (Fig.
4.2, A and B).
In contrast, the lower plume showed no increase in nitrati relative to increase in B
(Fig. 4.2, A). It did, however, show a positive relationship to K, and at a given K
139
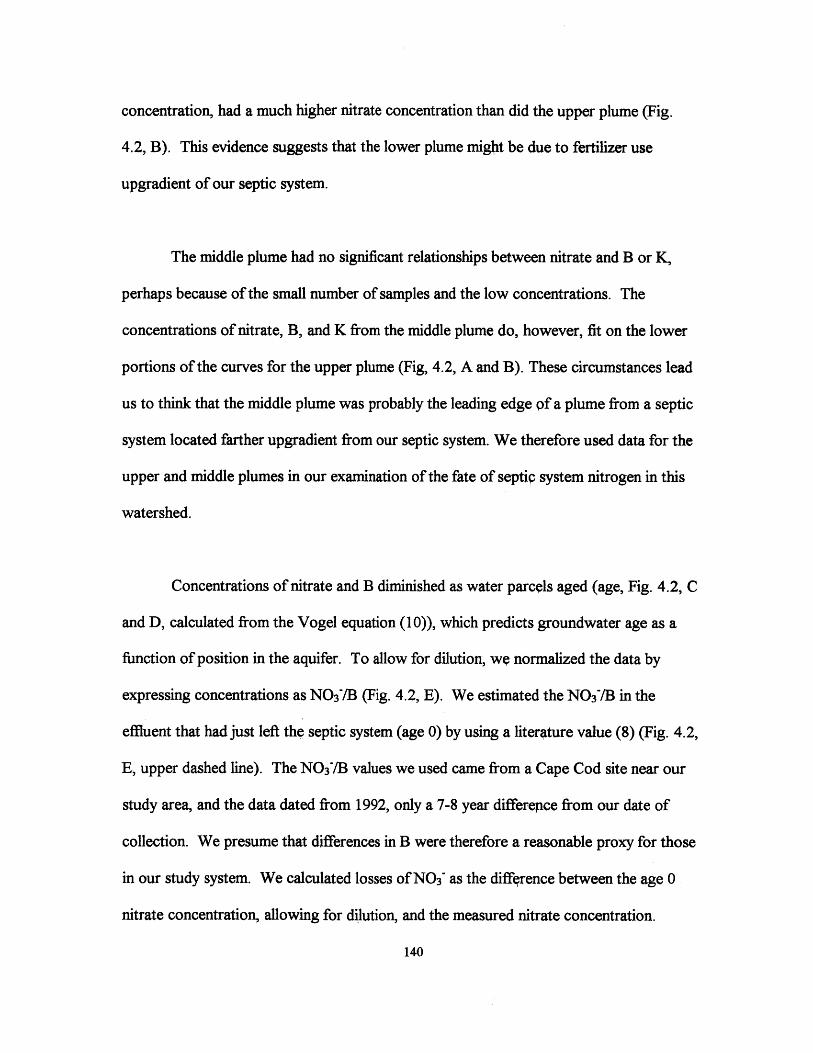
concentration, had a much higher nitrate concentration than did the upper plume (Fig.
4.2, B). This evidence suggests that the lower plume might be due to fertilizer use
upgradient of our septic system.
The middle plume had no significant relationships between nitrate and B or K,
perhaps because of the small number of samples and the low concentrations. The
concentrations of nitrate, B, and K from the middle plume do, however, fit on the lower
portions of the curves for the upper plume (Fig, 4.2, A and B). These circumstances lead
us to think that the middle plume was probably the leading edge of a plume from a septic
system located farther upgradient from our septic system. We therefore used data for the
upper and middle plumes in our examination of the fate of septic system nitrogen in this
watershed.
Concentrations of nitrate and B diminished as water parcels aged (age, Fig. 4.2, C
and D, calculated from the Vogel equation (10)), which predicts groundwater age as a
function of position in the aquifer. To allow for dilution, we normalized the data by
expressing concentrations as NO37B (Fig. 4.2, E). We estimated the NO37B in the
effluent that had just left the septic system (age 0) by using a literature value (8) (Fig. 4.2,
E, upper dashed line). The N0 37B values we used came from a Cape Cod site near our
study area, and the data dated from 1992, only a 7-8 year differepce from our date of
collection. We presume that differences in B were therefore a reasonable proxy for those
in our study system. We calculated losses of N0 3' as the difference between the age 0
nitrate concentration, allowing for dilution, and the measured nitrate concentration.
140
Losses of nitrate in excess of dilution were quite rapid, with rates reaching 50%
loss at 0.2 years (Fig. 4.2, F). The loss rates diminished with time, which suggests that, if
these data are representative of losses elsewhere, N losses by denitrification and retention
take place primarily near the septic system source. Extrapolating the curve of Figure 4.2
(F), we find that near-complete losses may be reached at 4.8 years, which is equivalent to
480-730 m from the septic system, assuming a travel rate of 100-150 m per year (11).
As a minimum estimate of loss, we also calculated loss relative to our highest
measured NO3~/B ratio (Fig. 4.2, E, lower dashed line). If our initial NO3~/B ratio were
closer to this measured value, our estimate of time to 50% N0 3 loss would increase to
0.6 years, but the estimate of time to 100% loss would not be affpcted. The extrapolation
to 100% loss assumes that the relationship between % loss N0 3~ and age continues to
hold beyond our oldest sample. This would not be the case if the availability of labile
organic carbon were to limit N0 3 ~ loss before 100% loss is achieved.
If coastal zone managers wish to regulate septic nitrogen loads, they could
concentrate on management of septic systems that lie within 480-730 m of the shore,
since these appeared to be the major contributors of nitrate to repeiving estuaries. Septic
sources farther upgradient probably contribute less significantly.
This research was supported by an internship from the Woods Hole Marine
Science Consortium to Elizabeth Westgate, an MIT Sea Grant (#65591) awarded to Ivan
141

Valiela and Harold Hemond, and National Estuarine Research Reserve Fellowships to
Wendy Pabich and Kevin Kroeger.
142
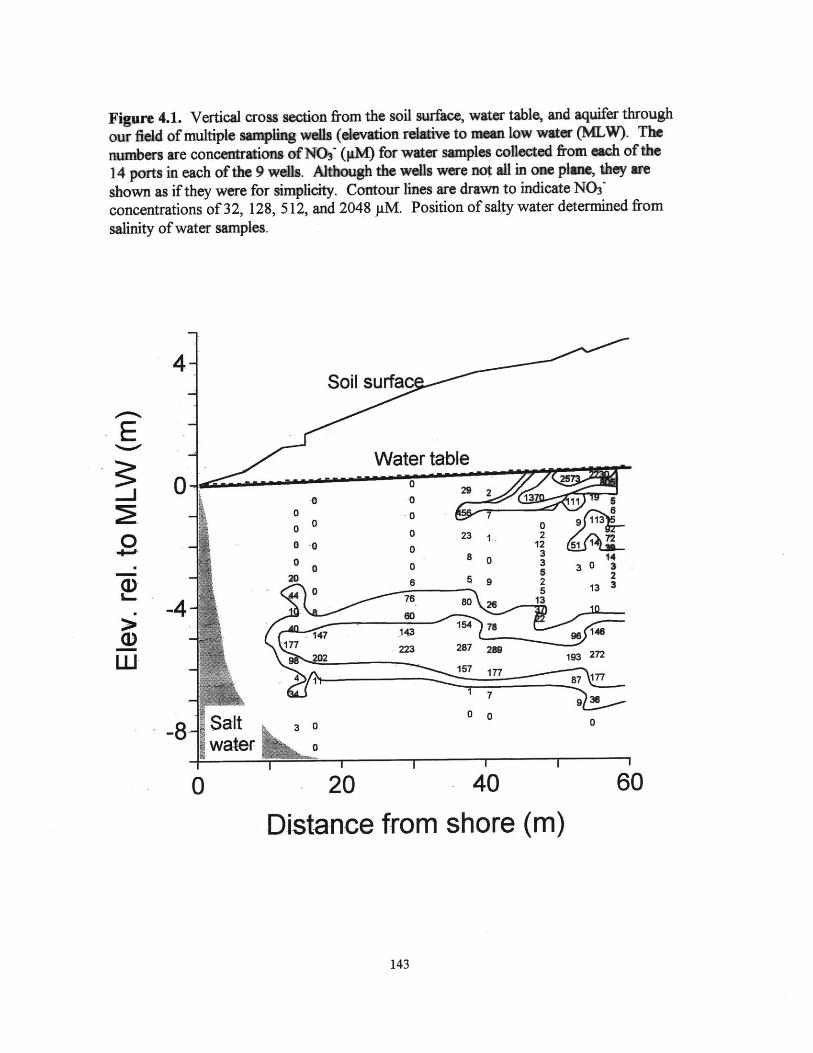
Figure 4.1. Vertical cross section from the soil swface, water table, and aquifer throughour field of multiple sampling weds (devation relative to mean low water (MLW). Thenumbers are concentrations of NO (M) for water samples collected from each of the14 ports in each of the 9 wes. Although the wells were not all in one plane, they are
shown as if they were for simplicity. Contour lines are drawn to indicate NO0concentrations of 32, 128, 512, and 2048 yM. Position of salty water determined fromsalinity of water samples.
4Soil surfa
E~ Water table
G 23
--0 00 076 80139
023 237 2 2
02 1 1 272:
0 20 40 60
Distance from shore (in)
143
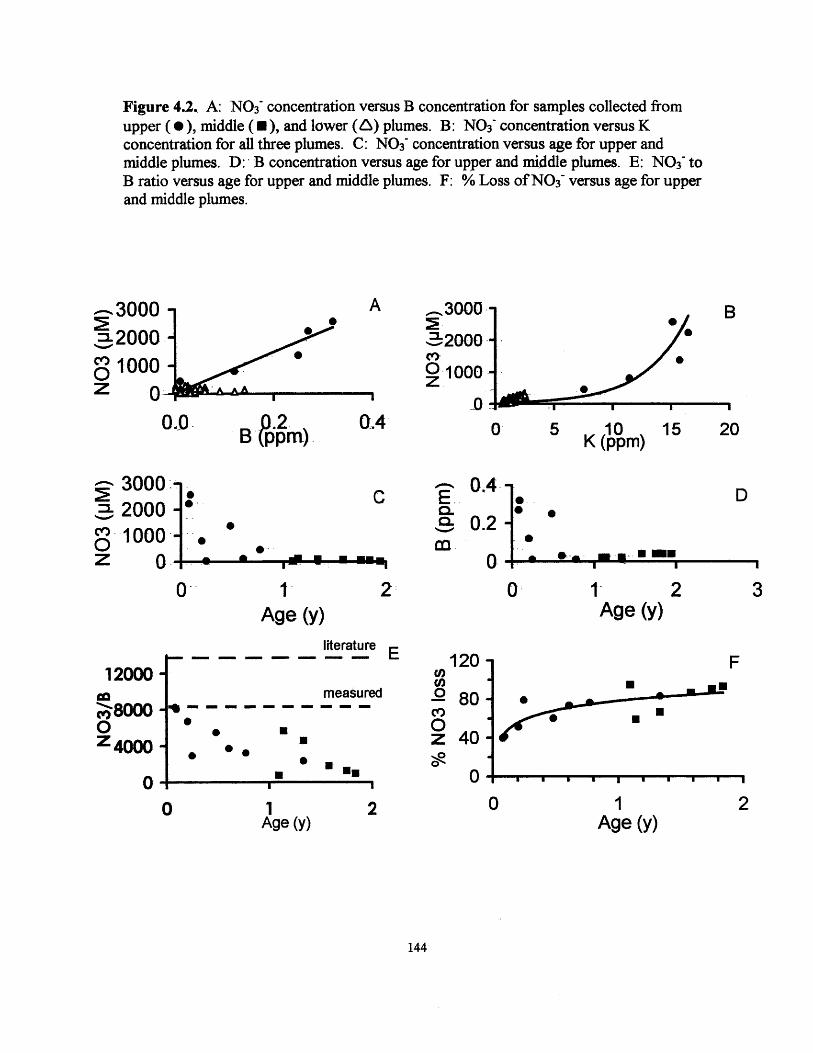
Figure 4.2., A: N0 3 concentration versus B concentration for samples collected fromupper (0 ), middle (U), and lower (8) plumes. B: N0 3~ concentration versus Kconcentration for all three plumes. C: N0 3 concentration versus age for upper andmiddle plumes. D: B concentration versus age for upper and middle plumes. E: N0 3 toB ratio versus age for upper and middle plumes. F: % Loss of N0 3 versus age for upperand middle plumes.
-,3000,
%02000C 1000z
S0O
=L
C')0z
3000 -
2000 -
1000 -
0-0
A0
B ppm)
*0*
0
0Ag
Age (y)
,3000 -
2000 -
z
0,4
C E.0-
2
-0
0
0.
1
00
0
B
0 5 10 15 20K (ppm)
.: D
.2
D *
0 IAge (y)
2
literature E
measured
CDCa)0
CO)0z0-
N M
2
120-
80-
40-
0~0
F
. . .
21Age (y)
144
12000 -
8000 -0z 4000 -
0'
3
00
*
E
*1
U
S
0
"
1Age (y)
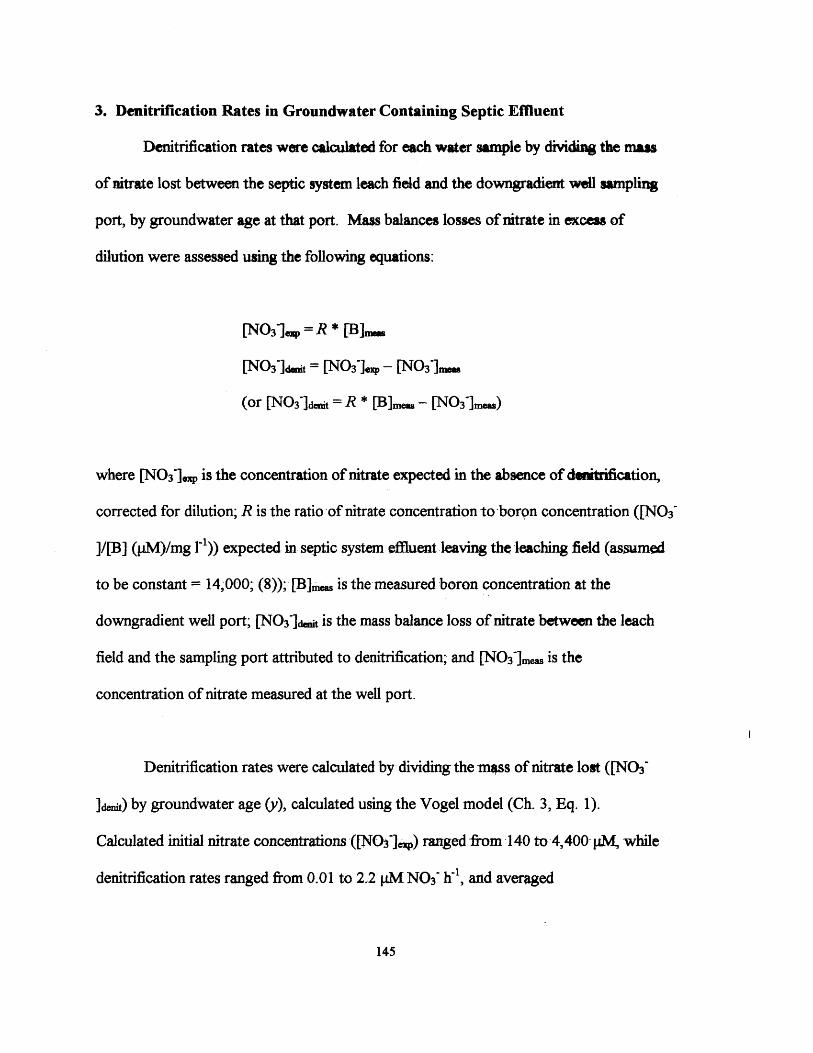
3. Denitrification Rates in Groundwater Containing Septic Effluent
Denitrification rates were calculated for each water sample by dividing the mass
of nitrate lost between the septic system leach field and the downgradient well sampling
port, by groundwater age at that port. Mass balances losses of nitrate in excess of
dilution were assessed using the following equations:
[N03].w= R * [B]n..
[NO3 ]a..it = [NO3 IV - [NO3~]m.
(or [NO3~]enit = R * [B]ma. - [NO3~Ime.)
where [NO3~].xp is the concentration of nitrate expected in the absence of denitrification,
corrected for dilution; R is the ratio of nitrate concentration to borpn concentration ([N0 3~
]/[B] (pM)/mg I')) expected in septic system effluent leaving the leaching field (assumed
to be constant = 14,000; (8)); [B]meas is the measured boron concentration at the
downgradient well port; [NO 3f]dit is the mass balance loss of nitrate between the leach
field and the sampling port attributed to denitrification; and [NO3~]me is the
concentration of nitrate measured at the well port.
Denitrification rates were calculated by dividing the mpss of nitrate lost ([N0 3~
],nit) by groundwater age (y), calculated using the Vogel model (Ch. 3, Eq. 1).
Calculated initial nitrate concentrations ([NOI],) ranged from 140 to 4,400- M, while
denitrification rates ranged from 0.01 to 2.2 M N0 3-h', and averaged
145
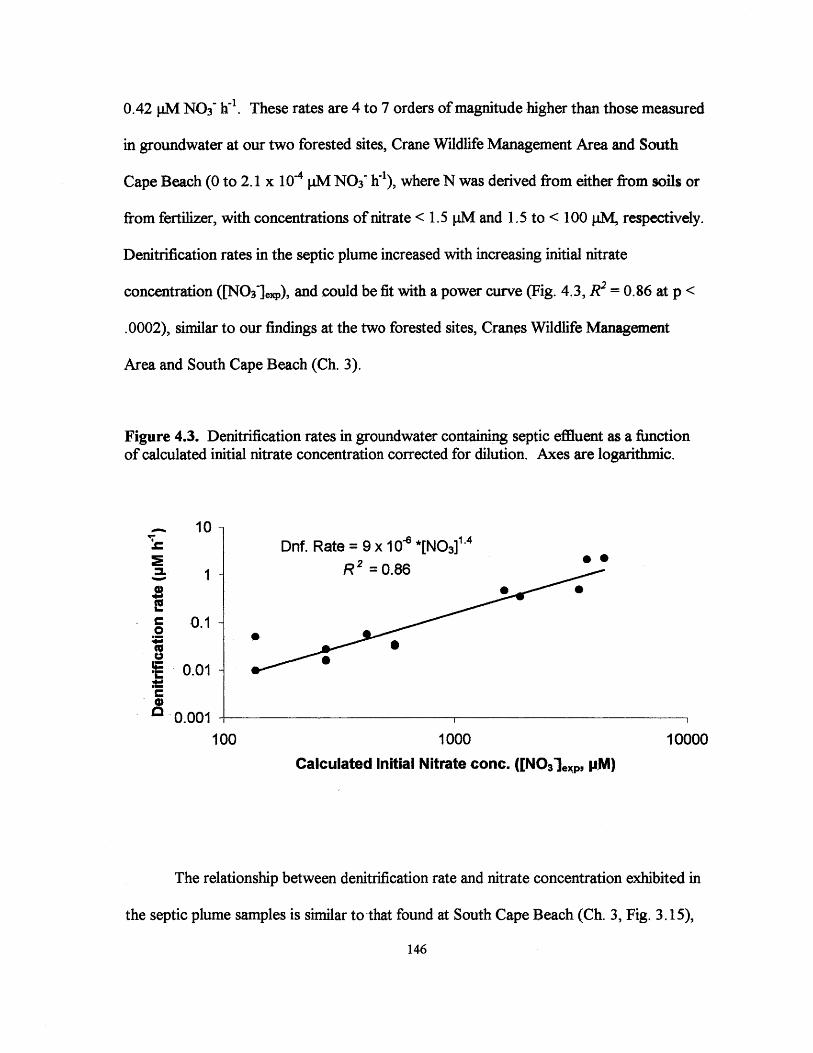
0.42 PM N0 3-h-. These rates are 4 to 7 orders of magnitude higher than those measured
in groundwater at our two forested sites, Crane Wildlife Management Area and South
Cape Beach (0 to 2.1 x 10 4 pM N0 3-h"l), where N was derived from either from soils or
from fertilizer, with concentrations of nitrate < 1.5 pM and 1.5 to < 100 M, respectively.
Denitrification rates in the septic plume increased with increasing initial nitrate
concentration ([NO3 ~]ep), and could be fit with a power curve (Fig. 4.3, R 2 = 0.86 at p <
.0002), similar to our findings at the two forested sites, Cranes Wildlife Management
Area and South Cape Beach (Ch. 3).
Figure 4.3. Denitrification rates in groundwater containing septic effluent as a functionof calculated initial nitrate concentration corrected for dilution. Axes are logarithmic.
..... 10 - 10.Dnf. Rate = 9 x 10~6 *[NO]'
1L R 2=0.86
.0.1-0
0.01
0.001100 1000 10000
Calculated Initial Nitrate conc. (!NO3]xp, IJM)
The relationship between denitrification rate and nitrate concentration exhibited in
the septic plume samples is similar to that found at South Cape Beach (Ch. 3, Fig. 3.15),
146
where DOC concentrations were higher (0.8 to 24 mg C 1 ; mean = 7.0 mg C 1t) than at
Crane Wildlife Management Area (0 to 1.9 mg C F'; mean = 0.4 mg C 1-). While we did
not measure DOC concentrations at the septic system site, thie similarity of the septic
system and South Cape Beach trends suggests that DOC concentrations at the septic
system are likely to be similar. Robertson et al. (12) measured DOC in 10 mature septic
system groundwater plumes in a sand aquifer in central Canada. We used their data to
plot DOC concentrations against plume age (Fig. 4.4; R-2'= 0.72).
Figure 4.4. Dissolved organic carbon concentrations (DOC) in groundwater as afunction of septic system plume age. Data from Robertson et al. (12).
90
80
70
6050 -[DOC] 27.7 * e ('0" *)
40 R2 =0.720a30
20
10 0
00 10 20 30 40 50
Plume Age (y)
Using this relationship, we estimated DOC concentrations for each of our septic
plume samples, based on calculated groundwater age (mean age = 0.90 yrs, mean DOC
26 mg 1). Estimated this way, DOC concentrations in the septic system samples fall just
147
outside the high end of the range measured at SCB (range = 0.8 to 23.4 mg C 11, mean =
7.0 mg C 1-1), clearly higher than DOC concentrations at Crane Wildlife (mean = 0.4 mg
C 1-1). Higher DOC concentrations in the septic plume and at South Cape Beach appear
to have allowed for faster rates of denitrification, relative to those in the low DOC
environment of Crane Wildlife for any given initial nitrate concentration.
The relationship between denitrification rate and DOC concentration is reflected
in a comparison the first order rate constants calculated for each site. We calculated a
first order rate constant (k = [ln([NO3~]aj/[NO3~]mm) / t ], or k = [ln (C/Co)]/t from
Rayleigh equation) for each individual groundwater sample frorp the septic plume, and
averaged the individual values to produce a first order rate constant for the data set as a
whole (k = 3.1 x 10⁻⁴hf or 2.7 y-). The half-life for nitrate (t112) in the plume, given this
first order rate constant, was calculated to be 0.25 years. This first order rate was 11
times higher than at Crane Wildlife (k =2.9 x -10- h or .26 y-; 112= 2.8 y), but only
twice as high as the first order rate for South Cape Beach (k = 1.8 x 10 -4 h' or 1.5 y1, t112
= 0.45 y), presumably because the-DOC concentrations- in the septic plume are similar to
the high end of the range of DOC concentrations measured at South Cape Beach (0.8 to
23.4 mg C F'), but are- significantly higher than those found at Crane Wildlife (0.1 to 1.9
mg C 1-). Higher rates in the septic plume and at South Cape Beach lead us to
hypothesize that denitrification in this groundwater system is cpntrolled by both nitrate
and DOC concentrations, and could be modeled using a saturating kinetics expression
with double substrate limitation by nitrate and DOC (Ch. 5).
148
4. Conclusions
Denitrification rates measured in groundwater at our septic systmn site ranged
from 0.01 to 2.23 pM N0 3 h-', and averaged 0.42 pM N0 3 h7'. Rates increased with
increasing initial nitrate concentration (137 to 4,396 pM), and cpuld be fit with a power
curve (R2 = 0.86 at p < .0002). The calculated septic system denitrification rates (k = 3.1
x 10 4hI) were several orders of magnitude higher than those measured in groundwater
at both the South Cape Beach (k = 1.8 x 10 4 h-1) and Crane Wildlife sites (k = 2.9 x 10 -5
hIf), where nitrate concentrations were significantly lower (0 to 91 pM). The relationship
between denitrification rate and nitrate concentration in the septic plume was similar to
that found at South Cape Beach, suggesting that higher DOC concentrations in these two
environments allowed for faster rates of denitrification for any given nitrate concentration
relative to the low DOC environment at Crane Wildlife.
149
5. References
1. Valielaetal. 1992. Estuaries 15: 443-457.
2. Valiela et al. 1997. Ecol. Appl. 7: 358-380.
3. Valiela et al. 2000. Biogeochernistry 49: 277-293.
4. Wilhelm, S.R., S.L. Schiff and J.A. Cherry. 1994. Ground Water 32: 905-
916.
5. Barth, S. 1998. Wat. Res. 32: 685-690.
6. LeBlanc, D.R. 1984. U.S. Geological Survey Water-Supply Paper 2218, 28
pp-
7. Barber, LB II, E.M. Thurman, M.P. Schroeder, apd D.R. LeBlanc. 1988.
Environ. Sci. Technol. 22: 205-211.
8. DeSimone, L.A., P.M. Barlow, B.L. Howes. Oppn-File Rep.- U.S. Geol.
Surv. 1995, No. 95-290.
9. Bjerg, P.L., T.H. Christensen. 1992. J. Hydrol. 131: 133-149.
10. Vogel, J.C. 1967. Pp. 3 55-369 in Isotopes in Hydrology, Proceedings of
IAEA-SM-83/24, Vienna.
11. LeBlanc, D.R., et al. 1991. Wat. Res. 27: 895-910.
12. Robertson WD, Schiff SL & Ptacek CJ. 1998. Groun4 Water. 36:1000-1010.
150
CHAPTER 5.
AN EMPIRICAL MODEL TO PREDICT GROUNDWATERDENITRIFICATION RATES, CAPE COD, USA: SUBSTRATE
LIMITATION BY DOC AND
151
Running head:
Article type:
Title:
Authors:
Affiliations:
Corresponding author:
Groundwater denitrification model
General research
An empirical model to predict groundwater denitrificationrates, Cape Cod, USA: Substrate limitation by DOC andNO
Wendy J. Pabichl*, Harold F. Hemond', and Ivan Valiela 2.
1) Massachusetts Institute of Technology, Department ofCivil and Environmental Engineering, Ralph M. ParsonsLaboratory, Cambridge, MA 02138, U.S.A.
2) Boston University Marine Program, Marine BiologicalLaboratory, Woods Hole, MA 02543, U.S.A.
Wendy J. Pabichc/o Boston University Marine ProgramMarine Biological LaboratoryWoods Hole, MA 02543USATelephone: (508) 289-7615Fax: (508) 289-7949Email: [email protected]
Key words: Cape Cod, denitrification, groundwater, kinetics, modeling
152
Abstract. An empirically-based saturating kinetics model describing groundwaterdenitrification under carbon and nitrate-limited conditions was developed.Denitrification rates were described using a kinetic expression with double substratelimitation (with nitrate as the terminal electron acceptor and dissolved organic carbon(DOC) as the electron donor). The kinetic parameters were estimated from our field data(half saturation constant for NO3 (KNO3)) and USGS field data (bacterial population [B]),and from data available in the literature (maximum bacterial growth rate (pmax), halfsaturation constant for DOC (KDOc), and bacterial yield constant (Y)). The proposedmodel is able to reasonably predict N losses along groundwater flow paths, measured attwo forested sites (Ch. 3), where DOC ranged. from 0 to 23 mg C 1- and nitrate rangedfrom <1 to 91 pM: Using higher values for the bacterial population ([Bj) and the half-saturation constant (KNO3), we were also able to predict N losses due to denitrificationwithin the very different biogeochemical conditions of a septic system plume ([NO3 ]ma- 4,400 pM, {DC ~ 26 mg C-1 and presumably a larger and more active bacterialpopulation). The model performs well over the wide range of geochemical conditionsfound at the three sites within this (R2= 0.96, m = 0.96 for measured vs. modeled).Eliminating the DOC term from the saturating kinetics expression, so that denitrificationis limited only by nitrate concentration, results in an overprediction of nitrate losses alonggroundwater flowpaths, particularly where DOC concentration are low. These resultsfurther confirm our previous conclusion (Ch. 3) that DOC concentrations exert asignificant control orn grotndwter denitrification rates.
153
1. Introduction
Eutrophication by land-derived anthropogenic nitrogen (N) is the major cause of
alterations to coastal ecosystems worldwide (GESAMP 1990, NRC 1994, Nixon 1986).
In coastal areas underlain by unconsolidated sands, such as Cape Cod, the majority of
land-derived N delivered to the coastal zone is transported by groundwater (Valiela et al.
1992). Many studies show that some portion of groundwater nitrogen is lost via
denitrification within aquifers (Bengtsson and Annadotter 1989, Bottcher et al. 1990,
Bragan et al. 1997a, Bragan et al. 1997b, Clay et al. 1996, Gillham 1991, Gold et al.
1998, Groffman et al. 1996, Jacinthe et al. 1998, Korom 1992, Peterjohn and Correll
1984, Valiela et al. 1992, Valiela et al. 2000, Verchot et al. 1997). Accurate estimation
of land-derived nitrogen loads delivered to estuaries requires that significant losses
occurring during transport, notably denitrification, be incorporated into models of
nitrogen loading.
Our measurements of denitrification rates in the Waquoit Bay aquifer on Cape
Cod, Massachusetts (Chs. 3 & 4), suggest that groundwater denitrification rates increased
with increasing nitrate and dissolved organic carbon (DOC) concentrations. N losses
along groundwater flowpaths at Crane Wildlife Management Area, where nitrate
concentrations ranged from 0.2 to 68 pM, but DOC was consistently low (< 2 mg C r-),
could be best predicted using a saturating kinetics expression with respect to nitrate (R2
0.96; Ch. 3, Fig. 3.20). Denitrification rates in the higher DOC environments of South
Cape Beach (up to 24 mg C 1-), and a septic plume (-26 mg C F1), were higher for any
154
given nitrate concentration than in the low DOC environment of Crane Wildlife. These
results are consistent with other studies that demonstrate the importance of carbon
substrate availability (Bradley et al. 1992b, Bremner and Argamann 1990, Christensen et
al. 1990, Groffman et al. 1996, Knowles 1982, Parkin 1987, Payne 1981, Smith and Duff
1988, Sprent 1987) and nitrate concentration (Bengtsson and Bergwall 1995, Bradley et
al. 1992a, Korom 1992, Morris et al. 1988, Slater and Capone 1987, Smith and Duff
1988) to denitrification rates.
Because concentrations of organic matter in groundwater are variable (0.1 to 27
mg C I', Pabich et al. 2000a, Ford and Naiman 1989, Fiebig et al. 1990, Fiebig 1995) and
concentrations of nitrate in Cape Cod groundwaters may vary over several orders of
magnitude (0 to 4,400 pM N0 3 , our data, Kroeger et al. 1999, Savoie and LeBlanc 1998,
Seely 1997, Valiela et al. 2000), our goal in this paper was to explore the use of a
saturating kinetics model, not only with respect to nitrate as in Chapter 3, but also with
respect to DOC, since higher concentration of DOC in groundwater appear to result in
higher rates of denitrification for any given nitrate concentration.
This approach is consistent with other previous studies. Numerous models of
varying complexity have been developed to predict denitrification rates, often for the
purposes of wastewater treatment system design (Almeida et al. 1995, Brenner and
Argamann 1990, Carucci et al. 1996, Engberg and Schroeder 1975, Glass and Silverstein
1998, Griffiths 1994, Kornaros et al. 1996, Kornaros and Lyberatos 1997, 1998, Wang et
155
al. 1995), or to predict co-metabolism of organic compounds under denitrifying
conditions (Jorgensen et al. 1995). This study draws from information on denitrification
kinetics in published laboratory experiments, and from our own field measurements, to
develop a field-scale model to assess denitrification in a groundwater setting.
2. Saturating Kinetics
Several lines of evidence suggest that denitrification in the Waquoit Bay aquifer is
controlled by saturating kinetics with respect to both DOC and nitrate concentrations.
We found that first order rate constants for denitrification with respect to nitrate (Ch. 3)
were highest where groundwater DOC concentrations were highest: k = 2.8 y~' in the
septic plume (- 26 mg C r'), k = 1.6 y -' at South Cape Beach (DOC = 0.8 to 23.4 mg C
I-), and k = .25 y-' at Crane Wildlife (0.1 to 1.9 mg C F-), suggesting that both DOC and
nitrate concentrations exert important controls on denitrification rate. In addition, Smith
and Duff (1988) found that denitrification, measured using an acetylene blockage assay
on slurried aquifer core material obtained near wastewater disposal beds, located
approximately 1 km to the east of the Crane Wildlife field site on the Massachusetts
Military Reservation, was carbon-limited ([DOC] was estimated to be - 12 mg C ri).
Groundwater nitrate concentrations in this aquifer (0 - 4,400 pM; Seely 1997, Valiela et
al. 2000, Kroeger et al. 1999, Savoie and LeBlanc 1998, Pabich, unpublished data) are of
similar magnitude to half-saturation constants (Km) measured for denitrification with
respect to nitrate (5-290 pM N0 3 , Knowles 1982; -1,300 pM Reddy et al. 1982),
suggesting that denitrification may become saturated with respect to nitrate.
156
Given this evidence, we modeled denitrification rates using a Michaelis-Menten-
type substrate-utilization expression with double substrate limitation (nitrate as the
terminal electron acceptor and organic carbon as the electron donor). In Chapter 3, we
derived values for maximum denitrification rate (V..) for both the forested sites and for
the septic plume from our field measurements of nitrate losses. One of the goals of this
paper was to determine whether the literature provided insight into the mechanistics of
bacterial metabolism that would allow us to predict maximum reaction rates based on
microbial theory. Toward that end, we modeled denitrification rates using the following
expression:
d[NO31/dt = [(Pmax *Bdenit)/Y] * [[N03/(KNO3 + [NO3 ])] * [[DOC]/(KDOC + [DOC])],
where is the maximum bacterial growth rate (hrf ), Bd, 1it is the population of
denitrifying bacteria (mg ri), Y is the bacterial yield constant (mg biomass mg C-1),
[NO3~] and [DOC] are the substrate concentrations (mg r'), KNo3 and KD0C (mg F') a
the half-saturation constants for nitrate and dissolved organic carbon, respectively.
Maximum reaction velocity (Vm=) determined from our field data is essentially a lumped
parameter equivalent to the first set of terms in the above model ( [(p * Bdenit)/Y]). The
advantage to utilizing this more explicit description of V.m. is thzt the population density
and activity of denitrifying bacteria have been shown to increase with increasing nitrate
concentration (Bengtsson and Bergwall 1995, King and Nedwell 1987), potentially
allowing us to develop a model for which only nitrate and DOC concentrations need be
157
measured in order to use the model to predict denitrification rates. We compare both
approaches to estimating Vm..
2.1 Assumption of steady state
We assumed that each of the sampling points in the Waquoit Bay aquifer
represented the output of a steady state reaction/flow system, with a population of
bacteria acclimated to the existing N0 3' and DOC concentrations within the aquifer. At
both the Crane Wildlife and South Cape Beach sites, temporal variability in groundwater
chemistry (dissolved 02, DOC, NH4+, and N0 3 concentrations) was minimal (Ch. 3, Fig.
3.4 and Table 3.6), and groundwater flow rates are believed to be relatively constant
(~0.4 m day-, Leblanc 1991), supporting this assumption.
We also assumed that at each location, there was a specific maximum denitrifier
population density, reflected in a constant growth rate (U) less than Fmax, which is often
the case when the substrate concentration is below the half-saturation constant (S <<K,
Alexander 1999). Given this conceptualization, we took each sampling location within
the aquifer to represent a specific position on a Michaelis-Menten-like substrate
utilization rate curve, that, taken together, would represent denitrification under
saturating conditions across the range of nitrate and DOC concentrations measured.
158
3. Model Parameterization
The literature suggests that the population density and activity of denitrifying
bacteria increase with increasing nitrate concentration. Bengtsson and Bergwall (1995)
showed that the population (B), growth rate (u..), and activity (higher Kn) of
denitrifying bacteria in groundwater of three Swedish aquifers increased with increasing
groundwater nitrate concentration. Similarly, King and Nedwell (1987) found that
denitrifying activity increased with increasing concentrations of nitrate in a nitrate
gradient in an estuarine sediment, and suggested that nitrate reducers were adapted to the
in situ concentrations of nitrate at each site. We estimated the effect of increasing nitrate
concentrations on the population and activity of denitrifying bacteria.
3.1 Half-saturation constants for nitrate (KNo3) and DOC (KDOC)
For the forested sites, we estimated KNo3 from groundwater profiles measured in
three multi-level sampling wells containing a range of nitrate concentrations (0 - 68 pM)
derived from soil and fertilizer (Ch. 4). DOC concentrations in the same samples
remained low and nearly constant (<2 mg C 'i), independent of the N0 3- concentration.
Using measured NO3" concentrations and denitrification rates for these samples, we
constructed a Lineweaver-Burk plot (I/dNOI3/dt vs. 1/[N03-]; Fig. 5.1) to estimate KNo3
(112 pM N0 3 ~). We estimated KNO3 from the septic plume samples in the same manner
(Fig. 5.2, 1760 pM N0 3 ~). Our estimates fall within the range of K. values for
denitrification reported in the literature (5-290 pM N0 3-, Knowles 1982; -1,300 PM
N0 3-, Reddy 1982).
159
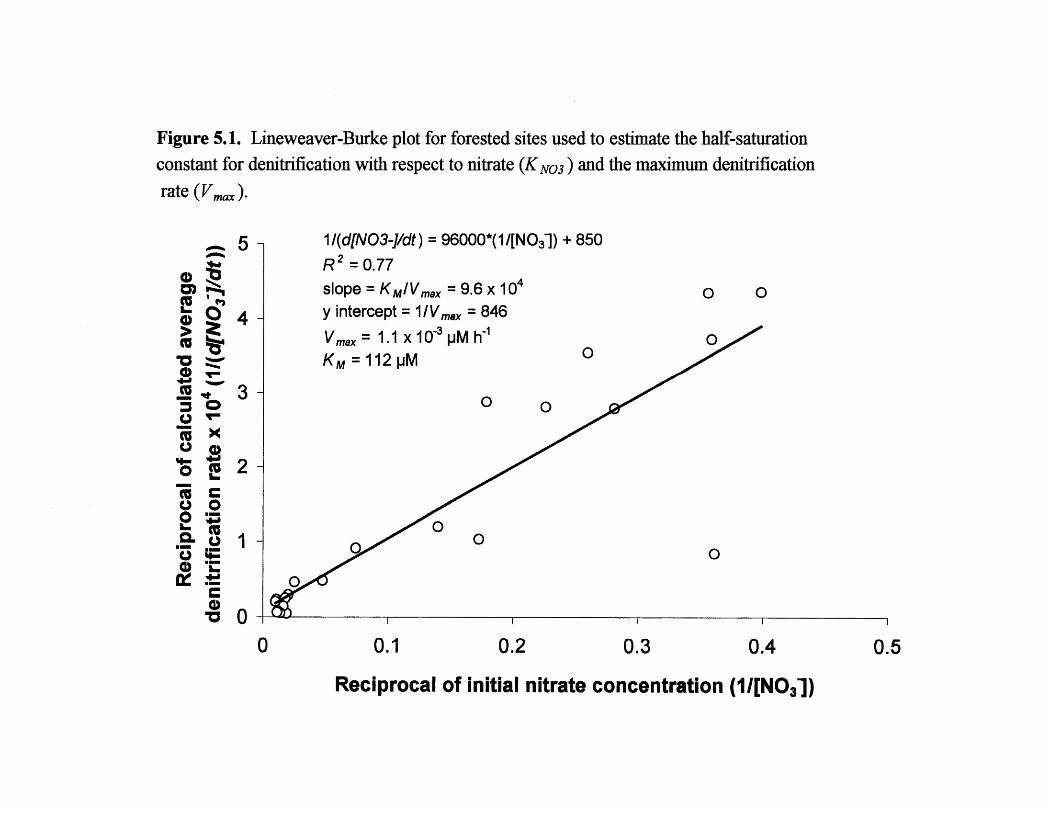
Figure 5.1. Lineweaver-Burke plot for forested sites used to estimate the half-saturationconstant for denitrification with respect to nitrate (KNo3) and the maximum denitrification
rate (Vmax).
5- 1I(d[NO3-J/dt) = 96000*(1/[NO3~) + 850R 2 = 0.77slope = KM/Vmax = 9.6 x 10⁴ Q Q
04 _ y intercept = 1IVmax = 846SVmax = 1.1 x 10~3 pM hW
Km = 112 pM
(U~ 3
0 0
00
0 0
0
0-
0 0.1 0.2 0.3 0.4 0.5
Reciprocal of initial nitrate concentration (1I[NO 3 )
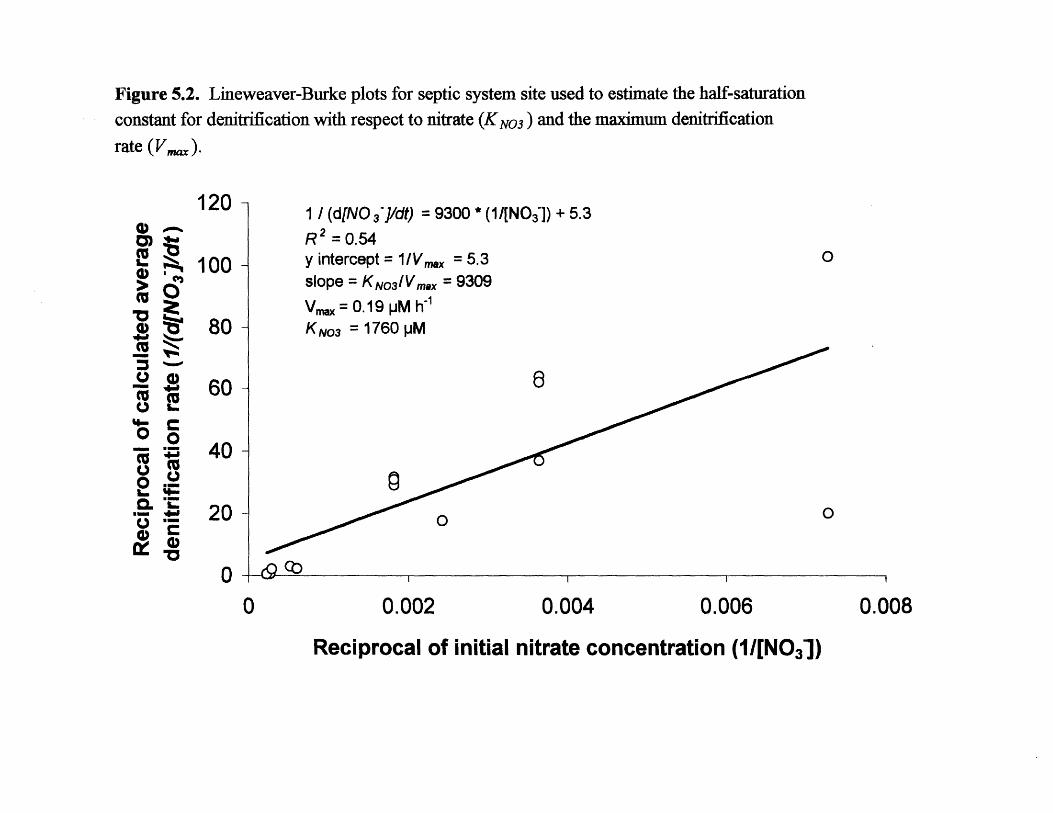
Figure 5.2. Lineweaver-Burke plots for septic system site used to estimate the half-saturation
constant for denitrification with respect to nitrate (KNo3) and the maximum denitrification
rate (V,,).
1201 / (d[N0 37]/dt) = 9300 * (1/[N03~]) + 5.3
R'2 = 0.54
1 io y intercept = 1V,,,, = 5.3slope = KNO3 /VmOx = 9309Vmx = 0.19 pM h
I 80- KN 3 =1760pM
' 60-
020 -00
0 00 0.002 0.004 0.006 0.008
Reciprocal of initial nitrate concentration (1/[N0 3])

While DOC concentrations in the aquifer varied between sites (0.04 to 24 mg C r
1), we were not able to use a Lineweaver-Burke plot to estimate KDOC as we did for
nitrate, since nitrate concentrations did not remain constant as DOC varied. Instead, we
estimated KDoc from kinetics experiments by Kornaros and Lyberatos (1997), who
calculated Ks for growth of Pseudomonas denitrificans on glutamic acid (C4H 9NO4) at
0.025 mM (or 1.4 mg C 1~ 1, which we assigned as the value for KDoc).
3.2 Denitrifying bacterial population
Deeper regions of the unsaturated zone, and uncontaminated, shallow water-table
aquifers contain populations of around 105 to 107 organisms per gram of dry subsurface
material or per liter of groundwater (Balkwill and Ghiorse 1985, Fliermans 1989, Ghiorse
and Wilson 1988, Webster et al. 1985) with 1-10% of these organisms being
metabolically active (Gehlen et al. 1985, Federle et al. 1996, Marxen 1988, Webster et al.
1985). In the same Cape Cod aquifer in which we worked, the USGS estimated the
abundance of free-living bacteria in groundwater using fluorescent labeling (Savoie and
LeBlanc 1998). Measured bacterial population averaged 6.1 x 10⁷ cells 11 in clean
groundwater (or 0.33 mg F, assuming that each cell weighs 5.5 x 10⁻¹⁰ mg,
Schwarzenbach et al. 1993). We used this value to represent the total groundwater
bacterial population (Botai).
Only a small percentage of enumerable groundwater bacteria are metabolically
active (-1 - 10 %, Webster et al. 1985). Given the generally low ambient nutrient
162
concentrations in this aquifer, we assumed that only 1% of the enumerable population
was metabolically active. This parameter is essentially a fitting parameter, since in the
absence of field measurements to assess bacterial viability, we might reasonably assume
that up to 10% of the bacterial population is viable. However, we found that our results
were best when we used the lower value for bacterial viability.
Denitrifying bacteria, like viable bacteria, also represent a subset of the total
bacterial population. To estimate the fraction of total bacteria that were denitrifiers, we
constructed a linear relationship between nitrate concentration and % denitrifiers using
data from Bengtsson and Bergwall (1995) from three aquifers in Sweden (Fig. 5.3, %
denitrifiers = .015*[N0 3 1+ 15, R2 = 0.95). For each groundwater sample from the two
forested sites, we used measured nitrate concentration and this linear regression to
estimate the fraction of denitrifying bacteria. Because nitrate concentrations at our two
sites spanned a small range (up to 68 M) relative to the range measured by Bengtsson
and Bergwell (450 to 2500 M), the calculated percent denitrifiers remained relatively
constant at all of our sampling locations (-15%). We multiplied the calculated percent
denitrifiers by the total bacterial population (Btotai), and by the 1% percent metabolically
active; the product represented the denitrifying population (Bd,,t). This resulted in a
relatively constant estimate of denitrifying population around 9.1 x 10⁵ cells 1- for the
two forested sites (Table 5.1).
163
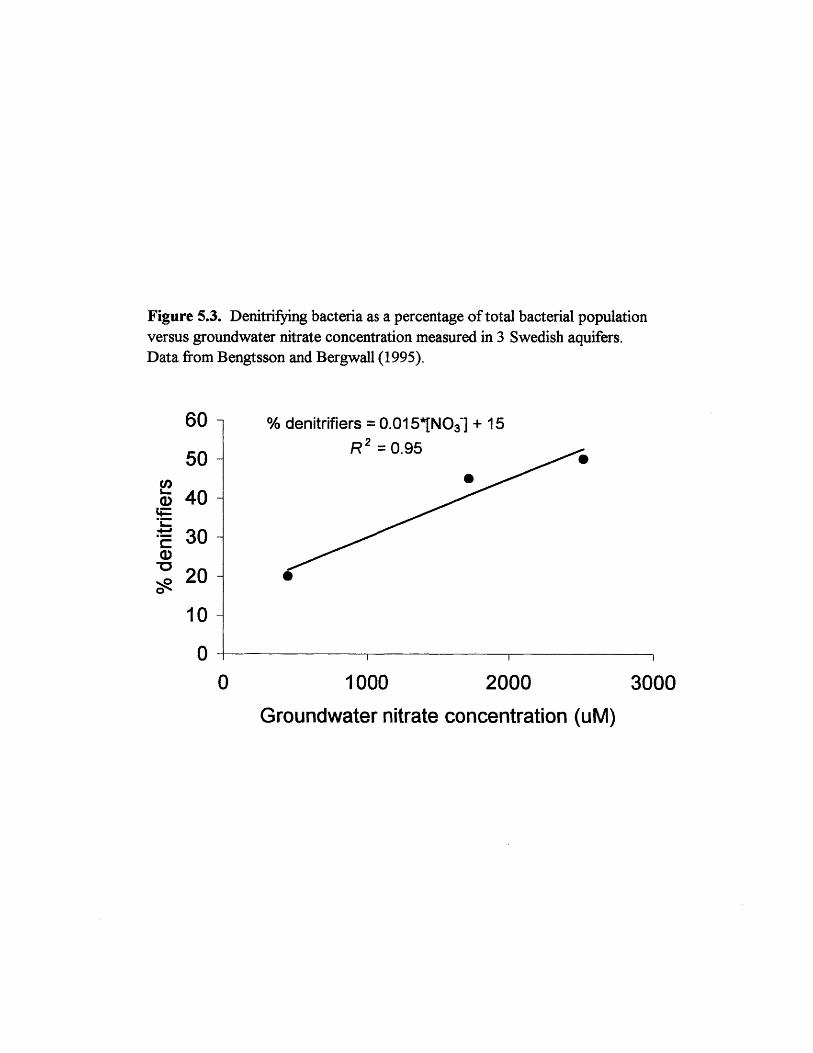
Figure 5.3. Denitrifying bacteria as a percentage of total bacterial populationversus groundwater nitrate concentration measured in 3 Swedish aquifers.Data from Bengtsson and Bergwall (1995).
60
50
40
30
20
10
00
% denitrifiers = 0.015*[NO3~] + 15R 2 = 0.95
1000 2000 3000
Groundwater nitrate concentration (uM)
CNO
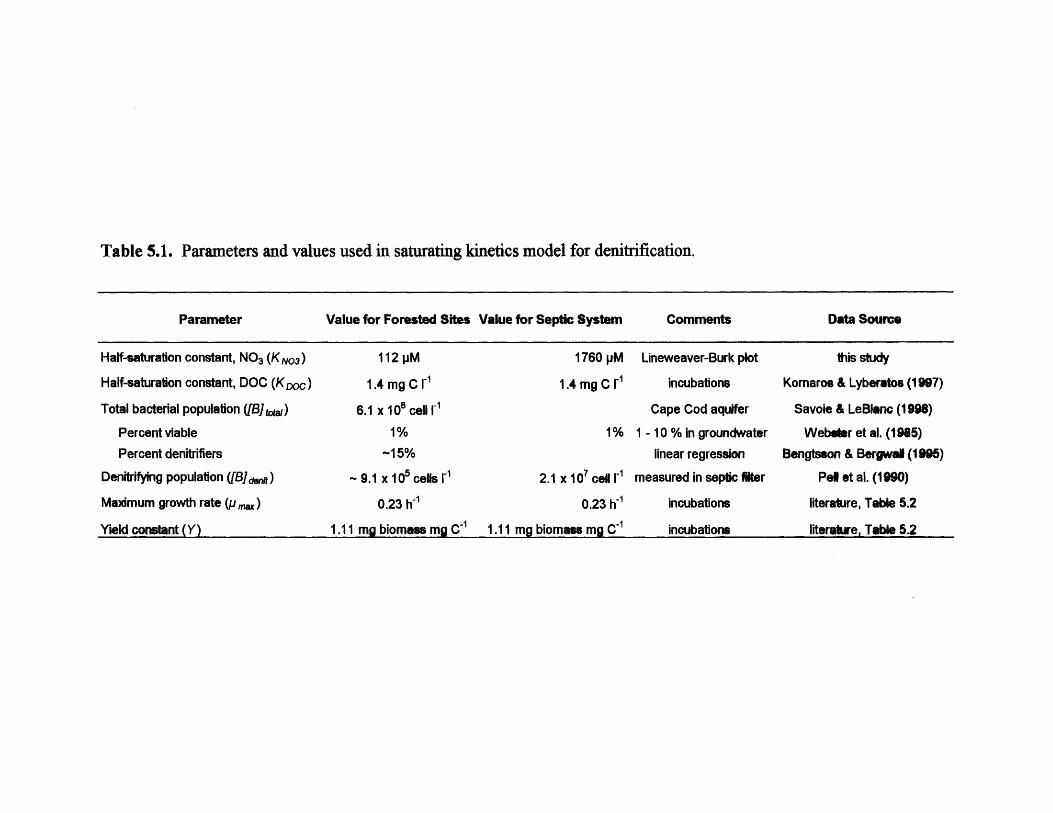
Table 5.1. Parameters and values used in saturating kinetics model for denitrification.
Parameter Value for Forested Sites Value for Septic System Comments Data Source
Half-saturation constant, NO3 (KNo3)
Half-saturation constant, DOC (KDoc)
Total bacterial population (fBJta,)
Percent viable
Percent denitrifiers
Denitrifying population ([B]j,)
Maximum growth rate (P max)
Yield constant (Y)
112 pM
1.4 mg C 1-
6.1 x 10 ce r
1%
-15%
- 9.1 x 10 5 cells 1i
0.23 h~
1.11 ma biomass ma C1 1.11 ma
1760 pM Lineweaver-Burk plot
1.4 mg C r1 incubations
Cape Cod aquifer
1% 1 - 10 % in groundwater
linear regression
2.1 x 10⁷ cep r1 measured in septic fter
0.23 h-' incubations
biomass ma C-1 incubations
this study
Komaro. & Lyberatos (1997)
Savoie & LeBlanc (1998)
Webster et al. (1985)
Bengtsson & Bergwal (1996)
Pet et al. (1990)
literature, Table 5.2
literature. Table 5.2
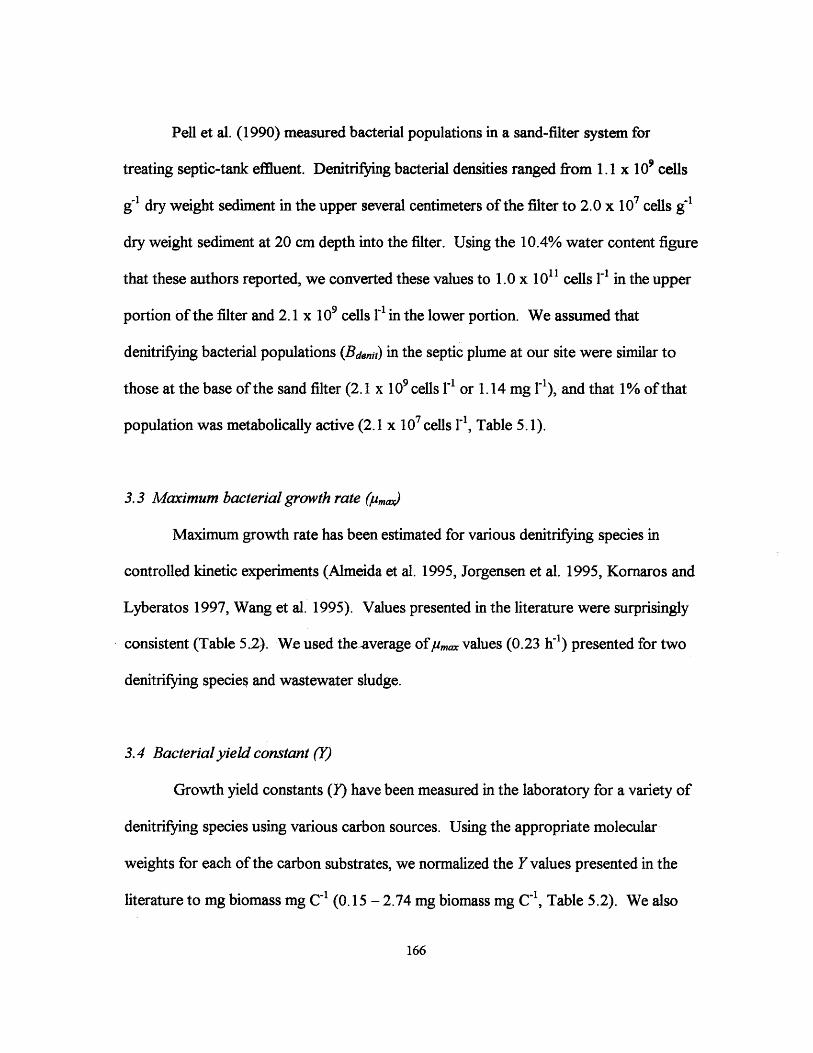
Pell et al. (1990) measured bacterial populations in a sand-filter system for
treating septic-tank effluent. Denitrifying bacterial densities ranged from 1.1 x 10' cells
g_ dry weight sediment in the upper several centimeters of the filter to 2.0 x 10⁷ cells g'
dry weight sediment at 20 cm depth into the filter. Using the 10.4% water content figure
that these authors reported, we converted these values to 1.0 x 10¹¹ cells 1- in the upper
portion of the filter and 2.1 x 10 9 cells 1' in the lower portion. We assumed that
denitrifying bacterial populations (Bd.njt) in the septic plume at our site were similar to
those at the base of the sand filter (2.1 x 10 9 cells 1-1 or 1.14 mg 1-), and that 1% of that
population was metabolically active (2.1 x 10⁷ cells r', Table 5.1).
3.3 Maximum bacterial growth rate (pma)
Maximum growth rate has been estimated for various denitrifying species in
controlled kinetic experiments (Alneida et al. 1995, Jorgensen et al. 1995, Kornaros and
Lyberatos 1997, Wang et al. 1995). Values presented in the literature were surprisingly
consistent (Table 5.2). We used the-average of pma values (0.23 hfr) presented for two
denitrifying species and wastewater sludge.
3.4 Bacterial yield constant (Y)
Growth yield constants (Y) have been measured in the laboratory for a variety of
denitrifying species using various carbon sources. Using the appropriate molecular
weights for each of the carbon substrates, we normalized the Yvalues presented in the
literature to mg biomass mg C- (0.15 - 2.74 mg biomass mg C', Table 5.2). We also
166
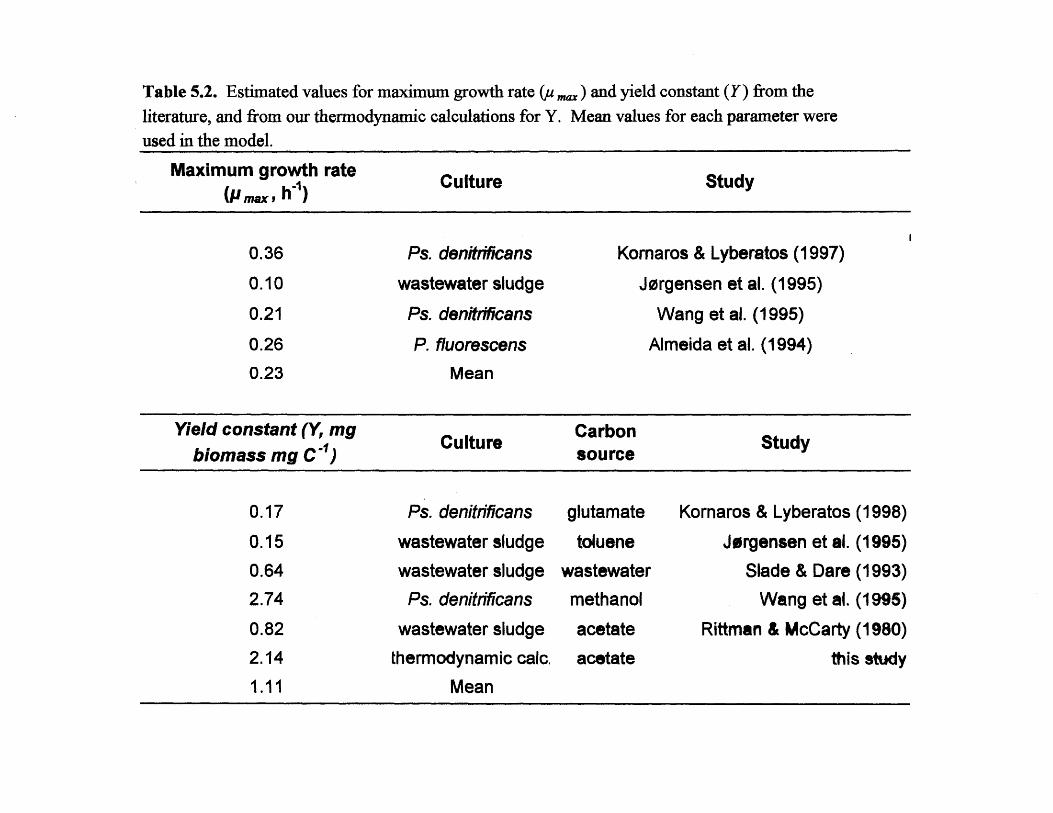
Table 5.2. Estimated values for maximum growth rate (,,,. ) and yield constant (Y) from the
literature, and from our thermodynamic calculations for Y. Mean values for each parameter were
used in the model.
Maximum growth rate Culture Study(p, max, h-)
Ps. denitritcans
wastewater sludge
Ps. denitrificans
P. fluorescens
Mean
Komaros & Lyberatos (1997)
Jorgensen et al. (1995)
Wang et al. (1995)
Almeida et al. (1994)
Yield constant (Y mg Culture Carbon Studybiomass mg C~) source
0.17 Ps. denitrficans glutamate Kornaros & Lyberatos (1998)
0.15 wastewater sludge toluene Jorgensen et al. (1995)
0.64 wastewater sludge wastewater Slade & Dare (1993)
2.74 Ps. denitriflcans methanol Wang et al. (1995)
0.82 wastewater sludge acetate Rittman & McCarty (1980)
2.14 thermodynamic calc acetate this study
1.11 Mean
0.36
0.10
0.21
0.26
0.23
I
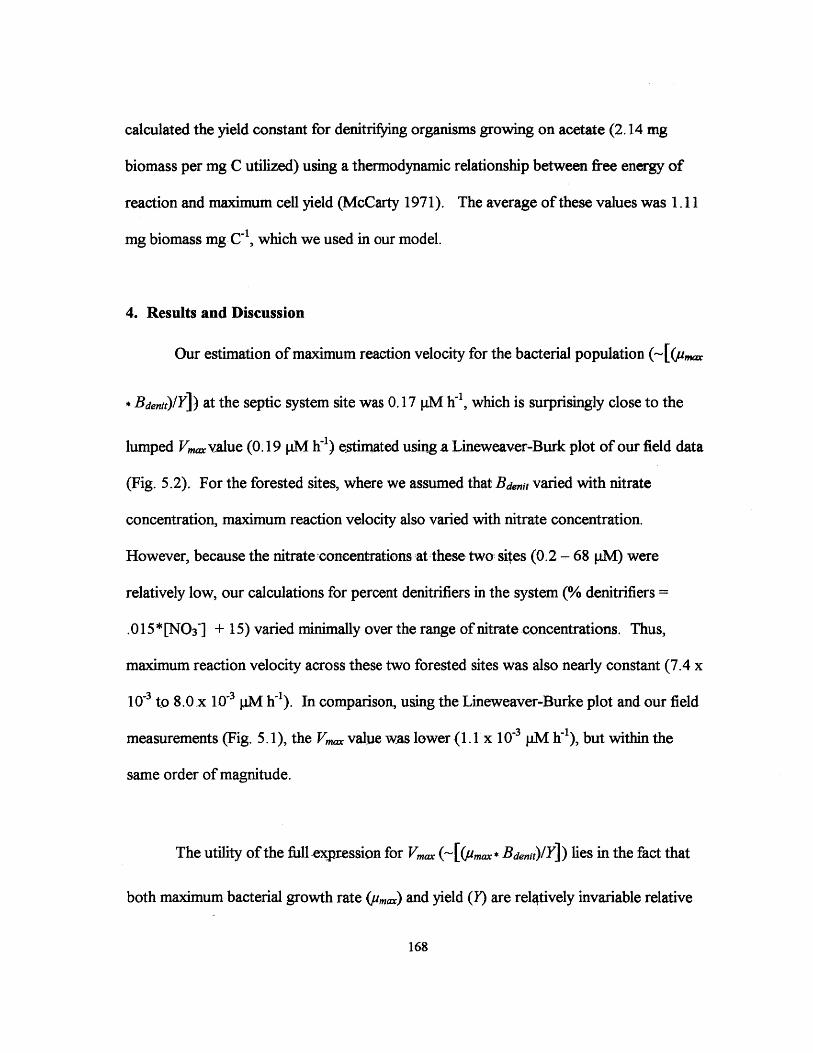
calculated the yield constant for denitrifying organisms growing on acetate (2.14 mg
biomass per mg C utilized) using a thermodynamic relationship between free energy of
reaction and maximum cell yield (McCarty 1971). The average of these values was 1.11
mg biomass mg C-1, which we used in our model.
4. Results and Discussion
Our estimation of maximum reaction velocity for the bacterial population (~(p,,
* Bdenit)/Y]) at the septic system site was 0.17 pM h~l, which is surprisingly close to the
lumped V., value (0.19 pM h) estimated using a Lineweaver-Burk plot of our field data
(Fig. 5.2). For the forested sites, where we assumed that Bdenit varied with nitrate
concentration, maximum reaction velocity also varied with nitrate concentration.
However, because the nitrate concentrations at these two- sites (0.2 - 68 pM) were
relatively low, our calculations for percent denitrifiers in the system (% denitrifiers =
.015*[N03-1 + 15) varied minimally over the range of nitrate concentrations. Thus,
maximum reaction velocity across these two forested sites was also nearly constant (7.4 x
10-3 to 8.0 x 10⁻³ pM hI). In comparison, using the Lineweaver-Burke plot and our field
measurements (Fig. 5.1), the V. value was lower (1.1 x 10⁻³ pM h-'), but within the
same order of magnitude.
The utility of the full -expression for V..( [(pmax* Bdenit)/Y]) lies in the fact that
both maximum bacterial growth rate (u,) and yield (Y) are relatively invariable relative
168

to the large changes that are expected in both total bacterial population (B.awz) and the
percentage of that population that are denitrifiers (Bs.t) with changing groundwater
nitrate and DOC conditions. An expression that accurately characterizes the denitrifying
population (and therefore the maximum reaction velocity (Vma)), would be quite useful
in terms of allowing the model to be applied to a wider range of field situations. Had the
nitrate concentrations beneath the forested sites varied more widely, we might have been
able to test how well our V., expression captures the relationship between nitrate
concentration and denitrifying activity, and thus, its utility in predicting losses of N via
denitrification from a generalized understanding of bacterial dynamics. Testing our
model using nitrate, DOC, and denitrification measurements from another site would be a
valuable future exercise.
We tested the model (using the V., values estimated from the full expression
([(um * Bdenit)IY]) for maximum reaction velocity) to determine how well we could
predict groundwater nitrate loss along the length of groundwater flowpaths across a range
of geochemical conditions. We ran a simulation to estimate total N lost in groundwater
between recharge and a downgradient sampling location, at two forested sites where
nitrate (0-91 pM) and DOC(0-24 mg C r') varied considerably, and in groundwater
sampled from a septic plume ({NO 3 ]. ~ 4,400 pM, [DOC] 26 mg C-). We compared
predicted downgradient nitrate concentrations [NO3 ~1.& with those actually measured in
the field [NO3 ]... For each water parcel, we discretized the groundwater flowpath into
4 time steps. For the first time step, we estimated the denitrification rate based on the
169
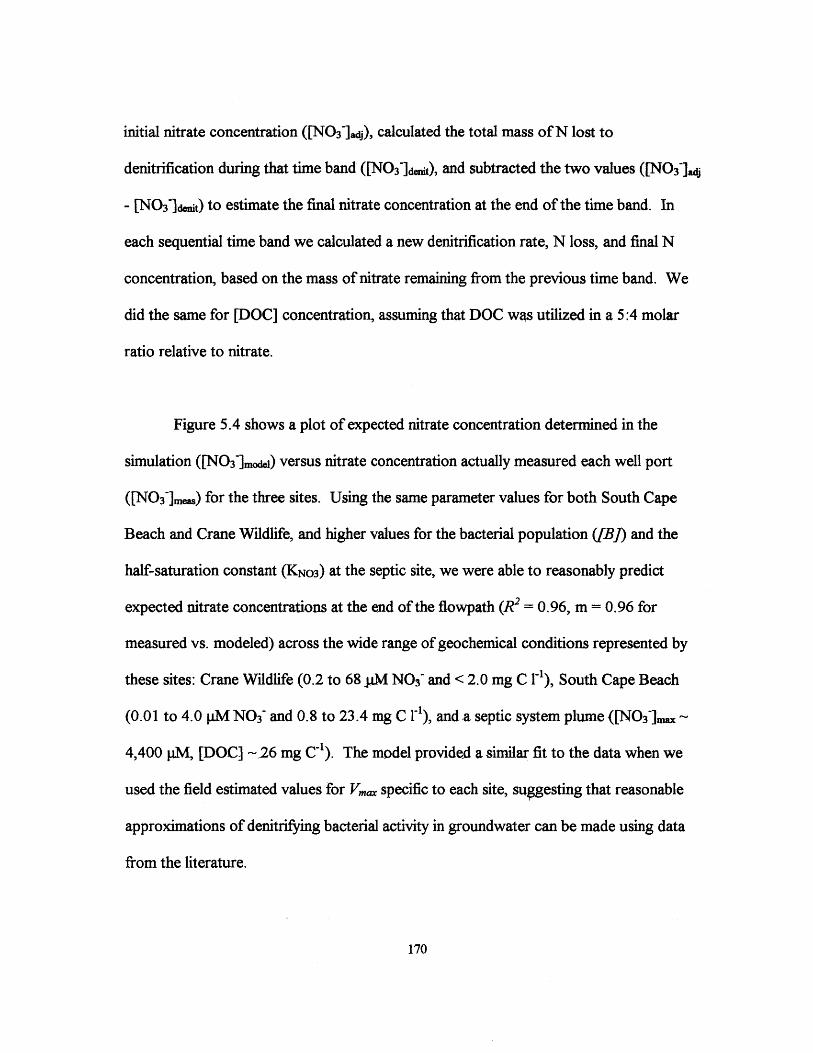
initial nitrate concentration ([NO3]adj), calculated the total mass of N lost to
denitrification during that time band ([NO3~d,wit), and subtracted the two values ([NO 3 ~]j
- [NO3~a&t) to estimate the final nitrate concentration at the end of the time band. In
each sequential time band we calculated a new denitrification rate, N loss, and final N
concentration, based on the mass of nitrate remaining from the previous time band. We
did the same for [DOC] concentration, assuming that DOC was utilized in a 5:4 molar
ratio relative to nitrate.
Figure 5.4 shows a plot of expected nitrate concentration determined in the
simulation ([NO3-]m1&) versus nitrate concentration actually measured each well port
([N0 3]me.) for the three sites. Using the same parameter values for both South Cape
Beach and Crane Wildlife, and higher values for the bacterial population ([B]) and the
half-saturation constant (KNo3) at the septic site, we were able to reasonably predict
expected nitrate concentrations at the end of the flowpath (R2 = 0.96, m = 0.96 for
measured vs. modeled) across the wide range of geochemical conditions represented by
these sites: Crane Wildlife (0.2 to 68 jiM N0 3 ~ and < 2.0 mg C 1 ), South Cape Beach
(0.01 to 4.0 pM N0 3-and 0.8 to 23.4 mg C r'), and a septic system plume ([NO 3 ]. ~
4,400 pM, [DOC] --26 mg C-1). The model provided a similar fit to the data when we
used the field estimated values for V.., specific to each site, suggesting that reasonable
approximations of denitrifying bacterial activity in groundwater can be made using data
from the literature.
170
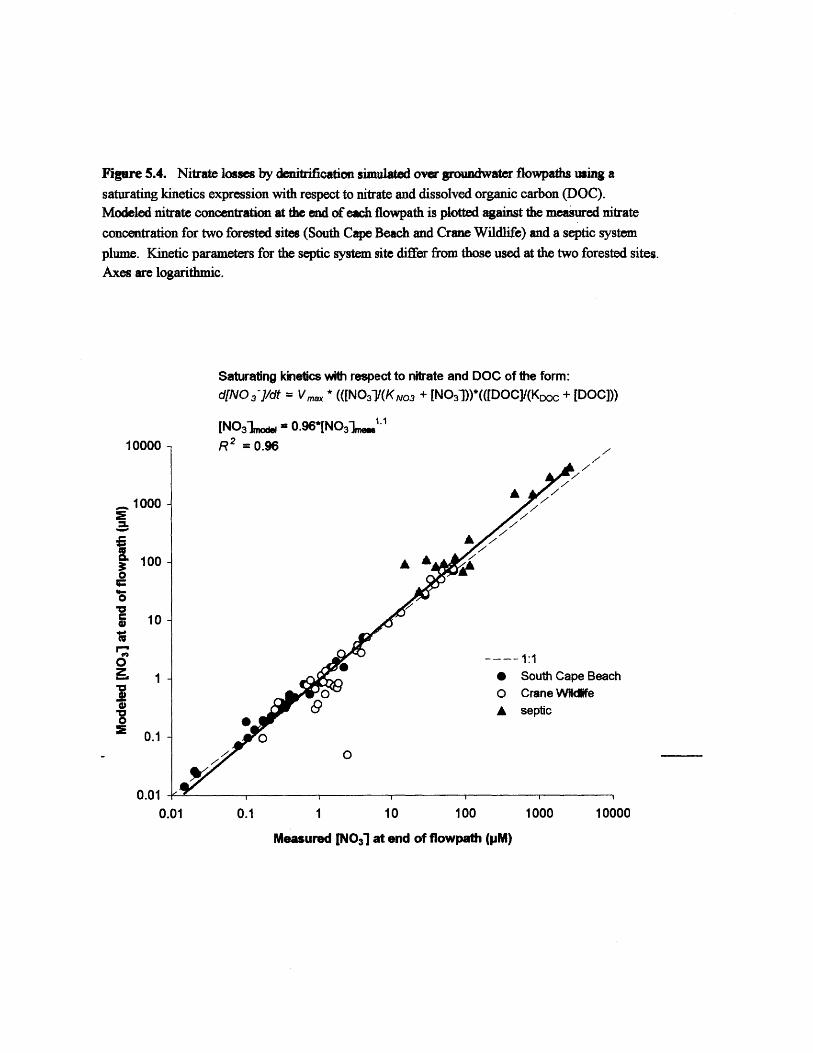
Figure 5.4. Nitrate louses by denitrification simulated over groundwater flowpaths using a
saturating kinetics expression with respect to nitrate and dissolved organic carbon (DOC).Modeled nitrate concentration at the end of each flowpath is plotted against the measured nitrate
concentration for two forested sites (South Cape Beach and Crane Wildlife) and a septic system
plume. Kinetic parameters for the septic system site differ from those used at the two forested sites.
Axes are logarithmic.
Saturating kinetics with respect to nitrate and DOC of the form:d[NO .3-/dt = Vmax * (([N0 31/(K NO3 + [N0 3 ~))*(([DOC]/(KDOc + [DOC]))
[NO 3 1 = 0.96*[NO3 1.'-'10000 R 2 = 0.96
C
0z
1000 -
100 -
I'
10
17
0.1 -
U.U --
0.01
A/A7
A A
0 South Cape B0 0 Crane Wik~e
A septic
0707 AA A
7
0.1 10 100 1000,I
each
110000
Measured [NO3] at end of flowpath (pM)

We also simulated nitrate losses along the groundwater flowpaths using a
saturating kinetics expression with respect only to nitrate. We used the Vmw value
estimated from the bacterial parameters, but eliminated the DOC terms ([DOC]/(KDoc +
[DOC])) from the kinetics expression (i.e., d[N03 ]/dt =Vmax * ([N03-1/(KO3 + [N0 3 ~]).
Figure 5.5 is a plot of expected nitrate concentration determined in the simulation ([N0 3~
]mcie) versus nitrate concentration actually measured each well port ([NO3]me.) for the
three sites. We found that, especially where DOC concentrations were low, the model
often overpredicted the rate of denitrification, resulting in negative predicted nitrate
concentrations. Where predicted nitrate concentrations were negative, we set [NO3~]m.
to 10~ pM in order to include this data on a logarithmic plot. The problem was
particularly noticeable for the Crane Wildlife dataset, where low DOC concentrations (<
2 mg C 1- 1) clearly limit groundwater denitrification rates. As a typical example, for a
groundwater parcel at Crane Wildlife with an initial nitrate concentration of 1.6 pM, and
a DOC concentration of 0.26 mg C 1-, the kinetic expression with respect to nitrate only,
predicts loss of 1.9 pM nitrate within the first time band (resulting in a [NO3~]m&I < 0).
In comparison, the kinetics expression that uses double substrate limitation by nitate and
DOC resulted in a predicted nitrate loss of only 0.09 PM during the first time step,
reflecting the impact of low DOC concentrations on denitrification rate. The much better
fit between [NO3~model and [NO3 ]hieas using the kinetics expression with respect to both
nitrate and DOC (Fig. 5.4), than using the model with respect only to nitrate (Fig. 5.5)
illustrates the importance of DOC as a control on gFoundwater denitrification rates.
172
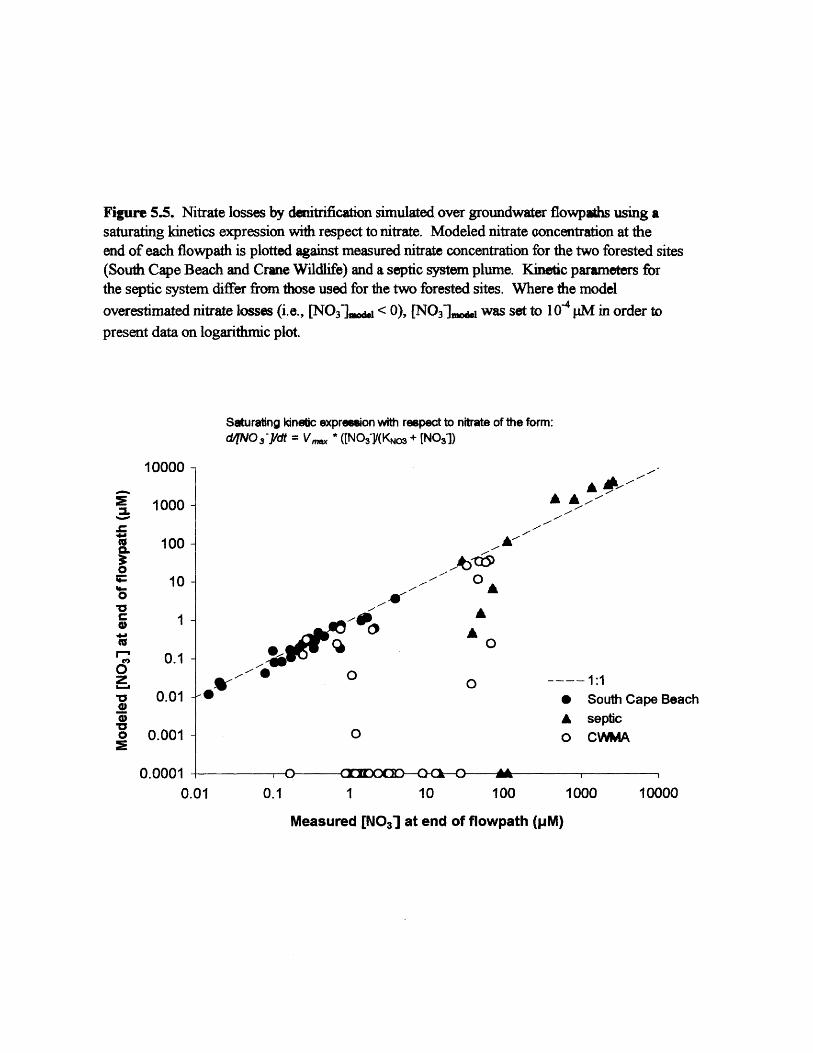
Figure 5.5. Nitrate losses by denitrification simulated over groundwater flowpaths using asaturating kinetics expression with respect to nitrate. Modeled nitrate concentration at theend of each flowpath is plotted against measured nitrate concentration for the two forested sites(South Cape Beach and Crane Wildlife) and a septic system plume. Kietic parameters forthe septic system differ from those used for the two forested sites. Where the modeloverestimated nitrate losses (i.e., [NO3 1 1 < 0), [NO3 1 1 was set to 10 4 pM in order topresent data on logarithmic plot.
Saturating kinetic expression with respect to nitrate of the form:d/NO 3~1/dt = Vm * ([N0 3 (KN0 + [N0 31)
A AA A-'
0 A
At'
-4
1 0- Q
AA
0
0
0
0.0001 i QnrOc-Oc-O0.01 0.1 1 10
---- 1:1* South Cape BeachA septico CV*AA
A100 1000
,10000
Measured [N0 31 at end of flowpath (pM)
10000 -
1000 -
100 -
10-
1-
0.1 -
0.01 -
0.001 -
0
0
I
go0
~00
These results further confirm our conclusions from Chapter 3, where we show
that first order denitrification rates with respect to nitrate are highest where DOC
concentrations are highest, suggesting that independent of nitrate concentration, DOC
concentrations play a critical role in controlling groundwater denitrification rates. The
kinetics model, with double substrate limitation by nitrate and DOC, that we present here,
provides a valuable tool for planners and managers interested in designing management
strategies to control nitrogen loading to coastal waters. Such a model might be used in
the design of setback limits for septic systems, in assessing the value of open spaces for
N load reduction, in regulating wastewater disposal, and in watershed-wide land use
planning.
174
5. Acknowledgements
MIT Sea Grant (#65591) and a National Estuarine Research Reserve (NERRS)
Graduate Fellowship from the National Oceanic and Atmospheric Administration
(NA770R024) supported this work. The authors would like to thank the many people
who assisted us in the field and lab work that provided the data against which we tested
this model, including: Denis LeBlanc of the US Geological Survey, Marlborough, MA;
Gabrielle Tomasky of the Boston University Marine Program; Vanessa Bhark, Amy
Watson, and John McFarland at MIT; Anne Giblin and Kathy Reagan at the Ecosystems
Center, Marine Biological Laboratory; and the staff at the Waquoit Bay National
Estuarine Research Reserve.
175
6. References
Alexander M. 1999. Biodegradation and bioremediation. 2 "d edition. Academic Press.San Diego. pp. 453.
Almeida JS, Julio SM, Reis MAM, & Carrondo MJT (1995) Nitrate inhibition ofdenitrification by Pseudomonas fluorescens. Biotech. Bioeng. 46: 194-201.
Balkwill DL & Ghiorse WC (1985) Characterization of subsurface bacteria associatedwith two shallow aquifers in Oklahoma. Appl. Env. Microbiol. 50: 580-588.
Bengtsson G & Annadotter 11 (1989) Nitrate reduction in a groundwater microcosmdetermined by 15N gas chromatography-mass spectrometry. Appl. Environ. Microbiol.55:2861-2870.
Bengtsson G & Bergwall C (1995) Heterotrophic denitrification potential as an adaptiveresponse in groundwater bacteria. FEMS Microbiol. Ecol. 16: 307-318.
Bottcher J, Strebel 0, Voerkelius S, & Schmidt HL (1990) Using isotope fractionation ofnitrate-nitrogen and nitrate-oxygen for evaluation of microbial denitrification in a sandyaquifer. J. Hydrol. 114:413-424.
Bradley PM, Aelion CM, & Vroblesky DA (1 992a) Influence of qnvironmental factors ondenitrification in sediment contaminated with JP-4 jet fuel. Ground Wat. 30:843-848.
Bradley PM, Fernandez M, Jr, & Chapelle FH (1992W),Carbon limitation ofdenitrification rates in an anaerobic groundwater system. Environ. Sci. Technol. 26:2377-2381.
Bragan RJ, Starr JL, & Parkin TB (1 997a& Shallow groundvyater denitrification ratesmeasured by acetylene block. J. Environ. Qual. 26:1531-1538.
Bragan RJ, Starr JL, & Parkin TB (1997bj)Acetylene transport in shallow groundwaterfor denitrification rate measurement. J. Environ. Qual. 26:1524-1530.
Bremner A & Argaman Y (1990) Effect of feed compositior, aerobic volume fractionand recycle rate on nitrogen in the single-sludge system. Wat. Res. 24: 1041-1049.
Carucci A, Ramadori R, Rossetti S, & Tomei MC (1996) Kinetics of denitrificationreactions in single sludge systems. Wat. Res. 30:51-56.
Christensen S, Simkins- S, & JM Tiedje (1990) Spatial variability in denitrification:Dependency of activity centers on the soil environment. Soil Sci. Soc. Am. J. 54:1608-1613.
176
Clay DE, Clay SA, Moorman TB, Brix-Davis K, Scholes KA, & Bender AR (1996)Temporal variability of organic C and nitrate in a shallow aquifer. Water Res. 30:559-568.
Engberg DJ & Schroeder ED (1975) Kinetics and stoichiometry of bacterialdenitrification as a function of cell residence time. Wat. Res. 9: 1051-1054.
Federle TW, Dobbins DC, Thorning-Manning JR, & Jones DD (1986) Microbialbiomass, activity, and community structure in subsurface soils. Ground Wat. 24: 365-374.
Fiebig D, Lock MA, & Neal C (1990) Soil water in the riparian zone as a source ofcarbon for a headwater stream. J. Hydrol. 116: 217-23 7.
Fiebig D (1995) Groundwater discharge and its contribution of dissolved organic carbonto an upland stream. Arch. Hydrobiol. 134: 129-155.
Fliermans CB (1989) Microbial life in the terrestrial subsurface of southeastern coastalplain sediments. Haz. Water Haz. Materials 6:155-171.
Ford T & Naiman RJ (1989) Groundwater-surface-water relagionships in boreal forestwatersheds: dissolved organic carbon and inorganic nutrient dynamics. Can. J. Fish.Aquat. Sci. 46: 41-49.
Gehlen M, Trampish HJ, & Dott W (1985) Physiological characterization ofheterotrophic bacterial communities from selected aquatic environments. Microb. Ecol.11:205-219.
GESAMP (1990) State of-the Marine Environment. Rep. Stud, No. 39, Joint Group ofExperts on the Scientific Aspects of Marine Pollution. United Nations EnvironmentProgramme. 111 p.
Ghiorse WC & Wilson JT (1988) Microbial ecology of the terrestrial subsurface. Adv.Appl. Microbiol. 33: 107-172.
Gillham RW (1991) Nitrate contamination of groundwater in Southern Ontario and theevidence for denitrification. NATO ASI SERIES, V G 30 Nitrate Contamination, (editedby Bogardi I, & Kuselka RD) p. 182-198.
Glass C & Silverstein J (1998) Denitrification kinetics of high nitrate concentrationwater: pH effect on inhibition and nitrate accumulation. Water Res. 32: 831-839.
177
Gold AJ, Jacinthe PA, Groffinan PM, Wright WR, & Puffer PH (1998) Patchiness ingroundwater nitrate removal in a riparian forest. J. Env. Qual. 27:146-155.
Griffiths P (1994) Modifications to the IAWPRC Task Group general activated sludgemodel. Water Res. 28: 657-664.
Groffman PM, Howard G, Gold AJ, & Nelson WM (1996) Microbial nitrate processingin shallow groundwater in a riparian forest. J. Env. Qual. 25: 1309-1316.
Jacinthe PA, Groffrnan PM, Gold AJ, & Mosier A (1998) Patchiness in microbialnitrogen transformations in groundwater in a riparian forest. J. Env. Qual. 27:156-164.
Jorgensen C, Flyvbjerg J, Arvin E, & Jensen BK (1995) Stoichipmetry and kinetics ofmicrobial toluene degradation under denitrifying conditions. Biodegradation 6: 147-156.
King D & Nedwell DB (1987) The adaptation of nitrate-reducing communities inestuarine sediments in response to overlying nitrate load. FEMS Microbiol. Ecol. 45:15-20.
Knowles R. (1982) Denitrification. Microbiol. Rev. 46:43-70.
Koram SF (1992) Natural denitrification in the saturated zone: A review. Wat. Res.Res. 28:1657-1668.
Kornaros M & Lyberatos G.(1998) Kinetics modelling of Pseudomonas denitrificansunder growth and denitrification under aerobic, anoxic and transient operating conditions.Water Res. 32: 1912-1922.
Komaros M, Zafiri C, & Lyberatos G-(1997) Kinetics of aerobic growth of a denitrifyingbacterium, Pseudomonas denitrificans, in the presence of nitrates and/or nitrites. WaterRes. 31: 479-488.
Kroeger KD, Bowen JD, Corcoran D, Moorman J, Michalowsgi J, Rose C, & Valiela I(1999) Nitrogen loading to Green Pond, Falmouth, MA: Sources and evaluation ofmanagement options. Environ.,Cape Cod 2: 15-26.
LeBlanc DR, Garabedian SP, Hess KM, Gelhar LW, Quadri RD, Stollenwerk KG, &Wood WW (1991) Large-scale natural gradient tracer test in sarid and gravel, Cape Cod,Massachusetts 1. Experimental design and observed tracer movement. Water Res. Res.27: 895-910
178-
Mariotti A, Landreau A, & Simon B (1988) 15N isotope biogeochemistry and naturaldenitrification process in groundwater: Application to the chalk aquifer of northernFrance. Geochim. at Cosmochim. Acta 52: 1869-1878.
Marxen J (1988) Investigations into the number of respiring bacteria in groundwaterfrom sandy and gravelly deposits. Microb. Ecol. 16:65-72.
McCarty PL (1971) Energetics and Bacterial Growth, Chap. 21 ii Organic Compounds inAquatic Environments, Faust SD & Hunter JV, Eds., Marcel Dekker, Inc., New York, pp.495-531.
Morris JT, Whitting GT, &-Chapelle FH (1988) Potential denitrification rates in deepsediments from the Southeastern Coastal Plain. Environ. Sci. Technol. 22:832-835.
National Research Council (1994) Priorities for Coastal S"'nce, National AcademyPress, Washington D.C. 88 p.
Nixon S, Oviatt CA, Frithsen J, & Sullivan B (1986) Nutrient and the productivity ofestuarine and coastal marine ecosystems. J. Limnol. Soc. S. A'rica 12: 43-71.
Pabich WJ, Valiela I, & Hemond HF (submitted) The effect of yadose thickness anddepth below the water table on DOC concentration in groundwater on Cape Cod, U.S.A.Biogeochemistry.
Pabich WJ, Hemond HF, & Valiela 1. Denitrification rates in-roundwater, Cape Cod,USA: Control by N0 3 ~ and DOC concentrations.
Parkin TB (1987) Soil microsite as a source of denitrification variability. Soil Sci. Soc.Amer. J. 51: 1194-1199.
Payne WJ(1981> Chapeter 10: Denitrification as a factoe in soil science: generalproperties. In: Denitrification. John Wiley & Sons, New York. pp. 118-133.
Pell M, Nyberg-F, & Lunddren-, H(I990)> Microbial numbers and activity duringinfiltration of septic-tank effluent in a subsurface sand filter. Wat. Res. 24:1347-1354.
Peterjohn WT, & Correll DL (1984)-Natrient dynamics irran agricultural watershed:Observations on the role of riparian forest. Ecology 65: 256-268.
Rittman BE,& McCarty PL (1980)-Evaluation ofstealy-state-biofilm kinetics.Biotechnol. Bioeng. 22: 2358-2373.
179
Savoie J, & LeBlanc DR (1998) Water-Quality Data and Methods of Analysis forSamples Collected Near a Plume of Sewage-Contaminated -(round Water, AshumetValley, Cape Cod, Massachusetts, 1993-94. U.S. Geological Survey, Marlborough
Seely BA (1997) Atmospheric deposition and flux dynamics 9 f nitrogen in the coastalforests of the Waquoit Bay watershed, Cape Cod, MA. PhD dissertation, BostonUniversity.
Slade AH, & Dare PH (1993) Technical note: Measuring maximum specific growth rateand half saturation coefficient for activated sludge systems using a freeze concentrationtechnique. Wat.. Res. 12:1793-1795.
Slater JM, & Capone DG (1987) Denitrification in aquifer soil and nearshore marinesediments influenced by groundwater nitrate. Appl. Environ. Mjcrobiol. 53:1292-1297.
Smith RL, & Duff JH (1988) Denitrification in a sand and gravel aquifer. Appl.Environ. Microbiol. 53: 1292-1297.
Sprent JI (1987) Chapter 3: Modified N cycles: effects of environment. In: TheEcology of the Nitrogen Cycle. Cambridge-Uriversity Presi New York. pp. 49-66.
Valiela I, Collins G, Kremer J, Lajtha K, Geist M, Seely B, Brawley J, & Sham CH(1997) Nitrogen loading from coastal watersheds to receiving es~paries: new method andapplication. Ecol. Appl. 7: 358-380
Valiela I; Foreman K LaMontagne M; Hersh D;-Costa J, PeckoliP, DeMeo-Andreson B,D'Avanzo C, Babione M, Sham CH, Brawley J, & Lajtha K (1992) Couplings ofwatersheds and coastal waters: sources and-consequences 9 f nutrient enrichment inWaquoit Bay, Massachusetts. Estuaries 15: 443-457.
Valiela I, GeistM, McClelland J, & Tomasky G:(2000) Nitrogen loading fromwatersheds to estuaries: Verification of the Waquoit Bay Nitrogen Loading Model.Biogpochemistry 49:277-293
Verchot LV, Franklin EC, & GilliarnJW (1997) Nitrogencyfig in Piedmont vegetatedfilter zones: II. Subsurface nitrogen removal. J. Environ. Qual. 26:337-347.
Vogel JC (1967) Investigation of growndwater flow with radiocarbon. In: Isotopes inHydrology (pp. 355-369). IAEA-SM-83/24, Vienna
Wang JH, Baltzis BC, & Lewandowski GA (1995) Fundamental denitrification kineticstudies with Pseudomonas denitrificans. Biotechnol. Bioeng. 47: 26-41.
180
Webster JJ, Hampton GJ, Wilson JT, Ghiorse WC, & Leach FR (1985) Determination ofmicrobial cell numbers in subsurface samples. Ground Wat. 23:17-25.
181-
CHAPTER 6:
CONCLUSIONS
182
1. Conclusions
A principal alteration of estuarine and coastal ecosystems worldwide is
eutrophication brought about by increasing loads of anthropogenically-derived nitrogen
(GESAMP 1990, NRC 1994, Nixon et al. 1996) transported by freshwater to receiving
coastal waters (Cole et al. 1993). Nitrogen transport rates are of critical importance
because rates of coastal production, as well as many otherkey processes coupled to
production, are set by nitrogen supply (Nixon, in press, Nixon et al. 1986, Howarth et al.
1996). The effects of eutrophication on coastal ecosystems are far-ranging, and can
include red tides, fish kills, anoxia and hypoxia as currently observed over wide areas of
the Gulf of Mexico, contamination of shellfish beds (NRC 2000), and alteration of
valuable habitat including loss of eelgrass beds, such as that documented in Waquoit Bay,
MA (Costa 1988).
Understanding how N is transformed and transported within aquifers is necessary
to calculating watershed N budgets, understanding basic nitrogen biogeochemistry, and
estimating total N delivery to coastal waters The- goal of this study was to estimate
groundwater denitrification rates in the Waquoit Bay aquifer on Cape Cod, to examine
how they vary as a function of nitrate and DOC conoentrations, and to construct a
predictive model that might be used to assess groundwater denitrification rates across the
range of geochemical conditio-ps present in this aquifer.
183 -
2. Controls on Groundwater DOC Concentrations
We show that the thickness of the vadose zone through wich recharge occurs and
the depth below the water table exert significant control on DOC concentrations in
underlying groundwater: We found that the deeper the vadose zone, the lower the
concentration of DOC in groundwater near the water table, indicating that considerable
attenuation of surface-derived DOC occurred in the vadose zope. Under vadose zones
<1 .25 -m, DOC concentrations at the surface of the water table ranged to >20 mg I' C,
while for vadose zones>5:0 in, DOC never exceeded 2.0 mg 14 C. DOC concentrations
also decreased with increasing depth belowthe water table, most potably in the upper two
meters, implying continued attenuation in the upper layer of the saturated zone. Ninety-
nine percent of the DOC was attenuated by the time the watergeached a depth of 19 m
below the water table. DOC concentrations in shallow groundwater show considerable
spatial variability; but concentration ofDOG: at- any one site is, qurprisingly stable over
time. The largest source of variation in DOC concentration in groundwater therefore is
spatial rather than temporal; suggesting that local-heterogeneits play an important role
in DOC delivery to shallow groundwater. Our results highlight both the importance of
shallow vadose areas in DOC delivery to groundwater-and the ieed to distinguish where
samples are collected in relation to flow paths before conclusions are made about mean
groundwater DOC concentrations. The substantial losses of DO( in the vadose zone and
in shallow depths within the aquifer suggest that quite active biogeochemical processing,
particularly denitriflcationt may occur in these boundary environments.
184 :
3. Groundwater Denitrifcation Rates
We used a stable isotopic approach to estimate average denitrification rates
occurring along groundwater flowpaths at two forested sites (Crane Wildlife
Management Area and South Cape-Beach) in and -near the Waquoit Bay watershed.
These sites provided a large range of groundwater nitrate (<1 to 91 pM) and DOC (0 to
23 mg CT') concentrations. We compared these rates to those that we measured using
mass balance of N in a septic plume. Denitrificatiorrrates increased with increasing
nitrate concentration, from 0 to 2.1 x 1 pMNh-- at the forestpd sites, and 0.01 to 2.23
pM NO 3 ~ h' in the septic system plume. First order denitrifiqation rate constants with
respect to nitrate were highest where- groundwater DOC concentrftions were highest: k =
2.8 y' in the septic plume(~ 26mg Cr'), k = 1.6y' -at South-Cape Beach (DOC= 0.8
to 23.4mg CT'), and k = .25y yat Crane-Wildlife- (0. to 1.9 mg Cr'), suggesting that,
independent of nitrate concentration, DOC concentration exert a significant control on
denitrification rates.
We simulated N losses along groundwater flowpaths- for the Crane Wildlife site;
the results of this analysis suggested that for the low DOC conditions at this site, a
saturatingkinetics expression with respect to-nitrate best predi9ts nitrate concentrations
measured at the dawngradilit well ports.(R2 = 0.96 for [NO3lmoeI vs. [NO 31meas).
185
4. Modeling of Denitrification Using a Saturating Kinetics Expression
We developed an empirically-based saturating kinetics 9xpression to describe
groundwater denitrification under carbon and nitrate-limited conditions. Denitrification
rates were described using a kinetic expression with double substrate limitation (with
nitrate as the terminal electron acceptor and dissolved organic carbon (DOC) as the
electron donor). The kinetic parameters were estimated from our field data (half
saturation constant for N0 3 ~ (KNo3)) and USGS field data (bacterial population [B]), and
from data available in the literature (maximum bacterial growth rate (pmax), half
saturation constant for DOC (Koc), and bacterial yield constant (Y)). The proposed
model was able to reasonably predict N losses along groundwater ,flow paths, measured at
the two fdrested. sites, where DOC ranged from 0 to 23 mg C r' and nitrate ranged from
<1 to 91 pM. Using higher values for the bacterial populatiop ([Bj) and the half-
saturation constant (KNO3), we were also able to predict N losses due to denitrification
within the very different biogeochemical conditions of the septic system plume ([N0 3~
]me~ 4,400 pM, [DOC] ~ 26 mg C4 , and presumably a larger. and more active bacterial
population). The model performs well over the wide range of geochemical conditions
found at the three sites within- this watershed (R?2 = 096; m = 0.96 for measured vs.
modeled). Eliminating the DOC term from the saturating kipetics expression, so that
denitrification is limited only by nitrate concentration, results in an overprediction of
nitrate losses along groundwater flowpaths; particularly wherN DOC concentration are
low. These results further confirm our previous conclusion that DOC concentrations
exert a significant control on groundwater denitrification rates.
186 -
We conclude that the magnitude of the nitrate source, its travel distance to shore,
and the DOC concentration in groundwater are useful predictors qf N downgradiat. The
saturating kinetics model, with double substrate limitation by nitrate and DOC, developed
here, provides a valuable tool for planners and managers interested in designing
management strategies to control nitrogen loading to coastal waters. Such a model might
be used in the design of setback limits for septic systems, in asgessing the value of open
spaces for N load reduction, in regulating wastewater disposal, and in watershed-wide
land use planning.
187
5. References
Costa JE (1988) Distribution, production, and historical changes in abundance ofeelgrass (Zostera marina) in southeastern Massachusetts. Ph.D. Thesis. BostonUniversity, 352 p.
Cole JJ, Peierls BL, Caraco NF & Pace ML (1993)- Nitrogen -loading of rivers as ahuman-driven process in McDonnell MJ & Pickett STA (eds.) Humans as Componentsof Ecosystems: The Ecology of Subtle Human-Effects and P9pulated Areas (pp 138-154). Springer-Verlag, New York, New York, U.S.A.
GESAMP (1990) State of the Marine Environment. Rep. Stud. No. 39, Joint Group ofExperts on the Scientific Aspects of Marine Pollution. United Nations EnvironmentProgramme. I Ip.
Howarth RW, Billen G, Swaney D, Townsend A, Jaworski N, Lajtha K, Downing JA,Elmgren R, Caraco N, Jordan T, Berendse F, Freney J, Kudeyarov V, Murdoch P, &Zhao-Liang Z (1996) Regional nitrogen budgets and riverine7 nitrogen and phosphorusfluxes for the drainages to the North Atlantic Ocean: natural and human influences.Bipgeochemistry 35:75-79.
National Research Council (NRC) (2000) Clean Coastal Waters: Understanding andReducing the Effects of Nutrient Pollution. National Academy Press, Washington, D.C.405 p.
National Research Council (NRC) (1994) Priorities for Coastal Science, NationalAcademy Press, Washington D.C. 88 p.
Nixon SW, Ammerman JW, Atkinson LP, Berounsky VM, Billen G, Boicourt WC,Boyton WR, Church TM, DiToro DM, Elmgren R, Garber JH, Giblin AE, Jahnke RA,Owens NJP, Pilson MEQ, & Seitzinger SP (1996) The fate of nitrogen and phosphorus atthe land-sea margin of the North Atlantic Ocean. Biogeochemistry 35: 141-180.
188
j )7.