Denitrification, greenhouse gas emission and solute …...Denitrification, greenhouse gas emission...
135
_______________________________________________________________________________________ _______________________________________________________________________________________ Denitrification, greenhouse gas emission and solute transport in reactive drainage filters (Subsurface flow constructed wetlands) Jacob Vestergaard Druedahl Bruun Ph.D. thesis Department of Agroecology, Science and Technology November 2015 AARHUS UNIVERSITY
Transcript of Denitrification, greenhouse gas emission and solute …...Denitrification, greenhouse gas emission...
_______________________________________________________________________________________
_______________________________________________________________________________________
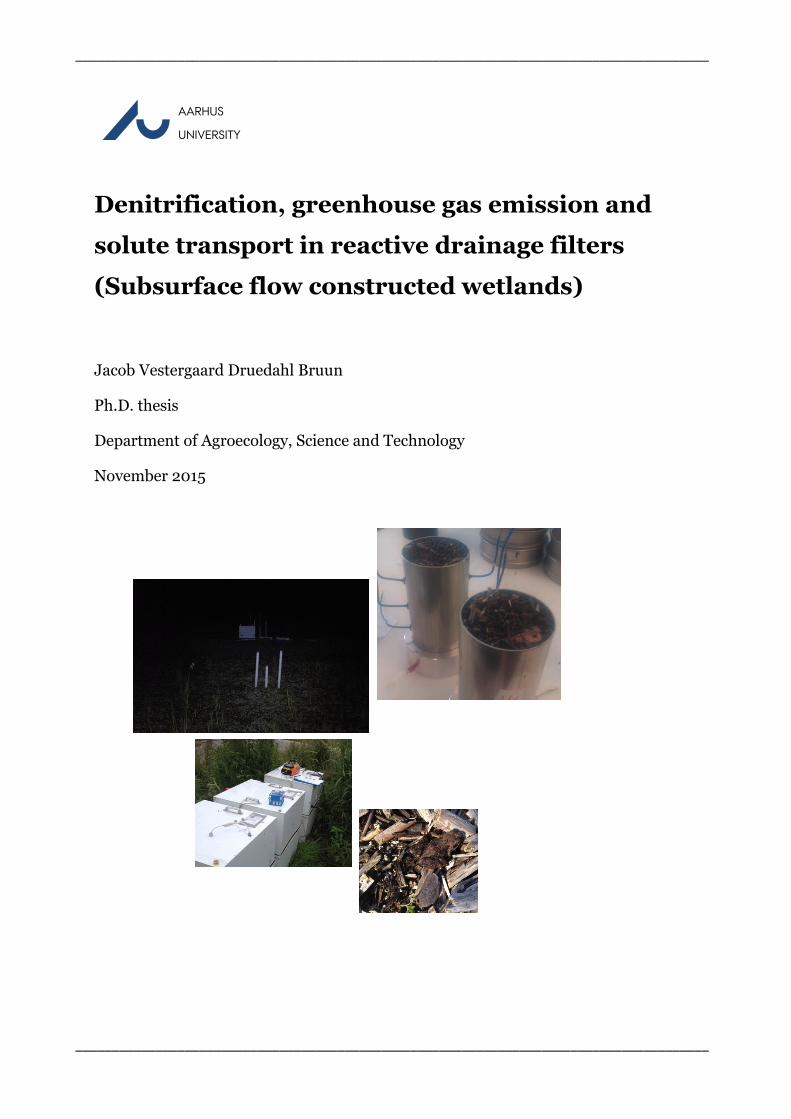
Denitrification, greenhouse gas emission and
solute transport in reactive drainage filters
(Subsurface flow constructed wetlands)
Jacob Vestergaard Druedahl Bruun
Ph.D. thesis
Department of Agroecology, Science and Technology
November 2015
AARHUS
UNIVERSITY

_______________________________________________________________________________________
_______________________________________________________________________________________ I
Ph.D. thesis by Jacob Bruun
Preface
This Ph.D. thesis is a product of the SUPREME-TECH research project funded by the Danish
Council for Strategic Research and was conducted between February 2012 and November 2015 at
the Department of Bioscience, Aarhus University, Denmark. The thesis was based on the three
enclosed papers (I-III). A fourth paper (Paper IV, in preparation) will be produced based in the
work carried out during this Ph.D. (Not enclosed). In the text Papers are referred to by their
Roman numerals.
I. Bruun J., Hoffmann, C.C, Kjaergaard, C., Nitrogen removal in permeable
woodchips filters affected by hydraulic loading rate and woodchips ratio. Manuscript
submitted to Environmental Quality
II. Bruun J., Hoffmann C.C., Kjaergaard C., Convective transport of dissolved
gases determines the fate of the greenhouse gases produced in reactive drainage filters.
Manuscript submitted to Ecological Engineering
III. Bruun J., Pugliese L., Hoffmann C.C., Kjaergaard C., Solute transport in full
scale subsurface flow constructed wetlands and the effect on NO3 removal. Final manuscript
enclosed, not yet submitted.
IV. Pugliese, L., Bruun, J.D., Hoffmann, C.C., Langergraber, G., Kjaergaard, C., Non-
equilibrium bromide transport in full size subsurface flow constructed wetlands – A
modeling approach. In preparation.

_______________________________________________________________________________________
_______________________________________________________________________________________ II
Ph.D. thesis by Jacob Bruun
Table of contents
Summary IV
Sammendrag (summary in Danish) VIII
1. Introduction 1
1.1. Research objectives 4
1.2. Hydrology and hydraulics in subsurface woodchip-based permeable systems 5
1.3. Woodchip media – physical structure 6
1.4. Solute transport 7
1.5. Introduction to the biochemical processes in water-saturated wood-based
systems 8
2. Presentation of the main methods used in the Ph.D. thesis and the study site
for greenhouse gas and in situ solute transport investigations 9
2.1. Determination of physical filter media characteristics 9
2.2. Filter materials 11
2.3. Most optimal performing filter mixture - laboratory column experiments 11
2.4. Subsurface flow constructed wetland design 12
2.5. Tracer experiments 13
2.5.1. Analysis of tracer experiments 14
2.5.2. Laboratory tracer tests 14
2.5.3. Field-scale tracer tests 15
2.6. Gas fluxes 16
3. Main results 17
_______________________________________________________________________________________
_______________________________________________________________________________________ III
Ph.D. thesis by Jacob Bruun
3.1. Woodchip media - physical structure 17
3.2. Solute transport 18
3.2.1. Solute transport in woodchip based systems (laboratory-scale) 18
3.2.2. Solute transport in full-size treatment systems (field-scale) 19
3.2.3. Improving the solute transport in woodchip based treatment systems 21
3.2.4. Practical considerations 22
4. Denitrification in constructed reactive systems 22
4.1. Most optimal performing mixed woodchip media 24
4.2. Effect of solute transport in treatment performance 24
5. Greenhouse gas production and emission 27
5.1. Nitrous oxide 28
5.1.1. Nitrous oxide in European context 29
5.2. Methane 29
5.2.1. Methane in global context 31
5.3. The effect of the hydraulic design on greenhouse gas export 31
6. Concluding remarks and perspectives 32
7. References 35
8. Appendix I - Paper I 43
9. Appendix II - Paper II 66
10. Appendix II - Paper III 97

_______________________________________________________________________________________
_______________________________________________________________________________________ IV
Ph.D. thesis by Jacob Bruun
Dansk sammendrag
Kvælstofudvaskning fra landbrugsjord til overfladevand fører til eutrofiering og dermed en
forringelse af vandkvaliteten, samt tab af biodiversitet. Underjordiske dræn leder nitratrigt
drænvand direkte og hurtigt til overfladevand, hvilket resulterer i en ineffektiv rensningseffektivitet
som eksisterende begrænsningsmetoder, så som ripariske vådområder og buffer-zoner tilbyder, da
disse forbipasseres. Nye innovative tiltag inkluderer ”end-of-pipe” ”subsurface flow” konstruerede
vådområder, der består af en filtermatrice, der indeholder et træflis-baseret filter materiale.
Vådområderne bruger de naturligt forekommende mikroorganismer til at fjerne nitrat via
denitrifikation. Udfordringerne for træflis-baseret rensningsteknologier er talrige. Inkorporering af
mineralske materialer i træflisfiltre kan bidrage til at fastholde filterets struktur og de hydrauliske
egenskaber over tid, men kan også begrænse denitrifikationen og dermed effektiviteten af disse
systemer. End-of-pipe systemer på landbrugsarealer bliver udfordret af den stokastiske
drænafstrømning, hvilket kan hæmme denitrifikationen ved høje hydrauliske belastninger (dvs. høj
ilt belastning og kort tid til omsætning af nitrat (NO3)). Identifikation af tærskelværdier for den
hydrauliske belastning for denitrifikationen er vigtigt i forhold til dimensioneringen af fuldskala
konstruerede vådområder. I permeable filtersystemer bestående af groft granulært materialer, så
som træflis, påvirker den hydrauliske belastningsgrad desuden stoftransporten, som desuden kan
påvirke reduktionen af NO3. Derfor er forbindelsen mellem hydrologiske strømningsveje, den
hydrauliske belastningsgrad og nitrat fjernelse af særlig betydning i træflis-baseret konstruerede
vådområder. Også emissionen af drivhusgasser er en bekymring i træflis-baseret systemer.
Dokumentation af drivhusgasudledning er derfor nødvendig, hvis disse systemer skal
implementeres
De primære mål for dette Ph.D. studie var at undersøge indflydelsen af stoftransport (dvs. ikke-
ligevægtsstrømning) på NO3 reduktionen og vurdere relevante træflis-baseret medier i forhold til
NO3 reduktion. Ydermere blev drivhusgas produktionen og den efterfølgende emission fra flis-
baseret ”subsurface flow” konstruerede vådområder (SSF-CW) undersøgt.
De specifikke mål var at:
• undersøge stoftransporten i træflis-baseret filter matrix medier (Paper I)
• identificere og vurdere den bedste ydende træflis-baseret filter matrix medier til anvendelse i
(SSF-CWs), baseret på NO3 reduktion rater og effektivitet, samt stoftransporten (Paper I)
_______________________________________________________________________________________
_______________________________________________________________________________________ V
Ph.D. thesis by Jacob Bruun
• måle drivhusgas produktionen og emissionen i fuldskala SSF-CWs bestående af de bedste ydende
træflis-baseret filter matrix medier (Papir II)
• vurdere risikoen for metan og lattergas produktion og emission i SSF-CWS indeholder en træflis-
baseret filtermatrix (Paper II)
• undersøge faktorer, der kontrollerer metan og lattergas produktion og den efterfølgende emission
i træflis-baseret SSF-CWs (Paper II)
• undersøge effekten af retningen af konvektive strømningsveje (dvs. hydraulisk design) på
produktionen og emissionen af drivhusgasser fra træflis-baseret SSF-CWs (Paper II)
• undersøge stoftransporten i fuldskala træflis-baseret SSF-CWS (Paper III) vha. tracer metoder
• forbinde stoftransporten og strømningsvejene (dvs. ikke-ligevægts transport) til NO3 fjernelse
effektivitet mellem SSF-CWs med forskellig hydraulisk design (Paper III) vha. tracer metoder
I Papir I blev fire forskellige filterblandinger af træflis medier vurderet. De fire filterblandinger
indeholdte en mineralsk komponent, som enten var knuste muslingeskaller eller Filtralit. Det blev
vist, at blandinger der indeholdte knuste muslingeskaller førte til en større reduktion af NO3 end
blandinger indeholdende Filtralit som mineralsk komponent. Denne forskel var sandsynligvis på
grund af den alkaliserende virkning, som muslingeskallerne havde, hvilket resulterede i en højere
pH værdi, således pH var inden for det optimale område for denitrifikation. Desuden udviste alle
træflis blandinger ikke-ligevægtsstrømning, der også inkluderede en diffusionsdreven
masseudveksling mellem mobile og immobile domæner. Diffusionen ind i det immobile domæne
tillod reduktion og/eller fysisk tilbageholdelse af NO3 ved høje hydrauliske belastningen (HLR),
selv om iltede forhold var fremherskende i det mobile domæne. På grund af diffusionstransporten
ind i det immobile domæne var det ikke muligt, at bestemme den laveste hydraulisk opholdstid
(HRT) for denitrifikation i de træflis-baseret medier.
I Papir II, blev nettoproduktionen og emissionen af drivhusgasser målt fra seks felt-skala SSF-CWs
med forskellige hydraulisk design. Udledningen af lattergas var generelt ubetydelig. Derfor blev
eksporten af opløste gasser via effluenten anerkendt som den vigtigste eksportvej for lattergas. To
temporale ”hot spots” for høj lattergas eksport blev identificeret i april og december.
Nettoproduktion og emission af metan var på den anden side høj. Nettometanproduktionen og
emissionen var positivt korreleret med den hydrauliske belastning (dvs. den hydrauliske
opholdstid) og porevandstemperaturen i filter matricen. Retningen af den konvektive transport af
_______________________________________________________________________________________
_______________________________________________________________________________________ VI
Ph.D. thesis by Jacob Bruun
opløste gasser (dvs. hydraulisk design; horisontal-, vertikal op- og vertikal nedadgående
strømningsretning) kontrollerede eksportvejen af den netto producerede metan. Den opadgående
konvektive transport af opløste gasser fremmede en højere emission i de SSF-CWs med vertikal
opadgående strømningsretning, hvorimod den nedadgående konvektive transport af opløste gasser
hæmmede emissionen af gasserne i de to SSF-CWs med nedadgående strømningsretning. I SSF-
CWs med horisontal strømningsretning, var de årlige metanemissioner lavere end ved vertikal
nedgående strømningsretning og højere end ved vertikal opadgående strømningsretning.
Emissionen af lattergas fra de træflis-baseret SSF-CWs var lavere end rapporteret fra andre NO3
reduktions strategier (f.eks randzoner og ripariske vådområder), mens metanemissionen var
betydeligt højere. Når man vurderer drivhusgasemissionerne fra træflis-baseret systemer i
sammenligning med alternative NO3 begrænsningsmetoder, skal den høje NO3 reduktion rate i de
træflis-baseret systemer, og derved det betydeligt mindre areal disse systemer dækker, tages i
betragtning.
I Paper III var det tydeligt, at stoftransporten i de tre af de seks felt-skala SSF-CWs udviste ikke-
ligevægts karakteristika, med en diffusionsdrevet masseudveksling mellem mobile og immobile
domæner. En markant forskel mellem stoftransporten blev fundet mellem de forskellige
hydrauliske designs. Generelt udviste vertikal opgående strømningsretning den højeste grad af
ikke-ligevægtsstrømning. En hurtig genvinding af ≤50% af den tilførte tracer masse indikerede, at
porevandshastigheden i det mobile domæne i dette SSF-CW var relativt hurtigere end i de SSF-CW
med nedgående strømningsvej og det med horisontal strømningsvej. Den hurtigere transport af
opløste stoffer i det mobile domæne reducere den tid biokemiske processer kan reducere NO3. Men
en fraktion af de opløste stof opbevares i en længere tid det immobile domæne, på grund af den
diffusive masseudveksling mellem domænerne. Den kortere tid til biokemiske processer i det
mobile domæne blev afspejlet i de lavere NO3 fjernelse rate i det SSF-CW med opadgående
strømningsretning. Men selv om den længere opholdstid i immobile domæne burde give øge den
generel reduktion af NO3, den relativt langsomme diffusionstransport af NO3 begrænset
sandsynligvis denitrifikationen i det immobile domæne. Den langsomme stof udveksling til et
relativt større immobile domæne i up-flow, sammenlignet med de andre SFF-CWS kan også
forklare den højere, dog ikke signifikante, netto metan produktion observeret i Paper II, som
relativt større immobile domæne potentielt fungerede som en kilde til metan. Det SSF-CWs med
nedadgående strømningsretning demonstrerede de højeste NO3 fjernelse rater. Dette blev
tilskrevet den langsommere genvinding af ≤50% af den tilførte tracer masse, hvilket indikerede en
langsommere pore-vand-hastighed, og dermed øget tiden for denitrifikation i den mobile domæne.

_______________________________________________________________________________________
_______________________________________________________________________________________ VII
Ph.D. thesis by Jacob Bruun
English summary
Nitrogen leaching from agricultural areas to surface waters leads to eutrophication and
consequently degradation of water quality and loss of biodiversity. Subsurface tile drains direct
nitrate (NO3) loaded drainage water directly and more rapidly to surface waters, resulting in
inefficient water treatment by existing measures such as riparian wetlands and buffer strips, as
these are bypassed. New innovative approaches consist of end-of-pipe subsurface flow constructed
wetlands, with a filter matrix consisting of woodchip-based media. The wetlands use the naturally
occurring denitrifying organisms to remove nitrate via denitrification. The challenges for nitrate
removing technologies using woodchips are numerous. In woodchip media, introduction of
supporting (i.e. mineral) materials can help to maintain structure and flow properties over time,
but may also limit the denitrification and thus the treatment efficiency of these systems. End-of-
pipe systems in the agricultural areas are challenged by event driven drainage discharges, impeding
the denitrification by high hydraulic loading rates (i.e. oxygen loads and short time of NO3
consumption). Identification of threshold values for the hydraulic loading rate limiting the
denitrification is therefore essential in the construction of field-scale systems. In coarse granular
permeable filter systems, such a woodchip-based filter matrixes, the hydraulic loading rate
additionally affect the solute transport of the flowing water, which can significantly affect the
reduction of NO3. Thus, the linkage between hydrological flow paths, hydraulic loading rate and
nitrate removal is of particular importance in woodchip-based treatment systems. Finally, the
production and emission of greenhouse gases are a concern in woodchip-based systems. Thus,
documentation of the contribution of greenhouse gases is needed before implementing such
systems.
The main objectives of this Ph.D. were to investigate the influence of solute transport paths (i.e.
non-equilibrium solute transport) on NO3 reduction and to assess relevant woodchip-based media
in terms of NO3 reduction. Further topics addressed were the greenhouse gas production and
subsequent emissions from woodchip-based subsurface flow constructed wetlands (SSF-CW).
Specifically the objectives were to:
investigate the solute transport in woodchip-based filter matrix media (Paper I)
identify and assess the best performing woodchip-based filter matrix media, based on NO3
reduction rate and efficiency and the solute transport patterns, for use in SSF-CWs (Paper I)

_______________________________________________________________________________________
_______________________________________________________________________________________ VIII
Ph.D. thesis by Jacob Bruun
measure the greenhouse gas production and emission in a full scale SSF-CWs consisting of the
best performing woodchip-based filter matrix media (Paper II)
assess the risk of methane and nitrous oxide production and methane and nitrous oxide
emission in woodchip-based SSF-CWs (Paper II)
investigate factors controlling methane and nitrous oxide production and subsequent methane
and nitrous oxide emission in woodchip-based SSF-CWs (Paper II)
investigate the effect of the direction of the convective flow path (i.e. hydraulic design) on
greenhouse gas production and emission from woodchip-based SSF-CWs (Paper II)
investigate the transport of anions in full-scale woodchip-based SSF-CWs using tracer
additions methods (Paper III)
link the solute transport paths (i.e. non-equilibrium transport) to NO3 removal efficiency
among SSF-CWs with different hydraulic design using tracer additions methods (Paper III)
In Paper I four different woodchip media mixtures, including a mineral component which was
either crushed seashells or Filtralite, were investigated. It was shown that mixtures containing
crushed Seashells lead to a larger reduction of NO3 than mixtures containing Filtralite as the
mineral material. The higher N removal rate observed in the Seashell mixtures were most likely
due to the alkalising effect of the Seashells, as compared to Filtralite, resulting in a higher pH,
affecting the denitrification. In addition, non-equilibrium solute transport was demonstrated for all
woodchip mixtures, also demonstrating a diffusional mass exchange between a mobile and an
immobile domain. The mass exchange by diffusion into the immobile domain allowed reduction
and/or physical retention of NO3 at high hydraulic loading rates (HLRs) even though oxic
conditions predominated in the mobile pores. Due to the diffusional mass exchange into the
immobile domain, it was not possible to determine a lower threshold hydraulic residence time
(HRT) for denitrification in the woodchip media mixtures.
In Paper II, the net production and emission of greenhouse gasses from six field-scale SSF-CWs
with different hydraulic design were measured. Emissions of nitrous oxide were generally
negligible; thus, the export of dissolved gases via the effluent was recognised as the main export
pathway for nitrous oxide. Two temporal hot spots for nitrous oxide export were identified in April
and December. The net production and emission of methane were, on the other hand high. Net
methane production and methane emission was positively correlated to the hydraulic residence

_______________________________________________________________________________________
_______________________________________________________________________________________ IX
Ph.D. thesis by Jacob Bruun
time and the filter matrix pore water temperature. The direction of the convective transport of
dissolved gases (i.e. hydraulic design; horizontal-, vertical up- and vertical down-flow) controlled
the fate of the methane produced. In the vertical up-flow SSF-CWs, emissions constituted the
largest methane export pathway due to the upward convective transport of dissolved methane,
whereas only a minor fraction (23%) of the totally net produced methane was exported as dissolved
methane with the effluent. In the vertical down-flow SSF-CW the main methane export pathway
was as dissolved methane in the effluent, whereas only a minor fraction was emitted (12%). In the
horizontal flow SSF-CW, the horizontal dissolved gas transport resulted in a medium methane
emission (yearly emissions were in between those of the two other hydraulic designs).
The emission of nitrous oxide from the woodchip-based SSF-Cs was lower than reported from
other NO3 mitigation strategies (e.g. buffer-strips and riparian wetlands), whereas methane
emissions from the woodchip-based SSF-CWs were considerable higher. When considering the
GHG emissions for woodchip-bases systems, the substantially high NO3 reduction rate in the
woodchip-based systems, and thus the significantly smaller area these systems comprise in
comparison alternative strategies need to be taken into account.
In Paper III, clear non-equilibrium solute transport, including a diffusional mass exchange
between mobile and immobile domains was found in three field-scale SSF-CWs. A distinct
difference between the solute transport among the hydraulic designs was found. Generally, the
vertical up-flow design demonstrated the highest degree of non-equilibrium transport. A fast initial
tracer mass recovery (≤50%), suggested a relative faster pore-water velocity, as compared to the
down-flow and horizontal flow SSF-CWs thus suggesting that a smaller fraction of the water-filled
pores contributed to the convective solute transport. While a faster transport of solutes in the
mobile domain reduce the time available for biochemical processes, a fraction of the solute was
retained for a longer time in the immobile domain, due to diffusive mass exchange between
domains. The shorter time for biochemical processes in the mobile pores were reflected by lower
NO3 removal rates in the up-flow SSF-CW. And even though, a longer time solute residence time in
the immobile domain suggest sufficient time for reductive process to consume NO3, the relatively
slow diffusional transport of NO3 most likely limited the denitrification kinetics in the immobile
domain. The slow solute exchange into a relatively larger immobile domain in the up-flow, as
compared with the other SFF-CWs, may also explain the higher, though not significantly, net
methane production observed in Paper II, as the relatively larger immobile domain potentially
acted as a source of methane. The down-flow SSF-CWs demonstrated the highest NO3 removal

_______________________________________________________________________________________
_______________________________________________________________________________________ X
Ph.D. thesis by Jacob Bruun
rates, which were attributed to the slower recovery of the initial tracer mass (≤50%), implying
slower pore-water velocities, and thus increased the time for denitrification in the mobile domain.
_______________________________________________________________________________________
_______________________________________________________________________________________ 1
Ph.D. thesis by Jacob Bruun
1. Introduction
Nitrogen (N) is an essential nutrient for all living organisms. However, excess N in aquatic
ecosystems can cause eutrophication (Carpenter et al., 1998). The consequences of eutrophication
are numerous and include hypoxia, degradation of water quality and loss of biodiversity (Carpenter
et al., 1998; Smith et al., 1999). It is possible to reverse eutrophication by decreasing the N input in
the aquatic ecosystem (Carpenter et al, 1998).
Agriculture is considered as the single major N source to surface waters (Carpenter et al., 1998;
Kronvang et al., 2009). Application of inorganic N fertilizer and liquid manure in excess of plant
demands increases the N transfer to aquatic ecosystems (Galloway et al., 1995; Howarth et al.,
1996). The use of fertilizers has increased worldwide; the consumption has more than tripled
between 1961 and 1999 (FAO, 2003) and is expected to increase to support the growing world
population (FAO, 2003; Vitousek et al., 1997). Nitrogen from agricultural areas enters the ground
and surface waters, primarily as nitrate (NO3) (Fausey et al., 1995; Kovacic et al., 2000; Lowrance
et al., 1997).
In the European Union, the Water Framework Directive (WFD) (Directive 2000/60/EC) has been
adopted to mitigate the excessive loss of nutrients to the aquatic ecosystems and requires member
states to obtain “good ecological quality” in their water bodies. In Denmark a series of national
action plans have been implemented since the mid-1980’s, with a positive effect on the N-loss to
the aquatic environment (Kronvang et al., 2005). Measures to reduce agricultural N loss include
buffer strips (Hill et al., 1996; Nelson et al., 1995) and riparian wetlands (Hoffmann and Baattrup-
Pedersen, 2007).
In the cultivated land, concentrated discharges occur through subsurface tile drains (Dinners et al.,
2002) directing NO3 loaded drainage water directly and more rapidly to the receiving surface
waters (Fausey et al., 1995). In Denmark, cultivated land covers 62% of the landscape and a large
proportion (> 50%) is artificially drained by subsurface tile drains which are responsible for 54-62
% of the total annual agricultural N loss (Blicher-Mathiesen et al., 2012). Thus, subsurface drains
must be considered a significant source of N to surface waters. In addition to NO3, being the
primary N source, drainage water is also typically rich in O2 and low in carbon (C). Furthermore, in
contrast to, for example wastewater, drainage flow and pollution concentrations from agricultural
areas are event driven (Baker, 1992), resulting in a temporal variation in water and nutrient
loading and consequently periods of transient flow. For strategies such as buffer strips and riparian
wetlands to function, drainage water must pass through them before entering the receiving waters,
thus concentrated discharge via subsurface tile drains may cause these mitigation strategies to be
ineffective. Therefore, it is necessary to find and apply innovative approaches for reduction of the
NO3 transport to surface waters via subsurface drains. In natural ecosystems NO3 can be
_______________________________________________________________________________________
_______________________________________________________________________________________ 2
Ph.D. thesis by Jacob Bruun
transformed and retained by several mechanisms (e.g. dissimilative nitrate reduction to ammonia,
anammox and assimilation). However, the process of heterotrophic denitrification is the only
permanent removal mechanism for NO3 (i.e., the atmosphere).
Constructed wetlands (CW) are treatment units designed and optimized to enhance the
biogeochemical processes (e.g. denitrification) found in natural ecosystems. In the last five
decades, CWs have received much attention due to their successful treatment of wastewater in
order to reduce point source pollution of surface waters (Vymazal, 2011), but they also have the
potential to trap non-point source pollution in agricultural watersheds before it reaches vulnerable
water bodies (Reinhardt et al., 2006). Most CWs targeting agricultural drainage discharge have
been surface flow (SF)-CWs (Koskiaho et al., 2003; Kovacic et al., 2000; Reinhardt et al., 2006;
Tanner et al., 2005; Thiere et al., 2011). In SF-CWs removal of NO3 is thought to be a function of
hydraulic loading rate and the water hydraulic residence time (HRT) typically controlled by the
watershed to wetland ratio (Koskiaho et al., 2003; Kovacic et al., 2000). As farmers strive to put a
minimum area of land out of production in order to protect the surface water quality, efficiency of
mitigation measures should be optimised. An additional way of controlling the NO3 removal
efficiency of CWs is by increasing the NO3 removal rate of a specific volume of wetland. In this
respect, subsurface flow CWs (SSF-CW), mostly known from wastewater treatment (Vymazal,
2009) may prove superior to SF-CWs due to the increased contact surface area between the
percolating water and the substrate. SSF-CWs are usually confined within a well-defined space
typically defined by a clay or synthetic liner (Kadlec and Wallace, 2008). The heart of the SSF-CW
is the filter matrix, usually water saturated, in which the percolating water comes into contact with
a network of oxic and anoxic zones (Vymazal, 2009), facilitating both oxidative and reductive
biochemical processes. The filter matrix in SSF-CWs is typically comprised of gravel, sand or local
soils (Kadlec and Wallace, 2008; Schierup et al., 1990).
In the recent three decades focus has been on the application of innovative technologies using
permeable carbon based filters for treatment of wastewater (Dalahmeh et al., 2011; Domingos et
al., 2009; Lens, 1994) but also for treatment of agricultural NO3 loss (Schipper et al., 2010;
Warneke et al., 2011a; Warneke et al., 2011b). Examples of such permeable filters include
denitrification walls (Jaynes et al., 2008; Robertson and Cherry, 1995; Schipper and Vojvodic-
Vukovic, 1998), denitrifying beds (Bowles et al., 1994; Robertson et al, 2005; Robertson et al.,
2009; Robertson and Merkley 2009; Warneke et al., 2011a), streambed reactors (Elgood et al.,
2010; Van Driel et al., 2006a, b) and denitrifying layers (Robertson and Cherry, 1995; Schipper and
McGill, 2008).
The above-mentioned technologies may differ in designs, but they all rely on organic substrates
(e.g. straw, maize cobs, cardboard, sawdust, green waste and woodchips) for stimulating the

_______________________________________________________________________________________
_______________________________________________________________________________________ 3
Ph.D. thesis by Jacob Bruun
heterotroph activity (e.g. denitrification) (Cameron and Schipper 2010; Greenan et al., 2006;
Robertson, 2010; Warneke et al., 2011a; Warneke et al., 2011b). Generally, highly labile carbon
sources (e.g. saw dust, maize cobs, straw) tend to facilitate higher NO3 reduction rates, but the
longevity of such carbon sources is short due to depletion of available carbon (Cameron and
Schipper, 2010; Greenan et al., 2006). Thus, usage of woodchips is ideal for denitrifying SSF-CWs
targeting agricultural drainage discharge. Introduction of supporting non-carbon (mineral)
materials to help retain structure and flow properties over time has been suggested as long as C is
not limiting the denitrification (Christianson et al., 2010). Mineral materials such as light expanded
clay aggregates (LECA) have been widely used in constructed water treatment systems (Kadlec and
Wallace, 2008) and as supporting materials in wood-based systems (Herbert, 2011). Additionally,
the use of crushed Seashells has been used in laboratory experiments (e.g. Canga et al., 2015;
Suliman et al., 2006a). Common to these two types of mineral materials, is that they are highly
porous (θtot = 0.66) (Canga et al., 2015), and may in addition have a large surface area, which may
facilitate the growth of biofilms. The growth of biofilms may furthermore promote biochemical
processes.
Biochemical processes (e.g. denitrification) in organic-based (e.g. woodchip) matrix systems, may
be limited to reductive micro-environments (Hebert, 2011). Woodchip media consist of a dual
porous structure including a primary porosity, constituting a convective (mobile) domain, and a
secondary porosity, constituting a non-convective (immobile) domain (Cameron et al., 2012). The
establishment of preferential flow paths (non-equilibrium solute transport) in woodchip-based
systems as a consequence of the contrasting domains (i.e. mobile and immobile domains), may
lead to low treatment performance. At non-equilibrium solute transport, the mass exchange
between domains (i.e. supply of NO3 to micro-environments) is restricted to diffusion (Van
Genuchten and Wierenga, 1976). Thus, the diffusion rate of NO3 (mass transfer rate) into reductive
microenvironments may be of great importance in permeable woodchip-based denitrifying systems
(Herbert, 2011). The linkage between hydrological flow paths, HRT and NO3 removal efficiency is
of particular importance for denitrifying carbon based systems (Schipper et al., 2010).
Despite the relevance of greenhouse gas (GHG) production and emission in mitigation measures,
only few studies have focused on the adverse effects of GHG production from reactive systems
(Elgood et al., 2010; Greenan et al.; 2006; Healy et al., 2012; Warneke et al., 2011a; Woli et al.,
2010) and even fewer on the direct emission of GHGs (Warneke et al., 2011a). In NO3 removing
systems, the most likely GHG to be produced is nitrous oxide (N2O) (Warneke et al. 2011a), a
potent greenhouse gas with a global warming potential (GWP) of 298 CO2 equivalents. In addition,
N2O can catalyse the destruction of ozone (Vitousek et al., 1997). Even though most researchers
have reported low net production and emission of N2O from reactive systems (Elgood et al. 2010;

_______________________________________________________________________________________
_______________________________________________________________________________________ 4
Ph.D. thesis by Jacob Bruun
Healy et al., 2012; Woli et al., 2010), high emissions has also been reported (Warneke et al. 2011a).
Several studies have also reported elevated production of methane (CH4) (Elgood et al., 2010;
Moorman et al., 2010), a GHG with a GWP of 25 CO2 equivalents (IPCC, 2007). In a woodchip
based streambed reactor CH4 emission, up to five times higher than what has been found in
cultivated fields or natural wetlands soils/sediments have been reported (Elgood et al., 2010; Le
Mer and Roger, 2001). Thus, despite a promising potential of woodchips in filter mixtures in SSF-
CWs, the production and subsequent emission of GHGs, may render such systems unattractive for
use as mitigation measures.
1.1 Research objectives
The overall objective of this Ph.D. thesis was to assess the application of denitrifying woodchip-
based SSF-CWs in targeting the agricultural drainage discharge. Sub-objects were determination of
the most optimal performing filter media for denitrification, including an assessment of the effect
of solute transport paths (i.e. non-equilibrium transport), and elucidation of potential greenhouse
gas production and subsequent export, either as dissolved gas in the effluent or emitted to the
atmosphere, from the woodchip filter media.
The specific objectives of the thesis were to:
investigate the solute transport in woodchip media (Paper I)
find and assess the best performing woodchip-based filter matrix media, based on NO3
reduction rate and efficiency and the solute transport patterns, for use in subsurface flow
constructed wetlands (SSF-CWs) (Paper I)
measure the greenhouse gas production in a full scale SSF-CW amended with the best
performing woodchip-based filter matrix media (Paper II)
assess the risk of CH4 and N2O emission and production in SSF-CWs containing a woodchip-
based filter matrix substrate (Paper II)
investigate factors controlling CH4 and N2O production and subsequent emission (Paper II)
investigate the effect of the direction of the convective flow path (i.e. hydraulic design) on
greenhouse gas emission and production (Paper II)
investigate the solute transport in full-scale woodchip-based SSF-CWs (Paper III)
link the solute transport paths (i.e. non-equilibrium) to NO3 removal efficiency among SSF-
CWs with different hydraulic design (Paper III)

_______________________________________________________________________________________
_______________________________________________________________________________________ 5
Ph.D. thesis by Jacob Bruun
1.2 Hydrology and hydraulics in subsurface woodchip-based permeable systems
In the Ph.D. thesis, most work was conducted using woodchip-based SSF-CWs, but the hydraulic
nomenclature apply to various types of subsurface systems, including reactive filters (i.e.
denitrifying beds and stream bed reactors). The engineering designs of the various reactive filters
differ, involving drainage discharge (denitrifying beds), groundwater flow (denitrifying walls) and
stream water flow, (Streambed reactor) (see Schipper et al., 2010). The combinations of these
reactive filters and woodchip-based SSF-CWs will in this Ph.D. thesis henceforth be termed
‘constructed reactive systems’ (CRS).
The success or failure of a CRS is dependent on water flows, which control the water residence time
and thus the time for biochemical processes to occur. CRS are typically closed systems restricted
from adjacent water systems by synthetic barriers (Schipper et al., 2010). Thus, water flows in CRS
are well-defined by an influent water transport entering the CW and an effluent water transport
leaving the systems (excluding denitrifying walls and stream bed reactors). Under ideal conditions,
the influent and the effluent flow rates (Q) are equal. Deviations from ideal conditions include
infiltration/exfiltration of water with adjacent systems but also the loss of water to the atmosphere
by evaporation and if vegetated evapotranspiration (Kadlec and Wallace, 2008). The influent flow
rate (Qi) controls the load of water to the system and can be translated into the hydraulic loading
rate (HLR), which for horizontal flow subsurface systems is defined by Kadlec and Wallace (2008)
as:
𝑞 = Q𝑖
𝐿𝑊
where, q = hydraulic loading rate (m d-1), L = wetland length (m), W = wetland width (m) and Qi =
inlet water flow rate (m3 d-1). For vertical flow systems L is replaced by the height (h) (m) of the
system.
In the granular media of CRS water transport (i.e. transport of solutes) occurs through a network of
interconnected water-filled pores constituting a water filled pore volume (V0)). The V0 is defined
as:
𝑉0 = 𝜃𝑡𝑜𝑡𝑉𝑡𝑜𝑡 = 𝜃𝑡𝑜𝑡 (𝑊𝐿ℎ)
where, Vtot is the total volume of the system (𝐿𝑊ℎ) (m3) and is θtot the total porosity.
The θtot is further defined as:
𝜃𝑡𝑜𝑡 = (𝑀𝑤𝑒𝑡 − 𝑀𝑑𝑟𝑦
𝑀𝑑𝑟𝑦)ρ𝑏
where Mwet= the material wet weight (kg), Mdry= the material dry weight (kg) and ρb = the bulk
density (kg m-3). The porosity may further be divided into a micro- (θ<30) and a macro-porosity
_______________________________________________________________________________________
_______________________________________________________________________________________ 6
Ph.D. thesis by Jacob Bruun
(θ≥30). According to the classification from USDA micro-porosity constitutes pores < 30 µm in
diameter and macro-porosity pore sizes ≥30 µm, hence the acronyms θ<30 and θ≥30. The
combination of θ<30 and θ≥30 is equal to the θtot.
An important factor of the CRS hydrology, in terms of treatment efficiency, is the residence time of
the flowing water. In this respect, it is convenient to work with the nominal detention time (τn). τn
is defined by Kadlec and Wallace (2008) as:
τ𝑛 = 𝑉0
Q𝑖
A commonly used term for the τn, is hydraulic residence time (HRT) (Kadlec and Wallace, 2008). It
is clear from numerous studies that the actual solute residence time can differ substantially from
the HRT (e.g. Cameron and Schipper, 2012; Herbert, 2011; van Driel et al., 2006a) as a
consequence of preferential flow paths, (i.e. non-equilibrium solute transport) in the filter matrix.
Non-equilibrium transport is dependent on the physical structure of the filter matrix.
1.3 Woodchip media - physical structure
Woodchips used in research studies are generally irregular in shape, may be either hardwood or
softwood (e.g. Cameron and Schipper 2010; Gibert et al., 2008; Greenan et al., 2006; Bruun, 2011)
and vary in size from < 2 mm to > 60 mm (e.g. Cameron and Schipper 2012; van Driel et al.,
2006a). The heterogeneity of woodchip media have been demonstrated by a broad grain size
distribution (Chun et al., 2009), and also indicated by a large standard deviation Cameron and
Schipper (2012). Woodchip media are characterised
by a dual porous structure, i.e. include both a macro-
and a micro-porosity, frequently termed ‘primary’
and ‘secondary’ porosity, respectively. Macro-
porosity, typically defined by gravitational drainage,
ranging between 0.44-0.65 m3 m-3 (Cameron and
Schipper, 2012; Robertson, 2010), while micro-
porosity, defined by drying (drying method varying
among studies) range between 0.20-0.47 m3 m-3
(Cameron and Schipper, 2012; Robertson, 2010,
Herbert, 2011).
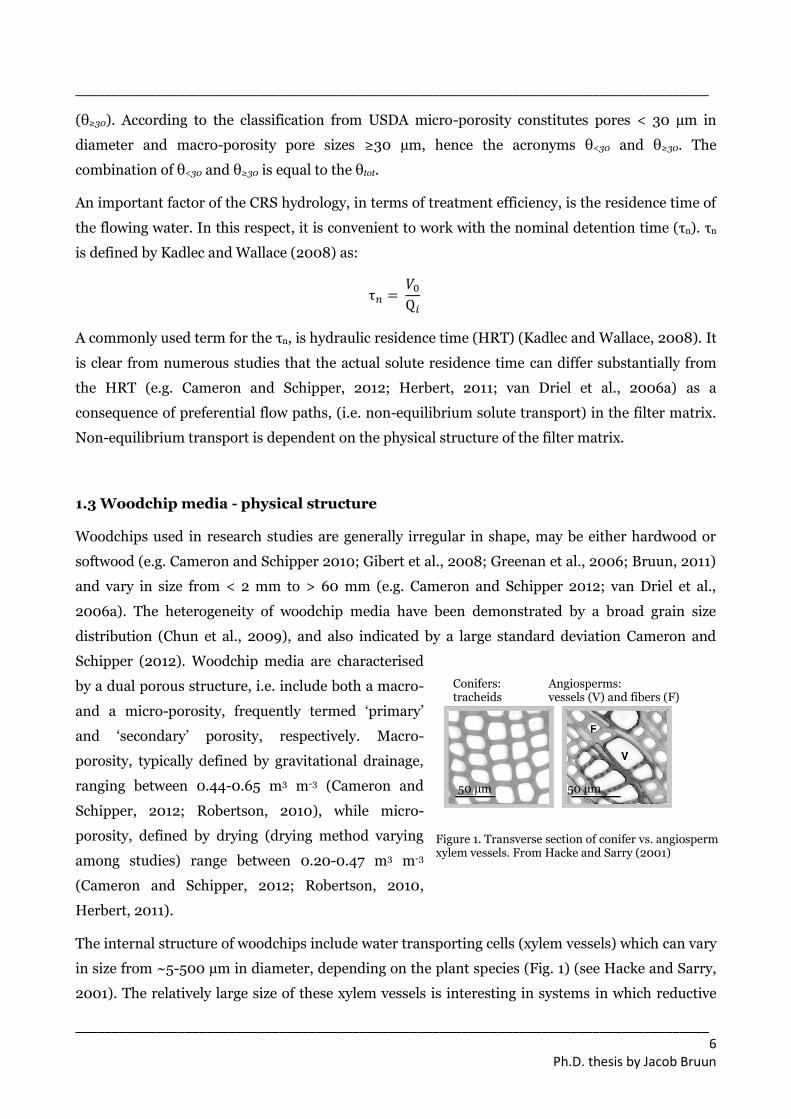
The internal structure of woodchips include water transporting cells (xylem vessels) which can vary
in size from ~5-500 µm in diameter, depending on the plant species (Fig. 1) (see Hacke and Sarry,
2001). The relatively large size of these xylem vessels is interesting in systems in which reductive
Figure 1. Transverse section of conifer vs. angiosperm xylem vessels. From Hacke and Sarry (2001)
50 µm
Conifers: tracheids
Angiosperms: vessels (V) and fibers (F)
50 µm
_______________________________________________________________________________________
_______________________________________________________________________________________ 7
Ph.D. thesis by Jacob Bruun
processes (e.g. denitrification) may be restricted to micro-sites. Bacteria facilitating denitrification
varying in size and can be down to ~1-2 µm in length (Deguchi et al., 2011). Given the size of the
xylem vessels, these bacteria may easily reside in the xylem vessels. In support, Robertson (2010)
suggested that microorganisms might have resided in the intra-granular pores in woodchips used
in their NO3 reduction experiment, indicated by a dark rim covering much of the woodchip volume.
If microorganisms are present within the intra-granular pore space of woodchips, they rely on the
transport of solutes (i.e. substrate) to sustain their existence.
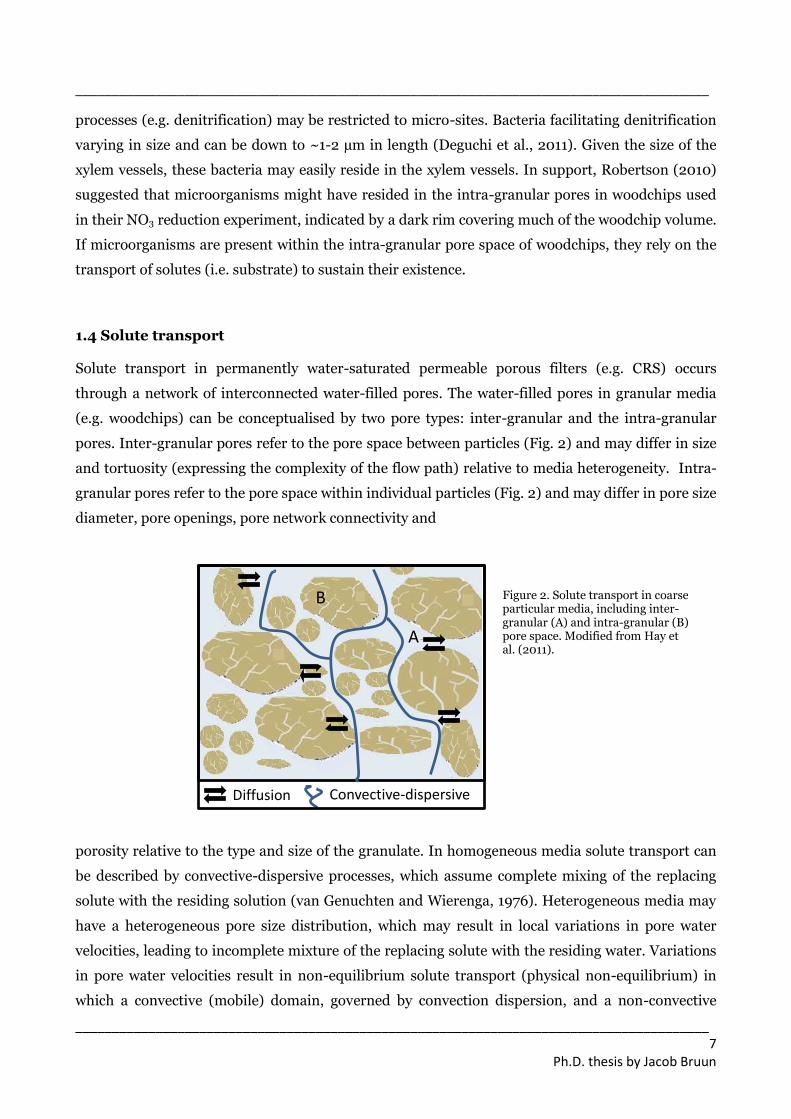
1.4 Solute transport
Solute transport in permanently water-saturated permeable porous filters (e.g. CRS) occurs
through a network of interconnected water-filled pores. The water-filled pores in granular media
(e.g. woodchips) can be conceptualised by two pore types: inter-granular and the intra-granular
pores. Inter-granular pores refer to the pore space between particles (Fig. 2) and may differ in size
and tortuosity (expressing the complexity of the flow path) relative to media heterogeneity. Intra-
granular pores refer to the pore space within individual particles (Fig. 2) and may differ in pore size
diameter, pore openings, pore network connectivity and
porosity relative to the type and size of the granulate. In homogeneous media solute transport can
be described by convective-dispersive processes, which assume complete mixing of the replacing
solute with the residing solution (van Genuchten and Wierenga, 1976). Heterogeneous media may
have a heterogeneous pore size distribution, which may result in local variations in pore water
velocities, leading to incomplete mixture of the replacing solute with the residing water. Variations
in pore water velocities result in non-equilibrium solute transport (physical non-equilibrium) in
which a convective (mobile) domain, governed by convection dispersion, and a non-convective
B
A
Diffusion Convective-dispersive
Figure 2. Solute transport in coarse particular media, including inter-granular (A) and intra-granular (B) pore space. Modified from Hay et al. (2011).
_______________________________________________________________________________________
_______________________________________________________________________________________ 8
Ph.D. thesis by Jacob Bruun
(immobile) domain in which solute transport is restricted to diffusion exist (van Genuchten and
Wierenga, 1976) (Fig. 2). In granular media, the immobile domain may include intra-granular
pores. The diffusional transport into these pores is termed intra-granular diffusion (Wood et al.,
1990). The apparent effect of intra-granular diffusion is dependent on granulate size, the pore
water velocities affecting the diffusion path length and the time available for diffusion (Rao et al.,
1980). Intra-granular diffusion may elongate the solute residence time and supply intra-granular
residing organisms with solutes.
In saturated subsurface systems the internal solute transport is critical to understanding
biochemical processes (Kadlec and Wallace, 2008).
1.5 Introduction to the biochemical
processes in water-saturated wood-
based systems
Permanent water-saturated conditions
typically prevail in CRS. Thus, the
processes in the following therefore refer to
water saturated systems.
CRS are usually composed of one or several
organic compounds. In highly C-rich
environments, heterotrophic degradation of
organic matter is the main energy yielding
process for microorganisms.
Biogeochemical reactions are governed by
the laws of thermodynamics. Thus,
microorganisms using the energetically
most favourable electron acceptor are
favoured. Generally, the order of preferred
electron acceptors is: O2 > NO3 > Mn(IV) >
Fe(III) > SO4 > CH3OOH and H2 (Reddy
and Delanue, 2008). Aerobic respiration
(O2 consumption) in CRS is generally high (Gibert et al., 2008; Robertson, 2010; Robertson et al.,
2009), and typically restricted to the inlet end of the filters (Gibert et al., 2008; van Driel, et al.,
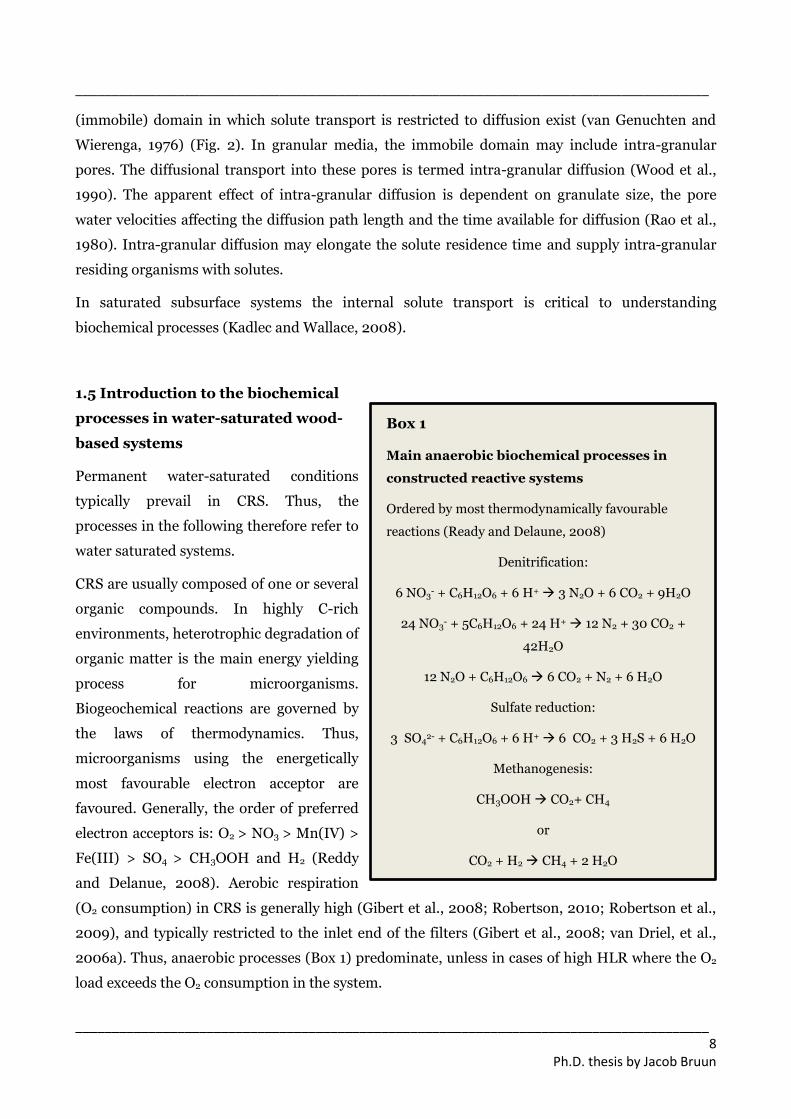
2006a). Thus, anaerobic processes (Box 1) predominate, unless in cases of high HLR where the O2
load exceeds the O2 consumption in the system.
Box 1
Main anaerobic biochemical processes in
constructed reactive systems
Ordered by most thermodynamically favourable
reactions (Ready and Delaune, 2008)
Denitrification:
6 NO3- + C6H12O6 + 6 H+ 3 N2O + 6 CO2 + 9H2O
24 NO3- + 5C6H12O6 + 24 H+ 12 N2 + 30 CO2 +
42H2O
12 N2O + C6H12O6 6 CO2 + N2 + 6 H2O
Sulfate reduction:
3 SO42- + C6H12O6 + 6 H+ 6 CO2 + 3 H2S + 6 H2O
Methanogenesis:
CH3OOH CO2+ CH4
or
CO2 + H2 CH4 + 2 H2O
_______________________________________________________________________________________
_______________________________________________________________________________________ 9
Ph.D. thesis by Jacob Bruun
Thermodynamically, in the absence of O2, nitrogen oxides are the most preferable electron
acceptors by facultative bacteria (Reddy and Delaune, 2008). Reduction of NO3 via heterotrophic
denitrification - the microbial facilitated process that reduces NO3 or NO2 to N2O or N2 (Box 1)
(Tiedje, 1982) - is recognised as the dominant mechanism in CRS (Greenan et al., 2006, Gibert et
al., 2008). Even though NO3 may be produced in oxic sites by nitrification (the oxidation of
ammonium (NH4) to NO3), the predominantly anaerobic conditions favour denitrification (Tiedje,
1982), resulting in a net reduction of NO3. Thus, the main source of NO3 comes from the influent,
typically feed by drainage discharge (SSF-CWs and Denitrifying beds), by stream water flow
(Streambed reactors) or by ground water (denitrifying walls).
If NO3 concentrations are low, reduction of Mn(IV), Fe(III) or SO4 can occur. For several field-scale
CRS a smell of rotten eggs at low HLRs has been reported (Wareneke et al., 2011a; Herbert, 2011),
indicating reduction of SO4 to hydrogensulfid (H2S).
Upon depletion of the more favourable electron acceptors (i.e. O2, NO3, Mn(IV) , Fe(III) , SO4),
organic compounds can be degraded by methanogenic microorganisms, resulting in the production
of CH4 (methanogenesis). Methanogens are anaerobic microorganisms (strict anaerobes) that use
acetate or H2 as electron acceptor (Box 1) (Le Mer and Roger, 2001).
2. Presentation of the main methods used in the Ph.D. thesis and the study site for
greenhouse gas and solute transport investigations.
In this thesis a combination of laboratory and in situ experiments were conducted to achieve the
objectives. In situ experiments were conducted in six SSF-CWs built as a part of the SUPREME-
TECH project (www.supremetech.dk).
2.1 Determination of physical filter media characteristics
Grain size distribution (GSD) were obtained from dried (80 ˚C for 72 hours) filter column
materials, and which were sieved with sieves with mesh sizes 2, 4, 8, 16, 32 mm. The mass of the
filter material retained by the sieves relative to the total filter material mass were used to estimate
D10, D50, D60 and D90 values in which Dx indicate grain size at which x% of the total filter material
mass (g) is finer than.
Uniformity coefficient (Uc) indicates the degree of uniformity of a GSD and was calculated as:
𝑈𝑐 = 𝐷60
𝐷10
_______________________________________________________________________________________
_______________________________________________________________________________________ 10
Ph.D. thesis by Jacob Bruun
where, D60 and D10 represents the grain sizes at which 60 and 10% of the total filter material mass
is finer than, respectively.
Pore size distribution (PSD) were obtained from the water retention characteristics, by
measuring the gravimetric water content on three replicate columns (1508 cm3) placed on 1 bar HF
pressure plate cells (3000 CP00 (30100), PQ Potters Europa, Kirchheimbolanden, Germany) at
pressure potentials (ψ) of -5, -15, -25, -50 and -100 cm from the column bottom. Gravimetric water
content was converted to volumetric water content by subtracting the sample dry weigh (dried at
80 ˚C for 72 hours). Assuming that the capillary theory applies to these coarse granular filters the
equivalent pore diameters (d) were estimated at each ψ.
Specific surface area (SSA) may be measured by two experimental approaches. One approach,
based on direct physical measurements typically involves the use of electron microscopy or x-ray
diffraction techniques to determine the shapes and the dimensions of individual particles (Pennell,
2002). The most common, approach used to determine the SSA is based on measurements of the
adsorption or retention of probe molecules on a solid surface at monolayer coverage (e.g. the
Brunauer-Emmett-Teller (BET) method (SSABET) and the ethylene glycol monoethyl ether (EGME)
adsorption method) (SSAEGME) (Pennell, 2002). The BET method, however, underestimates the
intra-granular pore surface in materials where pore < 2 nm and complex pore structures exist
(Makris et al., 2004). The SSAEGME of various filter materials are typically larger than SSABET
(Canga et al., 2015), thus accounting for a larger fraction of the pores. The EGME method was
applied in this Ph.D. thesis, using a modified protocol provided by Carter (1986). The modifications
involved an extended time (14 days) for saturation of the materials in the EGME solution.
Intra-granular diffusion in woodchips was assessed using two tracer solutes (3H2O and Br) in
a diffusion experiment. The experiment lasted ~28 days in which brown bottles with snaplids,
containing 20.0 g (wet weight) of woodchips and 75 ml tracer solution (constantly stirred (70
rpm)) were continuously sampled (Paper III). The relative change in inter-granular tracer
activity/concentration was assumed to reflect the intra-granular diffusion in the woodchips. In
addition, to assess the effect of particle size on the intra-granular diffusion the woodchips were
fractionised into particle size intervals of 4-8, 8-16 and 16-32 mm.
_______________________________________________________________________________________
_______________________________________________________________________________________ 11
Ph.D. thesis by Jacob Bruun
2.2 Filter materials
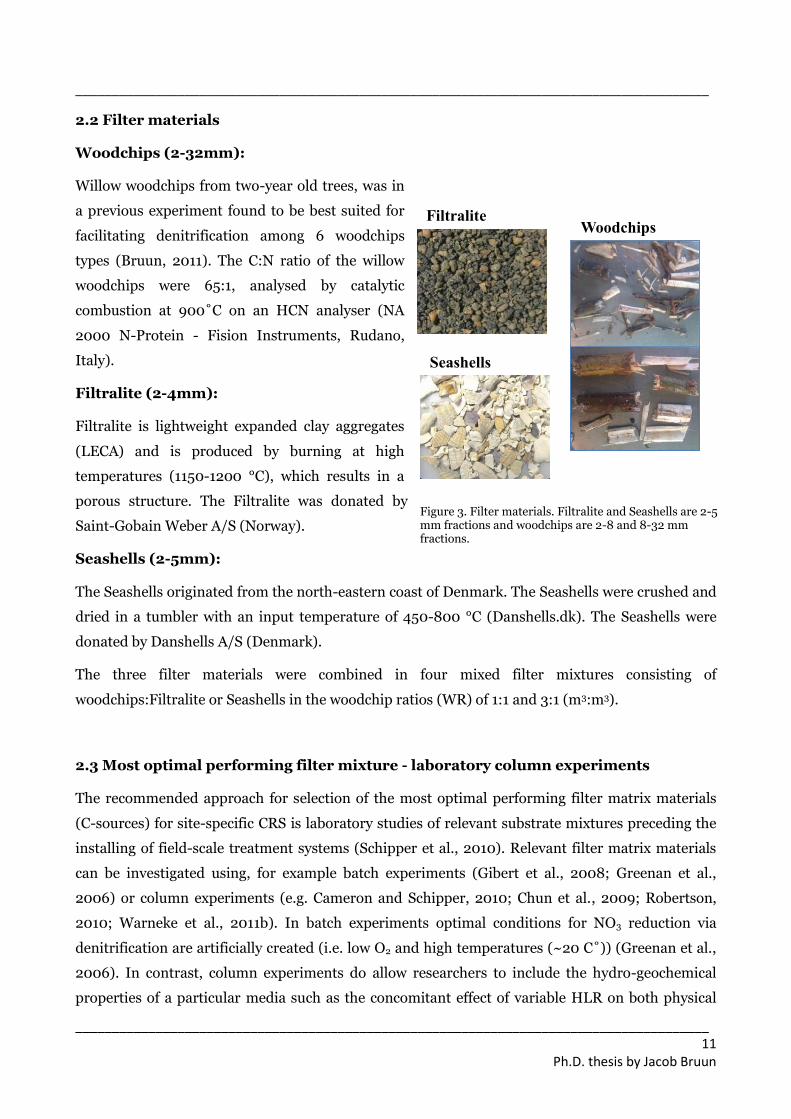
Woodchips (2-32mm):
Willow woodchips from two-year old trees, was in
a previous experiment found to be best suited for
facilitating denitrification among 6 woodchips
types (Bruun, 2011). The C:N ratio of the willow
woodchips were 65:1, analysed by catalytic
combustion at 900˚C on an HCN analyser (NA
2000 N-Protein - Fision Instruments, Rudano,
Italy).
Filtralite (2-4mm):
Filtralite is lightweight expanded clay aggregates
(LECA) and is produced by burning at high
temperatures (1150-1200 °C), which results in a
porous structure. The Filtralite was donated by
Saint-Gobain Weber A/S (Norway).
Seashells (2-5mm):
The Seashells originated from the north-eastern coast of Denmark. The Seashells were crushed and
dried in a tumbler with an input temperature of 450-800 °C (Danshells.dk). The Seashells were
donated by Danshells A/S (Denmark).
The three filter materials were combined in four mixed filter mixtures consisting of
woodchips:Filtralite or Seashells in the woodchip ratios (WR) of 1:1 and 3:1 (m3:m3).
2.3 Most optimal performing filter mixture - laboratory column experiments
The recommended approach for selection of the most optimal performing filter matrix materials
(C-sources) for site-specific CRS is laboratory studies of relevant substrate mixtures preceding the
installing of field-scale treatment systems (Schipper et al., 2010). Relevant filter matrix materials
can be investigated using, for example batch experiments (Gibert et al., 2008; Greenan et al.,
2006) or column experiments (e.g. Cameron and Schipper, 2010; Chun et al., 2009; Robertson,
2010; Warneke et al., 2011b). In batch experiments optimal conditions for NO3 reduction via
denitrification are artificially created (i.e. low O2 and high temperatures (~20 C˚)) (Greenan et al.,
2006). In contrast, column experiments do allow researchers to include the hydro-geochemical
properties of a particular media such as the concomitant effect of variable HLR on both physical
Woodchips Filtralite
Seashells
Figure 3. Filter materials. Filtralite and Seashells are 2-5 mm fractions and woodchips are 2-8 and 8-32 mm fractions.

_______________________________________________________________________________________
_______________________________________________________________________________________ 12
Ph.D. thesis by Jacob Bruun
properties and NO3 transformations under more realistic conditions. The main weakness for both
of these methods is their relatively small scale (< 0.2 m3). Extrapolation to field-scale systems,
typically > 1 m3, is difficult as the main assumption of a similar degree of heterogeneity at both
scales, is probably untrue as larger heterogeneities often arise in larger systems (Herbert, 2011).
Nonetheless, these methods are still valid as long as the main objective is a comparison of relevant
media.
According to the objectives of this Ph.D. thesis column experiments were chosen for assessing the
most optimal performing filter matrix media, and for analysing the solute transport (see tracer
experiment section).
An additional concern when using column experiments is the boundary effect. The boundary effect
is the hydraulic short-cutting of the column material, which may arise when the relatively coarse
particles do not pack sufficiently close to the inner boundary of the columns, thus creating
preferential flow paths for the flowing water. The influence of the boundary effect is greatest in
columns which has a small internal diameter, as the contact surface are between the column
material and the boundary of the column, and thus the area at which the short-cutting may occur,
is relatively larger, as compared with columns with a larger diameter. In order to determine the
column width, an initial test of the boundary effect was conducted in columns with a diameter of
0.10 and 0.20 m. In this test, the saturated hydraulic conductivity (Ksat) was measured in small
(0.10 m in diameter) and large (0.20 m in diameter) columns consisting of a mixture of willow
woodchips and Filtralite. The Ksat did not significantly differ between the column sizes (p = 0.03),
and so, the small columns (0.10 m in diameter) were chosen. The equipment used for determining
Ksat is described in Canga et al., (2014).
In the column experiment, the NO3 reduction rate and efficiency during continuous upward flow
were investigated at four HLRs: high (1.29 cm h-1), medium (0.58 cm h-1), moderate (0.38 cm h-1)
and low (0.29 cm h-1), corresponding to HRTs of approximately 11, 27, 43 and 54 hours,
respectively. The influent was oxygen saturated artificial drainage water (ADW), composed of
0.652 mM NaCl, 0.026 mM KCl,1.84 mM CaCl2 2H2O and 0.255 mM MgCl2 6H2O (pH = 6.4,
electrical conductivity, EC = 0.6 mS cm-1) spiked with potassium nitrate (KNO3) to a concentration
of 12 mg N L-1.
2.4 Subsurface flow constructed wetland design
The site for in situ experiments was a lowland area located in Skannerup, Jutland, Denmark (N
56.214132˚ – E 9.742723˚) which received drainage discharge from a ~85 ha agricultural
catchment. In this site six parallel SSF-CWs with the main purpose of removing NO3 from drainage
_______________________________________________________________________________________
_______________________________________________________________________________________ 13
Ph.D. thesis by Jacob Bruun
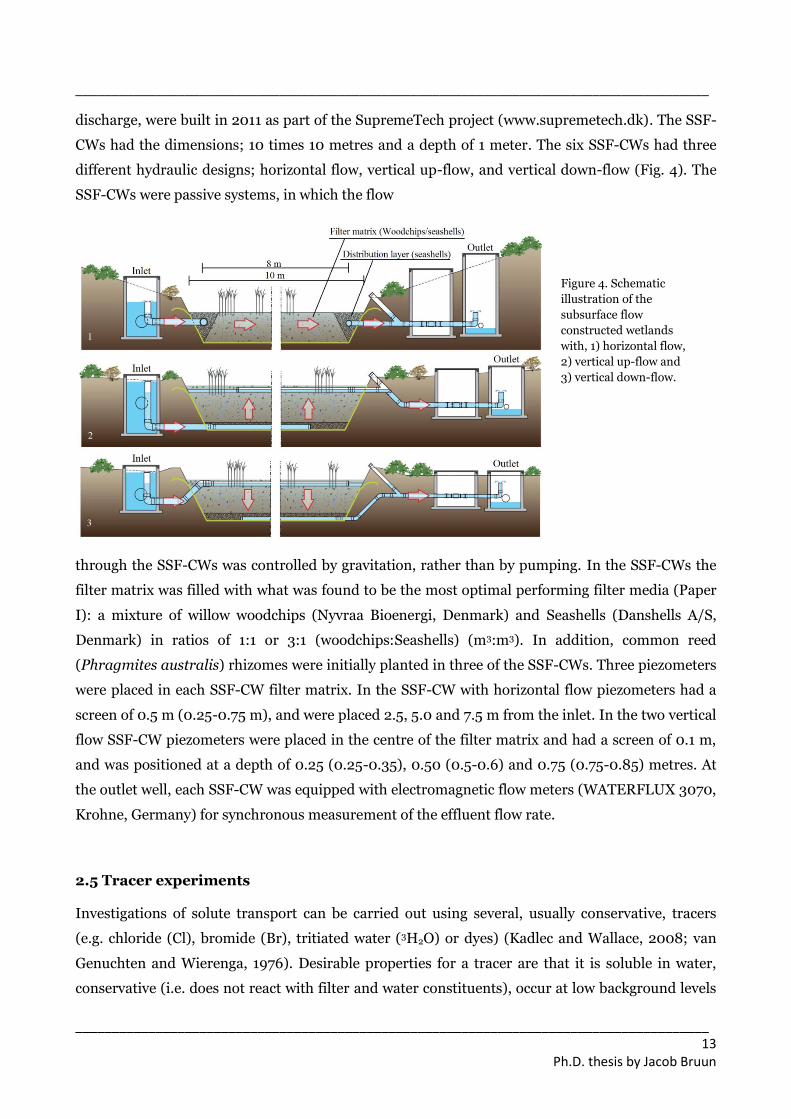
discharge, were built in 2011 as part of the SupremeTech project (www.supremetech.dk). The SSF-
CWs had the dimensions; 10 times 10 metres and a depth of 1 meter. The six SSF-CWs had three
different hydraulic designs; horizontal flow, vertical up-flow, and vertical down-flow (Fig. 4). The
SSF-CWs were passive systems, in which the flow
through the SSF-CWs was controlled by gravitation, rather than by pumping. In the SSF-CWs the
filter matrix was filled with what was found to be the most optimal performing filter media (Paper
I): a mixture of willow woodchips (Nyvraa Bioenergi, Denmark) and Seashells (Danshells A/S,
Denmark) in ratios of 1:1 or 3:1 (woodchips:Seashells) (m3:m3). In addition, common reed
(Phragmites australis) rhizomes were initially planted in three of the SSF-CWs. Three piezometers
were placed in each SSF-CW filter matrix. In the SSF-CW with horizontal flow piezometers had a
screen of 0.5 m (0.25-0.75 m), and were placed 2.5, 5.0 and 7.5 m from the inlet. In the two vertical
flow SSF-CW piezometers were placed in the centre of the filter matrix and had a screen of 0.1 m,
and was positioned at a depth of 0.25 (0.25-0.35), 0.50 (0.5-0.6) and 0.75 (0.75-0.85) metres. At
the outlet well, each SSF-CW was equipped with electromagnetic flow meters (WATERFLUX 3070,
Krohne, Germany) for synchronous measurement of the effluent flow rate.
2.5 Tracer experiments
Investigations of solute transport can be carried out using several, usually conservative, tracers
(e.g. chloride (Cl), bromide (Br), tritiated water (3H2O) or dyes) (Kadlec and Wallace, 2008; van
Genuchten and Wierenga, 1976). Desirable properties for a tracer are that it is soluble in water,
conservative (i.e. does not react with filter and water constituents), occur at low background levels
Figure 4. Schematic
illustration of the
subsurface flow
constructed wetlands
with, 1) horizontal flow,
2) vertical up-flow and
3) vertical down-flow.
_______________________________________________________________________________________
_______________________________________________________________________________________ 14
Ph.D. thesis by Jacob Bruun
and have low toxicity (Headley and Kadlec, 2007). The use of radioactive tracers (e.g. 3H2O) in
field-scale hydraulic analysis is often precluded by regulatory requirements (Kadlec and Wallace,
2008). Also vital to tracers is the density of the tracer solution, which can lead to density
stratification (Headley and Kadlec, 2007). Density stratification can result in the gravitational
pulling of the tracer solution to the bottom of the systems, impeding realistic observations of the
hydraulic behaviour, as seen in some studies (e.g. Chazarenc et al., 2003; Dirzo et al., 2000).
Recommendations are that the tracer solution density should not exceed the density of the ambient
water by more than 1% (Kadlec and Wallace, 2008). Another consideration in tracer tests is the
variable (un-regulated) flow, complicating the interpretation of the obtained tracer recovery
results. Steady flow is desirable, as it renders interpretation and subsequent conclusions easier.
2.5.1 Analysis of tracer experiments
Tracer experiments are usually carried out by pulse addition (Kadlec and Wallace, 2008). In this
Ph.D. thesis the pulse method was applied in all tracer experiments.
Tracer experiments results in a tracer response which can be translated into tracer breakthrough
curves (BTC)s (i.e. plotting the relative tracer concentration (C/C0) against time (either as hours or
translated to eluted pore volumes (Vi/V0), where Vi is the eluted water volume (L))). The analysis of
the BTCs include a semi-quantitative analysis in which a visual interpretation of the BTCs is
supported by a quantitative term, i.e. the number of V/V0, of specified parameters are noted (e.g.
peak height, first breakthrough and at x % of the total tracer mass (M0) recovered).
In addition to the semi-quantitative approach an alternative measure referred to as the Hydraulic
efficiency (λ) may be used. The measure was defined by Persson et al. (1999) as:
λ =𝑡𝑝
τ𝑛
where, tp= time of the peak outflow concentration (d) and τn is the nominal detention time (d).
Using this measure, Persson et al (1999) classified CWs and ponds into three categories: good:
λ>0.75, satisfactory: 0.75 >λ> 0.5, and poor: λ< 0.50.
In this Ph.D. thesis, both analytical methods were applied.
2.5.2 Laboratory tracer experiments
The solute transport behaviour in the four different filter mixtures was investigated by applying a
single pulse of tritiated water (3H2O) (specific activity 1.28 MBq) and subsequent measurement of
the activity in effluent sample fractions as a function of time. The tracer experiment was initiated

_______________________________________________________________________________________
_______________________________________________________________________________________ 15
Ph.D. thesis by Jacob Bruun
P
Br
by quickly switching the influent ADW to the 3H2O solution, thus not disrupting the continuous
steady flow in the columns. A continuous steady flow was ensured by peristaltic pumps. The solute
transport in the four filter mixtures was investigated at three hydraulic loading rates: high (1,29 cm
h-1, medium (0.58 cm h-1) and moderate (0.38 cm h-1). Effluent fractions were sampled
systematically, ensuring high data resolution. Sampling continued until effluent 3H2O activities
were < 100 disintegration per minute (DPM), which occurred after two to four eluted pore volumes
(V/V0). In the laboratory tracer test, the semi-quantitative approach was used (i.e. visual inspection
of tracer BTCs and quantitative interpretation of the tracer mass recoveries).
2.5.4 Field tracer tests
Field tracer tests were conducted at the
Skannerup site, in three of the six SSF-CWs
(on of each hydraulic design) (Fig. 4) at two
discharge rates: low (0.49 L s-1) and high (1.83
L s-1), corresponding to HRTs of 10 and 37
hours (Paper III). Investigations, using Br
tracer addition experiments, took place in
March and April 2015. A pulse of 25 L (10 g L-
1) (0.58% density difference compared with
tap water) tracer solution was added into the
influent pipe, directly entering the SSF-CW
(Fig. 5), at a rate corresponding to that of the
specific discharge rate (i.e. 0.49 or 1.83 L s-1). Steady continuous flow was achieved using aquarium
pumps (two to four per SSF-CW, depending on the discharge rate) (Fig. 5). Effluent and piezometer
water samples were taken continuously for 7 and 11 days for high and low discharge rate,
respectively. The experiments were terminated at ~4.5 V/V0, at which effluent bromide
concentrations were < 0.1 mg Br L-1. In the analyses of the Br-BTCs the two above mentioned tracer
approach were applied (i.e. visual inspection of Br-BTCs and quantitative interpretation of the
tracer mass recoveries, and the hydraulic efficiency (λ)). The analysis also included the
measurements of NO3 in the influent and the effluent, and in the piezometers.
Figure 5. Tracer (Br by hand) and influent (via pumps (P)) application during in situ tracer experiment.
_______________________________________________________________________________________
_______________________________________________________________________________________ 16
Ph.D. thesis by Jacob Bruun
2.6 Gas fluxes
In permanently saturated SSF-CWs, gases can be exported via two transport paths: i) emission, and
ii) as dissolved gases with the effluent.
Greenhouse gas emissions can be measured by chamber techniques. The two main types are static-
and dynamic chambers (Livingston and Hutchinson, 1995). In dynamic chambers (also called open
chambers), fluxes are determined by the difference in gas concentration between the chamber inlet
and outlet, whereas in the static chamber (also called closed chamber) fluxes are estimated from
the change in chamber gas concentration over time (Livingston and Hutchinson, 1995). An
alternative technique for measuring gas fluxes is the eddy covariance technique. The eddy
covariance technique relies on high frequency analysis of gas concentrations combined with three-
dimensional measurements of wind speed and wind direction (Baldocchi et al., 1988). This
technique is useful when considering whole ecosystems over large time scales (Baldocchi, 2003).
The technique is however not appropriate for investigating smaller scale flux differences. The
chamber technique has limitations as it alters the concentration gradient between the “soil” and the
atmosphere with increasing chamber concentrations, resulting in a non-linear increase at high
chamber gas concentrations.
Dissolved gases were analysed using the headspace equilibration method. Headspace equilibration
methods are simple and widely used (Cole and Caraco 1998; Jacinthe and Groffman 2001;
Spalding and Watson 2006). The method depends on the equilibrium between the gas and the
liquid phase, and subsequent the quantification of the gas concentration in the head space.
Dissolved gas export estimations (g h-1) were based on the dissolved gas concentration (g L-1) and
the effluent flow rate (L h-1) of the SSF-CWs.
Considering the objective of the thesis and the study site, the static chamber method was applied in
the investigations of GHG emissions. At each SSF-CW three replicates consisting of 1.2 m2 plots,
defined by pre-fixed PVC frames, were used for positioning the static chambers. Gas fluxes were
measured during the period 1/8 2013 - 28/8 2014 and included diurnal measurements at five
occasions during the growing season. The HMR procedure for trace gas flux estimation, available
from the HMR package (Pedersen, 2011) in the R software, was used for estimation of the gas
fluxes.
_______________________________________________________________________________________
_______________________________________________________________________________________ 17
Ph.D. thesis by Jacob Bruun
3 Main results and discussion
3.1 Woodchip media - physical characteristics
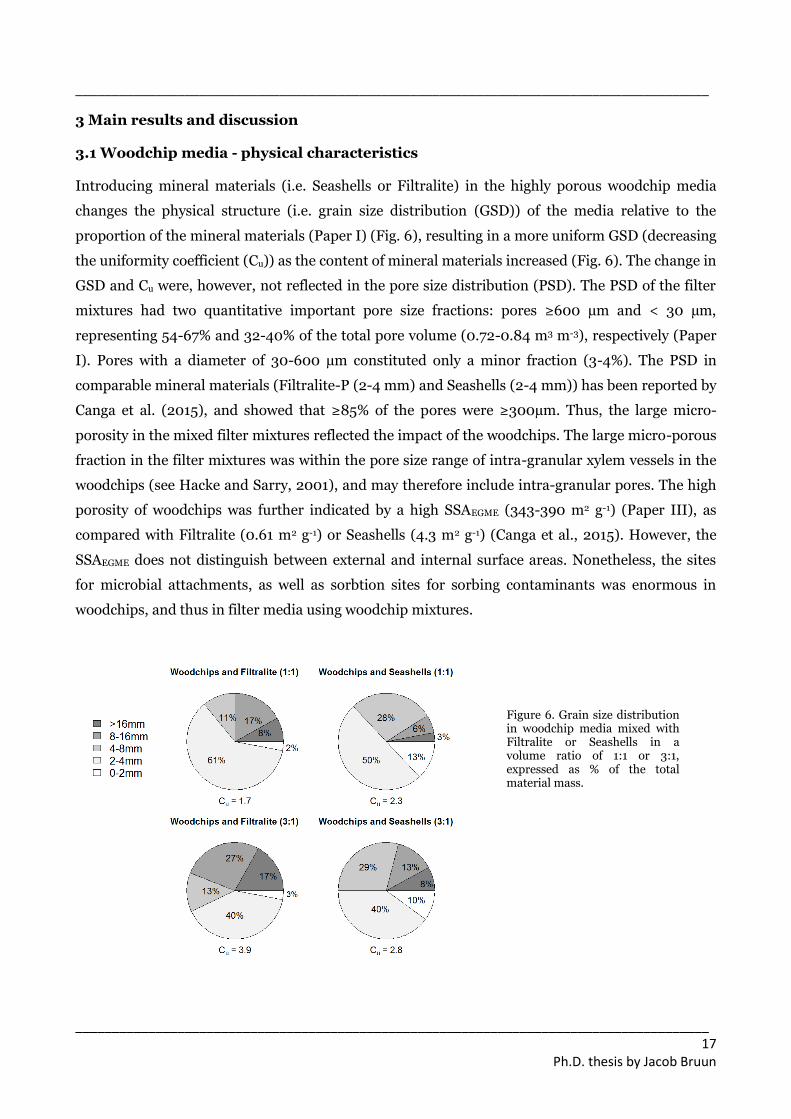
Introducing mineral materials (i.e. Seashells or Filtralite) in the highly porous woodchip media
changes the physical structure (i.e. grain size distribution (GSD)) of the media relative to the
proportion of the mineral materials (Paper I) (Fig. 6), resulting in a more uniform GSD (decreasing
the uniformity coefficient (Cu)) as the content of mineral materials increased (Fig. 6). The change in
GSD and Cu were, however, not reflected in the pore size distribution (PSD). The PSD of the filter
mixtures had two quantitative important pore size fractions: pores ≥600 µm and < 30 µm,
representing 54-67% and 32-40% of the total pore volume (0.72-0.84 m3 m-3), respectively (Paper
I). Pores with a diameter of 30-600 µm constituted only a minor fraction (3-4%). The PSD in
comparable mineral materials (Filtralite-P (2-4 mm) and Seashells (2-4 mm)) has been reported by
Canga et al. (2015), and showed that ≥85% of the pores were ≥300µm. Thus, the large micro-
porosity in the mixed filter mixtures reflected the impact of the woodchips. The large micro-porous
fraction in the filter mixtures was within the pore size range of intra-granular xylem vessels in the
woodchips (see Hacke and Sarry, 2001), and may therefore include intra-granular pores. The high
porosity of woodchips was further indicated by a high SSAEGME (343-390 m2 g-1) (Paper III), as
compared with Filtralite (0.61 m2 g-1) or Seashells (4.3 m2 g-1) (Canga et al., 2015). However, the
SSAEGME does not distinguish between external and internal surface areas. Nonetheless, the sites
for microbial attachments, as well as sorbtion sites for sorbing contaminants was enormous in
woodchips, and thus in filter media using woodchip mixtures.
Figure 6. Grain size distribution in woodchip media mixed with Filtralite or Seashells in a volume ratio of 1:1 or 3:1, expressed as % of the total material mass.

_______________________________________________________________________________________
_______________________________________________________________________________________ 18
Ph.D. thesis by Jacob Bruun
The accessibility of the intra-granular pore space in woodchips was demonstrated in a batch
diffusion experiment (Paper III). A decline in the inter-granular tracer concentration of 18% and
21% for Br and 3H2O, respectively was assumed to reflect the intra-granular diffusion in the
woodchips. Thus, intra-granular diffusion may likely attribute to a more pronounced non-
equilibrium transport and a greater retardation of the tracer solutes in woodchip media.
3.2 Solute transport
3.2.1 Solute transport in woodchip based systems (laboratory-scale)
The mixed woodchip media demonstrated a clear non-equilibrium solute transport, as indicated by
a left-shifted asymmetrical BTC, with the concentration peak arriving well before one V/V0, was
found (Paper I). Non-equilibrium solute transport in woodchip media have been attributed to the
dual porous and heterogeneous structure of the filter mixtures, and also include a diffusional mass
exchange between mobile and immobile domains (Cameron and Schipper, 2012; Paper I).
Cameron and Schipper (2012) suggested that movement of a Br tracer into and out of the micro-
porous domain (i.e. a solute exchange mechanism between the macro- and micro-pores) explained
the observed tracer retardation. Differentiation between inter- and intra-granular pores in the
micro pores (< 30µm in diameter) (i.e. inter- and/or intra-granular diffusion) was, however, not
possible in the above mentioned studies. But, as intra-granular diffusion can occur in woodchips
(Paper III), intra-granular diffusion likely played a role in the retardation, and thus the transport of
solutes in the woodchip media.
In some mineral materials used in CRS, such as Leca and Filtralite (Canga et al., 2015; Suliman et
al., 2006; this Ph.D. thesis), the effects of intra-granular diffusion may be of minor importance
because the intra-granular pores in these materials are enclosed (i.e. not connected to the granule
exteriors). Canga (2014) mentions that the intra-granular pores in Filtralite, are enclosed, and do
therefore not facilitate intra-granular diffusion. In contrast, Canga et al. (2015) suggested that the
observed retardation of the 3H2O tracer in Seashell media was due to intra-granular diffusion.
When woodchips (2-32 mm) were mixed with Filtralite (2-4 mm) (ratio 1:1) (Paper I), visual
inspections of the 3H2O-BTCs and the quantification of the tracer mass recovery showed that the
tracer breakthrough and the peak maximum, in terms of V/V0 decreased, indicating progressively
more non-equilibrium transport when increasing the HLR. Mixing woodchips (2-32 mm) with
Seashells (2-4 mm) (ratio 1:1), resulted in no significant effect of HLR on the non-equilibrium
transport, in contrast to the woodchips-Filtralite mixtures (Paper I).
Increasing the woodchip ratio to 3:1 (m3:m3) affected the BTCs and the mass recovery in the
Seashells mixture. Increasing the woodchip content decreased the number of pore volumes (V/V0)
_______________________________________________________________________________________
_______________________________________________________________________________________ 19
Ph.D. thesis by Jacob Bruun
required to achieve mass recoveries of ≤50% (Paper I), indicating a faster tracer recovery, and thus
slightly more pronounced non-equilibrium solute transport. No effect of WR was observed for the
Filtralite mixtures. The influence of WR on the physical properties (Fig. 6) thus seemed to be
reflected by the resulting effect on the tracer BTC in the Seashell mixture, while the Filtralite
mixture was not affected by WR (i.e. for the two woodchips ratios used in this study).
Use of 3H2O as a tracer in organic materials (e.g. woodchips) may result in retardation of 3H2O due
to hydroxyl exchange (Morris, 2004; Turner et al., 2009). Although, high recoveries of the 3H2O
tracer (92-98%) were observed in Paper I, physical non-equilibrium could not be distinguished
from chemical non-equilibrium in the woodchip mixtures.
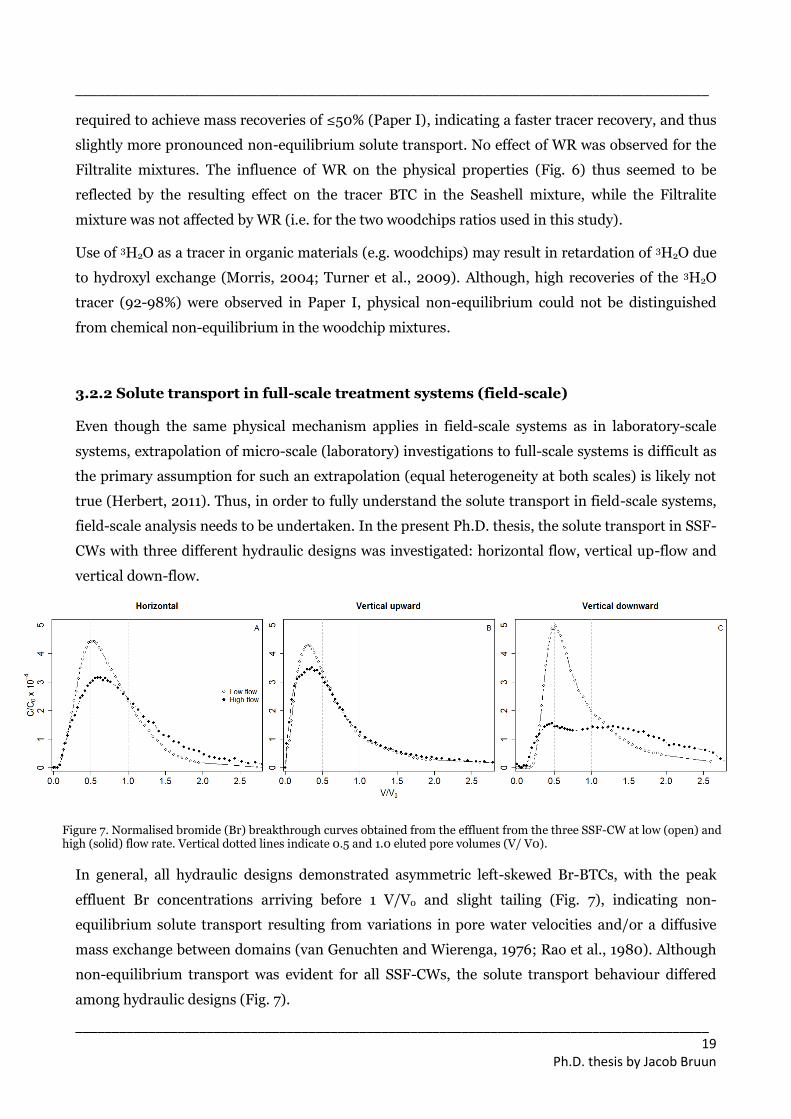
3.2.2 Solute transport in full-scale treatment systems (field-scale)
Even though the same physical mechanism applies in field-scale systems as in laboratory-scale
systems, extrapolation of micro-scale (laboratory) investigations to full-scale systems is difficult as
the primary assumption for such an extrapolation (equal heterogeneity at both scales) is likely not
true (Herbert, 2011). Thus, in order to fully understand the solute transport in field-scale systems,
field-scale analysis needs to be undertaken. In the present Ph.D. thesis, the solute transport in SSF-
CWs with three different hydraulic designs was investigated: horizontal flow, vertical up-flow and
vertical down-flow.
In general, all hydraulic designs demonstrated asymmetric left-skewed Br-BTCs, with the peak
effluent Br concentrations arriving before 1 V/V0 and slight tailing (Fig. 7), indicating non-
equilibrium solute transport resulting from variations in pore water velocities and/or a diffusive
mass exchange between domains (van Genuchten and Wierenga, 1976; Rao et al., 1980). Although
non-equilibrium transport was evident for all SSF-CWs, the solute transport behaviour differed
among hydraulic designs (Fig. 7).
Figure 7. Normalised bromide (Br) breakthrough curves obtained from the effluent from the three SSF-CW at low (open) and high (solid) flow rate. Vertical dotted lines indicate 0.5 and 1.0 eluted pore volumes (V/ V0).
_______________________________________________________________________________________
_______________________________________________________________________________________ 20
Ph.D. thesis by Jacob Bruun
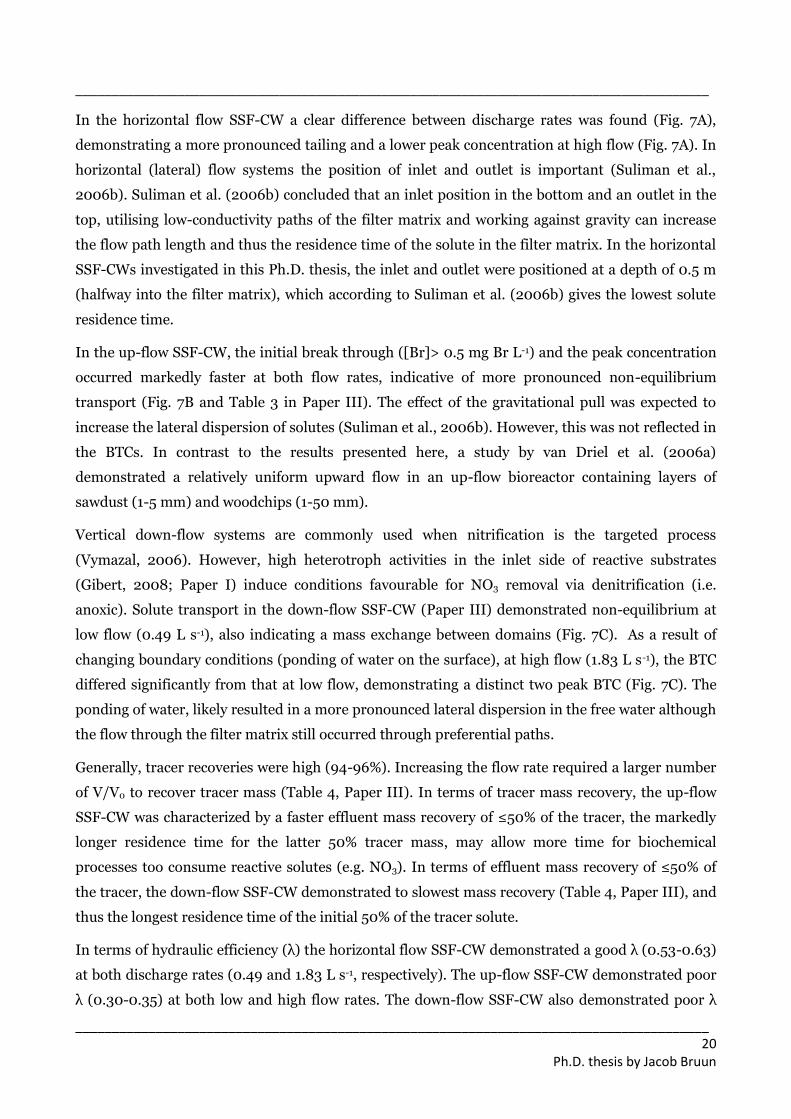
In the horizontal flow SSF-CW a clear difference between discharge rates was found (Fig. 7A),
demonstrating a more pronounced tailing and a lower peak concentration at high flow (Fig. 7A). In
horizontal (lateral) flow systems the position of inlet and outlet is important (Suliman et al.,
2006b). Suliman et al. (2006b) concluded that an inlet position in the bottom and an outlet in the
top, utilising low-conductivity paths of the filter matrix and working against gravity can increase
the flow path length and thus the residence time of the solute in the filter matrix. In the horizontal
SSF-CWs investigated in this Ph.D. thesis, the inlet and outlet were positioned at a depth of 0.5 m
(halfway into the filter matrix), which according to Suliman et al. (2006b) gives the lowest solute
residence time.
In the up-flow SSF-CW, the initial break through ([Br]> 0.5 mg Br L-1) and the peak concentration
occurred markedly faster at both flow rates, indicative of more pronounced non-equilibrium
transport (Fig. 7B and Table 3 in Paper III). The effect of the gravitational pull was expected to
increase the lateral dispersion of solutes (Suliman et al., 2006b). However, this was not reflected in
the BTCs. In contrast to the results presented here, a study by van Driel et al. (2006a)
demonstrated a relatively uniform upward flow in an up-flow bioreactor containing layers of
sawdust (1-5 mm) and woodchips (1-50 mm).
Vertical down-flow systems are commonly used when nitrification is the targeted process
(Vymazal, 2006). However, high heterotroph activities in the inlet side of reactive substrates
(Gibert, 2008; Paper I) induce conditions favourable for NO3 removal via denitrification (i.e.
anoxic). Solute transport in the down-flow SSF-CW (Paper III) demonstrated non-equilibrium at
low flow (0.49 L s-1), also indicating a mass exchange between domains (Fig. 7C). As a result of
changing boundary conditions (ponding of water on the surface), at high flow (1.83 L s-1), the BTC
differed significantly from that at low flow, demonstrating a distinct two peak BTC (Fig. 7C). The
ponding of water, likely resulted in a more pronounced lateral dispersion in the free water although
the flow through the filter matrix still occurred through preferential paths.
Generally, tracer recoveries were high (94-96%). Increasing the flow rate required a larger number
of V/V0 to recover tracer mass (Table 4, Paper III). In terms of tracer mass recovery, the up-flow
SSF-CW was characterized by a faster effluent mass recovery of ≤50% of the tracer, the markedly
longer residence time for the latter 50% tracer mass, may allow more time for biochemical
processes too consume reactive solutes (e.g. NO3). In terms of effluent mass recovery of ≤50% of
the tracer, the down-flow SSF-CW demonstrated to slowest mass recovery (Table 4, Paper III), and
thus the longest residence time of the initial 50% of the tracer solute.
In terms of hydraulic efficiency (λ) the horizontal flow SSF-CW demonstrated a good λ (0.53-0.63)
at both discharge rates (0.49 and 1.83 L s-1, respectively). The up-flow SSF-CW demonstrated poor
λ (0.30-0.35) at both low and high flow rates. The down-flow SSF-CW also demonstrated poor λ

_______________________________________________________________________________________
_______________________________________________________________________________________ 21
Ph.D. thesis by Jacob Bruun
(0.49) at low flow, whereas, the ponding of water at high flow was more difficult to assess because
of the two peaks (Fig. 7C) (Paper III). An important parameter for the λ of field-scale treatment
systems is the aspect ratio (width:length) (Persson, 1999; García et al., 2004), which affect the
delay time and the spreading (dispersal) of the solute (García et al., 2004). This is consistent with
the higher λ of the horizontal SSF-CW. The increase in λ following an increase in discharge rate was
related to the decrease in C/C0 at peak arrival and the more pronounced tailing, responsible for
solute diffusive exchange between mobile and immobile domains. Thus, in terms of evaluating
solute transport in SSF-CWs, λ does not provide information on the solute transport behavior.
Solute transport along the flow direction measured in the piezometers of the different SSF-CWs
demonstrated a more pronounced response to the different hydraulic designs (Fig. 4, 5 and 6,
Paper III). In the horizontal flow design, the BTC gradually developed along the direction of the
flow (Fig. 4, Paper III). Apart from a deviation in the BTC observed at a distance of 7.5 m from the
inlet, this BTC behaviour generally resembled that of the effluent BTC (Fig. 7). Larger and more
non-systematic variations were observed along the flow direction in the vertical up-flow SSF-CW
(Fig.5, Paper III), but still demonstrating the more pronounced non-equilibrium characteristics of
the up-flow design. In the down-flow SSF-CW, at low discharge rate the BTC along the direction of
the flow resembled that of the effluent (Fig. 7) (Fig. 6, Paper III). At high discharge rate a later
arrival of the concentration peak, was likely due to the ponding observed at the surface at high flow
in this SSF-CW.
It is important to note, that tracer tests only reveal the solute transport under the hydraulic
conditions at which they are performed. Thus, the solute transport parameters (BTCs, mass
recoveries, λ) only apply to the experimental conditions (i.e. discharge rates and temperatures)
under which the SSF-CWs were investigated.
3.2.3 Improving the solute transport in woodchip-based treatment systems
The results from this Ph.D. thesis indicate that the most optimal solute transport in coarse granular
materials (e.g. woodchips, woodchip mixtures), i.e. highest λ may be achieved by applying
horizontal flow, predominately due to a lower aspect ratio (Paper III), as recommended by Persson
et al. (1999) and García et al. (2004). However, as mentioned λ does not provide adequate
information on the solute transport behavior. Interestingly, the down-flow CWs demonstrated the
slowest recovery of ≤50% of the tracer mass, which indicate a relative longer solute residence time
in the down-flow hydraulic design, than for the other hydraulic designs. A longer solute residence

_______________________________________________________________________________________
_______________________________________________________________________________________ 22
Ph.D. thesis by Jacob Bruun
time may be important for the reductive biochemical processes (e.g. denitrification), as suggested
in (Paper I).
Herbert (2011) also suggested that reduction of the particle size (i.e. decreasing the intra-granular
diffusion distance) would lower the mass exchange rate. However, the hydraulic conductivity of
coarse granular media decreases with reduced particle size (Canga et al., 2014; Cameron and
Schipper, 2010), and may thus limit the hydraulic capacity of the systems.
3.2.4 Practical considerations
In addition to the specific media characteristics and system dimensions, the correct filling strategy
of a media into the SSF-CWs (i.e. in multiple sections rather than all at once) can improve the
solute transport (Suliman et al., 2007). Dividing the system into several sections before filling, can
minimize the segregation into layers, and thus the preferential flow paths in these layers, yielding
longer residence times and higher hydraulic efficiencies (λ), which furthermore, may improve
system treatment efficiency (Suliman et al., 2007).
4 Denitrification in constructed reactive systems
In the literature a wide range of denitrification rates from CRS are presented, varying
approximately one order of magnitude (<1 – 22 g N m-3 day-1), mainly due to variations in
temperature (typically 1 – 24 ˚C) and/or inlet NO3 and/or O2 loads (Blowes et al., 1995; Cameron
and Schipper, 2010; Greenan et al., 2006, Gibert et al., 2008; Jaynes et al., 2008; Robertson et al.,
2010).
The availability of electrons (electron donors) is one of the most important factors controlling the
activity of heterotroph microorganisms, which include most denitrifiers (Knowles, 1982).
Temperature is a driver of biochemical reactions. The importance of temperature for denitrification
in CRS has been pointed out several times (Cameron and Schipper, 2010 and 2011; Warneke et al.,
2011b). The optimal temperature for biological denitrification is about 60˚C (Bremner and Shaw,
1958). However, at temperature above 50 ˚C chemical decomposition reactions of NO2 may
become important (Keeney et al. 1979). Bollage et al., (1970) found an optimal temperature of 30 C
for denitrifyers.
Both streambed reactors and denitrifying beds have been shown to remove NO3 even at effluent
temperatures as low as 1–5 ˚C (Robertson and Merkley, 2009; Robertson et al., 2009; Elgood et
al., 2010). Evaluation of the effect of temperature on reaction rates typically comprises the used of
Q10 values, defined as the factor by which a reaction rate increases with a 10 ˚C rise in temperature:
_______________________________________________________________________________________
_______________________________________________________________________________________ 23
Ph.D. thesis by Jacob Bruun
Q10 =(𝑅2
𝑅1)
10/(𝑇2−𝑇1)
where, R is the reaction rate and T is the temperature to time 1 and 2.
Q10 values reported in field-scale and laboratory constructed reactive systems vary from 1.6 to 3.5
(van Driel et al., 2006a and b, Cameron and Schipper, 2010). Mostly field-scale CRS exhibits pore
water temperatures comparable to those of drainage water (i.e. ~8 ˚C) (e.g. van Driel et al., 2006a
and b; Cameron and Schipper 2010). Cameron and Schipper (2012 and 2011) pointed to efforts
towards increase the filter temperature as a main improvement measure of CRS, which they
achieved by covering experimental denitrifying beds with corrugated polycarbonate roofing sheets
fitted to wooden frames.
In natural systems, denitrification is positively related to pH (Knowles, 1982). The optimum for the
denitrification is at pH 7.0-8.0 (Knowles, 1982). At low pH nitrogen reductases, especially the N2O
reductase, are inhibited such that the overall denitrification decreases, but the end product ratio of
(N2O/N2) increases (Knowles, 1982). In CRS, no apparent effects of pH on the denitrification have
been reported. But initial low effluent pH during system start-up phase has been observed (Bruun,
2011; Gibert et al., 2008).
Despite the inhibiting effect of O2 on the denitrification, and thus the importance in end-of-pipe
CRS, laboratory experiments have been conducted under anoxic conditions (Greenan et al., 2006)
or with no clear description of the O2 conditions of the influent (Cameron and Schipper, 2012;
Herbert, 2011).
Zero-order kinetics are most often used to describe denitrification in woodchip-based systems (e.g.
Robertson, 2010; Robertson and Cherry, 1995; Schipper et al., 2005), and generally apply when
effluent NO3-N concentrations exceed the half-saturation constant (km) of the Michaelis-Menten
kinetics (1 mg NO3-N L-1). In practice, NO3 limiting conditions, and conditions limiting the
denitrification (i.e. high O2 loads), are likely to occur, given the stochastic nature and chemical
composition of drainage discharge. In Paper I a diffusional NO3 transport into immobile domains
implied that denitrification kinetics was controlled by a diffusive mass exchange between mobile
and immobile domains. Due to the diffusion restricted mass exchange into the immobile domain,
these sites may constitute NO3 sinks, as heterotrophic processes may rapidly consume the diffusion
oxidized species (e.g. O2 and NO3). In Paper I N reduction, though low, occurred at high HLR (1.29
cm h-1), corresponding to a HRT of ~11 hours. At high HLR (i.e. high O2 and NO3-N loads) oxic
conditions prevailed in the mobile domain, thus the diffusional transport of NO3 into the immobile
domain either consuming or physical retaining the NO3, explained the low, however significant N
removal (Paper I).

_______________________________________________________________________________________
_______________________________________________________________________________________ 24
Ph.D. thesis by Jacob Bruun
The most important factor controlling the NO3 removal efficiency in CRS is, however, HLR (HRT;
i.e. time for consumption of terminal electron acceptors (e.g. NO3)) (Robertson, 2010; Greenan et
al., 2009; Paper I).
4.1 Most optimal performing mixed woodchip media
Using laboratory studies, several researchers have investigated numerous types of wood products
in order to identify the most optimal performing substrate for CRS (e.g. Cameron and Schipper,
2012; Greenan et al., 2006; Greenan et al., 2009; Gibert et al., 2008). In a batch experiment Gibert
et al. (2008) found a good NO3 reduction efficiency (86%) of willow woodchips. However, the NO3
reduction efficiency was better in mixtures of branches and bark from un-identified softwood
species, and a mixture of coarse woodchips and branches from un-identified hardwood species
(>98%). An laboratory column experiment using aerated NO3 spiked influent concluded that
willow woodchips were the most optimal performing among six woodchip media in terms of
facilitating NO3 removal via denitrification (Bruun, 2011). The five other woodchip types in this
experiment were oak (Quercus robur), red-oak (Quercus rubra), poplar (Populus trichocarpa),
heather (Calluna vulgaris) and spruce (Abies nordmanniana).
Nitrate removal efficiencies and reduction rates demonstrated that the woodchips mixed with
Seashells had the most promising NO3 reduction capacity (0.35-3.97 g N m-3 L -1) (Paper I). The
greater potential of the seashell mixtures was most likely due to the higher pH in the seashell
mixtures (7.7-7.8), which was within the optimal range for denitrification (7.0-8.0) (Knowles,
1982), in contrast to the pH in the Filtralite mixtures (6.1-6.9).
Paper I describes that the N removal via denitrification in the mixed media at a woodchip content
of 1:1 (m3:m3) was limited as compared to filter media with a high woodchips content (i.e.
woodchip ratio 3:1 m3:m3). This limitation may have been due to the lower C availability at lower
woodchip content and/or a lower microbial population associated with a lower woodchip mass
(Moorman et al., 2010). Carbon limitation in woodchip media has also been suggested by Warneke
et al. (2011b). Although, the effect of WR presented in Paper I, indicated that carbon was limiting N
removal at the low WR ratio, it is not clear whether a further increase in WR above a 3:1 volume
ratio would further enhance the N reduction efficiency.
4.2 Effect of solute transport in treatment performance
Denitrification occurs only in that part of the anoxic layer through which NO3 penetrates (Knowles,
1982). At HLRs where the O2 load exceeds the heterotrophic O2 consumption, a diffusional mass
exchange into an immobile domain may either reduce NO3 via denitrification or may physically

_______________________________________________________________________________________
_______________________________________________________________________________________ 25
Ph.D. thesis by Jacob Bruun
retain NO3 (Paper I). In Paper I no clear relation between NO3 reduction and solute transport
behaviour for mixed woodchip media was found (Paper I). In addition, Cameron and Schipper
(2012) found no effect of (τ:HRT) (See Martinez et al., 2003) on the NO3 reduction in woodchip
media of varying grain sizes (Cameron and Schipper, 2010).
The results from Paper III show that non-equilibrium solute transport depends on the hydraulic
design of the SSF-CW (Paper III). While the faster transport of solutes (i.e. at relatively more
pronounced non-equilibrium transport) reduce the time available for biochemical processes in the
mobile domain, a fraction of the tracer solute can be retained for a longer time in the filter, due to
diffusive mass exchange between mobile and immobile pore domains (Rao et al., 1980). Among
the hydraulic designs investigated in the Ph.D. study, the up-flow design demonstrated the
most pronounced non-equilibrium transport (Fig. 7B), and also demonstrated the lowest
hydraulic efficiency (λ). The faster recovery of the ≤50% tracer mass in the up-flow SSF-
CW (Table 4, Paper III), suggest a faster pore-water velocity in the mobile pores, and thus
a shorter time for biochemical processes to reduce NO3-N. This was reflected in the lower
NO3-N removal observed in the up-flow SSF-CW. On the other hand, the down-flow SSF-
CW demonstrated the slowest initial (≤50%) tracer mass recovery, thus a longer solute
residence time as compared to the up-flow, but also as compared to the horizontal flow
SSF-CW (Table 4, Paper III). A longer solute residence time allow a longer time
biochemical processes to consume NO3, resulting in a higher NO3-N reduction rate and
removal efficiency.
Figure 8. The flow normalized NO3-N removal rate (gN m-3 m-3) plotted against the tracer mass recovery (M/M0) of 25
and 50% from the three hydraulic designs at low flow (0.49 L s-1).
In terms of explaining the NO3 removal rate, the λ was inadequate, whereas quantitative estimates
of the mass recovery (25 and 50% M/M0) showed a clear tendency (Fig. 8), however only
significant for M/M0 = 25% (p = 0.02) (p = 0.06, for M/M0 = 50%) in these SSF-CWs.
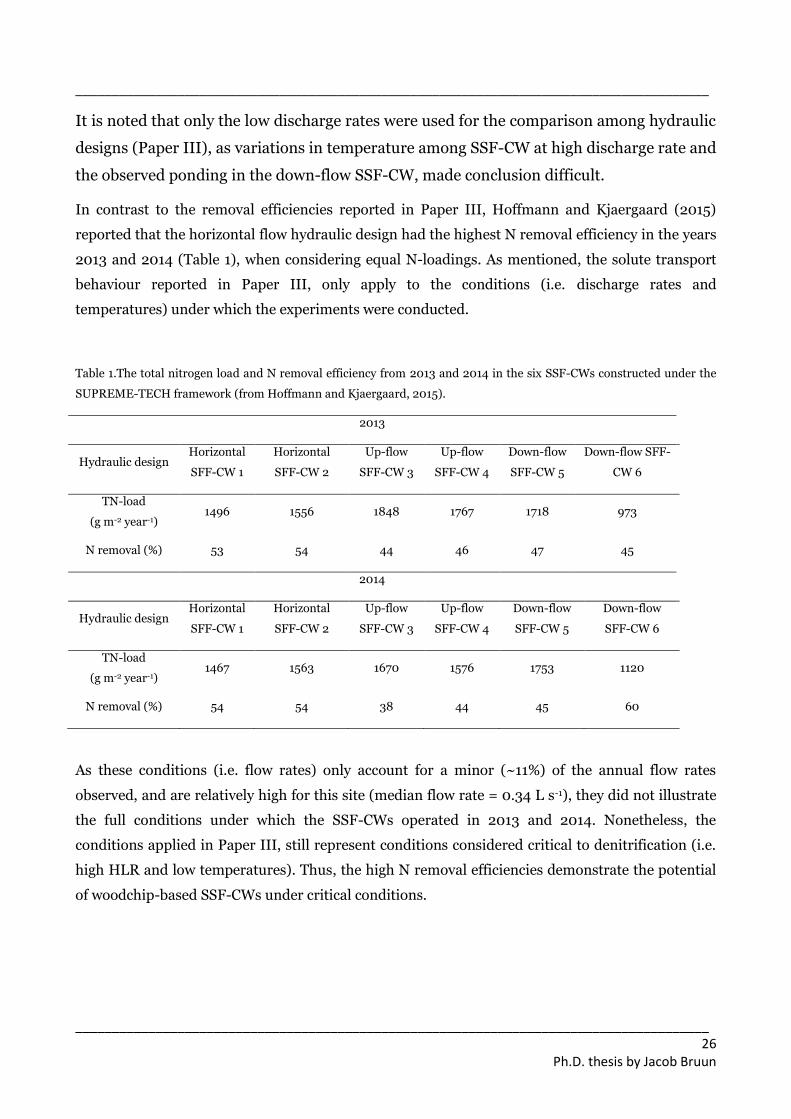
_______________________________________________________________________________________
_______________________________________________________________________________________ 26
Ph.D. thesis by Jacob Bruun
It is noted that only the low discharge rates were used for the comparison among hydraulic
designs (Paper III), as variations in temperature among SSF-CW at high discharge rate and
the observed ponding in the down-flow SSF-CW, made conclusion difficult.
In contrast to the removal efficiencies reported in Paper III, Hoffmann and Kjaergaard (2015)
reported that the horizontal flow hydraulic design had the highest N removal efficiency in the years
2013 and 2014 (Table 1), when considering equal N-loadings. As mentioned, the solute transport
behaviour reported in Paper III, only apply to the conditions (i.e. discharge rates and
temperatures) under which the experiments were conducted.
Table 1.The total nitrogen load and N removal efficiency from 2013 and 2014 in the six SSF-CWs constructed under the
SUPREME-TECH framework (from Hoffmann and Kjaergaard, 2015).
2013
Hydraulic design Horizontal
SFF-CW 1
Horizontal
SFF-CW 2
Up-flow
SFF-CW 3
Up-flow
SFF-CW 4
Down-flow
SFF-CW 5
Down-flow SFF-
CW 6
TN-load
(g m-2 year-1) 1496 1556 1848 1767 1718 973
N removal (%) 53 54 44 46 47 45
2014
Hydraulic design Horizontal
SFF-CW 1
Horizontal
SFF-CW 2
Up-flow
SFF-CW 3
Up-flow
SFF-CW 4
Down-flow
SFF-CW 5
Down-flow
SFF-CW 6
TN-load
(g m-2 year-1) 1467 1563 1670 1576 1753 1120
N removal (%) 54 54 38 44 45 60
As these conditions (i.e. flow rates) only account for a minor (~11%) of the annual flow rates
observed, and are relatively high for this site (median flow rate = 0.34 L s-1), they did not illustrate
the full conditions under which the SSF-CWs operated in 2013 and 2014. Nonetheless, the
conditions applied in Paper III, still represent conditions considered critical to denitrification (i.e.
high HLR and low temperatures). Thus, the high N removal efficiencies demonstrate the potential
of woodchip-based SSF-CWs under critical conditions.

_______________________________________________________________________________________
_______________________________________________________________________________________ 27
Ph.D. thesis by Jacob Bruun
5. Greenhouse gas production and emission
In the literature, only a few studies have focused on emission of GHG from constructed reactive
systems (Warneke et al., 2011a; Paper II), whereas several studies have reported on dissolved gas
concentrations (Elgood et al., 2010; Greenen et al., 2009; Moorman et al., 2010; Warneke et al.,
2011b, Paper I).
5.1 Nitrous oxide
Nitrous oxide can be produced by several microbial pathways (i.e. nitrification and denitrification)
(Baggs, 2008). It is generally assumed that denitrification is the mechanism responsible for the
production of N2O in CRS (e.g. Greenan et al., 2009; Elgood et al., 2010; Warneke et al., 2011a).
Nitrous oxide production via nitrification may also contribute to the accumulation of N2O. The
importance of N2O production via nitrification in CRS systems has however, not been addressed,
and is likely negligible given the predominance of anaerobic processes in these systems.
The accumulation of N2O in denitrifying systems may be caused by a number of factors. One of the
key factors controlling N2O production via denitrification is O2. Oxygen can inhibit the last step in
the denitrification process (i.e. reduction of N2O to N2 as the N2O reductase is more sensitive to O2
than the reductases facilitating the other steps in the denitrification (Firestone, 1982)). In a
streambed reactor, Elgood et al. (2010) identified two temporal hotspots associated with higher
influent O2 concentrations (among other factors). In other studies in CRSs, the N2O production and
the subsequent N2O emission were clearly related to influent O2 concentrations (Warneke et al.,
2011a; Warneke et al., 2011b). No effect of O2 or the O2 load was found in the field site in this Ph.D.
as stated Paper II. However, in Paper I the net production of N2O-N in the Seashell mixtures lead
to higher effluent N2O-N concentrations at high HLR (high O2 load) (Fig. 9) in accordance with the
above mentioned inhibition of the N2O reductase.
In addition to O2, N2O reductase is sensitive to the presence of other nitrogen oxides
(thermodynamically more preferable electron acceptors; Box 1, page 16), leading to accumulation
Figure 9. Effluent nitrous oxide concentrations as a function of hydraulic loading rate (HLR) for the Filtralite and Seashell filter mixtures at variable woodchip ratios (WR). Each data point represents one replicate.
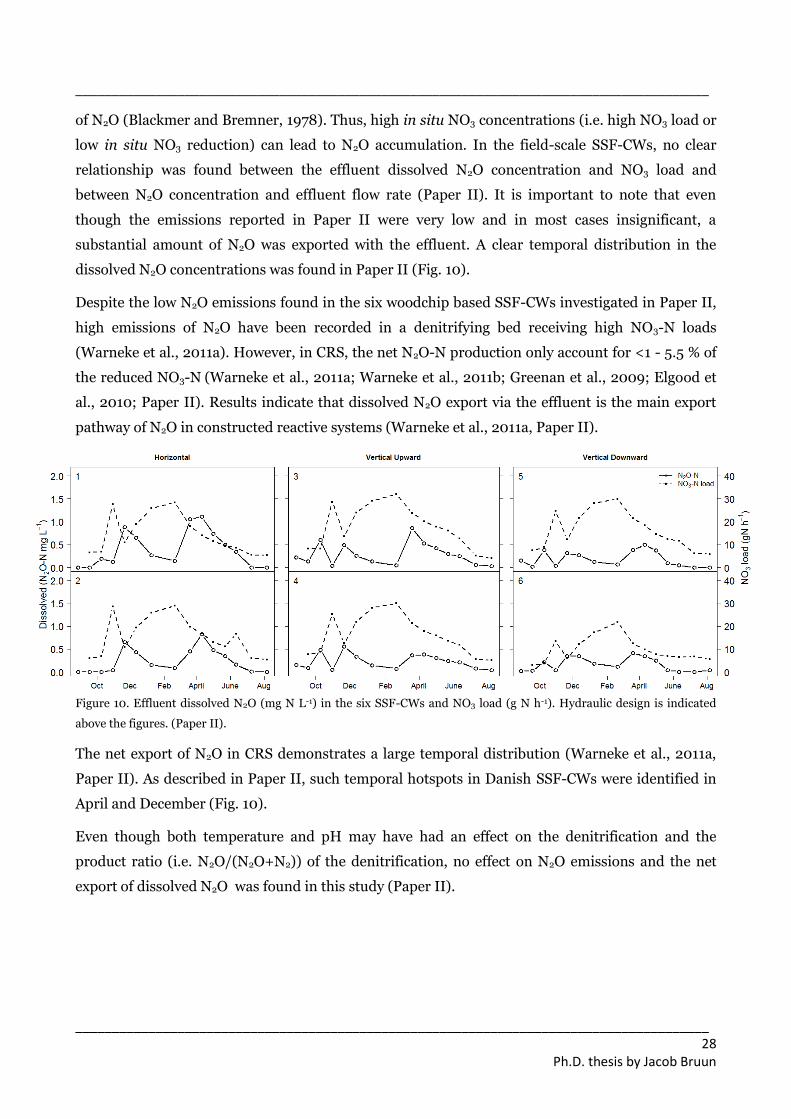
_______________________________________________________________________________________
_______________________________________________________________________________________ 28
Ph.D. thesis by Jacob Bruun
of N2O (Blackmer and Bremner, 1978). Thus, high in situ NO3 concentrations (i.e. high NO3 load or
low in situ NO3 reduction) can lead to N2O accumulation. In the field-scale SSF-CWs, no clear
relationship was found between the effluent dissolved N2O concentration and NO3 load and
between N2O concentration and effluent flow rate (Paper II). It is important to note that even
though the emissions reported in Paper II were very low and in most cases insignificant, a
substantial amount of N2O was exported with the effluent. A clear temporal distribution in the
dissolved N2O concentrations was found in Paper II (Fig. 10).
Despite the low N2O emissions found in the six woodchip based SSF-CWs investigated in Paper II,
high emissions of N2O have been recorded in a denitrifying bed receiving high NO3-N loads
(Warneke et al., 2011a). However, in CRS, the net N2O-N production only account for <1 - 5.5 % of
the reduced NO3-N (Warneke et al., 2011a; Warneke et al., 2011b; Greenan et al., 2009; Elgood et
al., 2010; Paper II). Results indicate that dissolved N2O export via the effluent is the main export
pathway of N2O in constructed reactive systems (Warneke et al., 2011a, Paper II).
Figure 10. Effluent dissolved N2O (mg N L-1) in the six SSF-CWs and NO3 load (g N h-1). Hydraulic design is indicated
above the figures. (Paper II).
The net export of N2O in CRS demonstrates a large temporal distribution (Warneke et al., 2011a,
Paper II). As described in Paper II, such temporal hotspots in Danish SSF-CWs were identified in
April and December (Fig. 10).
Even though both temperature and pH may have had an effect on the denitrification and the
product ratio (i.e. N2O/(N2O+N2)) of the denitrification, no effect on N2O emissions and the net
export of dissolved N2O was found in this study (Paper II).

_______________________________________________________________________________________
_______________________________________________________________________________________ 29
Ph.D. thesis by Jacob Bruun
5.1.1 Nitrous oxide in European context
On a global scale, the primary sources for N2O are natural and agricultural soils (6.0 tonnes N2O-N
year-1 and 3.5 tonnes N2O-N year-1, respectively) (IPCC, 2007). Nitrous oxide emissions from CRS
vary considerably from approximately zero to 1.12 Kg N2O-N ha-1 year-1. Emissions are comparable
to those reported from European forested and grassland ecosystems (0.122 to 7.3 Kg N2O-N ha-1
year-1) (Machefert et al., 2002). Considerable N2O emissions have been observed in other
denitrifying ecosystems such as riparian buffer strips (20 Kg N2O-N ha-1 year-1) (Hefting, 2003) and
European agricultural ecosystems (2.18 to 38.32 Kg N2O-N ha-1 year-1) (Machefert et al., 2002).
5.2 Methane
The most important control of CH4 emissions, once anaerobic conditions are obtained is the C
availability (Whalen et al., 2005). Conditions favourable for methanogenesis (redox potentials < -
200mV) (Le Mer and Roger, 2001) likely prevail under the constantly saturated (predominantly
anoxic) conditions under which CRS operate.
The dissolved concentrations of CH4 observed in CRS range from ~ 0 to 326 mg CH4 L-1 (Elgood et
al., 2010; Moorman et al., 2010; Warneke et al., 2011a; Paper II). The highest dissolved
concentrations (i.e. 326 mg L-1) were observed in the deeper layers of a denitrifying wall (Moorman
et al., 2010), which illustrates that woodchips can produce substantial amounts of CH4 given the
right conditions.
The net export of CH4 (emissions + dissolved export) usually show large temporal variability
associated with high HRT (i.e. exhaustion of NO3 along with other terminal electron acceptors (e.g.
SO4) (Elgood et al. 2010; Moorman et al. 2010; Warneke et al. 2011a; Paper II). Methanogenesis is
supressed at high concentrations of thermodynamically favourable electron acceptors (e.g. O2, NO3
and SO4); thus, high HLR of O2, NO3 and SO4 rich drainage discharge inhibits CH4 production.
Clearly the effluent flow rate (i.e. HRT) was the most important factor for net CH4 production and
subsequent CH4 emission in woodchip-based SSF-CWs (Paper II) and other CRS (Elgood et al.
2010; Moorman et al. 2010; Warneke et al. 2011a). For the SSF-CWs investigated in this Ph.D.
thesis, CH4 emissions increased exponentially with decreasing effluent flow rates (i.e. longer HRTs
(Fig. 11)). In comparison with the NO3 reduction efficiency observed during the same period
(August 2013 to September 2014) in the six SSF-CWs, a clear link between the depletion of NO3 at a
HRT of ~ 60 hours (Fig. 12) and increasing CH4 emissions was observed (Fig. 11). However, as
showed in Fig.11, CH4 emission also occurs prior to the 60 hours mark, at which it must be
assumed, that NO3 were still present in the mobile pore-water.

_______________________________________________________________________________________
_______________________________________________________________________________________ 30
Ph.D. thesis by Jacob Bruun
Figure 11. Methane emission versus effluent flow rate, translated into hydraulic residence time (HRT), based on total
porosity (Paper I). Open and closed circles represent SSF-CWs with media woodchip ratios of 1:1 and 3:1, respectively.
Dotted lines represent the 60 hour HRT mark.
Fig. 12. Nitrogen removal efficiency (NO3-Ninfluent – (NO3-Neffluent + NO2-Neffluent + N2O-Neffluent ))/ NO3-Ninfluent in the six
SSF-CWs in Skannerup, Denmark, from 28/8 to 2013-18/09-2014. The hydraulic residence time is derived from the
effluent flow rate and the total-porosity of the filter mixtures obtained in Paper I).
At HRTs < 60 hours, net production and emission of CH4 were observed (Fig.11) even though both
NO3 and SO4 occurred in relatively high concentrations in the effluent. The existence of immobile
domains, in which the supply of oxidised species is restricted to diffusion, may function as highly
reductive micro-sites in which methanogenesis could persist. Methanogenic activities in the
immobile domains will consequently create a CH4 concentration gradient between the mobile and
the immobile domains, which would drive CH4 into to the mobile domain, from where it can be
exported as dissolved gas, or emitted to the atmosphere.
The more pronounced non-equilibrium transport in the up-flow SSF-CW, also demonstrating a
longer residence time for solutes in the immobile domains (Paper III) suggest, that this particular

_______________________________________________________________________________________
_______________________________________________________________________________________ 31
Ph.D. thesis by Jacob Bruun
SSF-CW, had a immobile domain in which methanogenic activity could persist. In support, a
relatively larger (though no significantly) net CH4 production observed in the up-flow SSF-CWs
(Paper II).
Temperature is a strong driver of methanogenesis (Dunfield et al., 1993; Le Mer and Roger, 2001;
Moore and Dalva, 1993). In drained agricultural landscapes, the drainage discharge is typically
high during summer months (Simmelsgaard, 1994) as is the case with the temperature; thus, the
combined effect of low summer discharge and high summer temperatures might create temporal
hot-spots for CH4 emission.
5.2.2 Methane in global context
The CH4 emissions reported in Paper II were high compared to emissions observed in natural and
restored riparian wetlands (-0.12 to 38 g CH4-C m,-2 year-1) (Audet et al., 2013a and b), various
other wetlands worldwide (131 to 912 mg CH4 m-2 day-1) (Whalen et al., 2005) and in agricultural
NO3 mitigation systems such as constructed ponds (range 0-54 mg CH4 m-2 h-1) (Stadmark and
Leonardson, 2005). Even higher CH4 emissions have been reported from landfills (up to 75 g C m-2
h-1) (Boerjesson and Svensson, 1977; Chanton and Liptay 2000). Given the conditions reported in
Paper II (i.e. generally high HRT, median = 57 hours), woodchip-based SSF-CWs are significant
sources of CH4. However, the low CH4 emissions found at high HLRs by Warneke et al. (2011a)
emphasise the importance of flow control in CRS to handle CH4 emissions.
5.3 The effect of the hydraulic design on greenhouse gas export
As the N2O emissions reported in Paper II were insignificant, no effect of the flow design was found
for N2O.
The convective upward transport of dissolved CH4 implied that the highest emissions occurred
from the up-flow SSF-CWs (Paper II). However, total net CH4 production was not affected by the
hydraulic design. The export ratio (the ratio between the gas export via direct air emission and the
effluent) was however affected by the hydraulic design; i.e. a larger proportion of the net total CH4
export took place via emission in the up-flow SSF-CW (77%) and a significantly smaller proportion
was emitted in the down-flow SSF-CW (12%) with the horizontal-flow SSF-CWs ranging in-
between (59%).

_______________________________________________________________________________________
_______________________________________________________________________________________ 32
Ph.D. thesis by Jacob Bruun
6 Concluding remarks and perspectives
This Ph.D. thesis describes the investigations of solute transport, NO3 transformation and export of
the greenhouse gases.
Papers I and III demonstrate that the transport of solutes in woodchip-based filter media clearly
demonstrated non-equilibrium characteristics. The non-equilibrium transport, including a
diffusional mass exchange between a mobile and an immobile domain, was due to the dual porous
characteristic of the woodchip media. However, as described in Paper I, it could not be verified
whether the intra-granular pores in woodchips were accessible for anion solutes (e.g. NO3 and Br),
allowing them to function as a NO3 sinks. Intra-granular diffusion was however demonstrated in
woodchips (Paper III). The results from the diffusion experiment, suggested that anion exclusion
restricted the magnitude of intra-granular diffusion of anions (i.e. Br) as compared to neutrally
charged solutes (i.e. 3H2O).
Diffusional transport of NO3 into the immobile domain allowed mixed woodchip media to
remove/retain NO3 even at high HLRs when conditions in the mobile domain were unfavourable to
denitrification (i.e. O2 concentrations > 0.2 mg L-1) (Paper I).
Among the woodchip mixtures investigated in this Ph.D. study (Paper I), mixtures of willow
woodchip and crushed seashells demonstrated the highest potential for NO3 removal, exhibiting
flow normalised removal rates of 0.35-3.97 g N m-3 m-3. At the conditions presented in Paper I, it
seemed that the denitrification was limited at low woodchip content (1:1), as compared to high
woodchip content (3:1) most likely due to the availability of C and/or due to lower microbial
abundance associated with a lower woodchip mass. Although, the effect of WR in the present study,
indicated that carbon was limiting N removal at the low WR ratio, it is not clear whether a further
increase in WR above a 3:1 volume ratio would further enhance the N reduction efficiency.
The results in Paper III showed that the hydraulic design affect the solute transport. Most
pronounced non-equilibrium transport was found in the up-flow SSF-CW. In addition, the fast
initial tracer mass recovery (≤50%), suggested a relative high mobile pore-water velocity in the
mobile domain, which reduced the time for biochemical processes, resulting in a lower N removal
rate. In contrast, the down-flow hydraulic design demonstrate the highest NO3 removal, which
were related to the slower initial tracer mass recovery (≤50%) (i.e. slower pore-water velocities,
and thus longer solute residence time in the mobile domain).
Monitoring of GHG emissions over a one-year period showed that N2O-N emissions were, in most
cases, low (< 18 g N m-2 year-1) and/or insignificant. Instead N2O accumulated in the pore-water
and was exported as dissolved N2O in the effluent, which exhibited two temporal hotspots for N2O
accumulation (April and December). The main GHG produced and emitted from the SSF-CWs was

_______________________________________________________________________________________
_______________________________________________________________________________________ 33
Ph.D. thesis by Jacob Bruun
CH4, demonstrating yearly emissions of 390 – 1637 g CH4-C m-2 year-1. However, a relatively large
fraction of the net production of CH4 was exported as dissolved CH4 via the effluent. The
fractionation between emission of CH4 and dissolved export of CH4 was controlled by the hydraulic
design. The vertical upward convective transport of dissolved gases enhanced the CH4 emission,
whereas the vertical downward convective transport hampered CH4 emission. The CH4 export in
the horizontal constituted almost equal amounts exported by emissions and as dissolved CH4 in the
effluent.
Dissolved gases exported in the effluent were not considered an issue because of a potential for
further oxidation of CH4 and reduction of N2O in the receiving waters. It should be noted, though,
that constructions designed to aerate the effluent before it reaches the receiving waters may
facilitate the emission of dissolved gases. Thus, even though these constructions may improve the
O2 status of the effluent, the potential release of GHG gases must be taken into consideration.
Based on the results from this Ph.D. thesis, it can be concluded that CRS (including woodchip-
based SSF-CWs) are overall a promising measure for mitigating NO3 loads from agricultural
drainage discharge.
However, some issues need further consideration:
An increase in woodchip content beyond the ratios described in the Ph.D. thesis might further
improve the NO3 reduction rate.
The large specific surface area, indicate that the woodchips might function well to retain sorbing
contaminants, such as pesticides. This may add to the benefits of woodchip-based treatment
systems.
As suggested in this Ph.D. thesis, a vertical down-flow hydraulic design may hamper CH4 emission
due the convective mass transport of dissolved CH4 counteracting the upward diffusion transport
of CH4, but also due the a relatively smaller fractions of the water-filler pore space being immobile
(i.e. a potential source of CH4) In addition, vertical down-flow did facilitate a higher NO3-N
removal rate.
The main controlling factor for NO3 as well as of the net CH4 production and subsequent CH4
emission was the loading rate of terminal electron acceptors (e.g. O2, NO3, SO4) and equally
important, the time for TEA consumption and CH4 production (i.e. HRT). Thus, the importance of
flow control in CRS (e.g. woodchip-based SSF-CWs) is emphasized by this work.
Flow control using an adjustable in- or outlets may be used, to control the volume of the filter
matrix and therefore also to the HRT, but also the height of the un-saturated layer (i.e. the
possibility of CH4 oxidation). This could either be done by manual adjustment in an expected pre-
defined period flow period or by installing an intelligent device controlling the height of the outlet

_______________________________________________________________________________________
_______________________________________________________________________________________ 34
Ph.D. thesis by Jacob Bruun
pipe based on flow measurements. However, such an installation requires maintenance in an
otherwise low-maintenance technology.
_______________________________________________________________________________________
_______________________________________________________________________________________ 35
Ph.D. thesis by Jacob Bruun
7 References
Audet, J., Elsgaard, L., Kjaergaard, C., Larsen, S.E., Hoffmann, C.C., 2013a. Greenhouse gas
emissions from a Danish riparian wetland before and after restoration. Ecol. Eng. 57, 170-182.
Audet, J., Johansen, J.R., Andersen, P.M., Baattrup-Pedersen, A., Brask-Jensen, K.M., Elsgaard,
L., Kjaergaard, C., Larsen, S.E., Hoffmann, C.C., 2013b. Methane emissions in Danish riparian
wetlands: Ecosystem comparison and pursuit of vegetation indexes as predictive tools. Ecol.
Indications. 34, 548-559.
Baggs, E.M., 2008. A review of stable isotope techniques for N2O source partitioning in soils:
recent progress, remaining challenges and future considerations. Rapid Communications in Mass
Spectrometry 22 (11), 1664-1672
Baker, L.A., 1992. Introduction to nonpoint source pollution in the United States and prospects for
wetland use. Ecol. Eng., 1, 1-26.
Baldocchi, D.D., 2003. Assessing the eddy covariance technique for evaluating carbon dioxide
exchange rates of ecosystems: past, present and future. Global Change Bio. 9(4). 479-492.
Baldocchi, D.D., Hincks, B.B., Meyers, T.P., 1988. Measuring biosphere-atmosphere exchanges of
biologically related gases with micrometeorological methods. Ecology 69(5), 1331-1340.
Boerjesson, G., Svensson, B.H., 1997. Nitrous oxide emissions from landfill cover soils in Sweden.
Tellus 49B: 357–363.
Blackmer, A.M., Bremner, J.M., 1978. Inhibitory effect of nitrate on reduction of N2O to N2 by soil
microorganisms. Soil Biol. Biochem. 10 (3), 187-191.
Blicher-Mathiesen, G., Grant, R., Jensen, P.G., Hansen, B., Thorling, L., 2011.
Landovervaagningsopland 2011. NOVANA. DEC report no. 31. 40 p.
Bollag, J. M., Orcutt, M.L., Bollag, B., 1970. Denitrification by isolated soil bacteria under various
environmental conditions. Soil Sci. Soc. Am. Proc. 34, 875-879.
Brusseau, M.L., Rao, P.S.C., 1990. Modeling solute transport in structured soils: a review.
Geoderma 46, 169-192.
Bruun, J., 2011. Anvendelsen af træflis som kulstofkilde for denitrificerende bakterier i
minivådområder. Mc. thesis, Aarhus Universitet, Denmark.
Cameron, S.G, Schipper, L.A., 2010. Nitrate removal and hydraulic performance of organic carbon
for use in denitrification beds. Ecol. Eng. 36: 1588–1595.
_______________________________________________________________________________________
_______________________________________________________________________________________ 36
Ph.D. thesis by Jacob Bruun
Cameron, S.G., Schipper, L.A. 2011. Evaluation of passive solar heating and alternative flow
regimes on nitrate removal in denitrification beds. Ecological Engineering, 37(8), 1195-1204.
Cameron, S.G., Schipper, L. A., 2012. Hydraulic properties, hydraulic efficiency and nitrate
removal of organic carbon media for use in denitrification beds. Ecol. Eng. 41: 1–7.
Canga, E., Iversen, B.V., Kjaergaard, C., 2014. A simplified transfer function for estimating
saturated hydraulic conductivity of porous drainage filters. Water, Air, & Soil Pollution 225(1), 1-13.
Canga, E., 2015. Hydro-geochemical processes affection phosphorus retention in coarse granular
drainage filters. PhD Dissertation. Aarhus University, Department of Agroecology, Science and
Techonology, Denmark, pp. 1-134
Canga, E., Kjaergaard, C., Iversen, B.I., Heckrath, G.J., 2015. Agricultural drainage filters. I. Filter
hydro-physical properties and tracer transport. J. Environ Quality (Submitted 21.09.2015)
Carpenter, S R., Caraco, N.F., Correll, D.L., Howarth, R.W., Sharpley, A.N., Smith, V.H., 1998. Non
point pollution of surface waters with phosphorus and nitrogen. Ecological Applications, 8(3), 559-
568.
Chanton, J.P., Liptay, K., 2000. Seasonal variation in methane oxidation in a landfill cover
soil as determined by an in situ stable isotope technique. Global Biogeochem. Cycle 14: 51-60.
Chazarenc, F., Gérard, M., Gonheir, Y., 2003. Hydrodynamics of horizontal subsurface flow
constructed wetlands. Ecological Engineering, 21 (2-3), 165-173.
Chun, J.A., Cooke, R.A., Eheart, J.W., Cho, J., 2009. Estimation of flow and transport parameters
for woodchip-based bioreactors: II. field-scale bioreactor. Biosyst. Eng. 105, 95–102.
Christianson, L., Christianson, R., Helmers, M., Bhandari, A., 2010. Hydraulic property
determination of denitrifying bioreactor fill media. Appl. Eng. Agric. 26, 849–854.
Cole, J.J., and Caraco, N.F., 1998. Atmospheric exchange of carbon dioxide in a low-wind
oligotrophic lake measured by the addition of SF6. Limnol. Oceanogr. 43:647-656
Dalahmeh, S.S., Hylander, L.D., Vinneras, B., Pell, M., Oborn, I., Jonsson, H., 2011. Potential of
organic filter materials for treating greywater to achieve irrigation quality: a review. Water Sci.
Technol. 63, 1832.
Deguchi, S., Shimoshige, H., Tsudome, M., Mukai, S. A., Corkery, R. W., Ito, S., Horikoshi, K., 2011.
Microbial growth at hyperaccelerations up to 403,627× g. Proceedings of the National Academy of
Sciences, 108(19), 7997-8002.

_______________________________________________________________________________________
_______________________________________________________________________________________ 37
Ph.D. thesis by Jacob Bruun
Dinners, D.L., Karlen, D.L., Jaynes, D.B., Kaspar, T.C., Hatfield, J.L., Colvin, T.S., Cambardella,
C.A., 2002. Nitrogen management strategies to reduce nitrate leaching in tile-drained Midwestern
soils. Agron. J., 94, 153-171.
Directive 2000/60/EC. Directive 2000/60/EC of the European Parliament and of the Council of
23 October 2000 establishing a framework for community action in the field of water policy. J. Eur.
Communities L327:1–72.
Domingos, S., Boehler, K., Felstead, S., Dallas, S., Ho, G., 2009. Effect of External Carbon Sources
on Nitrate Removal in Constructed Wetlands Treating Industrial Wastewater : Woodchips and
Ethanol Addition. Technol. Manag. Sustain. Biosyst. 157–167.
Drizo, A., Frost, C.A., Grace, J., Smith, K.A, 2000. Phosphate and ammonium removal in a pilot-
scale constructed wetland with horizontal subsurface flow using shale as a substrate. Water
Research, 34 (9), 2483-2490.
Dunfield, P., Knowles, R., Dumont, R., Moore T.R., 1993. Methane production and consumption in
temperate and subarctic peat soils: Response to temperature and pH. Soil Biology and
Biochemistry 25:321-326.
Elgood, Z., Robertson, W.D., Schiff, S.L., Elgood, R., 2010. Nitrate removal and greenhouse gas
production in a stream-bed denitrifying bioreactor. Ecol. Eng. 36 (11), 1575-1580.
FAO, 2003. World agriculture: towards 2015/2030. An FAO perspective. In. J. Bruinsma (Ed).
Food and Agriculture Organization (FAO), London, UK.
Fausey N.R., Brown L.C., Belcher H.W., Kanwar R.S., 1995. Drainage and water quality in great
lakes and cornbelt states. J. Irrig. Drain. Eng., 121, 283-288.
Firestone, M.K. (1982). 8. Biological Denitrification. Nitrogen in Agricultural Soils, ASA-CSSA-
SSSA, Madison, 289-326.
Galloway, J.N., Schlesinger, W.H., Levy, H., Michaels, A., Schnoor, J.L., 1995. Nitrogen fixation:
anthropogenic enhancement – environmental response. Global Biogeochem. Sci. 9, 235-252.
García, J., Chiva, J., Aguirre, P., Álvarez, E., Sierra, J.P., Mujeriego, R., 2004. Hydraulic behaviour
of horizontal subsurface flow constructed wetlands with different aspect ratio and granular
medium size. Ecol. Eng. 23, 177–187.
Gibert, O., Pomierny, S., Rowe, I., Kalin, R.M., 2008. Selection of organic substrates as potential
reactive materials for use in a denitrification permeable reactive barrier (PRB). Bioresour. Technol.
99, 7587–96.
_______________________________________________________________________________________
_______________________________________________________________________________________ 38
Ph.D. thesis by Jacob Bruun
Greenan, C.M., Moorman, T.B., Kaspar, T.C., Parkin, T.B., Jaynes, D.B., 2006. Comparing carbon
substrates for denitrification of subsurface drainage water. J. Environ. Qual. 35, 824–9.
Greenan, C.M., Moorman, T.B., Parkin, T.B., Kaspar, T.C., Jaynes, D.B., 2009. Denitrification in
wood chip bioreactors at different water flows. J. Environ. Qual. 38, 1664–71.
Hacke, U.G., Sperry, J. S., 2001. Functional and ecological xylem anatomy. Perspectives in plant
ecology, evolution and systematics, 4(2), 97-115.
Healy, M.G., Ibrahim, T.G., Lanigan, G.J., Serrenho, A.J., Fenton, O., 2012. Nitrate removal rate,
efficiency and pollution swapping potential of different organic carbon media in laboratory
denitrification bioreactors. Ecol. Eng. 40, 198–209.
Headley, T.R, Kadlec, R.H., 2007. Conducting hydraulic tracer studies in constructed wetlands: A
practical guide. Ecohydrology and hydrobiology 8 (3-4), 269-282.
Hefting, M.M, Bobbink, R., de Caluwe, H., 2003. Nitrous oxide emissions and denitrification in
chronically nitrate-loaded riparian buffer zones. J. Environ. Qual. 32 (4), 1194-1203.
Hill, A.R., 1996. Nitrate Removal in Stream Riparian Zones. J. Environ. Qual. 25, 743.
Hoffmann, C.C., Kjaergaard, C., 2015. Testing of horizontal and vertical subsurface flow wetlands
with mixed matrices of woodchips and mussel shells for removal of nutrients in agricultural
drainage water. In preparation.
Hoffmann C.C., Baattrup-Pedersen A., 2007. Re-establishing freshwater wetlands in Denmark.
Ecol. Eng. 30, 157–166.
Howarth, R.W., Billen, G., Swaney, D., Townsend, A., Jaworski, N., Lajtha, K., Downing, J.A.,
Elmgren, R., Caraco, N., Jordan, T., Berendse, F., Ferney, J., Kudeyarov, V., Murdoch, P., Zhao-
liang, Z., 1996. Regional nitrogen budgets and riverine inputs of N and P for the drainage to the
North Atlantic Ocean: natural and human influences. Bio-geochemistry, 35, 75-139.
IPCC, 2007. Climate change 2007: The physical Science Basis. Contribution of Working Group I to
the Fourth Assessment. Report of the Intergovernmental Panel on Climate Change. Cambridge,
United Kingdom and New York, NY, USA.
Jacinthe, P.A., Groffman, P.M., 2001. Silicone rubber sampler to measure dissolved gases in
saturated soils and waters. Soil Biol. Biochem. 33:907-912
Jaynes, D.B., Kaspar, T.C., Moorman, T.B., Parkin, T.B., 2008. In situ bioreactors and deep drain-
pipe installation to reduce nitrate losses in artificially drained fields. J. Environ. Qual. 37, 429–
Kadlec, R. H., Wallace, S., 2008. Treatment wetlands, 2nd ed. CRC Press, Boca Raton, FL, USA.
CRC press, pp 1 - 867.
_______________________________________________________________________________________
_______________________________________________________________________________________ 39
Ph.D. thesis by Jacob Bruun
Keeney, D.R., Fillery ,I.R., Marx, G.P., 1979. Effect of temperature on the gaseous nitrogen
products of denitrification in a silt loam soil. Soil Sci. Soc. Am. J. 43, 1124-1128.
Knowles, R., 1982. Denitrification. Microbiol. Rewiews 46, 43–70.
Koskiaho, J., Ekholh, P., Räty, M., Riihimäki, J., Puustinen, M., 2003. Retaining agricultural
nutrients in constructed wetlands - experiences under boreal conditions. Ecological engineering,
20, 89-103.
Kovacic, D.A., David, M.B., Gentry, L.E., Starks, K.M., Cooke, R.A., 2000. Effective of constructed
wetlands in reducing nitrogen and phosphorus export from agricultural tile drains. J. Environ.
Qual., 29, 1262-1274.
Kronvang, B., Andersen, H.E., Børgesen, C., Dalgaard, T., Larsen, S.E., Bøgestrand, J., Blicher-
Mathiesen, G., 2005. Effects of policy measures implemented in Denmark on nitrogen pollution of
the aquatic environment. Environmental Science and policy, 11, 141-152.
Kronvang, B., Behrendt, H., Andersen, H.E., Arheimer, B., Barr, A, Borgvang, S.A., Bouraoui, F.,
Granlund, K., Grizzetti, B., Groenendijk, P., Schwaiger, E., Hejzlar, J., Hoffmann, L., Johnsson, H.,
Panagopoulos, Y., Lo Porto, A, Reisser, H., Schoumans, O., Anthony, S., Silgram, M., Venohr, M.,
Larsen, S.E., 2009. Ensemble modelling of nutrient loads and nutrient load partitioning in 17
European catchments. J. Environ. Monit. 11, 572–83.
Le Mer, J., Roger, P., 2001. Production, oxidation, emission and consumption of methane by soils:
A review. European Journal of Soil Biology, 37 (1), 25-50.
Lens, P., 1994. Direct treatment of domestic wastewater by percolation over peat, bark and
woodchips. Water Res. 28, 17–26.
Levenspiel, O., 1972. Chemical reaction engineering, 2nd Ed., Wiley, New York.
Livingston, G., Hutchinson, G., 1995. Enclosure-based measurement of trace gas exchange
applications and source of error. In: P.A. Matson & R.C. Harris (Eds.). Biogenic trace gases:
measuring emissions from soil and water. Blackwell Science Ltd. Oxford, U.K., 14-51.
Lowrance, R., Altier, L.S., Newbold, J.D., Schnabel, R.R., Groffman, P.M., Denver, J.M., Correll,
D.L., Gillian, J.W., Robinson, J.L., 1997. Water quality functions of riparian forest buffers in
Chesapeake Bay watersheds. Environ. Manage., 21, 687-712.
Machfert, S.E., Dise, N.B., Goulding, K.W.T., Whitehead, P.G., 2002. Nitrous oxide emission from
a range of land uses across Europe. Hydrol. Earth Syst. Sci. 6(3), 325-337.
_______________________________________________________________________________________
_______________________________________________________________________________________ 40
Ph.D. thesis by Jacob Bruun
Makris, K.C., El-Shall, H., Harris, W.G., O'Connor, G.A., Obreza, T.A., 2004. Intraparticle
phosphorus diffusion in a drinking water treatment residual at room temperature. Journal of
Colloid and Interface Science 277, 417-423.
Martinez, C. J., & Wise, W. R. (2003). Hydraulic analysis of Orlando easterly wetland. Journal of
Environmental Engineering, 129(6), 553-560.
Moore, T.R., Dalva, M., 1993. The influence of temperature and water table position on carbon
dioxide and methane emissions from laboratory columns of peatland soils. Journal of Soil Science
44:651-664
Moorman, T.B., Parkin, T.B., Kaspar, T.C., Jaynes, D.B., 2010. Denitrification activity, wood loss,
and N2O emissions over 9 years from a wood chip bioreactor. Ecol. Eng. 36, 1567–1574.
Morris, J.E., 2006. Organically bound tritium in sediments from the Severn estuary, UK,
University of Southampton.
Nelson, W.M., Gold A.J., Groffman P.M., 1995. Spatial and temporal variation in groundwater
nitrate removal in a riparian forest. Journal of Environmental Quality 24 (4), 691-699.
Pedersen, A.R., 2011. HMR. Flux estimations with static chamber data.
Pennell, K.D. 2002. Specific surface area. In: J.H. Dane and G.C Topp editors, Methods of Soil
Analysis. Part 4. Physical Methods. SSSA Book Ser. 5. SSSA, Madison, WI. 295-315
Persson, J., Somes, N., Wong, T., 1999. Hydraulics efficiency of constructed wetlands and ponds.
Water Sci. Technol., 40 (3), 291-300.
Reddy, K.R., Rao, P.S.C., Jessup, R.E., 1982. The Effect of Carbon Mineralization on Denitrification
Kinetics in Mineral and Organic Soils. Soil Sci. Soc. Am. J., 46 (1), 62-68.
Reddy, K.R., Delanue, R.D.,2008. Biogeochemistry of wetlands: Science and applications. CRC
Press, Boca Raton, Florida, 774 pp.
Reinhardt, M., Müller, B., Gächter, R., Wehrli, B., 2006. Nitrogen removal in a small constructed
wetland: An isotope mass balance approach. Environ Sci. Technol.. 40, 3313-3319.
Robertson, W.D., Cherry, J.A., 1995. In situ denitrification of septic-system nitrate using reactive
porous media barriers: field trials. Ground Water 33, 99–111.
Robertson, W.D., Yeung, N., van Driel, P.W., Lombardo, P.S., 2005. High- permeability layers for
remediation of ground water; go wide, not deep. Ground Water 43(4), 574-581.
Robertson, W.D., Merkley, L.C., 2009. In-stream bioreactor for agricultural nitrate treatment. J.
Environ. Qual. 38, 230–237.
_______________________________________________________________________________________
_______________________________________________________________________________________ 41
Ph.D. thesis by Jacob Bruun
Robertson, W.D., Ptacek, C.J., Brown, S.J., 2009. Rates of nitrate and perchlorate removal in a 5-
year-old wood particle reactor treating agricultural drainage. Ground Water Monit. Remediat. 29
(2), 87-94.
Seitzinger, S., Harrison, J.A., Bohlke, J.K., Bouwman, A.F., Lowrance, R., Peterson, B., Tobias, C.,
Van Drecht, G., 2006. Denitrification across landscapes and waterscapes: A Synthesis. Ecol. Appl.,
2064–2090.
Schipper, L.A., Vojvodic-Vukovic, M., 1998. Nitrate removal from ground water using a
denitrification wall amended with sawdust: field trial. J. Environ. Qual. 27, 664–668.
Schipper, L.A., McGill A., 2008. Nitrogen transformation in a denitrification layer irrigated with
dairy factory effluent. Water Res. 42, 2457–2464.
Schipper, L. A., Robertson, W.D., Gold, A.J., Jaynes, D.B., Cameron, S.C., 2010. Denitrifying
bioreactors-An approach for reducing nitrate loads to receiving waters. Ecol. Eng. 36, 1532–1543.
Simmelsgaard, S. E., 1994. Nitratkvælstof i drænvand 1971-91: Måling af nitratkvælstof i drænvand
samt modelberegning af afstrømning og kvælstofudvaskning til undergrunden. SP rapport Nr.
47/1994, Statens Planteavlsforsøg, 67pp.
Smith, V.H, Tilman, G.D., Nekola, J. C., 1999. Eutrophication: impacts of excess nutrient inputs on
freshwater, marine and terrestrial ecosystems. Environmental pollution, 100, 179-196.
Spalding, B. P., Watson, D. B., 2006. Measurement of dissolved H-2, O-2, and CO2 in groundwater
using passive samplers for gas chromatographic analyses. Environ. Sci. Technol. 40:7861-7867
Stadmark, J, Leonardson, L., 2005. Emissions of greenhouse gases from ponds constructed for
nitrogen removal. Ecol. Eng. 25, 542-551.
Suliman, F. F. H. K., French, H. K., Haugen, L. E., & Søvik, A. K. (2006). Change in flow and
transport patterns in horizontal subsurface flow constructed wetlands as a result of biological
growth. Ecological Engineering, 27(2), 124-133.
Tanner, C.C., Nguyen, M.L., Sukias, J.P.S., 2005. Nutrient removal by a constructed wetland
treating subsurface drainage from grazed dairy pasture. Agriculture, Ecosystems and Environment
105, 145-162.
Thiere, G., Stadmark, J., Weisner, S.E.B., 2011. Nitrogen retention versus methane emission:
Environmental benefits and risks of large-scale wetland creation. Ecol. Eng. 37, 6–15
Tiedje, J.M., Sexstone, A.J., Myrold, D.D., Robinson, J.A., 1982. Denitrification: ecological niches,
competition and survival. Antonie Van Leeuwenhoek 48, 569–83.

_______________________________________________________________________________________
_______________________________________________________________________________________ 42
Ph.D. thesis by Jacob Bruun
Turner, A., Millward, G.E., Stemp, M., 2009. Distribution of tritium in estuarine waters: the role of
organic matter. J. Environ. Radioact. 100, 890–895.
van Driel, P.W., Robertson, W.D., Merkley, L.C., 2006a. Denitrification of agricultural drainage
using wood-based reactors. Trans. ASAE 48, 121–128
van Driel, P.W., Robertson, W.D., Merkley, L.C., 2006b. Upflow reactors for riparian zone
denitrification. J. Environ. Qual. 35, 412–420.
Van Genuchten, M.Th., Wierenga, P.J., 1976. Mass transfer in sorbing porous media. Analytic
solutions. Soil Science Society Am. J. 44: 47–480.
Vitousek, P.M., Aber, J.D., Howarth, R.W., Likens, G.E., Matson, P.A., Schindler, D.W.,
Schlesinger, W.H., Tilman, D.G., 1997. Human alteration of global nitrogen cycle: Sources and
consequences. Ecol. Appl. 7 (3), 737-750.
Vymazal, J., 2007. Removal of nutrients in various types of constructed wetlands. Sci. Tot Envir.
380(1), 48-65.
Vymazal, J., 2009. The use constructed wetlands with horizontal sub-surface flow for various types
of wastewater. Ecol. Eng. 35 (1), 1-17.
Vymazal, J., 2011. Constructed wetlands for wastewater treatment: Five decades of experience.
Environmental Sci. Technol. 45, 61-69.
Warneke, S., Schipper, L.A., Bruesewitz, D.A., McDonald I., Cameron S., 2011a. Rates, controls and
potential adverse effects of nitrate removal in a denitrification bed. Ecol. Eng. 37, 511–522.
Whalen, S.C., 2005. Biogenchemistry of methane exchange between natural wetlands and the
atmosphere. Environ. Eng. Sci. 22 (1), 73-93.
Wood, W.W., Kraemer, T.F., Hearn, P.P., 1990. Intragranular diffusion: An important mechanism
influencing solute transport in clastic aquifers? Science 247, 1569-1572.
_______________________________________________________________________________________
_______________________________________________________________________________________ 43
Ph.D. thesis by Jacob Bruun
8. Appendix I
Nitrogen removal in permeable woodchips filters affected by hydraulic loading rate
and woodchips ratio
Jacob Bruun*1, 2, Carl Christian Hoffmann1, Charlotte Kjaergaard2
1Department of Bioscience, Aarhus University, 8600 Silkeborg, Denmark; 2Department of
Agroecology, Aarhus University, 8830 Tjele, Denmark
*Corresponding author: Jacob Vestergaard Druedahl Bruun, Department of Bioscience, Faculty
of Science and Technology, Aarhus University, Vejlsøvej 25, DK-8600 Silkeborg, Denmark. E-
mail:[email protected]
Glossary
GSD – Grain size distribution
Dx – Grain diameter at which x% of the filter material mass (g) is finer than
Cu – Uniformity coefficient – D60/D10
θx – Volume fraction of pores of size x (m3 m-3)
θtot – Total porosity (m3 m-3)
ρb – Bulk density (Kg m-3)
BTC – Breakthrough curve
V0 – Water-filled pore space (cm3)
V/V0 – Number of eluted pore volumes
M/M0 – Relative tracer mass recovery
WR – Woodchip ratio
Key words: Denitrification, Reactive woodchip filters, Physical non-equilibrium, Solute transport,
Hydraulic loading rate, Redox potential
_______________________________________________________________________________________
_______________________________________________________________________________________ 44
Ph.D. thesis by Jacob Bruun
Abstract
Unregulated and event-driven agricultural tile drainage discharge poses several challenges that
potentially limit the nitrate (NO3) reduction in woodchip-based constructed wetland systems
intercepting subsurface tile drains. Laboratory column tests were conducted to evaluate the
biogeochemical response of mixed reactive media (woodchips-Seashells and woodchips-Filtralite
mixtures) at two woodchips ratios (WR) to changes in the hydraulic loading rate (HLR). The tests
implied continuous loading of aerated NO3-N spiked artificial drainage water and tritium (3H2O)
breakthrough experiments. Flow normalized nitrate reduction rates were 0.35-3.97 g N m-3 L-1,
corresponding to N- removal efficiencies of 5 to 74% depending on HLR and filter mixtures. At
high HLR oxic conditions prevailed, thus N removal was restricted to the immobile domain,
controlled by diffusion. At lower HLR, progressively lower pore-water velocities allowed a longer
time for TEA consumption and thus N removal. An increase in the WR increased the N removal
rates, probably because the woodchips supported a higher denitrifying microbial population. In
general, the influence of WR on solute transport characteristic was not clear. Woodchip media
including a mineral fraction of crushed Seashells did demonstrate the highest flow N removal rates
and efficiencies, most likely due to the alkalizing effect of the Seashells, and was thus found to be
the best performing media to use in subsurface flow constructed wetlands targeting agricultural
drainage discharge.
_______________________________________________________________________________________
_______________________________________________________________________________________ 45
Ph.D. thesis by Jacob Bruun
1. Introduction
Agricultural nitrogen (N) loss is recognized as one of the main driving forces behind eutrophication
(Kronvang et al., 2009) and contributes to degradation of habitats and loss of biodiversity in inland
and coastal surface waters. In heavily drained agricultural catchments, subsurface tile drains act as
a major N transport pathway in Denmark (Blicher-Mathiesen et al., 2011) as well as in other
western countries (Domagalski et al., 2008; Rozemeijer et al., 2010).
Current efforts to reduce agricultural N losses include establishment of riparian buffer zones (Hill,
1996) and restoration of riparian wetlands (Hoffmann and Baattrup-Pedersen, 2007). The
efficiency of these measures may become limited, however, when subsurface tile drains in upland
agricultural fields discharges directly to surface waters. Surface flow constructed wetlands (CWs)
targeting the reduction of drainage discharge N losses have been applied as a local targeted
measure, but with highly variable efficiency (Koskiaho et al., 2003; Kovacic et al., 2000; Thiere et
al., 2011). Subsurface flow (SSF) CWs offers the potential for improved N removal by introducing a
permeable reactive filter media. Promising permeable filter media include woodchips, which have
previously proven highly effective in permeable reactive filters (Blowes et al., 1994; Robertson et
al., 2005; Robertson and Merkley, 2009).
In woodchip media, NO3 removal via denitrification, the stepwise reduction of NO3 or NO2 to N2O
or N2 (Knowles, 1982) is recognized as the dominant NO3 removal mechanism (Gibert et al., 2008;
Greenan et al., 2006). Denitrification is a facultative anaerobic microbial-facilitated process and is
primarily controlled by the availability of electron donors (carbon source) and terminal electron
acceptors (TEA) (among others NO3-, NO2
- and O2), temperature, the hydraulic residence time
(HRT) and the number and ecology of the present denitrifiers (Knowles, 1982; Reddy et al., 1982;
Seitzinger et al., 2006; Tiedje et al., 1982). In woodchip media, the denitrification is directly
affected by the high available carbon (electron donor) content (Burford and Bremner, 1975). The
high C availability indirectly affects the denitrification by inducing anoxic conditions (Robertson,
2010).
SSF-CWs receiving unregulated event-driven agricultural drainage discharge may experience
highly variable hydraulic loading rates (HLR). Particular stochastically occurring peak flow events
are critical as they significantly reduces the HRT of the discharging solute, thus reducing the
hydraulic residence time (HRT) and the time for TEA consumption (Greenan et al., 2006; Gibert et
al., 2008; Healy et al., 2006; Robertson, 2010). In addition, the HLR controls the pore-water
velocities, which in turn affect the transport of solutes (Rao et al., 1980). Non-equilibrium
transport due to incomplete mixing of the resident water and the replacing solute, arising from
local variations in pore water velocities and/or diffusive mass exchange between the mobile and
immobile pore domains (Van Genuchten and Wierenga, 1976), have been found in coarse
_______________________________________________________________________________________
_______________________________________________________________________________________ 46
Ph.D. thesis by Jacob Bruun
woodchip media having a dual porous structure (Cameron and Schipper, 2012). Herbert (2011)
suggested that immobile domains in woodchip media may potentially constitute microsites of
lower redox potential, and NO3-N diffusion into the immobile domain, may thus control NO3-N
reduction in woodchip filters.
The overall objective of the present study was to investigate the effect of hydraulic loading rate on
NO3 reduction efficiency at variable woodchip-mineral ratios (WR).
We hypothesized (i) that increasing hydraulic loading rate would increase non-equilibrium solute
transport, and decrease the NO3-N removal rate and efficiency, and (ii) that a larger woodchip
content would increase NO3-N removal efficiency possibly counteracting the negative effects of
increasing HLR.
In the current study, laboratory column tests were undertaken to assess the NO3-N removal rate
and efficiency as a function of HLR using four different reactive filter mixtures with two WRs.
Tritium (3H2O) tracer experiments were conducted to elucidate the solute transport behavior in the
different filter mixtures at variable HLRs.
2. Materials and methods
2.1 Filter characteristics and pretreatment
The media used in our experiments included a mixture of three commercially available granular
filter materials: i) Filtralite (2-4 mm), a light expanded clay aggregate (Saint-Gobain Weber A/S,
Norway), ii) Seashells (2-5 mm), crushed shells from the north-east coast of Denmark dried at 450-
800 °C (Danshells A/S, Denmark) and iii) willow woodchips (2-32 mm) (Nyvraa, Denmark). Four
different filter mixtures were combined by mixing woodchips with either Filtralite or Seashells at
woodchip:mineral volume ratios (WR) of 1:1 or 3:1. Prior to the experiment, the woodchips were air
dried for three days and subsequently prewashed for six weeks with tap water with a regular water
exchange (1.7 L Kg-1 week-1) to ensure leaching of easily dissolved carbon compounds, as suggested
by Schipper et al. (2010). Mineral fractions were water saturated for two weeks prior to
experimental start up. The pretreated filter fractions were mixed by hand to achieve 1:1 and 3:1
WRs (m3:m3). The filter mixtures were packed in stainless steel columns (9.8 cm inner diameter,
20 cm length) with six replicate columns for each of the four filter mixtures. Packing was done at
intervals of five cm followed by gently stamping ten times with a 1 kg weight to minimize
compaction of filter materials during the experiment.
2.2 Experimental set-up
_______________________________________________________________________________________
_______________________________________________________________________________________ 47
Ph.D. thesis by Jacob Bruun
A set-up of 24 stainless steel columns with aluminum caps was used to investigate N
transformation during convective discharge at variable HLRs (Fig. 1). Each column was operated at
water-saturated conditions with a continuous upward flow. Hydraulic loading rates were controlled
by peristaltic pumps (Version Ecoline, Ismatec, Wertheim, Germany). The column rested on a
stainless steel mesh (5 mm), and a porous membrane (SEFAR TETEX® DLW, pore size 161 µm)
was placed at both the inlet and the outlet to ensure an even distribution of influent and prevent
loss of filter material. Top and bottom caps were fitted with O-rings in order to keep the column
set-up gas- and watertight. Diffusion tight peekTM tubes (Sigma-Aldrich, Denmark) were used in all
connections between columns, the influent reservoir and the effluent sampling point. Each column
was connected to a three-way switch allowing application of two solutions: i) the influent solution,
O2 saturated and NO3-spiked (12 mg NO3-N L-1) artificial drainage water (ADW) (0.012 mM CaCl2,
0.015 mM MgCl2 and 0.12 mM NaCl; pH = 7.82, EC 2.24 x 10⁻³ S m-1) and 2) a tritiated (3H2O)
water solution (specific activity 1.28 MBq L-1). Oxygen saturation of the influents was obtained by
continuous aeration using aquarium pumps placed in the influent holding vessels. The 3H2O
solution was applied during the tracer experiment by switching on the three-way switch, thus
maintaining continuous constant infiltration. To measure the in situ redox potential (Eh), eight of
the 24 columns were equipped with six vertically installed platin (Pt) electrodes placed in pairs of
two at 5, 10 and 15 cm distance from the inlet and entering 2 cm into the columns. Reference redox
electrodes (REF 251, Radiometer Analytical SAS, Villeurbanne, France) were placed permanently
in the top 2 cm filter. Prior to the experiment, Pt electrode fittings were tested for diffusion
tightness.
{Insert figure 1}
2.4 N loading experiment
Prior to initiation of the experiment, all filters were slowly saturated from the bottom up with ADW
(NO3-N free) during 24 hours at HLR 0.58 cm h-1 to ensure escape of entrapped air. A subsequent
non-infiltration period of 7 days allowed all columns to reach an initial starting Eh of ~ 300mV.
Aeration of the NO3 spiked ADW influent was initiated within the start of the N loading. The
experiment was conducted in two steps with variable HLR. During step one, two times three
replicate columns for each of the four filter mixtures received either high HLR (1.27 cm h-1)
(column 1-12) or medium HLR (0.58 cm h-1) (column 13-24) for a duration of 30 days. Step one
was followed by a non-infiltration period of 10 days where Eh was restored to the initial level of 300
mV. During step two, HLR was reduced to moderate-low (0.38 cm h-1) (column 1-2) and low (0.29
cm h-1) (column 13-24), both flow rates having a duration of 48 days. Generally, each experimental
step lasted until steady state effluent NO3-N concentrations were observed in a series of samples
_______________________________________________________________________________________
_______________________________________________________________________________________ 48
Ph.D. thesis by Jacob Bruun
extracted over 10 to 15 days. All experiments were conducted in the dark in a 10 C° acclimated
room.
2.5 Effluent analysis
Column effluents were collected in acid-washed polyethylene (PE) pre-weighed bottles placed
directly beneath the effluent tubes and weighed at every sampling to control the actual HLR.
Effluent fractions were sampled in 1-3-day intervals for high and medium HLR and 3-5-day
intervals for moderate and low HLR.
Effluent pH was measured directly in fresh effluent samples with a portable pH meter (HQ11d
portable pH/ORP Meter, Hach, Colorado, USA). Subsequently, water samples were taken for
further chemical analysis.
Effluent fractions for nitrate (NO3-N), nitrite (NO2-N) and ammonium (NH4-N) analysis were
filtered through 45 µm Monta® membrane filters (Cat No MCEWGS047045, Frisenette, Denmark)
prior to freeze-storing. Effluent fractions for total organic carbon (TOC) and total organic nitrogen
(TON) were freeze-stored unfiltered. Prior to analysis, the frozen samples were slowly defrosted
overnight. Nitrate-N and NO2-N were analysed spectrophotometrically by flow injection (Lachat
QC 8000, Quickchem FIA+ method 10-107-04-1-C, Hach, Colorado, USA). Ammonium was
measured colorimetrically using a Shimadzu 1700 spectrophotometer (Shimadzu Corp., Kyoto,
Japan) according to a Danish/European standard method (DS/EN ISO 11732). TOC and TON were
analyzed using a TOC-L analyzer equipped with a TNM-L module addition (Shimadzu, Kyoto,
Japan).
Dissolved oxygen concentrations in the column effluent were measured in columns equipped with
Pt-electrodes at the end of each test using an optical oxygen meter (Fibox 3 trace, PreSens,
Regensburg, Germany).
2.6 Tracer experiment
Following the N transformation experiments, a tritium (3H2O) tracer experiment was carried out at
high, moderate and low HLR to investigate the solute transport behavior. A pulse of 3H2O-spiked
demineralized water was applied to the columns during continuous constant flow by switching the
three-way valve from the influent ADW to the 3H2O tracer. The duration of the pulse corresponded
to an application of 25 cm3 for each HLR. The three-way valve was switched back to influent ADW
after tracer application, maintaining a constant flow. Effluent fractions were sampled at high
frequency corresponding to either one sample per hour (high HLR) or one sample every second
hour (moderate and low HLR) until peak maximum was reached, followed by a systematic
reduction in sampling frequency. Effluent sampling continued until effluent 3H2O activities were <
100 disintegration per minute (DPM), which occurred after two to four eluted pore volumes (V/V0).
_______________________________________________________________________________________
_______________________________________________________________________________________ 49
Ph.D. thesis by Jacob Bruun
For each tracer application, 3H2O influent (C0) and effluent (C) activities were analyzed using liquid
scintillation counting (Tri-Carb 2250 CA).
2.7 Water retention characteristics and grain size distributions
Following column experiments, the filter columns were weighed and transferred to 1 bar HF
pressure plate cells (3000 CP00 (30100), PQ Potters Europa, Kirchheimbolanden, Germany) for
determination of water retention characteristics. Initially, the columns were slowly saturated from
the bottom up for 24 hours, followed by a steady increase in the pressure potential. Assuming that
the capillary theory applies to these coarse granular filters, pore size distributions (PSD) were
estimated from the volumetric water content at pressure potentials (ψ) of -5, -15, -25, -50 and -100
cm from the column bottom. Hydraulic contact between filter mixtures and pressure plates was
ensured by a thin layer of spheriglass (Spherigalss 3000 CO00 (30100)). Pressure potentials were
measured twice at each pressure level with a pressure calibrator (JofraTM, model APC030C,
Ametek, Allerød, Denmark). Dry weight (wdm) was determined by oven drying at 85 °C for 72 hours
according to Herbert (2011). The volumetric water content (θ) at each ψ was determined from the
column weight and the dry weight. Dry bulk density, ρb (Kg m-3), was calculated from total filter
volume, Vt (m3) and wdm. Total water-filled porosity, θtot (m3 m-3), was obtained from ρb and the
gravimetrical water content (Kg Kg-1). Water-filled pore space, V0 (m3), of the soil core was
calculated by multiplying θtot with Vt. Grain size distributions were obtained by sieving dry weight
material from each column at 2, 4, 8 and 16 mm. Grain size distributions are given as D10, D50 and
D90, where Dx is the grain diameter at which x% of the filter material mass (g) is finer than.
2.8 Data analysis
For data analysis, we used R software version 3.0.2 (R Core Team, 2013). Differences in ρb and
porosities (θtot, θ<30, θ30-600 and θ≥600) among filter mixtures were assessed by an analysis of
variance (ANOVA) followed by a Tukey’s HSD posthoc test. For analysis of the N loading
experiment, four samples were taken after steady state effluent NO3-N concentrations were
reached and merged into an average for each replicate.
The N removal efficiency (%) at specific HLRs was calculated as: (NO3-Nload – (NO3-Nexport + NO2-
Nexport + NH4-Nexport + N2O-Nexport)) / NO3load. The empirical relationship between N removal
efficiency and the concomitant effects of HLR and WR was tested using a non-linear (invers)
relation (best fit). The test included an analysis of covariance (ANCOVA), to test if the potential for
N removal efficiency among WRs responded similar to changes in the HLR.
Flow normalized N removal rates were calculated as: (NO3-Nload – (NO3-Nexport + NO2-Nexport + NH4-
Nexport + N2O-Nexport)) / Q.
where, Q (L d-1) is the flow rate.

_______________________________________________________________________________________
_______________________________________________________________________________________ 50
Ph.D. thesis by Jacob Bruun
Differences in flow normalized N removal rates among HLRs and filter mixtures were assessed by a
one-way ANOVA followed by a Tukey’s HSD posthoc test.
As all columns reached the predefined Eh level prior to each HLR test, and all HLRs were
considered independent.
The results obtained from the 3H2O tracer experiment were used to construct 3H2O breakthrough
curves (BTC) via plotting the relative tritium activities (C/C0) against eluted effluent volume (V)
converted to effluent pore volumes (V/V0) by dividing with the water-filled pore space (V0) for each
replicate column. In addition, a semi quantitative analysis, assessing the number of eluted pore
volumes (V/V0) at relative tritium mass recoveries (M/M0) of 10, 25, 50, 75 and 90%, was applied
where M is the accumulated tritium mass recovered and M0 is the tritium mass applied to each
column. To assess the degree of non-equilibrium flow, we used semi-quantitative analysis of 3H2O-
BTCs. Differences in mean V/V0 at specific M/M0 among HLRs for each filter mixture were
assessed by one-way ANOVA analysis followed by Tukey’s HSD posthoc test. One outlying value
was observed and ignored in the analysis of the 3:1 woodchip ratio Filtralite mixture.
3 Results and discussion
3.1 Physical properties of filter mixtures
-66% of
θtot
fraction (32-43% θtot) (Table 1). Similar high values for θtot (0.80-0.86 m3 m-3) and θ<30 (0.31-0.40
m3 m-3) have been reported for pure woodchips by Cameron and Schipper (2012) and Robertson
(2010), while lower θtot (~0.66 m3 m-3) and markedly lower θ<30 (0.04-0.11 m3 m-3) values have
been reported for 2-4 mm granular Seashells and Filtralite (Canga et al., 2015). The physical
properties of the woodchip-mineral mixtures thus reflect the major impact of the woodchip
fraction, although with the mineral fraction differentiating the filter mixtures (Table 1).
{Insert Table 1}
3.2 Tracer breakthrough behavior
The 3H2O-BTCs were characterized by asymmetric shapes and with peak maximum before 1 V/V0
and marked tailing, indicating non-equilibrium transport in all filter mixtures (Fig. 2 and 3).
Quantitative inspections of the 3H2O-BTCs demonstrated a faster tracer breakthrough and a
decrease in V/V0 at peak maximum as HLR increased in the Filtralite mixtures, (Fig. 2a, b, c), while
this behavior was not observed for the Seashell mixtures (Fig. 3a, b, c).
_______________________________________________________________________________________
_______________________________________________________________________________________ 51
Ph.D. thesis by Jacob Bruun
These differences were further reflected in the mass recovery of tracer M/M0 ≤50% (Table 2)
Increasing HLR significantly reduced M/M0 ≤50% and increased non-equilibrium transport in the
Filtralite mixtures, while this was not evident in the Seashell mixture (Table 2). It seems possible
that the lack of response to HLR for the Seashell mixture (no-significant M/M0 values), can result
from a more pronounced solute diffusion counteracting the reduction in pore volumes required to
achieve specific mass recoveries.
{Insert Table 2
{Insert figure 2}
{Insert figure 3}
Increasing WR in the Seashell mixture affected the tracer BTCs (Fig. 3), and decreased the number
of pore volumes (V/V0) required to achieve mass recoveries ≤50% (Table 2). This WR dependency
was not observed for the Filtralite mixtures (Fig. 2; Table 2). The influence of WR on the physical
properties (Table 1) thus seemed to be reflected by the resulting effect on the tracer BTC in the
Seashell mixture, while the Filtralite mixture was not affected by WR.
The non-equilibrium transport indicated by the BTCs for all filter mixtures suggest that solute
transport in these woodchip mixtures can be conceptualized by the mobile-immobile approach,
with convective transport in the mobile domain and diffusive mass exchange between mobile and
immobile domains (van Genuchten et al., 1976). Diffusive mass exchange was suggested in
woodchips (Cameron and Schipper, 2012) and demonstrated in 2-4 mm Seashell granulates (Canga
et al., 2015), but was not observed in 2-4 mm Filtralite granulates (Canga et al., 2015). The dual
porosity characteristic of the woodchip mixtures (Table 1) supports the conceptualization of the
mobile-immobile approach. In addition, 3H2O retardation caused by hydroxyl exchange to organic
matter has previously been demonstrated (Morris 2004; Turner et al., 2009) and may add to
explain part of the observed 3H2O BTC tailing. Thus, although high tracer mass recoveries (92-
98%) were observed, physical non-equilibrium cannot be distinguished from a potential chemical
non-equilibrium in these woodchip filters.
{Insert Table 2}
3.3 pH and redox dynamics
Effluent pH was approximately one unit higher in the Seashell mixtures (pH 7.7-7.8) compared to
the Filtralite mixtures (pH 6.3-6.9), with minor variations. Initial Eh values always ranged between
273 and 294 mV in the influent zone (5 cm), independent of filter mixtures. Generally, Eh
decreased with decreasing HLR (Fig. 4), resulting from the simultaneous decrease in the TEA
loading rate and the increased time for TEA consumption. Increasing the WR generally resulted in
_______________________________________________________________________________________
_______________________________________________________________________________________ 52
Ph.D. thesis by Jacob Bruun
lower Eh (Fig. 4C and D). Large variation was observed among replicate Eh probes up to 100 mV
(data not shown), possibly resulting from the non-equilibrium characteristics demonstrated for
these columns (Fig. 2 and 3). Thus, the TEA supply to the immobile domains was most likely
controlled by diffusive exchange from the mobile convective domain.
{Insert figure 4}
Assuming complete O2 saturation of the influent ADW, the O2 load was equivalent to 1.14 mg O2 h-1
at high HLR, and the difference in influent and effluent (1.0-2.1 mg L-1) O2 concentrations thus
corresponded to O2 retention/consumption rates of 0.83-1.04 mg O2 h-1. At medium HLR,
corresponding to an O2 load of 0.51 mg O2 h-1, the O2 retention/consumption rate was sufficient to
create anoxic effluents. As the effluent O2 concentration during high HLR reflects the
characteristics of the mobile convective domain, the immobile domain may potentially constitute a
TEA sink due to the longer residence time. Thus such redox / TEA concentration gradients between
mobile and immobile domains are expected to increase the TEA diffusion into the immobile
domain, and may control O2 consumption at high HLR.
3.4 N transformations
Average effluent NO3-N concentrations at steady state ranged from 3.5 to 11.3 mg NO3-N L-1 and
declined with decreasing HLR (Fig. 4). Effluent TON and TOC concentrations were < 1.0 mg N L-1
throughout the experiment, with slightly higher TOC concentrations in the 3:1 WR mixtures (data
not shown). Effluent NO2-N ranged from 0.20 to 2.72 mg NO2-N L-1, and with no clear relation to
HLR but generally slightly higher in the Seashells mixtures (data not shown). Effluent NH4-N was
generally found in low concentrations (< 0.53 mg NH4-N L-1). Dissolved N2O-N effluent
concentrations were generally low (<0.3 mg N2O-N L-1), corresponding to <0.3% of inlet NO3-N
concentrations (data not shown).
Nitrate removal in anoxic environments is facilitated by two processes: i) denitrification and ii)
dissimilative nitrate reduction to ammonium (DNRA). Denitrifying organisms are facultative
anaerobes that use NO3 as TEA (Tiedje et al., 1982). DNRA is carried out by fermentative
organisms using NO3/NO2 as TEA and reducing it to NH4 (Tiedje et al., 1988). High C:N ratios are
generally thought to favor DNRA (Tiedje et al.,1988), however, the NO3-N reduction in woodchip
filters is generally assumed to be dominated by denitrification (Greenan et al., 2006; Gibert et al.,
2008).
{Insert Fig. 5}
Generally, effluent NH4-N concentration only accounted for a small fraction of the NO3-N removed
(3-7%), revealing that the influence of DNRA was negligible for all filter mixtures and within the
range (<1-10%) found by Greenan et al. (2006) and Gibert et al. (2008). Thus, denitrification was

_______________________________________________________________________________________
_______________________________________________________________________________________ 53
Ph.D. thesis by Jacob Bruun
considered the primary NO3-N removal mechanism. In the denitrification process, nitrogen
reductases are progressively inhibited by low pH values (Knowles, 1982). Thus, the lower pH in the
Filtralite mixtures may explain the lower NO3-N reduction rates compared to Seashells with a pH
optimal to denitrification (Table 3).
{Insert Table 3}
3.6 Influence of hydraulic loading rate on NO3 reduction
The N removal efficiency decreased from 76% to 5% as the HLR increased (Fig. 5C and D),
depending on filter mixture. At high HLR the effluent remained oxic and diffusive exchange
between mobile and immobile domains most likely explained the partly observed O2 consumption.
The N removal observed at high HLR (Table 3) may thus be controlled by NO3-N diffusion into
immobile domains. Zero-order kinetics for denitrification has in many cases been used to describe
NO3-N removal in woodchip media (Robertson et al, 2000; Robertson et al., 2010; Schipper et al.,
2005). Zero-order kinetics is expected when NO3-N concentrations exceeds the half saturation
constant (km) (1 mg N L-1) of the Michaelis-Menten kinetics for denitrification. As effluent NO3-N
concentrations were > 3.5 mg N L-1 during steady state conditions zero-order denitrification
kinetics should apply. However, the flow normalized N removal rate increased with decreasing
HLR in all filter mixtures (Table 3), thus did not support an assumption of zero-order kinetics with
constant removal rates.
The decrease in N removal rate, with increasing HLR (i.e. O2 load), may reflect that the denitrifyers
switch metabolic pathway to O2 respiration, and thus not respire with NO3. Due to the structural
complexity of the filter mixtures and the influence of HLR on the solute transport and diffusional
mass exchange, the direct effect of changes in to O2 load were difficult to assess.
Diffusion into immobile domains could be restricted in case of anion exclusion (Porter et al., 1960).
However, studies using conservative anion tracers (bromide and chloride) equivalent in both
charge and hydrated radius to NO3 (Gabelich et al., 2002; Paugam et al., 2004) have suggested
diffusive exchange between mobile and immobile domains in wood material (Cameron and
Schipper, 2012; Herbert et al., 2011).
3.7 Influence of woodchip ratio on NO3 removal
Generally, effluent NO3-N concentrations were lower at the higher WR (Fig. 5). The higher N
removal rate observed at higher woodchip ratio (Table 3) was most likely caused by a larger
microbial population, associated with a greater woodchip mass (Mooreman et al., 2010) and/or a
greater availability of C at higher woodchip content, which may both indirectly (Robertson, 2010)
and directly (Burford and Bremner, 1975) stimulate denitrification.
Mixing woodchips with mineral material to retain a stable structure has been proposed, when

_______________________________________________________________________________________
_______________________________________________________________________________________ 54
Ph.D. thesis by Jacob Bruun
carbon availability is not limiting the treatment efficiency (Christianson, 2010). Although, the
effect of WR in the present study, indicated that carbon was limiting N removal at the low WR ratio
(Table 3), it is not clear whether a further increase in WR above a 3:1 volume ratio would further
enhance the N reduction efficiency.
The larger WR in the Filtralite mixtures resulted in a more pronounced response in N removal rate
to changes in HLR. This may result from an increased non-equilibrium transport, thus increasing
diffusive exchange and reduction processes
5. Conclusion
Removal of NO3-N by denitrification was found to be the major N removal mechanism in
woodchips-mineral filters with N removal efficiencies ranging from 5 to 76%, depending on HLR
and WR. Generally, all woodchip mixtures were characterized by non-equilibrium solute transport
with marked tailing, indicating diffusive solute exchange between mobile and immobile pore
domains.
Hydraulic loading rate strongly influenced the N removal by decreasing the overall residence time
as HLR increased. While an increase in HLR was accomplished by faster solute transport in the
Filtralite mixtures, thus a higher degree of non-equilibrium, the negative effect of HLR in the
Seashell mixtures may be minimized by a more pronounced diffusive solute exchange. The
importance of diffusive exchange was reflected directly at high HLR, when oxic effluent conditions
prevailed. A coexistence of oxic effluent and the observed N removal is most likely controlled by
diffusion into the anaerobic immobile domains. Increasing the WR generally increased the N
removal rate and efficiency, most likely due to greater carbon availability and/or a larger microbial
population. The larger WR further minimized the negative impact of increasing HLR in the
Filtralite. The higher N removal rates in Seashell mixtures at all HLR compared to the Filtralite
mixtures were could be attributed to the higher pH of the Seashell mixtures.
Acknowledgements
This research project was funded by the Danish Strategic Research Council, grant no. 09-067280
(Supreme Tech, www.supremetech.dk). We acknowledge the valuable support from Department of
Agroecology and Department of Bioscience, Aarhus University. Special thanks go to Michael
Koppelgaard for technical support as well as to Lene Skovmose Andersen and Eriona Canga for
assistance during sampling and valuable comments on the experimental set-up.
_______________________________________________________________________________________
_______________________________________________________________________________________ 55
Ph.D. thesis by Jacob Bruun
References
Blicher-Mathiesen, G., Grant, R., Jensen, P.G., Hansen, B., Thorling, L., 2011.
Landovervaagningsopland 2011. NOVANA. DEC report no. 31: 40 p.
Blowes, D., Robertson, W., Ptacek, C., Merkley, C., 1994. Removal of agricultural nitrate from tile-
drainage effluent water using in-line bioreactors. J. Contam. Hydrol. 15, 207–221.
Brix, H., 1994. Funktions of macrophytes i constructed wetlands. Water Sci. Technol. 29: 71–78.
Burford, J.R., & Bremner, J.M. (1975). Relationships between the denitrification capacities of soils
and total, water-soluble and readily decomposable soil organic matter. Soil Biol. Biochem. 7(6):
389-394.
Cameron, S.G., Schipper, L. A., 2012. Hydraulic properties, hydraulic efficiency and nitrate
removal of organic carbon media for use in denitrification beds. Ecol. Eng. 41: 1–7.
Domagalski, J.L., Ator, S., Coupe, R., McCarthy, K., Lampe, D., Sandstrom, M., Baker, N., 2008.
Comparative study of transport processes of nitrogen, phosphorus, and herbicides to streams in
five agricultural basins, USA. J. Environ. Qual. 37: 1158–69.
Christianson, L., Christianson, R., Helmers, M., Bhandari, A., 2010. Hydraulic propperty
determination of denitrifying bioreactor fill media. Appl. Eng. Agric. 26(5): 849-854:
Gibert, O., Pomierny, S., Rowe, I., Kalin, R.M., 2008. Selection of organic substrates as potential
reactive materials for use in a denitrification permeable reactive barrier (PRB). Bioresour. Technol.
99: 7587–96.
Greenan, C.M., Moorman, T.B., Kaspar, T.C., Parkin, T.B., Jaynes, D.B., 2006. Comparing carbon
substrates for denitrification of subsurface drainage water. J. Environ. Qual. 35: 824–9.
Healy, M.G., Rodgers, M., Mulqueen, J., 2006. Denitrification of a nitrate-rich synthetic
wastewater using various wood-based media materials. J. Environ. Sci. Health. A. Tox. Hazard.
Subst. Environ. Eng. 41: 779–88.
Herbert, R.B., 2011. Implications of non-equilibrium transport in heterogeneous reactive barrier
systems: evidence from laboratory denitrification experiments. J. Contam. Hydrol. 123: 30–9.
Hill, A.R., 1996. Nitrate Removal in Stream Riparian Zones. J. Environ. Qual. 25: 743-755.

_______________________________________________________________________________________
_______________________________________________________________________________________ 56
Ph.D. thesis by Jacob Bruun
Hoffmann, C.C., Baattrup-Pedersen, A., 2007. Re-establishing freshwater wetlands in Denmark.
Ecol. Eng. 30: 157–166.
Koskiaho, J, Ekholh P., Räty M., Riihimäki J., Puustinen M., 2003. Retaining agricultural nutrients
in constructed wetlands – Experiences under boreal conditions. Ecol. Eng. 20: 89-103.
Kovacic, D.A., David, M.B., Gentry L.E., Starks K.M., Cooke R.A., 2000. Effective of constructed
wetlands in reducing nitrogen and phosphorus export from agricultural tile drains. J. Environ.
Qual., 29: 1262-1274.
Knowles, R., 1982. Denitrification. Microbiol. Rewiews 46: 43–70.
Kronvang, B., Behrendt, H., Andersen, H.E., Arheimer, B., Barr, a, Borgvang, S. a, Bouraoui, F.,
Granlund, K., Grizzetti, B., Groenendijk, P., Schwaiger, E., Hejzlar, J., Hoffmann, L., Johnsson, H.,
Panagopoulos, Y., Lo Porto, a, Reisser, H., Schoumans, O., Anthony, S., Silgram, M., Venohr, M.,
Larsen, S.E., 2009. Ensemble modelling of nutrient loads and nutrient load partitioning in 17
European catchments. J. Environ. Monit. 11: 572–83.
Morris, J.E., 2006. Organically bound tritium in sediments from the Severn estuary, UK,
University of Southampton.
Porter, L.K., Kemper, W.D., Jackson, R.D., & Stewart, B.A., 1960. Chloride diffusion in soils as
influenced by moisture content. Soil Science Society of America Journal, 24(6), 460-463.
Rao, P.S.C., Rolston, D.E., Jessup, R.E., & Davidson, J.M., 1980. Solute transport in aggregated
porous media: Theoretical and experimental evaluation. Soil Science Society of America
Journal, 44(6), 1139-1146.
Rao, P.S.C., Jessup, R.E., Addiscott, T.M., 1982. Experimental and theoretical aspects of solute
diffusion in spherical and nonspherical aggregates. Soil Science, 133(6), 342-349.
Reddy, K.R., Rao, P.S.C., Jessup, R.E., 1982. The Effect of Carbon Mineralization on Denitrification
Kinetics in Mineral and Organic Soils. Soil Sci. Soc. Am. J. 46, NP.
Robertson, W.D., 2010. Nitrate removal rates in woodchip media of varying age. Ecol. Eng. 36:
1581–1587.
Robertson, W.D., Merkley, L., 2009. In-stream bioreactor for agricultural nitrate treatment.
Environ. Qual. 38: 230-237.

_______________________________________________________________________________________
_______________________________________________________________________________________ 57
Ph.D. thesis by Jacob Bruun
Robertson, W.D., Blowes, D.W., Ptacek, C.J., Cherry, J.A., 2000. Long-term of perfor- mance of in
situ reactive barriers for nitrate remediation. Ground Water 38, 689–695.
Robertson, W.D., Yeung, N., Van Driel, P.W., Lombardo, P.S., 2005. High-permeability layers for
remediation of ground water; go wide, not deep. Ground Water 43: 574–81.
Rozemeijer, J.C., van der Velde, Y., van Geer, F.C., Bierkens, M.F.P., Broers, H.P., 2010. Direct
measurements of the tile drain and groundwater flow route contributions to surface water
contamination: From field-scale concentration patterns in groundwater to catchment-scale surface
water quality. Environ. Pollut. 158: 3571–9.
Schipper, L.A., Vojvodic-Vukovic, M., 2000. Rates of nitrate removal from ground- water and
denitrification in a constructed denitrification wall. Ecol. Eng. 14, 269–278
Schipper, L.A., Robertson, W.D., Gold, A.J., Jaynes, D.B., Cameron, S.C., 2010. Denitrifying
bioreactors - An approach for reducing nitrate loads to receiving waters. Ecol. Eng. 36: 1532–1543.
Seitzinger, S., Harrison, J.A., Bohlke, J.K., Bouwman, A.F., Lowrance, R., Peterson, B., Tobias, C.,
Van Drecht, G., 2006. Denitrification across landscapes and water- scapes: a synthesis. Ecol. Appl.:
2064–2090.
Thiere, G., Stadmark, J., Weisner, S.E.B., 2011. Nitrogen retention versus methane emission:
Environmental benefits and risks of large-scale wetland creation. Ecol. Eng. 37: 6–15
Tiedje, J.M., Sexstone, A J., Myrold, D.D., Robinson, J. A, 1982. Denitrification: Ecological niches,
competition and survival. Antonie Van Leeuwenhoek 48: 569–83.
Turner, A., Millward, G.E., Stemp, M., 2009. Distribution of tritium in estuarine waters: the role of
organic matter. J. Environ. Radioact. 100: 890–895.
Van Genuchten M. TH., Wierenga, P.J., 1976. Mass Transfer Studies in Sorbing Porous Media: II.
Experimental Evaluation with Tritium. Soil sci. soc. Am. J. 4: 272–278.
Warneke, S., Schipper, L. A, Matiasek, M.G., Scow, K.M., Cameron, S., Bruesewitz, D. A,
McDonald, I.R., 2011a. Nitrate removal, communities of denitrifiers and adverse effects in different
carbon substrates for use in denitrification beds. Water Res. 45: 5463–75.
Warneke, S., Schipper, L. A., Bruesewitz, D. A., McDonald, I., Cameron, S., 2011b. Rates, controls
and potential adverse effects of nitrate removal in a denitrification bed. Ecol. Eng. 37: 511–522.

_______________________________________________________________________________________
_______________________________________________________________________________________ 58
Ph.D. thesis by Jacob Bruun
Figures
Figure 1. Principal sketch of the column set-up including (A) influent artificial drainage water
(ADW) and 3H2O solutions connected by a peristaltic pump (P), (B) filter columns with upwards
flow vertically installed in situ Pt probes and a redox reference electrodes, and (C) effluent
sampling system.

_______________________________________________________________________________________
_______________________________________________________________________________________ 59
Ph.D. thesis by Jacob Bruun
Figure 2. Tritium (3H2O) breakthrough curves as a function of effluent pore volumes (V/V0) in
Filtralite-woodchips mixtures at variable hydraulic loading rates (HLR) and woodchips ratio (WR).
Dotted line marks one pore volume. BTC estimates include V/V0 at peak maximum and first
breakthrough (bt) as well as C/C0 at peak maximum. Replicate columns are represented by
different symbols.
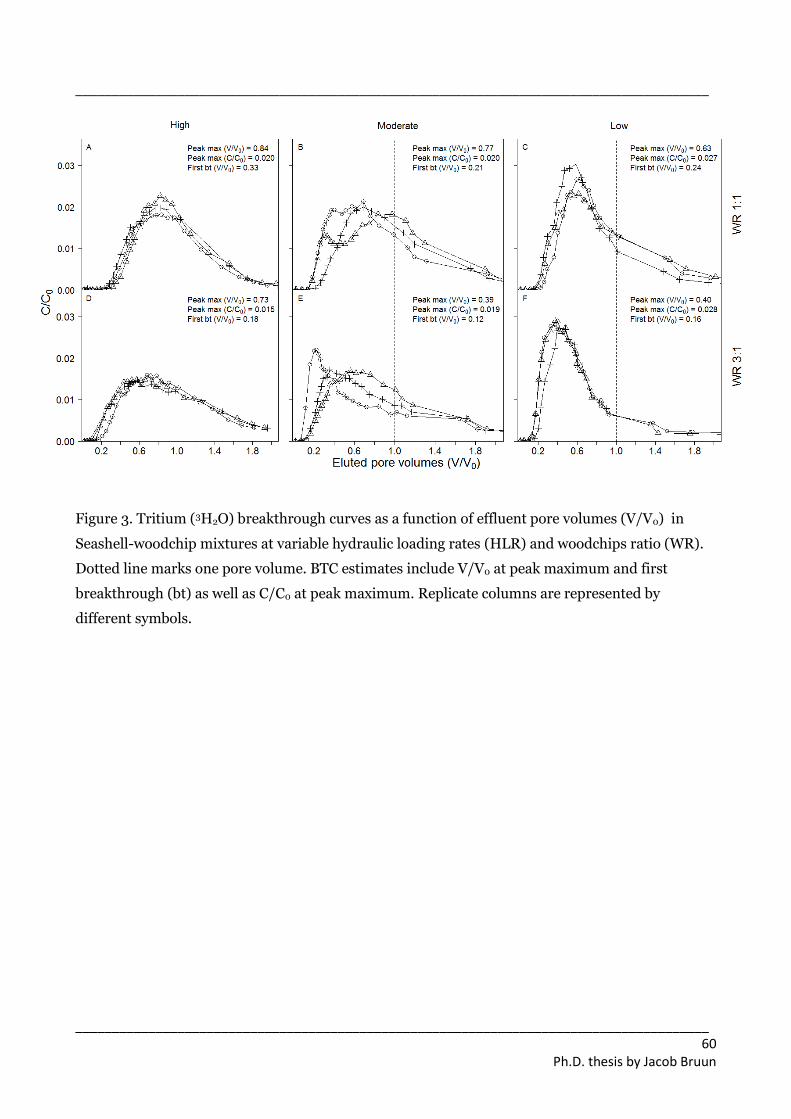
_______________________________________________________________________________________
_______________________________________________________________________________________ 60
Ph.D. thesis by Jacob Bruun
Figure 3. Tritium (3H2O) breakthrough curves as a function of effluent pore volumes (V/V0) in
Seashell-woodchip mixtures at variable hydraulic loading rates (HLR) and woodchips ratio (WR).
Dotted line marks one pore volume. BTC estimates include V/V0 at peak maximum and first
breakthrough (bt) as well as C/C0 at peak maximum. Replicate columns are represented by
different symbols.

_______________________________________________________________________________________
_______________________________________________________________________________________ 61
Ph.D. thesis by Jacob Bruun
Figure 4. Redox potential (Eh) as a function of hydraulic loading rate (HLR) in the Filtralite and
Seashell mixtures at woodchip ratio (WR) 1:1 and 3:1. Errorbars represent standard error of
average values.

_______________________________________________________________________________________
_______________________________________________________________________________________ 62
Ph.D. thesis by Jacob Bruun
Figure 5. Effluent NO3-N concentrations (A and B) and N removal efficiency (%) (C and D) as a
function of hydraulic loading rate (HLR) in the Filtralite and Seashell mixtures at woodchip ratio
(WR) of 1:1 and 3:1. Errorbars represent standard error of average values. In C and D, the curved
lines represent tin invers (y = b + ax-1) relation between the N removal efficiency (%) and the HLR.

_______________________________________________________________________________________
_______________________________________________________________________________________ 63
Ph.D. thesis by Jacob Bruun
Tables
Table 1. Grain-size distribution given as D10, D50, D90, and uniformity coefficient (Cu) and hydro-
physical characteristics of filter mixtures (n = 6) including bulk density (b), total porosity (tot) and
pore size fractions (< 30, 30-600 and ≥600 µm).
Filter mixtures
(woodchip ratio)
(m3 m-3)
D10 D50 D90 Cu (ρb) θtot θ<30 θ30-600 θ≥600
-------(mm)----- (Kg m-3) -----------(m3m-3)----------
Filtralite (1:1) 1.1 1.8 7.7 1.7 229a 0.84a 0.34a 0.03 0.47
Filtralite (3:1) 1.2 3.5 11.1 3.9 200a 0.84a 0.36a 0.03 0.45
Seashells (1:1) 0.9 1.8 3.5 2.3 640c 0.72c 0.23c 0.02 0.48
Seashells (3:1) 0.9 2.1 7.3 2.8 410b 0.79b 0.30b 0.02 0.47
SE for ρb , θtot, θ600, θ30-600 and θ<30 ≤ 0.01
a, b, c indicate significant (p < 0.05) differences among filter mixtures
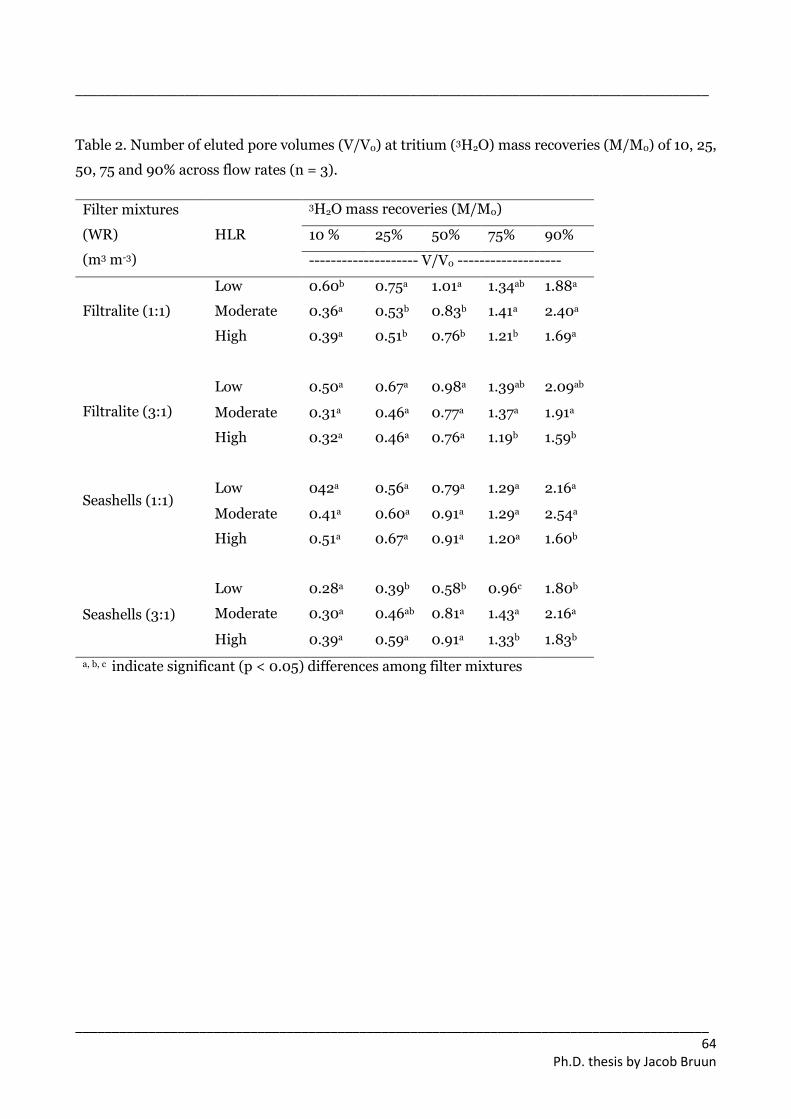
_______________________________________________________________________________________
_______________________________________________________________________________________ 64
Ph.D. thesis by Jacob Bruun
Table 2. Number of eluted pore volumes (V/V0) at tritium (3H2O) mass recoveries (M/M0) of 10, 25,
50, 75 and 90% across flow rates (n = 3).
Filter mixtures
(WR)
(m3 m-3)
HLR
3H2O mass recoveries (M/M0)
10 % 25% 50% 75% 90%
-------------------- V/V0 -------------------
Filtralite (1:1)
Low 0.60b 0.75a 1.01a 1.34ab 1.88a
Moderate 0.36a 0.53b 0.83b 1.41a 2.40a
High 0.39a 0.51b 0.76b 1.21b 1.69a
Filtralite (3:1)
Low 0.50a 0.67a 0.98a 1.39ab 2.09ab
Moderate 0.31a 0.46a 0.77a 1.37a 1.91a
High 0.32a 0.46a 0.76a 1.19b 1.59b
Seashells (1:1)
Low 042a 0.56a 0.79a 1.29a 2.16a
Moderate 0.41a 0.60a 0.91a 1.29a 2.54a
High 0.51a 0.67a 0.91a 1.20a 1.60b
Seashells (3:1)
Low 0.28a 0.39b 0.58b 0.96c 1.80b
Moderate 0.30a 0.46ab 0.81a 1.43a 2.16a
High 0.39a 0.59a 0.91a 1.33b 1.83b
a, b, c indicate significant (p < 0.05) differences among filter mixtures
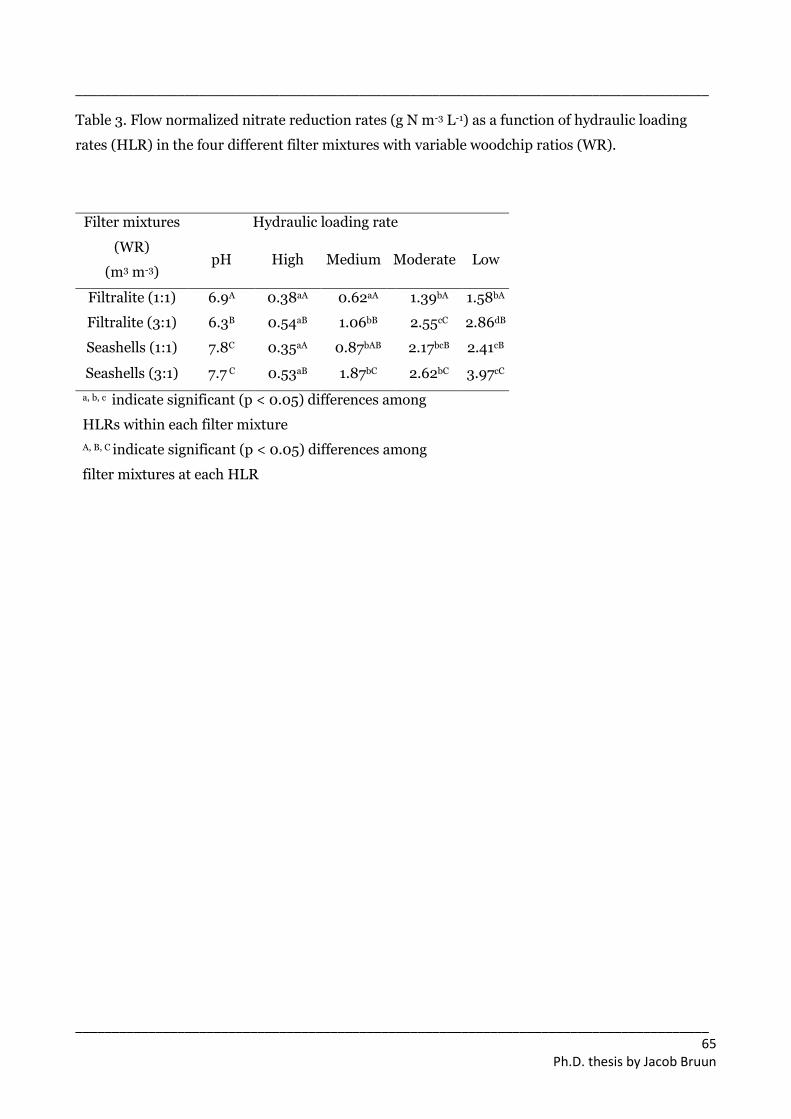
_______________________________________________________________________________________
_______________________________________________________________________________________ 65
Ph.D. thesis by Jacob Bruun
Table 3. Flow normalized nitrate reduction rates (g N m-3 L-1) as a function of hydraulic loading
rates (HLR) in the four different filter mixtures with variable woodchip ratios (WR).
Filter mixtures
(WR)
(m3 m-3)
Hydraulic loading rate
pH High Medium Moderate Low
Filtralite (1:1) 6.9A 0.38aA 0.62aA 1.39bA 1.58bA
Filtralite (3:1) 6.3B 0.54aB 1.06bB 2.55cC 2.86dB
Seashells (1:1) 7.8C 0.35aA 0.87bAB 2.17bcB 2.41cB
Seashells (3:1) 7.7 C 0.53aB 1.87bC 2.62bC 3.97cC
a, b, c indicate significant (p < 0.05) differences among
HLRs within each filter mixture
A, B, C indicate significant (p < 0.05) differences among
filter mixtures at each HLR
_______________________________________________________________________________________
_______________________________________________________________________________________ 66
Ph.D. thesis by Jacob Bruun
Appendix II
Convective transport of dissolved gases determines the fate of the greenhouse gases
produced in reactive drainage filters
Jacob Bruun*1,2, Carl Christian Hoffmann1, Charlotte Kjaergaard2
1Department of Bioscience, Aarhus University, 8600 Silkeborg, Denmark ;2Department of
Agroecology, 8830 Tjele, Denmark
*Corresponding author: Jacob Vestergaard Druedahl Bruun, Aarhus University, Department of
Bioscience, Faculty of Science and Technology, Vejlsøvej 25, DK-8600 Silkeborg, Denmark. E-
mail:[email protected]
Key words: Methane, Nitrous oxide, Constructed wetlands, Woodchips, Reactive filters,
Agriculture, Drainage water
_______________________________________________________________________________________
_______________________________________________________________________________________ 67
Ph.D. thesis by Jacob Bruun
Abstract
Mitigation of agricultural nitrogen (N) loss via tile drains using woodchip-based subsurface
constructed wetlands seems promising. However, the stochastic nature of drainage discharge and
consequent temporal variations in hydraulic loading rates may result in the emission of the
greenhouse gases (GHG) nitrous oxide (N2O) and methane (CH4) with potentially severe climatic
effects that are not yet adequately studied. We investigated the influence of the direction of the
convective transport on the net export of GHGs by measuring the two export paths of gases
(emitted and dissolved via the effluent) in six woodchip-based subsurface constructed wetlands
with different hydraulic designs (horizontal and vertical up- and downward flow). Emissions
ranged from -75.1 to 49.5 µg N2O-N m-2 h-1 and from -0.28 to 720 mg CH4-C m-2 h-1. Dissolved
concentrations in the effluent ranged from 0 to 1,108 µg N2O-N L-1 and from 4 to 8,452 µg CH4-C L-
1. Nitrous oxide emissions were negligible; thus, the main export path for N2O was dissolved in the
effluent. April and December were temporal hotspots for N2O production. High CH4 emissions and
dissolved concentrations were associated with the low hydraulic loading and high temperature
during the Danish summer. We found no effect of hydraulic design on the net export of N2O,
whereas the ratio between CH4 emissions and net export in the form of dissolved CH4 via the
effluent was significantly affected. In conclusion, vertical downward flow lowered the export ratio
of CH4 and may be the best hydraulic design, when conditions (i.e. low HLR) facilitate high CH4
production.
_______________________________________________________________________________________
_______________________________________________________________________________________ 68
Ph.D. thesis by Jacob Bruun
1. Introduction
Agricultural nitrogen (N) loading of the aquatic environment is recognised as one of the main
driving forces of eutrophication (Kronvang et al., 2009). Agricultural subsurface tile drains
represent a major N transport pathway in the heavily drained agricultural regions of the world
(Blicher-Mathiesen et al., 2011; Domagalski et al., 2008; Rozemeijer et al., 2010).
New technologies for reducing nitrate (NO3) loading of receiving waters through agricultural tile
drains include highly efficient denitrifying constructed wetlands and filters consisting of a reactive
substrate (Blowes et al., 1994; Hoffmann and Kjaergaard, 2015; Robertson et al., 2005; Robertson
and Merkley, 2009; Warneke et al., 2011). The reactive substrate commonly used in the various
CWs and filter systems consists of an organic carbon source (e.g. woodchips) to promote
denitrification (Robertson and Cherry, 1995; Schipper and Vojvodic, 1998; Schipper et al, 2010).
Denitrification is the microbial-mediated stepwise reduction of nitrogen oxides, NO3 and nitrite
(NO2), through several intermediates, to the gaseous end products nitrous oxide (N2O) or
dinitrogen (N2) (Tiedje, 1982), and is generally recognised as the dominant NO3 removal
mechanism in reactive filters (Greenan et al., 2006; Gibert et al., 2008). In unregulated event flow
driven systems, such as drainage systems, highly fluctuating hydraulic loading rates (HLR) (load of
terminal electron acceptors (TEA) (e.g. O2 and NO3) can severely affect the reducing conditions
within the systems. When reducing conditions are weak (TEA load > TEA consumption),
environmental conditions favouring the production of N2O rather than N2 may occur as the
synthesis of N2O reductase, reducing N2O to N2, is inhibited even at low O2 concentrations
(Knowles, 1982). Generally, the reduction of NO3 to N2 is considered beneficial to the environment,
whereas the production of N2O, a potent greenhouse gas (GHG) with a global warming potential
(GWP) 298 times greater than that of CO2 (IPCC, 2007), is considered detrimental. Even though
N2O production and emission in reactive filters generally are low (Warneke et al., 2011; Elgood et
al., 2010), N2O emissions have demonstrated large temporal variations (Elgood et al., 2010;
Moorman et al., 2010; Warneke et al., 2011), illustrating the potential for temporal hotspots for
N2O emissions. Common for all studies were that the production and/or emission of N2O was high
during periods of high TEA load.
In addition, anaerobic degradation of organic media may result in the production of methane
(CH4), a GHG having a GWP 25 times higher than that of CO2 (IPCC, 2007). Methane is produced
in anoxic environments by methanogenic archaea during the anaerobic digestion of organic
compounds (Le Mer and Roger, 2001). Methanogenesis requires strictly anaerobic conditions and
can be inhibited in the presence of other TEAs (e.g. O2, NO3 and SO4) (Le Mer and Roger, 2001).
Net CH4 production in reactive filters has shown large temporal variability (Warneke et al. 2011;
Moorman et al. 2010, Elgood et al. 2010). Elgood et al. (2010) measured summer production

_______________________________________________________________________________________
_______________________________________________________________________________________ 69
Ph.D. thesis by Jacob Bruun
values of up to 52 mg CH4-C m-2 h-1, which is five times higher than those from cultivated fields or
natural wetland soils/sediments (Le Mer and Roger, 2001). In reactive filters, production of CH4
has been attributed to depletion of NO3 along with other TEAs (e.g. SO4) (Elgood et al., 2010).
Generally, the benefits of wetland denitrification are considered to outweigh the environmental
impacts of GHG emission (Thiere et al. 2011). However, the climatic consequence of GHG emission
from woodchip-based agricultural treatment systems, including ways to mitigate this emission,
needs to be considered before implementation of these systems.
In permanently saturated constructed wetlands, gases can be exported via emission and in
dissolved form with the effluent. The direction of the convective mass transport of dissolved gases
might be determined by the hydraulic design (horizontal, vertical up- and downward), permitting
control of the ratio between gas export via direct air emission (Eair) and effluent (Ewater) (export
ratio, i.e. Eair/Ewater). A lower export ratio results in a greater fraction of the produced gases being
accessible for post-treatment of dissolved gases.
In this study, we investigated the net production and net emission of GHGs in six subsurface flow
constructed wetlands (SSF-CWs) consisting of a woodchip-based substrate. Both environmental
factors controlling GHG emission and the effect of the hydraulic design (horizontal, vertical up-
and down-flow) were investigated. We hypothesised that i) increasing TEA load would increase
N2O and decrease both CH4 production and emission, ii) a downward hydraulic design would
reduce the export ratio (Eair/Ewater) for both gases and iii) an upward hydraulic design would
increase the export ratio for both gases. We measured the net emission of the three GHGs: carbon
dioxide (CO2), nitrous oxide (N2O) and methane (CH4) using the static chamber method in six CWs
consisting of a woodchip-based substrate with different hydraulic designs (horizontal, vertical up-
and down-flow) over a 12-month period.
2. Methods
2.1 Field site
In 2012, six parallel SSF-CWs were excavated in Skannerup, Denmark (N 56.214132˚ – E
9.742723˚), with the purpose of mitigating nitrate removal in agricultural drainage water. Details
on design and characteristics of the SSF-CWs are given in Hoffmann and Kjaergaard (2015). In
summary, the experimental design consisted of six parallel SSF-CWs with individual inlet and
outlet wells (Fig. 1). Each SSF-CW was 10 m wide, 10 m long and 1 m deep. The excavated SSF-CWs
were covered with an impermeable lining (Junifold PE HD GEO MEMBRANE 1.0 mm; Millag,
Denmark) to avoid infiltration/exfiltration of water. The filter matrix consisted of willow

_______________________________________________________________________________________
_______________________________________________________________________________________ 70
Ph.D. thesis by Jacob Bruun
woodchips (Nyvraa Bioenergi, Denmark) and Seashells (Danshells A/S, Denmark) mixed either in
a 1:1 volume ratio (SSF-CW number 1, 3 and 5) or a 3:1 ratio (woodchips:Seashells) (SSF-CW
number 2, 4 and 6) (Fig. 1). Three of the SSF-CWs (1, 3 and 5) were initially planted with common
reed (Phragmites Australis) rhizomes, while the remaining SSF-CWs (2, 4 and 6) were left
unvegetated. The six SSF-CWs had three different hydraulic designs: horizontal flow, vertical up-
flow and vertical down-flow. The SSF-CWs received drainage discharge from an 85 ha catchment.
Water from the drainage ditch flowed into a common inlet well and from here into an inlet well for
each SSF-CW. Water was equally distributed among the six SSF-CWs. Three piezometers were
installed in the filter matrix of each SSF-CW: In SSF-CW 1 and 2 piezometers with a 0.5 m screen
were positioned at a depth of 0.25-0.75 m and installed 2.5, 5 and 7.5 m from the inlet (Fig. 1). In
SSF-CW 3-6, the piezometers with a screen length of 0.1 m were all placed in the centre of the filter
matrix at a depth of 0.25-0.35, 0.50-0.60 and 0.75-0.85 m, respectively. At the outlet well, each
SSF-CW was equipped with an electromagnetic flowmeter (WATERFLUX 3070, Krohne, Germany)
for continuous measurement of effluent flow rates. In each SSF-CW, three frames were inserted in
the filter matrix to hold the static chambers for GHG measurement (Fig. 1).
{Insert figure 1}
2.2 Vegetation development
Despite planting of P. australis rhizomes in SSF-CW 1, 3 and 5, vegetation development was
different in all six SSF-CWs. Dead stands of P. australis were present in the sampling period from
late August 2013 to the beginning of the growing season in 2014 in the three vegetated SSF-CWs at
the same density as they were initially planted (30 cm distance between seedlings). Dense
vegetation cover in the first 4-5 metres in the two horizontal flow SSF-CWs (1 and 2) and in the two
vertical down-flow SSF-CWs (5 and 6) was observed from summer 2014 to the end of the
experiment. In the two vertical up-flow SSF-CWs (3 and 4), phragmites managed quite poorly
(many dead stems and poor growth). In SSF-CWs 1, 2, 5 and 6, other plant species quickly
established where water was present on the surface, the most predominant species being Typha
latiformis, Bidens tripartite and Epilobium hirsutum.
2.3 Water chemistry analysis
Water sampling and field measurements were conducted every third week throughout the period
1/8 2013 to 28/8 2014. Dissolved oxygen (DO), pH and temperature were measured in the
piezometers, in the common inlet and in the effluent well using a handheld multiparameter meter
(YSI Professional Plus, Xylem Analytics, Ohio, USA). The water level in the filter matrix was
_______________________________________________________________________________________
_______________________________________________________________________________________ 71
Ph.D. thesis by Jacob Bruun
measured with a water level meter (Model 101, Solinst Canada Ltd, Georgetown, Canada). The
temperature in the filter matrix was measured at three depths (5, 10 and 15 cm) using a high-
precision digital thermometer (GMH 3710, PCE instruments UK Ltd., Southampton, UK). Influent
and effluent water samples were taken as grab samples. Water samples for analysis of dissolved
N2O-N and CH4-C samples were pumped with a peristaltic pump through diffusion-tight TygonTM
tubing into 12 ml glass vials (Exetainer, Labco, High Wycombe, UK) containing a glass ball;
subsequently 400 µl 50% ZnCl2 solution was added to each vial. We made sure that the samples
were free of air when the lid was fitted. All water samples for water chemistry analysis were filtered
through a 0.45 µm filter (Monta® membrane, Cat No MCEWGS047045, Frisenette, Denmark),
and water samples for ion chromatography were additionally filtered through a < 0.22 µm nylon
membrane filter (SNY 2225; Frisenette, Knebel, Denmark). Nitrate and SO4 were analysed
ionchromatically (Dionex ICS-1500 IC-system including an autosampler and suppressor unit)
(method: EN ISO 10304-1). Ammonium was measured colorimetrically on a Shimadzu 1700
spectrophotometer (Shimadzu Corp., Kyoto, Japan) according to a Danish standard method (DS
224). Total organic carbon was analysed using a TOC-L analyser equipped with a TNM-L module
addition (Shimadzu, Kyto, Japan). Dissolved gases were analysed by creating 3 ml of headspace in
each vial and replacing it with 6 ml He gas. Exetainers were shaken vigorously prior to analysis to
equilibrate the samples. Head space gases were analysed on a gaschromatograph (GC 7890A,
Agilent Technologies Aps, Santa Clara, US).
2.4 Greenhouse gas measurements
Emissions of the GHGs nitrous oxide (N2O-N), methane (CH4-C) and carbon dioxide (CO2-C) were
measured continuously from 1/8 2013 to 28/8 2014 using the static chamber method. Chambers
were 60x60x40cm non-transparent PVC chambers equipped with an internal fan, internal and
external thermometers and a pressure vent. When sampling, the chambers were positioned on the
top of pre-installed frames (Fig. 1). A rubber closure between chamber and frame ensured chamber
tightness. Three chambers were used as replicates in each SSF-CW (Fig. 1). Gas samples were
extracted with a 20 ml syringe and injected into 12 ml pre-evacuated glass vials (Exetainer, Labco,
High Wycombe, UK) and analysed on a gaschromatograph (GC 7890A, Agilent Technologies Aps,
Santa Clara, US) within 3 weeks of sampling. On five occasions during the growing season (April -
August), diurnal measurements were carried out. Measurements at night were initiated at 11:00
PM and lasted until ~ 3:00 AM, while daily measurements were carried out between 11:00 AM and
3:00 PM. In the period from June to August 2014, vegetation prevented use of the normal-sized
static chambers at specific plots. Thus, chamber extensions (60x60x40 cm) made of similar
material as the chambers were employed.

_______________________________________________________________________________________
_______________________________________________________________________________________ 72
Ph.D. thesis by Jacob Bruun
2.5 Data analysis
Data analysis and graphical illustrations were made using R version 3.0.2 software (R Core Team,
2013). Emissions of CH4-C, N2O-N and CO2-C were estimated from five consecutive samples taken
with a 15-minute interval using the HMR procedure for trace gas flux estimation available from the
HMR package (Pedersen et al. 2011) in the R software. In the HMR procedure (Pedersen et al.,
2010), investigators can choose one of three concentration-time series analysis procedures: i) a
non-linear regression based on an extension of the Hutchinson and Mosier (HM) model
(Hutchinson and Mosier, 1981) (HMR method), ii) a linear interpretation and iii) no flux estimate.
For CH4 emissions, 88% was analysed using the HMR method and 12 % using the linear method.
All N2O-N emissions were analysed by the linear method. For CO2, all emissions were analysed by
the HMR method. Yearly emissions were calculated by a linear interpolation between measuring
dates in the period September 2013 to August 2014.
When analysing the effect of environmental controllers on GHG emissions, we used a repeated
measures analysis with a mixed model (lmer from the lme4 package in R software) (Bates et al.,
2012). A model was created for each of the gases, including gas emission, hydraulic design (the six
SSF-CWs), effluent flow rate, filter matrix temperature at a depth of 0.50 m and filter matrix DO
and effluent NO3-N, SO4 and NH4-N concentrations and pH. We used the filter matrix temperature
measured in the piezometers at a depth of 0.50 m as they show little to no deviation from the
temperatures measured in the filter matrix at a depth of 0.05, 0.10 and 0.15 m, which have
previously been shown to be strongly correlated with especially CH4 emissions (Audet et al.,
2013b). Before constructing each model, the collinearity among variables was assessed by the
variation inflation index applying a threshold of 5. The following variables were log transformed
prior to analysis to control homogeneity of variance and achieve a Gaussian distribution of model
residuals: flow rate, DO, CH4-C emission, N2O-N emission, NO3-N and TOC. Prior to
transformation, a value of 1 and 101 was added to the CH4-C and N2O-N emissions, respectively.
When representing annual and seasonal averages from the transformed log-normal distributed
data, average values were calculated. When representing annual and seasonal averages from the
transformed log-transformed data, average values were calculated as: exp((µ) + (SD^2)/2), in
which µ and SD are the mean and the standard deviation, respectively, of the log-transformed data.
A one-way analysis of variance (ANOVA) was applied when analysing the total CH4-C and N2O-N
production among SSF-CWs. Total CH4-C and N2O-N production (mg h-1) in each basin was
calculated as: mean emission (mg h-1 m -2) + (dissolved (gas) (mg L-1) x discharge (L h-1m-2)). A two-
way repeated measures ANOVA was used to compare day and night measurements among the SSF-
CWs and to assess the export ratios among hydraulic designs. The export ratio was defined as the
gas flux by emission divided by the flux of dissolved gas in the outflowing water (Eair/Ewater). When

_______________________________________________________________________________________
_______________________________________________________________________________________ 73
Ph.D. thesis by Jacob Bruun
assessing the export ratio, we excluded SSF-CW 6 due to its overall lower hydraulic load, whereas
we combined SSF-CWs 1 and 2 (horizontal) and 3 and 4 (vertical). Seasons were defined as winter
(1 October to 31 March) and summer (1 April to 30 September).
3. Results
3.1 Effluent flow rate, temperature and water chemistry
In the period from 1/8-2013 to 28/8-2014 the effluent flow rate was comparable in all SSF-CWs
except for SSF-CW 6 which received a reduced discharge volume (Table 1). Following an
adjustment of the SSF-CW 6 inlet in June 2014, effluent flow rates were similar in all SSF-CWs.
Average effluent flow rates were generally twice as high during winter than in summer (table 1).
The water temperatures in the filter matrixes ranged from 3.2 to 16.2 °C (Fig. 5). The water level
below the filter matrix surface was consistently lower in the middle part of the two horizontal flow
SSF-CWs (1 and 2) and up to 13 cm below the filter matrix surface in the upward vertical flow SSF-
CW as compared to the downward vertical flow filters (Table 1). Average influent pH was 6.70 and
was approximately half a unit higher in the effluent (Table 2). No clear difference in effluent pH
among SSF-CWs was found. The DO concentrations measured in the piezometers ranged from <
0.01 to 3.82 mg L-1 and were highly dependent on the flow rate (see yearly averages in Table 1).
Mean yearly concentrations of all water chemistry parameters including dissolved N2O and CH4,
measured at the inlet and at the outlet of each SSF-CW, are shown in Table 2.
{Insert Table 1}
All SSF-WCs demonstrated a NO3-N removal efficiency ranging from ~20 to 100%, showing
consistently lower removal efficiency in winter. For detailed information on system performance
see Hoffmann and Kjaergaard (2015). Information on effluent dissolved GHG concentrations is
found in section 3.4.
{Insert Table 2}
3.2 Nitrous oxide emission and export with effluent
Generally, N2O-N emissions were close to zero from August 2013 until late March 2014 after which
greater variations from -75.1 to 49.5 µ N2O-N m-2 h-1 were observed in spring and summer (Fig. 2,
Table 3). The yearly accumulated emissions ranged from -12 to 18 mg N2O-N m-2 year-1 (Table 4).
Generally, the accumulated N2O emission did not differ significantly from zero (p > 0.220); thus,
these SSF-CWs were neither sources nor sinks for N2O. One exception was one vertical down-flow

_______________________________________________________________________________________
_______________________________________________________________________________________ 74
Ph.D. thesis by Jacob Bruun
SSF-CW (5) with high N2O-N emissions during spring 2014 (Fig. 2), implying that it acted as a net
source of N2O during the experimental period. The linear mixed effects model analysis of the N2O-
N emission revealed a negative correlation with the concentration of NH4-N, while no other
parameters were correlated with the N2O-N emission (Table 5). No clear trend in N2O-N emissions
along the flow direction was found in the two horizontal flow SSF-CWs (1 and 2). For the vertical
SSF-CWs (3-6), this was not an issue. Furthermore, we did not find any differences in N2O-N
emissions between day and night (p = 0.687) (Fig. 2)
{insert figure 2}
{insert Table 3}
{insert Table 4}
Dissolved effluent N2O concentrations ranged from 0 to 1,108 µg N2O-N L-1 (Fig. 3). Dissolved N2O-
N concentrations correlated with filter matrix temperature and effluent NO3--N concentrations (p <
0.042). The dissolved N2O-N export with the effluent was additionally analysed as a function of
flow rate; however, no clear response emerged (data not shown).
Generally, peaks in dissolved N2O-N concentrations were observed in December and April (Fig. 3).
The average total export rate of N2O SSF-CW ranged from -2,630 to 2,449 mg N2O-N h-1. Total
N2O-N exported by the effluent accounted for 2.2 to 5.5% of the total amount of NO3-N reduced.
No significant difference was found between SSF-CWs when taking additional parameters (i.e. flow
rate, NO3-N and NH4-N) into account (p = 0.990). We did not find any difference in the dissolved
export of N2O between day and night (p = 0.836).
{insert figure 3}
3.3 Methane emission and export with effluent water
Methane emission rates were highly dynamic and ranged from -0.28 to 720 mg CH4-C m-2 h-1, with
higher rates during summer (Table 3, Fig. 4). In the horizontal flow SSF-CWs, CH4 emission rates
increased with increasing distance from the inlet. Yearly CH4 emissions varied markedly from low
(48 g CH4-C m-2 year-1) and moderate (400-480 g CH4-C m-2 year-1) to high (740-1121 g CH4-C m-2
year-1) (Table 4). CH4-C emissions were significantly higher in the vertical up-flow SSF-CWs (p =
0.021 and 0.002, respectively), while the lowest CH4-C emission (p = 0.053) was observed in a
_______________________________________________________________________________________
_______________________________________________________________________________________ 75
Ph.D. thesis by Jacob Bruun
vertical down-flow SSF-CW (5) when taking into account the effect of all model variables.
Yearly CH4-C emissions were significantly positively correlated with filter matrix temperature and
negatively with effluent flow rate and SO4 concentrations (Table 5). The effluent flow rate was the
strongest driver for CH4 emission, which increased exponentially with decreasing flow rate (i.e.
increasing the hydraulic residence time (HRT)) (Fig. 5).
{insert figure 4}
{insert figure 5}
Dissolved effluent CH4 concentrations ranged from 4 to 8,452 µg CH4-C L-1 (Fig. 6) and exhibited a
temporal pattern similar to that of the CH4 emission (Fig. 4 and Fig. 6). The dissolved effluent CH4
concentrations did not differ significantly among the SSF-CWs (p = 0.906) when taking into
account the additional parameters, including filter matrix temperature (Fig. 6) and effluent flow
rate. Dissolved CH4-C concentrations correlated positively (p < 0.035) with filter matrix
temperature and effluent NO3-N concentrations and negatively with effluent flow rate and SO4
concentrations.
Total CH4 exported (Eair + Ewater) from the SSF-CWs ranged from 48 to 1,121 g CH4-C h-1 (Table 4)
and was controlled by the flow rate and the filter matrix temperature (p < 0.001). Although large
differences were observed in CH4 emissions between filters (Table 4), no significant difference was
found among the SSF-CWs (p = 0.685). On average, the CH4 emission accounted for approximately
52% of the total CH4 exported.
Grouping SSF-CWs according to hydraulic design revealed a clear difference in export ratios (p =
0.004), which were 1.49, 3.54 and 0.14 for horizontal flow; vertical up-flow and vertical down-flow,
respectively. In relative terms 77% of the total export of CH4-C was emitted directly to the air when
the convective flow path was vertical upward, while vertical downward flow resulted in the
emission of only 12%, and the horizontal flow path emitted 59%. We did not find any difference in
the CH4 emissions and dissolved export between day and night (p=0.861 and p = 0.690,
respectively).
{insert figure 6}
3.4 Carbon dioxide emission
The CO2 emissions were highly dynamic with rates from -22 to 1,983 mg CO2-C m-2 h-1 (Fig. 7).
Emissions of CO2-C generally followed the same seasonal pattern as the CH4-C emissions, with
_______________________________________________________________________________________
_______________________________________________________________________________________ 76
Ph.D. thesis by Jacob Bruun
markedly higher rates during summer (Table 3). Emissions were positively correlated with filter
matrix temperature and pH and negatively with effluent flow rate and NH4 concentrations (Table
5). The largest CO2-C emission rates were observed in the vertical upward flow SSF-CWs. Day and
night-time measurements showed that carbon dioxide emissions were generally higher during the
day (p = 0.014).
{insert figure 7}
3.5 Annual emission and export budgets
Converting CH4 and N2O to CO2 equivalents (25 for CH4 and 298 for N2O, IPCC (2007))
demonstrated that, on average, vertical up-flow attained the largest CO2 equivalent emission. While
emission at horizontal flow compared to vertical up-flow was 50% lower. The lowest average
emissions were found in the vertical down-flow SSF-CWs (Table 4).
4. Discussion
4.1 Nitrous oxide export
In denitrifying systems, the most likely GHG to be produced is N2O (Warneke et al., 2011).
However, we only observed marginal N2O-N emissions and a low total export, i.e. between 2.2 and
5.5% of the total NO3-N removal. Similarly, Warneke et al. (2011) found emissions and discharge
exports of N2O-N constituting 1% and 3.3% of the NO3--N removed. In the present study, less than
0.01% of the NO3-N removed was emitted as gaseous N2O-N, and export of dissolved N2O-N,
although relatively low, thus constituted the most important pathway of N2O-N losses in these
drainage filters. Dissolved N2O concentrations were well below saturated levels (~1500 mg N2O-N
L-1) (Linde, 2004), which may allow the N2O exported to be further reduced to N2 in the receiving
waters rather than being emitted. However, any construction intended for oxygenation of the
effluent may lead to additional N2O release through gaseous emission.
Considerable N2O emissions have been reported from other denitrifying ecosystems such as
riparian buffer strips (20 kg N2O-N ha-1 year-1) (Hefting, 2003) and European agricultural
ecosystems (2.18 to 38.32 kg N2O-N ha-1 year-1) (Machefert et al., 2002). However, our results (-
0.146 to 0.56 kg N2O-N ha-1 year-1) were comparable to emission values reported from European
forested and grassland ecosystems (0.122 to 7.3 kg N2O-N ha-1 year-1) (Machefert et al., 2002). Our
results show that these SSF-CWs were a source of N2O since relatively high amounts were exported
with the effluent, whereas the emission of N2O was generally negligible. Nitrous oxide emissions
were at times positive and at other times negative (Fig. 2). Thus, N2O was occasionally emitted to
the atmosphere and occasionally consumed from the atmosphere.
_______________________________________________________________________________________
_______________________________________________________________________________________ 77
Ph.D. thesis by Jacob Bruun
Seasonal variations in N2O production in reactive filters have been ascribed to incomplete
denitrification during cold winter periods (Elgood et al., 2010; Moorman et al., 2010). Elevated
N2O production during incomplete denitrification may be due to an excess of NO3, which is the
preferable TEA for denitrifiers rather than N2O due to a higher energetic yield of the NO3 reduction
(Knowles, 1982; Tiedje et al., 1982) and/or the presence of oxygen, supressing the final step in the
denitrification (i.e. N2O reduction to N2, inhibiting the synthesis of the N2O reductase) (Knowles,
1982; Tiedje et al., 1982).
4.2 Methane export
Methane emissions in this study were several orders of magnitude higher than what has previously
been reported from treatment filters using reactive substrates. Warneke et al. (2011) studied an
880 m2 denitrifying bed and found an average CH4 emission of 0.27 g CH4-C day-1. The markedly
higher emission in the present study was most likely due to a lower hydraulic load and thus also a
lower TEA load and a longer HRT (i.e. longer time for TEA consumption) in the present study as
compared to that of Warneke et al. (2011). Methane emissions were likewise high compared to
emissions observed in natural and restored riparian wetlands (-0.12 to 38 g CH4-C m,-2 year-1)
(Audet et al., 2013a; Audet et al., 2013b), various other wetlands worldwide (131 to 912 mg CH4-C
m-2 day-1) (Whale et al., 2005) and agricultural NO3 mitigation systems such as constructed ponds
(range 0 - 54 mg CH4-C m-2 h-1) (Stadmark and Leonardson, 2005). The present results are,
however, dwarfed by CH4 emissions reported from landfills (up to 75 g CH4-C m-2 h-1) (Boerjesson
and Svensson, 1977; Chanton and Liptay, 2000).
The dissolved effluent CH4-C concentrations were comparable to those observed within streambed
reactors (up to 7.8 mg CH4-C L-1) (Elgood et al., 2010) and higher than the levels recorded by
Warneke et al. (2011) (up to 34 µg CH4-C L-1). Extremely high concentrations (up to 326 mg CH4 L-
1) have been found in the deeper, presumably more reducing, layers of a denitrifying wall treating
agricultural drainage discharge (Moorman et al., 2010), indicating a high potential for CH4
production likely due to restricted pore water exchange (low TEA load) in the deeper layers.
A positive effect of the filter matrix temperature was found on both the CH4 emission and the total
export of CH4 as well as a negative correlation between effluent flow rate and the effluent SO4
concentration. The rate of biological reactions, including methanogenesis, strongly depends on
temperature (Dunfield et al., 1993; Le Mer and Roger, 2001; Moore and Dalva, 1993). Thus,
seasonal variations in the temperature were reflected in the marked temporal variation in the CH4
export. In Denmark, the summer months are typically a period with low drainage discharge and
warm temperatures (Simmelsgaard, 1994). Thus, conditions favourable for methanogenesis (Eh < -
200mV) (Le Mer and Roger, 2001) are likely to exist in warm summer periods of low drainage
discharge (i.e. long HRT and low TEA load). During winter when the hydraulic load was generally
_______________________________________________________________________________________
_______________________________________________________________________________________ 78
Ph.D. thesis by Jacob Bruun
high and temperatures low, the SSF-CWs neither acted as sources nor sinks of CH4. Warneke et al.
(2011) observed CH4 consumption during high hydraulic load and at low temperatures. Therefore,
based on this study, supported also by the results of Elgood et al. (2010), reactive SSF-CWs and
filters must be considered to be a severe CH4 source in warm summer months with low nutrient
loading. During winter reactive systems such as SSF-CWs may even act as CH4 sinks. This was,
however, not evident from the results presented in this study.
During methanogenesis, methanogens compete for substrates with, for example, sulphate-reducing
bacteria (SRB) (Conrad, 2007). Effluent SO4 concentrations reflect the potential for further SO4
reduction in the filter matrix. Previous studies have demonstrated non-equilibrium transport
characteristics in woodchip filters (Bruun et al., 2015; Cameron and Schipper, 2012), with diffusive
exchange of solutes between convective mobile and immobile domains controlling the solute
transport (Van Genuchten and Wierenga, 1976). The non-equilibrium transport characteristics
may additionally facilitate development of redox gradients, with TEA supply to immobile domains
controlled by diffusive exchange, thus allowing redox active zones (Bruun et al., 2015, Herbert,
2011).
4.3 Effect of water flow path
The hydraulic design did not affect the N2O emission or the total net export of N2O and CH4. Thus,
the production and emission of N2O as well as the total export of CH4 were not significantly
affected by the greater TEA (including O2) load in the vertical downward SSF-CWs (5 and 6).
A direct consequence of the three different hydraulic designs chosen for the six SSF-CWs was that
the depths and the water content of the unsaturated zone were not completely identical between
the SSF-CWs. The unsaturated zone in SSF-CWs 5 and 6 were constantly wetted due to the vertical
downward flow, while SSF-CWs 3 and 4 often had a dry unsaturated zone (most pronounced
during summer) and concomitant sparse development of wetland vegetation. The unsaturated
layer may exert an important control on net CH4 emissions since it may act as a CH4 sink as
observed in soils (Cicerone and Oremland, 1988; Smith et al., 2000). In soils, an unsaturated layer
of 20-30 cm is sufficient to ensure low emissions of CH4 (Audet et al., 2013a; Couwenberg et al.,
2011; Schäfer et al., 2012). However, despite the more pronounced unsaturated layer in the vertical
upward flow SSF-CWs, these demonstrated the largest CH4 emissions. The higher CO2 emissions in
these SSF-CWs may indicate that some CH4 oxidation may have taken place (Hanson and Hanson,
1996), and the rate of CH4 oxidation was most likely insufficient to balance the upward convective
mass transport of CH4. We did not measure the dissolved CO2 and can therefore only use CO2
emission as an indicator for methanotrophy and overall ecosystem respiration in the unsaturated
layer of the filter matrix where methanotrophy would also be most pronounced (Hanson and
_______________________________________________________________________________________
_______________________________________________________________________________________ 79
Ph.D. thesis by Jacob Bruun
Hanson, 1996). Carbon dioxide may also be a product of methanogenesis with acetate as substrate
(Le Mer and Roger, 2011; Whalen, 2005). Any CO2 produced in the saturated layer enters into the
bicarbonate system. Therefore, we were unable to assess the influence of the total production of
CO2 and thus also the total contribution of the SSF-CWs to global warming.
Even though a relatively large fraction of the CH4 export occurred as dissolved CH4 in the effluent,
supersaturation (i.e. >18 mg CH4-C L-1 at 10 ˚C; Yamamoto et al., 1976) was never reached. Thus,
we do not expect any substantial emission from the outflowing water. Supersaturation has,
however, been found in previous studies. Moorman et al. (2010) found concentrations of up to 326
mg CH4 L-1 in the deeper parts of a denitrifying bed, again highlighting the large potential of
methanogenesis and the potential for CH4 emission in reactive substrates. However, this potential
can only be realised if diffusional gradients are high and/or an active convective transport of
supersaturated water from more reducing sites within the filter matrix towards the surface exists.
The vertical downward convective mass transport seemed to counteract the upward diffusional CH4
transport, significantly lowering the ratio between the gas emission and discharge exports.
Emergent vegetation can, as mentioned, facilitate gas transport between the rizhosphere and the
atmosphere, in some instances enhancing the gas emission to the atmosphere (Henneberg et al.
2012). However, the dense vegetated vertical down-flow SSF-CWs (5 and 6) may have generated
greater oxygen transport into the rizhosphere, either improving the methanotrophy and/or
reducing the methanogenesis in the upper part of the filter matrix. However, the lack of difference
between the total CH4 productions in all SSF-CWs suggests that the vegetation did not play a
significant role in the total export of CH4 in this study.
Our results show high CH4 emissions from our SSF-CWs as compared to natural and restored
riparian wetlands, and to constructed ponds in agricultural fields (Audet et al., 2013a; Audet et al.,
2013b; Stadmark and Leonardson, 2005). The higher NO3 removal rates in reactive SSF-CW and
consequently the smaller size as compared to restored wetlands and constructed ponds must also
be considered. The SSF-CWs in this study covered a total area of 600 m2 but treated drainage water
from a 85 ha agricultural catchment.
Clearly, CH4 production and emission can be reduced by increasing the hydraulic loading rate and,
with it, the load of TEAs. This is most easily done by reducing the filter matrix size. The SSF-CWs
are dependent on the drainage discharge, which varies considerably during the year, being low or
absent in summer and higher during winter. Thus, reducing the volume of the filter matrix in
summer would decrease the water residence time and give less time for the redox processes to
proceed (i.e. only allowing denitrification to take place). Our results clearly indicate that by using a
vertical down-flow hydraulic design, the convective mass transport counteracts the upward

_______________________________________________________________________________________
_______________________________________________________________________________________ 80
Ph.D. thesis by Jacob Bruun
diffusional transport of dissolved gases, mainly CH4, assigning a larger proportion to be exported
as dissolved gas rather than directly into the atmosphere.
5. Conclusion
In our study nitrous oxide emissions were either low or negative, while the export of dissolved N2O-
N was identified as the most important pathway for N2O loss. The total net export of N2O was not
significantly affected by the direction of the flow path. Periods in April and December were
identified as temporal hotspots for N2O production.
Methane emissions were relatively high, implying that all SSF-CWs functioned as sources of CH4.
Effluent flow rate, and thus the HRT, and filter matrix temperature were identified as the main
controlling factors for the net emission of CH4. Thus, warm summer months were assigned as
temporal hotspots for CH4 emissions and net export.
The direction of the convective mass transport (i.e. hydraulic design) of dissolved gases
significantly affected the fate of the CH4. Downward flow counteracted the upward diffusional
transport of CH4-C, thereby lowering the export ratio. On the other hand, the upward convective
mass transport seemed to facilitate higher CH4-C emissions, i.e. increasing the export ratio.
Based on the results presented in this paper, we consider SSF-CWs with a filter matrix consisting of
a combination of woodchips and Seashells to be a promising NO3 mitigation measure for reducing
the N loss from subsurface tile drains. However, when the surrounding conditions (e.g. low
hydraulic load (TEA load) and/or high temperatures) facilitate high CH4-C production, the best
suitable solution seems to be a vertical downward flow hydraulic design.
Acknowledgements
This research project was funded by the Danish Strategic Research Council, grant no. 09-067280
(Supreme Tech, www.supremetech.dk). We would like to thank Frede Lundgaard Madsen for
setting aside the area for the pilot SSF-CWs.
References
Audet, J., Elsgaard, L., Kjaergaard, C., Larsen, S.E., Hoffmann, C.C., 2013a. Greenhouse gas
emissions from a Danish riparian wetland before and after restoration. Ecol. Eng. 57, 170–182.
_______________________________________________________________________________________
_______________________________________________________________________________________ 81
Ph.D. thesis by Jacob Bruun
Audet, J., Johansen, J.R., Andersen, P.M., Baatrup-Pedersen, A., Brask-Jensen, K.M., Elsgaard, L.,
Kjaergaard, C., Larsen, S.E., Hoffmann, C.C., 2013b. Methane emissions in Danish riparian
wetlands: Ecosystem comparison and pursuit of vegetation indexes as predictive tools. Ecol. Indic.
34, 548–559.
Bates, D., Maechler, M., Bolker, B., Walker, S., 2013, lme4: Linear mixed-effects models using
Eigen and S4. R package version 1.0-5. http://CRAN.R-project.org/package=lme4.
Boerjesson, G., Svensson, B.H., 1997. Nitrous oxide emissions from landfill cover soils in Sweden.
Tellus 49B: 357–363.
Blicher-Mathiesen, G., Grant, R., Jensen, P.G., Hansen, B., Thorling, L., 2011.
Landovervaagningsopland 2011. NOVANA. DEC report no. 31. 40 p.
Bruun, J., Hoffmann, C.C., Kjaergaard, C. Nitrogen removal in permeable woodchip filters
controlled by solute transport behaviour and woodchip ratio. Environ. Qual. (In preparation)
Chanton, J.P., Liptay, K., 2000. Seasonal variation in methane oxidation in a landfill cover
soil as determined by an in situ stable isotope technique. Global Biogeochem. Cycle 14, 51-60.
Cicerone, R.J., Oremland, R.S., 1988. Biogeochemical aspects of atmospheric methane. Global
Biogeochem., Cucles 2 (4), 299-327
Conrad, R, 2007. Microbial Ecology of Methanogens and Methanotrophs. In: L.S. Donald (Ed).
Advances in Agronomy. Vol. 96, Academic Press, pp. 1-63.
Couwenberg, J., Thiele, A., Tanneberger, F., Augustin, J., Bärisch, S., Dubovik, D., Liashchynskaya,
N., Michaelis, D., Skurativich, A., Joosten, H., 2011. Assessing greenhouse gas emission from
peatlands using vegetation as a proxy. Hydrobiologia 674 (1), 67–89.
Domagalski, J.L., Ator, S., Coupe, R., McCarthy, K., Lampe, D., Sandstrom, M., Baker, N., 2008.
Comparative study of transport processes of nitrogen, phosphorus, and herbicides to streams in
five agricultural basins, USA. J. Environ. Qual. 37, 1158–1169.
Dunfield, P., Knowles, R., Dumont, R., Moore, T.R., 1993. Methane production and consumption in
temperate and subarctic peat soils: Response to temperature and pH. Soil Biology and
Biochemistry 25:321-326
Elgood, Z., Robertson, W.D., Schiff, S.L., Elgood, R., 2010. Nitrate removal and greenhouse gas
production in a stream-bed denitrifying bioreactor. Ecol. Eng. 36, 1575–1580.
_______________________________________________________________________________________
_______________________________________________________________________________________ 82
Ph.D. thesis by Jacob Bruun
Gibert, O., Pomierny, S., Rowe, I., Kalin, R.M., 2008. Selection of organic substrates as potential
reactive materials for use in a denitrification permeable reactive barrier (PRB). Bioresour. Technol.
99, 7587–7596.
Greenan, C.M., Moorman, T.B., Kaspar, T.C., Parkin, T.B., Jaynes, D.B., 2006. Comparing carbon
substrates for denitrification of subsurface drainage water. J. Environ. Qual. 35, 824–829.
Hanson, R.S., Hanson, T.E., 1996. Methanotrophic bacteria. Microbiol. Rev.60 (2), 439–471.
Healy, M.G., Rodgers, M., Mulqueen, J., 2006. Denitrification of a nitrate-rich synthetic
wastewater using various wood-based media materials. J. Environ. Sci. Health. A. Tox. Hazard.
Subst. Environ. Eng. 41, 779–788.
Hefting, M.M., Bobbink, R. de Caluwe, H., 2003. Nitrous oxide emission and denitrification in
chronically nitrate-loaded riparian buffer zones. J. Environ. Qual. 32, 1194–1203
Henneberg, A., Sorrel, B.K., Brix, H., 2012. Internal methane transport through Juncus effusus:
experimental manipulation of morphological barriers to test above- and below-ground diffusion
limitation. New Phytol. 196(3), 799–806.
Hoffmann, C.C., Kjaergaard, C. Testing of horizontal and vertical subsurface flow wetlands with
mixed matrices of woodchips and mussel shells for removal of nutrients in agricultural drainage
water. (In preparation).
IPCC, 2007. Climate Change 2007: The Physical Science Basis. Contribution of Working Group I to
the Fourth Assessment. Report of the Intergovernmental Panel on Climate Change. Cambridge,
United Kingdom, and New York, NY, USA.
Joabsson, A, Christensen, T.R., Wallé, B., 1999. Vascular plant controls on methane emissions from
northern peatforming wetlands. Trends Ecol. Evol. 14 (10), 385–388.
Knowles, R., 1982. Denitrification. Microbiol. Rev. 46, 43–70.
Kronvang, B., Behrendt, H., Andersen, H.E., Arheimer, B., Barr, A, Borgvang, S.A, Bouraoui, F.,
Granlund, K., Grizzetti, B., Groenendijk, P., Schwaiger, E., Hejzlar, J., Hoffmann, L., Johnsson, H.,
Panagopoulos, Y., Lo Porto, a, Reisser, H., Schoumans, O., Anthony, S., Silgram, M., Venohr, M.,
Larsen, S.E., 2009. Ensemble modelling of nutrient loads and nutrient load partitioning in 17
European catchments. J. Environ. Monit. 11, 572–583. doi:10.1039/b900101h

_______________________________________________________________________________________
_______________________________________________________________________________________ 83
Ph.D. thesis by Jacob Bruun
Le Mer, J., Roger, P., 2001. Production, oxidation, emission and consumption of methane by soils:
A review. Eur. J. Soil Biol. 37 (1), 25–50.
Lide, D.R., 2004. Handbook of Chemistry and Physics, 85th Edition, CRC Press LLC.
Machfert, S.E., Dise, N.B., Goulding, K.W.T., Whitehead, P.G., 2002. Nitrous oxide emission from
a range of land uses across Europe. Hydrol. Earth Syst. Sci. 6(3), 325–337.
Moore, T.R., Dalva, M., 1993. The influence of temperature and water table position on carbon
dioxide and methane emissions from laboratory columns of peatland soils. Journal of Soil Science
44:651-664
Moorman, T.B., Parkin, T.B., Kaspar, T.C., Jaynes, D.B., 2010. Denitrification activity, wood loss,
and N2O emissions over 9 years from a wood chip bioreactor. Ecol. Eng. 36, 1567–1574.
Pedersen, A.R., 2011. HMR. Flux estimations with static chamber data.
R Core Team, 2013. R: A language and environment for statistical computing. R. Foundation for
Statistical Computing, Vienna, Austria. ISBN 3-900051-07-0, URL. http://www.R-project.org/.
Robertson, W.D., Cherry, J.A., 1995. In situ denitrification of septic-system nitrate using reactive
porous media barriers: Field trials. Ground Wat. 33, 99–111.
Rozemeijer, J.C., van der Velde, Y., van Geer, F.C., Bierkens, M.F.P., Broers, H.P., 2010. Direct
measurements of the tile drain and groundwater flow route contributions to surface water
contamination: From field-scale concentration patterns in groundwater to catchment-scale surface
water quality. Environ. Pollut. 158, 3571–3579. doi:10.1016/j.envpol.2010.08.014
Schipper, L.A., Vojvodic-Vukovic, M., 1998. Nitrate removal from ground water using a
denitrification wall amended with sawdust: field trial. J. Environ. Qual. 27, 664–668.
Schipper, L.A., Robertson, W.D., Gold, A.J., Jaynes, D.B., Cameron, S.C., 2010. Denitrifying
bioreactors - An approach for reducing nitrate loads to receiving waters. Ecol. Eng. 36, 1532–1543.
Schäfer, C.M., Elsgaard, L. Hoffmann, C.C., Petersen S.O., 2012. Seasonal methane dynamics in
three temperate grasslands on peat. Plant Soil. 357, 339–353.
Simmelsgaard, S.E., 1994. Nitratkvælstof i drænvand 1971-91: Måling af nitratkvælstof i drænvand
samt modelberegning af afstrømning og kvælstofudvaskning til undergrunden. SP rapport Nr.
47/1994, Statens Planteavlsforsøg, 67pp.

_______________________________________________________________________________________
_______________________________________________________________________________________ 84
Ph.D. thesis by Jacob Bruun
Smith, K.A., Dobbie, K.E., Ball, B.C., Bakken, L.R., Sitaula, B.K., Hansen, S., Orlanski, P., 2000.
Oxidation of atmospheric methane in Northern European soils, comparison with other ecosystems,
and uncertainties in the global terrestrial sink. Glob. Change Biol. 6 (7), 791–803.
Stadmark, J., Leonardson, L., 2005. Emissions of greenhouse gases from ponds constructed for
nitrogen removal. Ecol. Eng. 25, 542-551.
Tiedje, J.M., Sexstone, A J., Myrold, D.D., Robinson, J.A., 1982. Denitrification: ecological niches,
competition and survival. Antonie van Leeuwenhoek, 48, 569–583.
Thiere, G., Stadmark, J., Weisner, S.E.B., 2011. Nitrogen retention versus methane emission:
Environmental benefits and risks of large-scale wetland creation. Ecol. Eng. 37, 6–15.
Warneke, S., Schipper, L.A., Cameron, S., Bruesewitz, D.A., McDonald, I.R., 2011. Rates, controls
and potential adverse effects of nitrate removal in a denitrification bed. Ecol. Eng.37, 511-522.
Whalen, S.C., 2005. Biogeochemistry of methane exchange between natural wetlands and the
atmosphere. Environ. Eng. Sci. 22 (1), 73-93.
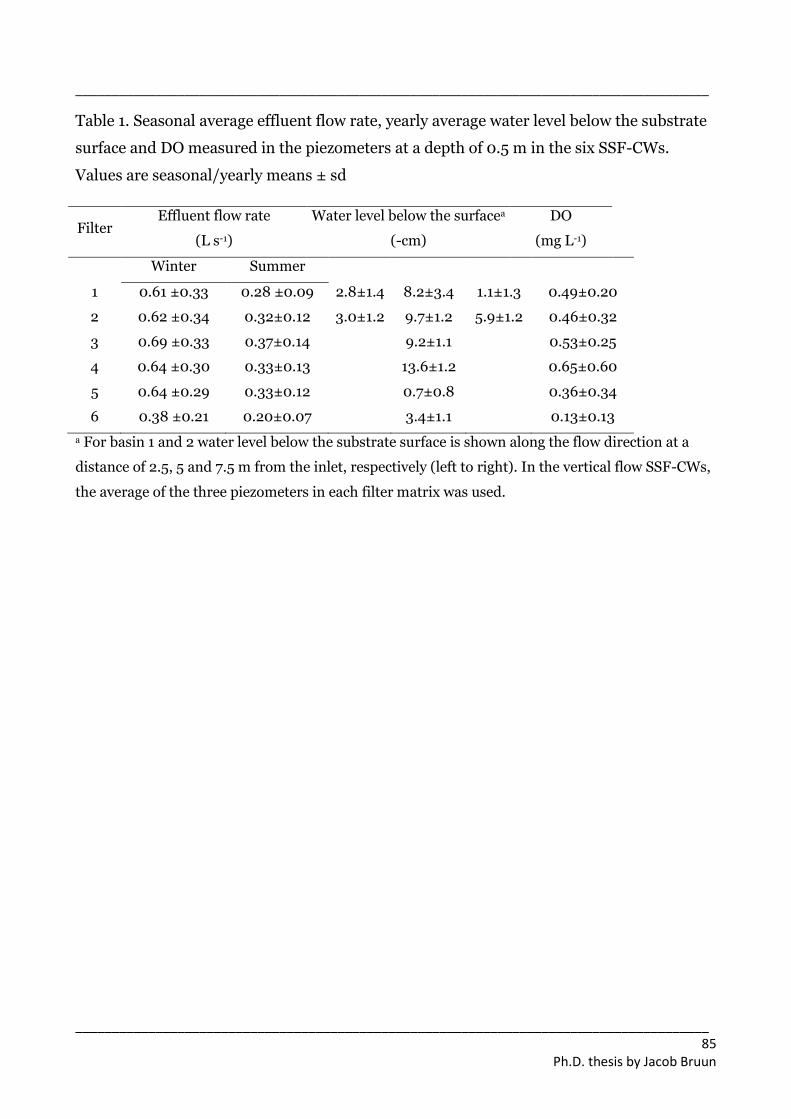
_______________________________________________________________________________________
_______________________________________________________________________________________ 85
Ph.D. thesis by Jacob Bruun
Table 1. Seasonal average effluent flow rate, yearly average water level below the substrate
surface and DO measured in the piezometers at a depth of 0.5 m in the six SSF-CWs.
Values are seasonal/yearly means ± sd
Filter Effluent flow rate
(L s-1)
Water level below the surfacea
(-cm)
DO
(mg L-1)
Winter Summer
1 0.61 ±0.33 0.28 ±0.09 2.8±1.4 8.2±3.4 1.1±1.3 0.49±0.20
2 0.62 ±0.34 0.32±0.12 3.0±1.2 9.7±1.2 5.9±1.2 0.46±0.32
3 0.69 ±0.33 0.37±0.14 9.2±1.1 0.53±0.25
4 0.64 ±0.30 0.33±0.13 13.6±1.2 0.65±0.60
5 0.64 ±0.29 0.33±0.12 0.7±0.8 0.36±0.34
6 0.38 ±0.21 0.20±0.07 3.4±1.1 0.13±0.13
a For basin 1 and 2 water level below the substrate surface is shown along the flow direction at a
distance of 2.5, 5 and 7.5 m from the inlet, respectively (left to right). In the vertical flow SSF-CWs,
the average of the three piezometers in each filter matrix was used.
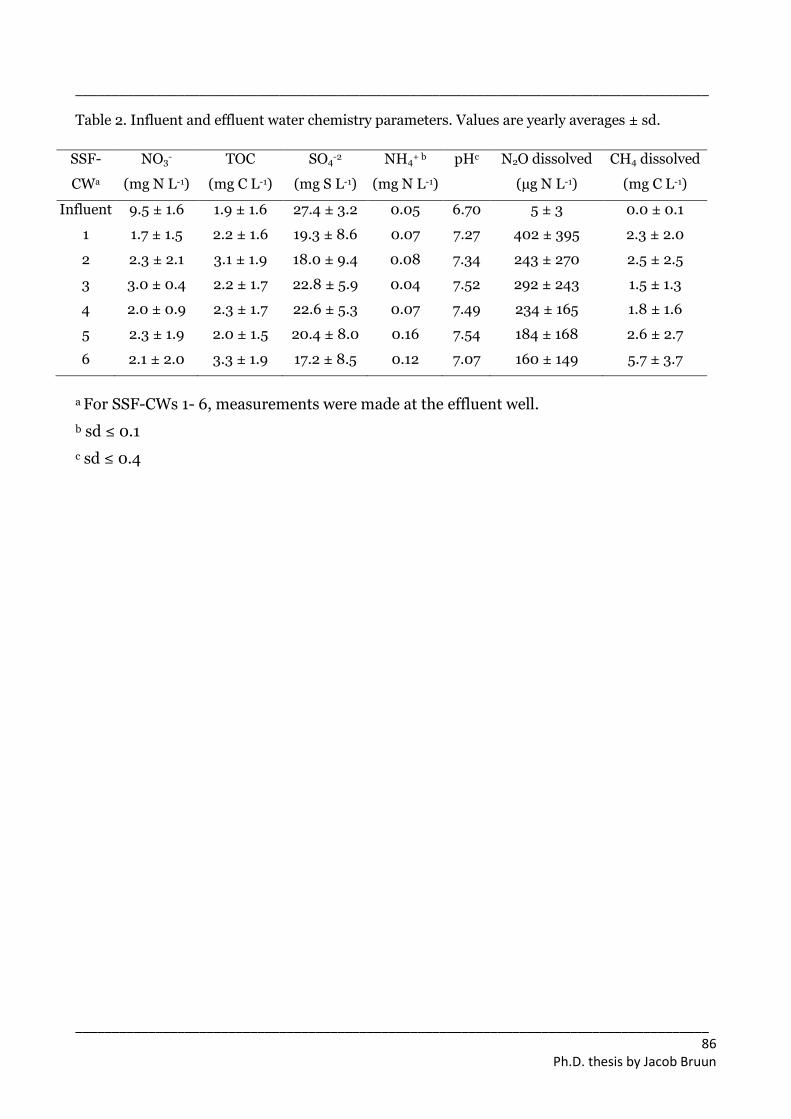
_______________________________________________________________________________________
_______________________________________________________________________________________ 86
Ph.D. thesis by Jacob Bruun
Table 2. Influent and effluent water chemistry parameters. Values are yearly averages ± sd.
SSF-
CWa
NO3-
(mg N L-1)
TOC
(mg C L-1)
SO4-2
(mg S L-1)
NH4+ b
(mg N L-1)
pHc
N2O dissolved
(µg N L-1)
CH4 dissolved
(mg C L-1)
Influent 9.5 ± 1.6 1.9 ± 1.6 27.4 ± 3.2 0.05 6.70 5 ± 3 0.0 ± 0.1
1 1.7 ± 1.5 2.2 ± 1.6 19.3 ± 8.6 0.07 7.27 402 ± 395 2.3 ± 2.0
2 2.3 ± 2.1 3.1 ± 1.9 18.0 ± 9.4 0.08 7.34 243 ± 270 2.5 ± 2.5
3 3.0 ± 0.4 2.2 ± 1.7 22.8 ± 5.9 0.04 7.52 292 ± 243 1.5 ± 1.3
4 2.0 ± 0.9 2.3 ± 1.7 22.6 ± 5.3 0.07 7.49 234 ± 165 1.8 ± 1.6
5 2.3 ± 1.9 2.0 ± 1.5 20.4 ± 8.0 0.16 7.54 184 ± 168 2.6 ± 2.7
6 2.1 ± 2.0 3.3 ± 1.9 17.2 ± 8.5 0.12 7.07 160 ± 149 5.7 ± 3.7
a For SSF-CWs 1- 6, measurements were made at the effluent well.
b sd ≤ 0.1
c sd ≤ 0.4
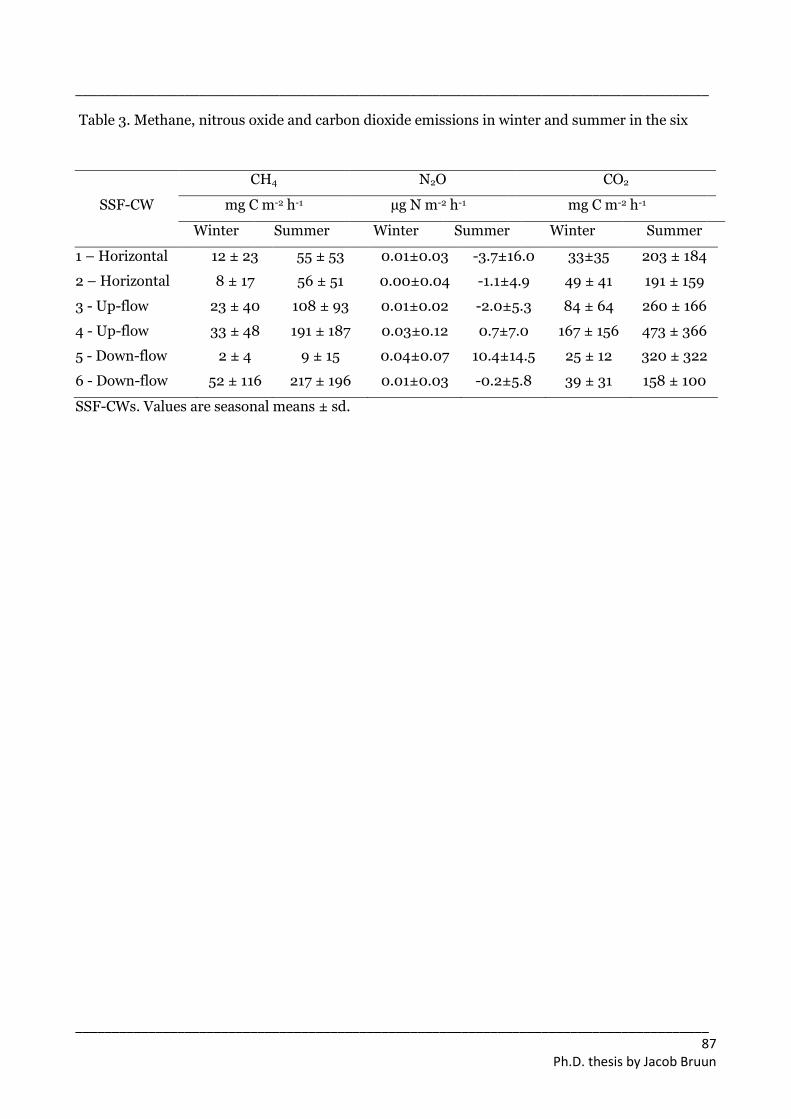
_______________________________________________________________________________________
_______________________________________________________________________________________ 87
Ph.D. thesis by Jacob Bruun
Table 3. Methane, nitrous oxide and carbon dioxide emissions in winter and summer in the six
SSF-CWs. Values are seasonal means ± sd.
SSF-CW
CH4 N2O CO2
mg C m-2 h-1 µg N m-2 h-1 mg C m-2 h-1
Winter Summer Winter Summer Winter Summer
1 – Horizontal 12 ± 23 55 ± 53 0.01±0.03 -3.7±16.0 33±35 203 ± 184
2 – Horizontal 8 ± 17 56 ± 51 0.00±0.04 -1.1±4.9 49 ± 41 191 ± 159
3 - Up-flow 23 ± 40 108 ± 93 0.01±0.02 -2.0±5.3 84 ± 64 260 ± 166
4 - Up-flow 33 ± 48 191 ± 187 0.03±0.12 0.7±7.0 167 ± 156 473 ± 366
5 - Down-flow 2 ± 4 9 ± 15 0.04±0.07 10.4±14.5 25 ± 12 320 ± 322
6 - Down-flow 52 ± 116 217 ± 196 0.01±0.03 -0.2±5.8 39 ± 31 158 ± 100
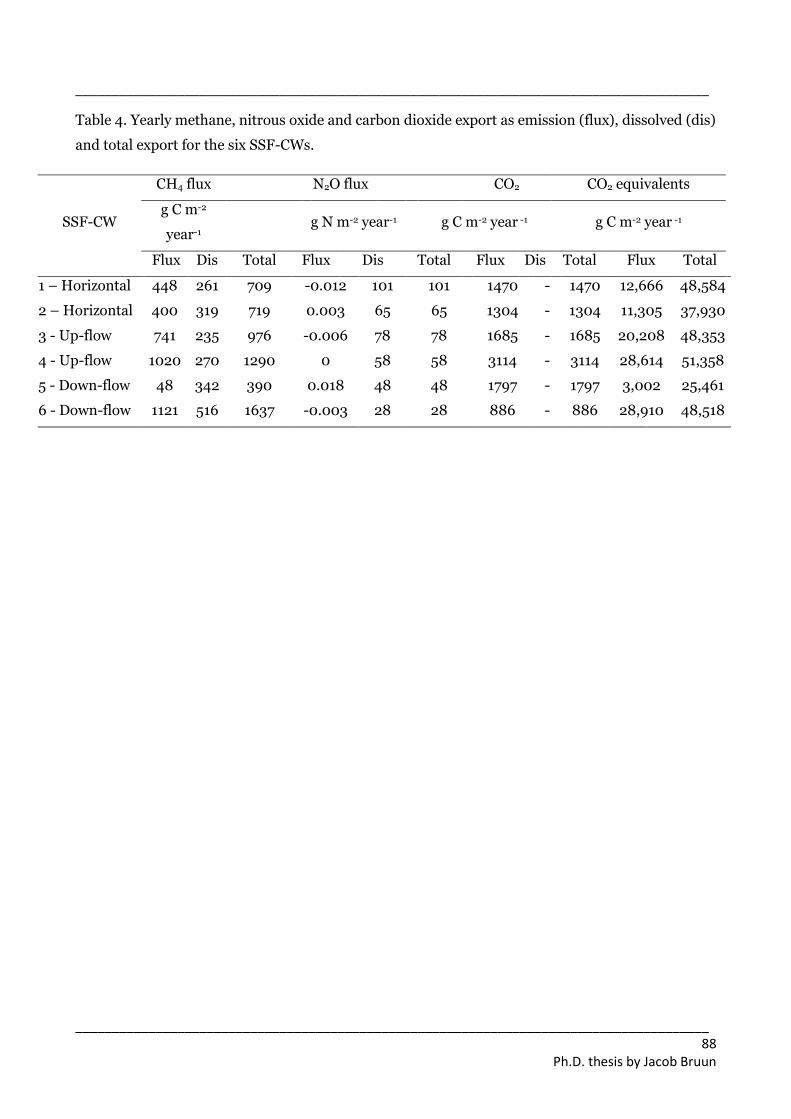
_______________________________________________________________________________________
_______________________________________________________________________________________ 88
Ph.D. thesis by Jacob Bruun
Table 4. Yearly methane, nitrous oxide and carbon dioxide export as emission (flux), dissolved (dis)
and total export for the six SSF-CWs.
SSF-CW
CH4 flux N2O flux CO2 CO2 equivalents
g C m-2
year-1 g N m-2 year-1 g C m-2 year -1 g C m-2 year -1
Flux Dis Total Flux Dis Total Flux Dis Total Flux Total
1 – Horizontal 448 261 709 -0.012 101 101 1470 - 1470 12,666 48,584
2 – Horizontal 400 319 719 0.003 65 65 1304 - 1304 11,305 37,930
3 - Up-flow 741 235 976 -0.006 78 78 1685 - 1685 20,208 48,353
4 - Up-flow 1020 270 1290 0 58 58 3114 - 3114 28,614 51,358
5 - Down-flow 48 342 390 0.018 48 48 1797 - 1797 3,002 25,461
6 - Down-flow 1121 516 1637 -0.003 28 28 886 - 886 28,910 48,518

_______________________________________________________________________________________
_______________________________________________________________________________________ 89
Ph.D. thesis by Jacob Bruun
Table 5. Correlation matrix of the repeated measures linear mixed models of GHG fluxes. The
parameters include effluent flow rate, effluent [O2], [NO3-], [NH4
+], [SO4-] and pH and the filter
matrix temperature. P values from the models are significant to/at < 0.01 (*), < 0.001 (**) and <
0.001 (***) and non-significant (ns).
CH4-C flux N2O-N flux Reco
Parameters p - value Estimate p - value estimate p - value estimate
SSF-CW *** - *** - *** -
Flow rate *** -1.217 ns *** -0.668
Temperature *** 0.159 ns *** 0.145
[O2] ns ns ns
[NO3] ns ns ns
[SO4] *** -0.044 ns ns
[NH4] ns ** -0.130 * -0.730
pH ns ns *** 0.921
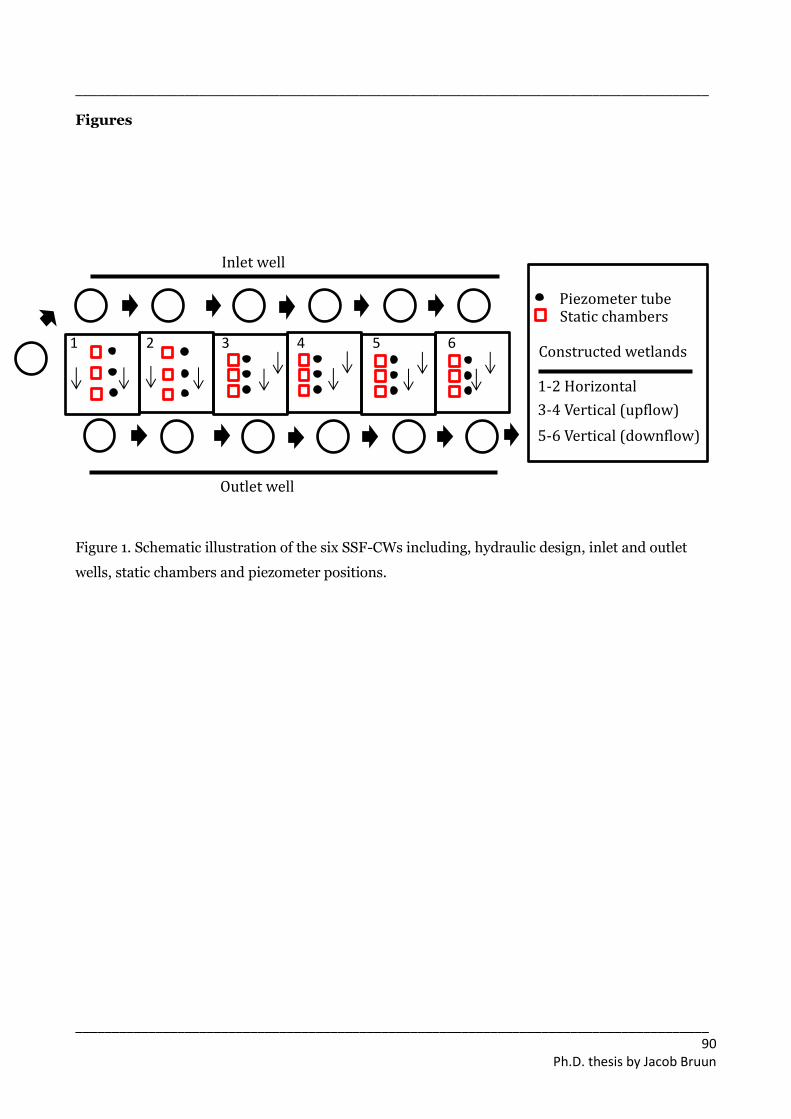
_______________________________________________________________________________________
_______________________________________________________________________________________ 90
Ph.D. thesis by Jacob Bruun
Figures
Figure 1. Schematic illustration of the six SSF-CWs including, hydraulic design, inlet and outlet
wells, static chambers and piezometer positions.
Inlet well
Outlet well
Piezometer tube Static chambers
1 2 3 4 5 6
3-4 Vertical (upflow)
5-6 Vertical (downflow)
Constructed wetlands
1-2 Horizontal
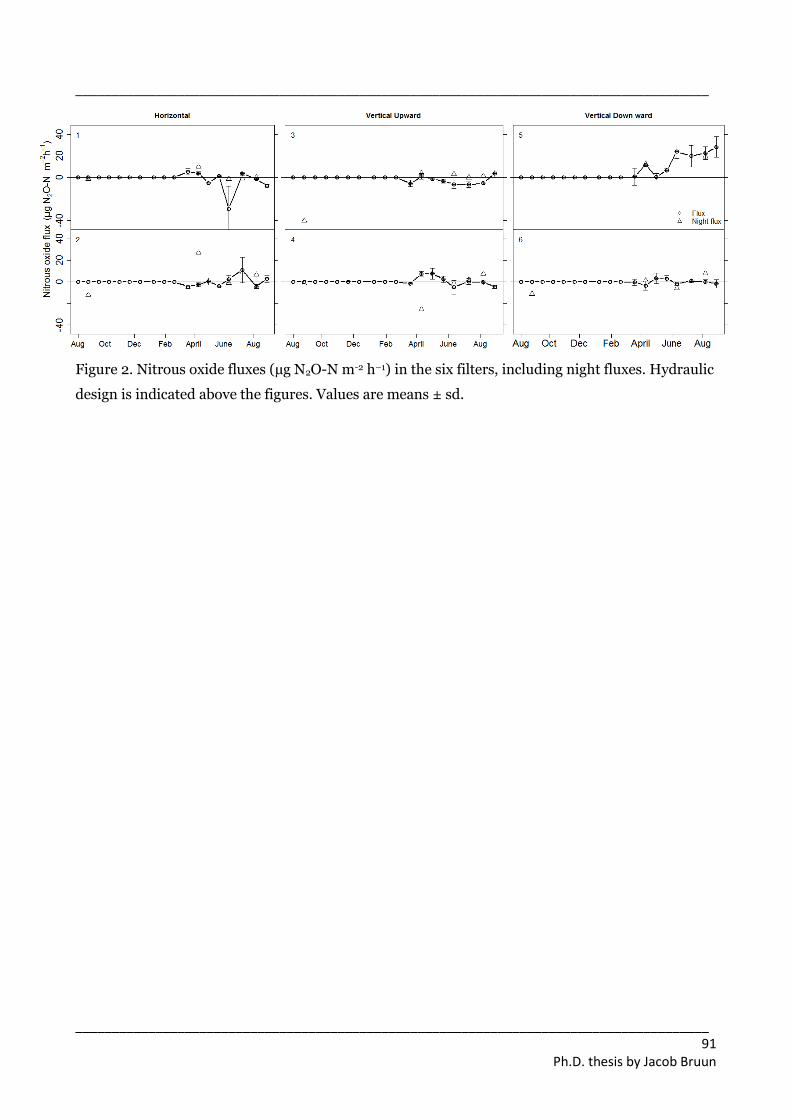
_______________________________________________________________________________________
_______________________________________________________________________________________ 91
Ph.D. thesis by Jacob Bruun
Figure 2. Nitrous oxide fluxes (µg N2O-N m-2 h–1) in the six filters, including night fluxes. Hydraulic
design is indicated above the figures. Values are means ± sd.
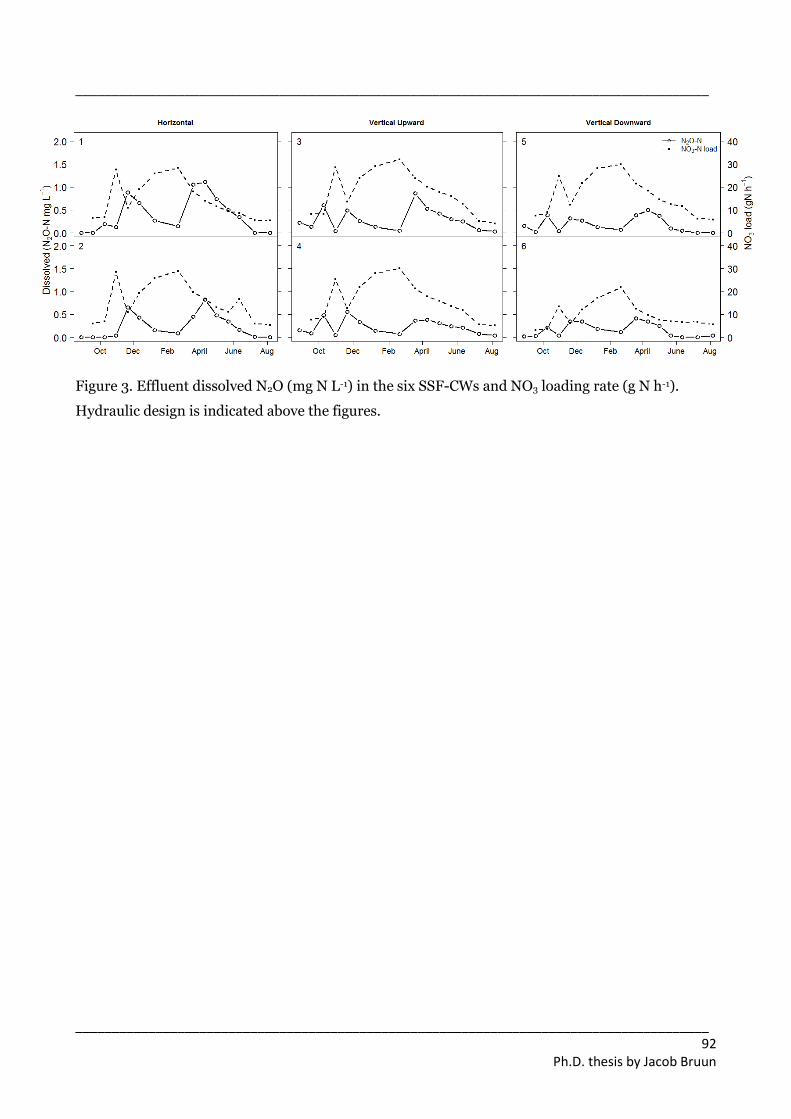
_______________________________________________________________________________________
_______________________________________________________________________________________ 92
Ph.D. thesis by Jacob Bruun
Figure 3. Effluent dissolved N2O (mg N L-1) in the six SSF-CWs and NO3 loading rate (g N h-1).
Hydraulic design is indicated above the figures.
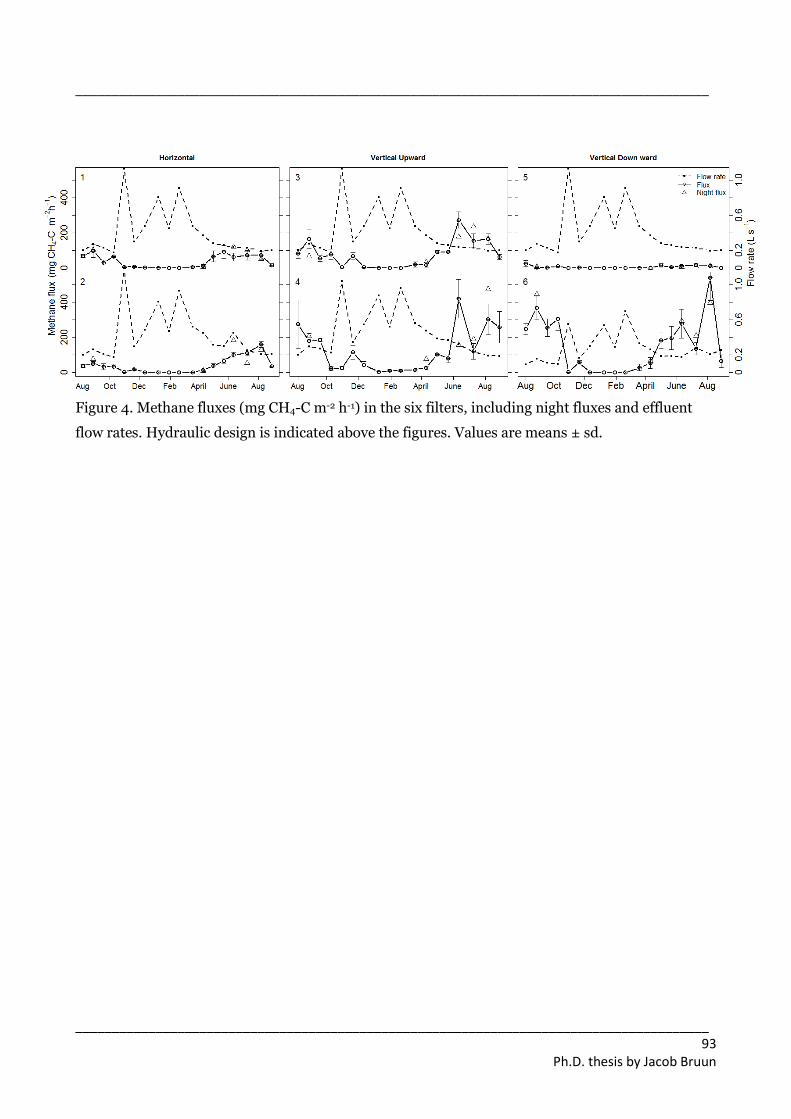
_______________________________________________________________________________________
_______________________________________________________________________________________ 93
Ph.D. thesis by Jacob Bruun
Figure 4. Methane fluxes (mg CH4-C m-2 h-1) in the six filters, including night fluxes and effluent
flow rates. Hydraulic design is indicated above the figures. Values are means ± sd.
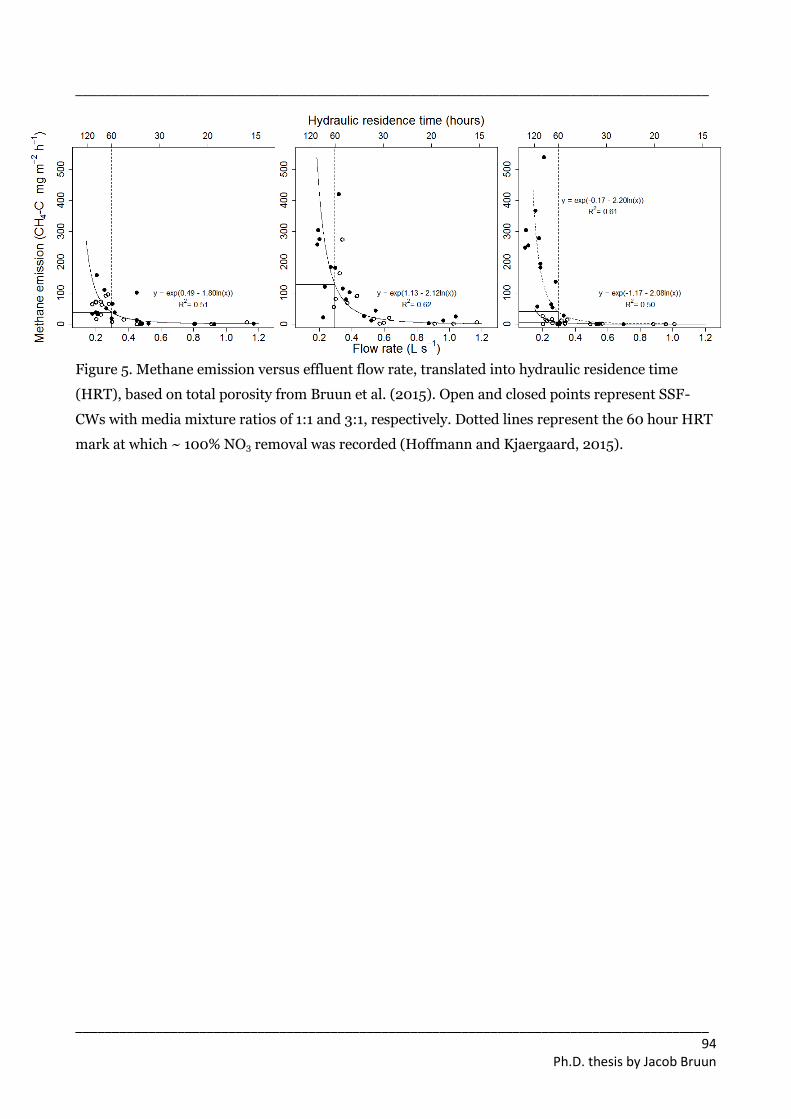
_______________________________________________________________________________________
_______________________________________________________________________________________ 94
Ph.D. thesis by Jacob Bruun
Figure 5. Methane emission versus effluent flow rate, translated into hydraulic residence time
(HRT), based on total porosity from Bruun et al. (2015). Open and closed points represent SSF-
CWs with media mixture ratios of 1:1 and 3:1, respectively. Dotted lines represent the 60 hour HRT
mark at which ~ 100% NO3 removal was recorded (Hoffmann and Kjaergaard, 2015).

_______________________________________________________________________________________
_______________________________________________________________________________________ 95
Ph.D. thesis by Jacob Bruun
Figure 6. Effluent dissolved CH4-C concentrations and filter temperatures measured at a depth of
0.5 m in the six SSF-CWs.
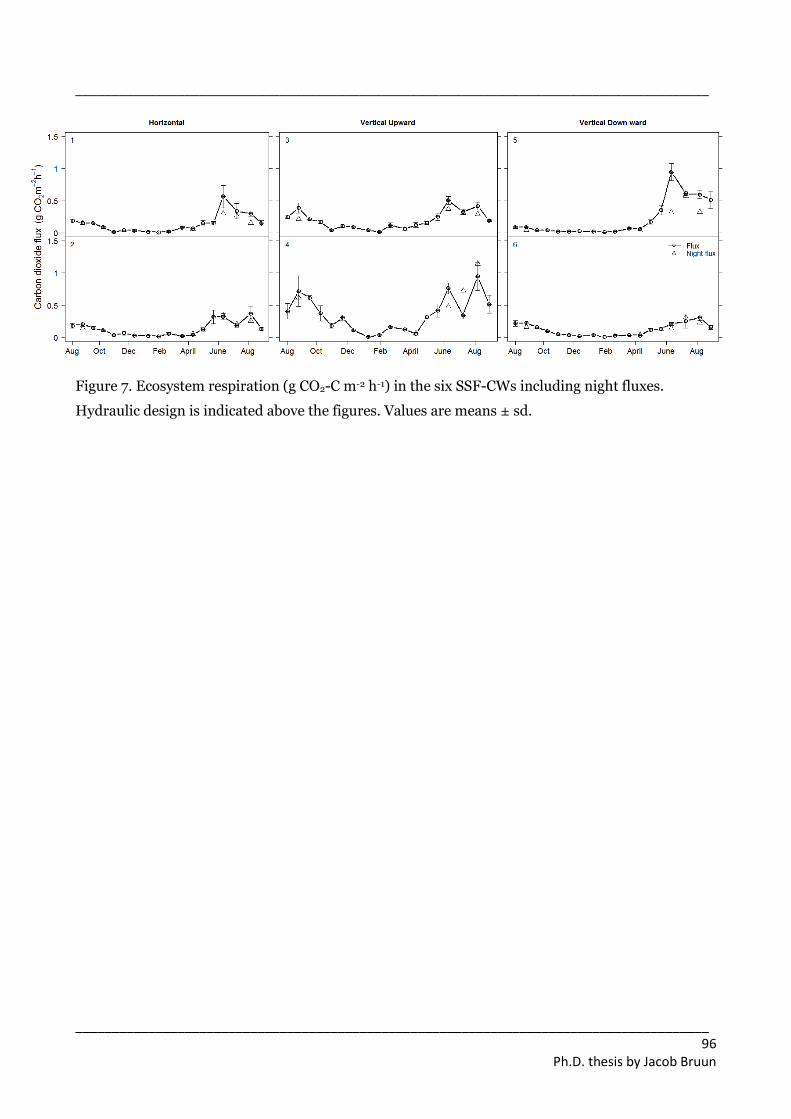
_______________________________________________________________________________________
_______________________________________________________________________________________ 96
Ph.D. thesis by Jacob Bruun
Figure 7. Ecosystem respiration (g CO2-C m-2 h-1) in the six SSF-CWs including night fluxes.
Hydraulic design is indicated above the figures. Values are means ± sd.
_______________________________________________________________________________________
_______________________________________________________________________________________ 97
Ph.D. thesis by Jacob Bruun
Appendix III
Solute transport and nitrate removal in full scale subsurface flow constructed
wetlands treating agricultural drainage water
Jacob Bruun*1,2, Lorenzo Pugliese2, Carl Christian Hoffmann1, Charlotte Kjaergaard2
1Department of Bioscience, Aarhus University, 8600 Silkeborg, Denmark 2Department of
Agroecology, Aarhus University, 8830 Tjele, Denmark
*Corresponding author: Jacob Vestergaard Druedahl Bruun, Aarhus University, Department of
Bioscience, Faculty of Science and Technology, Vejlsøvej 25, DK-8600 Silkeborg, Denmark. E-
mail:[email protected]
Key words: Constructed wetland, reactive filters, woodchip, solute transport, non-equilibrium,
diffusion, denitrification, hydraulic efficiency

_______________________________________________________________________________________
_______________________________________________________________________________________ 98
Ph.D. thesis by Jacob Bruun
Abstract
Subsurface flow constructed wetlands (SSF-CW) consisting of woodchip based filter matrixes are
promising measures targeting agricultural N loss via subsurface tile drains. Optimization of these
systems may include the selection of appropriate hydraulic designs (i.e. horizontal and vertical
flow), which may affect the solute residence time. In this study a bromide tracer experiment is
performed in three full scale SSF-CWs, constituted of a woodchip-based filter matrix. Three
different hydraulic designs (horizontal (H), vertical upward (Vup) and vertical down flow (Vdown))
and two flow rates were investigated (0.49 and 1.83 L s-1). Additionally, batch experiments
investigating the intra-granular diffusion into woodchips using two tracer solutes (tritium and
bromide) were carried out. Non-equilibrium solute transport, including a mass exchange between a
mobile and an immobile domain, prevailed in all SSF-CWs. The Vup demonstrated the most
pronounced non-equilibrium and the lowest N removal rate. In contrast the largest N removal rate
was observed in the Vdown. The higher NO3 removal rates was attributed to a longer solute residence
time . Tailing of the tracer BTC indicated the influence of diffusive exchange in solute residence
time, and this was further supported by the intra-.granular diffusion of tracer solutes. Generally,
the results suggested the vertical downwards SSF-CW as the best performing SSF-CW in terms of
solute transport behavior and N removal efficiency.

_______________________________________________________________________________________
_______________________________________________________________________________________ 99
Ph.D. thesis by Jacob Bruun
Introduction
Agricultural nitrogen (N) losses are recognized as the single major source of N to surface waters
(Carpenter et al., 1998; Kronvang et al., 2009), driving eutrophication and consequently the
degradation of water quality and loss of biodiversity (Carpenter et al., 1998). Agricultural
subsurface tile drains constitute a major transport pathway (Dinners et al., 2002), connecting
fields with receiving waters and thus, allowing the direct transport of NO3-N to surface waters
(Fausey et al., 1995). Promising strategies to mitigate agricultural subsurface drainage losses of N
include the implementation of subsurface flow constructed wetlands (SSF-CW) containing a
reactive filter media as part of the tile drainage structure or as end of pipe solutions (Schipper et
al., 2010; Robertson et al., 2010; Blowes et al. 2000).
Nitrate reduction via denitrification is generally recognized as the dominant mechanism
controlling NO3-N removal in reactive granular woodchips based filter media (Gibert et al., 2008;
Greenan et al., 2006). Woodchips based filters are characterized by a dual pore structure (Bruun et
al., 2015a; Cameron and Schipper 2010; Robertson, 2010) and non-equilibrium solute transport
(Bruun et al., 2015a; Cameron et al., 2012; Herbert, 2011). The non-equilibrium solute transport
can be conceptualized by the mobile and immobile approach (Van Genuchten and Wierenga, 1976),
with convective mass transfer in the mobile domain, and mass transfer between domains restricted
to diffusion (Van Genuchten and Wierenga, 1976). Non-equilibrium solute transport in woodchip
media have been attributed to variations in pore water velocities and/or inter or intra-granular
diffusion (Bruun et al., 2015a; Cameron and Schipper, 2012). Diffusive mass exchange into the
immobile domain increase the solute residence time and can affect the reaction rate of reactive
solutes (e.g. NO3) (Bruun et al., 2015a).
In the highly porous woodchips, diffusion of solutes into the intra-granular pore space (Wood et al.,
1990) affects the transport of both non-reactive (tracers) and reactive (e.g. NO3) solutes. The effect
of intra-granular diffusion on the solute transport of anions (e.g. NO3 or Br), may be limited due
the electrostatic repulsion of anions (anion exclusion) by negatively charged surfaces on the
woodchips, resulting from the oxidation of organic matter (e.g. polyanions created under oxidation
of lignin (ISWPC, 2003)). Thus, anion exclusion may affect the observed hydraulic performance of
woodchip-based systems.
The hydraulic efficiency (λ) of SSF-CWs has been used to evaluate the solute transport (e.g. García
et al., 2004; Masbough et al., 2005). In horizontal SSF-CWs the λ have been found to increase with
the aspect ratio, which is defined at the length: width ratio (García et al., 2004). Increasing the
aspect ratio by one unit, increase the normalized delay time (tracer delay time/HRT) a factor 1.6-
_______________________________________________________________________________________
_______________________________________________________________________________________ 100
Ph.D. thesis by Jacob Bruun
1.7 and decrease the dispersion number by 0.3-0.4 (García et al., 2004), which further more
increased the hydraulic efficiency (García et al., 2004).
In SSF-CWs with different hydraulic design (horizontal, vertical upward and vertical downward
flow), the annual N removal efficiencies have been found to be higher when applying a horizontal
flow as compare to the vertical flow hydraulic design (Hoffmann and Kjaergaard, 2015). Horizontal
flow SSF filters, may provide the highest aspect ratio, whereas vertical flow SSF filters due to the
dimensions have a larger cross sectional area for the infiltration water and a shorter flow path, and
thus a smaller aspect ratio.
The objective of this study was to investigate the solute transport in SSF-CWs of three hydraulic
designs (horizontal, vertical upward, and vertical downward flow) and link the hydrological flow
paths and the NO3 removal efficiency.
We hypothesized that; i) the vertical flow hydraulic designs would demonstrate the most
pronounced non-equilibrium solute transport, ii) the NO3-N removal rate would be highest in the
horizontal flow SSF-CW, and iii) that solutes can diffuse into the intra-granular pores of woodchips
To test these hypothesis three woodchip-based SSF-CWs, having different hydraulic designs
(horizontal (H), vertical upward (Vup) and vertical downward flow (Vdown)) where investigated.
Bromide (Br) was used as a tracer, at two different flow rates. Additional batch experiments were
conducted to investigate if intra-granular diffusion of anions occurs in woodchips.
2 Materials and methods
2.1 Field site and subsurface flow constructed wetland
Tracer experiments were conducted in a full-scale SSF-CW, located in Skannerup 56.214132 -
9.742723 N/E, Jutland (DK)) as part of a tile drainage system covering an agricultural catchment
of 85 ha. The SFF-CWs were constructed in 2012 by excavating 6 SSF-CWs with dimensions 10 m
wide, 10 m in length and 1 m deep (Kjaergaard and Hoffmann, 2015). The excavated SSF-CWs were
lined with an impermeable membrane (Junifold PE HD GEO MEMBRANE 1.0 mm; Millag,
Denmark) to avoid infiltration/exfiltration of water to/from the SSF-CWs. Three different
hydraulic designs allow either horizontal flow (H), vertical upwards flow (Vup) or vertical
downwards flow (Vdown) (Fig. 1). Drainage water was directed to each SSF-CW by individual
drainage wells, supplied from the same drainage inlet pond. A distribution layer consisting of
coarse Seashells size 8-32 mm (Danshells A/S, Denmark) was placed in the inlet zones to facilitate
homogeneous infiltration across the cross sectional inlet area, as well as in the outlet zones of H
_______________________________________________________________________________________
_______________________________________________________________________________________ 101
Ph.D. thesis by Jacob Bruun
and Vdown (Fig. 1). The filter matrix, placed between inlet and outlet, was composed of a 3:1 (m3:m3)
mixture of Willow woodchips size 4-32 mm (Nyvraa, Denmark) and crushed Seashells size 2-4 mm
(Danshells A/S, Denmark). Perforated inlet and outlet pipes were positioned at a depth of 0.5 m in
the H configuration, while were distributed across the inlet and outlet zone area in the Vup and
Vdown configurations (Hoffmann & Kjaergaard, 2015). More details on the SSF-CWs and on the field
site are given by Hoffmann and Kjaergaard (2015)
2.2 Instrumentation
The instrumentation included ISCO samplers (Lincoln, Nebraska, USA) for continuous automatic
collection of hourly water samples in a joint inlet well and the individual SSF-CW outlet wells. The
outlet wells were further equipped with electromagnetic flow-meters (WATERFLUX 3070, Krohne,
Germany) for continuous measurement of flow rate. In addition to influent and effluent water
sampling the CWs were equipped with piezometers to allow sampling of filter matrix pore water.
For the H configuration piezometers with a 0.50 m pore-water screen were positioned at a distance
of 2.5, 5 and 7.5 m from the inlet at a depth of 0.25-0.75 m. In the Vup and Vdown configurations
three piezometers with a 0.10 m pore-water screen were placed in the centre of the filter matrix at
depths of 0.25-0.35, 0.50-0.60 and 0.75-0.85 m.
[insert Fig. 1]
2.3 Tracer experiment
Br tracer breakthrough experiments were conducted at steady-state flow conditions, using high
(1.83 L s-1) and low (0.49 L s-1) flow rates. The median site specific flow rate was 0.34 L s-1, with the
experimental flow rates occurring at 3% and 8% of the days per year during 2013-2015 (Hoffmann
and Kjaergaard, 2015). Tracer experiments with high flow rates were conducted in March 2015,
while tracer experiments with low flow rates were conducted in April 2015. The flow rates were
kept constant by pumping (Pumps EHEIM, compact+ 2000) influent water to the SSF-CWs for the
full duration of the tracer experiment (Fig. 2). Steady state conditions prior to the tracer
application, were defined as three consecutive days with steady effluent flow rate.
The Br tracer solution was made by dissolving 373.0 g potassium bromide (KBr), corresponding to
250.4 g Br in 25 L demineralized water. The tracer solute was acclimated to the in situ water
temperature prior to tracer addition. At steady state out-flow conditions the pumps were turned
off, and the Br tracer solution was supplied directly to the inlet pipe at equal flow rates. At high
flow the tracer experiments were conducted in one SSF-CW at a time, as the in-flow volume did not
allow parallel experiments, while at low flow the tracer experiments were conducted in parallel.

_______________________________________________________________________________________
_______________________________________________________________________________________ 102
Ph.D. thesis by Jacob Bruun
[insert Fig. 2]
2.4 Sampling and analysis
Water samples for Br and water chemistry analysis were taken automatically from the outlet ISCO
samplers and manually from the piezometers. Prior to water sampling from the piezometers, the
stagnant water was removed by pumping, thus, allowing new pore water to enter into the
piezometers. Acid-washed polyethylene (PE) 50 ml bottles were used for the water sampling. Water
sampling was conducted continuously during the tracer experiment and lasted 7 and 11 days for
high and low flow, respectively. Each experiment was terminated when effluent Br concentrations
were < 0.1 mg Br L-1, at which > 91 % of the Br mass was recovered. Initially, samples were taken
every 1 hour (effluent water) and 10 min (piezometers) during low flow, and every 15 min (effluent
water) and 5 min (piezometers) during high flow. The sampling frequency was gradually reduced
after 24 hours (effluent water) and 7 hours (piezometers). Subsamples (20 ml) from both inlet and
outlet ISCO samplers were taken continuously for analysis of background (influent) and effluent Br
concentrations. Samples for Br analysis were stored cold, at < 10 C˚ until analysis. Additional
subsamples taken during the tracer experiment were pooled into one sample representing each
SSF-CW and subsequently frozen for later analysis.
All collected samples were analyzed for Br by ion chromatography (Dionex ICS-1500 IC-system
including an auto-sampler and suppressor unit) (method: DS/EN ISO 10304-1). Pooled effluent
samples were additionally analyzed for nitrate (NO3-N) and ammonium (NH4-N). Prior to analysis
the defrosted samples were filtered through a 45 µm Monta® membrane section (Cat No
MCEWGS047045, Frisenette, Denmark). Samples for NO3-N analysis were further filtered through
a 0.22 µm nylon membrane filter (SNY 2225; Frisenette, Knebel, Denmark) and analysed by ion
chromatography. Samples for NH4-N were measured colorimetrically using a Shimadzu 1700
spectrophotometer (Shimadzu Corp., Kyoto, Japan) according to a Danish standard method (DS
224). Influent and effluent water and pore water extracted from piezometers were analysed in situ
for pH, temperature and dissolved oxygen concentration (DO) using a handheld multiparameter
meter (YSI Professional Plus, Xylem Analytics, Ohio, USA). In situ analysis of influent water was
done in the individual inlet wells.
2.5 Intra-granular batch diffusion experiment
Intra-granular diffusion in woodchips was investigated in a batch equilibration experiment using
bromide (Br) and tritium (3H2O) tracer solutions. The tracer solutions were applied with either
1,000 mg Br L-1 (high) or 100 mg Br L-1(low) concentrations and constant 3H2O activity of 715 Bq.
Tracer solutions were produced from demineralized water, degassed by He flushing for 90 min to
_______________________________________________________________________________________
_______________________________________________________________________________________ 103
Ph.D. thesis by Jacob Bruun
remove dissolved O2 in order to inhibit the aerobic degradation and avoid structural changes of the
woodchips during the experiment.
Pre-saturated woodchips were collected from the SSF-CW in Skannerup, Denmark. The woodchips
were sieved into three size fractions 4-8, 8-16 and 16-32 mm using sieves of 4, 8, 16 and 32 mm in
mesh size. From each size fraction samples consisting of >30, 12 and 4 pieces of woodchips with
five replicates of each, were subjected to either high or low tracer solution.
Prior to the experiment 20.0 g of woodchips of each size fraction were placed in pre-autoclaved 100
ml brown bottles with snaplid and placed on a stirring table revolving at 70 rpm. Each size fraction
consisted of ten replicates. At time zero (t0) 75 ml. High and Low tracer solution were added to
each of the five replicates bottles. The first sample was taken 101 minutes (t1) after tracer addition.
Subsequent samples were taken continuously in each flask at time 10x + 0.3, where 10x is the time of
the previous sample. The final samples were taken at 104.6 minutes. Prior to each sample extraction
bottles were shaken. Bottles were closed between sample extractions. The woodchips were at all
times completely submerged in the tracer solution. The experiment was conducted in a dark
acclimated room at 10 °C.
After completion of the diffusion experiment woodchips weights were determined by drying at 80
C˚ for 72 hours according to Bruun et al. (2015a) and Herbert (2011). Woodchips were
subsequently submerged in EGME (ethylene glycol monoethyl ether) for further analysis of the
specific surface area (SSAEGME) (modified method from Carter (1986)). The modifications involved
an extended time (14 days) for saturation of the materials, as it was assessed necessary for a
complete saturation of EGME.
Tracer concentration/activity in the batch solution were analyzed using liquid scintillation
counting (Tri-Carb 2250 CA) for 3H2O, and for Br by ion chromatography as described above.
2.6 Data analysis
Data analysis was performed using R software version 3.0.2 (R Core Team, 2013). The Br analysis
returned breakthrough curves (BTCs) constructed by plotting the relative Br concentration (C/C0)
against the eluted volume (V), converted into eluted pore volumes (V/V0) by dividing V with the
water-filled pore space (V0). The total porosity (tot) of the 3:1 (m3:m3) woodchips:Seashell matrix
was determined by Bruun et al., (2015a). The porosity of the distribution layer was obtained by
packing columns (~1.500 cm3) with the coarse Seashell granulates, measuring water saturation and
gravimetric water content wdm (kg kg-1). Total water-filled porosity, θtot (m3 m-3), was obtained from
the dry bulk density ρb (kg m-3), the density of water (ρw) and the gravimetrical water content wdm .
Water-filled pore space V0 (m3) of the specific layer was calculated by multiplying the water-filled
_______________________________________________________________________________________
_______________________________________________________________________________________ 104
Ph.D. thesis by Jacob Bruun
porosity with the volume of the layer Vt (m3). The water-filled pore space (V0) (m3) of the SSF-CWs
was defined as (V1 x θ1) + (V2
x θ2), where Vx is the total volume and θx the porosity of the
distribution layer (1) and woodchips:Seashell filter media (2). The Br BTCs were additionally
evaluated by assessing the number of eluted pore volumes (V/V0) at Br mass recoveries (M/M0) of
10, 25, 50, 75 and 90 %, where M is the accumulated Br mass recovered in the effluent and M0 is
the total Br mas applied.
In addition to the evaluation for the BTCs, the commonly used hydraulic efficiency (λ) was used to
describe the solute transport and the NO3-N removal rate and efficiency. The hydraulic efficiency
is defined by Persson et al. (1999) as:
𝜆 =𝑡𝑝
𝑡𝑛
where, tp is the time of the peak arrival (h)
Flow normalized NO3-N removal rates were calculated as
𝑁𝑟𝑒𝑑 =𝑁𝑂 − 𝑁3𝑙𝑜𝑎𝑑 − 𝑁𝑂 − 𝑁3𝑒𝑥𝑝𝑜𝑟𝑡
𝑄
where, Q is the effluent flow rate (L d-1).
In the tracer diffusion experiment the relative decline in inter-granular tracer
activity/concentration is used as an indication of intra-granular diffusion. The mean of at least
three measuring points, after solution:woodchips equilibrium defined by no further change in the
inter-granular tracer activity/concentrations, were achieved for each replicate. To test the relative
decline in inter-granular activity/concentration between woodchip size fractions, differences in the
inter-granular tracer (Br) concentration/ (3H2O) activity were assessed using one-way analysis of
variance (ANOVA).
3. Results and discussion
3.1 Physical characteristics of the SSF-CWs
The physical characteristics of the SSF-CW woodchips-seashell filter matrix are given by Bruun et
al. (2015a). The water-filled pore space (V0) derived from the small-scale measured total porosity
and the volume of the specific filter (Table 1), has a major influence on the interpretation of the
_______________________________________________________________________________________
_______________________________________________________________________________________ 105
Ph.D. thesis by Jacob Bruun
tracer BTCs. The application of small-scale tot, however rely on an assumption of small- to large-
scale similarities, which may not be true (Herbert, 2011). In addition, a decrease in porosity as a
function of time in SSF-CWs may be caused by clogging of pores by biofilm growth/formation or by
particulate matter accumulation that may decrease the convective pore space (García et al., 2004).
On opposite an increase in root density from developing wetland vegetation could increase the
volume of larger biopores, and thus markedly influencing solute transport.
{insert Table 1}
The woodchip fractions were generally characterized by a very high specific surface area (SSAEGME)
ranging from 343 to 390 m2 g-1, while SSAEGME of 2-4 mm seashells was markedly lower (4.3 m2 g-1)
(Canga et al., 2015). Generally, the SSAEGME was not significantly affected by the size of the
woodchip particles (p = 0.063).
[insert Fig. 3]
3.2 Bromide transport in subsurface flow constructed wetlands
Generally, the Br-BTCs were in all hydraulic designs characterized by asymmetric left-skewed
behavior, with a peak arrival before 1 V/V0 and tailing (Fig. 3). Increasing the flow rate from 0.49 L
s-1 to 1.83 L s-1 decreased C/C0 at peak arrival and slightly increased tailing (Fig. 3, Table 2). A fast
tracer breakthrough was observed for Vdown, showing a strongly deviating BTC at high flow (Fig.
3C). The BTC behavior observed for all hydraulic designs indicates the presence of non-equilibrium
solute transport. The incomplete mixing of the resident pore water and the replacing solute may
result from local variations in pore water velocities and/or diffusive mass exchange between mobile
and immobile pore domains (Van Genuchten and Wierenga, 1976; Rao et al., 1980).
Although non-equilibrium transport was evident for all SSF-CWs, the BTCs shape differed slightly
among the hydraulic designs (Fig. 3, Table 2). BTC analysis revealed that the initial tracer
breakthrough and peak arrival occurred markedly faster at both flow rates in the Vup design,
indicating more pronounced non-equilibrium transport (Fig 3B, Table 2). The markedly deviating
BTC at high flow rate for Vdown most likely resulted from ponding surface water, which was only
observed at high flow rate prior to the Br application, thus resulting in non-steady experimental
conditions.
[insert Fig. 4]
_______________________________________________________________________________________
_______________________________________________________________________________________ 106
Ph.D. thesis by Jacob Bruun
3.3 Solute transport behavior along the flow pathway
Breakthrough curves obtained from piezometer measurements exhibited more pronounced
responses for the different hydraulic designs. In the H design the BTCs gradually developed along
the flow path (Fig. 4), with progressively later peak arrival and decreasing peak maximum C/C0 at
both flow rates (Table 2). Except for a deviation in the BTC observed at a distance of 7.5 m from the
inlet, this BTC behavior generally resembled that of the effluent BTC (Fig. 4A). Larger and non-
systematic variations were observed along the Vup direction (Fig. 5, Table 2), with BTCs deviating
markedly from the effluent BTC. Thus, demonstrating the more pronounced non-equilibrium
characteristics of the Vup design at both flow rates. Along the Vdown direction, the BTC gradually
developed with progressively later peak arrival and decreasing peak maximum C/C0 at low flow
(Fig. 6, Table 2), resembling the effluent BTC. The markedly later peak arrival at high flow was
most likely caused by the ponding of water at the surface inlet zone.
3.4 Tracer recovery and intra-granular diffusion
In general the mass recovery of effluent Br was high amounting to 90-96% following after ~4.5
V/V0 (Table 2). The exceptions were a slightly lower recovery at low vertical upwards flow (88%),
and a markedly lower recovery from the vertical downwards flow (79%), the latter probably
resulting from the ponding. The number of eluted pore volumes (V/V0) at variable M/M0
demonstrated the flow rate dependency of solute transport in these SSF-CWs, requiring a larger
number of pore volumes to recover tracer mass at high flow rates (Table 3). This was supported by
the lower peak C/C0, and the slightly more pronounced tailing at high flow, suggesting an increased
dispersion and/or diffusive mass exchange between mobile and immobile domains. The hydraulic
design affected the number of pore volumes required to achieve the specific Br mass recovery
(Table 4). The Vup design demonstrated the most pronounced degree of physical non-equilibrium,
with markedly lower V/V0 at M/M0 ≤50%, and markedly higher V/V0 at M/M0 >50% (Table 3).
This was unexpected, as the gravitational pull was expected to increase the lateral dispersion of the
solutes (Suliman et al., 2006). The faster mass recovery at M/M0 ≤50% suggests that a smaller
fraction of the water filled pore space is contributing to the convective solute transport (mobile
domain) during vertical upwards flow. While the faster transport of solutes reduce the time
available for biochemical processes, a fraction of the tracer solute was retained for a longer time in
the filter, due to diffusive exchange between mobile and immobile pore domains. These results
agree with the findings of Bruun et al. (2015a) investigating 3H2O transport in the similar
woodchips-mineral mixtures at variable flow rates in a controlled column setup. The occurrence of
diffusive solute exchange between dual pore domains in woodchips media was further suggested by
Cameron and Schipper (2012).
_______________________________________________________________________________________
_______________________________________________________________________________________ 107
Ph.D. thesis by Jacob Bruun
Anion exclusion can potentially affect the transport of solutes (Porter et al., 1960). In the tracer
batch diffusion experiment, the solute tracer concentrations declined log-linearly, and became
linear after 102.5-103.7 minutes, indicating a steady state. The decline in tracer concentration was
assumed to resemble intra-granular diffusion in woodchips. The relative change in the solute tracer
activity/concentration was significantly higher for 3H2O (21%) than for Br (18%) (p = 0.03). This
difference may either indicate a slight anion exclusion of Br and/or hydroxyl exchange of 3H2O to
woodchips (Morris, 2006; Turner et al., 2009). Intra-granular 3H2O diffusion was previously
suggested as a major transport parameter controlling solute transport at high convective velocities
in coarse 2-4 mm granular seashells filters (Canga et al., 2015). Thus it seems highly likely that the
longer residence time, of part of the tracer mass (Table 4), results from intra-granular diffusion in
the woodchips-mineral filters. No difference in the relative tracer concentrations was found
between grain-size fractions and Br concentrations (p = 0.13, p = 0.86, respectively).
3.5 Hydraulic efficiency
The hydraulic efficiency of SFF-CWs has been classified according to λ, differentiating the
hydraulic efficiency into poor (λ < 0.5), satisfactory (0.5 < λ ≤ 0.75) or good (λ > 0.75) (Persson et
al., 1999). According to this definition the Vup flow, with most pronounced non-equilibrium flow, is
characterized by a poor λ, while Vdown are just at the threshold between poor and satisfactory and
the H flow is slightly above the lower threshold of satisfactory (Table 4). This result is consistent
with what was expected given the aspect ratios of the SSF-CWs (Table 1) (García et al., 2004).
According to the definition by Persson et al. (1999) the optimal SFF-CW in terms of hydraulic
efficiency (λ = 1) is obtained when homogenous flow prevail. However, in terms of biochemical
reactions (Bruun et al., 2015a) and/or chemical reactive solutes (Canga et al., 2015) solute
reaction/transformation may actually benefit from a non-equilibrium flow system facilitating
solute diffusion into immobile pore domains with higher reaction rates and/or longer residence
time for reaction. Although the vertical upwards flow was characterized by a faster effluent mass
recovery of ≤50% of the tracer mass applied, the markedly longer residence time for the latter 50%
tracer mass (Table 3), may allow more time and/or higher reaction rates for reactive solutes. Bruun
et al. (2015a) suggested that redox gradients may develop across the dual domains, allowing the
immobile domains to constitute a redox reaction sink for terminal electron acceptors (i.e. O2, NO2-
N NO3-N). The increase in λ following an increasing the flow rate (Table 4) was related to the
decrease in C/C0 at peak arrival and the more pronounced tailing, thus indicating more
pronounced solute diffusive exchange between mobile and immobile domains. Thus, in terms of
evaluating solute transport in SSF-CWs dominated by physical non-equilibrium transport, λ does
not provide information on the solute transport behavior.
3.6 Nitrate reduction

_______________________________________________________________________________________
_______________________________________________________________________________________ 108
Ph.D. thesis by Jacob Bruun
Influent NO3-N and DO concentrations were high and constant within the duration of the tracer
experiments with average concentrations of 12.2 ± 0.6 mg NO3-N L-1 and 10.4 ± 0.6 mg DO L-1,
corresponding to high and low flow loading rates of 82.7 and 22.3 g h-1 NO3-N as well as 72.1 and
17.2 g h-1 DO . Effluent NO3-N and DO concentrations were slightly lower during low flow and
generally decreased along the direction of the flow (Fig. 7). The differences in effluent NO3-N
concentrations was reflected in the N removal efficiencies with 57, 51 and 45% for high and 65, 59
and 67% for low in the H, Vup and Vdown flow respectively. In reactive substrates N removal via
denitrification is considered the major NO3-N removal mechanism (Greenan et al., 2006, Gibert et
al., 2008). An alternative mechanism for NO3-N removal in highly carbon rich environments is
dissimilative nitrate to ammonium (DNRA), resulting in an accumulation of ammonium (NH4)
(Tiedje et al., 1988). As effluent NH4-N concentrations above 0.3 mg were not observed we
assumed negligible NO3 reduction via DNRA. Thus, denitrification was considered the major N
removal mechanism, which is supported by a laboratory experiment with the similar filter
composition (Bruun et al., 2015a). Flow normalized NO3-N removal rates were 66.4, 64.5 and 50.6
g N m-3 m-3 at high and 82.7, 73.2 and 85.0 g N m-3 m-3 at low flow rates for the H, Vup and Vdown
CWs, respectively (Fig. 8).
Influent pH ranged from 6.4-6.9 and increased along the flow direction of the CWs to 6.7-7.7 (Fig.
7). The pH in the filter matrixes were thus within the optimal range (pH 7-8) for denitrification
(Knowles, 1982). At low flow rate the mean influent water temperature were 7.6 ˚C and did not
vary among SSF-CWs (p = 0.85), whereas the outlet temperature were slightly lower (6.8 ˚C),
again with no difference among SSF-CWs (p = 0.78). At high flow the tracer experiments were
conducted individually with one SSF-CW at a time, thus this resulted in an inlet water temperature
ranging from 4.3 in Vdown to 8.0 in H (Fig. 7). At high flow rate, the outlet water temperatures were
~1.1 ˚C higher than the influent water temperature in the H and Vup, whereas no change in water
temperature between the in- and outlet was observed in the Vdown. Considering the effect of
temperature on biochemical reaction rates, the lower NO3-N reduction rate observes in the Vdown at
high flow rates, was most likely due to the significant lower temperature, as compared to the tow
other SSF-CWs at high flow.
The similar temperatures at low flow allow a direct comparison among hydraulic designs at this
flow rate, whereas the NO3-N removal rates at high are not directly comparable due to the variable
temperatures among the different hydraulic designs.
[insert Fig. 8]
_______________________________________________________________________________________
_______________________________________________________________________________________ 109
Ph.D. thesis by Jacob Bruun
3.6 Implications of solute transport behavior on nitrate reduction
Denitrifying organisms are dependent on the supply of substrate (NO3) (Knowles, 1982). The NO3
removal rate in woodchip media have been shown to be dependent on the hydraulic (and N)
loading rate (Bruun et al., 2015a). In the Vup, demonstrating the more pronounced non-equilibrium
transport, the faster convective transport of a fraction of the applied solutes indicate less time for
NO3-N transformation within the mobile domain. Although, higher reduction rates may prevail in
the immobile domain, the Vup design achieved overall markedly smaller N-removal rates. The
larger immobile domain in the Vup design may explain the higher CH4 production observed (Bruun
et al., 2015b).
The highest N removal rates and removal efficiencies were observed in the Vdown design. In the
Vdown the effluent mass recovery of ≤ 50% of the tracer was achieved later in terms of V/V0 than in
the two other hydraulic designs, demonstrating a longer solute residence time of the initial tracer
mass (≤ 50% ). Furthermore, in comparison with the horizontal flow the Vdown achieved higher
V/V0 at M/M0 ≥ 75% additionally suggesting a more pronounced diffusion into the immobile
domain.
In terms of explaining the NO3 removal rate, the λ parameter was inadequate. In contrast the
quantitative estimates of the mass recovery (25 and 50% M/M0) demonstrated a clear tendency
indicating a direct correlation between V/V0 at 25 and 50% mass recovery and the N removal rate
at both flow rates (when excluding the Vdown, at high flow rate) (Fig. 8). Thus as the solute residence
time increases due to solute retardation, the N removal rate increases. This tendency was, however
only significant for M/M0 = 25% (p = 0.02) (p = 0.06, for M/M0 = 50%).
In contrast to the results presented in this study, Hoffmann and Kjaergaard (2015) reporting the
highest N removal efficiency in the horizontal hydraulic design in the years 2013 and 2014. We
note, that the solute transport behaviour reported in this study, may only apply to the conditions
(i.e. flow rates and temperatures) under which the experiments were conducted. As these
conditions (i.e. flow rates) only account for a minor (~11%) of the annual flow rates observed, and
are relatively high as compared to the median flow rate (0.34 L s-1), they did not illustrate the full
conditions under which the SSF-CWs operated in 2013 and 2014. Nonetheless, the conditions
applied in this study, still represent conditions considered critical to denitrification (i.e. high HLR
and low temperatures), and further illustrate the potential of the woodchips-based SSF-CW to
remove NO3 under these conditions.
_______________________________________________________________________________________
_______________________________________________________________________________________ 110
Ph.D. thesis by Jacob Bruun
Conclusions
Non-equilibrium solute transport with diffusive exchange of solute between mobile and immobile
domains was observed in all SSF-CWs, but with marked variations in solute transport behavior
among hydraulic designs. The tracer mass recovery reflected the more pronounced non-
equilibrium transport in the vertical upwards SSF-CW, and indicated a markedly reduced residence
time for NO3-N, which was demonstrated by the lower N removal rates and removal efficiencies
observed for the vertical upwards flow SSF-CE. The highest N removal rate was found in the
vertical downwards flow SSF-CW, which was attributed to the longer solute residence time,
indicated by the tracer mass recovery. The BTC tailing indicated that the solute residence time was
affected by diffusive exchange, and this was further supported by the observed intra-granular
tracer diffusion in the woodchips. The faster convective solute transport at high flow implied less
time for biochemical processes in the mobile domain, which was additionally reflected by the lower
N removal rates at high flow.
The results have demonstrated the marked influence on hydraulic design on the solute transport
behavior and suggested the resulting impacts on N removal efficiencies. While tracer mass
recoveries was able to explain the observed N removal rates, the generally used hydraulic efficiency
parameter (λ), was inadequate to explain the solute transport behavior and resulting N removal.
Acknowledgements
This research project was funded by the Danish Strategic Research Council, grant no. 09-067280
(Supreme Tech, www.supreme-tech.dk). We would like to thank Frede Lundgaard Madsen for
setting aside the area for the pilot SSF-CWs.
References:
Bruun J., Hoffmann, C.C, Kjaergaard, C., 2015a. Nitrogen removal in permeable woodchips filters
affected by hydraulic loading rate and woodchips ratio. Manuscript submitted to Environmental
Quality.
Bruun J., Hoffmann C.C., Kjaergaard C., 2015b. Convective transport of dissolved gases
determines the fate of the greenhouse gases produced in reactive drainage filters. Manuscript
submitted to Ecological Engineering
Cameron, S.G, Schipper, L.A., 2010. Nitrate removal and hydraulic performance of organic carbon
for use in denitrification beds. Ecol. Eng. 36: 1588–1595.
Cameron, S.G, Schipper, L.A., 2011. Evaluation of passive solar heating and alternative flow
regimes on nitrate removal in denitrification beds. Ecol. Eng. 37, 1195-1204.
_______________________________________________________________________________________
_______________________________________________________________________________________ 111
Ph.D. thesis by Jacob Bruun
Cameron, S.G., Schipper, L.A., 2012. Hydraulic properties, hydraulic efficiency and nitrate
removal of organic carbon media for use in denitrification beds. Ecol. Eng. 41, 1–7.
Canga, E., Kjaergaard, C., Iversen, B. V., Heckrath, G. J., 2015. Agricultural drainage filters. I. Filter
hydro-physical properties and tracer transport. J. Environ Quality. (Submitted)
Carpenter, S. R., Caraco, N. F., Correll, D. L., Howarth, R. W., Sharpley, A. N., Smith, V. H., 1998.
Non point pollution of surface waters with phosphorus and nitrogen. Ecological Applications, 8(3),
559-568.
Dinners, D.L., Karlen, D.L., Jaynes, D.B., Kaspar, T.C., Hatfield, J.L., Colvin, T.S., Cambardella,
C.A., 2002. Nitrogen management strategies to reduce nitrate leaching in tile-drained Midwestern
soils. Agron. J., 94, 153-171.
Fausey, N.R., Brown, L.C., Belcher, H.W., Kanwar, R.S., 1995. Drainage and water quality in great
lakes and cornbelt states. J. Irrig. Drain. Eng., 121, 283-288.
García, J., Chiva, J., Aguirre, P., Álvarez, E., Sierra, J.P., Mujeriego, R., 2004. Hydraulic behaviour
of horizontal subsurface flow constructed wetlands with different aspect ratio and granular
medium size. Ecol. Eng. 23, 177–187. doi:10.1016/j.ecoleng.2004.09.002
Gibert, O., Pomierny, S., Rowe, I., Kalin, R.M., 2008. Selection of organic substrates as potential
reactive materials for use in a denitrification permeable reactive barrier (PRB). Bioresour. Technol.
99, 7587–7596.
Greenan, C.M., Moorman, T.B., Kaspar, T.C., Parkin, T.B., Jaynes, D.B., 2006. Comparing carbon
substrates for denitrification of subsurface drainage water. J. Environ. Qual. 35, 824–829.
Herbert, R.B., 2011. Implications of non-equilibrium transport in heterogeneous reactive barrier
systems: evidence from laboratory denitrification experiments. J. Contam. Hydrol. 123, 30–39.
Hoffmann, C.C., Kjaergaard, C., 2015. Testing of horizontal and vertical subsurface flow wetlands
with mixed matrices of woodchips and mussel shells for removal of nutrients in agricultural
drainage water. In preparation.
ISWPC, 2003. Proceedings of the 12th International Symposium on Wood and Pulping Chemistry :
June 9-12, 2003, Madison, Wisconsin, USA.
Knowles, R., 1982. Denitrification. Microbiol. Rewiews 46, 43–70.
_______________________________________________________________________________________
_______________________________________________________________________________________ 112
Ph.D. thesis by Jacob Bruun
Kronvang, B., Behrendt, H., Andersen, H.E., Arheimer, B., Barr, A., Borgvang, S. A., Bouraoui, F.,
Granlund, K., Grizzetti, B., Groenendijk, P., Schwaiger, E., Hejzlar, J., Hoffmann, L., Johnsson, H.,
Panagopoulos, Y., Lo Porto, A., Reisser, H., Schoumans, O., Anthony, S., Silgram, M., Venohr, M.,
Larsen, S.E., 2009. Ensemble modelling of nutrient loads and nutrient load partitioning in 17
European catchments. J. Environ. Monit. 11, 572–583.
Masbough, A., Frankowski, K., Hall, K.J., Duff, S.J., 2005. The effectiveness of constructed wetland
for treatment of woodwaste leachate. Ecol. Eng. 25(5), 552-566.
Morris, J.E., 2006. Organically bound tritium in sediments from the Severn estuary. Doctoral
thesis. University of Southampton, Faculty of Engineering Science and Mathematics, School of
Ocean and Earth Science. UK. 235 pp.
Persson, J., Somes, N., Wong, T., 1999. Hydraulics efficiency of constructed wetlands and ponds.
Water Sci. Technol. doi:10.1016/S0273-1223(99)00448-5
Porter, L.K., Kemper, W.D., Jackson, R.D., & Stewart, B.A., 1960. Chloride diffusion in soils as
influenced by moisture content. Soil Science Society of America Journal, 24(6), 460-463.
R Core Team, 2013. R: A language and environment for statistical computing. R. Foundation for
Statistical Computing, Vienna, Austria. ISBN 3-900051-07-0, URL. http://www.R-project.org/.
Rao, P.S.C, Rolston, D.E., Jessup, R.E., Davidson, J.M., 1980.Solute transport in aggregated porous
media: Theoretical and experimental evaluation. Soil Sci. Soc. Am. Journal 44, 1139–1146.
Robertson, W.D., 2010. Nitrate removal rates in woodchip media of varying age. Ecol. Eng. 36,
1581–1587.
Robertson, W.D., Yeung, N., Van Driel, P.W., Lombardo, P.S., 2005. High-permeability layers for
remediation of ground water; go wide, not deep. Ground Water 43, 574–581.
Schipper, L.A., Robertson, W.D., Gold, A.J., Jaynes, D.B., Cameron, S.C., 2010. Denitrifying
bioreactors - An approach for reducing nitrate loads to receiving waters. Ecol. Eng. 36, 1532–1543.
Suliman, F. F. H. K., French, H. K., Haugen, L. E., & Søvik, A. K. (2006). Change in flow and
transport patterns in horizontal subsurface flow constructed wetlands as a result of biological
growth. Ecological Engineering, 27(2), 124-133.
Tiedje, J.M., Sexstone, a J., Myrold, D.D., Robinson, J.A., 1982. Denitrification: ecological niches,
competition and survival. Antonie Van Leeuwenhoek 48, 569–83.
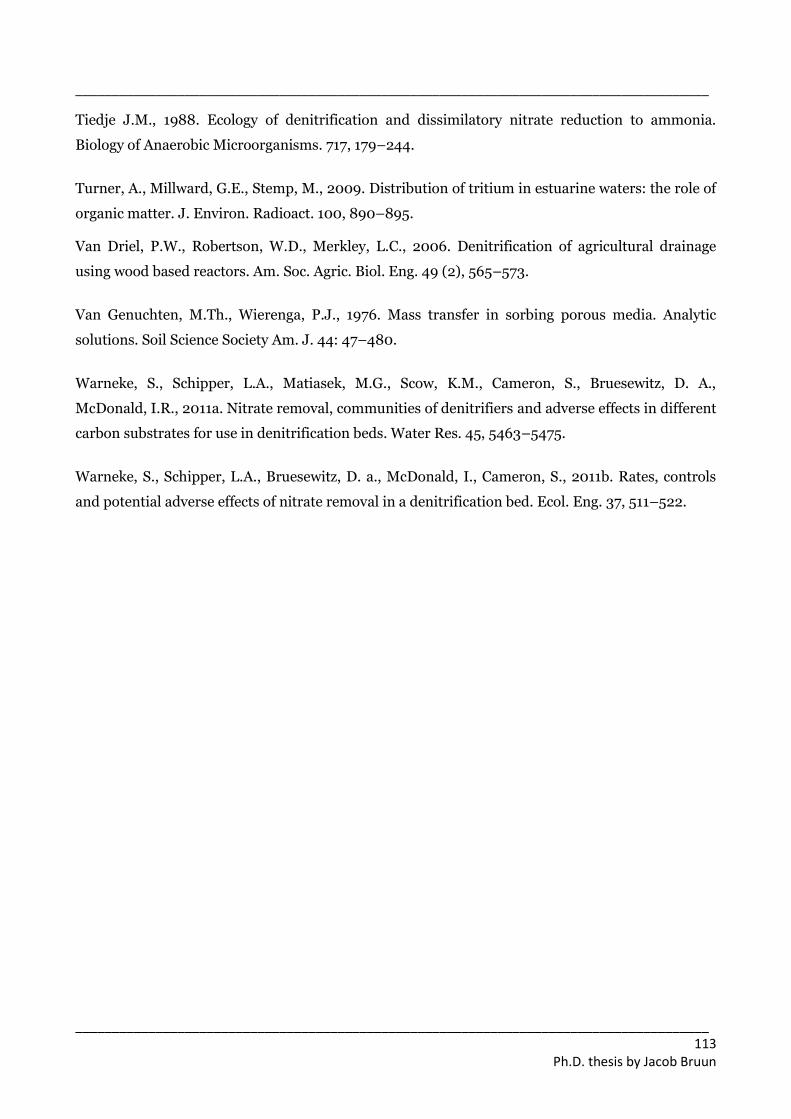
_______________________________________________________________________________________
_______________________________________________________________________________________ 113
Ph.D. thesis by Jacob Bruun
Tiedje J.M., 1988. Ecology of denitrification and dissimilatory nitrate reduction to ammonia.
Biology of Anaerobic Microorganisms. 717, 179–244.
Turner, A., Millward, G.E., Stemp, M., 2009. Distribution of tritium in estuarine waters: the role of
organic matter. J. Environ. Radioact. 100, 890–895.
Van Driel, P.W., Robertson, W.D., Merkley, L.C., 2006. Denitrification of agricultural drainage
using wood based reactors. Am. Soc. Agric. Biol. Eng. 49 (2), 565–573.
Van Genuchten, M.Th., Wierenga, P.J., 1976. Mass transfer in sorbing porous media. Analytic
solutions. Soil Science Society Am. J. 44: 47–480.
Warneke, S., Schipper, L.A., Matiasek, M.G., Scow, K.M., Cameron, S., Bruesewitz, D. A.,
McDonald, I.R., 2011a. Nitrate removal, communities of denitrifiers and adverse effects in different
carbon substrates for use in denitrification beds. Water Res. 45, 5463–5475.
Warneke, S., Schipper, L.A., Bruesewitz, D. a., McDonald, I., Cameron, S., 2011b. Rates, controls
and potential adverse effects of nitrate removal in a denitrification bed. Ecol. Eng. 37, 511–522.

_______________________________________________________________________________________
_______________________________________________________________________________________ 114
Ph.D. thesis by Jacob Bruun
Figures
Figure 1. Principal sketch of subsurface flow constructed wetlands (SSF-CWs) with horizontal flow
(1), vertical upwards flow (2) and vertical downwards flow (3). SSF-CW components include inlet
wells, perforated distributions pipes, coarse granular distribution/collection layer,
woodchips:seashell filter matrix, outlet well with electromagnetic flow-meter and outlet well with
effluent sampling and aeration of the effluent water.
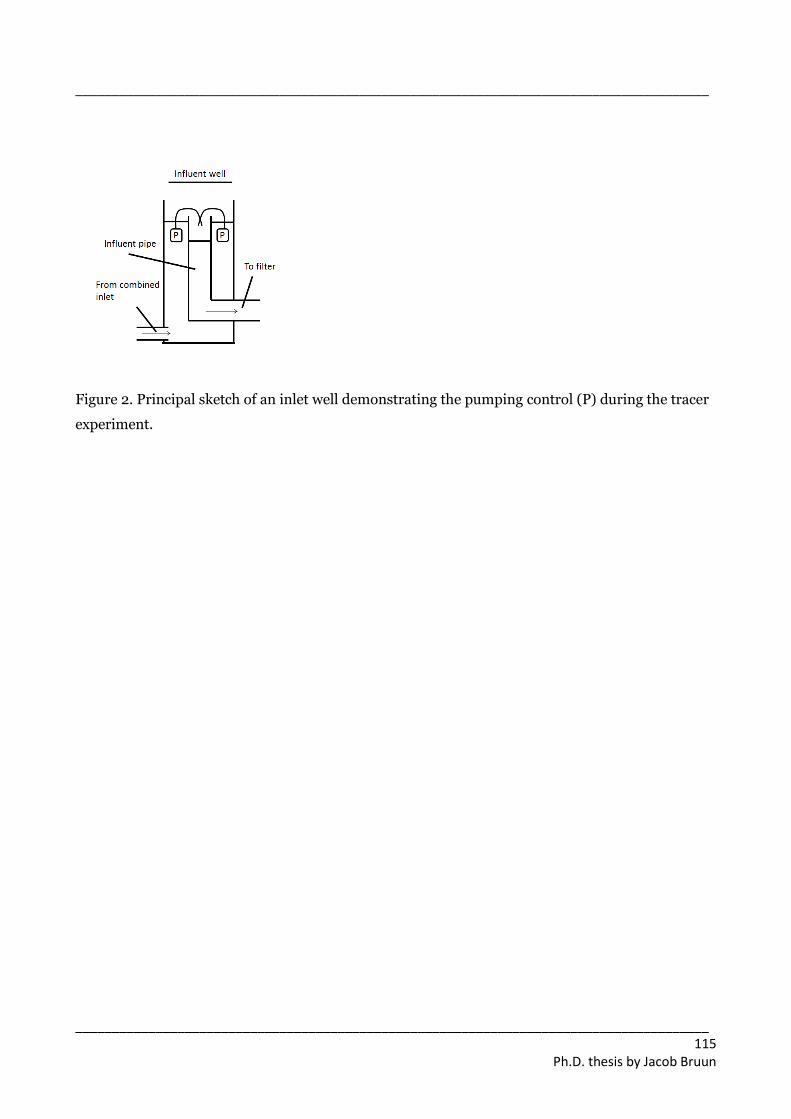
_______________________________________________________________________________________
_______________________________________________________________________________________ 115
Ph.D. thesis by Jacob Bruun
Figure 2. Principal sketch of an inlet well demonstrating the pumping control (P) during the tracer
experiment.
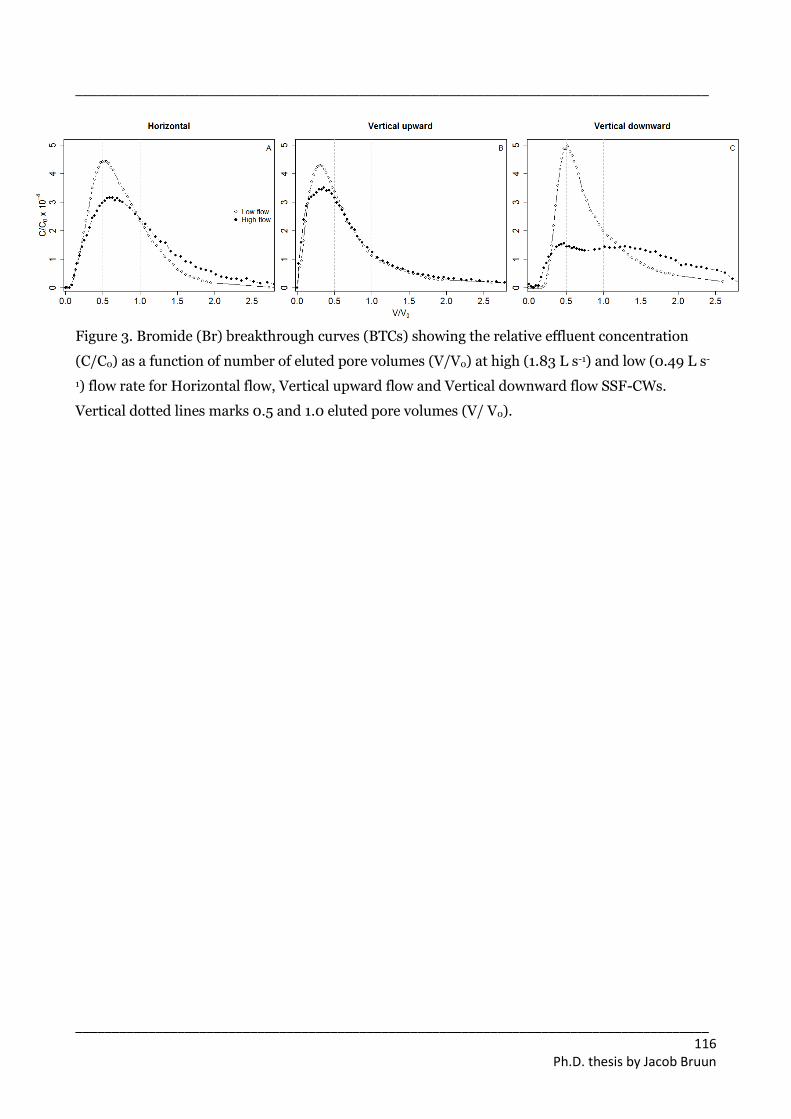
_______________________________________________________________________________________
_______________________________________________________________________________________ 116
Ph.D. thesis by Jacob Bruun
Figure 3. Bromide (Br) breakthrough curves (BTCs) showing the relative effluent concentration
(C/C0) as a function of number of eluted pore volumes (V/V0) at high (1.83 L s-1) and low (0.49 L s-
1) flow rate for Horizontal flow, Vertical upward flow and Vertical downward flow SSF-CWs.
Vertical dotted lines marks 0.5 and 1.0 eluted pore volumes (V/ V0).

_______________________________________________________________________________________
_______________________________________________________________________________________ 117
Ph.D. thesis by Jacob Bruun
Figure 4. Bromide (Br) breakthrough curves (BTCs) showing the relative concentration (C/C0) as a
function of number of eluted pore volumes (V/V0) from the horizontal design based on piezometer
measurements along the direction of the flow at the distance of 2.5, 5 and 7.5 m from the inlet at
high (1.83 L s-1) and low (0.49 L s-1) flow rate. Vertical dotted lines mark 0.5 and 1.0 eluted pore
volumes (V/ V0).

_______________________________________________________________________________________
_______________________________________________________________________________________ 118
Ph.D. thesis by Jacob Bruun
Figure 5. Bromide (Br) breakthrough curves (BTCs) showing the relative concentration (C/C0) as a
function of number of eluted pore volumes (V/V0) from the vertical upward SSF-CW based on
piezometer measurements along the direction of the flow at a distance of 0.25, 0.50 and 0.75 m
from the inlet at high (1.83 L s-1) and low (0.49 L s-1) flow rate. Vertical dotted lines mark 0.5 and
1.0 eluted pore volumes (V/ V0).
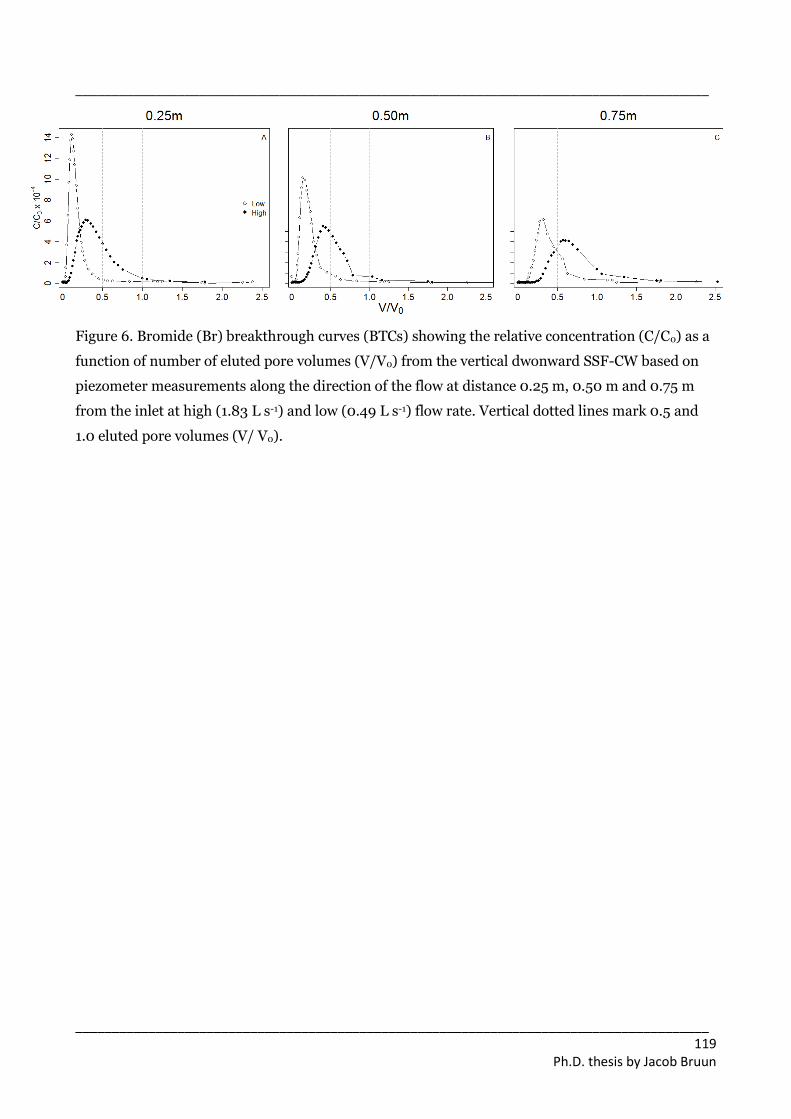
_______________________________________________________________________________________
_______________________________________________________________________________________ 119
Ph.D. thesis by Jacob Bruun
Figure 6. Bromide (Br) breakthrough curves (BTCs) showing the relative concentration (C/C0) as a
function of number of eluted pore volumes (V/V0) from the vertical dwonward SSF-CW based on
piezometer measurements along the direction of the flow at distance 0.25 m, 0.50 m and 0.75 m
from the inlet at high (1.83 L s-1) and low (0.49 L s-1) flow rate. Vertical dotted lines mark 0.5 and
1.0 eluted pore volumes (V/ V0).

_______________________________________________________________________________________
_______________________________________________________________________________________ 120
Ph.D. thesis by Jacob Bruun
Figure 7. Water chemistry parameters, including average dissolved oxygen (DO) and NO3-N
concentrations, inlet temperature, and pH from the three filters at high (1.83 L s-1) and low (0.49 L
s-1) flow rate.
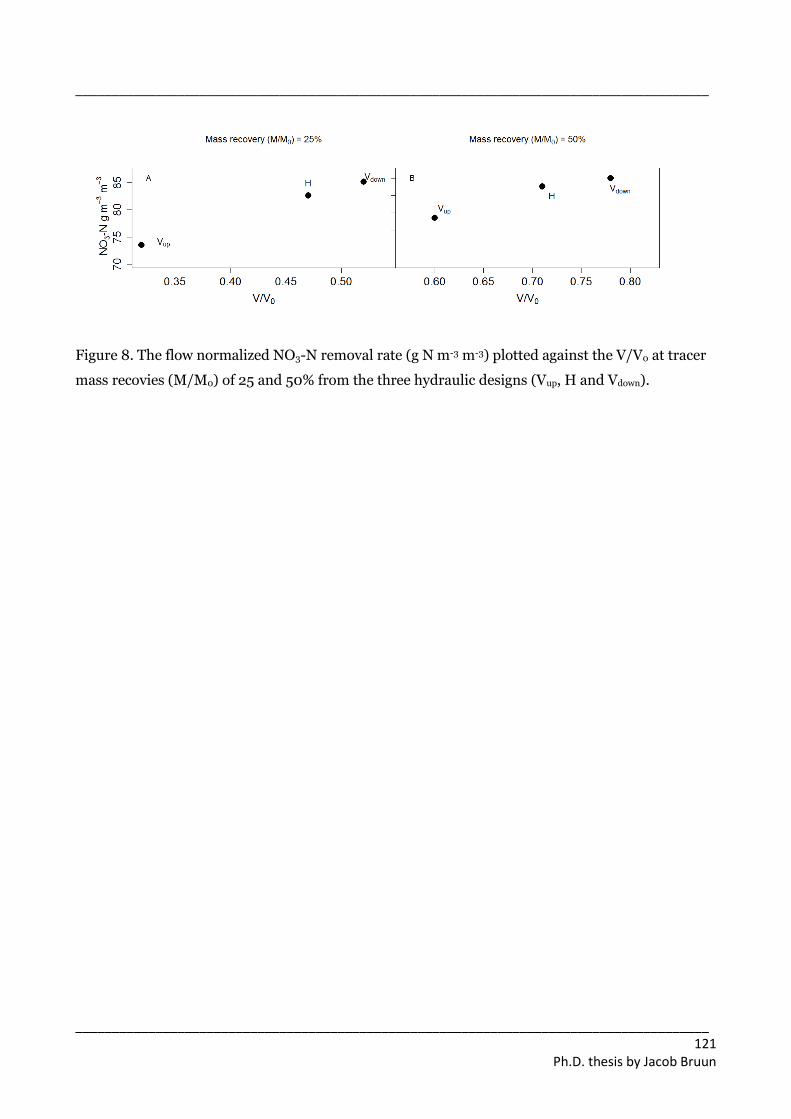
_______________________________________________________________________________________
_______________________________________________________________________________________ 121
Ph.D. thesis by Jacob Bruun
Figure 8. The flow normalized NO3-N removal rate (g N m-3 m-3) plotted against the V/V0 at tracer
mass recovies (M/M0) of 25 and 50% from the three hydraulic designs (Vup, H and Vdown).

_______________________________________________________________________________________
_______________________________________________________________________________________ 122
Ph.D. thesis by Jacob Bruun
Table 1. The physical characteristics of the SSF-CW matrix including to bulk density (ρb), median
grain-size (D50), macro (θ≥30) and total porosity (θtot), the total volume (Vtot) of the matrix and the
distribution layers and the resulting water-filled pore space (V0).
Filter matrix Coarse seashell layer Pore volume Aspect
ratio
Volume (m3) tota (m3 m-3) Volume (m3) tot (m3 m-3) V0 (m3 m-3) m m-1
H 76 0.79 5.0 0.71 64 1
Vup 81 0.79 0.20 0.71 64 0.1
Vdown 81 0.79 0.10 0.71 64 0.1
a Obtained from Bruun et al., 2015
b Negative values indicate water on the filter matrix surface.
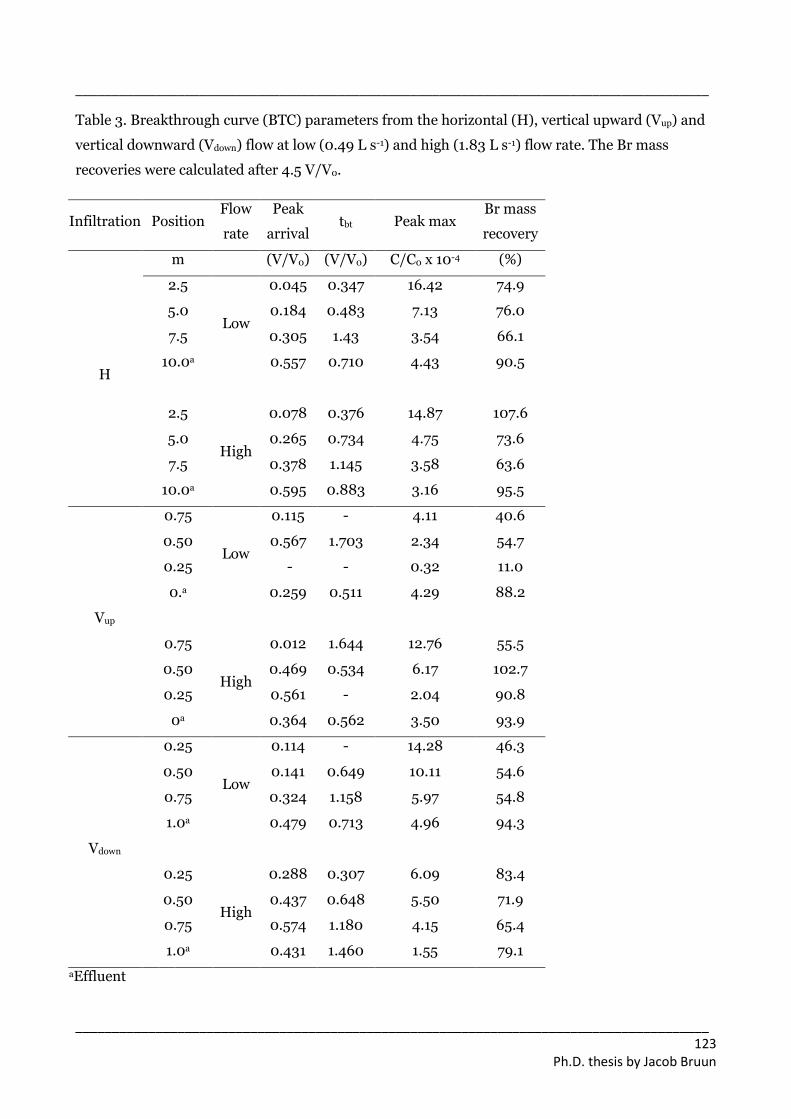
_______________________________________________________________________________________
_______________________________________________________________________________________ 123
Ph.D. thesis by Jacob Bruun
Table 3. Breakthrough curve (BTC) parameters from the horizontal (H), vertical upward (Vup) and
vertical downward (Vdown) flow at low (0.49 L s-1) and high (1.83 L s-1) flow rate. The Br mass
recoveries were calculated after 4.5 V/V0.
Infiltration
Position Flow
rate
Peak
arrival tbt Peak max
Br mass
recovery
H
m (V/V0) (V/V0) C/C0 x 10-4 (%)
2.5
Low
0.045 0.347 16.42 74.9
5.0 0.184 0.483 7.13 76.0
7.5 0.305 1.43 3.54 66.1
10.0a 0.557 0.710 4.43 90.5
2.5
High
0.078 0.376 14.87 107.6
5.0 0.265 0.734 4.75 73.6
7.5 0.378 1.145 3.58 63.6
10.0a 0.595 0.883 3.16 95.5
Vup
0.75
Low
0.115 - 4.11 40.6
0.50 0.567 1.703 2.34 54.7
0.25 - - 0.32 11.0
0.a 0.259 0.511 4.29 88.2
0.75
High
0.012 1.644 12.76 55.5
0.50 0.469 0.534 6.17 102.7
0.25 0.561 - 2.04 90.8
0a 0.364 0.562 3.50 93.9
Vdown
0.25
Low
0.114 - 14.28 46.3
0.50 0.141 0.649 10.11 54.6
0.75 0.324 1.158 5.97 54.8
1.0a 0.479 0.713 4.96 94.3
0.25
High
0.288 0.307 6.09 83.4
0.50 0.437 0.648 5.50 71.9
0.75 0.574 1.180 4.15 65.4
1.0a 0.431 1.460 1.55 79.1
aEffluent
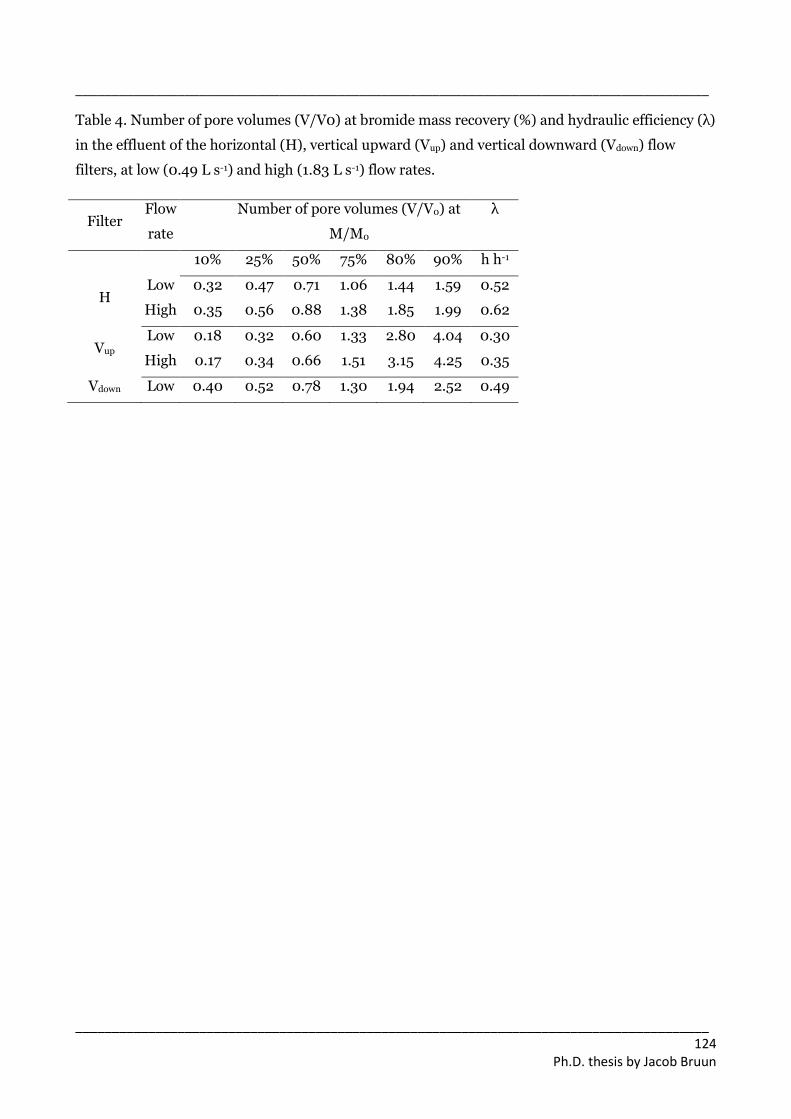
_______________________________________________________________________________________
_______________________________________________________________________________________ 124
Ph.D. thesis by Jacob Bruun
Table 4. Number of pore volumes (V/V0) at bromide mass recovery (%) and hydraulic efficiency (λ)
in the effluent of the horizontal (H), vertical upward (Vup) and vertical downward (Vdown) flow
filters, at low (0.49 L s-1) and high (1.83 L s-1) flow rates.
Filter Flow
rate
Number of pore volumes (V/V0) at
M/M0
λ
10% 25% 50% 75% 80% 90% h h-1
H Low 0.32 0.47 0.71 1.06 1.44 1.59 0.52
High 0.35 0.56 0.88 1.38 1.85 1.99 0.62
Vup Low 0.18 0.32 0.60 1.33 2.80 4.04 0.30
High 0.17 0.34 0.66 1.51 3.15 4.25 0.35
Vdown Low 0.40 0.52 0.78 1.30 1.94 2.52 0.49