Denham Springs New DSF Homes Housing Study March 2011 vs March 2012

8/3/2019 Denham Springs South Point Subdivision 2011 Comprehensive Housing Report
http://slidepdf.com/reader/full/denham-springs-south-point-subdivision-2011-comprehensive-housing-report 1/21
01/16/2012Clarus MarketMetrics®
Information not guaranteed. © 2012 - 2013 Terradatum and its suppliers and licensors (www.terradatum.com/about/licensors.td).
South Point, Denham Sprgs, Louisiana 70726
William CobbAccurate Valuations Group
Market Dynamics
Prepared For
1 of 21
8/3/2019 Denham Springs South Point Subdivision 2011 Comprehensive Housing Report
http://slidepdf.com/reader/full/denham-springs-south-point-subdivision-2011-comprehensive-housing-report 2/21
Dec-11
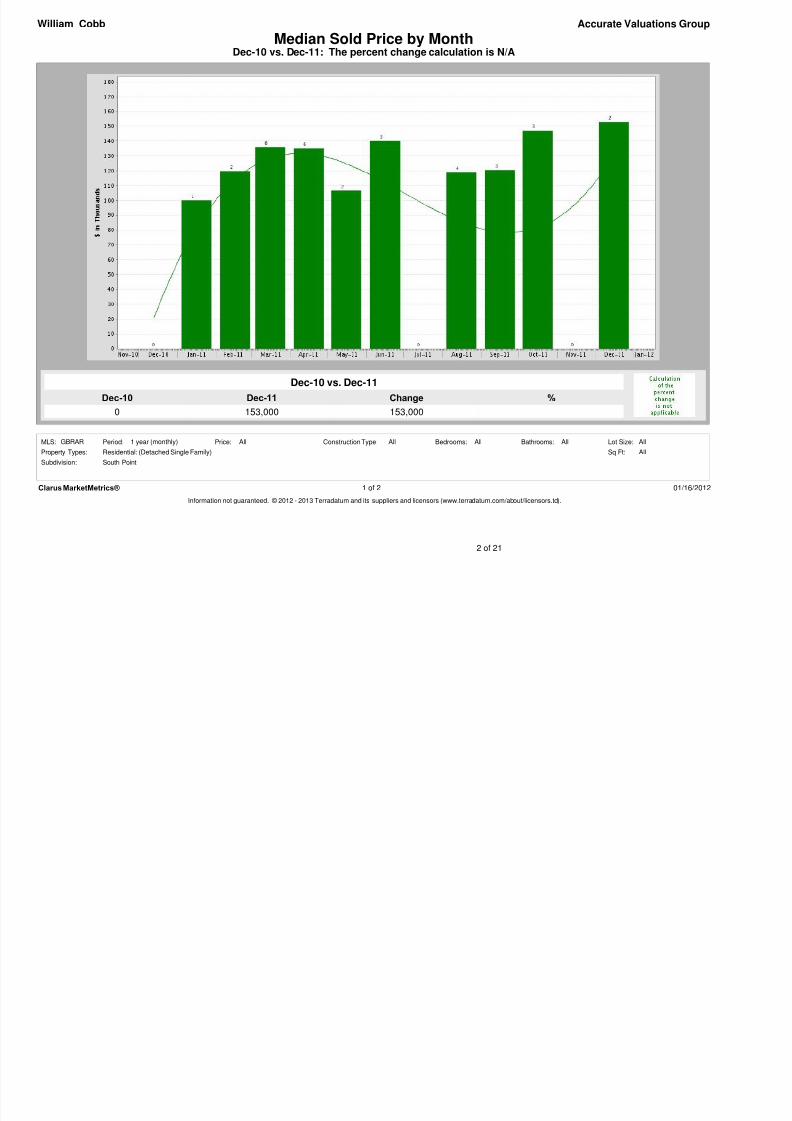
153,000
Dec-10
0
%Change
153,000
Dec-10 vs. Dec-11: The percent change calculation is N/AMedian Sold Price by Month
Accurate Valuations Group
Dec-10 vs. Dec-11
William Cobb
Clarus MarketMetrics® 1 of 2 01/16/2012
Information not guaranteed. © 2012 - 2013 Terradatum and its suppliers and licensors (www.terradatum.com/about/licensors.td).
AllBathrooms:MLS: AllAll
Sq Ft:
South Point
Residential: (Detached Single Family)
Period: All All
Property Types:
Subdivision:
All
Construction Type:Price: Lot Size:Bedrooms:1 year (monthly)GBRAR
2 of 21
8/3/2019 Denham Springs South Point Subdivision 2011 Comprehensive Housing Report
http://slidepdf.com/reader/full/denham-springs-south-point-subdivision-2011-comprehensive-housing-report 3/21
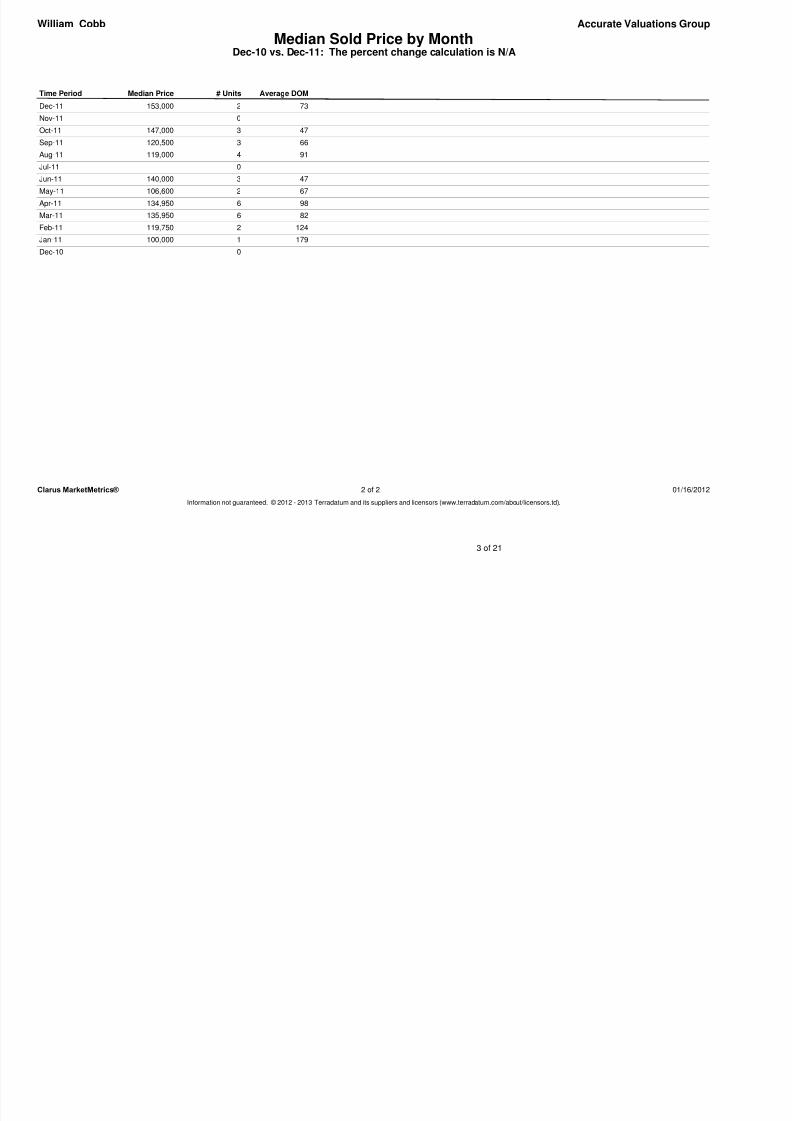
Median Sold Price by MonthDec-10 vs. Dec-11: The percent change calculation is N/A
Accurate Valuations GroupWilliam Cobb
Time Period Median Price # Units Average DOM
Dec-11 153,000 2 73
Nov-11 0
Oct-11 147,000 3 47
Sep-11 120,500 3 66
Aug-11 119,000 4 91
Jul-11 0
Jun-11 140,000 3 47
May-11 106,600 2 67Apr-11 134,950 6 98
Mar-11 135,950 6 82
Feb-11 119,750 2 124
Jan-11 100,000 1 179
Dec-10 0
Clarus MarketMetrics® 2 of 2 01/16/2012
Information not guaranteed. © 2012 - 2013 Terradatum and its suppliers and licensors (www.terradatum.com/about/licensors.td).
3 of 21
8/3/2019 Denham Springs South Point Subdivision 2011 Comprehensive Housing Report
http://slidepdf.com/reader/full/denham-springs-south-point-subdivision-2011-comprehensive-housing-report 4/21
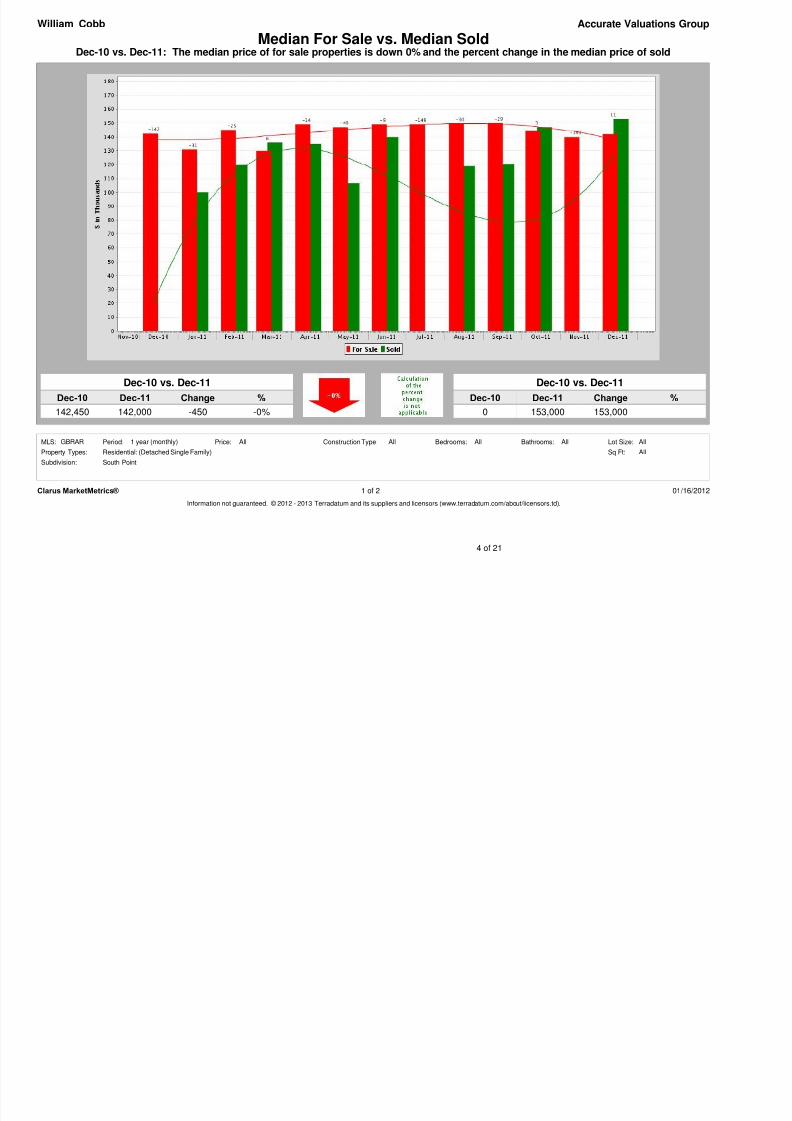
Dec-10 vs. Dec-11: The median price of for sale properties is down 0% and the percent change in the median price of sold
Accurate Valuations Group
Dec-10 vs. Dec-11
142,450 -0%
William Cobb
142,000
Dec-11
Median For Sale vs. Median Sold
ChangeDec-10 %
-450
Dec-10 Dec-11 %
0
Dec-10 vs. Dec-11
153,000
Change
153,000
Clarus MarketMetrics® 1 of 2 01/16/2012
Information not guaranteed. © 2012 - 2013 Terradatum and its suppliers and licensors (www.terradatum.com/about/licensors.td).
AllBathrooms:MLS: AllAll
Sq Ft:
South Point
Residential: (Detached Single Family)
Period: All All
Property Types:
Subdivision:
All
Construction Type:Price: Lot Size:Bedrooms:1 year (monthly)GBRAR
4 of 21
8/3/2019 Denham Springs South Point Subdivision 2011 Comprehensive Housing Report
http://slidepdf.com/reader/full/denham-springs-south-point-subdivision-2011-comprehensive-housing-report 5/21
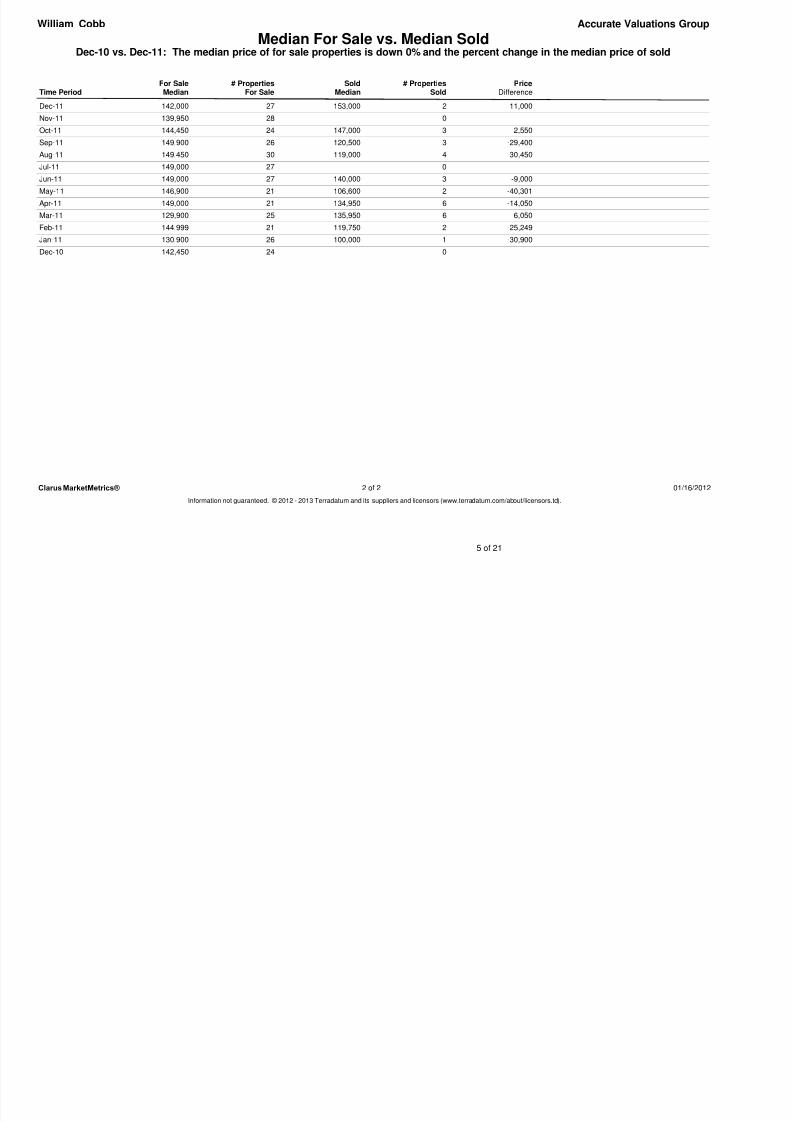
Median For Sale vs. Median SoldDec-10 vs. Dec-11: The median price of for sale properties is down 0% and the percent change in the median price of sold
Accurate Valuations GroupWilliam Cobb
Time Period For SaleMedian SoldMedianFor Sale # Properties # PropertiesSold Price
Difference
Dec-11 27 2142,000 153,000 11,000
Nov-11 28 0139,950
Oct-11 24 3144,450 147,000 2,550
Sep-11 26 3149,900 120,500 -29,400
Aug-11 30 4149,450 119,000 -30,450
Jul-11 27 0149,000
Jun-11 27 3149,000 140,000 -9,000
May-11 21 2146,900 106,600 -40,301
Apr-11 21 6149,000 134,950 -14,050
Mar-11 25 6129,900 135,950 6,050
Feb-11 21 2144,999 119,750 -25,249
Jan-11 26 1130,900 100,000 -30,900
Dec-10 24 0142,450
Clarus MarketMetrics® Information not guaranteed. © 2012 - 2013 Terradatum and its suppliers and licensors (www.terradatum.com/about/licensors.td).
2 of 2 01/16/2012
5 of 21
8/3/2019 Denham Springs South Point Subdivision 2011 Comprehensive Housing Report
http://slidepdf.com/reader/full/denham-springs-south-point-subdivision-2011-comprehensive-housing-report 6/21
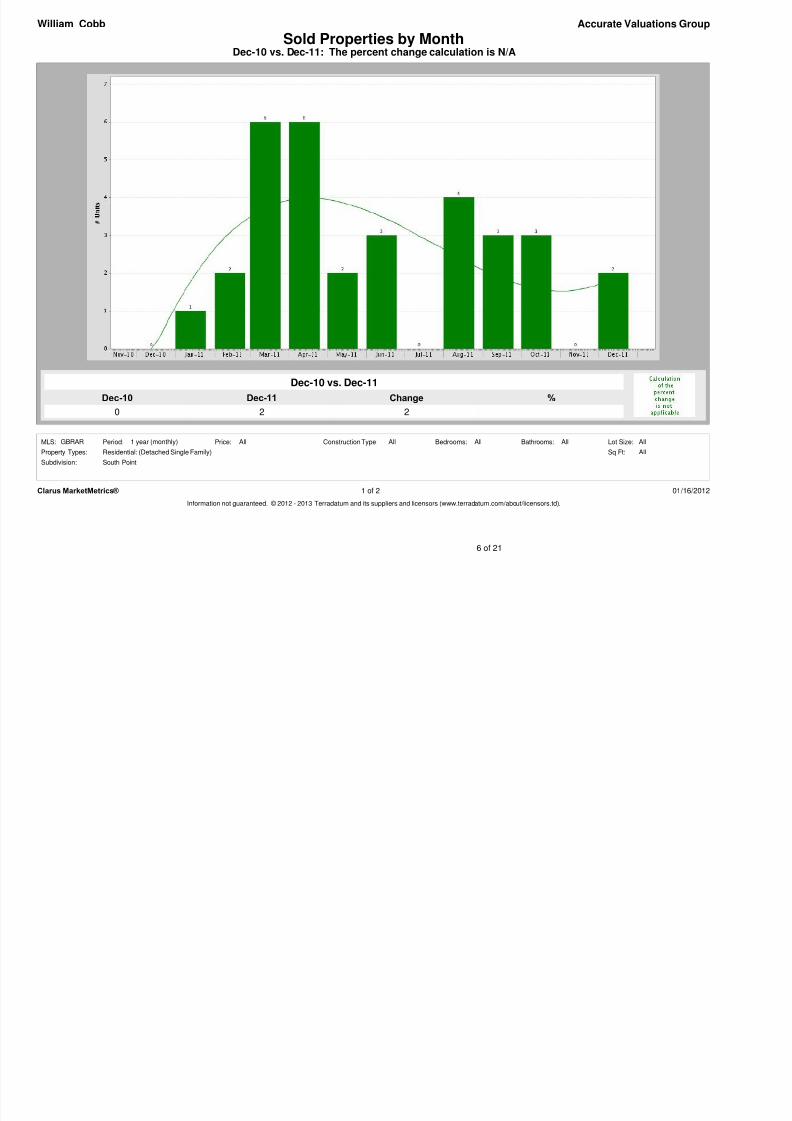
Dec-11
2
Dec-10
0
%Change
2
Dec-10 vs. Dec-11: The percent change calculation is N/ASold Properties by Month
Accurate Valuations Group
Dec-10 vs. Dec-11
William Cobb
Clarus MarketMetrics® 1 of 2 01/16/2012
Information not guaranteed. © 2012 - 2013 Terradatum and its suppliers and licensors (www.terradatum.com/about/licensors.td).
AllBathrooms:MLS: AllAll
Sq Ft:
South Point
Residential: (Detached Single Family)
Period: All All
Property Types:
Subdivision:
All
Construction Type:Price: Lot Size:Bedrooms:1 year (monthly)GBRAR
6 of 21
8/3/2019 Denham Springs South Point Subdivision 2011 Comprehensive Housing Report
http://slidepdf.com/reader/full/denham-springs-south-point-subdivision-2011-comprehensive-housing-report 7/21
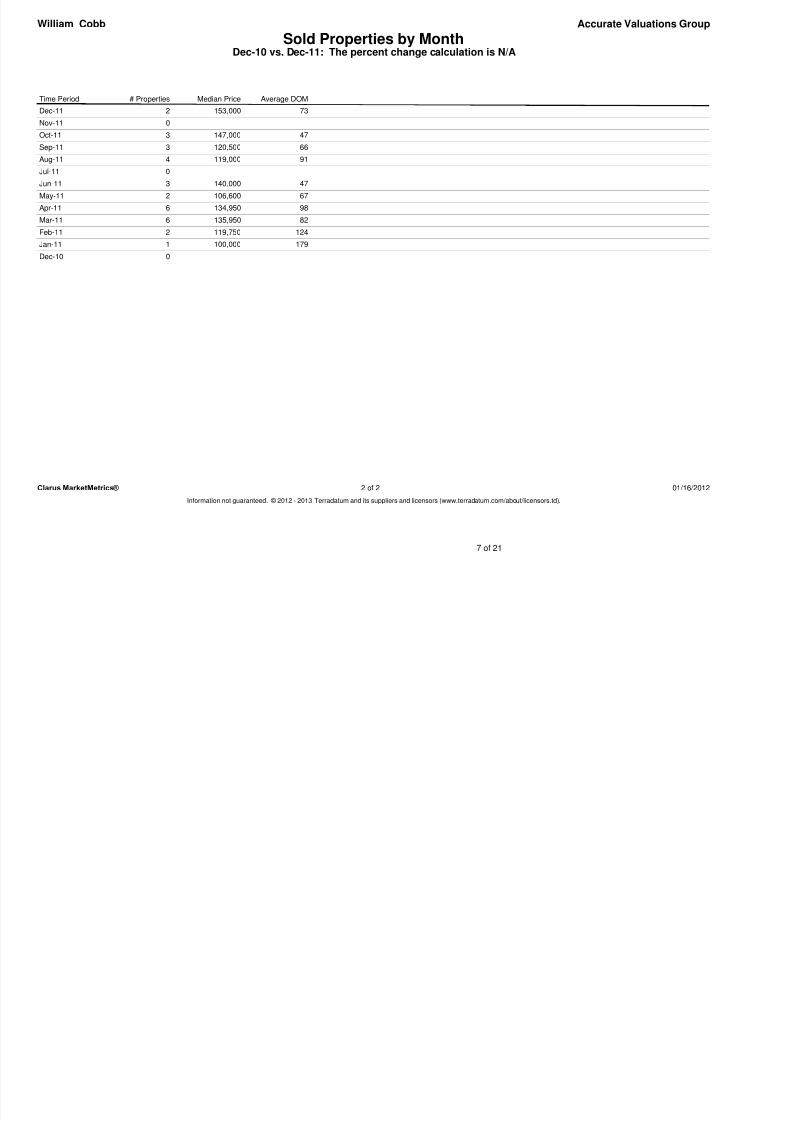
Sold Properties by MonthDec-10 vs. Dec-11: The percent change calculation is N/A
Accurate Valuations GroupWilliam Cobb
Time Period # Properties Median Price Average DOM
Dec-11 153,0002 73
Nov-11 0
Oct-11 147,0003 47
Sep-11 120,5003 66
Aug-11 119,0004 91
Jul-11 0
Jun-11 140,0003 47
May-11 106,6002 67Apr-11 134,9506 98
Mar-11 135,9506 82
Feb-11 119,7502 124
Jan-11 100,0001 179
Dec-10 0
Clarus MarketMetrics® 2 of 2 01/16/2012Information not guaranteed. © 2012 - 2013 Terradatum and its suppliers and licensors (www.terradatum.com/about/licensors.td).
7 of 21
8/3/2019 Denham Springs South Point Subdivision 2011 Comprehensive Housing Report
http://slidepdf.com/reader/full/denham-springs-south-point-subdivision-2011-comprehensive-housing-report 8/21
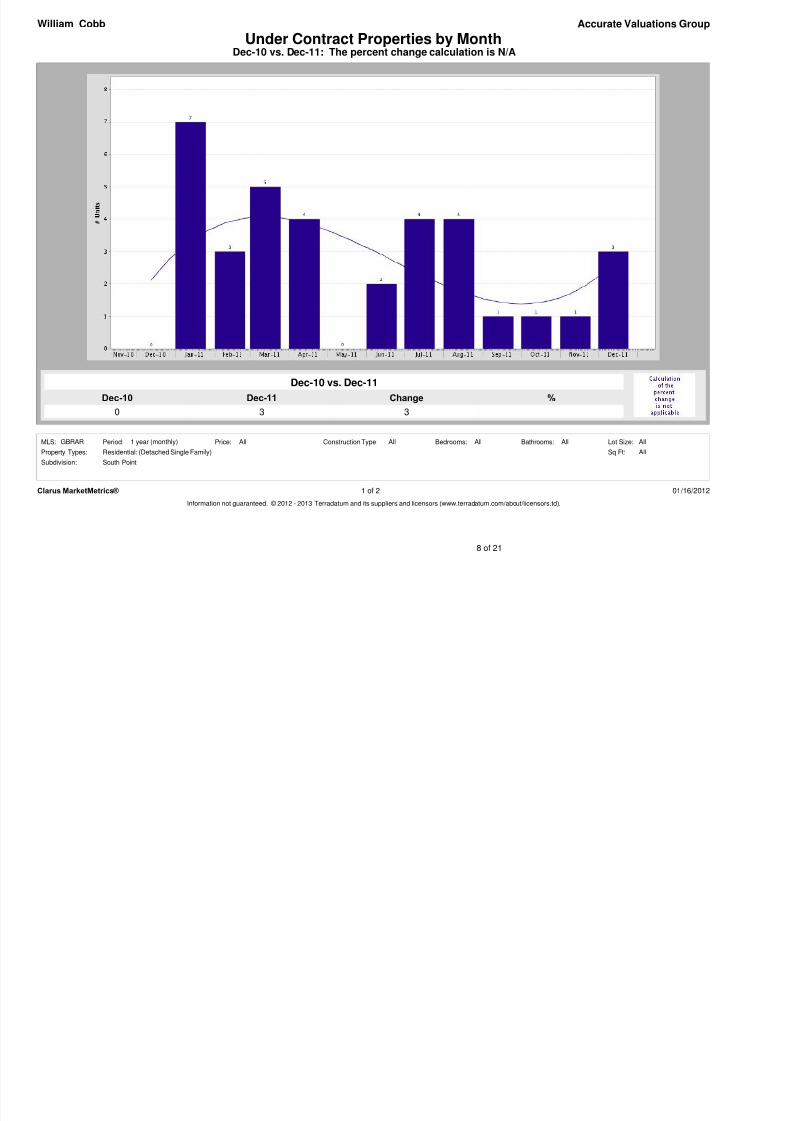
Dec-11
3
Dec-10
0
%Change
3
Dec-10 vs. Dec-11: The percent change calculation is N/AUnder Contract Properties by Month
Accurate Valuations Group
Dec-10 vs. Dec-11
William Cobb
Clarus MarketMetrics® 1 of 2 01/16/2012
Information not guaranteed. © 2012 - 2013 Terradatum and its suppliers and licensors (www.terradatum.com/about/licensors.td).
AllBathrooms:MLS: AllAll
Sq Ft:
South Point
Residential: (Detached Single Family)
Period: All All
Property Types:
Subdivision:
All
Construction Type:Price: Lot Size:Bedrooms:1 year (monthly)GBRAR
8 of 21
8/3/2019 Denham Springs South Point Subdivision 2011 Comprehensive Housing Report
http://slidepdf.com/reader/full/denham-springs-south-point-subdivision-2011-comprehensive-housing-report 9/21
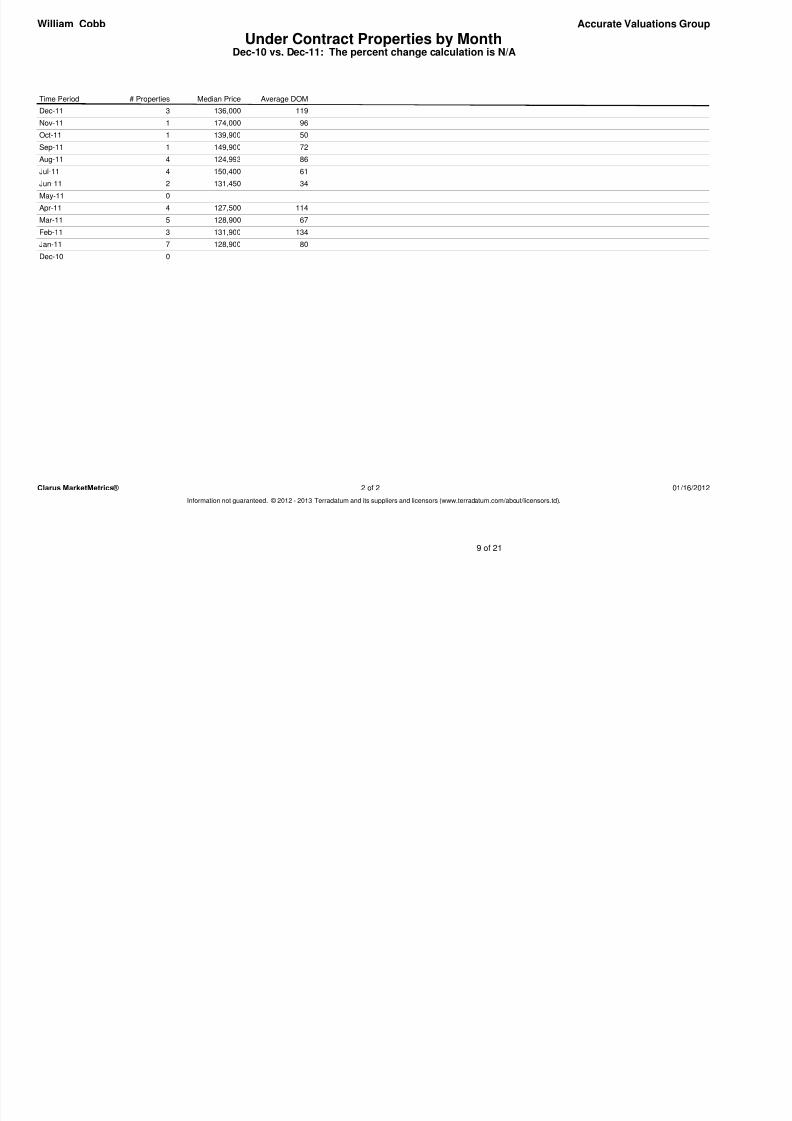
Under Contract Properties by MonthDec-10 vs. Dec-11: The percent change calculation is N/A
Accurate Valuations GroupWilliam Cobb
Time Period # Properties Median Price Average DOMDec-11 136,0003 119
Nov-11 174,0001 96
Oct-11 139,9001 50
Sep-11 149,9001 72
Aug-11 124,9934 86
Jul-11 150,4004 61
Jun-11 131,4502 34
May-11 0Apr-11 127,5004 114
Mar-11 128,9005 67
Feb-11 131,9003 134
Jan-11 128,9007 80
Dec-10 0
Clarus MarketMetrics® 2 of 2 01/16/2012Information not guaranteed. © 2012 - 2013 Terradatum and its suppliers and licensors (www.terradatum.com/about/licensors.td).
9 of 21
8/3/2019 Denham Springs South Point Subdivision 2011 Comprehensive Housing Report
http://slidepdf.com/reader/full/denham-springs-south-point-subdivision-2011-comprehensive-housing-report 10/21
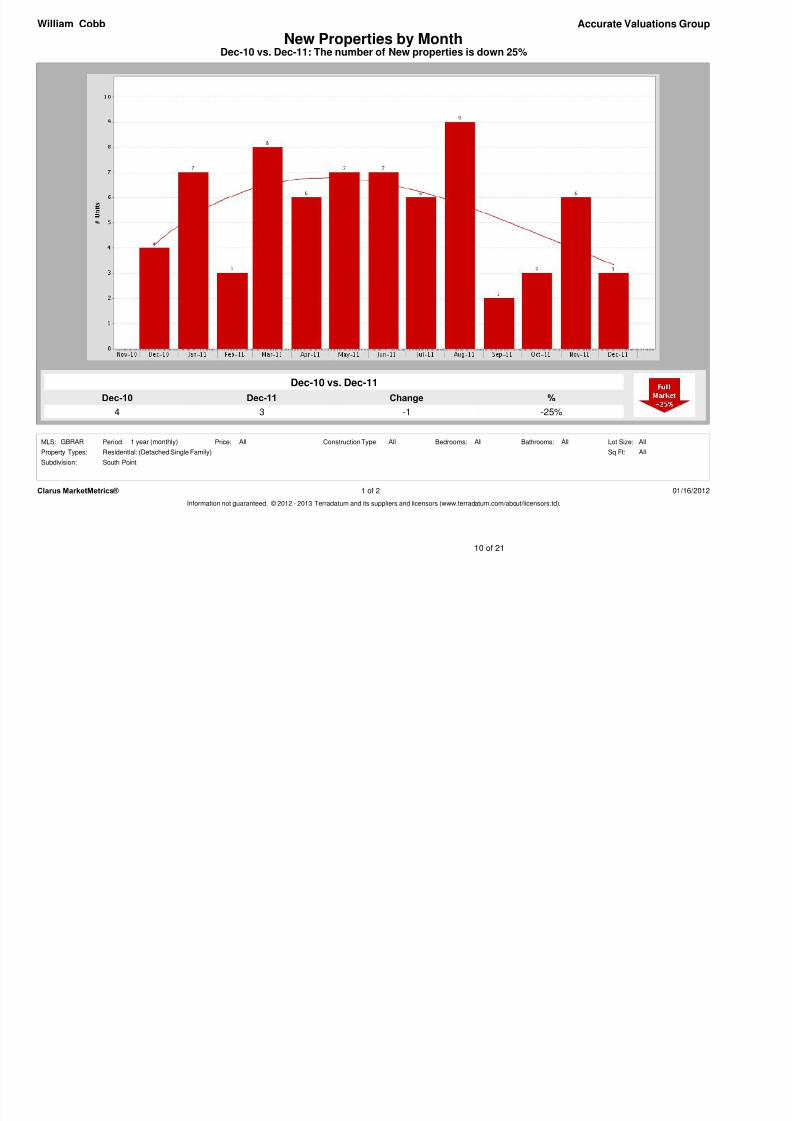
Dec-11
3
Dec-10
4
%
-25%
Change
-1
Dec-10 vs. Dec-11: The number of New properties is down 25%New Properties by Month
Accurate Valuations Group
Dec-10 vs. Dec-11
William Cobb
Clarus MarketMetrics® 1 of 2 01/16/2012
Information not guaranteed. © 2012 - 2013 Terradatum and its suppliers and licensors (www.terradatum.com/about/licensors.td).
AllBathrooms:MLS: AllAll
Sq Ft:
South Point
Residential: (Detached Single Family)
Period: All All
Property Types:
Subdivision:
All
Construction Type:Price: Lot Size:Bedrooms:1 year (monthly)GBRAR
10 of 21
8/3/2019 Denham Springs South Point Subdivision 2011 Comprehensive Housing Report
http://slidepdf.com/reader/full/denham-springs-south-point-subdivision-2011-comprehensive-housing-report 11/21
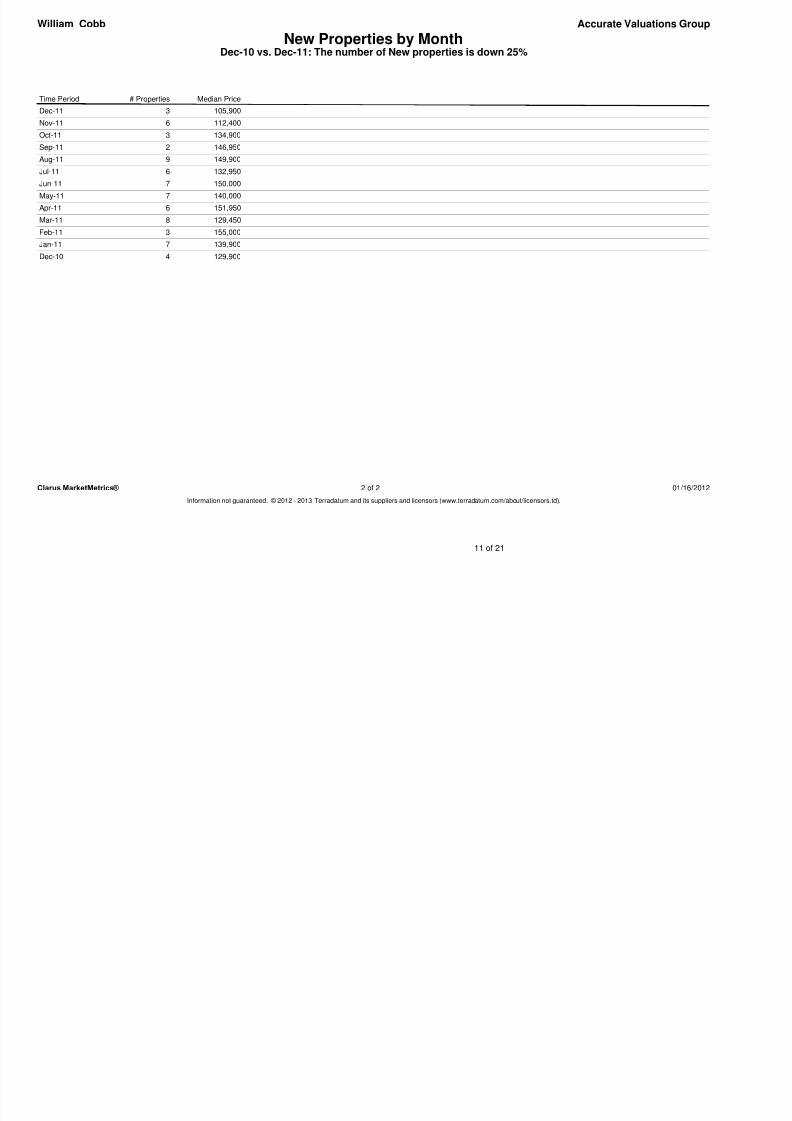
New Properties by MonthDec-10 vs. Dec-11: The number of New properties is down 25%
Accurate Valuations GroupWilliam Cobb
Time Period # Properties Median PriceDec-11 105,9003
Nov-11 112,4006
Oct-11 134,9003
Sep-11 146,9502
Aug-11 149,9009
Jul-11 132,9506
Jun-11 150,0007
May-11 140,0007Apr-11 151,9506
Mar-11 129,4508
Feb-11 155,0003
Jan-11 139,9007
Dec-10 129,9004
Clarus MarketMetrics® 2 of 2 01/16/2012Information not guaranteed. © 2012 - 2013 Terradatum and its suppliers and licensors (www.terradatum.com/about/licensors.td).
11 of 21
8/3/2019 Denham Springs South Point Subdivision 2011 Comprehensive Housing Report
http://slidepdf.com/reader/full/denham-springs-south-point-subdivision-2011-comprehensive-housing-report 12/21
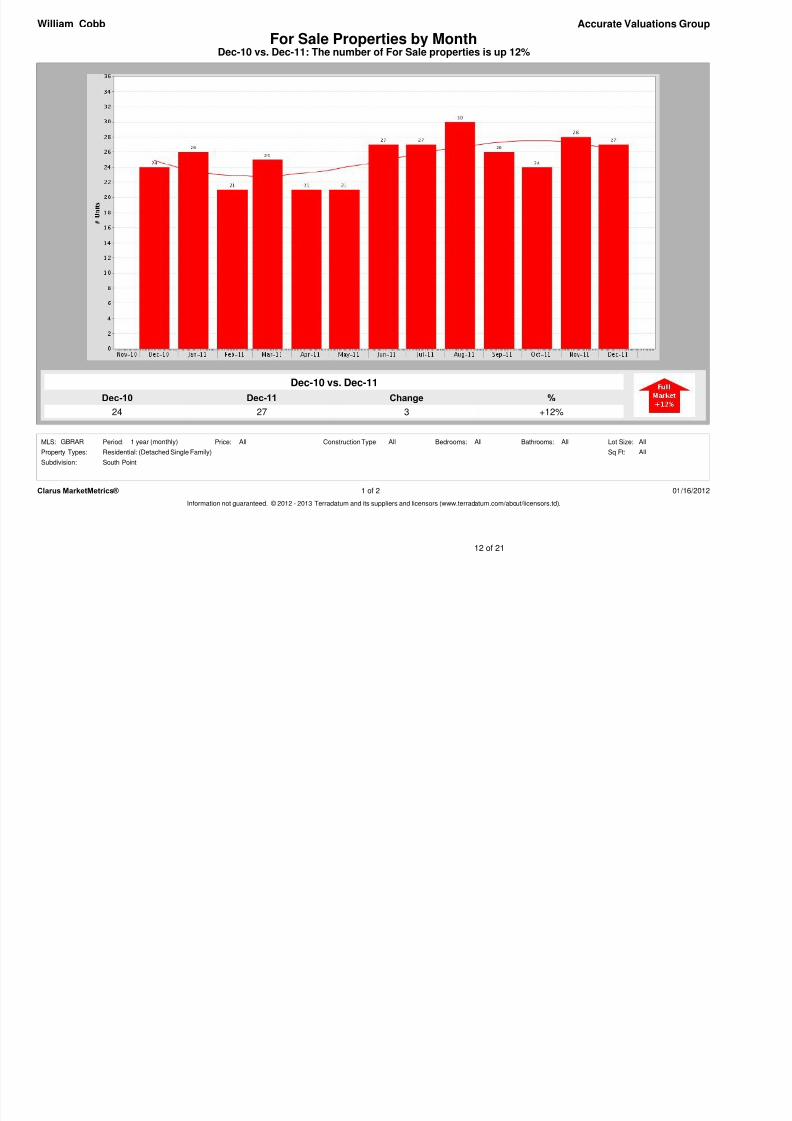
Dec-11
27
Dec-10
24
%
+12%
Change
3
Dec-10 vs. Dec-11: The number of For Sale properties is up 12%For Sale Properties by Month
Accurate Valuations Group
Dec-10 vs. Dec-11
William Cobb
Clarus MarketMetrics® 1 of 2 01/16/2012
Information not guaranteed. © 2012 - 2013 Terradatum and its suppliers and licensors (www.terradatum.com/about/licensors.td).
AllBathrooms:MLS: AllAll
Sq Ft:
South Point
Residential: (Detached Single Family)
Period: All All
Property Types:
Subdivision:
All
Construction Type:Price: Lot Size:Bedrooms:1 year (monthly)GBRAR
12 of 21

8/3/2019 Denham Springs South Point Subdivision 2011 Comprehensive Housing Report
http://slidepdf.com/reader/full/denham-springs-south-point-subdivision-2011-comprehensive-housing-report 13/21
For Sale Properties by MonthDec-10 vs. Dec-11: The number of For Sale properties is up 12%
Accurate Valuations GroupWilliam Cobb
Time Period # Properties Median Price Average DOMDec-11 142,00027 119
Nov-11 139,95028 104
Oct-11 144,45024 102
Sep-11 149,90026 84
Aug-11 149,45030 72
Jul-11 149,00027 70
Jun-11 149,00027 65
May-11 146,90021 59Apr-11 149,00021 70
Mar-11 129,90025 73
Feb-11 144,99921 101
Jan-11 130,90026 90
Dec-10 142,45024 102
Clarus MarketMetrics® 2 of 2 01/16/2012Information not guaranteed. © 2012 - 2013 Terradatum and its suppliers and licensors (www.terradatum.com/about/licensors.td).
13 of 21
8/3/2019 Denham Springs South Point Subdivision 2011 Comprehensive Housing Report
http://slidepdf.com/reader/full/denham-springs-south-point-subdivision-2011-comprehensive-housing-report 14/21
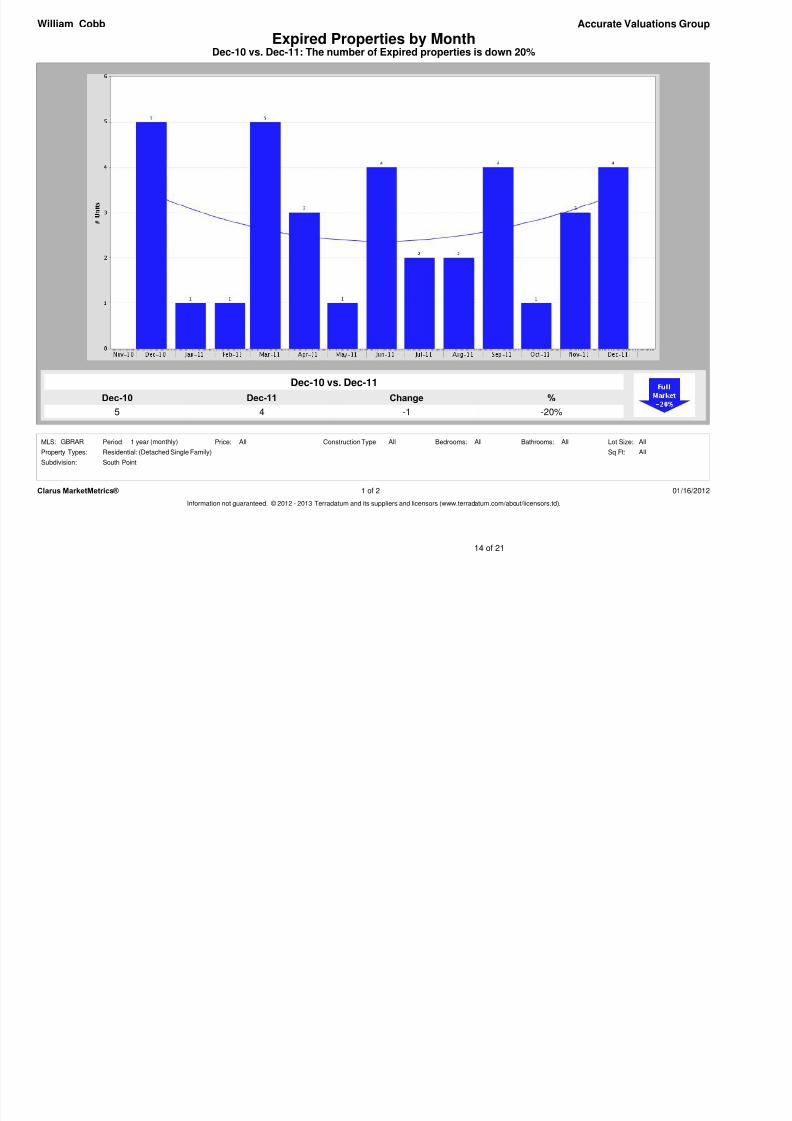
Dec-11
4
Dec-10
5
%
-20%
Change
-1
Dec-10 vs. Dec-11: The number of Expired properties is down 20%Expired Properties by Month
Accurate Valuations Group
Dec-10 vs. Dec-11
William Cobb
Clarus MarketMetrics® 1 of 2 01/16/2012
Information not guaranteed. © 2012 - 2013 Terradatum and its suppliers and licensors (www.terradatum.com/about/licensors.td).
AllBathrooms:MLS: AllAll
Sq Ft:
South Point
Residential: (Detached Single Family)
Period: All All
Property Types:
Subdivision:
All
Construction Type:Price: Lot Size:Bedrooms:1 year (monthly)GBRAR
14 of 21
8/3/2019 Denham Springs South Point Subdivision 2011 Comprehensive Housing Report
http://slidepdf.com/reader/full/denham-springs-south-point-subdivision-2011-comprehensive-housing-report 15/21
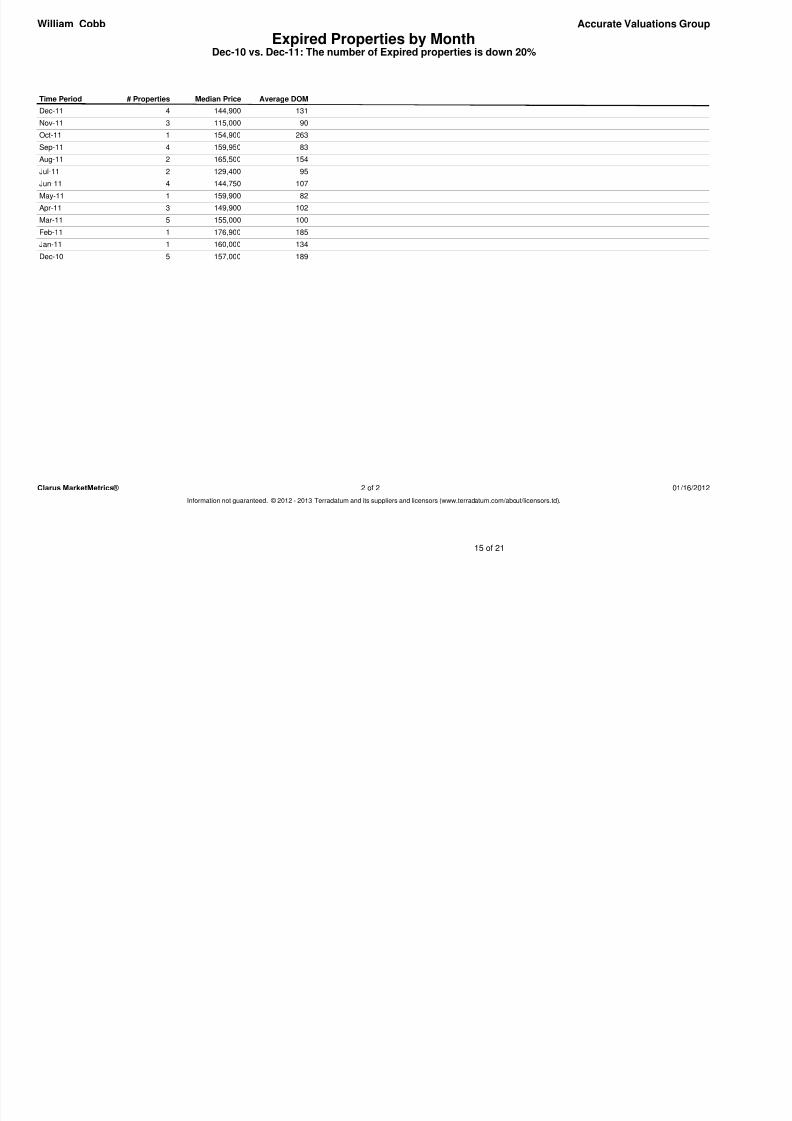
Expired Properties by MonthDec-10 vs. Dec-11: The number of Expired properties is down 20%
Accurate Valuations GroupWilliam Cobb
Time Period Median Price# Properties Average DOMDec-11 144,9004 131
Nov-11 115,0003 90
Oct-11 154,9001 263
Sep-11 159,9504 83
Aug-11 165,5002 154
Jul-11 129,4002 95
Jun-11 144,7504 107
May-11 159,9001 82Apr-11 149,9003 102
Mar-11 155,0005 100
Feb-11 176,9001 185
Jan-11 160,0001 134
Dec-10 157,0005 189
Clarus MarketMetrics® 2 of 2 01/16/2012Information not guaranteed. © 2012 - 2013 Terradatum and its suppliers and licensors (www.terradatum.com/about/licensors.td).
15 of 21
8/3/2019 Denham Springs South Point Subdivision 2011 Comprehensive Housing Report
http://slidepdf.com/reader/full/denham-springs-south-point-subdivision-2011-comprehensive-housing-report 16/21
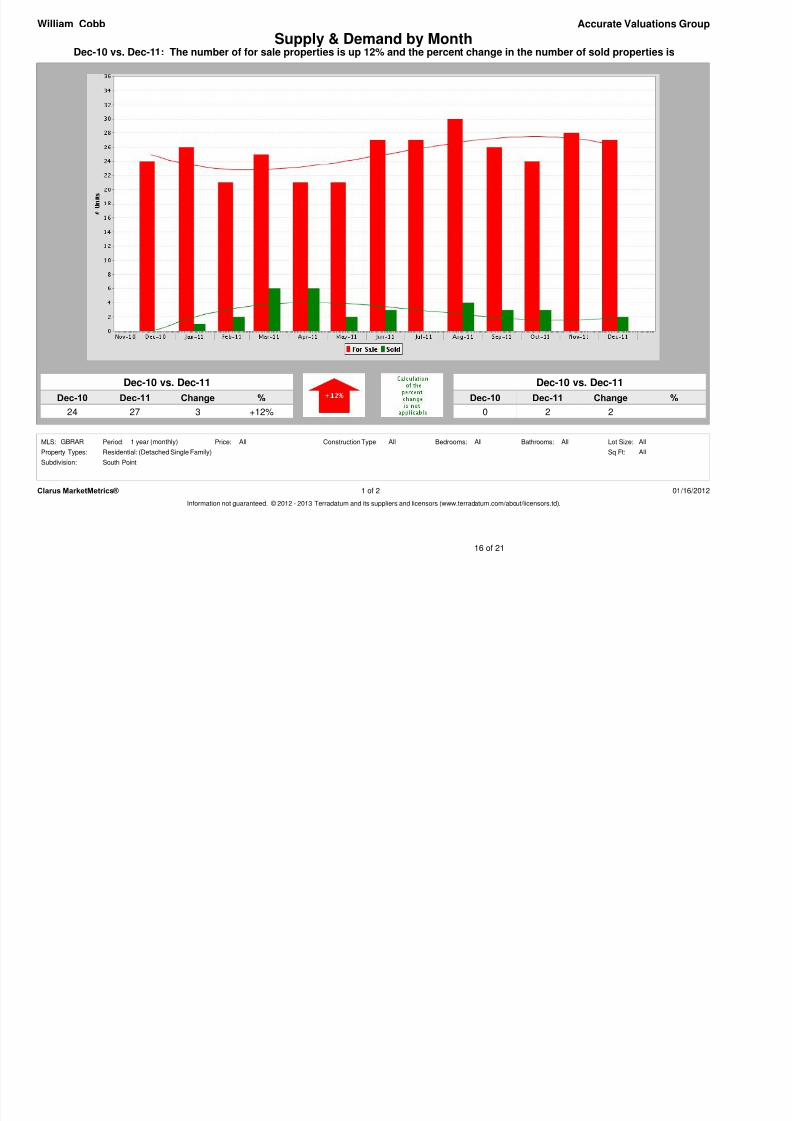
Dec-10 vs. Dec-11: The number of for sale properties is up 12% and the percent change in the number of sold properties is
Accurate Valuations Group
Dec-10 vs. Dec-11
24 +12%
William Cobb
27
Dec-11
Supply & Demand by Month
ChangeDec-10 %
3
Dec-10 Dec-11 %
0
Dec-10 vs. Dec-11
2
Change
2
Clarus MarketMetrics® 1 of 2 01/16/2012Information not guaranteed. © 2012 - 2013 Terradatum and its suppliers and licensors (www.terradatum.com/about/licensors.td).
AllBathrooms:MLS: AllAll
Sq Ft:
South Point
Residential: (Detached Single Family)
Period: All All
Property Types:
Subdivision:
All
Construction Type:Price: Lot Size:Bedrooms:1 year (monthly)GBRAR
16 of 21
Willi C bb A t V l ti G
8/3/2019 Denham Springs South Point Subdivision 2011 Comprehensive Housing Report
http://slidepdf.com/reader/full/denham-springs-south-point-subdivision-2011-comprehensive-housing-report 17/21
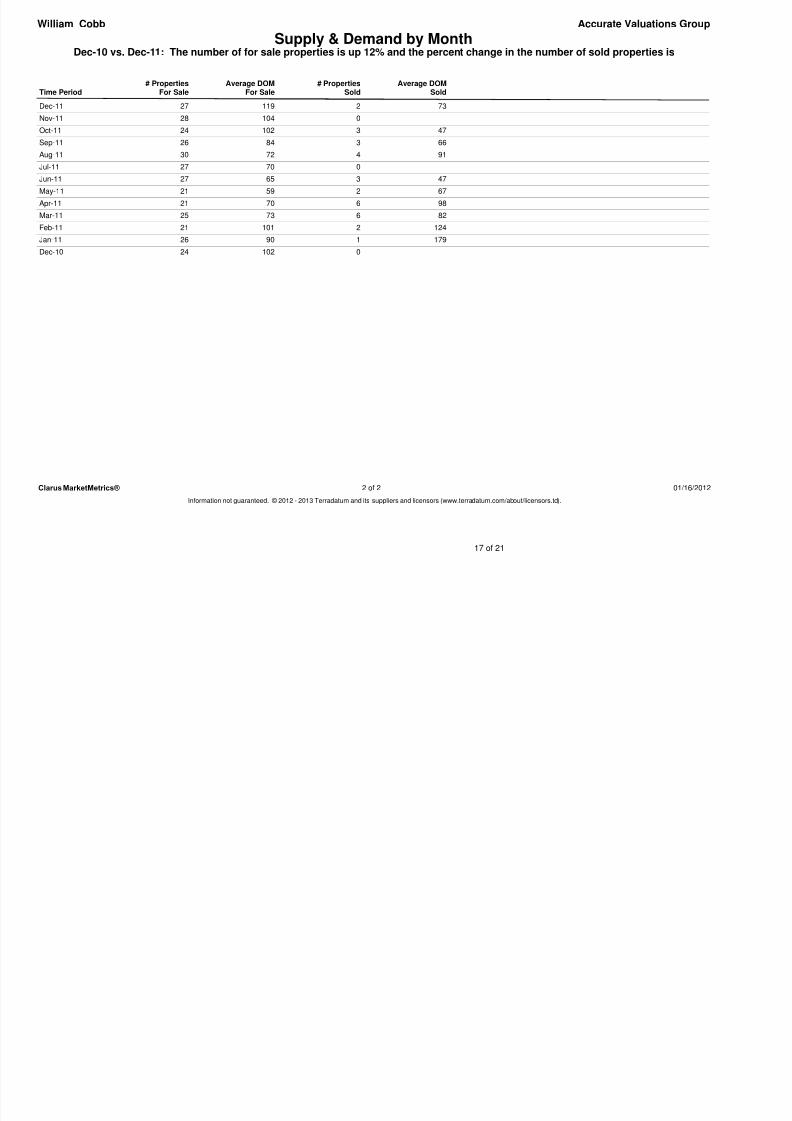
Supply & Demand by MonthDec-10 vs. Dec-11: The number of for sale properties is up 12% and the percent change in the number of sold properties is
William Cobb Accurate Valuations Group
Time Period For SaleFor Sale SoldSold# Properties Average DOM Average DOM# Properties
Dec-11 119 7327 2
Nov-11 10428 0
Oct-11 102 4724 3
Sep-11 84 6626 3
Aug-11 72 9130 4
Jul-11 7027 0
Jun-11 65 4727 3
May-11 59 6721 2
Apr-11 70 9821 6
Mar-11 73 8225 6
Feb-11 101 12421 2
Jan-11 90 17926 1
Dec-10 10224 0
Clarus MarketMetrics® 2 of 2 01/16/2012Information not guaranteed. © 2012 - 2013 Terradatum and its suppliers and licensors (www.terradatum.com/about/licensors.td).
17 of 21
Accurate Valuations GroupWilliam Cobb
8/3/2019 Denham Springs South Point Subdivision 2011 Comprehensive Housing Report
http://slidepdf.com/reader/full/denham-springs-south-point-subdivision-2011-comprehensive-housing-report 18/21
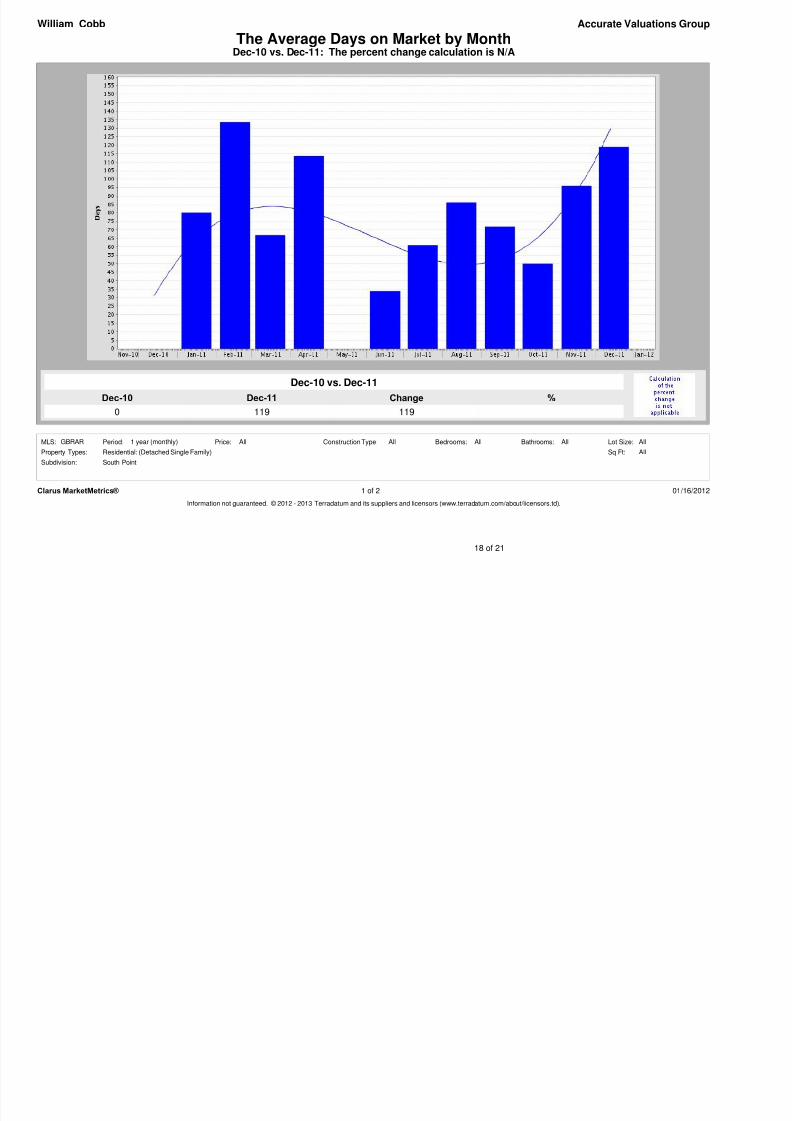
Dec-11
119
Dec-10
0
%Change
119
Dec-10 vs. Dec-11: The percent change calculation is N/AThe Average Days on Market by Month
Accurate Valuations Group
Dec-10 vs. Dec-11
William Cobb
Clarus MarketMetrics® 1 of 2 01/16/2012Information not guaranteed. © 2012 - 2013 Terradatum and its suppliers and licensors (www.terradatum.com/about/licensors.td).
AllBathrooms:MLS: AllAll
Sq Ft:
South Point
Residential: (Detached Single Family)
Period: All All
Property Types:
Subdivision:
All
Construction Type:Price: Lot Size:Bedrooms:1 year (monthly)GBRAR
18 of 21
Accurate Valuations GroupWilliam Cobb
8/3/2019 Denham Springs South Point Subdivision 2011 Comprehensive Housing Report
http://slidepdf.com/reader/full/denham-springs-south-point-subdivision-2011-comprehensive-housing-report 19/21
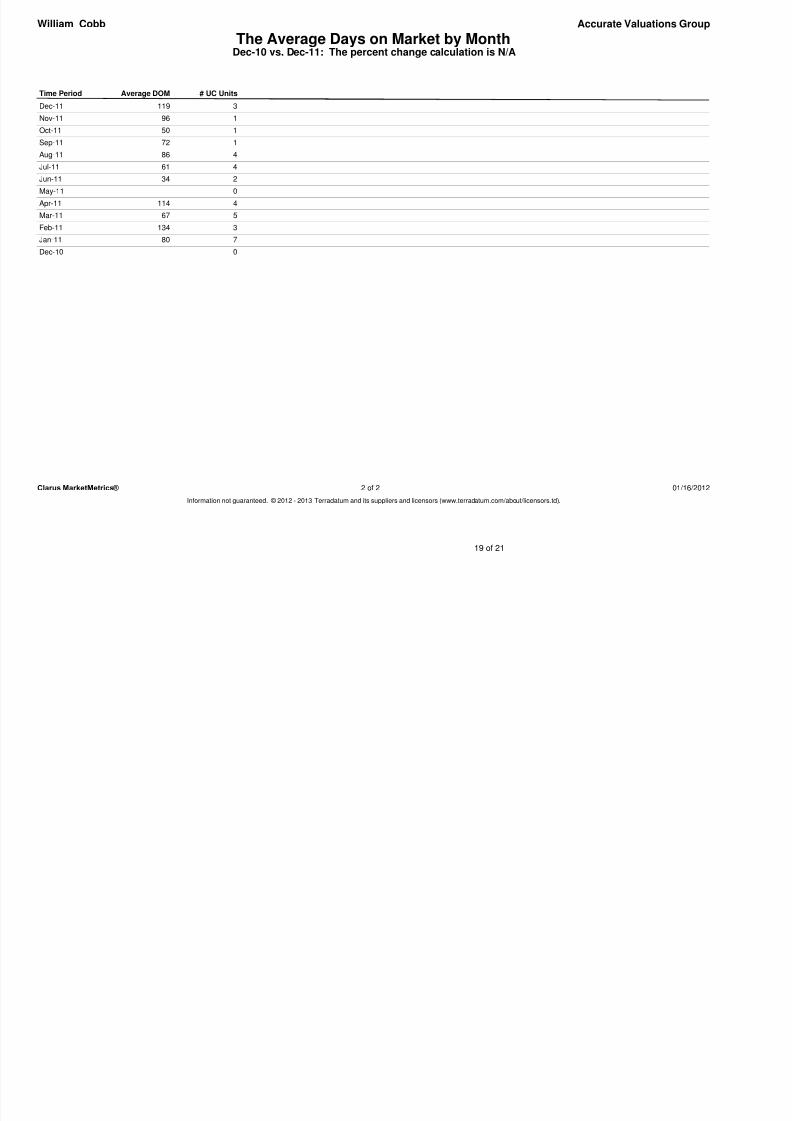
The Average Days on Market by MonthDec-10 vs. Dec-11: The percent change calculation is N/A
Accurate Valuations GroupWilliam Cobb
Time Period # UC UnitsAverage DOM
Dec-11 3119
Nov-11 196
Oct-11 150
Sep-11 172
Aug-11 486
Jul-11 461
Jun-11 234
May-11 0
Apr-11 4114
Mar-11 567
Feb-11 3134
Jan-11 780
Dec-10 0
Clarus MarketMetrics® 2 of 2 01/16/2012Information not guaranteed. © 2012 - 2013 Terradatum and its suppliers and licensors (www.terradatum.com/about/licensors.td).
19 of 21
Accurate Valuations GroupWilliam Cobb
8/3/2019 Denham Springs South Point Subdivision 2011 Comprehensive Housing Report
http://slidepdf.com/reader/full/denham-springs-south-point-subdivision-2011-comprehensive-housing-report 20/21
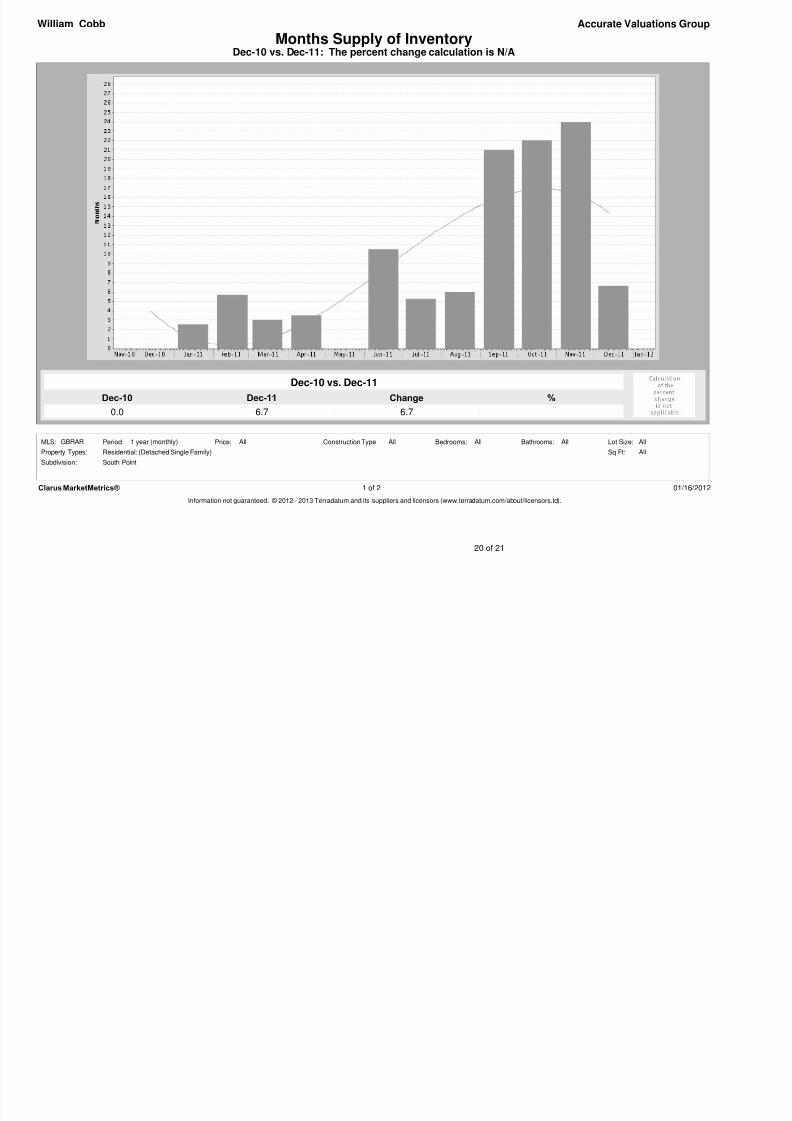
Dec-10 vs. Dec-11: The percent change calculation is N/A
Accurate Valuations Group
Dec-10 vs. Dec-11
0.0
William Cobb
6.7
Dec-11
Months Supply of Inventory
ChangeDec-10 %
6.7
Clarus MarketMetrics® 1 of 2 01/16/2012
Information not guaranteed. © 2012 - 2013 Terradatum and its suppliers and licensors (www.terradatum.com/about/licensors.td).
AllBathrooms:MLS: AllAll
Sq Ft:
South Point
Residential: (Detached Single Family)
Period: All All
Property Types:
Subdivision:
All
Construction Type:Price: Lot Size:Bedrooms:1 year (monthly)GBRAR
20 of 21
William Cobb Accurate Valuations Group
8/3/2019 Denham Springs South Point Subdivision 2011 Comprehensive Housing Report
http://slidepdf.com/reader/full/denham-springs-south-point-subdivision-2011-comprehensive-housing-report 21/21
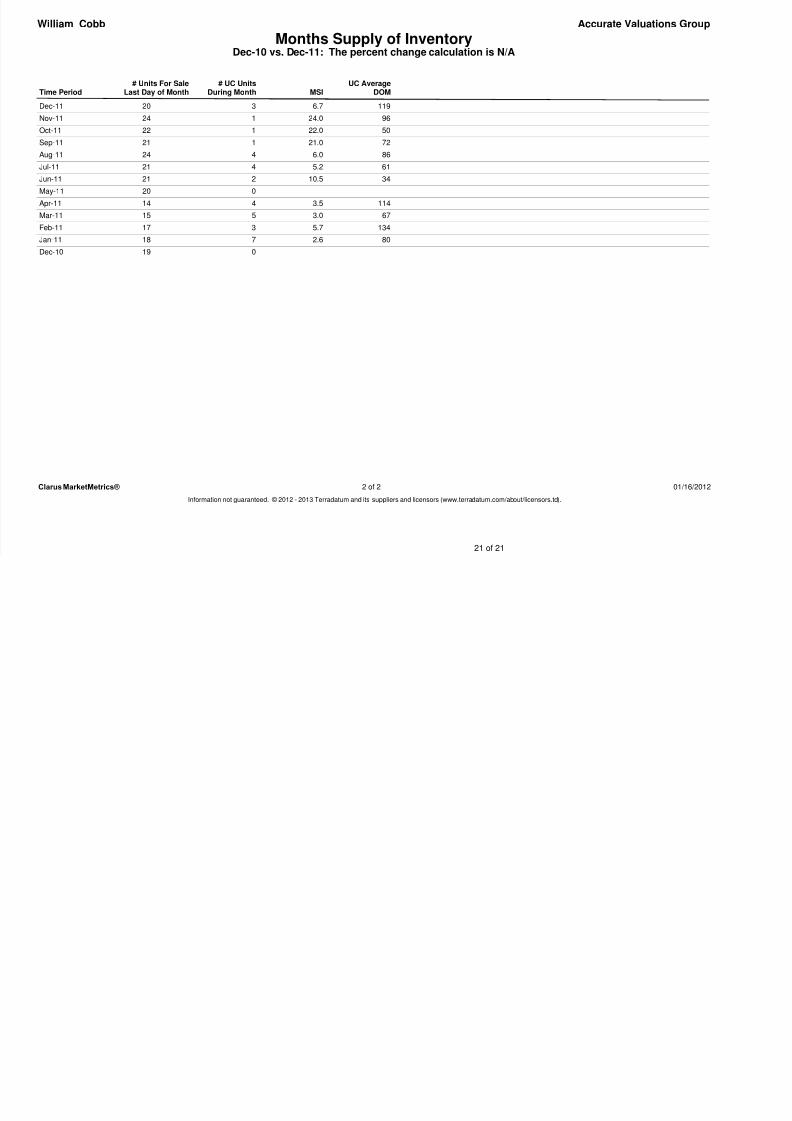
Months Supply of InventoryDec-10 vs. Dec-11: The percent change calculation is N/A
William Cobb Accurate Valuations Group
Time Period During MonthLast Day of Month DOMMSI# Units For Sale # UC Units UC Average
Dec-11 3 11920 6.7
Nov-11 1 9624 24.0
Oct-11 1 5022 22.0
Sep-11 1 7221 21.0
Aug-11 4 8624 6.0
Jul-11 4 6121 5.2
Jun-11 2 3421 10.5
May-11 020
Apr-11 4 11414 3.5
Mar-11 5 6715 3.0
Feb-11 3 13417 5.7
Jan-11 7 8018 2.6
Dec-10 019
Clarus MarketMetrics® 2 of 2 01/16/2012
Information not guaranteed. © 2012 - 2013 Terradatum and its suppliers and licensors (www.terradatum.com/about/licensors.td).
21 of 21