Dengue in Tanzania - Vector Control and Vaccination
24
American Journal of Computational and Applied Mathematics 2015, 5(2): 42-65 DOI: 10.5923/j.ajcam.20150502.03 Dengue in Tanzania - Vector Control and Vaccination Laurencia Ndelamo Massawe 1,* , Estomih S. Massawe 2 , Oluwole D. Makinde 3 1 Faculty of Science, Technology and Environmental Studies, The Open University of Tanzania, Dar es Salaam, Tanzania 2 Mathematics Department, University of Dar es salaam, Dar es Salaam, Tanzania 3 Faculty of Military Science, Stellenbosch University, Private Bag X2, Saldanha, South Africa Abstract In this paper a mathematical model is presented to examine the effect of treatment, careful and Careless Susceptibles with control on the transmission of Dengue fever in the society. A nonlinear mathematical model for the problem is proposed and analysed quantitatively using the stability theory of the differential equations. The results show that the disease-free equilibrium point is locally and globally asymptotically stable if the reproduction number (R 0 ) is less than unity. Then the endemic equilibrium is locally and globally asymptotically stable under certain conditions, using the additive compound matrices approach and Lyapunov method respectively. However treatment, careful Susceptibles and the control on the transmission of dengue fever disease will have a positive effect on decreasing the growth rate of dengue fever disease. The numerical simulation shows that on the application of vaccination, the number of infected individual is reduced. Keywords Dengue Fever Disease, treatment, Careful, Careless, Susceptible, Equilibrium, Control, infected, reproduction number, Vaccination 1. Introduction Dengue fever is a severe infection, flu-like illness transmitted to humans through the bites of infected female Aedes mosquitoes. Four different serotypes can cause dengue fever. A human infected by one serotype, on recovery, gains total immunity to that serotype and only partial and transient immunity with respect to the other three. Dengue fever can vary from mild to severe; the more severe forms of dengue fever include dengue hemorrhagic fever and dengue shock syndrome. Dengue hemorrhagic fever occurs when a person get infected by different type of dengue virus after being infected by another one sometimes before. Dengue shock syndrome is the most severe form of dengue infection. Dengue is found in tropical and sub-tropical climates worldwide, mostly in urban and semi-urban areas [1]. Mathematical modelling of the population models continues to provide important insights into population behaviour and control. Over the years, it has also become an important tool in understanding the dynamics of diseases, and the decision making process regarding intervention programs for controlling population and disease problems in many countries [2]. Mathematical modelling also became considerable important tool in the study of epidemiology because it helps in understanding the observed epidemiological patterns, * Corresponding author: [email protected] (Laurencia Ndelamo Massawe) Published online at http://journal.sapub.org/ajcam Copyright © 2015 Scientific & Academic Publishing. All Rights Reserved disease control and provides understanding of the underlying mechanisms which influence the spread of disease and may suggest control strategies [1-8]. Moreover [9], presented a dynamical model that studied the temporal model for dengue disease with treatment. So far no research has considered a dynamical system that incorporates the control strategies to reduce the spread of the dengue fever disease through the campaign to educate the careless human susceptible, control vector human contact, removing vector breeding areas, insecticides application and control maturation rate from larvae to adult. In this work, we present an extension of the model of [9] to include temporary immunity, control strategies and Susceptibles with different behaviour i.e. the dynamical system that incorporates the effects Careful and Careless Susceptibles on the transmission of Dengue fever in the society with vaccination. In this paper, data reported by the ministry of health in Tanzania is used. In July 2010 for the first time in Dar es Salaam region -Tanzania, an outbreak of dengue fever was reported, over 40 people were infected and then also between May and July 2013,172 were infected with this disease. Moreover in the year 2014, the government of Tanzania announced the dangers of the disease in which people were alerted about the disease and the precaution to be taken. In this 2014, 399 people were infected in which 2 died of the disease in Dar es Salaam region (http://www.wavuti.com/2014/05/wizara-ya-afya-kitengo-c ha.html). Data will be obtained from the different literature and estimated since there is no enough data in Tanzania. The purpose of this study is to match the empirical data with the modal simulation. Hence we formulate the SITRS (susceptible, Infected, Treated, Recovered, susceptible) and
Transcript of Dengue in Tanzania - Vector Control and Vaccination
American Journal of Computational and Applied Mathematics 2015, 5(2): 42-65 DOI: 10.5923/j.ajcam.20150502.03
Dengue in Tanzania - Vector Control and Vaccination
Laurencia Ndelamo Massawe1,*, Estomih S. Massawe2, Oluwole D. Makinde3
1Faculty of Science, Technology and Environmental Studies, The Open University of Tanzania, Dar es Salaam, Tanzania 2Mathematics Department, University of Dar es salaam, Dar es Salaam, Tanzania
3Faculty of Military Science, Stellenbosch University, Private Bag X2, Saldanha, South Africa
Abstract In this paper a mathematical model is presented to examine the effect of treatment, careful and Careless Susceptibles with control on the transmission of Dengue fever in the society. A nonlinear mathematical model for the problem is proposed and analysed quantitatively using the stability theory of the differential equations. The results show that the disease-free equilibrium point is locally and globally asymptotically stable if the reproduction number (R0) is less than unity. Then the endemic equilibrium is locally and globally asymptotically stable under certain conditions, using the additive compound matrices approach and Lyapunov method respectively. However treatment, careful Susceptibles and the control on the transmission of dengue fever disease will have a positive effect on decreasing the growth rate of dengue fever disease. The numerical simulation shows that on the application of vaccination, the number of infected individual is reduced.
Keywords Dengue Fever Disease, treatment, Careful, Careless, Susceptible, Equilibrium, Control, infected, reproduction number, Vaccination
1. Introduction Dengue fever is a severe infection, flu-like illness
transmitted to humans through the bites of infected female Aedes mosquitoes. Four different serotypes can cause dengue fever. A human infected by one serotype, on recovery, gains total immunity to that serotype and only partial and transient immunity with respect to the other three. Dengue fever can vary from mild to severe; the more severe forms of dengue fever include dengue hemorrhagic fever and dengue shock syndrome. Dengue hemorrhagic fever occurs when a person get infected by different type of dengue virus after being infected by another one sometimes before. Dengue shock syndrome is the most severe form of dengue infection. Dengue is found in tropical and sub-tropical climates worldwide, mostly in urban and semi-urban areas [1].
Mathematical modelling of the population models continues to provide important insights into population behaviour and control. Over the years, it has also become an important tool in understanding the dynamics of diseases, and the decision making process regarding intervention programs for controlling population and disease problems in many countries [2].
Mathematical modelling also became considerable important tool in the study of epidemiology because it helps in understanding the observed epidemiological patterns,
* Corresponding author: [email protected] (Laurencia Ndelamo Massawe) Published online at http://journal.sapub.org/ajcam Copyright © 2015 Scientific & Academic Publishing. All Rights Reserved
disease control and provides understanding of the underlying mechanisms which influence the spread of disease and may suggest control strategies [1-8]. Moreover [9], presented a dynamical model that studied the temporal model for dengue disease with treatment. So far no research has considered a dynamical system that incorporates the control strategies to reduce the spread of the dengue fever disease through the campaign to educate the careless human susceptible, control vector human contact, removing vector breeding areas, insecticides application and control maturation rate from larvae to adult. In this work, we present an extension of the model of [9] to include temporary immunity, control strategies and Susceptibles with different behaviour i.e. the dynamical system that incorporates the effects Careful and Careless Susceptibles on the transmission of Dengue fever in the society with vaccination. In this paper, data reported by the ministry of health in Tanzania is used. In July 2010 for the first time in Dar es Salaam region -Tanzania, an outbreak of dengue fever was reported, over 40 people were infected and then also between May and July 2013,172 were infected with this disease. Moreover in the year 2014, the government of Tanzania announced the dangers of the disease in which people were alerted about the disease and the precaution to be taken. In this 2014, 399 people were infected in which 2 died of the disease in Dar es Salaam region (http://www.wavuti.com/2014/05/wizara-ya-afya-kitengo-cha.html). Data will be obtained from the different literature and estimated since there is no enough data in Tanzania. The purpose of this study is to match the empirical data with the modal simulation. Hence we formulate the SITRS (susceptible, Infected, Treated, Recovered, susceptible) and

American Journal of Computational and Applied Mathematics 2015, 5(2): 42-65 43
SVITRS (Susceptible, Vaccinated, Infected, Recovered, Susceptible) models for transmission of dengue fever disease.
2. Formulation of the Model In this section, we adopt the model presented in [10]. The
model is based on two populations: humans and mosquitoes. Human population ( )hN is divided into five groups such
as 1hS - Careful human Susceptibles,
2hS - Careless
human Susceptibles, hI - infected human, hT - treated
infected human, hR - recovery infected human, so that we
have 1 2h h h h hN S S I T R= + + + + and the
population of female mosquitoes, indexed by m is divided into three groups that is mA -Aquatic phase (that includes
the egg, larva and pupa stages), mS - Susceptibles (mosquitoes that are able to contract the disease),
mI -Infectives (mosquitoes capable of transmitting the
disease to human). In formulating the model, the following assumptions are considered:
i. Total human population ( )hN is constant, ii. The population is homogeneous, which means that
every individual of a compartment is homogeneously mixed with the other individuals,
iii. Immigration and emigration are not considered, iv. Each vector has an equal probability to bite any host, v. Humans and mosquitoes are assumed to be born
susceptible i.e. there is no natural protection, vi. The coefficient of transmission of the disease is fixed
and does not vary seasonally, vii. For the mosquito there is no resistant phase, due to its
short lifetime, viii. The possibility of careless Susceptibles contracting
dengue fever disease is higher than that for careful Susceptibles.
Considering the above assumptions, we then have the following schematic model flow diagram for dengue fever disease with control:
Figure 1. Model Flow diagram for dengue fever disease with control

44 Laurencia Ndelamo Massawe et al.: Dengue in Tanzania - Vector Control and Vaccination
From the above flow diagram, the model will be governed by the following equations [10]:
( ) ( ) ( )1
1 1 22 1 1 1 21 1 1h mh h mh h h h h h
h
dS IN B S S R S
dt Nπ µ τ β µ θ τ θ
= − − − − + + −
( ) ( )2
2 2 22 2 1 21 1h mh h mh h h h h
h
dS IN B S S S
dt Nπµ τ β µ τ θ = − − − − −
( ) ( )( ) ( )1 22 1 2 21 1h m
h h mh h h hh
dI IB S B S a I
dt Nτ τ β µ η= − + − − + +
( )hh h h h h
dTI T
dtη µ δ= − + , ( )1
hh h h h
dRT R
dtδ µ θ= − +
( ) ( )5 31m mm m A A m
h
dA AS I A
dt kNϕ µ τ η τ= − + − + +
( )15 2 3 4IdSm hA B S SA m m m mhmdt Nh
τ η τ β µ τ= − − + −
( ) ( )2 3 41m hhm m m m
h
dI IB S I
dt Nτ β µ τ= − − + (1)
where mhβ is the transmission probability from mI (per bite), Aη is the maturation rate from larvae to adult (per day),
5τ is the control maturation rate from larvae to adult, 3B is the average daily biting (per day) for mosquito susceptible,
hmβ is the transmission probability from hI (per bite), k is the number of larvae per human, ϕ is the number of eggs
at each deposit per capita (per day), π is the fraction of subpopulation recruited into the population, 1B is the average
daily biting (per day) for careful human susceptible, 2B is the average daily biting (per day) for careless human susceptible, 2θ is the Positive change in behaviour of Careless individuals, 1τ is the campaign of educating Careless human susceptible, hµ is the average lifespan of humans (per day), a is the per capita disease induced death rate for humans, Aµ is the
natural mortality of larvae (per day), 2τ is the control of vector human contact , 3τ is the reducing vector breeding areas,
hη mean viremic period (per day), mµ average lifespan of adult mosquitoes (per day), 4τ insecticide application, 1θ portion that moves from compartment hR to
1hS due to loss of immunity and hδ treatment parameter.
3. Model Analysis
We study the solutions of System (1) in the closed set 1 2
1 2
1 2
8, ,
, ,
,
h h h h h m m m +
h h h h h m m m m h
m m h h h h h h h
(S S ,I ,T ,R A ,S ,I )Є :
= S S ,I ,T ,R A ,S ,I 0, A kN ,
S + I mN S S + I +T + R N
Ω ≥ ≤
≤ ≤
+
The Ω set is positively invariant with respect to Equation (1) [10].
3.1. Disease Free Equilibrium (DFE) For the disease free equilibrium, it is assumed that there is no infection for both populations of human and mosquitoes i.e.( )hI t = 0 and ( )I t = 0m , denoted by ‘ 0E ’. Thus 0E of the model system (1) is obtained as

American Journal of Computational and Applied Mathematics 2015, 5(2): 42-65 45
( ) ( ) ( ) ( )( )1 2
, ,0 h h m mE = S t S t , , , A t ,S t , =0 0 0 0( ) ( )( ) ( )
( )1 2 1 2
1 2
1 1 1,
1h h h
h
N Nπ µ τ θ τ θ π
µ τ θ
− + − + −
+ −
( ) ( )1 2 5 41h h h h
h A m
N qkN qkN,0,0,0, , ,0
πµµ τ θ ϕτ η ϕ µ τ+ − +
where ( )( )( )5 3 5 4A A A mq ϕτ η µ τ τ η µ τ= − + + +
3.2. The Basic Reproduction Number, 0R
The basic reproduction number, denoted by 0R , is defined as the average number of secondary infections that occurs when one infective individual is introduced into a completely susceptible population [11].
The basic reproduction number of the model (1) 0R is calculated by using the next generation matrix of an ODE [11].
Using the approach of [11]. 0R is obtaining by taking the largest (dominant) Eigen value (spectral radius) of
10 0( ) ( )i i
j j
F E V EX X
− ∂ ∂
∂ ∂ ,
where, iF is the rate of appearance of new infection in compartment i , iV + is the transfer of individuals out of the
compartment i by all other means and 0E is the disease free equilibrium.
( ) ( )( )
( )
1 22 1 2 2
2 3
1 1
1
mh h mh
h1i
2 hhm m
h
IB S B SNF
F = =F IB S
N
τ τ β
τ β
− + − −
Using the linearization method, the associated matrix at DFE is given by
( ) ( )
( ) ( )
1 10 0
h m
2 20 0
h m
дF дFE EдI дI
=дF дFE EдI дI
F
This implies that
( ) ( )( )
( )
1 22 1 2 2
2 3
1 1
1
h h mh
h
hm m
h
B S B S0
N=B S
0N
τ τ β
τ β
− + −
−
F
With
( ) ( )( ) ( )( )1
1 2 1 2
1 2
1 1 11
h h hh
h
N NS
π µ τ θ τ θ πµ τ θ
− + − + −=
+ −,
( )21 21
h hh
h
NS πµµ τ θ
=+ −
, ( )4
hm
m
kN qSϕ µ τ
=+
we have
46 Laurencia Ndelamo Massawe et al.: Dengue in Tanzania - Vector Control and Vaccination
( ) ( ) ( )( ) ( )( ) ( ) ( )
( )( )
2 1 1 2 1 22 2
1 2 1 2
2 3
4
1 1 1 11
1 1
1
h hmh
h h
hm
m
B0 B
=B kq
0
τ π µ τ θ τ θ π πµτ β
µ τ θ µ τ θ
τ βϕ µ τ
− − + − + − + −
+ − + − −
+
F
The transfer of individuals out of the compartment i is given by
( )( )4
h h h1i
2 m m
a IV= =
V I
µ η
µ τ
+ + +
V
Using the linearization method, the associated matrix at DFE is given by,
( ) ( )
( ) ( )
1 10 0
h m
2 20 0
h m
дV дVE EдI дI
=дV дVE EдI дI
V
This gives
4
h h
m
a 0= 0
µ ηµ τ
+ + +
V
With
4
h h–1
m
1 0a
=10
µ η
µ τ
+ + +
V
Therefore ( ) ( ) ( )( )
( )( )
( )( )
( )
2 1 1 2 2 2 2
1 2 1 2
2 344
1 1 1 11 1
1
h hmh
h h h h–1
hmmm
B B 10 0a
=1B kq 00
τ π µ τ θ θ π τ πµβ
µ τ θ µ τ θ µ η
τ βµ τϕ µ τ
− − + − + − + + − + − + + − + +
FV (2)
Then eigenvalues of the equation (2) is given by
( )( ) ( ) ( )( ) ( ) ( )
( )( )( )
( )( )
2 1 1 2 1 2 2 2
1 2
2 3
4
1 1 1 1 11
det det1
mh h mh mh h
h m–1
hm
m h h
B B0
– λ =kqB
0a
τ β π µ τ θ τ θ πβ τ β πµλ
µ τ θ µ
τ βλ
ϕ µ τ µ η
− − + − + − + − −
+ − −
− + + +
FV I
This gives
( )3
2 1 4
2( )( (1 ))( )
hm h h
h h h m
mhkB a H
a
Bβ β η µ
ϕ η µ µ θ τ µ τλ
− + +=
+ + − ++
where ( )( )( )5 3 5 4A A A mB ϕτ η µ τ τ η µ τϕ= − + + + ( )( )2 11hµ θ τ+ −
( ) ( ) ( )( )( 2 1 1 21 1 1H Bθ τ π π τ= − + − + − + + ( )( ) ( ))( )21 2 2 11 1hB B τπ π µ τ − +− + − − +

American Journal of Computational and Applied Mathematics 2015, 5(2): 42-65 47
( )( )( )3 5 4 5A A m Aq µ τ τ η µ τ τ η ϕ= − + + + −
consequently
( )3
2 1 4( )( (1 ))( )hm h h
h h h m
mh a
a
BkB Hβ β η µ
ϕ η µ µ θ τ µ τλ
− + +=
+ + − ++ or
( )3
2 1 4( )( (1 ))( )hm h h
h h h m
mh a
a
BkB Hβ β η µ
ϕ η µ µ θ τ µ τλ
− + +
+ ++ − += −
It follows that the Basic Reproductive number which is given by the largest Eigen value for model system (1) denoted by
0R is given by
( )30
2 1 4( )( (1 ))( )hm h h
h h h m
mhkB a HBR
a
β β η µ
ϕ η µ µ θ τ µ τ
− + +=
+ + − ++ (3)
If 0 1R < , the disease cannot invade the population and the infection will die out over a period of time, and also, if
0 1R > , then an invasion is possible and infection can spread through the population. Generally, the larger the value of 0R , the more severe, and possibly widespread the epidemic will be, [10].
3.3. Local Stability of Disease Free Equilibrium Point
To determine the local stability of the disease free equilibrium, the variation matrix 0EJ of the model system (1)
corresponding to the disease free 0E is obtained as
( )
0
1 2
1
5
5 4
4
0 0 0 00 0 0 0 0 00 0 0 0 0 00 0 0 0 0 00 0 0 0 0 0
0 0 0 0 0 1
0 0 0 0 00 0 0 0
1
0 0
1h
h h h
h h
A
A m
m
fyj
q
v
pw
=E
t g
z
µ θ θ
η δ µδ θ µ
ϕϕη τ
τ
η τ µ τµ τ
−
− −− −
−
− −−
−
−
J (4)
where
'
53 5
4
1
( )A
A Am
q
t
qϕϕη τ
µ τ η τϕ µ τ
−
− − − −=+
( ) ( ) ( )( )( )
1
2
12 1
1
1 1 21
mh h
h
Bf
πτ β τ θ µ
τ θ µ
− +− − −= −
− +
( )( )
2
2
2
2
1
1mh h
h
By
τ π β µ
τ θ µ
−= −
− +,
( )2 3
4(
1
)v hm
m
kqB β
ϕ µ
τ
τ=
+
−
( ) ( )22
221
1h
mhh
Bj
π µτ β
τ θ µ= − +
− +
( )( )
1
1
21
2
11
1 hB
τ πθπ
τ θ µ
−− +
− +
51
A
qg ϕ
ϕη τ= −
, ( )1 21 hp τ θ µ− − −=
48 Laurencia Ndelamo Massawe et al.: Dengue in Tanzania - Vector Control and Vaccination
w h ha η µ= − − − ,( )2 3
4( )
1 hmzm
kqB β
ϕ
τ
µ τ=
−−
+
Therefore the stability of the disease free equilibrium point can be clarified by studying the behaviour of 0EJ in which
for local stability of DFE we seek for its all eigenvalues to have negative real parts. It follows that, the characteristic function of the matrix (4) with λ being the eigenvalues of the Jacobian matrix, by using Mathematica software gives the following values:
,hλ µ1 = − ( )12 21 hλ τ θ µ= − − − The other eigenvalues are given as
431 1
= ,2 h h ma
dσλ η µ µ τ+ + + +− +
when σ is not a real number,
4 h hλ δ µ= − − , 15 hλ θ µ= − −
461 1
2 h h mad
λ η µ µ τ σ+ + + −= − +
when σ is not a real number,
( )( ) ( )( )( ) ( )72 12 2 42 1 1
1
h h mρλ
ϕ τ θ µ τ θ µ µ τα=
− + − + +− −
when ρ is not a real number, and finally.
( )( ) ( )( )( ) ( )2 2 4
82 12 1 1
1
h h mρλ
ϕ τ θ µ τ θ µ µ τα= +
− + − + +−
when ρ is not a real number, where
( )( ) ( )( )( )2 2 1 2 41 1h h md ϕ τ θ µ τ θ µ µ τ= − + − + +
( )( ) ( )( )( ) ( )(( 22 2 1 2 4 21 1 4 1h h mσ ϕ τ θ µ τ θ µ µ τ τ= − + − + + −
( )( ) ( ) ( )( )1 3 2 2 1 2 11 1hm mh h hkqB B πβ β τ θ µ τ θ µ− +− + − − +
( )( ) ( ) ( )(( 21 2 2 2 3 21 4 1 1h hm mh hk qB Bτ θ µ τ π β β µ ϕ τ− + − + −
)( ) ( )))22 4 4h h h m maθ µ η µ µ τ µ τ+ + + − − +
( )( ) ( )( ) ( )(2 2 22 22 21 421 1h h A mρ τ θ µ τ θ µ ϕ µ µ τ= − + − + + +
( ) ( )2 224 3 4 5 5
54 1 2m m A A
A
qqϕ µ τ µ τ τ η τ η τ ϕ ϕ
ϕη τ+ − + − + − −
( )( )2
' 2 '4 3 4 5
5 51 1m m A
A A
q qqµ τ µ τ τ η τ ϕ ϕ
ϕη τ ϕη τ+ − + − − + − +

American Journal of Computational and Applied Mathematics 2015, 5(2): 42-65 49
( ) ( )( ) '4 4 3 4 5
52 1A m m m A
A
qqϕµ µ τ ϕ µ τ µ τ τ η τ ϕ
ϕη τ+ − + − + − + −
( )( ) ( )( ) ( )(22 1 2 41 1h h mα τ θ µ τ θ µ ϕ µ τ= − + − + +
( ) '3 4 5
51 .A m A
A
qqµ µ τ τ η τ ϕ
ϕη τ+ + + + + −
Hence under certain conditions the system is stable since all the eight eigenvalues are negative. These imply that at
0 1R < the Disease Free Equilibrium point is locally asymptotically stable.
3.4. Global Stability of Disease Free Equilibrium Point In this subsection, the global behaviour of the equilibria for system (1) is analysed. The following theorem provides the
global property of the disease free equilibrium 0E of the system. The results are obtained by means of Lyapunov function. In choosing the Lyapunov function, we adopt the idea of [12].
Theorem1: If 0 1R ≤ , then the infection-free equilibrium is globally asymptotically stable in the interior of Ω . Proof: To establish the global stability of the disease-free equilibrium, we construct the following Lyapunov function:
( ) ( ) ( )(3 ( )hm h h h h hk B a Ht I aL = B tϕ β η µ ϕ η µ+ +++ +− (5)
( )( )) ( ) ( )22 1 41h m I tmµ θ τ µ τ− ++
Calculating the time derivative of L along (4), we obtain
( ) ( ) ( ) ( )('3
'hm h h h h hk B at = I aL B tHϕ β η µ ϕ η µ+ +++ +−
( )( )) ( ) ( )2
2 1 4'1h m mI tµ θ τ µ τ− ++
Then substituting ' '( ) & ( )h mI t I t from system (1), we get
( ) ( ) ( )(( 13 2 1' 1hm h hk B a HL t = B u B Shϕ β η µ− −+ + + ( ) ) ( )
22 21 mmh h h h
h
Iu B S a Ih N
β µ η− − + + +
( )2 1 42
( )( (1 )) ( )h h h maϕ η µ µ θ τ µ τ+ − +++ ( ) ( )2 3 41 hhm m m m
h
IB S I
Nτ β µ τ− − +
With ( )3
02 1 4
( )
( )( (1 ))( )hm h h
h h h m
mhkB aR
a
BHβ β η µ
ϕ η µ µ θ τ µ τ
− + +=
+ − +++
it follows that
( ) ( ) ( )( )( ) ( )2' 22 1 41h h h mL = at ϕ η µ µ θ τ µ τ+ + − +− + ( )( )0 01 1m f RI R f+ −
( ) ( )( )( )2 1 42 2
01 ( )
( )h h h m
hm hh
a R
a HBk
ϕ η µ µ θ τ µ τ
β η µ ϕ
+ + − ++−
+ +
( ) ( ) ( )(( h h h h h h hB a Ik a H aµ ηϕ η µ ϕ η µ+ + ++ ++ +

50 Laurencia Ndelamo Massawe et al.: Dengue in Tanzania - Vector Control and Vaccination
( )( )) ( )2 1 42
21 ( ) 1 hh m m
h
IS
Nτµ θ τ µ τ+ −−+
where
( ) ( )( )1 22 1 2 21 1h h
h
B S B Sf
N
τ τ− + −=
Thus, ( )L' t is negative if 0 1R < and L' = 0 if and only if h mI = I = 0
is reduced to the DFE. Consequently,
the largest compact invariant set in ( 1Sh ,
2Sh , hI , hT , hR , mA , mS , )mI ε Ω , L'=0 when 0 1R < is the singleton
0Ε . Hence, by LaSalle’s invariance principle, it is implied that 0"E " is globally asymptotically stable in Ω [13]. This completes the proof.
3.5. Existence of Local and Global Asymptotic Stability of Endemic Equilibrium Since we are dealing with presence of dengue fever disease in human population, we can reduce system (1) to a
4-dimensional system by eliminating ,h h m mT ,R A S& respectively, in the feasible region Ω . The values of mS can be
determined by setting m h mS = mN I− to obtain
( ) ( ) ( )11 1 22 1 1 1 21 1 1m
h h mh h h h h hh
dS IhN B S S R S
dt Nπ µ τ β µ θ τ θ= − − − − + + −
( ) ( )222 22 2 1 21 1m
h h mh h hh
dS IhN B S S Sh hdt N
πµ τ β µ τ θ= − − − − −
( ) ( )( ) ( )1 22 1 2 21 1 m
h h mh h h hh
dI Ih B S B S a Idt N
τ τ β µ η= − + − − + +
( ) ( ) ( )2 3 41m hhm h m m m
h
dI IB mN I I
dt Nτ β µ τ−= − − + (6)
3.5.1. The Endemic Equilibrium and Its Stability
Here, we study the existence and stability of the endemic equilibrium points. If 0 1,R > then the host-vector model system (6) has a unique endemic equilibrium given by
( )1 2* * * * *,h h h mE = S S , I , I
in Ω , with
( ) ( ) ( )( )( )1 2 2 1 2* 1 12h mh h h haSh N Bτ β η µ θ µτ= − −+ + + −
( )( ))( ) ( )21 1 2 4 2 31 1h m h hm mhB m B Nτ θ µ βτµ τ β+ + +− − +
( )( ) ( )( ) ( )( )( 1 2 1 2 2 2 11 2 1h h hN B B B Bπµ θ πµτ − −− −− + +
( ) ( )( ) ) ( )( 2 2 22 1 1 1 2
*22 1 1h h mhhB B R Nθ θτ τµ β+ + √− −−
( ) ( )( )( )( 1 2 1 2 414 h h h h mB B aµ η µ θ µ µ ττ+ + + +−
( ) ( )( )( )( ) ( )2 2
2 1 4 04
3
1h h h mm
hm mh
a R
B kBH
ϕ η µ µ θ τ µ τµ τ
β β
+ + + − ++
American Journal of Computational and Applied Mathematics 2015, 5(2): 42-65 51
( ) ( )) ( )((2 2*
3 1 21 1hm h h hhm B N R B mβ µ θτ τµ π+ + −+ −− +
( )( )) ( )(3 4 1– h hm h h h m h hB N a B aβ µ η µ µ τ η µ+ + + + + + +
( )( )( ) ( ) ( )((1 2 4 2 3 11 1 – 1h m hm h hm B Nτ τθ µ µ τ β µ τ−+ + −− −
( ) ) ( )( ) )))2
2 1 1 2* /1 1 hh h Rθ µ θ θ µπ τ +−+−+
( )( ( ) ( )( ))22 2 1 3 1 21 12 ,h hm mh h hm B B B N β β µ θτ µτ − −+ +−
( ) ( )((2*
2 21h h mh h hhNS a Bβ ητ µ µ+ += − +
( ) ( )( )( )( )2 22 1 4 0
3
1h h h m
hm
a R
B kBH
ϕ η µ µ θ τ µ τ
β
+ + + − +
( ) ( )( ))( ) ( )22 1 1 2 4 21 1 1h h mN B mθ µτ τττ µ− − −+ + + +
( ) ( )( )( )( 2 1 1 2 13 1h h h hm mh h hN B N B B πµ β β π µ θ µτ ++−+
( ) ( )( )( )( )( )
2 22 1 4 01h h h m
h h
a R
kBH a
ϕ η µ µ θ τ µ τ
η µ
+ + + − ++
+ +
( )( ) ) ( )( 21 1 1 2 2
*1 1h h hN B Rθ θ µτ τ+ −+ √−
( ) ( )( )( )(2 21 2 1 2 44 1h mh h h h h mN B B aβ µ η µ θ µ µ ττ+ + + +−
( ) ( )( )( )( )2 22 1 4 0
3
1h h h m
hm mh
a R
B kBH
ϕ η µ µ θ τ µ τ
β β
+ + + − +
( ) ( ) ( ))4 2 3*
11m h hm h hm B N Rµ τ βτ µ θ+ +−+ + +
( ) ( )( )( )( 2 2 3 4–1h h hm h h h mB m B N aµ π β µ η µτ µ τ− +− + + + +
( ) ( )( )( ) ( )(1 1 2 4 21 –1h h h mB a mη µ θ µ µ τττ+ + + −+ −−
( ) ( )( ) ( )((3 1 2 1 1 21 1 1hm h h hB Nβ µ θ µπ θ θτ τ+ −+− −
) ))) ( ) ( )(2 22 2 1
* 2 1/hR m B Bhµ τ+ +− −
( )( ))3 1 2 ,1h hm mh h hB N β β µ θτ µ+−
52 Laurencia Ndelamo Massawe et al.: Dengue in Tanzania - Vector Control and Vaccination
( )( )( )( ) (
( ) ( )( )( ))
4*
22 2
2 1 4 0
1
1
mh h h mh
mh h h
h h h m
k BH aI
k BH a m
a R
τ
β η µ µ τ
β η µ ϕ
η µ µ θ τ µ τ
+ + +=
+ +
+ + + +
− +
−
( ) ( )*2 1 1 2 1 2( ( )( ( )1 )1m h mh h h hN a B BI Bβ η µ θτ µτ+ + +− += −
( )24 2 3 2( ) (1 (m h hm mh h h hm B N N Bµ τ µτ β β µ π+ +−+ +
( ) ( ) ( )1 1 2 1 1 1*
2( )) ( )1 1 )1 h hhB B Rθ µτ τ θπ θ µ− +−+−+ +
( ) ( ) ( )( )(( 2 2 22 1 2 1 2141 h mh h h h hN B B aβ µ η µ θ µτ τ√ + −+ +−
( )( ) ( )( )( )( )2 2
2 1 4 04
3
1h h h mm
hm mh
a R
B kBH
ϕ η µ µ θ τ µ τµ τ
β β
+ + + − ++
( ) ( ) ( )) ( )((*4 2 3 1 2 21 1m hm h hh hm B N R Bµ τ β µ θ µτ τ+ + + + + −−−
( )( )) ( )(3 4 1– h hm h h h m h hm B N a B aπ β µ η µ µ τ η µ+ + + + + + +
( )( )( ) ( ) ( )((1 2 4 2 3 11 1 – 1h m hm h hm B Nτ τθ µ µ τ β µ τ−+ + −− −
( ) ) ( )( ) ))) ( )(*2 2
2 1 1 2 2 1/ 21 1 1hh h R Bθ µπ τ τθ θ µ− − −+ + +
( )( )( ) ( )( ))2 12 3 1 0*
0 211mh hm h h hB B N R f R f R mβ β µ θ τ− −+ + +
But from (3)
( )2 2
2 1 4 0
3
( ( )( (1 ))( ))h h h mh h
hm mh
a Ra
B kBH
ϕ η µ µ θ τ µ τη µ
β β
+ + + − ++ + = −
( ) ( )( )( )( )( )
2 22 1 4 0
31h h h m
hmmh h h
a RB
k BH a
ϕ η µ µ θ τ µ τβ
β η µ
+ + + − +
+ += −
( )mh h haβ η µ+ + =( ) ( )( )( )( )2 2
2 1 4 0
3
1h h h m
hm
a R
B kBH
ϕ η µ µ θ τ µ τ
β
+ + + − +
where
24 2 1 4
*3 3 1 1
( )( ( )( (1 ))( ))( ( ) )
m h h h m
hm mh h h h
afB kBHB N R
µ τ ϕ η µ µ θ τ µ τβ β β µ θ
+ + + + − +=
+
3.5.2. Local Stability of the Endemic Equilibrium In order to analyse the stability of the endemic equilibrium, the additive compound matrices approach is used, using the
idea of [14]. Local stability of the endemic equilibrium point is determined by the variational matrix *E( )J of the nonlinear
system (6) corresponding to *E to get

American Journal of Computational and Applied Mathematics 2015, 5(2): 42-65 53
( )
( ) ( )
( ) ( )
1 22 1
*1 2 2
**
2
*11 0
0 0
1 1
0 0
mhh
h
mh mhh h
h
m
h
m
m
B I
NA
B I B Ia B
N
H
G
NC
E =
F
β τµ θ τ
β τ β τη µ
−− − −
− −− − −
J (7)
From (7) the second additive compound matrix is given by
( )
( )
( )
11 211 13
21 22 23 24 26
32 1 2 in41 44 45
54 55*
2 26
*
3
6
3
6
3 6
4
0 0 0
00 0 0
0
1
1
1
00 0 0 0
0 0 0
mh
h
mh m
h
B ShN
a
B
N
a a
a aa
Ea aa a
Ia a
a
a a a
a
τ β
τ θ
τ β
∗( ) =
−
−
−
J 2 (9)
where ( ) ( )21
*2
21
1hmmh
h
BA
I
N
β τµ θ τ
−− − − −=
( ) ( )( )1 2*
1 2 2 2*1 1mh
h
B S B Sh hB
N
β τ τ− + −=
( ) ( )3 23 2
*11 hm
hmm
h
BC
ImB
N
β τβ τ
−− −=
( )3 24
*1hm hm
h
B IF
N
β τµ τ
−= − − −
( )22
*21
Gh
h
mhB S
N
β τ=
−− ,
( )11
*21
HmhB Sh
Nh
β τ=
−−
( ) ( ) ( )* *1 2 2 2
11 1 21 1
2 1mh m mh mh
h h
B B
N N
I Ia
τ β τ βµ τ θ
−−
−−−= − −
( ) *1 2
221
2mh mh h
h
Iaa
B
N
τ βη µ
−− −− −=
( ) ( )( )1 21 2 2* *
2321 1mh
h
B S B Sa
h h
N
β τ τ− + −= ,
( ) *2 2
211
a mh m
h
B
N
Iτ β=
− ( ) ( )3
32
*2
3 21
1 hm mhm
h
Ba
ImB
N
τ βτ β
−= − − ,
( ) *1 2
411 mh mB I
Na
h
τ β=
−−
( ) ( ) ( )* *1 2 3 2
4331 1mh m hm h
h mh h
B Ba
I I
N N
τ β τ βτ µ µ− + +
− −= − −
( ) ( ) *2
142
4 21
2 1 mh mh h
h
Ba a
I
N
τ βµ τ θ η
−= − − − − − −
( ) ( )( )1 21 2 2 24
* *
51 1mh
h
h ha
B S B S
N
β τ τ− + −=
( ) ( ) ( )2 2 3 22 1 4
* *
551 1
1 mmh hmh m
h h
hB I B Ia
N N
β τ β τµ θ τ µ τ
− −= − − − − − − −
54 Laurencia Ndelamo Massawe et al.: Dengue in Tanzania - Vector Control and Vaccination
( ) ( )354
*2
3 21
1 hm mhm
h
Ba
ImB
N
τ βτ β
−= − −
( )3*
6 4621hm
h h mh
h
B Ia a
N
β τη µ µ τ
−= − − − − − −
( )22 2
1
*
31 mh
h
ha
B S
N
τ β=
−− ,
( ) *1 2
631 mh m
h
Ba
N
Iτ β−=
( )11 2
*
261 mh hB S
aNh
τ β=
−
( )22 2
*
461 mh h
h
B Sa
N
τ β=
−, ( )24 1 21a τ θ−=
The following lemma is stated and proved by [15] to demonstrate the local stability of endemic equilibrium point *E .
Lemma 1: Let ( )*EJ be a 4 4× real matrix.
If ( )( )*tr EJ ,
( )( )*det EJ and
( )[ ]2*det E
J are all negative, then all eigenvalues of ( )*EJ have negative real
parts. Using the above Lemma, we will study the stability of the endemic equilibrium.
Theorem 2: If 0 1,R > the endemic equilibrium *E of the model (1) is locally asymptotically stable in Ω .
Proof: From the Jacobian matrix ( )*EJ in (7), we have
( )( ) ( ) ( ) ( )** 1 2 2 2
*
2 11 1
3 1mh mhh
h
m
h
mB I B Itr
N NE =
β τ β τµ θ τ
− −− − − − −J
( ) *3 2
41
< 0hhmh m
h
B Ia
N
β τη µ τ
−− − − − − .
( )( ) ( ) ( )( )( )( )22 1 4*
33
1et
1D
h h h m
hm mhh
a
kB BHE
N
ϕ η µ µ θ τ µ τ
β β
+ + + − +−=
J
( ) ( )( ) ( )( )20 4 3 2 1 2
* *1 1h m h mm h h mhhR N B I N B Iµ τ β τ µ β τ+ + − + −
( )( ) ( )( ) ( )* 2
2 1 2 3 21 1 12 mh h mh hm mh hN B I Bµ θ τ β τ β β µ τ+ − + − + − +
( ) ( )( ) ( )((22 2 1 1 2
* *1( 1 1h h h hm hmN I B N S B Nµ θ τ θ τ− + − + − +
) ( ) ( ))))1 1 22 2* * * *1 0h mh m h hhS B I S S <µ β τ+ − +
[ ] ( )( ) ( ) ( )(2 *
22*
361
det 1 hm mh hh
mMJ B mN IEN
τ β β= − − −
( ) ( ) ( ) ( )(( 2 20
*2 21 2 1h h h hmgR mN I F N aτ η µ τ− − + + + + −
) ( ) ( )((((*1
*121 1 4mh m mmhB I J V B I B N mh hβ τ β µ µ τ+ − − + + +
( ) ( ) ( )2 30
* * * * *2 2 21 11 ) 1 13 1 1h h m mh m hB I S gR AI B I Sτ β τ β τ− + − + −
( ) ))) ( )( )(* *1 121 2 2 2 41 1mh h h h mm hB I B N S Nβ τ θ τ θ µ µ τ− + − + + +

American Journal of Computational and Applied Mathematics 2015, 5(2): 42-65 55
( )( )) ( ) ( )((* *2 2 1
33 2 1 2 31 1 1h mhm mh hB I B I Y B B B Nτ β β τ τ+ − + − −
( ) ( )( )(2 *212
* *2 1 2m m hhm mh h h h hI mN I S N aβ β θ η τ θ µ− + + + − +
( ) ) ( )( )( )( )(2 0*
021 2 1 1mh h hm hB I N a tR tRτ β η µ+ − + + + −
( )( ) ( )( )( ) ((2*
2 1 211 2 1h h mh h h mmN B B I Nτ θ µ τ β µ µ− + + − + +
) ( )( )) ( )24 3 1 3
* *2 21 1hhm mh hm m mhB I B I Bτ τ β β τ β β+ + − + + −
( ) ( ) ( )( )((* * *2 20 2 2 12 21 1 2m mh hh hmN I gR B I S Nτ τ θ µ− − + − +
( )( ) )( )))* * *2 11 2 1 2 21 0m hmh hB B I B S B S <τ β+ − + +
But
22 1 4
3
( ( )( (1 ))( ))
( )h h h m
mhh h hm
a
k a B BH
ϕ η µ µ θ τ µ τβ
η µ β
+ + + − +=
+ + from (3)
Let
22 1 4
3
( ( )( (1 ))( ))
( )h h h m
h h hm
ag
k a B BH
ϕ η µ µ θ τ µ τ
η µ β
+ + + − +=
+ +
It follows that 20mh gRβ −= where
* 2
1 2 1 4
3
( ( )( (1 ))( ))
( 2 ) ( )
Im h h h m
h h h h h hm
AB at
N a k a B BH
ϕ η µ µ θ τ µ τ
η µ η µ β
+ + + − +=
+ + + +
( ) ( )(( * *1 32 14 1 )Ih h h m h hm hF B N a B Sη µ µ τ τ β= + + + + + − +
( ) ( ) ( )(2 *1 2 4
*2 211 1Imh m h h h h mB S B N aτ β η µ µ τ τ− + + + + + + −
( )) ) ( )( )(** *3 2 2
*212 21 2I Ihm h mh hm h hhB B S B N Sβ β τ θ µ+ − + +
( )( ) ( ) ( )( ))* * *1
*1 2 1 22 1 21 2 1 Ih h mh h m h hB N S B S Sτ θ µ τ β− + + − +
( ) ( )( ) ( )( )(*2 2 22 1 2 11 1 2 1Imh m h hJ B N B Bτ β τ θ µ τ= − − + + − +
) ( ) ( )( ) ( )(( 4 1* *
3 122 1 1I Imh m h h m hm hB N B Bβ µ µ τ τ β τ+ + + − + −
( ) )) ( )(*2 2
*2 2 2 41 hIh m h h h mN B S N aθ τ β η µ µ τ+ − + + + + + + ( ) )*
321 Ihm hBτ β−
( )( ) ( )( )( ) ((1 2*
2 1 21 2 1 Ih h mh m h hV N B B Nτ θ µ τ β µ= − + + − + +
) ( )( ))( )* *4 3 1
* *2 11 2 21 I Im hm h m hh m hB B B S B Sµ τ τ β β+ + − + +
( ) ( ) ( )((3 2 * *12 3 11 1I Ihm mh h m m hY B B mN Nτ β β τ= − − −
56 Laurencia Ndelamo Massawe et al.: Dengue in Tanzania - Vector Control and Vaccination
) ( )( ) ) (((*2 1 22 12 1 Ih mh m h hB B B N aθ µ τ β η+ + − + + +
( ) ) ( ) ( )*1 2 11
*2 2 21 2 1 ) 1Ih mh m hhB S B Nτ θ µ τ β τ− + + − + −
) ( ) ( )( )*24 32
*2 1 Ih h h m hm hhS N a Bθ η µ µ τ τ β+ + + + + + −
Thus, from the lemma 1, the endemic equilibrium *E of the model system (7) is locally asymptotically stable in Ω .
3.6. Global Stability of Endemic Equilibrium Point (EEP)
Theorem 3: If 0R > 1 the endemic equilibrium *E of the model system (1) is globally asymptotically stable.
Proof: To establish the global stability of endemic equilibrium *E we construct the following positive Lyapunov
function V as follows;
( )1 2* * * * * * * *, , , , , ,h h h m m mV S S I T R A Sh h & Ι = 1 2
1 1 1 2 2 21 2
* ** * * *log log
S Sh hS S S S S Sh h h h h hS Sh h
− − + − − +
* * ** * * * * *log log logh h h
h h h h h h h h hh h h
I T RI I I T T T R R R
I T R− − + − − + − − +
* * ** * * * * *log log logm m m
m m m m m m m m mm m m
A S IA A A S S S I I I
A S I− − + − − + − −
Direct calculation of the derivative of V along the solutions of (1) gives,
1 1 1 2 2 2
1 2
* * *h h h
h
S S dS S S dS I I dIdV h h h h h hdt S dt S dt I dth h
− − −= + +
* * *h h h h h h m m m
h h m
T T dT R R dR A A dA
T dt R dt A dt
− − −+ + +
* *m m m m m m
m m
S S dS I I dI
S dt I dt
− −+ +
dV
X Ydt
= − (8)
where
( )2 21 1
1 1 1
** **
1 1 2
2h hh h
h h h h h hS SS S
X N R N RS S Sh h h
µ θ πµ θ θ−
= + + + +
( ) ( ) ( )1 2 11 2 1
1 2 1
2 2 2* * **1 2 1
1 2h h hmh m mh m
h hh h
S S S S S Sh h hB I B IN
N S S N Sh h h
β τ βτ θ πµ
− − −+ + + +
( ) ( )22 2 21 2
2 2
2 2* * *2 2 2
1 2 2
* hmh m mh m
h h
S S S Sh h h I IB I B I m mmh mhB S B Sh hN S N S N Nh h h h
β ββ τ βτ+
− −+ + + +

American Journal of Computational and Applied Mathematics 2015, 5(2): 42-65 57
2 1 1 1
* * ** * *
2 2 1 1 1
*mh m mh m h mh m
h h h h h
I II I I Immh hB S B S B S B Sh h h hN N I N I Nh
β β β βτ + + +
1 1 1
* **
2 1 2 1 2 1m h mh m mh m
h h h h
I I I ImhB S B S B Sh h hN I N N
β β βτ τ τ+ + + +
21 2 2
* * * * ** *
2 1 2 2 2mh m h mh m mh m mh m h
hh h h h h h
I I I I I IB S B S B S B Sh h hN I N N N I
β β β βτ + + +
22 2
* * * ** *
2 2 2 2 2mh m h mh m h mh m h
h h hh h h h h h
I I I I I IB S B S B S Ih hN I N I N I
β β βτ τ η+ + + + +
* * * *
* * * *h h m mh h h h h h m m m m
h h m m
T R A AI T T S I S I
T R A Aη δ δ ϕ ϕ ϕ ϕ+ + + + + +
( ) ( )2 2* * ** * *
5 5m m m m m
m m A m A mh m h m m
A A A A SS I A A
kN A kN A Sϕ ϕ τ η τ η
− −+ + + +
( ) ( )2 2* **3 2 3
3m m m mhm h hm h h
m hmh m h m h
S S S SB I B I IS B
N S N S N
β τ ββ
− −+ + + +
* * * * * *
* * *2 3 3 33
h m h m h m hm hm m hm m hm m hm
h m h m h m h
I I I I I I IS B S B S B S B
N I N I N I Nτ β β β β+ + +
* *
*2 3 2 3 2 3
h m h hm hm m hm m hm
h m h h
I I I IS B S B S B
N I N Nτ β τ β τ β+ + +
( )1 11
1 1
2**1 hmh m
h h h hh h h
S SS hB IhY N N
S N S
βπµ µ
−= − − − −
( ) ( )1 11 1 1
1 1
2 2* * ***2 1
1 11
h h hmh mh h h
h h h
S S S S Sh hB IR R
N S S Sh
τ βµ θ θ
− −− − − −
( ) ( )2 2 2 2 2
2 2 2
* * **2 2
1 2
2 2h h h h hmh m
h hh h h h
S S S S SB IN
S N S S
τ βτ θ πµ
− −− − −
( ) ( ) ( )2 2 2 22 2
2 2 2
2 2* **2
2
2h h h hh hmh m
hh h h h
S SB I
N S
S S S S
S Sβ µ θ
− − −− −
1 2 2
* * * **
1 2 2 2 2mh m h mh m h mh m h
h h hh h h h h h
I I I I I IB S B S B SN I N I N I
β β βτ τ− − − −
1 1 1 1
* * ** *
1 1 1 2 1mh m mh m h mh m
h h h h
II I I ImmhB S B S B S B Sh h h hN N N I Nh
ββ β βτ− − −
58 Laurencia Ndelamo Massawe et al.: Dengue in Tanzania - Vector Control and Vaccination
21 1 1
* * * * ** *
2 1 2 1 2 1 2mh m h mh m h mh m mh m h
hh h h h h h h
I I I I I I IB S B S B S B Sh h hN I N I N N I
β β β βτ τ τ− − − −
2 2 2 2
* * ** *
2 2 2 2 2mh m mh m mh m h mh m
hh h h h h
I I I I IB S B S B S B Sh h hN N N I N
β β β βτ− − − − −
( )( )
( )( )
2
2 2** ** *
2 2
*h h h hmh m h
h h h h h h h hh h h h
I I T TI TB S a I Ih N I T T
βτ µ η η η µ δ
− −− + + − − − +
( )( ) ( )2* ** *
* *1
2Rh h m mRh m
h h h h h m m mh h m h m
R A AAT T S S S
R R A kN Aδ δ µ θ ϕ ϕ ϕ
− −− − − + − − −
( ) ( )( )
( )2 2* * ***
5 3
2m m m m m mm
m m m m A Ah m m h m m
A A A A A AAS I I I
kN A A kN A Aϕ ϕ ϕ ϕ µ τ η τ
− − −− − − − − + +
( ) ( )2* ** ** 3 2 3
5 5
2m m m mm hm h hm h
A m A mm h m h m
S S S SS B I B IA A
S N S N S
β τ βτ η τ η
− −− − − −
( )( )* * *
*4 3 3 3
2m m h m h
m m hm m hm m hmm h m h
S S II I I hS B S B S BS N I N Nh
τ µ β β β−
− + − − −
* * * **
3 2 3 2 3h m h h m
m hm m hm m hmh h h m
I I I I IS B S B S B
N I N N Imβ τ β τ β− − − −
( )( )2** *
* *2 3 2 3 4
m mh m hm hm m hm m
h m h m
I II I IS B S B
N I N Iτ β τ β µ τ
−− − +
Thus from equation (8), if Χ < Υ. Then dVdt
will be negative definite, implying that dVdt
< 0 . It then follows that
dVdt
= 0 if and only if 1 1 2 2
* * *, , ,h hS S S S I Ih h h h= = = * * *, , ,h h h h m mT T R R A A= = = * *andm m m mS S I I= = . Therefore
the largest compact invariant set in 1 2* * * * * * * *, , , , , , , : 0h h h m m m
dVS S I T R A S Ih h dt
∈ Ω = is the singleton *E where *E is the
endemic equilibrium of the model system (1). By LaSalle’s invariant principle, then it implies that *E is globally asymptotically stable in Ω if Χ < Υ . This completes the proof.
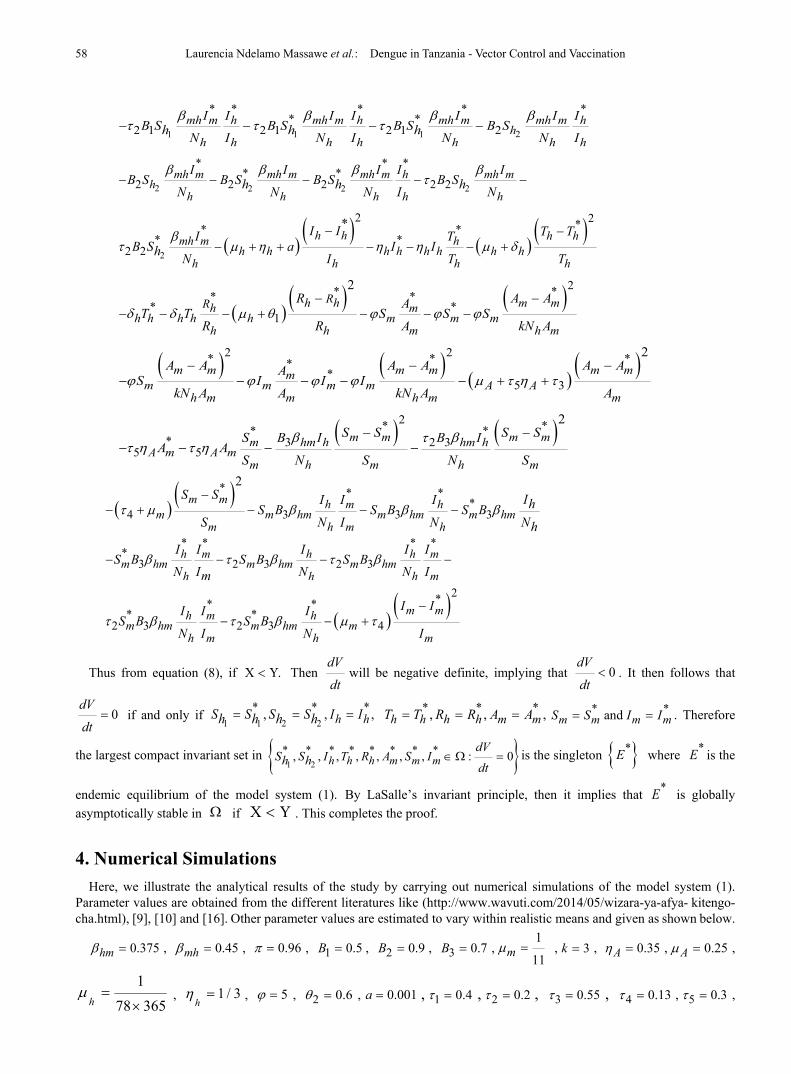
4. Numerical Simulations Here, we illustrate the analytical results of the study by carrying out numerical simulations of the model system (1).
Parameter values are obtained from the different literatures like (http://www.wavuti.com/2014/05/wizara-ya-afya- kitengo- cha.html), [9], [10] and [16]. Other parameter values are estimated to vary within realistic means and given as shown below.
0.375hmβ = , 0.45mhβ = , 0.96π = , 1 0.5B = , 2 0.9B = , 3 0.7B = ,1
11mµ = , 3k = , 0.35Aη = , 0.25Aµ = ,
1
78 365hµ =
×, 1 / 3
hη = , 5ϕ = , 2 0.6θ = , 0.001a = , 1 0.4τ = , 2 0.2τ = , 3 0.55τ = , 4 0.13τ = , 5 0.3τ = ,
American Journal of Computational and Applied Mathematics 2015, 5(2): 42-65 59
0.98hδ = and 1 0.01θ = (9).
Figure 2. Distribution of population with time in all classes of human and mosquito when no control is applied i.e. 1 0τ = , 2 0τ = , 3 0τ = ,
4 0τ = , 5 0τ = , 1hδ =
Figures 2 show the distribution of population with time in all classes of human and mosquito when no control is applied. Figures 2 show the human and mosquito populations in the absence of any control. The human infection reaches a peak
between the 2th and the 20th day. The infection of the mosquitoes reaches a peak between the 10th and the 30th day. The total number of infected humans obtained from System (1) is higher than observations in Tanzania. The difference is due to the absence of the data in the whole country of Tanzania [17].
Figures 3 (i)-(ii) show the variation of infected human and mosquito populations with combine use of all five controls as shown: 1 2 3 4 5 0A τ τ τ τ τ= = = = = = , 1 2 3 4 5 0.25B τ τ τ τ τ= = = = = = ,
1 2 3 4 5 0.50C τ τ τ τ τ= = = = = = , 1 2 3 4 5 0.75D τ τ τ τ τ= = = = = = ,
0 10 20 30 40 50 60 70 80 90 1000
200
400
600
800
1000
1200
1400
1600
1800
2000
Time(days)
num
ber o
f ind
ivid
uals
sh1
sh2
ihthrh
0 10 20 30 40 50 60 70 80 90 1000
0.5
1
1.5
2
2.5x 10
4
Time(days)
num
ber o
f mos
quito
es
am
smim
60 Laurencia Ndelamo Massawe et al.: Dengue in Tanzania - Vector Control and Vaccination
1 2 3 4 5 1E τ τ τ τ τ= = = = = =
(i)
(ii)
Figure 3. (i)-(ii): Variation of infected human and mosquito populations with combine use of all five controls
From figure 3 (i)-(ii), it is observed that when all the controls are used, the disease is eradicated.
5. Formulation of the Model with Vaccination In this section, we develop a deterministic model that describes the dynamics of Dengue fever under application of
Vaccination and treatment for humans where 1
Sh is the careful human susceptible population,
2hS
is the careless human
susceptible population, Vh is the vaccinated human population, hI is the infected human population, hT is the treated
0 10 20 30 40 50 60 700
2
4
6
8
10
12
Time(Years)
I h
A =0B=0.25 C=0.50D=0.75E=1
0 10 20 30 40 50 60 700
10
20
30
40
50
60
Time(Years)
I m
A =0B=0.25 C=0.50D=0.75E=1

American Journal of Computational and Applied Mathematics 2015, 5(2): 42-65 61
human population and hR is the recovered human population, ϑ is the fraction of the vaccinated careful human susceptible, χ is the proportional rate at which vaccinated careful human susceptible loses effect, ω is the reaction of the vaccinated careless human susceptible, ρ is the proportional rate at which vaccinated careless human susceptible loses effect, σ is the proportion of the vaccinated new born, φ is the infection rate of vaccinated careful human susceptible and ε is the infection rate of vaccinated careless human susceptible. Susceptible individuals acquire Dengue fever through the
bite of female Aedes mosquito with force of infections given by 11
mmh h
h
IB SN
β , and
22m
mh hh
IB SN
β where 2 1>B B .
Considering the above clarification, we then have the following schematic model flow diagram for dengue fever disease with vaccination:
Figure 5. Model Flow diagram for dengue fever disease with vaccination
From the above flow diagram, the model will be governed by the following equations [17]:
( ) ( )11 1 21 1 21 m
h h mh h h hh
dS IhN B S S R S Vh h hdt N
π µ β µ ϑ θ θ χ= − − − + + + +
( )22 22 2
mh h mh h h
h
dS IhN B S S Vh hdt N
πµ β µ θ ω ρ= − − + + +
( ) ( )2 1 2h
h mh h h h mh h
h
dV IN S S V B B Vh hdt N
σµ ϑ ω χ ρ µ φ ε β= + + − + + − +
( ) ( ) ( )1 21 2 1 2
h m mmh mh h h h h
h h
dI I IB S B S B B V a Ih hdt N N
β φ ε β µ η= + + + − + +
( )hh h h h h
dTI T
dtη µ δ= − + , ( )1
hh h h h
dRT R
dtδ µ θ= − + (10)
Mass vaccination generates the possibility of eliminating or eradication the infectious disease [18]. The more vaccinated
people, the less likely a susceptible person will come into contact with the infection. With the introduction of a vaccine, the SITRS model related to the human population changes to the SVITRS model. Vaccination is continuous with a constant proportion σ of vaccinated new born. A fraction ϑ and ω of careful and careless susceptible is vaccinated respectively. The vaccination reduces but does not eliminate susceptibility to infection. For this reason, we consider the
62 Laurencia Ndelamo Massawe et al.: Dengue in Tanzania - Vector Control and Vaccination
infection rate of vaccinated people: when 0φ ε= = the vaccine is perfect and when 1φ ε= = the vaccine has no effect at all. The vaccination loses effectiveness at a rate χ and ρ careful and careless susceptible respectively [17].
5.1. Model Simulation Here, we perform numerical simulations of the model system (11) using the set of estimated parameter values. Parameter
values are obtained from the different literatures like (http:/e/www.wavuti.com/2014/05/wizara-ya-afya-kitengo-cha.html), [9], [10], [16], other parameter values are estimated to vary within realistic means and given as 0.375hmβ = ,
0.45mhβ = , 0.96π = , 1 0.5B = , 2 0.9B = , 3 0.7B = , 1
11mµ = , 3k = , 0.35Aη = , 0.25Aµ = , 1
78 365hµ =
×,
1 / 3h
η = , 5ϕ = , 2 0.6θ = , 0.001a = , 0.85ϑ = , 0.75χ = , 0.82ω = , 0.30ρ = , 0.16σ = , 0.25φ = , 0.70ε = ,
0.98hδ = and 1 0.01θ = . Figures 4 show the variation of infected human populations with different levels of infection rate of vaccinated careful
human susceptible φ , infection rate of vaccinated careless human susceptible ε , fraction of the vaccinated careful human susceptible ϑ and fraction of the vaccinated careless human susceptible ω .
From figure 4 we vary infection rate of vaccinated careful susceptible φ , infection rate of vaccinated careless human susceptible ε , fraction of the vaccinated careful human susceptible ϑ and fraction of the vaccinated careless human susceptible ω , and it is observed that the effectiveness of the vaccine reduces the disease spread.
0 5 10 15 20 25 30 35 40 45 501
2
3
4
5
6
7
8
Time(Years)
Infe
cted
hum
an p
opul
atio
n
φ=0φ=0.35φ=0.75φ=1

American Journal of Computational and Applied Mathematics 2015, 5(2): 42-65 63
0 5 10 15 20 25 30 35 40 45 501
2
3
4
5
6
7
8
Time(Years)
Infe
cted
hum
an p
opul
atio
n
ε=0ε=0.35ε=0.75ε=1
0 5 10 15 20 25 30 35 40 45 501
2
3
4
5
6
7
Time(Years)
Infe
cted
hum
an p
opul
atio
n
ν=0ν=0.35ν=0.75ν=1

64 Laurencia Ndelamo Massawe et al.: Dengue in Tanzania - Vector Control and Vaccination
Figure 4. Variation of infected human populations with different levels infection rate of vaccinated careful human susceptible φ , infection rate of
vaccinated careless human susceptible ε , fraction of the vaccinated careful human susceptible ϑ and fraction of the vaccinated careless human susceptible ω
6. Conclusions A compartmental model for Dengue fever disease was
presented, The was model based on campaign of educating Careless human susceptible 1τ , control vector human
contact 2τ , reducing vector breeding areas 3τ , and
insecticide application 4τ , control maturation rate from
larvae to adult 5τ and treatment. The results show that Treatment and the controls on the transmission of dengue fever disease will have a positive effect on decreasing the growth rate of dengue fever disease. Then also shows that when 0φ ε= = the infected human population decrease and when 1φ ε= = the infected human population increase.
REFERENCES [1] Rodrigues, H.S., Monteiro, M.T.T., Torres, D.F.M., and
Zinober, A., 2010, Control of dengue disease Computational and Mathematical Methods in Science and Engineering, 816–822.
[2] Okosun, K.O., and Makinde, O.D., 2013, Optimal Control Analysis of Malaria in the Presence of Non-Linear Incidence
Rate, Appl. Comput. Math 12(1)20-32.
[3] Evans, T.P.O., and Bishop, S.R., 2014, A spatial model with pulsed releases to compare strategies for the sterile insect technique applied to the mosquito Aedes aegypti, Mathematical Biosciences 254, 6–27.
[4] Aldila, D., Götz, T., and Soewono, E., 2013, An optimal control problem arising from a dengue disease transmission model. Mathematical Biosciences 24, 9–16.
[5] Thome, R.C.A., Yang, H.M., and Esteva, L., 2010, Optimal control of Aedes aegypti mosquitoes by the sterile insect technique and insecticide. Math. Biosci. 223, 12-23.
[6] Wijayaa, K.P., Goetzb, T., Soewonoa, E., and Nurainia, N., 2013, Temephos spraying and thermal fogging efficacy on Aedes aegypti in homogeneous urban residences, ScienceAsia 39, 48–56.
[7] Lashari, A.A., Hattaf, K., Zaman, G., and Li, Xue-Zhi., 2013, Backward bifurcation and optimal control of a vector borne disease. Appl. Math. Inf. Sci. 7(1), 301-309.
[8] Fister, K.R., McCarthy, M.L., Oppenheimer, S.F., and Collins, C.,2013, Optimal control of insects through sterile insect release and habitat modification. Mathematical Biosciences 244, 201–212.
[9] Massawe, L.N., Massawe, E.S., and Makinde, O.D., 2015, Temporal model for dengue disease with treatment. Advances in Infectious Diseases, 5, 21-36.
[10] H.S. Rodrigues, M.T.T. Monteiro, and D.F.M. Torres,
0 5 10 15 20 25 30 35 40 45 501
2
3
4
5
6
7
Time(Years)
Infe
cted
hum
an p
opul
atio
n
ω=0ω=0.35ω=0.75ω=1

American Journal of Computational and Applied Mathematics 2015, 5(2): 42-65 65
Sensitivity Analysis in a Dengue Epidemiological Model. Conference Papers in Mathematics, 2013.
[11] Driessche, P van den., and Watmough J., 2002, “Reproduction numbers and sub-threshold endemic equilibria for compartmental models of disease transmission,” Mathematical Biosciences, 180, 29–48.
[12] Ozair, M., Lashari, A.A., Jung, Il Hyo., Seo, Y. Il., and Kim, B.N., 2013, Analysis of a Vector-Borne Disease with Variable Human Population. Research Article Stability, 1-12.
[13] J.P. LaSalle, the Stability of Dynamical Systems, Regional Conference Series in Applied Mathematics, SIAM, Philadelphia, Pa, USA, 1976.
[14] Lee, K.S. and Lashari, A.A. (2014). Global Stability of a
Host-Vector Model for Pine Wilt Disease with Nonlinear Incidence Rate Abstract and Applied Analysis, 1-11.
[15] McCluskey, C.C., and Driessche, P van den. (2004). Global analysis of tuberclosis models, Journal of Differential Equations, 16, 139–166.
[16] Dumont, Y., Chiroleu, F., and Domerg, C., 2008, “On a temporal model for the Chikungunya disease: modelling, theory and numerics,” Mathematical Biosciences, 213(1), 80–91.
[17] H.S. Rodrigues, M.T.T. Monteiro and D.F.M Torres, Dengue in Cap e Verde: Vector control and vaccination, 2012.
[18] C. Farrington, on vaccine efficacy and reproduction numbers. Mathematical, 2003.