Demystifying global warming Some basic observations for international students JN Birchall ‘Global...
35
Demystifying global warming Some basic observations for international students JN Birchall ‘Global Warming Update’,
-
Upload
prosper-warren -
Category
Documents
-
view
215 -
download
0
Transcript of Demystifying global warming Some basic observations for international students JN Birchall ‘Global...

Demystifying global warming
Some basic observations for international students
JN Birchall
‘Global Warming Update’,

• The greenhouse effect• Making predictions … and some possible
surprises• What are the predictions?• Past trends in climate• Debates on the ‘climate change’ problem• Policy advice
Supplementary materials:• Exercise on observations of recent climate
change• Information sources and ideas

The greenhouse effect


More gas!
Concentrations of greenhouse gases are higher now than at any time for the past 500,000 years
381
‘Natural’ CO2 conc.

Making predictions
• How are predictions made?
• What are the sources of uncertainty?
• Can we trust climate models?
• What factors do models include?
• Are there major sources of uncertainty not accounted for?

Basis of climate change predictions
Socio-economic scenarios
Greenhouse gas emissions
Greenhouse gas concentrations
Predicted temperature change
Uncertainty
V. large
Large
Moderate
Moderate

CO2 in SRES scenarios (SRES, 2000)
IPCC 2001 http://www.grida.no/climate/ipcc_tar/wg1/figspm-5.htm
Activity: Explore the IPCC scenarios and discuss their relative likelihood and/or policies which would see them fulfilled

GCM structure
Climate Research Unit, UEA
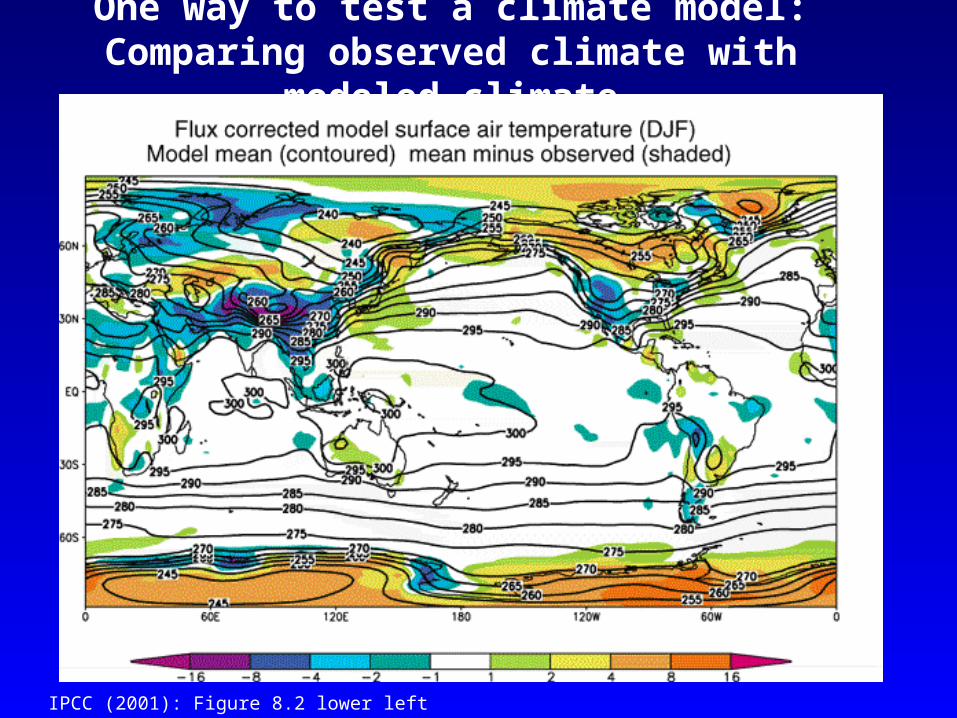
One way to test a climate model: Comparing observed climate with modeled climate
IPCC (2001): Figure 8.2 lower left

Major change to predictions from
similar GHG scenarios
(1996 cf. 1990)

Some possible surprises….
• Methane hydrates (oceans 9500 Gt, permafrost 400 Gt)
• Carbon cycle: strength of ocean and terrestrial ‘sinks’
• Ocean circulation: the ‘thermohaline conveyor’

NASA Earth Observatory
http://earthobservatory.nasa.gov/Newsroom/NasaNews/2001/200112106303.html
Activity: If 10% of methane hydrates were released, how does this compare with anthropogenic sources?
Methane hydrates stored in oceans and permafrost

Woods Hole research Center (2004) http://www.whrc.org/carbon/missingc.htm
Will natural sinks persist?
Activity: Evaluate the impact of the decrease/loss of the oceanic and/or terrestrial carbon sink on global carbon flux

Temperature change following shutdown of the North Atlantic conveyor (Vellinga and Wood, 2002. Climatic Change 54: 251-267)
Likelihood of decline in MOC - from a survey of scientists in the RAPID programme
http://www.soc.soton.ac.uk/rapid/sci/pdf/ann_mtg_survey.pdf
Activity: To what extent should adaptation policy be formed by the possibility of North Atlantic conveyor shutdown?

What are the predictions?
• Range• Regional patterns
• Changing ideas• Seasonality

IPCC(2001) Fig 9.14

IPCC (2001) Fig 9.10d.Multimodel ensemble annual temperature change 2071-2100 - 1961-1990Shading - temp change, Blue lines - range oC, green - mean change/mean sd

IPCC (2001) Fig 9.11d.Multimodel ensemble annual precipitation % change 2071-2100 - 1961-1990Shading - mean change, red lines - range, green - mean change/mean sd

IPCC reports- evolving predictions of climate change
Year Global temp Sea level
rise oC rise cm
1990 3.0 (1.5-4.5) 65
1995 2.0 (1.0-3.5) 48 (13-94)
2001 1.4-5.8 9-88
No best guesses

Seasonality can be more important than net change - e.g. UK precipitation (UKCIP02) www.ukcip.org.uk
2020s 2050s 2080s

Past trends in climate• Is there a trend in
global climate change?
• How do current temperatures compare with those in the past?
Frost fair on the River Thames (1814)
How much has global temperature risen over the past 100 years?

20001994
1989
Timing of IPCC report preparation
Activity(s): Are current trends in climate consistent with predictions for the future? See file.

Global temperature reconstructions for last 1000 years: are we now outside the range of “natural” variability?
1st IPCC report (1990)Note: no T scaleNote: no T scale
“no”
3rd IPCC report (2001)
based partly on using multi-proxy palaeoclimate data - the “hockey-stick” curve
probably “yes”

Is the hockey stick still valid?Multiple “spaghetti curves” now published
• larger changes than original hockey stick
• still show the late C20th as the warmest period of the last millennium
• how critical is this anyway to the case for human-induced warming?

DEBATES• There is genuine broad (although not
100%) consensus in the climate science community on main issues
• Argument, scepticism and hypothesis testing are at the heart of good science
• Publication of research, review and quality control are essential in this process

Arguments of ‘climate sceptics’
• Trends. There is no significant trend in global temperature (e.g. urban heat island effect, geographic coverage of data)
• Attribution. Human activities are not responsible for observed trends
• Impacts. The negative impacts of predicted climate change are over-estimated; cost-benefit analysis does not support mitigation action

Trendse.g. Urban heat island
Sources:
http://antwrp.gsfc.nasa.gov/apod/ap040822.html
http://data.giss.nasa.gov/gistemp/2005/
Activity: Compare temperature records from urban and rural areas in the UK – is there a systematic difference and how big is it?

Attribution
Observed changes are:
• within natural variability
• due to other effects (e.g. solar variability)
IPCC (2001) Figure 4 from SPM. Model outputs using natural (solar, volcanic) and anthropogenic (GHGs, aerosols) climate forcing

Impacts scepticsThe costs of mitigating climate change are greater than the benefits gained from adapting to change
Best exemplified by Bjorn Lomborg in ‘the skeptical environmentalist’
Activities:
How accurate are estimates of costs and benefits likely to be?
Economic costing does not include costs to natural systems – does this matter?

Science, consensus and debate
Consensus Consensus ScepticScepticSupporterSupporter
Contrasting reading - Fact vs fiction? Is the distinction clear?
Activity: Take extracts from the above (or use www sites) and identify differences in style, language, use of documentation, nature of documentation

International policy – is scientific advice followed?
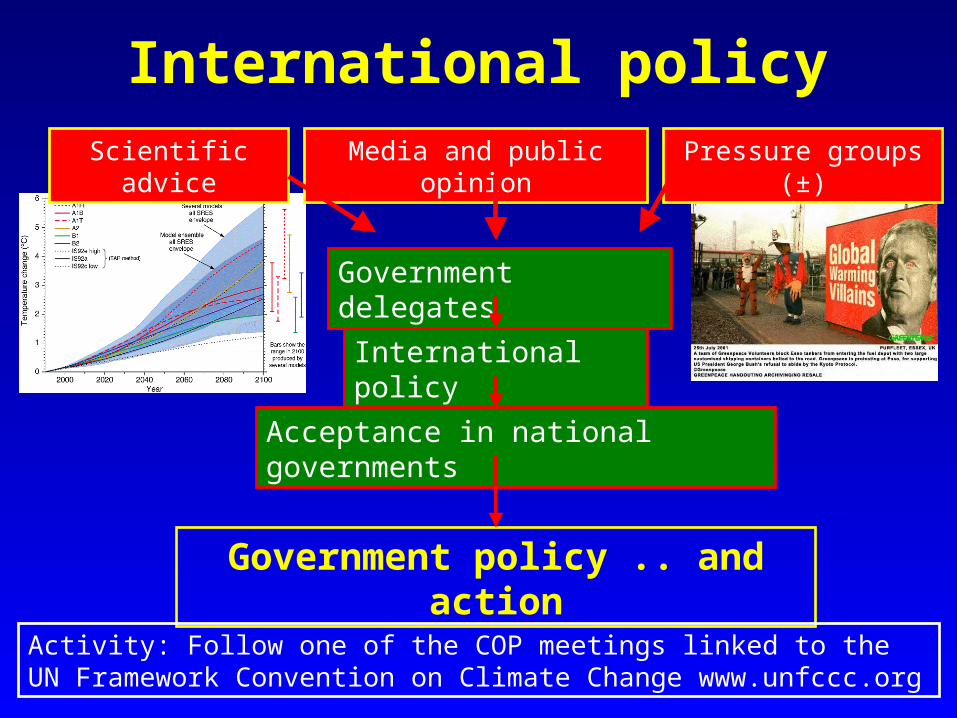
International policyScientific advice Pressure groups (±)Media and public opinion
International policy
Government delegates
Acceptance in national governments
Government policy .. and action
Activity: Follow one of the COP meetings linked to the UN Framework Convention on Climate Change www.unfccc.org
What are ‘desirable’ levels of future climate change?
Defined by:• Global temperature (+2oC?)• Global emissions (2.5 Gt C fossil fuels pa?)• Atmospheric concentration (450-550 ppm CO2?)• Timescale
e.g. UK RCEP (2002) Suggest 60% reduction on 1990 CO2 emissions by 2050 for UK
Compare with:– Kyoto target of c. 5.2% by 2008-2012 for Annex 1 countries– UK Government target of 20% by 2010 (and may hit 10%....)

Use the graph below from the RCEP Energy report as a starting point for debating questions such as:
Which parts of the world are the biggest contributors to climate change?
Should targets for reductions be based on current total contributions, per capita emissions or perhaps emissions per GDP?