Demystifying Communication in a Digital World: Social Media 101
31
Demystifying Communication In a Digital World Social Media 101 Shonali Burke, ABC Presented at Goodwill Industries International’s 2009 Summer Learning Event
-
Upload
shonali-burke -
Category
Education
-
view
1.976 -
download
1
Transcript of Demystifying Communication in a Digital World: Social Media 101

Demystifying Communication In a Digital World
Social Media 101
Shonali Burke, ABCPresented at Goodwill Industries International’s
2009 Summer Learning Event

Media Through the Ages
Image: Alibaba.com
© Imagesofanthropology.com
Image: Library of Congress
“Modern” Age Milestones
1600s: ads appear in English weekliesJune 1836: La Presse first to include paid advertising
in its pages20th Century: Women enter the business1920s: Sponsored programming on radio, carries
over to TV in the ’50s1960s: Creativity and the “USP” enter the game1980s/90s: MTV makes ads the focus, Internet
marketing appears21st Century: Interactive, contextually relevant ads

“Old” Media Trends
• Newspaper circulation 16% (1997-2007)1
• Radio listening 14% over last 10 years2
• Magazine readership 5% over last 5 years3
• OOH spends 7% over last year4
• TV usage at an all-time high: 142:29 hours per month on average5
• Cable TV/Satellite use: more than 65% of US HHs6
• Ad spends 2-3% in 2008 v. 4-8% forecast7
1 Newspaper Association of America 2 Arbitron 3 MRI Fall Studies 4 Outdoor Advertising Association of America 5 6 Nielsen 7 NPR Interview with Jack Myers

“New” Media Trends
• Average time on Internet: 27 hrs per month1
• 86% of employed Americans use the Internet2
• Share of adult Internet users on social networking sites from 8% - 35% (2005-2008)3
• Video consumption on mobile/Internet devices between 2 & 4 hrs per month4
• Internet ad spends 15.2% since last year5
o #1: Search advertisingo #2: Display bannerso #3: Classifieds1 4 Nielsen 2 3 Pew Research 5 PriceWaterHouse Coopers
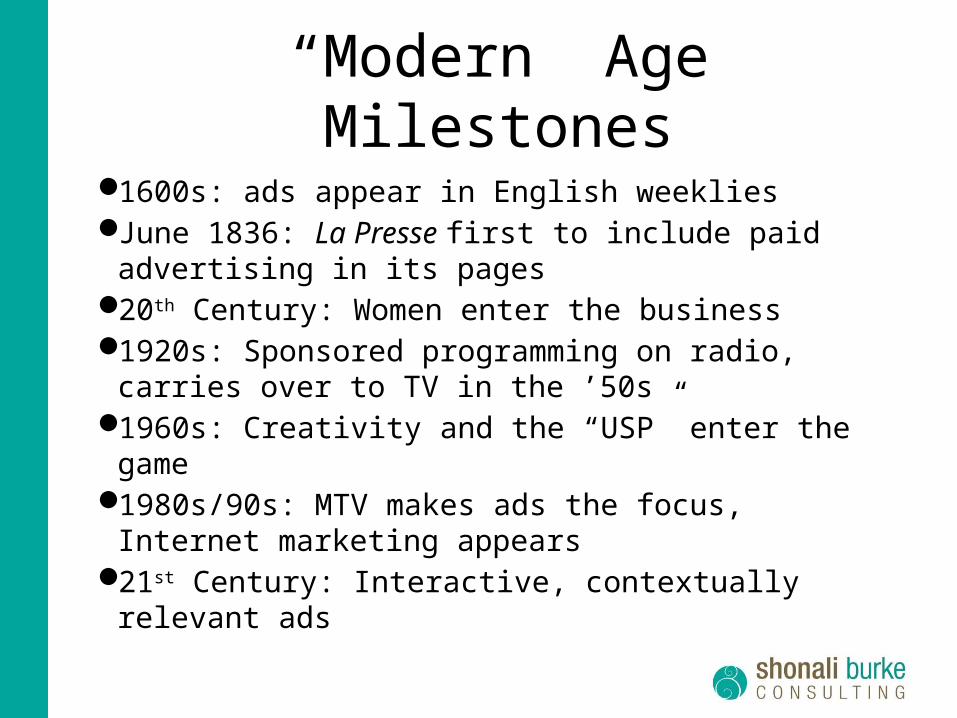
Public Relations Trends
• Between 1990 & 2001:o PR sector grew more than 3 times faster than
advertising1
• Between 1990 & 2007:o PR “body count” 44%2
o Advertising “body count” 14%3
• Social marketing is on the rise• Social media is here to stay1 2 3 PRWeek

The Millennials Are Here
Source: Pew Research
Image: http://www.flickr.com/photos/matthamm/2945559128/

Cartoon: http://www.flickr.com/photos/hubspot/3196650975/
The Shiny New Toy
Photo: http://www.flickr.com/photos/fsamuels/3323431435/

LinkedIn• Update profile• Status updates• Groups• Recommendations• Q&A• Blog Integration

Facebook• Grow “fans”• Post regularly• Engage• Encourage action• Causes• Integrate Twitter feed, blog posts, Flickr

Flickr• Smart tagging• Groups• Sets• Integrate with other networks

YouTube

Twitter• Two-way conversation• “Listen” (monitor)• Respond• Participate• Research• Engage• Customer service• Quality v. quantity

“The More Things Change, The More They Stay The Same”

Do You Know Your Audience?

What Are Your Measurable Objectives?

Are Your Communications Integrated?

Do You See Communication As A Business Function?

Are You Listening?
Image: Hulag

Pledge To End Hunger
Source: www.pledgetoendhunger.com

GoalsRaise awareness of childhood
hunger in USGive people tools to take actionNon-profit case study on SM &
cause marketing
Metrics# of pledge signees
$$ raised for Share Our Strength
Unique site visitors, Tr.im url click-thrus, Facebook
cause members, YouTube videos viewed,
#HungerPledge usage, SXSWi podium mentions
AudienceActive Twitterati, bloggers
SXSWi attendees & followers
Corporate/non-profit email databases
Wild cards: 2-3 degrees of separation
Courtesy: Scott Henderson

Story
•1 of 6 kids hungry
•1 click feeds 140 kids
Strategy
•Standalone site online hub
•SM outposts•Easy call to
action
Tactics
•2 “co-chairs,” 50+ “champions”
•Twitter, Facebook, YouTube accounts
•Email•Avatar,
hashtag, badges
•CTA: give, volunteer and/or share
Courtesy: Scott Henderson

Results
• > 4,600 pledges• > 19,000 site visitors• $28K for Share Our
Strength (@95% 1st-time donors)
• 2,600 members of Facebook Cause
Courtesy: Scott Henderson

KPIs Business Objectives
0
50,000,000
100,000,000
150,000,000
200,000,000
250,000,000
300,000,000
350,000,000
Janu
ary
Febru
ary
Mar
chApr
ilM
ayJu
ne July
Augus
t
Septe
mbe
r
Octobe
r
Novem
ber
Decem
ber
Exp
osur
e
0
100,000
200,000
300,000
400,000
500,000
600,000
700,000
Web
site
vis
itors
Overall exposure Web traffic
Courtesy: KD Paine & Partners
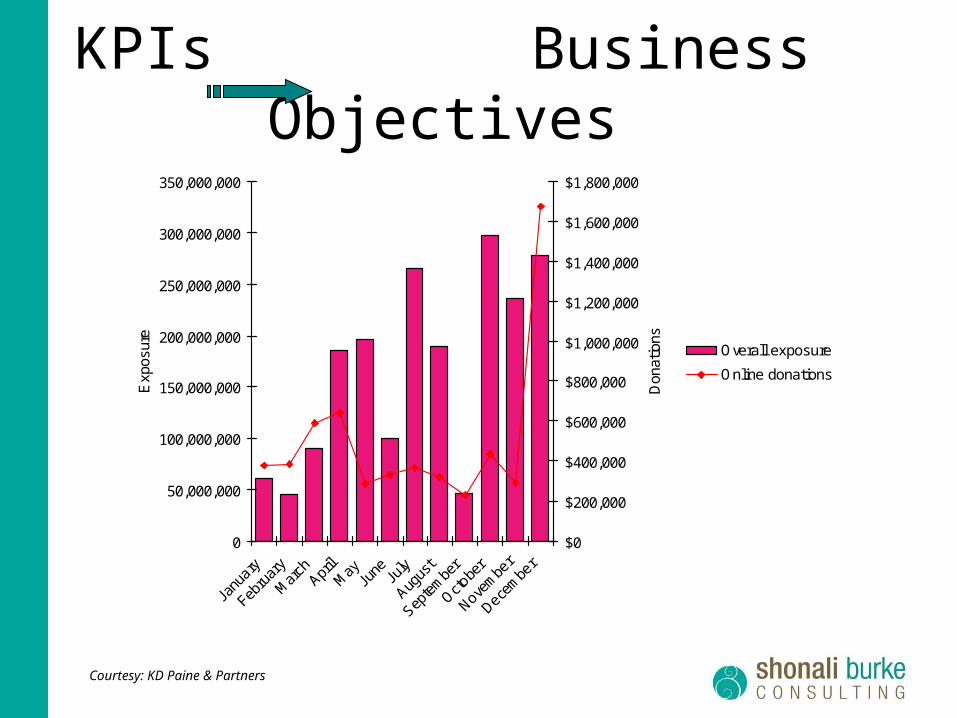
KPIs Business Objectives
0
50,000,000
100,000,000
150,000,000
200,000,000
250,000,000
300,000,000
350,000,000
Janu
ary
Febru
ary
Mar
chApr
ilM
ayJu
ne July
Augus
t
Septe
mbe
r
Octobe
r
Novem
ber
Decem
ber
Exp
osur
e
$0
$200,000
$400,000
$600,000
$800,000
$1,000,000
$1,200,000
$1,400,000
$1,600,000
$1,800,000
Don
atio
ns
Overall exposure
Online donations
Courtesy: KD Paine & Partners

The Seven Basic Steps*• Identify your audiences• Define objectives for each audience• Define your measurement criteria• Define your benchmark• Select a measurement tool• Analyze data, draw actionable conclusions,
make recommendations• Make changes, measure again
*Measuring Public Relationships, Katie Delahaye Paine

Measuring Social Media
EngagementQuantity
Influence QualityPhoto: http://www.flickr.com/photos/base53/3665260292/ Photo: http://www.flickr.com/photos/goincase/3771760999/

Key Performance Indicators• Track effectiveness
of your program against business objectiveso Saleso Donationso Membershipo Web traffico Subscribers

The Shiny New Toy Is…
• No longer a toy• Here to stay• An integral part of 21st century communications• What you make of it
Photo: http://www.flickr.com/photos/fsamuels/3323431435/

Questions?
Thank you!
You can find me at:E-mail: [email protected]: http://www.twitter.com/shonaliBlog: www.WaxingUnLyrical.comWeb: www.shonaliburke.comSkype: sburke15
Photo: http://www.flickr.com/photos/27546063@N03/3717938304/