Demystifying Chinese Investment in Australia (June...
44
Demystifying Chinese Investment in Australia June 2018 KPMG.com.au ISSN 2203-2037
-
Upload
nguyenhuong -
Category
Documents
-
view
220 -
download
0
Transcript of Demystifying Chinese Investment in Australia (June...
Demystifying Chinese Investment in Australia
June 2018
KPMG.com.au
ISSN 2203-2037
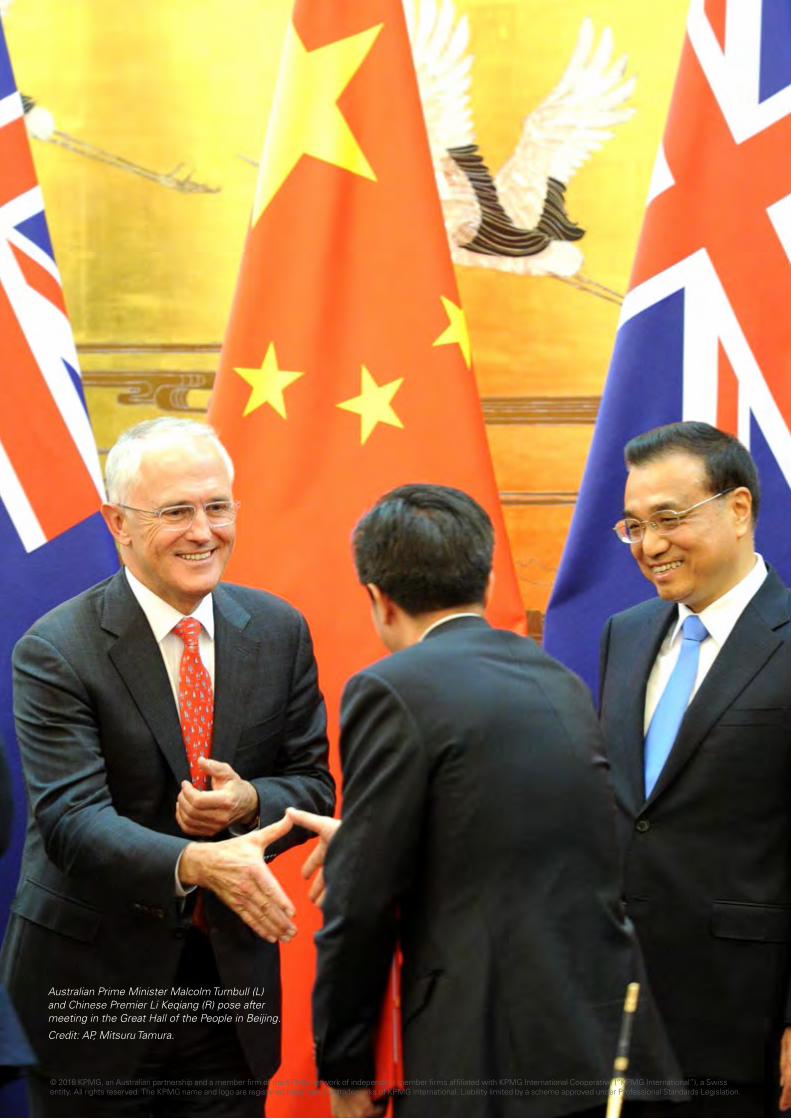
Australian Prime Minister Malcolm Turnbull (L) and Chinese Premier Li Keqiang (R) pose after meeting in the Great Hall of the People in Beijing.
Credit: AP, Mitsuru Tamura.
© 2018 KPMG, an Australian partnership and a member firm of the KPMG network of independent member firms affiliated with KPMG International Cooperative (“KPMG International”), a Swiss entity. All rights reserved. The KPMG name and logo are registered trademarks or trademarks of KPMG International. Liability limited by a scheme approved under Professional Standards Legislation.
Demystifying Chinese Investment in Australia | June 2018 3
About our reportsKPMG and The University of Sydney formed a strategic relationship to publish research and insights on doing business with Chinese investors. Our first report was launched in September 2011 and this is the fourteenth Demystifying Chinese Investment report in our series. This report examines Chinese investment in Australia for the calendar year 2017 and incorporates the latest Chinese Investors in Australia Survey. This special edition provides timely, new insights into the perceptions of the Australian investment climate by Chinese investors as well as the key challenges they feel they face in Australia.
The catalyst for our report series was the lack of detailed factual information about the nature and distribution of China’s outbound direct investment (ODI) in Australia. Without this information, there is misinformation and speculation. Our reports seek to set the record straight and debunk the myths associated with Chinese investment in this country.
MethodologyThe dataset is compiled jointly by KPMG and The University of Sydney Business School and covers investments into Australia made by entities from the People’s Republic of China through mergers and acquisitions (M&A), joint ventures (JV) and greenfield projects. Jones Lang LaSalle (JLL) has provided data and analysis on real estate transactions in the 2017 calendar year. ‘Real estate’ referred to in this report does not include residential apartment and private home sales.
The dataset also tracks Chinese investment by subsidiaries or special purpose vehicles in Hong Kong, Singapore and other locations. The data, however, does not include portfolio investments, such as the purchase of stocks and bonds, which do not result in foreign management, ownership or legal control.
Our database includes direct investments recognised in the year in which parties enter into legally binding contracts and if necessary, receive mandatory Foreign Investment Review Board (FIRB) and Chinese Government investment approvals. In certain instances, final completion and financial settlement may occur in a later year.
For consistency, the geographic distribution is based on the location of the head office of the Australian invested company and not on the physical location of the actual investment project. Completed deals which are valued below USD 5 million are not included in our analysis, as such deals consistently lack detailed, reliable information.
Unless otherwise stated, the data referred to throughout this report is sourced from the KPMG/University of Sydney database, and our previously published reports.1 The University of Sydney and KPMG team obtains raw data on China’s ODI from a wide variety of public information sources which are verified, analysed and presented in a consistent and summarised fashion. Our sources include commercial databases, corporate information, and official Australian and Chinese sources including the Australian Bureau of Statistics, FIRB and Ministry of Commerce (MOFCOM) of the People’s Republic of China.
Our data is regularly updated and continually revised when new information becomes available. In line with international practice, we traditionally record deals using USD as the base currency. However, since 2015 our reports have used AUD for detailed analysis.
We believe that the KPMG/University of Sydney dataset contains the most detailed and up-to-date information on Chinese ODI in Australia.
1 Includes Australia & China Future Partnership, September 2011; The Growing Tide: China ODI in Australia, November 2011; Demystifying Chinese Investment, August 2012; The Energy Imperative: Australia-China Opportunities, 25 September 2012; Demystifying Chinese Investment in Australia, March 2013; Demystifying Chinese Investment in Australian Agribusiness, October 2013; Demystifying Chinese Investment in Australia, March 2014; Demystifying SOE Investment, August 2014; Chinese Investors in Australia Survey, November 2014; Demystifying Chinese Investment in Australia, May 2015 Update; Demystifying Chinese Investment in Australia, April 2016; Demystifying Chinese Investment in Australia, May 2017; Demystifying Chinese Investment in Australian Healthcare, January 2018.
© 2018 KPMG, an Australian partnership and a member firm of the KPMG network of independent member firms affiliated with KPMG International Cooperative (“KPMG International”), a Swiss entity. All rights reserved. The KPMG name and logo are registered trademarks or trademarks of KPMG International. Liability limited by a scheme approved under Professional Standards Legislation.
4 Demystifying Chinese Investment in Australia | June 2018
Key findings
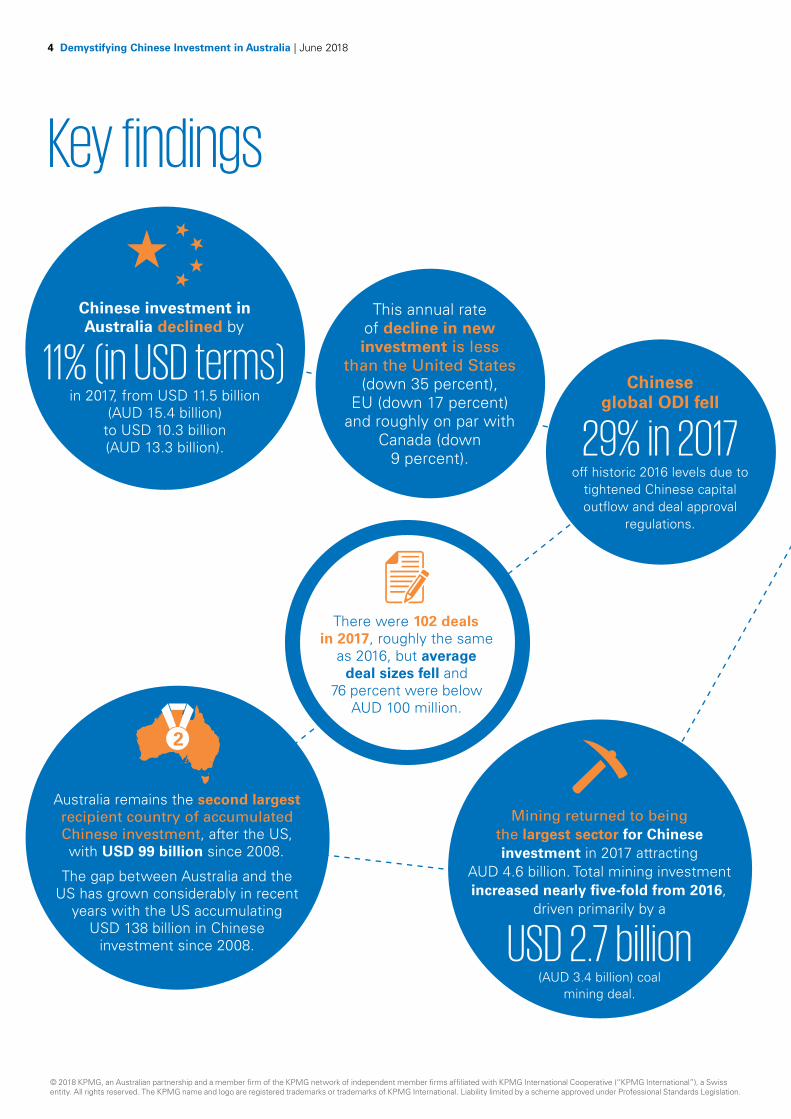
This annual rate of decline in new investment is less
than the United States (down 35 percent),
EU (down 17 percent) and roughly on par with
Canada (down 9 percent).
Chinese global ODI fell
29% in 2017 off historic 2016 levels due to
tightened Chinese capital outflow and deal approval
regulations.
There were 102 deals in 2017, roughly the same
as 2016, but average deal sizes fell and
76 percent were below AUD 100 million.
Australia remains the second largest recipient country of accumulated Chinese investment, after the US, with USD 99 billion since 2008.
The gap between Australia and the US has grown considerably in recent
years with the US accumulating USD 138 billion in Chinese
investment since 2008.
Mining returned to being the largest sector for Chinese investment in 2017 attracting
AUD 4.6 billion. Total mining investment increased nearly five-fold from 2016,
driven primarily by a
USD 2.7 billion
(AUD 3.4 billion) coal mining deal.
Chinese investment in Australia declined by
11% (in USD terms)in 2017, from USD 11.5 billion
(AUD 15.4 billion) to USD 10.3 billion (AUD 13.3 billion).
© 2018 KPMG, an Australian partnership and a member firm of the KPMG network of independent member firms affiliated with KPMG International Cooperative (“KPMG International”), a Swiss entity. All rights reserved. The KPMG name and logo are registered trademarks or trademarks of KPMG International. Liability limited by a scheme approved under Professional Standards Legislation.
Demystifying Chinese Investment in Australia | June 2018 5
2 http://demystifyingchina.com.au/reports/demystifying-chinese-investment-2018.pdf
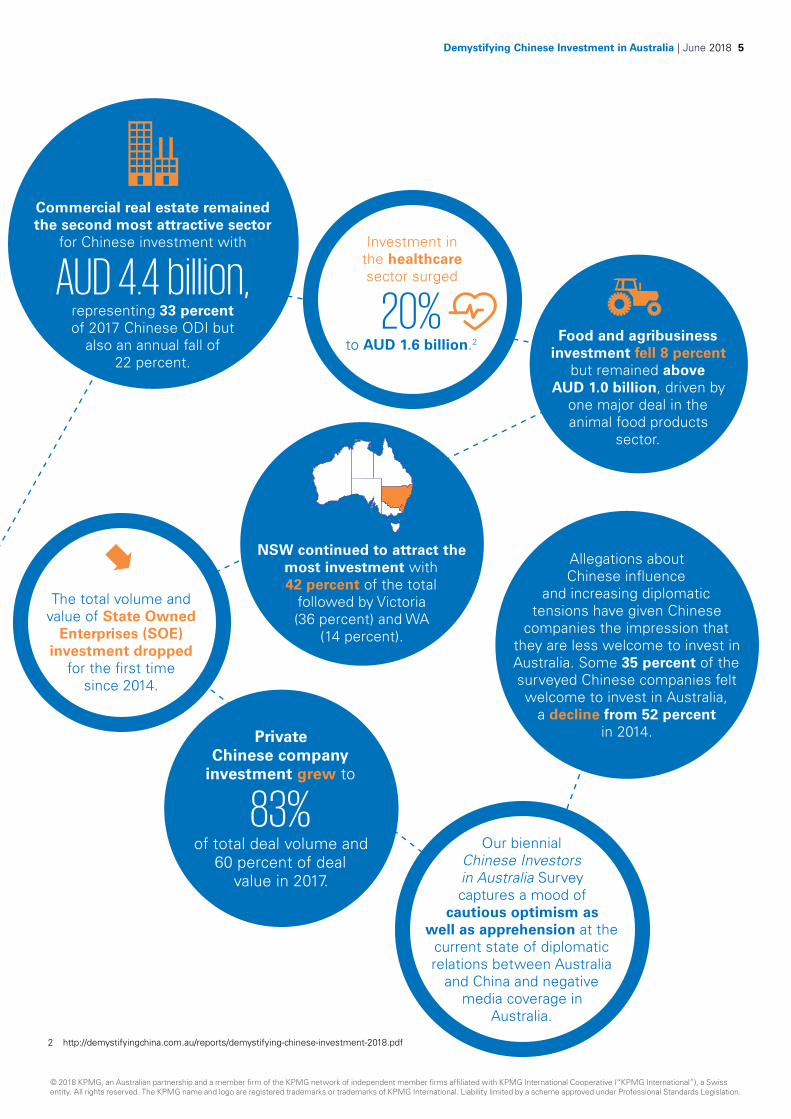
Our biennial Chinese Investors in Australia Survey captures a mood of
cautious optimism as well as apprehension at the
current state of diplomatic relations between Australia
and China and negative media coverage in
Australia.
Private Chinese company
investment grew to
83%of total deal volume and
60 percent of deal value in 2017.
Allegations about Chinese influence
and increasing diplomatic tensions have given Chinese
companies the impression that they are less welcome to invest in Australia. Some 35 percent of the surveyed Chinese companies felt welcome to invest in Australia,
a decline from 52 percent in 2014.
NSW continued to attract the most investment with 42 percent of the total
followed by Victoria (36 percent) and WA
(14 percent).
Commercial real estate remained the second most attractive sector
for Chinese investment with
AUD 4.4 billion, representing 33 percent of 2017 Chinese ODI but
also an annual fall of 22 percent.
Investment in the healthcare sector surged
20% to AUD 1.6 billion.2 Food and agribusiness
investment fell 8 percent but remained above
AUD 1.0 billion, driven by one major deal in the animal food products
sector.
The total volume and value of State Owned
Enterprises (SOE) investment dropped
for the first time since 2014.
© 2018 KPMG, an Australian partnership and a member firm of the KPMG network of independent member firms affiliated with KPMG International Cooperative (“KPMG International”), a Swiss entity. All rights reserved. The KPMG name and logo are registered trademarks or trademarks of KPMG International. Liability limited by a scheme approved under Professional Standards Legislation.
6 Demystifying Chinese Investment in Australia | June 2018
Global trends and context for Australia2017 – A year of decline
Since late 2016, Chinese authorities have increased their regulatory oversight of overseas investments in an effort to ensure that they are not speculative in nature, consider all risks, are in line with the company’s core business, and support China’s development goals. Under new regulations, Chinese ODI is categorised by the government as either encouraged, restricted or prohibited.
For the first time in a decade, Chinese ODI declined 29 percent in value globally in 2017, according to official Chinese MOFCOM figures.3 This reflects both the impact of tightened regulations in China, a significant and necessary correction from 2016 figures and also changing foreign investment regulations in several recipient countries.
The rate of growth of new Chinese ODI into the United States declined by 35 percent year on year to USD 29 billion in 2017. This reduction could be regarded as a correction from historic record Chinese capital investment in 2016, at USD 46 billion.4
The rate of growth of new Chinese ODI into the European Union (EU) declined by 17 percent to EUR 30 billion in 2017.5 Similar to the United States, declining investment in the EU may also be regarded as a correction from 2016 which saw a phenomenal 77 percent annual increase from 2015 levels.6
However if non-EU member countries are included, the overall value of Chinese ODI into continental Europe rose to record levels in 2017 on the back of the USD 43 billion Syngenta deal in Switzerland.7
3 http://www.mofcom.gov.cn/article/ae/ag/201801/20180102699398.shtml
4 https://rhg.com/research/chinese-fdi-us-2017-double-policy-punch/
5 https://www.merics.org/index.php/en/papers-on-china/chinese-fdi-in-europe
6 https://www.merics.org/en/papers-on-china/chinese-investment-europe-record-flows-and-growing-imbalances
7 https://www.bakermckenzie.com/-/media/files/insight/publications/2018/04/rising_tension_china_fdi.pdf?la=en
© 2018 KPMG, an Australian partnership and a member firm of the KPMG network of independent member firms affiliated with KPMG International Cooperative (“KPMG International”), a Swiss entity. All rights reserved. The KPMG name and logo are registered trademarks or trademarks of KPMG International. Liability limited by a scheme approved under Professional Standards Legislation.
Demystifying Chinese Investment in Australia | June 2018 7
Canada recorded a 9 percent decline in the rate of growth of new Chinese direct investment from CAD 7.5 billion in 2016 to CAD 6.8 billion in 2017.
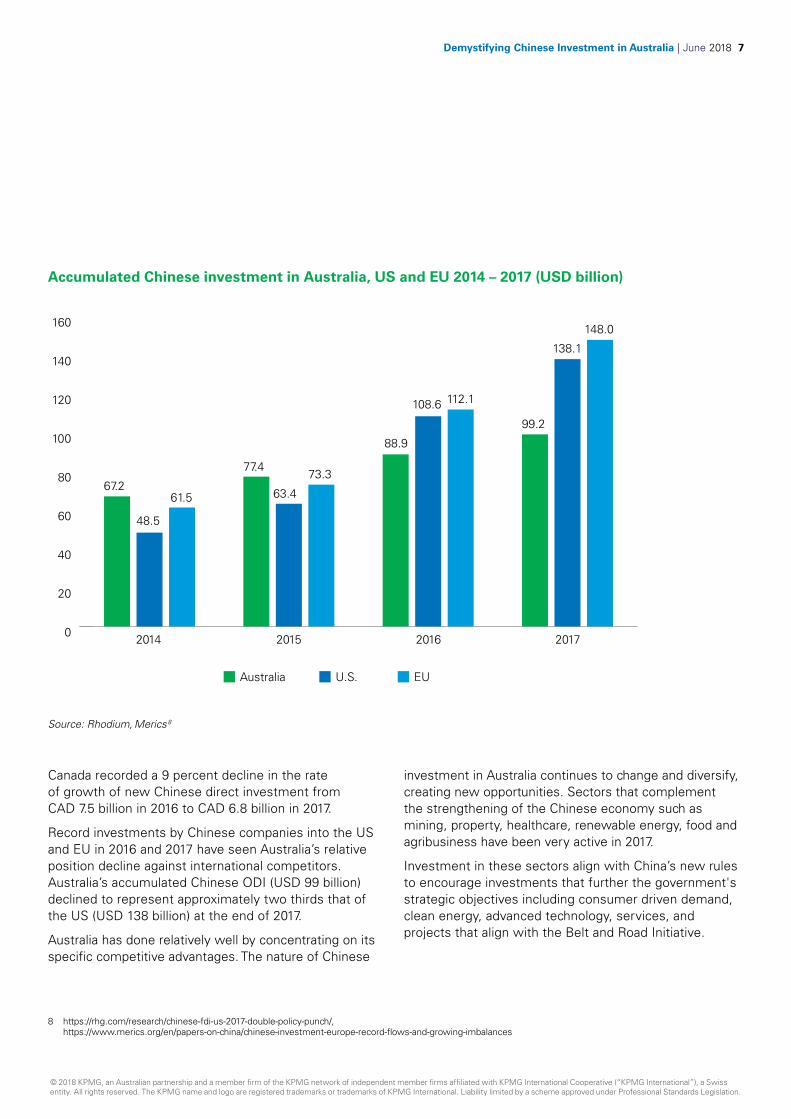
Record investments by Chinese companies into the US and EU in 2016 and 2017 have seen Australia’s relative position decline against international competitors. Australia’s accumulated Chinese ODI (USD 99 billion) declined to represent approximately two thirds that of the US (USD 138 billion) at the end of 2017.
Australia has done relatively well by concentrating on its specific competitive advantages. The nature of Chinese
investment in Australia continues to change and diversify, creating new opportunities. Sectors that complement the strengthening of the Chinese economy such as mining, property, healthcare, renewable energy, food and agribusiness have been very active in 2017.
Investment in these sectors align with China’s new rules to encourage investments that further the government's strategic objectives including consumer driven demand, clean energy, advanced technology, services, and projects that align with the Belt and Road Initiative.
Accumulated Chinese investment in Australia, US and EU 2014 – 2017 (USD billion)
8 https://rhg.com/research/chinese-fdi-us-2017-double-policy-punch/, https://www.merics.org/en/papers-on-china/chinese-investment-europe-record-flows-and-growing-imbalances
0
20
40
60
80
100
120
140
160
67.2
Australia U.S. EU
2014 2015 2016 2017
48.5
61.5
77.4
63.4
73.3
88.9
108.6 112.1
99.2
138.1
148.0
Source: Rhodium, Merics8
© 2018 KPMG, an Australian partnership and a member firm of the KPMG network of independent member firms affiliated with KPMG International Cooperative (“KPMG International”), a Swiss entity. All rights reserved. The KPMG name and logo are registered trademarks or trademarks of KPMG International. Liability limited by a scheme approved under Professional Standards Legislation.
8 Demystifying Chinese Investment in Australia | June 2018
Overview of Chinese investment in Australia
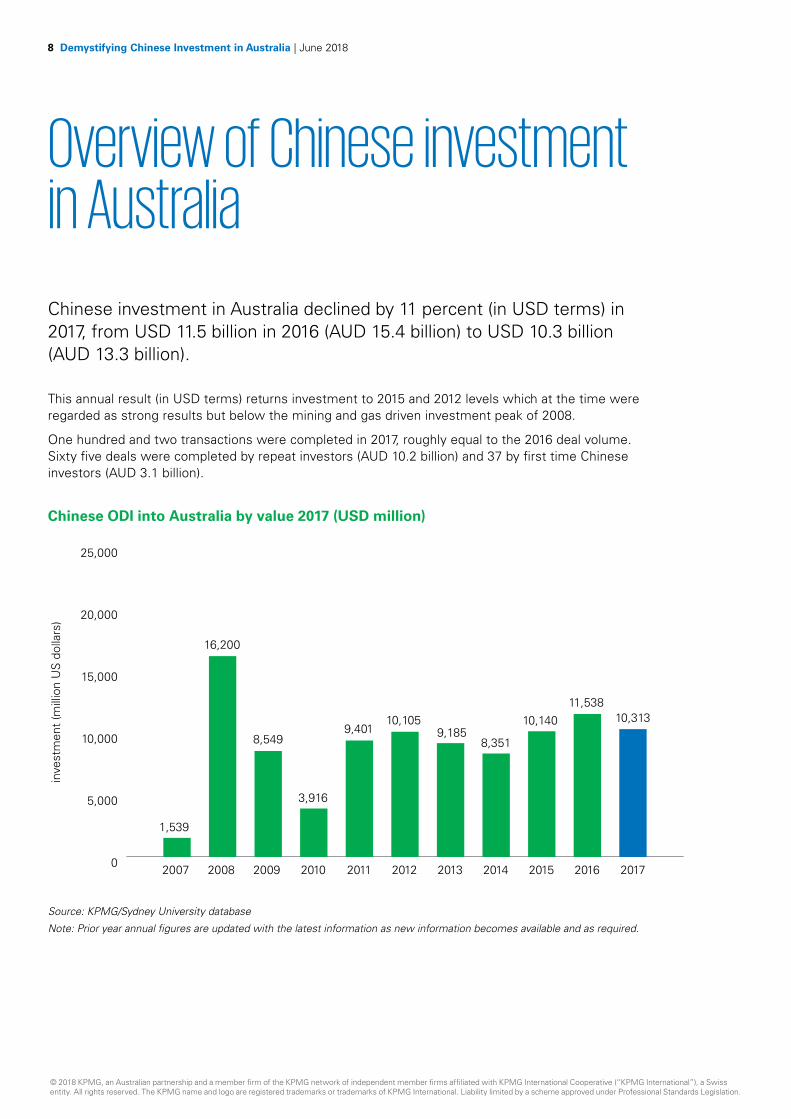
Chinese investment in Australia declined by 11 percent (in USD terms) in 2017, from USD 11.5 billion in 2016 (AUD 15.4 billion) to USD 10.3 billion (AUD 13.3 billion).
This annual result (in USD terms) returns investment to 2015 and 2012 levels which at the time were regarded as strong results but below the mining and gas driven investment peak of 2008.
One hundred and two transactions were completed in 2017, roughly equal to the 2016 deal volume. Sixty five deals were completed by repeat investors (AUD 10.2 billion) and 37 by first time Chinese investors (AUD 3.1 billion).
Chinese ODI into Australia by value 2017 (USD million)
0
5,000
10,000
15,000
20,000
25,000
1,539
2007 2008 2009 2010 2011 2012 2013 2014 2015 2016 2017
16,200
inve
stm
ent
(mill
ion
US
dol
lars
)
8,549
3,916
9,40110,105
9,1858,351
10,14011,538
10,313
Source: KPMG/Sydney University database
Note: Prior year annual figures are updated with the latest information as new information becomes available and as required.
© 2018 KPMG, an Australian partnership and a member firm of the KPMG network of independent member firms affiliated with KPMG International Cooperative (“KPMG International”), a Swiss entity. All rights reserved. The KPMG name and logo are registered trademarks or trademarks of KPMG International. Liability limited by a scheme approved under Professional Standards Legislation.
Demystifying Chinese Investment in Australia | June 2018 9
The decline in Chinese investment in Australia for 2017 corresponds to the global ODI trend, a correction back from 2016 and potentially reflects the impact of a number of regulatory and diplomatic developments between Australia and China which Chinese investors have commented upon in interviews for the 2018 survey.
Tightened restrictions on capital outflows from China have impacted some large scale and high profile investments in Australia in 2017. Projects with a sound commercial rationale are reported to be getting approvals and proceeding as planned.
Chinese investors confirmed that they consider whether their investment is in a sector that is encouraged or restricted by the Chinese government before pursuing and making investment decisions and applications.
The diplomatic relationship between China and Australia is also a factor. A number of Chinese investors
highlighted that the state of diplomatic relations between governments is a regular topic of conversation among Chinese investors in Australia and with their respective head offices in China.
At the same time, Chinese investors indicated there is growing familiarity with and confidence in the Australian market.
Most sectors experienced an annual fall in investment. The overall 2017 decline was largely driven by an 89 percent fall in new infrastructure investment from AUD 4.3 billion in 2016 to AUD 485 million in 2017.
In addition, we observed reductions in oil & gas (down 84 percent), renewable energy (down 64 percent), commercial real estate (down 22 percent), and food & agribusiness investments (down 8 percent).
© 2018 KPMG, an Australian partnership and a member firm of the KPMG network of independent member firms affiliated with KPMG International Cooperative (“KPMG International”), a Swiss entity. All rights reserved. The KPMG name and logo are registered trademarks or trademarks of KPMG International. Liability limited by a scheme approved under Professional Standards Legislation.
10 Demystifying Chinese Investment in Australia | June 2018
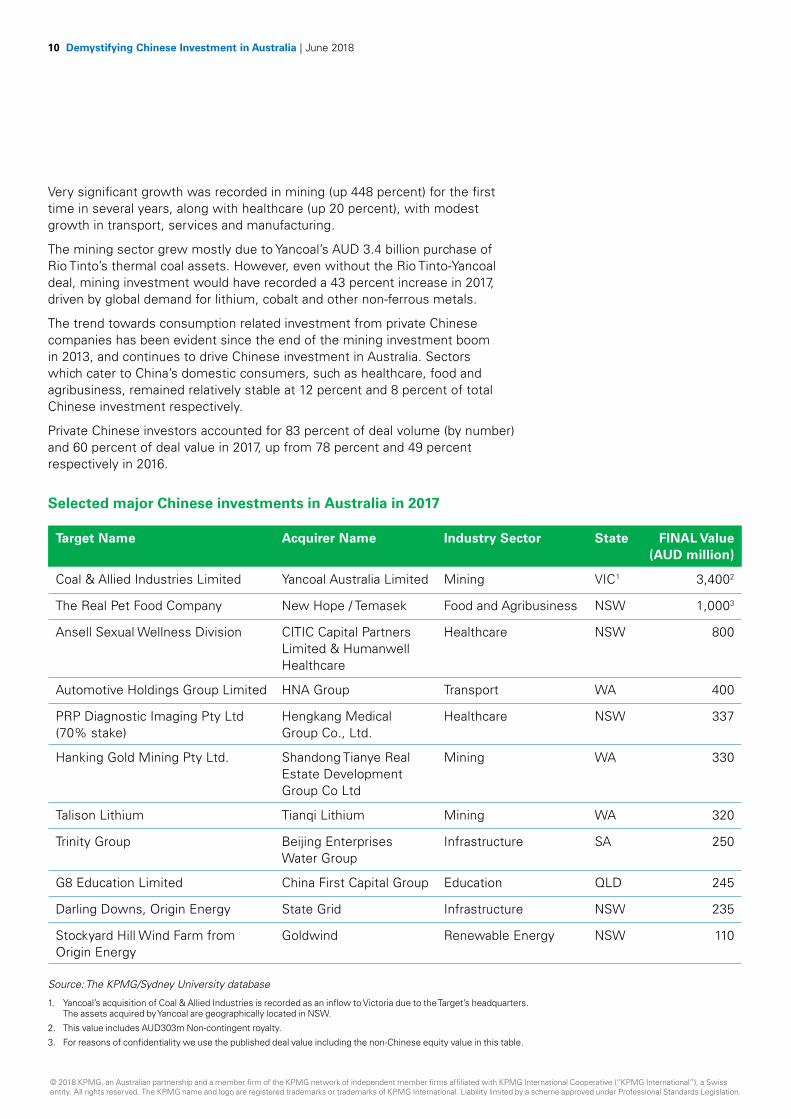
Very significant growth was recorded in mining (up 448 percent) for the first time in several years, along with healthcare (up 20 percent), with modest growth in transport, services and manufacturing.
The mining sector grew mostly due to Yancoal’s AUD 3.4 billion purchase of Rio Tinto’s thermal coal assets. However, even without the Rio Tinto-Yancoal deal, mining investment would have recorded a 43 percent increase in 2017, driven by global demand for lithium, cobalt and other non-ferrous metals.
The trend towards consumption related investment from private Chinese companies has been evident since the end of the mining investment boom in 2013, and continues to drive Chinese investment in Australia. Sectors which cater to China’s domestic consumers, such as healthcare, food and agribusiness, remained relatively stable at 12 percent and 8 percent of total Chinese investment respectively.
Private Chinese investors accounted for 83 percent of deal volume (by number) and 60 percent of deal value in 2017, up from 78 percent and 49 percent respectively in 2016.
Selected major Chinese investments in Australia in 2017
Target Name Acquirer Name Industry Sector State FINAL Value (AUD million)
Coal & Allied Industries Limited Yancoal Australia Limited Mining VIC1 3,4002
The Real Pet Food Company New Hope / Temasek Food and Agribusiness NSW 1,0003
Ansell Sexual Wellness Division CITIC Capital Partners Limited & Humanwell Healthcare
Healthcare NSW 800
Automotive Holdings Group Limited HNA Group Transport WA 400
PRP Diagnostic Imaging Pty Ltd (70% stake)
Hengkang Medical Group Co., Ltd.
Healthcare NSW 337
Hanking Gold Mining Pty Ltd. Shandong Tianye Real Estate Development Group Co Ltd
Mining WA 330
Talison Lithium Tianqi Lithium Mining WA 320
Trinity Group Beijing Enterprises Water Group
Infrastructure SA 250
G8 Education Limited China First Capital Group Education QLD 245
Darling Downs, Origin Energy State Grid Infrastructure NSW 235
Stockyard Hill Wind Farm from Origin Energy
Goldwind Renewable Energy NSW 110
Source: The KPMG/Sydney University database
1. Yancoal’s acquisition of Coal & Allied Industries is recorded as an inflow to Victoria due to the Target’s headquarters. The assets acquired by Yancoal are geographically located in NSW.
2. This value includes AUD303m Non-contingent royalty.
3. For reasons of confidentiality we use the published deal value including the non-Chinese equity value in this table.
© 2018 KPMG, an Australian partnership and a member firm of the KPMG network of independent member firms affiliated with KPMG International Cooperative (“KPMG International”), a Swiss entity. All rights reserved. The KPMG name and logo are registered trademarks or trademarks of KPMG International. Liability limited by a scheme approved under Professional Standards Legislation.
Demystifying Chinese Investment in Australia | June 2018 11
© 2018 KPMG, an Australian partnership and a member firm of the KPMG network of independent member firms affiliated with KPMG International Cooperative (“KPMG International”), a Swiss entity. All rights reserved. The KPMG name and logo are registered trademarks or trademarks of KPMG International. Liability limited by a scheme approved under Professional Standards Legislation.
12 Demystifying Chinese Investment in Australia | June 2018
Chinese Investment in Australia by industry
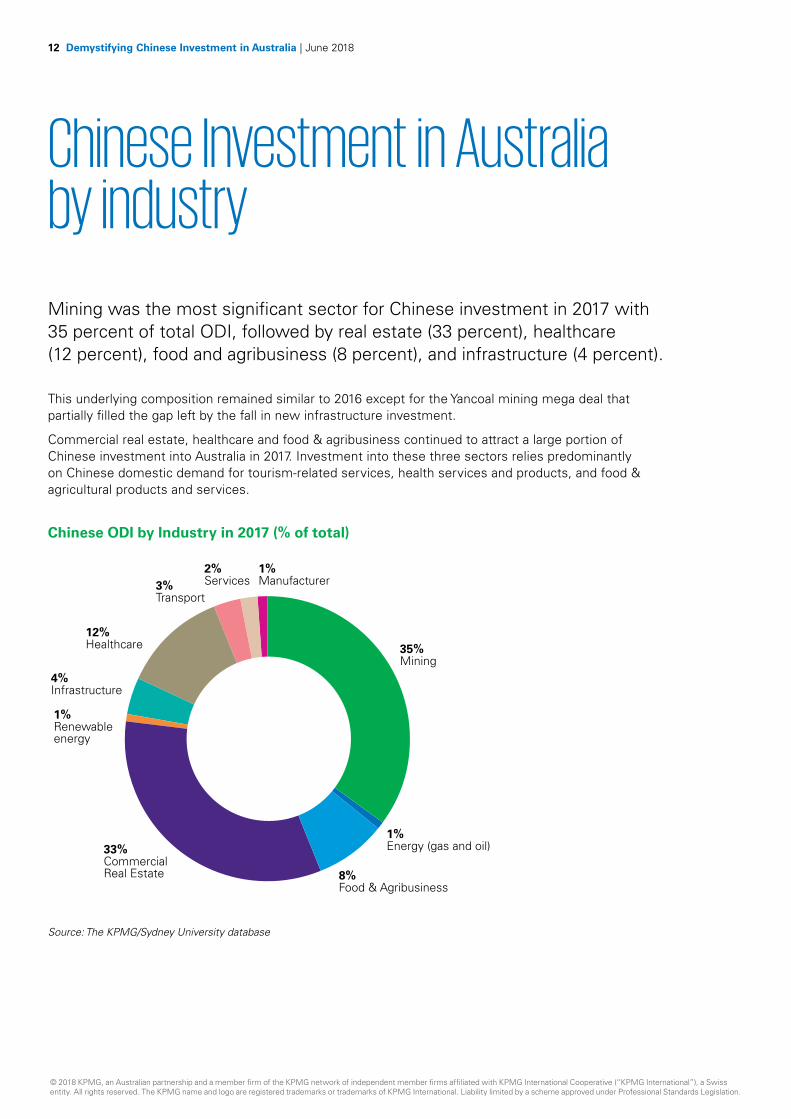
Mining was the most significant sector for Chinese investment in 2017 with 35 percent of total ODI, followed by real estate (33 percent), healthcare (12 percent), food and agribusiness (8 percent), and infrastructure (4 percent).
This underlying composition remained similar to 2016 except for the Yancoal mining mega deal that partially filled the gap left by the fall in new infrastructure investment.
Commercial real estate, healthcare and food & agribusiness continued to attract a large portion of Chinese investment into Australia in 2017. Investment into these three sectors relies predominantly on Chinese domestic demand for tourism-related services, health services and products, and food & agricultural products and services.
Chinese ODI by Industry in 2017 (% of total)
1%Energy (gas and oil)
8%Food & Agribusiness
33%Commercial Real Estate
35%Mining
1%Renewable energy
4%Infrastructure
3% Transport
12%Healthcare
2% Services
1%Manufacturer
Source: The KPMG/Sydney University database
© 2018 KPMG, an Australian partnership and a member firm of the KPMG network of independent member firms affiliated with KPMG International Cooperative (“KPMG International”), a Swiss entity. All rights reserved. The KPMG name and logo are registered trademarks or trademarks of KPMG International. Liability limited by a scheme approved under Professional Standards Legislation.
Demystifying Chinese Investment in Australia | June 2018 13
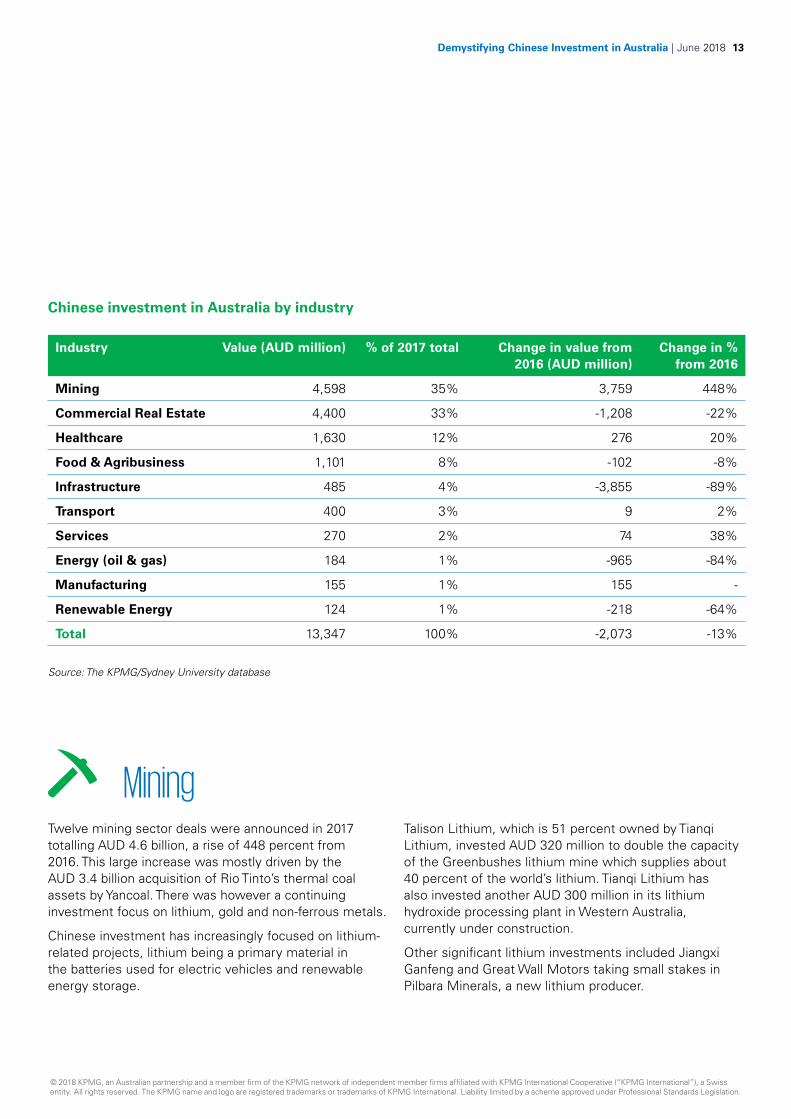
Source: The KPMG/Sydney University database
Industry Value (AUD million) % of 2017 total Change in value from 2016 (AUD million)
Change in % from 2016
Mining 4,598 35% 3,759 448%
Commercial Real Estate 4,400 33% -1,208 -22%
Healthcare 1,630 12% 276 20%
Food & Agribusiness 1,101 8% -102 -8%
Infrastructure 485 4% -3,855 -89%
Transport 400 3% 9 2%
Services 270 2% 74 38%
Energy (oil & gas) 184 1% -965 -84%
Manufacturing 155 1% 155 -
Renewable Energy 124 1% -218 -64%
Total 13,347 100% -2,073 -13%
Chinese investment in Australia by industry
MiningTwelve mining sector deals were announced in 2017 totalling AUD 4.6 billion, a rise of 448 percent from 2016. This large increase was mostly driven by the AUD 3.4 billion acquisition of Rio Tinto’s thermal coal assets by Yancoal. There was however a continuing investment focus on lithium, gold and non-ferrous metals.
Chinese investment has increasingly focused on lithium-related projects, lithium being a primary material in the batteries used for electric vehicles and renewable energy storage.
Talison Lithium, which is 51 percent owned by Tianqi Lithium, invested AUD 320 million to double the capacity of the Greenbushes lithium mine which supplies about 40 percent of the world’s lithium. Tianqi Lithium has also invested another AUD 300 million in its lithium hydroxide processing plant in Western Australia, currently under construction.
Other significant lithium investments included Jiangxi Ganfeng and Great Wall Motors taking small stakes in Pilbara Minerals, a new lithium producer.
© 2018 KPMG, an Australian partnership and a member firm of the KPMG network of independent member firms affiliated with KPMG International Cooperative (“KPMG International”), a Swiss entity. All rights reserved. The KPMG name and logo are registered trademarks or trademarks of KPMG International. Liability limited by a scheme approved under Professional Standards Legislation.
14 Demystifying Chinese Investment in Australia | June 2018
Case study: Mining
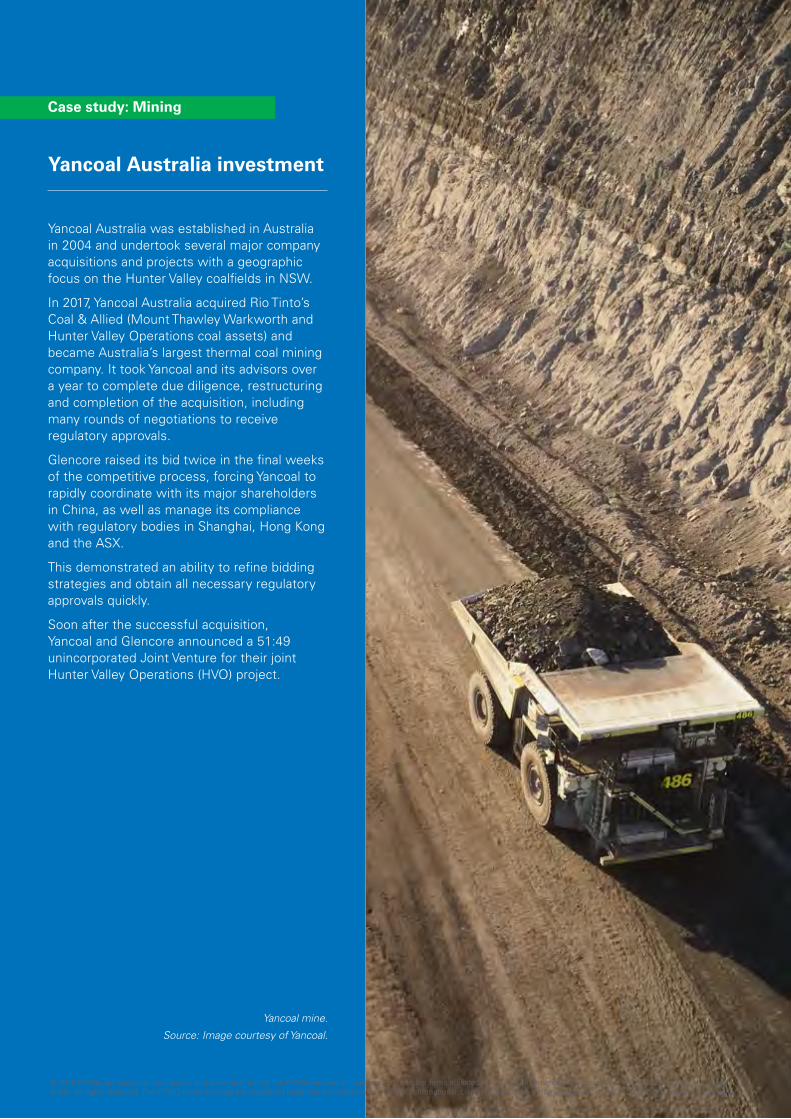
Yancoal Australia investment
Yancoal Australia was established in Australia in 2004 and undertook several major company acquisitions and projects with a geographic focus on the Hunter Valley coalfields in NSW.
In 2017, Yancoal Australia acquired Rio Tinto’s Coal & Allied (Mount Thawley Warkworth and Hunter Valley Operations coal assets) and became Australia’s largest thermal coal mining company. It took Yancoal and its advisors over a year to complete due diligence, restructuring and completion of the acquisition, including many rounds of negotiations to receive regulatory approvals.
Glencore raised its bid twice in the final weeks of the competitive process, forcing Yancoal to rapidly coordinate with its major shareholders in China, as well as manage its compliance with regulatory bodies in Shanghai, Hong Kong and the ASX.
This demonstrated an ability to refine bidding strategies and obtain all necessary regulatory approvals quickly.
Soon after the successful acquisition, Yancoal and Glencore announced a 51:49 unincorporated Joint Venture for their joint Hunter Valley Operations (HVO) project.
Yancoal mine.
Source: Image courtesy of Yancoal.
© 2018 KPMG, an Australian partnership and a member firm of the KPMG network of independent member firms affiliated with KPMG International Cooperative (“KPMG International”), a Swiss entity. All rights reserved. The KPMG name and logo are registered trademarks or trademarks of KPMG International. Liability limited by a scheme approved under Professional Standards Legislation.
Demystifying Chinese Investment in Australia | June 2018 15
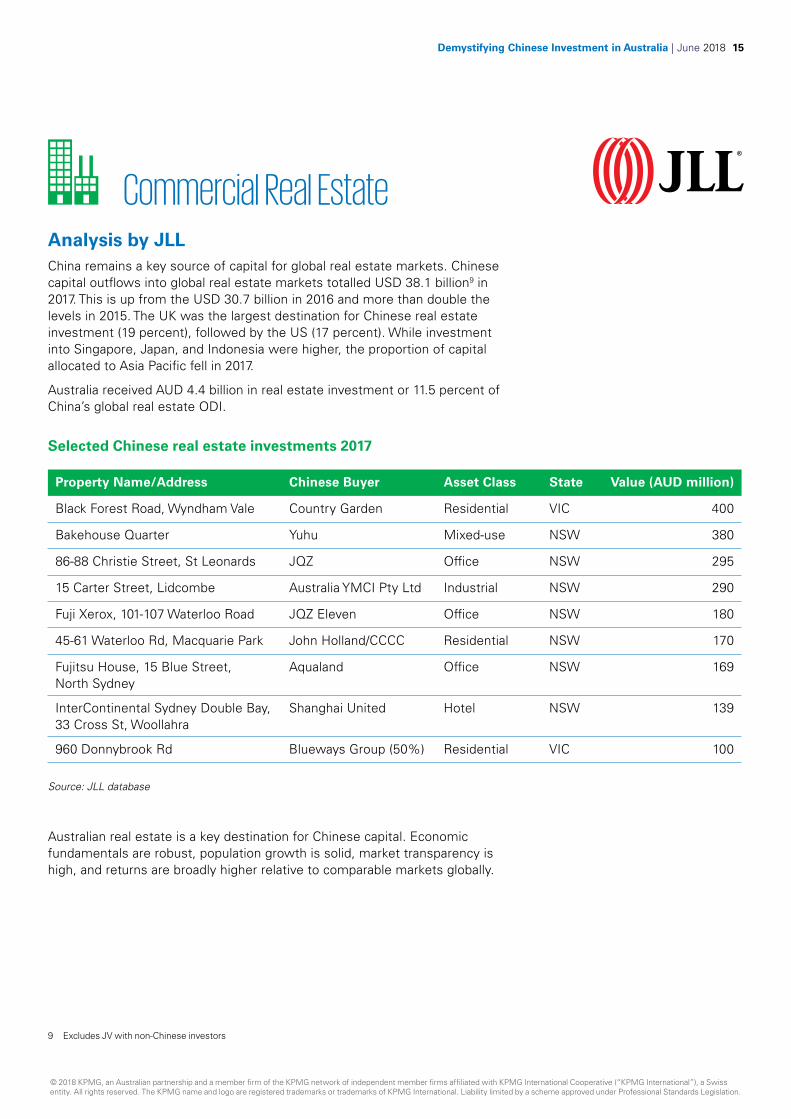
Commercial Real EstateAnalysis by JLLChina remains a key source of capital for global real estate markets. Chinese capital outflows into global real estate markets totalled USD 38.1 billion9 in 2017. This is up from the USD 30.7 billion in 2016 and more than double the levels in 2015. The UK was the largest destination for Chinese real estate investment (19 percent), followed by the US (17 percent). While investment into Singapore, Japan, and Indonesia were higher, the proportion of capital allocated to Asia Pacific fell in 2017.
Australia received AUD 4.4 billion in real estate investment or 11.5 percent of China’s global real estate ODI.
Selected Chinese real estate investments 2017
Property Name/Address Chinese Buyer Asset Class State Value (AUD million)
Black Forest Road, Wyndham Vale Country Garden Residential VIC 400
Bakehouse Quarter Yuhu Mixed-use NSW 380
86-88 Christie Street, St Leonards JQZ Office NSW 295
15 Carter Street, Lidcombe Australia YMCI Pty Ltd Industrial NSW 290
Fuji Xerox, 101-107 Waterloo Road JQZ Eleven Office NSW 180
45-61 Waterloo Rd, Macquarie Park John Holland/CCCC Residential NSW 170
Fujitsu House, 15 Blue Street, North Sydney
Aqualand Office NSW 169
InterContinental Sydney Double Bay, 33 Cross St, Woollahra
Shanghai United Hotel NSW 139
960 Donnybrook Rd Blueways Group (50%) Residential VIC 100
Source: JLL database
Australian real estate is a key destination for Chinese capital. Economic fundamentals are robust, population growth is solid, market transparency is high, and returns are broadly higher relative to comparable markets globally.
9 Excludes JV with non-Chinese investors
© 2018 KPMG, an Australian partnership and a member firm of the KPMG network of independent member firms affiliated with KPMG International Cooperative (“KPMG International”), a Swiss entity. All rights reserved. The KPMG name and logo are registered trademarks or trademarks of KPMG International. Liability limited by a scheme approved under Professional Standards Legislation.
16 Demystifying Chinese Investment in Australia | June 2018
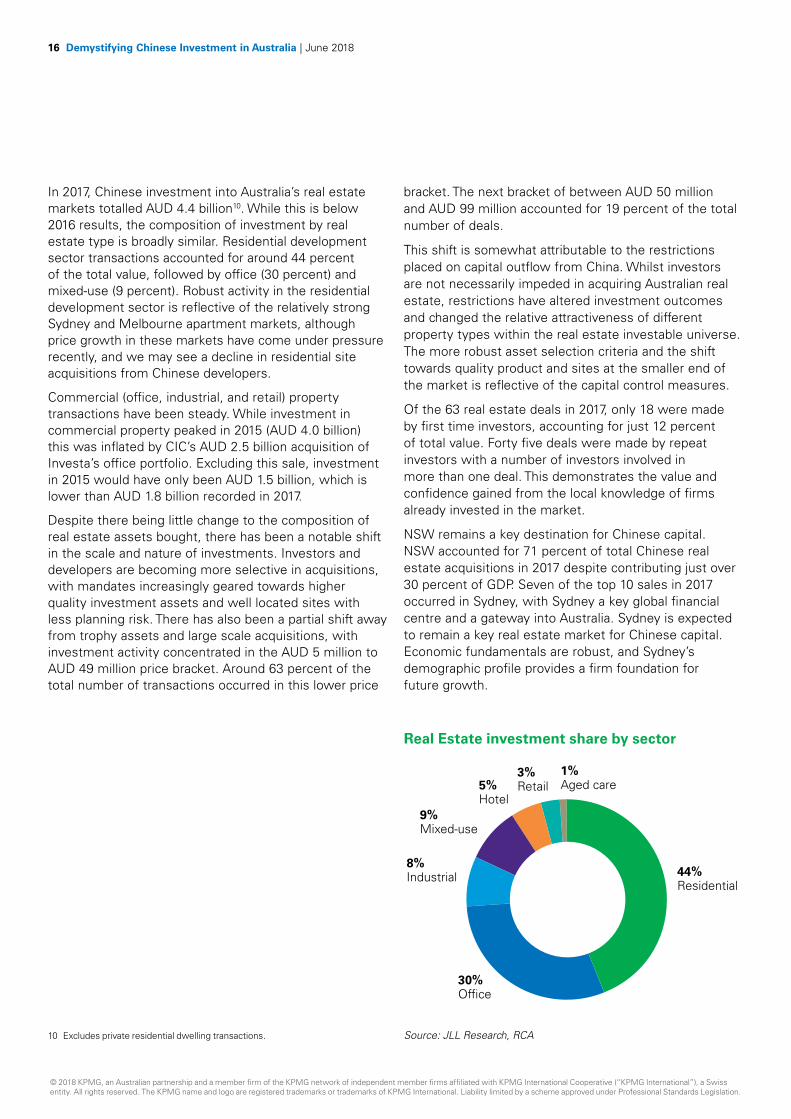
In 2017, Chinese investment into Australia’s real estate markets totalled AUD 4.4 billion10. While this is below 2016 results, the composition of investment by real estate type is broadly similar. Residential development sector transactions accounted for around 44 percent of the total value, followed by office (30 percent) and mixed-use (9 percent). Robust activity in the residential development sector is reflective of the relatively strong Sydney and Melbourne apartment markets, although price growth in these markets have come under pressure recently, and we may see a decline in residential site acquisitions from Chinese developers.
Commercial (office, industrial, and retail) property transactions have been steady. While investment in commercial property peaked in 2015 (AUD 4.0 billion) this was inflated by CIC’s AUD 2.5 billion acquisition of Investa’s office portfolio. Excluding this sale, investment in 2015 would have only been AUD 1.5 billion, which is lower than AUD 1.8 billion recorded in 2017.
Despite there being little change to the composition of real estate assets bought, there has been a notable shift in the scale and nature of investments. Investors and developers are becoming more selective in acquisitions, with mandates increasingly geared towards higher quality investment assets and well located sites with less planning risk. There has also been a partial shift away from trophy assets and large scale acquisitions, with investment activity concentrated in the AUD 5 million to AUD 49 million price bracket. Around 63 percent of the total number of transactions occurred in this lower price
bracket. The next bracket of between AUD 50 million and AUD 99 million accounted for 19 percent of the total number of deals.
This shift is somewhat attributable to the restrictions placed on capital outflow from China. Whilst investors are not necessarily impeded in acquiring Australian real estate, restrictions have altered investment outcomes and changed the relative attractiveness of different property types within the real estate investable universe. The more robust asset selection criteria and the shift towards quality product and sites at the smaller end of the market is reflective of the capital control measures.
Of the 63 real estate deals in 2017, only 18 were made by first time investors, accounting for just 12 percent of total value. Forty five deals were made by repeat investors with a number of investors involved in more than one deal. This demonstrates the value and confidence gained from the local knowledge of firms already invested in the market.
NSW remains a key destination for Chinese capital. NSW accounted for 71 percent of total Chinese real estate acquisitions in 2017 despite contributing just over 30 percent of GDP. Seven of the top 10 sales in 2017 occurred in Sydney, with Sydney a key global financial centre and a gateway into Australia. Sydney is expected to remain a key real estate market for Chinese capital. Economic fundamentals are robust, and Sydney’s demographic profile provides a firm foundation for future growth.
Real Estate investment share by sector
30%Office
44%Residential
8%Industrial
9%Mixed-use
3%Retail5%
Hotel
1%Aged care
Source: JLL Research, RCA10 Excludes private residential dwelling transactions.
© 2018 KPMG, an Australian partnership and a member firm of the KPMG network of independent member firms affiliated with KPMG International Cooperative (“KPMG International”), a Swiss entity. All rights reserved. The KPMG name and logo are registered trademarks or trademarks of KPMG International. Liability limited by a scheme approved under Professional Standards Legislation.
Demystifying Chinese Investment in Australia | June 2018 17
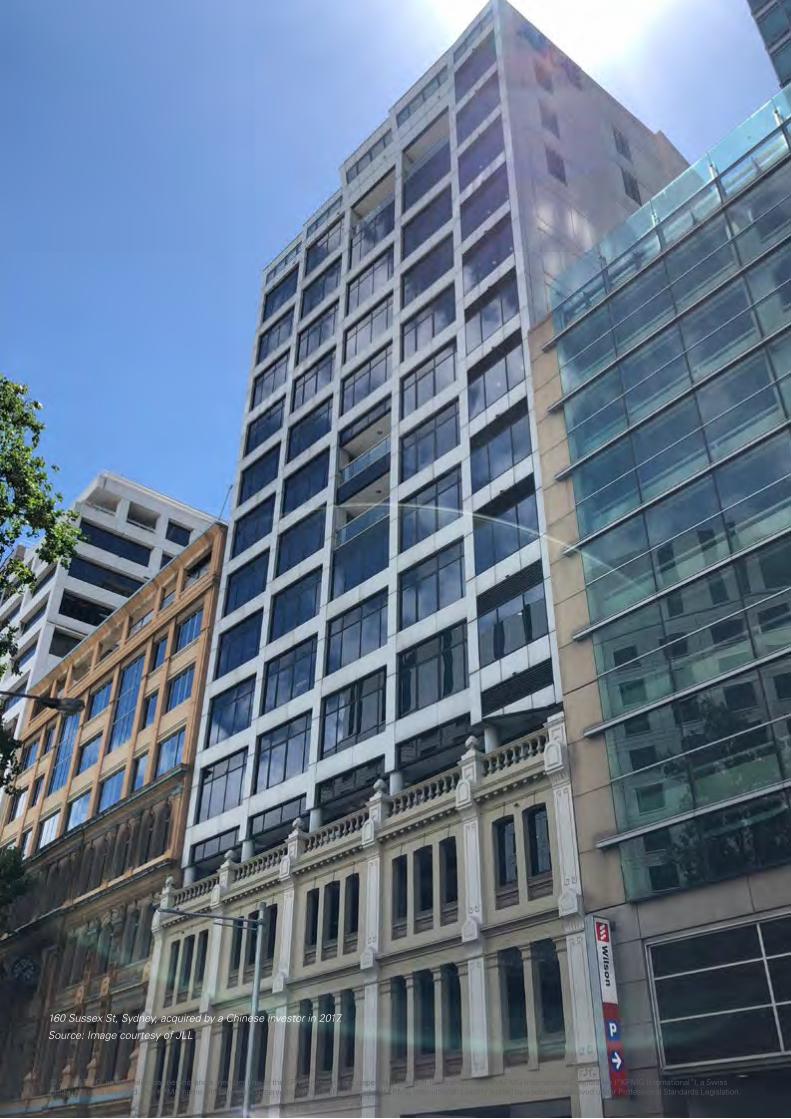
160 Sussex St, Sydney, acquired by a Chinese investor in 2017.
Source: Image courtesy of JLL
© 2018 KPMG, an Australian partnership and a member firm of the KPMG network of independent member firms affiliated with KPMG International Cooperative (“KPMG International”), a Swiss entity. All rights reserved. The KPMG name and logo are registered trademarks or trademarks of KPMG International. Liability limited by a scheme approved under Professional Standards Legislation.
18 Demystifying Chinese Investment in Australia | June 2018
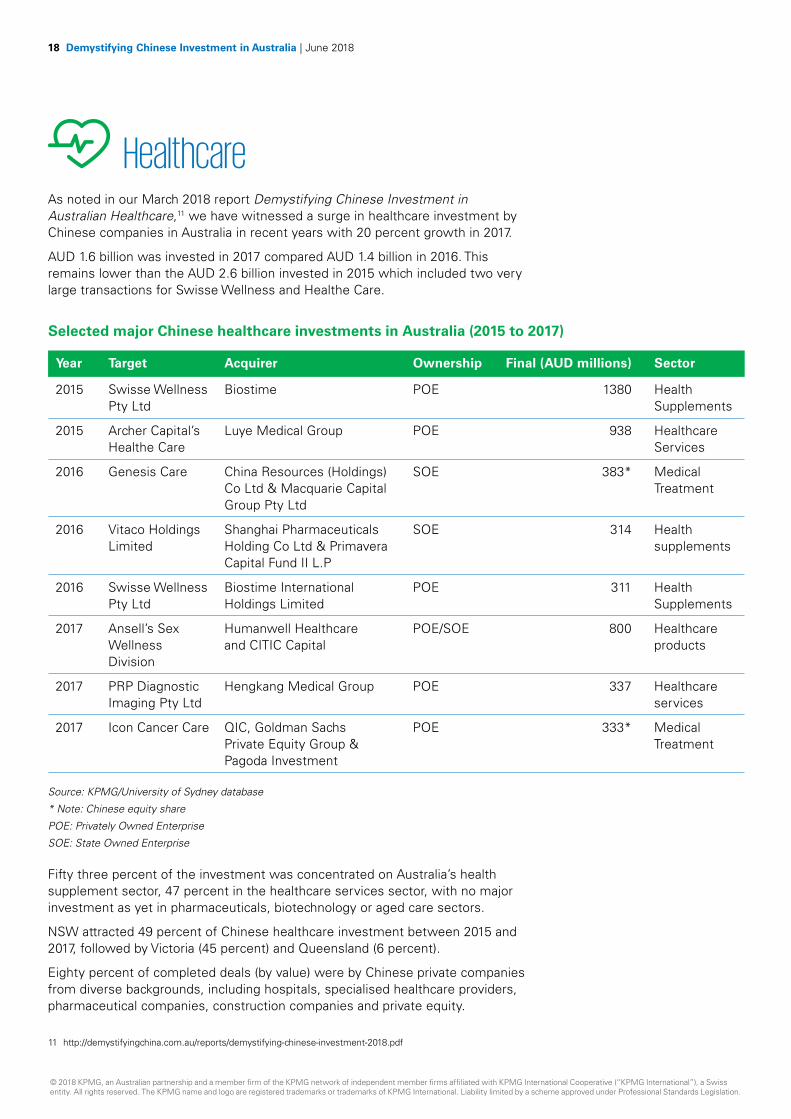
HealthcareAs noted in our March 2018 report Demystifying Chinese Investment in Australian Healthcare,11 we have witnessed a surge in healthcare investment by Chinese companies in Australia in recent years with 20 percent growth in 2017.
AUD 1.6 billion was invested in 2017 compared AUD 1.4 billion in 2016. This remains lower than the AUD 2.6 billion invested in 2015 which included two very large transactions for Swisse Wellness and Healthe Care.
Year Target Acquirer Ownership Final (AUD millions) Sector
2015 Swisse Wellness Pty Ltd
Biostime POE 1380 Health Supplements
2015 Archer Capital’s Healthe Care
Luye Medical Group POE 938 Healthcare Services
2016 Genesis Care China Resources (Holdings) Co Ltd & Macquarie Capital Group Pty Ltd
SOE 383* Medical Treatment
2016 Vitaco Holdings Limited
Shanghai Pharmaceuticals Holding Co Ltd & Primavera Capital Fund II L.P
SOE 314 Health supplements
2016 Swisse Wellness Pty Ltd
Biostime International Holdings Limited
POE 311 Health Supplements
2017 Ansell’s Sex Wellness Division
Humanwell Healthcare and CITIC Capital
POE/SOE 800 Healthcare products
2017 PRP Diagnostic Imaging Pty Ltd
Hengkang Medical Group POE 337 Healthcare services
2017 Icon Cancer Care QIC, Goldman Sachs Private Equity Group & Pagoda Investment
POE 333* Medical Treatment
Selected major Chinese healthcare investments in Australia (2015 to 2017)
Source: KPMG/University of Sydney database
* Note: Chinese equity share
POE: Privately Owned Enterprise
SOE: State Owned Enterprise
11 http://demystifyingchina.com.au/reports/demystifying-chinese-investment-2018.pdf
Fifty three percent of the investment was concentrated on Australia’s health supplement sector, 47 percent in the healthcare services sector, with no major investment as yet in pharmaceuticals, biotechnology or aged care sectors.
NSW attracted 49 percent of Chinese healthcare investment between 2015 and 2017, followed by Victoria (45 percent) and Queensland (6 percent).
Eighty percent of completed deals (by value) were by Chinese private companies from diverse backgrounds, including hospitals, specialised healthcare providers, pharmaceutical companies, construction companies and private equity.
© 2018 KPMG, an Australian partnership and a member firm of the KPMG network of independent member firms affiliated with KPMG International Cooperative (“KPMG International”), a Swiss entity. All rights reserved. The KPMG name and logo are registered trademarks or trademarks of KPMG International. Liability limited by a scheme approved under Professional Standards Legislation.
Demystifying Chinese Investment in Australia | June 2018 19
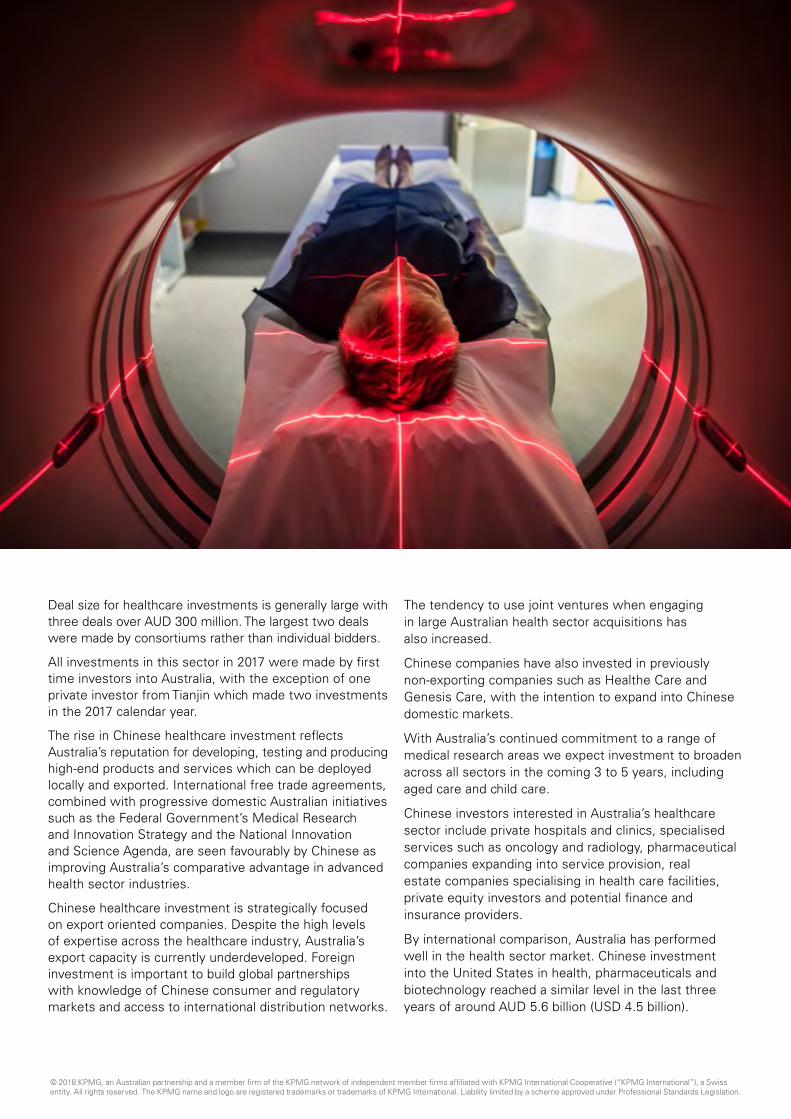
Deal size for healthcare investments is generally large with three deals over AUD 300 million. The largest two deals were made by consortiums rather than individual bidders.
All investments in this sector in 2017 were made by first time investors into Australia, with the exception of one private investor from Tianjin which made two investments in the 2017 calendar year.
The rise in Chinese healthcare investment reflects Australia’s reputation for developing, testing and producing high-end products and services which can be deployed locally and exported. International free trade agreements, combined with progressive domestic Australian initiatives such as the Federal Government’s Medical Research and Innovation Strategy and the National Innovation and Science Agenda, are seen favourably by Chinese as improving Australia’s comparative advantage in advanced health sector industries.
Chinese healthcare investment is strategically focused on export oriented companies. Despite the high levels of expertise across the healthcare industry, Australia’s export capacity is currently underdeveloped. Foreign investment is important to build global partnerships with knowledge of Chinese consumer and regulatory markets and access to international distribution networks.
The tendency to use joint ventures when engaging in large Australian health sector acquisitions has also increased.
Chinese companies have also invested in previously non-exporting companies such as Healthe Care and Genesis Care, with the intention to expand into Chinese domestic markets.
With Australia’s continued commitment to a range of medical research areas we expect investment to broaden across all sectors in the coming 3 to 5 years, including aged care and child care.
Chinese investors interested in Australia’s healthcare sector include private hospitals and clinics, specialised services such as oncology and radiology, pharmaceutical companies expanding into service provision, real estate companies specialising in health care facilities, private equity investors and potential finance and insurance providers.
By international comparison, Australia has performed well in the health sector market. Chinese investment into the United States in health, pharmaceuticals and biotechnology reached a similar level in the last three years of around AUD 5.6 billion (USD 4.5 billion).
© 2018 KPMG, an Australian partnership and a member firm of the KPMG network of independent member firms affiliated with KPMG International Cooperative (“KPMG International”), a Swiss entity. All rights reserved. The KPMG name and logo are registered trademarks or trademarks of KPMG International. Liability limited by a scheme approved under Professional Standards Legislation.
20 Demystifying Chinese Investment in Australia | June 2018
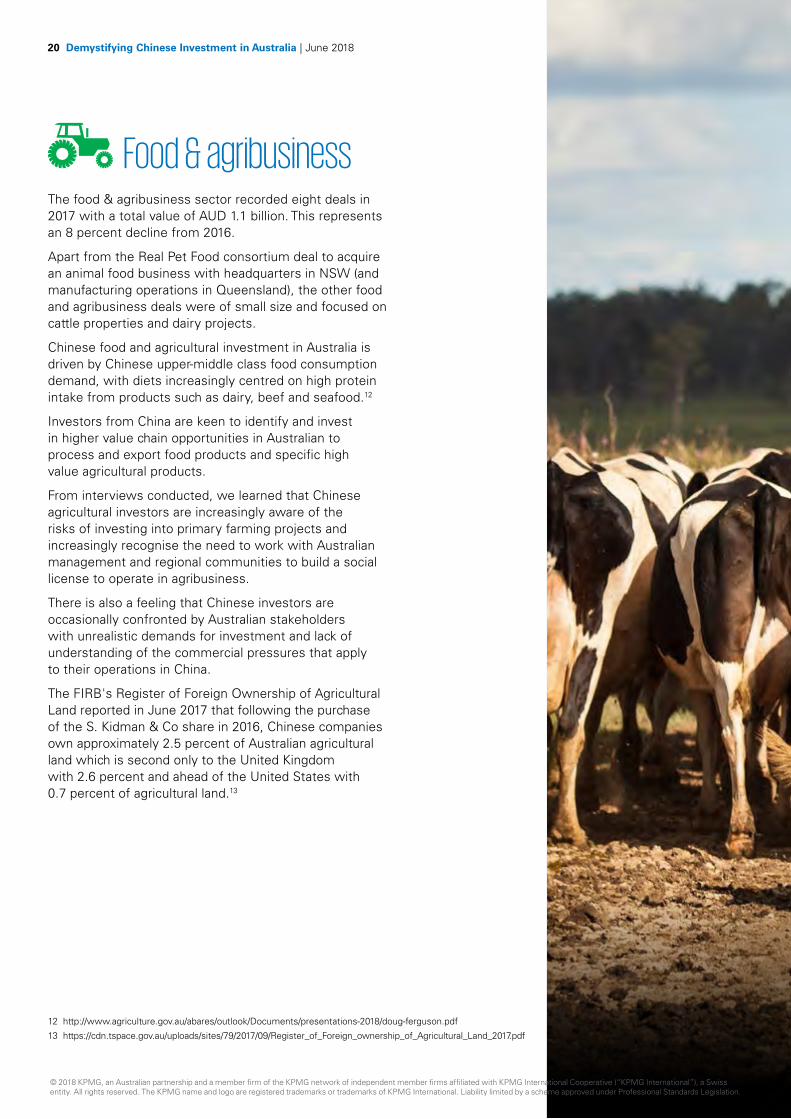
Food & agribusinessThe food & agribusiness sector recorded eight deals in 2017 with a total value of AUD 1.1 billion. This represents an 8 percent decline from 2016.
Apart from the Real Pet Food consortium deal to acquire an animal food business with headquarters in NSW (and manufacturing operations in Queensland), the other food and agribusiness deals were of small size and focused on cattle properties and dairy projects.
Chinese food and agricultural investment in Australia is driven by Chinese upper-middle class food consumption demand, with diets increasingly centred on high protein intake from products such as dairy, beef and seafood.12
Investors from China are keen to identify and invest in higher value chain opportunities in Australian to process and export food products and specific high value agricultural products.
From interviews conducted, we learned that Chinese agricultural investors are increasingly aware of the risks of investing into primary farming projects and increasingly recognise the need to work with Australian management and regional communities to build a social license to operate in agribusiness.
There is also a feeling that Chinese investors are occasionally confronted by Australian stakeholders with unrealistic demands for investment and lack of understanding of the commercial pressures that apply to their operations in China.
The FIRB's Register of Foreign Ownership of Agricultural Land reported in June 2017 that following the purchase of the S. Kidman & Co share in 2016, Chinese companies own approximately 2.5 percent of Australian agricultural land which is second only to the United Kingdom with 2.6 percent and ahead of the United States with 0.7 percent of agricultural land.13
12 http://www.agriculture.gov.au/abares/outlook/Documents/presentations-2018/doug-ferguson.pdf
13 https://cdn.tspace.gov.au/uploads/sites/79/2017/09/Register_of_Foreign_ownership_of_Agricultural_Land_2017.pdf
© 2018 KPMG, an Australian partnership and a member firm of the KPMG network of independent member firms affiliated with KPMG International Cooperative (“KPMG International”), a Swiss entity. All rights reserved. The KPMG name and logo are registered trademarks or trademarks of KPMG International. Liability limited by a scheme approved under Professional Standards Legislation.
Demystifying Chinese Investment in Australia | June 2018 21
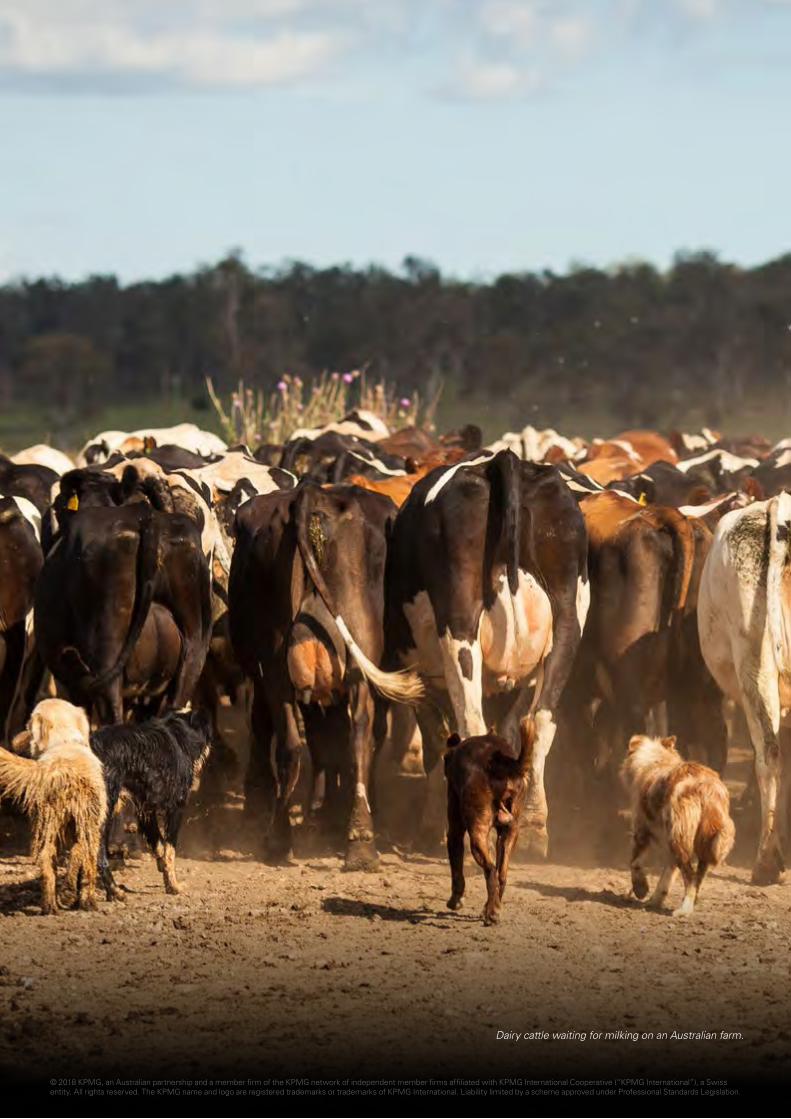
Dairy cattle waiting for milking on an Australian farm.
© 2018 KPMG, an Australian partnership and a member firm of the KPMG network of independent member firms affiliated with KPMG International Cooperative (“KPMG International”), a Swiss entity. All rights reserved. The KPMG name and logo are registered trademarks or trademarks of KPMG International. Liability limited by a scheme approved under Professional Standards Legislation.
22 Demystifying Chinese Investment in Australia | June 2018
Renewable energyTotal investment of AUD 124 million was recorded in 2017, representing a 64 percent annual decline and mostly driven by one large transaction – Goldwind’s acquisition of Origin’s Stockyard Hill wind farm for AUD 110 million.
Renewable energy investment is attracting both established Chinese companies and new entrants with interests in wind, and increasingly solar energy. Chinese companies have built strong local teams and become more experienced and confident in their capabilities to successfully develop and operate renewable energy projects in the Australian market.
There are a number of new potential Chinese investors in this sector who are doing research on Australia’s renewable energy market and building important contacts with local governments and industry partners to buy projects and jointly develop new projects.
Chinese investors in this sector shared a key concern about the shortage of skilled and experienced labour for project capabilities in Australia. They found it hard to recruit experienced project managers and key technical engineers in Australia.
InfrastructureAfter the two major port infrastructure acquisitions in 2016, there were two smaller infrastructure projects recorded for 2017 by State Grid and the Hong Kong listed Beijing Enterprises Water Group, both with existing operations in Australia.
We continue to see strong interest from Chinese infrastructure players seeking project opportunities in Australia. Many Chinese investors in this sector have accumulated many years of experience in other developing countries and have shifted focus to developed countries. They are planning long-term in the future for Belt and Road Initiative related infrastructure projects.
Chinese investors are keen to partner with local Australian companies to bid for projects together rather than alone. Most are willing to make equity investments into a local companies to gain access to established industry credentials following the example of John Holland and CCCI a few years ago.
In our interviews we learned that the new Critical Infrastructure Centre (CIC) has led to some uncertainty while it establishes its track record, however there were no reports of the CIC negatively impacting project applications.
© 2018 KPMG, an Australian partnership and a member firm of the KPMG network of independent member firms affiliated with KPMG International Cooperative (“KPMG International”), a Swiss entity. All rights reserved. The KPMG name and logo are registered trademarks or trademarks of KPMG International. Liability limited by a scheme approved under Professional Standards Legislation.
Demystifying Chinese Investment in Australia | June 2018 23
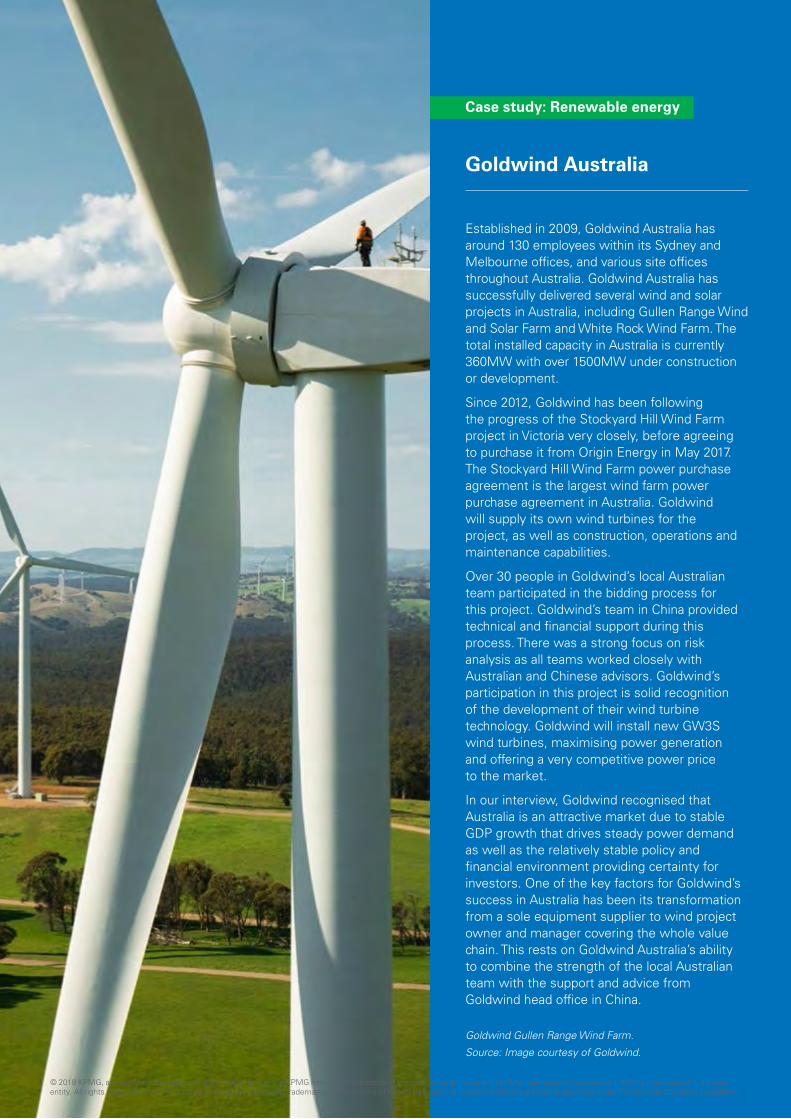
Goldwind Australia
Established in 2009, Goldwind Australia has around 130 employees within its Sydney and Melbourne offices, and various site offices throughout Australia. Goldwind Australia has successfully delivered several wind and solar projects in Australia, including Gullen Range Wind and Solar Farm and White Rock Wind Farm. The total installed capacity in Australia is currently 360MW with over 1500MW under construction or development.
Since 2012, Goldwind has been following the progress of the Stockyard Hill Wind Farm project in Victoria very closely, before agreeing to purchase it from Origin Energy in May 2017. The Stockyard Hill Wind Farm power purchase agreement is the largest wind farm power purchase agreement in Australia. Goldwind will supply its own wind turbines for the project, as well as construction, operations and maintenance capabilities.
Over 30 people in Goldwind’s local Australian team participated in the bidding process for this project. Goldwind’s team in China provided technical and financial support during this process. There was a strong focus on risk analysis as all teams worked closely with Australian and Chinese advisors. Goldwind’s participation in this project is solid recognition of the development of their wind turbine technology. Goldwind will install new GW3S wind turbines, maximising power generation and offering a very competitive power price to the market.
In our interview, Goldwind recognised that Australia is an attractive market due to stable GDP growth that drives steady power demand as well as the relatively stable policy and financial environment providing certainty for investors. One of the key factors for Goldwind’s success in Australia has been its transformation from a sole equipment supplier to wind project owner and manager covering the whole value chain. This rests on Goldwind Australia’s ability to combine the strength of the local Australian team with the support and advice from Goldwind head office in China.
Case study: Renewable energy
Goldwind Gullen Range Wind Farm.
Source: Image courtesy of Goldwind.
© 2018 KPMG, an Australian partnership and a member firm of the KPMG network of independent member firms affiliated with KPMG International Cooperative (“KPMG International”), a Swiss entity. All rights reserved. The KPMG name and logo are registered trademarks or trademarks of KPMG International. Liability limited by a scheme approved under Professional Standards Legislation.
24 Demystifying Chinese Investment in Australia | June 2018
Chinese investment in Australia by geography
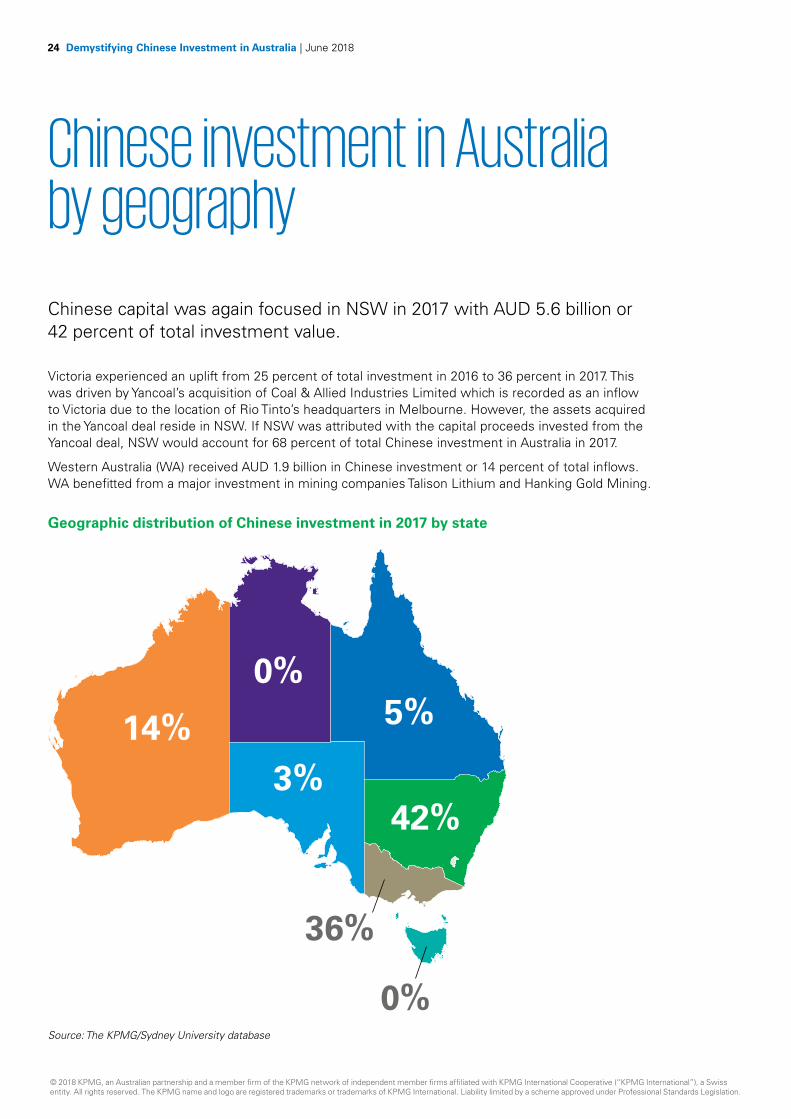
Chinese capital was again focused in NSW in 2017 with AUD 5.6 billion or 42 percent of total investment value.
Victoria experienced an uplift from 25 percent of total investment in 2016 to 36 percent in 2017. This was driven by Yancoal’s acquisition of Coal & Allied Industries Limited which is recorded as an inflow to Victoria due to the location of Rio Tinto’s headquarters in Melbourne. However, the assets acquired in the Yancoal deal reside in NSW. If NSW was attributed with the capital proceeds invested from the Yancoal deal, NSW would account for 68 percent of total Chinese investment in Australia in 2017.
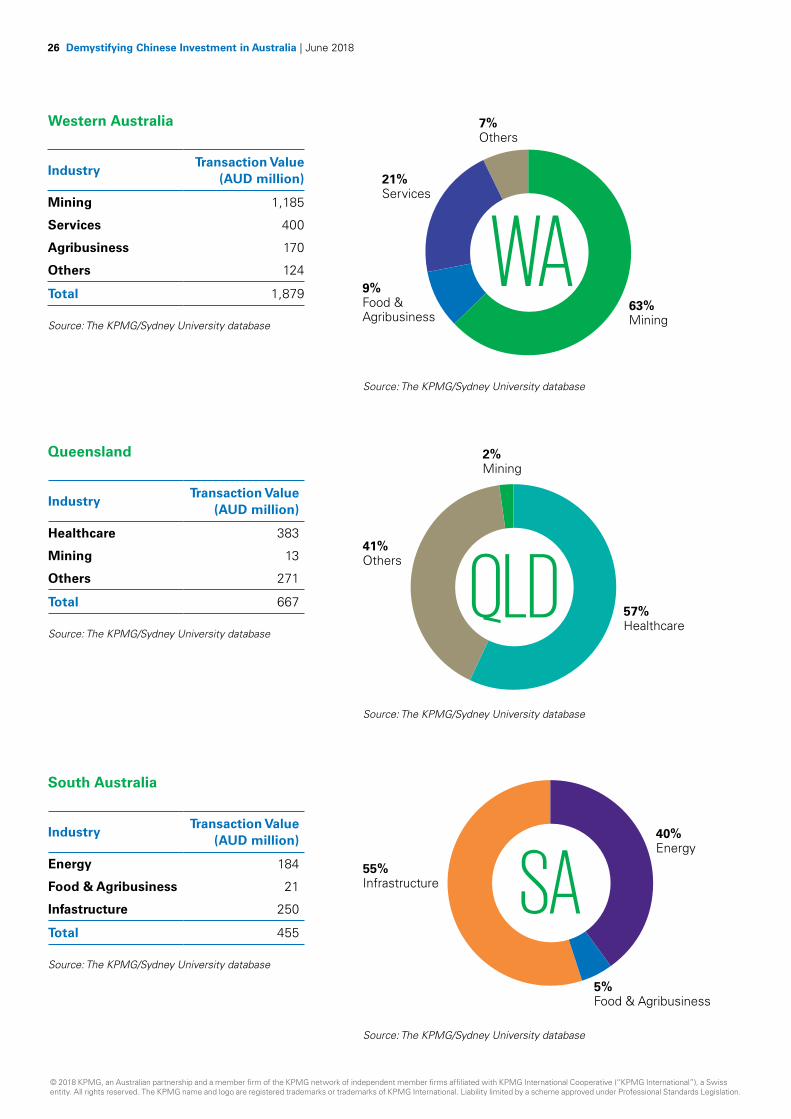
Western Australia (WA) received AUD 1.9 billion in Chinese investment or 14 percent of total inflows. WA benefitted from a major investment in mining companies Talison Lithium and Hanking Gold Mining.
Geographic distribution of Chinese investment in 2017 by state
Source: The KPMG/Sydney University database
42%
5%0%
36%
0%
14%3%
© 2018 KPMG, an Australian partnership and a member firm of the KPMG network of independent member firms affiliated with KPMG International Cooperative (“KPMG International”), a Swiss entity. All rights reserved. The KPMG name and logo are registered trademarks or trademarks of KPMG International. Liability limited by a scheme approved under Professional Standards Legislation.
Demystifying Chinese Investment in Australia | June 2018 25
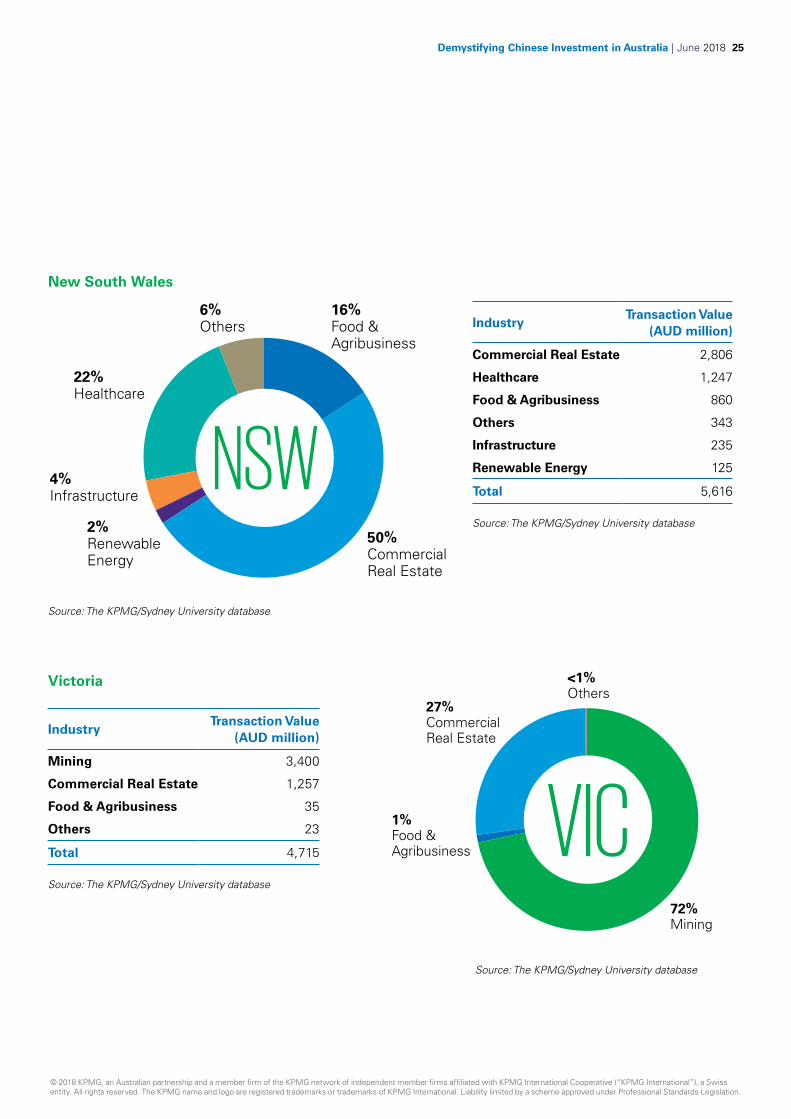
IndustryTransaction Value
(AUD million)
Commercial Real Estate 2,806
Healthcare 1,247
Food & Agribusiness 860
Others 343
Infrastructure 235
Renewable Energy 125
Total 5,616
Source: The KPMG/Sydney University database
New South Wales
Source: The KPMG/Sydney University database
50%Commercial Real Estate
16%Food & Agribusiness
2%Renewable Energy
4%Infrastructure
6%Others
22%Healthcare
NSW
IndustryTransaction Value
(AUD million)
Mining 3,400
Commercial Real Estate 1,257
Food & Agribusiness 35
Others 23
Total 4,715
Source: The KPMG/Sydney University database
Victoria
72%Mining
1%Food & Agribusiness
<1%Others
27%Commercial Real Estate
VICSource: The KPMG/Sydney University database
© 2018 KPMG, an Australian partnership and a member firm of the KPMG network of independent member firms affiliated with KPMG International Cooperative (“KPMG International”), a Swiss entity. All rights reserved. The KPMG name and logo are registered trademarks or trademarks of KPMG International. Liability limited by a scheme approved under Professional Standards Legislation.
26 Demystifying Chinese Investment in Australia | June 2018
South Australia
IndustryTransaction Value
(AUD million)
Energy 184
Food & Agribusiness 21
Infastructure 250
Total 455
Source: The KPMG/Sydney University database
Source: The KPMG/Sydney University database
Western Australia
IndustryTransaction Value
(AUD million)
Mining 1,185
Services 400
Agribusiness 170
Others 124
Total 1,879
Source: The KPMG/Sydney University database
63%Mining
9%Food & Agribusiness
7%Others
21%Services
WA
40%Energy
55%Infrastructure
5%Food & Agribusiness
SA
Queensland
IndustryTransaction Value
(AUD million)
Healthcare 383
Mining 13
Others 271
Total 667
Source: The KPMG/Sydney University database
57%Healthcare
41%Others
2%Mining
QLDSource: The KPMG/Sydney University database
Source: The KPMG/Sydney University database
© 2018 KPMG, an Australian partnership and a member firm of the KPMG network of independent member firms affiliated with KPMG International Cooperative (“KPMG International”), a Swiss entity. All rights reserved. The KPMG name and logo are registered trademarks or trademarks of KPMG International. Liability limited by a scheme approved under Professional Standards Legislation.
Demystifying Chinese Investment in Australia | June 2018 27
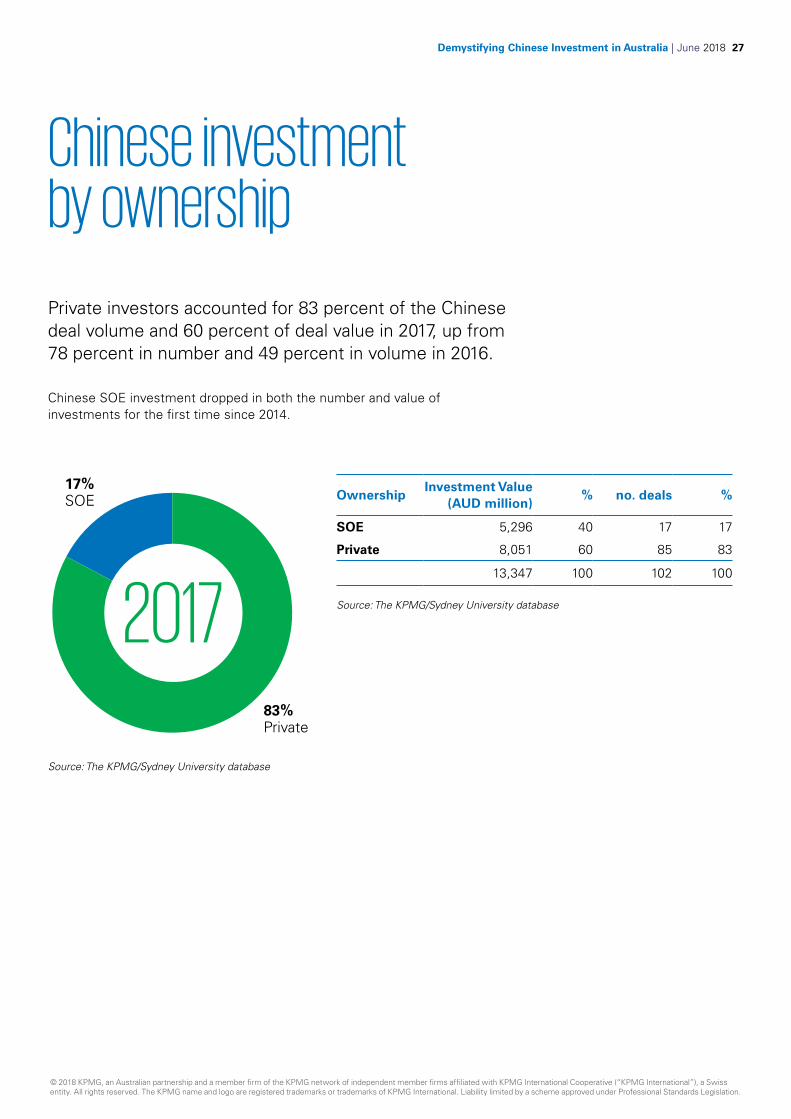
Chinese investment by ownership
Private investors accounted for 83 percent of the Chinese deal volume and 60 percent of deal value in 2017, up from 78 percent in number and 49 percent in volume in 2016.
Chinese SOE investment dropped in both the number and value of investments for the first time since 2014.
17%SOE
83%Private
2017
OwnershipInvestment Value
(AUD million)% no. deals %
SOE 5,296 40 17 17
Private 8,051 60 85 83
13,347 100 102 100
Source: The KPMG/Sydney University database
Source: The KPMG/Sydney University database
© 2018 KPMG, an Australian partnership and a member firm of the KPMG network of independent member firms affiliated with KPMG International Cooperative (“KPMG International”), a Swiss entity. All rights reserved. The KPMG name and logo are registered trademarks or trademarks of KPMG International. Liability limited by a scheme approved under Professional Standards Legislation.
28 Demystifying Chinese Investment in Australia | June 2018
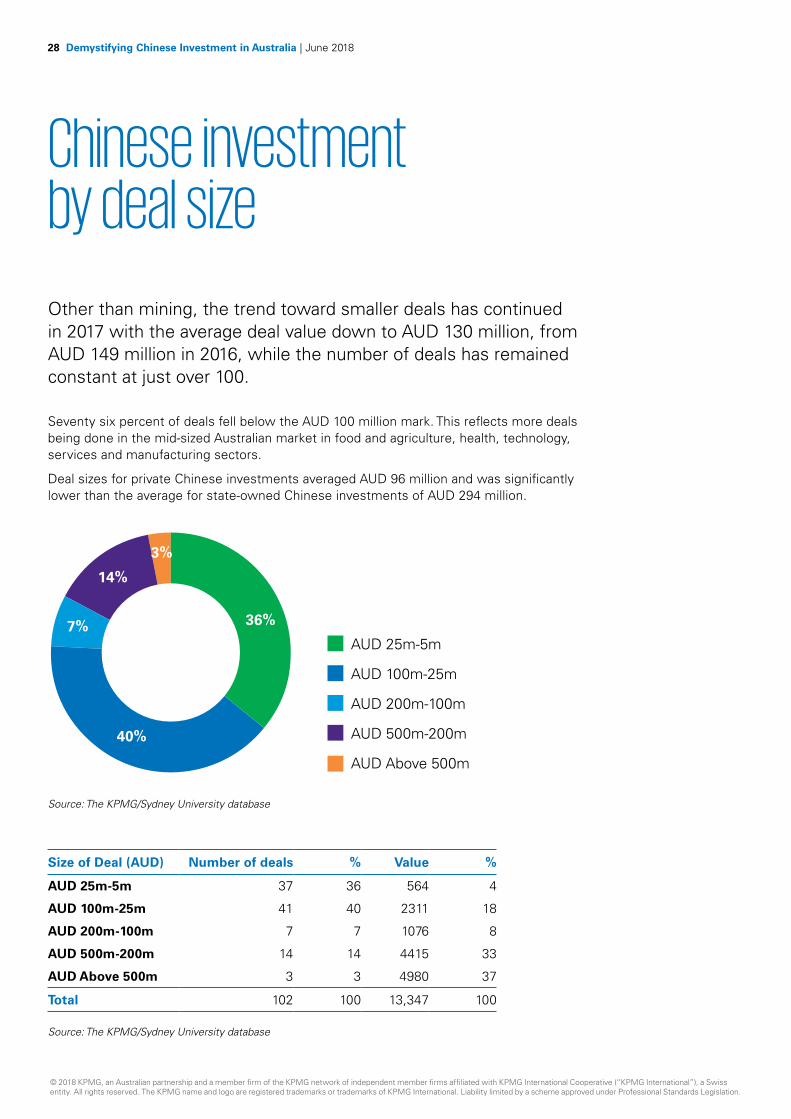
Chinese investment by deal size
Other than mining, the trend toward smaller deals has continued in 2017 with the average deal value down to AUD 130 million, from AUD 149 million in 2016, while the number of deals has remained constant at just over 100.
Seventy six percent of deals fell below the AUD 100 million mark. This reflects more deals being done in the mid-sized Australian market in food and agriculture, health, technology, services and manufacturing sectors.
Deal sizes for private Chinese investments averaged AUD 96 million and was significantly lower than the average for state-owned Chinese investments of AUD 294 million.
36%
40%
7%
14%
3%
AUD 25m-5m
AUD 100m-25m
AUD 200m-100m
AUD 500m-200m
AUD Above 500m
Source: The KPMG/Sydney University database
Size of Deal (AUD) Number of deals % Value %
AUD 25m-5m 37 36 564 4
AUD 100m-25m 41 40 2311 18
AUD 200m-100m 7 7 1076 8
AUD 500m-200m 14 14 4415 33
AUD Above 500m 3 3 4980 37
Total 102 100 13,347 100
Source: The KPMG/Sydney University database
© 2018 KPMG, an Australian partnership and a member firm of the KPMG network of independent member firms affiliated with KPMG International Cooperative (“KPMG International”), a Swiss entity. All rights reserved. The KPMG name and logo are registered trademarks or trademarks of KPMG International. Liability limited by a scheme approved under Professional Standards Legislation.
Demystifying Chinese Investment in Australia | June 2018 29
Special edition: Chinese Investors in Australia Survey
© 2018 KPMG, an Australian partnership and a member firm of the KPMG network of independent member firms affiliated with KPMG International Cooperative (“KPMG International”), a Swiss entity. All rights reserved. The KPMG name and logo are registered trademarks or trademarks of KPMG International. Liability limited by a scheme approved under Professional Standards Legislation.
30 Demystifying Chinese Investment in Australia | June 2018
About this surveyThe Chinese Investors in Australia Survey is a comprehensive survey of the experiences and views of Chinese investors in Australia. The survey provides insights into the perceptions of the Australian investment climate by Chinese investors and the key challenges they feel they face in Australia.
KPMG and The University of Sydney Business School acknowledge the generous support of the late Dr William Chiu, for enabling the first Chinese Investors in Australia Survey in 2014.
The 2018 Chinese Investors in Australia Survey was both survey and interview based and focused on latest sentiments covering 2017 and YTD 2018. KPMG and The University of Sydney Business School surveyed senior executives from 45 Chinese-invested companies located in Australia in April 2018. These companies operate in a broad range of sectors including real estate, mining, agribusiness, renewable energy, health, and infrastructure. The survey questions covered topical issues relating to experience, perceptions and confidence of Chinese companies investing in Australia. Where appropriate we have compared the survey results to 2014 and interview sentiments to those recorded in 2016.
We would like to thank the Chinese companies who participated in our survey and interviews for the purposes of this report.
Our results are divided in three sections:• Investment climate• Operational challenges• Performance and outlook
© 2018 KPMG, an Australian partnership and a member firm of the KPMG network of independent member firms affiliated with KPMG International Cooperative (“KPMG International”), a Swiss entity. All rights reserved. The KPMG name and logo are registered trademarks or trademarks of KPMG International. Liability limited by a scheme approved under Professional Standards Legislation.
Demystifying Chinese Investment in Australia | June 2018 31
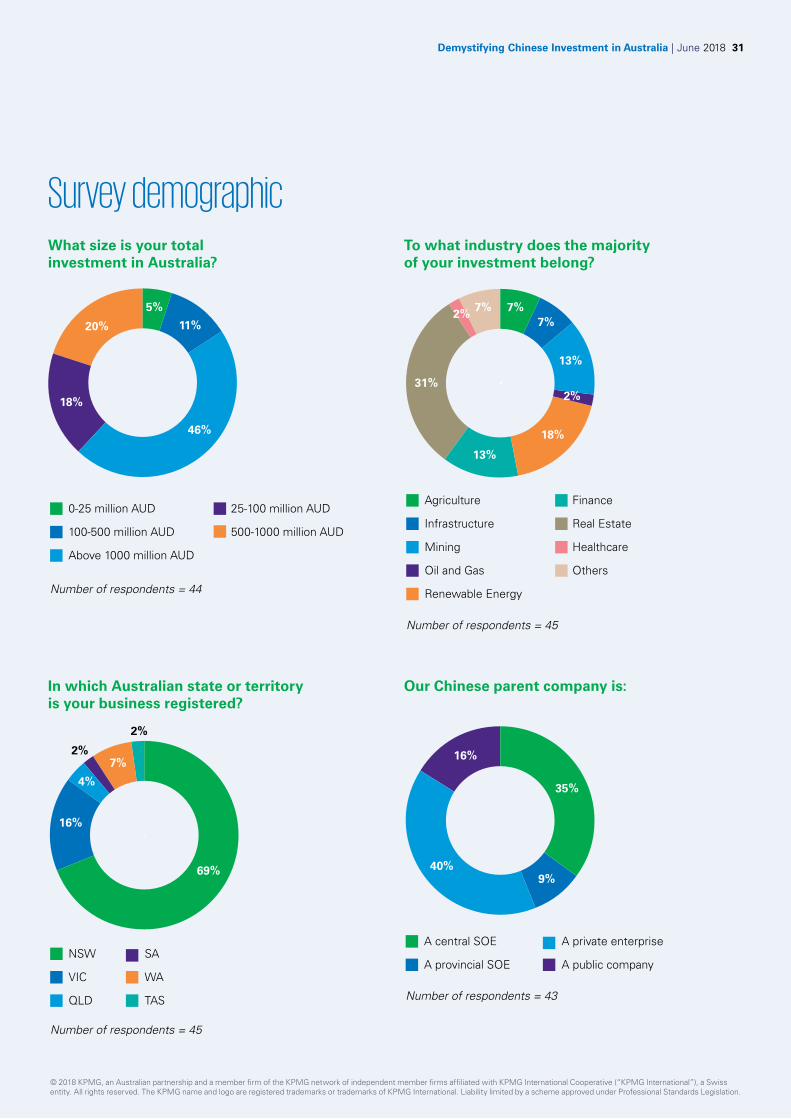
Survey demographic
7%7%7%
13%
2%
18%
13%
31%
2%
Agriculture
Infrastructure
Mining
Oil and Gas
Renewable Energy
Finance
Real Estate
Healthcare
Others
Number of respondents = 45
7%
2%
2%
69%
16%
4%
NSW
VIC
QLD
SA
WA
TAS
Number of respondents = 45
To what industry does the majority of your investment belong?
5%
11%
46%
18%
20%
0-25 million AUD
100-500 million AUD
Above 1000 million AUD
25-100 million AUD
500-1000 million AUD
Number of respondents = 44
What size is your total investment in Australia?
35%
40%
16%
9%
A central SOE
A provincial SOE
A private enterprise
A public company
Number of respondents = 43
In which Australian state or territory is your business registered?
Our Chinese parent company is:
© 2018 KPMG, an Australian partnership and a member firm of the KPMG network of independent member firms affiliated with KPMG International Cooperative (“KPMG International”), a Swiss entity. All rights reserved. The KPMG name and logo are registered trademarks or trademarks of KPMG International. Liability limited by a scheme approved under Professional Standards Legislation.
32 Demystifying Chinese Investment in Australia | June 2018
2017 investment climate
2017 was a year of significant volatility, marked by political debate in Australia about the role of Chinese investment in Australia as well as changes to ODI regulations in China.
This year’s survey captures a mood of cautious optimism as well as apprehension. While Chinese investors continue to regard Australia as a safe environment, they are more cautious to invest and feel less welcome than before.
Key findings:• Allegations about Chinese influence and increasing diplomatic tensions have
given Chinese companies the impression that they are less welcome to invest in Australia. Only 35 percent of the surveyed Chinese companies felt welcome to invest in Australia, a decline from 52 percent in 2014.
• Overall, Chinese investors find Australia a safer environment than many other countries. Our interviews confirmed that Australia’s rule of law, stable market institutions and comprehensive policies continue to attract Chinese investors. However, Chinese businesses are concerned about political uncertainty and the potential impact on the investment approval process.
• Since November 2016, the Chinese government has increased its scrutiny of capital outflows and now categorises outbound investment into encouraged, restricted, and prohibited transactions. The regulatory changes have impacted new investment in Australia. Over three quarters (77 percent) of respondents stated that Chinese government regulatory change have made it more difficult to invest in Australia.
• The tightening of currency controls has also made it more difficult for Chinese companies to source finance from China. Two thirds (65 percent) of the surveyed Chinese companies found it more difficult to get capital out of China in 2017. Private companies and listed companies are most affected by the capital control restrictions.
• The changes in ODI regulations are not seen by survey respondents as targeted at Australia, rather a correction of speculative or ‘irrational’ investment globally.
© 2018 KPMG, an Australian partnership and a member firm of the KPMG network of independent member firms affiliated with KPMG International Cooperative (“KPMG International”), a Swiss entity. All rights reserved. The KPMG name and logo are registered trademarks or trademarks of KPMG International. Liability limited by a scheme approved under Professional Standards Legislation.
Demystifying Chinese Investment in Australia | June 2018 33
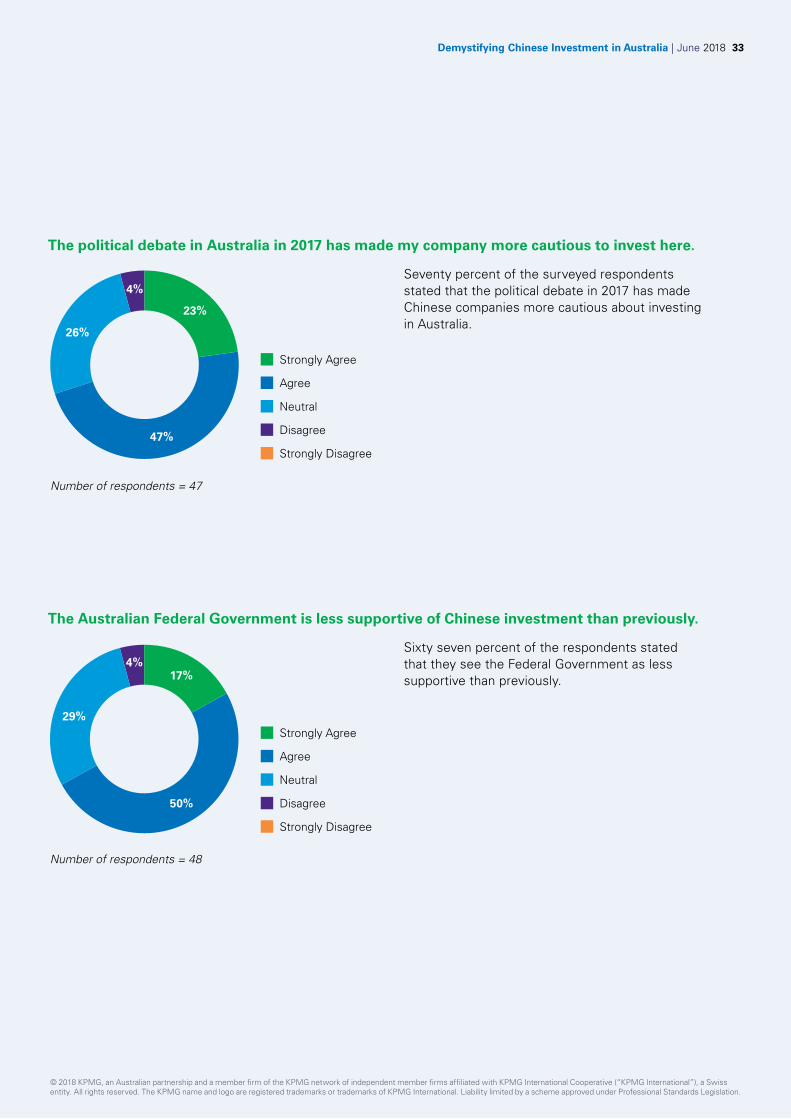
The political debate in Australia in 2017 has made my company more cautious to invest here.
Seventy percent of the surveyed respondents stated that the political debate in 2017 has made Chinese companies more cautious about investing in Australia.
23%
26%
4%
47%
Number of respondents = 47
Strongly Agree
Agree
Neutral
Disagree
Strongly Disagree
17%
29%
4%
50%
Number of respondents = 48
Strongly Agree
Agree
Neutral
Disagree
Strongly Disagree
The Australian Federal Government is less supportive of Chinese investment than previously.
Sixty seven percent of the respondents stated that they see the Federal Government as less supportive than previously.
© 2018 KPMG, an Australian partnership and a member firm of the KPMG network of independent member firms affiliated with KPMG International Cooperative (“KPMG International”), a Swiss entity. All rights reserved. The KPMG name and logo are registered trademarks or trademarks of KPMG International. Liability limited by a scheme approved under Professional Standards Legislation.
34 Demystifying Chinese Investment in Australia | June 2018
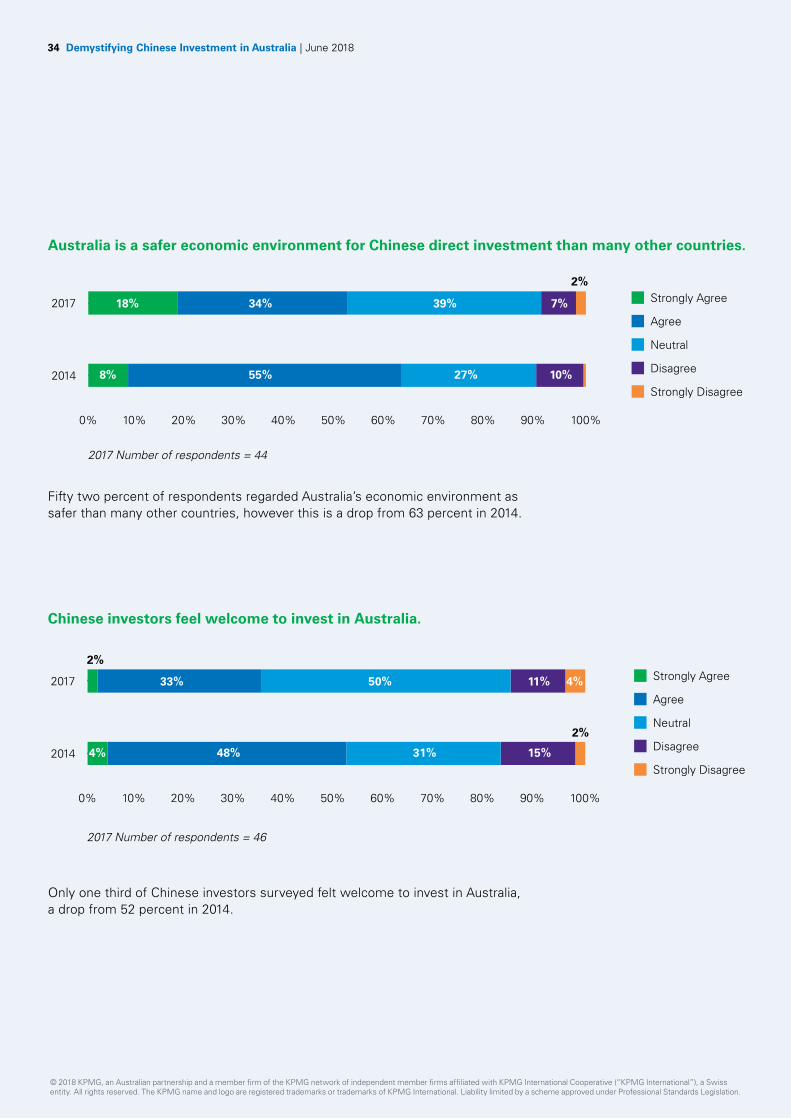
Australia is a safer economic environment for Chinese direct investment than many other countries.
2017
2%
2014
2017 Number of respondents = 44
0% 10% 20% 30% 40% 50% 60% 70% 80% 90% 100%
7%
10%27%55%8%
39%34%18% Strongly Agree
Agree
Neutral
Disagree
Strongly Disagree
Chinese investors feel welcome to invest in Australia.
2017
2014
2017 Number of respondents = 46
0% 10% 20% 30% 40% 50% 60% 70% 80% 90% 100%
4%11%
2%
15%31%48%4%
50%33%
2%Strongly Agree
Agree
Neutral
Disagree
Strongly Disagree
Only one third of Chinese investors surveyed felt welcome to invest in Australia, a drop from 52 percent in 2014.
Fifty two percent of respondents regarded Australia’s economic environment as safer than many other countries, however this is a drop from 63 percent in 2014.
© 2018 KPMG, an Australian partnership and a member firm of the KPMG network of independent member firms affiliated with KPMG International Cooperative (“KPMG International”), a Swiss entity. All rights reserved. The KPMG name and logo are registered trademarks or trademarks of KPMG International. Liability limited by a scheme approved under Professional Standards Legislation.
Demystifying Chinese Investment in Australia | June 2018 35
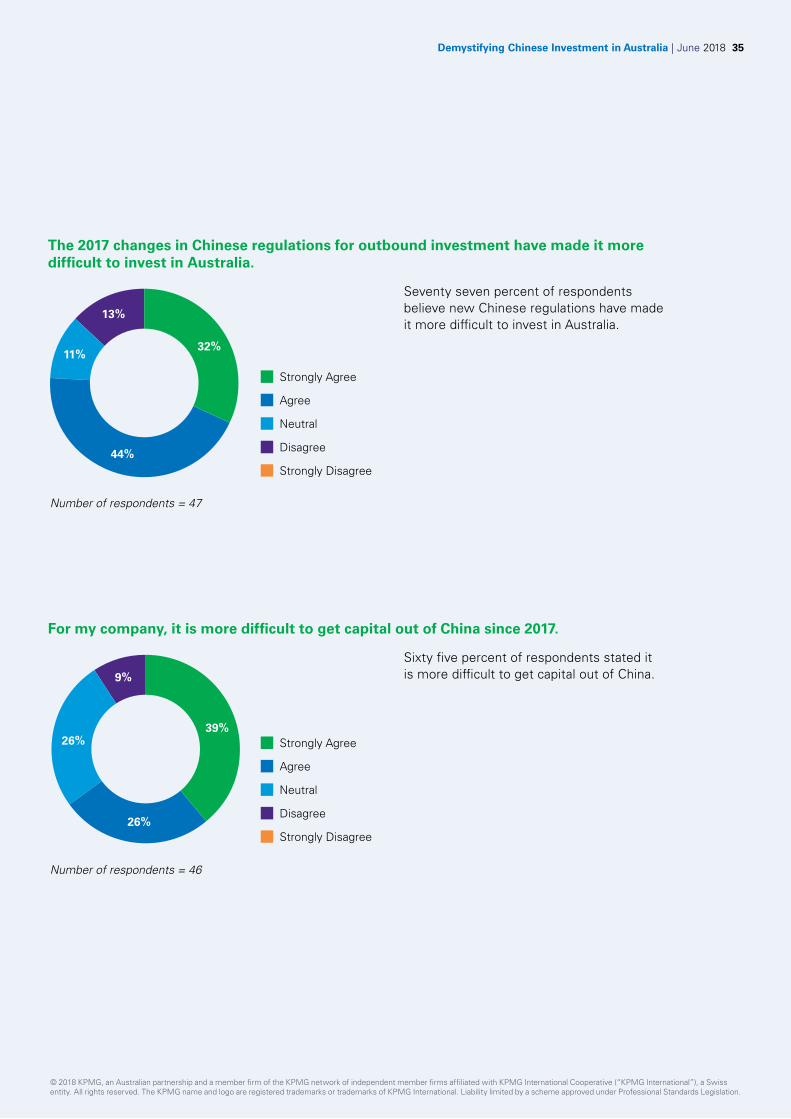
For my company, it is more difficult to get capital out of China since 2017.
39%
9%
26%
26%
Number of respondents = 46
Strongly Agree
Agree
Neutral
Disagree
Strongly Disagree
Sixty five percent of respondents stated it is more difficult to get capital out of China.
The 2017 changes in Chinese regulations for outbound investment have made it more difficult to invest in Australia.
32%
13%
11%
44%
Number of respondents = 47
Strongly Agree
Agree
Neutral
Disagree
Strongly Disagree
Seventy seven percent of respondents believe new Chinese regulations have made it more difficult to invest in Australia.
© 2018 KPMG, an Australian partnership and a member firm of the KPMG network of independent member firms affiliated with KPMG International Cooperative (“KPMG International”), a Swiss entity. All rights reserved. The KPMG name and logo are registered trademarks or trademarks of KPMG International. Liability limited by a scheme approved under Professional Standards Legislation.
36 Demystifying Chinese Investment in Australia | June 2018
Operational challenges
In this year’s survey, we focused on post-investment operational advantages and challenges facing Chinese companies in Australia.
Key findings:• Chinese investors cited ‘quick decision making’ as a key competitive advantage to
investing and competing in Australia. This may be at odds with the perception of some Australian vendors and advisors.
• Chinese investors place their trust foremost in the Australian business community followed by the state government, local councils and federal government.
• Among the social stakeholders, public media are seen as least supportive. The ratio of respondents agreeing that Australian media were supportive towards Chinese investment dropped from 16 percent in 2014 to 10 percent in 2017.
• Finding qualified staff is seen as the biggest difficulty for Chinese companies. For example, firms in the renewable energy sector regard the lack of qualified workers as a bottleneck for their operations in Australia.
• Australia is seen by Chinese investors as a more expensive country to operate in than the UK, US and Canada.
• Even as Chinese companies become more established in the Australian environment, there remains a trust gap between Chinese owners and Australian management.
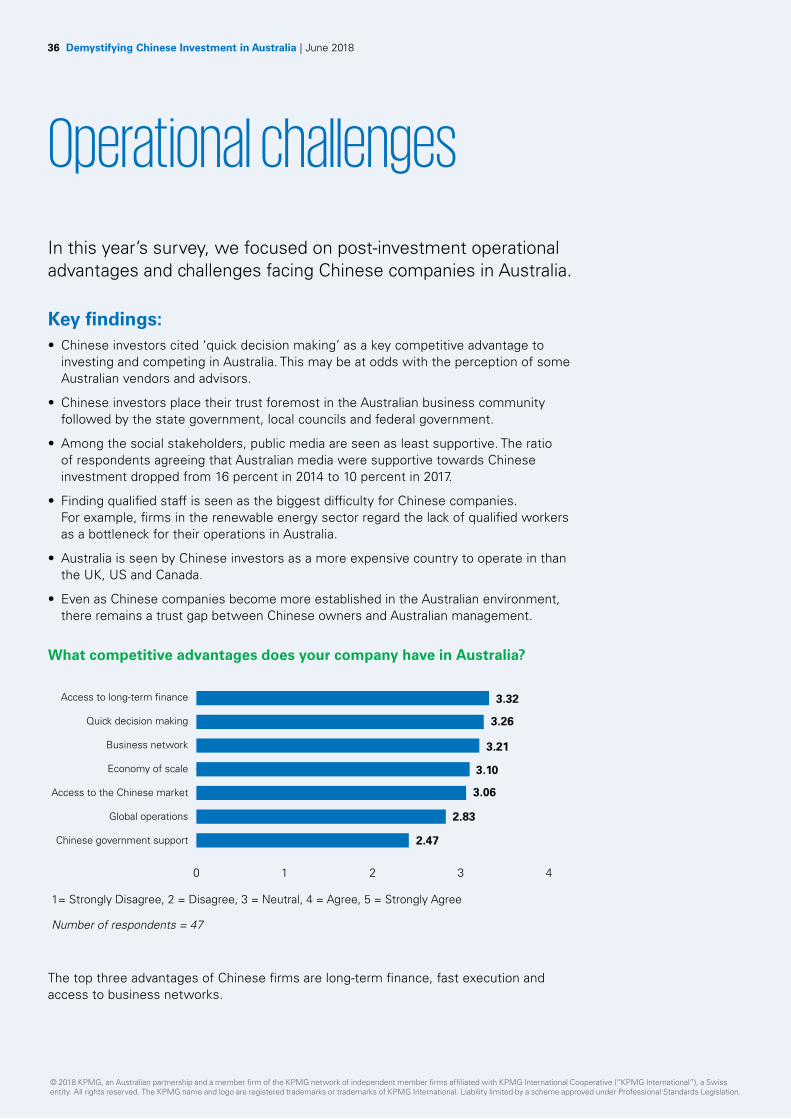
What competitive advantages does your company have in Australia?
1= Strongly Disagree, 2 = Disagree, 3 = Neutral, 4 = Agree, 5 = Strongly Agree
Access to long-term finance 3.32
3.26
3.21
3.10
3.06
2.47
Quick decision making
Business network
Economy of scale
Global operations
Chinese government support
Access to the Chinese market
Number of respondents = 47
0 1 2 3 4
2.83
The top three advantages of Chinese firms are long-term finance, fast execution and access to business networks.
© 2018 KPMG, an Australian partnership and a member firm of the KPMG network of independent member firms affiliated with KPMG International Cooperative (“KPMG International”), a Swiss entity. All rights reserved. The KPMG name and logo are registered trademarks or trademarks of KPMG International. Liability limited by a scheme approved under Professional Standards Legislation.
Demystifying Chinese Investment in Australia | June 2018 37
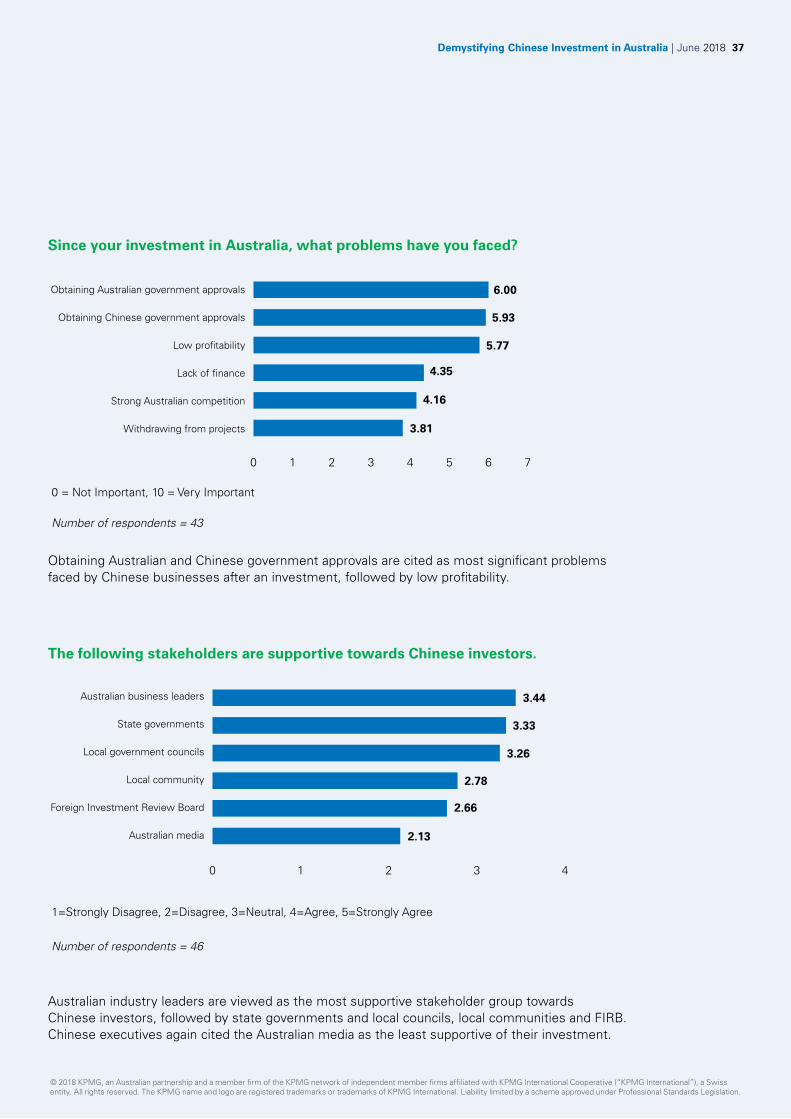
0 = Not Important, 10 = Very Important
Obtaining Australian government approvals 6.00
5.93
5.77
4.16
Obtaining Chinese government approvals
Low profitability
Lack of finance
Withdrawing from projects
Strong Australian competition
Number of respondents = 43
0 1 2 3 4 5 6 7
3.81
4.35
Since your investment in Australia, what problems have you faced?
Obtaining Australian and Chinese government approvals are cited as most significant problems faced by Chinese businesses after an investment, followed by low profitability.
1=Strongly Disagree, 2=Disagree, 3=Neutral, 4=Agree, 5=Strongly Agree
Australian business leaders
State governments
Local government councils
Local community
Australian media
Foreign Investment Review Board
Number of respondents = 46
0 1 2 3 4
3.44
3.33
3.26
2.13
2.66
2.78
Australian industry leaders are viewed as the most supportive stakeholder group towards Chinese investors, followed by state governments and local councils, local communities and FIRB. Chinese executives again cited the Australian media as the least supportive of their investment.
The following stakeholders are supportive towards Chinese investors.
© 2018 KPMG, an Australian partnership and a member firm of the KPMG network of independent member firms affiliated with KPMG International Cooperative (“KPMG International”), a Swiss entity. All rights reserved. The KPMG name and logo are registered trademarks or trademarks of KPMG International. Liability limited by a scheme approved under Professional Standards Legislation.
38 Demystifying Chinese Investment in Australia | June 2018
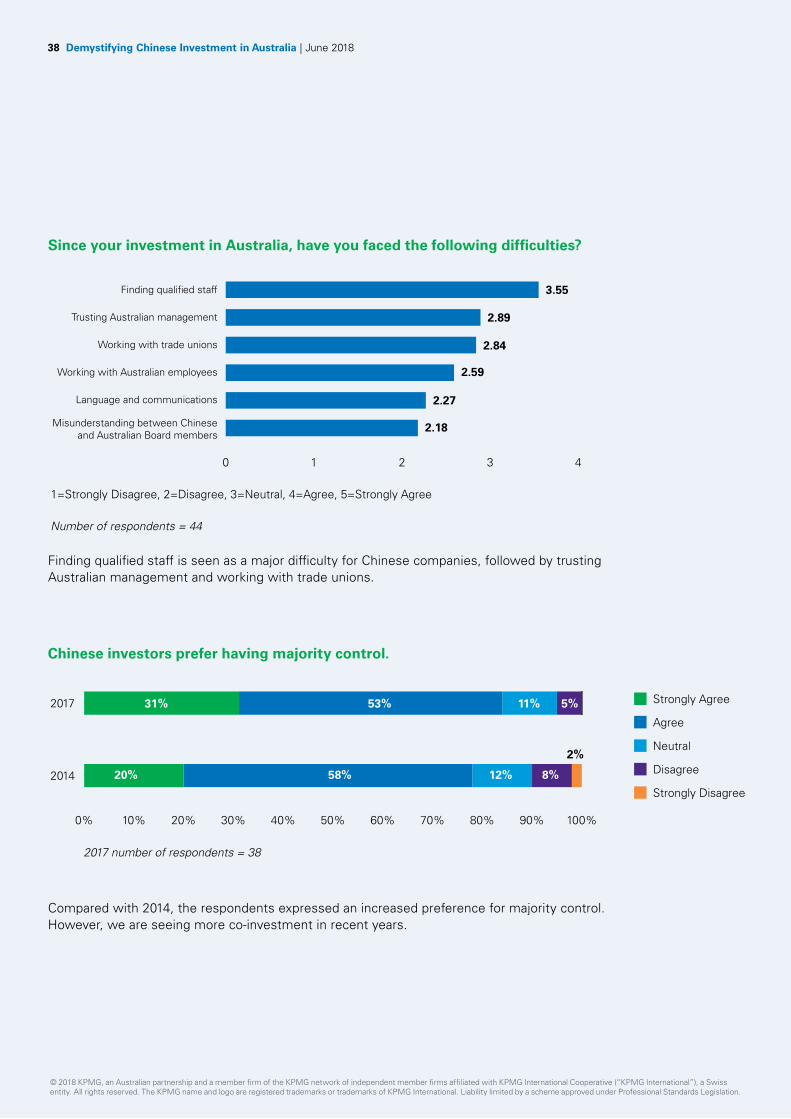
Since your investment in Australia, have you faced the following difficulties?
1=Strongly Disagree, 2=Disagree, 3=Neutral, 4=Agree, 5=Strongly Agree
Finding qualified staff 3.55
2.84
Trusting Australian management
Working with trade unions
Working with Australian employees
Misunderstanding between Chinese and Australian Board members
Language and communications
Number of respondents = 44
0 1 2 3 4
2.18
2.27
2.59
2.89
Finding qualified staff is seen as a major difficulty for Chinese companies, followed by trusting Australian management and working with trade unions.
2017
2014
2017 number of respondents = 38
0% 10% 20% 30% 40% 50% 60% 70% 80% 90% 100%
5%11%
2%
8%12%58%20%
53%31% Strongly Agree
Agree
Neutral
Disagree
Strongly Disagree
Compared with 2014, the respondents expressed an increased preference for majority control. However, we are seeing more co-investment in recent years.
Chinese investors prefer having majority control.
© 2018 KPMG, an Australian partnership and a member firm of the KPMG network of independent member firms affiliated with KPMG International Cooperative (“KPMG International”), a Swiss entity. All rights reserved. The KPMG name and logo are registered trademarks or trademarks of KPMG International. Liability limited by a scheme approved under Professional Standards Legislation.
Demystifying Chinese Investment in Australia | June 2018 39
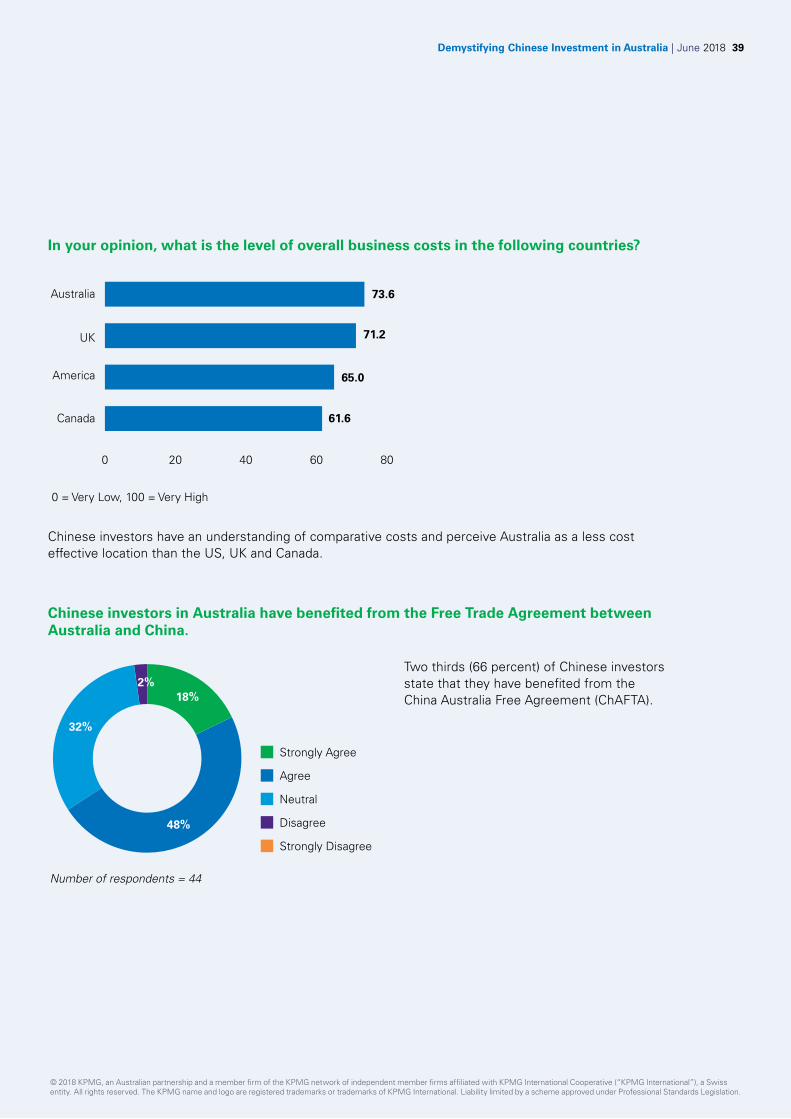
48%
18%2%
32%
Number of respondents = 44
Strongly Agree
Agree
Neutral
Disagree
Strongly Disagree
In your opinion, what is the level of overall business costs in the following countries?
0 = Very Low, 100 = Very High
Australia
UK
America
Canada
0 20 40 60 80
73.6
71.2
65.0
61.6
Chinese investors have an understanding of comparative costs and perceive Australia as a less cost effective location than the US, UK and Canada.
Two thirds (66 percent) of Chinese investors state that they have benefited from the China Australia Free Agreement (ChAFTA).
Chinese investors in Australia have benefited from the Free Trade Agreement between Australia and China.
© 2018 KPMG, an Australian partnership and a member firm of the KPMG network of independent member firms affiliated with KPMG International Cooperative (“KPMG International”), a Swiss entity. All rights reserved. The KPMG name and logo are registered trademarks or trademarks of KPMG International. Liability limited by a scheme approved under Professional Standards Legislation.
40 Demystifying Chinese Investment in Australia | June 2018
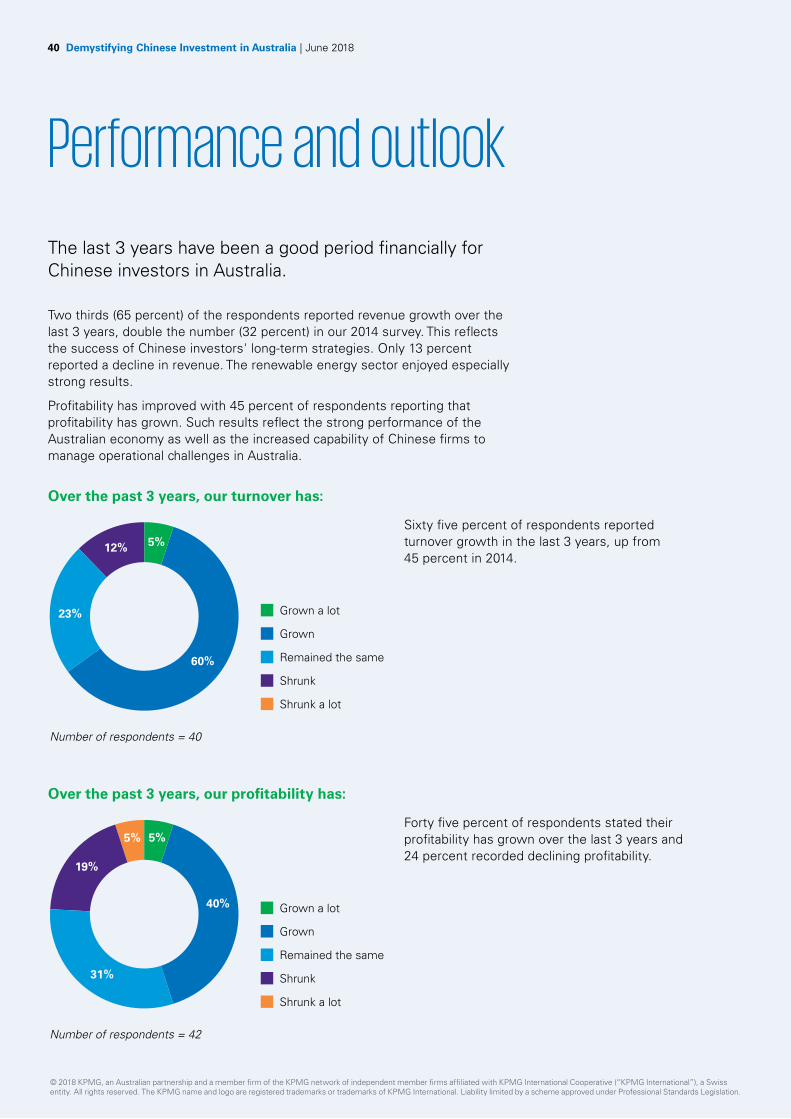
Performance and outlook
The last 3 years have been a good period financially for Chinese investors in Australia.
Two thirds (65 percent) of the respondents reported revenue growth over the last 3 years, double the number (32 percent) in our 2014 survey. This reflects the success of Chinese investors' long-term strategies. Only 13 percent reported a decline in revenue. The renewable energy sector enjoyed especially strong results.
Profitability has improved with 45 percent of respondents reporting that profitability has grown. Such results reflect the strong performance of the Australian economy as well as the increased capability of Chinese firms to manage operational challenges in Australia.
23%
12%
60%
5%
Number of respondents = 40
Grown a lot
Grown
Remained the same
Shrunk
Shrunk a lot
Sixty five percent of respondents reported turnover growth in the last 3 years, up from 45 percent in 2014.
Forty five percent of respondents stated their profitability has grown over the last 3 years and 24 percent recorded declining profitability.
Over the past 3 years, our turnover has:
Over the past 3 years, our profitability has:
31%
19%
40%
5% 5%
Number of respondents = 42
Grown a lot
Grown
Remained the same
Shrunk
Shrunk a lot
© 2018 KPMG, an Australian partnership and a member firm of the KPMG network of independent member firms affiliated with KPMG International Cooperative (“KPMG International”), a Swiss entity. All rights reserved. The KPMG name and logo are registered trademarks or trademarks of KPMG International. Liability limited by a scheme approved under Professional Standards Legislation.
Demystifying Chinese Investment in Australia | June 2018 41
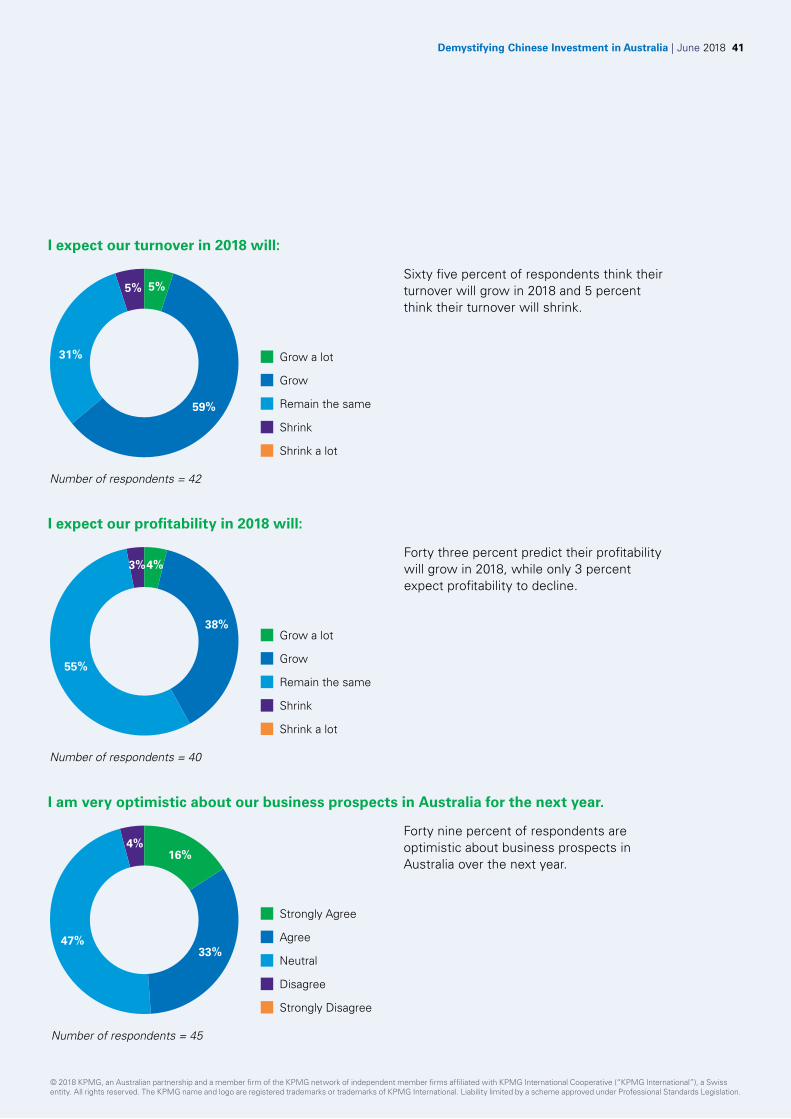
I expect our turnover in 2018 will:
I expect our profitability in 2018 will:
I am very optimistic about our business prospects in Australia for the next year.
31%
59%
5%5%
Number of respondents = 42
Grow a lot
Grow
Remain the same
Shrink
Shrink a lot
55%
38%
3%4%
Number of respondents = 40
Grow a lot
Grow
Remain the same
Shrink
Shrink a lot
47%33%
4%16%
Number of respondents = 45
Strongly Agree
Agree
Neutral
Disagree
Strongly Disagree
Sixty five percent of respondents think their turnover will grow in 2018 and 5 percent think their turnover will shrink.
Forty three percent predict their profitability will grow in 2018, while only 3 percent expect profitability to decline.
Forty nine percent of respondents are optimistic about business prospects in Australia over the next year.
© 2018 KPMG, an Australian partnership and a member firm of the KPMG network of independent member firms affiliated with KPMG International Cooperative (“KPMG International”), a Swiss entity. All rights reserved. The KPMG name and logo are registered trademarks or trademarks of KPMG International. Liability limited by a scheme approved under Professional Standards Legislation.
42 Demystifying Chinese Investment in Australia | June 2018
Final word
The numbers don’t lie – changing regulatory, political and economic landscapes have impacted new investment flows from China to the world, including Australia, in 2017. Our local survey has revealed sentiment has also shifted, with a higher level of apprehension by Chinese investors towards investing in Australia.
Chinese investment in Australia remains strong at USD 10.3 billion (AUD 13.3 billion) in 2017, despite an 11 percent (in USD terms) year-on-year decline. The pause in historic growth was an international phenomena, with global Chinese overseas direct investment falling by 29 percent during the year.
Importantly, Australia remains globally competitive for attracting Chinese investment – retaining its position as the second largest recipient of accumulated Chinese investment, with just under USD 100 billion since 2008. Chinese investors continue to be drawn to projects in Australia that relate to growing Chinese consumer demand and Chinese government priority initiatives. Australia can be pleased that the fall in the rate of growth of new investment from 2016 levels hasn’t been anywhere near as severe as experienced in the US (down 35 percent) and EU (down 17 percent).
2017 was a year of significant volatility, marked by political debate in Australia about the role of Chinese investment in our country, as well as changes to ODI regulations in China. Although the last three years have been a good period financially for Chinese investors in Australia – with 65 percent of respondents reporting revenue growth, and 45 percent profitability growth – 70 percent of respondents stated that the political debate had made Chinese companies more cautious about investing in Australia. And 67 percent see the Federal Government as less supportive than previously. The Australian media was cited as the group least supportive of their investment; with Australian business leaders the most supportive.
The resultant mood shift is clear, with our survey results revealing that confidence in the Australian market as a safe investment destination has declined between 2014 and 2018. While most Chinese investors retained a level of optimism about their Australian investments some investors, especially SOEs, are apprehensive due to diplomatic tensions and the sense of feeling unwelcome. Only 35 percent of surveyed companies felt welcome to invest in Australia – a notable decline from 52 percent in 2014.
Lack of trust in the Australian government and media remains a notable antagonism for Chinese investors, with the ‘acquisition’ of social licence appearing for the first time as a major challenge in 2017.
Looking ForwardAustralia’s relationship with China, while experiencing a period of heightened tension, is mature and deeply established in trade and investment and increasingly in society and culture through education, tourism and migration.
Chinese investors are increasingly conscious of the need to acquire assets, knowledge and technology and then leverage their links to the Chinese market for profitable growth, rather than base their investment on the expected growth of the domestic Australian economy alone. They are investing with a long-term focus – and this is positive for Australia.
Australia’s long-term economic interests remain linked to China, a market that cannot be underestimated in terms of opportunity or opportunity cost. In addition to the top end of town, we believe that medium sized Australian companies with high quality food and health products, leading technology, services and advanced manufacturing capabilities have an incredible opportunity to grow through trade and investment. Australian SMEs have expressed and demonstrated the appetite and ambition to make this work, but need support from government.
It is important that the Australian Government and business community collaborate to encourage further investment in the right areas. Australia stands to make sustained economic, social and diplomatic gains by nurturing long-term partnerships between Australian companies and Chinese investors.
© 2018 KPMG, an Australian partnership and a member firm of the KPMG network of independent member firms affiliated with KPMG International Cooperative (“KPMG International”), a Swiss entity. All rights reserved. The KPMG name and logo are registered trademarks or trademarks of KPMG International. Liability limited by a scheme approved under Professional Standards Legislation.

Demystifying Chinese Investment in Australia | June 2018 43
Kyle Chalmers instructs school children during a visit by South Australian Premier Steven Marshall to a primary school in Shanghai, China.
Credit: DAVID MARIUZ AAP Image
© 2018 KPMG, an Australian partnership and a member firm of the KPMG network of independent member firms affiliated with KPMG International Cooperative (“KPMG International”), a Swiss entity. All rights reserved. The KPMG name and logo are registered trademarks or trademarks of KPMG International. Liability limited by a scheme approved under Professional Standards Legislation.
The information contained in this document is of a general nature and is not intended to address the objectives, financial situation or needs of any particular individual or entity. It is provided for information purposes only and does not constitute, nor should it be regarded in any manner whatsoever, as advice and is not intended to influence a person in making a decision, including, if applicable, in relation to any financial product or an interest in a financial product. Although we endeavour to provide accurate and timely information, there can be no guarantee that such information is accurate as of the date it is received or that it will continue to be accurate in the future. No one should act on such information without appropriate professional advice after a thorough examination of the particular situation.
To the extent permissible by law, KPMG and its associated entities shall not be liable for any errors, omissions, defects or misrepresentations in the information or for any loss or damage suffered by persons who use or rely on such information (including for reasons of negligence, negligent misstatement or otherwise).
© 2018 KPMG, an Australian partnership and a member firm of the KPMG network of independent member firms affiliated with KPMG International Cooperative (“KPMG International”), a Swiss entity. All rights reserved.
The KPMG name and logo and are registered trademarks or trademarks of KPMG International.
Liability limited by a scheme approved under Professional Standards Legislation.
June 2018. 240765059LOBS.
Doug FergusonPartner in Charge, Asia and International MarketsAdjunct professor,University of Sydney Business School
KPMG AustraliaT: +61 9335 7140M: +6140415363E: [email protected]
Helen Zhi DentPartner in Charge,China Business Group
KPMG AustraliaT: +61 2 9335 7059E: [email protected]
Vaughn BarberGlobal Chair, KPMG Global China Practice
KPMG ChinaT: +86 10 8508 7071E: [email protected]
Hans HendrischkeProfessor of Chinese Business & Management China Studies Centre/Business School
The University of SydneyT: +61 2 9351 3107M: +61 407 188 287E: [email protected]
Wei LiLecturer in International Business,University of Sydney Business School
The University of SydneyT: +61 2 9036 6399E [email protected]
Michael ZhangHead of China Desk, Australia
JLL AustraliaT: +61 2 9220 8672 M: +61 448 778 634 E: [email protected]
Authors and key contactsFor further information contact:
Report contributorsSissi QianKristin SilvaJames Levy Cathy AiPeter Chong