Demonstration Trupti Joshi Computer Science Department 317 Engineering Building North E-mail:...
34
Demonstration Trupti Joshi Computer Science Department 317 Engineering Building North E-mail: [email protected] 573-884-3528(O)
-
date post
21-Dec-2015 -
Category
Documents
-
view
212 -
download
0
Transcript of Demonstration Trupti Joshi Computer Science Department 317 Engineering Building North E-mail:...

Demonstration
Trupti Joshi
Computer Science Department317 Engineering Building North
E-mail: [email protected](O)

Examples
Microarray Data GeneSpring Functional Analysis Pathway Analysis
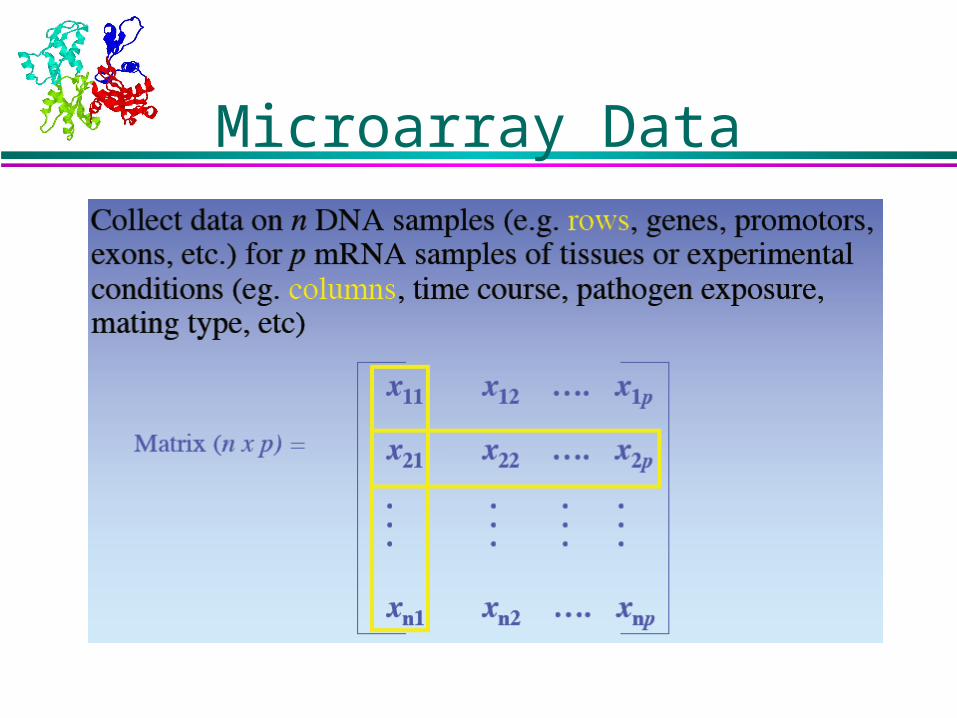
Microarray Data

DATA
Affymetrix Chips-Experiments: 4mer,8mer,Chitin-Mix,Mock(Raw data, Expt Details, Gene-Chip Analysis, Processed data.txt)-3 Replicates each

Affymetrix : Raw Data .CEL

Affymetrix : Report .RPT

Affymetrix : Processed Data .TXT

Post- Normalization Calculations: Log Transformations and Fold Change
Control

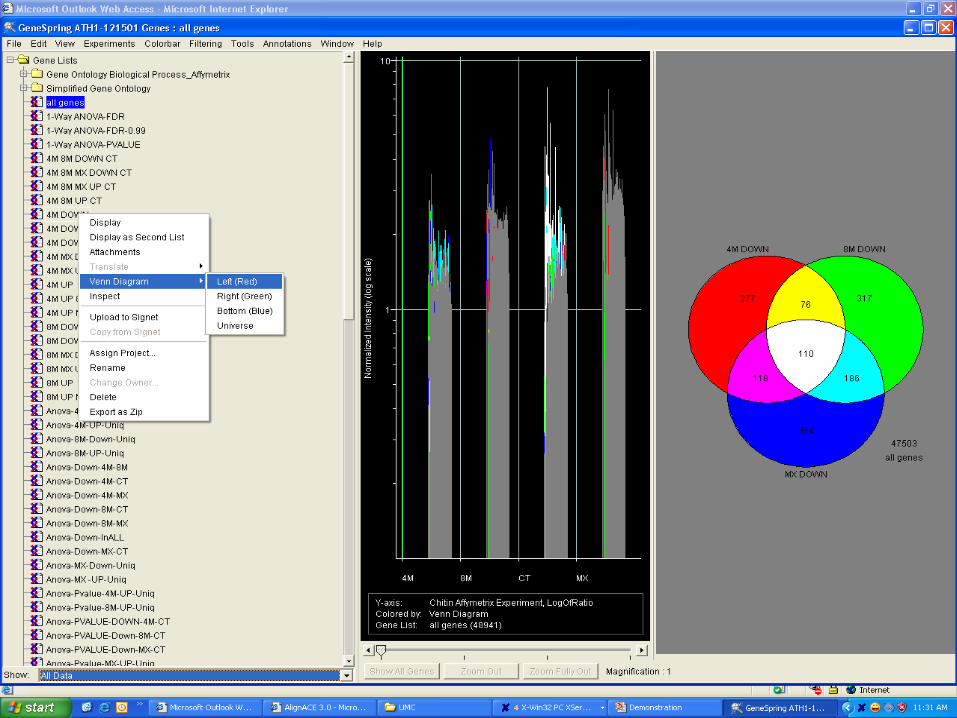
GeneSpring Software
GeneSpring (Silicon Genetics) Broadly used Nice user interface Data Normalization (Lowess, etc.) Powerful ANOVA statistical analysis
t-test/1-way ANOVA test 2-way ANOVA tests 1-way post-hoc tests for reliably identifying differentially expressed genes
Incorporation of different analysis tools Clustering Visual filtering Pathway viewing Scripting


Normalization in GeneSpring


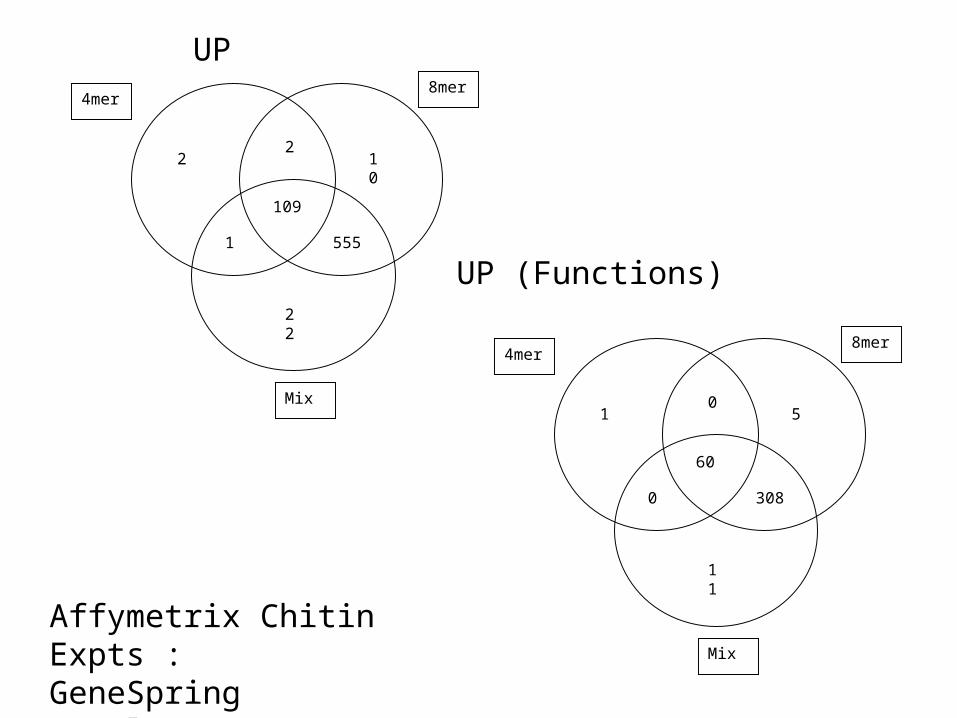
2
109
210
555
22
1
4mer8mer
Mix
UP
UP (Functions)
1
60
05
308
11
0
4mer8mer
Mix
Affymetrix Chitin Expts : GeneSpring Results

Function Analysis : GO
Aim:
To study functional categories distribution based on Gene Ontology Annotations in order to understand the genes and pathways involved in experimental conditions.
Three key parts: gene name/id
GO term(s)
evidence for association

3 Ontologies A gene product has one or more molecular
functions and is used in one or more biological processes; it might be associated with one or more cellular components.
For example, the gene product cytochrome c can be described by the
-molecular function term electron transporter activity,
-biological process terms oxidative phosphorylation and induction of cell death,
-cellular component terms mitochondrial matrix and mitochondrial
inner membrane.

Example Ontology

1. Downloads
• Ontologies – (various – GO, OBO, XML, OWL MySQL)
• Annotations – gene association files
• Ontologies and Annotations – MySQL and XML
2. Web-based access
• AmiGO (http://www.godatabase.org)
• QuickGO (http://www.ebi.ac.uk/ego)
How to access the GO and its annotations

• Access gene product functional information
• Provide a link between biological knowledge and …
•gene expression profiles
•proteomics data
• Find how much of a proteome is involved in a process/ function/ component in the cell
• using a GO-Slim (a slimmed down version of GO to summarize biological attributes of a proteome)
• Map GO terms and incorporate manual GOA annotation into own databases
• to enhance your dataset
• or to validate automated ways of deriving information about gene function (text-mining).
What can scientists do with GO?

GO for microarray analysis
Annotations give ‘function’ label to genes
Ask meaningful questions of microarray data e.g.genes involved in the same process, same/different
expression patterns?

Microarray analysis
Whole genome analysis(J. D. Munkvold et al., 2004)

Function Distribution of All Annotated Arabidopsis Genes

Up regulated - All in 8Mer (373 genes)
0%
0%0%0%0%0%1%
0%2%
response to stress
4%
cell communication
8%response to
external stimulus12%
cell growth and/or maintenance
19%
metabolism47%
cell death7%
cell communication
cell death
cell differentiation
cell growth and/ormaintenancemembrane fusion
morphogenesis
regulation of geneexpression\, epigeneticaging
embryonic development
homeostasis
metabolism
nodulation
response to endogenousstimulusresponse to externalstimulus response to stress
Down regulated - All in 8Mer (35 genes)
2%
response to external stimulus
4%
cell communication
4%
response to stress
4%
response to endogenous
stimulus12%
cell growth and/or
maintenance20%
metabolism54%
cell communication
cell growth and/or maintenance
morphogenesis
metabolism
response to endogenous stimulus
response to external stimulus
response to stress
GO Biological Process

UP 8M-ALL
14%
9%
0%
22%
0%13%
8%
14%
3%
1%
6%
8%2%
METABOLISM
ENERGY
CELL CYCLE AND DNA PROCESSING
TRANSCRIPTION
PROTEIN SYNTHESIS
PROTEIN FATE
CELLULAR TRANSPORT, TRANSPORTFACILITATION AND TRANSPORT ROUTES
CELLULAR COMMUNICATION/SIGNALTRANSDUCTION MECHANISM
CELL RESCUE, DEFENSE AND VIRULENCE
INTERACTION WITH THE CELLULARENVIRONMENT
INTERACTION WITH THE ENVIRONMENT
CELL FATE
DEVELOPMENT
DOWN 8M-ALL
14%
12%
8%
30%
12%
8%
8%
4%4%
METABOLISM
ENERGY
CELL CYCLE AND DNA PROCESSING
TRANSCRIPTION
PROTEIN FATE
CELLULAR TRANSPORT, TRANSPORTFACILITATION AND TRANSPORT ROUTES
CELLULAR COMMUNICATION/SIGNALTRANSDUCTION MECHANISM
CELL RESCUE, DEFENSE AND VIRULENCE
INTERACTION WITH THE ENVIRONMENT
MIPS Function

SAMPLE 1 : Bar Plot
0.47 (52)
2.62 (1)
2.62 (2)
2.62 (1)
1.69 (302)
0.87 (1)
0.52 (10)
0.44 (1)
0.37 (7)
0.26 (2)
0.21 (1)
0.08 (1) response to stress
morphogenesis
response to endogenous stimulus
response to external stimulus
post-embryonic development
cell growth and/or maintenance
cell communication
regulation of gene expression\, epigenetic
metabolism
pattern specification
aging
secretion
Fu
nct
ion
Cat
ego
ries
Ratio Observed/Expected
GO FUNCTIONS
WS 5hr
Sample 1 : 0-3 mm
Sample 2 : 3-11 mm
SAMPLE 2 : Bar Plot
0.23 (1)0.24 (2)0.26 (3)
0.49 (1)0.57 (2)0.61 (10)0.62 (11)0.67 (65)
0.91 (1)1.50 (241)
1.95 (1)2.44 (2)
morphogenesis response to endogenous stimulus
response to stresspost-embryonic development
cell differentiation cell communication
response to external stimuluscell growth and/or maintenance
regulation of gene expression\, epigeneticmetabolism
pattern specificationaging
Fu
nct
ion
al C
ateg
ori
es
Ratio Observed/Expected
* Numbers of genes observed are shown in brackets

GO for microarray analysis
experimental condition
Gen
e
com
pone
nt
proc
ess
func
tion

Selected Gene Tree: pearson lw n3d ...Branch color classification:Set_LW_n3d_5p_...
Colored by: Copy of Copy of C5_RMA (Defa...Gene List: all genes (14010)
attacked
time
control
Puparial adhesionMolting cyclehemocyanin
Defense responseImmune responseResponse to stimulusToll regulated genesJAK-STAT regulated genes
Immune responseToll regulated genes
Amino acid catabolismLipid metobolism
Peptidase activityProtein catabloismImmune response
Selected Gene Tree: pearson lw n3d ...Branch color classification:Set_LW_n3d_5p_...
Colored by: Copy of Copy of C5_RMA (Defa...Gene List: all genes (14010)
Bregje Wertheim at the Centre for Evolutionary Genomics, Department of Biology, UCL and Eugene Schuster Group, EBI.
MicroArray data analysis

Color indicates up/down regulation
GoMiner Tool, John Weinstein et al, NCI: Genome Biol. 4 (R28) 2003
Apotosis Regulator
Red: up by 1.5 fold
Blue: down 1.5 fold

KEGG Pathways Analysis
List of Arabidopsis genes assigned to KEGG Pathways acquired
UP or DOWN regulated genes mapped to Pathways

AT1G65930; AT5G14590;
AT5G08300
AT5G08300 ; AT2G05710; AT2G05710; AT4G35830; AT2G05710;
AT2G47510
AT5G43330; AT3G47520 ; AT5G09660; AT3G15020
AT5G55070
AT3G55410; AT3G55410; AT3G55410
AT2G42790
Red : 5hr 0-3mm Blue : 5hr 3-11 mm Purple : 48hr 0-3mm Green : 48 hr 3-11mm

AT3G47340
Red : 5hr 0-3mm Blue : 5hr 3-11 mm Purple : 48hr 0-3mm Green : 48 hr 3-11mm
AT1G72330
AT4G24830
AT5G65010

Examples
Microarray Data GeneSpring Functional Analysis Pathway Analysis