Demonstration of Regenerable, Large-scale Ion Exchange ... · Demonstration of Regenerable,...
96
FINAL REPORT Demonstration of Regenerable, Large-scale Ion Exchange System Using WBA Resin in Rialto, CA ESTCP Project ER-201168 December 2012 Jeffrey Rine Edward Coppola Andrea Davis Applied Research Associates, Inc.
Transcript of Demonstration of Regenerable, Large-scale Ion Exchange ... · Demonstration of Regenerable,...

FINAL REPORT Demonstration of Regenerable, Large-scale Ion Exchange
System Using WBA Resin in Rialto, CA
ESTCP Project ER-201168
December 2012
Jeffrey Rine Edward Coppola Andrea Davis Applied Research Associates, Inc.

Standard Form 298 (Rev. 8/98)
REPORT DOCUMENTATION PAGE
Prescribed by ANSI Std. Z39.18
Form Approved OMB No. 0704-0188
The public reporting burden for this collection of information is estimated to average 1 hour per response, including the time for reviewing instructions, searching existing data sources, gathering and maintaining the data needed, and completing and reviewing the collection of information. Send comments regarding this burden estimate or any other aspect of this collection of information, including suggestions for reducing the burden, to the Department of Defense, Executive Services and Communications Directorate (0704-0188). Respondents should be aware that notwithstanding any other provision of law, no person shall be subject to any penalty for failing to comply with a collection of information if it does not display a currently valid OMB control number. PLEASE DO NOT RETURN YOUR FORM TO THE ABOVE ORGANIZATION. 1. REPORT DATE (DD-MM-YYYY) 2. REPORT TYPE 3. DATES COVERED (From - To)
4. TITLE AND SUBTITLE 5a. CONTRACT NUMBER
5b. GRANT NUMBER
5c. PROGRAM ELEMENT NUMBER
5d. PROJECT NUMBER
5e. TASK NUMBER
5f. WORK UNIT NUMBER
6. AUTHOR(S)
7. PERFORMING ORGANIZATION NAME(S) AND ADDRESS(ES) 8. PERFORMING ORGANIZATION REPORT NUMBER
9. SPONSORING/MONITORING AGENCY NAME(S) AND ADDRESS(ES) 10. SPONSOR/MONITOR'S ACRONYM(S)
11. SPONSOR/MONITOR'S REPORT NUMBER(S)
12. DISTRIBUTION/AVAILABILITY STATEMENT
13. SUPPLEMENTARY NOTES
14. ABSTRACT
15. SUBJECT TERMS
16. SECURITY CLASSIFICATION OF: a. REPORT b. ABSTRACT c. THIS PAGE
17. LIMITATION OF ABSTRACT
18. NUMBER OF PAGES
19a. NAME OF RESPONSIBLE PERSON
19b. TELEPHONE NUMBER (Include area code)

ESTCP Project No. ER-201168 ARA Project No. 001060
ii
Table of Contents
LIST OF FIGURES .................................................................................................................................................. III LIST OF TABLES .................................................................................................................................................... IV ACRONYMS ................................................................................................................................................................ 1 ACKNOWLEDGEMENTS ........................................................................................................................................ 3 EXECUTIVE SUMMARY ......................................................................................................................................... 4
1.0 INTRODUCTION ..................................................................................................................... 7 1.1. Background ................................................................................................................................................... 7 1.2. Objective of the Demonstration ..................................................................................................................... 7 1.3. Regulatory Drivers ........................................................................................................................................ 7
2.0 TECHNOLOGY ....................................................................................................................... 9 2.1. Technology Description ................................................................................................................................ 9 2.2. Technology Development ............................................................................................................................ 11 2.3. Advantages and Limitations of the WBA IX Technology ............................................................................. 13
3.0 PERFORMANCE OBJECTIVES .............................................................................................. 14 3.1. Performance Objective: Meet Perchlorate Regulatory Standard ............................................................... 16 3.2. Performance Objective: Demonstrate Post Treatment Capability .............................................................. 16 3.3. Performance Objective: Minimize Process Waste ...................................................................................... 17 3.4. Performance Objective: Treatment of Spent Regenerating Stream ............................................................ 19 3.5. Performance Objective: Perchlorate Bleed from Regenerated Vessel ........................................................ 19 3.6. Performance Objective: Treatment Flow Rate............................................................................................ 20 3.7. Performance Objective: Operating Costs ................................................................................................... 20 3.8. Performance Objective: System Scalability ............................................................................................... 22 3.9. Performance Objective: Predict WBA Resin Capacity ............................................................................... 22 3.10. Performance Objective: System Control During Treatment and Regeneration Cycles ............................ 24
4.0 SITE DESCRIPTION .............................................................................................................. 25 4.1. Site Location and History ............................................................................................................................ 25 4.2. Site Geology/Hydrogeology ........................................................................................................................ 26 4.3. Contaminant Distribution ........................................................................................................................... 26
5.0 TEST DESIGN....................................................................................................................... 28 5.1. Conceptual Experimental Design ................................................................................................................ 28 5.2. Baseline Characterization Activities ........................................................................................................... 28 5.3. Treatability or Laboratory Study Results .................................................................................................... 29 5.4. Design and Layout of Technology Components .......................................................................................... 29 5.5. Field Testing ............................................................................................................................................... 37 5.6. Sampling Methods ....................................................................................................................................... 42 5.7. Sampling Results ......................................................................................................................................... 46 5.7.1 Perchlorate Analysis ................................................................................................................................. 46 5.7.2 Post Treatment—Langelier Saturation Index (LSI) .................................................................................. 47 5.7.3 Nitrosamine Analysis ................................................................................................................................ 48
6.0 PERFORMANCE ASSESSMENT ............................................................................................. 50 6.1. Performance Objective: Meet Perchlorate Regulatory Standard ............................................................... 50 6.2. Performance Objective: Demonstrate Post Treatment Capabilities ........................................................... 50 6.3. Performance Objective: Minimize Process Waste ...................................................................................... 51 6.4. Performance Objective: Treatment of Spent Regenerating Stream ............................................................ 53 6.5. Performance Objective: Perchlorate Bleed from Regenerated Vessel ........................................................ 54 6.6. Performance Objective: Treatment Flow Rate............................................................................................ 55 6.7. Performance Objective: Operating Costs ................................................................................................... 55

ESTCP Project No. ER-201168 ARA Project No. 001060
iii
6.8. Performance Objective: System Scalability ............................................................................................... 55 6.9. Performance Objective: Predict WBA Resin Capacity ............................................................................... 56 6.10. Performance Objective: System Control During Treatment and Regeneration Cycles ............................ 57
7.0 COST ASSESSMENT ....................................................................................................... 58 8.0 IMPLEMENTATION ISSUES .................................................................................................. 71
8.1. Environmental Issues and Implementation ................................................................................................. 71 8.2. End User Concerns and Issues.................................................................................................................... 71 8.3. Procurement Issues ..................................................................................................................................... 73
9.0 REFERENCES ....................................................................................................................... 74 APPENDIX A: POINTS OF CONTACT ............................................................................................................ A-1 APPENDIX B: RIALTO NO. 3 WBA IX DEMONSTRATION SYSTEM EQUIPMENT SPECS ................. B-1 APPENDIX C: RIALTO NO. 3 WBA IX DEMONSTRATION TEST PERIOD TREATMENT DATA...... C-1
List of Figures FIGURE 2-1. WEAK BASE ANION RESIN CHEMISTRY................................................................................... 9 FIGURE 2-2. GENERAL PROCESS FLOW DIAGRAM ................................................................................... 10 FIGURE 2-3. REGENERATION & SCAVENGING PROCESSES .................................................................... 11 FIGURE 3-1. THE WBA TREATMENT CYCLE ................................................................................................ 18 FIGURE 4-1. LOCATIONS OF WELLS IN THE WESTERN PLUME IN RELATION TO RIALTO NO. 3 ..................................................................................................................................................................................... 27 FIGURE 5-1. FLOW SCHEMATIC OF THE WBA TREATMENT SYSTEM ................................................ 30 FIGURE 5-2. REGENERATION STEPS .............................................................................................................. 34 FIGURE 5-3. PROTONATION STEPS ................................................................................................................. 35 FIGURE 5-4. WBA SYSTEM INTEGRATION WITH RIALTO NO. 3 ............................................................ 36 FIGURE 5-5. RIALTO 3 WBA IX TESTING ....................................................................................................... 39 FIGURE 5-6. CONFIGURATION DESCRIPTION OF OPERATIONAL STEPS ............................................ 41 FIGURE 5-7. ARA LABORATORY PERCHLORATE RESULTS FOR TEST PERIODS 1-4 ...................... 46 FIGURE 5-8. CERTIFIED LABORATORY PERCHLORATE RESULTS FOR TEST PERIODS 1-4 ......... 47 FIGURE 5-9. LANGELIER SATURATION INDEX RESULTS OF WBA IX TREATED WATER FOR TEST PERIODS 1-4 .................................................................................................................................................. 48 FIGURE 6-1. TEST PERIOD 4: LEAD VESSEL B PERCHLORATE AND ANION CONCENTRATIONS ..................................................................................................................................................................................... 57 FIGURE 7-1. SCAVENGER SBA RESIN COST VERSUS PERCHLORATE CONCENTRATION .............. 63

ESTCP Project No. ER-201168 ARA Project No. 001060
iv
List of Tables
TABLE 3-1. PERFORMANCE OBJECTIVES ...................................................................................................... 15 TABLE 3-2. COST CATEGORIES FOR DETERMINING O&M TREATMENT COST ($/ACRE-FT) ....... 21 TABLE 5-1. ANALYTICAL RESULTS – HISTORICAL SUMMARY DATA FOR WELL NO. 3 RIALTO ..................................................................................................................................................................................... 28 TABLE 5-2. WBA IX TEST MATRIX .................................................................................................................... 40 TABLE 5-3. SAMPLING SUMMARY FOR WBA IX DEMONSTRATION DURING THE TREATMENT CYCLE ....................................................................................................................................................................... 43 TABLE 5-4. SAMPLING SUMMARY FOR WBA IX DEMONSTRATION DURING THE REGENERATION CYCLE ..................................................................................................................................... 44 TABLE 5-5. ANALYTICAL METHODS USED DURING THE WBA IX DEMONSTRATION .................... 45 TABLE 5-6. CERTIFIED LABORATORY RESULTS OF NITROSAMINES .................................................. 49 TABLE 6-1. REGENERATION WASTE PROPERTIES ..................................................................................... 52 TABLE 6-2. PERCENT WASTE GENERATED BY THE WBA IX ................................................................... 53 TABLE 6-3. ANION AND TDS CONCENTRATIONS IN SPENT REGENERANT BEFORE AND AFTER SCAVENGING WITH PUROLITE A530E SBA ................................................................................................... 54 TABLE 6-4. ARA LABORATORY RESULTS OF REGENERATED VESSEL BLEED ................................. 54 TABLE 6-5. CERTIFIED LABORATORY RESULTS OF REGENERATED VESSEL BLEED .................... 55 TABLE 7-1. COST MODEL ELEMENTS FOR THE WBA IX PROCESS ..................................................... 58 TABLE 7-2. COST ANALYSIS FOR THE WBA IX PROCESS ....................................................................... 65 TABLE 7-3. EQUIPMENT COSTS FOR THE 1,000 GPM WBA IX SYSTEM ................................................ 66 TABLE 7-4. CONSUMABLE MATERIAL COSTS FOR OPERATION OF THE WBA IX PROCESS ....... 67 TABLE 7-5. WBA IX PROCESS ELECTRICAL COSTS ................................................................................... 70
ESTCP Project No. ER-201168 ARA Project No. 001060
1
Acronyms A&E – Architecture and Engineering AF – Acre Feet AFCEE – Air Force Center of Environmental Excellence AMCOM – Army Aviation and Missile Command ARA – Applied Research Associates, Inc. BV – Bed Volumes CDPH – California Department of Public Health DoD – Department of Defense DLR— Detection Limit for Reporting ESTCP – Environmental Security Technology Certification Program FWC – Fontana Water Company gpm – gallons per minute HASP – Health and Safety Plan I&C – Instrumentation and Control IEBL – Inland Empire Brine Line ISEP – Ion Separation IX – Ion Exchange MCL – Maximum Contamination Level meq – Milliequivalents NDMA – N-nitrosodimethylamine NPDES – National Pollutant Discharge Elimination System O&M – Operation and Maintenance

ESTCP Project No. ER-201168 ARA Project No. 001060
2
O/I – Operator Interface OSHA – Occupational Safety and Health Administration P2 – Pollution Prevention PEO – Program Executive Office psig – pounds per square inch, gauge PLC – Programmable Logic Controller PM – Program Manager ppb – parts per billion ppm – parts per million PPE – Personal Protective Equipment QA – Quality Assurance QA/QC – Quality Assurance/Quality Control QAPP – Quality Assurance Project Plan RfD – Reference Dose SBA – Strong Base Anion SBVMWD – San Bernardino Valley Municipal Water District SSC – Site Safety Coordinator TPM – Technical Program Manager WBA – Weak Base Anion

ESTCP Project No. ER-201168 ARA Project No. 001060
3
ACKNOWLEDGEMENTS
The execution of this demonstration was due in part to the coordination and assistance of several individuals from many organizations. Special appreciation is extended to Dr. Andrea Leeson and Ms. Deanne Rider of the Program Office of the Environmental Security Technology Certification Program for their project guidance and support; Mr. Sean McCarthy and Mr. Andres Aguirre of California Department of Health Services, Division of Drinking and Environmental Management for assistance with reviewing site operations and comprehensive sampling and analysis for permitting; Ms. Sharon Bishop of San Bernardino County, Department of Public Works, Solid Waste Management Division and Ralph Murphy of GeoLogic Associates for hosting and coordinating site access at Rialto No. 3 well site; Mr. Dan Quiroz and Mr. Dennis Bullard of City of Rialto Department of Public Works for invaluable onsite assistance; Carollo Engineers for engineering and construction management; Bauer International for system construction; Mr. David Larose of Purolite Ion Exchange Resins for technical assistance and support; Ms. Chris Stanley of Brenntag Pacific for invaluable assistance during startup and decommissioning; Mr. John M. Thompson for onsite support with sampling and system operation.
ESTCP Project No. ER-201168 ARA Project No. 001060
4
EXECUTIVE SUMMARY
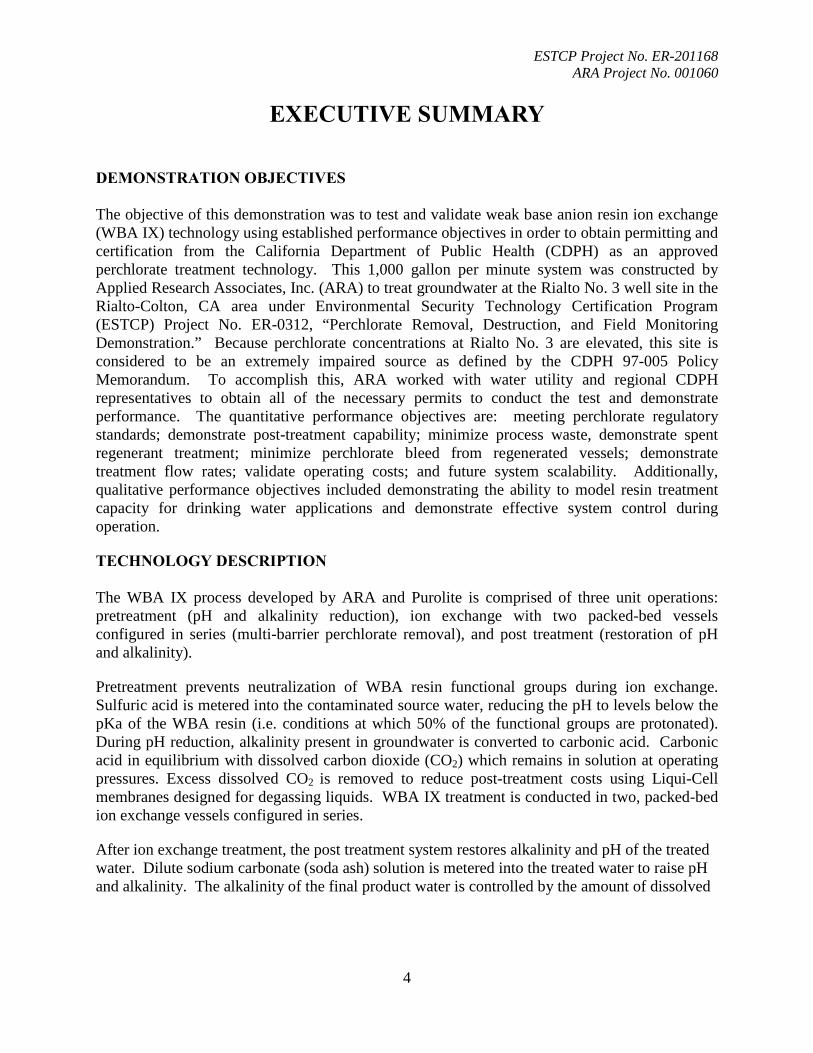
DEMONSTRATION OBJECTIVES The objective of this demonstration was to test and validate weak base anion resin ion exchange (WBA IX) technology using established performance objectives in order to obtain permitting and certification from the California Department of Public Health (CDPH) as an approved perchlorate treatment technology. This 1,000 gallon per minute system was constructed by Applied Research Associates, Inc. (ARA) to treat groundwater at the Rialto No. 3 well site in the Rialto-Colton, CA area under Environmental Security Technology Certification Program (ESTCP) Project No. ER-0312, “Perchlorate Removal, Destruction, and Field Monitoring Demonstration.” Because perchlorate concentrations at Rialto No. 3 are elevated, this site is considered to be an extremely impaired source as defined by the CDPH 97-005 Policy Memorandum. To accomplish this, ARA worked with water utility and regional CDPH representatives to obtain all of the necessary permits to conduct the test and demonstrate performance. The quantitative performance objectives are: meeting perchlorate regulatory standards; demonstrate post-treatment capability; minimize process waste, demonstrate spent regenerant treatment; minimize perchlorate bleed from regenerated vessels; demonstrate treatment flow rates; validate operating costs; and future system scalability. Additionally, qualitative performance objectives included demonstrating the ability to model resin treatment capacity for drinking water applications and demonstrate effective system control during operation.
TECHNOLOGY DESCRIPTION The WBA IX process developed by ARA and Purolite is comprised of three unit operations: pretreatment (pH and alkalinity reduction), ion exchange with two packed-bed vessels configured in series (multi-barrier perchlorate removal), and post treatment (restoration of pH and alkalinity).
Pretreatment prevents neutralization of WBA resin functional groups during ion exchange. Sulfuric acid is metered into the contaminated source water, reducing the pH to levels below the pKa of the WBA resin (i.e. conditions at which 50% of the functional groups are protonated). During pH reduction, alkalinity present in groundwater is converted to carbonic acid. Carbonic acid in equilibrium with dissolved carbon dioxide (CO2) which remains in solution at operating pressures. Excess dissolved CO2 is removed to reduce post-treatment costs using Liqui-Cell membranes designed for degassing liquids. WBA IX treatment is conducted in two, packed-bed ion exchange vessels configured in series.
After ion exchange treatment, the post treatment system restores alkalinity and pH of the treated water. Dilute sodium carbonate (soda ash) solution is metered into the treated water to raise pH and alkalinity. The alkalinity of the final product water is controlled by the amount of dissolved

ESTCP Project No. ER-201168 ARA Project No. 001060
5
CO2 that remains after pretreatment. The pH and alkalinity are controlled to achieve product water that is neither scaling nor corrosive. This is determined by calculating the Langelier Saturation Index (LSI) for treated water samples. After perchlorate breaks through the lead WBA vessel, the vessels are reconfigured so that the spent vessel (lead) is taken offline while the second vessel remains online. This enables treatment to continue while the spent vessel is regenerated. Regeneration is accomplished by increasing the pH of the spent resin to neutralize WBA resin functional groups. Water is circulated through the resin bed for a fixed time period. Sufficient caustic (NaOH) is added to the water to neutralize the WBA resin functional groups and achieve a pH of 12.0. The resin is rinsed using perchlorate-free water to remove residual perchlorate. Wastewater produced during regeneration is treated to remove perchlorate. This is performed using a small volume of strong base anion (SBA) scavenger resin. After the scavenger process, the perchlorate-free regenerating solution is discharged and the spent scavenger resin incinerated.
After rinsing, the WBA resin is restored to the ionized or protonated form by decreasing the pH of the resin. During protonation, water is circulated through the resin bed for a fixed time period. Sufficient acid is added to protonate the ion exchange sites and achieve a pH equal to or less than 4.0. After protonation, the resin is rinsed again and returned to service as the lag vessel. The spent protonating solution may be recovered, reused, or neutralized and discharged. DEMONSTRATION RESULTS The total value of the subcontract to design, install, and build the Rialto 3 demonstration system was $1.958M. Design and equipment costs accounted for $1.492M with installation costs of $0.466M. Observed costs for the demonstration were higher than anticipated due to fluctuating chemical costs, shortened operational periods, and intermittent operational difficulties. The normalized treatment cost for the demonstration system was $229 per acre-foot water treated. During the Rialto 3 demonstration, a total of 14,950 BV (39.15MG) of groundwater was treated over four (4) test periods. The perchlorate concentration of all treated water samples was below the detection limit for reporting (DLR) of 4.0 parts per billion (ppb). During start up, NDEA and NPIP were detected at < 5 BV of water treated, but did not appear after this point. All testing was performed at flow rate of 800 gpm (2.29 gpm/cu ft), which was the highest possible flow rate due to equipment and pressure limitations. The first and second test periods were designed to be short cycle tests (1,339 BV and 2,261 BV) where the lead vessel was regenerated after only 7 days online and well before perchlorate breakthrough. These tests were designed to improve resin performance by executing more regenerations per vessel to condition the virgin resin. The third test period was designed to operate the system to approximately 50% of resin capacity (4,081 BV), while the fourth test period was designed to operate the system to perchlorate breakthrough. Test period 4 treated 7,269 BV, but perchlorate breakthrough was not achieved due to operational delays and budgetary constraints. Based on previous ESTCP field demonstrations and models using Rialto No. 3 groundwater characteristics, the lead vessel will treat ≥ 9,000 BV’s of water before significant perchlorate breakthrough is observed.

ESTCP Project No. ER-201168 ARA Project No. 001060
6
Resin was regenerated at the end of the first three test periods. No detectable perchlorate bleed was observed when the regenerated vessel was placed back online as the lag vessel. The spent regenerant volume was limited to 0.07% of the total water treated during testing which resulted in concentrating the perchlorate to over 35,000 ppb. The SBA scavenger process effectively lowered perchlorate in the spent regenerant to non-detectable levels (< 2.5 ppb). TECHNOLOGY IMPLEMENTATION Implementation of this technology is straightforward. Commercial, large-scale, ion exchange equipment for WBA resin technology is commonplace. The pretreatment section of the system consists of pH control unit operations with two-stage static mixing which is straight forward to design and engineer. Reducing the alkalinity/stripping of carbon dioxide from the groundwater feed can be accomplished using membrane treatment systems or stripping towers. Both methods are straightforward and are commercially available. The post treatment system used to restore alkalinity and pH of the treated groundwater consists of a package soda ash delivery system combined with static mixers; both are commercially available. Treatment of residuals by the SBA scavenger ion exchange process is a proven technology. Parameters that directly affect implementation of the WBA IX technology are groundwater alkalinity, perchlorate groundwater concentration, and treated water alkalinity. The amount of acid required to achieve operating pH is directly proportional to feed water alkalinity. Perchlorate concentration directly affects the amount of scavenger resin required, which can also increase cost. The amount of acid used in pretreatment and the desired alkalinity of the treated water affects soda ash requirements for neutralization, which, in turn, affects neutralization cost. The cost of each of these drivers is affected by fluctuating market prices. Perchlorate concentration below 1 ppm has little effect on treatment capacity and resin regeneration costs. As a result, the WBA IX process becomes more economical than direct SBA IX as perchlorate concentration increases.

ESTCP Project No. ER-201168 ARA Project No. 001060
7
1.0 Introduction
1.1. Background The Department of Defense (DoD) has used perchlorate (ClO4
¯) as an oxidizer in ordnance items and rocket motors since the 1940s. This very water soluble and environmentally persistent compound now contaminates drinking water for tens of millions of people in the United States. The cost for DoD to achieve compliance with this drinking water limit could be billions of dollars. The current approach is treatment by ion exchange for drinking water applications. Existing ion exchange technologies in use today include regenerable and single-use processes. Regenerable ion exchange processes use salt as the regenerating agent, such as the Calgon ISEP® process and other, more conventional, lead-lag processes. These non-selective regenerable systems require frequent regeneration and generate large volumes of salt brine containing high concentrations of nitrate, sulfate and perchlorate. This waste stream is becoming more difficult to dispose and the operation and maintenance (O&M) cost from frequent regenerations is high. Single-use ion exchange processes use strong base anion resins. After perchlorate loading capacity is reached, the single-use resins must be removed from the ion exchange vessels and incinerated resulting in high disposal and replacement costs.
Applied Research Associates, Inc., (ARA) was selected by the Environmental Security Technology Certification Program (ESTCP) to evaluate and demonstrate a regenerable ion exchange process for removing perchlorate from groundwater. The regenerable process that Applied Research Associates, Inc. (ARA) co-developed with The Purolite Company uses perchlorate-selective, weak-base-anion (WBA) resin. This process has the potential to significantly reduce operation and maintenance costs and reduce process waste compared to existing single-use and brine regenerable ion exchange processes.
1.2. Objective of the Demonstration The objective of this demonstration was to test and validate weak base ion exchange (WBA IX) technology using established performance objectives in order to obtain permitting and certification from the California Department of Public Health (CDPH) as an approved perchlorate treatment technology. The 1,000 gallon per minute system constructed at the Rialto No. 3 well site by Applied Research Associates, Inc. (ARA) to treat perchlorate in groundwater was completed under Environmental Strategic Technology Certification Program (ESTCP) Project No. ER-0312, “Perchlorate Removal, Destruction, and Field Monitoring Demonstration.” Elevated groundwater perchlorate concentrations at Rialto No. 3 cause the site to be considered as an extremely impaired source as defined by the CDPH 97-005 Policy Memorandum. Based on previous pilot demonstrations, it was anticipated that O&M costs would be < $150/acre-ft.
1.3. Regulatory Drivers Perchlorate is water soluble and persistent in the environment. This is of human health concern because perchlorate has been shown to inhibit the uptake of iodide by the thyroid gland, potentially impacting thyroid hormone production. On January 26, 2006, the U.S. EPA adopted a
ESTCP Project No. ER-201168 ARA Project No. 001060
8
reference dose (RfD) for perchlorate of 0.0007 mg/kg-day.1 This RfD equates to a Drinking Water Equivalent Level (DWEL) of 24.5 micrograms per liter (or 24.5 ppb). On January 8, 2009, the United States Environmental Protection Agency (EPA) updated the Interim Drinking Water Health Advisory for exposure to perchlorate from 24.5 μg/L (or ppb) in drinking water to 15 ppb. This adjustment was made to account for perchlorate exposure from food in addition to drinking water. Following EPA’s lead, on April 22, 2009, the Office of the Under Secretary of Defense reduced the preliminary remediation goal from 24 ppb to 15 ppb or the State regulatory goal, whichever is least. In California, the drinking water public health goal (PHG) for perchlorate is 6 ppb.
The anticipated outcome of this demonstration is obtaining a modified or revised drinking water permit that includes WBA resin ion exchange as a treatment process for drinking water treatment applications. To accomplish this, ARA worked closely with water utility and regional CDPH representatives to develop a sampling and analysis plan that provided the data necessary to obtain permit modification. Acquiring the permit modification by the regional CDPH officials will facilitate permit modification in the future for other water utilities in this region (or in other regions) and facilitate technology implementation.
1 U.S. EPA. Assessment Guidance for Perchlorate Memorandum dated January 26, 2006 http://epa.gov/newsroom/perchlorate.pdf

ESTCP Project No. ER-1168 ARA Project No. 001060
9
2.0 Technology
2.1. Technology Description 2.1.1. WBA Resin Chemistry
ARA and Purolite developed the regenerable ion exchange process to take advantage of the pH-dependent nature of WBA resins. At low pH, WBA functional groups on the resin have a positive charge (i.e., R-NH3+), allowing anion exchange to occur. However, at high pH, the functional groups lose a proton and become uncharged (i.e., R-NH2) and no longer attract the counter anion. It is this loss of a proton which enables the efficient and complete regeneration of the functional groups. The pH dependent nature of WBA resins enables efficient regeneration, minimizing the amount of regeneration chemicals consumed, which results in an economical process. Equations representing the pH-dependent chemistry of WBA functional groups are shown in Figure 2-1.
Figure 2-1. Weak Base Anion Resin Chemistry
2.1.2. WBA Ion Exchange Process The WBA ion exchange process has two primary modes: operation and regeneration. During operation, perchlorate is removed from the contaminated water. Once the resin has reached its exchange capacity for perchlorate, it is considered “spent” and the resin must be regenerated before it can be returned to the operational mode. These modes are described below.
2.1.2.1. WBA Ion Exchange Operation
Because of the pH dependent nature of WBA resins, pH must be controlled during the ion exchange treatment process. The general ion exchange process developed by ARA and Purolite is comprised of three unit operations: pretreatment (pH and alkalinity reduction), ion exchange
WBA resin in free-base form (R-NH2) is ionized (R-NH3+) by
protonating with acid (H+):
R-NH2 + H+ R-NH3+
Protonated resin removes anions (A-) from aqueous streams:
R-NH3+ + A- R-NH3-A
Spent resin (R-NH3-A) is regenerated by neutralizing with caustic (NaOH), which liberates anions and returns resin to the free-base form:
R-NH3-A + Na+OH- R-NH2 + HOH + Na+A-

ESTCP Project No. ER-201168 ARA Project No. 001060
10
with two columns configured in series (multi-barrier perchlorate removal), and post treatment (restoration of pH and alkalinity). A general flow diagram of this process is shown in Figure 2-2.
Figure 2-2. General Process Flow Diagram
The purpose of pretreatment is to prevent neutralization of WBA resin functional groups during ion exchange. This is accomplished by adding acid to the contaminated source water and reducing the pH. Specifically, the pH is reduced to below the pKa of the WBA resin (i.e. conditions at which 50% of the functional groups are protonated). During pH reduction, carbonate (CO3
2-) and bicarbonate (HCO3-) alkalinity present in groundwater is converted to
carbonic acid. Carbonic acid is in equilibrium with dissolved carbon dioxide (CO2), which remains in solution at operating pressure and enables pretreatment and ion exchange to be accomplished using a single pumping operation. Ion exchange treatment is conducted in packed bed ion exchange vessels configured in series.
Post treatment returns the treated water to acceptable levels of alkalinity and pH. The pH is controlled in the post-treatment neutralization process by the addition of base (i.e., sodium hydroxide or sodium carbonate). Alkalinity in the product water is controlled by the amount of dissolved CO2 removed prior to or during neutralization. Conditions for pH and alkalinity are controlled to achieve product water that is neither scaling nor corrosive. This is determined by measuring pH, temperature, alkalinity, hardness, and total dissolved solids in the product water and calculating the Langlier Saturation Index (LSI).
2.1.2.2. WBA Ion Exchange Regeneration
When regeneration becomes necessary, the ion exchange vessels are configured so that the spent vessel (lead) is offline and the second vessel (lag) remains online. In this configuration, treatment continues while the spent vessel is regenerated. Regeneration is accomplished by increasing the pH of the spent resin to neutralize weak base functional groups. Another objective

ESTCP Project No. ER-201168 ARA Project No. 001060
11
of regeneration is to minimize the volume of water generated for disposal. A predetermined volume of water is circulated through the resin bed for a fixed duration. Sufficient caustic (i.e. NaOH) is added to the water to neutralize the resin exchange sites and maintain pH above 12.0 throughout regeneration. Wastewater produced during regeneration is treated to remove perchlorate. This can be done by use of a small volume of scavenger resin, or by biodegradation. When using the scavenger process, the perchlorate-free regenerating solution can then be discharged and the scavenger resin incinerated once capacity is reached. Schematics showing the batch regeneration process and scavenger process are shown in Figure 2-3. A rinse using perchlorate-free water is conducted to remove residual perchlorate from the resin.
Figure 2-3. Regeneration & Scavenging Processes
Once rinsing is complete, the WBA resin is restored to the ionized or protonated form by decreasing the pH of the resin. During protonation, water is circulated through the resin bed for a fixed duration. Sufficient acid is added to protonate the ion exchange sites and maintain pH equal to or less than 4.0. After protonation is complete, a rinse is conducted and the vessel is returned to service as the second treatment vessel in series (lag position). The spent protonating solution may be recovered, reused, or neutralized and discharged.
2.1.3. Expected Applications The expected applications for WBA resin ion exchange includes removal of perchlorate, nitrate, and other oxyanions from contaminated source waters. This includes drinking water treatment applications, especially waters that have relatively high contamination (10’s to 100’s ppb) where a regenerable process is more cost effective than a single-use ion exchange process. Another expected application for the WBA process is for use in treating industrial wastewaters containing higher concentrations of perchlorate. In addition to treating perchlorate and nitrate, the WBA resin ion exchange process may also be effective in removing anions of concern in the environment including selenium, chromium, and radionuclides.
2.2. Technology Development Two pilot demonstrations of the WBA resin technology have been successfully completed. The first pilot demonstration was performing groundwater remediation at Redstone Arsenal, AL. The

ESTCP Project No. ER-201168 ARA Project No. 001060
12
second pilot demonstration was conducting drinking water treatment at Fontana, CA. Both demonstrations were conducted and reported under ESTCP Project No. ER-0312, “Perchlorate Removal, Destruction, and Field Monitoring Demonstration.”
2.2.1. Groundwater Remediation – Redstone Arsenal, AL Groundwater remediation was conducted at Redstone Arsenal, located near Huntsville, Alabama. The demonstration was performed over a period of 15 weeks during which treatment rates of 12, 18, and 24 bed volumes per hour (1.5, 2.25, and 3.0 gpm/ft3 of resin, respectively) were evaluated. Well RS498, a six-inch extraction well, was selected as the groundwater source for the demonstration. Anion concentrations of the well were as follows: 1500 to 2200 ppb perchlorate; 4 ppm nitrate; 3 ppm sulfate; 4 ppm chloride, and 150 ppm bicarbonate. Performance of the WBA IX technology was assessed by collecting and analyzing groundwater samples before and after treatment. Five resin regeneration tests were performed to characterize regeneration efficiency. The spent regenerating solutions from these tests were used in perchlorate destruction and scavenging evaluations.
Results of the demonstration at Redstone Arsenal confirmed that perchlorate was reduced in the contaminated groundwater from >1500 ppb to well below the method detection limit (4 ppb) using EPA Method 314.0. Regeneration of WBA resin was effectively and efficiently accomplished. The volume of spent regenerating solution was limited to less than 0.05% of the volume of water treated. Two treatment processes for the spent regenerating solution were demonstrated including biodegradation and a zero-discharge approach using strong base anion (SBA) scavenger resin. Both processes were effective in destroying or removing perchlorate to below the method detection limit. The regenerable WBA resin technology proved to be up to 50 times more efficient than brine-regenerable processes using SBA resins. In addition, O&M costs were projected to be less than $100 per acre-ft.
2.2.2. Drinking Water Treatment – Fontana, CA As a result of the successful demonstration at Redstone Arsenal, a second demonstration for drinking water treatment in California was conducted at Plant F17 in Fontana, CA. Well F17-C water contained 8 ppb perchlorate; 11 ppm chloride; 31 ppm nitrate; 14 ppm sulfate; and 150 ppm bicarbonate. Six test periods were conducted during this demonstration. The minimum treatment rate was 24 bed volumes (BV) per hour (3 gpm/ft3). Four test periods were long cycle breakthrough tests (1, 2, 5, and 6). During regeneration of the spent column, the lag column remained online and treated water in a single column. The remaining two test periods (3 and 4) were short-cycle tests. In short-cycle tests, columns were regenerated after approximately one week on-line and before breakthrough. These short-cycle tests were conducted to maximize the number of regenerations per column and minimize the duration of the demonstration. The short-cycle tests were also used to evaluate perchlorate removal efficiency at higher specific flow rates (4 gpm/ft3). Regeneration of spent resin and treatment of the spent regenerating solution using the zero-discharge scavenger process were conducted on-site.

ESTCP Project No. ER-201168 ARA Project No. 001060
13
The treatment capacity determined from this demonstration was 9,700 bed volumes. The treated water was below the method report limit for perchlorate (< 0.10 ppb) using IC/MS/MS. Nitrosamines were analyzed using EPA Method 521. NDMA was 2.6 ppt with a detection limit of 2 ppt. All other nitrosamines analyzed (including NDEA, NDBA, NDPA, NMEA, NMOR, NPIP, and NPYR) were below the detection limit. The residual alkalinity of the treated water was controlled by varying the pH and using a combination of air/membrane stripping and calcite contacting. Treated water had a Langelier Saturation Index (LSI) near zero, which indicated that it had neither corrosive nor scaling tendencies. Five resin regenerations were accomplished using 3 bed volumes of regenerant solution, or approximately 0.03% of the treated water. The spent regenerating solution was successfully treated using the zero-discharge scavenger resin approach to remove perchlorate to below method reports limits. The scavenger approach cost less than $5 per acre-foot to implement based on conditions at the Fontana demonstration site.
2.3. Advantages and Limitations of the WBA IX Technology 2.3.1. Technology Comparisons
Three technologies are currently used commercially for remediating perchlorate-contaminated groundwater: 1) biodegradation, 2) ion exchange using SBA regenerable resins, and 3) ion exchange using non-regenerable or disposable SBA resins. The WBA resin technology takes advantage of the performance, favorable public perception, and regulatory acceptance of ion exchange while minimizing the liabilities of current ion exchange systems. These liabilities include: 1) high cost of perchlorate-selective resins currently in use, 2) large volume of residuals generated by regenerable systems, 3) difficulty and high cost of treating residuals, and 4) resin replacement and incineration costs for non-regenerable systems.
2.3.2. Technology Advantages and Limitations Weak base, perchlorate-selective resins do not have the treatment capacity of strong base, perchlorate-selective, single-use resins. Even so, overall cost savings may be substantial since the WBA resins can be economically regenerated. Pretreatment and post treatment steps required for the WBA resin process do add process complexity compared to single-use ion exchange systems; however, the complexity is not greater than other commercial, regenerable ion exchange technologies. Pretreatment and post treatment unit operations are very straight-forward pH control processes.
Water quality parameters including alkalinity, hardness, perchlorate concentration, sulfate concentration, and treated water alkalinity affect cost and performance. The amount of acid required to achieve operating pH is directly proportional to feed water alkalinity and; therefore, pretreatment cost. Perchlorate concentration dictates the resin treatment capacity and regeneration frequency which affects regeneration cost. In addition, perchlorate concentration and regeneration frequency impact the amount of spent regenerating solution and treatment cost. Hardness and desired alkalinity of treated water affect the caustic requirement for neutralization, which affects neutralization cost. Competing ions such as nitrate will also impact treatment performance by driving a need for more frequent regenerations. Competing ion concentration is a limiting factor for all ion exchange technologies.

ESTCP Project No. ER-201168 ARA Project No. 001060
14
3.0 Performance Objectives
The objective of this effort was to demonstrate a large-scale (1,000 gpm) drinking water treatment system for perchlorate removal using the WBA process. This treatment system was designed specifically for treating drinking water from Rialto No. 3. Due to the level of perchlorate concentration and presence other contaminants, this particular well is considered an extremely impaired source as defined by the CDPH 97-005 Policy Memorandum.
During the demonstration, data was collected to evaluate perchlorate removal performance, regeneration efficiency, ease of operation, and operation and maintenance (O&M) costs. Based on data from the previous pilot demonstrations, it was anticipated that O&M costs would be < $150/acre-ft. Upon completion of demonstration testing, there is an option for ownership of the treatment system to be transferred to the City of Rialto.
Performance of the WBA system was evaluated by collecting and analyzing samples for perchlorate during ion exchange, regeneration, and treatment of residuals. Analytical results were used to assess and predict treatment performance of the WBA resin at the conditions tested. Operational data including flow rate, system pressure, pH, and consumption of chemicals and power were recorded and analyzed to validate operating performance and predict O&M costs. Specific quantitative and qualitative performance objectives for this demonstration are summarized in Table 3-1. Subsequent sections provide details for each performance objective identified.

ESTCP Project No. ER-201168 ARA Project No. 001060
15
Table 3-1. Performance Objectives
Performance Objective Data Requirements Success Criteria Results
Quantitative Performance Objectives 1. Meet perchlorate regulatory standard
Perchlorate concentration in treated water < DLR (4 ppb) < 1.5 ppb
(average= 0.61 ppb) 2. Demonstrate post treatment capability
Treated water characteristics including pH, total dissolved solids, alkalinity, hardness, and temperature to be used for calculating Langelier Saturation Index (LSI).
0 < LSI < 1.0 (i.e., non-corrosive & non-
scaling)
No samples met requirement
3. Minimize process waste
Volume of spent solutions collected during regeneration and volume of water treated prior to regeneration
≤ 0.07 vol% residual ≤ 0.07 vol% residual
4. Demonstrate treatment of spent regenerating streams
Perchlorate concentration in treated spent regenerant following treatment using strong base anion resin (scavenging)
≤ 100 ppb perchlorate ≤ 2.5 ppb perchlorate
5. Determine perchlorate bleed from regenerated vessel
Perchlorate concentration in regenerated vessel effluent following a regeneration cycle)
< DLR (4 ppb) All samples ≤ 0.27 ppb perchlorate
6. Treatment flow rate Log of operational flow rate (gpm) during ion exchange ≥ 2.5 gpm/ft3 ≤ 2.5 gpm/ft3
(2.29 gpm/ft3) 7. Validate and report operating cost
Consumable chemicals, waste disposal, electrical requirements, labor requirements, and miscellaneous supply costs
< $150 /acre-ft Actual= $266/acre-ft
Theoretical= $229/acre-ft
8. System scalability Actual regeneration time required for offline vessel; anticipated regeneration frequency.
System can support two additional ion exchange
treatment trains and expand to 3000 gpm
System will support two additional trains
Qualitative Performance Objectives 9. Model/predict WBA resin capacity for drinking water application
Perchlorate, nitrate, sulfate, and chloride concentrations in groundwater and in treated water exiting lead vessel
Provide a treatment capacity, in bed volumes,
before regeneration is required
≥ 9,000 BVs
10. System control during treatment and regeneration cycles
Feedback from field technician on ability to use programmable logic control system to effectively monitor and control system operations such as flow, pressure, and pH during demonstration treatment and regeneration
A single field technician able to effectively take
measurements and control system. System control features and interlocks
operate as designed. System startup following shutdown
initiates as designed.
Normal operations one operator req’d; during regeneration, two operators req’d

ESTCP Project No. ER-201168 ARA Project No. 001060
16
3.1. Performance Objective: Meet Perchlorate Regulatory Standard The current regulatory standard for perchlorate issued by CDPH is a Public Health Goal of 6 ppb (effective October 18, 2007). In order for the WBA technology to be successful and ultimately issued a drinking water supply permit, it is imperative that perchlorate concentration in the treated water is below the regulatory standard.
3.1.1. Data Requirements Data required to evaluate this performance objective includes perchlorate concentration in the fully treated water. Treated water samples were collected at defined frequencies, described in Section 5.6, throughout the demonstration. The sampling location, date, time, volume of water treated at sample collection and name of the individual collecting the sample was recorded in a logbook at the site. Collected samples were analyzed using EPA approved methods EPA 314.0 (IC) and EPA 331.0 (LC-IC-MS-MS).
3.1.2. Success Criteria This performance objective was considered successful if perchlorate concentration in the treated water (following the lag column) remained less than the DLR of 4 ppb during normal operations. Any deviation from this goal throughout the demonstration resulted in a careful analysis of the events leading to the deviation, identification of probable causes, corrective actions, and preventative measures.
3.1.3. Results This performance objective was considered successful throughout the demonstration and the technology worked as expected. All fully treated water samples analyzed for perchlorate during each test period were less than the DLR of 4 ppb. During the demonstration, there were numerous unexpected shutdowns due to water supply problems with Rialto No. 3, or from other perturbations. The WBA IX system was restarted on each occasion with no treated water perchlorate concentrations exceeding the DLR of 4 ppb.
3.2. Performance Objective: Demonstrate Post Treatment Capability Post treatment, described in Section 2.1.2.1, is required to adjust pH and alkalinity of the fully treated water to acceptable levels with regard to corrosiveness or scaling tendencies prior to distribution. The Langelier Saturation Index (LSI) was used as the measure of post treatment success. This calculated number was used to predict the calcium carbonate stability of water; that is, whether a water sample will precipitate, dissolve, or be in equilibrium with calcium carbonate.
3.2.1. Data Requirements The data required to calculate LSI includes alkalinity (mg/L as CaCO3), pH, total dissolved solids (mg/L TDS), calcium hardness (mg/L as CaCO3), and water temperature (°C). Select samples of fully treated water were analyzed by a certified laboratory and the resulting data was

ESTCP Project No. ER-201168 ARA Project No. 001060
17
used to determine the pH at which the water sampled is saturated with calcium carbonate (pHs). The LSI was calculated by the certified analytical laboratory. LSI is calculated as the difference between the actual pH of the fully treated water sample and the calcium carbonate saturation pH. The calculation is shown below:
LSI = pH – pHS
pHS = (9.3 + A + B) – (C + D) where: A = (Log10 [TDS] – 1) / 10 B = -13.12 x Log10 (°C + 273) + 34.55 C = Log10 [Ca+2 as CaCO3] – 0.4 D = Log10 [alkalinity as CaCO3]
3.2.2. Success Criteria This performance objective was considered successful if 95% of the fully treated water samples analyzed by a certified laboratory had a calculated LSI value between 0 and 1.
3.2.3. Results This performance objective was not met. Eighteen samples were taken throughout the demonstration and none met the performance objective of having a value 0 < LSI < 1.0. While this may appear to be a failure of the objective, the problems responsible are mechanical in nature and are easily remedied. Scaling issues were frequently observed in the soda ash mix tank, suction strainers, and the injector of the soda ash static mixer, preventing the required amount of soda ash to be dosed into the treated water. This scaling can be eliminated (or minimized) by installing media canisters to soften the recycled treated water prior to dilution of the soda ash in the dissolver tank of the package soda ash system. Also, the soda ash static mixer was sized specifically for the WBA system, but did not effectively mix the dilute soda ash. Mixing the soda ash with treated water would improve greatly by implementing a two-stage mixing process identical to that used to pre-dilute and mix sulfuric acid in the pretreatment step of the system. Additionally, the static mixer must be placed further upstream from the pH probes to allow more reaction time prior to pH measurement and sampling for LSI.
3.3. Performance Objective: Minimize Process Waste Minimization of process waste is a key benefit of the WBA process which was validated. For this application, process waste is defined as the amount of spent regenerating solution generated that must be disposed offsite. The amount was reported as a percentage of the total groundwater treated. This value was calculated after each treatment cycle during the demonstration. Each treatment cycle consists of two steps as defined in Figure 3-3 (NOTE: in this figure, GW stands for groundwater and TGW stands for treated groundwater). At the conclusion of the demonstration, the total volume of spent regenerating solution disposed off site was calculated and compared to the total volume of groundwater treated.

ESTCP Project No. ER-201168 ARA Project No. 001060
18
Cycle 1 Cycle 2
Figure 3-1. The WBA Treatment Cycle
3.3.1. Data Requirements The data required to evaluate this performance objective includes the volume of treated groundwater produced during each cycle, and the total volume of water disposed offsite as wastewater, or spent regenerant. The total volume of water treated during each cycle was quantified and recorded using a magnetic flow sensor and a totalizer that was programmed into the process control system/PLC. This data was transmitted to a data acquisition system (DAQ) that recorded system parameters, including instantaneous flow rate and totalized flow, at a systematic interval (i.e. every 5 minutes) for the length of the demonstration. The volume of wastewater generated was quantified at the time of disposal using the manifest of the disposal company responsible for disposing the waste.
3.3.2. Success Criteria This performance objective was considered successful if waste disposed is less than 0.07% of the groundwater treated.
3.3.3. Results This performance objective was met based on data obtained during Test Periods 1-3. The percentage of waste disposed of during these test periods was determined to be 0.07% based on amounts of water treated and regeneration waste disposed of during those test periods. Data from Test Period 4 was not factored into this performance objective because the system was offline and the demonstration discontinued prior to completion.
Vessel 1
Vessel 2
Step A – Both vessels online (Vessel 1 lead and vessel 2 lag)
GW TGW
Vessel 1
Vessel 2
GW
TGW Regen
Vessel 1
Vessel 2
Step A – Both vessels online (Vessel 2 lead and vessel 1 lag)
TGW GW
Vessel 1
Vessel 2
GW
TGW
Step B – Vessel 1 online and vessel 2 regenerating
Regen
Step B – Vessel 2 online and vessel 1 regenerating

ESTCP Project No. ER-201168 ARA Project No. 001060
19
3.4. Performance Objective: Treatment of Spent Regenerating Stream Prior to disposal of spent regenerating solution, perchlorate was removed using a scavenger resin approach. The scavenger approach consisted of passing spent regenerating solution through two ion exchange vessels arranged in series, each containing 52.5 ft3 of Purolite A530E strong base anion (SBA) resin. Perchlorate that concentrated in the spent regenerating solution was removed by this process prior to disposal.
3.4.1. Data Requirements The data required to evaluate this performance objective was the perchlorate concentration of the composite, treated spent regenerating solution. This sample was collected following each scavenging operation using the sample valves located on the scavenger vessel valve manifold assembly. Perchlorate was analyzed by ion chromatography using method EPA 314.0 or EPA 331.0.
3.4.2. Success Criteria This performance objective was considered successful if the perchlorate concentration of the composite, treated spent regenerating solution from the lag scavenger vessel remained below the reporting limit of the analytical method. The composite water was stored in a 10,500 gallon wastewater holding tank. A circulation pump was used to mix the tank contents. Following regeneration, and prior to disposal, the composite of the treated wastewater was collected and analyzed.
3.4.3. Results This performance objective was successful. All samples obtained during scavenging of the regeneration waste during Test Periods 1-3 were found to be ≤ 2.5 ppb. Data from Test Period 4 was not factored into this performance objective because the system was offline and the demonstration discontinued prior to completion.
3.5. Performance Objective: Perchlorate Bleed from Regenerated Vessel It is important to ensure that a regenerated vessel does not exhibit perchlorate bleed when placed back in service. A rinse step at the conclusion of resin regeneration has been used to eliminate perchlorate bleed. The goal of this performance objective was to verify the effectiveness of the rinse process.
3.5.1. Data Requirements To investigate the adequacy of the rinse step in eliminating perchlorate bleed, a freshly regenerated vessel was sampled and analyzed for perchlorate using EPA 314.0 or EPA 331.0. Initial samples were taken within 300 BV’s of the vessel being placed back online. Additional samples were taken after the vessels had been online between 1,000 and 2,500 BV’s. Perchlorate data from both ARA and certified laboratory samples were evaluated to determine whether any perchlorate bleed was observed after the newly regenerated vessels were placed back online.
ESTCP Project No. ER-201168 ARA Project No. 001060
20
3.5.2. Success Criteria This performance objective was considered successful if the perchlorate concentrations of the samples collected were below 4 ppb.
3.5.3. Results This performance objective was successful. All samples collected and measured using both EPA 314.0 and 331.0 were below 0.27 ppb. The final rinsing step adequately minimized bleed from the regenerated vessel.
3.6. Performance Objective: Treatment Flow Rate In order to be a viable drinking water treatment process, the treatment flow rate must adequate and comparable to existing treatment systems. This performance objective was evaluated in units of gallons per minute per cubic foot of resin (gpm/ft3).
3.6.1. Data Requirements The data required to evaluate this performance objective was system flow rate which was monitored using a magnetic flow sensor. This flow rate in turn was monitored by the PLC and transmitted to the DAQ for storage. In addition, the total volume of resin loaded in each ion exchange vessel was 350 ft3 per vessel.
3.6.2. Success Criteria This performance objective was considered successful if an average treatment rate of 2.5 gpm/ft3 is maintained throughout the demonstration (i.e., greater than 875 gpm).
3.6.3. Results Although the WBA IX system did not maintain the desired treatment flow rate of 2.5 gpm/ft3
(875 gpm), the average flow throughout the demonstration was consistently 2.29 gpm/ft3 (800 gpm). Lower flow rates were a result of increased pressure drop across the Liqui-Cell membranes used in the pretreatment system. When flow rates were increased to levels above 800 gpm, the system would operate for short periods of time before the high pressure interlock safety was activated (> 90 psig), causing the system to shut down. This problem can easily be overcome by installing a means for performing cleaning procedures on the membranes and by adding an additional pair of membranes. This is discussed further in Section 6.6.1.
3.7. Performance Objective: Operating Costs Operating costs are critical in determining if the WBA process is competitive compared to existing perchlorate treatment systems. Activities and materials that contribute to O&M costs will be documented and reported in dollars per acre-ft of water treated.
ESTCP Project No. ER-201168 ARA Project No. 001060
21
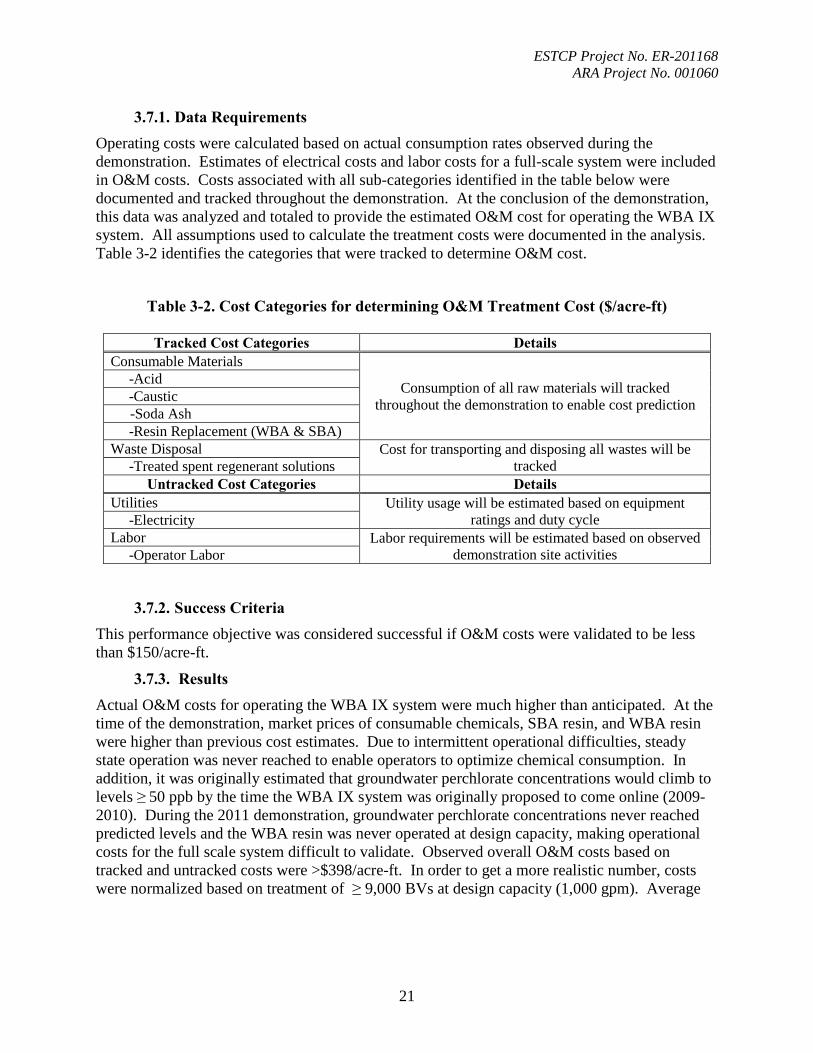
3.7.1. Data Requirements Operating costs were calculated based on actual consumption rates observed during the demonstration. Estimates of electrical costs and labor costs for a full-scale system were included in O&M costs. Costs associated with all sub-categories identified in the table below were documented and tracked throughout the demonstration. At the conclusion of the demonstration, this data was analyzed and totaled to provide the estimated O&M cost for operating the WBA IX system. All assumptions used to calculate the treatment costs were documented in the analysis. Table 3-2 identifies the categories that were tracked to determine O&M cost.
Table 3-2. Cost Categories for determining O&M Treatment Cost ($/acre-ft)
Tracked Cost Categories Details Consumable Materials
Consumption of all raw materials will tracked throughout the demonstration to enable cost prediction
-Acid -Caustic
-Soda Ash -Resin Replacement (WBA & SBA) Waste Disposal Cost for transporting and disposing all wastes will be
tracked -Treated spent regenerant solutions Untracked Cost Categories Details
Utilities Utility usage will be estimated based on equipment ratings and duty cycle -Electricity
Labor Labor requirements will be estimated based on observed demonstration site activities -Operator Labor
3.7.2. Success Criteria
This performance objective was considered successful if O&M costs were validated to be less than $150/acre-ft.
3.7.3. Results Actual O&M costs for operating the WBA IX system were much higher than anticipated. At the time of the demonstration, market prices of consumable chemicals, SBA resin, and WBA resin were higher than previous cost estimates. Due to intermittent operational difficulties, steady state operation was never reached to enable operators to optimize chemical consumption. In addition, it was originally estimated that groundwater perchlorate concentrations would climb to levels ≥ 50 ppb by the time the WBA IX system was originally proposed to come online (2009-2010). During the 2011 demonstration, groundwater perchlorate concentrations never reached predicted levels and the WBA resin was never operated at design capacity, making operational costs for the full scale system difficult to validate. Observed overall O&M costs based on tracked and untracked costs were >$398/acre-ft. In order to get a more realistic number, costs were normalized based on treatment of ≥ 9,000 BVs at design capacity (1,000 gpm). Average

ESTCP Project No. ER-201168 ARA Project No. 001060
22
market pricing of consumable chemicals was also used for these calculations. Subsequently, O&M costs dropped to $229.00/acre-ft of water treated. These results are discussed further in Section 7.0, “Cost Assessment.”
3.8. Performance Objective: System Scalability There is an economy of scale associated with the regeneration components of the WBA system. The Rialto Well 3 system was designed to allow for additional ion exchange treatment trains to be installed without requiring additional equipment to be purchased (i.e., regeneration tanks, pumps, etc.).
3.8.1. Data Requirements The regeneration process is designed to regenerate a single vessel at a time. For the regeneration system to support additional treatment trains, the frequency of regeneration must be such that there is no interference in drinking water treatment (i.e. a vessel can be completely regenerated before another vessel requires regeneration). Data including frequency of regeneration per vessel and total, real-time duration of regeneration was documented in logbooks. Quantities and frequency of replenishment of regeneration chemicals was also documented. These data points were used to validate that additional ion exchange trains can be added with little or no modification to the existing regeneration equipment.
3.8.2. Success Criteria This objective was considered successful if the demonstration data indicated that the regeneration system could support two additional ion exchange treatment trains, which would expand the system from 1,000 gpm to 3,000 gpm.
3.8.3. Results During this demonstration, this performance objective was successfully met. Although the first regeneration required approximately 72 hours due to several mechanical and programming issues, the second and third were achieved in less than 48 hours. Because breakthrough concentrations were not achieved in this demonstration, a model was used to calculate capacity. Using that model with the current flow rate capacity of 800 gpm (or the design flow rate of 1,000 gpm) and Rialto No. 3 groundwater characteristics, the lead vessel should treat 9,000 BV’s, which equates to run times of between 16 and 21 days before the regeneration of the lead vessel is required. Based on those numbers, the existing onsite equipment easily supports two additional ion exchange treatment trains.
3.9. Performance Objective: Predict WBA Resin Capacity The purpose of this performance objective was to collect the necessary water quality data to estimate and predict the treatment capacity of the WBA resin in drinking water applications with similar groundwater characteristics. For this purpose, treatment capacity is defined as the totalized volume of water treated before regeneration of the lead vessel is required.

ESTCP Project No. ER-201168 ARA Project No. 001060
23
3.9.1. Data Requirements Initially, it is important to regenerate the resin frequently in order to reach a performance homeostasis and calculate an accurate estimate of capacity (several operation-regeneration cycles are needed to overcome virgin-resin effects with exchanging anions). Perchlorate breakthrough will not be achieved for the first two test periods, which are purposely shorter in order to accomplish frequent regenerations for both resin beds. Once these short test periods are completed, efforts will be made to “bracket” perchlorate breakthrough in the lead vessel during subsequent 14 day test periods. Sampling frequency was conducted daily during estimated periods of breakthrough. Data tables and plots showing volume of water treated versus perchlorate concentration was generated in an effort to characterize perchlorate breakthrough during the demonstration.
The data requirements include perchlorate concentration in effluent from the lead vessel, and the total volume of water treated by lead vessel at the time of sampling. The volume of water treated will be monitored using a magnetic flow sensor, totalized by the PLC, and stored by the DAQ for the length of the demonstration. The predicted treatment capacity can be calculated based on the most appropriate perchlorate breakthrough concentration. For this performance objective, perchlorate breakthrough will be defined as the point in time when the perchlorate concentration of the lead vessel effluent equals 50% of the perchlorate concentration of the Rialto No. 3 groundwater perchlorate concentration (17 ppb).
To ensure ability to compare source waters and predict capacity, characteristics of the untreated groundwater including pH, alkalinity, and concentrations of perchlorate, nitrate, sulfate, and chloride were also determined and recorded.
3.9.2. Success Criteria The criterion for success of this performance objective was to develop a calculation or model capable of predicting the volume of water treated before perchlorate breakthrough occurs based on groundwater characteristics including perchlorate, nitrate, sulfate, chloride concentrations, and alkalinity.
3.9.3. Results During this demonstration, the breakthrough capacity of the resin was not observed. During the fourth test period, an inconsistent supply of water from Rialto No. 3 and budget constraints halted the demonstration before breakthrough in the lead vessel was accomplished. This inconsistent operation of the system provided atypical results based on previous demonstrations. Although this capacity was not reached, it is much higher than observed. The current capacity can be calculated using a more recent model for the D4170 WBA resin constructed from previous ESTCP field demonstrations. Using the current WBA IX flow rate capacity of 800 gpm and observed Rialto No. 3 groundwater characteristics, this model supports the earlier estimates that the lead vessel will treat ≥ 9,000 BV’s before regeneration is required.

ESTCP Project No. ER-201168 ARA Project No. 001060
24
3.10. Performance Objective: System Control During Treatment and Regeneration Cycles The Rialto No. 3 WBA system was automated to minimize operator effort and time requirements. The system also has the flexibility to manually modify system parameters such as flow rates, pH set points, time cycles, etc. The system includes a secure, fully enclosed control room that houses the equipment for monitoring and controlling the WBA system. Key operation screens and parameters including pH, flow rates, tank levels, valve conditions (i.e. open or closed), etc., are viewable on the operator interface (O/I). All recorded system data was stored on the DAQ for the duration of the demonstration. The effectiveness and ease of use of the WBA demonstration system using the automated monitoring and control system during ion exchange and regeneration operations will be investigated.
3.10.1. Data Requirements Checklists and protocols were used to guide and streamline system inspection and data collection for each site visit. The time required for completing checklists to accomplish system inspection and data collection was documented each visit. Any tasks that could not be accomplished by a single technician were documented in the site log book and analyzed for alternatives that simplified the process.
3.10.2. Success Criteria Success criterion for this performance objective was defined as the ability of a single field technician/system operator to effectively monitor and control the system during ion exchange and regeneration operations cycles. Success was based on the ability of a single operator to complete a system inspection checklist; view and record monitoring information in log books, including pH, flow rate, tank/vessel level, etc.; and have the ability to adjust control set points in the PLC from the O/I, if necessary.
3.10.3. Results During normal operations, the performance objective was met. The use of the touch screen by a single operator for monitoring and controlling/adjusting system control parameters was very straightforward. Completing checklists and sampling was also handled by a single operator. It is only when the system is having problems, either during treatment or regeneration, that the system requires two or more operators. Because the system is operated from the PLC touch screen in the control room, it is difficult for a single operator to observe what the system is actually doing during trouble shooting.

ESTCP Project No. ER-201168 ARA Project No. 001060
25
4.0 Site Description
4.1. Site Location and History The City of Rialto, California is located in San Bernardino County at the southern base of the San Gabriel Mountains with topography ranging from a low of 1,120 feet to a high of 1,520 feet above sea level. The 22 square mile City is bounded by San Bernardino and Colton on the East and Southeast and by Fontana and unincorporated Bloomington on the West and Southwest.
The northern two-thirds of the City of Rialto overlies the Rialto-Colton Groundwater basin. The City of Rialto currently depends on groundwater from this basin and other nearby groundwater basins for approximately 90% of its annual water supply. Groundwater in the basin flows southeast from the northwest near the former Rialto Ammunition Storage Point (RASP) site, toward the Santa Ana River.
The RASP property was used for munitions storage by the United States Army during World War II. Following inactivation of the RASP in late 1945, and over several years, the property was leased, subdivided, and sold to commercial activities. One resulting activity is the Mid-Valley Sanitary Landfill (MVSL), which has been operated by the County of San Bernardino since 1958. This property consists of approximately 448 acres of which 222 acres are in use for waste disposal activities. In 1990, the County purchased the northeast area of its current property, which contained storage bunkers that were known to have housed explosives, chemicals, propellant, oxidizers, and fireworks. The County demolished these bunkers in 1998-1999 and a portion of this area is currently used by a sand and gravel business in accordance with an agreement between the County and the business. In 1997, the County sampled 23 monitoring wells in the MVSL monitoring system for perchlorate. Only one well had a detectable concentration of perchlorate and it was less than five parts per billion. In 2001, perchlorate concentration of one of the MVSL monitoring wells increased significantly to 250 ppb. As a result, the County increased its monitoring for perchlorate in existing monitoring wells. The County also initiated an assessment of the possible perchlorate sources on its property by analyzing soil samples and process water samples generated by the sand and gravel business. The County found that the northeast area of its property purchased in 1990 may be a source of perchlorate contamination in the groundwater.
The municipal well Rialto No. 3 is located near the City of Rialto’s municipal airport and is owned and operated by the City of Rialto. This well is down gradient of the MVSL property owned by the County and has been impacted by perchlorate and volatile organic carbon (VOC) contamination. This well has historically represented approximately 15% of the City’s demand and is considered an important facility for the City’s water system. In 2003-2004, the Santa Ana Regional Water Quality Control Board (RWQCB) issued cleanup and abatement orders that required the County to cleanup and abate perchlorate discharges at and from its property as well as provide replacement water.
Presently at Rialto No. 3, the County has in place a 2,000 gpm, single-use ion exchange system for perchlorate treatment. This treatment system is intended to intercept, contain, and treat
ESTCP Project No. ER-201168 ARA Project No. 001060
26
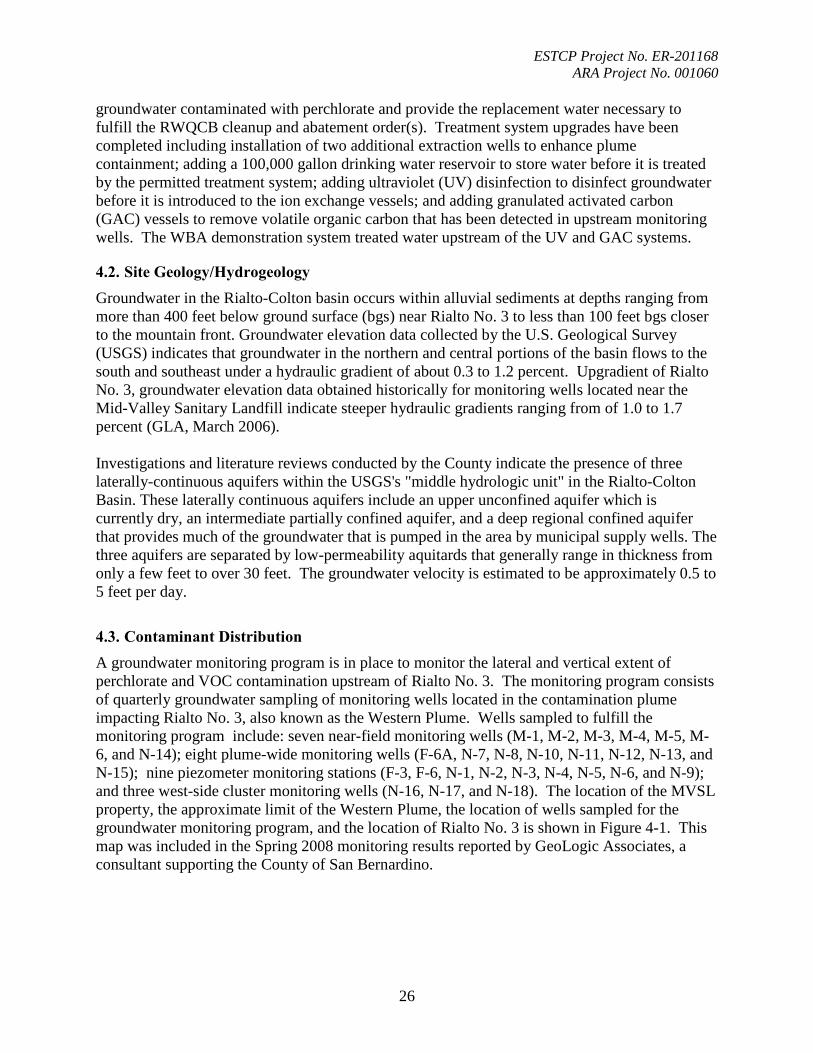
groundwater contaminated with perchlorate and provide the replacement water necessary to fulfill the RWQCB cleanup and abatement order(s). Treatment system upgrades have been completed including installation of two additional extraction wells to enhance plume containment; adding a 100,000 gallon drinking water reservoir to store water before it is treated by the permitted treatment system; adding ultraviolet (UV) disinfection to disinfect groundwater before it is introduced to the ion exchange vessels; and adding granulated activated carbon (GAC) vessels to remove volatile organic carbon that has been detected in upstream monitoring wells. The WBA demonstration system treated water upstream of the UV and GAC systems.
4.2. Site Geology/Hydrogeology Groundwater in the Rialto-Colton basin occurs within alluvial sediments at depths ranging from more than 400 feet below ground surface (bgs) near Rialto No. 3 to less than 100 feet bgs closer to the mountain front. Groundwater elevation data collected by the U.S. Geological Survey (USGS) indicates that groundwater in the northern and central portions of the basin flows to the south and southeast under a hydraulic gradient of about 0.3 to 1.2 percent. Upgradient of Rialto No. 3, groundwater elevation data obtained historically for monitoring wells located near the Mid-Valley Sanitary Landfill indicate steeper hydraulic gradients ranging from of 1.0 to 1.7 percent (GLA, March 2006). Investigations and literature reviews conducted by the County indicate the presence of three laterally-continuous aquifers within the USGS's "middle hydrologic unit" in the Rialto-Colton Basin. These laterally continuous aquifers include an upper unconfined aquifer which is currently dry, an intermediate partially confined aquifer, and a deep regional confined aquifer that provides much of the groundwater that is pumped in the area by municipal supply wells. The three aquifers are separated by low-permeability aquitards that generally range in thickness from only a few feet to over 30 feet. The groundwater velocity is estimated to be approximately 0.5 to 5 feet per day.
4.3. Contaminant Distribution A groundwater monitoring program is in place to monitor the lateral and vertical extent of perchlorate and VOC contamination upstream of Rialto No. 3. The monitoring program consists of quarterly groundwater sampling of monitoring wells located in the contamination plume impacting Rialto No. 3, also known as the Western Plume. Wells sampled to fulfill the monitoring program include: seven near-field monitoring wells (M-1, M-2, M-3, M-4, M-5, M-6, and N-14); eight plume-wide monitoring wells (F-6A, N-7, N-8, N-10, N-11, N-12, N-13, and N-15); nine piezometer monitoring stations (F-3, F-6, N-1, N-2, N-3, N-4, N-5, N-6, and N-9); and three west-side cluster monitoring wells (N-16, N-17, and N-18). The location of the MVSL property, the approximate limit of the Western Plume, the location of wells sampled for the groundwater monitoring program, and the location of Rialto No. 3 is shown in Figure 4-1. This map was included in the Spring 2008 monitoring results reported by GeoLogic Associates, a consultant supporting the County of San Bernardino.

ESTCP Project No. ER-201168 ARA Project No. 001060
27
Figure 4-1. Locations of Wells in the Western Plume in Relation to Rialto No. 3

ESTCP Project No. ER-1168 ARA Project No. 001060
28
5.0 Test Design
5.1. Conceptual Experimental Design This section provides a broad overview of the experimental design to be used to evaluate the technology based on performance objectives. Specific details of the experimental design including sample collection, quality controls and procedures, and data evaluation are provided in the following sections.
5.2. Baseline Characterization Activities A water monitoring program has been in effect for Rialto No. 3 and monitoring wells since 2006. A report is generated quarterly summarizing the analytical results. The results from 6/22/10 of the raw water from Rialto Well No. 3 are shown below in Table 5-1.
Table 5-1. Analytical Results – Historical Summary Data for Well No. 3 Rialto
ANALYTE UNITS AVG. VALUE
Anions Nitrate-Nitrogen mg/L 4.64
Perchlorate µg/L 15.14 Sulfate mg/L 13.36
Volatile Organic Compounds (EPA 524.2)NC Bromochloromethane µg/L 0.19
Bromodichloromethane µg/L 0.42 Bromoform µg/L 0.36
Chloromethane µg/L 0.26 Dibromochloromethane µg/L 1.09
Trichloroethene µg/L 0.36 Total Trihalomethanes µg/L 3.83
Bacteriological Heterotrophic Plate Count CFU/mL 29.9
5.2.1. Available Characterization Data The County of San Bernardino executes a groundwater monitoring program monthly, quarterly, and annually. During this program, approximately 26 groundwater monitoring wells or piezometers are sampled to characterize the groundwater and contamination plume. Relative to the location of Rialto No. 3, these wells and piezometers are positioned near-field, plume-wide, and on the west side. Samples are analyzed for one or more of the various constituents including perchlorate, volatile organic carbon compounds, alkalinity, bicarbonate, carbonate, chloride, hardness (calculation), hydroxide, nitrate, sulfate, total dissolved solids, and metals. Wells from which water could not be sampled (i.e. the well is dry) are identified in the data report.
Data collected from the most up to date groundwater monitoring report were reviewed prior to initiating the demonstration for any anomalies and to facilitate characterization of the groundwater properties approaching Rialto No. 3. Of most interest for this demonstration were

ESTCP Project No. ER-201168 ARA Project No. 001060
29
the near-field wells located directly upstream from Rialto No. 3. These wells include N-14, M-1, and M-3, which are approximately 325 ft, 900 ft, and 2,440 ft directly upstream from Rialto No. 3, respectively.
5.2.2. Groundwater Sampling In addition to having the available plume characterization data, groundwater from Rialto No. 3 was sampled and analyzed prior to startup of the WBA demonstration system. Groundwater from Rialto No. 3 was analyzed for perchlorate, nitrate, sulfate, chloride, and general mineral and physical properties used to determine scaling potential. These water quality characteristics were used not only to assist in determining operational parameters, but also to establish the baseline for evaluating performance objectives identified in Section 3.0. Throughout the demonstration, Rialto No. 3 was sampled several times each month and analyzed by either ARA or by a certified laboratory.
5.3. Treatability or Laboratory Study Results Treatability and laboratory studies were previously performed under ESTCP Project No. ER-0312, “Perchlorate Removal, Destruction, and Field Monitoring Demonstration.”
5.4. Design and Layout of Technology Components 5.4.1. WBA Demonstration System
The WBA ion exchange process is comprised of four major operations: pretreatment, ion exchange, post treatment, and regeneration. Pretreatment consists of acid addition to decrease pH of the untreated feed water in order to maintain functional groups on the WBA resin in the ionized or protonated form. Carbonate (CO3
2-) and bicarbonate (HCO3-) alkalinity present in the
groundwater is converted to carbonic acid in equilibrium with CO2. Approximately 90 percent of the dissolved CO2 is removed by a Liqui-Cel membrane degasifier system. Ion exchange is conducted using two packed-bed ion exchange vessels in lead-lag configuration. At system pressure, any undissolved CO2 remains in solution. Post treatment consists of pH control using soda ash to return treated water to acceptable levels of alkalinity and pH. Regeneration of spent resin is accomplished by circulating a high pH solution through the offline vessel to neutralize the functional groups, followed by rinsing, protonation using acid, and a final rinse. Each of these major operations is illustrated in subsequent sections. A flow diagram of the general process is shown in Figure 5-1. A drawing package containing the original Rialto No. 3 site development plan, WBA system layouts, and WBA system PID’s are attached as Appendix B. Equipment specifications are attached as Appendix C.

ESTCP Project No. ER-201168 ARA Project No. 001060
30
Figure 5-1. Flow Schematic of the WBA Treatment System
IXLead
IXLag
Na2CO3SlurryTank
Well Water2000 gpm
SulfuricAcid
pHpH
Product Water1000 gpm - 20 psig
To Siemens System2000 gpm
Liqui-CelMembraneDegasifier
Bypass1000 gpm
IX vessel drainTransfer
Tank Regeneration rinseProtonation rinse
Feed Pumps1000 gpm
75 psig
Transfer Pump100 gpm
RegenerationRinse – pH 9
Make-Up Water
ProtonationRinse
(Treated Water)
pH
Fully-TreatedWater
Reservoir
StaticMixer
StaticMixer
Dry Soda Ash
StaticMixerIX
LeadIX
Lag
Na2CO3SlurryTank
Well Water2000 gpm
SulfuricAcid
pHpH
Product Water1000 gpm - 20 psig
To Siemens System2000 gpm
Liqui-CelMembraneDegasifier
Bypass1000 gpm
IX vessel drainTransfer
Tank Regeneration rinseProtonation rinse
Feed Pumps1000 gpm
75 psig
Transfer Pump100 gpm
RegenerationRinse – pH 9
Make-Up Water
ProtonationRinse
(Treated Water)
pH
Fully-TreatedWater
Reservoir
StaticMixer
StaticMixer
Dry Soda Ash
StaticMixer

ESTCP Project No. ER-1168 ARA Project No. 001060
31
5.4.1.1. Pretreatment (Reduce pH)
The objective for pretreatment was to reduce pH in the groundwater prior to ion exchange. Reducing the pH of the groundwater ensured that functional groups on the WBA resin remained protonated or ionized and capable of perchlorate exchange. The operational pH was maintained at 4.0-4.5 by addition of NSF certified 96-98% sulfuric acid. Two–step mixing of the sulfuric acid into the feed water was performed to ensure complete mixing while reducing groundwater pH. In the first step, a dosing pump injected acid into a slipstream of feed water downstream of the system feed pumps. This line contained a static mixer which provided the initial mixing of the acid. This slipstream was then redirected to an injection location on the suction side of the feed pumps where it passed through another static mixer. This configuration ensured the optimal/complete mixing of feed water and acid before water reached the membrane degasifier system and ion exchange vessels, and protecting the main feed pumps.
At operational pH, carbonate (CO32-) and bicarbonate (HCO3
-) alkalinity present in the groundwater converted to carbonic acid in equilibrium with dissolved CO2. To save chemical costs on the downstream, neutralization process (post-treatment), excess dissolved CO2 was removed from the feed water using the membrane degasifying system. The Liqui-Cel membrane degassing system stripped 85-90% of the dissolved CO2 from the feed water. A liquid-ring vacuum pump provided the vacuum required for operation of the membrane system.
Integrated redundant pH probes monitored feed water pH downstream of the membrane degassing system. WBA system interlocks were controlled by one pH probe, although the PLC monitored both probes to ensure accurate and precise pH control was maintained. If signals from the pH probes deviated from one another by the predetermined amount, then alarms and interlocks initiated system shutdown.
5.4.1.2. Ion Exchange
Perchlorate removal was accomplished using two, packed bed ion exchange vessels operated in a series, lead-lag configuration. These vessels have a diameter of 108 inches (9 ft), with a cylindrical height of 92.5 inches (7.7 ft). The materials of construction for these vessels were SA 516-70 lined with an NSF-approved vinyl ester material that was resistant to acid and caustic solutions. The packed-bed configuration minimized the volumes of regenerating and rinse solutions generated during regeneration procedures. Operational service for the vessels was designed to be upflow with a design treatment rate of 3 gpm/ft3 of resin (24 BV/hr), establishing a minimum resin capacity of 333 ft3 per vessel (in the free-base form). Each vessel was loaded with 350 ft3 of Purolite D-4170 resin and 40 ft3 of Purolite IP4 inert resin. A vessel diameter of 9 feet results in a linear flow rate of 17 gpm/ft2 with a pressure drop of 13.5 psig at 1100 gpm. Based on a treatment capacity of 10,000 bed volumes and with perchlorate concentration less than or equal to 200 ppb in the groundwater, the regeneration frequency was estimated to be every 17 days when operated 24 hours per day. The CDPH 97-005 Policy Memorandum requires “multi-barrier” treatment (i.e., lead-lag, two-stage vessel configuration) for perchlorate removal when using ion exchange. Ion exchange treatment systems have been permitted for intermittent operation with a single vessel on-line while the redundant vessel is being regenerated or the resin is replaced.

ESTCP Project No. ER-201168 ARA Project No. 001060
32
5.4.1.3. Post Treatment (Restore pH)
Post treatment of the treated water restores pH and alkalinity to acceptable levels. Soda ash was used to restore alkalinity and pH, resulting in near-neutral water with respect to scaling or corrosion tendencies. The post-treatment soda ash system has the flexibility to produce soda ash solutions that vary in concentration from 1 to 10% dry soda ash.
The packaged soda ash system was engineered and fabricated by Merrick Industries, Inc. The system includes components for storage of dry soda ash and for preparation and delivery of soda ash solution. Bags of dry soda ash were emptied into a bag dump station equipped with a dust control system (reverse pulse jet dust collector and blower assembly). The dry soda ash was conveyed to a storage hopper (39.5 ft3) using a flexible screw conveyer. Soda ash solutions were prepared in a 100 gallon dissolver tank. This was accomplished by simultaneously feeding dry soda ash from the storage hopper and a slip stream of treated water into the dissolver tank at pre-determined and pre-calibrated rates to attain the desired concentration of soda ash solution in the tank. The soda ash concentration has the flexibility to be adjusted, as needed, to meet system requirements. Soda ash concentration was maintained volumetrically and independent of the usage rate.
Two positive displacement pumps with pulsation dampeners were used to deliver soda ash solution to neutralize the 800-1000 gpm treated water stream. A static mixer element was used at the injection point to ensure complete mixing of the soda ash solution. Flow rates were adjustable by changing the stroke length of the pumps.
Redundant pH probes monitored the fully treated water pH downstream of the static mixing element. WBA system interlocks were controlled by a single pH probe. However, the PLC monitored both probes to ensure that accurate pH control was maintained. If signals from the pH probes deviated from one another by the predetermined amount, then alarms, interlocks, or shutdown were initiated.
5.4.1.4. Regeneration
Major components of the regeneration system consist of: 1) a drain/transfer pump to initially drain the offline, ion exchange vessel; 2) a transfer vessel and pump to recycle rinse water and vessel drain water; 3) a sulfuric acid (96-98%) storage tank and feed pump; 4) a sodium hydroxide (25%) storage tank and feed pump; 5) a regeneration tank; 6) a protonation tank; 7) pH probes and associated controls for use with the regeneration system; 8) a 500-gpm regeneration/protonation pump; and 9) a scavenger ion exchange system to treat spent regenerating solution before discharge.
Regeneration of spent WBA resin included two key operations: 1) neutralization of the functional groups to “release” anions (regeneration) and rinsing and 2) ionization of functional groups to restore ion exchange functionality (protonation) and rinsing. Key steps of this entire operation are shown as flow diagrams in Figures 5-2 and 5-3. During regeneration, a spent, offline, ion exchange vessel was drained and the water was pumped to the front of the system for treatment by the online vessel (Step 1). Regeneration solution (a pre-determined amount of sodium hydroxide in a fixed volume of water) was circulated at a minimum of 500 gpm, up-flow,

ESTCP Project No. ER-201168 ARA Project No. 001060
33
through the spent ion exchange vessel (Step 2). After attaining set time and pH criteria, circulation was discontinued. The spent regenerating solution was pumped from the offline vessel, through the scavenger vessels, and into the waste holding tank (Step 3). The initial pH 9 rinse was collected in the regeneration tank and held for the next regeneration (Step 4). A final rinse of 16-20 hours flowed to the transfer tank for retreatment (Step 5 – not shown).

ESTCP Project No. ER-1168 ARA Project No. 001060
34
RegenTank
Proton-ationTank
Off-lineVessel
ScavengerVessels
1 – Vessel Drain – 100 gpm
HoldingTank
TransferTank
Packed BedDrain pump
On-lineVessel
Transfer Pump
RegenTank
Proton-ationTank
Off-lineVessel
ScavengerVessels
2 – Regeneration – Up Flow 500 gpm
HoldingTank
TransferTank
pH
Transfer Pump
RegenPump
RegenTank
Proton-ationTank
Off-lineVessel
ScavengerVessels
3 – Regeneration Drain and Scavenge
HoldingTank
TransferTank
Packed BedDrain pump
Transfer Pump
RegenTank
Proton-ationTank
Off-lineVessel
ScavengerVessels
4 – Initial Regen Rinse – Down Flow 100 gpm
HoldingTank
TransferTank
Fully-treatedWater pH 9
Transfer Pump
RegenTank
Proton-ationTank
Off-lineVessel
ScavengerVessels
1 – Vessel Drain – 100 gpm
HoldingTank
TransferTank
Packed BedDrain pump
On-lineVessel
Transfer Pump
RegenTank
Proton-ationTank
Off-lineVessel
ScavengerVessels
2 – Regeneration – Up Flow 500 gpm
HoldingTank
TransferTank
pH
Transfer Pump
RegenPump
RegenTank
Proton-ationTank
Off-lineVessel
ScavengerVessels
3 – Regeneration Drain and Scavenge
HoldingTank
TransferTank
Packed BedDrain pump
Transfer Pump
RegenTank
Proton-ationTank
Off-lineVessel
ScavengerVessels
4 – Initial Regen Rinse – Down Flow 100 gpm
HoldingTank
TransferTank
Fully-treatedWater pH 9
Transfer Pump
Figure 5-2. Regeneration Steps

ESTCP Project No. ER-201168 ARA Project No. 001060
35
RegenTank
Proton-ationTank
Off-lineVessel
ScavengerVessels
8 – ProtonationRinse – Down Flow 100 gpm
HoldingTank
TransferTank
On-lineVessel
TreatedWater pH 4
Transfer Pump
Tank Truck
RegenTank
Proton-ationTank
Off-lineVessel
ScavengerVessels
6 – Protonation– Up Flow 500 gpm
HoldingTank
TransferTank
Transfer Pump
pH
RegenPump
RegenTank
Proton-ationTank
Off-lineVessel
ScavengerVessels
7 – ProtonationDrain
HoldingTank
TransferTank
Packed BedDrain pump
Transfer Pump
RegenTank
Proton-ationTank
Off-lineVessel
ScavengerVessels
8 – ProtonationRinse – Down Flow 100 gpm
HoldingTank
TransferTank
On-lineVessel
TreatedWater pH 4
Transfer Pump
Tank Truck
RegenTank
Proton-ationTank
Off-lineVessel
ScavengerVessels
8 – ProtonationRinse – Down Flow 100 gpm
HoldingTank
TransferTank
On-lineVessel
TreatedWater pH 4
Transfer Pump
Tank Truck
RegenTank
Proton-ationTank
Off-lineVessel
ScavengerVessels
6 – Protonation– Up Flow 500 gpm
HoldingTank
TransferTank
Transfer Pump
pH
RegenPump
RegenTank
Proton-ationTank
Off-lineVessel
ScavengerVessels
6 – Protonation– Up Flow 500 gpm
HoldingTank
TransferTank
Transfer Pump
pH
RegenPump
RegenTank
Proton-ationTank
Off-lineVessel
ScavengerVessels
7 – ProtonationDrain
HoldingTank
TransferTank
Packed BedDrain pump
Transfer Pump
RegenTank
Proton-ationTank
Off-lineVessel
ScavengerVessels
7 – ProtonationDrain
HoldingTank
TransferTank
Packed BedDrain pump
Transfer Pump
Figure 5-3. Protonation Steps

ESTCP Project No. ER-1168 ARA Project No. 001060
36
Following the pH 9 rinse, the resin in the offline vessel was protonated. To accomplish this, a protonation solution (a pre-determined amount of sulfuric acid in a fixed volume of water) was circulated at a minimum of 500 gpm, up-flow, through the ion exchange vessel (Step 6). After attaining the pH criteria for the specified time, circulation of the protonation solution was discontinued and the ion exchange vessel and protonation tank were drained to the waste holding tank (Step 7). The vessel was rinsed with treated water for a set time (Step 8) prior to returning the vessel to online operation in the lag position.
5.4.2. Integration with Extraction Well Rialto No. 3 The demonstration system was integrated with Rialto No. 3 as a “pre-treatment” system to the existing, single-use ion exchange system as shown in Figure 5.4. This enabled the demonstration of the WBA treatment system to take place while still allowing the City of Rialto to simultaneous produce up to 2,000 gpm of drinking water through their existing, permitted treatment system. During the demonstration, flow from Rialto No. 3 was split to provide up to 1,000 gpm to the WBA process and up to 1,000 gpm to the 100,000 gallon feed reservoir. During periods when the WBA system was offline, all well water flowed unrestricted to the feed reservoir. Suction head pressure for the WBA system was observed to be 8-10 psig.
Final Treated Water(2000 gpm)
95 ppm Alkalinity 15 ppm Chloride93 ppm Sulfate27 ppm Nitrate< 1 ppb Perchlorate
ContaminatedGroundwater(2000 gpm)
160 ppm Alkalinity 15 ppm Chloride15 ppm Sulfate27 ppm Nitrate200 ppb Perchlorate
WBA Treated Water30 ppm Alkalinity 15 ppm Chloride171 ppm Sulfate27 ppm Nitrate< 1 ppb Perchlorate-0.5 < LSI < 0.5
Combined Feed Water95 ppm Alkalinity 15 ppm Chloride93 ppm Sulfate27 ppm Nitrate100 ppb Perchlorate
Siemens System
WBA Demo System
FeedEqualization
Tank
Alkalinity as CaCO3Nitrate as NO3
1000 gpm
1000 gpm
2000 gpm
Figure 5-4. WBA System Integration with Rialto No. 3

ESTCP Project No. ER-201168 ARA Project No. 001060
37
5.4.3. Integration with Infiltration Basin and Feed Reservoir Piping and valves were installed to direct water produced by the WBA treatment system to either of the two following discharge points: 1) an infiltration basin with a capacity of approximately 900,000 gallons; or 2) a 100,000 gallon feed reservoir which serves as the source of water for the existing treatment system at Rialto No. 3, which operates under a drinking water supply permit issued by CDPH.
Water produced from the demonstration system during functional testing, start-up testing, and troubleshooting operations was be discharged directly to the infiltration basin. During these tests, the system operated for short periods of time and/or at reduced flow rates as limited by the infiltration basin capacity.
During the actual demonstration, water was directed to the 100,000 gallon feed reservoir after completion of an extensive review of WBA operating procedures and approval by CDPH. Water from the reservoir was treated by the existing permitted system that included UV sterilization, ion exchange, carbon treatment, and disinfection. After disinfection the water entered normal distribution.
5.5. Field Testing 5.5.1. Functional Testing
All vessels, tanks, pumps, pipes and valves, and sensors and controls were inspected for structural integrity and function. Leak testing of tanks, pumps, and valves were performed by filling tanks with potable water or groundwater and inspecting the system for leaks while operating individual pumps and valves. Equipment items (i.e., pumps, air compressor, etc.) and instrumentation (i.e, pH probes, level sensors, etc.) were functionally/operationally tested and calibrated. Water used for leak testing was drained into the infiltration basin.
Functional testing was previously completed during the fall of 2010 under ESTCP Project No. ER-0312, “Perchlorate Removal, Destruction, and Field Monitoring Demonstration.”
5.5.2. Startup Testing Following functional testing, the system was operated under scenarios which tested system operation and control. All system alarms and interlocks in the PLC logic were tested to ensure that the system operated as designed in a controlled and reliable manner.
Startup testing was previously completed during the fall of 2010 under ESTCP Project No. ER-0312, “Perchlorate Removal, Destruction, and Field Monitoring Demonstration.”
5.5.3. System Disinfection Prior to delivering water from the WBA demonstration system to the 100,000 gallon reservoir feeding the existing perchlorate treatment system, the vessels, tanks, and pipes were disinfected. A subcontractor was hired to disinfect the system according to AWWA standard C653-03 “Disinfection of Water Treatment Plants.” Disinfection was previously completed during the fall of 2010 under ESTCP Project No. ER-0312. Due to the length of time the system had been in standby awaiting for various approvals (approximately 6-7 months), Bac-T analyses were
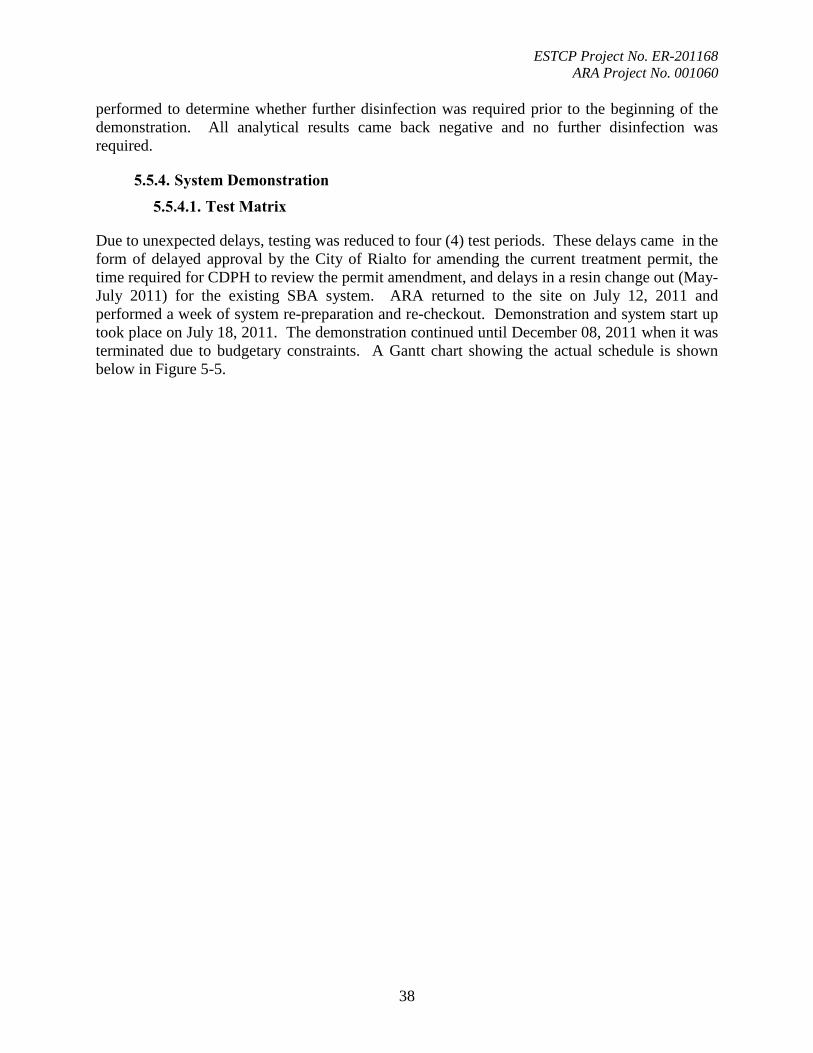
ESTCP Project No. ER-201168 ARA Project No. 001060
38
performed to determine whether further disinfection was required prior to the beginning of the demonstration. All analytical results came back negative and no further disinfection was required.
5.5.4. System Demonstration 5.5.4.1. Test Matrix
Due to unexpected delays, testing was reduced to four (4) test periods. These delays came in the form of delayed approval by the City of Rialto for amending the current treatment permit, the time required for CDPH to review the permit amendment, and delays in a resin change out (May-July 2011) for the existing SBA system. ARA returned to the site on July 12, 2011 and performed a week of system re-preparation and re-checkout. Demonstration and system start up took place on July 18, 2011. The demonstration continued until December 08, 2011 when it was terminated due to budgetary constraints. A Gantt chart showing the actual schedule is shown below in Figure 5-5.

ESTCP Project No. ER-1168 ARA Project No. 001060
39
Figure 5-5. Rialto 3 WBA IX Testing

ESTCP Project No. ER-1168 ARA Project No. 001060
40
Delays and problems occurred throughout each test period that lengthened the overall time of the demonstration. These delays and problems presented themselves most often as difficulties obtaining groundwater from Rialto No. 3, but also with operation of the soda ash post treatment system. The test plan performed is shown in Table 5-2.
Table 5-2. WBA IX Test Matrix
Test Period
Lead Vessel
Actual Days of
Operation
Lead Column Gallons Treated
(MG) BV
Treated ClO4 Conc.
(ppb) %
Breakthrough 1 1 WBA-301 3.1 1,339 1.2 13 3.51 2 1 WBA-302 5.5 2,261 1.4 16 5.92 3 1 WBA-301 9.3 4,081 2.8 31 10.69 4 2 WBA-302 16.5 7,269 4.4 49 19.03
TOTALS: 34.4 14,950 39.15 1 The low volume of BV’s treated during the first three test periods were due to early termination of testing to meet project regeneration objectives 2 The fourth test was terminated early due to operational problems During each test period, there were six operating modes for each ion exchange vessel: 1) IX operation/water treatment; 2) regeneration of the lead column; 3) scavenger treatment of regeneration waste; 4) regeneration rinse; 5) protonation; and 6) protonation rinse. Figure 5-5 is a diagram illustrating the order of these operating modes and provides a brief configuration description for the lead and lag vessels.

ESTCP Project No. ER-201168 ARA Project No. 001060
41
Operating Modes Configuration Description
Lead Vessel Lag Vessel Configuration Description
IX Operation IX Operation Both vessels online, in series treating groundwater
Regeneration IX Operation Lead vessel regenerated while lag vessel is operating online
Scavenger Treatment IX Operation Spent regenerating solution lead vessel is treated while lag vessel is operating online
Regeneration Rinse IX Operation Lead vessel is rinsed while lag is operating online
Protonation IX Operation Lead vessel is protonated while lag is operating online
Protonation Rinse IX Operation Lead vessel is rinsed while lag is operating online
Figure 5-6. Configuration Description of Operational Steps
Each test period was defined as the point in time when flow was initiated through the newly regenerated vessel in the lead position until the vessel was taken offline for regeneration. Data from models based on the Fontana demonstration (ESTCP Project No. ER-0312) estimates that each WBA vessel will treat approximately 9,000 bed volumes of water from Rialto No. 3 prior to perchlorate breakthrough. The first two test periods were intentionally reduced in order to accomplish the operation-regeneration cycles in a short period of time. This was performed in an attempt to enable the resin to reach homeostatic performance, overcoming the performance influences caused by virgin-resin effects. The third test period was intended to operate the resin to near breakthrough conditions. For this demonstration, breakthrough was defined as the amount of BV’s treated when the perchlorate concentration of the lead vessel effluent reaches 50% of the perchlorate concentration of the groundwater influent. The calculated BV’s required for breakthrough was predicted to be 9,000 BV’s. The fourth test period was intended to demonstrate breakthrough, but was not completed due to operational difficulties and budgetary constraints. As stated previously, during each test period there were several events that lengthened each test period. Spreadsheets outlining daily flows, totalizer readings, and comments for each test period during the demonstration are attached as Appendix D.
REGENERATED VESSEL RETURNED TO SERVICE IN LAG POSITION
LAG VESSEL BECOMES LEAD VESSEL

ESTCP Project No. ER-201168 ARA Project No. 001060
42
5.5.5. System Shutdown and Demobilization The demonstration was ended on December 08, 2011 due to schedule and budget constraints. ARA returned to the site February 22, 2012 to begin demobilization. Both ion exchange vessels were regenerated offline manually. At completion of regeneration, both vessels were drained and the resin left at pH >12.0 to prevent any biological growth during long term storage. The Liqui-Cel membrane pretreatment system was isolated and completely drained. All chemical supply lines were back flushed to a sump and drained to the waste storage tank for disposal. Each of the chemical storage vessels and regeneration vessels were also drained to the waste storage tank, rinsed, re-drained to waste storage, and isolated. The A530E SBA resin used for scavenging perchlorate from the spent regenerant was removed from the scavenger vessels by a certified contractor (Baker/Purolite) and landfilled. All soda ash was removed from the package soda ash post treatment system and placed in containers for disposal. This soda ash and excess bags of soda ash were disposed of by a certified waste hauler (K-Vac Environmental, Rancho Cucamonga, CA). The soda ash dissolver tank was drained and rinsed thoroughly to the waste storage tank. The soda ash feed system was also disassembled and all equipment rinsed down with potable water into a sump and drained to waste storage. All liquids from the waste storage tank were neutralized and disposed of at the San Bernardino SARI line by the certified waste handler (K-Vac Environmental) under ARA’s disposal permit. All data collected on the DAQ was downloaded onto a thumb drive and secured. The data acquisition system and PLC were switched off and system power was de-energized at the breaker panels. All pH probes were thoroughly cleaned, rinsed with distilled water, and placed in individual storage containers filled with pH 7.0 buffer solutions. Spare parts and equipment to be left onsite were stored in boxes on shelves in the control building. The WBA resin ion exchange system will remain in standby mode until final disposition is determined by San Bernardino County and the City of Rialto.
5.6. Sampling Methods All demonstration sampling was conducted by ARA personnel. A comprehensive sampling plan titled “Demonstration of Perchlorate Removal at Rialto No. 3 using 1000 gpm WBA Resin Technology-Performance Objective Plan” was submitted to CDPH April 2011 for pretreatment permit approval. This plan covers sampling, calibration of analytical equipment, quality assurance sampling, and sample documentation and has been attached as Appendix E. A summary of the analytes, methods, sample descriptions, and number of samples pulled during both the water treatment cycle and the regeneration cycle for each test period are shown below in Tables 5-3 and 5-4. The number of samples does not include duplicates or QA/QC samples collected and analyzed in accordance with the QAPP.

ESTCP Project No. ER-1168 ARA Project No. 001060
43
Table 5-3. Sampling Summary for WBA IX Demonstration During the Treatment Cycle
Test Period
Sample Description
ARA Laboratory Weck Laboratories ClO4
- (EPA314.0)
Anions (EPA300.0)*
ClO4-
(EPA314.0) ClO4
- (EPA331.0)
Anions (EPA300.0)*
LSI Group** Biological
1
GW Feed 6 2 1 1 1 1
Lead A 6 2 1 1 1 Lag B 6 2 FTGW 6 2 1 1 1 1 1
2
GW Feed 6 2 4 1 2 Lag A 6 2 1 Lead B 6 2 2 1 FTGW 6 2 2 1 2 2
3
GW Feed 14 5 4 1 Lead A 14 5 2 1 2 Lag B 14 5 1 FTGW 14 5 6 4 5 2
4
GW Feed 24 9 1 1 Lag A 24 9 1 Lead B 24 9 7 3 FTGW 24 9 13 6 5 3
TOTALS: 200 72 12 36 14 17 19
*Anions include nitrate, sulfate, and chloride
**LSI Group includes pH, alkalinity, total dissolved solids, calcium, and temperature
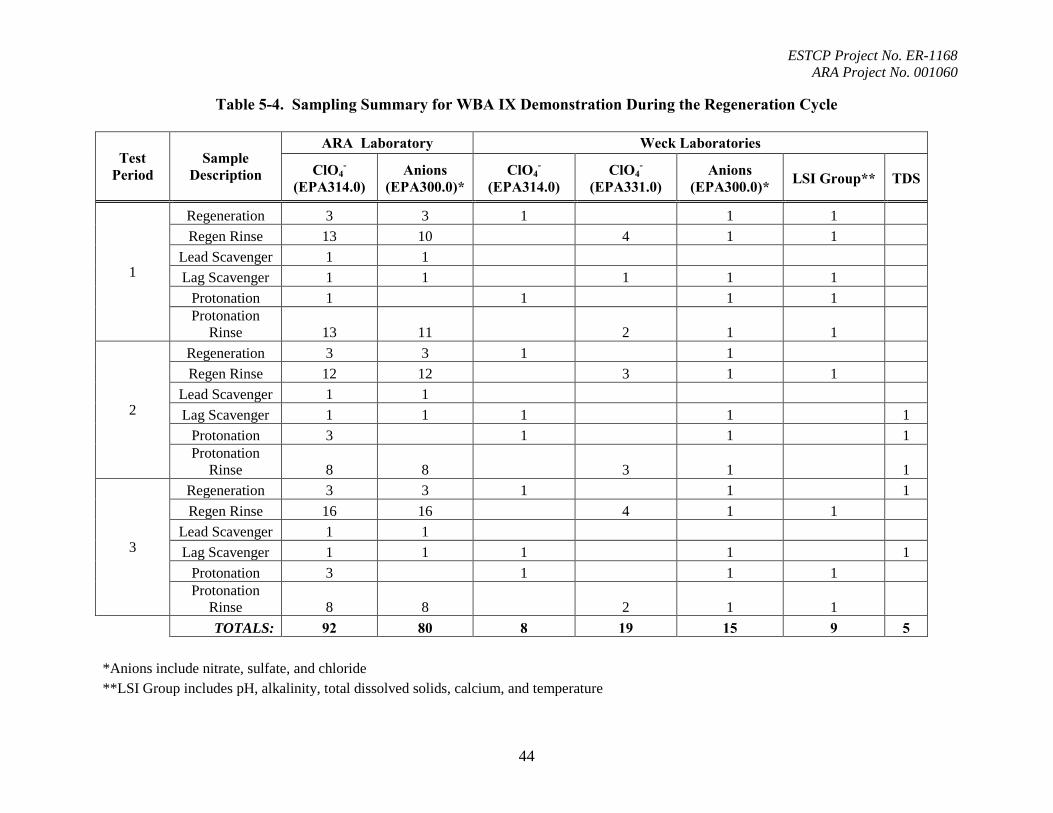
ESTCP Project No. ER-1168 ARA Project No. 001060
44
Table 5-4. Sampling Summary for WBA IX Demonstration During the Regeneration Cycle
Test Period
Sample Description
ARA Laboratory Weck Laboratories
ClO4-
(EPA314.0) Anions
(EPA300.0)* ClO4
- (EPA314.0)
ClO4-
(EPA331.0) Anions
(EPA300.0)* LSI Group** TDS
1
Regeneration 3 3 1 1 1 Regen Rinse 13 10 4 1 1
Lead Scavenger 1 1 Lag Scavenger 1 1 1 1 1
Protonation 1 1 1 1 Protonation
Rinse 13 11 2 1 1
2
Regeneration 3 3 1 1 Regen Rinse 12 12 3 1 1
Lead Scavenger 1 1 Lag Scavenger 1 1 1 1 1
Protonation 3 1 1 1 Protonation
Rinse 8 8 3 1 1
3
Regeneration 3 3 1 1 1 Regen Rinse 16 16 4 1 1
Lead Scavenger 1 1 Lag Scavenger 1 1 1 1 1
Protonation 3 1 1 1 Protonation
Rinse 8 8 2 1 1 TOTALS: 92 80 8 19 15 9 5
*Anions include nitrate, sulfate, and chloride **LSI Group includes pH, alkalinity, total dissolved solids, calcium, and temperature

ESTCP Project No. ER-201168 ARA Project No. 001060
45
Table 5-5 lists the analytical methods along with specific containers, preservatives and maximum holding times used during the demonstration.
Table 5-5. Analytical Methods Used During the WBA IX Demonstration
Analyte Method Container Preservative Holding TimePerchlorate, IC EPA 314.0 HDPE < 4 oC 28 days
Low-Level Perchlorate, LC/IC/MS/MS EPA 331.0 HDPE < 4 oC 28 daysNitrate, as NO3 EPA 300.0 HDPE < 4 oC 2 days
Sulfate EPA 300.0 HDPE < 4 oC 28 daysChloride EPA 300.0 HDPE < 4 oC 28 days
pH EPA 150.1 HDPE < 4 oC 15 minutesAlkalinity (as CaCO3) SM 2320B HDPE < 4 oC 14 days
Total Dissolved Solids (TDS) SM 2540C HDPE < 4 oC 7 days
Calcium, Total EPA 200.7 HDPE < 4 oC, Nitric Acid
6 months
Langelier Saturation Index/Corrosivity** SM 2330B HDPE < 4 oC 14 daysNitrosamines EPA 521 Amber Glass < 4 oC 365 days
Total Coliform/E. coli, P/A SM 9223 Sterile Polyethylene < 4 oC, Sodium Thiosulfate
30 hours
*All samples were in an aqueous matrix**LSI/Corrosivity includes pH, alkalinity, total dissolved solids, calcium, and temperature
Samples were analyzed for perchlorate, other inorganic anions, and total dissolved solids at ARA's in-house laboratory. Select samples were split and shipped to Weck Laboratories for external analysis of perchlorate, inorganic anions, Langelier Saturation Index, and other general mineral and physical analyses. Biological testing required by CDPH was performed by Clinical Laboratories. The address of each laboratory is listed below: In-House Analyses: External Analyses: Applied Research Associates, Inc. Weck Laboratories, Inc. 430 West 5th Street, Suite 700 14859 East Clark Avenue Panama City, Florida, 32401 City of Industry, CA 91745 Phone: 850-914-3188 Phone: 626-336-2139 NELAP #: 04229CA
Clinical Laboratory of San Bernardino, Inc. 21881 Grand Terrace Road Grand Terrace, CA 92313 Phone: 909-825-7693 ELAP #: 1088

ESTCP Project No. ER-201168 ARA Project No. 001060
46
5.7. Sampling Results
5.7.1 Perchlorate Analysis All fully treated water samples analyzed for perchlorate during each test period were less than the DLR of 4 ppb. During the demonstration, there were several unexpected shutdowns due to water supply problems with Rialto No. 3, or from other perturbations. The WBA IX system was restarted on each occasion with no treated water perchlorate concentrations exceeding the DLR of 4 ppb. ARA laboratory results are shown below in Figure 5-6. Both groundwater and treated groundwater samples were analyzed using EPA Method 314.0 (IC).
0.0
2.0
4.0
6.0
8.0
10.0
12.0
14.0
16.0
18.0
20.0
Perc
hlor
ate
Con
cent
ratio
n (p
pb)
Date
Rialto 3 Groundwater
WBA IX Treated Groundwater
DLR = 4 ppb
Figure 5-7. ARA Laboratory Perchlorate Results for Test Periods 1-4 Results from Weck Laboratories (City of Industry, CA) are shown below in Figure 5-7. These results confirm the ARA results above. All groundwater samples from Rialto No. 3 were analyzed using EPA 314.0 (IC), while all fully treated water samples were analyzed using EPA 331.0 (LC-IC-MS-MS).

ESTCP Project No. ER-201168 ARA Project No. 001060
47
0.0
2.0
4.0
6.0
8.0
10.0
12.0
14.0
16.0
18.0
20.0
Perc
hlor
ate
Con
cent
ratio
n (p
pb)
Date
Rialto 3 Feed Water (EPA 314.0)
Fully Treated Water (EPA 331.0)
DLR = 4 ppb
Figure 5-8. Certified Laboratory Perchlorate Results for Test Periods 1-4
5.7.2 Post Treatment—Langelier Saturation Index (LSI) The performance objective for post treatment was to control and adjust pH and alkalinity of the fully treated water to acceptable levels with regard to corrosiveness or scaling tendencies prior to distribution. The Langelier Saturation Index (LSI) was used as the measure of post treatment success. This index is a calculated number used to predict the calcium carbonate (CaCO3) stability of water; that is, whether a water sample will precipitate, dissolve, or be in equilibrium with calcium carbonate. The data required to calculate LSI includes alkalinity (mg/L as CaCO3), pH, total dissolved solids (mg/L TDS), calcium hardness (mg/L as CaCO3), and water temperature (°C). If water has an LSI of > 1.0, scale tends to form; conversely, if water has an LSI of -1.0, it is considered corrosive (i.e., dissolves CaCO3). In practice, water between -0.5 and 0.5 tends to be neither scaling, nor corrosive. For this demonstration, the objective was considered successful if 95% or more of the samples were between and LSI of 0 and 1.0.
Samples of fully treated water were analyzed by Weck Laboratories and the resulting data was used to calculate the LSI for each sample. Of the eighteen samples taken during the demonstration, no samples measured at 20°C met our performance objective of having an LSI between 0 and 1.0. Only four samples (22%) measured at 60°C met that objective. Results are shown below in Figure 5-8.
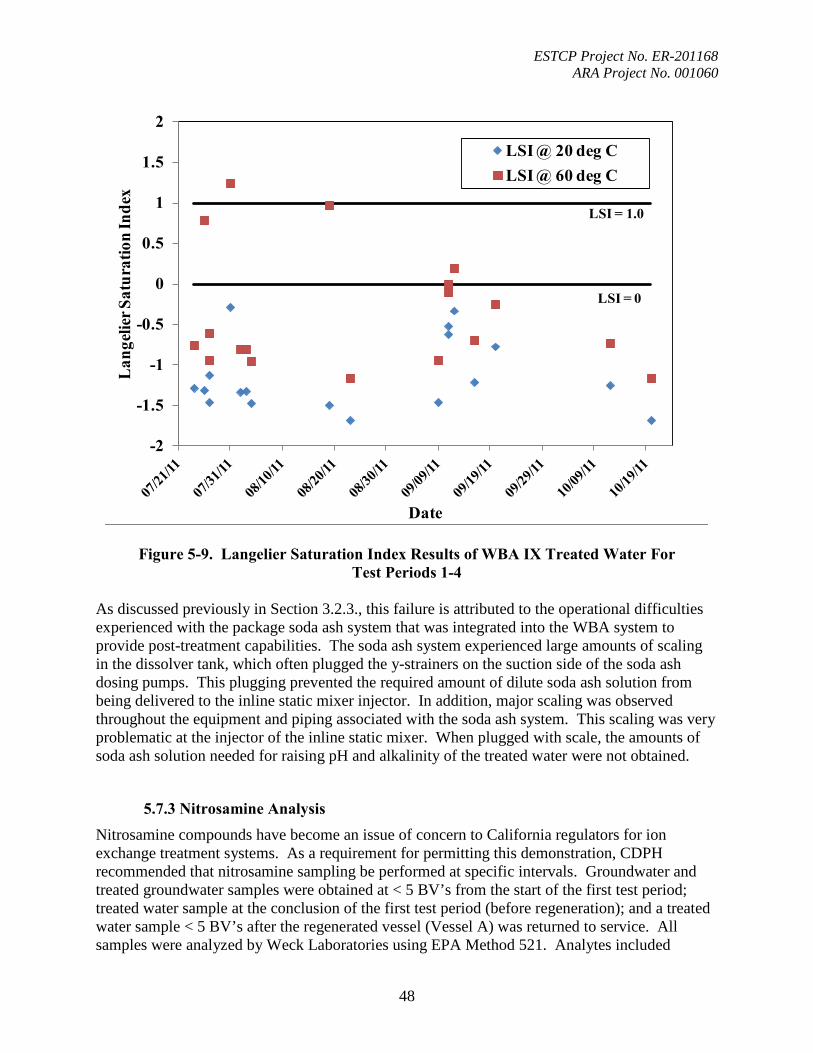
ESTCP Project No. ER-201168 ARA Project No. 001060
48
-2
-1.5
-1
-0.5
0
0.5
1
1.5
2L
ange
lier S
atur
atio
n In
dex
Date
LSI @ 20 deg CLSI @ 60 deg C
LSI = 1.0
LSI = 0
Figure 5-9. Langelier Saturation Index Results of WBA IX Treated Water For Test Periods 1-4
As discussed previously in Section 3.2.3., this failure is attributed to the operational difficulties experienced with the package soda ash system that was integrated into the WBA system to provide post-treatment capabilities. The soda ash system experienced large amounts of scaling in the dissolver tank, which often plugged the y-strainers on the suction side of the soda ash dosing pumps. This plugging prevented the required amount of dilute soda ash solution from being delivered to the inline static mixer injector. In addition, major scaling was observed throughout the equipment and piping associated with the soda ash system. This scaling was very problematic at the injector of the inline static mixer. When plugged with scale, the amounts of soda ash solution needed for raising pH and alkalinity of the treated water were not obtained.
5.7.3 Nitrosamine Analysis Nitrosamine compounds have become an issue of concern to California regulators for ion exchange treatment systems. As a requirement for permitting this demonstration, CDPH recommended that nitrosamine sampling be performed at specific intervals. Groundwater and treated groundwater samples were obtained at < 5 BV’s from the start of the first test period; treated water sample at the conclusion of the first test period (before regeneration); and a treated water sample < 5 BV’s after the regenerated vessel (Vessel A) was returned to service. All samples were analyzed by Weck Laboratories using EPA Method 521. Analytes included

ESTCP Project No. ER-201168 ARA Project No. 001060
49
NDEA, NDMA, NDBA, NDPA, NMEA, NMOR, NPIP, and NPYR. The reportable limit for each of these analytes is 2 ng/L. NDEA and NPIP were observed at concentrations above the reportable limit at < 5 BV’s after startup, but were non-detect throughout the remainder of the demonstration. According to Purolite, low-level nitrosamine formation can occur if resin is stored for extended periods of time prior to use. The WBA resin was loaded into the IX vessels several months prior to demonstration testing. Once placed into service, the nitrosamine concentration was quickly reduced to non-detectable levels. Results are shown in Table 5-6.
Table 5-6. Certified Laboratory Results of Nitrosamines
EPA Method 521 Nitrosamines (ng/L)
Sample Points
GW 07/18 @ 1029
FTGW 07/18 @
1029
FTGW 07/24 @
0810
Vessel A Rtn to Svc (<5BV) 07/27 @1117
N-Nitrosodiethylamine (NDEA) ND 26 ND ND
N-Nitrosodimethylamine (NDMA) ND ND ND ND
N-Nitrosodi-n-butylamine (NDBA) ND ND ND ND
N-Nitrosodi-n-propylamine (NDPA) ND ND ND ND
N-Nitrosomethylethylamine (NMEA) ND ND ND ND
N-Nitrosomorpholine (NMOR) ND ND ND ND
N-Nitrosopiperidine (NPIP) ND 660 ND ND N-Nitrosopyrrolidine
(NPYR) ND ND ND ND

ESTCP Project No. ER-201168 ARA Project No. 001060
50
6.0 Performance Assessment
The objective of this demonstration was to test and validate weak base ion exchange (WBA IX) technology using established performance objectives in order to obtain permitting and certification from the California Department of Public Health (CDPH) as an approved perchlorate treatment technology. Elevated groundwater perchlorate concentrations at Rialto No. 3 cause the site to be considered as an extremely impaired source as defined by the CDPH 97-005 Policy Memorandum. Based on previous pilot demonstrations, it was anticipated that O&M costs would be < $150/acre-ft.
Performance of the WBA system was evaluated by collecting and analyzing samples for perchlorate during ion exchange, regeneration, and treatment of residuals. Analytical results were used to assess and predict treatment performance of the WBA resin at the conditions tested. Operational data including flow rate, system pressure, pH, and consumption of chemicals were recorded and analyzed to validate operating performance and predict O&M costs.
6.1. Performance Objective: Meet Perchlorate Regulatory Standard 6.1.1. Results
This performance objective was considered successful throughout the demonstration. The data requirements, success criteria, and a brief description of the results for this performance objective were discussed earlier in Sections 3.1.1-3.1.3, and 5.7.1. All WBA IX treated water samples analyzed by both ARA and Weck Laboratories during this demonstration were less than the DLR of 4 ppb.
6.2. Performance Objective: Demonstrate Post Treatment Capabilities 6.2.1. Results
The performance objective for post treatment was to control and adjust pH and alkalinity of the fully treated water to acceptable levels (0 < LSI < 1.0) with regard to corrosiveness or scaling tendencies prior to distribution. As discussed previously in Sections 3.2.3. and 5.7.2., this performance objective was not met. While this may appear to be a failure of the objective, the problems responsible are mechanical in nature and are easily remedied. Scaling issues were frequently observed in the soda ash mix tank, suction strainers, and the injector of the soda ash static mixer, preventing the required amount of soda ash to be dosed into the treated water. This scaling can be eliminated (or minimized) by installing media canisters to soften the recycled treated water prior to dilution of the soda ash in the dissolver tank of the package soda ash system. Also, the soda ash static mixer was sized specifically for the WBA system, but did not effectively mix the dilute soda ash. Mixing the soda ash with treated water would improve greatly by implementing a two-stage mixing process identical to that used to pre-dilute and mix sulfuric acid in the pretreatment step of the system. Additionally, the static mixer must be placed further upstream from the pH probes to allow more reaction time prior to pH measurement and sampling for LSI.

ESTCP Project No. ER-201168 ARA Project No. 001060
51
6.3. Performance Objective: Minimize Process Waste 6.3.1. Results
One of the key benefits of the WBA process is the minimization of process waste created during the resin regeneration process. Process waste is defined as the ‘spent” regenerating solution that is generated by the regeneration process, scavenged, and pumped into the 10,500 gallon waste storage tank onsite (TK-701). A table of the key wastewater characteristics of this spent regenerating solution is shown below in Table 6-1. These characteristics were analyzed as a requirement for obtaining a disposal permit through the City of San Bernardino Municipal Water Department (SBMWD) Water Reclamation Plant (WRP) for use of the Inland Empire Brine Line (IEBL) Santa Ana Watershed Project Authority (SAWPA).

ESTCP Project No. ER-201168 ARA Project No. 001060
52
Table 6-1. Regeneration Waste Properties
Analysis Units Results
EPA 625--Semivolatile Organic Compounds ug/L All were
ND pH 11.8 BOD mg/L 23 TSS mg/L 280 TDS mg/L 63,000 VSS mg/L 14 Dissolved Organic Carbon mg/L 21 Hardness as CaCO3, Total mg/L 140 EPA 200.7--Metals
Arsenic, Total mg/L 0.024 Cadmium, Total mg/L ND Calcium, Total mg/L 52
Chromium, Total mg/L 0.079 Copper, Total mg/L ND Lead, Total mg/L ND
Magnesium, Total mg/L 1.7 Nickel, Total mg/L ND
Silica as SiO2, Total mg/L 21 Silver, Total mg/L ND Zinc, Total mg/L ND
EPA 245.1--Mercury, Total mg/L ND EPA 314.0--Perchlorate ug/L ND
EPA 324--Volatile Organics ug/L All were
ND
EPA 608--Chlorinated Pesticides and/or PCB's ug/L All were
ND Oil & Grease mg/L ND Sulfide, soluble mg/L ND Sulfide, Total mg/L ND Cyanide, Free (amenable) mg/L ND Cyanide, Total mg/L ND EPA 300.0--Anions
Chloride mg/L 1500 Nitrate mg/L 610 Sulfate mg/L 28,000
The amount of waste disposed during this demonstration of was calculated as a percentage of the total groundwater treated during each test period. The percentage of waste created was determined to be 0.07% of the total water treated during Test Periods 1-3. Note that because the

ESTCP Project No. ER-201168 ARA Project No. 001060
53
typical online regeneration procedure could not be followed after Test Period 4, the data was not included in this determination. Data used to calculate this number is shown below in Table 6-2.
Table 6-2. Percent Waste Generated by the WBA IX
Disposal Date
Test Period
Vessel Regenerated
Water Treated
(G)
Regen Waste
Disposed (G)
% Regen Waste
9-Sep 1 A 3,505,780 5,000 0.14% 2 B 5,919,575 4,800 0.08%
13-Sep 3 A 10,685,200 5,000 0.05%
TOTALS: 20,110,555 14,800 0.07%
It must also be noted that during each test period, the resin was not loaded to capacity. The first two regenerations were conducted to minimize virgin resin effects and the third was conducted based on time limitations and budget constraints. Once the resin is permitted to treat closer to the 9,000 BV breakthrough capacity, the percentage regeneration waste will be much lower.
6.4. Performance Objective: Treatment of Spent Regenerating Stream 6.4.1. Results
The performance criterion for treating the spent regenerant was to remove perchlorate from the spent regenerant solutions to concentrations less than 100 ppb. As described earlier, perchlorate was removed from the spent regeneration waste prior to disposal using a scavenger resin approach. This process consisted of passing the spent regenerant through two ion exchange vessels that were configured in series. Each vessel contained approximately 52.5 ft3 of Purolite A530E strong base anion (SBA) resin which is highly selective for perchlorate. Perchlorate was removed as the spent regenerating solution passed through the scavenger resin for storage in wastewater holding tank TK-701 (10,500 gallons). ARA laboratory results using EPA 314.0 show that the spent regenerant was successfully treated to levels below the detection limit (< 1.4 ppb). A summary of anion and TDS concentrations of both the spent regenerant and the treated regenerant for disposal are shown below in Table 6-3.

ESTCP Project No. ER-201168 ARA Project No. 001060
54
Table 6-3. Anion and TDS Concentrations in Spent Regenerant Before and After Scavenging with Purolite A530E SBA
Date Test Period
Regen Solution
EPA 314.0 Perchlorate
(ug/L)
Anions (mg/L) TDS (mg/L) Cl- NO3
- SO4
07/25/11 1 Spent 7,737 170 3,951 17,000 40,000
Treated ND 605 108 18,000 35,000
08/01/11 2 Spent 16,648 274 5,699 20,000 61,000
Treated ND 1,205 534 24,000 58,000
09/10/11 3 Spent 35,951 334 6,555 22,000 80,000
Treated ND 680 5,051 24,000 82,000
6.5. Performance Objective: Perchlorate Bleed from Regenerated Vessel 6.5.1. Results
During the WBA IX regeneration process, a rinse step at the conclusion of resin regeneration was used to reduce and/or eliminate perchlorate bleed. To determine the effectiveness of the rinsing process, perchlorate data from samples analyzed by both ARA and the certified laboratory were evaluated to determine whether any perchlorate bleed was observed after the newly regenerated vessels were placed back online. Samples were obtained for this determination to bracket data from < 300 BV’s of the vessel being placed back online until the next available sample point (<= 2500 BV’s). All data shows that perchlorate bleed was below the performance objective of 4 ppb. Samples analyzed for perchlorate by ARA were below the detection limit (1.4 ppb) and are shown in Table 6-4. Similar samples analyzed by Weck Laboratories mirror ARA analyses (Table 6.5).
Table 6-4. ARA Laboratory Results of Regenerated Vessel Bleed
Test Period
Date of Regeneration
Regenerated Vessel
Treated Water
Sample Date
Approx BVs
Treated
Perchlorate Conc. (ppb)
1 07/25-07/27 A 7/27/2011 19 ND 7/28/2011 326 ND
2 08/01-08/02 B 8/3/2011 291 ND 8/4/2011 460 ND
3 09/10-09/11 A 9/12/2011 225 ND 9/13/2011 533 ND

ESTCP Project No. ER-201168 ARA Project No. 001060
55
Table 6-5. Certified Laboratory Results of Regenerated Vessel Bleed
Test Period
Date of Regeneration
Regenerated Vessel
Treated Water Sample Date
Approx. BVs
Treated
Perchlorate Conc. (ppb)
1 07/25-07/27 A 07/27/11 10 ND 07/31/11 2260 0.22
2 08/01-08/02 B 08/03/11 300 ND 08/05/11 1280 0.15
3 09/10-09/11 A 09/12/11 200 0.14 09/14/11 1490 0.27
6.6. Performance Objective: Treatment Flow Rate 6.6.1. Results
During this demonstration the WBA IX system did not quite reach the treatment flow rate of 2.5 gpm/ft3 (875 gpm). The average flow throughout the demonstration was 2.29 gpm/ft3 (800 gpm). This was due to a large pressure drop observed across the Liqui-Cell membranes used in the pretreatment system. As flow rates increased above 800 gpm, pressures at the pump would rise above the high pressure safety interlock (90 psig), causing the system to shut down. This problem may be rectified by performing periodic cleaning of the membranes. According to Membrana (manufacturer of the membranes), any substantial biological growth or other particulates from the groundwater accumulating on the surface of the membranes will cause increased pressure drop across the membranes. Another solution would be adding another membrane pair to the existing manifold of three membrane pairs, which would allow the flow to be further spread across additional membrane surface area, lowering the pressure drop. These two changes would solve this issue.
6.7. Performance Objective: Operating Costs 6.7.1. Results
Operating costs are critical in determining if the WBA process is competitive compared to existing perchlorate treatment systems. Activities and materials that contribute to O&M costs were documented and reported in dollars per acre-ft of water treated. Operating costs were calculated based on actual consumption rates and costs that were observed during the demonstration. This performance objective will be discussed in detail in Section 7.0, Cost Assessment.
6.8. Performance Objective: System Scalability 6.8.1. Results
During this demonstration, this performance objective was successfully met. Although the first regeneration required approximately 72 hours due to mechanical and programming issues, the second and third were achieved in less than 48 hours. Due to Rialto No. 3 operational problems,

ESTCP Project No. ER-201168 ARA Project No. 001060
56
getting a consistent source of ground water for the WBA IX from Rialto No. 3 was difficult. The demonstration was discontinued before a resin treatment capacity could be established. Instead, the capacity of the resin was calculated using a more recent model for the D4170 WBA resin constructed using previous demonstration data (ESTCP ER-0312). Based on the current WBA IX flow rate capacity (800 gpm, or 2.29 gpm/ft3) and Rialto No. 3 groundwater characteristics, the model supports the earlier estimates from the Fontana, CA pilot demonstration that the lead vessel will treat 9,000 BV’s before regeneration is required. This provides 21 days of operation before regeneration of the lead vessel is required. Based on that number, the existing onsite equipment will easily support the two additional ion exchange treatment trains. Regeneration events could be staggered to provide adequate time for regeneration. Additionally, if changes are made to the system to enable operation at the design flow rate of 1000 gpm (2.86 gpm/ft3) at the above predicted capacities, regeneration of the lead vessel of each train will be required every 16 days, which would still allow for the addition of two more ion exchange trains.
6.9. Performance Objective: Predict WBA Resin Capacity 6.9.1. Results
During the fourth test period, non-continuous supplies of water from Rialto No. 3 well and program constraints resulted in termination of the demonstration before breakthrough was attained. Sampling indicated that the resin was approaching breakthrough concentrations, or 8-9 ppb (50% of the groundwater feed perchlorate concentration). Three of the final samples indicated that the perchlorate was leveling off at 6 ppb at 6,900 BV’s, but then the system experienced a 3 week shutdown due to a combination of problems with the Rialto No. 3 well site and problems with the soda ash system and static mixer/injector that required maintenance and repairs to be effected. When the system was repaired and restarted, sampling indicated that perchlorate concentration had dropped to 2.9 ppb at 7,300 BV’s. This is shown below in Figure 6-1. Only two days of part time operation were accomplished before the Rialto No. well experienced more operational problems and program constraints halted the demonstration.

ESTCP Project No. ER-201168 ARA Project No. 001060
57
0
20
40
60
80
100
120
140
160
180
0.0
2.0
4.0
6.0
8.0
10.0
12.0
14.0
16.0
18.0
20.0
Ani
on C
onc.
(mg/
L)
Perc
hlor
ate
Con
c. (u
g/L
)
Groundwater Treated (BVs)
Groundwater ClO4 (ug/L)
Vessel B ClO4 (ug/L)
Chloride (mg/L)
Nitrate (mg/L)
Sulfate (mg/L)
Figure 6-1. Test Period 4: Lead Vessel B Perchlorate and Anion Concentrations In test period 4, perchlorate breakthrough was not achieved, and capacity of the resin (i.e., bed volumes to breakthrough) is actually greater than demonstrated. During the Phase 2 field demonstration at Redstone Arsenal in 2005 (ESTCP Project CU-0312) the WBA resin reached a capacity of 6,500 BVs at a treatment rate that varied from 2.25-3.00 gpm/ft3 with much higher groundwater perchlorate concentrations (2200 ppb). In addition, during the Phase 3 field drinking water treatment demonstration at Fontana in 2006 (ESTCP Project ER-0312) a higher treatment capacity of 9,700 BVs at a rate of > 3.0 gpm/ft3 was observed, although at a lower perchlorate influent concentration (8.0 ppb). Although the breakthrough capacity was not able to be demonstrated, the current capacity can be calculated using a model for the D4170 WBA resin constructed from those demonstrations. Using the Rialto treatment rate of 800 gpm (2.29 gpm/ft3) and the Rialto No. 3 groundwater characteristics, this model supports the earlier estimates that the lead vessel will treat 9,000 BV’s before regeneration is required.
6.10. Performance Objective: System Control During Treatment and Regeneration Cycles 6.10.1. Results
During normal operations, the performance objective was met. The use of the touch screen by a single operator for monitoring and controlling/adjusting system control parameters was very straightforward. Completing checklists, sampling, and downloading data from the DAQ system was also handled by a single operator. During regeneration or mechanical troubleshooting, it is recommended that two or more operators be onsite. Because the system is operated from the PLC touch screen in the control room, it is difficult for a single operator to observe what the system is actually doing during trouble shooting or regeneration.
ESTCP Project No. ER-201168 ARA Project No. 001060
58
7.0 Cost Assessment
7.1. Cost Model The purpose of this demonstration was not only to demonstrate the WBA IX technology, but to also to validate equipment, construction, and operation and maintenance (O&M) costs of the WBA IX process. To accomplish this, data for various cost elements of the WBA process were identified and collected, as shown below in Table 7-1. Data for each element was collected for the duration of the demonstration effort. Detailed descriptions of each cost element are provided in subsequent sections. This data was compared and integrated into previously derived WBA process cost models in order to establish a robust, realistic cost model for implementing the WBA IX technology. When modeling the implementation and operating costs of the WBA technology, care should be taken to apply the appropriate site specific elements to the model. For example, different methods may be employed to remove excess CO2 generated during pretreatment of the influent water such as membranes, air stripping, or no treatment. The method selected will impact the equipment, electrical, and consumable costs.
Table 7-1. Cost Model Elements for the WBA IX Process
Cost Element Tracked Data Units
Design, Construction,
and Installation
Design Engineering, Construction Mgmt, Equipment and Installation. Costs, including
actual equipment costs, construction management, and installation costs
$/1,000 gpm
treatment system
Consumable Materials
Consumables which were tracked and documented include:
• Sulfuric acid • Sodium hydroxide • Sodium carbonate (soda ash) • Strong base anion resin for scavenging • Weak base anion resin for primary
treatment • Gas separation membranes • Miscellaneous chemicals and supplies
$/acre-foot water treated
Waste Disposal Disposal of treated spent regenerating solution (transport and disposal fee)
$/acre-foot water treated
Untracked Elements
Electricity
Total electrical consumption of the demonstration system was calculated based upon installed equipment, usage rates, and load factors
$/acre-foot water treated
Labor Labor required for operating and maintaining system
$/acre-foot water treated

ESTCP Project No. ER-201168 ARA Project No. 001060
59
7.1.1. Cost Element: Construction and Installation Equipment, construction management, and installation cost data were tracked from actual costs of the subcontract with Carollo Engineers for design and construction of the 1,000 gpm demonstration unit. Equipment costs were based on invoices from the Carollo subcontract and on invoices for equipment purchased by ARA. Total equipment purchases for the 1,000 gpm system totaled $1.958M, with system installation costs totaling $466K. To derive cost estimates for different sized systems, standard industry practice scaling factors may be used to derive cost estimates using the six-tenths power factor rule. According to this rule, if the cost of a given unit at one capacity is known, the cost of a similar unit with X times the capacity of the first is X 0.6 times the cost of the initial unit. In addition, design, engineering, and management costs are much greater for a first-of-a-kind technology demonstration than for the construction and installation of additional similar systems. There are also unique costs for the management and reporting requirements of an ESTCP demonstration. For input into the cost model, design and engineering costs can be estimated based upon a factor of the actual delivered equipment costs. This factor is usually some percentage of the equipment costs.
7.1.2. Cost Element: Consumable Materials
7.1.2.1. Sulfuric Acid
Sulfuric acid (98 wt%) was used to lower the pH of the ground water during pretreatment and at the end of the regeneration process to restore the resin to the active ionized or protonated form. The size of the storage tank permitted procurement of sulfuric acid in full tank truck quantities. At the time of the 1,000 gpm system demonstration, market pricing of sulfuric acid for the California site was at an all-time high of $0.215/lb. A five year US average price which is more reflective of the current market pricing of sulfuric acid is approximately $0.12/lb for bulk chemical purchases. The acid storage tank level was monitored and recorded by the data acquisition system so that acid consumption could be calculated for any time period during the demonstration. During steady-state operation (between regeneration events), the daily acid consumption and acid consumption per acre-foot of treated water were calculated. Acid required for WBA resin protonation during the regeneration process was determined separately. Acid needed for each regeneration-protonation cycle was measured using a digital flowmeter/totalizer that was monitored by the data acquisition system. Acid consumption per acre-foot of water was calculated based on the number of acre-feet of water treated before regeneration was required.
7.1.2.2. Sodium Hydroxide
Sodium hydroxide (25 wt% NaOH) caustic solution was used to regenerate the WBA resin. The size of the storage tank permitted procurement of 25% NaOH solution in full tank truck quantities. Current market pricing and market pricing of sodium hydroxide during the demonstration were $0.1675/lb for bulk chemical delivery. 50% NaOH is more economical, but

ESTCP Project No. ER-201168 ARA Project No. 001060
60
25% was selected to eliminate the potential for precipitation of solid NaOH during the winter months. The caustic storage tank level was monitored and recorded by the data acquisition system so that caustic consumption could be calculated for any time period during the demonstration. The volume of caustic required for each regeneration-protonation cycle was measured using a digital flowmeter/totalizer that was monitored by the data acquisition system. Caustic consumption per acre-foot of water was calculated based on the number of acre-feet of water treated before regeneration was required.
7.1.2.3. Soda Ash
Soda ash (Na2CO3) solution was used to restore the pH and alkalinity of the treated water to acceptable levels prior to discharge to the reservoir. Solid soda ash was used to prepare a 3% soda ash solution on-site. For the demonstration, soda ash was purchased in 50 pound bags delivered as 2,100 pound pallets at $0.3225/lb. This is not the most economical approach. Soda ash can also be delivered in 1,000-pound super-sacks, or by bulk, pneumatic truck. For this assessment, actual purchase price and consumption were used to determine soda ash costs. The average soda ash consumption was calculated based on the number of 50-pound sacks consumed over an extended period of time (3-10 days). The consumption rate and cost per acre-foot of water treated were calculated from this usage rate.
7.1.2.4. Strong Base Anion Resin (Scavenger Resin)
The SBA resin scavenging system consists of two (2), 60 cubic foot ion exchange vessels configured in series. Each vessel was charged with approximately 52.5 cubic feet of resin. There are three reasons for this design: 1) to prevent the inadvertent discharge of perchlorate-contaminated effluent; 2) achieve maximum loading of SBA resin in the lead vessel; and 3) to determine when perchlorate breakthrough of the lead vessel occurs. Based on previous pilot test data, breakthrough of the lead vessel was designed to occur during the demonstration. Treated water from the lead vessel was sampled and analyzed during each regeneration event in order to determine when breakthrough occurs. Breakthrough is defined as when perchlorate concentration of treated water from the lead vessel equals 20-50% of the perchlorate concentration of the spent regenerating solution being treated. The cost of SBA resin change-out includes transportation costs, resin replacement costs ($240.95/cu. ft.), and spent resin disposal costs. The average cost per acre-foot of water treated was calculated based on the total amount of water treated up to perchlorate breakthrough and the total cost of resin replacement. Actual perchlorate loading on the SBA resin was determined. SBA resin cost is the only cost element that is dependent on the perchlorate concentration of the groundwater being treated. Based on demonstration test results, the cost of scavenger resin was determined as a function of perchlorate concentration in the groundwater.
7.1.2.5. Weak Base Anion Resin
The WBA resin is anticipated to provide acceptable performance for several years. However, since it will have a limited lifetime, and it is relatively expensive, the cost of the WBA resin must be factored into overall treatment costs. Resin cost was determined by the current market
ESTCP Project No. ER-201168 ARA Project No. 001060
61
replacement cost of the WBA resin. Replacement cost includes transportation and disposal of the old resin. Resin life is estimated to be ten years. The cost per acre-foot of water treated was calculated based on 700 cubic feet of resin (350 cubic feet per vessel) and the amount of water treated assuming system operation at the rated capacity (1,000 gpm) for 360 days per year. The current market price of the WBA resin is $478.23/cu ft.
7.1.2.6. Gas Separation Membranes
Liquid-cell gas membranes are used to reduce dissolved CO2 (carbonic acid) in the ground water that is the result of the reaction between alkalinity in the water and the sulfuric acid used to maintain low pH in the WBA IX process. The WBA IX system can be operated without actively removing CO2, but this would result in much higher consumption of soda ash necessary to restore treated water pH and alkalinity to levels acceptable for distribution as drinking water. Treatment cost per acre-foot of water treated was calculated both ways – with and without degassing. Liquid-cell membranes have a limited life expectancy. The current replacement price of an individual membrane is $10,140/ea. The cost per acre-foot of water treated was calculated based on operation at the rated capacity (1,000 gpm) for 360 days per year, and the replacement cost and life expectancy of the liquid-cell membranes. For input into the cost model, alternative, less expensive means of removing the CO2 from groundwater may be considered (i.e., using a stripping tower prior to discharge of treated water to a reservoir). A stripping tower was not used for the Rialto demonstration due to the footprint and height restrictions at the site.
7.1.2.7. Miscellaneous Chemicals and Supplies
Other chemicals and supplies were consumed for routine maintenance and calibrations. These materials may include: bleach solution for disinfection components, pH buffers for calibrating pH probes, air filters for the membrane degasification system and air compressor, and oil for gearboxes. The approximate annual cost of miscellaneous chemicals and supplies was estimated to be $12,000 per year. The cost per acre-foot of water treated was calculated based on operation at the rated capacity (1,000 gpm) for 360 days per year.
7.1.3. Cost Element: Electricity Because operation of the WBA system was intermittent throughout the demonstration, power consumption was estimated/calculated based on equipment rating, frequency of operation, and a factored load rating. Total electrical cost per acre-foot was calculated using $0.10/kilowatt-hour based on the volume of water treated and estimated kilowatt-hours consumed during demonstration testing. For input into the cost model, site specific requirements should be considered. For example, if booster pumps and membrane degassing are not required based upon site specific requirements, then total power consumption per acre-foot would be drastically reduced.
7.1.4. Cost Element: Labor Operating labor was estimated based on ARA personnel hours during normal, steady-state operation and regeneration. Labor hours per acre-foot of water treated were calculated based on

ESTCP Project No. ER-201168 ARA Project No. 001060
62
operation at the rated capacity (1,000 gpm) with 312 days of “normal” operation (1.5 labor hours per day) and 48 days of operation in “regeneration” mode (16 labor hours per regeneration). A labor rate of $75.00 per hour was used in all calculations. For use in the cost model, labor hours per acre-foot should be scaled accordingly. Doubling or halving the size of the system will not double or half the labor hours required for operation of the system and should be factored accordingly.
7.1.5. Cost Element: Waste Disposal Ion exchange resin wastes are accounted for as part of WBA and SBA resin costs. The only additional waste produced during the demonstration was treated, spent regenerating solution. This solution contains no perchlorate. This waste was hauled by a local, commercial waste handler (K-Vac Environmental, Rancho Cucamonga, CA) to a local disposal facility/terminal in San Bernardino, CA. The pH requirement for disposal of this solution is 6.0-12.0. Adjustment of pH was sometimes required prior to pick up. The total cost of waste disposal included pH adjustment, pick-up and transportation, and the tipping fee at the terminal. Waste disposal cost per acre-foot of groundwater treated was calculated from the volume of wastewater produced per regeneration and the average regeneration frequency at the rated capacity (1,000 gpm) for 360 days per year. Actual hauling costs to the San Bernardino facility were $800.00 per 10,000 gallons of spent regenerant, in addition to disposal fees of $0.054 per gallon
7.2. Cost Drivers There are five main cost drivers for the WBA IX system: 1) perchlorate concentration of the feed water; 2) alkalinity of the feed water; 3) alkalinity of the treated water; 4) regeneration frequency; and 5) WBA resin costs. Each cost driver has site-specific or equipment-specific characteristics that impact costs which are discussed in the following sections. Soda ash consumption is dependent on sulfuric acid usage. If excess acid is used for pH reduction, higher amounts of soda ash will be required to neutralize pH during post-treatment.
7.2.1. Perchlorate Concentration Overall, the cost advantage of WBA IX technology relative to conventional SBA technology is greater as perchlorate concentration in the groundwater increases. However, scavenger resin consumption is directly proportional to perchlorate concentration. Since perchlorate is very concentrated in the spent regenerating solutions, much more perchlorate can be exchanged onto a strong-base scavenger resin than is removed by the primary ion exchange resin (weak base or strong base, single-use resin) used to directly treat the groundwater. The perchlorate-loading capacity of the perchlorate-selective SBA resin (meq/L) is directly proportional to the concentration of perchlorate in the spent regenerating solution. SBA resin used in single-use ion exchange systems to treat low perchlorate concentrations (10’s of ppb) loads only a small fraction of the total available ion exchange sites with perchlorate. For instance, the highly selective Purolite A530E resin will load only ~30 milliequivalents (meq) of perchlorate from treating a typical groundwater source containing 20 ppb perchlorate, even though the total ion exchange capacity is greater than 600 meq. That is only 5% capacity before breakthrough is observed and the resin must be removed and incinerated. However, since the spent regenerating solution from the WBA process has 2,000-5,000 times more perchlorate and lower ratios of

ESTCP Project No. ER-201168 ARA Project No. 001060
63
competing anions, A530E resin will load over 90% (550 meq) of the exchangeable sites with perchlorate. This efficient use of SBA resin in the scavenging process reduces resin consumption by over 95% compared to single-use systems used for groundwater treatment.
In previous laboratory scavenger tests, Purolite A-530E resin was the most economical resin based on treatment capacity and replacement costs ($240.95 per cubic foot). SBA resin cost is the only cost driver/element that is dependent on the perchlorate concentration of the groundwater being treated. Figure 7-1 shows SBA resin cost as a function of groundwater perchlorate concentration. The scavenger resin costs for this demo were determined to be $10.11 per acre-foot based on an average groundwater perchlorate concentration of 16 mg/L.
Figure 7-1. Scavenger SBA Resin Cost versus Perchlorate Concentration
7.2.2. Groundwater Alkalinity The amount of acid required for pretreatment to attain the pH necessary for good performance is directly proportional to groundwater alkalinity. Acid cost was determined to be $3.96/acre-foot for every 10 mg/L of total alkalinity in the groundwater, based on sulfuric acid pricing of $0.12 per pound, delivered. The pilot demonstration at Fontana, CA resulted in an acid cost of $2.47/acre-foot for every 10 mg/L of alkalinity in the groundwater. This represents a 38% increase in acid use which was caused by inadequate mixing of acid prior to pH measurement. This is a design issue that can be rectified by relocation of the pH probes to permit additional mixing time.

ESTCP Project No. ER-201168 ARA Project No. 001060
64
7.2.3. Treated Water Alkalinity
Post treatment costs are directly proportional to the alkalinity required in the treated water to achieve a slightly negative LSI. The post treatment approach is dependent on the water quality at each site. The approach taken during the Rialto demonstration was to lower the pH using sulfuric acid, remove excess dissolved CO2 using Liqui-Cel membranes, and use sodium carbonate (soda ash) solution to return alkalinity to the desired level. Post treatment cost (soda ash, electricity, membrane replacement) for this demonstration equated to $59/acre-foot based on an average of 54 ppm of residual alkalinity (as CaCO3). Soda ash represents 80% of this cost and consumption was significantly higher than the theoretical requirement. This was due to the addition of excess acid during regeneration and pretreatment. Optimization of the regeneration, pretreatment, and post-treatment operations will significantly reduce both acid and soda ash consumption.
7.2.4. Resin Regeneration Frequency Regeneration frequency and the related costs are dependent on resin treatment capacity, which is affected by competing anions present in a groundwater. For a given water composition, treatment capacity is relatively independent of perchlorate concentration below 100 ppb because the perchlorate isotherm is linear between 1 and 100 ppb. In other words, the quantity of the perchlorate anion that is exchanged is directly proportional to the concentration of perchlorate anion in untreated water.
7.2.5. WBA Resin Cost Resin replacement cost is a major component of operating costs for several reasons. The commercial resin used in this demonstration (D4170) is produced by Purolite at $478.23 per cubic foot. While this resin is commercially produced, production rates are relatively low at this time. Higher production rates in the future may lead to reduced costs. Also, perchlorate treatment systems for drinking water require a “multi-barrier” or two-stage, lead-lag treatment configuration. This configuration, in effect, doubles the amount of resin necessary for a treatment process. The cost of resin replacement is $22.08 per acre-foot based on a 10-year service life.
7.3. Cost Analysis The costs provided in Table 7.2 are normalized costs based on the current WBA IX configuration and the water quality at the Rialto 3 site. Observed costs were higher than projected due to problems identified and discussed in previous sections. Feed water pH ranged between 7.5 and 7.9 and the average alkalinity was 150 mg/L. Treated water pH was between 6.5 and 7.5 and the average alkalinity was 55 mg/L.

ESTCP Project No. ER-201168 ARA Project No. 001060
65
Table 7-2. Cost Analysis for the WBA IX Process
Cost Element Assumptions Costs
Design, Construction,
and Installation
1,000 gpm system with multi-stage barrier treatment, boost pumps, membrane
degasification, soda ash injection system for post treatment.
$1.958M
Consumable Materials
Consumables include: • Sulfuric acid • Sodium hydroxide • Sodium carbonate (soda ash) • Strong base anion resin for scavenging • Weak base anion resin for primary
treatment • Gas separation membranes • Miscellaneous chemicals and supplies
$42.79/AF $13.84/AF $38.19/AF $8.09/AF $22.08/AF
$7.65/AF $7.54/AF
Waste disposal Disposal of treated spent regenerating solution (transport and disposal fee) $10.11/AF
Untracked Elements
Electricity Total electrical consumption as configured for demo, including boost pumps and vacuum pumps for CO2 degassing
$20.44/AF
Labor Labor required for operating and maintaining system $58.27/AF
TOTAL: $229.00/AF
7.3.1. Design/Construction/Installation The design and management costs for a first-of-a-kind technology demonstration are much larger than would be expected for future implementations of this technology. When estimating design and engineering costs of future implementations of the WBA technology, a factor of the current delivered equipment costs, typically 30 percent (Peters, Timmerhaus, and West, 2002), should be used. Derived from 2008-2010 costs, Table 7-3 shows the total value of the subcontract with Carollo Engineering for design, construction, and installation of the Rialto 1,000 gpm system ($1.958M). Equipment costs for the demonstration unit totaled $1.492M, with system installation costs totaling $466K. The Rialto system capacity can be increased to 2,000 gpm by installing an additional train of lead/lag vessels at minimal cost as the post treatment system and regeneration system were designed for future expansion. In order to determine the price of systems larger than 2,000 gpm, standard industry scaling factors such as the six-tenths power factor rule may be used (Peters, Timmerhaus, and West, 2002). According to this rule, if the cost of a given unit at one unit of capacity is known, the cost of a similar unit with X times the capacity of the first is X 0.6 times the cost of the initial unit.

ESTCP Project No. ER-201168 ARA Project No. 001060
66
Table 7-3. Equipment Costs for the 1,000 gpm WBA IX System
Equipment Cost ($)
Pretreatment:Feed Pumps (2 x 600 gpm) $ 28,284 Membrana System (CO2 degasification) $ 80,375 Acid Storage Tank (6,000 gal) $ 29,254 Acid Feed Pump (5-10 gpm) $ 4,957 Heat Exchanger $ 3,847
Ion Exchange:Vessels, Packed Bed, Coated Stainless (2 X 9ft diameter) $ 292,003 Nozzles (1000, including gaskets) $ 25,239 WBA Resin (Purolite D4170, 700 cu.ft) $ 287,000 Inert Material (Purolite IP-4, 82 cu.ft.) $ 10,250
Post Treatment:Merrick Soda Ash Delivery System $ 57,505
Regeneration:Scavenger Vessels (2 X 68 cu.ft.) $ 24,660 SBA Resin (Purolite A530E, 105 cu.ft.) $ 19,425 Acid Transfer Pump (10 gpm) $ 4,957 Caustic Transfer Pump (20 gpm) $ 2,904 Regeneration/Protonation Circulation Pump (500 gpm) $ 10,053 Tranfer Tank Pump (100 gpm) $ 7,489 IX Vessel Drain Pump (100 gpm) $ 7,489 Caustic Storage Tank (3000 gal) $ 16,800 Regeneration Tank (4500 gal) $ 18,781 Protonation Tank (1200 gal) $ 7,694 Transfer Tank (500 gal) $ 1,886
Control System/Electrical:Electrical Building $ 22,628 VFD Panel $ 17,619 Motor Starter Panel $ 4,991 PLC Control Panel $ 30,084 Local Electrical Panel $ 8,318 Data Acquisition System $ 5,300 pH Controllers (10 units) $ 10,578 Lighting $ 8,620 Air Compressor (20 cfm) $ 5,926
Subtotal Equipment $ 1,054,916 Other Misc. Costs:
Design, Piping, Static Mixers, Waste Storage Tank, Lighting, Wiring, pH Probes, Control Valves, Safety Equipment (eye wash, safety showers), Coatings, Chemical Containment Areas, Fencing, Additional Seismic Requirements $ 437,084
Total Design/Equipment Costs $ 1,492,000 Installation Costs 466,010$
Total Subcontract Value 1,958,010$

ESTCP Project No. ER-201168 ARA Project No. 001060
67
7.3.2. Cost Element: Consumable Materials Observed and normalized consumable material costs are shown in Table 7.4. Observed costs are actual costs observed during the demonstration period. Because of the difficulty of determining costs due to problems experienced during the demonstration, normalized costs were developed based on the design treatment capacity of 9,000 BVs (average alkalinity of 150 mg/L) at 1,000 gpm over a 16 day operating cycle. In some cases material costs are based on bulk rates and/or average pricing, not including fuel costs and other miscellaneous charges. Each consumable item is discussed in detail in subsequent sections.
Table 7-4. Consumable Material Costs for Operation of the WBA IX Process
Consumable Material Actual Demonstration Cost, $/AF
Normalized Cost, $/AF
Sulfuric Acid, 98 wt % $106.50 $42.79
Sodium Hydroxide, 25 wt% $25.00 $13.84
Sodium Carbonate (Soda Ash) $47.45 $38.19
Strong Base Anion Scavenger Resin, A530E 1 -- $8.09
Weak Base Anion Resin, D4170 1 -- $22.08
Gas Separation Membranes 1 -- $7.65
Misc. Chemicals & Supplies2 -- $7.54
1Actual costs were unable to be determined as these items’ life cycle were longer than the demonstration 2This cost is based on a yearly budget of $12,000, which may vary from site to site
7.3.2.1. Sulfuric Acid
During this demonstration, acid consumption was 125 gallons per day (gpd), or 36 gallons/AF of treated water. Sulfuric acid market prices were higher than usual ($0.215/lb), which raised demonstration acid costs to $106.50/AF of treated water. Costs were based on actual volumes of water treated, actual flow rates, and recorded run times, which were considerably less due to the first two test periods being short cycles, and the third and fourth test periods being shortened due to intermittent operational difficulties experienced by the City of Rialto at the well site. This consumption rate is much higher (38%) than previous demonstrations due to mixing issues and non-steady state operation issues discussed in preceding sections. This sulfuric acid consumption rate is considered the maximum rate and must be adjusted based on groundwater

ESTCP Project No. ER-201168 ARA Project No. 001060
68
alkalinity. Sulfuric acid cost can vary greatly; therefore, site-specific conditions should be used to model future implementations of this technology. Using the five-year US industry average of $0.12/lb, sulfuric acid costs drop to $42.79/AF of treated water. This is based on treating 9,000 BV of groundwater with 150 ppm alkalinity at design flow rates of 1,000 gpm over a 16 day cycle. Also, acid consumption drops to 103 gallons per day, or 23 gallons/AF of treated water.
7.3.2.2. Sodium Hydroxide
Actual caustic (25% NaOH) consumption over the demonstration period averaged 559 gallons per regeneration for each vessel (350 ft3 of resin), or 35 gallons/AF treated water. Overall demonstration costs were $25.00/AF of treated water based on market costs of $0.1675/lb. However, each of the test periods (1-3) was shortened, either by design, or by time constraints caused by well site operational issues. Because of the shortened run times, the caustic consumption rates were much higher. Using the same system operating conditions as with sulfuric acid (9,000 BVs), a theoretical caustic consumption rate per regeneration was calculated based on the 1.4 equivalents per liter of resin plus a 5% excess which equates to 481 gallons of 25% NaOH. This drops caustic consumption to 8 gallons/AF of treated water and $13.84/AF of treated water. Sodium hydroxide costs can vary greatly, therefore, site-specific conditions should be used to model future implementations of this technology.
7.3.2.3. Sodium Carbonate (Soda Ash)
Actual soda ash consumption during the demonstration averaged ~500 pounds per day (10 x 50 lb. bags). This equates to a soda ash consumption rate of 147.15 lbs/AF of treated water at an average cost of $47.45/AF of treated water. This consumption rate is considerably higher than predicted, but was greatly affected by excess acid used during pretreatment and regeneration. Normalizing costs as before drops treatment consumption rates to 118.42 lbs/AF of treated water and $38.19/AF of treated water. Soda ash consumption could be reduced proportionately and costs greatly lowered by optimization of chemical usage during the regeneration process, making improvements to the membrane pretreatment system, and making improvements to the soda ash delivery system.
7.3.2.4. Strong Base Anion Resin for Scavenging
Current market resin replacement costs, installation costs, transportation costs, and disposal costs were used to determine the scavenger resin costs. Calculations were based on the total amount of water treated to achieve perchlorate breakthrough in the lead scavenger vessel. Because the scavenger vessels were not operated to breakthrough during this demonstration, a theoretical cost was calculated. The lead and lag scavenger vessels each contained 52.5 cu. ft. of Purolite A530E SBA resin (105 cu. ft. total). The SBA resin consumption was projected to be 0.0336 ft3 per acre-foot of water treated. At current market pricing of $240.95/cu. ft. resin, the average cost of the SBA resin was $8.09 per acre-foot of water treated. As discussed in Section 7.2.3, SBA resin cost is the only cost element that is dependent upon the perchlorate concentration of the groundwater being treated. Calculations were based on an average perchlorate concentration of 16 ppb during this demonstration at the Rialto No. 3 well site.

ESTCP Project No. ER-201168 ARA Project No. 001060
69
7.3.2.5. Weak Base Anion Resin for Primary Treatment
Cost calculations for the WBA resin were based on a resin life expectancy of 10 years, operating at the rated capacity of 1,000 gpm for 360 days per year. As with scavenger resin costs, calculations take into consideration transportation costs, spent resin disposal, and resin installation using the current market cost for WBA resin. Each of the packed bed ion exchange vessels was loaded with 350 ft3 WBA resin (700 ft3 total). Based on current market pricing of $478.23/ft3, the consumption rate is 0.046 ft3 of resin per acre-foot, or $22.08 per acre-foot of water treated.
7.3.2.6. Gas Separation Membranes
The cost of the gas separation membranes is based on a life expectancy of 5 years and the system operating at the rated capacity of 1,000 gpm for 360 days per year. With three pairs of membranes (6 membranes total) and a replacement cost of $10,140.00 each, the cost per acre-foot of water treated equates to $7.65.
7.3.2.7. Miscellaneous Chemicals and Supplies
The annual cost for miscellaneous chemicals and materials is estimated to be $12,000 per year. Based on the system operating at the rated capacity of 1,000 gpm for 360 days per year, the average cost per acre-foot of water treated was determined to be $7.54. These costs are for supplies such as sump pumps, tools, electrical cords, disinfecting solutions, onsite pH analysis, etc.
7.3.3. Electricity Electricity consumed during the demonstration was an untracked cost. Calculated power consumption was based on equipment ratings and duty cycles. The total amount of electricity consumed during the entire demonstration was approximately 24,548 kilowatt hours. Based on a rate of $0.10 per kW-hr and a total of 120.12 acre-foot of water treated during the demonstration, total electricity cost was $20.44 per acre-foot of water treated, or 204 kW-hr per acre-foot water treated. This number accounts for each of the three regenerations performed during the demonstration. Power consumption was dominated by the booster feed pumps (75% of total) and the liquid ring vacuum pump (19% of total). Depending on site-specific requirements, many applications may not require booster pumps or a liquid ring vacuum pump for membrane degassing as demonstrated in Rialto. Electrical costs representing the exclusion of various elements are calculated and shown in Table 7.5.

ESTCP Project No. ER-201168 ARA Project No. 001060
70
Table 7-5. WBA IX Process Electrical Costs
Electrical Elements Total kW Required
Total kW-hr Used
Total Cost ($)
Cost ($) per acre-ft Water
Treated IX operations, as demonstrated 140 24548 $2,454.79 $20.44
IX operation, excl. regenerations 112 24289 $2,428.94 $20.22 IX operation, excl. booster &
vacuum pumps 47 1600 $160.04 $1.33
IX operation, excl. regenerations, booster & vacuum pumps 19 1342 $134.19 $1.22
7.3.4. Labor Labor hours were determined based on the normal operation and regeneration operation modes. From the demonstration, it was determined that under normal operating conditions, a single operator was needed on-site for approximately 1.5 hours per day. During regeneration cycles, it was determined that two (2) operators would need to be onsite intermittently for approximately 8 hours per day. With the system operating at the rated capacity of 1,000 gpm for 360 days per year at a $75.00/hr rate, labor costs were $58.27 per acre-foot of water treated. Labor costs per acre-foot of water treated may vary from site to site due to varying labor rates. Doubling or halving the size of the system will not double or half the labor hours required for operation of the system.
7.3.5. Waste Disposal The only waste requiring disposal during the demonstration was the perchlorate-free, spent regenerating solution. Each regeneration cycle produced approximately 5,000 gallons of the solution. A 10,500 gallon waste tank, located onsite, allowed for two regenerations to be conducted before a certified waste hauler/environmental company would transport and dispose of this solution. The transportation costs for this process was $800 per 10,000 gallons of waste, with disposal fees of $0.054 per gallon. Assuming the system runs at capacity (1,000 gpm) for 360 days per year, and 24 regenerations are performed throughout the year, the waste disposal costs would be $10.11 per acre-foot of water treated.

ESTCP Project No. ER-201168 ARA Project No. 001060
71
8.0 Implementation Issues
8.1. Environmental Issues and Implementation The City of Rialto has an existing permit for treating perchlorate using the single-use, SBA resin treatment process located at Rialto No. 3. In order to demonstrate the WBA system, ARA was required to go through a multi-step process to apply for an amendment to this permit. With the City’s approval, an application for amending the permit, along with a Performance Objective Plan and an Operations Manual/Control Narrative, were submitted to CDPH. CDPH reviewed both documents and issued a permit amendment for the WBA system to be operated only as a pretreatment system to the existing treatment system. A treatment permit approving WBA technology as a primary treatment may be issued after review of the Final Report and completion of the permitting process. According to CDPH, implementation of this treatment technology at other sites will be approved on a case by case basis. Additionally, the WBA system requires a permit for disposal of the waste produced during WBA resin regeneration. An application for a discharge permit was submitted to the San Bernardino Valley Municipal Water District (SBVMWD) in order to have a certified waste hauler dispose of this waste at the Inland Empire Brine Line (IEBL). Samples of the waste were analyzed by a certified laboratory for a list of pollutants and the results were submitted to SBVWMD. A site inspection was also conducted by an environmental technician from SBVWMD in order to create a process flow diagram for the permit. The permit was issued directly to ARA. If the City of Rialto chooses to operate the WBA system, they must re-apply for a permit that would be issued directly to the City.
8.2. End User Concerns and Issues End-users for this technology include DoD facilities, formally used defense sites, and municipal drinking water systems that have been contaminated with perchlorate by past DoD operations. In addition to drinking water applications, the technology can be used for pump-and-treat perchlorate remediation and to facilitate remediation of co-contaminants (such as VOCs) by removal of perchlorate to enable discharge or re-injection. The technology can also be applied to the treatment of other types of wastewater generated by munitions manufacturing or demilitarization operations. Implementation of this technology is straightforward. Commercial, large-scale, ion exchange equipment for WBA resin technology is commonplace. The pretreatment section of the system consists of pH control unit operations with two-stage static mixing which is straight forward to design and engineer. Reducing the alkalinity/stripping of carbon dioxide from the groundwater feed can be accomplished using membrane treatment systems or stripping towers. Both methods are straightforward and are commercially available. The post treatment system used to return alkalinity and raise the pH of the treated groundwater consists of a package soda ash delivery system combined with static mixers; both are commercially available. Treatment of residuals by an SBA resin scavenger ion exchange process is a proven technology.

ESTCP Project No. ER-201168 ARA Project No. 001060
72
The issues of primary concern for the end user concerning the WBA technology are: 1) operational complexity; 2) labor requirements; and 3) requirements for bulk chemicals onsite (i.e., acid, caustic, and soda ash).
8.2.1. Interfering Anions The WBA resin has greater selectivity for perchlorate than other anions. However, the presence of competing anions such as chloride, nitrate, and/or sulfate will reduce the overall treatment capacity of the resin. WBA resin performance can be modeled based on site-specific groundwater characteristics.
8.2.2. Operational Complexity The WBA IX system demonstrated at the Rialto No. 3 well site is an automated water treatment system. Automation of any technology brings a level of complexity to that technology. The programmable logic controller (PLC), operator interface (O/I), control software, and other associated electronics used to control the WBA system were off-the-shelf, and readily available. A computer engineer programmed the PLC system based on a predetermined control philosophy which allowed operators to control the system by means of input and monitoring screens at the O/I. In addition, the system could be operated in manual or automatic modes. Real-time data was also displayed on the monitoring screens. Operators must have a basic understanding of PLC systems, control logic, and the operating philosophy of the WBA system.
8.2.3. Labor Requirements The WBA system, as designed in Rialto, CA, will require a single operator for approximately 1.5 hours per day. This operator can perform sampling, collect operational data, perform or monitor chemical re-supply, and basic maintenance. During the 48-hour regeneration cycles and major maintenance procedures, it is recommended that two (2) operators be available onsite intermittently for 8 hours per day. Once familiarity with the system has been established and operations streamlined, these requirements can be reduced.
8.2.4. Chemical Storage Requirements Currently, bulk chemicals need to be stored onsite for the WBA system at the Rialto No. 3 site: sodium hydroxide (25%) in a 3,000 gallon poly tank (T-501); sulfuric acid (93%) in a 6,000 gallon poly tank (T-601); and 4 or 5 pallets (4 or 5 x 2,100 lb) of soda ash. The acid and caustic vessels are in sealed containment areas with sumps to protect against an accidental spill or release. Since soda ash is highly hygroscopic, it should be stored indoors or in a covered area to prevent moisture intrusion/hardening of the soda ash.

ESTCP Project No. ER-201168 ARA Project No. 001060
73
8.2.5. System Improvements 8.2.5.1. Pre-Treatment
In order to reduce the pressure drop experienced across the membranes and increase flow to the design capacity of 1,000 gpm, the membrane system must be modified. An additional membrane pair must be installed to reduce the flow through each membrane train. In addition, the membrane system must be modified to allow for periodic cleaning to be performed. Rotameters used to balance the airflow through the membranes were oversized for this application. Smaller rotameters will enable operators to better control airflow (and CO2 removal) across the membranes. Also, the membrane vendor (Membrana) recommended that the membranes and associated equipment be covered to provide protection from direct sunlight. If the WBA system is used as a permanent treatment system, this will prolong the life cycle of the membranes.
8.2.5.2. Post-Treatment
The Merrick soda ash system was not designed for outdoor use. This system will require a cover to protect it from the elements. It is also recommended that softened water or RO water be used for dissolving solid soda ash in the dissolver tank of the Merrick soda ash system. If not, scale will form in the dissolver tank, soda ash feed pump strainers, piping, and in the injection quill of static mixer MX-401. Softening of the water will eliminate scale formation. During this demonstration, LSI and pH of the treated water was difficult to control. To rectify this problem, two-stage mixing should be employed with the soda ash—identical to that employed in the pretreatment system with sulfuric acid. In this process, the soda ash would be premixed with a slipstream of recycled treated water in a smaller static mixer which would then be injected into the larger static mixer. To further assist mixing and increase residence time, the distance between the static mixer and the pH probes must be maximized.
8.3. Procurement Issues This system is not considered a commercial off-the-shelf (COTS) system. Although the WBA system is composed of readily available commercial components, application of this technology to other sites will require additional engineering to meet site-specific requirements based on groundwater characteristics and onsite needs and/or restrictions.

ESTCP Project No. ER-201168 ARA Project No. 001060
74
9.0 References
Aguirre, Andres. California Department of Public Health, Associate Sanitary Engineer. (909) 383-4308. [email protected]
American Water Works Association, “Disinfection of Water Treatment Plants,” ANSI/AWWA C653-03, June 01, 2003. Bernhagen, Patrick M., Goldschmidt, Victor M., Hrnjak, Predrag S., Johnson, David, Schilling, Richard L., Timmerhaus, Klaus D. 2007. Perry’s Chemical Engineers’ Handbook 8th Edition. Boodoo, Francis. The Purolite Company. (610) 668-9090. [email protected] Clesceri, Lenore, S., Eaton, Andrew D., Greenberg, Arnold E. 1997. Standard Methods for the
Examination of Water and Waste Water 20th Edition. Collins, Heather. California Department of Public Health, Region V Manager. (909) 383-4327.
[email protected] Helfferich, Friedrich. 1995. Ion Exchange. Keith, Lawrence H. 1992. EPA's Sampling and Analysis Methods. Larose, David. The Purolite Company. (619) 212-0626. [email protected] McCarthy, Sean. California Department of Health, San Bernardino District Engineer. (909) 388-
2602. [email protected] Peters, Max, Timmerhaus, Klaus, West, Ronald. 2002. Plant Design Economics for Chemical
Engineers 5th Edition. Schweitzer, Philip A. 1979. Handbook of Separation Techniques for Chemical Engineers. 97-005 Policy Memorandum. November 5, 1997, California Department of Public Health U.S. EPA. Assessment Guidance for Perchlorate Memorandum dated January 26, 2006 http://epa.gov/newsroom/perchlorate.pdf US EPA 2009 Perchlorate Guidance DOD 2009 Perchlorate Guidance ITRC Technology Review, Perchlorate: Overview of Issues, Status, and Remedial Options September 2005 Prepared by The Interstate Technology & Regulatory Council Perchlorate Team

ESTCP Project No. ER-201168 ARA Project No. 001060
A-1
Appendix A: Points of Contact
PROJECT ROLE POINT OF CONTACT
Name
ORGANIZATION Name
Address Phone/Fax/Email
ESTCP Project Manager/COR
Dr. Andrea Leeson
ESTCP 901 N. Stuart Street,
Suite 303 Arlington, VA 22203
703-696-2118 703-696-2114 fax
ARA Technical Manager
Mr. Edward Coppola
ARA 430 W. 5th St, Ste 700
Panama City, FL 32401
850-914-3188 850-914-3189 fax
ARA Project Manager Mr. Jeffrey Rine ARA
430 W. 5th St, Ste 700 Panama City, FL 32401
850-914-3188 850-914-3189 fax
ARA QA Manager Mr. Steve Baxley ARA
430 W. 5th St, Ste 700 Panama City, FL 32401
850-914-3188 850-914-3189 fax [email protected]
ARA QA/QC Coordinator Mr. Robert Girvin
ARA 430 W. 5th St, Ste 700
Panama City, FL 32401
850-914-3188 850-914-3189 fax [email protected]
Site Consultant Mr. Ralph Murphy GeoLogic Associates
1831 Commercenter East San Bernardino, CA 92408
909-383-8728 909-383-8732 fax
Site Liaison Mr. Nick Somogyi
Bryan A. Stirrat & Associates (BAS)
1360 Valley Vista Dr . Diamond Bar, Ca 91765
909-860-7777 909-396-1768 fax
DW Treatment Operator
Mr. John M. Thompson (Mike)
Grade T4 Drinking Water Treatment Operator
(Lic. No. 22694) 1922 W Sycamore St
San Bernardino, CA 92407
909-435-6017 cell [email protected]
CDPH Liaison Mr. Sean McCarthy
CDPH 464 W 4th Street, Suite 437 San Bernardino, CA 92401
909-388-2602 [email protected]

ESTCP Project No. ER-201168 ARA Project No. 001060
B-1

ESTCP Project No. ER-201168 ARA Project No. 001060
B-1
Appendix B
Rialto No. 3 WBA IX Demonstration System
Equipment Specifications
ESTCP PROJECT: ER-1168 ARA PROJECT: 001060

ESTCP Project No. ER-1168 ARA Project No. 001060
B-2
Name Tag # Manufacturer Model Capacity Set
Point Description Function Type of Control
Control Sensor(s) Interlock(s) Parameters to
monitor
Heat exchanger HE-201 WCR WCR-6x72-BEU WCR shell and tube heat exchanger: 6" nominal X 72" tube length. 4 pass, type BEU. All shell side
and tube side wetted parts are 316L stainless steel. 3/4" OD X 0.049 wall u-tubes. ASME
stamped for 150 psig @ 250F
Groundwater slipstream is used to cool water recycled for LRV pump (P-201).
Flow of slipstreamed controlled manually (30 gpm) using GV-203.
Slipstream is returned to suction side of feed pumps (P-101A/B).
None None None FI-203 (flow of slipstream)
Lag scavenger vessel ST-701A Baker Corp KW2000HPV Liquid phase filter vessel, 48" D, 96" H, 75 psi, 68 cu.ft., 150F, high pH internal coating
Vessel containing 45 cu.ft. of strong base anion resin (A530E) for treating
spent regen solution.
Manual Manually configure valves. However, the regen cycle for pumping regen is
automatic.
Are there any lock valves?
Lead scavenger vessel ST-701B Baker Corp KW2000HPV Liquid phase filter vessel, 48" D, 96" H, 75 psi, 68 cu.ft., 150F, high pH internal coating
Vessel containing 45 cu.ft. of strong base anion resin (A530E) for treating
spent regen solution.
Manual Manually configure valves. However, the regen cycle for pumping regen is
automatic.
Are there any lock valves?
WBA ion exchange vessel WBA-301 AATECH Vessel 9 FT. X 7FT. 7 IN. FT. SSH; Vessel Lining VYNYLESTER by SOCCO
WBA ion exchange vessel WBA-302 AATECH Vessel 9 FT. X 7FT. 7 IN. FT. SSH; Vessel Lining VYNYLESTER by SOCCO
Liqui-Cel membrane contactors
201-A, B, C, D, E, F
Liqui-cel G533 14"X28" membrane contactor. X50 fiber, epoxy potting, PVC vessel with nylon end caps, 2" ANSI
gas side connections, 4" ANSI liquid side connections. Gas ports in line
Manual
Secondary acid mixer MX-101 Komax 54989 N/A N/A 8 IN. Inline mixer, CPVC Construction Mixes stream from primary acid mixer with groundwater.
None None None None
Primary acid mixer MX-102 Komax 54988 N/A N/A 1" in-line mixer. SS injection quill. Mixes 93% sulfuric acid from metering pump MP-601 with a slipstream of groundwater. MP-601 addition is
controlled by AT-201A (pH following membrane system). Flow rate of
slipstream is manually controlled at 30 gpm using GV-101.
None None None None
Caustic metering pump MP-501 Nipton 547-S-N5 30 gph 30 gph Caustic transfer Pump 30GPH at 100PSI. 1/2 HP, 1ph, 115V, TEFC MOTOR
Meter caustic for regeneration rinse Manual
Acid metering pump MP-601 NEPTUNE /Pumping Solutions
535-A-N4-FA-SCR50
10 gph 5.33 gph?? Final acid feed pump 10 GPH at 150 PSI, Alloy 20 PVDF wetted parts, 115V, 3 1 PH, 60 HZ with SCR
drive
Pump conc. acid from TK-601 to reduce pH of the groundwater. Pumps through
an initial stage mixer (MX-102) mixed with a stream of groundwater (stream volume manually controlled using GV-101) and added to the suction side of
the feed pumps (P-101A/B) at MX-101.
Automatic AT-201A/B
Feed pump P-101A Grundfos CRN90-3 600 gpm VFD driven so total flow is
1000 gpm
Ion Exchanger feed pumps, 600 GPM at 90 PSI, Vertical multistage centrifugal pump, 316 SS
construction, 460v, 3ph, 60 hz.
Pump groundwater to demo system. 1000 gpm total. VFD
Automatic FT101 - PSH-201
BFC-101 Control valve
Flow rate too low or high (FALL-101 &
FAHH-101)

ESTCP Project No. ER-1168 ARA Project No. 001060
B-3
Name Tag # Manufacturer Model Capacity Set Point Description Function Type of
Control Control
Sensor(s) Interlock(s) Parameters to monitor
Feed pump P-101B Grundfos CRN90-3 600 gpm VFD driven so total flow is
1000 gpm
Ion Exchanger feed pumps, 600 GPM at 90 PSI, Vertical multistage centrifugal pump, 316 SS
construction, 460v, 3ph, 60 hz.
Pump groundwater to demo system. 1000 gpm total. VFD
Automatic FT101 - PSH-201
Transfer pump P-102 Grundfos CRN15-5 100 gpm 100 gpm Transfer pump, 100 GPM at 90 PSI, Vertical multistage centrifugal pump, 316 SS construction,
460v, 3ph, 60 hz.
Pump from transfer tank to front of system (injection side of feed pumps
prior to FT-101)
Automatic Controlled by level sensors in transfer tank TK-101: LSL-101, LSH-102, and
LSHH-102.
Liquid ring vacuum pump P-201 Nash Elmo 2BV5161 Vacuum ring pump, 327 CFM at 150 in. HG ABS, 25 HP, 460V, 3PH, 60 HZ
"Sweeps" carbon dioxide out of membrane system.
Always on??
None Don't see a way for this pump to be shut off automatically in a shutdown event…??
FI-203 monitors flow rate of fluid entering shell side of HX. Manually control rate
using GV-203 (30 gpm). TI-201 monitors
temperature of water exiting tube side of the HX
before LVP. PI-202 monitors pressure of
sweep from membranes entering LVP.
What is purpose of PS-201?
Drain pump P-301 Grundfos CRN15-3 100 gpm 100 gpm Drain Pump 100 GPM at 90 PSI, 316 SS construction, __ HP, 460V, 3PH, 60 HZ, TEFC
motor, Vertical multi-stage centrifugal
Automatic
Caustic transfer pump P-501 Iwaki 100LFZE-1 10 gpm 10 gpm Caustic transfer Pump 10 GPM at 60 ft. 1/3 HP, 115V, TEFC MOTOR
Pump fixed volume of caustic from caustic storage tank (T-501) to Regen
tank (T-502)
Automatic
Regeneration/Protonation Pump
P-502 F.H. Pumps SUMMIT MODEL CC, SIZE 3X4-8
500 gpm 500 gpm SUMMIT MODEL CC, SIZE 3X4-8 316 SS WITH SILICON CARBIDE/SILICON. CARBIDE/VITON/316
SS MECHANICAL SEAL CLOSE COUPLED TO A 20HP/3600RPM 230-460V/3PH/60CY TEFC
MOTOR
Circulate regenerating solution from tank TK-502 through IX vessel.
Circulate protonating solution from TK-602 through IX vessel.
Automatic Activated during regeneration by control system
Acid transfer pump P-601 Iwaki 100LFZE-1 10 gpm 10 gpm Acid transfer Pump 10 GPM at 60 ft. 1/3 HP, 115V, TEFC MOTOR
Pump fixed volume of acid from acid storage tank (TK-601) to Protonation
tank (TK-602)
Automatic
Protonation drain pump P-602 Grundfos CRN5-4 30 gpm 30 gpm Protonation drain pump 30 GPM at 30 PSI, ___ HP 460V, 3PH, 60 HZ, TEFC motor, 316 SS
construction
Drains protonating solution from IX vessel(s) to waste holding tank (TK-701)
Automatic Regeneration sequence
Waste circulation pump P-701 Grundfos CRN15-2 100 gpm 100 gpm Circulation Pump 100 GPM at 30 PSI, 316 SS construction, __ HP, 460V, 3PH, 60 HZ, TEFC
motor, Vertical multi-stage centrifugal
Circulates contents in the waste tanks. Will pump out waste tanks.
Manual None None
Pretreatment pH AE/AIT 201A
Enders Hauser 0-14 4 pH sensor with transmitter 0-14 pH, 4-20 ma signal
Measure pH of the pretreated water Automatic This electrode controls acid
metering pump MP-601.
If pH is outside of predetermined
range, alarm and/or shutdown. If pH
deviates from redundant electrode by a predetermined
amount, alarm and/or shutdown.
Pretreatment pH AE/AIT 201B
Enders Hauser 0-14 4 pH sensor with transmitter 0-14 pH, 4-20 ma signal
Redundant measure of the pH of pretreated water
Automatic Used to compare to AE/AT 201A

ESTCP Project No. ER-1168 ARA Project No. 001060
B-4
Name Tag # Manufacturer Model Capacity Set Point Description Function Type of
Control Control
Sensor(s) Interlock(s) Parameters to monitor
Regeneration/Protonation pH AE/AIT-301A
Enders Hauser 0-14 Variable depending
on operation
1/4 in. PG Ball valve, 316 SS, single piece, FNPT Measures pH of the regenerating solution and protonating solution. If the
pH of either solution is not within the specification at a fixed time, more
caustic or acid is added (i.e. regeneration pH < 12.5 after XX time,
additional caustic added)
Automatic This sensor controls caustic transfer pump (P-501) to add additional
caustic if needed and controls acid transfer pump (P-601) to add more
acid if needed.
Regeneration/Protonation pH AE/AIT-301B
Enders Hauser 0-14 Variable depending
on operation
1/4 in. PG Ball valve, 316 SS, single piece, FNPT Redundant measure of the pH of regenerating solution and protonating
solution.
Automatic Used to compare to AE/AT 201B
Protonation pH AE/AIT/302 Enders Hauser ≥12.5 1/4 in. PG Ball valve, 316 SS, single piece, FNPT
Regeneration pH AE/AIT/303 Enders Hauser ≤4
Regeneration Rinse pH AE/AIT-402A
Enders Hauser ≥12 pH sensor with transmitter 0-14 pH with 4-20 ma signal to PLC
Measures pH of regeneration rinse solution. The caustic metering pump used to adjust pH (MP-501) must be
manually controlled.
Regeneration Rinse pH AE/AIT-402B
Enders Hauser ≥12 pH sensor with transmitter 0-14 pH with 4-20 ma signal to PLC
Redundant measure of pH of the regenerating rinse solution.
Fully treated water pH AE/AIT-401A
Enders Hauser 7-8 pH sensor with transmitter 0-14 pH with 4-20 ma signal to PLC
Fully treated water pH AE/AIT-401B
Enders Hauser 7-8 pH sensor with transmitter 0-14 pH with 4-20 ma signal to PLC
Waste pH AE/AIT/701 Enders Hauser 0-14 None pH sensor with transmitter, 0-14 pH, 4-20 ma signal
Measures pH of the waste circulating in the waste tanks (TK-701 A/B) using
pump P-701.
Manual None None pH
Groundwater Butterfly valve BFC-101 Bray 30-0800-11010-110
N/A N/A 8 in. BF Valve, wafer style, nylon coated disc, EPDM seat with Double Acting actuator, 100 PSI
pressure
Controls flow of groundwater from Rialto No. 3 to the WBA system.
Automatic Normally open. Closed for all
shutdown events.
System flow rate FE/FIT-101 Signet 3-2551-P1-12 1200 gpm 1000 gpm Magnetic flow sensor, 1200 GPM, 8 in. pipe, Monitors system flow rate. Controls VFD feed pumps to achieve desired flow
rate.
Automatic FIT-101 Triggers alarms and shutdowns if out of
range.
FE-101.; FQ-101; FALL-101; FAHH-101
Drain pump flow rate FE/FIT-301 Signet 3-2551-1O-12 100 gpm Flow meter and sensor with display and 4-20 ma reading, sensor, flow transmitter, flow integral
mounting, magnetic type
?? Is there any control to this pump to reduce flow based on level sensors in
transfer tank?
Regeneration rinse flow rate FE/FIT-401 Signet 3-2551-TO-12 Magnetic type flow sensor , 3 IN. PIPE
Protonation rinse flow rate FE/FIT-402 Signet 3-2551-TO-12 Magnetic type flow sensor , 3 IN. PIPE
Caustic tranfer pump flow rate FE/FIT-501 Signet Signet
3-5600 3-2551-TO-12
Flow Batch controller monitor, 24V power supply, for 1 in. pipe, 10 gpm flow rate
Magnetic type flow sensor polypropylene
Protonation/Regeneration pump flow rate
FE/FIT-502 Signet 3-2551-P1-12 6 in. flow transmitter and sensor magnetic type
Acid transfer pump flow rate FE/FIT-601 Signet Signet
3-5600 3-2551-TO-12
Flow Batch controller monitor, 24V power supply, 1 in. pipe, 10 gpm
1 IN. PIPE Magnetic type flow sensor polypropylene, 10 GPM
Slip stream flow for acid injection
FI-101 ?? ?? ?? 30 gpm - manually using GV-
101
?? Monitors flow of a slip stream of groundwater water to accomplish acid
injection
Manual None - Manually adjust GV-101
None None

ESTCP Project No. ER-1168 ARA Project No. 001060
B-5
Name Tag # Manufacturer Model Capacity Set Point Description Function Type of
Control Control
Sensor(s) Interlock(s) Parameters to monitor
Air flow meter FI-201A Blue-White F-452250GHN Air flow meter, vacuum flow, 240 cfm, 2 in. FNPT Measure air flow sweeping through one pair of membranes (201-A & 201-B). Air flow can be manually adjusted using GV-
201A.
Manual None None
Air flow meter FI-201B Blue-White F-452250GHN Air flow meter, vacuum flow, 240 cfm, 2 in. FNPT Measure air flow sweeping through one pair of membranes (201-C & 201-D). Air flow can be manually adjusted using GV-
201B.
Manual None None
Air flow meter FI-201C Blue-White F-452250GHN Air flow meter, vacuum flow, 240 cfm, 2 in. FNPT Measure air flow sweeping through one pair of membranes (201-E & 201-F). Air flow can be manually adjusted using GV-
201C.
Manual None None
Air flow meter FI-202 BLUE-WHITE F-452250GHN N/A Air flow meter, vacuum flow, 240 cfm, 2 in. FNPT Measure air flow sweeping through membrane system.
None None None None
Flow to HX for LRV pump FI-203 Blue-white F451004LHN-24 0-40 gpm 30 gpm - manually using GV-
203
Feed water flow meter 0-40 GPM In line type, 1 1/2 IN. FNPT
Supplies water to the shell side of the HX cooling water to the LRV pump.
Manual None - Manually adjust GV-203
None FI-203; TI-201
Feed pump outlet pressure PI-101A Ashcroft 351009SWL04L150 PSI
150 psi None Pump outlet pressure gauges, 0-150 PSI, 3 1/2 in. dial. 316 SS construction wetted parts, glycerin
liquid filled, 1/2 in. MNPT LM
Monitor outlet pressure of feed pump P-101A.
None Software alarm if pressure is too low/too high??
Feed pump outlet pressure PI-101B Ashcroft 351009SWL04L150 PSI
151 psi None Pump outlet pressure gauges, 0-150 PSI, 3 1/2 in. dial. 316 SS construction wetted parts, glycerin
liquid filled, 1/2 in. MNPT LM
Monitor outlet pressure of feed pump P-101B.
None Software alarm if pressure is too low/too high??
Transfer pump outlet pressure PI-102 Ashcroft 351009SWL04L100 PSI
100 psi None Pump outlet pressure gauges, 0-100 PSI, 4 in. dial. 316 SS construction wetted parts, glycerin liquid
filled, 1/2 in. MNPT LM
Monitors outlet pressure of the transfer pump P-102.
None
Pressure air sweep entering LRV pump
PI-202 Ashcroft 351009SWL04L30 in./0 in. Hg
30 in. to 0 in. Hg
None Vacuum pressure gauge, 316 SS, liquid filled, 1/2 in. lower mount
Monitors vacuum pressure exiting membrane system and entering LRV
pump.
Manual None - Adjust vacuum??
None
Drain pump outlet pressure PI-301 Ashcroft 351009SWL04L150 PSI
Drain pump outlet pressure gauges, 0-150 PSI, 3 1/2 in. dial. 316 SS construction wetted parts,
glycerine liquid filled, 1/2 in. MNPT LM
Caustic transfer pump outlet pressure
PI-501 PLAST OMATIC, RYAN
HERCO/PENVALVE
5342-030 Pressure indicator, 0/100psi, bottom mount, oil-filled gauge with CPVC guard seal & Teflon
diaphragm, Plastomatic
Protonation/Regeneration pump outlet pressure
PI-502 PLAST OMATIC, RYAN
HERCO/PENVALVE
5342-030 Pressure indicator, 0/100psi, bottom mount, oil-filled gauge with PVDF guard seal & Teflon
diaphragm, Plastomatic
Acid transfer pump outlet pressure
PI-601 PLAST OMATIC, RYAN
HERCO/PENVALVE
5342-030 Pressure indicator, 0/100psi, bottom mount, oil-filled gauge with PVDF guard seal & Teflon
diaphragm, Plastomatic
Acid metering pump outlet pressure
PI-602 PLAST OMATIC, RYAN
HERCO/PENVALVE
5342-030 Pressure indicator, 0/100psi, bottom mount, oil-filled gauge with PVDF guard seal & Teflon
diaphragm, Plastomatic
Protonation drain pump outlet pressure
PI-603 PLAST OMATIC, RYAN
HERCO/PENVALVE
5342-030 Pressure indicator, 0/100psi, bottom mount, oil-filled gauge with PVDF guard seal & Teflon
diaphragm, Plastomatic
Circulation pump outlet pressure
PI-701 Ashcroft 351009SWL04L100 PSI
Circulation pump outlet pressure gauges, 0-100 PSI, 43 1/2in. dial. 316 SS construction wetted parts, glycerin liquid filled, 1/2 in. MNPT LM
Temperature of water entering LRV pump
TI-201 Ashcroft 20CL60R025 0/250F
0 to 200°F None Temperature indicator, 2 IN. DIAL ,0-200 deg.F, 1/4 IN. NPT
Monitors temperature of water exiting tube side of HX and entering LRV pump.
Manual None None FI-203
Discharge separator tank- membrane system
T-201 Membrana separator 2BV5161
Tank integrated with outlet port of LRV pump to allow separation of gas and
liquid. Gas is vented and liquid is drained into a holding tank and recycled
for cooling the LRV pump.
None None None None

ESTCP Project No. ER-1168 ARA Project No. 001060
B-6
Name Tag # Manufacturer Model Capacity Set Point Description Function Type of
Control Control
Sensor(s) Interlock(s) Parameters to monitor
LRV Pump holding tank T-202 US Plastic 5318 55 gal N/A closed-head tank, 55 gal, 22-1/4" X 43-1/8" Tank for collecting liquid from discharge separator tank and recycling through
heat exchanger to LRV pump
None None None Manually check level to ensure additional water is
not needed. Transfer Tank TK-101 Schneider 500 gallons Low, high,
HighHigh 500 GAL. Transfer tank, 48 in. x 74 in. with 18 in.
manway, flat bottom, domed top Receives effluent from ion exchange
draining prior to regeneration (pumped at ~ 80 gpm by P-301)); and final
regeneration rinse and protonation rinse (introduced at a fixed rate of ~80 gpm based on manually adjusted flows from GV-401 and GV-402, respectively). Level sensors in the tank control P-102 (on/off) to ensure that liquid is pumped at a constant rate (100 gpm) to the front
of the system and tank does not overflow.
Automatic - Level
sensors
Level sensors in tank: LSL-101, LSH-102, and LSHH-102
control P-102
Waste holding tank TK-701A Baker Corp 6500 gal 6500 gal N/A 6500 gal Poly tank Rented storage tank to hold regeneration waste prior to disposal.
Manual None None FE/FIT-301 - To quantify amount of waste added to
the tank during regeneration waste to scavenger followed by
waste and protonation drain to waste.
Waste holding tank TK-701B Baker Corp 6500 gal 6500 gal N/A 6500 gal Poly tank Rented storage tank to hold regeneration waste prior to disposal.
Manual None None FE/FIT-301 - To quantify amount of waste added to
the tank during regeneration waste to scavenger followed by
waste and protonation drain to waste.

ESTCP Project No. ER-1168 ARA Project No. 001060
C-1
Appendix C
Rialto No. 3 WBA IX Demonstration
Test Period Treatment Data
ESTCP PROJECT: ER-1168 ARA PROJECT: 001060

ESTCP Project No. ER-1168 ARA Project No. 001060
C-2
Test Period 1
Start FinishDate/Time Date/Time Initial Final
7/18/11 10:19 7/18/11 12:05 1.77 0.07 800 114476 191435 76959 440 29 flow to basin7/18/11 14:57 7/18/11 18:51 3.90 0.15 800 191435 364202 172767 440 66 flow to basin7/19/11 9:05 7/19/11 9:39 0.57 0.02 800 364202 389125 24923 440 10 flow to basin7/19/11 9:39 7/19/11 14:40 5.02 0.21 800 389125 628300 239175 440 91 flow to reservoir7/20/11 7:54 7/20/11 9:03 1.15 0.05 800 628394 683852 55458 440 21 flow to basin7/20/11 10:15 7/20/11 11:03 0.80 0.03 800 683852 720905 37053 440 14 flow to basin7/20/11 14:14 7/20/11 14:54 0.67 0.03 800 720905 750178 29273 440 11 flow to basin
7/20/11 14:56 7/21/11 2:52 11.93 0.15 800 750178 925917 175739 440 67reservoir at 800/600/400 gpm, then
back to 6007/21/11 7:27 7/21/11 8:43 1.27 0.00 600 1160843 1162824 1981 330 1 flow to basin7/21/11 8:43 7/21/11 14:00 5.28 0.22 600 1162824 1350279 187455 330 72 flow to reservoir7/21/11 14:00 7/21/11 16:00 2.00 0.09 700 1350279 1440730 90451 385 35 flow to reservoir7/21/11 16:00 7/21/11 21:36 5.60 0.18 800 1440730 1643991 203261 440 78 flow to reservoir7/22/11 10:46 7/22/11 15:56 5.17 0.22 800 1643991 1892375 248384 440 95 flow to reservoir7/22/11 16:12 7/23/11 8:22 16.17 0.68 800 1892375 2673949 781574 440 299 flow to reservoir7/23/11 8:22 7/24/11 7:35 23.22 0.96 800 2673949 3785585 1111636 440 425 flow to reservoir7/24/11 7:35 7/24/11 9:10 1.58 0.06 800 3785585 3855276 69691 440 27 flow to reservoir
TOTAL: 3.1 TOTAL: 3,505,780 6,765 1,339
CommentsTime Duration
(hrs)Flow Setpt
(GPM)Water Totalizer (G)
Water Processed (G)Calc
BV/dayActual BV/day
Runtime (days)
Test Period 2
Start FinishDate/Time Date/Time Initial Final
7/24/11 9:10 7/24/11 9:20 0.17 0.00 800 0 4781 4781 440 2 flow to reservoir, regen7/24/11 9:20 7/24/11 19:33 10.22 0.02 800 4781 32877 28096 440 11 flow to reservoir
7/24/11 19:33 7/24/11 19:45 0.20 0.00 800 32877 34122 1245 440 0flow to reservoir; CR3 shut down @
19457/25/11 8:05 7/26/11 7:50 23.75 0.99 800 34122 1175290 1141168 440 436 flow to reservoir, continue regen7/26/11 7:50 7/27/11 14:28 30.63 1.21 800 1175290 2573102 1397812 440 534 flow to reservoir, finish regen 7/27/11 14:28 7/28/11 10:13 19.75 0.07 500 2573102 2624061 50959 275 19 flow to reservoir @ reduced flow
7/28/11 10:13 7/29/11 10:19 24.10 1.00 500 2624061 3345310 721249 275 275Increased flow from 500 GPM to 800
GPM @ 17:237/29/11 10:19 7/30/11 8:45 22.43 0.67 800 3345310 4120126 774816 440 2967/30/11 8:45 7/31/11 22:20 37.58 1.18 800 4120126 5473755 1353629 440 5177/31/11 22:20 8/1/11 8:05 9.75 0.39 800 5473755 5919575 445820 440 170
TOTAL: 5.5 TOTAL: 5,919,575 4070 2261
Time Duration (hrs)
Flow Setpt (GPM)
Water Totalizer (G)Water Processed (G) Comments
Calc BV/day
Actual BV/day
Runtime (days)

ESTCP Project No. ER-1168 ARA Project No. 001060
C-3
Test Period 3
Start FinishDate/Time Date/Time Initial Final8/1/11 8:05 8/2/11 7:00 22.92 0.88 800 0 1018578 1018578 440 389 Started regen vessel B
8/2/11 7:00 8/3/11 12:08 29.13 0.55 800 1018578 1655286 636708 440 243Completed regen vessel B; PM--pH
LoLo; system shutdown overnt
8/3/11 12:08 8/4/11 11:46 23.63 0.89 800 1655286 2685225 1029939 440 393Restart system @ 1153; low P alarm @
1447
8/4/11 11:46 8/5/11 11:45 23.98 0.16 800 2685225 2872876 187651 440 72Lo-lo pH @ 0912; restart; low P alarm
@ 15078/5/11 11:45 8/6/11 12:10 24.42 0.41 800 2872876 3348069 475193 440 182 Restart @ 1055; hi P alarm @ 21388/6/11 12:10 8/7/11 10:00 21.83 0.91 800 3348069 4395590 1047521 440 400 Restart @ 11458/7/11 10:00 8/8/11 6:03 20.05 0.83 800 4395590 5356549 960959 440 367 System dwn-broken soda ash lines
8/8/11 6:03 8/18/11 18:40 252.62 0.00 800 5356549 5356549 0 4632 0Repairs complete--attempted restart 08/10 @ 2000; chk vlv CV-101B brkn--
system down8/18/11 18:40 8/19/11 11:00 16.33 0.61 800 5356549 6060744 704195 440 269 Lo-lo pH 0600 08/19; restart8/19/11 11:00 8/20/11 8:40 21.67 0.54 800 6060744 6683412 622668 440 238 Lo-lo pH 2328 08/19; restart8/20/11 8:40 8/21/11 16:15 31.58 0.93 800 6683412 7758528 1075116 440 411 Lo-Lo pH 0600-0700; restart8/21/11 16:15 8/22/11 9:45 17.50 0.73 800 7758528 8594662 836134 440 319
8/22/11 9:45 8/23/11 10:04 24.32 0.23 800 8594662 8859579 264917 440 101 HI P shutdwn 1440 08/22; restart 08/23
8/23/11 10:04 8/24/11 7:40 21.60 0.22 800 8859579 9108527 248948 440 95 Rialto 3 down 1440 08/23; restart 08/24
8/24/11 7:40 8/25/11 7:17 23.62 0.28 800 9108527 9436239 327712 440 125Rialto 3 down @ 1340 08/24; restart @
1615
8/25/11 7:17 8/26/11 7:00 23.72 0.00 800 9436239 9436239 0 440 0
pH LoLo @ 1750 08/24; restart not successful--soda ash lines plugged
solid; shutdown until MT available to fix
8/26/11 7:00 8/27/11 7:00 24.00 0.00 800 9436239 9436239 0 440 08/27/11 7:00 8/28/11 7:00 24.00 0.00 800 9436239 9436239 0 440 08/28/11 7:00 8/29/11 7:00 24.00 0.00 800 9436239 9436239 0 440 0 Rialto 3 down--DOW resin probs8/29/11 7:00 8/30/11 7:00 24.00 0.00 800 9436239 9436239 0 440 0 Rialto 3 down--DOW resin probs8/30/11 7:00 8/31/11 7:00 24.00 0.00 800 9436239 9436239 0 440 0 Rialto 3 down--DOW resin probs
8/31/11 7:00 9/1/11 7:00 24.00 0.00 800 9436239 9436239 0 440 0Rialto 3 down--DOW resin probs; repairs complete; cleaning tank
9/1/11 7:00 9/2/11 7:00 24.00 0.00 800 9436239 9436239 0 440 09/2/11 7:00 9/3/11 7:00 24.00 0.00 800 9436239 9436239 0 440 09/3/11 7:00 9/4/11 7:00 24.00 0.00 800 9436239 9436239 0 440 09/4/11 7:00 9/5/11 7:00 24.00 0.00 800 9436239 9436239 0 440 0
9/5/11 7:00 9/6/11 7:50 24.83 0.08 800 9436239 9527271 91032 440 35Restart system @ 1123; pH feed water
HiHi shutdown @ 1253 09/05
9/6/11 7:50 9/7/11 7:00 23.17 0.80 800 9527271 10447451 920180 440 351Restart system @ 0736; Rialto 3 down--
low P shutdown (PSH-201) @ 1256 09/06; restart system @1705
9/7/11 7:00 9/8/11 7:00 24.00 0.00 800 10447451 10447451 0 440 0Rialto 3 down--low P shutdown (PSH-
201) @ 0745 09/07; cannot restart
9/8/11 7:00 9/9/11 12:01 29.02 0.00 800 10447451 10447451 0 440 0Rialto 3 offline--bag filters plugged
early AM 09/08; restart @ 1201 09/09
9/9/11 12:01 9/10/11 10:05 22.07 0.21 800 10447451 10685200 237749 440 91Rialto 3 down--low P shutdown (PSH-201) @ 1600 09/09; restart 0830 09/10
TOTAL: 9.3 TOTAL: 10,685,200 17,833 4,081
Time Duration (hrs)
Flow Setpt (GPM)
Water Totalizer (G)Water Processed (G) Comments
Calc BV/day
Actual BV/day
Runtime (days)

ESTCP Project No. ER-1168 ARA Project No. 001060
C-4
Test Period 4
Start FinishDate/Time Date/Time Initial Final
9/10/11 10:05 9/11/11 10:38 24.55 1.02 800 0 1,173,400 1,173,400 440 448 Start regen TP 4/vessel A @ 10059/11/11 10:38 9/12/11 9:00 22.37 0.93 800 1,173,400 2,242,300 1,068,900 440 4089/12/11 9:00 9/13/11 14:10 29.17 0.08 800 2,242,300 2,331,180 88,880 440 34 Rialto 3 down--low P shutdown (PSH-201) @ 0955 09/12; restart @ 1320 09/13
9/13/11 14:10 9/14/11 10:00 19.83 0.37 800 2,331,180 2,762,500 431,320 440 165 Rialto 3 down--pH LoLo @ 2200 09/14; restart @ 0836 09/149/14/11 10:00 9/15/11 9:45 23.75 0.99 800 2,762,500 3,897,660 1,135,160 440 4349/15/11 9:45 9/16/11 8:45 23.00 0.81 800 3,897,660 4,830,200 932,540 440 3569/16/11 8:45 9/17/11 7:55 23.17 0.96 800 4,830,200 5,940,300 1,110,100 440 4249/17/11 7:55 9/18/11 12:30 28.58 1.14 800 5,940,300 7,249,116 1,308,816 440 500 Hi P alarm shutdown @ 1230 09/17: restart @ 1255 09/17
9/18/11 12:30 9/19/11 8:00 19.50 0.57 800 7,249,116 7,911,182 662,066 440 253 Rialto 3 offline--low P shutdown (PSH-201) @ 1348 09/18; restart @ 1830 09/189/19/11 8:00 9/20/11 9:35 25.58 0.22 800 7,911,182 8,161,902 250,720 440 96 Rialto 3 offline--low P shutdown (PSH-201) @ 1224 09/19; restart @ 0846 09/209/20/11 9:35 9/21/11 9:12 23.62 0.23 800 8,161,902 8,431,768 269,866 440 103 Rialto 3 offline--low P shutdown (PSH-201) @ XXXX 09/20; restart @ 0912 09/219/21/11 9:12 9/22/11 7:15 22.05 0.23 800 8,431,768 8,696,951 265,183 440 101 Rialto 3 offline--low P shutdown (PSH-201) @ 1454 09/21; restart @ 0715 09/229/22/11 7:15 9/23/11 14:05 30.83 0.26 800 8,696,951 8,997,974 301,023 440 115 Rialto 3 offline--low P shutdown (PSH-201) @ 1323 09/22; restart @ 1353 09/23
9/23/11 14:05 9/24/11 7:05 17.00 0.01 800 8,997,974 9,012,217 14,243 440 5 Rialto 3 offline--low P shutdown (PSH-201) @ 1442 09/24; could not restart9/24/11 7:05 9/25/11 0:00 16.92 0.00 800 9,012,217 9,012,217 0 440 0 Rialto 3 offline--high P diff/electrical problems9/25/11 0:00 9/26/11 0:00 24.00 0.00 800 9,012,217 9,012,217 0 440 0 Rialto 3 offline--pump motor repairs9/26/11 0:00 9/27/11 0:00 24.00 0.00 800 9,012,217 9,012,217 0 440 0 Rialto 3 offline--pump motor repairs9/27/11 0:00 9/28/11 0:00 24.00 0.00 800 9,012,217 9,012,217 0 440 0 Rialto 3 offline--pump motor repairs9/28/11 0:00 9/29/11 0:00 24.00 0.00 800 9,012,217 9,012,217 0 440 0 Rialto 3 offline--pump motor repairs9/29/11 0:00 9/30/11 0:00 24.00 0.00 800 9,012,217 9,012,217 0 440 0 Rialto 3 offline--pump motor repairs9/30/11 0:00 10/1/11 0:00 24.00 0.00 800 9,012,217 9,012,217 0 440 0 Rialto 3 offline--pump motor repairs10/1/11 0:00 10/2/11 0:00 24.00 0.00 800 9,012,217 9,012,217 0 440 0 Rialto 3 offline--pump motor repairs10/2/11 0:00 10/3/11 0:00 24.00 0.00 800 9,012,217 9,012,217 0 440 0 Rialto 3 offline--pump motor repairs10/3/11 0:00 10/4/11 0:00 24.00 0.00 800 9,012,217 9,012,217 0 440 0 WBA IX offline--foreign materials in Siemens resin; no restart allowed10/4/11 0:00 10/5/11 0:00 24.00 0.00 800 9,012,217 9,012,217 0 440 0 WBA IX offline--foreign materials in Siemens resin; no restart allowed10/5/11 0:00 10/6/11 0:00 24.00 0.00 800 9,012,217 9,012,217 0 440 0 WBA IX offline--foreign materials in Siemens resin; no restart allowed10/6/11 0:00 10/7/11 0:00 24.00 0.00 800 9,012,217 9,012,217 0 440 0 WBA IX offline--foreign materials in Siemens resin; no restart allowed10/7/11 0:00 10/8/11 0:00 24.00 0.00 800 9,012,217 9,012,217 0 440 0 WBA IX offline--foreign materials in Siemens resin; no restart allowed10/8/11 0:00 10/9/11 0:00 24.00 0.00 800 9,012,217 9,012,217 0 440 0 WBA IX offline--foreign materials in Siemens resin; no restart allowed10/9/11 0:00 10/10/11 0:00 24.00 0.00 800 9,012,217 9,012,217 0 440 0 WBA IX offline--foreign materials in Siemens resin; no restart allowed
10/10/11 0:00 10/11/11 13:30 37.50 0.00 800 9,012,217 9,012,217 0 440 0 WBA IX offline--foreign materials in Siemens resin; no restart allowed10/11/11 13:30 10/12/11 9:15 19.75 0.85 800 9,012,217 9,992,194 979,977 440 374 Startup 10/11 @ 133010/12/11 9:15 10/13/11 16:20 31.08 0.78 800 9,992,194 10,887,172 894,978 440 342 Rialto 3 offline--low P shutdown (PSH-201) @ 1441 10/12; restart @ 2251 10/1210/13/11 16:20 10/14/11 10:03 17.72 0.01 800 10,887,172 10,896,365 9,193 440 4 Rialto 3 offline--low P shutdown (PSH-201) @ 1236 10/13; restart @ 1003 10/1410/14/11 10:03 10/15/11 11:12 25.15 0.24 800 10,896,365 11,175,254 278,889 440 107 Rialto 3 offline--low P shutdown (PSH-201) @ 1534 10/14; restart @ 1105 10/15
10/15/11 11:12 10/16/11 15:02 27.83 0.88 800 11,175,254 12,192,411 1,017,157 440 389Rialto 3 offline--high P shutdown (Line Over Pressure) @ 1153 10/15; restart @ 1812
10/1510/16/11 15:02 10/17/11 9:58 18.93 0.79 800 12,192,411 13,104,107 911,696 440 348
10/17/11 9:58 10/18/11 18:40 32.70 1.32 800 13,104,107 14,628,409 1,524,302 440 582Rialto 3 offline--low flow (FT-101 IX Feed Low Low) @ 1101 (Siemens unannounced
maintenance); restart @ 1148 10/1710/18/11 18:40 10/19/11 9:25 14.75 0.28 800 14,628,409 14,955,079 326,670 440 125 10/19 0128 Treated Water pH LoLo--strainer clogged; restart @ 0910 10/1910/19/11 9:25 10/20/11 16:20 30.92 1.04 800 14,955,079 16,149,404 1,194,325 440 45610/20/11 16:20 10/21/11 15:45 23.42 0.95 800 16,149,404 17,248,926 1,099,522 440 420 10/21 1510 treated water pH LoLo--soda ash out; restart 1605 10/2110/21/11 15:45 10/22/11 7:05 15.33 0.63 800 17,248,926 17,970,806 721,880 440 276 Shutdown--soda ash pumps leaking10/22/11 7:05 10/23/11 7:00 23.92 0.00 800 17,970,806 17,970,806 0 440 0 Troubleshooting soda ash pumps10/23/11 7:00 10/24/11 7:00 24.00 0.00 800 17,970,806 17,970,806 0 440 0 Troubleshooting soda ash pumps10/24/11 7:00 10/25/11 7:00 24.00 0.00 800 17,970,806 17,970,806 0 440 0 Troubleshooting soda ash pumps10/25/11 7:00 10/26/11 7:00 24.00 0.00 800 17,970,806 17,970,806 0 440 0 Soda ash static mixer/injector damaged during troubleshooting10/26/11 7:00 10/27/11 7:00 24.00 0.00 800 17,970,806 17,970,806 0 440 010/27/11 7:00 10/28/11 7:00 24.00 0.00 800 17,970,806 17,970,806 0 440 010/28/11 7:00 10/29/11 7:00 24.00 0.00 800 17,970,806 17,970,806 0 440 010/29/11 7:00 10/30/11 7:00 24.00 0.00 800 17,970,806 17,970,806 0 440 010/30/11 7:00 10/31/11 7:00 24.00 0.00 800 17,970,806 17,970,806 0 440 010/31/11 7:00 11/1/11 7:00 24.00 0.00 800 17,970,806 17,970,806 0 440 011/1/11 7:00 11/2/11 7:00 24.00 0.00 800 17,970,806 17,970,806 0 440 011/2/11 7:00 11/3/11 7:00 24.00 0.00 800 17,970,806 17,970,806 0 440 011/3/11 7:00 11/4/11 7:00 24.00 0.00 800 17,970,806 17,970,806 0 440 011/4/11 7:00 11/5/11 7:00 24.00 0.00 800 17,970,806 17,970,806 0 440 011/5/11 7:00 11/6/11 7:00 24.00 0.00 800 17,970,806 17,970,806 0 440 011/6/11 7:00 11/7/11 7:00 24.00 0.00 800 17,970,806 17,970,806 0 440 011/7/11 7:00 11/8/11 7:00 24.00 0.00 800 17,970,806 17,970,806 0 440 011/8/11 7:00 11/9/11 7:00 24.00 0.00 800 17,970,806 17,970,806 0 440 011/9/11 7:00 11/10/11 7:00 24.00 0.00 800 17,970,806 17,970,806 0 440 0
11/10/11 7:00 11/11/11 7:00 24.00 0.00 800 17,970,806 17,970,806 0 440 0 Static mixer repaired; reservoirs are full--CR#3 offline/unable to startup11/11/11 7:00 11/12/11 7:00 24.00 0.00 800 17,970,806 17,970,806 0 440 0 CR#3 offline/unable to startup11/12/11 7:00 11/13/11 7:00 24.00 0.00 800 17,970,806 17,970,806 0 440 0 CR#3 offline/unable to startup11/13/11 7:00 11/14/11 12:25 29.42 0.01 800 17,970,806 17,983,284 12,478 440 5 Startup/ph LoLo--soda ash feed off/restart 11/17 PM11/14/11 12:25 11/15/11 8:45 20.33 0.74 800 17,983,284 18,839,194 855,910 440 327
11/15/11 8:45 11/16/11 7:00 22.25 0.17 800 18,839,194 19,030,498 191,304 440 73CR3 offline @ 0945 11/15 for testing; restart @ 1045; CR3 offline @ XXXX--UV lamps
out11/16/11 7:00 11/30/11 0:00 329.00 0.00 800 19,030,498 19,030,498 0 440 0 CR3 offline; unable to restart11/30/11 0:00 12/5/11 7:00 127.00 0.00 800 19,030,498 19,030,498 0 440 0 CR3 offline; restart system @ XXXX12/5/11 7:00 12/6/11 7:00 24.00 0.00 800 19,030,498 19,030,498 0 440 012/6/11 7:00 12/7/11 7:00 24.00 0.00 800 19,030,498 19,030,498 0 440 012/7/11 7:00 12/8/11 7:00 24.00 0.00 800 19,030,498 19,030,498 0 440 0 End of Demo
TOTAL: 16.5 TOTAL: 19,030,498 18,041 6,589
Time Duration (hrs)
Flow Setpt (GPM)Water Totalizer FQIT-101
Water Processed (G) CommentsCalc
BV/dayActual BV/day
Runtime (days)

ESTCP Project No. ER-1168 ARA Project No. 001060
C-5
July 2010
Start FinishDate/Time Date/Time Initial Final
7/18/11 10:19 7/18/11 12:05 1.8 0.1 800 114,476 191,435 76,959 basin7/18/11 14:57 7/18/11 18:51 3.9 0.1 800 191,435 364,202 172,767 basin7/19/11 9:05 7/19/11 9:39 0.6 0.0 800 364,202 389,125 24,923 basin7/19/11 9:39 7/19/11 14:40 5.0 0.2 800 389,125 628,300 239,175 reservoir7/20/11 7:54 7/20/11 9:03 1.1 0.0 800 628,394 683,852 55,458 basin
7/20/11 10:15 7/20/11 11:03 0.8 0.0 800 683,852 720,905 37,053 basin7/20/11 14:14 7/20/11 14:54 0.7 0.0 800 720,905 750,178 29,273 basin
7/20/11 14:56 7/21/11 2:52 11.9 0.2 800 750,178 925,917 175,739reservoir at 800/600/400 gpm, then
back to 6007/21/11 7:27 7/21/11 8:43 1.3 0.0 600 1,160,843 1,162,824 1,981 basin7/21/11 8:43 7/21/11 14:00 5.3 0.2 600 1,162,824 1,350,279 187,455 reservoir
7/21/11 14:00 7/21/11 16:00 2.0 0.1 700 1,350,279 1,440,730 90,451 reservoir7/21/11 16:00 7/21/11 21:36 5.6 0.2 800 1,440,730 1,643,991 203,261 reservoir7/22/11 10:46 7/22/11 15:56 5.2 0.2 800 1,643,991 1,892,375 248,384 reservoir7/22/11 16:12 7/23/11 8:22 16.2 0.7 800 1,892,375 2,673,949 781,574 reservoir7/23/11 8:22 7/24/11 7:35 23.2 1.0 800 2,673,949 3,785,585 1,111,636 reservoir7/24/11 7:35 7/24/11 9:10 1.6 0.1 800 3,785,585 3,855,276 69,691 reservoir7/24/11 9:10 7/24/11 9:20 0.2 0.0 800 0 4,781 4,781 reservoir, regen7/24/11 9:20 7/24/11 19:33 10.2 0.0 800 4,781 32,877 28,096 reservoir
7/24/11 19:33 7/24/11 19:45 0.2 0.0 800 32,877 34,122 1,245 reservoir; city well shut down @ 19457/25/11 8:05 7/26/11 7:50 23.8 1.0 800 34,122 1,175,290 1,141,168 reservoir, continue regen7/26/11 7:50 7/27/11 14:28 30.6 1.2 800 1,175,290 2,573,102 1,397,812 reservoir, finish regen
7/27/11 14:28 7/28/11 10:13 19.7 0.1 500 2,573,102 2,624,061 50,959 Reservoir @ reduced flow
7/28/11 10:13 7/29/11 10:19 24.1 1.0 500 2,624,061 3,345,310 721,249Raised flow from 500 GPM to 800 GPM
@ 17:237/29/11 10:19 7/30/11 8:45 22.4 0.7 800 3,345,310 4,120,126 774,816 Reservoir7/30/11 8:45 7/31/11 22:20 37.6 1.2 800 4,120,126 5,473,755 1,353,629 Reservoir
7/31/11 22:20 8/1/11 8:05 9.8 0.4 800 5,473,755 5,919,575 445,820 ReservoirTOTAL: 8.6 9,425,355
Time Duration (hrs) Flow Setpt (GPM)Water Totalizer
Water Processed (G) CommentsRuntime (days)
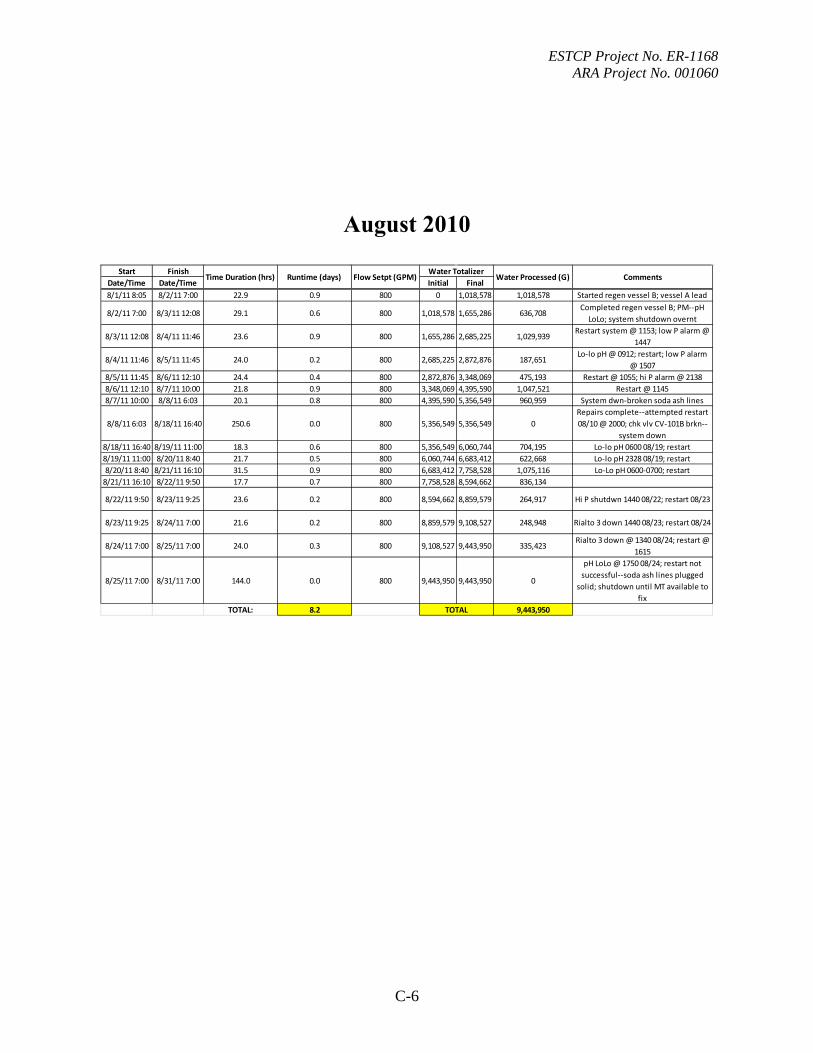
ESTCP Project No. ER-1168 ARA Project No. 001060
C-6
August 2010
Start FinishDate/Time Date/Time Initial Final8/1/11 8:05 8/2/11 7:00 22.9 0.9 800 0 1,018,578 1,018,578 Started regen vessel B; vessel A lead
8/2/11 7:00 8/3/11 12:08 29.1 0.6 800 1,018,578 1,655,286 636,708Completed regen vessel B; PM--pH
LoLo; system shutdown overnt
8/3/11 12:08 8/4/11 11:46 23.6 0.9 800 1,655,286 2,685,225 1,029,939Restart system @ 1153; low P alarm @
1447
8/4/11 11:46 8/5/11 11:45 24.0 0.2 800 2,685,225 2,872,876 187,651Lo-lo pH @ 0912; restart; low P alarm
@ 15078/5/11 11:45 8/6/11 12:10 24.4 0.4 800 2,872,876 3,348,069 475,193 Restart @ 1055; hi P alarm @ 21388/6/11 12:10 8/7/11 10:00 21.8 0.9 800 3,348,069 4,395,590 1,047,521 Restart @ 11458/7/11 10:00 8/8/11 6:03 20.1 0.8 800 4,395,590 5,356,549 960,959 System dwn-broken soda ash lines
8/8/11 6:03 8/18/11 16:40 250.6 0.0 800 5,356,549 5,356,549 0Repairs complete--attempted restart 08/10 @ 2000; chk vlv CV-101B brkn--
system down8/18/11 16:40 8/19/11 11:00 18.3 0.6 800 5,356,549 6,060,744 704,195 Lo-lo pH 0600 08/19; restart8/19/11 11:00 8/20/11 8:40 21.7 0.5 800 6,060,744 6,683,412 622,668 Lo-lo pH 2328 08/19; restart8/20/11 8:40 8/21/11 16:10 31.5 0.9 800 6,683,412 7,758,528 1,075,116 Lo-Lo pH 0600-0700; restart
8/21/11 16:10 8/22/11 9:50 17.7 0.7 800 7,758,528 8,594,662 836,134
8/22/11 9:50 8/23/11 9:25 23.6 0.2 800 8,594,662 8,859,579 264,917 Hi P shutdwn 1440 08/22; restart 08/23
8/23/11 9:25 8/24/11 7:00 21.6 0.2 800 8,859,579 9,108,527 248,948 Rialto 3 down 1440 08/23; restart 08/24
8/24/11 7:00 8/25/11 7:00 24.0 0.3 800 9,108,527 9,443,950 335,423Rialto 3 down @ 1340 08/24; restart @
1615
8/25/11 7:00 8/31/11 7:00 144.0 0.0 800 9,443,950 9,443,950 0
pH LoLo @ 1750 08/24; restart not successful--soda ash lines plugged
solid; shutdown until MT available to fix
TOTAL: 8.2 9,443,950
Comments
TOTAL
Time Duration (hrs) Flow Setpt (GPM)Water Totalizer
Water Processed (G)Runtime (days)

ESTCP Project No. ER-1168 ARA Project No. 001060
C-7
September 2010
Start FinishDate/Time Date/Time Initial Final9/1/11 7:00 9/2/11 7:00 24.0 0.0 800 9,436,239 9,436,239 0 Rialto 3 offline/soda ash repairs9/2/11 7:00 9/3/11 7:00 24.0 0.0 800 9,436,239 9,436,239 09/3/11 7:00 9/4/11 7:00 24.0 0.0 800 9,436,239 9,436,239 09/4/11 7:00 9/5/11 7:00 24.0 0.0 800 9,436,239 9,436,239 09/5/11 7:00 9/6/11 7:50 24.8 0.1 800 9,436,239 9,527,271 91,032 Restart system @ 1123; pH feed water HiHi shutdown @ 1253 09/05
9/6/11 7:50 9/7/11 7:00 23.2 0.8 800 9,527,271 10,447,451 920,180Restart system @ 0736; Rialto 3 offline--low P shutdown (PSH-201) @ 1256 09/06;
restart system @17059/7/11 7:00 9/8/11 7:00 24.0 0.0 800 10,447,451 10,447,451 0 Rialto 3 offline--low P shutdown (PSH-201) @ 0745 09/07; could not restart9/8/11 7:00 9/9/11 12:01 29.0 0.0 800 10,447,451 10,447,451 0 Rialto 3 offline--bag filters plugged early AM 09/08; restart @ 1201 09/099/9/11 12:01 9/10/11 9:38 21.6 0.2 800 10,447,451 10,664,000 216,549 Rialto 3 offline--low P shutdown (PSH-201) @ 1600 09/09; restart 0830 09/109/10/11 9:38 9/10/11 10:05 0.5 0.0 800 10,664,000 10,685,200 21,200 Start regen vessel A @ 1005
9/10/11 10:05 9/11/11 10:38 24.6 1.0 800 0 1,173,400 1,173,400 Start Test Period 49/11/11 10:38 9/12/11 9:00 22.4 0.9 800 1,173,400 2,242,300 1,068,9009/12/11 9:00 9/13/11 14:10 29.2 0.1 800 2,242,300 2,331,180 88,880 Rialto 3 offline--low P shutdown (PSH-201) @ 0955 09/12; restart @ 1320 09/13
9/13/11 14:10 9/14/11 10:00 19.8 0.4 800 2,331,180 2,762,500 431,320 pH LoLo @ 2200 09/13; restart @ 0836 09/149/14/11 10:00 9/15/11 9:45 23.8 1.0 800 2,762,500 3,897,660 1,135,1609/15/11 9:45 9/16/11 8:45 23.0 0.8 800 3,897,660 4,830,200 932,540 Hi P alarm shutdown @ 1124 09/15; restart system @ 14569/16/11 8:45 9/17/11 7:55 23.2 1.0 800 4,830,200 5,940,300 1,110,1009/17/11 7:55 9/18/11 12:30 28.6 1.1 800 5,940,300 7,227,982 1,287,682 Hi P alarm shutdown @ 1657 09/17: restart @ 1728
9/18/11 12:30 9/19/11 8:00 19.5 0.6 800 7,227,982 7,911,182 683,200 Rialto 3 offline--low P shutdown (PSH-201) @ 1348 09/18; restart @ 1830 09/189/19/11 8:00 9/20/11 9:35 25.6 0.2 800 7,911,182 8,161,902 250,720 Rialto 3 offline--low P shutdown (PSH-201) @ 1224 09/19; restart @ 0846 09/209/20/11 9:35 9/21/11 9:12 23.6 0.2 800 8,161,902 8,431,768 269,866 Rialto 3 offline--low P shutdown (PSH-201) @ 1502 09/20; restart @ 0912 09/219/21/11 9:12 9/22/11 7:15 22.1 0.2 800 8,431,768 8,696,951 265,183 Rialto 3 offline--low P shutdown (PSH-201) @ 1454 09/21; restart @ 0715 09/229/22/11 7:15 9/23/11 14:05 30.8 0.3 800 8,696,951 8,997,974 301,023 Rialto 3 offline--low P shutdown (PSH-201) @ 1323 09/22; restart @ 1353 09/23
9/23/11 14:05 9/24/11 0:00 9.9 0.0 800 8,997,974 9,012,217 14,243 Rialto 3 offline--low P shutdown (PSH-201) @ 1442 09/23; could not restart9/24/11 0:00 9/25/11 0:00 24.0 0.0 800 9,012,217 9,012,217 0 Rialto 3 offline--high P diff/electrical problems9/25/11 0:00 9/26/11 0:00 24.0 0.0 800 9,012,217 9,012,217 0 Rialto 3 offline--pump motor repairs9/26/11 0:00 9/27/11 0:00 24.0 0.0 800 9,012,217 9,012,217 0 Rialto 3 offline--pump motor repairs9/27/11 0:00 9/28/11 0:00 24.0 0.0 800 9,012,217 9,012,217 0 Rialto 3 offline--pump motor repairs9/28/11 0:00 9/29/11 0:00 24.0 0.0 800 9,012,217 9,012,217 0 Rialto 3 offline--pump motor repairs9/29/11 0:00 9/30/11 0:00 24.0 0.0 800 9,012,217 9,012,217 0 Rialto 3 offline--pump motor repairs9/30/11 0:00 10/1/11 0:00 24.0 0.0 800 9,012,217 9,012,217 0 Rialto 3 offline--pump motor repairs
TOTAL: 8.9 10,261,178
Comments
TOTAL
Time Duration (hrs)
Flow Setpt (GPM)Water Totalizer
Water Processed (G)Runtime
(days)

ESTCP Project No. ER-1168 ARA Project No. 001060
C-8
October 2010
Start FinishDate/Time Date/Time Initial Final
10/1/11 0:00 10/2/11 0:00 24.00 0.0 800 9,012,217 9,012,217 0 Rialto 3 offline--pump motor repairs10/2/11 0:00 10/3/11 0:00 24.00 0.0 800 9,012,217 9,012,217 0 Rialto 3 offline--pump motor repairs
10/3/11 0:00 10/4/11 0:00 24.00 0.0 800 9,012,217 9,012,217 0WBA IX system offline--not permitted to restart due to foreign materials in
Siemens resin beds
10/4/11 0:00 10/5/11 0:00 24.00 0.0 800 9,012,217 9,012,217 0WBA IX system offline--not permitted to restart due to foreign materials in
Siemens resin beds
10/5/11 0:00 10/6/11 0:00 24.00 0.0 800 9,012,217 9,012,217 0WBA IX system offline--not permitted to restart due to foreign materials in
Siemens resin beds
10/6/11 0:00 10/7/11 0:00 24.00 0.0 800 9,012,217 9,012,217 0WBA IX system offline--not permitted to restart due to foreign materials in
Siemens resin beds
10/7/11 0:00 10/8/11 0:00 24.00 0.0 800 9,012,217 9,012,217 0WBA IX system offline--not permitted to restart due to foreign materials in
Siemens resin beds
10/8/11 0:00 10/9/11 0:00 24.00 0.0 800 9,012,217 9,012,217 0WBA IX system offline--not permitted to restart due to foreign materials in
Siemens resin beds
10/9/11 0:00 10/10/11 0:00 24.00 0.0 800 9,012,217 9,012,217 0WBA IX system offline--not permitted to restart due to foreign materials in
Siemens resin beds
10/10/11 0:00 10/11/11 1:30 25.50 0.0 800 9,012,217 9,012,217 0WBA IX system offline--not permitted to restart due to foreign materials in
Siemens resin beds10/11/11 1:30 10/12/11 9:15 31.75 0.9 800 9,012,217 9,992,194 979,977 Start up system 10/11 @ 133010/12/11 9:15 10/13/11 16:20 31.08 0.8 800 9,992,194 10,887,172 894,978 Rialto 3 offline--low P shutdown (PSH-201) @ 1441 10/12; restart @ 2251 10/1210/13/11 16:20 10/14/11 10:03 17.72 0.0 800 10,887,172 10,896,365 9,193 Rialto 3 offline--low P shutdown (PSH-201) @ 1236 10/13; restart @ 1003 10/1410/14/11 10:03 10/15/11 11:12 25.15 0.2 800 10,896,365 11,175,254 278,889 Rialto 3 offline--low P shutdown (PSH-201) @ 1534 10/14; restart @ 1105 10/15
10/15/11 11:12 10/16/11 15:02 27.83 0.9 800 11,175,254 12,192,411 1,017,157Rialto 3 offline--high P shutdown (Line Over Pressure) @ 1153 10/15; restart @
1812 10/1510/16/11 15:02 10/17/11 9:58 18.93 0.8 800 12,192,411 13,104,107 911,696
10/17/11 9:58 10/18/11 18:40 32.70 1.3 800 13,104,107 14,628,409 1,524,302Rialto 3 offline--low flow (FT-101 IX Feed Low Low) @ 1101 (County/Siemens
unscheduled maintenance); restart @ 1148 10/1710/18/11 18:40 10/19/11 9:25 14.75 0.3 800 14,628,409 14,955,079 326,670 0128 10/19 Treated Water pH LoLo--strainer clogged; restart @ 0910 10/1910/19/11 9:25 10/20/11 16:20 30.92 1.0 800 14,955,079 16,149,404 1,194,32510/20/11 16:20 10/21/11 15:45 23.42 1.0 800 16,149,404 17,248,926 1,099,522 10/21 1510 treated water pH LoLo--soda ash out; restart 1605 10/2110/21/11 15:45 10/22/11 7:05 15.33 0.6 800 17,248,926 17,970,806 721,880 Shutdown--soda ash pumps leaking10/22/11 7:05 10/23/11 7:00 23.92 0.0 800 17,970,806 17,970,806 0 Troubleshooting soda ash pumps10/23/11 7:00 10/24/11 7:00 24.00 0.0 800 17,970,806 17,970,806 0 Troubleshooting soda ash pumps10/24/11 7:00 10/25/11 7:00 24.00 0.0 800 17,970,806 17,970,806 0 Troubleshooting soda ash pumps10/25/11 7:00 10/26/11 7:00 24.00 0.0 800 17,970,806 17,970,806 0 Soda ash static mixer/injector damaged during troubleshooting10/26/11 7:00 10/27/11 7:00 24.00 0.0 800 17,970,806 17,970,806 0 Down10/27/11 7:00 10/28/11 7:00 24.00 0.0 800 17,970,806 17,970,806 0 Down10/28/11 7:00 10/29/11 7:00 24.00 0.0 800 17,970,806 17,970,806 0 Down10/29/11 7:00 10/30/11 7:00 24.00 0.0 800 17,970,806 17,970,806 0 Down10/30/11 7:00 10/31/11 7:00 24.00 0.0 800 17,970,806 17,970,806 0 Down10/31/11 7:00 11/1/11 0:00 17.00 0.0 800 17,970,806 17,970,806 0 Down
TOTAL: 7.8 8,958,589
Comments
TOTAL
Time Duration (hrs)
Flow Setpt (GPM)Water Totalizer
Water Processed (G)Runtime
(days)

ESTCP Project No. ER-1168 ARA Project No. 001060
C-9
November 2010
Start FinishDate/Time Date/Time Initial Final
11/1/11 7:00 11/2/11 7:00 24.0 0.0 800 17,970,806 17,970,806 0 Broken soda ash static mixer11/2/11 7:00 11/3/11 7:00 24.0 0.0 800 17,970,806 17,970,806 0 Broken soda ash static mixer11/3/11 7:00 11/4/11 7:00 24.0 0.0 800 17,970,806 17,970,806 0 Broken soda ash static mixer11/4/11 7:00 11/5/11 7:00 24.0 0.0 800 17,970,806 17,970,806 0 Broken soda ash static mixer11/5/11 7:00 11/6/11 7:00 24.0 0.0 800 17,970,806 17,970,806 0 Broken soda ash static mixer11/6/11 7:00 11/7/11 7:00 24.0 0.0 800 17,970,806 17,970,806 0 Broken soda ash static mixer11/7/11 7:00 11/8/11 7:00 24.0 0.0 800 17,970,806 17,970,806 0 Broken soda ash static mixer11/8/11 7:00 11/9/11 7:00 24.0 0.0 800 17,970,806 17,970,806 0 Broken soda ash static mixer11/9/11 7:00 11/10/11 7:00 24.0 0.0 800 17,970,806 17,970,806 0 Broken soda ash static mixer
11/10/11 7:00 11/11/11 7:00 24.0 0.0 800 17,970,806 17,970,806 0 Static mixer repaired; reservoirs are full--CR#3 offline/unable to startup11/11/11 7:00 11/12/11 7:00 24.0 0.0 800 17,970,806 17,970,806 0 CR#3 offline/unable to startup11/12/11 7:00 11/13/11 7:00 24.0 0.0 800 17,970,806 17,970,806 0 CR#3 offline/unable to startup11/13/11 7:00 11/14/11 12:25 29.4 0.0 800 17,970,806 17,983,284 12,478 Startup 11/14 @ 1225; forgot to turn on soda ash--offline @ 1304; restart @ 162411/14/11 12:25 11/15/11 8:45 20.3 0.7 800 17,983,284 18,839,194 855,910
11/15/11 8:45 11/16/11 7:00 22.2 0.2 800 18,839,194 19,030,498 191,304CR3 offline @ 0945 11/15 for testing; restart @ 1045; CR3 offline @ 1335--UV
lamps out11/16/11 7:00 11/30/11 7:00 336.0 0.0 800 19,030,498 19,030,498 0 CR3 offline; unable to restart
TOTAL: 0.9 1,059,692
Comments
TOTAL
Time Duration (hrs)
Flow Setpt (GPM) Water Totalizer Water Processed (G)Runtime (days)
December 2010
Start FinishDate/Time Date/Time Initial Final
12/1/11 7:00 12/2/11 7:00 24.0 0.0 800 18,839,194 18,839,194 0 CR3 offline; UV lamp problems12/2/11 7:00 12/3/11 7:00 24.0 0.0 800 18,839,194 18,839,194 0 CR3 offline12/3/11 7:00 12/4/11 7:00 24.0 0.0 800 18,839,194 18,839,194 0 CR3 offline12/4/11 7:00 12/5/11 7:00 24.0 0.0 800 18,839,194 18,839,194 0 CR3 offline12/5/11 7:00 12/6/11 7:00 24.0 0.0 800 18,839,194 18,839,194 0 CR3 offline12/6/11 7:00 12/7/11 7:00 24.0 0.0 800 18,839,194 18,839,194 0 CR3 offline12/7/11 7:00 12/8/11 7:00 24.0 0.0 800 18,839,194 18,839,194 0 End of Demo
TOTAL: 0.0 0
Comments
TOTAL
Time Duration (hrs)
Flow Setpt (GPM)Water Totalizer
Water Processed (G)Runtime
(days)