Demonstrating the Operational Utility of Incident-Based ... · and communications network !hat...
49
U.S. Department of Justice Office ofJustice Programs Bureau ofJustice Statistics HtH Demonstrating the Operational Utility &Wl • of Incident-Based Data for Local Crime Analysis
Transcript of Demonstrating the Operational Utility of Incident-Based ... · and communications network !hat...

U.S. Department of Justice Office of Justice Programs Bureau ofJustice Statistics
HtH
Demonstrating the Operational Utility
&Wl •
of Incident-Based Data for Local Crime Analysis

-------------------------------- ---
Want on-line access to
Criminal Justice Databases, Software, Publications and Electronic Mail Services?
What Is the SEARCH-BBS?
The SEARCH-8RS is an electronic bulletin board system available fiee to criminal justice professionals nationwide -It's a national forum and communications network !hat gives you access to on-line databases, downloadable sof~Nare, indispensable justice publications, electronic mail message areas, and the Internet • The SEARCH-BSS is a service of SEARCH, The National Consortium for Justice Information and Statistics, and Is funded by the Bureau of Justice Statistics, U.S. Department of Justice
Then call the SEARCH·BBS! 9161392-4610
How Can I Use the SEARCH-BBS? How to Reach Us
The SEARCH-BSS offers a range of benefits to Any justice nrofesslonal with a computer, a you and other criminal justice professionals • Databases -There is on-line access to databases containing criminal justice employment listings, calendar of events, law enforcement planning abstracts, and lists of criminal justice-related BBSs nationwide· Automated Index • You can access the Automated Index of Criminal Justice Information Systems, a database containing profiles of automated Criminal justice agencies and descriptions of computerized information systems deSigned specifically for use by justice agencies. The Automated Index enables you to quickly identify public domain and commercial software systems that meet speCific needs, and to identify agencies with practical experience with those systems • Software • The SEARCH-BBS provides for easy downloading of hundreds of public domain and shareware software programs designed spE'cifically for criminal justice applications' Publications' Selected articles from national publications, such as the FBI Law Enforcement Bulfetin, are available on-line • U.S. Supreme Court Decisions' As soon as U.S. Supreme Court decisions are handed down, they are avaiiable on-line via the SEARCH-BBS • Information Exchange· Through national electronic mail services and public forums, you can 'chat" with criminal justice colleagues nationwide, exchanging information, sharing resources, and receiving and providing technical assislance
modem and a communications package can reach the SEARCH-BBS 24 hours a day, 7
days a week • The SEARCH-BBS supports modems of 1200, 2400, 4800 and 9600 bits per second (v.32 and v.42 compatible)
1. Set your system parameters to:
.t 8 data bits
.t 1 stop bit
.t No parity
2. Dial 916/392-4640
3. Log on to the SEARCH-BBS
The menu-driven system is easy to use, and first·time callers may register on-line
for more information, call SEARCH 01 916/392.;2550

U.S. Department of Justice Office of Justice Programs Bureau of Justice Statistics
Demonstrating the Operational Utility of Incident-Based Data for Local Crime Analysis:
Reporting Systems in Tacoma, \Vashington, and New Bedford, Massachusetts
June 1994, NCJ-14S860
U.S. Department of Justice National Institute of Justice
145860
This document has been reproduced exactly as received from the person or organization originating it. Points 01 view or opinions stated in this document are those of the authors and do not necessarily represent the official position or policies of the National Institute of Justice.
Permission to reproduce this I a material has been granted by
PUbLic Domain/OJP/BJS u.s. Department of Justice
to the National Criminal Justice Reference Service (NCJRS).
Further reproduction outside of the NCJRS system requires permission 01 the I II !'Owner.

U.S. Department of Justice Office of Justice Programs Bureau of Justice Statistics
Lawrence A. Greenfeld Acting Director
Acknowledgements. This report was prepared by SEARCH, The National Consortium for Justice Information and Statistics, Dr. Francis J. Carney Jr., Chairman, and Gary R. Cooper, Executive Director. The project director was David J. Roberts, Deputy Director, Programs. The report was written by David J. Roberts and Seth F. Jacobs, Director, Re&earch and Statistics Program. Support was provided by Twyla R. Cunningham, Manager, Corporate Communications, and Jane L. Bassett, Publishing Assistant. This report was made possible by the kind cooperation of the New Bedford, Massachusetts Police Deprutment and the Tacoma, Washington Police Department. The project was conducted under the direction of Paul D. White, Program Manager, Bureau of Justice Statistics.
Report of work performed under BJS Grant No. 90-BJ-CX-K005, awarded to SEARCH Group, Inc., 7311 Greenhaven Drive, Suite 145, Sacramento, California 95831. Contents of this document do not necessarily reflect the views or policies of the Bureau of Justice Statistics, the U.S. Department uf Justice, the New Bedford, Massachusetts Police Department or the Tacoma, Washington Police Department. Please note that software products mentioned in this report may be trademarks of their respective companies.
Copyright © SEARCH Group, Inc. 1994
The U.S. Department of Justice authorizes any person to reproduce, publish, translate or otherwise use all or any part of the copyrighted material in this publication with the exception of those items indicating they are copyrighted or reprinted by any source other than SEARCH Group, Inc.
if Demonstrating the Operational Utility of Incident-Based Datafor Local Crime Analysis

Contents
List of tables ... e ••••••••••••••••••••••••••••••••••••••••••••••••••••••• " •••• 8 ••••••••••••••••• " •••••• v
List of figures .................... " .. " .............................. "~ .... ".,, .................... o ••• vi
Foreword ................. c •• _ ••••••••••••••• a ••••••••••••••••••••••••••••••••••••••• e ••••••••••••••••• vii
I. Introduction ...... ,u, •••••••• Q •••••••••••••••••••••••• O~ ••••••••••••••••••••••••••••••••••••• O ••••• 1 Project overview ............................................................................ 2
Background ................................................................................... 2 The UCR program ..................................................................... 2 The NIBRS program ................................................................. 3
Use of crime analysis by law enforcement. ................................... 4
IT. Crime analysis survey ......... a ..... u' ................. ct .................................. 7 Sample ........................................................................................... 7
Response rates ............................................................................... 7
Findings ......................................................................................... 8 Percentage of police agencies with crime analysis units ........... 8 Training needs ........................................................................... 10 Crime analysis data ................................................................... 11 Products and services ................................................................ 12 Software ........................................................... , ........................ 13 Dissemination and use ............................................................... 14 Unit structure ............................................................................. 14'
Summary and conclusions ............................................................. 15
ID. Site analyses ... 'J ••• & ••••••••••••••••••••••••••••••••••••••••••••••••••••••••••• " ••• 0,.. •••••••••• 17 Overvie"" ....................................................................................... 17
Limitations of official data ............................................................ 17
Demonstrating the Operational Utility 0/ Incident-Based Data/or Local Crime Analysis iii

Tacoma, Washington ..................................................................... 18 Site goals ....................... " .. " .... " ........ " ...................................... 18 Data system ....... " ...................................................................... 18
- Data obtained from LESA/CLEAR .............................. 18 - Time series analysis ..................................................... 19
Findings ..................................................................................... 19 - Overview of robberies in Tacoma ................ , ............... 19 - i';me series results ........................................................ 20 - Routine forecasts .......................................................... 20 - Exception reporting ...................................................... 21 - 38th Street corridor ....................................................... 24
New Bedford, Massachusetts ........................................................ 25 Site goals ................................................................................... 25 Data system ................... " .......................................................... 25 Findings ..................................................................................... 25
- Probability of return ..................................................... 26 - Geographic clustering .................................................. 26 - Three-dimensional display ........................................... 28
Summary of site analyses .............................................................. 30
IV. Discussion and conclusion .................... ee ...................................... 33
Appendix: Software used by crime !analysis units ............................ 35
iv Demonstrating the Operational Utility of Incident-Based Data for Local Crime Analysis

List of tables
1. The NIBRS Group A offenses ............................... 3
2. The NIBRS Group B offenses ...................... ' ......... 4
3. Response rate by agency size ................................. 8
4. Size of agency and crime analysis units ................ 9
5. Agency interest in crime analysis unit.. ................. 9
6. Sourc~s of crime analysis data ............................. 11
7. Number of data sources ....................................... 11
8. Frequency of products and services ..................... 12
9. Type of software used .......................................... 13
10. Dissemination of crime analysis products ........... 14
11. Use of crime analysis products ............................ 14
12. Rank of crime analysis unit head ......................... 15
13. Staff background of crime analysis unit .............. 15
14. Robberies by day of week, Tacoma ..................... 19
15. Robberies by time of day, Tacoma ...................... 19
16. Robberies by location, Tacoma ............................ 19
17. Distribution of calls by address, New Bedford .... 25
Demonstrating the Operational Utility of Incident-Based Data for Local Crime Analysis v

List of figures
1. Training needs ...................................................... 10
2. Number of robberies per week, Tacoma .............. 20
3. Number of fitted versus actual robberies per week, Tacoma ................................................ 21
4. Control chart of robberies per week, Tacoma ...... 23
5. Number of robberies per week in the 38th Street corridor, Tacoma ....................................... 24
6. Probability of return by number of dispatches to an address, New Bedford ................................. 26
7. Geographic distribution of drug offenses, New Bedford ........................................................ 27
8. Close-up of drug offense Cluster 1, with schools, New Bedford .................................. 29
9. Three-dimensional display of drug offenses, New Bedford ........................................................ 31
vi Demonstrating the Operational Utility of Incident-Based Datafor Local Crime Analysis

Foreword
In 1991, the Fedeml Bureau of Investigation began moving from compiling summary counts of crime statistics under its Uniform Crime Reporting (VCR) program to a more comprehensive and detailed reporting system known as the National Incident-Based Reporting System (NIBRS). It is expected that a large number of the 17,000 local and State law enforcement agencies in the Nation will report their crime statistics to NIBRS by the end of 1994. NIBRS offers a crime reporting program that captures data substantially more comprehensive, significantly richer in complexity, and considerably broader in scope than the aggregate-based UCR system. The traditional UCR system provides raw counts of incidents and arrests in a jurisdiction. NIBRS, on the other hand, provides a wealth of details about offenses, victims, offenders and the environment in which they interact. NIBRS data are expected to enhance crime analysis and provide better statistics for crime fighting at the local, State, and national levels. Ultimately, NIBRS will replace UCR as the source of official FBI counts of crimes reported to law enforcement agencies.
In order to encourage State and local law enforcement agencies to participate in NIBRS, the Federal government is undertaking an effort to demonstrate the ut.ility of NIBRS data for local agency management and administrative decision making; for strategic and tactical crime analysis; and for addressing the specific information needs of community-based and problemoriented policing. This report is part of that effort. The potential for effective crime analysis at the local level has grown significantly in recent years, particularly due to the dramatic advances made in computer hardware, analytic packages, and information sources. Law enforcement agencies now have access to powerful microcomputers and sophisticated software packages. This technology, combined with the increasing focus on communitybased approaches to crime resolution, means that the criminal justice system is well-poised to reap the 1. ~nefits of crime analysis.
This report involved the cooperation of the Tacoma, Washington, and New Bedford, Massachusetts Police Departments. Each department identified specific crime problems in their communities that they wanted addressed - strong-arm and commercial robbery trends in Tacoma, and drug offense hot-spots in New Bedford. Each department
then provided automated, incidentbased data gleaned from their operational CAD (computer-aided dispatch) and records management systems, both of which are useful sources of data for NIBRS reporting. These incident-based data were then subjected to sophisticated analyses, which in tum produced findings directly relevant to each department's decisionmaking needs. By identifying community-specific crime analysis objectives and analyzing the incident-based data of these police departments, this project provides tangible examples of analyses that are possible with NIBRS-capable local systems. This proje.::t also shows that crime analysis units can productively convert incident-based data into relevant information for managerial, administrative, tactical, and strategic decisionmaking.
BJS has long encouraged the development of crime analysis units, as well as the implementation of automated, incident-based r(,,cords management systems. By demonstrating the ways in which NIBRS-capable, incident-based data can address the specific information needs of communitybased policing, we hope to encourage and support NIBRS participation in law enforcement agencies nationwide.
Lawrence A. Greenfeld Acting Director Bureau of Justice Statistics
Demonstrating the Operational Utility of Incident-Based Datafor Local Crime Analysis vii

I. Introlduction
TneNational Incident~Based Reporting System (NIBRS) offers a crime reporting program that will be more comprehensive, detailed, accurate, and flexible than the earlier, aggregate-based Uniform Crime Reporting (UCR) program. N1BRS will dramatically enhance the capacity for crime analysis at the local, State, and Federal levels, putting law enforcement agencies in a better position to define their needs, justify expenditures, and allocate existing resources for maximal effectiveness and efficiency. The possibility of fully exploiting the potential of NIBRS research, however, depends on three factors: the extent to which incident-based reporting can be integrated into agency records management systems, the value of the data collected to the local agency, and the ease of meeting NIBRS data reporting standards.
Recognizing the need for changes in the aggregate-based UCR program, the Bureau of Justice Statistics (BJS), U.S. Department of Justice, has taken several steps to support, encourage and guide the development of a national incidentbased reporting system. In 1982, BJS provided funding for an examination of the existing UCR program, its history, objectives, data elements, and relationships with other systems. In 1984, the second phase of this project began, with the goal of identifying available options and recommending changes.1 Beginning in
1 U.S. Department of Justice, Federal Bureau of Investigation and Bureau of Justice Statistics, Blueprintfor the Future of the Uniform Crime Reporting Program: Final Report of the UCR
1988. the third phase produced specifications for collecting and submitting data, as well as approaches to implementing the system.2 From 1987 through 1991, BJS provided support to 40 State UCR programs in their implementation of chan~es required to participate in NIBRS.
Although considerable planning has been done and considerable progress has been made, much remains to be done before NlBRS will be adopted by local law enforcement agencies throughout the Nation. One way to encourage local agencies to participate in NIBRS is to demonstrate how incident-based reporting systems
Study, by Eugene C. Poggio, et aI., Abt ASSClciates (Washington, D.C.: Government Printing Office, May 1985). Hereafter, Blueprint report.
2U.S. Department of Justice, Federal Bureau of Investigation, National Incident-Based Reporting System, Volume 1: Data Collection Guidelines (Washington, D.C.: Govenunent Printing Office,July I, 1988); U.S. Department of Justice, Federal Bureau of Investigation, National IncidentBased Reporting System, Volume 2: Data Submission Specifications (Washington, D.C.: Government Printing Office, May 1992); and U.S. Department of Justice, Federal Buteau of Investigation, National IncidentBased Reporting System, Volume 3.' Approaches to Implementing an Incident-Based Reporting (IBR) System (Washington, D.C.: Government Printing Office, JUly 1, 1992).
3U.S. Department of Justice, Office of Justice Programs, Bureau of Justice Statistics, Bureau of Justice Statistics Application Information.' Fiscal Year 1992 Programs (Washington, D.C.: Government Printing Office, February 1992) p. 28.
can meet their needs for management and administrative information, as well as for crime analysis. As departments implement automated, incident-based records management systems for their own use, they should also be able to meet the data standards for NIBRS, since local departments typically need substantially more comprehensive and detailed data than are required in the national NIBRS system. Such an approach will enhance the crime analysis capabilities of local police departments while building their capacity to participate in NIBRS, thereby increa~;ing the scope, completeness, and value of NIBRS at the State and Federallevels.4
4rhis project is consistent with a resolution unanimously passed by the SEARCH Membership Group on May 7, ".987, in Baltimore, Maryland: "SEARCH Group, Inc. reaffirms its support for incident-based Uniform Crime Reporting. Recognizing the importance of broadbased support and acceptance of the incident-based UCR program by law enforcement agencies, SEARCH Group recommends that the Bureau of Justice Statistics and the Federal Bureau of Investigation immediately undertake a program to document the benefits of incident-based UCR to law enforcement agencies, as well as policy decisionmakers. This documentation should take the form of r~ports and innovative audiovisual presentations (for example, slideshows, films, and videotapes), and should demonstrate the administrative, management, and crime analytic capabilities of the data for local and State agencies. In the design of this program, State and local law enforcement administrators, researchers, policymakers, and other users of the data should play an active role:'
Demonstrating the Operational Utility oj Incident-Based Datajor Local Crime Analysis Page 1

Project overview
To encourage local law enforcement agencies to participate in the NIBRS program, BJS supported a project conducted by SEARCH to demonstrate the usefulness of NIBRS data for strategic and tactical crime analysis at the local level. The project, of which this report is a component, was designed to: 1) demonstrate crime analytic models which use NIBRS data elements to address issues relevant to local agencies; 2) identify and utilize additional data or infonnation systems which enhance the crime analytic potential ofNIBRS data; 3) identify and demonstrate a variety of software systems which have application to local crime analysis; and 4) conduct a nationwide survey of crime analysis units.
The project included two primary activities: 1) conducting~' analysis of automated, incident~based crime data provided by two law enforcement agencies; and 2) conducting a national survey of crime analysis units.
By identifying communily~specific crime analysis objectives and analyzing the automated, incident~ based data of two police departments, this project provides tangible examples of analyses that are possible with NIBRS-capable local systems. By using actual data and focusing on problems identified by the departments, the analyses demonstrate how incident~ based data can address issues vital to local law enforcement officials.
The survey was designed to detennine the extent to which crime analysis units have been implemented in local law enforcement agencies, and to assess their characteristics and training needs. Since crime analysis units represent the organizational resources available locally to convert incident-based data into decision-relevant information, an overview of these units is essential to detennining how prepared agencies are to make use of the research potential ofNIBRS.
Background
The UCR program
The UCR program was established in 1929, and its structure has changed very little since then. UCR is a voluntary reporting program under which nearly 16,000 city, county, and State law enforcement agencies report data monthly to the Federal Bureau ofInvestigation (FBI) on the number of Part I offenses5 and Part I and Part II arrests that have occurred within their respective jurisdictions.6 In addition ta simple monthly tallies of the number of offenses and aITests, additional data
SThe original UCR program included seven Part I offenses: murder, rape, rob1:>ery, aggravated assault, bill'glary, larceny/theft, and motor vehicle theft. In 1979, arson was added to the list U.S. Department of Justice, Federal Bureau of Investigation, Crime in the United States, 1991 (Washington, D.C.: Government Printing Office, August 10, 1992) p. 1.
6Ibid, p. 376.
are captured on particular offenses,7 and data on age, sex, race, and ethnicity are captured on arrests. In nearly every State, a State agency reviews, edits, and compiles the data for statewide VCR reporting, and then forwards the data to the FBI for inclusion in national statistical compilations.
Although UCR data are used by researchers, legislators, municipal planners, the press, and the public, its structure severely limits how the data can be used. As an aggregate reporting program, the UCR produces counts of specific types of offenses, but it does not permit the examination of complex relationships among variables. Moreover, be.cause of the aggregate reporting stl1lcture, an individual offense cannot be linked to its associated arrest. Consequently, the ability to track criminal justice events from offense through arrest, or to analyze the relationship between offense characteristics and arrests, is limited. Detailed offense infonnation is collected only on the eight Part I offenses (also known as Index offenses). Even with these
7For example, the Supplementary Homicide Report captures data on the age, sex, race, and ethnicity of both offender and victim; the weapon used; the relationship between the victim and the offender; and the circumstances of the offense. For a detailed discussion of UCR reporting requirements, definitions, clatlsifications, scoring, and preparation of monthly reports, see: U.S. Department of Justice, Federal Bureau of Investigation, Uniform Crime Reporting Handbook (Washington, D.C.: Government Printing Office, 1991); and U.S. Department of Justice, Office of Justice Programs, Bureau of Justice Statistics, National1ncident-Based Reporting System: Using NIBRS Data to Analyze Violent Crime, Bureau of Justice Statistics Technical Report series (Washington, D.C.: Government Printing Office, October 1993).
Page 2 Demonstrating the Operational Utility of Incident-Based Datafor Local Crime Analysis

detailed data, however, reporting provisions of Lite VCR program obscure or ignore what may be a substantial volume of crime.8 For example, the "hierarchy rule" limits the reporting of multiple offenses that have been committed within the course of a single criminal incident to the single most serious offense.9 In a similar vein, the UCR program uses a "hotel rule," in which the burglary of multiple rooms within a single hotel are counted as a single burglary. 10
The NIBRS program
Several notable differences distinguish NIBRS from VCR -such as the ability to distinguish between attempted and completed crimes, expanded victim/offender relationship data, expanded data on the circumstances of an offense, and elimination of the hierarchy rule. The most important and fundamental difference, however, is that in NIBRS, individual records relating to each distinct crime incident and its associated arrestrather than monthly summaries -will be captured by local law enforcement agencies and submitted to State and Federal reporting programs. This is a
8Por a general discussion regarding the limitations of the UCR program, see Albert J. Reiss Jr., "Problems in fue Documentation of Crime" in A. L. Guenther, ed., Criminal Behavior and Social Systems (Chicago: Rand McNally, 1976) pp.11l-130.
9U.S. Departtnent of Justic;e, Federal Bureau of Investigation, Uniform Crime Reporting Handbook (Washington, D.C.: Government Printing Office. 1991) pp. 33-34. Offense seriousness is prescribed in the UCR program according to an ordinal ranking. ru; follows: criminal homicide, forcible rape, robbery, aggravated assault, burglary,larceny/theft, motor vehicle theft, and arson.
10n,id. p. 20.
significant shift in reporting practice. Rather than gathering summary statistics and raw counts of the number of crimes reported within a jurisdiction, NIBRS promises a wealth of detailed data on offenses, victims, and offenders. A summary-based system resembles a prefurmatted table of data, capable of addressing only a few questions. An incident-based system, on the other hand, represents a database, one which can be manipulated to address a variety of questions. By capturing these detailed data in an incidentbased reporting format (including a unique incident number), practitioners and researchers will be able to undertake sophisticated, mult,ivariate analyses of crime within a jurisdiction and link demographic and economic elata. By including the originating agency case (OAC) number, practitioners and researchers will be able to link these data to other databases that include the OAe identifier.
In addition to changing the fundamental reporting structure underlying crime and arrest data, NIBRS will also capture data on an expanded range of offenses, far beyond the eight Part I offenr;es. In NIBRS, there are 46 offenses for which incident and arrest information will be collected (referred to as Group A offenses), and 11 offenses for which only arrest information will be collected (referred to as Group B offenses).l1 (See Tables 1 and 2.)
llU.S. Depsrtme.nt ofJustice, Federal Bureau of Investigation, National Incident-Based Reporting System, Volume 1: Data Collection Guidelines (Washington, D.C.: Government Printing Office, 1988) pp. 10-11.
Derrwnstrating the Operational Utility 0/ Incident-Based Data/or Local Crime Analysis
Arson Assault offenses
Aggravated assault Simple assault Intimidation
Bribery Burglary/breaking and entering Counterfeiting/forgery Destruction/damage!
vandalism of property Drug/narcotic offenses
Drug/narcotic violations Drug equipment violations
Embezzlement Extortionlblackmail Fraud offenses
False pretenses/swindle/ confidence game
Credit card/A TM fraud Impersonation Welfare fraud Wire fraud
Gambling offenses Betting/wagering Operating/promoting!
assisting gambling Gambling equipment violations Sports tampering
Homicide offenses Murder/nonnegligent
manslaughter Negligent manslaughter Justifiable homicide
Kidnapin&/abduction Larc:eny/theft offenses
Pocket picking Purse snatching Shoplifting Theft from building Theft from coin-iJpcrated
machines Theft from motor vehi.cle Theft of motor vehicle
parts/accessories All other larceny
Motor vehicle theft Pornography/obscene material Prostitution offenses
Prostitution Assisting or promoting
prostitution Robbery Sex offenses, forcible
Forcible rape Forcible sodomy Sexual assault with an object Forcible fond!.ing
Sex offenses. nonforcible Incest Statutory rape
Stolen property offenses Weapon law violations
Table 1. The NI8RS Group A offenses
Page :3

Bad checks Curfew/loitering/vagrancy Disorderly conduct Driving under the influence Dnmkenness Liquor law violations Nonviolent family offenses Peeping Tom Runaway Trespassing All other offenses
Table 2. The NIBRS Group B offenses
Taken as a whole, these changes substantially increase the analytic potential of crime data. The incident-based structure means that the system will be more accurate, complete, and flexible than possible under the current UCR program. It will be easier to correct errors, utilize detailed edit checks, adjust for cleared offenses, and improve audit capabilities. It will be possible to correlate all variables included in each record, link an arrest record to its related offense record, and link records to other data systems. It also will be much easier to collect additional information as needed. 12
Many States throughout the Nation are at some stage of implementing the new NIBRS system,13 and several States have decided to enhance their incident-based reporting systems beyond the NIBRS standards, so as to meet their individual and sometimes unique information needs. For example, Arizona gives local agencies the option of supplying data on solvability factors. North Dakota
12BIueprint report, pp. 50-52. 13The FBI began accepting NIBRS
data in January 1989. As of November 1992, law enforcement agencies in six States (Alabama, Colorado, Idaho, Iowa, North Dakota, and South Carolina) supplied NIBRS data to the FBI.
has added data elements on victim characteristics and has expanded the location, offense, injury, and property description codes. New York's system will enable local agencies to provide victim/offender relationship data for a greater number of offenses. 14 While only the data required for national participation in NIBRS will be forwarded to the FBI, these States have decided to apply the advantages of incident-based reporting to their own systems.
One of the primary uses to which incident-based data will be put is to support crime analysis by local law enforcement agencies. An incidentbased reporting system will provide the raw data needed by local agencies to identify "hot spots" of criminal activity, target emerging crime trends, and guide patrol deployment decisions. These are just a few of the ways incidentbased data could be used to support crime analysis.
Use of crime analysis by law enforcement
Crime analysis refers to the use of data routinely collected by an agency to support police operations through strategic planning, manpower deployment and
14Information regarding each State's implementation (or planned implementation) of the NIBRS program was obtained from a survey conducted in June 1992 by SEARCH. A letter was sent to the UCR director of each Slate, requesting information on the status of NlBRS imp].:;mentation and the extent to which the State's incident-based reporting standards exceed the national NlBRS standards. Of the 54 surveys sent out (50 States, plus the District of Columbia, Guam. Puerto Rico, and the U.S. Virgin Islands), 45 were returned, for a response rate of 83%.
investigative assistance.15 Crime analysis techniques can be traced as far back as 1896, to a system developed by Scotland Yard for classifying criminals by their modus operandi. 16 Since then, crime analysis has expanded to include the following types: crime pattern detection, crime-suspect correlation, target profile analysis, forecasting crime potential, exception reports, forecasting crime trends, and resource allocation.
15U.S. Department of Jill ,i~'e, Law Enforcement Assistance Administration, National Institute of Law Enforcement and Criminal Justice, Police Crime Analysis Unit Handbook, by George A. Buck, et al. (Washington, D.C.: Government Printing Office, November 1973) p. 1.
16Classification of offenders by their modus operandi can be useful to the extent individuals commit similar offenses using similar methods. Nearly 100 years ago, a former Commissioner of the London Police had this to say about the tendency of criminals to repeat their offenses:
Criminals, if they will pardon me for saying so, show a strange want of originality. The streets of London have thousands of pickpockets: they began to pick pockets, and they continue to pick pockets. The omnibus thief remains the omnibus thief; and u;e stealer of milk-cans steals milk-cans and nothing else. The stealer of dogs might surely diversify his program by occasionally stealing a cat; but no, the feline race concerns him not. With strange stupidity they freqllent the same line of omnibuses, return to the same streets, and, till Nemesis overtakes them. steal the same articles.
Lieutenant Colonel Sir Henry Slnith. K.C.B.. quoted in B {ackwood's Magazine. Source: Raymond Fosdick, European Police Systems (New York: The Century Co .• 1915) p. 338, note 2.
Page 4 Demonstrating the Operational Utility of Incident-Based Datafor Local Crime Analysis
• Crime pattern detection refers to the identification and monitoring of crimes which share specific characteristics, such as location or time of day.
• Crime-suspect correlation refers to the identification of suspects through a review of data files maintained on active offenders, such as career criminal files, suspect vehicles, telephone pen register logs, modus operandi files, field interrogation card files, and so forth.
• Target profile analysis refers to the analysis of detailed information on victims and premises so as to guide tactical responses " and crime prevention efforts. 17
• Forecasting crime potential refers to efforts to predict the time and location of future criminal events with sufficient precision and reliability to serve as a guide to tactical operations.
• Exception reports are a type of early warning system under which the appropriate agency's personnel are alerted when the volume of crime exceeds its normal range.
17The Waycross, Georgia Police Department uses data obtained from its crime analysis unit to design its baited vehicle operations (which involves placing valuable objects in a vehicle in a high crime area and keeping the vehicle undf'! surveillance). "Police Practices~ Baited Vehicle Detail," FBi Law Enforcement Bulletin (May 1991) pp.24-25.
• Forecasting crime trends is the analysis of incidents in order to predict long-term crime trends for an agency. (It differs from forecasting crime potential in that it is not specific enough to serve as a guide to tactical operations.)
• Resource allocation refers to analyses designed to make the most effective use of the agency's personnel.18
Several Federal init,ativcs have been designed to encourage the development of crime analysis units. From 1975 to 1980, the Law Enforcement Assistance Administration (LEAA) provided funding to police departments to support Integrated Comprehensive Apprehension (lCAP) programs, which included supporting the 6eveloBment of crime analysis units.1 From 1986 to 1992, the U.S. Department of Justice had a funding program, Implementation of the National-Incident Based Reporting System.20 Under this
18Samson K. Chang, et al., Crime Analysis System Support: Descriptive Report of Manual and Automated Crime Analysis Functions (Gaithersburg, Maryland: International Association of Chiefs of Police, May 1979) pp. xvi-xix. Hereafter, Crime Analysis Functions report.
19Lawrence Bennet, "Crime Analysis: A Management Challenge," Police Chief(October 1986) p. 71.
20U.S. Department of Justice, Office of Justice Programs, Bureau of Justice Statistics, Announcement of Funding Program for implementation of the National incident-Based Reporting System (NiBRS), March 5, 1991.
program, BJS provided support to a<;sist the States in implementing the NIBRS program. Funds were used to purchase data processing equipmGlt (including microcomputers or minicomputers), as long as the equipment was used to process, analyze or publish NIBRS data. No State-matching funds were required, and 39 States and the District of Columbia received funds from this program.
Demonstrating the Operational Utility of Incident-Based Data for Local Crime Analysis PageS

II. Crime analysis survey
Many law enforcement agencies have established crime analysis units to identify hot spots of criminal activity, target emerging crime trends, and guide patrol deployment. For example, the Illinois State Police uses telephone pen register data, association charts, time series analysis, financial analysis, and other systems to support its intelligence operations, and is beginning to investigate the potential of using artificial intelligence for crime analysis.21 Even though the number of crime analysis units has grown dramatically in recent years, little is known about the characteristics of analysis units.
In 1991, a survey was conducted by SEARCH to obtain a broad overview of how crime analysis is practiced by law enforcement agencies throughout the Nation. Its purpose was to collect information which could be used by law enforcement administrators in establishing or enhancing a crime analysis unit. This information would also be useful to organizations interested in providing training or developing software for these units. The survey assessed how prevalent crime analysis tmits are, what their training needs are, the data used by their analysts, the products and services they produced, the hardware and software tools they employed, the use and dissemination of their crime analy:;is products, and their organizational structures.
21Letter from Sam W. Nolen. acting director. Illinois State Police. dated February 28. 1991.
Sample
A list of all law enforcement agencies in the United States was obtained from the U.S. Bureau of the Census. A representative sample of this list was obtained by selecting all agencies serving a population of 100,000 or more, as well as a random sample of agencies serving ati0pulation of less than 100,000. The survey mailing list included 1,208 agencies; of these, 709 agencies serve a population of 100,000 or more, while the remaining 499 agencies serve a population of less than 100,000.
On February I, 1991, surveys were sent to each of the 1,208 agencies, together with a cover letter describing the purpose of the survey, and a business reply envelope. A reminder postcard was mailed to all subjects two weeks later, and a follow-up mailing was sent to all nonresIJOndents two weeks after that. On April 12, 1991, a fmal follow-up mailing was sent to all nonrespondents.
22The list provided by the Census Bureau contained 19.201 entries. After excluding special law enforcement agencies that were unlikely to engage in crime analysis (for example. alcohol beverage controi agencies). 15.861 State. county. municipal, and township law enforcement agencies remained. from which the sample was drawn.
Response rates
Of the 1,208 agencies to which surveys were mailed, 29 were subsequently eliminated from the sample. Eigh~een of these agencies were sheriffs i departments whose responsibilities were limited to civil or correctional duties; seven surveys could not be delivered; and four agencies were eliminated for other reasons. From this revised sample of 1,179 agencies, responses were received from 810, for a response rate of 69%. (See Table 3.)
Demonstrating the Operational Utility of Incident-Based Datafor Local Crime Analysis Page 7

Sworn Deliverable Surveys Response personnel surveys returned rate
1-25 395 200 51% 26·50 102 67 66 51·100 133 93 70 101·500 389 313 80 501+ 144 129 90 Not reported. 16 8 50
Total delivered 1,179 810 69% Undeliverable 29 Total mailed 1,208
Table 3. Response rate by agency size
The response rate ranged from 90% for the largest agencies to 51 % for the smallest agencies. These response rates suggest that the surveys returned are representative of agencies throughout the country - especially for larger agencies -and thus the survey's findings accurately reflect the current status of crime analysis in law enforcement agencies.
Findings
Percentage of police agencies with crIme analysis units
A very basic item of information about crime analysis, and one for which there has been very little information, is the percentage of li!lw enforcement agencies that have established such units. The prevalence of these units demonstrates the extent to which law enforcement administrators re.cognize the value of crime analysis. It also implies that funding agencies should focus on encouraging the creation of these units and enhancing their capabilities. Almost half the agencies with 101 to 500 officers had crime analysis units, as did a quarter of those with 51 to 100
officers. (See Table 4.) About a third of all agencies with at least 51 officers expressed high interest in establishing a crime analysis unit. (See Table 5.)23
23The survey was intended to collect information regarding crime analysis un:ts and did not specifically inquire about crime- analysis conducted by other J1nits. Nevertheless, an additional 9% of the respondents indicated that while they did not have a fonnal crime analysis unit, their agency did conduct crime analysis. The organizational context of this analysis varied from the very informal (for example, "All officers are responsible for crime analysis'') to very structured contexts in which crime analysis was an ongoing responsibility of a unit whose primary function was not crime analysis.
Page 8 Demonstrating the Operational Utility of Incident-Based Datafor Local Crime Analysis

Does your agency have a crime analysis unit?
NUMBER OF SWORN PERSONNEL 1-25 26-50 51·100 101·500 500+ Total
No 93.5% 83.5% 75.3% 52.7% 36.5% 65.5% Yes 6.5 16.4 24.7 47.3 63.6 34.5
100.0% 100.0% 100.0% 100.0% 100.0% 100.0%
Valid number (200) (67) (93) (313) (129) (802) Mlsslng (8) Total (810)
Table 4. Size of agency and crime analysis units
How interested is your agency in establishing a crime analysis unit?
Interest ~UMefiR OE ~WOB~ EIiRSQ~Nj;L In a unit 1·25 26·50 51·100 101·500 500+ Total
Low 60.3% 48.1% 18.8% 24.4% 29.5% 39.3% Medium 29.9 37.0 50.0 43.1 31.8 37.7 High 9.8 14.8 31.3 32.5 38.6 23.0
100.0% 100.0% 100.0% 100.0% 100.0% 100.0%
Valid number (174) (54) (64) (160) (44) (496) Not applicable (279) Missing (35) Total (810)
Table 5. Agency Interest In crime analysis unit
Approximately a third of an law enforcement agencies have established a crime analysis unit Whether a specific agency will have a unit is strongly affected by the size of the agency. Agencies with 1 to 25 sworn personnel rarely have a crime analysis unit. while a majority of very large agencies (500 or more sworn officers) do have a separate unit for crime analysis.
Similarly, interest in establishing a crime analysis unit was mainly confined to the larger agencies. Only 15% of agencies with 26 to 50 sworn personnel had a high degree of interest in establishing a unit, in comparison with 31 % for agencies with 51 to 100 sworn personnel. This suggests that those agencies with more than 50 sworn personnel are likely to be the primary target audience for any ::.fforts to provide technical assistance in the forrr:ation of crime analysis units.
Of those agencies with plans to establish a crime analysis unit, the typical agency expected to establish their unit in about a year, but not all agencies very interested in establiShing a crime analysis unit had converted that interest into concrete plans. For example, 34% of the agencies that were very interested in establishing a unit did not have actual plans to do so, suggesting that they laclced the necessflI'Y resources to establish a unit.24
24Data on such plans are not shown in any table.
Demonstrating the Oper(ltional Utility 0/ Incident-Based Data/or Local Crime Analysis Page 9

Training needs
As greater numbers of criminal justice agencies become automated and seek to exploit the analytic potential inherent in their crime data, the need for training will increase. The crime analysis process - from the receipt of raw data to the production of a fmished report - often demands that the analyst be trained in a variety of technical areas. Even data provided in electronic form are often obtained from multiple sources and using different types of computer hardware and operating systems, so the submissions must still be processed before they can be analyzed. The correct cases must be selected, data errors must be corrected, and often the data must be reformatted
or trl'.nsformed. Once the data are ready, to conduct the analysis successfully, law enforcement personnel must be familiar with a variety of software packages, such as spreadsheets, databases, statistical packages, and geographic information systems (GIS, also known as computerized mapping).
Crime analysts have substantial training needs. The survey sought to identify the specific areas where training was most needed (data processing versus hardware, for example). Training needs for data processing, hardware, software, statistical techniques, crime analysis, computerized mapping, and report writing were measured on a four-point scale from low to medium, high, and very high. (See Figure 1.)
How great is the need in your unit for training in the following areas? (Very high; High; Medium; Low; Don't know)
DEGREE OF NEED 4 VelJl high
3.5
. AVERAGE TRAINING NEED
~ ,'3
2.5
2 Medium
1.5
1 Low
Oats Hardware Processing
Software Statistics Crime
Analysis
Figure 1. Training needs
GIS
The respondents indicated that the overall need for training was moderate, and that crime analysts are especially interested in advanced training. On a four-point scale, the average training need per agency over all skill areas was 2.6. General purpose skill areas, such as data processing, hardware, and report writing, were all below the mean, while specialized training needs areas, such as crime analysis, computerized mapping, and statistical techniques, were all above the mean, suggesting that the training needs are greatest in these areas.
Writing
Page 10 Demonstrating the Operational Utility of Incident-Based Datafor Local Crime Analysis

Crime analysis data
The source of crime analysis data - for instance, computer-aided dispatch (CAD), crime or arrest reports, field interrogation cards, and so forth - largely determines the type of issues that can be investigated. The data source can also have a strong impact on the effectiveness and efficiency of a crime analysis unit. The source determines the variables and cases available for analysis, the degree to which the data are formatted for analysis, and the completeness and accuracy of the data. The primary source of data is crime reports. (See Table 6.) Over half of the agencies, however, used four or more sources to collect their data. (See Table 7.)
Virtually all crime analysis units depend on crime reports as a data source. Arrest reports were also frequently used, as were field interrogation cards and CAD data. Rarely does a crime analysis unit rely solely on a single data source, or even just two data sources. The mean number of data sources used by crime analysis units was 3.6.25
Computer-aided dispatch data appear not to be utilized as frequently as might be expected, although CAD systems have several desirable characteristics as a source of data. First, they are automated and contain a complete record of all calls to the agency, including addresses and disposition of calls. Second, although the number of variables typically captured by a CAD system is limited, the fields are sufficient for many types of workload analysis and for identifying crime hot spots. Third, CAD records usually can be linked to crime and arrest report~ for additional analysis. Despite all
25These data are not shown in any table.
this, CAD data are used less frequently than crime, arrest, and field interrogation data.
One interpretation of this finding is that CAD data, although automated, are less accessible to crime analysis units than other types of data. Smaller departments frequently rely upon regional CAD systems to which the crime analyst may not have routine access. CAD systems frequently are not integrated with an agency's records management system. Analysts may not be familiar with the hardware, operating systems, software, and data structures used by the CAD system. Any of these factors could account for the relatively modest use of CAD data.
A challenge often facing crime analysts is preparing the data for analysis, which frequently requires manual review and coding of each report. The survey found that 76% of the crime analysis units have to manually process their data prior to analyzing it, and the typical unit spends 40% of its time doing just that. Participation in an incidentbased reporting program system does not significantly affect the amount of time spent manually processing data. While 59% of the departments participated in an incident-based UCR program and 41 % did not, each spent a similar amount of time mSlnually processing data.2b
26This question may not have been clear to all respondents, espccially to those belonging to an agency that participated in the aggregate UCR program but not an incident-based UCR program. Part of this confusion may have resulted from the fact that OCR functions and crime analysis functions are sometimes handled by different units.
Please indicate each data sOUrce used by your unit
Types of data
Crime reports A rrest reports Field Interrogation cards CAD Other
Valid number Missing
Percentage'
97.8% 86.7 74.8 65.8 36.0
(278) (1)
*Note: Percentages add to more than 100% because respondents could indicate more than one type of data.
Table 6. Sources of crime analysis data
Number of data sources Percentage
One 5.0% Two 10.1 Three 23.0 Four 42.4 Five 19.4
100.0%
Valid number (278) Missing (\)
Table 7. Number of data sources
The more data sources a department used, the more time its personnel spent manually processing data, although this relationship was weak. The percentage of lime spent processing data was not related to the degree to which agencies felt they needed additional training. That is, agencies that were spending much of their time manually processing data were no more likely to want additional training than were
Demonstrating the Operational Utility of Incident-Based Data/or Local Crime Analysis Page 11

agencies that spent little time manually processing data.27
Perhaps the data are processed manually because of a lack of
. equipment or software, rather than a lack of know ledge on establishing an electronic link with other database systems.
Some crime analysis units have encouraged line personnel to collect data in a form amenable to analysis. For example, the San Diego Police Department crime analysis unit has developed an Investigator's Notebook which simultaneously met a need of the department's investigators and dramatically improved the quality of data provided to the crime analysis unit. Kimberly Glenn of the department's crime analysis unit explains:
The ~nvestigator's Notebook is an aid to be used by investigators when interviewing witnesses. It contains pictures of every type of weapon , article of clothing. etc. So instead of having the witness describe a gun. the witness merely identifies a picture of it. This makes the investigator's job much easier. And since each picture is linked to a code, the investigator need only enter the code value in the report to completely describe the weapon. This makes his job easier and dramatically improves the quality of data provided to the crime
I · . "8 ana YSlS unlf.-
27None of the correlations between the percentage of time the crime analysis unit spent manually processing data and training needs was statistically significant at the .01 level.
28Kimberly Glenn, supervising administrative analyst, San Diego Police Department, speaking before the
Products and servlce~
Through the products and services they provide, crime analysis units contribute to the strategic and tactical decision making of a department. Although some products can be used for both strategic and tactical purposes, most products have a much narrower focus. An understanding of crime analysis units would be incomplete if it did not include an overview of the types of products and services produced by these units.
Incident recaps (a listing of selected items of information from several incidents with a similar modus OJ-zrandt) are provided daily by 30.9% of the units. Pin maps and case repurts were also often provided on a daily basis (25.6% and 23.5%, respectively). Statistical reports and trend information was often produced on a monthly basis (51.9% and 38.7%, respectively). Most crime analysis units provided four or five products and services to their agencies. (See Table 8.)
Please indicate the frequency with which your crime analysis unit provides each of the fol/owing products and services.
~BQI:1UQI Q8 S!;8~IQ!; Pin UCR Case Incident Statistical maps Trends reports reports I'ecaps reports
Dally 25.6% 9.4% 8.7% 23.5% 30.9% 13.4% Weekly 16.8 29.7 2.8 22.0 28.3 22.8 Monthly 9.5 38.7 60.9 20.4 15.1 51.9 Rarely 48.1 22.2 27.7 34.1 25.7 11.9
100.0% 100.0% 100.0% 100.0% 100.0% 100.0%
Valid number (262) (266) (253) (255) (265) (268) Missing (17) (13) (26) (24) (14) (11)
Table 8. Frequency of products and services
Research and Statistics Program Advisory Committee, SEARCH Group, Inc., July 16, 1991, in San Diego, California.
Case mgml.
17.4% 10.8 19.1 52.7
100.0%
(241) (38)
Page 12 Demonstrating the Operational Utility of Incident-Based Datafor Local Crime Analysis

One factor which may be related to the number of products and services provided by a crime analysis unit is the number of data sources to which it has access. Although the relationship between sources and services was weak, units with access to more data sources provided a greater number of products and services to their agencies.29
Software
In most cases, agencies felt that the software they were using was good or excellent. While there was slightly less satisfaction with crime analysis and GIS packages (perhaps due to their complexity), even with these packages, well over a majority of units thought that the systems they, were using were good or excellent. 32
Computerization is an essential element of modem crime analysis and 95% of all units had computerized their duties to at least some extent. In fact, it is hard to imagine effective crime analysis without computerization. Several statistical techniques are not practical without it, and the sheer volume of cases would overwhelm manual procedures in all but the smallest departments,30 Respondents were asked to identify which of eight types of software packages they used. Most units used a word processing package (usually WordPerfect), but nearly as many used a database package (usually dBASE). Statistical, crime analysis, and GIS packages were used less frequently. (See Table 9.)31
Please indicate Which of the fol/owing types of software are used by your crime analysis unit.
Word Spread- Data- Crime processing sheet base S~atlstlcs analysis
No 16.6% 38.5% 18.9% 54.3% 44.2% Yes 83.4 61.5 81.1 45.7 55.8
100.0% 100.0% 100.0% 100.0% 100.0%
Valid number (265) (265) (265) (265) (265) Not applicable (14) (14) (14) (14) (14) Missing (0) (0) (0) (0) (0)
Table 9. Type of software used
29The Pearson's product moment correlation (r = .2191) was significant at the .001 level, for a one-tailed test.
30For example, Sergeant Frederick Anselmo, who was assigned to the crime analysis unit of the New Bedford, Massachusetts Police Department both before and after it computerized, found that computerization dramatically improved the ability of the Department to conduct crime analysis, aIld to respond to questions from local officials about crime in their neighborhoods.
31 Many different software packages for each category were identified by survey respondents. Some categories were domi.-lated by one software product. These categories were (the
most popular packages are in parentheses): word processing \'N ordPerfect), spreadsheets (Lotus 1-2-3), database (dBASE), statiritics (SPSS), geographic information systems (MapInfo), and graphics (Harvard Graphics). In addition, 10 respondents indicated that systems were developed in-house to address statistical issues, while 19 indicated they had developed systems to address crime analysis issues.
32These data are not shown in any table.
Demonstrating the Operational Utility of Incident-Based Datafor Local Crime Analysis
GIS
58.9% 41.1
100.0%
(265) (14) (0)
Graphics
44.5% 55.5
100.0%
(265) (14) (0)
Page 13

Dissemination and use
The ultimate effectiveness of a crime analysis unit depends on the dissemination of its products and services to personnel capable of using them. The survey revealed that crime analysis products were almost always disseminated to patrol officers, detectives, and upper management. Even the public often had access to at least some crime analysis products. (See Table 10.)
Table 11 shows that crime analysis was most often used to provide general management information and to provide tactical support (for example, to identify related crimes and suspects). Table 11 also shows that crime analysis units often provide support for strategic decisions (for example, workload allocations and setting patrol boundaries), as well as providing information support for UCR reports, annual reports, and public relations. Thus, it appears that the responsibilities of crime analysis units often include broad administrative and reporting functions.
To whom are the proQucts of your unit routinely distributed?
Units receiving products Percentage
Detectives 94% Patrol 92 Upper management 92 Tactical unIts 63 Public 42
Note: All percentages are based on 279 cases. Percentages add to mom than 100% because respondents could indicate more than one category.
Table 10. Dissemination of crime analysis products
The category of public relations may include the use of cri~? . analysis to support the actlVlues of crime prevention officers in the department. Several law en- . forcement officials have descnbed how crime analysis could be an effective tool at neighborhood crime prevention meetings. A presentation that combined a visual display of crime incidents in the attendees' neighborhood, combined with tips on preventing crime and providing descriptions of suspects, was identified as an especially effective approach.33
33ChiefRichard Benoit and Sergeant Frederick Anselmo (New Bedford, Massachusetts Police Department), and Captain Bill Woodard (facoma, Washington, Police Department).
How are the products of your unit used?
How unit's productlll are used Percentage
General Information 92% Identify related crImes 87 Identify slJspects 85 Public relations 66 Annual reports 62 Workload allocation 53 UCR reports 50 Set patrol boundaries 44
Note: All percentages are based on 279 cases. Percentages add to more than 100% because respondents could indicate more than one category.
Table 11. Use of crime analysis products
Unit structure
Administrators face many choices when establishing a crime analysis unit.34 So as to obtain information regarding the typical structure of crime analysis units in the United States, the survey included questions on the number and type of personnel assigned to these units. This enables administrators to be guided by the experience of other agencies. Most crime analysis units have only a few staff and are typically headed by a sergeant or a lieutenant. Staff were most likely to include civilians and officers who had been assigned to patrol just prior to their transfer to the crime analysis unit. (See Tables 12 and 13.)
34Some agencies had more than one crime analysis unit. These agencies were asked to respond to the survey's questions as if all of the individ~al crime analysis units were combmed.
Page 14 Demonstrating the Operational Utility 0/ Incident-Based Data/or Local Crime Analysis

What is the rank or title of the unit head?
Rank of unit head Analyst Sergeant Lieutenant Captain Other
Percentage
5% 24 23 9
40
100%
Valid number (268) Missing (11)
Table 12. Rank of crime analysis unit head
To what units were the personnel in the crime analysis unit assigned just prior to their transfer to the r;rime analysis unit?
Staff background Percentage
Civilian 44% Clerical 25 Detective 28 Management 17 Patrol 44
Note: All percentages are based on 272 cases. Percentages add to more than 100% because respondents could indicate more than one category.
Table 13. Staff background of crime analysis unit
Summary and conclusions
Crime analysis has become an integral part of the operation of many law enforcement agencies. The typical unit has one or two analysts who blend data from a variety of sources - especially crime and arrest reports - and its products and services are oriented primarily toward tactical issues, although other uses are evident. It appears that crime analysis units could benefit from additional training and technical assistance opportunities. The greatest need is for an advanced course, focusing on GIS systems, statistical techniques, and crime analysis. To a lesser extent, a need also exists for training and technical assistance in more basic areas, such as data processing. hardware, software, and report writing.
The survey did not investigate the analytic potential of incident-based data; instead, it focused on existing practices of crime analysis units. The next section examines how incident-based data can be combined with statistical techniques and advances in infonnation technology to enhance crime analysis, and to improve the infonnation available to law enforcement administrators for their tactical and strategic decisionmaking.
Denwnstrating the Operational Utility of Incident-Based Datafor Local Crime Analysis Page 15

---- ---------- ._---------------- ---- --_. - --
III. Site analyses
A major component of this project was to demonstrate the crime anal~ ysis potential inherent in incidentbased data. Incident-based data of the type routinely collected by law enforcement agencies contain information relevant to many of the tactical and strategic decisions that administrators must make. 'Ibis report demonstrates the value of incident-based data for crime analysis by analyzing incident~ based data provided by local police departments to addresS important crime issues they have identified.
Overview
To demonstrate the potential of incident-based data to meet the practical needs of law enforcement agencies, SEARCH staff met with administrators and crime analysts from two police departments (Tacoma, Washington, and New Bedford, Massachusetts); reviewed the data presently collected and automated by those departments; examined current crime analytic procedures; identified tactical and strategic analytic objectives of each department; and obtained from each data mes pertinent to their analytic objectives.35
35Many departments were considered for inclusion in this project. Potential candidates were initially identified by State and Federal officials. The criteria used for the selection process included interest, degree of automation, quality of the information system, hardware and software used, the size of agency, and the number of offenses, as well as other factors.
SEARCH staff analyzed data from each department, using a variety of microcomputer-based software packages, and focused on identifying crime analytic models which have tactical and strategic utility for the departments. Following completion of the analyses, representatives from each department attended a briefing session on July 2, 1991, at the National Criminal Justice Computer Laboratory and Training Center, which is located at the SEARCH office in Sacramento.
Both the Tacoma and New Bedford departments were interested in technological developments which would enable their crime analysis units to exploit crime data more fully. The New Bedford Police Department was primarily interested in drug offenses, while Tacoma was primarily interested in strong-arm robberies. The type of data used to support the analyses (CAD records from New Bedford and crime reports from Tacoma) is collected by most law enforcement agencies. While some processing of the data was nec.essary to prepare the files for .analysis, the incidentbased data both departments had readily available were more than sufficient to support several types of crime analysis.36
36rhe data processing consisted of correcting data entry errors, converting abbreviations, reformatting data files, and geocoding street address information (geocoding refers to converting street information to longitude and latitude coordinates).
Limitations of official data
Crime analysis largely relies on official reports of crime and is therefore subject to all of the limitations associated with this type of data. A host of factors, including the seriousness of the offense and the victim-offenderrelationship, influence reporting practices. This means that known crimes are only a percentage of actual crimes.37 While official data are known to be incomplete, as long as the ratio of known to actual crimes is fixed, official data will identify changes in the amount of crime. It is changes or differences in the level of crime that are of primary concern to crime analysis. Although the ratio of known to actual crime may not be completely fIxed, in most cases, changes in the ratio will take place over a long period. Since crime analysis :3 frequently concerned with a narrow timeframe, in many instances it may be reasonable to assume that the ratio of known to actual crime is fIxed.
The quality of official data has been subject to long and vigorous debate. Partly in response to concerns about offIcial data, alternative measures have been developed (such as self reports and victimization surveys). Key to assessing the quality of official data for analytic purposes has been the degree to which these different sources of data on crime produce
37Leonard D. Savitz, "Official Police Statistics and Their Limitations," Crime in Society (New York: John Wiley & Sons, 1978) pp. 74-75. Hereafter, Crime in Society article.
Demonstrating the Operational Utility of Incident-Based Datafor Local Crime Analysis Page 17

similar or divergent results. Fortunately, it appears that official records, self-reports, and victimization surveys produce similar results, after adjusting for methodological differences between the techniques.38 Thus, official data can serve as an adequate representation of criminal activity and can playa central role in crime analysis by local law enforcement.
Tacoma, Washington
Site goals
The Tacoma Police Department was primarily interested in strong-arm and commercial robberies.39 Its crime analysis unit spends a considerable portion of its time on robberies, automating information from the general report and keying it into its own data files. By using standardized coding categories, the unit is able to conduct searches on a combination of fields and produce daily recap and weekly analysis reports, which it disseminates to patrol, detectives, crime prevention, and identification
38See Gwynn Nettler, Explaining Crime (New York: McGraw-Hill, 1978) p. 117. See also Crime in Society article, p. 78.
39 After SEARCH staff discussed the project with Captain Bob Woodard, the head of Tacoma's crime analysis unit, the department's assistant chief approved the project on September 14, 1990, and appointed Captain Woodard as the agency's contact person.
On September 28, 1990, SEARCH staff (Seth F. Jacobs) met with Captain Woodard; crime analysts Valerie C. Cruz and Juli Neher; Arnold H. Blaker, assistant director, Law Enforcement Support Agency (LESA); Bruce Jennison, systems development analyst, LESA; Donna Wendt, systems analyst, City Planning Department; and Bob Christensen. crime analysis consultant.
personne1.40 In particular, the department was interested in using incident-based data to study robbery patterns in the city, because a few areas of the city -particularly the Hilltop area and the 38th Street corridor - appeared to be suffering from substantial increases in robbery activity.
Data system
The primary source documents used by Tacoma's crime analysis unit are the incident and arrest reports produced by line personnel. These documents are forwarded to the crime analysis unit, which enters portions of the reports into its crime analysis data file. A second copy of these documents is forwarded from line units 10 the Law Enforcement Support Agency (LESA). LESA maintains the information systems utilized by the Tacoma Police Department and the Pierce County Sheriff's Department. The primary systems maintained by LESA include Computer Aided Dispatch (CAD), Consolidated Law Enforcement Automated Records (CLEAR), Criminal History Record Information (CRRI), and the Jail Information Management System (JIMS).
CLEAR is an incident-based system that captures data on all incidents for which a written report has been forwarded. Information captured by the CLEAR system includes: incident number, agency name, date and time of offense, location of offense, census block, district, domestic violence, victim and suspect information,
40Memorandwn dated October 19, 1990, from Juli Neher, Tacoma Police Department, to SEARCH staff Seth F. Jacobs.
relationship between victim and suspect, and offense information.41
- Data obtained from LESAICLEAR
The CLEAR system contained sufficient information to address issues of interest to the department, including the geographic distribution of robbery offenses as well as any robbery trends. LESA provided a file containing records for each offense that occurred in Tacoma from November 1, 1988, through October 31, 1990. Among other data, the CLEAR information included offense type; type of premise; weapon used; date, time, and location of offense; and victim and suspect information. The location of the robbery could be geocoded (converted to longitude and latitude coordinates) 76% of the time.
41lntroduction to Law Enforcement Support Agency System (unpublished report, Tacoma Police Department, no date).
LESA is in the process of implementing the Washington IncidentBased Reporting (WIBR) system, which is an expanded version of the NlBRS system. WIBR began with the NlBRS data set and expanded it to 131 variables - the expansion due mainly to incre.3Sed reporting on modus operandi data. Near the end of 1990, WIBR was undergoing testing. At that time, the CLEAR system collected approximately 50% of the planned 131 variables, while the forms had been modified to capture 80% of the variables specified in the WIBRS system. (Personal communication with Arnold Blaker, assistant director, LESA, September 28, 1990.)
Page 18 Demonstrating the Operational Utility of Incident-3ased Datafor Local Crime Analysis

- Time series analysis
Time series analysis can be used to address several questions of interest to law enforcement agencies.42 Time series analysis can discover patterns that enable the time series to be expressed as a mathematical model, which can then be used to forecast future values. Another function of time series analysis is to evaluate policy initiatives. For example, a time series analysis of armed robberies in Boston found that passage of a gun control law had no effect.43
Findings
- Overview of robberies In Tacoma
Before the results of the time series analyses are presented, a review of the summary statistics of Tacoma robberies will prove useful. There were 2,019 robbery incidents available for analysis from January 1, 1989, through October 31,1990. Information available on each robbery included the type of premise where the incident
42Time series anruysis refers to a class of analytic techniques which uses past patterns to predict future values of the time series. A time series is a set of observations of a single variable over a period of time, such as the number of robberies occurring each week for a year. In these observations, the time between each measurement is fixed and constant, and the time order of the observations is of prime importance. For more information, see: Charles VI. Ostrom, Jr. Time Series Analysis: Regression Techniques (Beverly Hills: Sage Publications, 1978) p. 9. See also SPSS, Inc., Trends (Chicago: SPSS Inc., 1987) p. A2.
43Richard McCleary and Richard A. Hay, Jr., Applied Time Series Analysis for the Social Sciences (Beverly Hills: Sage Publications, 1980) p. 110·121. Hereafter: Social Sciences Time Series Analysis report.
occurred, the weapon used, and the date and time of the robbery . Strong-arm robberies were the prevalent form of robbery, followed by handguns; a variety of weapons accounted for the remainder. Many of the robberies took place in public places, including parking lots, sidewalks, streets, and alleys. Businesses were also frequent targets: banks, convenience stores, grocery stores, restaurants. service stations, taverns, and so on. A v2riety of public and private premises accounted for the remainder of the robberies. The greatest number of robberies occurred at 2 a.m. Robberies were most likely to occur on Saturdays and Tuesdays. (See Tables 14, 15 and 16.)
Day of week Percentage
Monday 14% Tuesday 15 Wednesday 14 Thursday 13 Friday 14 Saturday 16 Sunday 14
100%
Valid number (2019) Missing (0)
Table 14. RobberIes by day of week, Tacoma
January 1, 1989· October 31, 1990
Demonstrating the Operational Utility 0/ Incident~Based Data/or Local Crime Analysis
Time of day Percentage
B.m. 12:01-1:00 8% 1:01-2:00 7 2:01-3:00 6 3:01-4:00 4 4:01-5:00 3 5:01-6:00 2 6:01-7:00 2 7:01-8:00 1 8:01-9:00 2 9:01-10:00 2 10:01-11:00 2 11:01-12:00 2
p.m. 12:01-1:00 3% 1:01-2:00 :3 2:01-3:00 4 3:01-4:00 4 4:01-5:00 5 5:01-6:00 4 6:01-7:00 5 701-8:00 6 8;01·9:00 6 9:01-10:00 7 10:01·11:00 8 11:01-12:00 6
100%
Valid number (2019) Missing (0)
Table 15. Robberies by time of day, Tacoma
January 1, 1989· October 31, '1990
Location Percentage
Alley 4% Bank 2 Convenience store 7 Grocery store 4 Restaurant 3 Service station 3 Sidewalk 9 Street 32 Tavern 1 Other 3S
100%
Valid number (2019) Missing (0)
Table 16. Robberies by location, Tacoma January 1, 1989· October 31, 1990
Page 19

40
35
30
25
20
15
10
5
o ~mHffffi~ffffi~ffffi~~~~mH~~~~~~~~~~
Week
Figure 2. Number of robberies per week, Tacoma January 1, 1989·0ctober 31, 1990
- Time series results
To determine whether there was a discernible structure or time ordering for robberies in Tacoma, a plot of the number of robberies by week is presented in Figure 2. This chart provides an initial view of the data, one from which obvious patterns can be detected and incorporated in the initial assessment of robbery patterns.
While the data have no clear overall trend, robberies were generally less frequent during 1990 than in 1989 - an exception being the pea.1e during weeks 85 to 90. No substaIltial increase in robberies occurred during summer or any other season, nor was there any sudden change in the series. Moreover, the number of robberies in one week was similar to the number of robberies in adjacent weeks (a circumstance known as autocorrelation) and was less related to the number of robberies
in more distant periods. These factors (trend, seasonality, and autocorrelation) can be incorporated into the forecast to improve its predictive accuracy. A review of the Tacoma data indicates that forecasts should be based primarily on the relatively strong autocorrelation and secondarily on the overall mean of the series, because no upward or downward trend is apparent in the data.
- Routine forecasts
A situation common in crime anlilysis h the need to routinely produce forecasts on many series on a regular basis. For example, a police chief might want to know how many Part I offenses to expect each week in each precinct. If there are 10 precincts, this would require a crime analyst to generate 80 forecasts each week (10 precincts multiplied by eight Part I offenses). Exponential smoothing is a prediction technique appropriate
when a large number of predictions is required. An advantage of exponential smoothing is that once a satisfactory model has been selected, forecasts can be generated quickly and easily.44 The technique can be useful when routine forecasting on many series is called for, a common situation in crime analysis.
Exponential smoothing works by filtering out the more erratic components of a series, leaving a more structured representation of the data, which is easier to understand and can be used to make forecasts. Autocorrelated time series, such as this robbery series, are often good candidates for smoothing techniques. The result of the exponential smoothing operation is displayed in Figure 3, overlaid with the original data series.45
44SPSS, Inc., Trends (Chicago: SPSS Inc .. 1987) p. B5-B7.
45The parameters of this model are no trend, no seasonality, with alpha = .3.
Page 20 Demonstrating the Operational Utility of Incident-Based Datafor Local Crime Analysis

40
35
30
25
20
15
10
5
Number of robberies
,... CD .... <0 ... ... N N
... co ... M M "'"
Week
It) ... It) ....
Forecasts
----Fitted robberies - - - - - Actual robberies
Figure 3. Number of fitted versus actual robberies per week, Tacoma January 1, 19898 0ctober 31, 1990
The fitted values are considerably smoother than the actual values. (:Jee Figure 3.) These fitted, or smoothed, values give a clearer indication of the overall pattern of the series, making it easier to identify how the series has behaved in the past. The fitted series seems to suggest a general decline in the number of robberies, and perhaps a slight seasonal effect.
This method also can be used to predict future levels of a series "one-step ahead." A one-step ahead forecast, in the present context, refers to a prediction that can be made one week in advance, but no further. (If the time series was of daily robberies, it could forecast one day in advance. If the time series was of yearly robberies, it could forecast one year in advance.) In those circumstances where a one-step ahead forecast is all that an agency requires,
exponential smoothing is a relatively simple technique which can provide usable forecasts.
- Exception reporting
One common responsibility of crime analysis units is to produce an exception report whenever crime exceeds its normal level. The objective of exception reports is to alert administrators as soon as possible to a significant upswing in crime in a neighborhood or throughout the city. An exception report should indicate whether the increase appears to be random or a significant change in criminal activity. If part of a pattern, the report should advise the administrator whether the increase is part of a seasonal effect or part of a long-term trend. With this information, law enforcement planners can better decide whether
a tactical or a strategic response is appropriate.46
The challenge in developing valid exception reports is that most crime series contain a substantial amount of random fluctuation. While the timely identification of true change is critical to the effective use of law enforcement resources, random fluctuations can make true change difficult to detect. If an increase in crime is not detected and responded to in a timely fashion, crimes which could have been prevented will occur, and the criminal element will have more time to' take root and will be more difficult to eradicate. 011 the other hand, if agencies respond to an increase which is solely due to random fluctuation, limited resources will be wasted. More impor~~.:ly, since a random
46Crime Analysis Functions report, p.79.
Demonstrating the Operational Utility 0/ Incident-Based Data/or Local Crime Analysis Page 21
increase will likely be followed by a decrease, such a pattern might cause an agency to conclude -incorrectly - that its response was the reason for the decrease. This could lead an agency to widely establish or more heavi1;1 depend on an ineffective program. Thus, some means of distinguishing random fluctuations from true change is needed.
A statistical technique which can be used to decide whether fluctuations in a time series exceed their usual or typical values is known as ARlMA (AutoRegressive Integrated Moving Average).47
47 Social Sciences Time Series Analysis report, p. 121. The goal of the analysis is to identify It model which accounts for the behavior of the time series. Each time series is assumed to contain both a systematic component and all error term. Mathematical models are constructed to represent the systematic component and are used to "subtract" the systematic component from the time series. Statistical tests are used to determine if the residual time series contains only a random component. Onc~ the residual component contains only random fluctuations, the systematic components which have been modeled are accepted as an adequate representation of the time series. This model can then be applied to the time series to predict future values of the series.
Box-Jenkins time series analysis is a useful technique for uncovering patterns in data and in making forecasts, but its limitations need to be understood as well. In general, BoxJenkins analysis requires at least 50 observati.ons (for instance, 50 days worth of robbery counts, if days is the unit of analysis). In addition, BoxJenkins is only appropriate if the research question can be optimally addressed via time series (not all research questions can), and if data are available to represent the time series process. Additional limitations may apply to specific research questions. Ibid, pp. 20-24.
There are three steps tv this process: identification, estimation, and diagnosis.
• Identification refers to selection of a preliminary model, based on patterns in the data, that the analyst believes may be appropriate.
• Estimation refers to the computation of values for a model.
• Diagnosis refers to a quantitative assessment of the statistical adequacy of the model.
As a group, these three steps are referred to as the model building process.48 If these procedures are carried out properly, the resulting model can be used for exception reporting, as well as for impact assessment (for example, "Did an increase in patrol reduce crime in this neighborhood?"), forecasting (for example, "How many robberies will occur next month?"), and causal analysis (for example, "If the number of males 16 to 19 years of age increases by 5% a year, what effect will that have on residentiai burglaries?").
Time series analysis is also described in the following books: John M. Gottman, Time-Series Analysis: A Comprehensive Introduction for Social Scientists (Cambridge, Massachusetts: Cambridge University Press, 1981); and Charles R. Nelson, Applied Time Series Analysisfor Managerial Forecasting (San Francisco: HoldenDay, Inc., 1973).
48Social Sciences TiJ.ne Series Analysis report, pp. 91-100.
An ARIMA analysis was applied to the Tacoma robbery time series49 and a control chart was developed. A control chart is a grophic method for indicating the range of variation in a time series that can be expected as long as the underlying process remains the same. For example, given die level of robbery activity in the past, a control chart will indicate the expected level of robbery activity during the forecast period. If the level of robbery exceeds the ronge indicated by ilie control chart (either higher or lower) then there is primafacie50 evidence of a significant increase in robbery activity. A control chart for Tacoma robberies is presented in Figure 4.
49The ARIMA analysis identified a first order autoregressive model, which is similar to what was found with the exponential smoothing analysis. The paranleters of the model were: AR(I) == .481 wiLIt p < .01 and a constant = 20.955 with p < .01.
50 Apparent; true, valid or sufficient at first impression.
Page 22 Demonstrating the Operational Utility of Incident-Based Datafor Local Crime Analysis

Number of robberIes 35
30
25
20
15
10
5
0 ·111111111111111111111111111111111111111111111111111111111111111111111111111111111111 ... CD ... ,.. CD ... ... N
... C')
-------- Lowerbound
... .,.
Week
---- Expected
... co
- - - - - Upper bound
Figure 4. Control chart of robberies per week, Tacoma January 1,1989-0ctober31,1990
The lines of interest in the control chart are the upper and lower lines; these indicate the range of normal or expected fluctuations of the data. As long as the process underlying robbery in Tacoma remains the same, the number of robberies that will occur will probably remain between the upper and lower bounds.51 If the process underlying robberies should change, then the time series will change. Changes in
51 A comparison of the control chart in Figure 4 and the exponential smooth chart in Figure 3 will reveal that the forecasted values vary for a larger number of forecast points when an ARIMA model is used. This is because ARIMA models are more sophisticated. using a greater amount of information from the time series. As a result, its estimates are usually more accurate.
the process could result from factors over which the police have no control (for instance, the economy) or from factors over which they have more control (for instance, patrol patterns). While the results of an ARlMA analysis cannot indicate which factor changed, they can be used as an early warning system to indicate that a change has occurred which may warrant additional attention.
Demonstrating the Operational Utility of Incident-Bflsed Data for Local Crime Analysis
... Q ... CD
Q ...
Page 23
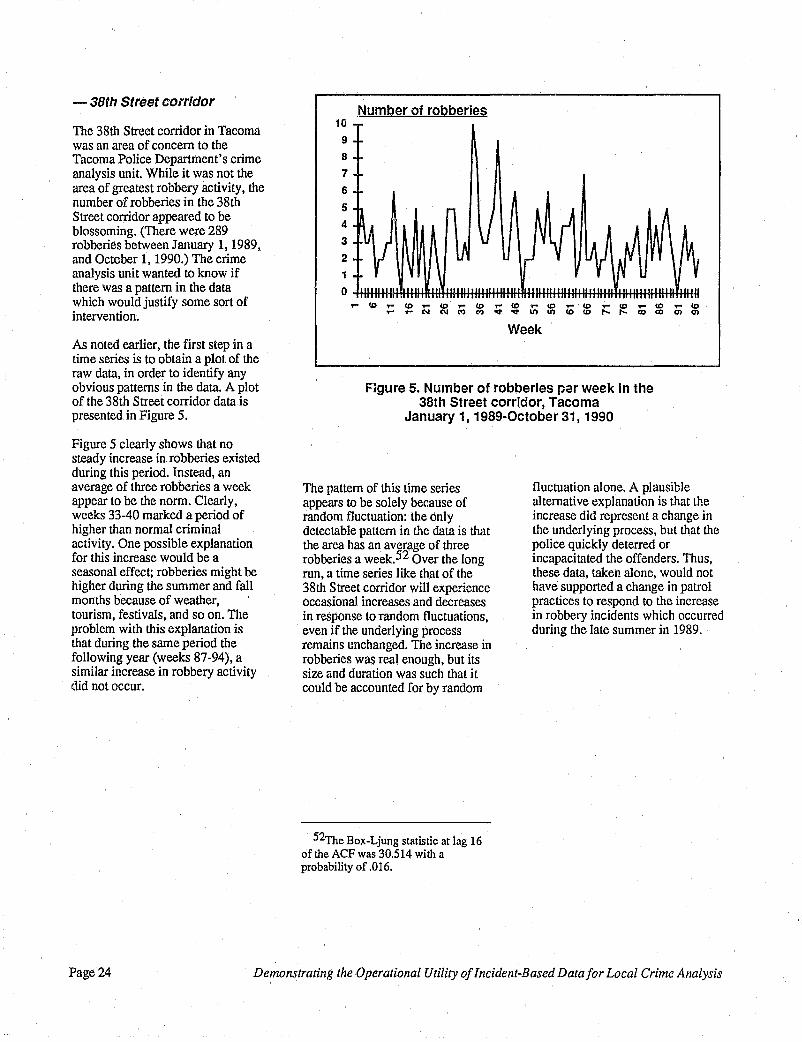
- 38th Street corridor
The 38th Street corridor in Tacoma was an area of concern to the Tacoma Police Department's crime analysis unit. While it was not the area of greatest robbery activity, the number of robberies in the 38th Street corridor appeared to be blossoming. (There were 289 robberies between January 1, 1989, and October I, 1990.) The crime analysis unit wanted to know if there was a pattern in the data which would justify some sort of intervention.
As noted earlier, the flrst step in a time series is to obtain a plot of the raw data, in order to identify any obvious patterns in the data. A plot of the 38th Street corridor data is presented in Figure 5.
Figure 5 clearly shows that no steady increase in robberies existed during this period. Instead, an average of three robberies a week appear to be the norm. Clearly, weeks 33-40 marked a period of higher than normal criminal activity. One possible explanation for this increase would be a seasonal effect; robberies might be higher during the summer and fall months because of weather, tourism, festivals, and so on. The problem with this explanation is that during the same period the following year (weeks 87-94), a similar increase in robbery activity did not occur.
,Number Of robberies 10
9
8
7
6
5
4
3
2
1
O~~~~~~~~~~mH*ffi~~HH~~~~**~
Week
FIgure 5. Number of robberies par week In the 38th Street corridor, Tacoma
January 1, 1989-0ctober31, 1990
The pattern of this time series appears to be solely because of random fluctuation: the only detectable pattern in the data is that the area has an average of three robberies a week. 52 Over the long run, a time series like that of the 38th Street corridor will experience occasional increa'>es and decreases in response to random fluctuations, even if the underlying process remains unchanged. The increase in robberies was real enough, but its size and duration was such that it could be accounted for by random
52The Box-Ljung statistic at lag 16 of the ACF was 30.514 with a probability of .016.
fluctuation alone. A plausible alternative explanation is that the increase did represent a change in the underlying process, but that the police quickly deterred or incapacitated the offenders. Thus, these data, taken alone, would not have supported a change in patrol practices to respond to the increase in robbery incidents which occurred during the late summer in 1989.
Page 24 Demonstrating the Operational Utility a/Incident-Based Data/or Local Crime Analysis

New Bedford, Massachusetts
Site goals
The City of New Bedford is a port city located at the southeastern tip of Massachusetts with approximately 100,000 residents.53 The New Bedford Police Department consists of approximately 100 sworn officers. Within the last few years the department has begun to automate its information systems. Although the. department's experience with computers is recent, representatives easily identified a large number of uses for automated crime analysis, including program evaluation, crime cluster identification and resource allocation. The department was particularly interested in drug offenses and wanted to use crime analysis to obtain an overview of drug activity in the city, and to respond to drug activity near schools.54 The department was also interested in using crime analysis to proactively identify addresses or houses that were repeatedly the source of drug problems. Currently the department uses a traditional approach in identifying drug houses. For example, detectives identify a suspected drug house and then, to support an application for a search warrant, obtain a listing of past dispatch activity at the address for
530n September 21, 1990, SEARCH staff (David J. Roberts and Seth F. Jacobs) met with Chief Richard Benoit, Sergeants Frederick AlISelmo and William Born, Detective Dan Chieppa, and Officers Bradford Simmons and Ned Leduc of the New Bedford Police Department.
54Chapter 94C, section 34, subsection J, of the Annotated Laws of Massachusetts provides for enhanced penalties for distribution of drugs within 1,000 feet of a school.
which they are requesting a search warrant. They hoped that this traditional method could be supplemented by identifying drug houses from the information system. This information then could be forwarded to detectives for evaluation and follow-up. Although this method would obviously not replace traditional methods for identifying drug houses, the department would like to determine if it could provide its detectives with an additional tool for identifying drug houses.
Data system
The data used in this analysis were obtained from the New Bedford CAD system and consisted of all drug-related offenses from January 2, 1990 through September 30, 1990.55 An incident was classified as drug-related if the dispatch was to a drug offense; or, if on arrival, the responding officer found drugs to be involved in some way~ or if the call was for a drug raid.:J6
Number of Number of separate calls addresses
4C3 2 78 3 35 4 17 ~ 45
Total 578
Findings
Officers were dispatched to a total of 1,326 drug-related calIs at 578 different addresses. Although this averages to 2.2 calls per address, the calls were not evenly distributed among all addresses. Most of the addresses (70%) had only one drug-related call; a few addresses accounted for a large percentage of the calls. (See Table 17.)
Of the 578 addresses with a drug call, 8% (45) recorded five or more calls and accounted for 42% of all drug calls. Similarly, 4% (24) recorded 10 or more calls, and accounted for 31 % of all drug calls. These data support what officers already knew: that a few addresses cause most of the problems. These data indicate precisely how extreme this disproportionality can become and demonstrates that much of the department's resources are expended responding to the problems created by a few addresses.
Number of calls at address
403 156 105 68
594
1326
Table 17. Distribution of calls by address, New Bedford January 2, 1990-September 30,1990
55 Approximately 93% of the drug offenses could be geocoded. Incomplete addresses was the primary reason why some addresses could not be geocoded.
56 Alcohol-related offenses were not included.
Demonstrating the Operational Utility of Incident-Based Datafor Local Crime Analysis Page 25

- Probability of return
While a few addresses account for a disproportionate amount of the department's resources, to enable the department to take advantage of this fact, it must be able to proactively identify which addresses are likely to be chronic problems in the future. The department needs a means of determining when the number of calls to an address makes it almost certain that the address will continue to be a problem. At that point, it may be cost-effective for the department to take steps to solve the underlying problem giving rise to the drug incidents. Information relevant to this issue is presented in Figure 6.
Given the first call to an address, there was only a .30 probability that an officer would return to the address within the nine-month period of this study for a second drug-related incident. Thus, it would probably not be costeffective to target these addresses since most of the time there would be no second call. If an officer had to respond to an address a second time, however, the probability of a third return rose to .58, and with each return to 8;1 address, the probability of a subsequent return increases. By the time an officer has responded to an address five times - and there were 45 addresses in the city that had five or more such incidents - the probability of a subsequent incident is very high (.87). At this point, treating these addresses in a proactive manner is clearly costeffective, since they represent a chronic problem to the community.
- GeographIc clusterIng
These findings suggest that much of the drug problem within the city is related to relatively few
Probability of return 1.00
0.90
0.80
0.70 0.60
0.50
0.40
0.30
0.20
0.10
0.00
1 2 3 4 5
Number of dispatches to an address
Figure 6. Probability of return by number of dispatches to an address, New Bedford
January 2, 1990·September 30, 1990
addresses and that the department can predict which addresses will continue to represent a problem. The findings do not, however, indicate how these problem addresses are distributed throughout the city. One way of addressing this issue is by plotting the geographic location of offenses on a map of the city. This can be easily accomplished on a microcomputer with commercially available mapping software. 57
This approach involves the use of a pin map to depict geographical relationships between particular criminal events and is the most frequently used analytical technique by police agencies. 58 Cluster analysis is based on the
57MapInfo desktop mapping softwate was used to geocode the New Bedford data and produce pin maps of the city.
58Crime A!lalysis FlUlctions report, p.5.
assumption that the study of clusters of objects can reveal characteristics that the objects share, as well as those in which they differ. Cluster analysis is used in biology to classify plants and animals and in medicine to identify diseases and their stages.59 Geographic clustering of offenses is a key issue for law enforcement agencies, and is directly related to tactical and strategic issues. More recently, problem-oriented policing uses the concept of cluster analysis to identify offenses which share a vulnerable intervention point. Because cluster analysis lends itself easily to the analysis of offenses, and because the identification of similar offenses underlies many different types of crime analysis, cluster analysis has tremendous potential. Figure 7 depicL'l the geographic clustering of the 1,326 drug offenses in New Bedford.
59SPSS Inc., SPSSIPC+ Advanced Statistics™V2.0 (Chicago: SPSS Inc., 1988) p. B-71.
Page 26 Demonstrating the Operational Utility of I ncident-B ased Data for Local Crime Analysis

"
I · · ·
I , . .
· · · , · .
, , .
", , " ,
.. \ ..
\ \ . .
. . \
\
· · · . "
\ \'"
" ' ,
" ......
" , . I · · ·
I ,I , ... , - - # .. • -!. . .. ~ ....... ",
@i.'
:,;1 .: :.\ ~~ ~Iuster 3 /
, --'" ~ ~Iuster 2 " . " ' ..... '" . . -- -:'. '" . '.: ,II' ~
. . 'v' , .. '.~ .' ~". " ,": ': -,'.
. t . '.
"
· · ·
, M' ", "'; 'J-.--,
':"._ ... ,'/ -\ ......
". "
'" "C"'" \ "
·~IU.ster I (
. . , . ~I----------~I----------~~ ( . , o :z
miles 4 \ ,
,,i i · . , .
. .
. . , ·
\ \
· · ·
, . . .
, y'" •..••.•
"
) \ '. \)
,/ .•. ~-.. , I '\. ..
.' '1 ;' \
\ : \. \J . .' .
"
Figure 7. Geographic distribution of drug offenses, New Bedford January 2, 1990-September 30,1990
Demonstrating the Operational Utility of Incident-Based Datafor Local Crime Analysis Page 27

The map in Figure 7 provides an overview of drug activity in New Bedford. Each point represents an address that had a dispatch for a drug call between January 2, 1990, and September 30. 1990. The distribution of points shows that drug activity is concentrated in three areas. Cluster 1 is located in the harbor area; Cluster 2 is southwest of the intersection of 1-195 and State highway 18; and Cluster 3 is northeast of the intersection ofI-195 and State highway 18. These clusters represent areas at which intervention efforts should be focused, whether these effort>; are mounted by the police department acting alone or in conjunction with other city agencies. Successful interventions in these areas will likely have a greater impact on drug activity and related crimes tlm.l. efforts in other &leas of the city.
Cluster 1, near the harbor, deserves closer scrutiny because it is located near two schools. One reason for the department's interest in crime analysis is because it is interested in monitoring and responding to drug activity near schools. Figure 8 presents a close-up of a portion of the harbor cluster, and depicts the location of two schools as well.
Both schools in Figure 8 are elementary schools and both are located near the harbor cluster. A circle with a radius of one-tenth of one mile (.1) has been drawn around each school. As can be seen, over 10 drug offenses were reported within this zone. Several jurisdictions have tried to establish "drug-free" zones around schools by providing enhanced penalties for drug offenses within a specified distance to schools. Even without this legislation, law enforcement agencies may be especially concerned about drug activity in close proximity to schools. By
geocoding incident-based data, as well as the location of schools, crime analysts can easily study the geographic relationship between drug clusters and areas deserving additional protection.
- Three-dimenSional display
One limitation of map displays is that data points often overlap one another and can be obscured. It can be difficult to distinguish locations with a single point from locations with a large number of points. While there are several means of addressing this problem (that is, displaying counts of points), if there is a great deal of overlap in the data, one effective approach is to produce a three-dimensional display of the data, with the degree of overlap represented by height. An example of this approach is presented in Figure 9.
Page 28 Demonstrating the Operational Utility 0/ Incident-Based Data/or Local Crime Analysis

o 0.1
miles 0.2
Figure 8. Close"up of drug offense Cluster 1, with schools, New Bedford January 2, 1990-September 30,1990
Demonstrating the Operational Utility oj Incident-Based DalaJor Local Crime Analysis Page 29

Figure 9 depicts the same data as presented in the two-dimensional map of New Bedford (Figure 7), but in a three-dimensional format. The peaks indicate areas of the city with a large number of drug calls, while the floor indicates areas of the city with few calls. Larger peaks indicate areas with more serious drug activity. In this figure, Cluster 1 is located near the bottom, as in the earlier figures. The other two clusters, however, have been merged into a single cluster. As noted earlier, these two clusters were bisected by an interstate freeway and by a State highway. These features of the city may effectively isolate these clusters from each other to such an extent that they are separate clusters. The volume and proximity of the ciusters, however, indicates that for some iJurposes it may not be necessary to distinguish between them.60
The chief of the New Bedford Police Department saw an immediate use for crime analysis in establishing boundaries for tactical units. For some time he had been considering how best to divide the city, and saw crime analysis as providing an additional source of information.
60 A computerized type of clus~r analysis found only two actual clusters in the city. corresponding to Cluster I, and a second cluster which contained both Cluster 2 and Cluster 3. The procedure also identified another cluster. but it ii1cluded only a few cases and was not considered to be important.
This information could be used to assign areas of responsibility for my tactical drug units. The goaE would be to divide the city evenly among the units in such a way as to enhance their effectiveness.61
One way that crime analysis can assist in the setting of boundaries is to ensure that the boundaries do not bisect any major clusters. Since offenses that occur within a cluster are more likely to be related to each other than more isolated offenses, drawing boundaries that intersect clusters should be avoided. This is not to suggest, however, that boundaries should be set solely on the basis of the appearance of clusters, but that the results of such analyses can serve a useful role as one of several items of information to be considered when allocating manpower.62
61 Chief Richard A. Benoit, New Bedford. Massachusetts Police Department, July 2, 1991, NIBRS demonstration meeting. SEARCH Group. Inc. offices, Sacramento. California.
62Shortly after the NIBRS demonstration on July 2. 1991. Chief Benoit requested that SEARCH conduct additional analyses regarding the distribution of drug offenses. ThiJ; information was used by Chief Beaoit in deciding how to allocate his tactical drug units.
Summary of site analyses
The utilization of incident-based data for crime analysis was demonstrated with data from two police departments. In Tacoma, Washington, the analysis focused on robbery trends in the city as a whole and in specific neighborhoods. For New Bedford, Massachusetts. the analysis focused on the clustering of drug offenses. In each instance, sophisticated analyses were conducted and findings directly relevant to the administration of each agency were produced. The key to the success of these analyses was the incidentbased nature of the data available from each agency. which allowed for flexibility in the aJ1~lysis.
Page 30 Demonstrating the Operational Utility of I ncident-B ased Data for Local Crime Analysis

Figure 9. Three-dimensional display of drug offenses, New Bedford January 2, 1990-September 3D, 1990
Demonstrating the Operational Utility 0/ Incident-Based Data/or Local Crime Analysis Page 31

Page 32 Demonstrating the Operational Utility oj Incident-Based DataJor Local Crime Analysis

IV. Discussion and conclusion
For over 60 years, the United States has measured the incidence and fluctuation of crime and arrests through the Uniform Crime Reporting (VCR) program, a monthly aggregation of eight Index offenses reported by law enforcement agencies throughout the Nation. Although UCR statistics have proven useful in research and relevant to policy decision making, limitations inherent in the nature of aggregate reporting have been recognized for many years. In an effort to address these problems, BJS, th,e FBI, law enforcement professionals, and leading researchers throughout the Nation worked closely together to modify the program to capture incident-based data. The National Incident-Based Reporting System (NIBRS) reflects a dramatic shift in the nature of crime and arrest reporting.
NIBRS captures data that are more comprehensive, richer in complexity, and broader in scope than the existing aggregate UCR program. With NIBRS, researchers will be able to examine complex relatillnships in crime, victimization, and arrest practices by relying on an expanded range of variables captured in the new program. NIBRS data will prove us.eful at the State and Federal levels in assessing the level of crime, detecting broad crime trends, ullcx~ating resources, guiding policy and operations, informing planning. and facilitating research.
In addition to greatly improving the quality of State and national statistical compilations on crime and criminal justice, NIBRS also supports local law enforcement
agencies in theii' automation of incident-based records management systems, which capture and report NIBRS-required data. With few exceptions,63 the data required for NIBRS participation represent a subset of the data genemlly captured in law enforcement offense and arrest reports. Moreover, NIBRS properly reflects the inherently incident-based structure of police reporting practices. Local law enforcement agencies will, however, need to expand the range of data collected in their records management systems beyond the minimal requirements of NIBRS in order to conduct effective crime analysis. By demonstrating the value of automated, incident-based reporting, NIBRS may act to improve the crime analytic capabilities of local law enforcement, helping them to better define their needs, justify resources, and allocate existing resources for maximal effectiveness and efficiency.
This project was designed to demonstrate a variety of crime analysis techniques and methodologies using automated incident-based data drawn from two local jurisdictions and readily available microcomputer-based software applications, The analyses identified hot spots of drug ,':lctivity
630ne exception may be the collection of data reg8l'ding bias motivation, which has been included in NIB RS. For a description of the hate crime reporting requirements of NIBRS, see U.S. Department of Justice, Federal Bureau of Investigation, Hate Crime Data Collection Guidelines (Washington, D.C.: Federal Bureau of Investigation, no pUblication date).
in one city, and in another ciLy concluded that an apparent inciease in robbery activity was probably due to random tluctuations. The project demonstrated the significant benefits which can accrue when local law enforcement agencies use the NIBRS standfu'ds as a foundation for crime analysis, while augmenting their records management systems with additional data elements vital to local crime analysis.
The analyses conducted in this project were possible because the participating police departments had automated their incident-based records management systems, and because software that facilitates data analysis, computerized mapping, and the production of graphics is readily available and comparatively inexpensive. Moreover, the data provided by the IJgencies, which included both computer-aided dispatch records and crime reports, are generally available to many police agencies throughout the Nation. These data are inherently incident-based and enable agencies to undertake a broad range of crime analysis.
In addition to demonstrating the utility of incident-based data for
, local crime analysis, SEARCH also conducted a national survey of crime analysis programs in police departments as part of this project. The survey provided a comprehensive overview of the crime analysis practices in police departments of aU sizes, and found that crime analysis has become an integral part of many law enforcement agencies. It appears, however, that crime analysis units could benefit frum additional
Demonstrating the Operational Utility 0/ Incident-Based Data/or Local Crime AnalysiS Page 33

training and technical assistance opportunities. The greatest need is for an advanced course that generally focuses on geo!ITaphic infonnation systems, statistical techniques, and crime analysis.
With the growing acceptance and implementation of communirjbased policing and problemoriented pOdcing, local law enforcement agencies increasingly need the ability to conduct detailed crime analysis to properly guide these important programs. Given the shifting nature of policing in the United States, a need exists for additional demonstration projects, research efforts demonstrating innovative methodologies and software applications, and the development of analytic models for use at both the local and State level in analyzing incident-based data.
By demonstrating the unique ways in which NIBRS-capable, incidentbased data can address the specific information needs of communitybased policing, we can encourage and support implementation of community-based policing and NIBRS participation in police departments throughout the Nation. Moreover, by documenting the ability of ir.cidcnt-based crime reporting systems to address the specific infonnatjon needs for effective community-based policing, we will be improving the potential for success of local community-based policing programs and will be building a solid research foundation that demonstrates the linkage between incident-based crime reporting, community-based policing, and other community-oriented data. Additionally, as local police departments implement automated, ir.cident-based records management systems for their own use, they will clso be better able to meet the data ~tandards for NIBRS participation,
since local departments typically need substantially more comprt:hensive and detailed data th!ifi are required in the national NIBRS program. This project, therefore, will enhance the crime analysis capabilities of local police departments, while building their capacity to participate in NIBRS, thereby increasing the scope, completeness, and value of the NIBRS program at the State and Federal levels.
Page 34 Demonstrating the Operational Utility of Incident-Based Data/or Local Crime Analysis

Appendix: Software used by crime analysis units
Demonstrating the Operational Utility 0/ Incident-Based Data/or Local Crime Analysis Page 35

The following is a compilation of the software in
use by the crime analysis units of law enforcement
agencies, as reported by the 810 agencies which
responded to SEARCH's national crime analysis unit
survey in 1991.64
64Survey questions regarding the names of software packages used by crime analysis units were in a free-field format. Thus, responses did not always contain sufficient information to identify specific software products. In addition, respondents did not always place a software product in the appropriate category. The list in this appendix was derived from the survey after adjustments were made for incomplete information and improperly classified software. Please note that the software products listed here may be trademarks of their respective companies.
Word processing DcskMate Display Write Enable Microsoft Word Multi-Mate ProWrite Wang Word Processor Word Perfect WordS tar Works Write Now Writing Assistant
Spreadsheet Lotus 1-2-3 Enable Excel MultiPlan Quatro SuperCalc
Database dBASE DataEase DataFlex DBM2 Enable File Express FoxBase FoxPro HyperCard Informix Nutshell Oracle Paradox PC File RBase Reflex TeamUp
Statistical Matmatica MiniTab NeSS SAS SPSS Systat
Crime analysis ACISS CAPPS CAS CISCO CLASS CLUES Command Data System Crime Management System DrugTrak LEADS PIMS PRC T-CAP Tiburon
Geographic Information systems Arc Info LandTrak MapInfo Mapper Streets on a Disk Street Smart Ultimap
Graphics Applause ChartMaster Dr. Halo Draw Perfect FoxGraph Freelance Plus Graphwriter Harvard Graphics MacDraw Microsoft Chart PFS First Graphics Print Shop SuperPaint Sygraph Symphony Wang Graphics
Other FormTool PageMaker Q&A
Page 36 Demonstrating the Operational Utility of Incident-Based Datafor Local Crime Analysis

New from the Bureau of Justice Statistics! Thinking about computerizing your criminal justice agency's information? Save time and trouble by finding out what your colleagues are using! Order the Directory of Automated Criminal Justice Information Systems, 1993, which:
1)' ~~~ ~~ ~.~~~-~~.~.-~
l~ectorYOf
o Identifies the State and local criminal justice agencies that use automated information systems and the functions that are computerized.
CrllninaJ Jus ~utomated Informal" fiee
o Describes the systems these agencies use for a variety of functions, the software, the operating systems, the hardware requirements, product features, and support services offered.
o Gives the names, addresses, and
1993 IOn SYstems
Volume]. 1..: . aw 1i:nfOlY:em
ent
telephone numbers of contact persons at the criminal justice agencies and at the system vendors.
The useful resource is in two volumes:
Volume I: Law Enforcement. 869 pp. $5
D' . l~tory oJ' A ••
CnminalJi ~tomated Informal' Ust'ee 1993 Ion SYstems
VOlume]l. Probati • Correclio
onlParole Pros os, courts, , CCu/ion
Volume II: Corrections, Courts, Probation/Parole, Prosecution. 654 pp. $4
To order, fill out the form below and send it, with payment, to Bureau of Justice Statistics Clearinghouse, 179 Annapolis Junction, MD 20701-0179. If using a credit card, fax your order to 410-792-4358. Questions? Call the BJS Clearinghouse at 1-800-732-3277.
r.----------------------~-----------~-, I Order Form 0 I I Please send me I I 0 Directory of Automated Criminal Justice Information Systems, 1993, Vol. I: Law Enforcement I I (NCJ 142645). $5 postage and handling. I : 0 Directory of Automated Criminal Justice Information Systems, 1993, Vol. II: Corrections, Courts, :
I Probation/Parole, Prosecution (NCJ 142646). $4 post.age and handling. I I 0 Payment enclosed, payable to NCJRS. I I 0 Charge my Q MasterCard 0 VISA I : Account# Exp.date :
I Signature I I Name I I Address I I City State ZIP I L ______________________________________ ~

Highlights from 20 Years of Surveying Crime Victims ON SLIDES! The Bureau of Justice Statistics (BJS) commemorates the 20th anniversary of the National Crime Victimization Survey (NCVS) by offering color slides to accompany its landmark report Highlights from 20 Years of Surveying Crime Victims: The National Crime Victimization Survey, 1973-92. These slides were specially designed for classroom use, training, and public presentations.
More than 40 slides illustrate the charts and graphs presented in the publication. Each slide is coded for ready reference to the full text of the report. Also included is a reproducible paper set of the slides (with supporting data tables) for creating overhead transparencies.
Slide topics answer the frequently asked questions:
• How much crime occurs?
.. What are the trends in crime?
• Who are the victims of crime?
• How much crime occurs in schools?
• To what extent are weapons involved in crime?
• Are most crimes reported to the police?
Order your slides TODAYI Just fill out and return this ad to:
Bureau of Justice Statistics Clearinghouse P.O. Box 179
Annapolis Junction, MD 20701-0179
Or fax to: (410) 792-4358
o YES! Please send me Highlights from 20 Years of Surveying Crime Victims on slides (NCJ 148140)
o Payment of $25 enclosed [] Check [J Money Order (Make payable to NCJRS)
Please bill my: [] NCJRS Deposit Account # ___________________ _
[] VISA ::J MasterCard # ______________ Exp. date
Signature ___________________________ _
[] Government Purchase Order # _____________ (Add $1.95 for processing)
Ship to: Name: _______________ Organization: ___________ _
Address: ________________________ , ______ _
City, State, ZIP: ___________________________ _
Telephone: '-) ___ . _____________ . __________ _

F
Bureau of Justice Statistics reports (Revised May 1994)
Call toll-free 800-732-3277 to order BJS reports, to be added to one of the BJS mailing lists, or to speak to a reference specialist In statistics at the Bureau of Just/ce Stat/stlcs Clearinghouse, P.O. Box 179, Annapolis Junction, MD 20701·0179; or fax orders to 410-792-4358. For drugs and crime data, call the Drugs & Crime Data Center & Clearinghouse, 1600 Research Blvd., Rockville, MD 20850, toll-free 800-666-3332 ..
8JS technIcal reports New directions for NCS, NCJ·115571, 3189 Series crlrnes~ Report of a field test,
NCJ·l04615,4/87
Corrections BJS bulletins and special reports
Prisoners In 1993, NCJ·147036, 5/94 Women In prison, NCJ·145321, 3/94 Capital pLlnlshmenl1992, NCJ·145031,
12193 HIV In U.S. prisons and lolls, NCJ· I 43292,
9/93 Drug enforcement and treatment
In prisons, 1990, NCJ·134724, 7/92 Violent State prisoners and their victims,
NCJ·124133,7/90 BJS maintains these mailing lists: Prison rule vlolatore, NOJ·120344, 12189 • Law enforcement reports Recidivism of prisoners released In 1983, • Federal statistics NCJ·1 I 6261, 4/89 • Drugs and crime data Drug use and crime: Stale prison Inmate • Justice expenditure add employment survey, 1986, NCJ·l 11940,7/88 • Privacy and security of criminal histories Time served In prison and on parole, 1984,
NCJ·l08544,12187 and criminal justice information policy Profile of State prison Inmates, 1986, • BJS bulletins and special reports NCJ.l09926,1/88 • state felony courts Imprisonment In four countries, • Corrections NCJ·l03967,2/87
• National Crime Victimization Survey National Corrections Reporting Program: • Sourcebook of Criminal Justice 1991, NCJ·145861, 2194 Statistics (annual) 1990, NCJ-141879, 5/93
Single copies of reports are free', use II'tle, Prisoners at midyear 1993 (press release), NCJ·I439S0, 9/93
NCJ number to order. Postage and Correctloflal populallons In tne u.s.: handling are charged for bulk orders 1991, NCJ·142729, 8/93 of single reports. For single caples of 1990, NCJ·134946, 7192 multiple titles, up to 10 tllles are free; Survey of State prison inmates,1991, 11-40 titles $10; more than 40, $20; NCJ·136949,5/93 libraries cali for special rates. Census 01 Stale nnd Federal correctional
facilities, 1990, NCJ·137003, 6/92 Public·use tapes, disks, and CD-RaM's Prisons and prisoners In the United States, ofSJS data sets and other criminal justice NCJ·137002,4/92 data are available from the National State and Federal Institutions, 1926-86: Archive of Criminal Justice Data (formerly Race of prisoners admitted, NCJ·12561t.l, CJAIN), P.O. Box 1248, Ann Arbor, MI 6/91 48106 (tal/-free 800-999-0960). HI~~~~~~ll~:~~siJ~~ on prisoners,
National Crime Victimization Survey Criminal victimization In the U.S.:
1973·92 trends, NCJ·147006, 6/94 1992 (linal), NCJ·145125, 4/94
Violent crime: Selected findings, NCJ·147486,4194
.Elderly crime victims: Selected ffndlngs, NCJ·147186, 3/94
Violence against women, NCJ·145325, 1/94 Highlights from 20 years of surveying crime
victims: 1973·92, NCJ·144525, 10/93 Crime and older Americans Information
package, NCJ·140091, 4193, $15 Crime Victimization In city, suburban,
and rural areas, NCJ·135943, 6192 School crime, NCJ·128129, 5/91 The Nation's two crIme measures: Uniform
Crime Reports and the National Crime Survey, NCJ·122705, 4/90
RedesIgn of the National Crime Surveys, NCJ'111457,3/89
The seasonality of crime victimization, NCJ·111033,6/88
Census of jails and survey of jail inmates BJS bulletins and speclat reports
Jail Inmates, 1992, NCJ·143284, 8/93 Drunk driving: 1989 Survey of Inmates
of Local Jails, NCJ·134728, 9/92 Women In Jail, 1989, NCJ·134732, 3/92 Drugs and jail Inmates, NCJ·130836, 8191 Profile of jail Inmates, 1989,
NCJ·129097,4191 Population density In locallalls, 1988,
NCJ·122299, 3/90 Census of local JailS, 1988,
NCJ·121101,2190
Census of local Jails, 1988: Summary and methodology, vol. f,
NCJ·127992, 3/91 Cata lor Individual Jails In the Northeast,
Midwest, South, West, vols. II·V, NCJ·130759·130762,9/91
Census of local Jails, 1983: Selected findings, methodology, summary tables, vol. V,NCJ-112795,11/88
V!ctlmlzatlon and fear 01 crime: World perspectives, NCJ·93872, 1/85,$9.15 Probation and parole
The National Crime Survey: Working papers, 8JS bulletins and special reports Vol. I, Hlstor/t NCJ·75374, 8/82 P b II d Vol. II, Methodology, NCJ·90307, 12184, $9.90 ro a on an parole: 1592, NCJ·146412, 6194
BJS crime data briefs 1990, NCJ·133285, 11/91 Crime and neighborhoods, NCJ-147005, Recidivism of YOU\'9 parolees,
6/94 NCJ·l04915,5/87 G'l'!S and crime: Handgun victimization,
flrellrm self·defense, and firearm theft, JUvenile corrections NCJ·147003,4/94
Carjacking, NCJ.147002, 3/94 The costs of crimp 10 victims, NCJ·145865,
2194
BJS bulletins Criminal victimization 1992, NCJ·144776,
11193 Crime and the Nation's households, 1992,
NCJ·143288, 9193 Measuring crime, NCJ· 75710,2181
8JS special reports Black vlcthns, NCJ·122562, 4190 Hlspanl;: victims, NCJ·120507, 1/90 Motor vehicle theft, NCJ·l09978, 3/88 Violent crime trends, NCJ-l07217,11187 Robbery victims, NCJ·l0463B, 4/87 Vlo.lent crime by strangers and 01:10'
Children In custody: Census of public nnd private Juvenile detention, correctional, and shelterfacllllles,1975·85, NCJ·114065, 5/89
Survey of youth In custody, 1987 (special report), NCJ·l 13365,9/88
Expenditure and employment Justice expenditure and employment:
1990 (BJS bulletin), NCJ·135777, 9/S2 1988 (full report), NCJ·125619, 8/91 Extracts,1984, 'SS, '86, NCJ-124139, 8/91,
$12.25 Jusllce variable pass·through data, 1990:
Anti-drug abuse formula grams (BJS technical reporl), NCJ·133018, 3/92
Courts BJSbulietins
Prosecutors In State courts 1992, NCJ·145319, 12193 1990, NCJ·134500, 3/92
Felony sentences In Stale courts 1990, NCJ·140186, 3193 1988, NCJ·126923, 12190
Pretrial release of felony defendants 1990, NCJ·139560, 11192 1988, NCJ·127202. 2191
Criminal dele. se for the poor, 1986, NCJ·l 12919,9/88
BJS special reports Murder In families, NCJ·143498, 4/94 Murder In large urban coufltles, 1988,
NCJ'140614,3/93 Recidivism of felons on probation,
1985-89, NCJ·134177, 2192 Felony case processing In State courts,
1986, NCJ-121753, 2190
National Judicial Reporting Program 1991l, NCJ·145323, 12193 1988, NCJ·135945, 1/93
Felony defendants In large urban counlles, 1991l: National Pretrial Reporting Program, NCJ·141872, 5/93
Felons sentenced to probation In State courts,19SS, NCJ·124944, 11/90
Felony defendants In large urban counlles, 1988, NCJ·122385, 4/90
Profile 01 felons convicted In State courts, 1986, NCJ·120021, 1/90
Felony laws of 50 States and the District of Columbia, 1986, NCJ·l05066, 2188, $14.60
State court model statistical dictionary: Supplement, NCJ·98326, 9185 1st edillon, NCJ·62320, 9/80, $10.60
Privacy and security Criminal Justice Information policy:
Use and management of crfmlnal history record Information: A comprehensive report, NCJ·143501, 11/93
Survey of criminal history Information systems, 1992, NCJ·143500, 11193
Report of Ihe National Task Force on Criminal History Record Disposition Reporting, NCJ·135836, 6/92
Altorney General's program for Improving the Nation's criminal historY records:
BJS Implementation status report, NCJ·134722,3/92
Law Enforcement Management and Administrative Statistics LEMAS,1990: Data for Individual agencies,
100 or more officers, NCJ·134436, 9192
BJS bulletins and special reports Census 01 State and locsllaw enforcement
agencies 1992, NCJ·142972, 7/93 Drug enforcement by police and sheriffs'
departments,1990, NCJ·134505, 5192 State and local police departments, 1990,
NCJ-133284,2I92 Sheriffs' depart men IS, 1990, NCJ·133283,
2192 Police departm<lnls In large cilles, 1987,
NCJ·119220, 8189 Prolllo of State and local law enforcement
agencies, 19B7, NCJ·113949, 3/89
Drugs & crime Drugs and crime facts,1993, NCJ·146246, 6194 Slate drug resources: 1994 national
directory, NCJ·147706, 6194 Drugs, crfme, and the Justice system:
A national report, NCJ·133652, 5/93 Technical appendix, NCJ·139578, 6/93
Catalog of selected Federal publications on Illegal drug and alcohol abuse, NCJ·139562,6/93
Federal drug data for national policy, NCJ·122715, 4190
Federal justice statistics Federal drug case processing, 1985·91, with
preliminary data for 1992, NCJ·144392, 3194 Federal criminal case processing, 1982-91,
with preliminary data for 1992, NCJ·144526,11/93
Compendfum of Federal Justice statistics: 1990, NCJ·143499, 9193
Federal offenses and offenders BJS bulletins and speCial reports
Pretrial release 01 Federal felony defendants, 1990, NCJ·145322, 2194
Prosecullng criminal enterprises, NCJ·1425:!4,11/93
Federal senlenclng In transition, 1986-90, NCJ·134727, 6/92
Immigration olfenses, NCJ·124546, a/90 The Federal civil Justice system,
NCJ·l04769,8187
General Identifying telons who attempt to purchase firearms, NCJ-I44393, 10/89
Idenillying pe,sons, other Ihan felons, 8JS bulletins and special reports who attempt to purchase firearms, BJS telephone contacts, '94, NCJ·143707, NCJ.123050, 3/90, $9.90 11/93
Assessing completeness and accuracy of Patterns of robbery and burglary criminal history record Information: In 9 States, 1984·88, NCJ·137368, 11/92 Audit guide, NCJ.133651, 2192 Forgery and fraud·related olfense&
Forensic DNA analysis: Issues, In 6 States, 1983·68, NCJ·132445, 1/92 NCJ.128567,6/91 Inlernatlonal crime rates, NCJ-l1il776, 5188
Statutes requiring use of criminal history BJS discussion papers: record Informallon, NCJ·129896, 5/91 SentenCing In the Federal courts: Does
Original records of entry, NCJ·125626, 12190 race matter? The transition to Strategies for Improving dala quality, sentenCing guidelines, 1986-90
NCJ·115339,5189 Summary, NCJ·145332, 12/93 Public access to criminal history record Full report, NCJ·145328, 12193, $5
Information, NCJ·111458, 11188 Performance measures for the criminal Juvenile records and recordkeeplng justice system: Papers from the BJS-
systems, NCJ·112B15,11188 Princeton Project, NOJ·143505, 10193 Automated fingerprint Identlllcation Local prosecution of organized crime: Use
systems: Technology and policy fssues, of State RICO statutes, NCJ·t43502, 10/93 NCJ·l04342, 4187 Felony sentencing and Jail characteristics,
Criminal Justice "hot" flies, NC 1·101850, NCJ·142523,6193 12/86
Expert witness manual, NCJ·77927, 9/81, $11.50
BJSISEARCH conference proceedings: National conference on criminal Justice
bulletin board systems, NCJ·145327, 2/94
National conference on Improving the quality of criminal illatory Infarmotlon, NCJ'133532,2I92
Criminal justice In the 1990's: The future of Information management, NCJ·121697, 5/90, $7.70
Juvenile and adult records: One system, one record? NCJ·114947, 1/90
Open vs. confidential records, NCJ·113560, 1/88, $7.70
Compendium at State privacy and security leglslallon:
1992 summary, NCJ·137058, 7192 1992 full report (1,500pp, microfiche $2,
hard copy, NCJ·139126, $184), 7192
Enhancing capacities and confronting controversies In criminal jusllce: Proceedings of a BJS/JRSA conference, NCJ·14531B, 6194
Firearms and crimes of violence: Selec!ed findings, NCJ·146844, 2194
Using NIBRS data to analyze violent crime: National Incident-Based Reporting System (Technical Report), NCJ·144785, 11193
Directory of automated criminal Justice Information systems, 1993: Vol. 1, Law enforcement, NCJ·142645,9193, $5 Vol. 2, Corrections, courts, probatlonl parole, prosecution, NCJ·142646, 9/93, $4
Sourcebook of criminal justice statistics, 1992, NCJ-143496, 9/93, $6
State jusllce sourcebook of lItatlsttcs and research, NCJ·13799i, 9192
Publications of BJS, 1985-S9: Microfiche library, PR030014, 5/90, $190 Bibliography, T8030013, 5190, $17.50
Publlcallons of BJS, 1971-84: Microfiche library, PR030012, 10/86, $203 Bibliography, TB030012, 10/86, $17,50
Report to the Nation on crime and jusllce: Second edition, NCJ·l05506, 6/88 strangers, NCJ·103702, 1187
Prevenllng domestic violence against women, NCJ·l02037, 8/86 See order form on last page Technical appendix, NCJ·112011, 8/88, $8.40

Please put me on the mailing list for:
o Law enforcement reportsNational data on State and local police and sheriffs' departments: operations, equipment, personnel, salaries, spending, policies, and programs
o Federal statistics - Federal case processing: investigation through prosecution, adjudication, sentencing, incarceration
o Drugs and crime - Sentencing and time served by drug offenders, drug use at time of crime by jail inmates and State prisoners, and other quality data on drugs, crime, and law enforcement
To be added to any BJS mailing list, please fill in this page and fax to (410) 792-4358 or fold, stamp, and mail to the Bureau of Justice Statistics Clearinghouse at the address below.
You will receive an annual renewal card. If you do not return it, we must drop you from the mailing list.
o Justice expenditure and employment - Spending and staffing by Federal/State/local governments and by function (police, courts, corrections, etc.)
o Privacy and security of criminal history Information and Informa tion policy - New State legislation; maintaining and releasing intelligence and investigative records; data quality
o BJS bulletins & special reportsTimely reports of the Liost current justice data
o State felony courts - Defendant demographics and criminal history; pretrial release, prosecution, adjudication, and sentencing; State felony laws; indigent defense
o Corrections reports - Results of sample surveys and censuses of jails, prisons, parole, probation, and other corrections data
o National Crime Victimization Survey reports - The only ongoing national survey of crime victims
o Sourcebook of Criminal Justice Statistics (annual) - Broad-based data from 150+ sources (400+ tables, 100+ figures, subject index, anno tated bibliography, addresses of sources)
o Send me a signup form for the NIJ Catalog (free 6 times a year), which abstracts both private and government criminal justice publications and lists upcoming conferences
Name: _______________________________________ _
Title: __________________ _
Organization: _________________________ _
Street or box: _________________________________ _
City, State, ZIP: ____________________ _
Daytime phone number: ________________________ _
Criminal justice interest: ___________________ _ To order copies of recent BJS reports, attach a list of titles and NCJ order numbers.
Please put organization
U.S. Department of Justice Bureau of Justice Statistics Washington, D.C. 20531
and title here if you used
home address above: ____________________ _
Bureau of Justice Statistics Clearinghouse P.O. Box 179, Dept. BJS-236 Annapolis Junction, MD 20701-0179
Place first-class
stamp here

Now you can receive BJS press releases and other current data from the NCJRS Electronic Bulletin Board!
The Electronic Bulletin Board provides quick and easy access to new informationuse your personal computer and modem, set at 8-N-1 (rates 300 to 2400 baud) I and call 301-738-8895, 24 hours a day.
Once online, you will be able to review current news and announcements from BJS and its Justice Statistics Clearinghouse, including new publication listings and conference calendars.
For more information about the Bulletin Board, call 1-800-732-3277.

Questions about drugs and crime?
Call1-80Q-666-3332
Drugs & Crime Data Center & Clearinghouse 1600 Research Boulevard Rockville, MD 20850
Officiai Business
To order this report or ask about other crime and justice data:
Call1-80()'''732 ... 3277
Bureau of Justice Statistics Clearinghouse Box 6000 Rockville, MD 20850
Or call the BJS section of the NCJRS electronic bulletin board for the latest data releases:
! 1-301 ~ 738~8895 l~, ___ ~,
U.s. Department of Justice Office of Justice Programs Bureau of Justice Statistics
Penalty for Private Use $300
Washington, D.C, 20531