
Demonstrating the Capacity Benefits of Dynamic Ratings in ... · Demonstrating the Capacity...
26
1 IEEE PES Conference on Innovative Smart Grid Technologies (ISGT) January 20 th , 2010 Demonstrating the Capacity Benefits of Dynamic Ratings in Smarter Distribution Networks Luis(Nando) Ochoa , Lucy C. Cradden, and Gareth P. Harrison Institute for Energy Systems The University of Edinburgh
Transcript of Demonstrating the Capacity Benefits of Dynamic Ratings in ... · Demonstrating the Capacity...

1
IEEE PES Conference onInnovative Smart Grid Technologies (ISGT)
January 20th, 2010
Demonstrating the Capacity Benefits ofDynamic Ratings in
Smarter Distribution NetworksLuis(Nando) Ochoa, Lucy C. Cradden, and Gareth P. Harrison
Institute for Energy SystemsThe University of Edinburgh

2
• Political decisions
Targets to decrease CO2 emissions Targets to increase the use of renewable sources of energy etc., etc., etc.

3
Institute for Energy SystemsThe University of Edinburgh
Activity 3.1 “Strategies to maximise the absorption of new generation”
To what extent can innovative schemes (a more ‘intelligent’ network) increase the penetration of (renewable) Distributed Generation?

4
Institute for Energy SystemsThe University of Edinburgh
Changing Networks
Passive(Semi-active)
Networks
Now Mid-term
Distribution Automation
Why?
Increase reliability… but DG is treated the same way
‘Fit and forget’ connection of distributed generation (DG)
Long term
Active Network Management (ANM)
Why?
Increase and improve DG and DER integration… high usage of assets

5
Institute for Energy SystemsThe University of Edinburgh
Changing Networks
Passive(Semi-active)
Networks
Now Mid-term
Distribution Automation
Why?
Increase reliability… but DG is treated the same way
‘Fit and forget’ connection of distributed generation (DG)
Long term
SmartDistribution Grids
Why?
Increase and improve DG and DER integration… high usage of assets
6
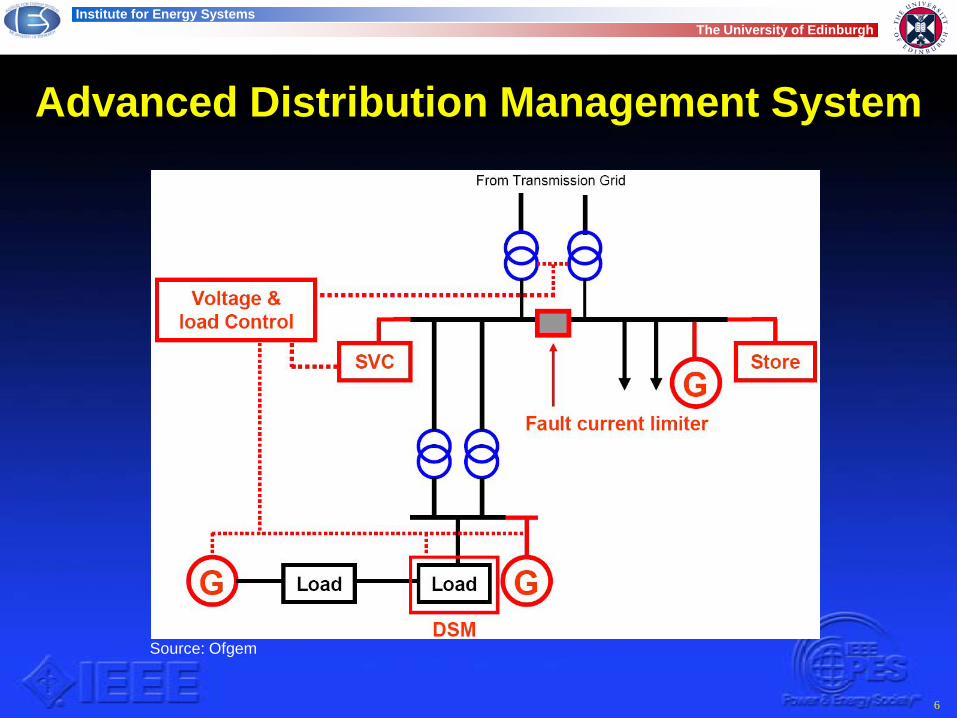
Institute for Energy SystemsThe University of Edinburgh
Advanced Distribution Management System
Source: Ofgem

7
Institute for Energy SystemsThe University of Edinburgh
UK Incentives for Facilitating the Connection of DG and Innovation in Distribution Networks
Distribution Price Control Review 4 (2005-2010) Innovation Funding Incentive (IFI)
• R&D, 0.5% of the turnover for eligible projects… to have more innovation
DG Incentive• £2.5/kW/year (for 15 years)… for DNOs to have a more proactive attitude
Registered Power Zone (RPZ)• +£2.0/kW/year (for the first 5 years). Cap of £0.5m/DNO/year … to develop cost-effective approaches for connecting DG

8
New £500 million Low Carbon Networks Fund for large-scale trials of advanced technology and commercial initiatives

9
RPZ – EDF EnergyVoltage Constraints
Coordinated control of OLTC
Uses (measures/estimates) generation and demand data
Can double the connectable DG capacity
Institute for Energy SystemsThe University of Edinburgh

10
RPZ – Scottish and Southern Energy (SSE)Thermal Constraints
The Orkney Islands have great wind resources but are connected to the mainland throgh submarine cables
This system uses:• availability of the circuit• variability of wind power• variability of demand
Significantly increases the export capacity
Institute for Energy SystemsThe University of Edinburgh

11
RPZ – E.On Central NetworksDynamic Ratings
Dynamic monitoring of line ratings (132kV) – increases the connection capacity of DG
Helps transporting the energy from off-shore wind farms
Line ratings is calculated using the ambient temperature and wind speeds
Power donut (www.usi-power.com)
Institute for Energy SystemsThe University of Edinburgh
12
Institute for Energy SystemsThe University of Edinburgh
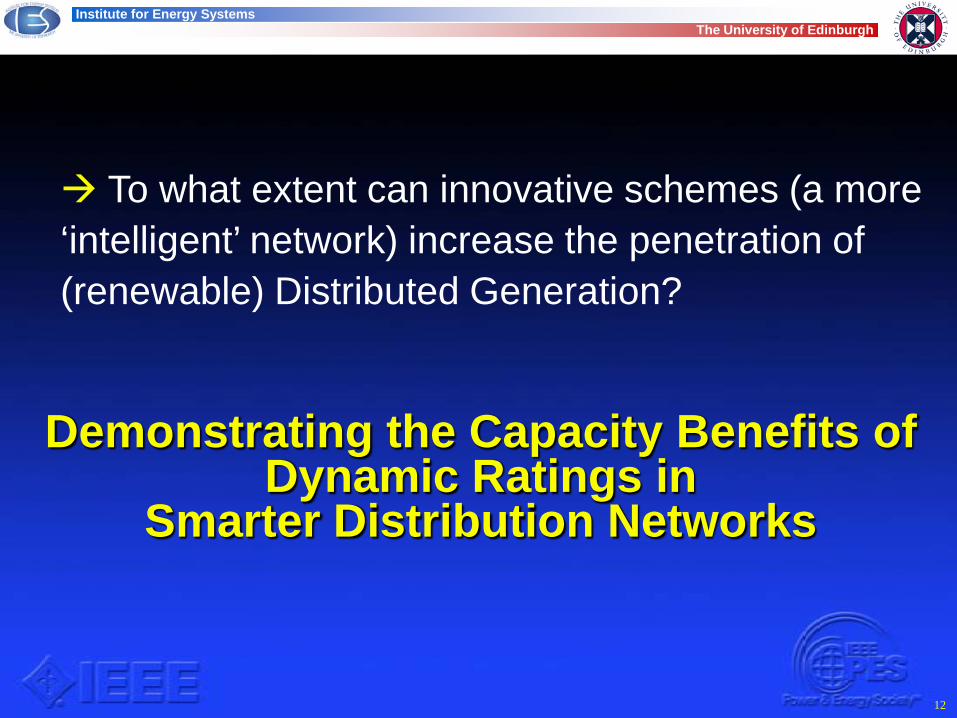
To what extent can innovative schemes (a more ‘intelligent’ network) increase the penetration of (renewable) Distributed Generation?
Demonstrating the Capacity Benefits ofDynamic Ratings in
Smarter Distribution Networks
13
Institute for Energy SystemsThe University of Edinburgh
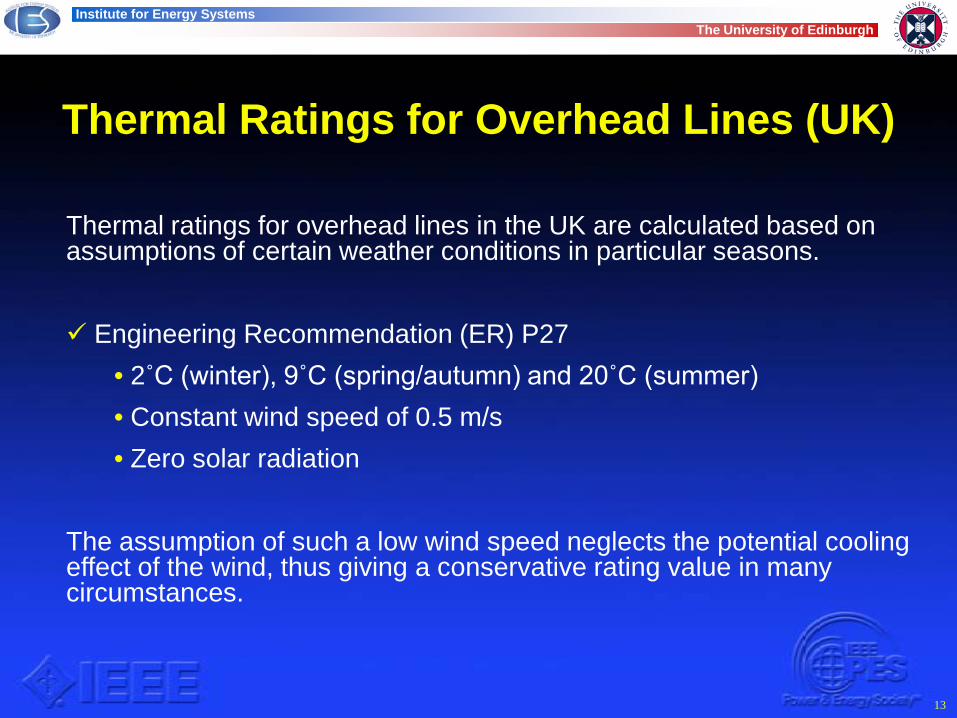
Thermal Ratings for Overhead Lines (UK)
Thermal ratings for overhead lines in the UK are calculated based on assumptions of certain weather conditions in particular seasons.
Engineering Recommendation (ER) P27• 2˚C (winter), 9˚C (spring/autumn) and 20˚C (summer)• Constant wind speed of 0.5 m/s• Zero solar radiation
The assumption of such a low wind speed neglects the potential cooling effect of the wind, thus giving a conservative rating value in many circumstances.

14
Institute for Energy SystemsThe University of Edinburgh
Current Carrying Capacity of Overhead Lines
The current carrying capacity of overhead lines can be calculated through different methods.
IEEE Std 738-2006
• At a given set of weather conditions, m, the (single-phase) ampacity for an overhead line l will be obtained considering the maximum permissible temperature of the conductor:
, , ,, ( )
c m r m s ml m
c
q q qI
R T+
+
+ −= Amp
• convective cooling• radiative cooling• solar heating• resistance of the conductor
( )1,2,(1,2) ,
, ,3l
dynamic pul m l mb
f V Iβ
+ +
== pu
• maximum 3φ power flow
15
Institute for Energy SystemsThe University of Edinburgh
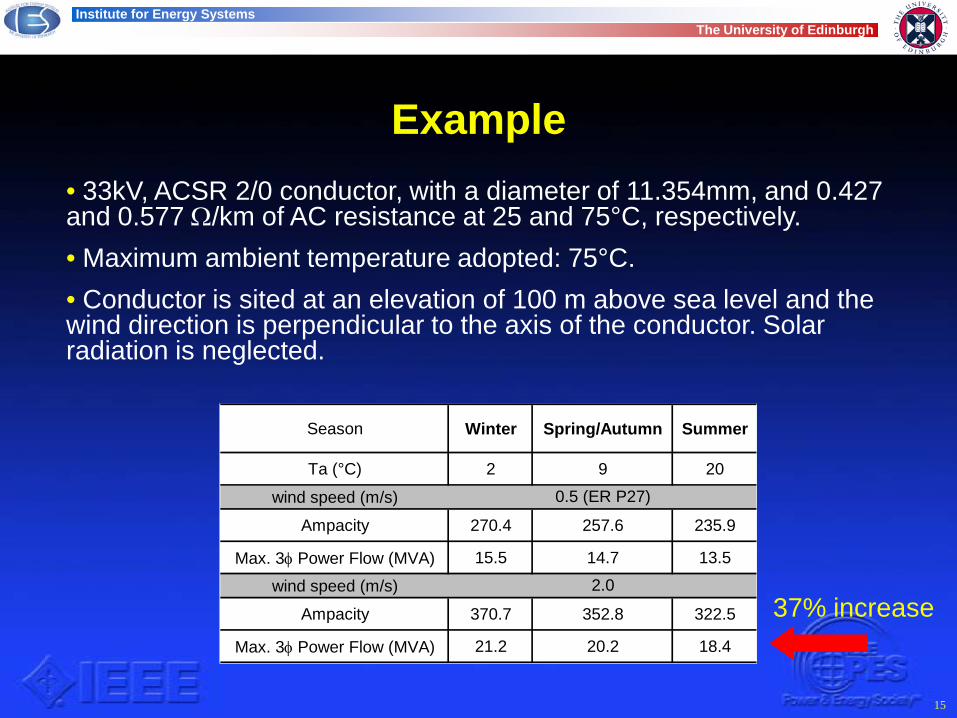
Example• 33kV, ACSR 2/0 conductor, with a diameter of 11.354mm, and 0.427 and 0.577 Ω/km of AC resistance at 25 and 75°C, respectively.• Maximum ambient temperature adopted: 75°C.• Conductor is sited at an elevation of 100 m above sea level and the wind direction is perpendicular to the axis of the conductor. Solar radiation is neglected.
Season Winter Spring/Autumn Summer
Ta (°C) 2 9 20
wind speed (m/s)
Ampacity 270.4 257.6 235.9
Max. 3φ Power Flow (MVA) 15.5 14.7 13.5
wind speed (m/s)
Ampacity 370.7 352.8 322.5
Max. 3φ Power Flow (MVA) 21.2 20.2 18.4
0.5 (ER P27)
2.037% increase

16
Absorbing More RenewablesIncorporating Operation into Planning
• real and reactive nodal power balance• voltage level constraints• voltage angle set to zero for the reference bus• thermal limits (lines and transformers)• constant power factor operation of DG units
• voltage step change• N-1 security constraints• fault level constraints
• coordinated voltage control• adaptive power factor control• generation curtailment• dynamic ratings
BasicAC OPF
Multi-PeriodAC OPF
+ANM
New Constraints
New Control
Schemes
Subject to:
Maximise DG Capacity
Institute for Energy SystemsThe University of Edinburgh

17
0.0
0.2
0.4
0.6
0.8
1.0
1 25 49 73 97 121 145 169
(p.u
.)
Wind Demand
0.0
0.2
0.4
0.6
0.8
1.0
1 25 49 73 97 121 145 169Winter: 1st Week of January
(p.u
.)
d0.7-w0.0
Multi-PeriodsHandling the Variability of Demand and Generation
Institute for Energy SystemsThe University of Edinburgh

18
Multi-PeriodsHandling the Variability of Demand and Generation
0
30
70
100
0
30
70
100
% of Generation Capacity% of Peak
Demand
500
250
0
Hou
rs/y
ear
10 261 319 55 0 063 1116 1365 255 027 597 739 95 1 307 400 502 85 01 343 504 87 0 702 455 956 174 00 63 230 48 0 100
30 70 100
% o
f Gen
erat
ion
Cap
acity
% of Peak Demand
Institute for Energy SystemsThe University of Edinburgh
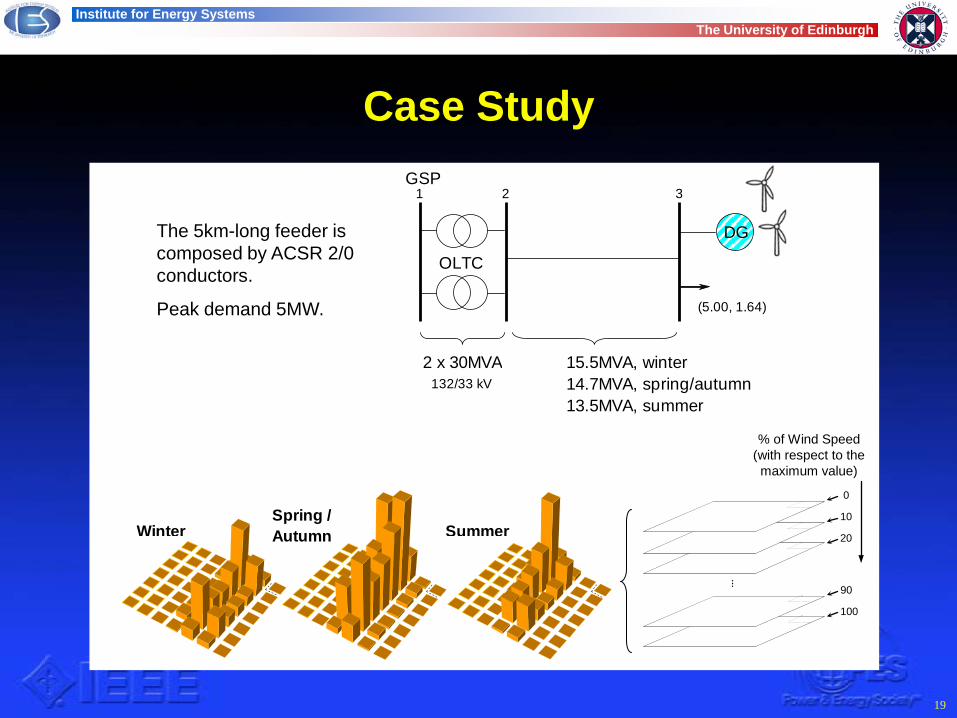
• The process is extended to cater for seasonality, wind speeds, temperatures, etc.
19
Case StudyGSP
(5.00, 1.64)
OLTC
1
DG
2 3
2 x 30MVA 15.5MVA, winter14.7MVA, spring/autumn13.5MVA, summer
132/33 kV
The 5km-long feeder is composed by ACSR 2/0 conductors.
Peak demand 5MW.
Spring / Autumn SummerWinter
...
% of Wind Speed (with respect to the maximum value)
100
90
20
10
0
30
70
100
0
30
70
30
70
100
0
30
70
30
70
100
0
30
70
Institute for Energy SystemsThe University of Edinburgh
20
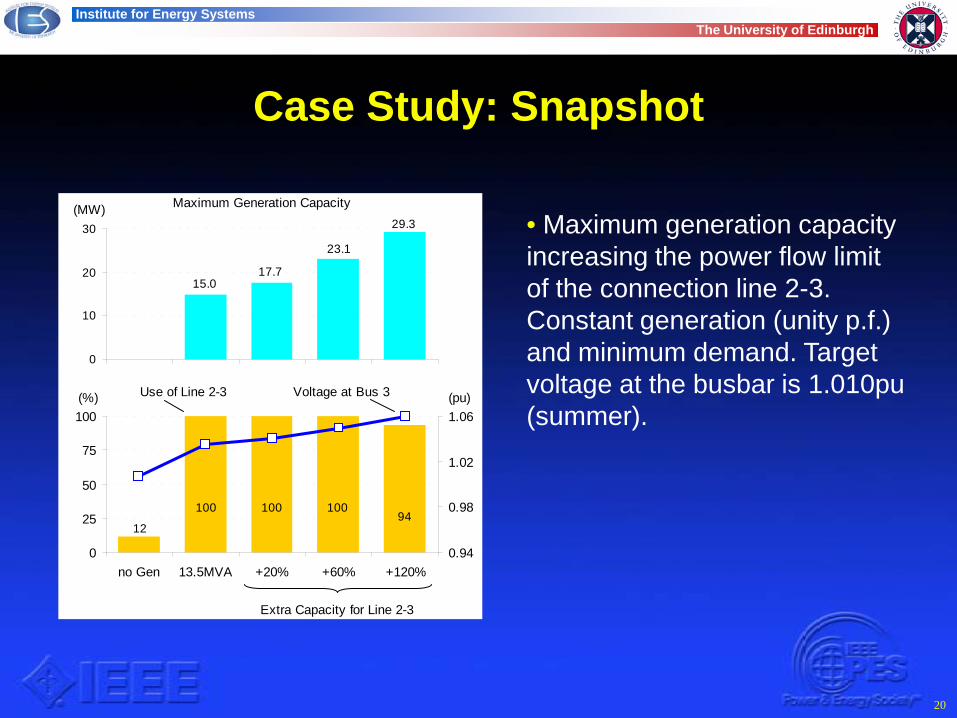
Case Study: Snapshot
Institute for Energy SystemsThe University of Edinburgh
15.017.7
23.1
0
10
20
30
no Gen 13.5MVA +20% +60% +120%
12
100 100 10094
0
25
50
75
100
no Gen 13.5MVA +20% +60% +120%0.94
0.98
1.02
1.06
(MW)
(%) (pu)
Maximum Generation Capacity
Use of Line 2-3 Voltage at Bus 3
Extra Capacity for Line 2-3
29.3 • Maximum generation capacity increasing the power flow limit of the connection line 2-3. Constant generation (unity p.f.) and minimum demand. Target voltage at the busbar is 1.010pu (summer).

21
Connectable (renewable) DG capacity
Dynamic Ratings + CVC + unity PF:DG penetration doubles that without ANM
0.95 (i)
Unity
0.95 (c)
no CVCno CVC
CVC
34.7
37.1
35.4
30.1
22.2
17.8
15.1
16.4
15.8
0
10
20
30
(MW)
MaximumGeneration Capacity
Dynamic Ratings
Static Seasonal Ratings
Institute for Energy SystemsThe University of Edinburgh
• Connectable wind power generation capacity (in MW) considering static seasonal ratings and dynamic ratings, as well as the use of coordinated voltage control (CVC).
• ER P27 temperatures are adopted.

22
Connectable (renewable) DG capacity
This new set of temperatures translated into an average increase of 3.7%
36.835.4
38.5
36.0
34.7
37.1
30
40
0.95 (i) Unity 0.95 (c)
16.417.0
15.615.1
16.4 15.8
10
20
0.95 (i) Unity 0.95 (c)
Dynamic Ratings + CVC
Static Seasonal Ratings, no CVC
ER P27
Average Seasonal Temperatures
(MW)
(MW)
Institute for Energy SystemsThe University of Edinburgh
• Average seasonal temperatures derived from the 2003 time-series data for central Scotland (3.9°, 9.2°, 15.2°C, in winter, spring/autumn, and summer, respectively)

23
Conclusions
Windy sites are ideal for the harvesting of such renewable resource. At the same time, given the cooling effect of wind, larger volumes of power can be transferred through overhead lines without reaching critical points. This is a win-win scenario where the resource being harvested also frees transfer capacity that otherwise would be achieved with conventional reinforcements.
Institute for Energy SystemsThe University of Edinburgh

24
Conclusions
Compared to the widely used passive operation of distribution networks, very high penetration levelsof new variable generation capacity can be reachedby strategically adopting Smart Grid-like control schemes.
Institute for Energy SystemsThe University of Edinburgh
25
Conclusions
This AC OPF-based planning tool allows quantification of the benefits in terms of the ability of innovative schemes to ‘free up’ capacity, and thus, help justify the corresponding investment.
It is important, however, that each solution, or the combination of them, should be assessed on a case-by-case basis since network characteristics drive the performance and cost-effectiveness of each scheme.
Institute for Energy SystemsThe University of Edinburgh

26
Thanks!
Questions?
Institute for Energy SystemsThe University of Edinburgh
Dr Nando [email protected]