Demonstrating Our Value: Practical Approaches to Effective Library Assessment Steve Hiller Director,...
92
Demonstrating Our Value: Practical Approaches to Effective Library Assessment Steve Hiller Director, Assessment and Planning University of Washington Libraries Visiting Program Officer, Association of Research Libraries Hawaii Library Association Preconference Workshop November 9, 2007
-
Upload
emery-fleming -
Category
Documents
-
view
215 -
download
0
Transcript of Demonstrating Our Value: Practical Approaches to Effective Library Assessment Steve Hiller Director,...

Demonstrating Our Value: PracticalApproaches to Effective Library
Assessment
Steve Hiller Director, Assessment and PlanningUniversity of Washington Libraries
Visiting Program Officer, Association of Research Libraries
Hawaii Library AssociationPreconference Workshop
November 9, 2007

Workshop GoalAfter This Session You’ll Say
Free Speech Wall in Charlottesville, VA Site of 2006 Library Assessment Conference

What Makes a Good Library?
• Library “Goodness” traditionally defined internally: – Quality (Bigger was better!)
– Access and availability
– Effectiveness
– Efficiency
– Economy
– Equity
• Now focus on : How much good does this library do?– Impact and outcomes for customers
– Value to customers and stakeholders
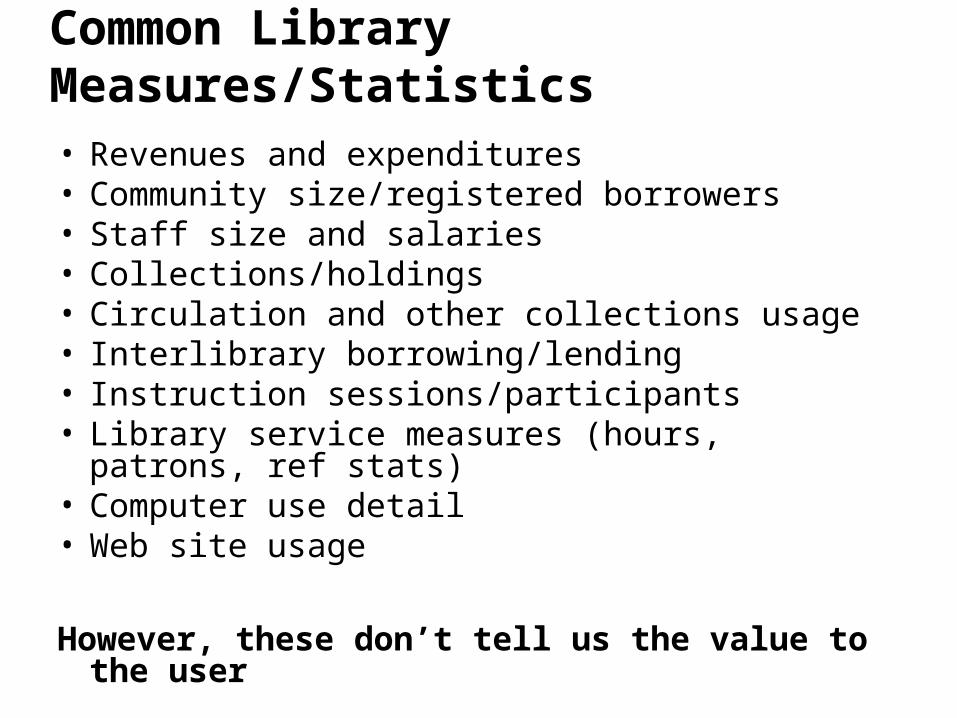
Common Library Measures/Statistics
• Revenues and expenditures• Community size/registered borrowers• Staff size and salaries• Collections/holdings• Circulation and other collections usage • Interlibrary borrowing/lending• Instruction sessions/participants• Library service measures (hours, patrons, ref stats)• Computer use detail • Web site usage
However, these don’t tell us the value to the user
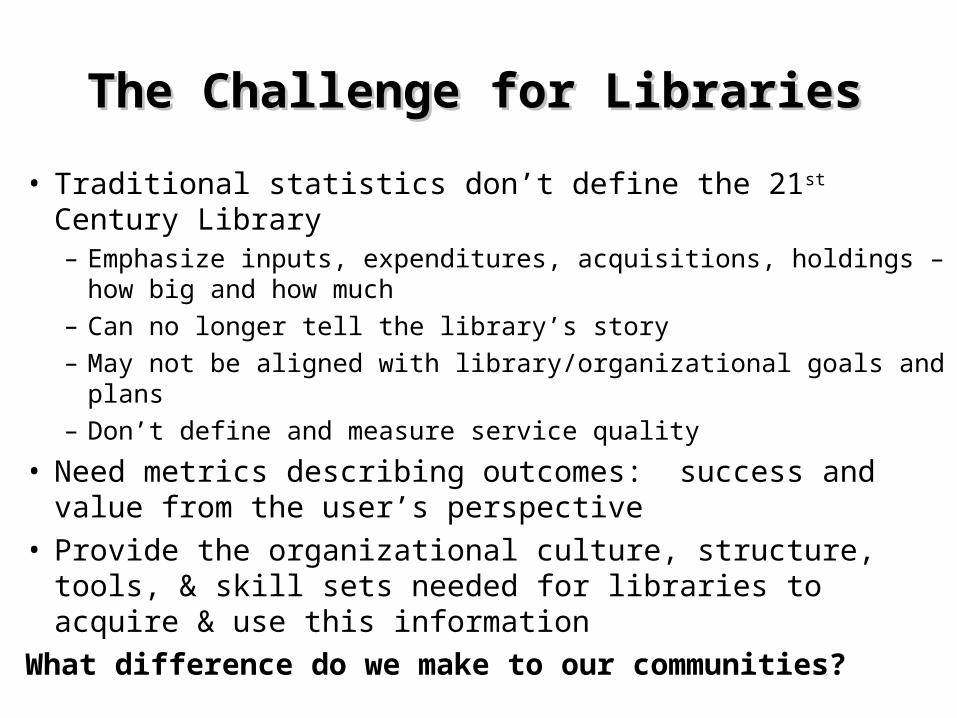
The Challenge for LibrariesThe Challenge for Libraries
• Traditional statistics don’t define the 21st Century Library– Emphasize inputs, expenditures, acquisitions, holdings – how big
and how much
– Can no longer tell the library’s story
– May not be aligned with library/organizational goals and plans
– Don’t define and measure service quality
• Need metrics describing outcomes: success and value from the user’s perspective
• Provide the organizational culture, structure, tools, & skill sets needed for libraries to acquire & use this information
What difference do we make to our communities?

The Role of Library Assessment
Library assessment provides a structured process to learn about our communities, their work and the libraries connection to what they do
The information acquired through library assessment is used in an iterative manner to improve library programs and services and make our libraries responsive to the needs of our communities.
Libraries do not exist in a vacuum but are part of a
larger organization and community. Assessment may take place at the library level as well as at the broader community level.

Library Assessment Provides Information That Can Be Used for:
• Accountability and justification• Measure progress/achievement • Improvement of services • Comparison with others• Identify changing use and needs patterns
– Remote/In-person– Relevancy of current services and resources– New services
• Marketing and promotion• Telling “our” story• Decisions based on data, not assumptions
– Assumicide!

Customer-Centered Library and the Culture of Assessment
Customer-Centered Library • All services and activities are
viewed through the eyes of the customers
• Customers determine quality
• Library services and resources add value to the customer
Culture of Assessment • Organizational environment in
which decisions are based on facts, research and analysis,
• Services are planned and delivered to maximize positive customer outcomes
It’s not about us! It’s about the customer.

What Do We Need to Know About Our Customers?
• Who are our customers (and potential customers)?• What do they do? How is information used in their work?• How do they work? What’s important to them?• How do libraries support work, learning, leisure and life?• How do they use library services? What would they
change?• How do they differ from each other in library use/needs?
How does the library add value to their work or needs?How does the library contribute to their success?
The Value of Community Assessment
• Know actual and potential customers• Understand needs and use preferences• Use funding and staff effectively• Understand and address “competition”• Community involvement and “ownership” • Marketing, market penetration and outreach• Customer-centering• Measure, demonstrate, present the value of the library
to the community
Life in the Networked World (Adapted from Peter Brophy)
• Personal search replaces ‘ask a librarian’• Global search of the global library
– Google, flickr, del.icio.us; PubMed; Google Scholar– If there’s no response in 3 seconds, try elsewhere
• Then: Resources scarce, attention abundant• Now: Attention scarce, resources abundant
• Social networking/communication - wikis, blogs• Content please. Discovery to Delivery is one action.• Satisficing
– Then: what is the best source of authoritative information?– Now: which is the most readily accessible source of adequate
information?
• Network tools used are embedded in workflow
So Understanding Communities is Critical
• Your communities need library services which are embedded in their:– Workflows– Learnflows– Leisureflows– Lifeflows
• Engage with their languages and their processes of learning, research, leisure and … life
• Learn what’s important to them• Because they may not come to youSupport learning, research and life where they occur –
and surface that support within their lifeflows

How Do We Get Customer Information?
• Surveys• Usage statistics• Focus groups• Observation• Usability• Interviews• Embedding• Data mining (local, institutional)• Logged activities• Comments, suggestions, “over the counter”

If It Was Only This Easy!
Which Services Do We Assess
• Services that are strategically and operationally important• Services that are critical to the success of the library AND
the community• Services that are mandated for review• High performing, heavily used services
– Celebrate their success• High performing, but underused services
– Is marketing needed?– Is the service outmoded?
• Poorly performing services– Can they be fixed? Should they be discontinued?
• New services
Choosing the Assessment Method
• Define the question and need before you start?• Is there existing information you can use?• Is the method appropriate? • Is it timely?• Is it cost effective?• What expertise is needed to conduct and analyze?• How will the results be used?
Are you assessing what’s important?Are you assessing what’s important to your community?

Using Existing Information
• Community/institutional data sources • Previous assessment efforts (library/organization)• Library use data (including e-metrics)• Acquisition requests and interlibrary loan data• Computer/Web log data• Comparative or trend data from other sources
User SurveysQuestions Before You Begin
• What information do you need– Actual or perceived
• Who do you need it from • How will you use it• Is a survey the best way to get it• How soon do you need the information• What resources are available and/or needed• How will you analyze results

Customer Surveys: Some Caveats
• Long lead time may be needed– Survey design, human subjects approval, campus coordination
• Expense (direct and indirect costs)• Tends to measure perceptions not specific experiences• Survey population factors
– Sample size, representativeness, response rate, survey fatigue
• Expertise needed for design, analysis and interpretation• Understanding & using results may be difficult to achieve • Questions often asked from “our” perspective & language• Recognize the value of your respondent’s time

Gresham’s Law Adapted to Web Surveys
Many Bad Web Surveys Drive Down Response to All Surveys
• Logistically easier to create and use Web-based surveys• Can construct surveys without understanding of good
survey methodology• Many web survey characterized by low response rates• Self selection among respondents adds bias• Increasingly difficult to generalize from respondent results
to entire population (even if they are representative)

Sometimes The Data Isn’t Revealing
The Qualitative May Be the Key
• Increasing use of such qualitative methods as comments interviews, focus groups, usability, observation
• Statistics often can’t tell us – Who, how, why– Value, impact, outcomes
• Qualitative provides information directly from users– Their language– Their issues– Their work
• Qualitative provides context and understanding
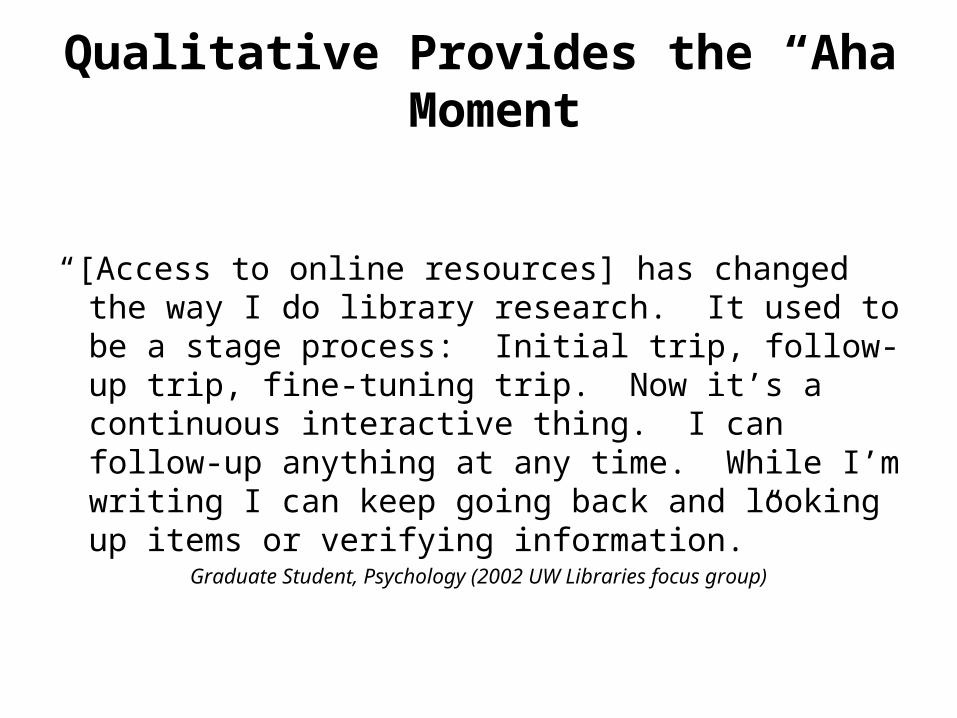
Qualitative Provides the “Aha” Moment
“[Access to online resources] has changed the way I do library research. It used to be a stage process: Initial trip, follow-up trip, fine-tuning trip. Now it’s a continuous interactive thing. I can follow-up anything at any time. While I’m writing I can keep going back and looking up items or verifying information.”
Graduate Student, Psychology (2002 UW Libraries focus group)

Alternatives to Survey/Quantitative Data
• Observations• Interviews• Focus groups• Usability• Comments (solicited/unsolicited) • Customer “panels”• Social networking info• Logged activities

Observational Studies
• Describe user activities in terms of:what they do
how they do it
how much time they take
problems they encounter
• Can be obtrusive or unobtrusive• Can be tied in with interviews or usability• Well-developed data collection method/protocol essential• Room counts/facilities use most common• Quick and inexpensive; can use sampling

Observational Studies
Use For:• Time sensitive• Low-cost support• Reality check• Help identify/define
issues (including usability)
Be Aware Of:• Intruding on users• Not representative• Limited focus• Defining data points
needed• Data collection and
analysis issues
Interviews and Focus Groups
• High degree of customer involvement• Clarify and add context to previously identified issues• Customer defined language and issues• Objective and effective interviewer/facilitator needed• Analysis can be complicated complicated• Can identify broader patterns, themes, consistency but
not generalizeable to broader population• Interview/focus group themes can be followed up with
other methods or they can add context to other data

Interviews
• Becoming the method of choice for understanding user needs, work, behavior and outcomes
• Can be done efficiently and effectively• Purpose defined; questions should be well-thought out• Need skilled/trained interviewer• People like to talk/tell you what they think• Structured but flexibility to follow-up within the
interview

Focus Groups
• Structured discussion to obtain user perceptions and observations on a topic
• Usually composed of 6-10 participants and may be repeated several times with different groups
• Participants within group should be similar• Facilitator or moderator guides discussion • Participants encouraged to share perspectives• Participants learn from each other

Focus Groups
• Use For:• High user involvement
• Identify or clarify issues
• User defined perspective
• Focus group “bounce”
• Intermediate time/cost
• Results can lead to use of other methods
• Be Aware Of:• Topic needs to be clear• External facilitator• Minimum # of participants• Not representative• Complex logistics• Wandering discussion• Transcription costs/time• Complicated analysisIt May Take More Time
Than You Think
Usability: Assessment Success Story
• User-centered design• Apply both to virtual (Web) and physical space
(wayfinding)• Asks users to demonstrate:
– How easy is it to navigate– How easy is it to understand– How easy is it to find– How easy is it to perform– Overall how easy is it to use
• Iterative process

Comments
• Unsolicited• Unstructured (open suggestion “boxes”)• Prompted on specific issues (tell us what you think
about . . . )• Part of another assessment tool (e.g. open-ended
questions/comments on survey)
Comments are valuable for identifying issues of concern, and can add richness and texture. They generally need to be corroborated by other information

Once You Have Data . . . .
• “…but to suppose that the facts, once established in all their fullness, will ‘speak for themselves’ is an illusion.”
Carl BeckerAnnual Address of the President of the American Historical Association, 1931
. . . Comes the difficult parts:• Understanding your data• Communicating results• Using the results for improvement

Use Data Wisely
• Understand your data• Know the limitations of your data• Use appropriate analysis methods and tools• Comparative data provide context and understanding• Seek internal or external validation• Identify what is important and why
Making Data Meaningful
• Summarize• Compare• Analyze• Present• Go below the surface to examine results by:
– Demographic group
– Users and non-users
– Stakeholders vs non-stakeholders
• Compare current data with information from the past• How can we use the data for action?

Analyzing Qualitative Data• Identify key themes• Categorize them• Review for:
– Frequency
– Extensiveness
– Intensity
– Body language
– Specificity
– Consistency
– Language
Specialized (e.g. Atlas T.I.) or standard applications (e.g. MS Access) can be used to help analyze

Presenting Data and Results
• Make sure data/results are:– Timely
– Understandable
– Usable
• Identify important findings/key results– What’s important to know
– What’s actionable
• Present key/important results to:– Library administration/institutional administration
– Library staff
– Other libraries/interested parties/stakeholders
Be Graphic!!!
“Often the most effective way to describe, explore and summarize a set of numbers – even a very large set – is to look at pictures of those numbers.
Furthermore, of all methods for analyzing and communicating statistical information, well designed data graphics are usually the simplest and at the same time the most powerful.”
Edward TufteThe Visual Display of Quantitative Information"The Leonardo da Vinci of data." THE NEW YORK TIMES

Presenting Results: What’ s Important
• What’s the message?– Fewer “messages” means greater impact
• Who’s the audience– Multiple audiences may need different presentations
• How is it presented?– Quantitative data
• Tables, charts, text, “data”
– Qualitative data• Be selective, use direct quotes from users
• How is the presentation structured?

Sometimes the Evidence Isn’t Enough: Organizational Issues and Assessment
ARL Sponsored Assessment Activities
• A gateway to assessment tools: StatsQUAL®:
– ARL Statistics -- E-Metrics
– LibQUAL+®
– DigiQUAL®
– MINES for Libraries®
TOOLS ARE NOT ENOUGH . . .
• Building a community of assessment practice– Library Assessment Conferences– Service Quality Evaluation Academy– Library Assessment Blog– Making Library Assessment Work– ESP Assessment (Effective, Sustainable, Practical)
“Making Library Assessment Work”
• ARL project approved in 2004 to evaluate assessment efforts in participating libraries
• Site visits by Steve Hiller (UW) and Jim Self (UVa) to 24 libraries in the U.S. and Canada during 2005-06– Presentation
– Interviews and meetings
– Report to the Library
• Succeeded by Effective, Sustainable and Practical Library Assessment in 2007– Open to all libraries
– 6 libraries participating in 2007

What We Found: Organizational Development & Structure Issues are Critical
• Strong interest in using assessment to improve customer service and demonstrate value of library
• Many libraries uncertain on how to establish, maintain, and sustain effective assessment; need assessment skills
• Effectiveness of assessment program not dependent on library size or budget
• Each library has a unique culture and mission. No “one size fits all” approach works.
• Strong customer-focus and leadership support are keys to developing effective and sustainable assessment

Effective Assessment
• Is customer-focused• Is aligned with library and organizational goals• Assesses what is important• Develops criteria for success• Uses appropriate and multiple assessment methods• Uses corroboration from other sources• Provides results that can be used

Sustainable Assessment needs . . • Organizational leadership• Sufficient resources• Supportive organizational culture• Identifiable organizational responsibility • Connection to strategic planning and library priorities• Iterative process of data collection, analysis, and use • Involvement of customers, staff and stakeholders

Practical Assessment • Keep it simple and focused – “less is more”• Know when enough is enough• Use assessment that adds value for customers• Present results that are understandable• Organize to act on results
There Will Be Assessment Skeptics!
“ Oh, people can come up with statistics to prove anything Kent [Brockman]. 14% of people know that.”
“Facts are meaningless. You could use facts to prove any-thing that's even remotely true!”
Homer Simpson

University of Washington(Site of the 2008 Library Assessment Conference!)
• Located in beautiful Seattle metro population 3.2 million
• Comprehensive public research university – 27,000 undergraduate students– 12,000 graduate and professional
students (80 doctoral programs)– 4,000 research and teaching
faculty
• $800 million annually in federal research funds (2nd in U.S.)
• Large research library system– $40 million annual budget– 150 librarians on 3 campuses

UW Libraries Assessment Priorities:Customer Needs, Use Patterns, and Success
• Information seeking behavior and use• Patterns of library use• Value of library• User needs• Library contribution to customer success• User satisfaction with services, collections, overall• Data to make informed and wise decisions that lead to
resources and services that contribute to user success

UW Libraries: Assessment Methods Used
• Large scale user surveys every 3 years (“triennial survey”): 1992, 1995, 1998, 2001, 2004, 2007 – All faculty – Samples of undergraduate and graduate students– Research scientists, Health Sciences fellow/residents
2004-
• In-library use surveys every 3 years beginning 1993• Focus groups/Interviews (annually since 1998)• Observation (guided and non-obtrusive)• Usability• Use statistics/data miningInformation about assessment program available at:
http://www.lib.washington.edu/assessment/

Qualitative AssessmentSome Examples from UW
• Usability– Library Web site design, OCLC World Cat local, Wayfinding
• Observation– Unobtrusive observation of public access computer use– Faculty and grad searching of bibliographic databases– Use of main library space
• Focus groups– Interlibrary loan, instruction, info seeking behavior, scholarly
communication, bioscientists
• Interviews– Electronic journals, scholarly publishing, finding information,
data management, bioscientists
UW Libraries Biosciences Review (2006)
• Better understand how bioscientists work• Growing inter/multi/trans disciplinary work• Significant change in use patterns• Libraries responsiveness to these changes• Value of research enterprise to the University• Strengthening library connection to research
Ensuring our services and resources support the work of the UW biosciences community

Biosciences Review Process (2006)
• Define scope (e.g. what is “bioscience”?)• Identify and mine existing data sources
– Extensive library assessment data– Institutional and external data
• Acquire new information through a customer-centered qualitative approach – Environmental scan – Interviews (faculty) – Focus groups (faculty, grad students, undergrads) – Peer library surveys
NO NEW USER SURVEYS

Biosciences Interview & Focus Group Questions
Interviews• Describe your work• What type of information do
you need and how do you find it?
• What barriers do you encounter?
• What role does the library play in connecting you to information
• What else could the library do to support your work
Focus Groups• How do you find the
information you need?• What barriers do you
encounter?• What other services would
you like to have available?• What services in the library
do you like or appreciate?

Biosciences Faculty Interview Themes
• Library seen primarily as E-Journal provider • Physical library used only for items not available online• Start information search with Google and PubMed• Too busy for training, instruction, workshops• Faculty who teach undergrads use libraries differently• Difficulty coming up with “new library services” unless
prompted
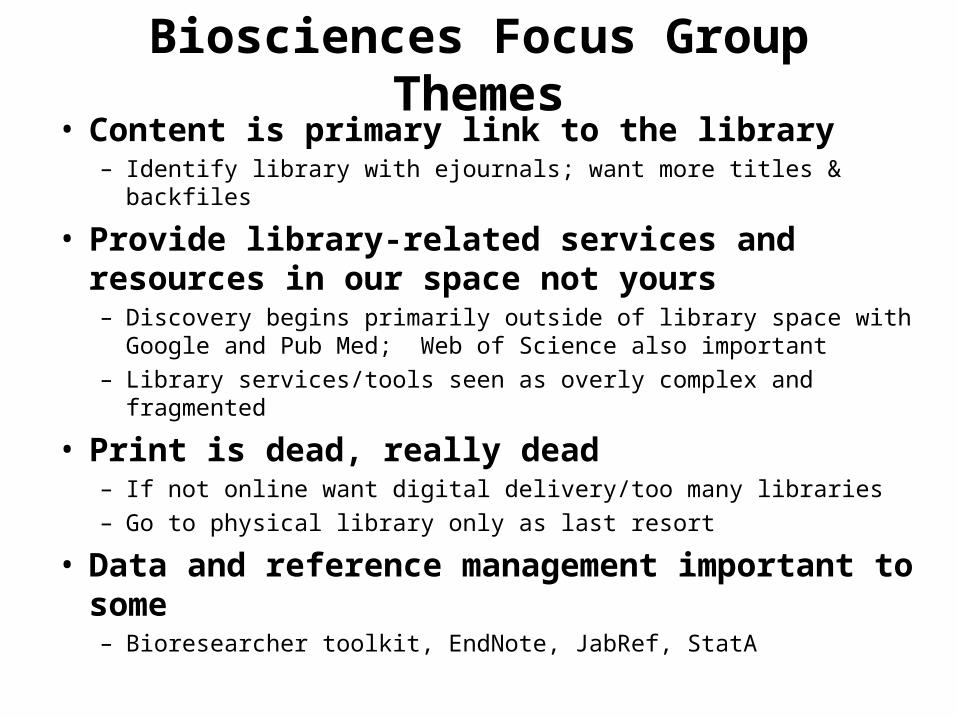
Biosciences Focus Group Themes• Content is primary link to the library
– Identify library with ejournals; want more titles & backfiles
• Provide library-related services and resources in our space not yours– Discovery begins primarily outside of library space with Google and Pub
Med; Web of Science also important
– Library services/tools seen as overly complex and fragmented
• Print is dead, really dead– If not online want digital delivery/too many libraries
– Go to physical library only as last resort
• Data and reference management important to some– Bioresearcher toolkit, EndNote, JabRef, StatA
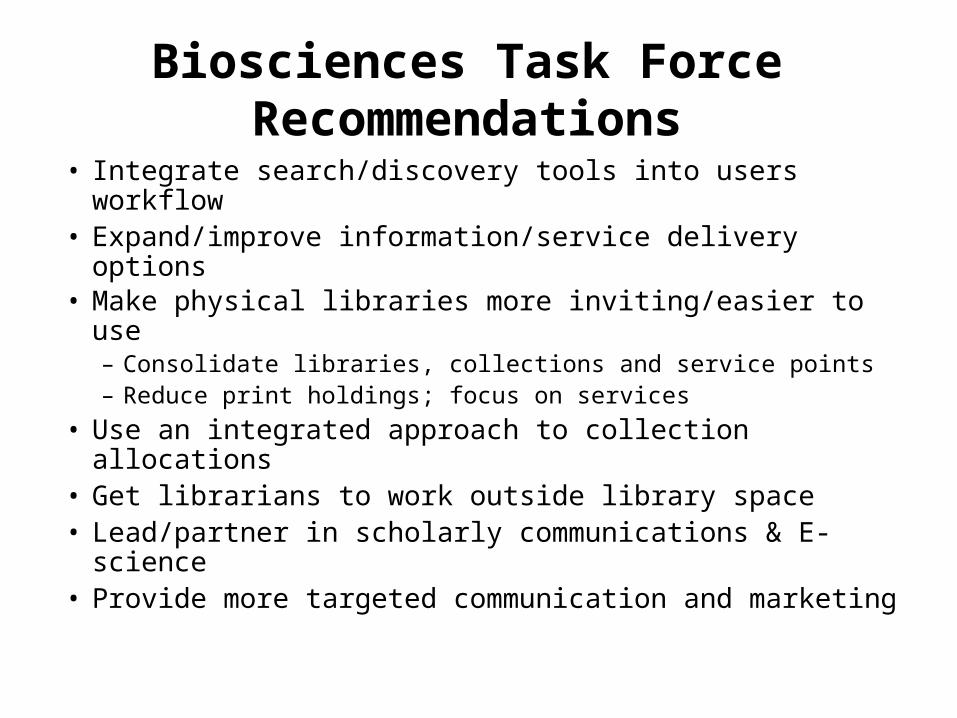
Biosciences Task Force Recommendations
• Integrate search/discovery tools into users workflow• Expand/improve information/service delivery options• Make physical libraries more inviting/easier to use
– Consolidate libraries, collections and service points– Reduce print holdings; focus on services
• Use an integrated approach to collection allocations• Get librarians to work outside library space• Lead/partner in scholarly communications & E-science • Provide more targeted communication and marketing
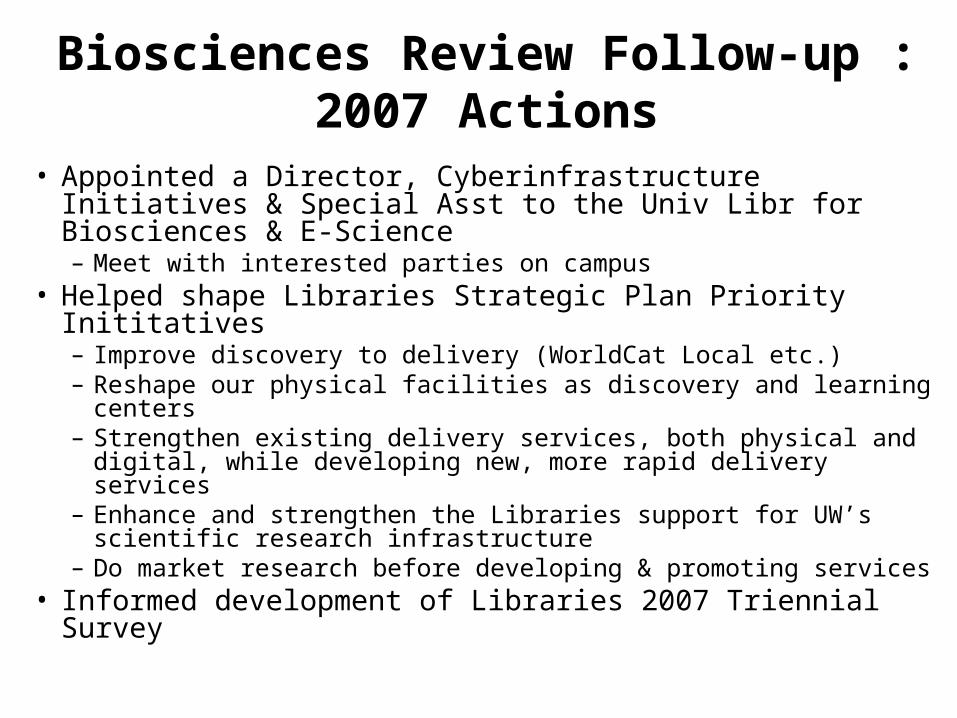
Biosciences Review Follow-up : 2007 Actions
• Appointed a Director, Cyberinfrastructure Initiatives & Special Asst to the Univ Libr for Biosciences & E-Science– Meet with interested parties on campus
• Helped shape Libraries Strategic Plan Priority Inititatives– Improve discovery to delivery (WorldCat Local etc.)– Reshape our physical facilities as discovery and learning centers – Strengthen existing delivery services, both physical and digital,
while developing new, more rapid delivery services– Enhance and strengthen the Libraries support for UW’s scientific
research infrastructure – Do market research before developing & promoting services
• Informed development of Libraries 2007 Triennial Survey

Traditional Library Core Business
• Physical Collections – Print (primarily) – Microforms – Other
• Facilities – House collections– Customer service & work space– Staff work space
• Services– Reference– Instruction– Access
UW Libraries Usage Data
Items Used In-Library2.12 million in 1995-960.36 million in 2006-07
Gate Counts4.64 million in 2002-034.33 million in 2006-07
In-Person Reference Questions142,000 in 2002-03 94,000 in 2006-07
In God We Trust: All Others Must Bring Data
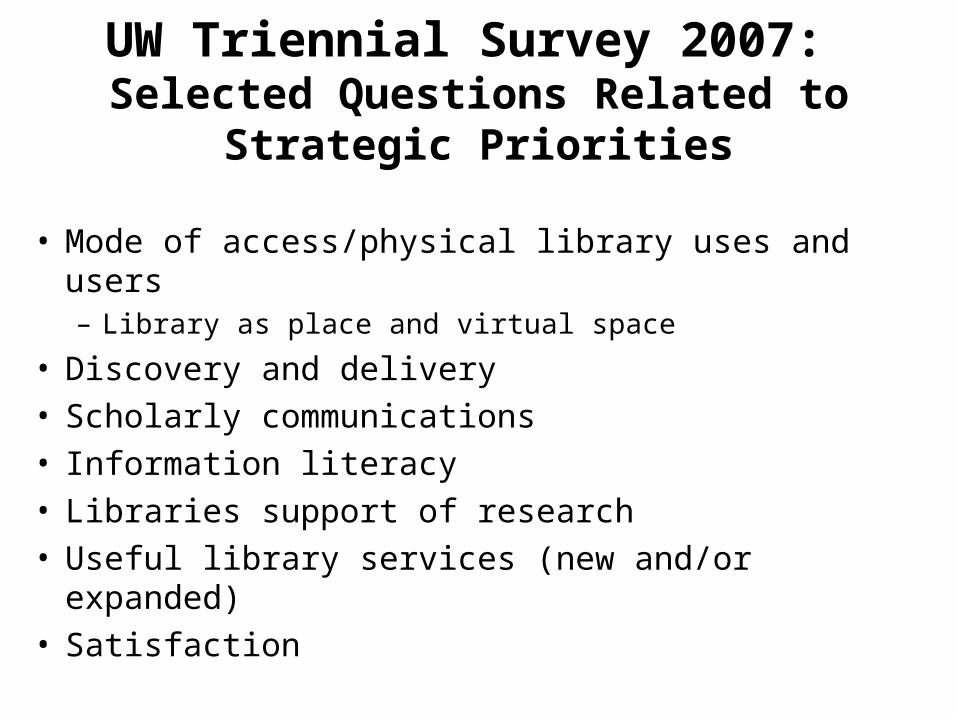
UW Triennial Survey 2007: Selected Questions Related to Strategic Priorities
• Mode of access/physical library uses and users– Library as place and virtual space
• Discovery and delivery• Scholarly communications• Information literacy• Libraries support of research • Useful library services (new and/or expanded)• Satisfaction

UW Triennial Library Survey Number of Respondents and Response Rate 1992-2007
Large number of respondents allows for analysis within groups
2007 2004 2001 1998 1995 1992
Faculty 1455
36%
1560
40%
1345
36%
1503
40%
1359
31%
1108
28%
Grad/Prof
Students
580
33%
627
40%
597
40%
457
46%
409
41%
560
56%
Undergrads 467
20%
502
25%
497
25%
787
39%
463
23%
407
41%
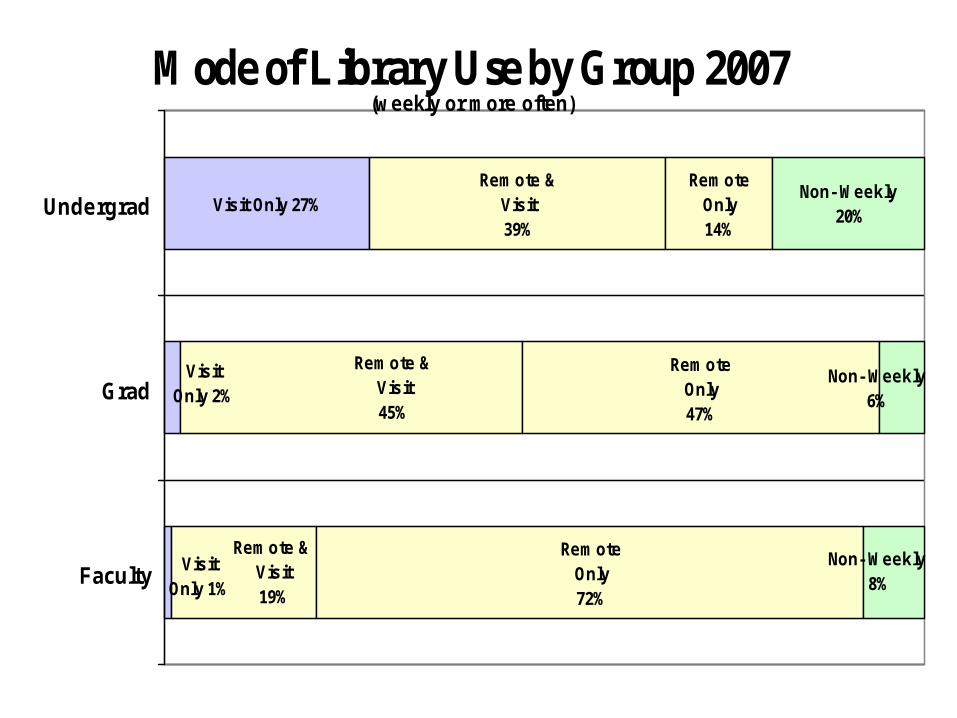
Mode of Library Use by Group 2007 (weekly or more often)
Visit Only 2%
Visit Only 1%
Visit Only 27%
Remote & Visit 19%
Remote & Visit 39%
Remote & Visit45%
Remote Only72%
Remote Only47%
Remote Only14%
Non- Weekly 8%
Non- Weekly6%
Non- Weekly 20%
Faculty
Grad
Undergrad
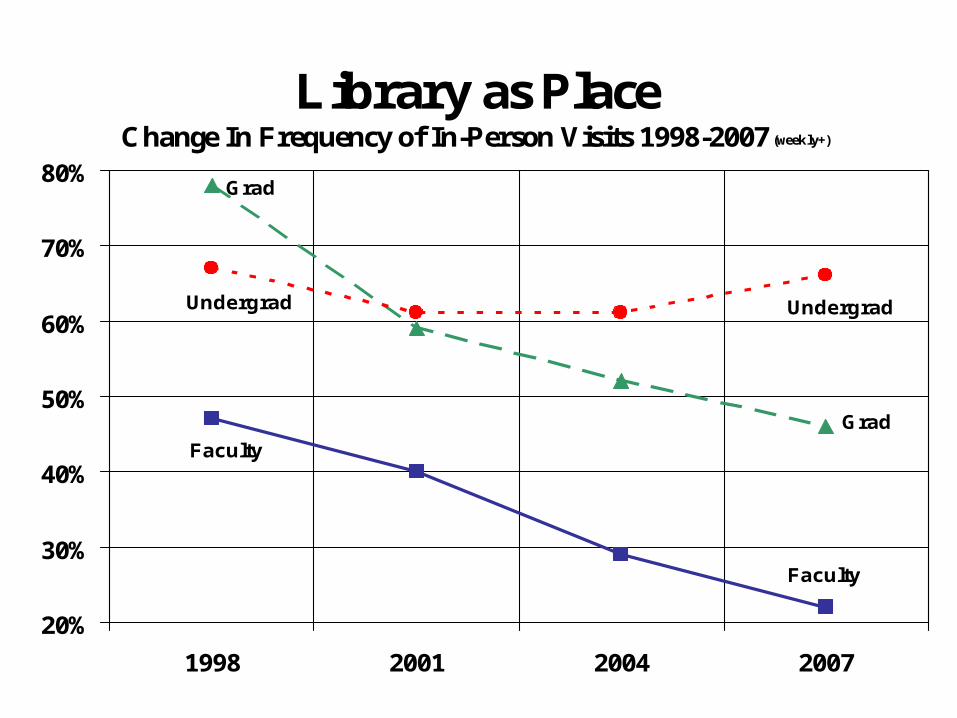
Library as Place Change In Frequency of In-Person Visits 1998-2007 (weekly+)
Faculty
Faculty
Grad
Grad
Undergrad
Undergrad
20%
30%
40%
50%
60%
70%
80%
1998 2001 2004 2007

Reasons for In-Person Library Visits 2001(Faculty and Undergrads Visiting Weekly or More Often)
0%
10%
20%
30%
40%
50%
60%
70%
80%
90%
100%
Use Collections Use space orservices
Only Collections Only space orservices
Faculty
Undergrads
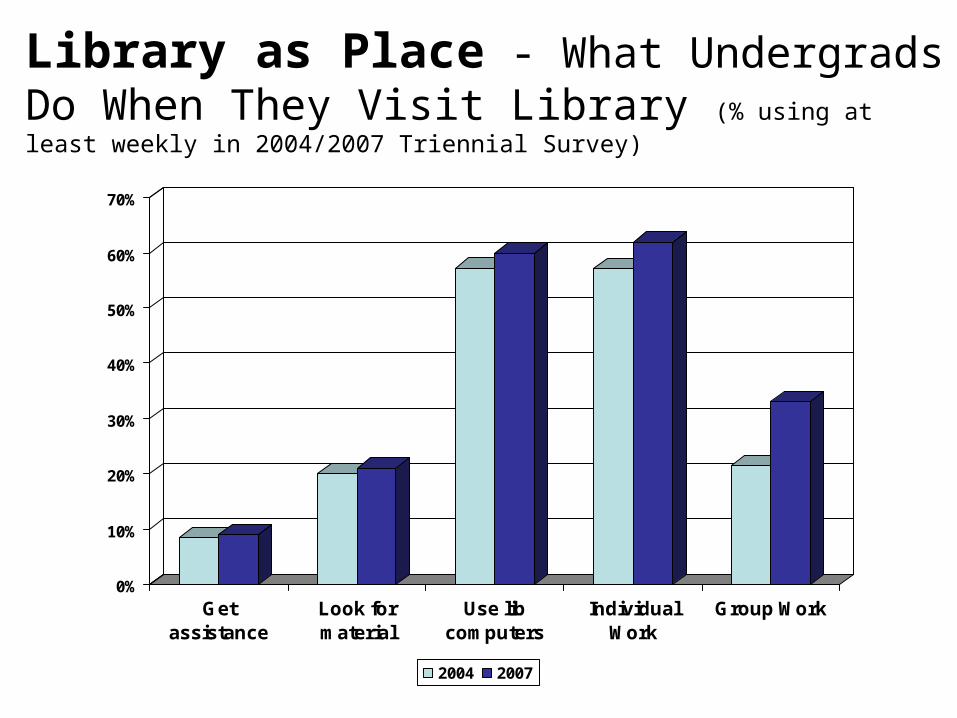
Library as Place - What Undergrads Do When They Visit Library (% using at least weekly in 2004/2007 Triennial Survey)
0%
10%
20%
30%
40%
50%
60%
70%
Getassistance
Look formaterial
Use libcomputers
IndividualWork
Group Work
2004 2007

Library as Place - Usefulness of New and/or Expanded Services for Undergrads (Physical Library Services in Red)
0% 10% 20% 30% 40% 50% 60%
Group/PresentationSpaces
Book Self-Check out
Integrate services intocampus Web sites
More library computers
Increase weekend hours
Quiet work/study areas
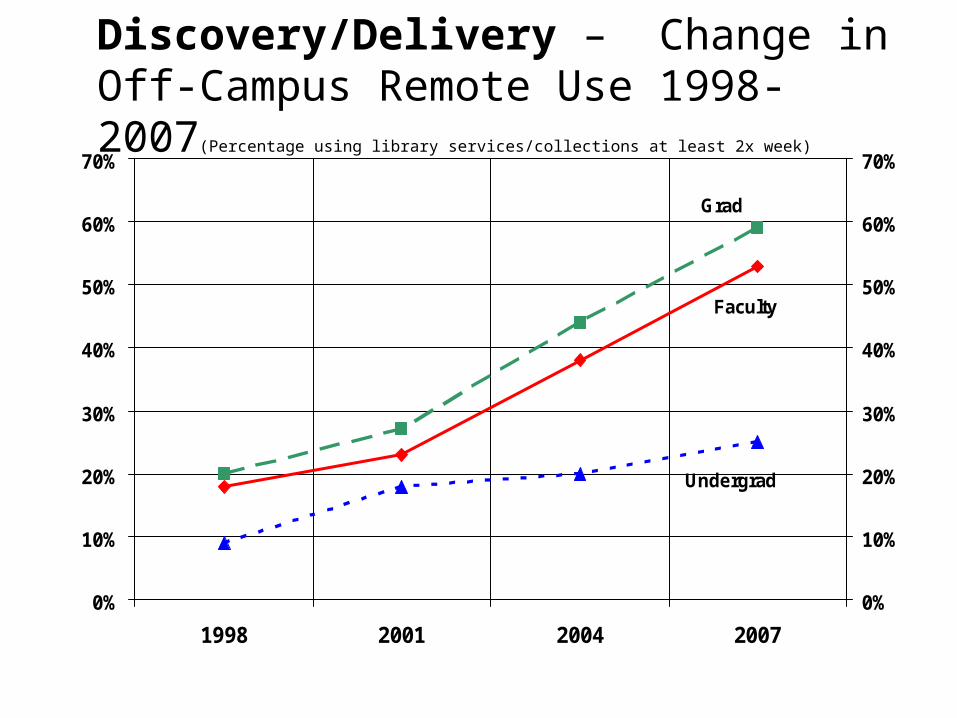
Discovery/Delivery – Change in Off-Campus Remote Use 1998-2007(Percentage using library services/collections at least 2x week)
Faculty
Undergrad
Grad
0%
10%
20%
30%
40%
50%
60%
70%
1998 2001 2004 2007
0%
10%
20%
30%
40%
50%
60%
70%
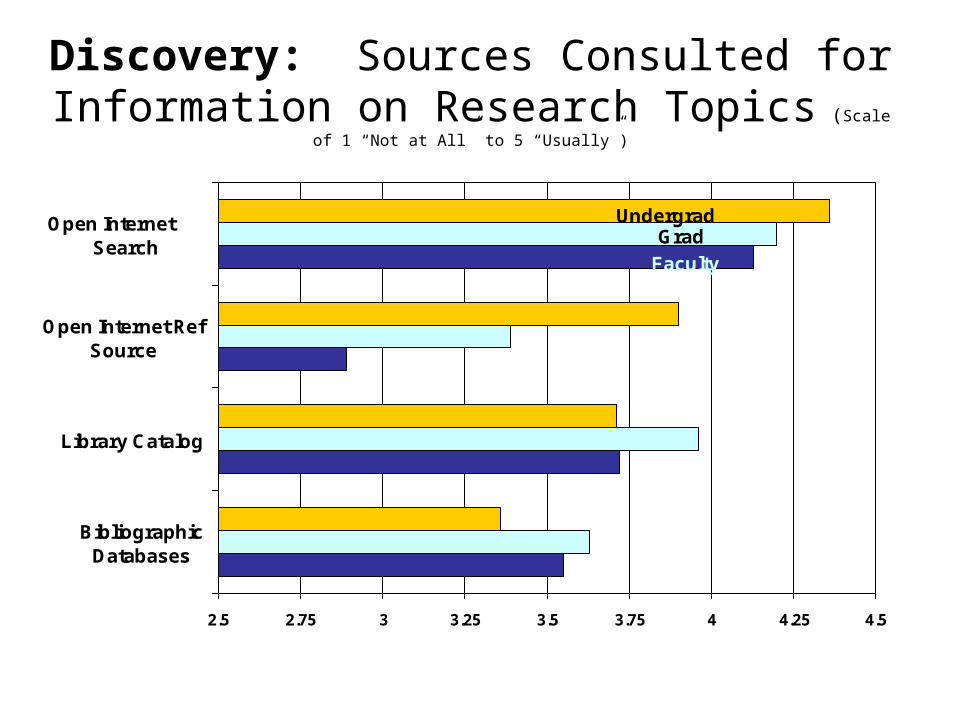
Discovery: Sources Consulted for Information on Research Topics (Scale of 1 “Not at All” to 5 “Usually”)
Faculty
Grad
Undergrad
2.5 2.75 3 3.25 3.5 3.75 4 4.25 4.5
BibliographicDatabases
Library Catalog
Open Internet RefSource
Open Internet Search

Discovery/Delivery - Primary Reasons for Faculty Use of Libraries Web Sites (at least 2x per week)
15%
25%
35%
45%
55%
65%
75%
Health Sci Science-Engin Hum-Soc Sci
Library Catalog Bib Database Online journal articlesThe ability to access full-text or pdf research articles online through the library subscriptions is my primary use of the library and is central to my research. Neurobiology Grad Student

Delivery – Usefulness of New/Expanded Services for Faculty & Graduate Students
0% 10% 20% 30% 40% 50% 60% 70% 80%
Manage your info anddata
Integrate services intocampus Web sites
Office Delivery ofBooks
Digitize specializedcollections
Scan on Demand
Grad Faculty

Scholarly Communications: Important Factors in Where Faculty Publish Journal Articles (% Faculty marking “Very important”)
0% 10% 20% 30% 40% 50% 60% 70% 80% 90% 100%
Journal cost
Retain copyright
Open Access
Library subscription
Journal online
Non-profit pubisher
Journal reputation
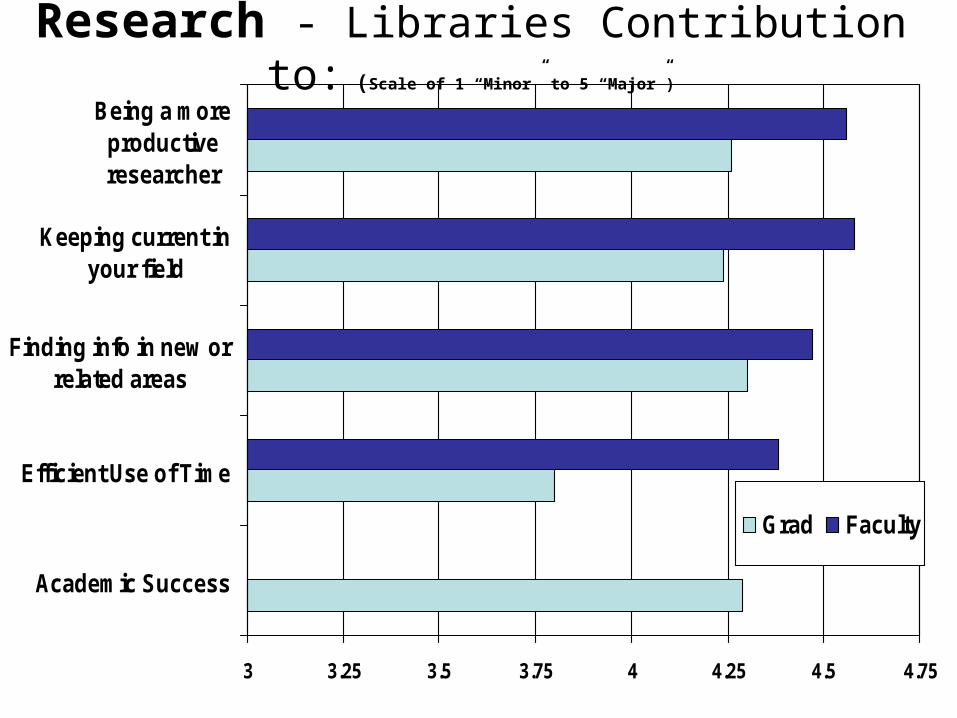
Research - Libraries Contribution to: (Scale of 1 “Minor” to 5 “Major”)
3 3.25 3.5 3.75 4 4.25 4.5 4.75
Academic Success
Efficient Use of Time
Finding info in new orrelated areas
Keeping current inyour field
Being a moreproductiveresearcher
Grad Faculty

Information Literacy – Faculty Rating of Importance to Undergrad Success & Student Performance(% of Faculty marking 4 or 5 on scale of 1 “Low” to 5 “High” in 2007 Triennial Survey)
0% 10% 20% 30% 40% 50% 60% 70% 80% 90% 100%
Finding and RefiningResearch Topics
Finding Info in Library
Finding Info on Web
Critically evaluatinginfo sources
Cite sources correctly
Knowing aboutplagiarism
Performance Importance

Information Literacy: Undergrad Rating of Usefulness for Course Work (Mean score on scale of 1 “Not Useful” to 5 “Very Useful”)
3 3.25 3.5 3.75 4 4.25 4.5
Librarian classpresentation
Research consultwith librarian
Library referenceassistance
Library subjectguides
Course reserves

2007 Triennial Survey Selected Findings Related to Vision 2010
• Long-term changes in mode of use continue– Sharp increase in off-campus remote use by faculty/grad
– Library as place still important to undergraduates
• Discovery takes place increasingly outside of library space• Faculty/grad want content delivered to them in their
format of choice and in their space (virtual/physical)• Faculty decision to publish based on reputation/readership• Libraries is major contributor to research productivity• Faculty view information literacy “competencies” as
important and undergrad performance as low
What We’ve Learned about the UW Community
• Libraries are still important source of information; however library less integrated into work/learn “flows”
• Library needs/use patterns vary by and within academic areas and groups
• Remote access is preferred method for faculty and grad students and has changed the way they use libraries
• Faculty and students find information and use libraries differently than librarians prefer them too
• Library/information environment is perceived as too complex; users find simpler ways (Google) to get info
• Customers cannot predict the Libraries future
How UW Libraries Has Used Assessment
• Extend hours in Undergraduate Library (24/5.5)• Create more diversified student learning spaces• Eliminate print copies of journals • Enhance usability of discovery tools and website• Provide standardized service training for all staff• Stop activities that do not add value • Consolidate and merge branch libraries• Change/reallocate collections budget• Change/reallocate staffing• Support budget requests to University
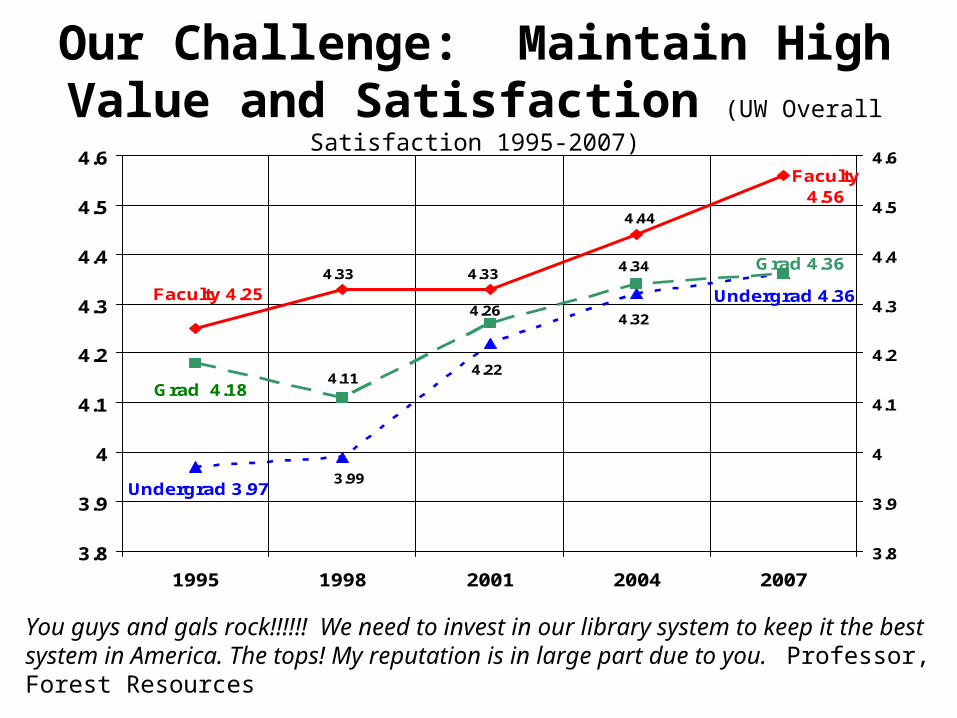
Our Challenge: Maintain High Value and Satisfaction (UW Overall Satisfaction 1995-2007)
Faculty 4.25
4.44
4.33 4.33
Faculty 4.56
Undergrad 3.97 3.99
4.22
4.32
Undergrad 4.36
4.34
4.26
4.11Grad 4.18
Grad 4.36
3.8
3.9
4
4.1
4.2
4.3
4.4
4.5
4.6
1995 1998 2001 2004 2007
3.8
3.9
4
4.1
4.2
4.3
4.4
4.5
4.6
You guys and gals rock!!!!!! We need to invest in our library system to keep it the best system in America. The tops! My reputation is in large part due to you. Professor, Forest Resources

Measuring Outcomes and Performance
• Outcomes are the effect of the library on the environment or target population
• Performance is the degree to which a library is achieving its objectives, particularly in term of users’ needs
• Performance indicators (measures) are quantified statements used to evaluate the performance of the library in achieving its objectives

IFLA Measuring Quality Performance Measurement in Libraries (2007)
Some examples (ISO 11620 compliant)• Resources, infrastructure
– Per capita: user area, seats, expenditures, staff
• Use – User satisfaction; collection use; reference questions
• Efficiency– Cost per user, visit, use, download ; processing speed
• Potentials and Development– % of acq. budget spent electronically, library staff
providing and developing electronic services
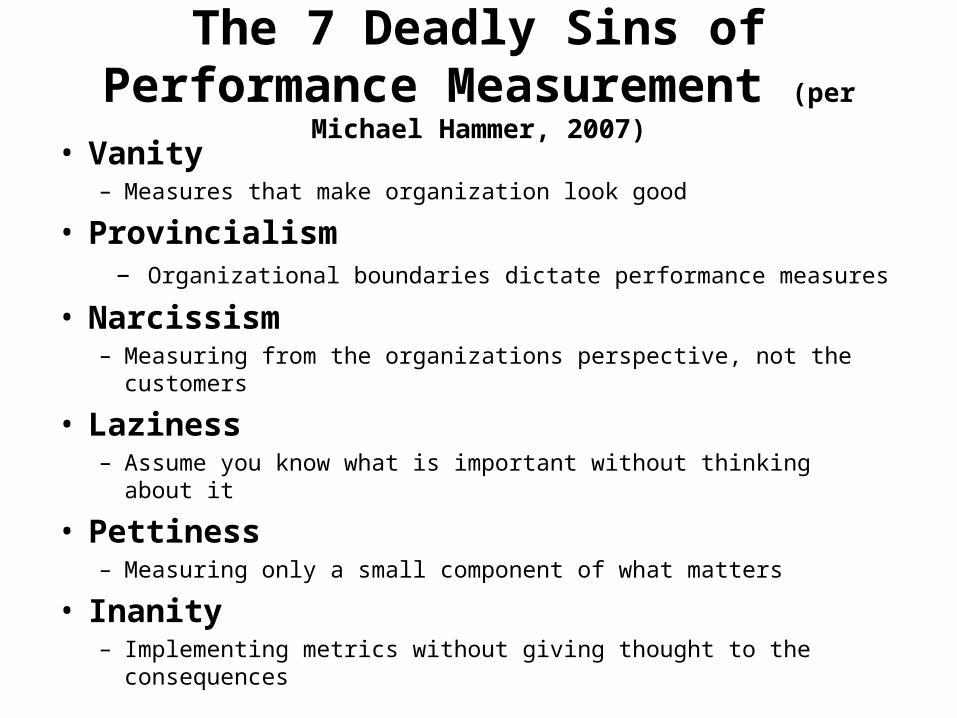
The 7 Deadly Sins of Performance Measurement (per Michael Hammer, 2007)
• Vanity – Measures that make organization look good
• Provincialism – Organizational boundaries dictate performance measures
• Narcissism– Measuring from the organizations perspective, not the customers
• Laziness– Assume you know what is important without thinking about it
• Pettiness– Measuring only a small component of what matters
• Inanity– Implementing metrics without giving thought to the consequences

And the 7th: Frivolity(Not being serious about measurement)
Keys to avoiding these 7 deadly sins• Decide what to measure
– Measure importance to success
• Measure the right way– Consider precision, accuracy, overhead, robustness
• Use metrics systematically– Embed the metrics in disciplined process that uses them
• Create a measurement-friendly culture– Make it part of the value system; leadership is critical
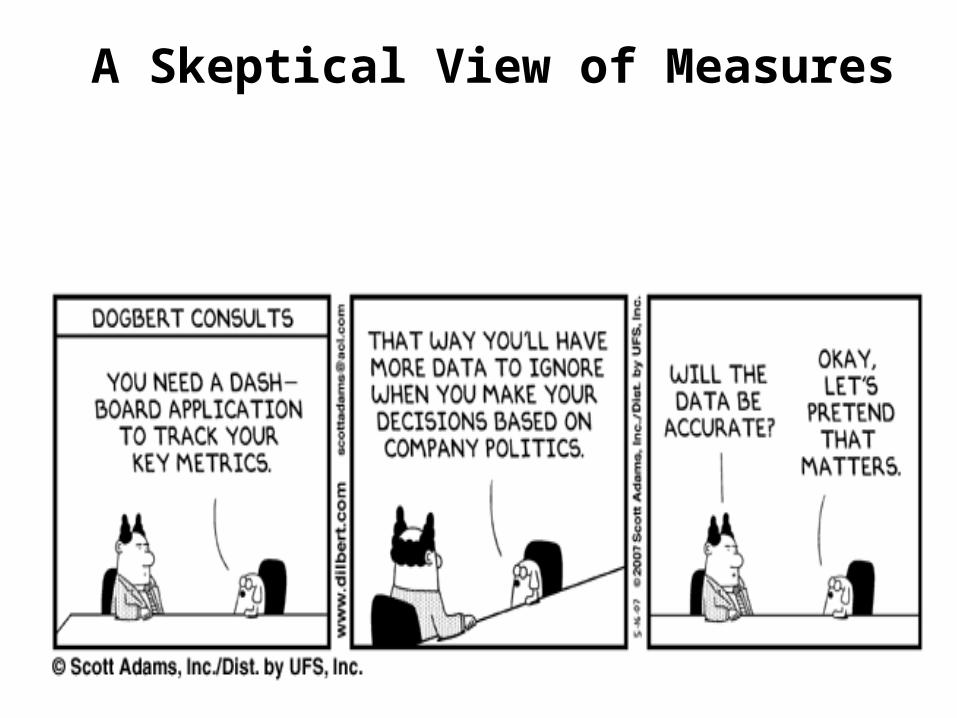
A Skeptical View of Measures
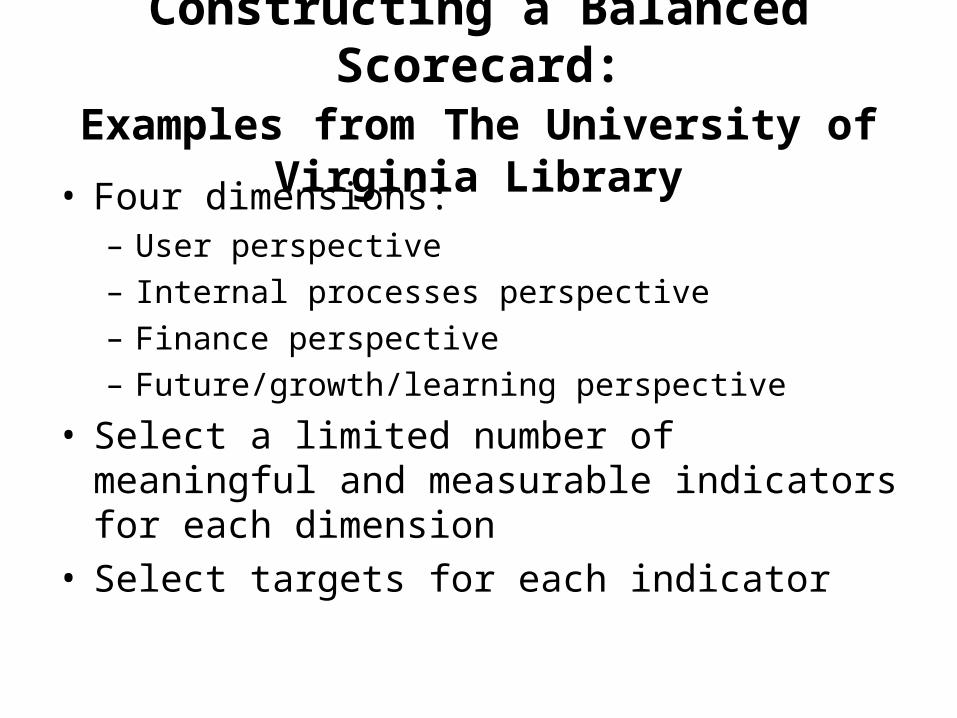
Constructing a Balanced Scorecard:Examples from The University of Virginia Library
• Four dimensions:– User perspective
– Internal processes perspective
– Finance perspective
– Future/growth/learning perspective
• Select a limited number of meaningful and measurable indicators for each dimension
• Select targets for each indicator
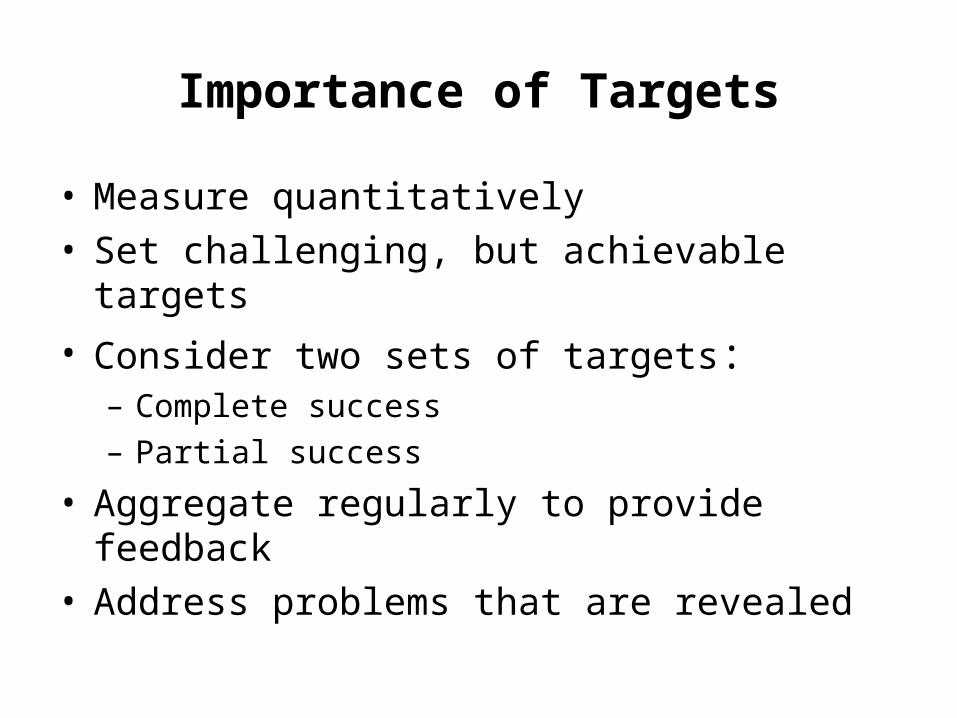
Importance of Targets
• Measure quantitatively• Set challenging, but achievable targets
• Consider two sets of targets:– Complete success
– Partial success
• Aggregate regularly to provide feedback• Address problems that are revealed
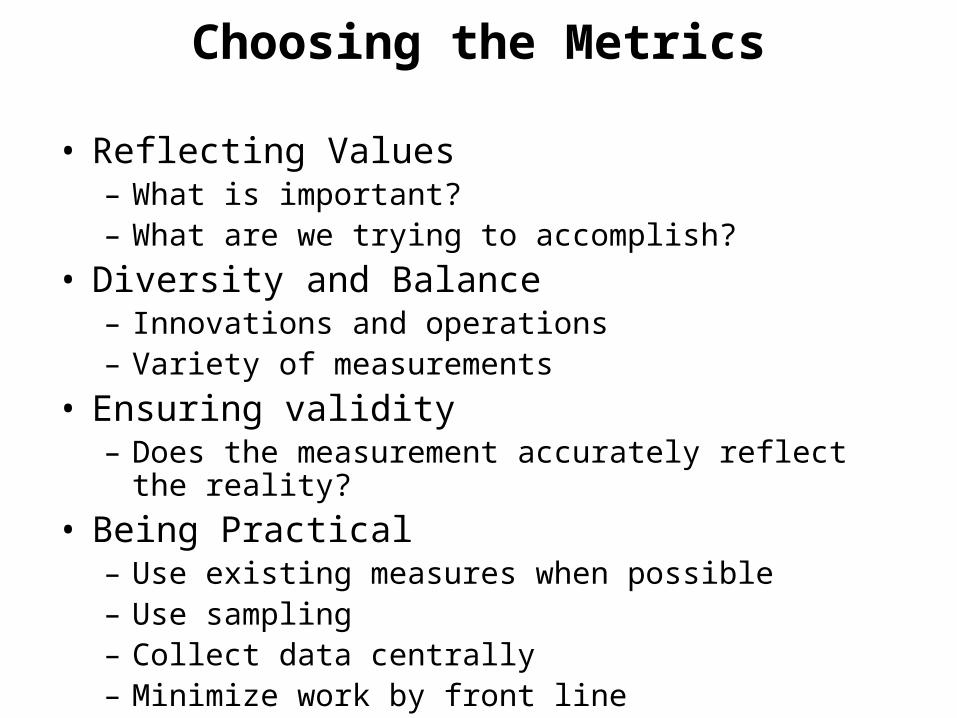
Choosing the Metrics
• Reflecting Values– What is important?– What are we trying to accomplish?
• Diversity and Balance– Innovations and operations– Variety of measurements
• Ensuring validity– Does the measurement accurately reflect the reality?
• Being Practical– Use existing measures when possible– Use sampling– Collect data centrally– Minimize work by front line

Balanced Scorecard Examples
User Perspective• Overall rating in student and faculty surveys
– Target1: An average score of at least 4.25 (out of 5.00) from each of the major constituencies
– Target2: A score of at least 4.00
Internal Processes• Processing time for routine acquisitions
– Target1: Process 90% of in-print books from North America within one month.
– Target2: Process 80% of in-print books from North America within one month
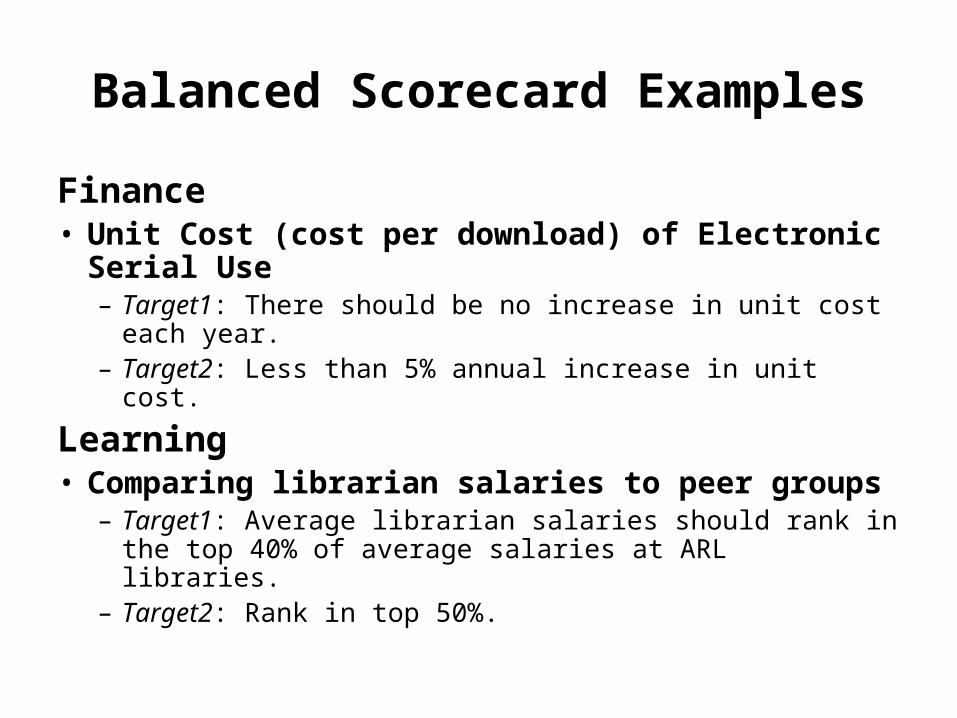
Balanced Scorecard Examples
Finance• Unit Cost (cost per download) of Electronic Serial
Use– Target1: There should be no increase in unit cost each year.– Target2: Less than 5% annual increase in unit cost.
Learning• Comparing librarian salaries to peer groups
– Target1: Average librarian salaries should rank in the top 40% of average salaries at ARL libraries.
– Target2: Rank in top 50%.
To summarize…The Balanced Scorecard
• Reflects the organization’s vision• Clarifies and communicates the vision• Provides a quick, but comprehensive, picture of the
organization’s health

Developing an Assessment Plan
• Understand organizational mission, goals, objectives• Align with library strategic plan and operations• Identify and prioritize what’s important
– To the larger organization/community, customers and the library
• Develop meaningful outcomes• Develop realistic performance indicators and measures• Identify resource needs, data sources and action
responsibilities and adjust plan as appropriate• Develop and implement timeline• Learn, evaluate and improve

The Goal is Practical Assessment Results That Can Be Used!
• Keep it simple and focused – “less is more”• Know when “good ‘nuff” is good enough• Focus on what is important to your customers and
stakeholders• Use assessment where it can add value to customers• Present results so they are understandable and
actionable• Libraries are organized to act on results
And remember . . . it’s not about us!
Remember to Use Assessment Data for Good! Remember to Use Assessment Data for Good!