Demographics for 1111 Bishop St
3
Log In Become a free member For Sale For Lease Find a Broker Add Listing My LoopNet Demographics for 1111 Bishop St., Honolulu, HI 96813 Population 1-mi. 3-mi. 5-mi. 2015 Male Population 22,168 99,363 171,145 2015 Female Population 22,675 99,873 168,866 % 2015 Male Population 49.43% 49.87% 50.34% % 2015 Female Population 50.57% 50.13% 49.66% 2015 T otal Population: Adult 37,990 167 ,133 282,693 2015 T otal Daytime Population 124,431 333,660 476,184 2015 T otal Employees 101,494 233,909 302,697 2015 T otal Population: Median Age 44 42 40 2015 T otal Population: Adult Median Age 51 49 48 2015 T otal population: Under 5 years 2,020 9,447 17 ,376 2015 T otal population: 5 to 9 years 1,791 8,728 16,034 2015 T otal population: 10 to 14 years 1,941 8,728 15,293 2015 T otal population: 15 to 19 years 1,934 9,086 16,442 2015 T otal population: 20 to 24 years 2,888 14,240 26,839 2015 T otal population: 25 to 29 years 3,519 16,760 29,695 2015 T otal population: 30 to 34 years 3,220 14,917 26,335 2015 T otal population: 35 to 39 years 2,743 12,315 21,493 2015 T otal population: 40 to 44 years 2,954 12,873 21,600 2015 T otal population: 45 to 49 years 2,934 12,590 20,729 2015 T otal population: 50 to 54 years 3,166 13,649 21,905 2015 T otal population: 55 to 59 years 3,341 14,046 22,545 2015 T otal population: 60 to 64 years 2,990 12,847 20,501 2015 T otal population: 65 to 69 years 2,710 11,560 18,303 2015 T otal population: 70 to 7 4 years 2,095 8,015 12,833 2015 T otal population: 75 to 79 years 1,575 6,107 9,890 2015 T otal population: 80 to 84 years 1,347 5,488 9,140 2015 T otal population: 85 years and over 1,675 7 ,840 13,058 % 2015 Total population: Under 5 years 4.50% 4.74% 5.11% % 2015 Total population: 5 to 9 years 3. 99% 4.38% 4.72% % 2015 T otal population: 10 to 14 years 4.33% 4.38% 4.50% % 2015 T otal population: 15 to 19 years 4.31% 4.56% 4.84% % 2015 T otal population: 20 to 24 years 6.44% 7 .15% 7.89% % 2015 T otal population: 25 to 29 years 7 .85% 8.41% 8.73% % 2015 T otal population: 30 to 34 years 7 .18% 7 .49% 7.75% % 2015 T otal population: 35 to 39 years 6.12% 6.18% 6.32% % 2015 T otal population: 40 to 44 years 6.59% 6.46% 6.35% % 2015 T otal population: 45 to 49 years 6.54% 6.32% 6.10% % 2015 T otal population: 50 to 54 years 7 .06% 6.85% 6.44% % 2015 T otal population: 55 to 59 years 7.45% 7.05% 6.63% % 2015 T otal population: 60 to 64 years 6.67% 6.45% 6.03% % 2015 T otal population: 65 to 69 years 6.04% 5.80% 5.38% % 2015 T otal population: 70 to 7 4 years 4.67% 4.02% 3.77% % 2015 T otal population: 75 to 79 years 3.51% 3.07% 2.91% % 2015 T otal population: 80 to 84 years 3.00% 2.75% 2.69% % 2015 T otal population: 85 years and over 3.7 4% 3.94% 3.84% 2015 White alone 6,061 32,637 67 ,334 2015 Black or African American alone 852 3,240 8,712 2015 American Indian and Alaska Native alone 113 447 953 2015 Asian alone 27,017 110,516 175,818 2015 Native Hawaiian and OPI alone 4,146 19,391 28,399 2015 Some Other Race alone 392 1,962 3,962 2015 Two or More Races alone 6,262 31,043 54,833 2015 Hispanic 2,606 11,669 22,159 2015 Not Hispanic 42,237 187,567 317 ,852 % 2015 White alone 13.52% 16.38% 19.80% % 2015 Black or African American alone 1.90% 1.63% 2.56% Enter a location s for sale
description
demo for area surrounding
Transcript of Demographics for 1111 Bishop St
7/21/2019 Demographics for 1111 Bishop St
http://slidepdf.com/reader/full/demographics-for-1111-bishop-st 1/3
Log IBecome a free member
For Sale For Lease Find a Broker Add Listing My LoopNet
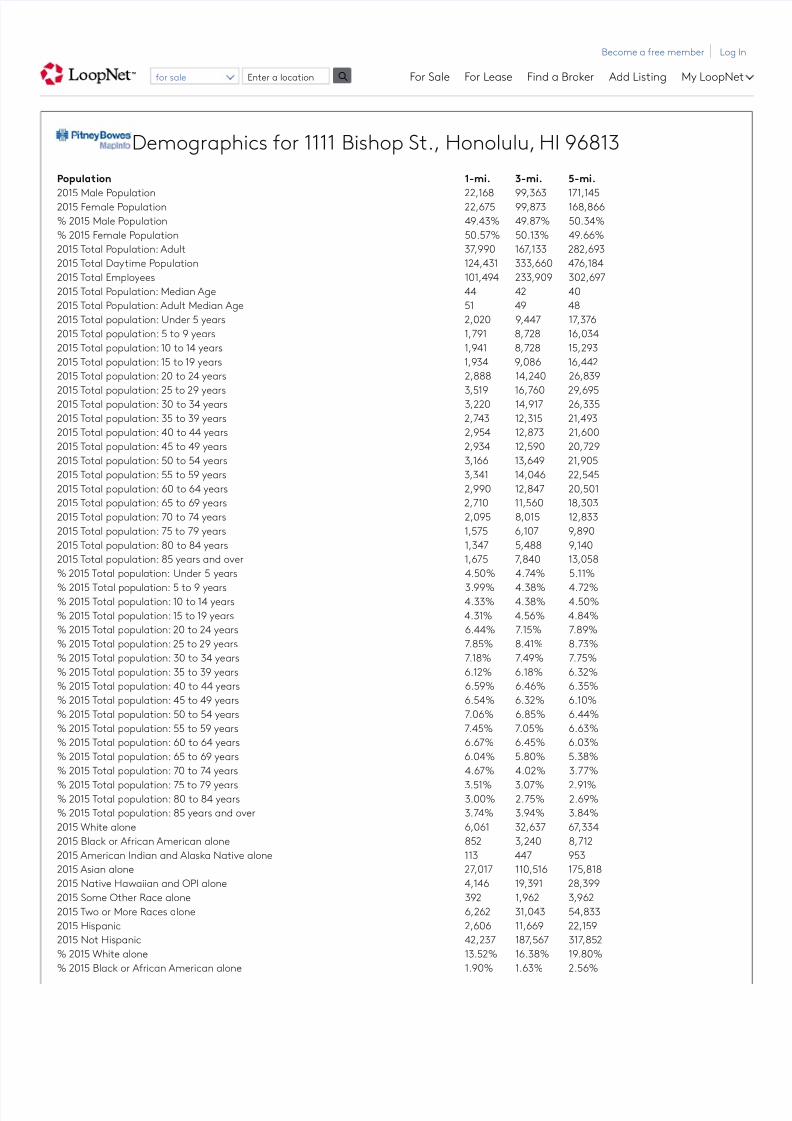
Demographics for 1111 Bishop St., Honolulu, HI 96813
Population 1-mi. 3-mi. 5-mi.
2015 Male Population 22,168 99,363 171,1452015 Female Population 22,675 99,873 168,866
% 2015 Male Population 49.43% 49.87% 50.34%
% 2015 Female Population 50.57% 50.13% 49.66%
2015 Total Population: Adult 37,990 167,133 282,693
2015 Total Daytime Population 124,431 333,660 476,184
2015 Total Employees 101,494 233,909 302,697
2015 Total Population: Median Age 44 42 40
2015 Total Population: Adult Median Age 51 49 48
2015 Total population: Under 5 years 2,020 9,447 17,376
2015 Total population: 5 to 9 years 1,791 8,728 16,034
2015 Total population: 10 to 14 years 1,941 8,728 15,293
2015 Total population: 15 to 19 years 1,934 9,086 16,442
2015 Total population: 20 to 24 years 2,888 14,240 26,839
2015 Total population: 25 to 29 years 3,519 16,760 29,6952015 Total population: 30 to 34 years 3,220 14,917 26,335
2015 Total population: 35 to 39 years 2,743 12,315 21,493
2015 Total population: 40 to 44 years 2,954 12,873 21,600
2015 Total population: 45 to 49 years 2,934 12,590 20,729
2015 Total population: 50 to 54 years 3,166 13,649 21,905
2015 Total population: 55 to 59 years 3,341 14,046 22,545
2015 Total population: 60 to 64 years 2,990 12,847 20,501
2015 Total population: 65 to 69 years 2,710 11,560 18,303
2015 Total population: 70 to 74 years 2,095 8,015 12,833
2015 Total population: 75 to 79 years 1,575 6,107 9,890
2015 Total population: 80 to 84 years 1,347 5,488 9,140
2015 Total population: 85 years and over 1,675 7,840 13,058
% 2015 Total population: Under 5 years 4.50% 4.74% 5.11%
% 2015 Total population: 5 to 9 years 3.99% 4.38% 4.72%% 2015 Total population: 10 to 14 years 4.33% 4.38% 4.50%
% 2015 Total population: 15 to 19 years 4.31% 4.56% 4.84%
% 2015 Total population: 20 to 24 years 6.44% 7.15% 7.89%
% 2015 Total population: 25 to 29 years 7.85% 8.41% 8.73%
% 2015 Total population: 30 to 34 years 7.18% 7.49% 7.75%
% 2015 Total population: 35 to 39 years 6.12% 6.18% 6.32%
% 2015 Total population: 40 to 44 years 6.59% 6.46% 6.35%
% 2015 Total population: 45 to 49 years 6.54% 6.32% 6.10%
% 2015 Total population: 50 to 54 years 7.06% 6.85% 6.44%
% 2015 Total population: 55 to 59 years 7.45% 7.05% 6.63%
% 2015 Total population: 60 to 64 years 6.67% 6.45% 6.03%
% 2015 Total population: 65 to 69 years 6.04% 5.80% 5.38%
% 2015 Total population: 70 to 74 years 4.67% 4.02% 3.77%
% 2015 Total population: 75 to 79 years 3.51% 3.07% 2.91%% 2015 Total population: 80 to 84 years 3.00% 2.75% 2.69%
% 2015 Total population: 85 years and over 3.74% 3.94% 3.84%
2015 White alone 6,061 32,637 67,334
2015 Black or African American alone 852 3,240 8,712
2015 American Indian and Alaska Native alone 113 447 953
2015 Asian alone 27,017 110,516 175,818
2015 Native Hawaiian and OPI alone 4,146 19,391 28,399
2015 Some Other Race alone 392 1,962 3,962
2015 Two or More Races alone 6,262 31,043 54,833
2015 Hispanic 2,606 11,669 22,159
2015 Not Hispanic 42,237 187,567 317,852
% 2015 White alone 13.52% 16.38% 19.80%
% 2015 Black or African American alone 1.90% 1.63% 2.56%
Enter a location sfor sale
7/21/2019 Demographics for 1111 Bishop St
http://slidepdf.com/reader/full/demographics-for-1111-bishop-st 2/3
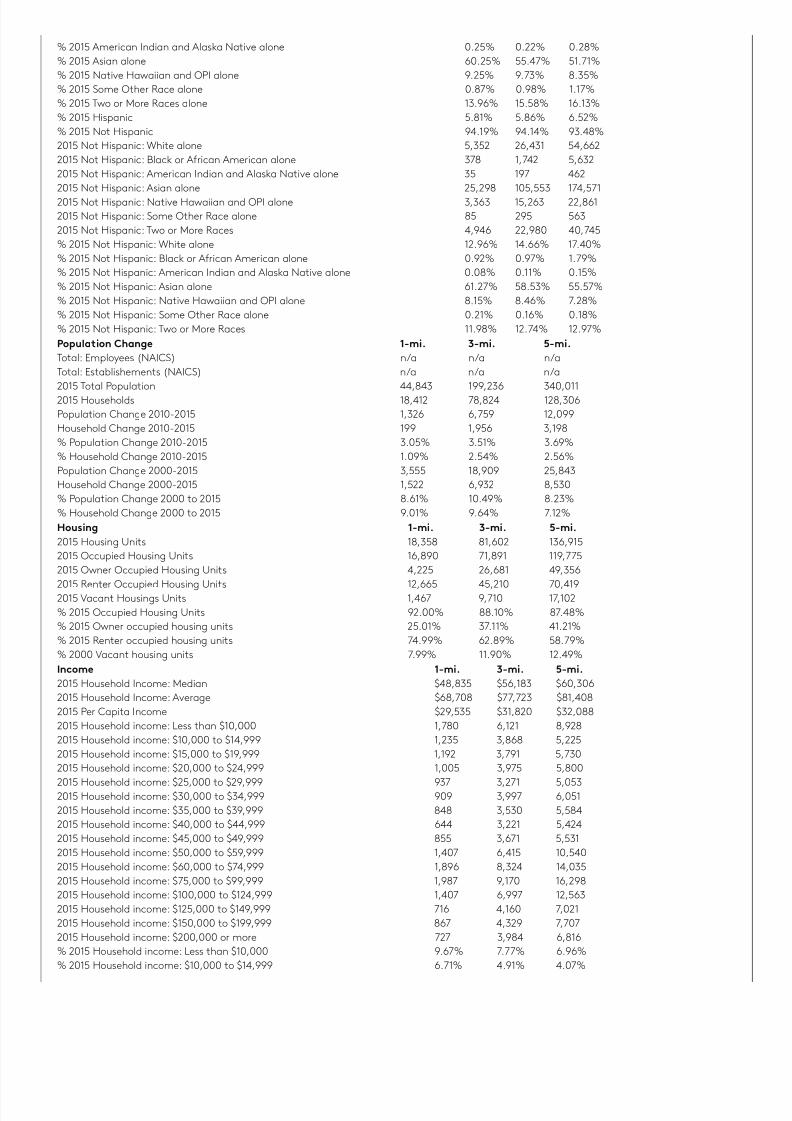
% 2015 American Indian and Alaska Native alone 0.25% 0.22% 0.28%
% 2015 Asian alone 60.25% 55.47% 51.71%
% 2015 Native Hawaiian and OPI alone 9.25% 9.73% 8.35%
% 2015 Some Other Race alone 0.87% 0.98% 1.17%
% 2015 Two or More Races alone 13.96% 15.58% 16.13%
% 2015 Hispanic 5.81% 5.86% 6.52%
% 2015 Not Hispanic 94.19% 94.14% 93.48%
2015 Not Hispanic: White alone 5,352 26,431 54,662
2015 Not Hispanic: Black or African American alone 378 1,742 5,632
2015 Not Hispanic: American Indian and Alaska Native alone 35 197 462
2015 Not Hispanic: Asian alone 25,298 105,553 174,571
2015 Not Hispanic: Native Hawaiian and OPI alone 3,363 15,263 22,861
2015 Not Hispanic: Some Other Race alone 85 295 563
2015 Not Hispanic: Two or More Races 4,946 22,980 40,745
% 2015 Not Hispanic: White alone 12.96% 14.66% 17.40%
% 2015 Not Hispanic: Black or African American alone 0.92% 0.97% 1.79%
% 2015 Not Hispanic: American Indian and Alaska Native alone 0.08% 0.11% 0.15%
% 2015 Not Hispanic: Asian alone 61.27% 58.53% 55.57%
% 2015 Not Hispanic: Native Hawaiian and OPI alone 8.15% 8.46% 7.28%
% 2015 Not Hispanic: Some Other Race alone 0.21% 0.16% 0.18%
% 2015 Not Hispanic: Two or More Races 11.98% 12.74% 12.97%
Population Change 1-mi. 3-mi. 5-mi.
Total: Employees (NAICS) n/a n/a n/a
Total: Establishements (NAICS) n/a n/a n/a
2015 Total Population 44,843 199,236 340,011
2015 Households 18,412 78,824 128,306
Population Change 2010-2015 1,326 6,759 12,099
Household Change 2010-2015 199 1,956 3,198
% Population Change 2010-2015 3.05% 3.51% 3.69%
% Household Change 2010-2015 1.09% 2.54% 2.56%
Population Change 2000-2015 3,555 18,909 25,843
Household Change 2000-2015 1,522 6,932 8,530
% Population Change 2000 to 2015 8.61% 10.49% 8.23%
% Household Change 2000 to 2015 9.01% 9.64% 7.12%
Housing 1-mi. 3-mi. 5-mi.
2015 Housing Units 18,358 81,602 136,915
2015 Occupied Housing Units 16,890 71,891 119,775
2015 Owner Occupied Housing Units 4,225 26,681 49,356
2015 Renter Occupied Housing Units 12,665 45,210 70,4192015 Vacant Housings Units 1,467 9,710 17,102
% 2015 Occupied Housing Units 92.00% 88.10% 87.48%
% 2015 Owner occupied housing units 25.01% 37.11% 41.21%
% 2015 Renter occupied housing units 74.99% 62.89% 58.79%
% 2000 Vacant housing units 7.99% 11.90% 12.49%
Income 1-mi. 3-mi. 5-mi.
2015 Household Income: Median $48,835 $56,183 $60,306
2015 Household Income: Average $68,708 $77,723 $81,408
2015 Per Capita Income $29,535 $31,820 $32,088
2015 Household income: Less than $10,000 1,780 6,121 8,928
2015 Household income: $10,000 to $14,999 1,235 3,868 5,225
2015 Household income: $15,000 to $19,999 1,192 3,791 5,730
2015 Household income: $20,000 to $24,999 1,005 3,975 5,800
2015 Household income: $25,000 to $29,999 937 3,271 5,0532015 Household income: $30,000 to $34,999 909 3,997 6,051
2015 Household income: $35,000 to $39,999 848 3,530 5,584
2015 Household income: $40,000 to $44,999 644 3,221 5,424
2015 Household income: $45,000 to $49,999 855 3,671 5,531
2015 Household income: $50,000 to $59,999 1,407 6,415 10,540
2015 Household income: $60,000 to $74,999 1,896 8,324 14,035
2015 Household income: $75,000 to $99,999 1,987 9,170 16,298
2015 Household income: $100,000 to $124,999 1,407 6,997 12,563
2015 Household income: $125,000 to $149,999 716 4,160 7,021
2015 Household income: $150,000 to $199,999 867 4,329 7,707
2015 Household income: $200,000 or more 727 3,984 6,816
% 2015 Household income: Less than $10,000 9.67% 7.77% 6.96%
% 2015 Household income: $10,000 to $14,999 6.71% 4.91% 4.07%
7/21/2019 Demographics for 1111 Bishop St
http://slidepdf.com/reader/full/demographics-for-1111-bishop-st 3/3
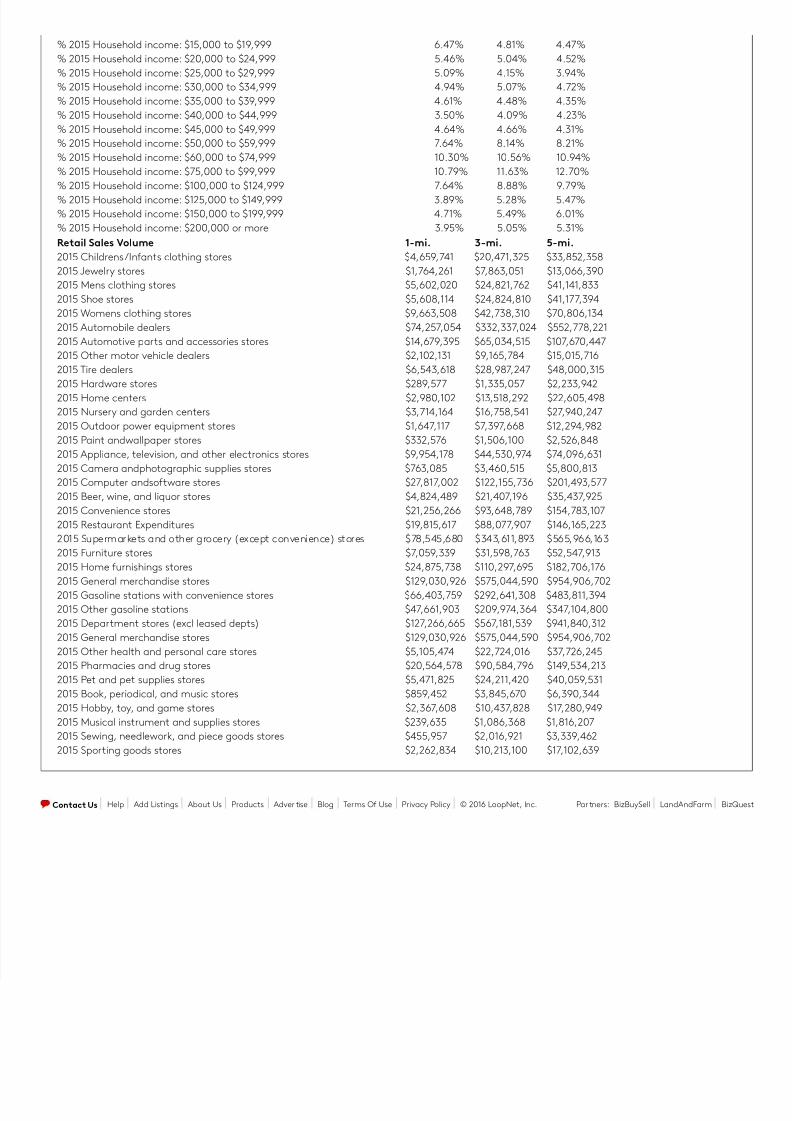
% 2015 Household income: $15,000 to $19,999 6.47% 4.81% 4.47%
% 2015 Household income: $20,000 to $24,999 5.46% 5.04% 4.52%
% 2015 Household income: $25,000 to $29,999 5.09% 4.15% 3.94%
% 2015 Household income: $30,000 to $34,999 4.94% 5.07% 4.72%
% 2015 Household income: $35,000 to $39,999 4.61% 4.48% 4.35%
% 2015 Household income: $40,000 to $44,999 3.50% 4.09% 4.23%
% 2015 Household income: $45,000 to $49,999 4.64% 4.66% 4.31%
% 2015 Household income: $50,000 to $59,999 7.64% 8.14% 8.21%
% 2015 Household income: $60,000 to $74,999 10.30% 10.56% 10.94%
% 2015 Household income: $75,000 to $99,999 10.79% 11.63% 12.70%
% 2015 Household income: $100,000 to $124,999 7.64% 8.88% 9.79%
% 2015 Household income: $125,000 to $149,999 3.89% 5.28% 5.47%% 2015 Household income: $150,000 to $199,999 4.71% 5.49% 6.01%
% 2015 Household income: $200,000 or more 3.95% 5.05% 5.31%
Retail Sales Volume 1-mi. 3-mi. 5-mi.
2015 Childrens/Infants clothing stores $4,659,741 $20,471,325 $33,852,358
2015 Jewelry stores $1,764,261 $7,863,051 $13,066,390
2015 Mens clothing stores $5,602,020 $24,821,762 $41,141,833
2015 Shoe stores $5,608,114 $24,824,810 $41,177,394
2015 Womens clothing stores $9,663,508 $42,738,310 $70,806,134
2015 Automobile dealers $74,257,054 $332,337,024 $552,778,221
2015 Automotive parts and accessories stores $14,679,395 $65,034,515 $107,670,447
2015 Other motor vehicle dealers $2,102,131 $9,165,784 $15,015,716
2015 Tire dealers $6,543,618 $28,987,247 $48,000,315
2015 Hardware stores $289,577 $1,335,057 $2,233,942
2015 Home centers $2,980,102 $13,518,292 $22,605,498
2015 Nursery and garden centers $3,714,164 $16,758,541 $27,940,247
2015 Outdoor power equipment stores $1,647,117 $7,397,668 $12,294,982
2015 Paint andwallpaper stores $332,576 $1,506,100 $2,526,848
2015 Appliance, television, and other electronics stores $9,954,178 $44,530,974 $74,096,631
2015 Camera andphotographic supplies stores $763,085 $3,460,515 $5,800,813
2015 Computer andsoftware stores $27,817,002 $122,155,736 $201,493,577
2015 Beer, wine, and liquor stores $4,824,489 $21,407,196 $35,437,925
2015 Convenience stores $21,256,266 $93,648,789 $154,783,107
2015 Restaurant Expenditures $19,815,617 $88,077,907 $146,165,223
2015 Supermarkets and other grocery (except convenience) stores $78,545,680 $343,611,893 $565,966,163
2015 Furniture stores $7,059,339 $31,598,763 $52,547,913
2015 Home furnishings stores $24,875,738 $110,297,695 $182,706,176
2015 General merchandise stores $129,030,926 $575,044,590 $954,906,702
2015 Gasoline stations with convenience stores $66,403,759 $292,641,308 $483,811,394
2015 Other gasoline stations $47,661,903 $209,974,364 $347,104,800
2015 Department stores (excl leased depts) $127,266,665 $567,181,539 $941,840,312
2015 General merchandise stores $129,030,926 $575,044,590 $954,906,702
2015 Other health and personal care stores $5,105,474 $22,724,016 $37,726,245
2015 Pharmacies and drug stores $20,564,578 $90,584,796 $149,534,213
2015 Pet and pet supplies stores $5,471,825 $24,211,420 $40,059,531
2015 Book, periodical, and music stores $859,452 $3,845,670 $6,390,344
2015 Hobby, toy, and game stores $2,367,608 $10,437,828 $17,280,949
2015 Musical instrument and supplies stores $239,635 $1,086,368 $1,816,207
2015 Sewing, needlework, and piece goods stores $455,957 $2,016,921 $3,339,462
2015 Sporting goods stores $2,262,834 $10,213,100 $17,102,639
Contact Us Help Add Listings About Us Products Adver tise Blog Terms Of Use Privacy Policy © 2016 LoopNet, Inc. Par tners: BizBuySell LandAndFarm BizQu