
Demographic Transition in Thailand Population as enumerated by the censuses. YearPopulation...
22
-
Upload
primrose-oneal -
Category
Documents
-
view
215 -
download
0
Transcript of Demographic Transition in Thailand Population as enumerated by the censuses. YearPopulation...


Demographic Transition in Thailand• Population as enumerated by the
censuses.Year Population
1910 8.3 Million
1919 9.2 Million
1929 11.5 Million
1937 14.5 Million
1947 17.4 Million
1960 26.3 Million
1970 34.4 Million
1980 44.5 Million
1990 54.5 Million
2000 60.9 Million
2010 65.4 Million*
* Cross border migrants were included.
Population in Thailand increased 8 folds, from 8.3 m. in 1910 to 65.4 m. in 2010.
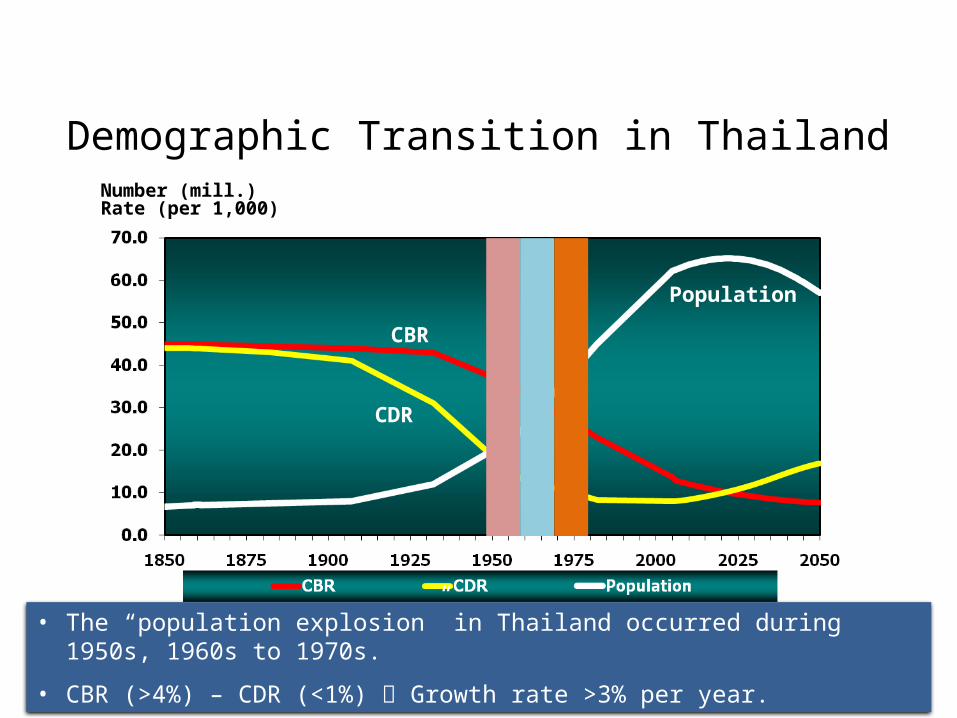
Demographic Transition in ThailandNumber (mill.) Rate (per 1,000)
CDR
CBR
Population
• The “population explosion” in Thailand occurred during 1950s, 1960s to 1970s.
• CBR (>4%) – CDR (<1%) Growth rate >3% per year.
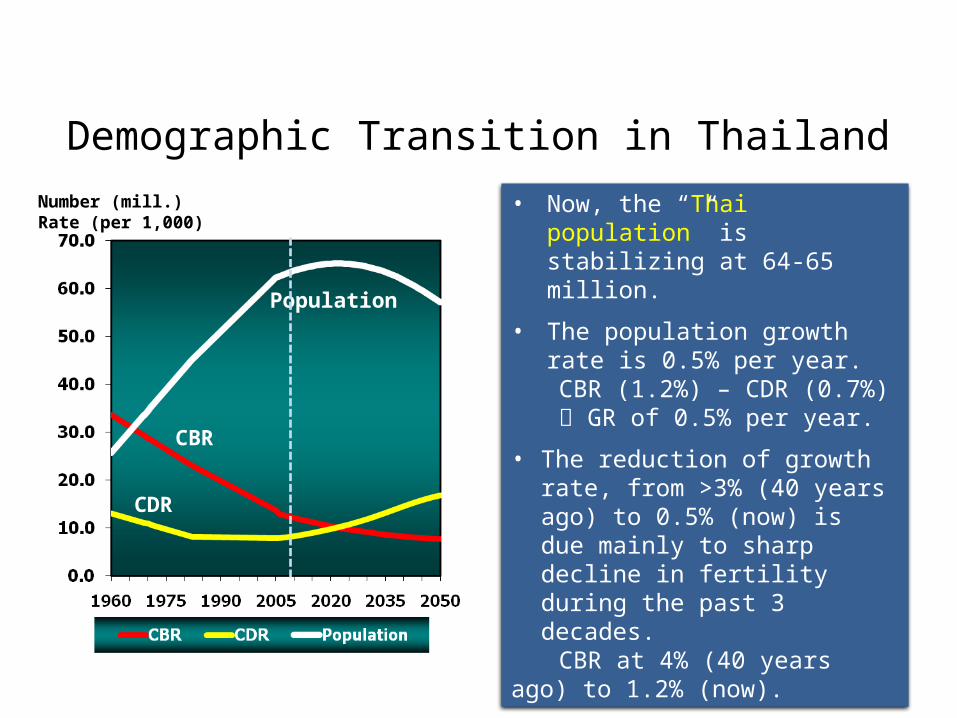
Demographic Transition in ThailandNumber (mill.) Rate (per 1,000)
CDR
CBR
Population
• Now, the “Thai population” is stabilizing at 64-65 million.
• The population growth rate is 0.5% per year.
CBR (1.2%) – CDR (0.7%) GR of 0.5% per year.
• The reduction of growth rate, from >3% (40 years ago) to 0.5% (now) is due mainly to sharp decline in fertility during the past 3 decades.
CBR at 4% (40 years ago) to 1.2% (now).
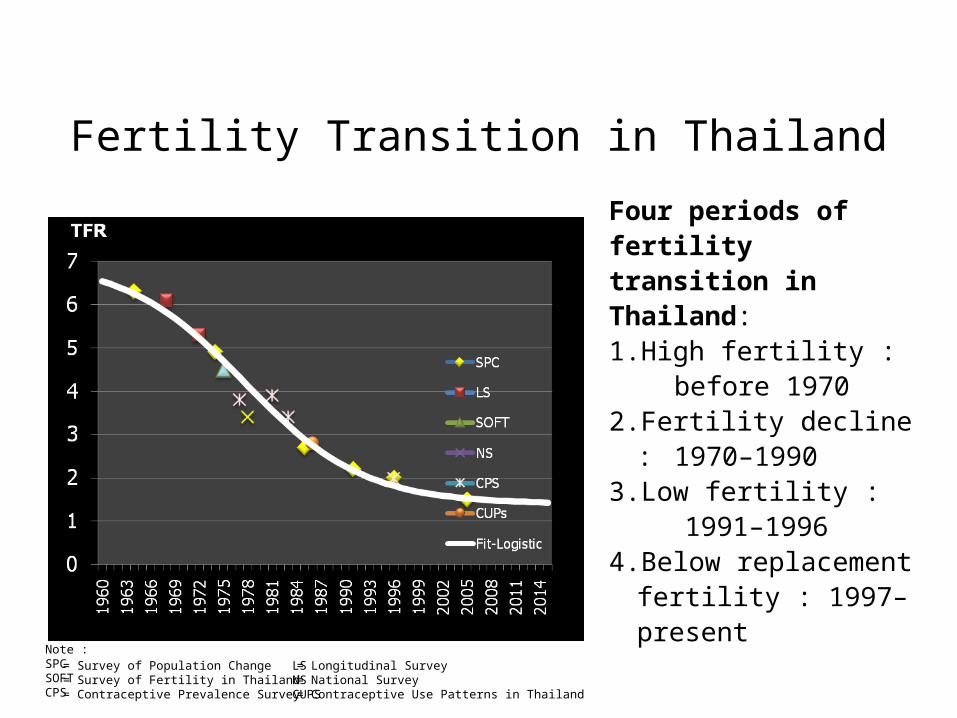
Fertility Transition in Thailand
Note :SPCSOFTCPS
= Survey of Population Change= Survey of Fertility in Thailand= Contraceptive Prevalence Survey
= Longitudinal Survey= National Survey= Contraceptive Use Patterns in Thailand
LSNSCUPS
Four periods of fertility transition in Thailand:1.High fertility : before
19702.Fertility decline :
1970–1990 3.Low fertility :
1991–1996 4.Below replacement
fertility : 1997–present
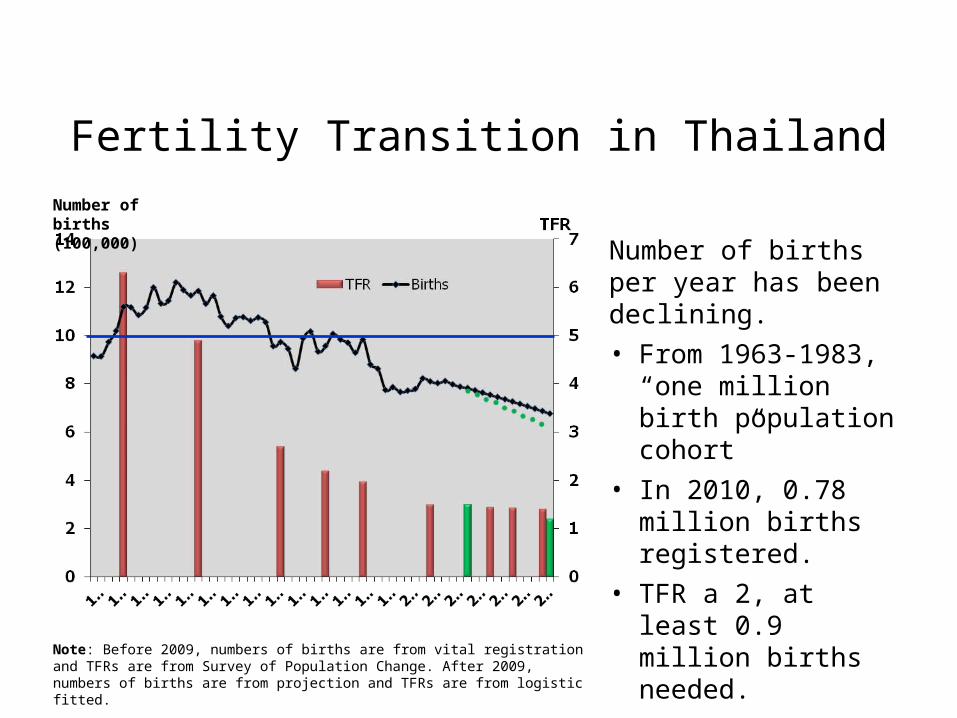
Fertility Transition in Thailand
Number of births per year has been declining.• From 1963-1983,
“one million birth population cohort”
• In 2010, 0.78 million births registered.
• TFR a 2, at least 0.9 million births needed.
• If TFR at 2020 = 1.2, number of births would be 0.6 million.
“Replacement level”
Number of births (100,000)
Note: Before 2009, numbers of births are from vital registration and TFRs are from Survey of Population Change. After 2009, numbers of births are from projection and TFRs are from logistic fitted.

Fertility Transition in Thailand
Average number of children per woman (throughout her childbearing period)
Whole kingdom1.5
Urban 1.0Rural 1.7
(Source: SPC 2005 – 2006)
RegionBangkok
0.9Central
1.2North 1.6Northeast
2.0South 1.5
(Source: SPC 2005 – 2006)
Muslims in 3 most southern provinces
3.4(Source: Est. from RH Survey 2003)
Highland ethnic groups
Karen 2.2Hmong4.8
(Source: Gray, et al. 2004)
Cross-border migrant women
Myanmar3.6
(Source: Pimonpan & Sukanya, 2004)

Number of years for TFR to decline from 5.5 to 2.2
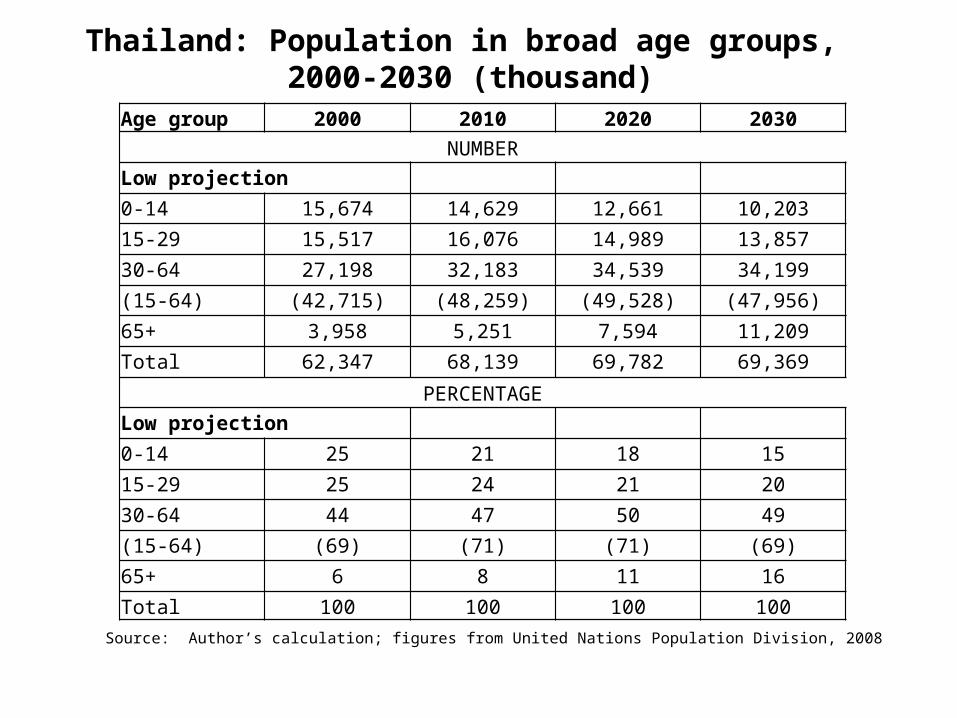
Thailand: Population in broad age groups, 2000-2030 (thousand)
Age group 2000 2010 2020 2030
NUMBERLow projection
0-14 15,674 14,629 12,661 10,203
15-29 15,517 16,076 14,989 13,857
30-64 27,198 32,183 34,539 34,199
(15-64) (42,715) (48,259) (49,528) (47,956)
65+ 3,958 5,251 7,594 11,209
Total 62,347 68,139 69,782 69,369
PERCENTAGELow projection
0-14 25 21 18 15
15-29 25 24 21 20
30-64 44 47 50 49
(15-64) (69) (71) (71) (69)
65+ 6 8 11 16
Total 100 100 100 100
Source: Author’s calculation; figures from United Nations Population Division, 2008

Trends in percentage of population aged 65+
Source: United Nations Population Division 2008, medium projection.

Thailand’s new demographic situation
• Nearing end of population growth• Remarkable change in age pyramids• Declining child and young adult population • Ageing population• Demographic dividend ended• Migration patterns lowering av. education• Population decline in many rural areas• Growth of the medium cities

Population Pyramids of Thailand 1960-2030

Thailand: Index of Growth of Age Groups, 2000-2030

Population Ageing and Growth of the Older Population, Thailand 1970-2030

• Decrease in number of students entering compulsory education, especially primary schools in rural villages.
Impact of Fertility Decline
School size in 2008
13,909 schools with less than 120 students.
381 schools of less than 20 students.
262 schools with no students.• Caused bya) Declining number of birthsb) Parents’ out-migrationc) Commuting to urban schools because of better roads and
transportation
Population-responsive policies
• How to best utilize and care for growing elderly population?
• How to raise human capital of a shrinking workforce?
• How to prepare health care workforce to adapt to changing care needs?
• How to best utilize foreign workers?• How to plan for growing cities and rural
population decline?

Living arrangements of persons age 60 and above, Thailand 1986-2007

Percentage of households having members attending post-secondary education, by indicator of economic status

Influencing population trends
• Over three decades, Thailand focused on lowering fertility rates
• Total fertility rate has fallen to 1.5, far below replacement level
• Longer-term implications of fertility maintained at this level or below are negative:– Population ageing– Contraction of workforce– Negative population momentum – population decline

Policy Consideration
• More emphasis should be on quality than on quantity of births.
• Thailand should have both pro- and anti-natalist policy :– Pro-natalist : among adults, intended couples.– Anti-natalist : among adolescents.
Births from adolescent mothers, 2009
Age of mother % Number (x 1,000)
Under 15 0.38 2.9
Under 20 16.08 120.1Source: Calculated from registered births reported in Public Health Statistics, not adjusted for under registration.

Policy ConsiderationIncentives for pro-natalist :• Tax reduction for unlimited number of children.• Revise the regulation on the limited 3 children to
receive financial and welfare assistance from the government.
• Any incentive measure must not lead to discrimination of labour employment and promotion.

Learning from Asian neighbours• Other low-fertility Asian countries are seriously
concerned • Too slow in introducing pro-natalist policies • Thailand should now introduce a set of measures to
facilitate raising of children:– Paid maternity (and paternity) leave– Flexible working hours– Eldercare support– Subsidized childcare– Tax incentives and/or baby bonus schemes
• Can such measures work?