Demographic Profile: Arabi -...
44
Demographic Profile: Arabi
Transcript of Demographic Profile: Arabi -...

Demographic Profile:Arabi

[This Page Intentionally Left Blank]
Contents
• Decennial 2010 Profile
• Technical Notes, Decennial Profile
• ACS 2013-17 Profile
• Technical Notes, ACS Profile

[This Page Intentionally Left Blank]
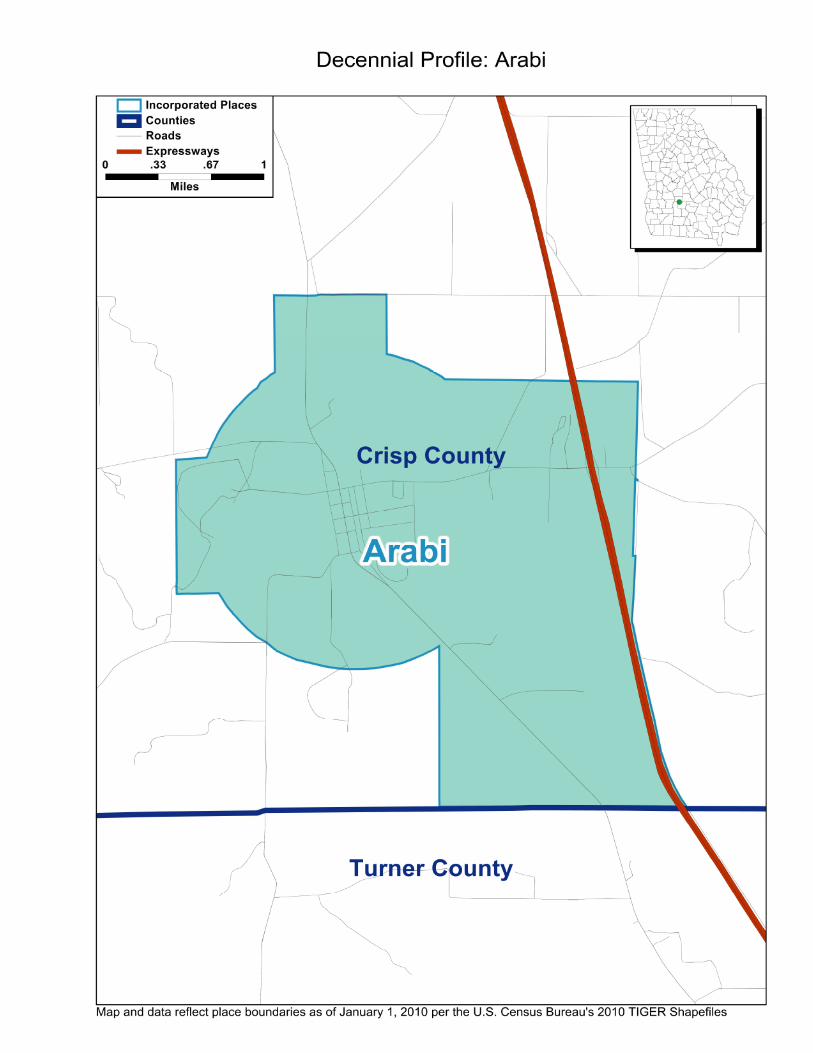
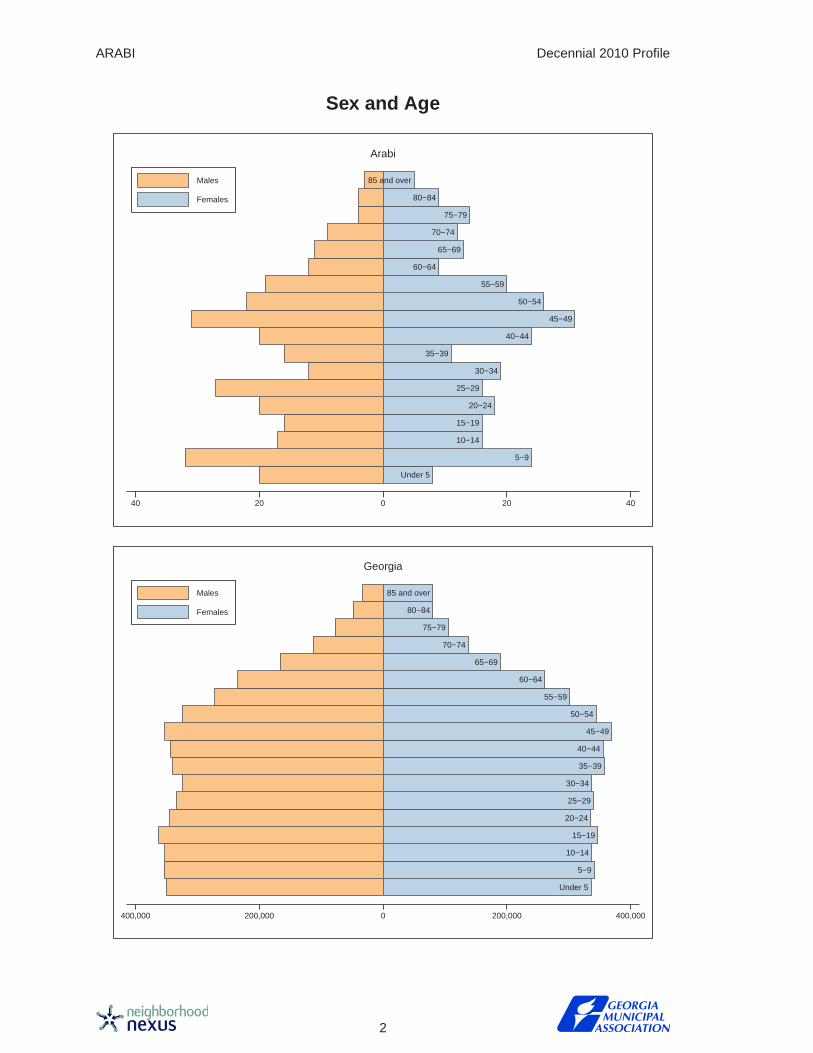
ARABI Decennial 2010 Profile
Sex and Age
85 and over
Under 5
80−84
60−64
35−39
70−74
65−69
75−79
25−29
15−19
10−14
20−24
30−34
55−59
5−9
40−44
50−54
45−49
40 20 0 20 40
Males
Females
Arabi
85 and over
80−84
75−79
70−74
65−69
60−64
55−59
20−24
Under 5
10−14
30−34
25−29
5−9
50−54
15−19
40−44
35−39
45−49
400,000 200,000 0 200,000 400,000
Males
Females
Georgia
2
Decennial 2010 Profile ARABI
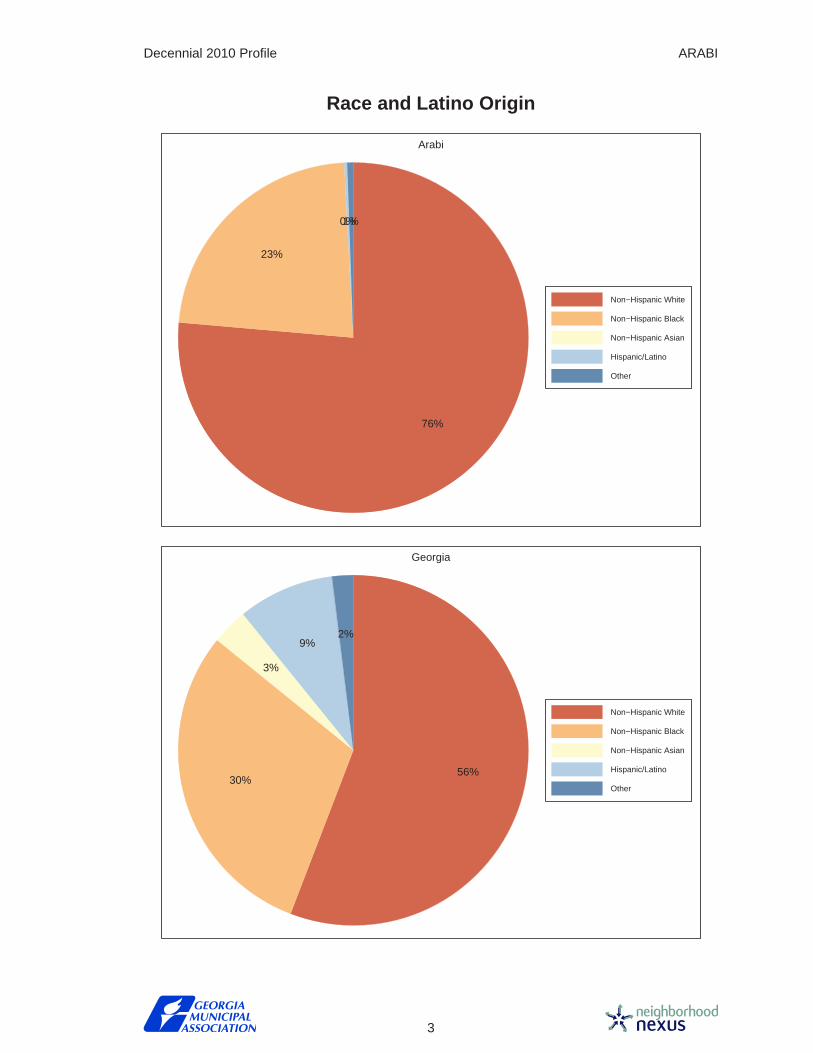
Race and Latino Origin
76%
23%
0%1%
Non−Hispanic White
Non−Hispanic Black
Non−Hispanic Asian
Hispanic/Latino
Other
Arabi
56%30%
3%
9%2%
Non−Hispanic White
Non−Hispanic Black
Non−Hispanic Asian
Hispanic/Latino
Other
Georgia
3

ARABI Decennial 2010 Profile
Housing Tenure
34%
29%
22%
15%
Owner−occupied with mortgage
Owner−occupied free and clear
Renter−occupied
Vacant
Arabi
43%
15%
30%
12%
Owner−occupied with mortgage
Owner−occupied free and clear
Renter−occupied
Vacant
Georgia
4
Decennial 2010 Profile ARABI
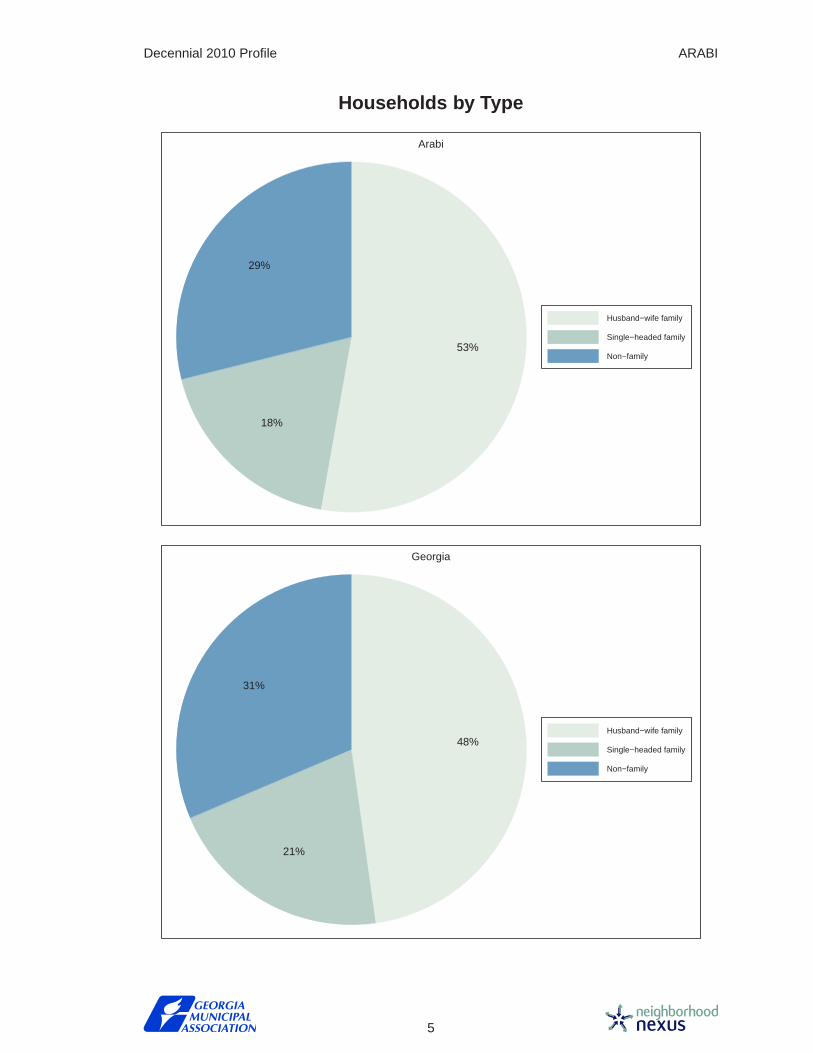
Households by Type
53%
18%
29%
Husband−wife family
Single−headed family
Non−family
Arabi
48%
21%
31%
Husband−wife family
Single−headed family
Non−family
Georgia
5

ARABI Decennial 2010 Profile
Children by Household Type
58%
19%
22%
1%
Own parent(s), husband−wife family
Own parent, single−parent family
Other relative
Non−relative or group quarters
Arabi
57%28%
12%2%
Own parent(s), husband−wife family
Own parent, single−parent family
Other relative
Non−relative or group quarters
Georgia
6
Decennial 2010 Profile ARABI
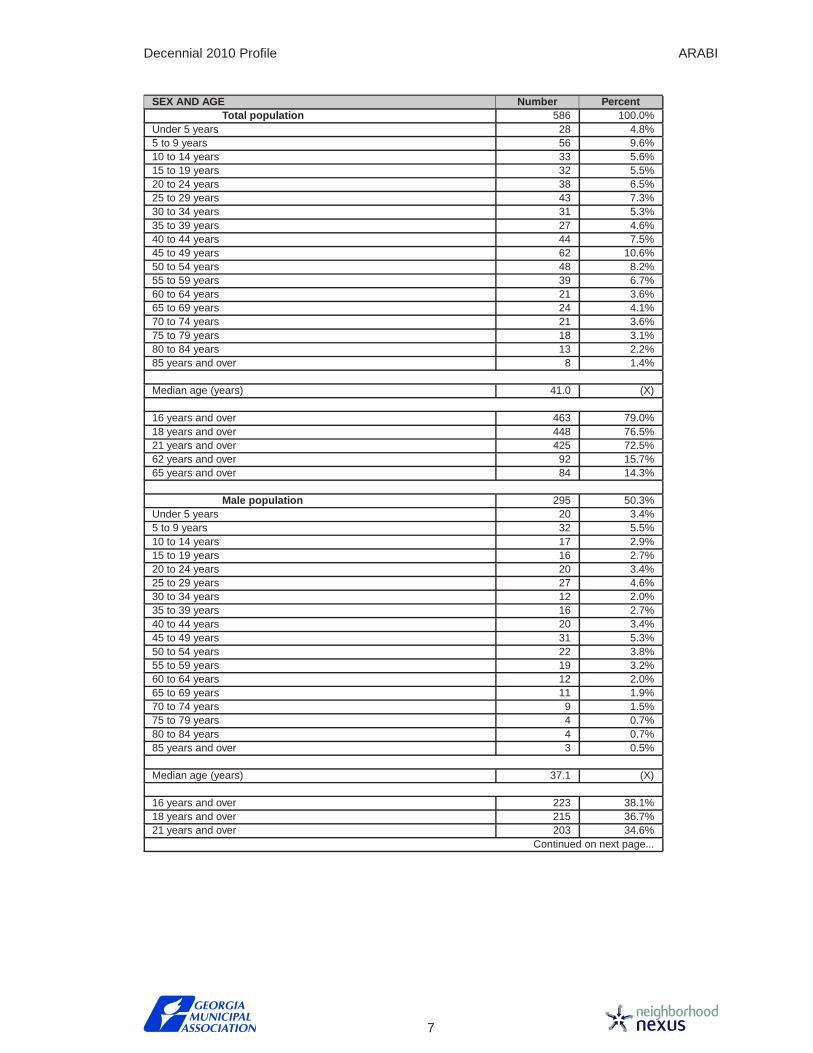
SEX AND AGE Number PercentTotal population 586 100.0%
Under 5 years 28 4.8%5 to 9 years 56 9.6%10 to 14 years 33 5.6%15 to 19 years 32 5.5%20 to 24 years 38 6.5%25 to 29 years 43 7.3%30 to 34 years 31 5.3%35 to 39 years 27 4.6%40 to 44 years 44 7.5%45 to 49 years 62 10.6%50 to 54 years 48 8.2%55 to 59 years 39 6.7%60 to 64 years 21 3.6%65 to 69 years 24 4.1%70 to 74 years 21 3.6%75 to 79 years 18 3.1%80 to 84 years 13 2.2%85 years and over 8 1.4%
Median age (years) 41.0 (X)
16 years and over 463 79.0%18 years and over 448 76.5%21 years and over 425 72.5%62 years and over 92 15.7%65 years and over 84 14.3%
Male population 295 50.3%Under 5 years 20 3.4%5 to 9 years 32 5.5%10 to 14 years 17 2.9%15 to 19 years 16 2.7%20 to 24 years 20 3.4%25 to 29 years 27 4.6%30 to 34 years 12 2.0%35 to 39 years 16 2.7%40 to 44 years 20 3.4%45 to 49 years 31 5.3%50 to 54 years 22 3.8%55 to 59 years 19 3.2%60 to 64 years 12 2.0%65 to 69 years 11 1.9%70 to 74 years 9 1.5%75 to 79 years 4 0.7%80 to 84 years 4 0.7%85 years and over 3 0.5%
Median age (years) 37.1 (X)
16 years and over 223 38.1%18 years and over 215 36.7%21 years and over 203 34.6%
Continued on next page...
7
ARABI Decennial 2010 Profile
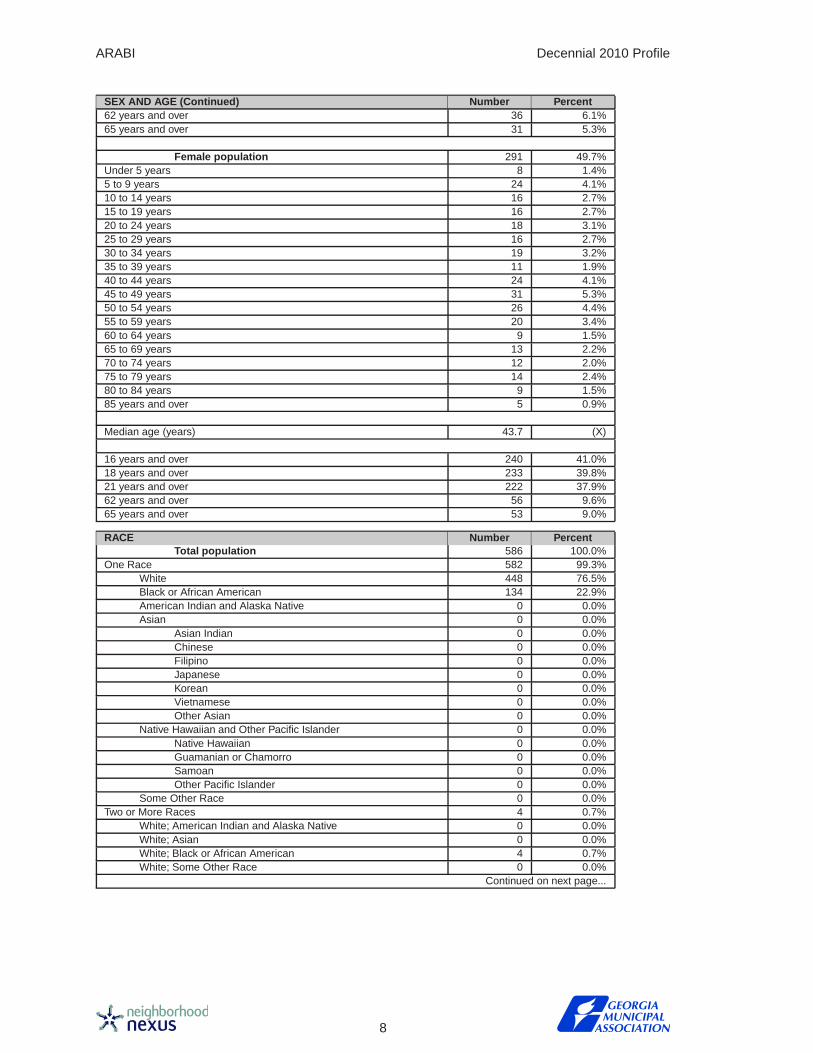
SEX AND AGE (Continued) Number Percent62 years and over 36 6.1%65 years and over 31 5.3%
Female population 291 49.7%Under 5 years 8 1.4%5 to 9 years 24 4.1%10 to 14 years 16 2.7%15 to 19 years 16 2.7%20 to 24 years 18 3.1%25 to 29 years 16 2.7%30 to 34 years 19 3.2%35 to 39 years 11 1.9%40 to 44 years 24 4.1%45 to 49 years 31 5.3%50 to 54 years 26 4.4%55 to 59 years 20 3.4%60 to 64 years 9 1.5%65 to 69 years 13 2.2%70 to 74 years 12 2.0%75 to 79 years 14 2.4%80 to 84 years 9 1.5%85 years and over 5 0.9%
Median age (years) 43.7 (X)
16 years and over 240 41.0%18 years and over 233 39.8%21 years and over 222 37.9%62 years and over 56 9.6%65 years and over 53 9.0%
RACE Number PercentTotal population 586 100.0%
One Race 582 99.3%White 448 76.5%Black or African American 134 22.9%American Indian and Alaska Native 0 0.0%Asian 0 0.0%
Asian Indian 0 0.0%Chinese 0 0.0%Filipino 0 0.0%Japanese 0 0.0%Korean 0 0.0%Vietnamese 0 0.0%Other Asian 0 0.0%
Native Hawaiian and Other Pacific Islander 0 0.0%Native Hawaiian 0 0.0%Guamanian or Chamorro 0 0.0%Samoan 0 0.0%Other Pacific Islander 0 0.0%
Some Other Race 0 0.0%Two or More Races 4 0.7%
White; American Indian and Alaska Native 0 0.0%White; Asian 0 0.0%White; Black or African American 4 0.7%White; Some Other Race 0 0.0%
Continued on next page...
8

Decennial 2010 Profile ARABI
RACE (Continued) Number PercentRace alone or in combination with one or more other races:White 452 77.1%Black or African American 138 23.5%American Indian and Alaska Native 0 0.0%Asian 0 0.0%Native Hawaiian and Other Pacific Islander 0 0.0%Some Other Race 0 0.0%
HISPANIC OR LATINO Number PercentTotal population 586 100.0%
Hispanic or Latino (of any race) 1 0.2%Mexican 1 0.2%Puerto Rican 0 0.0%Cuban 0 0.0%Other Hispanic or Latino 0 0.0%
Not Hispanic or Latino 585 99.8%
HISPANIC OR LATINO AND RACE Number PercentTotal population 586 100.0%
Hispanic or Latino 1 0.2%White alone 1 0.2%Black or African American alone 0 0.0%American Indian and Alaska Native alone 0 0.0%Asian alone 0 0.0%Native Hawaiian and Other Pacific Islander alone 0 0.0%Some Other Race alone 0 0.0%Two or More Races 0 0.0%
Not Hispanic or Latino 585 99.8%White alone 447 76.3%Black or African American alone 134 22.9%American Indian and Alaska Native alone 0 0.0%Asian alone 0 0.0%Native Hawaiian and Other Pacific Islander alone 0 0.0%Some Other Race alone 0 0.0%Two or More Races 4 0.7%
RELATIONSHIP Number PercentTotal population 586 100.0%
In households 586 100.0%Householder 218 37.2%Spouse 115 19.6%Child 169 28.8%
Own child under 18 years 106 18.1%Other relatives 58 9.9%
Under 18 years 30 5.1%65 years and over 6 1.0%
Nonrelatives 26 4.4%Under 18 years 2 0.3%65 years and over 1 0.2%
Unmarried partner 12 2.0%
In group quarters 0 0.0%Institutionalized population 0 0.0%
Male 0 0.0%Female 0 0.0%
Noninstitutionalized population 0 0.0%Continued on next page...
9

ARABI Decennial 2010 Profile
RELATIONSHIP (Continued) Number PercentMale 0 0.0%Female 0 0.0%
HOUSEHOLDS BY TYPE Number PercentTotal households 218 100.0%
Family households (families) 155 71.1%With own children under 18 years 57 26.1%
Husband-wife family 115 52.8%With own children under 18 years 40 18.3%
Male householder, no wife present 12 5.5%With own children under 18 years 5 2.3%
Female householder, no husband present 28 12.8%With own children under 18 years 12 5.5%
Nonfamily households 63 28.9%Householder living alone 53 24.3%
Male 21 9.6%65 years and over 4 1.8%
Female 32 14.7%65 years and over 15 6.9%
Households with individuals under 18 years 76 34.9%Households with individuals 65 years and over 63 28.9%
Average household size 2.69 (X)Average family size 3.21 (X)
HOUSING OCCUPANCY Number PercentTotal housing units 255 100.0%
Occupied housing units 218 85.5%Vacant housing units 37 14.5%
For rent 10 3.9%Rented, not occupied 0 0.0%For sale only 1 0.4%Sold, not occupied 5 2.0%For seasonal, recreational, or occasional use 5 2.0%All other vacants 16 6.3%
Homeowner vacancy rate (percent) 0.6 (X)Rental vacancy rate (percent) 14.9 (X)
HOUSING TENURE Number PercentOccupied housing units 218 100.0%
Owner-occupied housing units 161 73.9%Population in owner-occupied housing units 435 (X)Average household size of owner-occupied units 2.70 (X)
Renter-occupied housing units 57 26.1%Population in renter-occupied housing units 151 (X)Average household size of renter-occupied units 2.65 (X)
Notes:∞ Data could not be computed (see Technical Notes).
Report prepared by Emory University’s Policy Analysis Laboratory andTerra Cognita Consulting, LLC in cooperation with Neighborhood Nexus.
10
Technical Notes, Decennial Profile
This report features demographic profiles based on the Census Bureaus 2010 Census of Populationand Housing. These profiles follow precisely the order, format, and content of the DP-1 profiles availablevia the Census Bureaus American Fact Finder online system.
Why is there so much less data in this report than in the 2000 De mographic Profiles?
The short answer is that the 2010 Census form asked only 10 questions, and that many items of interest(e.g. income, educational attainment, employment status, rents paid) no longer appear on the question-naire.
A longer answer involves a bit of history to understand recent changes in how the Census Bureaucollects data. First, it is worth noting that the decennial census is a constitutional requirement– Article I,Section 2 requires an enumeration of inhabitants once every 10 years to determine apportionment of theHouse of Representatives. But the only constitutional requirement is the count itself; the government haslong seen fit to gather other data about the nation as an add-on to this process. Indeed, from 1940 until2000, the Census Bureau actually conducted a census (counting of the entire population) simultaneouslywith a survey (measuring a sample of the population) simultaneously: most households received a ”shortform” with basic questions (e.g. age, sex, race), while a ”long form” with everything contained on the ”shortform” plus many other topics (e.g. educational attainment, occupation, income) was administered to asample of households (varied by year and other factors, but roughly 1 in 7 households).
Because the decennial census takes place only once every ten years, it provides a single ”snapshot”of the country. But policymakers wanted to have more timely data, so the Census Bureau moved to anew ”continuous measurement” model followed by the American Community Survey (ACS), which had itsnationwide launch in 2005. The ACS is a nationwide survey conducted by the U.S. Census Bureau ona continuous, rolling basis. It is intended to replace the ”long form” that has been a component of thedecennial census for the last several decades.
So will the most recent ACS fill in for the missing 2010 data?
Though the ACS is intended to replace the decennial long form, it is not a direct substitute. The twodiffer in many important ways, but we will focus on a few key points.
First, as mentioned above, the ”continuous measurement” model means that the ACS is not a snapshotfor any particular point in time. So while the decennial census measured where people lived on Census Day(historically April 1st of years ending in 0), the ACS looks at where people live on the day they are surveyed.For example, ACS income measures look at the 12-month period preceding the survey date, while thedecennial looked at the previous calendar year. Second, the ACS sample is much smaller than that of thedecennial census: roughly 2.5% each year. Even pooling the data over a 5-year period yields a combinedsample of only about 12.5%, considerably smaller than the roughly 16.7% sampled in the decennial census;the implications of this smaller sample on the margin of error for estimates is discussed below. Third, thepooling across years required to yield a decent-sized sample for smaller areas creates complications forinterpretation. Whereas the decennial census allowed one to say, ”on April 1, 2000, X% of the populationin region Y was unemployed,” we must now say ”over the course of the period 2005-2009, on average X%of the population in region Y was unemployed.”
When faced with a period of rapid change such as the onset of the ”Great Recession,” having a pooledestimate over a 5-year period is much less helpful than having a firm snapshot at a single point in time. Sowhile the ACS has been of great help to policymakers interested in the effects of the Great Recession on

large geographies such as states, counties, and major cities (areas for which 1-year or 3-year estimatesare available), it has created new challenges for people interested in small cities and neighborhoods withinlarger cities.
To learn more about the ACS, how to use it, and how it differs from the decennial census, please referto the Census Bureau’s publication A Compass for Understanding and Using American Community SurveyData: What General Data Users Need to Know.
How do you estimate medians, and why cannot they be estimated all of the time?
The median is that value that marks the 50% line in a population: 50% of the population is above themedian and 50% is below. With individual level data, one can simply sort the data and find the middlevalue (if the number of items is odd) or take the average of the two middlemost values (if the number ofitems is even). However, the Census Bureau reports grouped data, e.g. how many households fall into aparticular income range. Estimating medians from grouped data involves finding the range that contains themiddlemost value, then estimating the point within that range that the middlemost value would occupy. Themedian cannot be estimated if it falls within a range lacking a minimum or maximum value.
Why do you note that some figures are based on tract-level data ?
The Census Bureau reports most of the data used in this report at the census block level, a very granularlevel of geography. However, some data are reported only for census tracts, which are generally muchlarger. Because the geographic areas in this report are built from blocks, data reported only for tracts mustbe re-estimated to the block level. We do this by assigning tract-level data to blocks based on the proportionof the tract population residing within each block comprising that tract.
Why do you note that certain fields in this report may differ sl ightly from DP-1 totals?
A very small number of data fields were reported differently in the SF1 release (where block-level dataare made available) and in the DP-1 release (data released no lower than the tract. For example, thequestion of whether Chinese and Taiwanese are the same nationality was handled differently in the tworeleases. Though minor, these differences are flagged in our reports.

ARABI ACS 2013-17 Profile
Percent without a High School Diploma or GED
0
20
40
60
80
100P
erce
nt
Arabi Crisp County River Valley Georgia
Percent with a Bachelor’s Degree or Higher
0
20
40
60
80
100
Per
cent
Arabi Crisp County River Valley Georgia
Note: Bars represent the margin of error around each estimated value.
2

ACS 2013-17 Profile ARABI
Percent Foreign-Born
0
20
40
60
80
100
Per
cent
Arabi Crisp County River Valley Georgia
Percent Speaking a Language other than English at Home
0
20
40
60
80
100
Per
cent
Arabi Crisp County River Valley Georgia
Note: Bars represent the margin of error around each estimated value.
3
ARABI ACS 2013-17 Profile
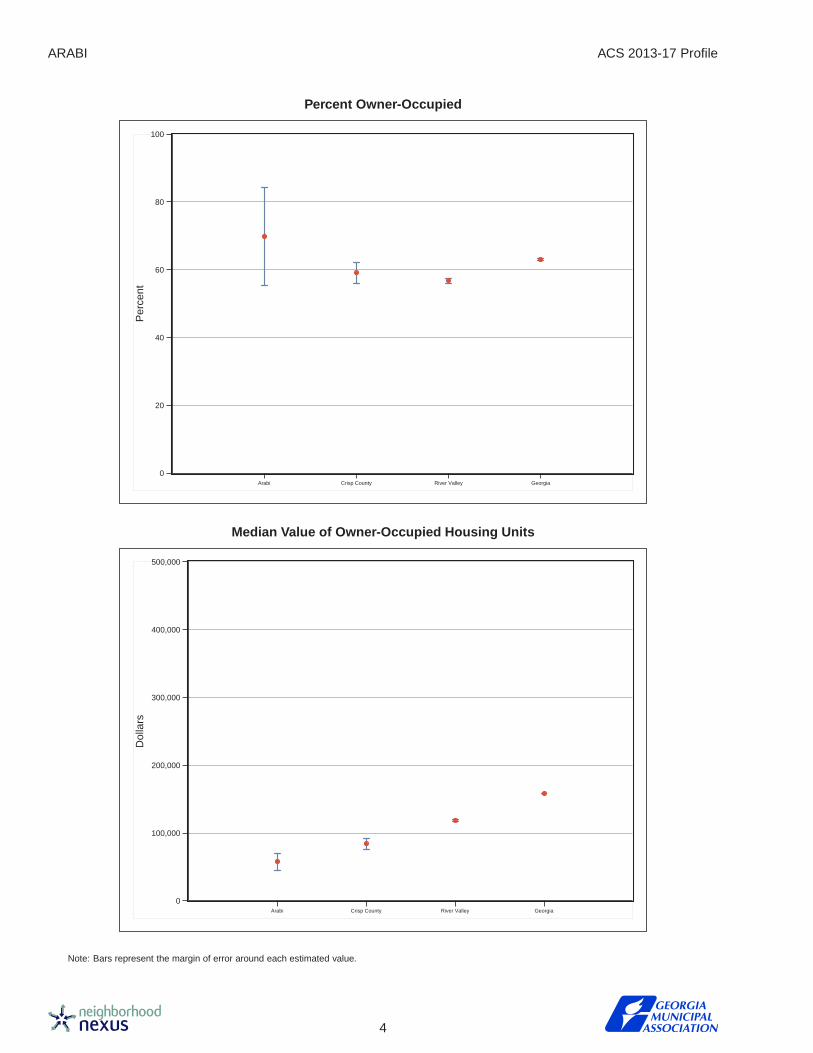
Percent Owner-Occupied
0
20
40
60
80
100P
erce
nt
Arabi Crisp County River Valley Georgia
Median Value of Owner-Occupied Housing Units
0
100,000
200,000
300,000
400,000
500,000
Dol
lars
Arabi Crisp County River Valley Georgia
Note: Bars represent the margin of error around each estimated value.
4

ACS 2013-17 Profile ARABI
Homeowner Vacancy Rate
0
20
40
60
80
100
Rat
e
Arabi Crisp County River Valley Georgia
Rental Vacancy Rate
0
20
40
60
80
100
Rat
e
Arabi Crisp County River Valley Georgia
Note: Bars represent the margin of error around each estimated value.
5
ARABI ACS 2013-17 Profile
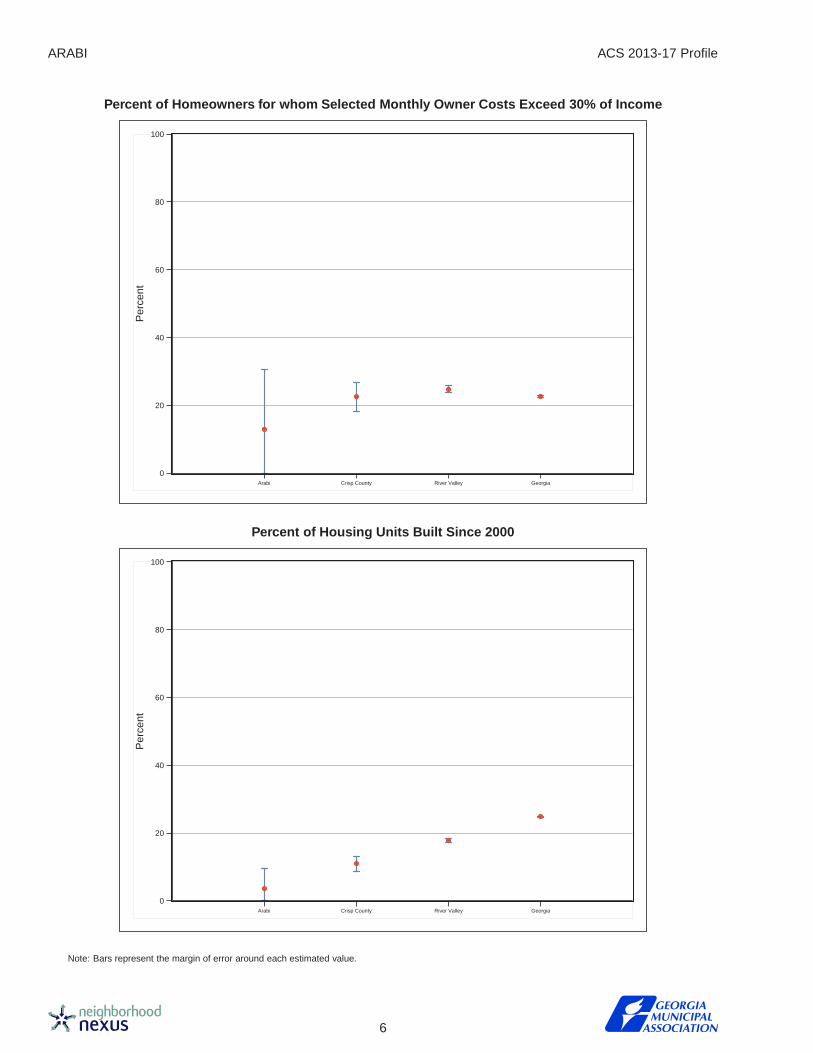
Percent of Homeowners for whom Selected Monthly Owner Costs Exceed 30% of Income
0
20
40
60
80
100P
erce
nt
Arabi Crisp County River Valley Georgia
Percent of Housing Units Built Since 2000
0
20
40
60
80
100
Per
cent
Arabi Crisp County River Valley Georgia
Note: Bars represent the margin of error around each estimated value.
6

ACS 2013-17 Profile ARABI
Percent of Persons Living outside Home County 1 Year Earlier
0
20
40
60
80
100
Per
cent
Arabi Crisp County River Valley Georgia
Median Household Income
0
40,000
80,000
120,000
160,000
Dol
lars
Arabi Crisp County River Valley Georgia
Note: Bars represent the margin of error around each estimated value.
7

ARABI ACS 2013-17 Profile
Percent Civilian Unemployed
0
20
40
60
80
100P
erce
nt
Arabi Crisp County River Valley Georgia
Percent in Poverty
0
20
40
60
80
100
Per
cent
Arabi Crisp County River Valley Georgia
Note: Bars represent the margin of error around each estimated value.
8

ACS 2013-17 Profile ARABI
Selected Social Characteristics
HOUSEHOLDS BY TYPE Estimate Margin of Error Percent Margin of ErrorTotal households 242 ±55 242 (X)
Family households (families) 142 ±38 58.7% ±8.3With own children of the householder under 18 years 36 ±27 14.9% ±10.8
Married-couple family 82 ±24 33.9% ±6.2With own children of the householder under 18 years 19 ±16 7.9% ±6.4
Male householder, no wife present, family 0 ±13 0.0% ±5.4With own children of the householder under 18 years 0 ±13 0.0% ±5.4
Female householder, no husband present, family 60 ±35 24.8% ±13.3With own children of the householder under 18 years 17 ±18 7.0% ±7.3
Nonfamily households 100 ±40 41.3% ±13.6Householder living alone 94 ±41 38.8% ±14.565 years and over 58 ±35 24.0% ±13.4
Households with one or more people under 18 years 56 ±33 23.1% ±12.6Households with one or more people 65 years and over 95 ±39 39.3% ±13.4
Average household size 2.33 ±0.27 (X) (X)Average family size 3.07 ±1.06 (X) (X)
RELATIONSHIP Estimate Margin of Error Percent Margin of ErrorPopulation in households 563 ±144 563 (X)
Householder 242 ±55 43.0% ±14.7Spouse 82 ±28 14.6% ±3.3Child 156 ±72 27.7% ±10.6Other relatives 56 ±40 9.9% ±6.7Nonrelatives 27 ±25 4.8% ±4.2
Unmarried partner 10 ±12 1.8% ±2.1
MARITAL STATUS Estimate Margin of Error Percent Margin of ErrorMales 15 years and over 223 ±59 223 (X)
Never married 93 ±48 41.7% ±18.5Now married, except separated 81 ±28 36.3% ±8.2Separated 0 ±13 0.0% ±5.8Widowed 14 ±18 6.3% ±7.9Divorced 35 ±26 15.7% ±10.9
Females 15 years and over 256 ±84 256 (X)Never married 63 ±59 24.6% ±21.6Now married, except separated 91 ±30 35.5% ±2.4Separated 9 ±13 3.5% ±4.9Widowed 51 ±27 19.9% ±8.3Divorced 42 ±31 16.4% ±10.8
FERTILITY Estimate Margin of Error Percent Margin of ErrorNumber of women 15 to 50 years old who had a birthin the past 12 months
4 ±6 4 (X)
Unmarried women (widowed, divorced, and never married) 0 ±13 0.0% ±325.0Per 1,000 unmarried women 0 ±153 (X) (X)
Per 1,000 women 15 to 50 years old 29 ±40 (X) (X)Per 1,000 women 15 to 19 years old 0 ±1532 (X) (X)Per 1,000 women 20 to 34 years old 98 ±337 (X) (X)Per 1,000 women 35 to 50 years old 0 ±216 (X) (X)
9
ARABI ACS 2013-17 Profile
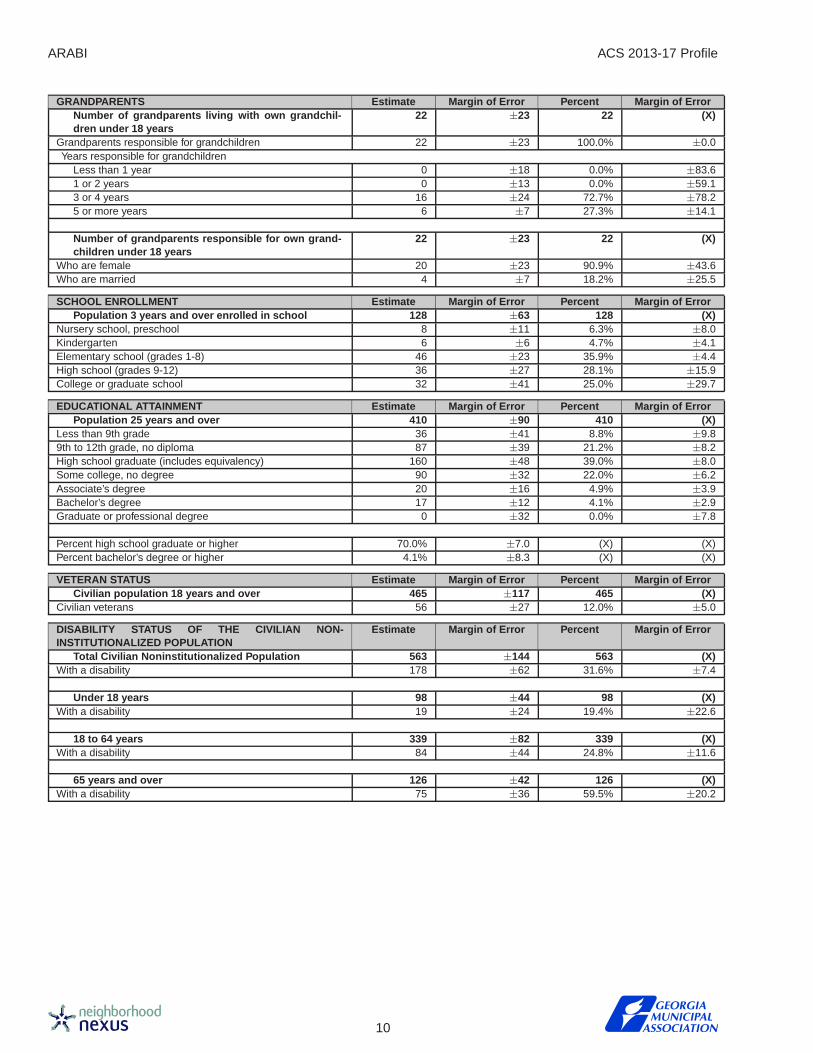
GRANDPARENTS Estimate Margin of Error Percent Margin of ErrorNumber of grandparents living with own grandchil-dren under 18 years
22 ±23 22 (X)
Grandparents responsible for grandchildren 22 ±23 100.0% ±0.0Years responsible for grandchildren
Less than 1 year 0 ±18 0.0% ±83.61 or 2 years 0 ±13 0.0% ±59.13 or 4 years 16 ±24 72.7% ±78.25 or more years 6 ±7 27.3% ±14.1
Number of grandparents responsible for own grand-children under 18 years
22 ±23 22 (X)
Who are female 20 ±23 90.9% ±43.6Who are married 4 ±7 18.2% ±25.5
SCHOOL ENROLLMENT Estimate Margin of Error Percent Margin of ErrorPopulation 3 years and over enrolled in school 128 ±63 128 (X)
Nursery school, preschool 8 ±11 6.3% ±8.0Kindergarten 6 ±6 4.7% ±4.1Elementary school (grades 1-8) 46 ±23 35.9% ±4.4High school (grades 9-12) 36 ±27 28.1% ±15.9College or graduate school 32 ±41 25.0% ±29.7
EDUCATIONAL ATTAINMENT Estimate Margin of Error Percent Margin of ErrorPopulation 25 years and over 410 ±90 410 (X)
Less than 9th grade 36 ±41 8.8% ±9.89th to 12th grade, no diploma 87 ±39 21.2% ±8.2High school graduate (includes equivalency) 160 ±48 39.0% ±8.0Some college, no degree 90 ±32 22.0% ±6.2Associate’s degree 20 ±16 4.9% ±3.9Bachelor’s degree 17 ±12 4.1% ±2.9Graduate or professional degree 0 ±32 0.0% ±7.8
Percent high school graduate or higher 70.0% ±7.0 (X) (X)Percent bachelor’s degree or higher 4.1% ±8.3 (X) (X)
VETERAN STATUS Estimate Margin of Error Percent Margin of ErrorCivilian population 18 years and over 465 ±117 465 (X)
Civilian veterans 56 ±27 12.0% ±5.0
DISABILITY STATUS OF THE CIVILIAN NON-INSTITUTIONALIZED POPULATION
Estimate Margin of Error Percent Margin of Error
Total Civilian Noninstitutionalized Population 563 ±144 563 (X)With a disability 178 ±62 31.6% ±7.4
Under 18 years 98 ±44 98 (X)With a disability 19 ±24 19.4% ±22.6
18 to 64 years 339 ±82 339 (X)With a disability 84 ±44 24.8% ±11.6
65 years and over 126 ±42 126 (X)With a disability 75 ±36 59.5% ±20.2
10

ACS 2013-17 Profile ARABI
RESIDENCE 1 YEAR AGO Estimate Margin of Error Percent Margin of ErrorPopulation 1 year and over 558 ±143 558 (X)
Same house 519 ±142 93.0% ±8.9Different house in the U.S. 39 ±33 7.0% ±5.6
Same county 27 ±29 4.8% ±5.0Different county 12 ±16 2.2% ±2.7Same state 9 ±15 1.6% ±2.7Different state 3 ±4 0.5% ±0.7
Abroad 0 ±13 0.0% ±2.3
PLACE OF BIRTH Estimate Margin of Error Percent Margin of ErrorTotal population 563 ±144 563 (X)
Native 563 ±144 100.0% ±0.0Born in United States 563 ±142 100.0% ±35.9State of residence 499 ±137 88.6% ±8.8Different state 64 ±36 11.4% ±5.7
Born in Puerto Rico, U.S. Island areas, or born abroad toAmerican parent(s)
0 ±13 0.0% ±2.3
Foreign born 0 ±13 0.0% ±2.3
U.S. CITIZENSHIP STATUS Estimate Margin of Error Percent Margin of ErrorForeign-born population 0 ±13 0 (X)
Naturalized U.S. citizen 0 ±13 .% ±.Not a U.S. citizen 0 ±13 .% ±.
YEAR OF ENTRY Estimate Margin of Error Percent Margin of ErrorPopulation born outside the United States 0 ±13 0 (X)
Native 0 ±26 0 (X)Entered 2010 or later 0 ±13 .% ±.Entered before 2010 0 ±23 .% ±.
Foreign born 0 ±13 0 (X)Entered 2010 or later 0 ±13 .% ±.Entered before 2010 0 ±23 .% ±.
WORLD REGION OF BIRTH OF FOREIGN BORN Estimate Margin of Error Percent Margin of ErrorForeign-born population, excluding population bornat sea
0 ±13 0 (X)
Europe 0 ±13 .% ±.Asia 0 ±13 .% ±.Africa 0 ±13 .% ±.Oceania 0 ±13 .% ±.Latin America 0 ±13 .% ±.Northern America 0 ±13 .% ±.
LANGUAGE SPOKEN AT HOME Estimate Margin of Error Percent Margin of ErrorPopulation 5 years and over 541 ±136 541 (X)
English only 541 ±131 100.0% ±34.9Language other than English 0 ±45 0.0% ±8.3
Speak English less than ’very well’ 0 ±78 0.0% ±14.4Spanish 0 ±23 0.0% ±4.2Speak English less than ’very well’ 0 ±39 0.0% ±7.2
Other Indo-European languages 0 ±23 0.0% ±4.2Speak English less than ’very well’ 0 ±39 0.0% ±7.2
Asian and Pacific Islander languages 0 ±23 0.0% ±4.2Speak English less than ’very well’ 0 ±39 0.0% ±7.2
Other languages 0 ±23 0.0% ±4.2Speak English less than ’very well’ 0 ±39 0.0% ±7.2
11
ARABI ACS 2013-17 Profile
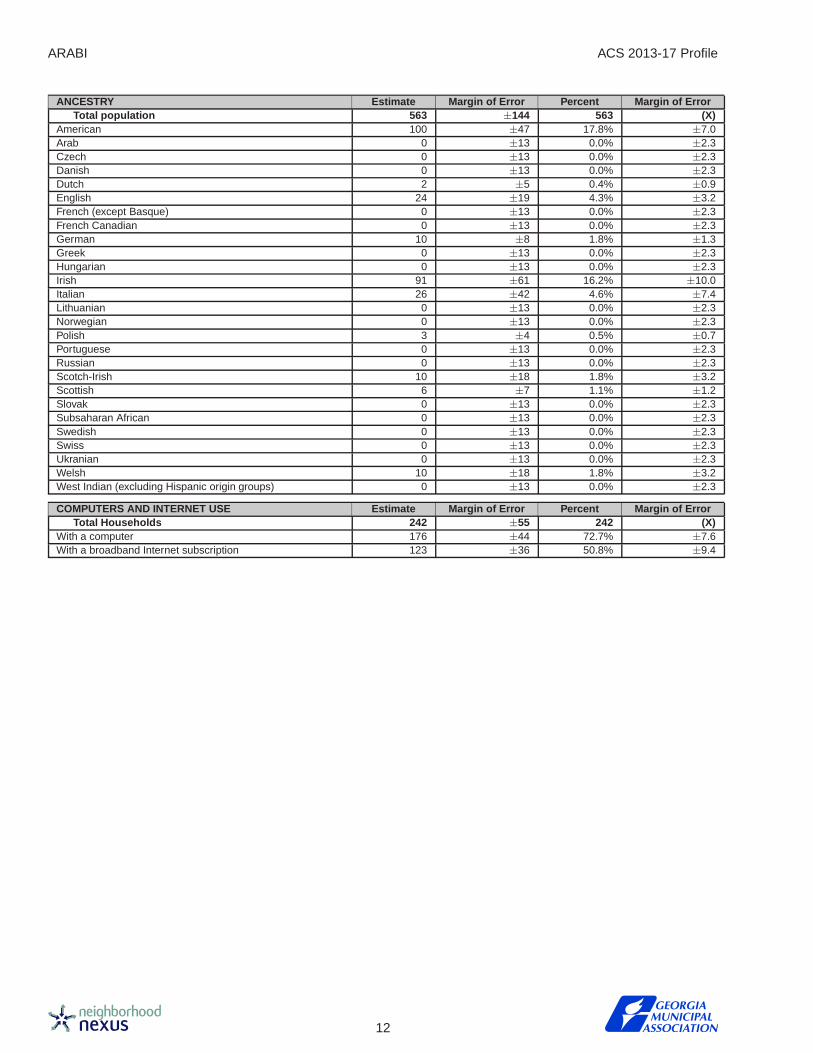
ANCESTRY Estimate Margin of Error Percent Margin of ErrorTotal population 563 ±144 563 (X)
American 100 ±47 17.8% ±7.0Arab 0 ±13 0.0% ±2.3Czech 0 ±13 0.0% ±2.3Danish 0 ±13 0.0% ±2.3Dutch 2 ±5 0.4% ±0.9English 24 ±19 4.3% ±3.2French (except Basque) 0 ±13 0.0% ±2.3French Canadian 0 ±13 0.0% ±2.3German 10 ±8 1.8% ±1.3Greek 0 ±13 0.0% ±2.3Hungarian 0 ±13 0.0% ±2.3Irish 91 ±61 16.2% ±10.0Italian 26 ±42 4.6% ±7.4Lithuanian 0 ±13 0.0% ±2.3Norwegian 0 ±13 0.0% ±2.3Polish 3 ±4 0.5% ±0.7Portuguese 0 ±13 0.0% ±2.3Russian 0 ±13 0.0% ±2.3Scotch-Irish 10 ±18 1.8% ±3.2Scottish 6 ±7 1.1% ±1.2Slovak 0 ±13 0.0% ±2.3Subsaharan African 0 ±13 0.0% ±2.3Swedish 0 ±13 0.0% ±2.3Swiss 0 ±13 0.0% ±2.3Ukranian 0 ±13 0.0% ±2.3Welsh 10 ±18 1.8% ±3.2West Indian (excluding Hispanic origin groups) 0 ±13 0.0% ±2.3
COMPUTERS AND INTERNET USE Estimate Margin of Error Percent Margin of ErrorTotal Households 242 ±55 242 (X)
With a computer 176 ±44 72.7% ±7.6With a broadband Internet subscription 123 ±36 50.8% ±9.4
12

ACS 2013-17 Profile ARABI
Selected Economic Characteristics
EMPLOYMENT STATUS Estimate Margin of Error Percent Margin of ErrorPopulation 16 years and over 471 ±118 471 (X)
In labor force 235 ±72 49.9% ±8.7Civilian labor force 235 ±72 49.9% ±8.7Employed 187 ±66 39.7% ±10.0Unemployed 48 ±66 10.2% ±13.7
Armed Forces 0 ±58 0.0% ±12.3Not in labor force 236 ±75 50.1% ±9.8
Civilian labor force 235 ±72 235 (X)Unemployment Rate 20.4% ±27.2 (X) (X)
Females 16 years and over 256 ±84 256 (X)In labor force 120 ±55 46.9% ±14.7
Civilian labor force 120 ±55 46.9% ±14.7Employed 93 ±49 36.3% ±14.9
own children of the householder under 6 years 22 ±23 22 (X)All parents in family in labor force 11 ±18 50.0% ±64.4
own children of the householder 6 to 17 years 60 ±39 60 (X)All parents in family in labor force 56 ±39 93.3% ±22.7
13
ARABI ACS 2013-17 Profile
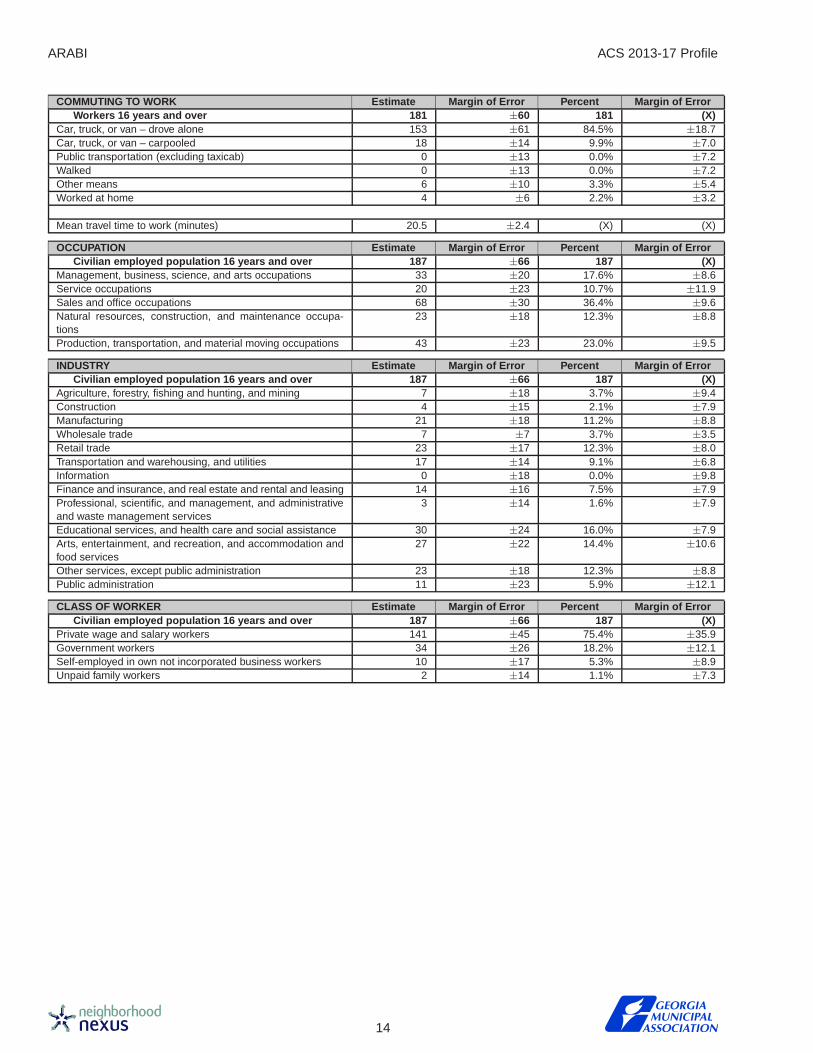
COMMUTING TO WORK Estimate Margin of Error Percent Margin of ErrorWorkers 16 years and over 181 ±60 181 (X)
Car, truck, or van – drove alone 153 ±61 84.5% ±18.7Car, truck, or van – carpooled 18 ±14 9.9% ±7.0Public transportation (excluding taxicab) 0 ±13 0.0% ±7.2Walked 0 ±13 0.0% ±7.2Other means 6 ±10 3.3% ±5.4Worked at home 4 ±6 2.2% ±3.2
Mean travel time to work (minutes) 20.5 ±2.4 (X) (X)
OCCUPATION Estimate Margin of Error Percent Margin of ErrorCivilian employed population 16 years and over 187 ±66 187 (X)
Management, business, science, and arts occupations 33 ±20 17.6% ±8.6Service occupations 20 ±23 10.7% ±11.9Sales and office occupations 68 ±30 36.4% ±9.6Natural resources, construction, and maintenance occupa-tions
23 ±18 12.3% ±8.8
Production, transportation, and material moving occupations 43 ±23 23.0% ±9.5
INDUSTRY Estimate Margin of Error Percent Margin of ErrorCivilian employed population 16 years and over 187 ±66 187 (X)
Agriculture, forestry, fishing and hunting, and mining 7 ±18 3.7% ±9.4Construction 4 ±15 2.1% ±7.9Manufacturing 21 ±18 11.2% ±8.8Wholesale trade 7 ±7 3.7% ±3.5Retail trade 23 ±17 12.3% ±8.0Transportation and warehousing, and utilities 17 ±14 9.1% ±6.8Information 0 ±18 0.0% ±9.8Finance and insurance, and real estate and rental and leasing 14 ±16 7.5% ±7.9Professional, scientific, and management, and administrativeand waste management services
3 ±14 1.6% ±7.9
Educational services, and health care and social assistance 30 ±24 16.0% ±7.9Arts, entertainment, and recreation, and accommodation andfood services
27 ±22 14.4% ±10.6
Other services, except public administration 23 ±18 12.3% ±8.8Public administration 11 ±23 5.9% ±12.1
CLASS OF WORKER Estimate Margin of Error Percent Margin of ErrorCivilian employed population 16 years and over 187 ±66 187 (X)
Private wage and salary workers 141 ±45 75.4% ±35.9Government workers 34 ±26 18.2% ±12.1Self-employed in own not incorporated business workers 10 ±17 5.3% ±8.9Unpaid family workers 2 ±14 1.1% ±7.3
14

ACS 2013-17 Profile ARABI
INCOME AND BENEFITS (IN 2017 INFLATION-ADJUSTEDDOLLARS)
Estimate Margin of Error Percent Margin of Error
Total households 242 ±55 242 (X)Less than $10,000 34 ±30 14.0% ±12.0$10,000 to $14,999 45 ±29 18.6% ±11.2$15,000 to $24,999 17 ±11 7.0% ±4.1$25,000 to $34,999 35 ±25 14.5% ±10.0$35,000 to $49,999 39 ±21 16.1% ±10.0$50,000 to $74,999 66 ±30 27.3% ±10.0$75,000 to $99,999 0 ±13 0.0% ±5.4$100,000 to $149,999 6 ±14 2.5% ±5.7$150,000 to $199,999 0 ±13 0.0% ±5.4$200,000 or more 0 ±13 0.0% ±5.4Median household income (dollars) 30,833 ±11,009 (X) (X)Mean household income (dollars) 34,443 ±10,946 (X) (X)
With earnings 135 ±40 55.8% ±10.6Mean earnings (dollars) 39,018 ±2,794 (X) (X)
With Social Security 118 ±42 48.8% ±13.4Mean Social Security income (dollars) 16,307 ±8,203 (X) (X)
With retirement income 62 ±29 25.6% ±10.5Mean retirement income (dollars) 12,681 ±1,727 (X) (X)
With Supplemental Security Income 12 ±14 5.0% ±5.7Mean Supplemental Security Income (dollars) 10,058 ±16,387 (X) (X)
With cash public assistance income 0 ±13 0.0% ±5.4Mean cash public assistance income (dollars) . ±. (X) (X)
With Food Stamp/SNAP benefits in the past 12 months 67 ±37 27.7% ±13.9
Families 142 ±38 142 (X)Less than $10,000 20 ±25 14.1% ±17.2$10,000 to $14,999 5 ±10 3.5% ±7.0$15,000 to $24,999 18 ±16 12.7% ±10.5$25,000 to $34,999 15 ±11 10.6% ±7.3$35,000 to $49,999 21 ±16 14.8% ±10.6$50,000 to $74,999 57 ±25 40.1% ±14.4$75,000 to $99,999 0 ±13 0.0% ±9.2$100,000 to $149,999 6 ±14 4.2% ±9.7$150,000 to $199,999 0 ±13 0.0% ±9.2$200,000 or more 0 ±13 0.0% ±9.2Median family income (dollars) 41,250 ±13,307 (X) (X)Mean family income (dollars) 41,669 ±1,624 (X) (X)
Per capita income (dollars) 16,201 ±5,389 (X) (X)
Nonfamily households 100 ±40 100 (X)Median nonfamily income (dollars) 14,565 ±8,749 (X) (X)Mean nonfamily income (dollars) 22,521 ±4,882 (X) (X)
Median earnings for workers (dollars) 22,308 ±8,176 (X) (X)Median earnings for male full-time, year-round workers (dol-lars)
32,083 ±11,684 (X) (X)
Median earnings for female full-time, year-round workers (dol-lars)
22,500 ±6,435 (X) (X)
15

ARABI ACS 2013-17 Profile
HEALTH INSURANCE COVERAGE Estimate Margin of Error Percent Margin of ErrorCivilian noninstitutionalized population 563 ±144 563 (X)With health insurance coverage 475 ±99 84.4% ±27.8With private health insurance 327 ±78 58.1% ±20.3With public coverage 250 ±74 44.4% ±6.6No health insurance coverage 88 ±56 15.6% ±9.2
Civilian noninstitutionalized population under 1 years 114 ±55 114 (X)No health insurance coverage 5 ±16 4.4% ±13.7
Civilian noninstitutionalized population 19 to 64 years 323 ±110 323 (X)In labor force: 212 ±79 212 (X)Employed: 168 ±58 168 (X)With health insurance coverage 123 ±45 73.2% ±8.9With private health insurance 123 ±45 73.2% ±8.9With public coverage 20 ±19 11.9% ±10.5No health insurance coverage 45 ±32 26.8% ±16.7
Unemployed: 44 ±38 44 (X)With health insurance coverage 8 ±7 18.2% ±2.6With private health insurance 5 ±5 11.4% ±5.7With public coverage 3 ±5 6.8% ±9.7No health insurance coverage 36 ±37 81.8% ±45.6
Not in labor force: 111 ±52 111 (X)With health insurance coverage 109 ±53 98.2% ±12.8With private health insurance 60 ±35 54.1% ±18.8With public coverage 54 ±36 48.6% ±23.1No health insurance coverage 2 ±4 1.8% ±3.5
PERCENTAGE OF FAMILIES AND PEOPLE WHOSE IN-COME IN THE PAST 12 MONTHS IS BELOW THEPOVERTY LEVEL
Estimate Margin of Error Percent Margin of Error
All families 22.5% ±19.5 (X) (X)With related children of the householder under 18 years 37.5% ±48.3 (X) (X)With related children of the householder under 5 years
only.% ±. (X) (X)
Married couple families 4.9% ±5.9 (X) (X)With related children of the householder under 18 years 0.0% ±61.9 (X) (X)With related children of the householder under 5 years
only.% ±. (X) (X)
Families with female householder, no husband present 46.7% ±37.2 (X) (X)With related children of the householder under 18 years 60.0% ±50.1 (X) (X)With related children of the householder under 5 years
only.% ±. (X) (X)
All people 23.1% ±15.0 (X) (X)Under 18 years 21.4% ±36.5 (X) (X)
related children of the householder under 18 years 21.4% ±23.8 (X) (X)related children of the householder under 5 years 27.3% ±98.2 (X) (X)related children of the householder 5 to 17 years 19.7% ±40.4 (X) (X)
18 years and over 23.4% ±12.3 (X) (X)18 to 64 years 28.6% ±15.3 (X) (X)65 years and over 9.5% ±17.3 (X) (X)
People in families 22.5% ±17.2 (X) (X)Unrelated individuals 15 years and over 25.2% ±16.7 (X) (X)
16
ACS 2013-17 Profile ARABI
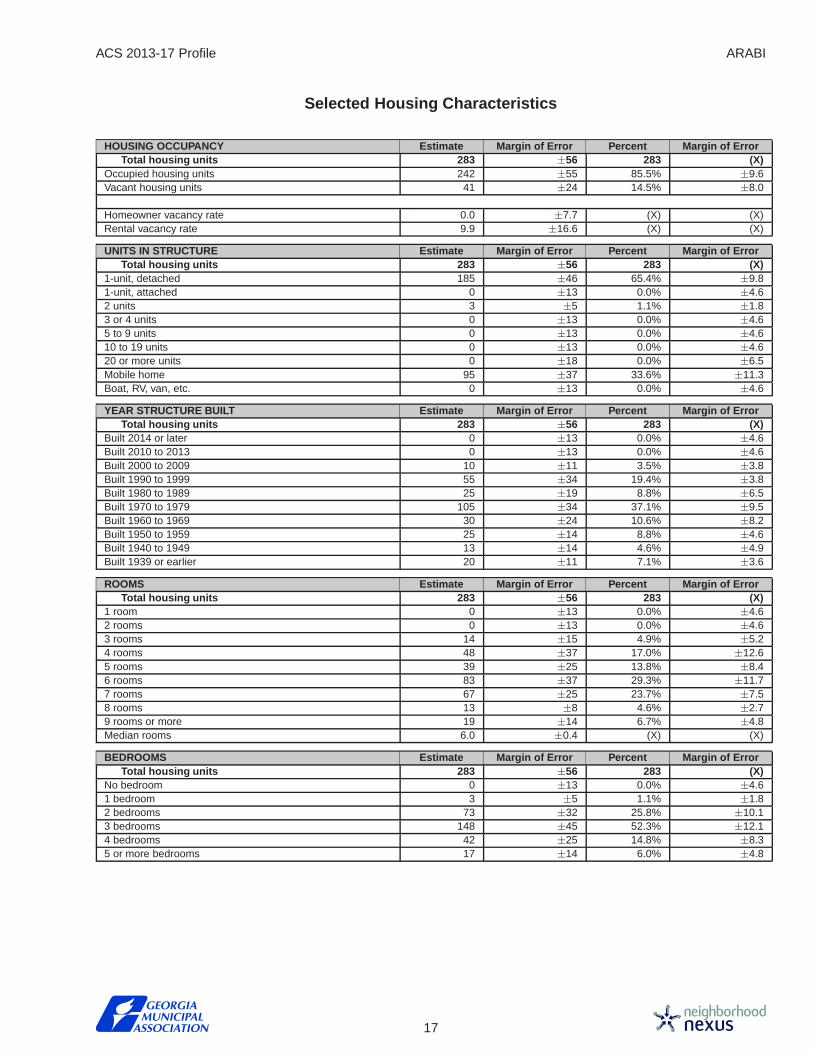
Selected Housing Characteristics
HOUSING OCCUPANCY Estimate Margin of Error Percent Margin of ErrorTotal housing units 283 ±56 283 (X)
Occupied housing units 242 ±55 85.5% ±9.6Vacant housing units 41 ±24 14.5% ±8.0
Homeowner vacancy rate 0.0 ±7.7 (X) (X)Rental vacancy rate 9.9 ±16.6 (X) (X)
UNITS IN STRUCTURE Estimate Margin of Error Percent Margin of ErrorTotal housing units 283 ±56 283 (X)
1-unit, detached 185 ±46 65.4% ±9.81-unit, attached 0 ±13 0.0% ±4.62 units 3 ±5 1.1% ±1.83 or 4 units 0 ±13 0.0% ±4.65 to 9 units 0 ±13 0.0% ±4.610 to 19 units 0 ±13 0.0% ±4.620 or more units 0 ±18 0.0% ±6.5Mobile home 95 ±37 33.6% ±11.3Boat, RV, van, etc. 0 ±13 0.0% ±4.6
YEAR STRUCTURE BUILT Estimate Margin of Error Percent Margin of ErrorTotal housing units 283 ±56 283 (X)
Built 2014 or later 0 ±13 0.0% ±4.6Built 2010 to 2013 0 ±13 0.0% ±4.6Built 2000 to 2009 10 ±11 3.5% ±3.8Built 1990 to 1999 55 ±34 19.4% ±3.8Built 1980 to 1989 25 ±19 8.8% ±6.5Built 1970 to 1979 105 ±34 37.1% ±9.5Built 1960 to 1969 30 ±24 10.6% ±8.2Built 1950 to 1959 25 ±14 8.8% ±4.6Built 1940 to 1949 13 ±14 4.6% ±4.9Built 1939 or earlier 20 ±11 7.1% ±3.6
ROOMS Estimate Margin of Error Percent Margin of ErrorTotal housing units 283 ±56 283 (X)
1 room 0 ±13 0.0% ±4.62 rooms 0 ±13 0.0% ±4.63 rooms 14 ±15 4.9% ±5.24 rooms 48 ±37 17.0% ±12.65 rooms 39 ±25 13.8% ±8.46 rooms 83 ±37 29.3% ±11.77 rooms 67 ±25 23.7% ±7.58 rooms 13 ±8 4.6% ±2.79 rooms or more 19 ±14 6.7% ±4.8Median rooms 6.0 ±0.4 (X) (X)
BEDROOMS Estimate Margin of Error Percent Margin of ErrorTotal housing units 283 ±56 283 (X)
No bedroom 0 ±13 0.0% ±4.61 bedroom 3 ±5 1.1% ±1.82 bedrooms 73 ±32 25.8% ±10.13 bedrooms 148 ±45 52.3% ±12.14 bedrooms 42 ±25 14.8% ±8.35 or more bedrooms 17 ±14 6.0% ±4.8
17

ARABI ACS 2013-17 Profile
HOUSING TENURE Estimate Margin of Error Percent Margin of ErrorOccupied housing units 242 ±55 242 (X)
Owner-occupied 169 ±52 69.8% ±14.5Renter-occupied 73 ±35 30.2% ±12.7
Average household size of owner-occupied unit 2.23 ±0.00 (X) (X)Average household size of renter-occupied unit 2.55 ±0.62 (X) (X)
YEAR HOUSEHOLDER MOVED INTO UNIT Estimate Margin of Error Percent Margin of ErrorOccupied housing units 242 ±55 242 (X)
Moved in 2015 or later 6 ±8 2.5% ±3.2Moved in 2010 to 2014 77 ±39 31.8% ±14.5Moved in 2000 to 2009 42 ±25 17.4% ±9.7Moved in 1990 to 1999 45 ±30 18.6% ±11.6Moved in 1980 to 1989 29 ±26 12.0% ±10.2Moved in 1979 or earlier 43 ±26 17.8% ±9.8
VEHICLES AVAILABLE Estimate Margin of Error Percent Margin of ErrorOccupied housing units 242 ±55 242 (X)
No vehicles available 16 ±16 6.6% ±6.31 vehicle available 80 ±43 33.1% ±16.22 vehicles available 107 ±37 44.2% ±11.43 or more vehicles available 39 ±31 16.1% ±12.2
HOUSE HEATING FUEL Estimate Margin of Error Percent Margin of ErrorOccupied housing units 242 ±55 242 (X)
Utility gas 0 ±13 0.0% ±5.4Bottled, tank, or LP gas 27 ±15 11.2% ±5.7Electricity 212 ±55 87.6% ±11.0Fuel oil, kerosene, etc. 0 ±13 0.0% ±5.4Coal or coke 0 ±13 0.0% ±5.4Wood 0 ±13 0.0% ±5.4Solar energy 0 ±13 0.0% ±5.4Other fuel 3 ±5 1.2% ±2.0No fuel used 0 ±13 0.0% ±5.4
SELECTED CHARACTERISTICS Estimate Margin of Error Percent Margin of ErrorOccupied housing units 242 ±55 242 (X)
Lacking complete plumbing facilities 0 ±13 0.0% ±5.4Lacking complete kitchen facilities 0 ±13 0.0% ±5.4No telephone service available 9 ±10 3.7% ±4.2
OCCUPANTS PER ROOM Estimate Margin of Error Percent Margin of ErrorOccupied housing units 242 ±55 242 (X)
1.00 or less 236 ±62 97.5% ±12.81.01 to 1.50 6 ±16 2.5% ±6.51.51 or more 0 ±26 0.0% ±10.7
VALUE Estimate Margin of Error Percent Margin of ErrorOwner-occupied units 169 ±52 169 (X)
Less than $50,000 72 ±32 42.6% ±13.3$50,000 to $99,999 64 ±28 37.9% ±12.2$100,000 to $149,999 11 ±12 6.5% ±6.9$150,000 to $199,999 20 ±21 11.8% ±12.1$200,000 to $299,999 2 ±13 1.2% ±7.9$300,000 to $499,999 0 ±18 0.0% ±10.9$500,000 to $999,999 0 ±18 0.0% ±10.9$1,000,000 or more 0 ±23 0.0% ±13.3Median (dollars) 57,800 ±12,572 (X) (X)
18

ACS 2013-17 Profile ARABI
MORTGAGE STATUS Estimate Margin of Error Percent Margin of ErrorOwner-occupied units 169 ±52 169 (X)
Housing units with a mortgage 58 ±26 34.3% ±11.2Housing units without a mortgage 111 ±47 65.7% ±19.1
SELECTED MONTHLY OWNER COSTS (SMOC) Estimate Margin of Error Percent Margin of ErrorHousing units with a mortgage 58 ±26 58 (X)
Less than $500 6 ±20 10.3% ±33.6$500 to $999 41 ±22 70.7% ±20.1$1,000 to $1,499 11 ±13 19.0% ±20.7$1,500 to $1,999 0 ±13 0.0% ±22.4$2,000 to $2,499 0 ±13 0.0% ±22.4$2,500 to $2,999 0 ±13 0.0% ±22.4$3,000 or more 0 ±23 0.0% ±38.8Median (dollars) 725 ±74 (X) (X)
Housing units without a mortgage 111 ±47 111 (X)Less than $250 60 ±37 54.1% ±24.7$250 to $399 33 ±17 29.7% ±9.3$400 to $599 16 ±15 14.4% ±11.6$600 to $799 2 ±13 1.8% ±12.0$800 to $999 0 ±18 0.0% ±16.6$1,000 or more 0 ±32 0.0% ±28.7Median (dollars) 243 ±44 (X) (X)
SELECTED MONTHLY OWNER COSTS AS A PERCENT-AGE OF HOUSEHOLD INCOME (SMOCAPI)
Estimate Margin of Error Percent Margin of Error
Housing units with a mortgage (excluding units whereSMOCAPI cannot be computed)
58 ±34 58 (X)
Less than 20.0 percent 36 ±23 62.1% ±15.120.0 to 24.9 percent 6 ±7 10.3% ±10.425.0 to 29.9 percent 9 ±14 15.5% ±22.430.0 to 34.9 percent 3 ±5 5.2% ±8.135.0 percent or more 4 ±19 6.9% ±32.6
Not computed 0 ±13 (X) (X)
Housing unit without a mortgage (excluding unitswhere SMOCAPI cannot be computed)
111 ±45 111 (X)
Less than 10.0 percent 34 ±15 30.6% ±5.110.0 to 14.9 percent 42 ±32 37.8% ±24.315.0 to 19.9 percent 9 ±11 8.1% ±9.320.0 to 24.9 percent 3 ±5 2.7% ±4.425.0 to 29.9 percent 8 ±10 7.2% ±8.530.0 to 34.9 percent 7 ±7 6.3% ±5.835.0 percent or more 8 ±23 7.2% ±20.1
Not computed 0 ±13 (X) (X)
GROSS RENT Estimate Margin of Error Percent Margin of ErrorOccupied units paying rent 35 ±20 35 (X)
Less than $500 13 ±35 37.1% ±96.6$500 to $999 22 ±32 62.9% ±82.6$1,000 to $1,499 0 ±18 0.0% ±52.5$1,500 to $1,999 0 ±13 0.0% ±37.1$2,000 to $2,499 0 ±13 0.0% ±37.1$2,500 to $2,999 0 ±13 0.0% ±37.1$3,000 or more 0 ±18 0.0% ±52.5Median (dollars) 661 ±306 (X) (X)
No rent paid 38 ±30 (X) (X)
19
ARABI ACS 2013-17 Profile
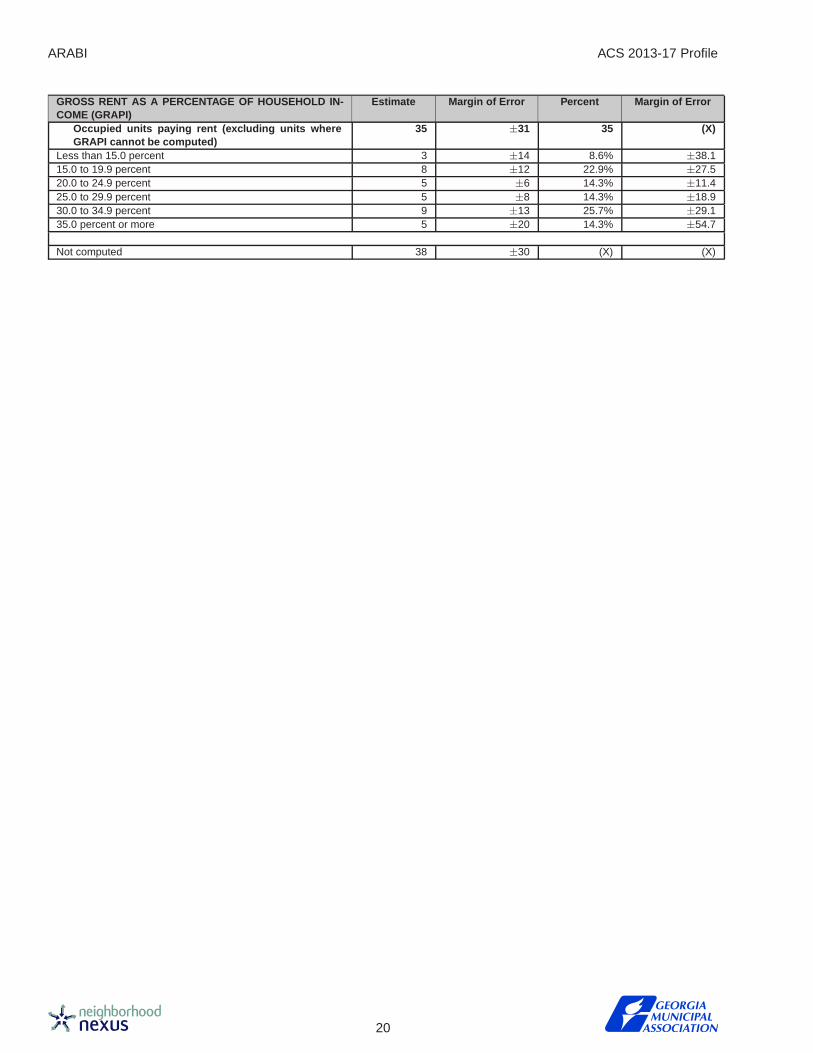
GROSS RENT AS A PERCENTAGE OF HOUSEHOLD IN-COME (GRAPI)
Estimate Margin of Error Percent Margin of Error
Occupied units paying rent (excluding units whereGRAPI cannot be computed)
35 ±31 35 (X)
Less than 15.0 percent 3 ±14 8.6% ±38.115.0 to 19.9 percent 8 ±12 22.9% ±27.520.0 to 24.9 percent 5 ±6 14.3% ±11.425.0 to 29.9 percent 5 ±8 14.3% ±18.930.0 to 34.9 percent 9 ±13 25.7% ±29.135.0 percent or more 5 ±20 14.3% ±54.7
Not computed 38 ±30 (X) (X)
20
ACS 2013-17 Profile ARABI
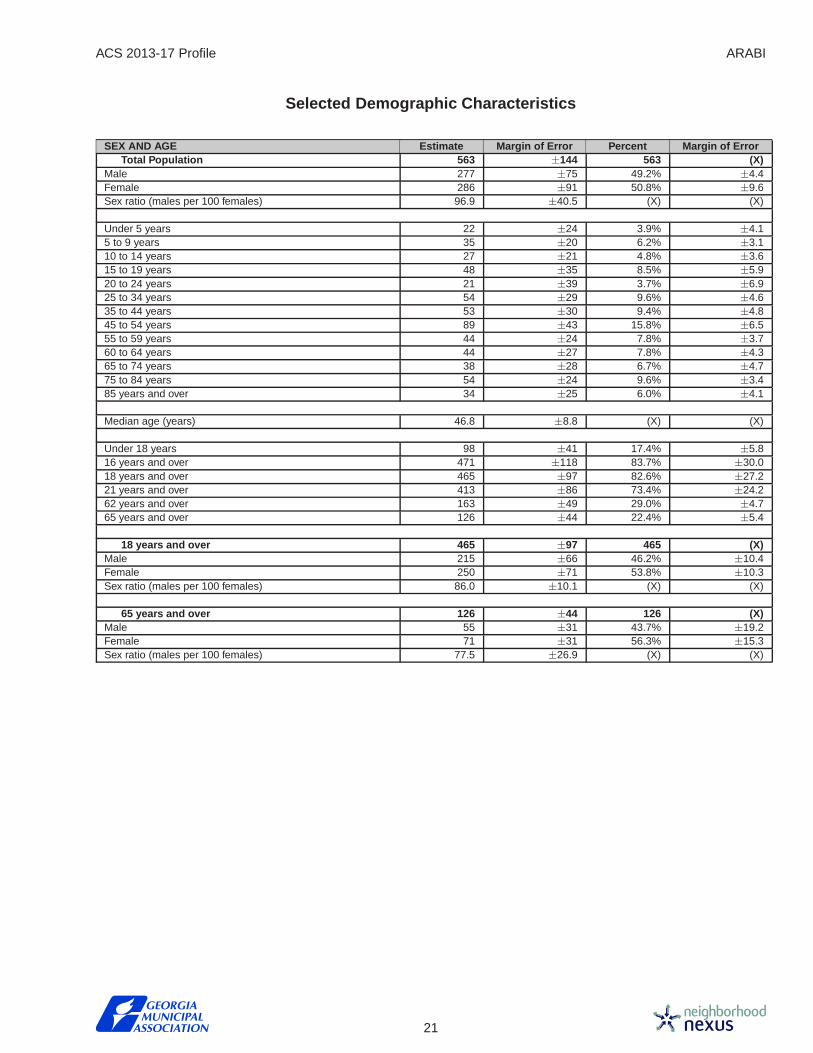
Selected Demographic Characteristics
SEX AND AGE Estimate Margin of Error Percent Margin of ErrorTotal Population 563 ±144 563 (X)
Male 277 ±75 49.2% ±4.4Female 286 ±91 50.8% ±9.6Sex ratio (males per 100 females) 96.9 ±40.5 (X) (X)
Under 5 years 22 ±24 3.9% ±4.15 to 9 years 35 ±20 6.2% ±3.110 to 14 years 27 ±21 4.8% ±3.615 to 19 years 48 ±35 8.5% ±5.920 to 24 years 21 ±39 3.7% ±6.925 to 34 years 54 ±29 9.6% ±4.635 to 44 years 53 ±30 9.4% ±4.845 to 54 years 89 ±43 15.8% ±6.555 to 59 years 44 ±24 7.8% ±3.760 to 64 years 44 ±27 7.8% ±4.365 to 74 years 38 ±28 6.7% ±4.775 to 84 years 54 ±24 9.6% ±3.485 years and over 34 ±25 6.0% ±4.1
Median age (years) 46.8 ±8.8 (X) (X)
Under 18 years 98 ±41 17.4% ±5.816 years and over 471 ±118 83.7% ±30.018 years and over 465 ±97 82.6% ±27.221 years and over 413 ±86 73.4% ±24.262 years and over 163 ±49 29.0% ±4.765 years and over 126 ±44 22.4% ±5.4
18 years and over 465 ±97 465 (X)Male 215 ±66 46.2% ±10.4Female 250 ±71 53.8% ±10.3Sex ratio (males per 100 females) 86.0 ±10.1 (X) (X)
65 years and over 126 ±44 126 (X)Male 55 ±31 43.7% ±19.2Female 71 ±31 56.3% ±15.3Sex ratio (males per 100 females) 77.5 ±26.9 (X) (X)
21

ARABI ACS 2013-17 Profile
RACE Estimate Margin of Error Percent Margin of ErrorTotal population 563 ±144 563 (X)
One race 563 ±144 100.0% ±0.0Two or more races 0 ±13 0.0% ±2.3One race 563 ±144 100.0% ±0.0
White 449 ±116 79.8% ±2.9Black or African American 114 ±78 20.2% ±12.8American Indian and Alaska Native 0 ±13 0.0% ±2.3Cherokee tribal grouping 0 ±13 0.0% ±2.3Chippewa tribal grouping 0 ±13 0.0% ±2.3Navajo tribal grouping 0 ±13 0.0% ±2.3Sioux tribal grouping 0 ±13 0.0% ±2.3
Asian 0 ±13 0.0% ±2.3Asian Indian 0 ±13 0.0% ±2.3Chinese 0 ±18 0.0% ±3.3Filipino 0 ±13 0.0% ±2.3Japanese 0 ±13 0.0% ±2.3Korean 0 ±13 0.0% ±2.3Vietnamese 0 ±13 0.0% ±2.3Other Asian 0 ±54 0.0% ±9.5
Native Hawaiian and Other Pacific Islander 0 ±13 0.0% ±2.3Native Hawaiian 0 ±13 0.0% ±2.3Guamanian or Chamorro 0 ±13 0.0% ±2.3Samoan 0 ±13 0.0% ±2.3Other Pacific Islander 0 ±37 0.0% ±6.5
Some other race 0 ±13 0.0% ±2.3Two or more races 0 ±13 0.0% ±2.3
White and Black or African American 0 ±13 0.0% ±2.3White and American Indian and Alaska Native 0 ±13 0.0% ±2.3White and Asian 0 ±13 0.0% ±2.3Black or African American and American Indian andAlaska Native
0 ±13 0.0% ±2.3
Race alone or in combination with one or more other racesTotal population 563 ±144 563 (X)
White 449 ±116 79.8% ±2.9Black or African American 114 ±78 20.2% ±12.8American Indian and Alaska Native 0 ±13 0.0% ±2.3Asian 0 ±13 0.0% ±2.3Native Hawaiian and Other Pacific Islander 0 ±13 0.0% ±2.3Some other race 0 ±13 0.0% ±2.3
HISPANIC OR LATINO AND RACE Estimate Margin of Error Percent Margin of ErrorTotal population 563 ±144 563 (X)
Hispanic or Latino (of any race) 0 ±13 0.0% ±2.3Mexican 0 ±13 0.0% ±2.3Puerto Rican 0 ±13 0.0% ±2.3Cuban 0 ±13 0.0% ±2.3Other Hispanic or Latino 0 ±26 0.0% ±4.6
Not Hispanic or Latino 563 ±144 100.0% ±0.0White alone 449 ±116 79.8% ±2.9Black or African American alone 114 ±78 20.2% ±12.8American Indian and Alaska Native alone 0 ±13 0.0% ±2.3Asian alone 0 ±13 0.0% ±2.3Native Hawaiian and Other Pacific Islander alone 0 ±13 0.0% ±2.3Some other race alone 0 ±13 0.0% ±2.3Two or more races 0 ±13 0.0% ±2.3Two races including Some other race 0 ±13 0.0% ±2.3Two races excluding Some other race, and 0 ±13 0.0% ±2.3Three or more races
22
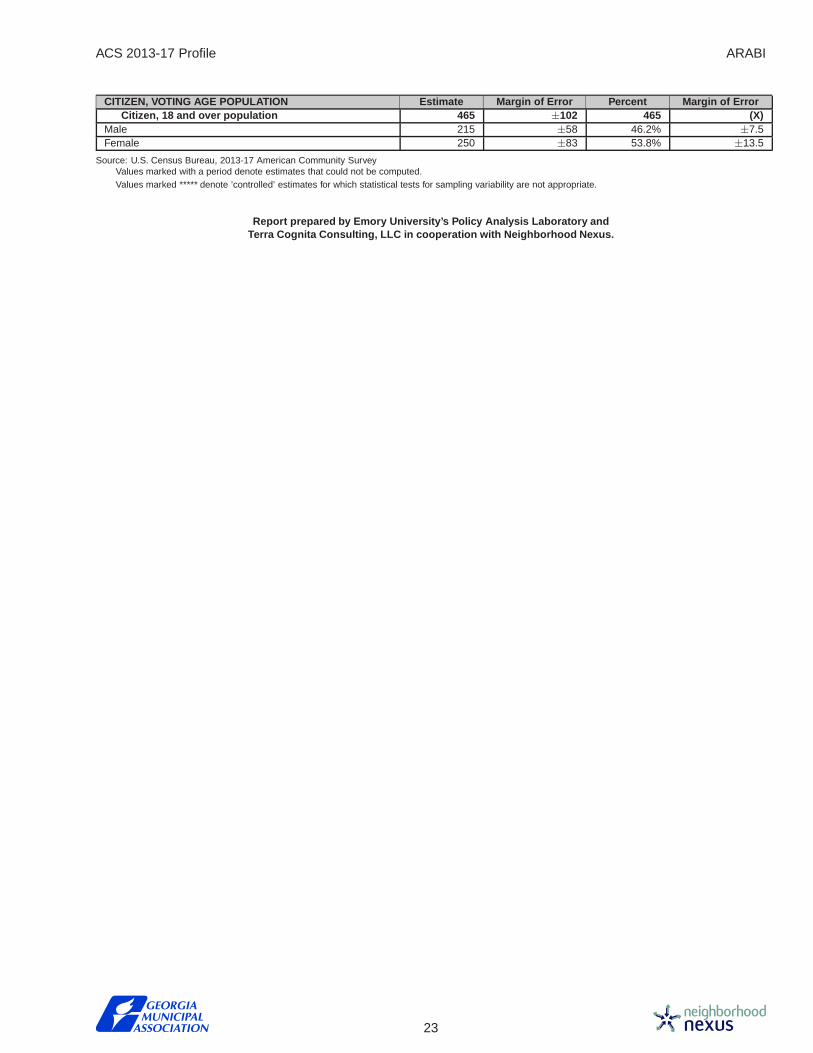
ACS 2013-17 Profile ARABI
CITIZEN, VOTING AGE POPULATION Estimate Margin of Error Percent Margin of ErrorCitizen, 18 and over population 465 ±102 465 (X)
Male 215 ±58 46.2% ±7.5Female 250 ±83 53.8% ±13.5
Source: U.S. Census Bureau, 2013-17 American Community SurveyValues marked with a period denote estimates that could not be computed.Values marked ***** denote ’controlled’ estimates for which statistical tests for sampling variability are not appropriate.
Report prepared by Emory University’s Policy Analysis Laboratory andTerra Cognita Consulting, LLC in cooperation with Neighborhood Nexus.
23
Technical Notes, ACS Profile
This report features demographic profiles based on the Census Bureaus 2013-2017 American Commu-nity Survey 5-year estimates. These profiles follow precisely the order, format, and content of the ACS-based ”fact sheets” available via the Census Bureaus American Fact Finder online system.
What is the American Community Survey, and What is a 5-Year Es timate?
The American Community Survey is a nationwide survey conducted by the U.S. Census Bureau ona continuous, rolling basis. It is intended to replace the ”long form” that has been a component of thedecennial census for the last several decades.
From 1940 until 2000, the Census Bureau actually conducted a census (counting of the entire popu-lation) and a survey (measuring a sample of the population) simultaneously: most households received a”short form” with basic questions (e.g. age, sex, race), while a ”long form” with everything contained on the”short form” plus many other topics (e.g. educational attainment, occupation, income) was administered toa sample of households (varied by year and other factors, but roughly 1 in 7 households). As the nameimplies, the decennial census took place only once every ten years, providing a single ”snapshot” of thecountry. But policymakers wanted to have more timely data, so the Census Bureau moved to the new”continuous measurement” model of the ACS, which had its nationwide launch in 2005.
Though the ACS is a replacement for the long form component of the census, it is not a direct substitute.The two differ in many important ways, but we will focus on a few key points.
First, as mentioned above, the ”continuous measurement” model means that the ACS is not a snapshotfor any particular point in time. So while the decennial census measured where people lived on Census Day(historically April 1st of years ending in 0), the ACS looks at where people live on the day they are surveyed.For example, ACS income measures look at the 12-month period preceding the survey date, while thedecennial looked at the previous calendar year. Second, the ACS sample is much smaller than that of thedecennial census: roughly 2.5% each year. Even pooling the data over a 5-year period yields a combinedsample of only about 12.5%, considerably smaller than the roughly 16.7% sampled in the decennial census;the implications of this smaller sample on the margin of error for estimates is discussed below. Third, thepooling across years required to yield a decent-sized sample for smaller areas creates complications forinterpretation. Whereas the decennial census allowed one to say, ”on April 1, 2000, X% of the populationin region Y was unemployed,” we must now say ”over the course of the period 2005-2009, on average X%of the population in region Y was unemployed.” When faced with a period of rapid change such the onsetof the ”Great Recession,” having a pooled estimate over a 5-year period is much less helpful than having afirm snapshot at a single point in time. So while the ACS has been of great help to policymakers interestedin the effects of the Great Recession on large geographies such as states, counties, and major cities (areasfor which 1-year or 3-year estimates are available), it has created new challenges for people interested insmall cities and neighborhoods within larger cities.
To learn more about the ACS, how to use it, and how it differs from the decennial census, please referto the Census Bureau’s publication A Compass for Understanding and Using American Community SurveyData: What General Data Users Need to Know.
What is a Margin of Error, and Why is its Calculation so Import ant?
It is not feasible to administer the long form or the ACS to the entire population. Fortunately, this is notnecessary: just like a single spoonful can tell you if a pot of soup has enough salt, a reasonable estimateof a population may be derived from a quality sample. The quality of a sample depends on two factors: itsrepresentativeness and its size. In some sense, the representativeness is the more important of the two: abiased sample, however large, can never yield a good estimate. After adding salt to your soup but beforetasting, you stir the soup. Otherwise you’ll get a spoonful of extra-salty soup not representative of the potas a whole. Randomly sampling the population has the same effect as stirring the soup: you get a samplethat is representative of the population from which it was drawn. But the spoonful of soup doesn’t haveexactly the same proportion of salt as the rest of the pot: it contains the ”true” amount, plus or minus someamount due to chance. We call that chance variation from the true amount ”sampling error.” The larger thesample, the smaller that error is likely to be, though the marginal reduction in sampling error of increasingthe sample size by a unit declines as the number of units goes up.
Proper reporting of a sample-based estimate, therefore, requires three pieces of information: a ”pointestimate” (our best estimate of the actual value), plus a margin of error, given a particular confidence level(which allow assessment of the quality of the estimate): we are 90% confident that the pot of soup has 8,500milligrams of salt, plus or minus 500 milligrams. Holding a sample size constant, increasing the confidencelevel forces us to increase the margin of error (we would have to increase the size of the range to be 99%confident that our range contains the true value).
When applying this concept to the ACS, we should first note that the Census Bureau typically reportsa 90% confidence interval: we are 90% certain that the true number lies within the reported range. Whenlooking at counties or large cities, the samples are large and the confidence intervals small. But for smallercities and geographies such as census tracts, even the five-year pooled sample is quite small– yieldinga rather large confidence interval. When the confidence intervals for two areas overlap, we cannot tellwhether the difference we observed is real or an artifact caused by sampling error (or, to use the technicalterm, the differences are not ”statistically significant”).
Although you can simply add the raw population of two census tracts together, estimating the marginof error for the resultant area is somewhat more complicated. To estimate the margin of error for numbersand proportions, we follow the method recommended in Appendix 3 of the Census Bureau’s publicationA Compass for Understanding and Using American Community Survey Data: What General Data UsersNeed to Know. To estimate the margin of error for medians, we follow the method recommended on pages16-17 of 2005-2009 ACS 5-year PUMS Accuracy of the Data.
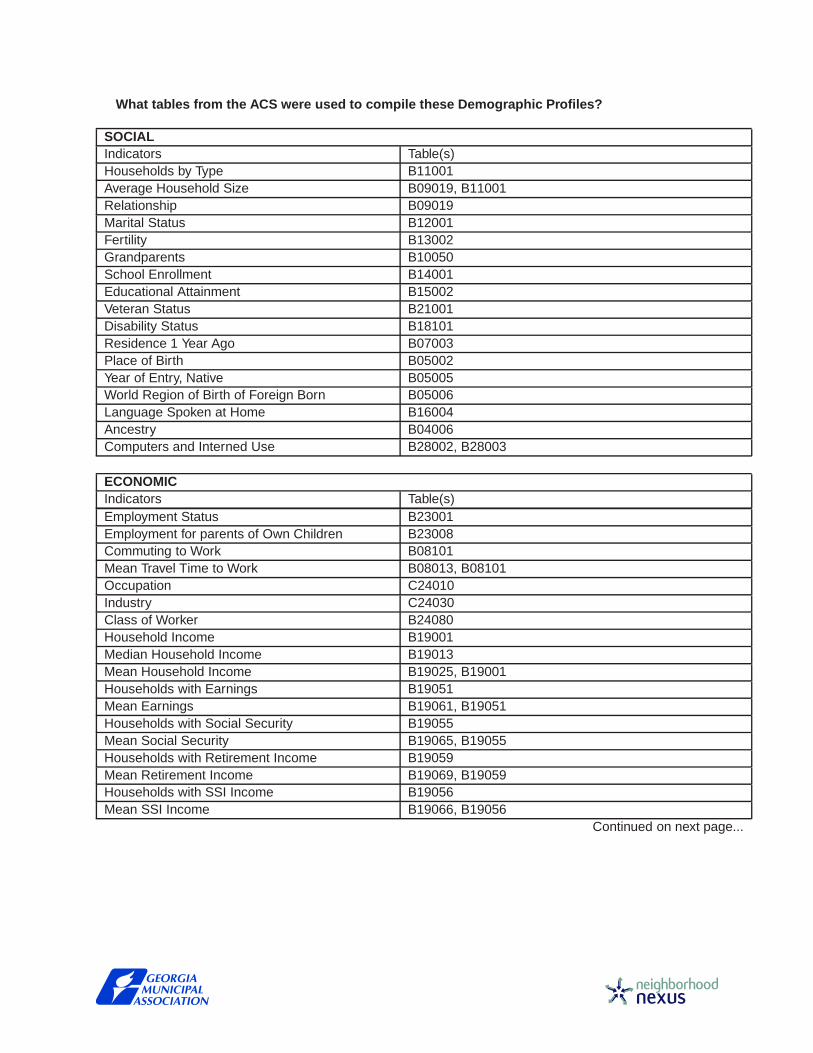
What tables from the ACS were used to compile these Demograph ic Profiles?
SOCIALIndicators Table(s)Households by Type B11001Average Household Size B09019, B11001Relationship B09019Marital Status B12001Fertility B13002Grandparents B10050School Enrollment B14001Educational Attainment B15002Veteran Status B21001Disability Status B18101Residence 1 Year Ago B07003Place of Birth B05002Year of Entry, Native B05005World Region of Birth of Foreign Born B05006Language Spoken at Home B16004Ancestry B04006Computers and Interned Use B28002, B28003
ECONOMICIndicators Table(s)Employment Status B23001Employment for parents of Own Children B23008Commuting to Work B08101Mean Travel Time to Work B08013, B08101Occupation C24010Industry C24030Class of Worker B24080Household Income B19001Median Household Income B19013Mean Household Income B19025, B19001Households with Earnings B19051Mean Earnings B19061, B19051Households with Social Security B19055Mean Social Security B19065, B19055Households with Retirement Income B19059Mean Retirement Income B19069, B19059Households with SSI Income B19056Mean SSI Income B19066, B19056
Continued on next page...
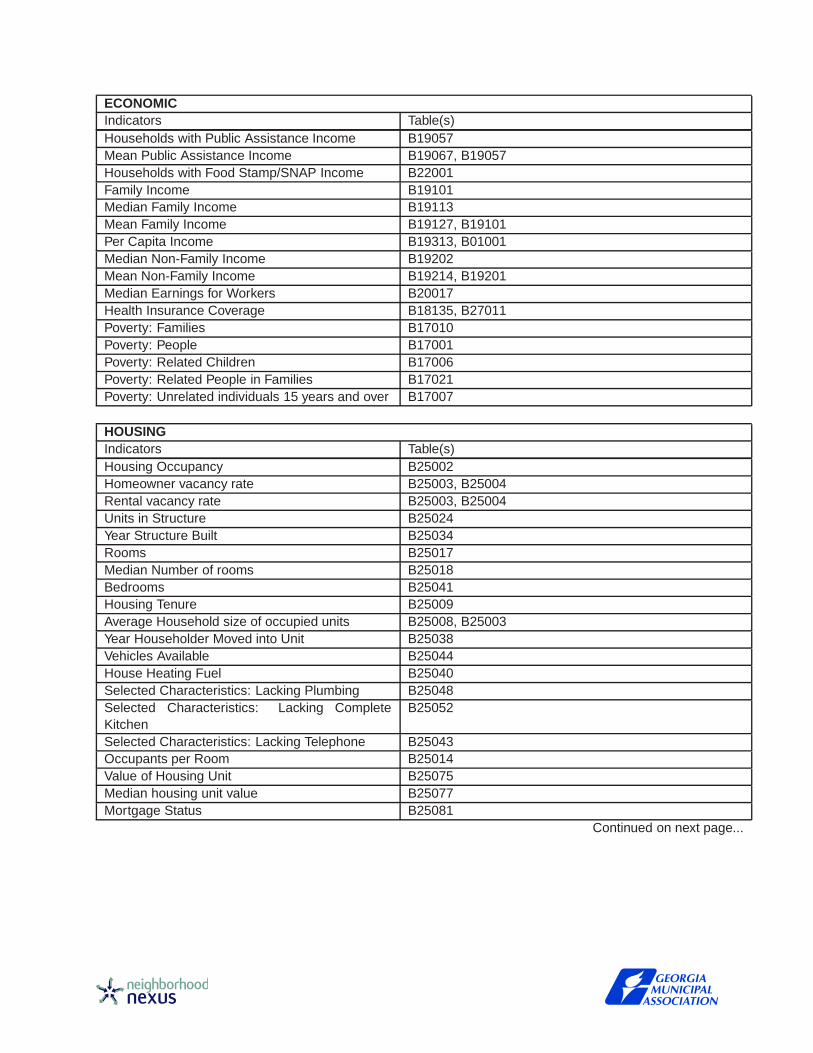
ECONOMICIndicators Table(s)Households with Public Assistance Income B19057Mean Public Assistance Income B19067, B19057Households with Food Stamp/SNAP Income B22001Family Income B19101Median Family Income B19113Mean Family Income B19127, B19101Per Capita Income B19313, B01001Median Non-Family Income B19202Mean Non-Family Income B19214, B19201Median Earnings for Workers B20017Health Insurance Coverage B18135, B27011Poverty: Families B17010Poverty: People B17001Poverty: Related Children B17006Poverty: Related People in Families B17021Poverty: Unrelated individuals 15 years and over B17007
HOUSINGIndicators Table(s)Housing Occupancy B25002Homeowner vacancy rate B25003, B25004Rental vacancy rate B25003, B25004Units in Structure B25024Year Structure Built B25034Rooms B25017Median Number of rooms B25018Bedrooms B25041Housing Tenure B25009Average Household size of occupied units B25008, B25003Year Householder Moved into Unit B25038Vehicles Available B25044House Heating Fuel B25040Selected Characteristics: Lacking Plumbing B25048Selected Characteristics: Lacking CompleteKitchen
B25052
Selected Characteristics: Lacking Telephone B25043Occupants per Room B25014Value of Housing Unit B25075Median housing unit value B25077Mortgage Status B25081
Continued on next page...

HOUSINGIndicators Table(s)Selected Monthly Owner Costs B25087Median Selected Monthly Owner Costs B25088Selected Monthly Owner Costs as a Percentageof Household Income
B25091
Gross Rent B25063Median Gross Rent B25064Gross Rent as a Percentage of Household In-come
B25070
DEMOGRAPHICIndicators Table(s)Sex and Age B01001Median Age B01002Race C02003Tribal Groupings B02005Asian Groupings B02006Hawaiian and Pacific Islander Groupings B02007Race Alone or In Combination with One or MoreOther Races
B02008, B02009, B02010, B02011, B02012, B02013
Hispanic or Latino and Race B03001, B03002