Demographic Profile of the Native American Population of
24
Demographic Profile of the Native American Population of Multnomah County, Oregon by Barry Edmonston and Sharon M. Lee A Report Commissioned by the Native American Rehabilitation Association of the Northwest, Inc. Center for Population Research and Census Portland State University Portland, OR 97207-0751 June 16, 1999
Transcript of Demographic Profile of the Native American Population of

Demographic Profile of the Native American Population of Multnomah County, Oregon
by
Barry Edmonston and Sharon M. Lee
A Report Commissioned by the Native American Rehabilitation Association of the Northwest, Inc.
Center for Population Research and Census Portland State University Portland, OR 97207-0751
June 16, 1999

ABOUT THE AUTHORS
Barry Edmonston is Director, Center for Population Research and Census, and Professor, School of Urban Studies and Planning, Portland State University. He completed his B.A. in sociology at the University of Oregon and his Ph.D. in population studies at the University of Michigan. He was on the faculty at Stanford University and Cornell University and the research staff at the Urban Institute and the National Academy of Sciences prior to joining Portland State University in 1997. His major areas of research are immigration studies, population distribution and migration, and census issues. His recent publication include Race and Ethnicity: The Adaptation of America’s Newest Immigrants (with Jeffrey S. Passel, The Urban Institute Press, 1994), Modernizing the U.S. Census (with Charles Schultze, The National Academy Press, 1995), The New Americans: The Demographic, Economic, and Fiscal Effects of Immigration (with James P. Smith, The National Academy Press, 1997), and The Immigration Debate (with James P. Smith, The National Academy Press, 1998).
Sharon M. Lee is Associate Professor, Department of Sociology, Portland State University. She has a B.A. in sociology and psychology from the University of Rochester, and completed her Ph.D. in sociology from Princeton University. Prior to joining Portland State University in 1998, she was on the faculty at the National University of Singapore, Cornell University, and the University of Richmond. Her research focuses on race and ethnicity, Asian Americans, immigration, and social inequalities. Recent publications include "Racial Classifications in the U.S. Census: 1890 to 1990," Ethnic and Racial Studies (1993); "Poverty and the U.S. Asian Population," Social Science Quarterly (1994); Asian Americans: Diverse and Growing (Population Reference Bureau, Washington, D.C., 1998); and "Trends in Asian American Racial/Ethnic Intermarriage: A Comparison of 1980 and 1990 Census Data," Sociological Perspectives (with M. Fernandez, 1998).

EXECUTIVE SUMMARY
This study provides a demographic profile for the Native American population in Multnomah County. The study was requested by the Native American Rehabilitation Association of the Northwest, located in Portland, Oregon, in order to have an up-to-date analysis of population trends for the local Native American population. The Native American population, as defined by federal government guidelines on racial and ethnic classification, includes American Indians, Alaska Natives, and Aleuts. The Native American population in Multnomah County, as well as in the state of Oregon, is predominantly American Indian.
For purposes of this study, we relied on 1990 census data, population estimates prepared by the
U.S. Bureau of the Census and Portland State University's Center for Population Research and Census, and data from a new large household survey -- called the American Community Survey (ACS) -- that the U.S. Census Bureau began testing in Multnomah County and seven other sites in 1996. We used ACS data from 1996 and 1997 for this report to examine the demographic, social, and economic characteristics of Multnomah County's Native American population.
The report covers three main topics of interest. First, we developed an estimate of the current
1999 Native American population for Multnomah County, the other four counties of the Portland metropolitan area, and for Oregon. For Multnomah County, we made an estimate for the number of Multnomah County's Native American population in the age groups 0 to 6 years, 7 to 11 years, and 12 to 18 years. We also projected the Native American population six years into the future, to 2005, in order to provide an estimate of the total Native American population and for the three youngest age groups.
Second, we relied on ACS information to construct a census tract map for the Native American
population in Multnomah County in 1996. We also constructed comparable maps for Asians, blacks, and Hispanics in order to provide similar information for other minority groups.
Third, we used ACS data in order to provide a profile of the Native American population in 1996
and 1997. The study reports on employment, marital status, educational attainment and school enrollment, and poverty.
The highlights contained in this report include:
• The Native American population has been increasing in recent years due to natural increase (more births than deaths) and from the increased likelihood of residents to identify themselves as Native Americans. For every person who reported himself or herself as Native American in the 1990 census on the race question, there were four others who did not report themselves as Native Americans (most reported themselves as white) but who reported that they had Native American ancestry. There is, therefore, a large potential for additional "growth" in the Native American population, if more people choose to identify themselves as Native American in the 2000 census.
• Multnomah County's Native Americans are a young and growing population. This population
increased from 7,290 in 1990 to 8,700 in mid-1999, an increase of over 1,400 persons, or a gain of 19 percent. Over one-fourth of the County's Native Americans are 18 years of age or younger, a comparative young population relative to the overall population. We expect that the Native American population will increase to 9,790 in 2005, including 2,800 persons 18 years of age and younger.
• About one-half of Native Americans in the Portland metropolitan area lived in Multnomah
County. Native Americans lived throughout the County, but have increased their numbers especially in several areas, including Kerns and the Brentwood-Darlington neighborhoods.
• Although Native American youth were less likely to be enrolled in school (either public or
private) than the overall population in Multnomah County, there was an important exception: 55 percent of Native American females in the 19 to 24 age group reported that they were in school (this is
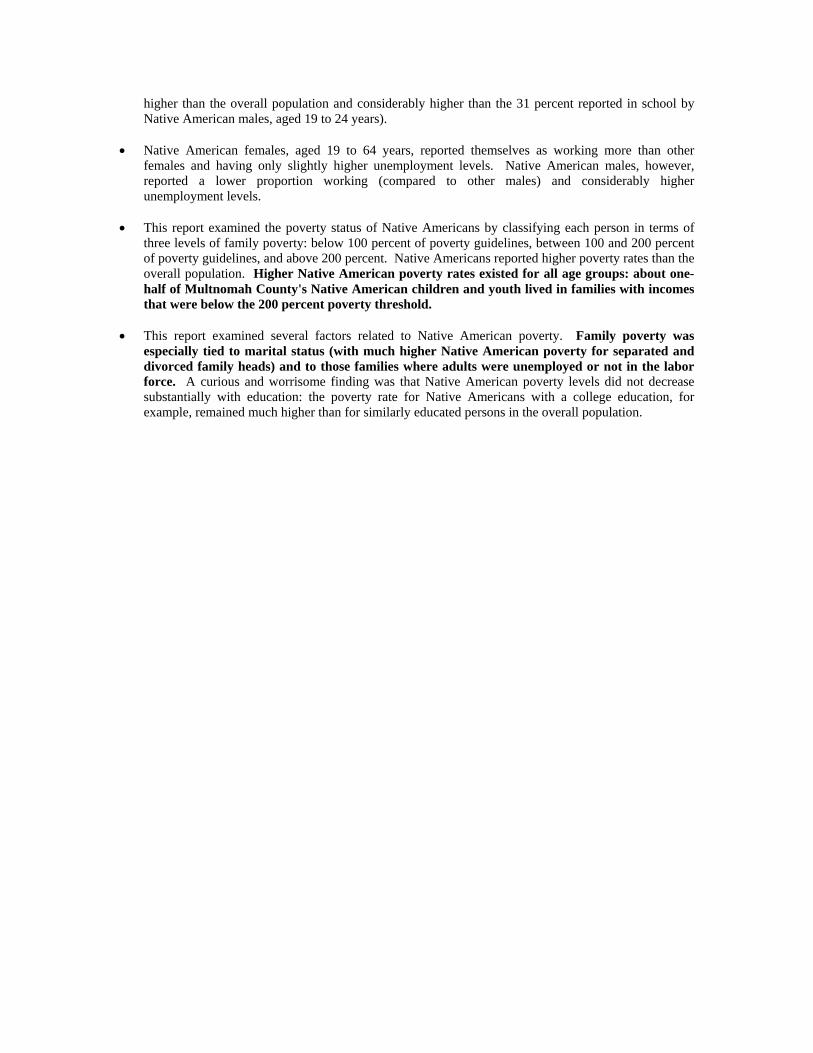
higher than the overall population and considerably higher than the 31 percent reported in school by Native American males, aged 19 to 24 years).
• Native American females, aged 19 to 64 years, reported themselves as working more than other
females and having only slightly higher unemployment levels. Native American males, however, reported a lower proportion working (compared to other males) and considerably higher unemployment levels.
• This report examined the poverty status of Native Americans by classifying each person in terms of
three levels of family poverty: below 100 percent of poverty guidelines, between 100 and 200 percent of poverty guidelines, and above 200 percent. Native Americans reported higher poverty rates than the overall population. Higher Native American poverty rates existed for all age groups: about one-half of Multnomah County's Native American children and youth lived in families with incomes that were below the 200 percent poverty threshold.
• This report examined several factors related to Native American poverty. Family poverty was
especially tied to marital status (with much higher Native American poverty for separated and divorced family heads) and to those families where adults were unemployed or not in the labor force. A curious and worrisome finding was that Native American poverty levels did not decrease substantially with education: the poverty rate for Native Americans with a college education, for example, remained much higher than for similarly educated persons in the overall population.
1
INTRODUCTION The Native American Rehabilitation Association of the Northwest requested a study that offered a demographic profile of the Native American population living in Multnomah County. In particular, they asked for a study that analyzed population trends for the Native American population from 1990 to the present, focusing especially on pre-school age children, school-age children, and adolescents. They also asked for estimates of future growth of the Native American population. In the last two decades, the Native American (American Indian, Alaskan Native, and Aleuts) population grew rapidly. The 1970 census counted 827,000; this number increased to 1.4 million in 1980, and over 2 million in 1990. According to the most recent census in 1990, there were 2,065,014 American Indians, Alaskan Natives, and Aleuts in the United States. The Census Bureau projects that the Native American population may reach 4.3 million by 2050, representing just over 1 percent of the nation's population. The large percent increases in the Native American population over the last twenty years cannot be attributed to natural increase alone. Other factors that have contributed to the rapid growth of the Native American population include: improvements to how the race question on the census form is worded, leading to better quality data on race; improvements in how residents of reservations and Alaska Native villages were counted; improved outreach programs and promotion campaigns to inform minority populations about the census; and a greater tendency for people, particularly those with partial American Indian ancestry, to self-identify as American Indian in the 1990 census. Oregon's Native American population is not as large as some other states. In 1990, there were 42,655 Native Americans in Oregon, compared with over 252,000 in Oklahoma (the state with the largest Native American population). Other states with large Native American populations are California (with over 242,000), Arizona (204,000), New Mexico (134,000), and Alaska (86,000). Native Americans comprised 1.5 percent of Oregon's population in 1990. The majority of Native Americans, 96 percent nationally and 95 percent in Oregon, are American Indians. About 17 percent of Oregon's Native American population lived in Multnomah County in 1990.
This report documents the demographic characteristics of the Native American population of Multnomah County, Oregon. The report highlights the demographic profiles of three age groups: 0-6, 7-12, and 12-18, as requested by the Native American Rehabilitation Association of the Northwest. However, where appropriate, the report presents data on other age groups and the total population to serve as comparisons with Native American children and youth. Since about 95 percent of Native Americans are American Indians, the demographic data reported here will necessarily reflect the demographic profile of the American Indian population. In addition, because of the dominance of American Indians in the Native American population, most of the available data tend to refer to American Indians only. We include American Indians and Alaska Natives in the report and assume the demographic characteristics of Alaska Natives in Multnomah County would not significantly differ from that of American Indians. The small number of Alaska Natives in the Multnomah County Native American population will also not change the overall demographic profiles presented.
DATA SOURCES
The most recent national data on Native Americans are based on the 1990 census. Fortunately for the purposes of this report on Native Americans in Multnomah County, we can use data from the 1996 and 1997 American Community Surveys (ACS) to provide more recent data. The American Community Survey is a large monthly household survey conducted by the Census Bureau. The survey is conducted using mail questionnaires, telephone interviews, and personal visits from the Census Bureau's field representatives. Portland/Multnomah County is one of eight sites where the American Community Survey is conducted. The survey collects information on housing characteristics as well as for each person living in the household surveyed. Data on the individual's race, age, sex, education, income, and poverty status are among the information collected in the survey. Data from two years, 1996 and 1997, are merged to
2
increase the sample of Native Americans for analysis. All demographic information reported here on the Native American population of Multnomah County are based on the merged 1996/1997 American Community Survey data files for Portland/Multnomah County.
HOW MANY NATIVE AMERICANS LIVE IN MULTNOMAH COUNTY?
The 1990 census enumerated all persons in the United States as of April 1st. Some undercount
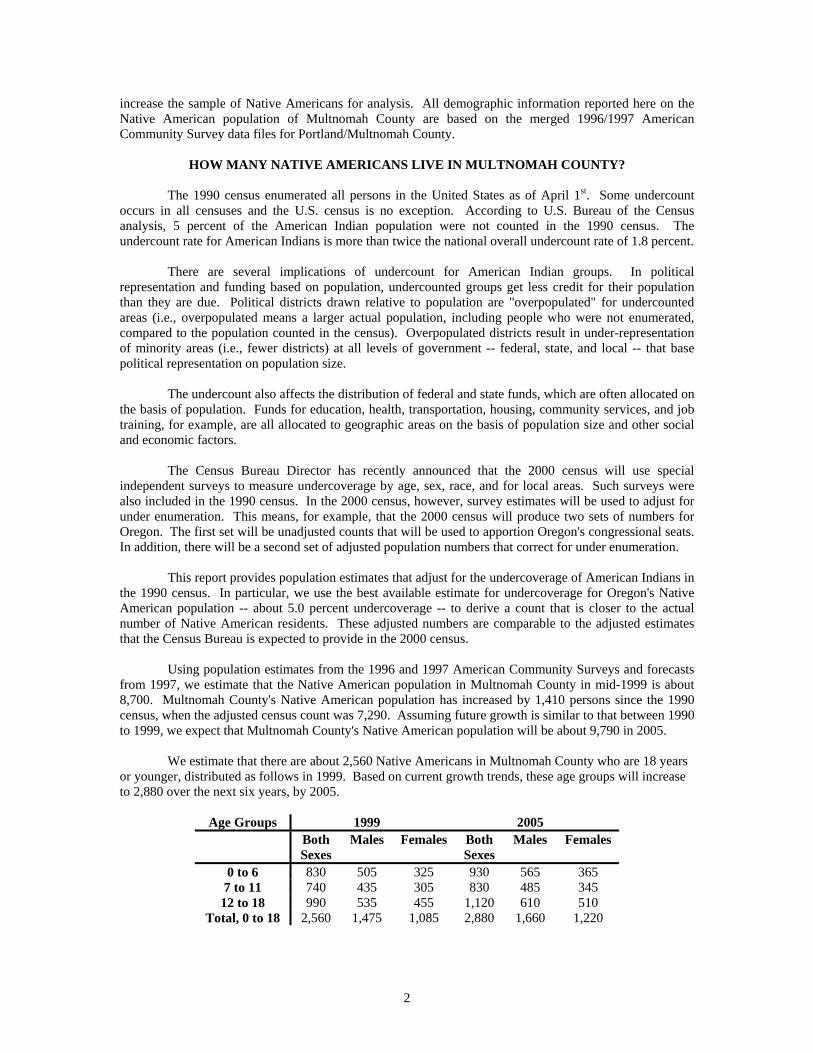
occurs in all censuses and the U.S. census is no exception. According to U.S. Bureau of the Census analysis, 5 percent of the American Indian population were not counted in the 1990 census. The undercount rate for American Indians is more than twice the national overall undercount rate of 1.8 percent. There are several implications of undercount for American Indian groups. In political representation and funding based on population, undercounted groups get less credit for their population than they are due. Political districts drawn relative to population are "overpopulated" for undercounted areas (i.e., overpopulated means a larger actual population, including people who were not enumerated, compared to the population counted in the census). Overpopulated districts result in under-representation of minority areas (i.e., fewer districts) at all levels of government -- federal, state, and local -- that base political representation on population size. The undercount also affects the distribution of federal and state funds, which are often allocated on the basis of population. Funds for education, health, transportation, housing, community services, and job training, for example, are all allocated to geographic areas on the basis of population size and other social and economic factors. The Census Bureau Director has recently announced that the 2000 census will use special independent surveys to measure undercoverage by age, sex, race, and for local areas. Such surveys were also included in the 1990 census. In the 2000 census, however, survey estimates will be used to adjust for under enumeration. This means, for example, that the 2000 census will produce two sets of numbers for Oregon. The first set will be unadjusted counts that will be used to apportion Oregon's congressional seats. In addition, there will be a second set of adjusted population numbers that correct for under enumeration. This report provides population estimates that adjust for the undercoverage of American Indians in the 1990 census. In particular, we use the best available estimate for undercoverage for Oregon's Native American population -- about 5.0 percent undercoverage -- to derive a count that is closer to the actual number of Native American residents. These adjusted numbers are comparable to the adjusted estimates that the Census Bureau is expected to provide in the 2000 census. Using population estimates from the 1996 and 1997 American Community Surveys and forecasts from 1997, we estimate that the Native American population in Multnomah County in mid-1999 is about 8,700. Multnomah County's Native American population has increased by 1,410 persons since the 1990 census, when the adjusted census count was 7,290. Assuming future growth is similar to that between 1990 to 1999, we expect that Multnomah County's Native American population will be about 9,790 in 2005. We estimate that there are about 2,560 Native Americans in Multnomah County who are 18 years or younger, distributed as follows in 1999. Based on current growth trends, these age groups will increase to 2,880 over the next six years, by 2005.
Age Groups 1999 2005
Both Sexes
Males Females Both Sexes
Males Females
0 to 6 830 505 325 930 565 365 7 to 11 740 435 305 830 485 345 12 to 18 990 535 455 1,120 610 510
Total, 0 to 18 2,560 1,475 1,085 2,880 1,660 1,220

3
WHERE DO NATIVE AMERICANS LIVE? For the United States overall, one-third of Native Americans live on reservations and trust lands, which are usually very small communities. Of the 279 recognized reservations for American Indians (Alaskan Natives and Aleuts have a different arrangement with the federal government for their home lands), only 18 had populations of 5,000 or more in 1990. The largest in area, the Navajo reservation, is also the most populous with 143,000 residents in 1990. It is nearly 13 times larger than the next largest reservation, Pine Ridge Sioux in South Dakota, which had a 1990 population of 11,000. Reservations have grown substantially in the past two decades, more than doubling in population size. Yet, in relative terms, they represent a gradually declining share of the total Native American population. Most Native Americans do not live on reservations or trust lands. Although Native Americans include large rural populations, about 50 percent are located in urban areas.
We estimate that in mid-1999, there are about 16,940 Native Americans living in the Portland total
metropolitan area, including Clark County, Washington. Of these, 13,210 Native Americans live in the Oregon portion of the Portland metropolitan area. This represents about one-third of Oregon's total Native American population. Adjusted counts from the 1990 census reveal that Oregon's Native American population was 42,655; the population has increased to 48,058 in 1999, an increase of about 5,400 persons. The Native American population in the Portland metropolitan area grew from 13,393 in 1990, to 15,230 in 1997, and to 16,940 in 1999. Over fifty percent of the Native American metropolitan residents in 1999 live in Multnomah County, as shown in Figure 1.
Figure 1. American Indian Population in the Portland Metropolitan Area, by County of Residence, 1990, 1997, and 1999.
The Native American population, however, is apparently increasing more slowly in Multnomah County than in some of the outlying metropolitan counties. Population growth, for example, appears to be more rapid in Yamhill County (increasing by 2.8 percent per year in the 1990s) and in Clark County, Washington (increasing by 4.4 percent per year).
1990 1997 1999
Clark, WA 2,504 3,412 3,727 Clackamas 2,125 2,517 2,642 Columbia 542 637 667
Multnomah 7,289 8,364 8,699 Yamhill 933 1,135 1,200
Metropolitan Portland
13,393 16,065 16,935
1990 1997 19990
5,000
10,000
15,000
20,000
Year
Population
Clark, WAYamhillColumbiaClackamasMultnomah

4
In Multnomah County, the Native American population lives throughout the area, although there
are selected census tracts with a larger number of Native American residents, as shown in the first map in the Map section at the end of the report. Compared to places of residence in 1990, population increases for the Native American population have occurred in the Corbett-Terwilliger and Kenton areas. Decreases have taken place between 1990 and from 1996-1997 in Kerns and in the Brentwood-Darlington neighborhoods.
DEMOGRAPHIC PROFILE OF NATIVE AMERICANS We begin the demographic profile of the Native American population in Multnomah County by describing the age and sex composition of the population. This is followed by a section that describes the marital status of the Native American population. In all cases, we compare the Native American population with the total population.
Age and Sex Composition
As shown in Figure 2, the Native American population is younger than the overall population. In particular, there is a greater proportion of Native Americans in the 0-6, 7-11, 12-18, 19-24, and 25-44 age groups. For example, 38 percent of the Native American population are 24 or younger, compared to 30 percent for the overall population. There are, however, relatively fewer Native Americans in the 45 to 64 age group. And, most noticeably, only 5 percent of Multnomah County’s Native Americans are aged 65 years and older, while almost 15 percent (or three times as many) of the overall population are 65 and older.
Figure 2. Age Distribution of Native Americans and the Total Population, Multnomah County, 1996 and 1997
The age distribution for Native American males and females are comparable in Multnomah County. Census data from 1990 indicate that except for the population 65 years and older, there are roughly about the same proportion of males and females in most age groups. Data from the 1996 and 1997 American Community Survey, however, indicate that some differences may have emerged in recent years. In particular, the ACS data suggest that there may be a larger proportion of females in the 45 to 64 age group. Whether this reflects relatively higher in-migration of Native American women or relatively higher out-migration of Native American men remains to be explored with larger samples. Confirmation of these results using data from the 2000 census, along with future analysis, are needed.
0-6 7-11 12-18 19-24 25-44 45-64 65+0
10
20
30
40
Age Groups
Percent
NativeAmericansTotalPopulation

5
Marital Status Data on marital status are presented for those 18 and older. Marital status is an important sociodemographic characteristic because it has been shown to vary by race and ethnic group, age, and gender. Marital status also affects fertility behavior and number of children that may be present in a household. In addition, marital status is highly related to other important social characteristics, including employment and poverty status. Figure 3 compares the marital status of Native Americans and the total population. Reflecting the generally younger age structure of the Native American population, more Native Americans are single and have never been married (over 33 percent, compared with 27 percent of the total population). Fewer Native Americans are married, about 39 percent, compared with 48 percent of the total population. Finally, slightly more Native Americans are either divorced or separated from their spouses.
Figure 3. Marital Status of Native Americans and the Total Population, 18 Years of Age and Older, Multnomah County, 1996 and 1997
Marital status varies somewhat between Native American males and females, as shown in Figure 4. More men report that they have never been married and slightly more men are also divorced. Slightly more Native American women are separated and widowed. The percentage that are married are roughly equal for men and women, about 38 or 39 percent.
Figure 4. Marital Status of Native Americans, Males and Females, 18 Years of Age and Older, Multnomah County, 1996 and 1997
Married Separated Widowed Divorced Never Married0
10
20
30
40
50
Marital Status
Percent
NativeAmericansTotalPopulation
Married Separated Widowed Divorced Never Married0
10
20
30
40
50
Marital Status
Percent
Males Females
6
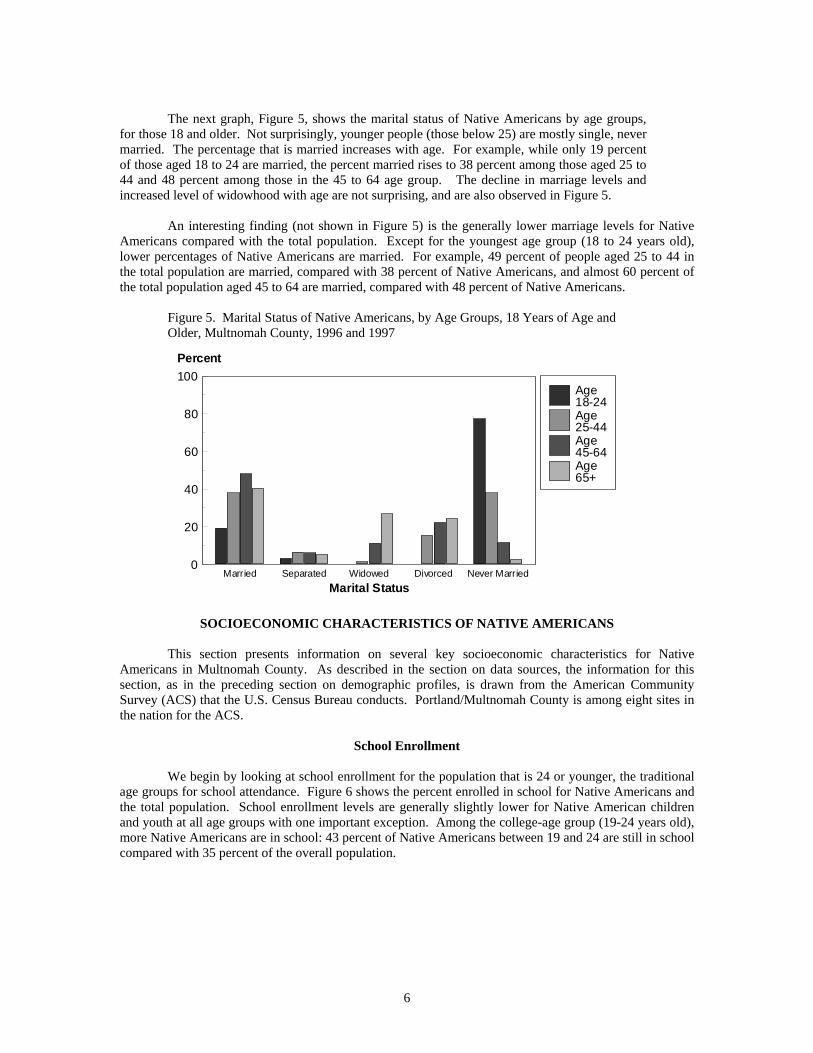
The next graph, Figure 5, shows the marital status of Native Americans by age groups,
for those 18 and older. Not surprisingly, younger people (those below 25) are mostly single, never married. The percentage that is married increases with age. For example, while only 19 percent of those aged 18 to 24 are married, the percent married rises to 38 percent among those aged 25 to 44 and 48 percent among those in the 45 to 64 age group. The decline in marriage levels and increased level of widowhood with age are not surprising, and are also observed in Figure 5.
An interesting finding (not shown in Figure 5) is the generally lower marriage levels for Native
Americans compared with the total population. Except for the youngest age group (18 to 24 years old), lower percentages of Native Americans are married. For example, 49 percent of people aged 25 to 44 in the total population are married, compared with 38 percent of Native Americans, and almost 60 percent of the total population aged 45 to 64 are married, compared with 48 percent of Native Americans.
Figure 5. Marital Status of Native Americans, by Age Groups, 18 Years of Age and Older, Multnomah County, 1996 and 1997
SOCIOECONOMIC CHARACTERISTICS OF NATIVE AMERICANS This section presents information on several key socioeconomic characteristics for Native Americans in Multnomah County. As described in the section on data sources, the information for this section, as in the preceding section on demographic profiles, is drawn from the American Community Survey (ACS) that the U.S. Census Bureau conducts. Portland/Multnomah County is among eight sites in the nation for the ACS.
School Enrollment
We begin by looking at school enrollment for the population that is 24 or younger, the traditional age groups for school attendance. Figure 6 shows the percent enrolled in school for Native Americans and the total population. School enrollment levels are generally slightly lower for Native American children and youth at all age groups with one important exception. Among the college-age group (19-24 years old), more Native Americans are in school: 43 percent of Native Americans between 19 and 24 are still in school compared with 35 percent of the overall population.
Married Separated Widowed Divorced Never Married0
20
40
60
80
100
Marital Status
Percent
Age18-24Age25-44Age45-64Age65+

7
Figure 6. Percent Enrolled in School, Native Americans and Total Population, by Age Groups, Multnomah County, 1996 and 1997
The next figure, Figure 7, shows school enrollment by sex and age groups for Native Americans. A pattern of higher female school enrollment is observed for all groups (there was no gender difference for one age group, those 7 to 11 years old). The gender gap is particularly remarkable at the college age years. Among those 19 to 24 years old, well over half (55 percent) of Native American females were still in school, compared with just 31 percent of males.
Figure 7. Percent Enrolled in School, Native Americans, by Sex and Age Groups, Multnomah County, 1996 and 1997
Educational Attainment We shift now to educational attainment, or schooling completed, for the older age groups, and look at those 18 and older only. Figure 8 compares the educational attainment of Native Americans with that of the total population. The percentage of Native Americans at each level of completed schooling is generally not different from the total population with two important differences. Slightly more Native Americans report having had some post-high school education (39 percent), compared with 34 percent of the total population. The second important difference is at the highest category of schooling: about 27 percent of the total population are college graduates but only 17 percent of Native Americans are college graduates.
0-6 7-11 12-18 19-240
20
40
60
80
100
Age Groups
Percent
NativeAmericansTotalPopulation
0-6 7-11 12-18 19-240
20
40
60
80
100
Age Groups
Percent
MalesFemales

8
Figure 8. Educational Attainment of Native Americans and the Total Population, 18 Years of Age and Older, Multnomah County, 1996 and 1997
Employment
We continue the socioeconomic profile of Native Americans by examining employment status for adults between the ages of 18 and 64 years. We examine three types of employment status: working, unemployed, and not in the labor force. Working includes adults who are working fulltime or part-time in the civilian labor force and in the military. Unemployed persons are not working but have been looking for a job within the past four weeks. Persons who are not in the labor force include those who have not been working or have not been seeking work within the past four weeks. Persons not in the labor force may, it should be noted, include persons who might be interested in work but may have become discouraged over time and no longer actively seek employment.
Overall, as shown in Figure 9, the Native American adult population is slightly less likely to be
working (71 percent) than the overall population (78 percent) in Multnomah County. A lower rate of working is primarily the result of higher unemployment rates (10 percent for Native Americans compared to 4 percent for the overall population) rather than the proportion that is not in the labor force (which is similar for Native Americans and for the total population).
Figure 9. Employment Status of Native Americans and the Total Population, Ages 18 to 64 Years, Multnomah County, 1996 and 1997
Less than H.S.Some H.S.
High SchoolSome College
College & More0
10
20
30
40
50
Education Attainment
Percent
NativeAmericansTotalPopulation
Working Unemployed Not in Lab. Force0
20
40
60
80
100
Employment Status
Percent
NativeAmericansTotalPopulation

9
Does employment status for adult Native Americans differ for males and females? Yes, the overall differences seem to reflect primarily differences between Native American males and males in the overall population. Figure 10 presents the comparison for males and Figure 11 displays the comparison for females. There are substantial differences for males: the unemployment rate for Native Americans is 15 percent compared to 4 percent for the overall population; the result is fewer Native American males working. Among females, Native Americans have a slightly higher proportion working even though they have a slightly higher unemployment rate (5 percent compared to 4 percent for overall adult females).
Figure 10. Employment Status of Native Americans and the Total Population, Males, Ages 18 to 64 Years, Multnomah County, 1996 and 1997
Figure 11. Employment Status of Native Americans and the Total Population, Females, Ages 18 to 64 Years, Multnomah County, 1996 and 1997
Poverty
Poverty is an important aspect for the socioeconomic condition of American Indians in Multnomah County. Using ACS data, we classify each person into one of three poverty statuses: (1) those persons whose family income is below 100 percent of the poverty guideline, (2) those persons whose family income is between 100 and 200 percent of the poverty guidelines, and (3) those persons whose family income is at 200 percent or above of the poverty guideline.
Working Unemployed Not in Lab. Force0
20
40
60
80
100
Employment Status
Percent
NativeAmericansTotalPopulation
Working Unemployed Not in Lab. Force0
20
40
60
80
Employment Status
Percent
NativeAmericansTotalPopulation

10
In the discussion of poverty, we include all persons in the American Community Survey regardless of age. For children, their poverty status reflects the poverty status of their family: if a family is below the 100 percent poverty guideline, for instance, then all children in the family are also below the 100 percent poverty guideline.
There are noticeable differences in poverty status for Multnomah County residents according to their reported racial identification (see Figure 12). In terms of the percentage of persons who are below the 100 percent poverty guideline, the highest rates are reported for Hispanics (32 percent), followed by blacks (23 percent) and Native Americans (19 percent). Asians have a reported poverty rate of 15, and whites have the lowest reported poverty rate (12) percent in the County.
There are also substantial variations in the proportion of persons who have intermediate poverty
levels, that is, those between 100 to 200 percent of poverty guidelines. For this poverty range, Hispanics have the highest percentage (33 percent), followed by Native Americans (29 percent), Asians (27 percent), and blacks (26 percent).
Combining the two poverty statuses, 0 to 100 and 100 to 200 percent, one notices an especially
high proportion of Hispanics in poverty (64 percent are below 200 percent). Native Americans and blacks have similar poverty levels with almost 50 percent below 200 percent of the poverty guidelines. The white population, by contrast, has 30 percent below the 200 percent level.
Figure 12. Poverty Status of Native Americans and Other Race Groups, Multnomah County, 1996 and 1997
Poverty also varies by age groups. Examining the distribution of the three poverty levels described above, Figure13 shows the distribution of persons within selected age groups by poverty.
A high proportion of Native American children are in poverty in Multnomah County. For children
6 years and younger, 25 percent are below the 100 percent poverty status and 35 percent are in families between 100 and 200 percent. Overall, 60 percent are below 200 percent (compared to 49 percent in the overall population).
For Native American children aged 7 to 11 years, 16 percent are below 100 percent and 39 percent
are between 100 and 200 percent. Overall, 55 percent are in families with incomes below 200 percent of the poverty guidelines (compared to 45 percent for the overall population).
Native Americans in the age group 12 to18 years have poverty levels similar to the 7 to 11 year-
olds. Nineteen percent of this age group are in the under 100 percent poverty category and 35 percent in
Native Amer. Asian Black Hispanic White0
20
40
60
80
100
Race Groups
Percent
Poverty200+Poverty100-199Poverty0-99

11
the 100 to 200 percent group. Overall, 54 percent are below 200 percent (compared to 38 percent for the overall population).
Native Americans between 19 and 24 years old have about the same proportion of persons below
100 percent poverty levels as the overall population (23 compared to 24 percent, respectively). Native Americans in this age group, however, have a greater proportion (36 percent) between 100 and 200 percent poverty compared to the overall population (28 percent).
Although poverty rates generally decline with age – as is the case for the overall population in
Multnomah County – this does not occur for the Native American population. The proportion below 100 poverty levels remains high for the 25 to 44 age group (20 percent compared to 12 percent for the overall population), for the 45 to 64 age group (17 percent compared to 9 percent for the overall population), and for the 65 years and older age group (30 percent compared to 10 percent for the overall population). Observed poverty rates for Native Americans aged 25 years and older are two to three times the rates for the overall population. These higher poverty rates have two effects. One is to create a situation in which a high number of Native Americans, regardless of other family factors, are in poverty. The second is to expose their children to poverty because, if the parents are in poverty, then the children also experience poverty conditions as well.
Figure 13. Poverty Status of Native Americans, by Age Groups, Multnomah County, 1996 and 1997
To what extent does poverty for Native Americans reflect other factors? We turn next to an examination of the influence of marital status, educational attainment, and employment status on poverty. First, it is apparent that poverty varies by marital status (see Figure 14). Poverty rates are lower among married couples and higher among separated and divorced persons. But there are some interesting differences between Native Americans and the overall population.
Poverty rates are relatively lower for Native Americans who are married with their spouse present
(6 percent below 100 percent poverty guideline) and are similar to married persons in the overall population (5 percent). Widowed Native Americans (there are relatively few in the American Community Survey so one should be cautious in interpreting this finding) have low poverty rates as well.
On the other hand, the poverty rates for Native Americans who are separated or divorced are about twice the level for the overall population who are in similar marital statuses. What circumstances and experiences characterize Native Americans who are separated (and their children) that leads to 56 percent falling below the 100 percent poverty guideline (compared to 24 percent of separated persons in the overall population)? Why do 37 percent of divorced Native Americans (and their children) find themselves below
0-6 7-11 12-18 19-24 25-44 45-64 65+0
20
40
60
80
100
Age Groups
Percent
Poverty200+Poverty100-199Poverty0-99

12
the 100 percent poverty guideline (compared to 19 percent for divorced persons in the overall population)? Unfortunately, there is no data that will allow us to further examine these patterns and differences.
Figure 14. Poverty Status of Native Americans, by Marital Status, for Ages 18 Years and Older, Multnomah County, 1996 and 1997
Figure 15 compares the poverty status of Native Americans by levels of educational attainment.
Although poverty levels are generally lower for more highly educated persons (as is the case for the overall population in Multnomah County), there are some noteworthy exceptions for the Native American population. Poverty rates are high for Native Americans who lack a high school education, but there is a substantial proportion of Native American adults who have some college or a college education, who are below either the 100 or 200 percent poverty thresholds.
Figure 15. Poverty Status of Native Americans, by Educational Attainment, for Ages 18 to 64 Years, Multnomah County, 1996 and 1997
Compared to the overall population in Multnomah County, poverty rates for Native Americans at different levels of educational attainment are generally similar: 22 percent below 100 percent poverty guidelines for those with 8 years or less of education (compared to 27 percent in the overall population), 24 percent for those with 9 to 11 years of education (compared to 24 percent in the overall population), and 14 percent for those with a high school education (compared to 14 percent in the overall population).
Married Separated Widowed Divorced Never Married0
20
40
60
80
100
Marital Status
Percent
Poverty200+Poverty100-199Poverty0-99
Less than H.S. Some H.S. High School Some College College Plus0
20
40
60
80
100
Educational Attainment
Percent
Poverty200+Poverty100-199Poverty0-99

13
However, the poverty rate for Native Americans with some college is almost twice the level for
the overall population (21 percent below 100 percent poverty levels compared to 11 percent for the overall population). In addition, the poverty rate for Native Americans with a college education is more than four times the level for the overall population (24 percent compared to 6 percent for the overall population). Indeed, the data shown in Figure 15 suggest virtually no reduction in poverty for increased education among Native Americans.
Finally, employment status is usually an important factor related to poverty status. Indeed, it is rare for a family where there are two adults, both working, to be in poverty. Limiting attention to adults in the labor force, that is, those between 18 and 64, we find that poverty rates are generally lowest for those adults who are working and highest for those adults who are not in the labor force (see Figure 16). Comparing Native Americans and the overall population, poverty rates are similar for adults who are either unemployed or not in the labor force. There are striking differences for working adults however: 14 percent of working Native Americans are below the 100 percent poverty guideline compared to 8 percent of those working in the overall population.
Therefore, while the relationship between employment status and poverty status are generally
similar for Native Americans and the total population, we again observe evidence that employment (just as for education) does not consistently protect Native Americans from poverty as well as it does for the overall population.
Figure 16. Poverty Status of Native Americans, by Employment Status, for Ages 18 to 64 Years, Multnomah County, 1996 and 1997
CONCLUSION This study of Native Americans living in Multnomah County, who come from a diverse background of different tribes in Oregon and other states and including a small number of Alaskan Natives, has shown that the Native American population is a young and growing population. While a large number of Native Americans have at least a high school education, are working, are in fairly stable family arrangements, and a relatively high percentage of Native American women are enrolled in college and working, this study also shows several areas of concern.
First, Native American unemployment and poverty rates are often higher than that of the overall population. When we limit attention to children and young adults (persons who are less than 25 years of age), current information indicates that more than one-fifth are below the 100 percent poverty guidelines and than more than one-third are between 100 and 200 percent poverty guidelines. Since 4 out of 10 Native Americans are younger than 25, the findings suggest that poverty and low incomes are major
Working Unemployed Not in Lab.Force0
20
40
60
80
100
Employment Status
Percent
Poverty200+Poverty100-199Poverty0-99

14
socioeconomic concerns for the Native American population. Considerably more than one-half of Multnomah County’s younger Native Americans live in families that are either poor or have very low incomes. Another area that deserves additional analysis is why employment and post-high school educational attainment do not protect Native Americans from poverty as well as they do for the total population. The demographic data analyzed and profiled in this report do not allow further examination of these patterns. However, these are obviously important concerns that require further study. Finally, the report also shows important gender differences in school enrollment among the 12 to 18, and 19 to 24 age groups, together with the higher employment rates among Native American women, compared with men. This is another issue that deserves additional study and analysis.

15
MAPS
This section presents maps displaying the estimated number of persons living within the census tract areas of Multnomah County. Census tracts are relatively homogeneous areas, designated by the U.S. Census Bureau in consultation with local officials, that have about 5,000 residents. Multnomah County’s census tracts include some areas with relatively few people. Multnomah County stretches east along the Columbia River towards Mt. Hood and northwest into mountainous, hilly areas – both areas with few people. The attached maps do not include the far eastern and northwestern portions of the County. The maps present population estimates from the American Community Survey for Native Americans (American Indian, Alaska Native, and Aleuts), Asian and Pacific Islanders, blacks, and persons reporting themselves of “other race” (who are predominantly persons who report themselves as Hispanic).

16

17

18

19

20
MAPS
Table: P006.IVT - P6. Race
GEOGRAPHY: Multnomah CountyRACE: American Indian, Eskimo, and Aleut
ESTIMATE: Direct Estimate