
Demographic Profile Current Population …€™s institutions of higher learning between 1990 and...
12
Demographic Profile 1 2006 City of Duluth Comprehensive Plan The Demographic background profile provides a foundation of information on city-wide demographic characteristics, the regional context of Duluth’s population, and current trends projections. The information is presented to put comprehensive plan decisions within the context of where Duluth is now, how the City arrived at this juncture, and what the City ap- pears to be facing as it moves into the 21 st century. This report updates draft work previously completed by Duluth City staff and the 2001 com- prehensive plan consulting team titled Community-wide Analysis. Additional detail on the 1990 and 2000 Census results may be found in several existing planning documents, including the following: Ø Comprehensive Plan Component – Demographics (Dept. of Planning & Develop- ment, April, 2003) Ø Comprehensive Plan Component – Housing Analysis (Dept. of Planning & Develop- ment, April 2003) Ø Duluth School District Demographic Reports (Dept. of Planning & Development, November 2003, November 2004) Ø Draft Duluth-Superior Long Range Transportation Plan, (Duluth-Superior Metropoli- tan Interstate Commission, June, 2005) Current Population The 2000 Decennial Census found the City of Duluth with a population of 86,918 people, a slight increase from 1990.1 Most significantly, the population increase ended a 30-year slide in population that started with the economic downtowns of the 1970s and 80s. Duluth saw its population peak in 1960, exceeding 106,000 people in the 1960 Census year. The exodus of large employers that started with the closure of the U.S. Steel plant in 1973 had a substantial impact on the number of people living in the region and in Duluth in particular. The effects of the economic downturn were exacerbated by the national trend of smaller families and de- clining household size. The number of people leaving Duluth skyrocketed, the number mov- ing in plummeted, and the households that remained had fewer people in them. 1 2000 and 1990 Census information throughout the report was obtained from the 2000 Census Gateway website, www.census.gov/main Figure D-1: Duluth Population, 1970-2030 Demographic Profile Demographic Profile Current Population
Transcript of Demographic Profile Current Population …€™s institutions of higher learning between 1990 and...
Dem
ogra
phic
Pro
file
12006 City of Duluth Comprehensive Plan
The Demographic background profile provides a foundation of information on city-wide demographic characteristics, the regional context of Duluth’s population, and current trends projections. The information is presented to put comprehensive plan decisions within the context of where Duluth is now, how the City arrived at this juncture, and what the City ap-pears to be facing as it moves into the 21st century.
This report updates draft work previously completed by Duluth City staff and the 2001 com-prehensive plan consulting team titled Community-wide Analysis. Additional detail on the 1990 and 2000 Census results may be found in several existing planning documents, including the following:
Ø Comprehensive Plan Component – Demographics (Dept. of Planning & Develop-ment, April, 2003)
Ø Comprehensive Plan Component – Housing Analysis (Dept. of Planning & Develop-ment, April 2003)
Ø Duluth School District Demographic Reports (Dept. of Planning & Development, November 2003, November 2004)
Ø Draft Duluth-Superior Long Range Transportation Plan, (Duluth-Superior Metropoli-tan Interstate Commission, June, 2005)
Current Population
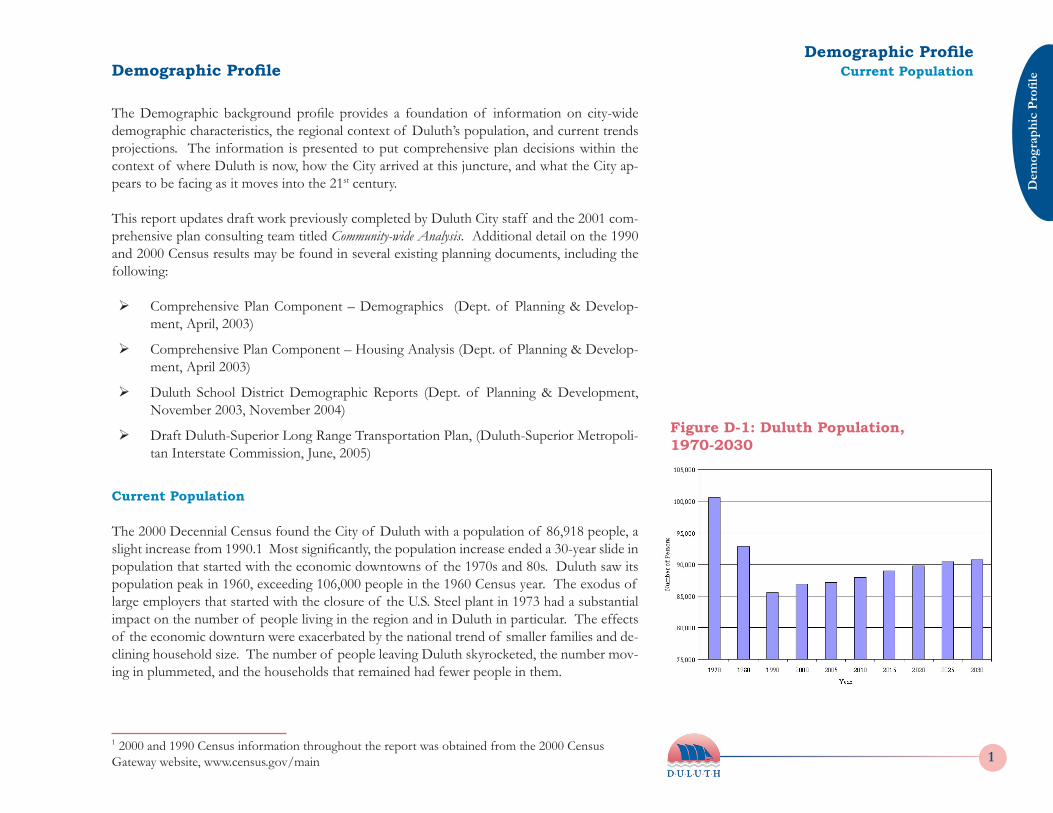
The 2000 Decennial Census found the City of Duluth with a population of 86,918 people, a slight increase from 1990.1 Most significantly, the population increase ended a 30-year slide in population that started with the economic downtowns of the 1970s and 80s. Duluth saw its population peak in 1960, exceeding 106,000 people in the 1960 Census year. The exodus of large employers that started with the closure of the U.S. Steel plant in 1973 had a substantial impact on the number of people living in the region and in Duluth in particular. The effects of the economic downturn were exacerbated by the national trend of smaller families and de-clining household size. The number of people leaving Duluth skyrocketed, the number mov-ing in plummeted, and the households that remained had fewer people in them.
1 2000 and 1990 Census information throughout the report was obtained from the 2000 Census Gateway website, www.census.gov/main
Figure D-1: Duluth Population, 1970-2030
Demographic ProfileDemographic Profile
Current Population
Dem
ographic Profile
2 2006 City of Duluth Comprehensive Plan
Dem
ogra
phic
Pro
file
32006 City of Duluth Comprehensive Plan
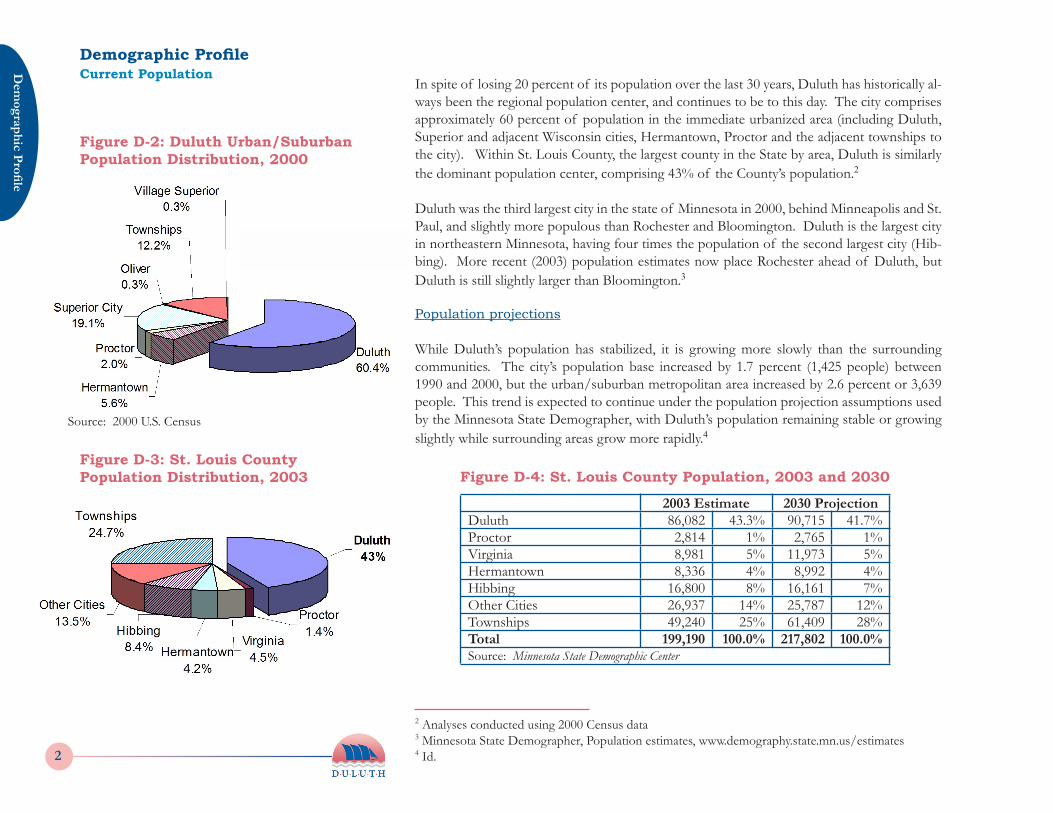
In spite of losing 20 percent of its population over the last 30 years, Duluth has historically al-ways been the regional population center, and continues to be to this day. The city comprises approximately 60 percent of population in the immediate urbanized area (including Duluth, Superior and adjacent Wisconsin cities, Hermantown, Proctor and the adjacent townships to the city). Within St. Louis County, the largest county in the State by area, Duluth is similarly the dominant population center, comprising 43% of the County’s population.2
Duluth was the third largest city in the state of Minnesota in 2000, behind Minneapolis and St. Paul, and slightly more populous than Rochester and Bloomington. Duluth is the largest city in northeastern Minnesota, having four times the population of the second largest city (Hib-bing). More recent (2003) population estimates now place Rochester ahead of Duluth, but Duluth is still slightly larger than Bloomington.3
Population projections
While Duluth’s population has stabilized, it is growing more slowly than the surrounding communities. The city’s population base increased by 1.7 percent (1,425 people) between 1990 and 2000, but the urban/suburban metropolitan area increased by 2.6 percent or 3,639 people. This trend is expected to continue under the population projection assumptions used by the Minnesota State Demographer, with Duluth’s population remaining stable or growing slightly while surrounding areas grow more rapidly.4
2 Analyses conducted using 2000 Census data3 Minnesota State Demographer, Population estimates, www.demography.state.mn.us/estimates4 Id.
2003 Estimate 2030 ProjectionDuluth 86,082 43.3% 90,715 41.7%Proctor 2,814 1% 2,765 1%Virginia 8,981 5% 11,973 5%Hermantown 8,336 4% 8,992 4%Hibbing 16,800 8% 16,161 7%Other Cities 26,937 14% 25,787 12%Townships 49,240 25% 61,409 28%Total 199,190 100.0% 217,802 100.0%Source: Minnesota State Demographic Center
Figure D-4: St. Louis County Population, 2003 and 2030
Figure D-2: Duluth Urban/Suburban Population Distribution, 2000
Figure D-3: St. Louis County Population Distribution, 2003
Source: 2000 U.S. Census
Source: 2000 U.S. Census
Demographic ProfileCurrent Population
Dem
ographic Profile
2 2006 City of Duluth Comprehensive Plan
Dem
ogra
phic
Pro
file
32006 City of Duluth Comprehensive Plan
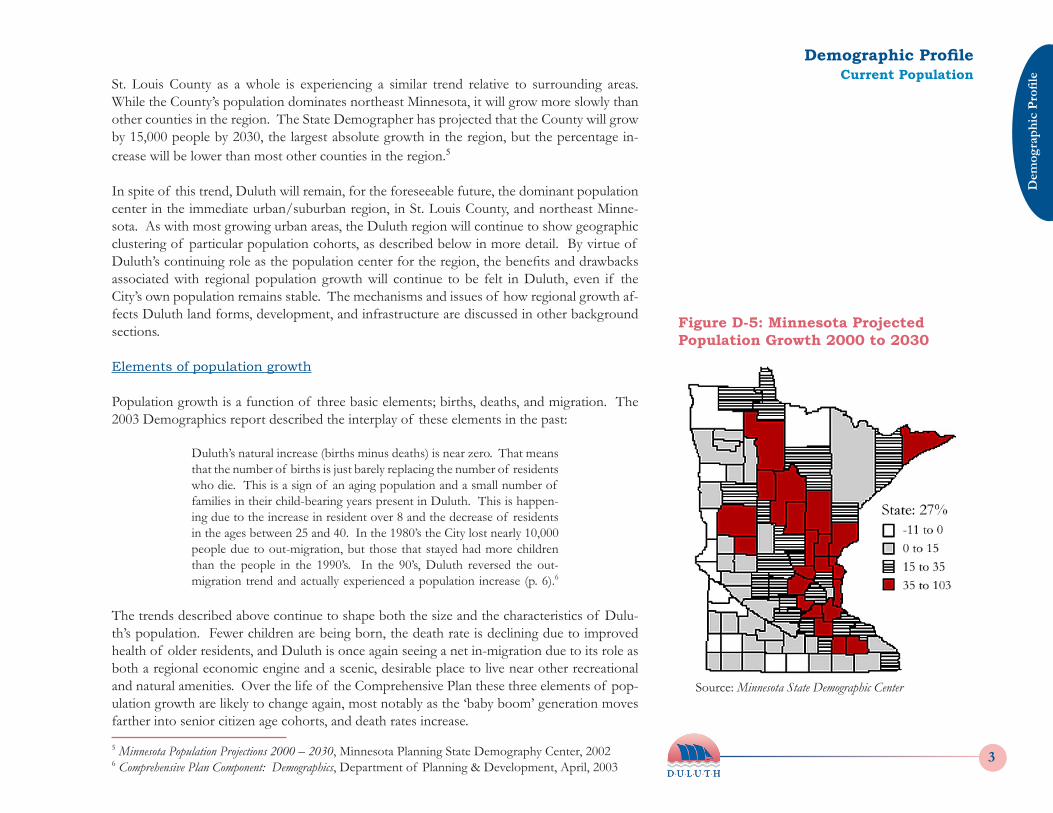
St. Louis County as a whole is experiencing a similar trend relative to surrounding areas. While the County’s population dominates northeast Minnesota, it will grow more slowly than other counties in the region. The State Demographer has projected that the County will grow by 15,000 people by 2030, the largest absolute growth in the region, but the percentage in-crease will be lower than most other counties in the region.5
In spite of this trend, Duluth will remain, for the foreseeable future, the dominant population center in the immediate urban/suburban region, in St. Louis County, and northeast Minne-sota. As with most growing urban areas, the Duluth region will continue to show geographic clustering of particular population cohorts, as described below in more detail. By virtue of Duluth’s continuing role as the population center for the region, the benefits and drawbacks associated with regional population growth will continue to be felt in Duluth, even if the City’s own population remains stable. The mechanisms and issues of how regional growth af-fects Duluth land forms, development, and infrastructure are discussed in other background sections.
Elements of population growth
Population growth is a function of three basic elements; births, deaths, and migration. The 2003 Demographics report described the interplay of these elements in the past:
Duluth’s natural increase (births minus deaths) is near zero. That means that the number of births is just barely replacing the number of residents who die. This is a sign of an aging population and a small number of families in their child-bearing years present in Duluth. This is happen-ing due to the increase in resident over 8 and the decrease of residents in the ages between 25 and 40. In the 1980’s the City lost nearly 10,000 people due to out-migration, but those that stayed had more children than the people in the 1990’s. In the 90’s, Duluth reversed the out- migration trend and actually experienced a population increase (p. 6).6
The trends described above continue to shape both the size and the characteristics of Dulu-th’s population. Fewer children are being born, the death rate is declining due to improved health of older residents, and Duluth is once again seeing a net in-migration due to its role as both a regional economic engine and a scenic, desirable place to live near other recreational and natural amenities. Over the life of the Comprehensive Plan these three elements of pop-ulation growth are likely to change again, most notably as the ‘baby boom’ generation moves farther into senior citizen age cohorts, and death rates increase.
5 Minnesota Population Projections 2000 – 2030, Minnesota Planning State Demography Center, 20026 Comprehensive Plan Component: Demographics, Department of Planning & Development, April, 2003
Figure D-5: Minnesota Projected Population Growth 2000 to 2030
Source: Minnesota State Demographic Center
Demographic ProfileCurrent Population
Dem
ographic Profile
4 2006 City of Duluth Comprehensive Plan
Dem
ogra
phic
Pro
file
52006 City of Duluth Comprehensive Plan
Geographic growth areas
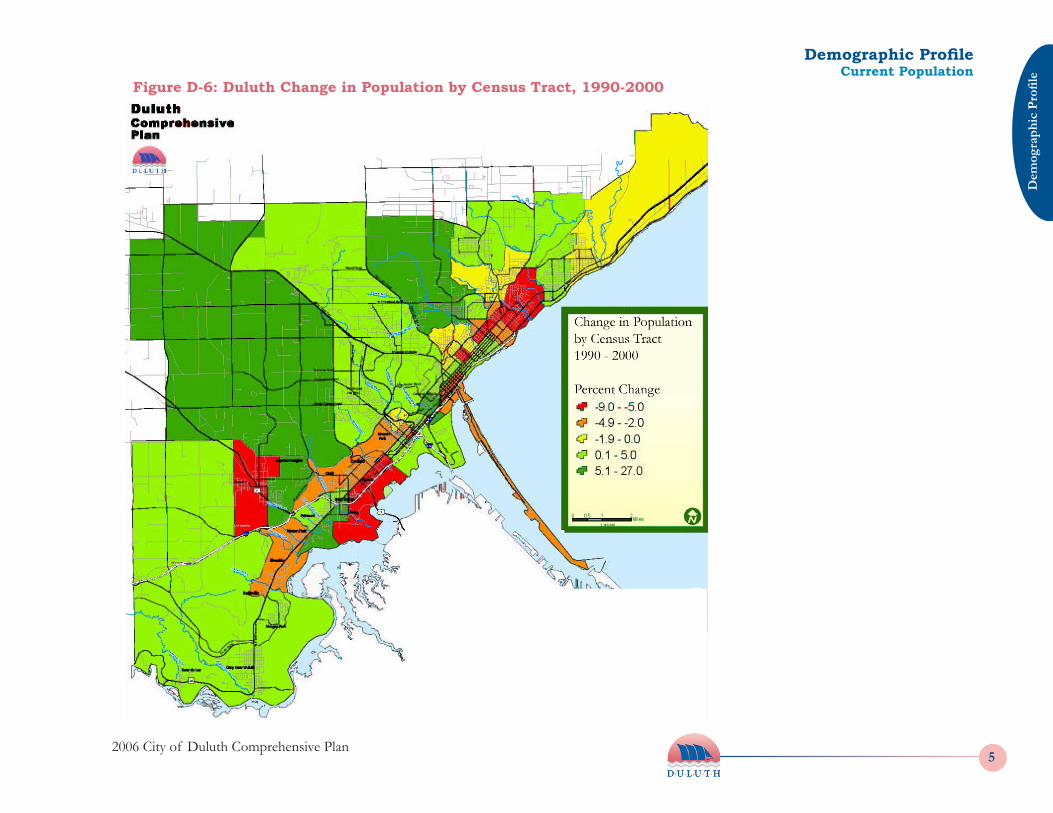
Duluth’s housing and population growth in the 1990s did not occur uniformly across the City. The 2003 Demographics report noted that of the 42 census tracts that comprise Duluth only 17 had an increase in population, and only 11 increased by more than 3%.7 An analysis of popu-lation change by census tract portrays a similar picture.8 Most of the neighborhoods below the ridge lost population or remained stable. Most of the growth occurred in neighborhoods in the far west and farther up the ridge or over the ridge. Growth areas tend to be the neigh-borhoods with land that could be developed for residential housing. Fully developed areas of the City tended to lose population. This trend seems to bear out the conventional wisdom that cities can only grow where new housing can be built.
The 2003 Demographics report did note several exceptions to the loss in housing units. For in-stance, two census tracts (tract 20 and 26) in the bayfront area saw increases in the number of housing units of eleven and eight percent respectively. These areas are some of the oldest developed areas, but realized growth due to redevelopment efforts that converted non-resi-dential land to residential or replaced underutilized housing. These two growth areas, while accounting for only 2,300 people, are indicative that growth can occur in ‘fully developed’ ar-eas, provided the market shows sufficient demand for the higher density housing typical of such areas.
The map on the following page presents population growth by census tract.
7 Ibid, p. 58 Ibid, p. 15
Demographic ProfileCurrent Population
Dem
ographic Profile
4 2006 City of Duluth Comprehensive Plan
Dem
ogra
phic
Pro
file
52006 City of Duluth Comprehensive Plan
Figure D-6: Duluth Change in Population by Census Tract, 1990-2000
Demographic ProfileCurrent Population
Dem
ographic Profile
6 2006 City of Duluth Comprehensive Plan
Dem
ogra
phic
Pro
file
72006 City of Duluth Comprehensive Plan
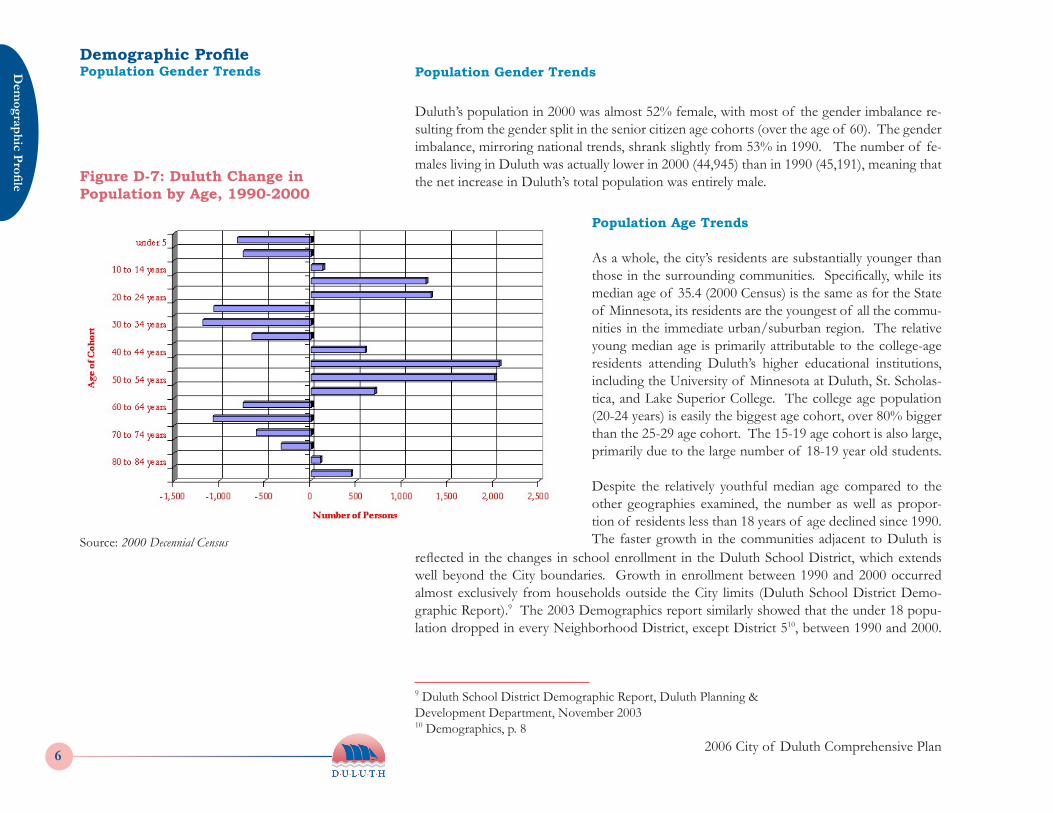
Duluth’s population in 2000 was almost 52% female, with most of the gender imbalance re-sulting from the gender split in the senior citizen age cohorts (over the age of 60). The gender imbalance, mirroring national trends, shrank slightly from 53% in 1990. The number of fe-males living in Duluth was actually lower in 2000 (44,945) than in 1990 (45,191), meaning that the net increase in Duluth’s total population was entirely male.
9 Duluth School District Demographic Report, Duluth Planning & Development Department, November 200310 Demographics, p. 8
Population Age Trends
As a whole, the city’s residents are substantially younger than those in the surrounding communities. Specifically, while its median age of 35.4 (2000 Census) is the same as for the State of Minnesota, its residents are the youngest of all the commu-nities in the immediate urban/suburban region. The relative young median age is primarily attributable to the college-age residents attending Duluth’s higher educational institutions, including the University of Minnesota at Duluth, St. Scholas-tica, and Lake Superior College. The college age population (20-24 years) is easily the biggest age cohort, over 80% bigger than the 25-29 age cohort. The 15-19 age cohort is also large, primarily due to the large number of 18-19 year old students.
Despite the relatively youthful median age compared to the other geographies examined, the number as well as propor-tion of residents less than 18 years of age declined since 1990. The faster growth in the communities adjacent to Duluth is
reflected in the changes in school enrollment in the Duluth School District, which extends well beyond the City boundaries. Growth in enrollment between 1990 and 2000 occurred almost exclusively from households outside the City limits (Duluth School District Demo-graphic Report).9 The 2003 Demographics report similarly showed that the under 18 popu-lation dropped in every Neighborhood District, except District 510, between 1990 and 2000.
Figure D-7: Duluth Change in Population by Age, 1990-2000
Source: 2000 Decennial Census
Demographic ProfilePopulation Gender Trends Population Gender Trends
Dem
ographic Profile
6 2006 City of Duluth Comprehensive Plan
Dem
ogra
phic
Pro
file
72006 City of Duluth Comprehensive Plan
Growth cohorts
Almost all of Duluth’s 1990-2000 increase in population occurred in the two general age co-horts; the college-aged (18-24) and the middle-aged (40-59). Increasing enrollment at Du-luth’s institutions of higher learning between 1990 and 2000, clearly contributed to Duluth’s population increase. As the colleges continue to grow, Duluth’s regional role as a center for higher education should continue to off-set other trends toward declining population.
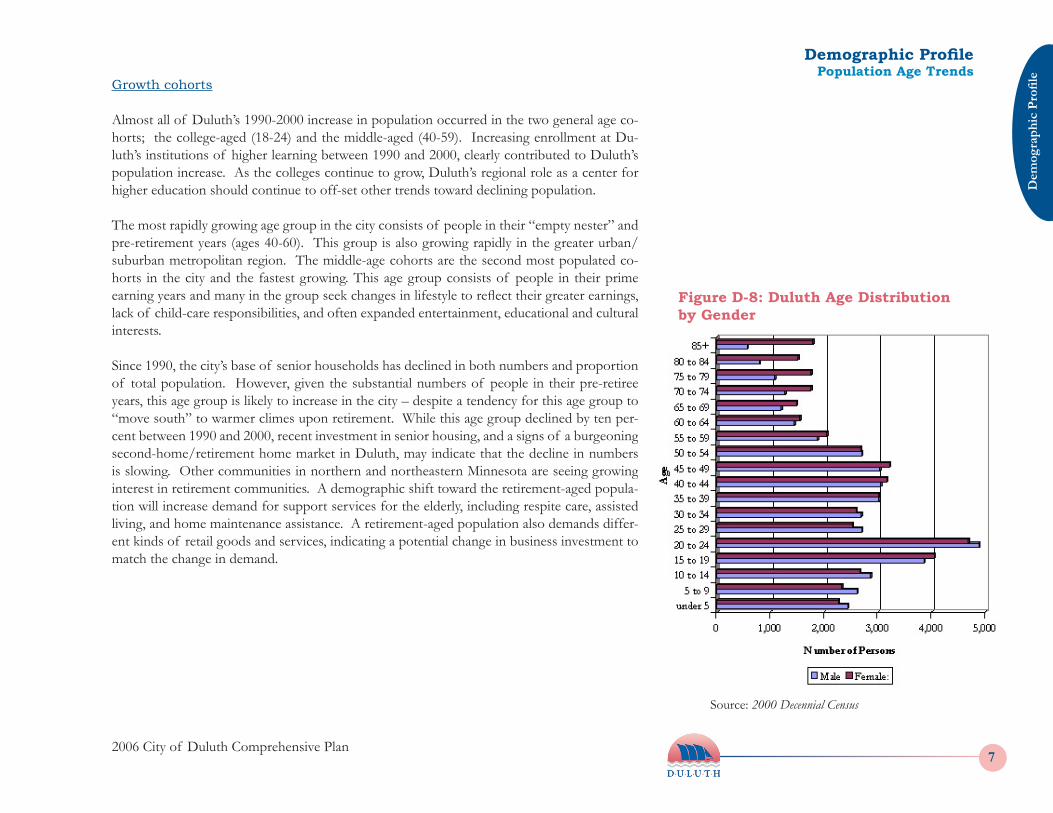
The most rapidly growing age group in the city consists of people in their “empty nester” and pre-retirement years (ages 40-60). This group is also growing rapidly in the greater urban/suburban metropolitan region. The middle-age cohorts are the second most populated co-horts in the city and the fastest growing. This age group consists of people in their prime earning years and many in the group seek changes in lifestyle to reflect their greater earnings, lack of child-care responsibilities, and often expanded entertainment, educational and cultural interests.
Since 1990, the city’s base of senior households has declined in both numbers and proportion of total population. However, given the substantial numbers of people in their pre-retiree years, this age group is likely to increase in the city – despite a tendency for this age group to “move south” to warmer climes upon retirement. While this age group declined by ten per-cent between 1990 and 2000, recent investment in senior housing, and a signs of a burgeoning second-home/retirement home market in Duluth, may indicate that the decline in numbers is slowing. Other communities in northern and northeastern Minnesota are seeing growing interest in retirement communities. A demographic shift toward the retirement-aged popula-tion will increase demand for support services for the elderly, including respite care, assisted living, and home maintenance assistance. A retirement-aged population also demands differ-ent kinds of retail goods and services, indicating a potential change in business investment to match the change in demand.
Figure D-8: Duluth Age Distribution by Gender
Source: 2000 Decennial Census
Demographic ProfilePopulation Age Trends
Dem
ographic Profile
8 2006 City of Duluth Comprehensive Plan
Dem
ogra
phic
Pro
file
92006 City of Duluth Comprehensive Plan
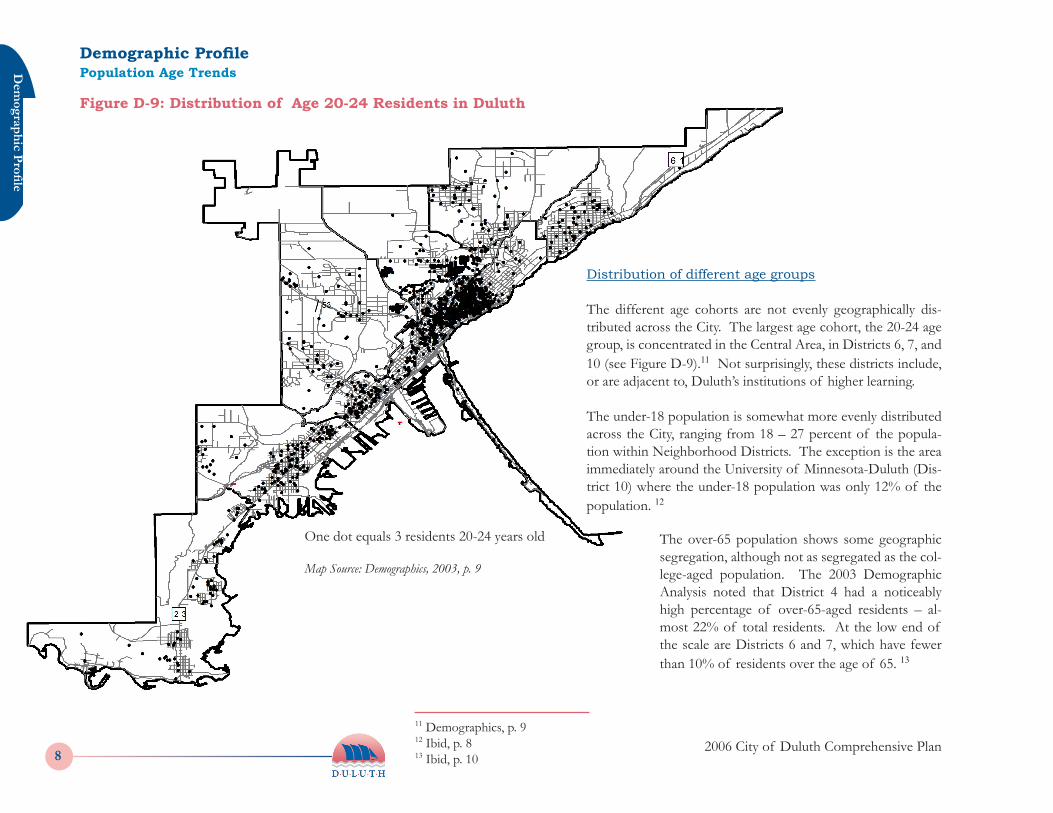
Figure D-9: Distribution of Age 20-24 Residents in Duluth
Distribution of different age groups
The different age cohorts are not evenly geographically dis-tributed across the City. The largest age cohort, the 20-24 age group, is concentrated in the Central Area, in Districts 6, 7, and 10 (see Figure D-9).11 Not surprisingly, these districts include, or are adjacent to, Duluth’s institutions of higher learning.
The under-18 population is somewhat more evenly distributed across the City, ranging from 18 – 27 percent of the popula-tion within Neighborhood Districts. The exception is the area immediately around the University of Minnesota-Duluth (Dis-trict 10) where the under-18 population was only 12% of the population. 12
The over-65 population shows some geographic segregation, although not as segregated as the col-lege-aged population. The 2003 Demographic Analysis noted that District 4 had a noticeably high percentage of over-65-aged residents – al-most 22% of total residents. At the low end of the scale are Districts 6 and 7, which have fewer than 10% of residents over the age of 65. 13
11 Demographics, p. 912 Ibid, p. 813 Ibid, p. 10
One dot equals 3 residents 20-24 years old
Map Source: Demographics, 2003, p. 9
Demographic ProfilePopulation Age Trends
Dem
ographic Profile
8 2006 City of Duluth Comprehensive Plan
Dem
ogra
phic
Pro
file
92006 City of Duluth Comprehensive Plan
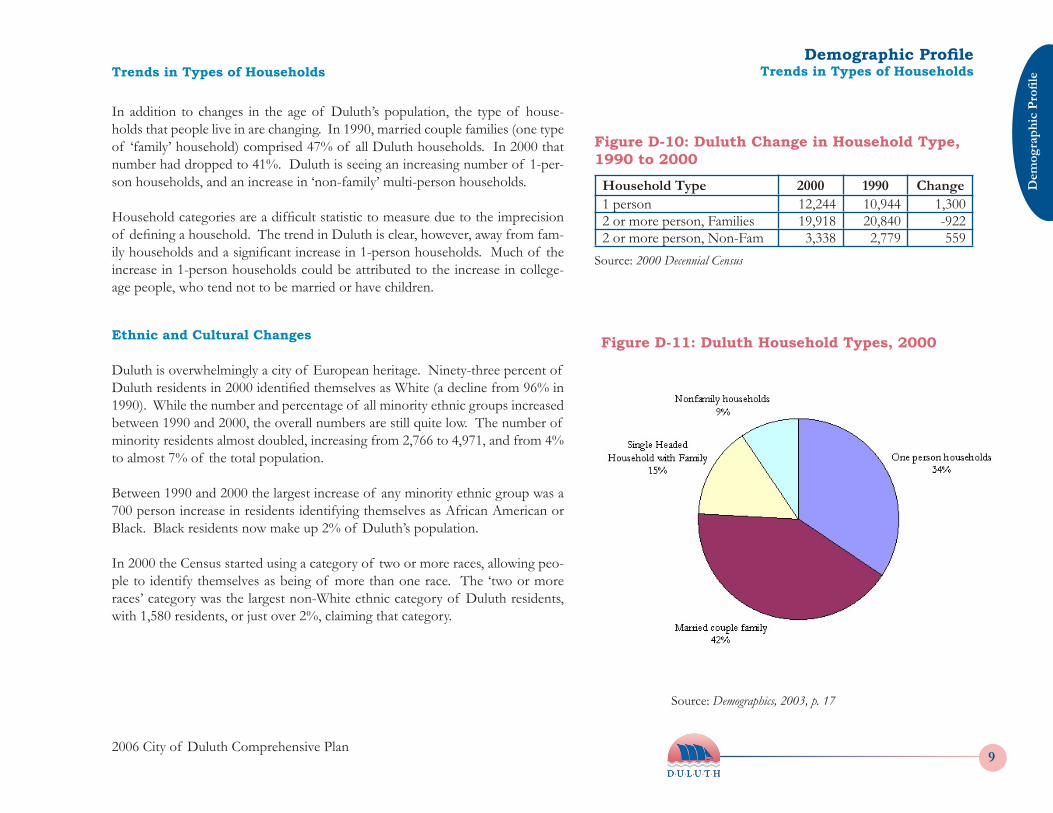
Household Type 2000 1990 Change1 person 12,244 10,944 1,3002 or more person, Families 19,918 20,840 -9222 or more person, Non-Fam 3,338 2,779 559
In addition to changes in the age of Duluth’s population, the type of house-holds that people live in are changing. In 1990, married couple families (one type of ‘family’ household) comprised 47% of all Duluth households. In 2000 that number had dropped to 41%. Duluth is seeing an increasing number of 1-per-son households, and an increase in ‘non-family’ multi-person households.
Household categories are a difficult statistic to measure due to the imprecision of defining a household. The trend in Duluth is clear, however, away from fam-ily households and a significant increase in 1-person households. Much of the increase in 1-person households could be attributed to the increase in college-age people, who tend not to be married or have children.
Ethnic and Cultural Changes
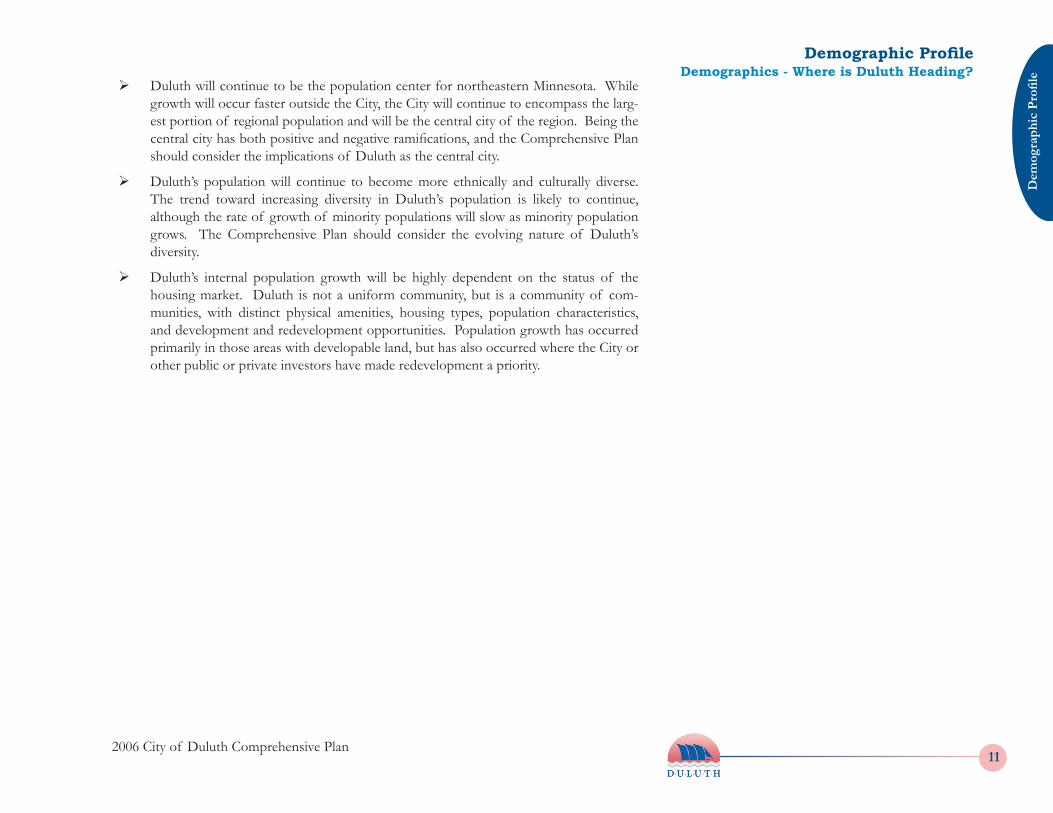
Duluth is overwhelmingly a city of European heritage. Ninety-three percent of Duluth residents in 2000 identified themselves as White (a decline from 96% in 1990). While the number and percentage of all minority ethnic groups increased between 1990 and 2000, the overall numbers are still quite low. The number of minority residents almost doubled, increasing from 2,766 to 4,971, and from 4% to almost 7% of the total population.
Between 1990 and 2000 the largest increase of any minority ethnic group was a 700 person increase in residents identifying themselves as African American or Black. Black residents now make up 2% of Duluth’s population.
In 2000 the Census started using a category of two or more races, allowing peo-ple to identify themselves as being of more than one race. The ‘two or more races’ category was the largest non-White ethnic category of Duluth residents, with 1,580 residents, or just over 2%, claiming that category.
Figure D-10: Duluth Change in Household Type, 1990 to 2000
Source: 2000 Decennial Census
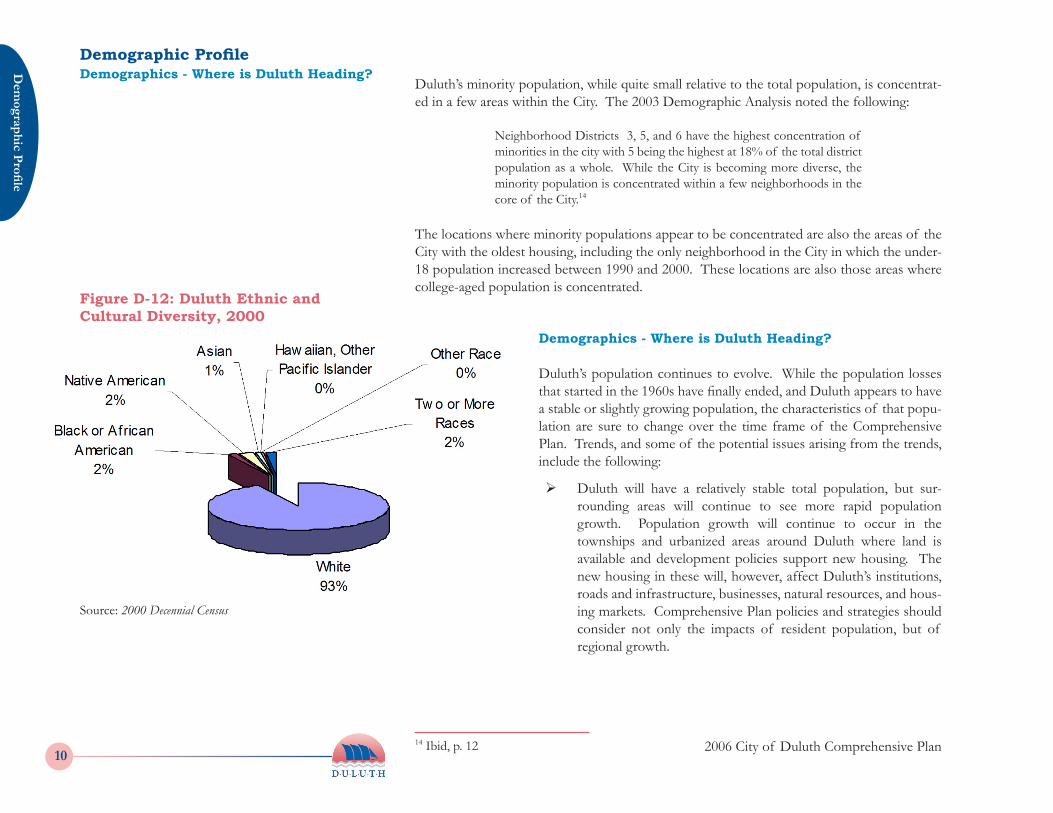
Figure D-11: Duluth Household Types, 2000
Source: Demographics, 2003, p. 17
Demographic ProfileTrends in Types of HouseholdsTrends in Types of Households
Dem
ographic Profile
10 2006 City of Duluth Comprehensive Plan
Dem
ogra
phic
Pro
file
112006 City of Duluth Comprehensive Plan
Duluth’s minority population, while quite small relative to the total population, is concentrat-ed in a few areas within the City. The 2003 Demographic Analysis noted the following:
Neighborhood Districts 3, 5, and 6 have the highest concentration of minorities in the city with 5 being the highest at 18% of the total district population as a whole. While the City is becoming more diverse, the minority population is concentrated within a few neighborhoods in the core of the City.14
The locations where minority populations appear to be concentrated are also the areas of the City with the oldest housing, including the only neighborhood in the City in which the under-18 population increased between 1990 and 2000. These locations are also those areas where college-aged population is concentrated.
Demographics - Where is Duluth Heading?
Duluth’s population continues to evolve. While the population losses that started in the 1960s have finally ended, and Duluth appears to have a stable or slightly growing population, the characteristics of that popu-lation are sure to change over the time frame of the Comprehensive Plan. Trends, and some of the potential issues arising from the trends, include the following:
Ø Duluth will have a relatively stable total population, but sur-rounding areas will continue to see more rapid population growth. Population growth will continue to occur in the townships and urbanized areas around Duluth where land is available and development policies support new housing. The new housing in these will, however, affect Duluth’s institutions, roads and infrastructure, businesses, natural resources, and hous-ing markets. Comprehensive Plan policies and strategies should consider not only the impacts of resident population, but of regional growth.
14 Ibid, p. 12
Figure D-12: Duluth Ethnic and Cultural Diversity, 2000
Source: 2000 Decennial Census
Demographic ProfileDemographics - Where is Duluth Heading?
Dem
ographic Profile
10 2006 City of Duluth Comprehensive Plan
Dem
ogra
phic
Pro
file
112006 City of Duluth Comprehensive Plan
Ø Duluth will continue to be the population center for northeastern Minnesota. While growth will occur faster outside the City, the City will continue to encompass the larg-est portion of regional population and will be the central city of the region. Being the central city has both positive and negative ramifications, and the Comprehensive Plan should consider the implications of Duluth as the central city.
Ø Duluth’s population will continue to become more ethnically and culturally diverse. The trend toward increasing diversity in Duluth’s population is likely to continue, although the rate of growth of minority populations will slow as minority population grows. The Comprehensive Plan should consider the evolving nature of Duluth’s diversity.
Ø Duluth’s internal population growth will be highly dependent on the status of the housing market. Duluth is not a uniform community, but is a community of com-munities, with distinct physical amenities, housing types, population characteristics, and development and redevelopment opportunities. Population growth has occurred primarily in those areas with developable land, but has also occurred where the City or other public or private investors have made redevelopment a priority.
Demographic ProfileDemographics - Where is Duluth Heading?
Dem
ographic Profile
12 2006 City of Duluth Comprehensive Plan
Demographic ProfileDemographics - Where is Duluth Heading?