Demographic Differences in Sentencing: An Update to … · J. Patricia Wilson Smoot ([2IÀFLR...
49
Demographic Differences in Sentencing: An Update to the 2012 Booker Report UNITED STATES SENTENCING COMMISSION
Transcript of Demographic Differences in Sentencing: An Update to … · J. Patricia Wilson Smoot ([2IÀFLR...
Demographic Differences in Sentencing: An Update to the 2012 Booker Report
UNITED STATES SENTENCING COMMISSION

William H. Pryor, Jr. Acting Chair
Rachel E. BarkowCommissioner
Charles R. BreyerCommissioner
Danny C. ReevesCommissioner
Zachary C. BolithoEx Officio
J. Patricia Wilson SmootEx Officio
Kenneth P. Cohen Staff Director
Glenn R. SchmittDirector
Office of Research and Data
November 2017
United States Sentencing CommissionOne Columbus Circle, N.E. Washington, DC 20002www.ussc.gov

Glenn R. Schmitt, J.D., M.P.P., Director, Office of Research and Data
Louis Reedt, Sc.D., Deputy Director, Office of Research and Data
Kevin Blackwell, Senior Research Associate, Office of Research and Data

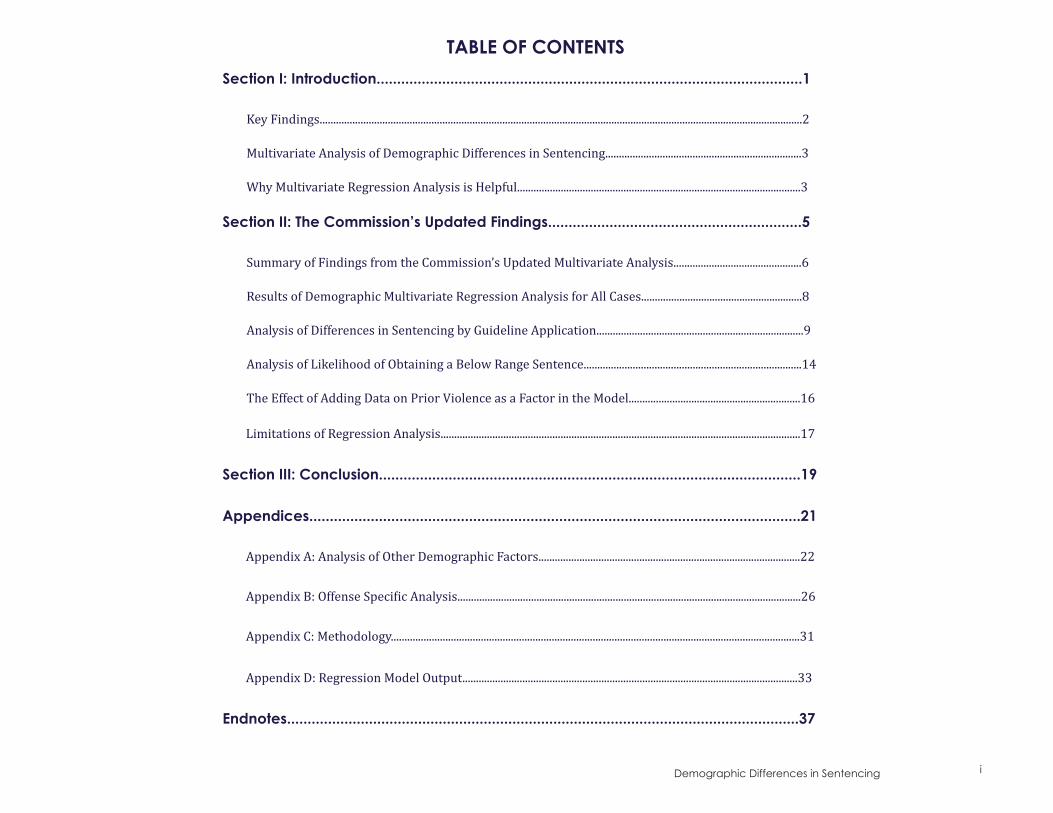
Section I: Introduction........................................................................................................1
Key Findings.................................................................................................................................................................................2
Multivariate Analysis of Demographic Differences in Sentencing........................................................................3
Why Multivariate Regression Analysis is Helpful........................................................................................................3
Section II: The Commission’s Updated Findings..............................................................5
Summary of Findings from the Commission’s Updated Multivariate Analysis...............................................6
Results of Demographic Multivariate Regression Analysis for All Cases...........................................................8
Analysis of Differences in Sentencing by Guideline Application............................................................................9
Analysis of Likelihood of Obtaining a Below Range Sentence................................................................................14
The Effect of Adding Data on Prior Violence as a Factor in the Model...............................................................16
Limitations of Regression Analysis....................................................................................................................................17
Section III: Conclusion.......................................................................................................19
Appendices........................................................................................................................21
Appendix A: Analysis of Other Demographic Factors................................................................................................22
Appendix B: Offense Specific Analysis..............................................................................................................................26
Appendix C: Methodology......................................................................................................................................................31
Appendix D: Regression Model Output...........................................................................................................................33
Endnotes.............................................................................................................................37
TABLE OF CONTENTS
Demographic Differences in Sentencing i


t
Section I
Introduction

Demographic Differences in Sentencing2
Introduction In 2010, the Commission published an analysis of federal
sentencing data which examined whether the length of sentences imposed on federal offenders was correlated with demographic characteristics of those offenders.1 That analysis found that some demographic factors were associated with sentence length to a statistically significant extent during some of the time periods studied.2 Among other findings, the analysis showed that Black male offenders received longer sentences than White male offenders, and that the gap between the sentence lengths for Black and White male offenders was increasing.
In 2012, the Commission updated this analysis by examining cases in which the offender was sentenced after the release of the 2010 report.3 The Commission also expanded its analyses to examine demographic differences in sentences based on a comparison of the position of the sentence imposed relative to the sentencing guideline range that applied in the case; based on the type of offense committed by the offender, including drug trafficking, fraud, and firearms; and based on changes in sentence length for offenders of particular race and gender pairings. These findings were released as part of the Commission’s comprehensive report4 on sentencing practices after the Supreme Court’s decision in United States v. Booker.5 In its 2012 report, the Commission found that the type of demographic differences in sentencing reported in 2010 continued to be observed in sentencings that occurred after that report.
The Commission has once again updated its analysis by examining cases in which the offender was sentenced during the period following the 2012 report. This new time period, from October 1, 2011, to September 30, 2016, is referred to as the “Post-Report period” in this publication. Also, the Commission has collected data about an additional variable—violence in an offender’s criminal history—that the Commission had previously noted was missing from its analysis but that might help explain some of the differences in sentencing noted in its work. This report presents the results observed from adding that new data to the Commission’s analysis.
Key Findings
Consistent with its previous reports, the Commission found that sentence length continues to be associated with some demographic factors. In particular, after controlling for a wide variety of sentencing factors, the Commission found:
• Black male offenders continued to receive longer sentences than similarly situated White male offenders. Black male offenders received sentences on average 19.1 percent longer than similarly situated White male offenders during the Post-Report period (fiscal years 2012-2016), as they had for the prior four periods studied. The differences in sentence length remained relatively unchanged compared to the Post-Gall period.
• Non-government sponsored departures and variances appear to contribute significantly to the difference in sentence length between Black male and White male offenders. Black male offenders were 21.2 percent less likely than White male offenders to receive a non-government sponsored downward departure or variance during the Post-Report period. Furthermore, when Black male offenders did receive a non-government sponsored departure or variance, they received sentences 16.8 percent longer than White male offenders who received a non-government sponsored departure or variance. In contrast, there was a 7.9 percent difference in sentence length between Black male and White male offenders who received sentences within the applicable sentencing guidelines range, and there was no statistically significant difference in sentence length between Black male and White male offenders who received a substantial assistance departure.
• Violence in an offender’s criminal history does not appear to account for any of the demographic differences in sentencing. Black male offenders received sentences on average 20.4 percent longer than similarly situated White male offenders, accounting for violence in an offender’s past in fiscal year 2016, the only year for which such data is available. This figure is almost the same as the 20.7 percent difference without accounting for past violence. Thus, violence in an offender’s criminal history does not appear to contribute to the sentence imposed to any extent beyond its contribution to the offender’s criminal history score determined under the sentencing guidelines.
• Female offenders of all races received shorter sentences than White male offenders during the Post-Report period, as they had for the prior four periods. The differences in sentence length decreased slightly during the five-year period after the 2012 Booker Report for most offenders. The differences in sentence length fluctuated across all time periods studied for White females, Black females, Hispanic females, and Other Race female offenders.

Demographic Differences in Sentencing 3
Multivariate Analysis of Demographic Differences in Sentencing
For this report and in its prior two reports, the Commission has used multivariate regression analyses to explore the relationships between demographic factors, such as race and gender, and sentencing outcomes. These analyses were aimed at determining whether there were demographic differences in sentencing outcomes that were statistically significant, and whether those findings changed during the periods studied.
Multivariate regression analysis usually begins with a decision to examine an observed phenomenon or outcome. In the Commission’s work, the outcome observed are the sentences imposed in federal cases. The researcher will then develop a hypothesis as to the many possible factors that might produce that outcome. Among the factors considered by the Commission were the type of offense, the sentencing range determined by the court in each case using the Commission’s Guidelines Manual,6 and whether the offender was subject to a mandatory minimum penalty. The hypothesis is then tested using multivariate regression analysis to bring together data about the outcome and many possible factors that might affect that outcome. The goal of multivariate regression analysis is to determine whether there is an association between the factors being studied and, if so, to measure the extent to which each factor contributes to the observed outcome. Researchers refer to the outcome (in this report the length of the sentence imposed) as the “dependent variable.” The factors that might affect (and therefore might explain) that outcome are referred to as the “independent variables” or the “explanatory variables.”7
The principal benefit of multivariate regression analysis is that it controls for the effect of each factor in the analysis by comparing offenders who are similar to one another in relevant ways. By controlling for such factors and comparing similarly situated offenders, this multivariate regression analysis seeks to answer the question: if two offenders are similar in certain ways, what other factors might be associated with those two offenders receiving different sentences? In addition, multivariate regression analysis measures the extent of the difference in outcomes.
Multivariate regression analysis often cannot control for all possible factors that might affect the outcome being studied, typically because sufficient data about some factors is not readily available. For example, in its past reports, the Commission noted some potentially relevant factors were not included in its analyses, such as whether the offender’s criminal history included violent criminal conduct, the offender’s family ties, and the offender’s employment history.8 Data was not readily available for those factors because the Commission did not routinely extract that information from the court documents it receives.9 Therefore, for those prior analyses, the Commission could not control for them.10 For this reason, caution should always be used when drawing conclusions based on multivariate regression analysis.
Why Multivariate Regression Analysis is Helpful
Multivariate regression analysis can be helpful when considering demographic differences in sentencing outcomes because results from more simplistic data analyses that examine only selected demographic factors and sentencing outcomes can be misleading. Such simplistic analyses may yield results that might appear to indicate that demographic factors correlate with sentence length, when the actual correlation may be attributable to other, non-demographic factors, such as the type of offense committed or whether the offense was one for which a statutory mandatory minimum penalty applied. Most importantly, simplistic analyses do not consider the effect of the guideline range provided for under the sentencing guidelines, which takes into account, among other things, the type of offense, the presence of aggravating or mitigating factors, and the criminal history of the offender.
For example, a simplistic pairing of recent data regarding race and gender with sentence length shows that sentences of Black male offenders have always been longer than those of White male offenders. As shown on figure 1, however, the average sentences for Black male offenders were shorter during the Post-Report period (fiscal years 2012 to 2016) than during the Booker period (January 2005 to December 2007), and the Gall period (December 2007 to the end of fiscal year 2011). At the same time, the average sentence for White male offenders increased during the Post-Report period after a slight decrease in the Gall period. As a result, the difference in the sentences imposed on Black male and White male offenders has substantially decreased in recent years, from a difference of 34 months in fiscal year 2006, to nine months in fiscal years 2016.

Demographic Differences in Sentencing4
Some commentators have pointed to this change to erroneously assert that racial differences in sentencing are decreasing.11 However, such an analysis ignores many important factors that affect sentence length, such as the type of offense, criminal history, and weapon possession. For instance, the narrowing gap between Black and White male offender sentence lengths is due, in large part, to sizeable reductions in penalties for crack cocaine offenses, in which Black offenders constitute the large majority of the offenders. Despite these apparent changes in sentencing outcomes, the Commission’s multivariate regression analysis shows that when other relevant factors are controlled for, the gap in the sentence length between Black male and White male offenders did not shrink but, in fact, remained relatively stable across these periods.
Because simplistic analyses do not control for other relevant factors, they cannot provide an accurate estimate of the extent to which demographic factors are associated with sentence length. For this reason, multivariate regression analysis is necessary to explore the many factors that may contribute to these sentencing outcomes.
SOURCE: U.S. Sentencing Commission, 1999 - 2016 Datafile, USSCFY 99 -USSCFY16.
0
20
40
60
80
100White Male Black MaleMonths
Fig. 1. Average Sentence for White Male and Black Male Offenders Fiscal Years 1999-2016

Section II
Updated Findings
Demographic Differences in Sentencing6
The Commission’s Updated Findings The Commission’s findings are set forth below in five parts.
The first part summarizes the findings from the Commission’s updated analysis. The second part provides the findings from the Commission’s updated analysis of all cases regarding demographic differences associated with race and gender. Findings regarding other demographic factors are discussed in Appendix A to this report. In the third part of this report the Commission presents the findings of the multivariate regression analysis of cases divided into groups by the position of the sentence imposed relative to the guideline range. The findings regarding race and gender are discussed in the body of the report and the findings regarding other demographic factors are discussed in Appendix A. In the fourth part, multivariate regression analysis is used to examine the differences among offenses in the likelihood of receiving a sentence below the applicable guideline range. Lastly, the fifth part presents the results of a multivariate regression analysis that incorporates data about an offender’s violent criminal history. In Appendix B to this report the Commission presents the results of a multivariate regression analysis examining the sentences imposed for three types of offenses: drug trafficking, fraud, and firearms offenses.
Summary of Findings from the Commission’s Updated Multivariate Analysis
Consistent with its previous reports, the Commission found that sentence length is associated with some demographic factors. The Commission’s analysis considered race, gender, citizenship, age, and education level.12
The Commission found that sentences of Black male offenders were longer than those of White male offenders for all periods studied. Black male offenders’ sentences were 19.1 percent longer than those of White male offenders during the Post-Report period. The gap in sentence length between these two groups was smallest during the PROTECT Act period (5.5%) and largest during the Gall period (19.5%). Hispanic male offenders received sentences that were 5.3 percent longer than those of White male offenders during the Post-Report period. However, there was no statistically significant difference between the average sentences for the two groups during the Gall period. The differences in the sentences imposed on Other Race male offenders compared to those imposed on White male offenders were not statistically significant in the Post-Report period or the Gall period.
When examining all cases as a group, female offenders of all races received shorter sentences than White male offenders during the Post-Report period, as they had in the prior four periods. White female offenders received sentences that were 28.9 percent shorter than those of White male offenders in the Post-Report period, compared to 31.1 percent shorter during the Gall period. Black female offenders and Other Race female offenders also received shorter sentences than White male offenders during the Post-Report period, at 29.7 percent and 35.4 percent shorter respectively. In the Gall period these differences were 33.1 percent and 34.6 percent, respectively. Hispanic female offenders received sentences that were 16.8 percent shorter than those of White male offenders during the Post-Report period, compared to 18.2 percent shorter in the Gall period.
Non-citizen offenders received longer sentences than United States citizens during the Post-Report period, although this difference
• The Koon period, from October 1, 1998 through April 30, 2003. This period relates to cases decided after the Supreme Court’s 1996 decision in Koon v. United States.
• The PROTECT Act period, from May 1, 2003 (the date of the enactment of the PROTECT Act), through June 24, 2004 (the date of the Supreme Court’s decision in Blakely v. Washington).
• The Booker period, from January 12, 2005 (the date of the Supreme Court’s decision in United States v. Booker), through December 10, 2007 (the date of the Supreme Court’s decisions in Kimbrough v. United States and Gall v. United States).
• The Gall period, from December 11, 2007 through September 30, 2011.
• The Post-Report period, from October 1, 2011 through September 30, 2016.
Report Time Periods

Demographic Differences in Sentencing 7
decreased from the Gall period. No difference was found during the PROTECT Act period, but differences in sentence length returned during the Booker and Gall periods at levels exceeding those of the Koon period. Offenders with at least some college education had no difference in sentence length than offenders who did not attend college in the Post-Report period; a finding that differs from the other four periods where offenders with some college education received shorter sentences than offenders with no college education.13
The Commission also studied whether there were demographic differences in sentencing based on the position of the sentence imposed relative to the sentencing guideline range that applied in the case.14 The Commission found statistically significant differences in sentence length during all time periods for Black male offenders, who received longer within range sentences than White male offenders who received within range sentences, although the difference decreased in the Post-Report period. The differences in sentence length between Hispanic male offenders and White male offenders who received within range sentences varied over the five time periods studied, but Hispanic male offenders generally received shorter sentences than White male offenders during all but the Post-Report period. In the Post-Report period, however, there was no statistically significant difference between the average sentences for Hispanic and White male offenders who were sentenced within the guideline range.
With respect to offenders who received below range sentences based on their substantial assistance to the government,15 Black male offenders received longer sentences than White male offenders during the Koon period only. In all other periods, there was no statistically significant difference between the two groups. Other Race male offenders who received substantial assistance below range sentences received longer sentences than White male offenders during the Booker period only.
Comparing Black male offenders to White male offenders who received a non-government sponsored below range sentence, the differences in sentence length between the two groups were statistically significant in two periods, including the Post-Report period, where Black males received sentences that were 16.8 percent longer than those for White males. Differences in sentence length between Hispanic male offenders and White male offenders who received a non-government
sponsored below range sentence were statistically significant only in the Gall and Post-Report periods, when the differences were 9.3 and 10.6 percent respectively. There were no statistically significant differences between the sentences imposed on Other Race male offenders and White male offenders who received a non-government sponsored below range sentence.
Across most periods, female offenders who received within range sentences, regardless of their race, were sentenced to terms shorter than those of White male offenders who received within range sentences. For most female offenders, these differences increased over time. In the Post-Report period, White female offenders who received within range sentences received sentences that were 24.1 percent shorter than those of White male offenders who received within range sentences. Black female offenders with within range sentences received sentences that were 27.1 percent shorter than within range sentences for White male offenders in the Post-Report period.
Sentences for Hispanic female offenders followed a different pattern. The sentences for Hispanic females who received within range sentences were not statistically different from those for White male offenders during the Post-Report period. This is a change from all prior periods studied, where Hispanic female within range sentences were lower than those for White male offenders. The differences in sentence length between Other Race female offenders who received within range sentences and White male offenders have decreased in the recent period studied. This difference was 37.2 percent during the Post-Report period.
Female offenders of all races who received substantial assistance departures generally received shorter sentences than White male offenders who received substantial assistance departures. During the Post-Report period, the sentence length for White female offenders who received substantial assistance departures was 26.0 percent shorter than for White male offenders who received substantial assistance departures. For Black female offenders who received substantial assistance departures the difference was 21.1 percent shorter than White male offenders. In the Post-report period, sentences for Hispanic female offenders who received a substantial assistance departure were 25.5 percent shorter than for White male offenders who received a substantial assistance departure. However, the difference for Other Race female offenders and White male offenders was not statistically significant in the Post-Report period.

Demographic Differences in Sentencing8
White and Black female offenders who received a non-government sponsored below range sentence received shorter sentences than White male offenders who received a non-government sponsored below range sentence during the Gall and Post-Report periods. Hispanic and Other Race female offenders who received a non-government sponsored below range sentence received shorter sentences than White male offenders who received a non-government sponsored below range sentence during the Booker, Gall, and Post-Report periods.
The Commission also conducted a multivariate regression analysis of the likelihood that an offender would receive a non-government sponsored below range sentence. This analysis showed statistically significant differences during the PROTECT Act, Booker, Gall, and Post-Report periods.16 During these periods, Black male offenders were between 20 to 25 percent less likely to receive a non-government sponsored below range sentence than White male offenders. These differences in the likelihood of receiving this type of below range sentence may contribute to the sentence length differences between Black and White male offenders. Hispanic male offenders also were less likely than White male offenders to receive a non-government sponsored below range sentence during all periods.
Finally, the Commission conducted a multivariate regression analysis of demographic differences in sentencing associated with the specific type of offense committed. This analysis showed that sentencing outcomes varied depending on the offense. For example, an analysis of firearms cases revealed statistically significant differences between the sentence length of White and Black male offenders during the Koon, Booker, Gall, and Post-Report periods. In comparison, an analysis of fraud cases showed statistically significant differences between sentence length of White male and Black male offenders only in the Koon and Post-Report periods.
Results of Demographic Multivariate Regression Analysis for All Cases
The Commission’s multivariate regression analysis for all cases, updated through fiscal year 2016, continues to demonstrate that some demographic factors are associated with sentence length to a statistically significant extent during the periods studied. For the remainder of this report, the Commission’s analysis will focus primarily on the most recent period studied—the Post-Report period—as compared to the
immediately preceding period, the Gall period. The results for all periods are presented in the figures that accompany this discussion.17 Also, this portion of the report will discuss differences in sentencing that are associated with race and gender. Analyses of sentencing differences associated with other demographic factors can be found in Appendix A of this report.
Analysis: All Cases
Figures 2 and 3 depict differences in sentence length for all cases. Differences in sentence length for Black male offenders compared to White male offenders remained relatively stable between the Gall and Post-Report periods. During the Post-Report period, Black male offenders were sentenced to 19.1 percent longer sentences than White male offenders. In the Gall period, the sentences of Black male offenders were 19.5 percent longer.
Hispanic male offenders received sentences that were 5.3 percent longer than those of White male offenders during the Post-Report period. However, there was no statistically significant difference between the average sentences for the two groups during the Gall period.
Fig. 2. Differences in Sentence Length for Male Offenders Koon, PROTECT, Booker, Gall, and Post-Report Periods
11.2
-3.6
*
5.5
-4.4
-8.0
15.2
* *
19.5
* *
19.1
5.3
*
-10
-5
0
5
10
15
20
25 Koon PROTECT Booker Gall Post-ReportPercentage Difference in Sentence Length
Black Male vs. White Male Hispanic Male vs. White Male Other Male vs. White Male
•Indicates that the difference between the two groups was not statistically significant. SOURCE: U.S. Sentencing Commission, 1999 -2016 Datafiles, USSCFY99-USSCFY16.
Demographic Differences in Sentencing 9
The differences in the sentences imposed on Other Race males compared to those imposed on White male offenders were not statistically significant in the Post-Report period or the Gall period.
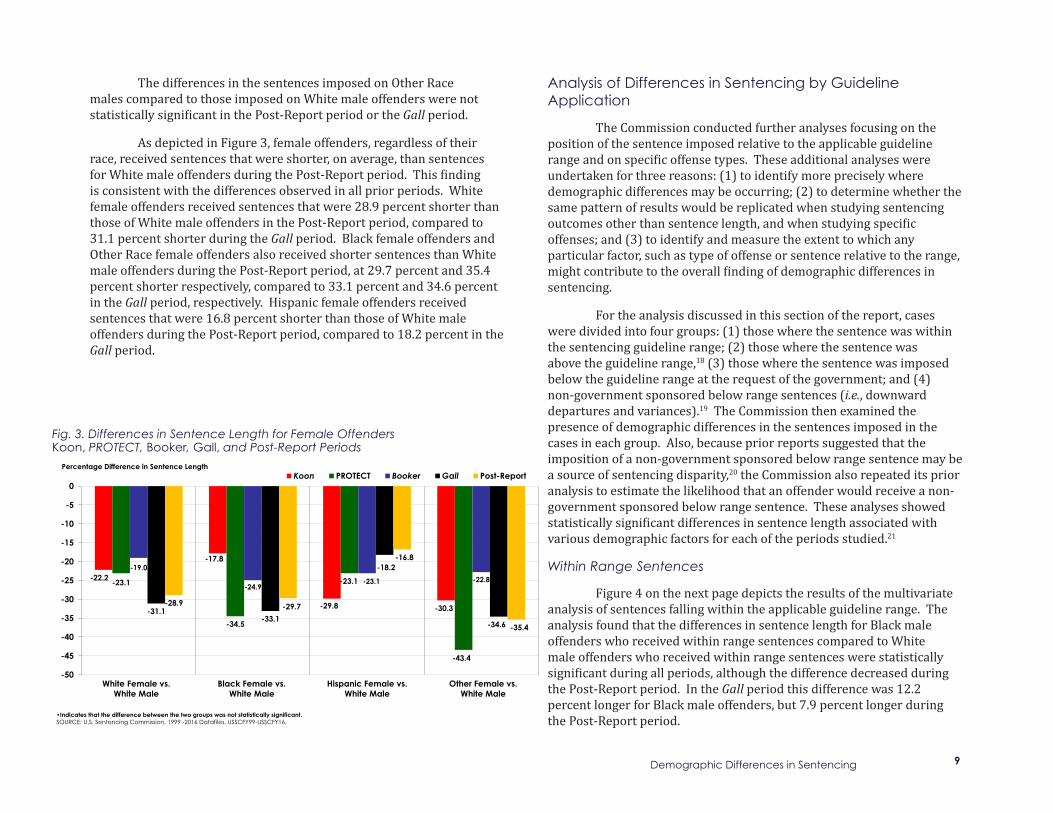
As depicted in Figure 3, female offenders, regardless of their race, received sentences that were shorter, on average, than sentences for White male offenders during the Post-Report period. This finding is consistent with the differences observed in all prior periods. White female offenders received sentences that were 28.9 percent shorter than those of White male offenders in the Post-Report period, compared to 31.1 percent shorter during the Gall period. Black female offenders and Other Race female offenders also received shorter sentences than White male offenders during the Post-Report period, at 29.7 percent and 35.4 percent shorter respectively, compared to 33.1 percent and 34.6 percent in the Gall period, respectively. Hispanic female offenders received sentences that were 16.8 percent shorter than those of White male offenders during the Post-Report period, compared to 18.2 percent in the Gall period.
Analysis of Differences in Sentencing by Guideline Application
The Commission conducted further analyses focusing on the position of the sentence imposed relative to the applicable guideline range and on specific offense types. These additional analyses were undertaken for three reasons: (1) to identify more precisely where demographic differences may be occurring; (2) to determine whether the same pattern of results would be replicated when studying sentencing outcomes other than sentence length, and when studying specific offenses; and (3) to identify and measure the extent to which any particular factor, such as type of offense or sentence relative to the range, might contribute to the overall finding of demographic differences in sentencing.
For the analysis discussed in this section of the report, cases were divided into four groups: (1) those where the sentence was within the sentencing guideline range; (2) those where the sentence was above the guideline range,18 (3) those where the sentence was imposed below the guideline range at the request of the government; and (4) non-government sponsored below range sentences (i.e., downward departures and variances).19 The Commission then examined the presence of demographic differences in the sentences imposed in the cases in each group. Also, because prior reports suggested that the imposition of a non-government sponsored below range sentence may be a source of sentencing disparity,20 the Commission also repeated its prior analysis to estimate the likelihood that an offender would receive a non-government sponsored below range sentence. These analyses showed statistically significant differences in sentence length associated with various demographic factors for each of the periods studied.21
Within Range Sentences
Figure 4 on the next page depicts the results of the multivariate analysis of sentences falling within the applicable guideline range. The analysis found that the differences in sentence length for Black male offenders who received within range sentences compared to White male offenders who received within range sentences were statistically significant during all periods, although the difference decreased during the Post-Report period. In the Gall period this difference was 12.2 percent longer for Black male offenders, but 7.9 percent longer during the Post-Report period.
Fig. 3. Differences in Sentence Length for Female Offenders Koon, PROTECT, Booker, Gall, and Post-Report Periods
-22.2
-17.8
-29.8 -30.3
-23.1
-34.5
-23.1
-43.4
-19.0
-24.9-23.1 -22.8
-31.1-33.1
-18.2
-34.6
-28.9 -29.7
-16.8
-35.4
-50
-45
-40
-35
-30
-25
-20
-15
-10
-5
0Koon PROTECT Booker Gall Post-Report
Percentage Difference in Sentence Length
White Female vs. White Male
Black Female vs. White Male
Hispanic Female vs. White Male
Other Female vs. White Male
•Indicates that the difference between the two groups was not statistically significant.SOURCE: U.S. Sentencing Commission, 1999 -2016 Datafiles, USSCFY99-USSCFY16.

Demographic Differences in Sentencing10
The differences in sentence length between Hispanic male offenders and White male offenders who received within range sentences varied over the five time periods studied, but Hispanic male offenders received shorter sentences than White male offenders during all but the Post-Report period. In the Gall period, Hispanic male offenders who received within range sentences received sentences that were 4.2 percent shorter than those of White male offenders who received within range sentences. In the Post-Report period, however, there was no statistically significant difference between the average sentences for Hispanic and White male offenders.
In the Post-Report period, Other Race male offenders received sentences that were 7.9 percent shorter than those imposed on White male offenders. There was no statistically significant difference between the sentences for these two groups in the Gall period.
Across most periods, female offenders who received within range sentences, regardless of their race, were sentenced to terms shorter than those of White male offenders who received within range sentences. For most female offenders, these differences have increased over time. In the Post-Report period, White female offenders who received within range sentences received sentences that were 24.1
percent shorter than White male offenders who received within range sentences. In the Gall period this difference was 27.3 percent. For Black females, within range sentences were 27.1 percent shorter than within range sentences for White male offenders in the Post-Report period. In the Gall period this difference was 31.5 percent.
Sentences for Hispanic female offenders followed a different pattern. The sentences for Hispanic females who received within range sentences were not statistically different from those for White male offenders during the Post-Report period. This is a change from all prior periods studied, where Hispanic female within range sentences were lower than those for White male offenders. For example, in the Gall period, Hispanic female offenders sentenced within the guideline range had sentences that were 5.5 percent shorter than the within range sentences for White male offenders.
The differences in sentence length between Other Race female offenders who received within range sentences and White male offenders have decreased slightly in the recent period studied. In the Gall period, that difference was 40.2 percent, the largest percentage difference for all race/gender pairs for all time periods studied, but decreased to 37.2 percent during the Post-Report period.
Fig. 4. Differences in Within Range Sentences for Male Offenders Koon, PROTECT, Booker, Gall, and Post-Report Periods
3.8
-5.7
*
3.5
-8.1
*
6.6
-8.3
-4.4
12.2
-4.2
*
7.9
*
-7.9-10
-5
0
5
10
15 Koon PROTECT Booker Gall Post-ReportPercentage Difference in Sentence Length
Black Male vs. White Male Hispanic Male vs. White Male Other Male vs. White Male
•Indicates that the difference between the two groups was not statistically significant. SOURCE: U.S. Sentencing Commission, 1999 -2016 Datafiles, USSCFY99-USSCFY16.
-14.2 -13.5 -11.9
-24.3
-15.9
-29.7
-13.6
-20.8-17.2
-24.1
-12.1
-25.0-27.3
-31.5
-5.5
-40.2
-24.1-27.1
*
-37.2
-45
-40
-35
-30
-25
-20
-15
-10
-5
0Koon PROTECT Booker Gall Post-Report
Percentage Difference in Sentence Length
White Female vs. White Male
Black Female vs. White Male
Hispanic Female vs. White Male
Other Female vs. White Male
•Indicates that the difference between the two groups was not statistically significant.SOURCE: U.S. Sentencing Commission, 1999 -2016 Datafiles, USSCFY99-USSCFY16.
Fig. 5. Differences in Within Range Sentences for Female Offenders Koon, PROTECT, Booker, Gall, and Post-Report Periods

Demographic Differences in Sentencing 11
Below Range Sentences
Substantial Assistance Departure Sentences
The Commission also examined cases in which the sentence imposed was below the applicable guideline range to determine whether demographic differences were present. These “below range” sentences can occur for different considerations. For statistical purposes, the Commission groups below range sentences into two broad categories—those sponsored by the government and those not sponsored by the government.22 Government sponsored below range sentences are further subdivided.23 Each will be addressed in turn.
Figure 6 presents the results of the analysis of below range sentences based on substantial assistance departures. During the Koon period, Black male offenders who received substantial assistance departures received sentences 19.2 percent longer than White male offenders who received such departures. However, there were no statistically significant differences between the sentences of Black and White male offenders who received substantial assistance departures during any later period, including the Post-Report period.
There were also no statistically significant differences between White male and Hispanic male offenders who received substantial assistance departures during any period. Similarly, in only one period did Other Race male offenders have a statistically significant difference from White male offenders. During the Booker period Other Race males received sentences that were 24.4 percent longer than those for White males.
Female offenders of all races who received substantial assistance departures generally received shorter sentences than White male offenders who received substantial assistance departures. During the Post-Report period, the sentence length for White female offenders who received substantial assistance departures was 26.0 percent shorter than that for White male offenders who received substantial assistance departures. The difference was a slight decrease from the 27.4 percent difference during the Gall period.
Black female offenders who received substantial assistance departures also received shorter sentences than White male offenders who received substantial assistance departures. During the Post-Report period, Black female offenders who received substantial assistance
19.2
* ** * ** *
24.4
* * ** * *0
5
10
15
20
25Koon PROTECT Booker Gall Post-Report
Percentage Difference in Sentence Length
Black Male vs. White Male Hispanic Male vs. White Male Other Male vs. White Male
•Indicates that the difference between the two groups was not statistically significant. SOURCE: U.S. Sentencing Commission, 1999 -2016 Datafiles, USSCFY99-USSCFY16.
Fig. 6. Differences in Substantial Assistance Departure Sentences for Male Offenders Koon, PROTECT, Booker, Gall, and Post-Report Periods
-31.5 -29.0
-41.7-38.9
-35.5
-45.1
-35.9
-74.0
-20.5-27.7
-29.1
*
-27.4-31.6
-35.6
-26.4-26.0
-21.1-25.5
*
-80
-70
-60
-50
-40
-30
-20
-10
0Koon PROTECT Booker Gall Post-Report
Percentage Difference in Sentence Length
White Female vs. White Male
Black Female vs. White Male
Hispanic Female vs. White Male
Other Female vs. White Male
•Indicates that the difference between the two groups was not statistically significant. SOURCE: U.S. Sentencing Commission, 1999 -2016 Datafiles, USSCFY99-USSCFY16.
Fig. 7. Differences in Substantial Assistance Departure Sentences for Female Offenders Koon, PROTECT, Booker, Gall, and Post-Report Periods

Demographic Differences in Sentencing12
departures received sentences that were 21.1 percent shorter than those for White male offenders who received substantial assistance departures. However, this was a decrease from the 31.6 percent difference observed in the Gall period.
Sentences for Hispanic female offenders who received substantial assistance departures followed a somewhat similar pattern. In the Post-Report period, sentences for Hispanic female offenders who received a substantial assistance departure were 25.5 percent shorter than those for White male offenders who received a substantial assistance departure. In the Gall period this difference was 35.6 percent.
The differences in sentence lengths between Other Race female offenders and White male offenders who received a substantial assistance departure have varied over all five time periods studied.24 In the Gall period this difference was 26.4 percent, however, in the Post-Report period no statistically significant difference was observed.
Other Government Sponsored Below Range Sentences
Figure 8 presents the findings of the Commission’s multivariate analysis of government sponsored below range sentences for reasons other than the offender’s substantial assistance.25 Cases from the Koon period were excluded from this analysis because the Commission did not collect data during that period in a manner that would indicate whether a sentence below the guideline range for reasons other than substantial assistance was initiated by the government or the court.
The analysis found that the differences in sentence length were statistically significant during some periods. During the Post-Report period, sentence lengths for Black males who received an other government sponsored below range sentence were 28.7 percent longer than those for White males who received other government sponsored below range sentences. However, no statistically significant difference was noted during the Gall period. There were no statistically significant differences between the sentence lengths of Other Race male offenders who received an other government sponsored below range sentence and White male offenders except during the Post-Report period, where Other Race male offenders received sentences that were 17.6 percent longer than those for White males.
* * *
22.8
29.8
**
23.6
*
28.7
25.9
17.6
0
5
10
15
20
25
30
35PROTECT Booker Gall Post-Report
Percentage Difference in Sentence Length
Black Male vs. White Male
Hispanic Male vs. White Male
Other Male vs. White Male
•Indicates that the difference between the two groups was not statistically significant. SOURCE: U.S. Sentencing Commission, 2003 -2016 Datafiles, USSCFY03-USSCFY16.
Fig. 8. Differences in Other Gov’t Sponsored Below Range Sentences for Male Offenders PROTECT, Booker, Gall, and Post-Report Periods
-48.8
*
-27.3
-64.3
-32.3
* *
-46.4-41.4
-48.2
* *
-26.0
*
-28.7
-38.6
-70
-60
-50
-40
-30
-20
-10
0
PROTECT Booker Gall Post-ReportPercentage Difference in Sentence Length
•Indicates that the difference between the two groups was not statistically significant. SOURCE: U.S. Sentencing Commission, 2003 -2016 Datafiles, USSCFY03-USSCFY16.
White Female vs. White Male
Black Female vs. White Male
Hispanic Female vs. White Male
Other Female vs. White Male
Fig. 9. Differences in Other Gov’t Sponsored Below Range Sentences for Female Offenders PROTECT, Booker, Gall, and Post-Report Periods

Demographic Differences in Sentencing 13
The differences in sentence length between Hispanic male offenders and White male offenders who received an other government sponsored below range sentence were statistically significant during three periods. In the Post-Report period, Hispanic male offenders who received an other government sponsored below range sentence received sentences that were 25.9 percent longer than those for White male offenders who received an other government sponsored below range sentence. During the Gall period, the difference was 23.6 percent.
For the periods in which there were statistically significant differences, female offenders of all races who received an other government sponsored below range sentence were sentenced to shorter terms than White male offenders. In the Post-Report period, the sentences of White female offenders who received an other government sponsored below range sentence were 26.0 percent shorter than those of White males who received an other government sponsored below range sentence. The difference was a decrease from 41.4 percent during the Gall period.
The sentences of Black female offenders who received an other government sponsored below range sentence were 48.2 percent shorter than those of White male offenders who received an other government sponsored below range sentence during the Gall period, the only period in which there were statistically significant differences. There was no statistically significant difference between the two groups in the Post-Report period.
Other Race female offenders who received an other government sponsored below range sentence in the Post-Report period received sentences that were 38.6 percent shorter than those for White male offenders who received an other government sponsored below range sentence. Although similar differences were noted in earlier periods, no statistically significant difference was observed during the Gall period.
Sentences for Hispanic female offenders who received an other government sponsored below range sentence were 28.7 percent shorter in the Post-Report period. There were no statistically significant differences between the sentences of Hispanic female offenders who received an other government sponsored below range sentence and White male offenders who received an other government sponsored below range sentence during the Gall period.
Non-Government Sponsored Below Range Sentences
Figure 10 depicts the results of the Commission’s multivariate analysis of non-government sponsored below range sentences, i.e., downward departures and variances resulting in sentences below the guideline range for any reason not initiated by the government. Only four time periods are included in this multivariate analysis: the PROTECT Act, Booker, Gall, and Post-Report periods.26
The analysis found that in the Post-Report period, Black male offenders who received a non-government sponsored below range sentence received sentences that were 16.8 percent longer than those for White male offenders who received that type of sentence. The only other period in which such a difference was noted was the Booker period, where the difference was 12.3 percent. There were no statistically significant differences between the two groups in the other two periods.
Similarly, the differences in sentence length between Hispanic male offenders and White male offenders who received a non-government sponsored below range sentence were statistically significant in only two periods. In the Gall period, Hispanic male offenders who received a non-government sponsored below range
Fig. 10. Differences in Non-Gov’t Sponsored Below Range Sentences for Male Offenders PROTECT, Booker, Gall, and Post-Report Periods
* * *
12.3
* **
9.3
*
16.8
10.6
*0
5
10
15
20PROTECT Booker Gall Post-Report
Percentage Difference in Sentence Length
Black Male vs. White Male Hispanic Male vs. White Male Other Male vs. White Male
•Indicates that the difference between the two groups was not statistically significant. SOURCE: U.S. Sentencing Commission, 2003 -2016 Datafiles, USSCFY03-USSCFY16.
Demographic Differences in Sentencing14
sentence received sentences 9.3 percent longer than those for White male offenders who received that type of sentence. In the Post-Report period the difference was 10.6 percent. There were no statistically significant differences between the sentences imposed on Other Race male offenders and White male offenders who received a non-government sponsored below range sentence in any period.
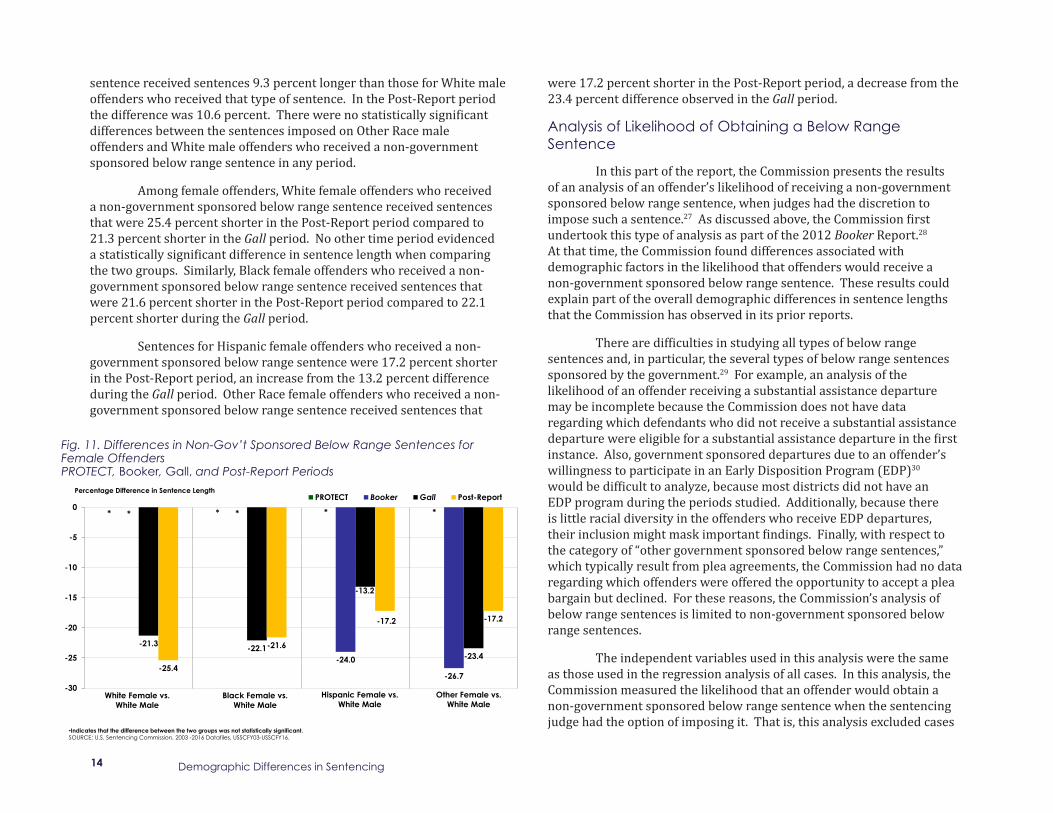
Among female offenders, White female offenders who received a non-government sponsored below range sentence received sentences that were 25.4 percent shorter in the Post-Report period compared to 21.3 percent shorter in the Gall period. No other time period evidenced a statistically significant difference in sentence length when comparing the two groups. Similarly, Black female offenders who received a non-government sponsored below range sentence received sentences that were 21.6 percent shorter in the Post-Report period compared to 22.1 percent shorter during the Gall period.
Sentences for Hispanic female offenders who received a non-government sponsored below range sentence were 17.2 percent shorter in the Post-Report period, an increase from the 13.2 percent difference during the Gall period. Other Race female offenders who received a non-government sponsored below range sentence received sentences that
* * * ** *
-24.0
-26.7
-21.3 -22.1
-13.2
-23.4-25.4
-21.6
-17.2 -17.2
-30
-25
-20
-15
-10
-5
0PROTECT Booker Gall Post-Report
Percentage Difference in Sentence Length
White Female vs. White Male
Black Female vs. White Male
Hispanic Female vs. White Male
Other Female vs. White Male
•Indicates that the difference between the two groups was not statistically significant. SOURCE: U.S. Sentencing Commission, 2003 -2016 Datafiles, USSCFY03-USSCFY16.
Fig. 11. Differences in Non-Gov’t Sponsored Below Range Sentences for Female Offenders PROTECT, Booker, Gall, and Post-Report Periods
were 17.2 percent shorter in the Post-Report period, a decrease from the 23.4 percent difference observed in the Gall period.
Analysis of Likelihood of Obtaining a Below Range Sentence
In this part of the report, the Commission presents the results of an analysis of an offender’s likelihood of receiving a non-government sponsored below range sentence, when judges had the discretion to impose such a sentence.27 As discussed above, the Commission first undertook this type of analysis as part of the 2012 Booker Report.28 At that time, the Commission found differences associated with demographic factors in the likelihood that offenders would receive a non-government sponsored below range sentence. These results could explain part of the overall demographic differences in sentence lengths that the Commission has observed in its prior reports.
There are difficulties in studying all types of below range sentences and, in particular, the several types of below range sentences sponsored by the government.29 For example, an analysis of the likelihood of an offender receiving a substantial assistance departure may be incomplete because the Commission does not have data regarding which defendants who did not receive a substantial assistance departure were eligible for a substantial assistance departure in the first instance. Also, government sponsored departures due to an offender’s willingness to participate in an Early Disposition Program (EDP)30 would be difficult to analyze, because most districts did not have an EDP program during the periods studied. Additionally, because there is little racial diversity in the offenders who receive EDP departures, their inclusion might mask important findings. Finally, with respect to the category of “other government sponsored below range sentences,” which typically result from plea agreements, the Commission had no data regarding which offenders were offered the opportunity to accept a plea bargain but declined. For these reasons, the Commission’s analysis of below range sentences is limited to non-government sponsored below range sentences.
The independent variables used in this analysis were the same as those used in the regression analysis of all cases. In this analysis, the Commission measured the likelihood that an offender would obtain a non-government sponsored below range sentence when the sentencing judge had the option of imposing it. That is, this analysis excluded cases
Demographic Differences in Sentencing 15
in which a below range sentence was not possible, such as when the sentencing guideline range included an applicable statutory mandatory minimum penalty, or in cases where some aspect of the sentencing was otherwise outside the court’s discretion, such as when the court accepts a binding plea agreement. The Koon period was not included in this analysis.31
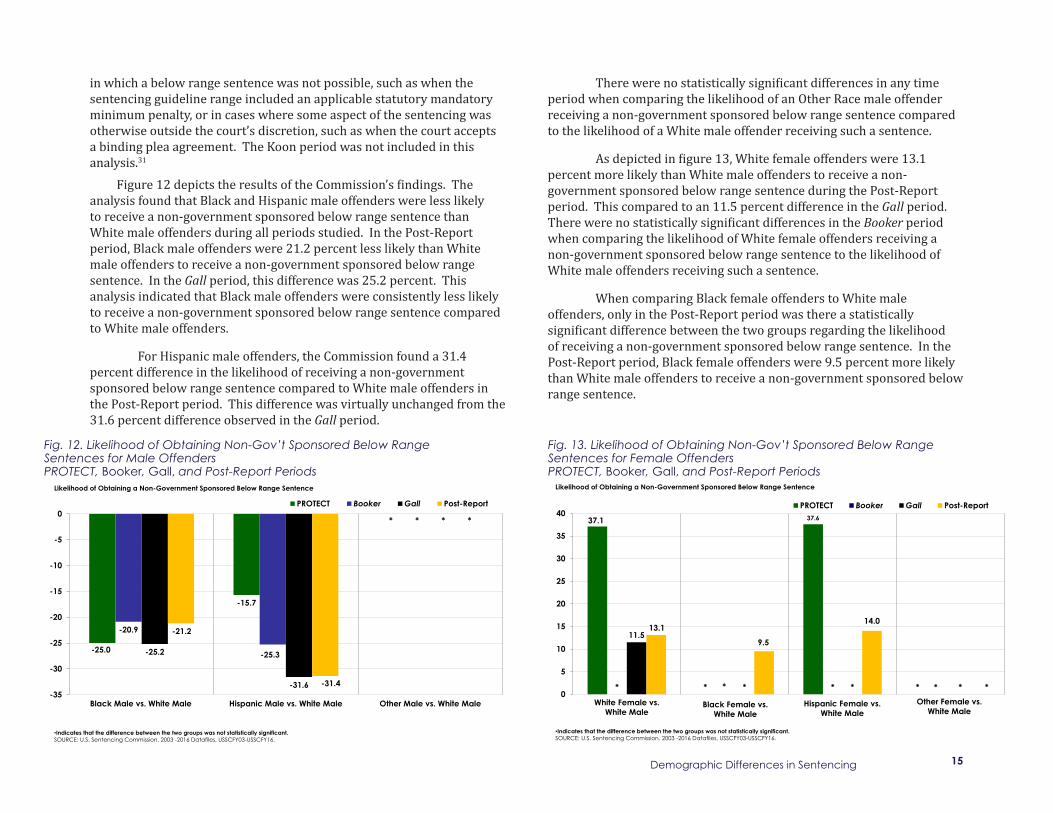
Figure 12 depicts the results of the Commission’s findings. The analysis found that Black and Hispanic male offenders were less likely to receive a non-government sponsored below range sentence than White male offenders during all periods studied. In the Post-Report period, Black male offenders were 21.2 percent less likely than White male offenders to receive a non-government sponsored below range sentence. In the Gall period, this difference was 25.2 percent. This analysis indicated that Black male offenders were consistently less likely to receive a non-government sponsored below range sentence compared to White male offenders.
For Hispanic male offenders, the Commission found a 31.4 percent difference in the likelihood of receiving a non-government sponsored below range sentence compared to White male offenders in the Post-Report period. This difference was virtually unchanged from the 31.6 percent difference observed in the Gall period.
There were no statistically significant differences in any time period when comparing the likelihood of an Other Race male offender receiving a non-government sponsored below range sentence compared to the likelihood of a White male offender receiving such a sentence.
As depicted in figure 13, White female offenders were 13.1 percent more likely than White male offenders to receive a non-government sponsored below range sentence during the Post-Report period. This compared to an 11.5 percent difference in the Gall period. There were no statistically significant differences in the Booker period when comparing the likelihood of White female offenders receiving a non-government sponsored below range sentence to the likelihood of White male offenders receiving such a sentence.
When comparing Black female offenders to White male offenders, only in the Post-Report period was there a statistically significant difference between the two groups regarding the likelihood of receiving a non-government sponsored below range sentence. In the Post-Report period, Black female offenders were 9.5 percent more likely than White male offenders to receive a non-government sponsored below range sentence.
Fig. 12. Likelihood of Obtaining Non-Gov’t Sponsored Below Range Sentences for Male Offenders PROTECT, Booker, Gall, and Post-Report Periods
-25.0
-15.7
*
-20.9
-25.3
*
-25.2
-31.6
*
-21.2
-31.4
*
-35
-30
-25
-20
-15
-10
-5
0PROTECT Booker Gall Post-Report
Likelihood of Obtaining a Non-Government Sponsored Below Range Sentence
Black Male vs. White Male Hispanic Male vs. White Male Other Male vs. White Male
•Indicates that the difference between the two groups was not statistically significant. SOURCE: U.S. Sentencing Commission, 2003 -2016 Datafiles, USSCFY03-USSCFY16.
Fig. 13. Likelihood of Obtaining Non-Gov’t Sponsored Below Range Sentences for Female Offenders PROTECT, Booker, Gall, and Post-Report Periods
37.1
*
37.6
** * * *
11.5
* * *
13.1
9.5
14.0
*0
5
10
15
20
25
30
35
40PROTECT Booker Gall Post-Report
White Female vs. White Male
Black Female vs. White Male
Hispanic Female vs. White Male
Other Female vs. White Male
•Indicates that the difference between the two groups was not statistically significant.SOURCE: U.S. Sentencing Commission, 2003 -2016 Datafiles, USSCFY03-USSCFY16.
Likelihood of Obtaining a Non-Government Sponsored Below Range Sentence

Demographic Differences in Sentencing16
The likelihood of Hispanic females receiving a non-government sponsored below range sentence was 14.0 percent higher in the Post-Report period. There was no statistically significant difference between the two groups during the Gall period or the Booker period, although there was a 37.6 percent higher likelihood than that of White male offenders during the PROTECT Act period.
The Effect of Adding Data on Prior Violence as a Factor in the Model
As discussed above, the Commission’s 2012 Booker Report and its 2010 Booker Multivariate Analysis noted that judges make sentencing decisions based on many legal factors and other legitimate considerations, and that data regarding some of these considerations was not included in the Commission’s regression analyses because it was not readily available.32 One specific example concerned information about violence in an offender’s criminal history. As the Commission explained in 2010:
[A] judge sentencing two offenders convicted of similar crimes with the same criminal history score under the federal sentencing guidelines might impose a longer sentence on the offender with a more violent criminal past than on the offender with a less violent, or non-violent, criminal history. Similarly, a judge sentencing two offenders convicted of similar crimes might be influenced by the presence of violence in one case that was not present in the other case and was not reflected in the final offense level for those cases as determined under the sentencing guidelines.33
To address this issue, the Commission examined cases in which the offender was sentenced in fiscal year 2016 and collected information about the types of prior offenses for which the offender had been sentenced, including both federal and state crimes.34 Using this data, the Commission determined whether the offender had ever committed a violent offense.35 This data was then included in the Commission’s regression analysis to assess whether adding the data had any effect on the demographic differences in sentencing that had been observed.
Because the data regarding violent offenses was available only for offenders sentenced in fiscal year 2016, the Commission’s analysis had to be limited to cases from that fiscal year. Also, in order to
determine whether adding the data regarding violence had any effect on the analysis, the Commission first performed an analysis of cases from fiscal year 2016 without the additional data involving violence. Then the analysis was replicated, with data concerning prior violence added into the analysis. The two results were then compared.
Figure 14 shows the results of those analyses. Examining only cases from fiscal year 2016, the Commission found a 20.7 percent difference in the sentence length for Black male offenders compared to White male offenders, and a 9.4 percent difference between Hispanic male offenders and White male offenders. Any difference between the sentences for Other Race male offenders and White male offenders was not statistically significant.
In order to determine whether adding the additional data regarding violence had any effect on the analysis, the Commission then replicated the analysis using the data on offenders’ violent criminal history. To do this, the Commission added an independent variable in the model to control for that fact. Through this technique, the Commission was able to assess the effect of data about violence in the criminal history not only on the demographic differences in sentencing but on the overall model itself.
20.7
9.4
*
20.4
9.7
*0
5
10
15
20
25 2016 2016 - Violence CH Variable
Percentage Difference in Sentence Length
Black Male vs. White Male Hispanic Male vs. White Male Other Male vs. White Male
•Indicates that the difference between the two groups was not statistically significant. SOURCE: U.S. Sentencing Commission, 2016 Datafile, USSCFY16.
Fig. 14. Differences in Sentence Length Accounting for Prior Violence for Male Offenders Fiscal Year 2016

Demographic Differences in Sentencing 17
As can be seen in figures 14 and 15, the addition of the variable indicating a prior conviction for a violent offense had almost no effect on the contribution of race and gender to the sentence of the offender after controlling for all other factors. For example, after controlling for violence in the offenders’ criminal history, the difference in sentence length between Black male offenders and White male offenders was 20.4 percent, a difference of only 0.3 percentage points from the results found without the additional data. The difference in sentence length between Hispanic male offenders and White male offenders also changed only slightly, from 9.4 percent to 9.7 percent. Similarly, the difference in average sentence between the remaining offender groups was virtually identical to what it was without the additional data included in the analysis.
Also, the Commission found that the effect of the data about violent criminal history on the sentences imposed was, in itself, not statistically significant. That is, violence in an offender’s past did not have any independent effect on the sentence imposed over and above the effect of the other variables measured. As discussed more fully in the 2010 Booker Multivariate Analysis, interpreting regression analysis results depends on several factors. One primary factor is the “significance test,” which asks whether the results of the analysis for each
independent variable are “statistically significant.” Statistical significance is a determination of the probability that the measured relationship between an independent variable and the dependent variable is the result of random chance (i.e., that the measured relationship does not, in fact, reflect a true association).36 The Commission found that the prior violence variable itself had no statistically significant effect on the dependent variable (i.e., sentence length).37 That is, it cannot be said that violence in an offender’s past has any true association with the sentence imposed.
A second factor helpful in assessing the results of regression analysis is the R2 (or “r-squared”). This is a numerical measure of the extent to which the results of a regression analysis account for all the variation in the data used in the analysis. Put another way, it is a representation of the “degree of fit” between the regression results and the particular data being analyzed. A high R2 means that much of the variation in the dependent variable has been accounted for by the independent variables in the model whereas a low R2 indicates that there are one or more variables missing from the model that affect the dependent variable, or the variables selected have little to no association with the independent variables.38
In theory, the addition of data about a factor that has an effect on a phenomenon being studied should increase the R2 of a regression analysis. If additional data does not increase the R2, then the researcher can conclude that the factor does not help explain the phenomenon being studied; that is, it has no actual effect on the outcome. The inclusion of the prior violence data in the Commission’s regression analysis had no effect in the overall R2 of the model.39 Based on this, the Commission concludes that violence in an offender’s criminal history has no effect on the sentence imposed over and above the contribution that the sentence imposed for the crime in which the violent act occurred has on the offender’s criminal history score.40
Limitations of Regression Analysis
In its prior reports,41 the Commission noted that results from its analyses should be taken with caution. Although regression analysis is a tool commonly used by social scientists, as well as in a variety of legal contexts, to examine the relationship between multiple factors, 42 it has limitations. In particular, one or more key factors that could affect the analysis may have been omitted from the methodologies used because a particular factor is unknown, or because data about it is not readily available.
Fig. 15. Differences in Sentence Length Accounting for Prior Violence for Female Offenders Fiscal Year 2016
-27.2 -26.4
*
-37.7
-27.0 -26.4
*
-37.5-40
-35
-30
-25
-20
-15
-10
-5
02016 2016 - Violence CH Variable
Percentage Difference in Sentence Length
White Female vs. White Male
Black Female vs. White Male
Hispanic Female vs. White Male
Other Female vs. White Male
•Indicates that the difference between the two groups was not statistically significant. SOURCE: U.S. Sentencing Commission, 2016 Datafile, USSCFY16.

Demographic Differences in Sentencing18
For example, judges may consider potentially relevant information available to them in a presentence report, such as an offender’s employment history or family circumstances. However, the Commission does not routinely extract this information from the sentencing documents it receives and, therefore, data about those factors are not controlled for in this analysis. Additionally, judges may make decisions about sentencing offenders based on other legitimate considerations that cannot be measured.
Because multivariate regression analysis cannot control for all of the factors that judges may consider, the results of the analyses presented in this report should be interpreted with caution and should not be taken to suggest discrimination on the part of judges. Multivariate analysis cannot explain why the observed differences in sentencing outcomes exist, but only that they do exist.

Section III
Conclusion

Demographic Differences in Sentencing20
Conclusion In this report, the Commission has provided an update to its
prior reports on demographic differences in sentencing. The Commission found that sentence length continues to be associated with some demographic factors, in particular race and gender. After controlling for a wide variety of sentencing factors, the Commission found that Black male offenders continued to receive longer sentences than similarly situated White male offenders, and that female offenders of all races received shorter sentences than White male offenders.
Non-government sponsored departures and variances appear to contribute significantly to the difference in sentence length between Black male and White male offenders. Black male offenders were less likely than White male offenders to receive a non-government sponsored downward departure or variance during the most recent period studied. Further, even when Black male offenders received a non-government sponsored departure or variance, their sentences were longer than White male offenders who received a non-government sponsored departure or variance.
The Commission also found that prior violent crimes, as documented in an offender’s criminal history, do not significantly contribute to demographic differences in federal sentencing. An offender’s past criminal violence is not a statistically significant predictor of the sentence imposed for a federal offense to any extent beyond the contribution it makes to the offender’s final sentence imposed through operation of the criminal history score under the sentencing guidelines.

Appendices

Demographic Differences in Sentencing22
Appendix A: Analysis of Other Demographic FactorsResults of Demographic Multivariate Regression Analysis for All Cases
As discussed in the body of this report, the Commission’s multivariate regression analysis for all cases, updated through fiscal year 2016, continues to demonstrate that some demographic factors are associated with sentence length to a statistically significant extent during the periods studied. In this appendix, the Commission will focus on the demographic factors of citizenship, education, and age of the offender. Again, the analysis will focus primarily on the most recent period studied—the Post-Report period—as compared to the immediately preceding period, the Gall period; however, the results for all periods are presented in the figures that accompany this discussion.43
Figure 16 depicts differences in sentence length associated with the demographic factors of citizenship, education, and age for all cases. Non-citizen offenders received sentences that were 5.0 percent longer than those for United States citizens during the Post-Report period, although this difference was lower than observed in any of the prior periods studied. During the Gall period the difference was 10.4 percent longer than those of United States citizens.
The differences in sentences for offenders with at least some college education compared to offenders with no college education was not statistically significant in the Post-Report period, although those differences had been statistically significant in prior periods. During the Gall period, offenders with at least some college education received sentences that were 4.6 percent shorter than those of offenders with no college education.
Finally, offenders over the age of 25 had slightly longer sentences than those 25 years of age or younger, with a difference of 2.9 percent in the Post-Report period. The differences between the sentences for these two groups was 2.5 percent in the Gall period.
Analysis of Differences in Sentencing by Guideline Application
The Commission conducted further analyses focusing on the position of the sentence imposed relative to the applicable guideline range and on specific offense types. These additional analyses were undertaken for three reasons: (1) to identify more precisely where demographic differences may be occurring; (2) to determine whether the same pattern of results would be replicated when studying sentencing outcomes other than sentence length, and when studying specific offenses; and (3) to identify and measure the extent to which any particular factor, such as type of offense or sentence relative to the range, might contribute to the overall finding of demographic differences in sentencing.
For this analysis, cases were divided into four groups: (1) those where the sentence was within the sentencing guideline range; (2) those where the sentence was above the guideline range;44 (3) those where the sentence was imposed below the guideline range at the request of the government; and (4) all other below range sentences.45
7.4
-7.8
3.6
*
-3.9
*
8.5
-5.4
3.1
10.4
-4.6
2.5
5.0
*
2.9
-10
-5
0
5
10
15Koon PROTECT Booker Gall Post-Report
Percentage Difference in Sentence Length
Non-U.S. Citizen vs.U.S. Citizen
Any College vs.No College
Over 25 Years of Age vs.25 Years of Age or Younger
•Indicates that the difference between the two groups was not statistically significant. SOURCE: U.S. Sentencing Commission, 1999 -2016 Datafiles, USSCFY99-USSCFY16.
Fig. 16. Differences in Sentence Length in All Cases by Demographic Factors Koon, PROTECT, Booker, Gall, and Post-Report Periods

Demographic Differences in Sentencing 23
Within Range Sentences
Figure 17 depicts the results of the multivariate analysis regarding citizenship, education, and age for within range sentences. During the Koon period, non-citizen offenders sentenced within the guideline range received sentences that were 5.5 percent shorter than those for United States citizens sentenced within the range. However, in the four periods afterward, the within range sentences for non-citizens were longer than those for United States citizens. This difference was 7.0 percent in the Gall period, and 6.3 percent in the Post-Report period.
The Commission’s prior analysis found no statistically significant differences in the sentence length of offenders who had attended college and received within range sentences compared to offenders who had not attended college and received within range sentences. However, in the Post-Report period, the Commission found that those who attended college received sentences that were 1.9 percent longer than offenders who did not attend college.
Similarly, the Commission’s prior analysis found no statistically significant differences in the sentence length for offenders over the age of 25 who received within range sentences compared with the within range
sentences for offenders 25 years of age or younger. In the Post-Report period, however, the Commission found a 2.8 percent decrease in the within range sentences of those who were over 25 years of age compared to those who were 25 years of age and younger.
Below Range Sentences
Substantial Assistance Departure Sentences
The Commission also examined cases in which the sentence imposed was below the applicable guideline range to determine whether demographic differences were present. These “below range” sentences can occur for different considerations. For statistical purposes, the Commission groups below range sentences into two broad categories—those sponsored by the government and those not sponsored by the government.46 Government sponsored below range sentences are further subdivided.47 Each will be addressed in turn.
Figure 18 depicts the findings of the analysis regarding citizenship, education, and age for cases in which there was a substantial assistance departure. There were no statistically significant differences between the sentence lengths of non-citizen offenders compared to
Fig. 17. Differences in Within Range Sentences by Demographic Factors Koon, PROTECT, Booker, Gall, and Post-Report Periods
Fig. 18. Differences in Substantial Assistance Departure Sentences by Demographic Factors Koon, PROTECT, Booker, Gall, and Post-Report Periods
-5.5
**
6.0
**
9.7
**
7.0
**
6.3
1.9
-2.8
-10
-5
0
5
10
15Koon PROTECT Booker Gall Post-Report
Percentage Difference in Sentence Length
•Indicates that the difference between the two groups was not statistically significant. SOURCE: U.S. Sentencing Commission, 1999 -2016 Datafiles, USSCFY99-USSCFY16.
Non-U.S. Citizen vs.U.S. Citizen
Any College vs.No College
Over 25 Years of Age vs.25 Years of Age or Younger
*
-18.2
** * **
-14.0
-8.4
*
-14.3
-11.8
*
-10.5
-12.5
-20
-18
-16
-14
-12
-10
-8
-6
-4
-2
0Koon PROTECT Booker Gall Post-Report
Percentage Difference in Sentence Length
•Indicates that the difference between the two groups was not statistically significant. SOURCE: U.S. Sentencing Commission, 1999 -2016 Datafiles, USSCFY99-USSCFY16.
Non-U.S. Citizen vs.U.S. Citizen
Any College vs.No College
Over 25 Years of Age vs.25 Years of Age or Younger

Demographic Differences in Sentencing24
sentence lengths of United States citizens who received substantial assistance departures in any period.
The differences in sentences for offenders with some college education who received substantial assistance departures compared to offenders with no college education who received substantial assistance departures were statistically significant in all but one time period. In the Post-Report period, offenders with any college education who received substantial assistance departures received sentences that were 10.5 percent shorter than offenders with no college education who received such departures. During the Gall period this difference was 14.3 percent.
The differences between sentences of offenders over the age of 25 who received a substantial assistance departure compared with those 25 years of age or younger who received such a departure were statistically significant in only the last three time periods. In the Post-Report period, offenders over the age of 25 who received a substantial assistance departure received sentences 12.5 percent shorter than offenders who were 25 years of age or younger who received a substantial assistance departure, a slight increase from the 11.8 percent difference in the Gall period.
Other Government Sponsored Below Range Sentences
Figure 19 presents the findings of the Commission’s multivariate analysis of government sponsored below range sentences for reasons other than the offender’s substantial assistance.48 Cases from the Koon period were excluded from this analysis because the Commission did not collect data during that period in a manner that would indicate whether a sentence below the guideline range for reasons other than substantial assistance was initiated by the government or the court.
Figure 19 shows the Commission’s findings of the multivariate analysis as to citizenship, education, and age specific to other government sponsored below range sentences. In the Gall period, the sentence for non-citizen offenders was 19.2 percent longer than those for U.S. citizen offenders. This difference increased to 27.7 percent in the Post-Report period.
There was no statistically significant difference in sentence length between offenders with at least some college education compared to offenders with no college education who received an other government sponsored below range sentence in any period. In the Gall period, offenders over the age of 25 who received an other government sponsored below range sentence received sentences 18.5 percent shorter than offenders who were 25 years of age or younger and received an other government sponsored below range sentence. In the Post-Report period this difference was 10.1 percent.
Non-Government Sponsored Below Range Sentences
Figure 20 on the next page depicts the results of the Commission’s multivariate analysis of non-government sponsored below range sentences, i.e., those sentences falling below the guideline range for any reason not initiated by the government. Only four time periods are included in this multivariate analysis: the PROTECT Act, Booker, Gall, and Post-Report periods.49
The Commission’s findings regarding citizenship, education, and age for non-government sponsored below range sentences are depicted in Figure 20. During the Post-Report period, the sentences for non-citizens who received a non-government sponsored below range sentence were 24.3 percent longer than those for United States citizens who received a non-government sponsored below range sentence. In the Gall period, that difference was 25.2 percent. There were no statistically
* **
22.9
*
-15.2
19.2
*
-18.5
27.7
*
-10.1
-20
-10
0
10
20
30PROTECT Booker Gall Post-Report
Percentage Difference in Sentence Length
•Indicates that the difference between the two groups was not statistically significant.SOURCE: U.S. Sentencing Commission, 2003 -2016 Datafiles, USSCFY03-USSCFY16.
Non-U.S. Citizen vs.U.S. Citizen
Any College vs.No College
Over 25 Years of Age vs.25 Years of Age or Younger
Fig. 19. Differences in Other Gov’t Sponsored Below Range Sentences by Demographic Factors PROTECT, Booker, Gall, and Post-Report Periods

Demographic Differences in Sentencing 25
significant differences in sentence length between these two groups in the PROTECT Act period.
Only in the Post-Report period was there a statistically significant difference found in sentence length between offenders with at least some college education who received a non-government sponsored below range sentence and offenders with no college education who received that type of sentence. Offenders who attended college received sentences 7.0 percent higher than those who did not attend in the Post-Report period. In all prior periods, no statistically significant differences in non-government sponsored below range sentences were observed.
The differences between sentences of offenders over the age of 25 who received a non-government sponsored below range sentence and those 25 years of age or younger who received a non-government sponsored below range sentence were not statistically significant in the Post-Report period. In the Gall period the difference was 8.4 percent.
Analysis of Likelihood of Obtaining a Below Range Sentence
In this part of the Appendix, the Commission presents the results of an analysis of an offender’s likelihood of receiving a non-government sponsored below range sentence, when judges had the discretion to impose such a sentence, and any association with the demographic factors of citizenship, education, and age.50
As depicted in Figure 21, during the Post-Report period, non-citizen offenders had a 20.4 percent higher likelihood of receiving a non-government sponsored below range sentence than United States citizen offenders. The difference was an increase from the 11.2 percent difference observed during the Gall period.
In the Post-Report period, offenders with at least some college education were 22.5 percent more likely to receive a non-government sponsored below range sentence than offenders with no college education. The difference was 23.7 percent in the Gall period.
The differences between sentences of offenders over the age of 25 compared with those 25 years of age or younger were statistically
20.718.1
14.1
18.2
22.1
7.5
11.2
23.7
*
20.422.5
-3.7
-10
-5
0
5
10
15
20
25PROTECT Booker Gall Post-Report
•Indicates that the difference between the two groups was not statistically significant. SOURCE: U.S. Sentencing Commission, 2003 -2016 Datafiles, USSCFY03-USSCFY16.
Likelihood of Obtaining a Non-Government Sponsored Below Range Sentence
Non-U.S. Citizen vs.U.S. Citizen
Any College vs.No College
Over 25 Years of Age vs.25 Years of Age or Younger
Fig. 21. Likelihood of Obtaining Non-Gov’t Sponsored Below Range Sentences by Demographic Factors PROTECT, Booker, Gall, and Post-Report Periods
Fig. 20. Differences in Non-Gov’t Sponsored Below Range Sentences by Demographic Factors PROTECT, Booker, Gall, and Post-Report Periods
* **
17.2
*
-10.3
25.2
*
-8.4
24.3
7.0
*
-15
-10
-5
0
5
10
15
20
25
30PROTECT Booker Gall Post-Report
Percentage Difference in Sentence Length
•Indicates that the difference between the two groups was not statistically significant. SOURCE: U.S. Sentencing Commission, 2003 -2016 Datafiles, USSCFY03-USSCFY16.
Non-U.S. Citizen vs.U.S. Citizen
Any College vs.No College
Over 25 Years of Age vs.25 Years of Age or Younger

Demographic Differences in Sentencing26
significant in three time periods, but in different directions. In the Post-Report period, offenders who were over 25 years of age were 3.7 percent less likely to receive a non-government sponsored below range sentence than offenders who were 25 years of age and younger. This was a reverse of the relationship observed during the PROTECT Act and Booker periods, where offenders over the age of 25 were more likely to receive a non-government sponsored below range sentence than offenders who were 25 years of age or younger. By the time of the Gall period, however, no statistically significant differences were found between the two groups.
Appendix B: Offense Specific AnalysisAnalysis of Differences in Sentencing by Offense Type
For the 2012 Booker Report, the Commission expanded its multivariate analysis to examine specific types of offenses.51 While the Commission’s multivariate analyses always control for the type of offense involved in the case, the additional analyses presented in the 2012 Booker Report used the regression technique to examine a single offense more closely, by limiting the cases in each analysis to those involving that specific offense type. The Commission performed this additional analysis
for two reasons: first, to determine whether its findings on demographic differences in overall sentencing outcomes would be replicated in the major offense types; and second, to determine the extent to which demographic differences in sentencing for different offense types contributed to the demographic differences observed for all sentences. In the 2012 Booker Report the Commission presented an analysis of three major offense types for which there was a sufficient number of cases and sufficient diversity in the demographic factors: drug trafficking, fraud, and firearms. Immigration and child pornography offenses lacked a sufficient number of cases with offenders of different races to support a robust analysis.52
Consistent with the results of the analysis of all cases, demographic factors were associated with sentence length to a statistically significant extent during some of the time periods studied for drug trafficking, fraud, and firearms offenses. For this report, the Commission has updated these offense type analyses with data from the Post-Report period.53
Drug Trafficking Offenses
Figure 22 depicts the results of the Commission’s multivariate analysis specific to drug trafficking offenses. This analysis includes offenders involved in trafficking of the five major drug types—powder cocaine, crack cocaine, marijuana, methamphetamine, and heroin—while controlling for the type of drug involved in the offense. Controlling for drug type means, for example, that crack cocaine offenders are compared only to other crack cocaine offenders, while methamphetamine offenders are compared only to other methamphetamine offenders. The analysis found that the differences in sentence length for Black male drug offenders compared to White male drug offenders have varied over time. In the Post-Report period, Black male drug offenders received sentences that were 17.7 percent longer than White male drug offenders. In the Gall period the difference between these two groups was 13.1 percent.
The differences in sentence length between Hispanic male and White male drug offenders were statistically significant in three of the five time periods studied. In the Post-Report period Hispanic male drug offenders received sentences 6.8 percent longer than White male drug offenders. This compares to 4.3 percent during the Gall period. There were no statistically significant differences between the sentences for the two groups during the Koon or PROTECT Act periods.
9.2
* ** * *
9.1
4.8
10.6
13.1
4.3
11.8
17.7
6.8
11.8
0
5
10
15
20Koon PROTECT Booker Gall Post-Report
Percentage Difference in Sentence Length
Black Male vs. White Male Hispanic Male vs. White Male Other Male vs. White Male
•Indicates that the difference between the two groups was not statistically significant. SOURCE: U.S. Sentencing Commission, 1999 -2016 Datafiles, USSCFY99-USSCFY16.
Fig. 22. Differences in Sentence Length for Male Drug Trafficking Offenders Koon, PROTECT, Booker, Gall, and Post-Report Periods
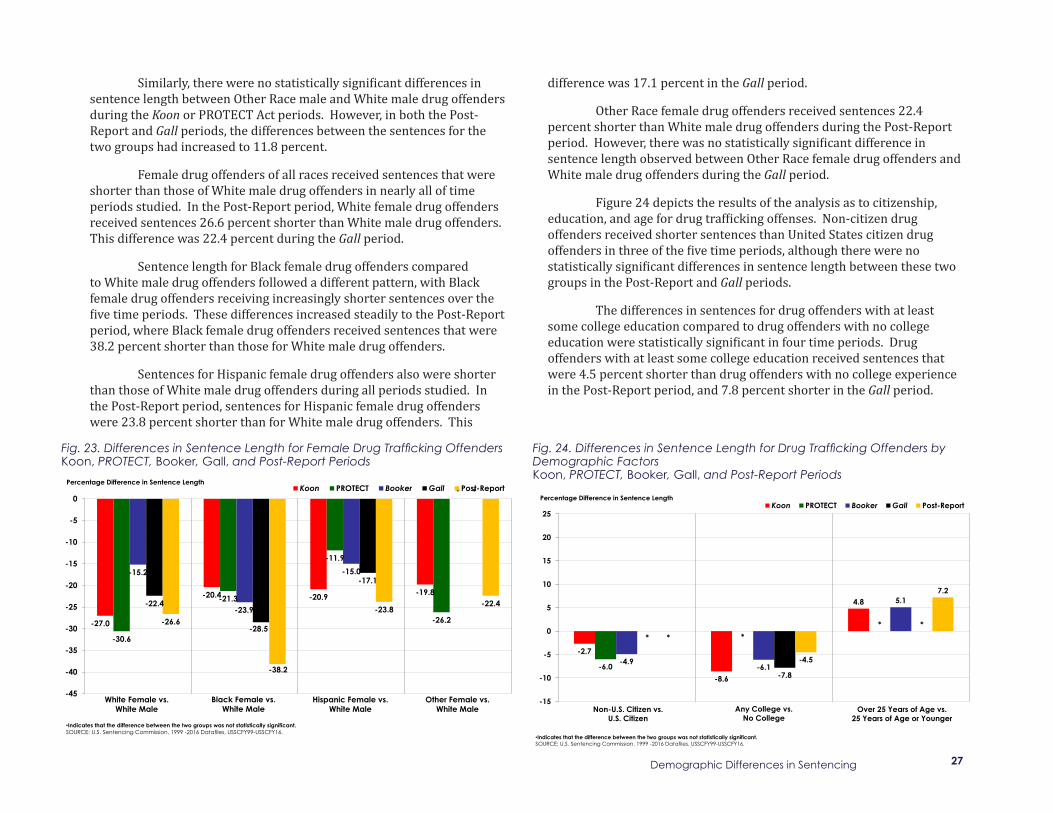
Demographic Differences in Sentencing 27
Similarly, there were no statistically significant differences in sentence length between Other Race male and White male drug offenders during the Koon or PROTECT Act periods. However, in both the Post-Report and Gall periods, the differences between the sentences for the two groups had increased to 11.8 percent.
Female drug offenders of all races received sentences that were shorter than those of White male drug offenders in nearly all of time periods studied. In the Post-Report period, White female drug offenders received sentences 26.6 percent shorter than White male drug offenders. This difference was 22.4 percent during the Gall period.
Sentence length for Black female drug offenders compared to White male drug offenders followed a different pattern, with Black female drug offenders receiving increasingly shorter sentences over the five time periods. These differences increased steadily to the Post-Report period, where Black female drug offenders received sentences that were 38.2 percent shorter than those for White male drug offenders.
Sentences for Hispanic female drug offenders also were shorter than those of White male drug offenders during all periods studied. In the Post-Report period, sentences for Hispanic female drug offenders were 23.8 percent shorter than for White male drug offenders. This
difference was 17.1 percent in the Gall period.
Other Race female drug offenders received sentences 22.4 percent shorter than White male drug offenders during the Post-Report period. However, there was no statistically significant difference in sentence length observed between Other Race female drug offenders and White male drug offenders during the Gall period.
Figure 24 depicts the results of the analysis as to citizenship, education, and age for drug trafficking offenses. Non-citizen drug offenders received shorter sentences than United States citizen drug offenders in three of the five time periods, although there were no statistically significant differences in sentence length between these two groups in the Post-Report and Gall periods.
The differences in sentences for drug offenders with at least some college education compared to drug offenders with no college education were statistically significant in four time periods. Drug offenders with at least some college education received sentences that were 4.5 percent shorter than drug offenders with no college experience in the Post-Report period, and 7.8 percent shorter in the Gall period.
-27.0
-20.4 -20.9 -19.8
-30.6
-21.3
-11.9
-26.2
-15.2
-23.9
-15.0
*
-22.4
-28.5
-17.1
*
-26.6
-38.2
-23.8-22.4
-45
-40
-35
-30
-25
-20
-15
-10
-5
0Koon PROTECT Booker Gall Post-Report
Percentage Difference in Sentence Length
White Female vs. White Male
Black Female vs. White Male
Hispanic Female vs. White Male
Other Female vs. White Male
•Indicates that the difference between the two groups was not statistically significant. SOURCE: U.S. Sentencing Commission, 1999 -2016 Datafiles, USSCFY99-USSCFY16.
Fig. 23. Differences in Sentence Length for Female Drug Trafficking Offenders Koon, PROTECT, Booker, Gall, and Post-Report Periods
-2.7
-8.6
4.8
-6.0
**
-4.9-6.1
5.1
*
-7.8
**
-4.5
7.2
-15
-10
-5
0
5
10
15
20
25Koon PROTECT Booker Gall Post-Report
Percentage Difference in Sentence Length
Non-U.S. Citizen vs. U.S. Citizen
Any College vs. No College
Over 25 Years of Age vs.25 Years of Age or Younger
•Indicates that the difference between the two groups was not statistically significant. SOURCE: U.S. Sentencing Commission, 1999 -2016 Datafiles, USSCFY99-USSCFY16.
Fig. 24. Differences in Sentence Length for Drug Trafficking Offenders by Demographic Factors Koon, PROTECT, Booker, Gall, and Post-Report Periods

Demographic Differences in Sentencing28
Finally, there were differences between sentences of drug offenders over the age of 25 compared with those 25 years of age or younger during three of the five periods studied. In the Post-Report period, drug offenders over the age of 25 received sentences that were 7.2 percent longer than drug offenders 25 years of age or younger. During the Gall period, there were no statistically significant sentencing differences between these two groups of offenders.
Fraud Offenses
The findings of the Commission’s multivariate analysis specific to fraud offenses are presented in Figure 25. The differences in sentence length for Black male fraud offenders compared to White male fraud offenders were statistically significant during the Post-Report period, when the difference was a 10.7 percent longer sentence for Black male offenders. There was no statistically significant difference observed during the Gall period.
The differences in sentence length between Hispanic male and White male fraud offenders were statistically significant in each period. In the Post-Report period, Hispanic male fraud offenders received sentences that were 17.3 percent longer than White male fraud offenders. That difference was a decrease from 29.6 percent in the Gall period.
There were no statistically significant differences in sentence length between Other Race male and White male fraud offenders during any time period.
As seen in figure 26, female fraud offenders of all races generally were sentenced to shorter terms than White male fraud offenders. In the Post-Report period, White female fraud offenders received sentences that were 20.9 percent shorter than those for White male fraud offenders. In the Gall period, that difference was 18.3 percent. During the PROTECT Act and Booker periods, there were no statistically significant differences in sentence length between the two groups.
The differences in sentence length for Black female fraud offenders compared to White male fraud offenders were statistically significant in each period. In the Post-Report period, Black female fraud offenders received sentences 18.1 percent shorter than White male fraud offenders. This difference was similar to the 18.6 percent observed in Gall period.
Differences in sentence length for Hispanic female fraud offenders compared to White male fraud offenders were not statistically significant in the Post-Report and Gall periods.
7.4
12.1
**
25.6
**
20.8
**
29.6
*
10.7
17.3
*0
5
10
15
20
25
30
35Koon PROTECT Booker Gall Post-Report
Percentage Difference in Sentence Length
Black Male vs. White Male Hispanic Male vs. White Male Other Male vs. White Male
•Indicates that the difference between the two groups was not statistically significant. SOURCE: U.S. Sentencing Commission, 1999 -2016 Datafiles, USSCFY99-USSCFY16.
Fig. 25. Differences in Sentence Length for Male Fraud Offenders Koon, PROTECT, Booker, Gall, and Post-Report Periods
-12.2 -13.0
-25.5
-31.6
*
-23.0
-28.9
-35.0
*
-15.4
-19.2
*
-18.3 -18.6
*
-21.5-20.9-18.1
* *
-40
-35
-30
-25
-20
-15
-10
-5
0
Koon PROTECT Booker Gall Post-ReportPercentage Difference in Sentence Length
White Female vs. White Male
Black Female vs. White Male
Hispanic Female vs. White Male
Other Female vs. White Male
•Indicates that the difference between the two groups was not statistically significant. SOURCE: U.S. Sentencing Commission, 1999 -2016 Datafiles, USSCFY99-USSCFY16.
Fig. 26. Differences in Sentence Length for Female Fraud Offenders Koon, PROTECT, Booker, Gall, and Post-Report Periods
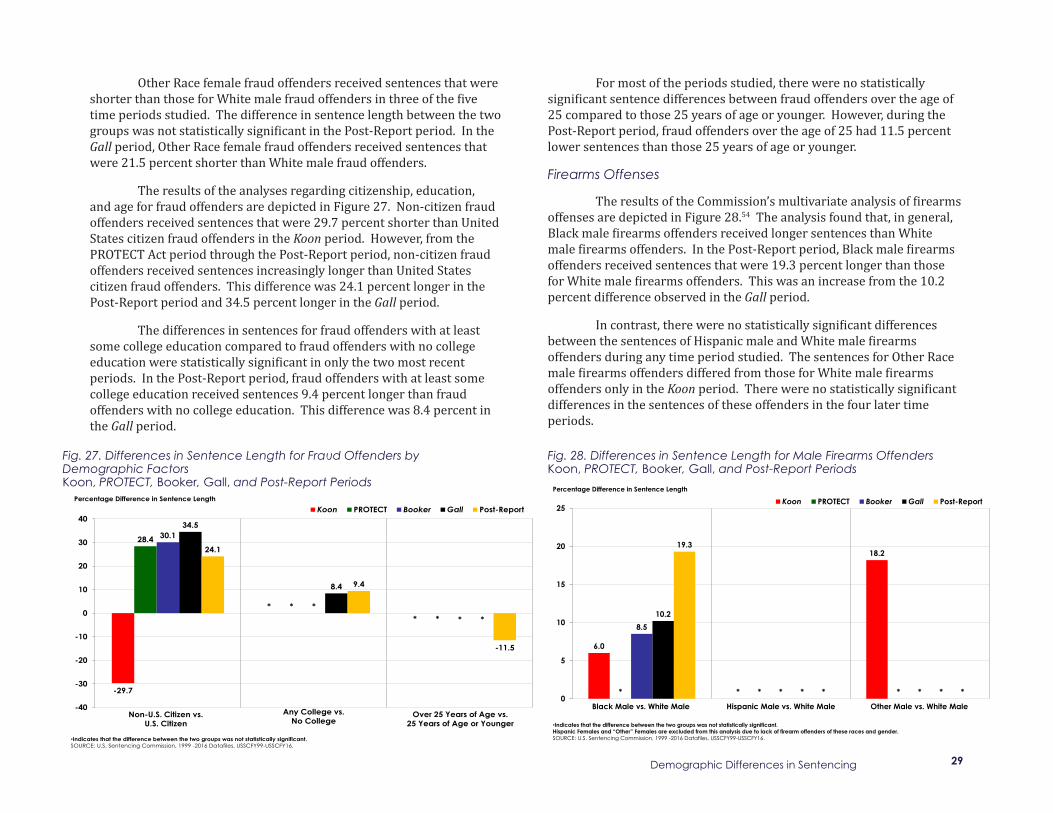
Demographic Differences in Sentencing 29
Other Race female fraud offenders received sentences that were shorter than those for White male fraud offenders in three of the five time periods studied. The difference in sentence length between the two groups was not statistically significant in the Post-Report period. In the Gall period, Other Race female fraud offenders received sentences that were 21.5 percent shorter than White male fraud offenders.
The results of the analyses regarding citizenship, education, and age for fraud offenders are depicted in Figure 27. Non-citizen fraud offenders received sentences that were 29.7 percent shorter than United States citizen fraud offenders in the Koon period. However, from the PROTECT Act period through the Post-Report period, non-citizen fraud offenders received sentences increasingly longer than United States citizen fraud offenders. This difference was 24.1 percent longer in the Post-Report period and 34.5 percent longer in the Gall period.
The differences in sentences for fraud offenders with at least some college education compared to fraud offenders with no college education were statistically significant in only the two most recent periods. In the Post-Report period, fraud offenders with at least some college education received sentences 9.4 percent longer than fraud offenders with no college education. This difference was 8.4 percent in the Gall period.
For most of the periods studied, there were no statistically significant sentence differences between fraud offenders over the age of 25 compared to those 25 years of age or younger. However, during the Post-Report period, fraud offenders over the age of 25 had 11.5 percent lower sentences than those 25 years of age or younger.
Firearms Offenses
The results of the Commission’s multivariate analysis of firearms offenses are depicted in Figure 28.54 The analysis found that, in general, Black male firearms offenders received longer sentences than White male firearms offenders. In the Post-Report period, Black male firearms offenders received sentences that were 19.3 percent longer than those for White male firearms offenders. This was an increase from the 10.2 percent difference observed in the Gall period.
In contrast, there were no statistically significant differences between the sentences of Hispanic male and White male firearms offenders during any time period studied. The sentences for Other Race male firearms offenders differed from those for White male firearms offenders only in the Koon period. There were no statistically significant differences in the sentences of these offenders in the four later time periods.
Fig. 27. Differences in Sentence Length for Fraud Offenders by Demographic Factors Koon, PROTECT, Booker, Gall, and Post-Report Periods
-29.7
**
28.4
**
30.1
**
34.5
8.4
*
24.1
9.4
-11.5
-40
-30
-20
-10
0
10
20
30
40Koon PROTECT Booker Gall Post-Report
Percentage Difference in Sentence Length
Non-U.S. Citizen vs.U.S. Citizen
Any College vs.No College
Over 25 Years of Age vs.25 Years of Age or Younger
•Indicates that the difference between the two groups was not statistically significant.SOURCE: U.S. Sentencing Commission, 1999 -2016 Datafiles, USSCFY99-USSCFY16.
6.0
*
18.2
* * *
8.5
* *
10.2
* *
19.3
* *0
5
10
15
20
25Koon PROTECT Booker Gall Post-Report
Percentage Difference in Sentence Length
Black Male vs. White Male Hispanic Male vs. White Male Other Male vs. White Male
•Indicates that the difference between the two groups was not statistically significant. Hispanic Females and “Other” Females are excluded from this analysis due to lack of firearm offenders of these races and gender.SOURCE: U.S. Sentencing Commission, 1999 -2016 Datafiles, USSCFY99-USSCFY16.
Fig. 28. Differences in Sentence Length for Male Firearms Offenders Koon, PROTECT, Booker, Gall, and Post-Report Periods
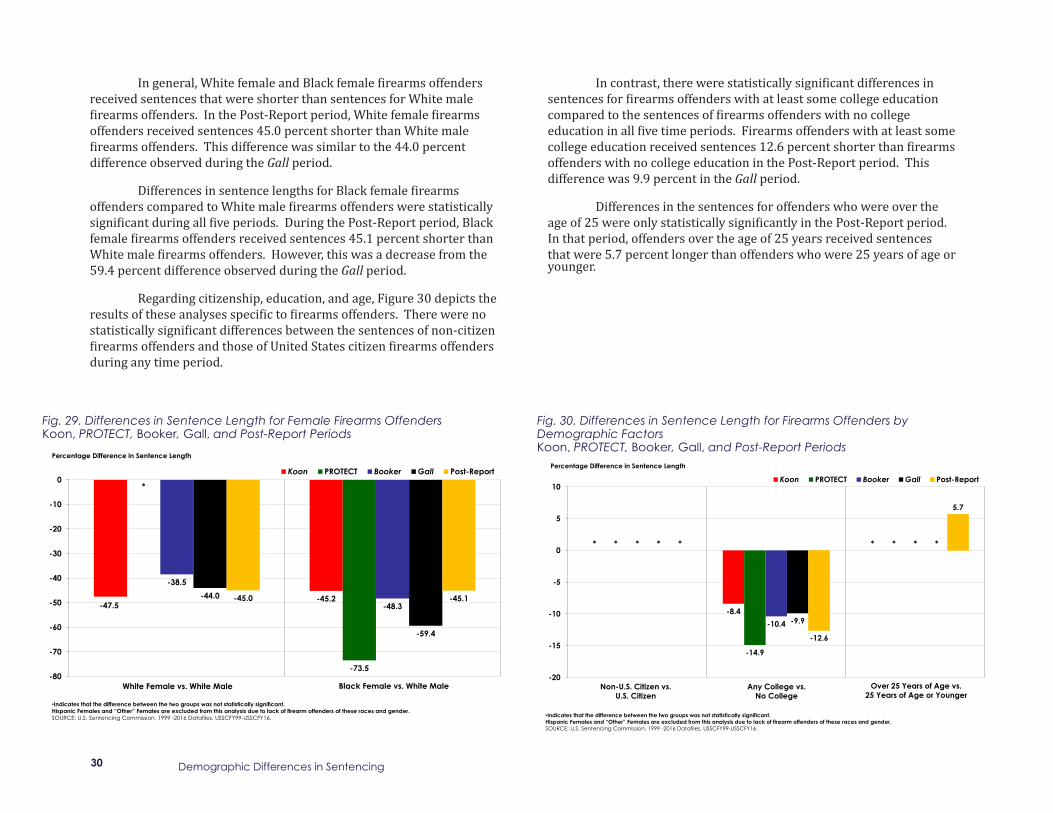
Demographic Differences in Sentencing30
In general, White female and Black female firearms offenders received sentences that were shorter than sentences for White male firearms offenders. In the Post-Report period, White female firearms offenders received sentences 45.0 percent shorter than White male firearms offenders. This difference was similar to the 44.0 percent difference observed during the Gall period.
Differences in sentence lengths for Black female firearms offenders compared to White male firearms offenders were statistically significant during all five periods. During the Post-Report period, Black female firearms offenders received sentences 45.1 percent shorter than White male firearms offenders. However, this was a decrease from the 59.4 percent difference observed during the Gall period.
Regarding citizenship, education, and age, Figure 30 depicts the results of these analyses specific to firearms offenders. There were no statistically significant differences between the sentences of non-citizen firearms offenders and those of United States citizen firearms offenders during any time period.
In contrast, there were statistically significant differences in sentences for firearms offenders with at least some college education compared to the sentences of firearms offenders with no college education in all five time periods. Firearms offenders with at least some college education received sentences 12.6 percent shorter than firearms offenders with no college education in the Post-Report period. This difference was 9.9 percent in the Gall period.
Differences in the sentences for offenders who were over the age of 25 were only statistically significantly in the Post-Report period. In that period, offenders over the age of 25 years received sentences that were 5.7 percent longer than offenders who were 25 years of age or younger.
-47.5-45.2
*
-73.5
-38.5
-48.3-44.0
-59.4
-45.0 -45.1
-80
-70
-60
-50
-40
-30
-20
-10
0Koon PROTECT Booker Gall Post-Report
Percentage Difference in Sentence Length
White Female vs. White Male Black Female vs. White Male
•Indicates that the difference between the two groups was not statistically significant. Hispanic Females and “Other” Females are excluded from this analysis due to lack of firearm offenders of these races and gender.SOURCE: U.S. Sentencing Commission, 1999 -2016 Datafiles, USSCFY99-USSCFY16.
Fig. 29. Differences in Sentence Length for Female Firearms Offenders Koon, PROTECT, Booker, Gall, and Post-Report Periods
*
-8.4
**
-14.9
**
-10.4
**
-9.9
**
-12.6
5.7
-20
-15
-10
-5
0
5
10Koon PROTECT Booker Gall Post-Report
Percentage Difference in Sentence Length
•Indicates that the difference between the two groups was not statistically significant. Hispanic Females and “Other” Females are excluded from this analysis due to lack of firearm offenders of these races and gender.SOURCE: U.S. Sentencing Commission, 1999 -2016 Datafiles, USSCFY99-USSCFY16.
Non-U.S. Citizen vs.U.S. Citizen
Any College vs.No College
Over 25 Years of Age vs.25 Years of Age or Younger
Fig. 30. Differences in Sentence Length for Firearms Offenders by Demographic Factors Koon, PROTECT, Booker, Gall, and Post-Report Periods

Demographic Differences in Sentencing 31
Appendix C: Methodology The dependent variable used in each of the analyses was an
offender’s total sentence length, in months, which included alternatives to imprisonment.55 Probationary sentences without conditions of confinement are included as sentences of zero months. The independent variables were:
• The presumptive sentence, which is the bottom of the applicable sentencing guideline range that applies in a case (i.e., the minimum sentence, in months, to which the offender was subject under the sentencing guidelines, taking into account all guideline, statutory, and mandatory minimum provisions);56
• Type of offense committed (violent, sexual, pornography, drug trafficking, white collar, immigration, or other);57
• Whether a statutory mandatory minimum punishment was applied at sentencing;58
• Whether the court determined that a sentence outside the applicable sentencing guideline range was warranted;59
• Detention status (whether the offender had been released on bail prior to sentencing);
• Whether the offender pleaded guilty;
• Race of the offender paired with the gender of the offender;
• Citizenship of the offender (whether the offender was a United States citizen);
• Educational level of the offender; and
• Age of the offender.
The multivariate analyses pair race and gender into eight distinct groups: White males/females, Black males/females, Hispanic males/
females, and Other Race males/females. Reporting the results of the analyses in this way identifies any differences in sentencing outcomes associated with the offender’s race, gender, or both.
For the portion of this report regarding violence in an offender’s criminal history, the Commission used data from a separate project examining the criminal history of federal offenders. As part of that project, the Commission examined the presentence investigation reports (PSRs) for all offenders sentenced in fiscal year 2016 to collect data on all juvenile adjudications and state and federal adult convictions. An optical recognition program scanned the criminal history section of the PSRs and recorded the following:
• Date of arrest;
• Date of sentence;
• State in which the court was located;
• Number of points assigned under Chapter 4 of the sentencing guidelines;
• Chapter 4 guideline(s) cited;
• Whether the offense was a juvenile adjudication or adult conviction;
• Whether the adjudication/conviction was in a federal, state, or tribal court; and
• Conviction charge(s).
The program assigned each adjudication or conviction to one of 102 standardized offense categories. Those categories were further grouped into 35 broad offense groups for analytical purposes. For all offenders with criminal history, staff reviewed all of the information recorded by the program to ensure accuracy, made any necessary changes to the data, and confirmed the categorization of the adjudication or offense into one of the 35 offense groups.

Demographic Differences in Sentencing32
Assault, Simple Assault, Intimidation (of a person other than a witness), Hit and Run with Bodily Injury, Extortion, Child Abuse, Burglary, Arson, Rioting, and Other Violent Offense (a group of infrequently-occurring violent offenses). All offenders were then divided into two groups: those with any prior adjudication or conviction for a violent offense and those with no prior adjudications or convictions for a violent offense. A binary independent variable was created with this data and included in the Commission’s multivariate regression analysis model. These analyses show that some differences exist, and describe the relative size of those differences, in the periods in which the differences were observed. However, the fact that certain sentencing outcomes may be correlated with demographic factors does not mean that the demographic factors caused the outcome.60 Therefore, the demographic differences in sentencing outcomes revealed by these analyses should not be interpreted as a finding that demographic factors caused those differences. Neither can the analyses presented in this report be used to explain why the observed differences in sentencing outcomes exist. Although multivariate regression analysis is common in social science research, and steps were taken to ensure its appropriateness for these analyses, this type of analysis has limitations. One or more key factors that could affect the analysis may have been omitted from the methodologies used because a particular factor is unknown, or because data concerning the factor is not readily available in the Commission’s datasets. Such factors may include whether the offender committed crimes not reflected in an offender’s criminal history score, and the offender’s employment record. Accordingly, the results presented in this report should be interpreted with caution and should not be taken to suggest race or gender discrimination on the part of judges.

Demographic Differences in Sentencing 33
Appendix D: Regression Model Output Regression model 2012-2016
The REG Procedure Model: MODEL1 Dependent Variable: logsplit
Number of Observations Read 322275 Number of Observations Used 322275
Analysis of Variance
Sum of Mean Source DF Squares Square F Value Pr > F
Model 23 1068533 46458 18451.7 <.0001 Error 322251 811366 2.51781 Corrected Total 322274 1879899
Root MSE 1.58676 R-Square 0.5684 Dependent Mean 2.68470 Adj R-Sq 0.5684 Coeff Var 59.10388
Parameter Estimates
Parameter Standard Standardized Variable DF Estimate Error t Value Pr > |t| Estimate
Intercept 1 0.21375 0.01371 15.59 <.0001 0 logmin 1 0.61526 0.00148 415.49 <.0001 0.61552 drugtraff 1 0.18545 0.00959 19.33 <.0001 0.03604 sexual2 1 0.23591 0.02985 7.90 <.0001 0.00949 porn 1 0.62975 0.01917 32.85 <.0001 0.04464 immigration 1 -0.03436 0.01217 -2.82 0.0048 -0.00647 othtype 1 -0.57546 0.01733 -33.21 <.0001 -0.04382 whitecoll 1 -0.20351 0.01154 -17.63 <.0001 -0.03100 upward 1 0.64847 0.01957 33.13 <.0001 0.03897 downdep 1 -1.06743 0.00662 -161.36 <.0001 -0.21512 subasst 1 -1.11105 0.00992 -111.95 <.0001 -0.15554 mandmin2 1 0.47247 0.00966 48.92 <.0001 0.06714 NEWCNVTN 1 0.50739 0.01632 31.09 <.0001 0.03693 custody 1 1.34406 0.00819 164.17 <.0001 0.24219 whitefemale 1 -0.34097 0.01444 -23.61 <.0001 -0.03029 blackmale 1 0.17520 0.00949 18.46 <.0001 0.02790 blackfemale 1 -0.35241 0.01792 -19.66 <.0001 -0.02452 hispmale 1 0.05176 0.00976 5.30 <.0001 0.01067 hispfemale 1 -0.18347 0.01478 -12.41 <.0001 -0.01629 othermale 1 -0.03887 0.01704 -2.28 0.0225 -0.00284 otherfemale 1 -0.43742 0.03152 -13.88 <.0001 -0.01640 agedummy 1 0.02821 0.00783 3.60 0.0003 0.00428 educ 1 -0.00270 0.00765 -0.35 0.7241 -0.00045774 NEWCIT 1 0.04916 0.00938 5.24 <.0001 0.00996

Demographic Differences in Sentencing34
Regression model 2016
The REG Procedure Model: MODEL1 Dependent Variable: logsplit
Number of Observations Read 59160 Number of Observations Used 59160
Analysis of Variance
Sum of Mean Source DF Squares Square F Value Pr > F
Model 23 206222 8966.18995 3281.01 <.0001 Error 59136 161604 2.73275 Corrected Total 59159 367826
Root MSE 1.65310 R-Square 0.5607 Dependent Mean 2.58726 Adj R-Sq 0.5605 Coeff Var 63.89395
Parameter Estimates
Parameter Standard Standardized Variable DF Estimate Error t Value Pr > |t| Estimate
Intercept 1 0.03523 0.03399 1.04 0.3000 0 logmin 1 0.59033 0.00354 166.77 <.0001 0.59220 drugtraff 1 0.16276 0.02323 7.01 <.0001 0.03050 sexual2 1 0.32368 0.06596 4.91 <.0001 0.01396 porn 1 0.69122 0.04528 15.27 <.0001 0.04972 immigration 1 -0.11592 0.02936 -3.95 <.0001 -0.02114 othtype 1 -0.63132 0.04268 -14.79 <.0001 -0.04553 whitecoll 1 -0.10795 0.02833 -3.81 0.0001 -0.01567 upward 1 0.61161 0.04569 13.39 <.0001 0.03721 downdep 1 -1.12238 0.01612 -69.64 <.0001 -0.22097 subasst 1 -1.16465 0.02478 -46.99 <.0001 -0.15234 mandmin2 1 0.53709 0.02369 22.68 <.0001 0.07309 NEWCNVTN 1 0.53340 0.04138 12.89 <.0001 0.03598 custody 1 1.62716 0.02026 80.30 <.0001 0.28125 whitefemale 1 -0.31754 0.03598 -8.83 <.0001 -0.02685 blackmale 1 0.18778 0.02358 7.96 <.0001 0.02911 blackfemale 1 -0.30730 0.04444 -6.91 <.0001 -0.02046 hispmale 1 0.08940 0.02478 3.61 0.0003 0.01788 hispfemale 1 -0.07408 0.03550 -2.09 0.0369 -0.00662 othermale 1 0.00265 0.04147 0.06 0.9490 0.00018873 otherfemale 1 -0.47330 0.07757 -6.10 <.0001 -0.01701 agedummy 1 0.03591 0.01925 1.87 0.0620 0.00524 educ 1 -0.01221 0.01859 -0.66 0.5113 -0.00202 NEWCIT 1 0.00027532 0.02259 0.01 0.9903 0.00005390
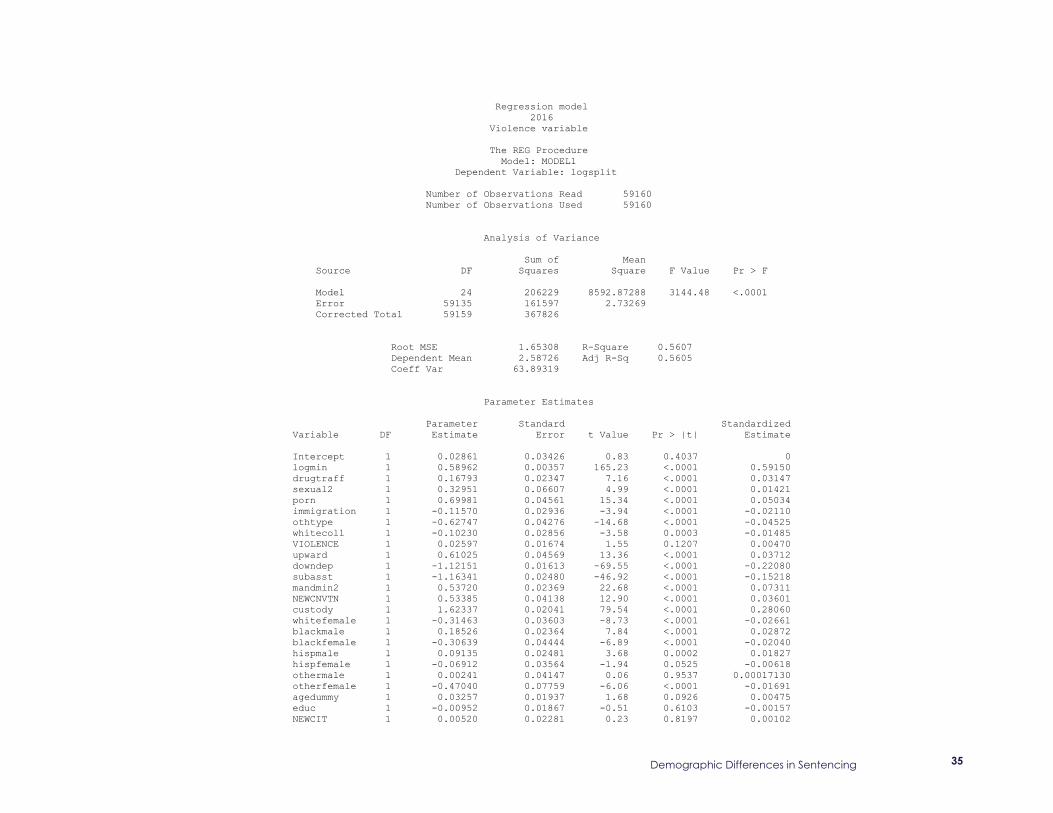
Demographic Differences in Sentencing 35
Regression model 2016 Violence variable
The REG Procedure Model: MODEL1 Dependent Variable: logsplit
Number of Observations Read 59160 Number of Observations Used 59160
Analysis of Variance
Sum of Mean Source DF Squares Square F Value Pr > F
Model 24 206229 8592.87288 3144.48 <.0001 Error 59135 161597 2.73269 Corrected Total 59159 367826
Root MSE 1.65308 R-Square 0.5607 Dependent Mean 2.58726 Adj R-Sq 0.5605 Coeff Var 63.89319
Parameter Estimates
Parameter Standard Standardized Variable DF Estimate Error t Value Pr > |t| Estimate
Intercept 1 0.02861 0.03426 0.83 0.4037 0 logmin 1 0.58962 0.00357 165.23 <.0001 0.59150 drugtraff 1 0.16793 0.02347 7.16 <.0001 0.03147 sexual2 1 0.32951 0.06607 4.99 <.0001 0.01421 porn 1 0.69981 0.04561 15.34 <.0001 0.05034 immigration 1 -0.11570 0.02936 -3.94 <.0001 -0.02110 othtype 1 -0.62747 0.04276 -14.68 <.0001 -0.04525 whitecoll 1 -0.10230 0.02856 -3.58 0.0003 -0.01485 VIOLENCE 1 0.02597 0.01674 1.55 0.1207 0.00470 upward 1 0.61025 0.04569 13.36 <.0001 0.03712 downdep 1 -1.12151 0.01613 -69.55 <.0001 -0.22080 subasst 1 -1.16341 0.02480 -46.92 <.0001 -0.15218 mandmin2 1 0.53720 0.02369 22.68 <.0001 0.07311 NEWCNVTN 1 0.53385 0.04138 12.90 <.0001 0.03601 custody 1 1.62337 0.02041 79.54 <.0001 0.28060 whitefemale 1 -0.31463 0.03603 -8.73 <.0001 -0.02661 blackmale 1 0.18526 0.02364 7.84 <.0001 0.02872 blackfemale 1 -0.30639 0.04444 -6.89 <.0001 -0.02040 hispmale 1 0.09135 0.02481 3.68 0.0002 0.01827 hispfemale 1 -0.06912 0.03564 -1.94 0.0525 -0.00618 othermale 1 0.00241 0.04147 0.06 0.9537 0.00017130 otherfemale 1 -0.47040 0.07759 -6.06 <.0001 -0.01691 agedummy 1 0.03257 0.01937 1.68 0.0926 0.00475 educ 1 -0.00952 0.01867 -0.51 0.6103 -0.00157 NEWCIT 1 0.00520 0.02281 0.23 0.8197 0.00102

Demographic Differences in Sentencing36

Endnotes

Demographic Differences in Sentencing38
Endnotes1 See U.S. Sentencing Comm’n, Demographic Differences in Federal Sentencing Practices: An Update of the Booker Report’s Multivariate Regression Analysis (2010) [hereinafter 2010 Booker Multivariate Analysis].
2 The time periods studied in the 2010 report were as follows: the PROTECT Act period, from May 1, 2003, the date of the enactment of the PROTECT Act, through June 24, 2004, the date of the Supreme Court’s decision in Blakely v. Washington, 542 U.S. 296 (2004); the Booker period, from January 12, 2005, the date of the Supreme Court’s decision in United States v. Booker, 543 U.S. 220 (2005), through December 10, 2007, the date of the Supreme Court’s decisions in Kimbrough v. United States, 552 U.S. 85 (2007) and Gall v. United States, 552 U.S. 38 (2007); and the Gall period, from December 11, 2007 through September 30, 2009.
3 The Commission’s updated analysis examined cases in which the offender was sentenced between October 1, 2009 through September 30, 2011. In that report, the Commission expanded the Gall period to include offenders sentenced from December 11, 2007 to September 30, 2011. An additional time period was also included in that analysis, the Koon period, involving cases in which the offender was sentenced between October 1, 1998 through April 30, 2003. This period relates to cases decided after the Supreme Court’s decision in Koon v. United States, 518 U.S. 81 (1996).
4 U.S. Sentencing Comm’n, Report on the Continuing Impact of United States v. Booker on Federal Sentencing, Part E (2012) [hereinafter 2012 Booker Report].
5 United States v. Booker, 543 U.S. 220 (2005).
6 U.S. Sentencing Comm’n, Guidelines Manual (Nov. 2016) [hereinafter USSG].
7 For a more detailed explanation of multivariate regression analysis, the methodology behind it, and its uses and limitations, see 2010 Booker Multivariate Analysis, supra note 1, at 4–10. See also Federal Judicial Center, Reference Manual on Scientific Evidence 303–587 (3d ed. 2011) [hereinafter FJC Reference Manual] (chapters titled “Reference Guide on Multiple Regression,” by Daniel L. Rubinfeld, Ph.D.); Neil J. Salkind, Statistics for People Who (Think They) Hate Statistics 324 (2d ed. 2007).
8 As the Commission first stated in 2006, “The presence of violent criminal history may lead the court to sentence higher in the prescribed range. The Commission’s datafile does not have information on the type of criminal
history behavior. In 2002, the Commission created a datafile which took a 25% random sample of cases sentenced in fiscal year 2000. This datafile looked more closely at [an] offender’s criminal conduct, including detailed information on the type of criminal history the offender had. Using this data (the Intensive Study Sample 2000, or ISS2000), it was found that 24.4% of white offenders had violent criminal history events, as did 43.7% of Black offenders, 18.9% of Hispanic offenders, and 23.7% of ‘other’ offenders.” U.S. Sentencing Comm’n, Final Report on the Impact of United States v. Booker On Federal Sentencing (2006) 105 n.317. See also 2010 Booker Multivariate Analysis, supra note 1, at 9–10; 2012 Booker Report, supra note 4, at Part E, 8.
9 Beginning with fiscal year 2016 data, the Commission has developed a process to record all prior criminal history of federal offenders, including the date of sentence and the type of offense involved. This data is discussed later in this report. See infra notes 32 to 35 and accompanying text. A discussion of how this data was collected can be found in Appendix C. 10 In addition, the Commission also does not have ready access to data related to prosecutorial decision making, which some commentators contend may contribute to demographic differences in sentencing. For further discussion of demographic differences in prosecutorial decision making, see Vera Institute of Justice, Do Race and Ethnicity Matter in Prosecution?: A Review of Empirical Studies (2012) (reviewing 34 studies analyzing the role of race and ethnicity in prosecutorial decision making), https://storage.googleapis.com/vera-web-assets/downloads/Publications/do-race-and-ethnicity-matter-in-prosecution-a-review-of-empirical-studies/legacy_downloads/race-and-ethnicity-in-prosecution-first-edition.pdf June 2012.
11 Amy Baron-Evans and David Patton, A Response to Judge Pryor’s Proposal to “Fix” the Guidelines: A Cure Worse than the Disease, 29 Fed. Sentencing Rep. 104, 106 (2016–2017).
12 See the Appendix to this report for more information about these factors and a discussion of how the Commission’s analysis was performed. The Commission’s analysis pairs race and gender factors into eight distinct groups: White males/females, Black males/females, Hispanic males/females, and Other Race males/females. Conducting analyses in this way helps to identify differences in sentencing outcomes associated with the offender’s race, gender, or both.
13 For statistical purposes, the Commission divides offenders into four broad groups based on the level of education reported by the court in the presentence investigation report: less than high school graduate, high school graduate, some college education, college graduate. For this analysis, offenders were combined into two groups—those with no college education and those with at least some college education.

Demographic Differences in Sentencing 39
14 See infra notes 18 to 21 and accompanying text for a discussion of how the Commission determines the position of the sentence imposed relative to the sentencing guideline range.
15 See infra notes 22 to 24 and accompanying text for a discussion of sentences based on an offender’s substantial assistance to the government.
16 This analysis did not include the Koon period because the Commission did not collect data during that period in a manner that would indicate whether the below range sentence was sponsored by the government, except in cases involving substantial assistance motions.
17 These results are unchanged from those reported in the 2010 Booker Multivariate Analysis and the 2012 Booker Report.
18 Due to the small number of cases in the “Above Range” group, no further analysis was possible.
19 For additional information about the Commission’s practice of separating cases into various subgroups according to the position of the sentence relative to the guideline range, see generally U.S. Sentencing Comm’n, 2016 Sourcebook of Federal Sentencing Statistics (2017) (Appendix A).
20 2012 Booker Report, supra note 4, at Part E, 20–23.
21 No analysis was performed for government sponsored below range sentences based on an offender’s participation in an early disposition program, because there was insufficient racial diversity among the offenders in that group to perform such an analysis.
22 See generally U.S. Sentencing Comm’n, 2016 Sourcebook of Federal Sentencing Statistics S-51 (2017). For additional information about the Commission’s practice of separating cases into various subgroups according to the position of the sentence relative to the guideline range, see id. at Appendix A.
23 The three categories of government sponsored below range sentences are: those based on an offender’s substantial assistance to the government (see 18 U.S.C. § 3553(e); USSG, supra note 6, at §5K1.1), those based on an offender’s participation in an early disposition program (see USSG, supra note 6, at §5K3.1); and all other government sponsored below range sentences.
24 The high fluctuations for this comparison were mainly due to the small population of Other Race female offenders who received substantial assistance departures.
25 As discussed above, no analysis was performed for government sponsored below range sentences based on the offender’s participation in an early disposition program. See supra note 21.
26 Cases from the Koon period were excluded from the analysis because the Commission did not collect data during that period in a manner that would indicate whether the below range sentence was sponsored by the government, except in cases involving substantial assistance motions.
27 Such an analysis is also called “odds ratio” analysis, as it measures the probability of an outcome occurring while controlling for independent variables. Odds ratios are calculated from a regression analysis on a binary outcome measure (in the case of this analysis, the binary outcome is whether the offender received a non-government sponsored below range sentence). This type of regression analysis is known as “logistic regression.” Similar to a regression analysis on a continuous variable, logistic regression shows the effect of the outcome variable, controlling for the independent variables in the model.
28 2012 Booker Report, supra note 4, at Part E, 20–23.
29 For more information on the nature and prevalence of these types of sentences see U.S. Sentencing Comm’n, 2016 Sourcebook of Federal Sentencing Statistics S-51 (2017).
30 USSG, supra note 6, at §5K3.1.
31 Cases from the Koon period were excluded from the analysis because the Commission did not collect data during that period in a manner that would indicate whether the below range sentence was sponsored by the government, except in cases involving substantial assistance motions.
32 See supra notes 8 to 10 and accompanying text.
33 2010 Booker Multivariate Analysis, supra note 1, at 9–10 (citations omitted).
34 While the Commission regularly collects information about the number of prior convictions and the number of points assigned to those offenses under the guidelines (see USSG, supra note 6, at Ch. 4), the Commission did not regularly collect information about the nature of an offender’s prior offenses (e.g., assault, robbery, larceny, drug trafficking) prior to fiscal year 2016. Beginning with fiscal year 2016 data, the Commission developed a method to collect data about all prior state and federal convictions, including the type of offense and date of sentence. This information was extracted from the presentence investigation report prepared in connection with the offender’s federal offense and submitted

Demographic Differences in Sentencing40
to the Commission by the sentencing court. For more information on how this data was collected, and for a list of the offense types that were determined to involve violence, see Appendix C. 35 The offender’s instant (i.e., current) federal offense was not considered in making this determination. However, violence associated with an offender’s instant federal offense was separately controlled for in the Commission’s regression model.
36 The researcher determines the statistical significance threshold that he or she wishes to use, often called the “p value.” This decision is based on a number of factors, including the amount of data available for analysis and the purpose for the analysis. The Commission’s measure of statistical significance is p < 0.01. That is, the Commission will not report an observed difference in sentencing unless the probability that it occurred simply by random chance is less than .01%.
37 The p value for the independent variable regarding violence in an offender’s criminal history was 0.1207.
38 The R2 has a value of between 0 and 1 and is commonly expressed as a percentage.
39 The R2 of the Commission’s analysis for fiscal year 2016 data was 56.1% before the addition of the data on violent criminal history and 56.1% after the inclusion of that data.
40 Under the guidelines, offenders are assigned to one of six criminal history categories (CHCs) based on their prior criminal history. The criminal history score establishes the CHC for an offender. See USSG, supra note 6, at Ch. 4. The CHC, along with the final offense level, determines the sentencing range under the guidelines. The Commission regression analysis controlled for what it called the “presumptive sentence” in each case, which is the bottom of the guideline range that applied in the case. This variable accounts for the fact that the sentencing judge must properly determine this range and consider it when imposing sentencing. This variable was statistically significant in all time periods studied. Therefore, all of an offender’s criminal history, whether involving violence or not, has an effect on the presumptive sentence that applied in each case.
41 2012 Booker Report, supra note 7, at Part E, 1; 2010 Booker Multivariate Analysis, supra note 1, at 9-10.
42 See Michael O. Finkelstein and Bruce Levin, Statistics For Lawyers 350 (2d ed. 2001).
43 These results are unchanged from those reported in the 2010 Booker Multivariate Analysis and the 2012 Booker Report. 44 Due to the small number of cases in the “Above Range” group, no further analysis was possible.
45 For additional information about the Commission’s practice of separating cases into various subgroups according to the position of the sentence relative to the guideline range, see generally U.S. Sentencing Comm’n, 2016 Sourcebook of Federal Sentencing Statistics (2017) (Appendix A).
46 See generally U.S. Sentencing Comm’n, 2016 Sourcebook of Federal Sentencing Statistics S-51 (2017). For additional information about the Commission’s practice of separating cases into various subgroups according to the position of the sentence relative to the guideline range, see id. at Appendix A.
47 The three categories of government sponsored below range sentences are: those based on an offender’s substantial assistance to the government (see 18 U.S.C. § 3553(e); USSG, supra note 6, at §5K1.1), those based on an offender’s participation in an early disposition program (see USSG, supra note 6, at §5K3.1); and all other government sponsored below range sentences.
48 As discussed above, no analysis was performed for government sponsored below range sentences based on the offender’s participation in an early disposition program. See supra note 21.
49 Cases from the Koon period are excluded from the analysis because the Commission did not collect data during that period in a manner that would indicate whether the below range sentence was sponsored by the government, except in cases involving substantial assistance motions.
50 Such an analysis is also called “odds ratio” analysis, as it measures the probability of an outcome occurring while controlling for independent variables. Odds ratios are calculated from a regression analysis on a binary outcome measure (in the case of this analysis, the binary outcome is receiving a non-government sponsored below range sentence or not). This type of regression analysis is known as “logistic regression.” Similar to a regression analysis on a continuous variable, logistic regression shows the effect of the outcome variable, controlling for the independent variables in the model.
51 For a list and description of the offense types used in Commission analyses, see U.S. Sentencing Comm’n, 2016 Sourcebook of Federal Sentencing Statistics S-165-68 (2017).
52 Child pornography offenders are overwhelmingly White male
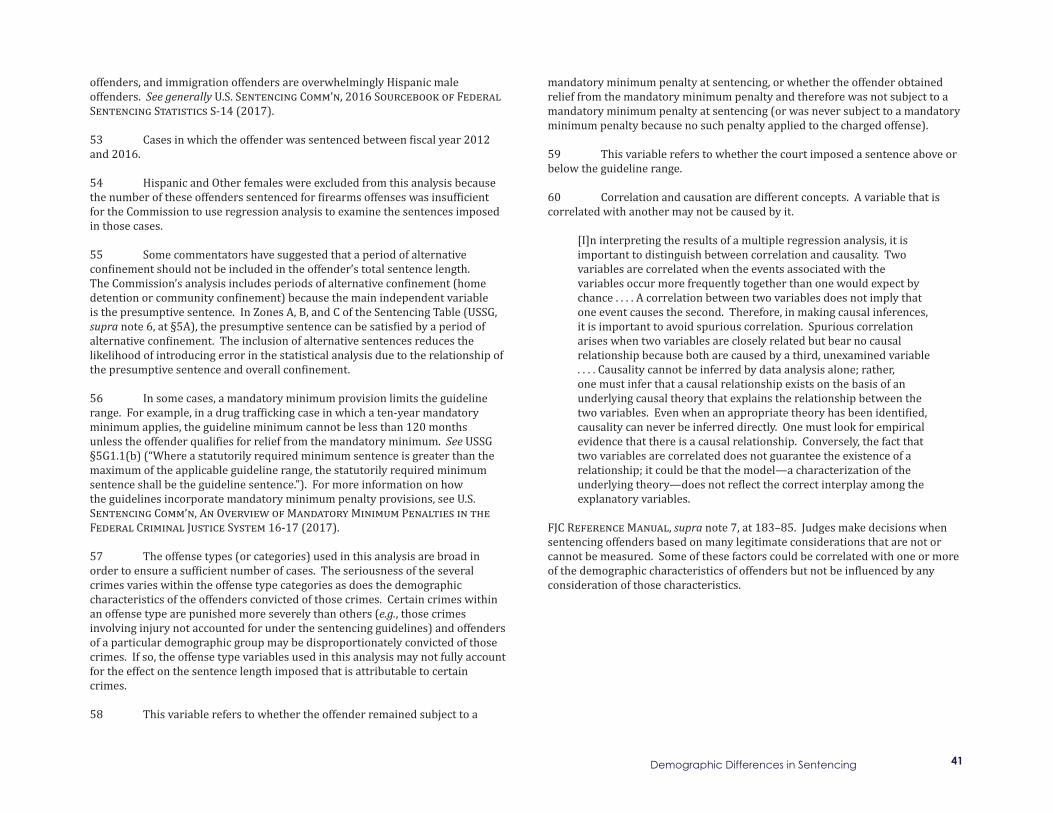
Demographic Differences in Sentencing 41
offenders, and immigration offenders are overwhelmingly Hispanic male offenders. See generally U.S. Sentencing Comm’n, 2016 Sourcebook of Federal Sentencing Statistics S-14 (2017).
53 Cases in which the offender was sentenced between fiscal year 2012 and 2016.
54 Hispanic and Other females were excluded from this analysis because the number of these offenders sentenced for firearms offenses was insufficient for the Commission to use regression analysis to examine the sentences imposed in those cases.
55 Some commentators have suggested that a period of alternative confinement should not be included in the offender’s total sentence length. The Commission’s analysis includes periods of alternative confinement (home detention or community confinement) because the main independent variable is the presumptive sentence. In Zones A, B, and C of the Sentencing Table (USSG, supra note 6, at §5A), the presumptive sentence can be satisfied by a period of alternative confinement. The inclusion of alternative sentences reduces the likelihood of introducing error in the statistical analysis due to the relationship of the presumptive sentence and overall confinement.
56 In some cases, a mandatory minimum provision limits the guideline range. For example, in a drug trafficking case in which a ten-year mandatory minimum applies, the guideline minimum cannot be less than 120 months unless the offender qualifies for relief from the mandatory minimum. See USSG §5G1.1(b) (“Where a statutorily required minimum sentence is greater than the maximum of the applicable guideline range, the statutorily required minimum sentence shall be the guideline sentence.”). For more information on how the guidelines incorporate mandatory minimum penalty provisions, see U.S. Sentencing Comm’n, An Overview of Mandatory Minimum Penalties in the Federal Criminal Justice System 16-17 (2017).
57 The offense types (or categories) used in this analysis are broad in order to ensure a sufficient number of cases. The seriousness of the several crimes varies within the offense type categories as does the demographic characteristics of the offenders convicted of those crimes. Certain crimes within an offense type are punished more severely than others (e.g., those crimes involving injury not accounted for under the sentencing guidelines) and offenders of a particular demographic group may be disproportionately convicted of those crimes. If so, the offense type variables used in this analysis may not fully account for the effect on the sentence length imposed that is attributable to certain crimes.
58 This variable refers to whether the offender remained subject to a
mandatory minimum penalty at sentencing, or whether the offender obtained relief from the mandatory minimum penalty and therefore was not subject to a mandatory minimum penalty at sentencing (or was never subject to a mandatory minimum penalty because no such penalty applied to the charged offense).
59 This variable refers to whether the court imposed a sentence above or below the guideline range.
60 Correlation and causation are different concepts. A variable that is correlated with another may not be caused by it.
[I]n interpreting the results of a multiple regression analysis, it is important to distinguish between correlation and causality. Two variables are correlated when the events associated with the variables occur more frequently together than one would expect by chance . . . . A correlation between two variables does not imply that one event causes the second. Therefore, in making causal inferences, it is important to avoid spurious correlation. Spurious correlation arises when two variables are closely related but bear no causal relationship because both are caused by a third, unexamined variable . . . . Causality cannot be inferred by data analysis alone; rather, one must infer that a causal relationship exists on the basis of an underlying causal theory that explains the relationship between the two variables. Even when an appropriate theory has been identified, causality can never be inferred directly. One must look for empirical evidence that there is a causal relationship. Conversely, the fact that two variables are correlated does not guarantee the existence of a relationship; it could be that the model—a characterization of the underlying theory—does not reflect the correct interplay among the explanatory variables.
FJC Reference Manual, supra note 7, at 183–85. Judges make decisions when sentencing offenders based on many legitimate considerations that are not or cannot be measured. Some of these factors could be correlated with one or more of the demographic characteristics of offenders but not be influenced by any consideration of those characteristics.

Demographic Differences in Sentencing42

Demographic Differences in Sentencing 43