Demographic Challenges and Opportunities in the Waikato Region: An A-B-C Approach to Population...
42
Demographic Challenges and Opportunities in the Waikato Region: An A-B-C Approach to Population Ageing HAMILTON in Context Natalie Jackson © Professor of Demography Director, Population Studies Centre 2010 1
-
Upload
jonathan-lyons -
Category
Documents
-
view
213 -
download
0
Transcript of Demographic Challenges and Opportunities in the Waikato Region: An A-B-C Approach to Population...
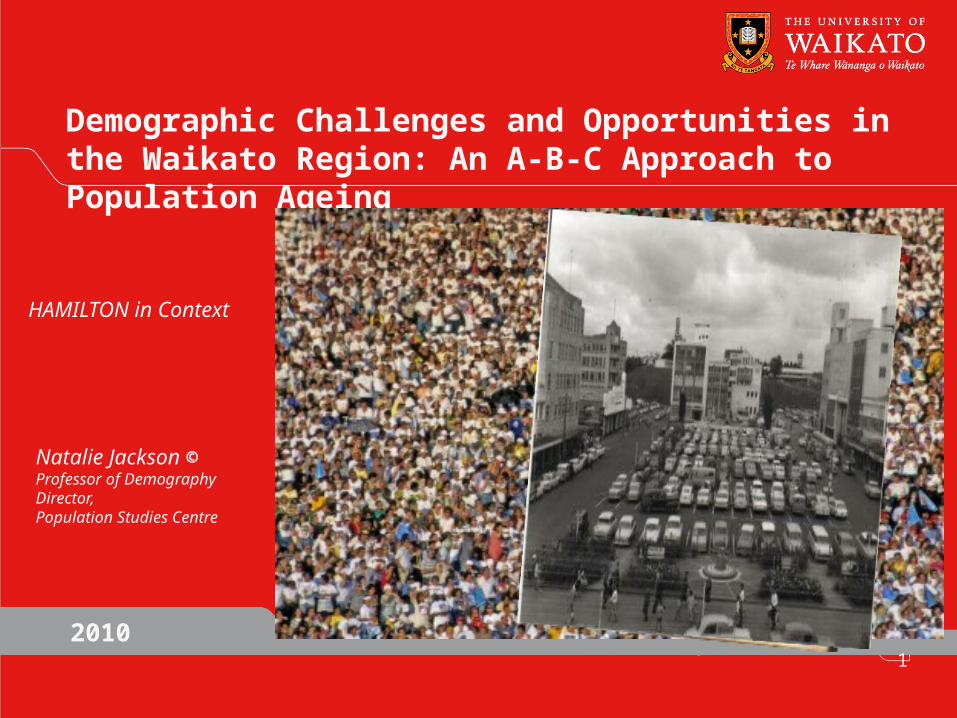
Demographic Challenges and Opportunities in the Waikato Region: An A-B-C Approach to Population Ageing
HAMILTON in Context
Natalie Jackson ©Professor of DemographyDirector, Population Studies Centre
20101
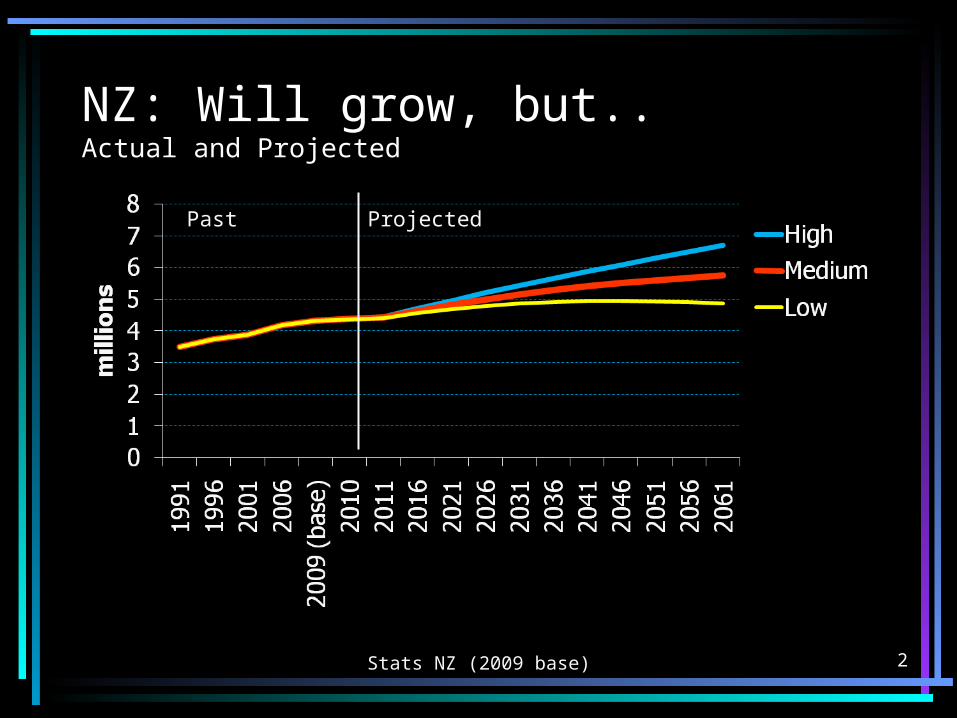
NZ: Will grow, but..Actual and Projected
2Stats NZ (2009 base)
Past Projected
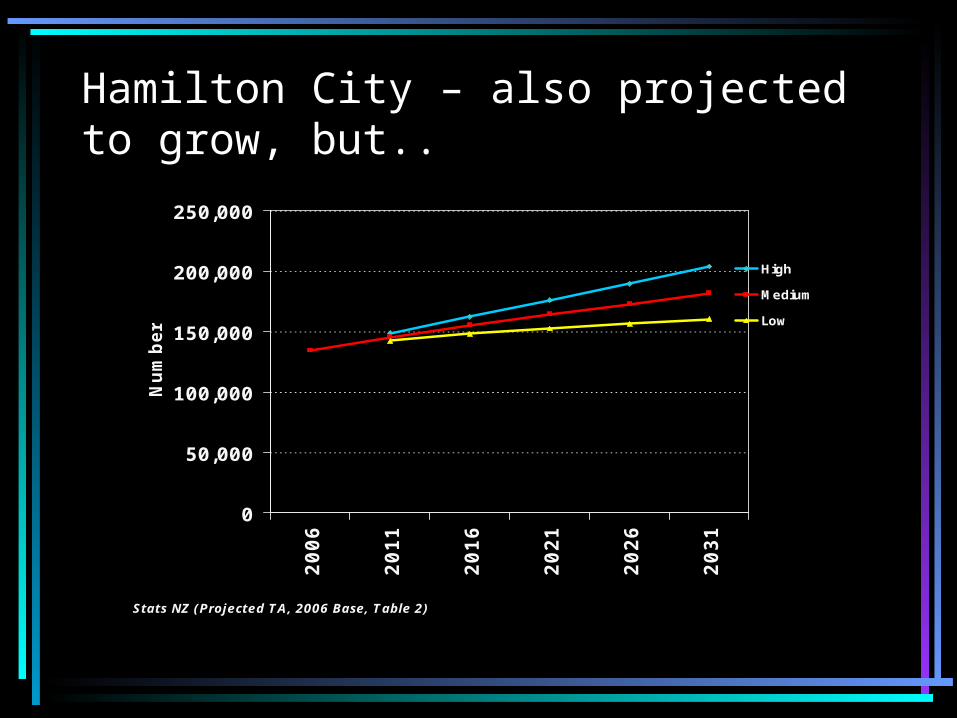
Hamilton City – also projected to grow, but..
0
50,000
100,000
150,000
200,000
250,000
2006
2011
2016
2021
2026
2031
Stats NZ (Projected TA, 2006 Base, Table 2)
Num
ber
High
Medium
Low
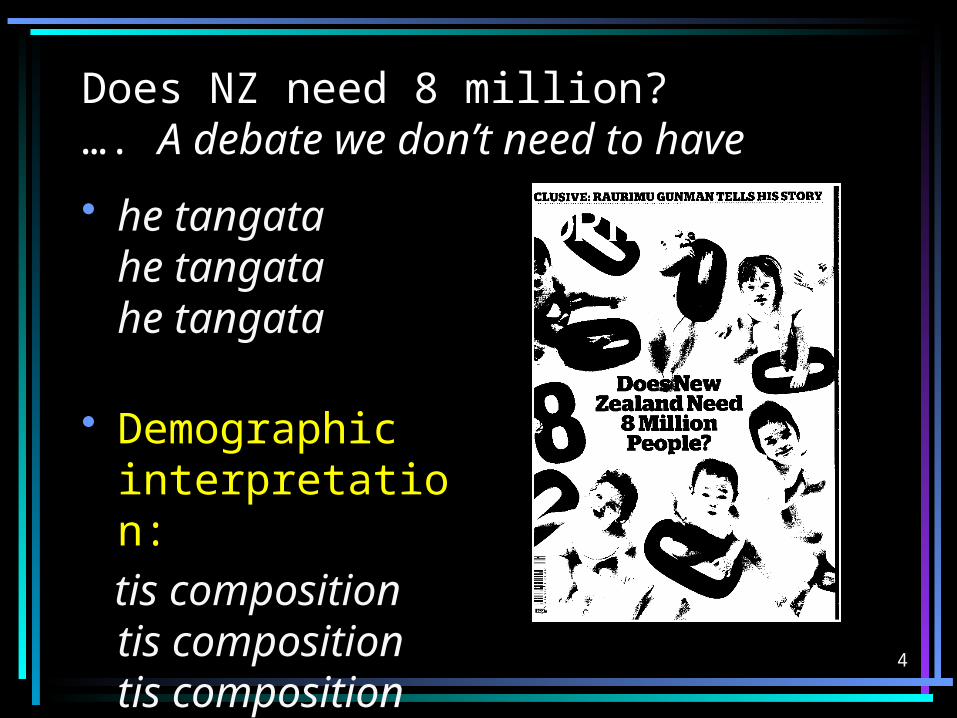
Does NZ need 8 million? …. A debate we don’t need to have
• he tangatahe tangatahe tangata
• Demographic interpretation:
tis compositiontis compositiontis composition
4
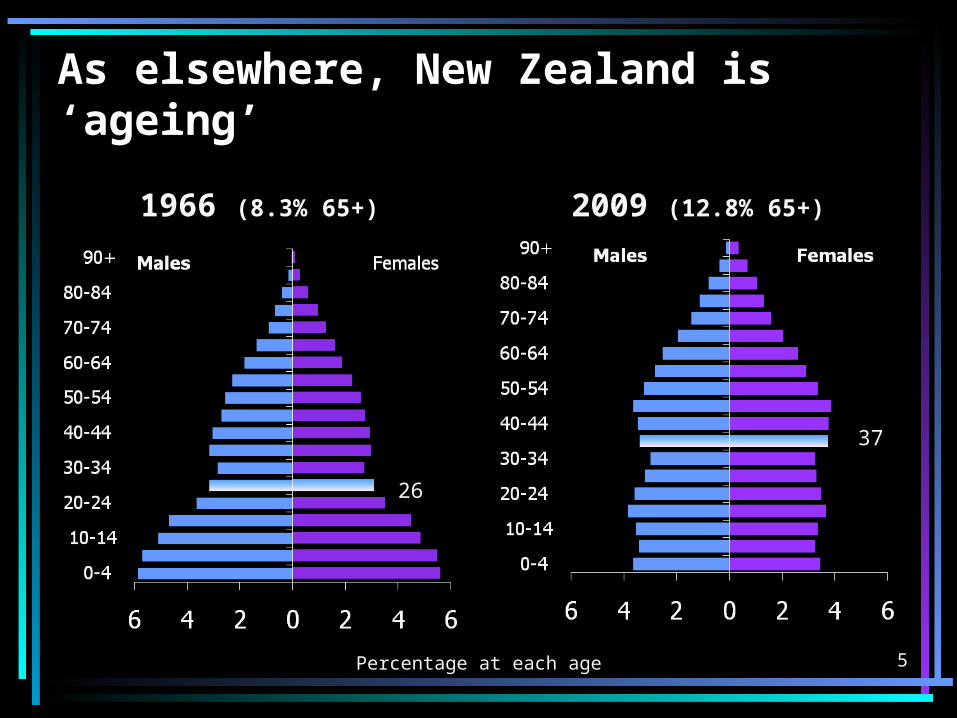
As elsewhere, New Zealand is ‘ageing’
1966 (8.3% 65+) 2009 (12.8% 65+)
Percentage at each age 5
37
26
6
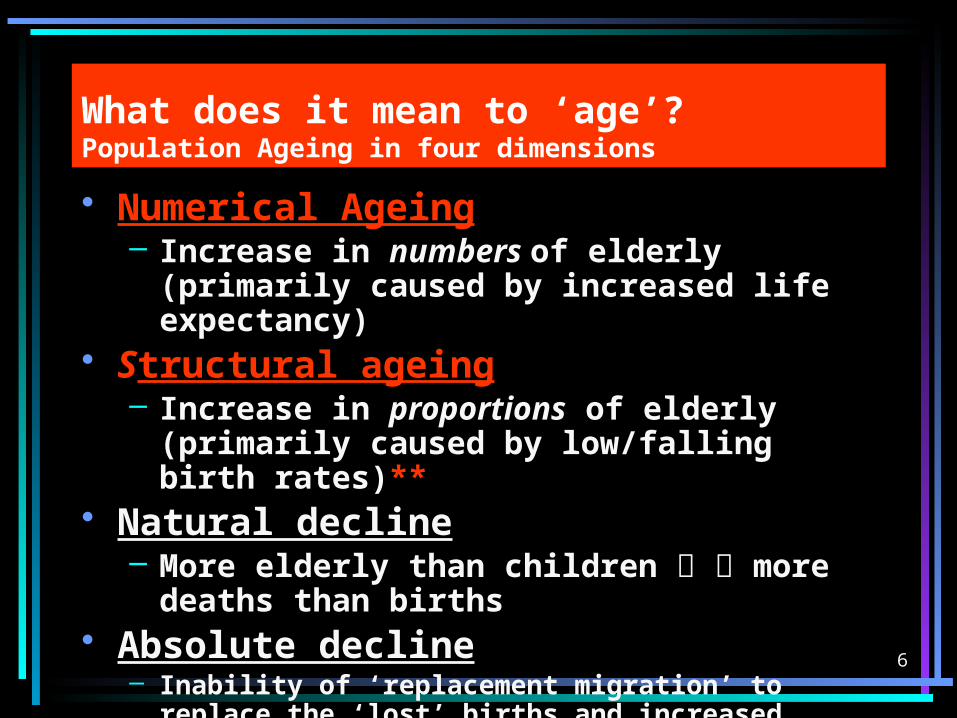
What does it mean to ‘age’?Population Ageing in four dimensions
• Numerical Ageing– Increase in numbers of elderly
(primarily caused by increased life expectancy)
• Structural ageing– Increase in proportions of elderly
(primarily caused by low/falling birth rates)**
• Natural decline– More elderly than children more
deaths than births• Absolute decline
– Inability of ‘replacement migration’ to replace the ‘lost’ births and increased deaths
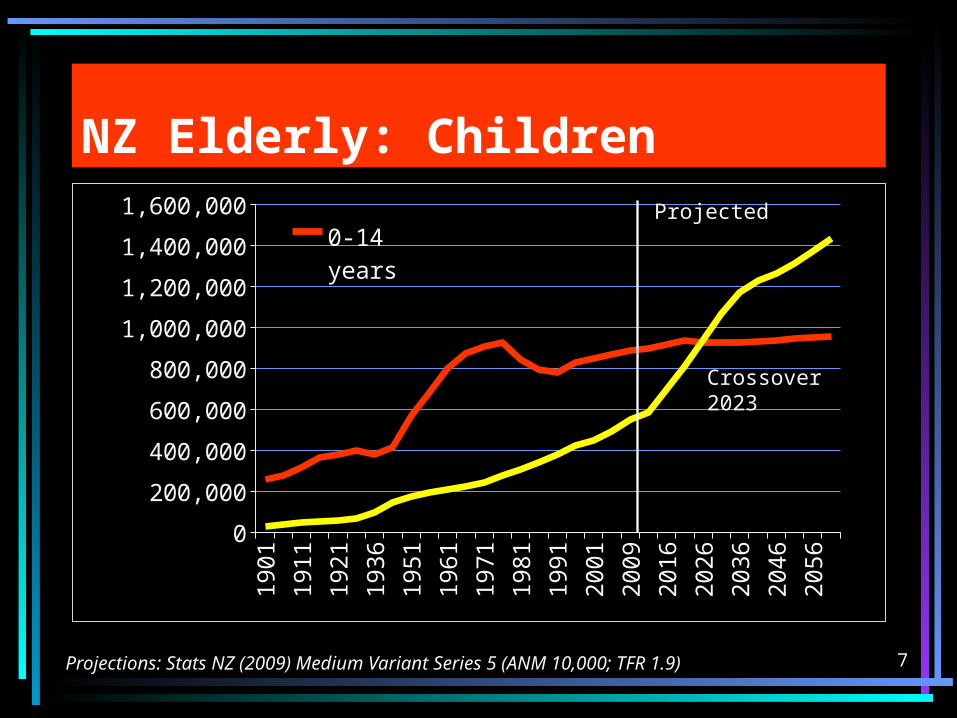
NZ Elderly: Children
1901
1911
1921
1936
1951
1961
1971
1981
1991
2001
2009
2016
2026
2036
2046
2056
0
200,000
400,000
600,000
800,000
1,000,000
1,200,000
1,400,000
1,600,0000-14 years
Num
ber
7
Projected
Crossover 2023
Projections: Stats NZ (2009) Medium Variant Series 5 (ANM 10,000; TFR 1.9)
8
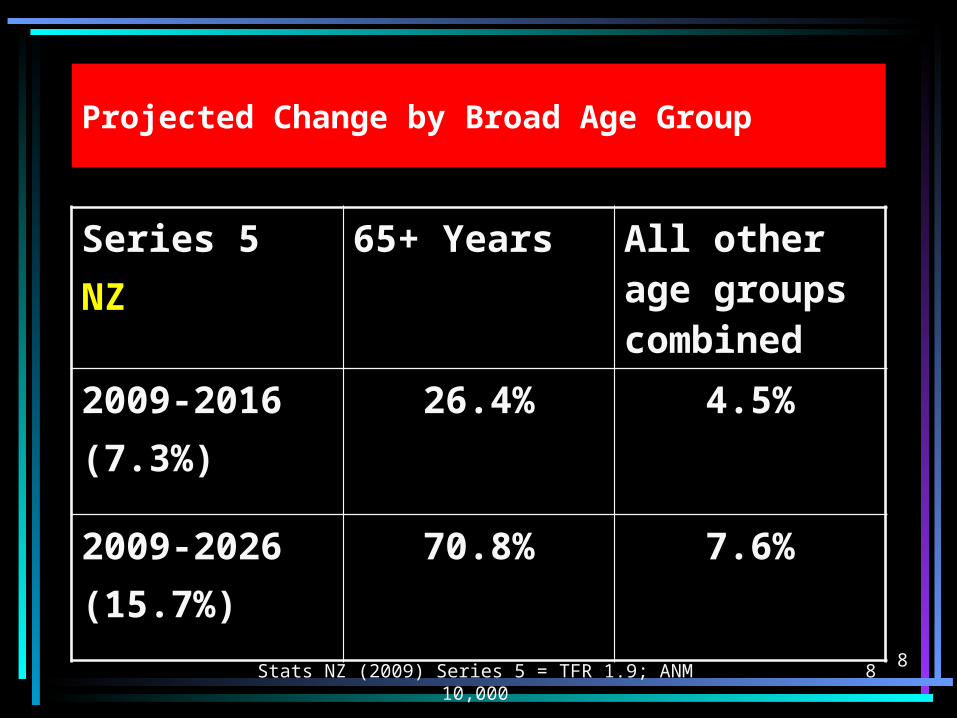
Projected Change by Broad Age Group
Series 5NZ
65+ Years All other age groups combined
2009-2016(7.3%)
26.4% 4.5%
2009-2026(15.7%)
70.8% 7.6%
8Stats NZ (2009) Series 5 = TFR 1.9; ANM 10,000
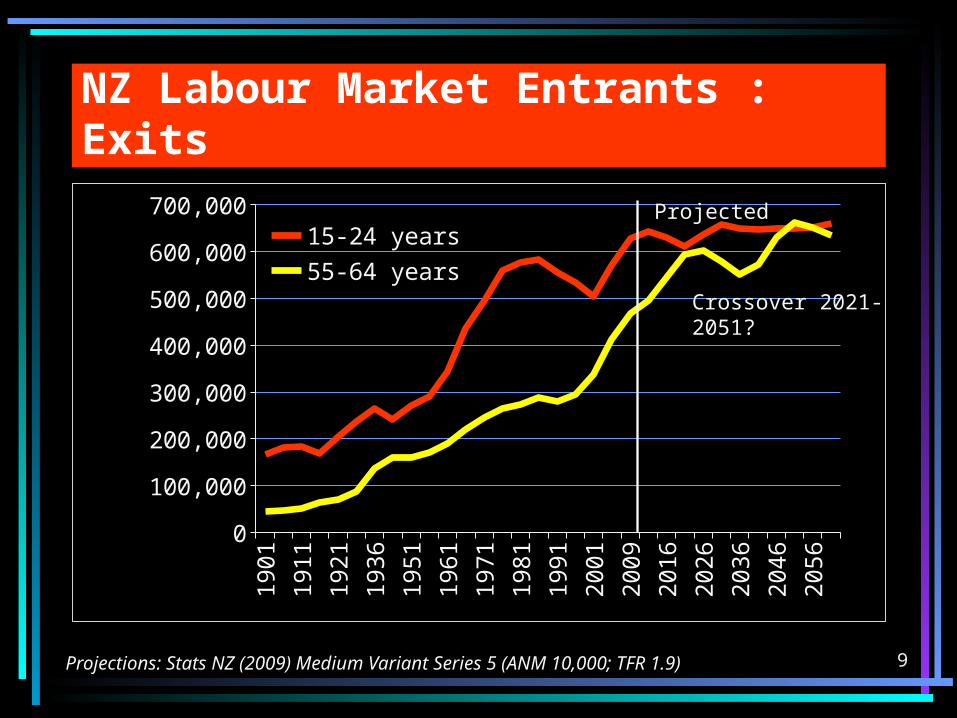
NZ Labour Market Entrants : Exits
1901
1911
1921
1936
1951
1961
1971
1981
1991
2001
2009
2016
2026
2036
2046
2056
0
100,000
200,000
300,000
400,000
500,000
600,000
700,00015-24 years55-64 years
Num
ber
9
Projected
Crossover 2021-2051?
Projections: Stats NZ (2009) Medium Variant Series 5 (ANM 10,000; TFR 1.9)
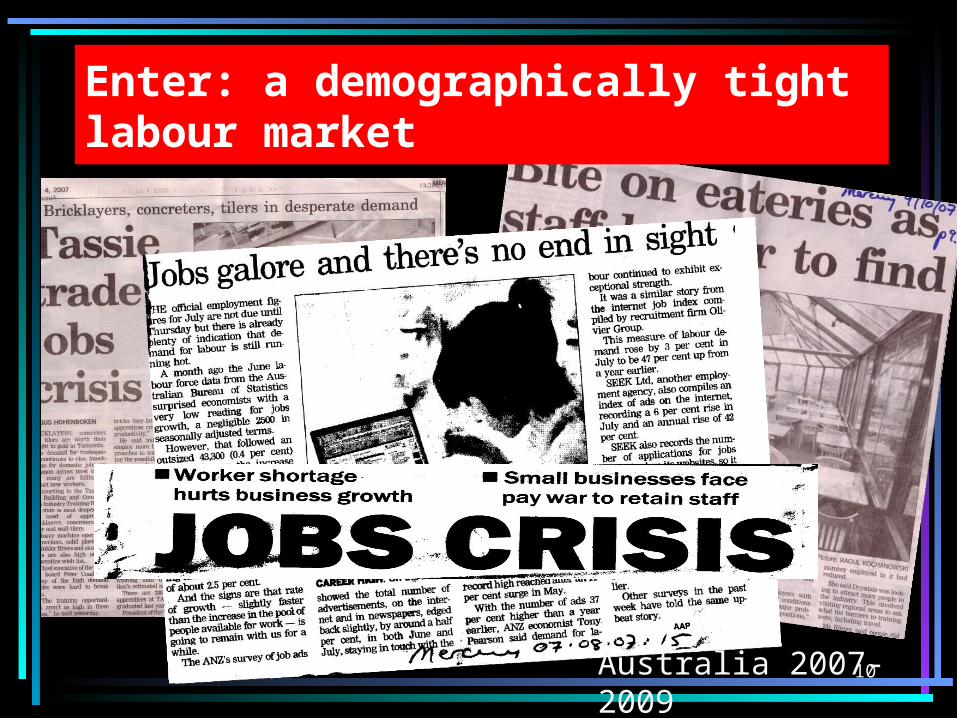
Enter: a demographically tight labour market
Australia 2007-200910
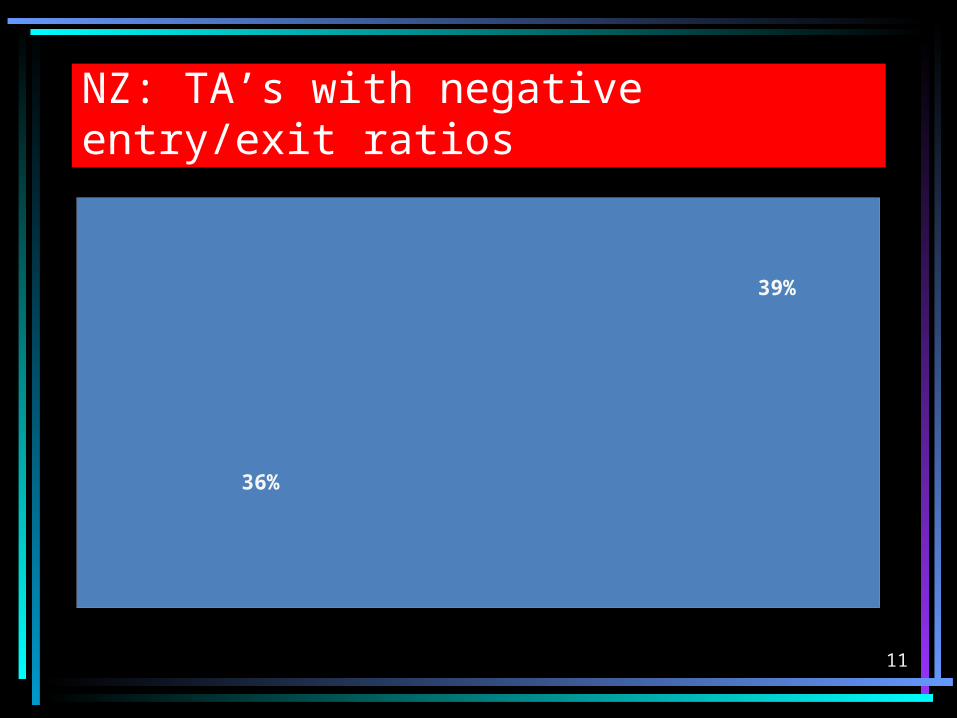
NZ: TA’s with negative entry/exit ratios
26
27
27
28
28
29
29
30
2006 2007 2008 2009
Perc
enta
ge
11
39%
36%
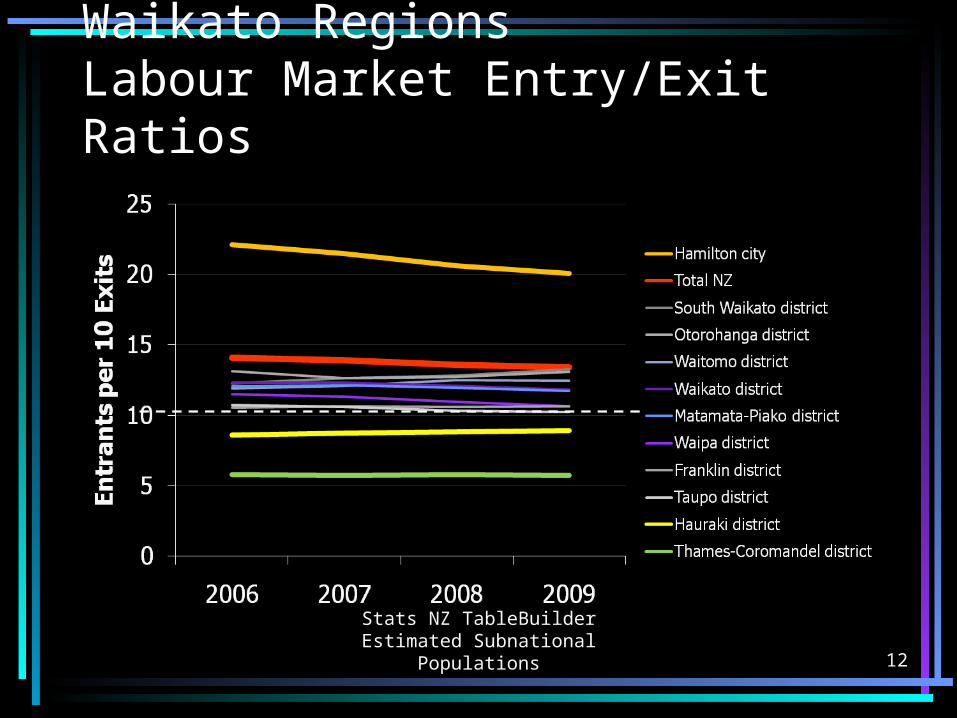
Waikato RegionsLabour Market Entry/Exit Ratios
12Stats NZ TableBuilder Estimated
Subnational Populations

13
14
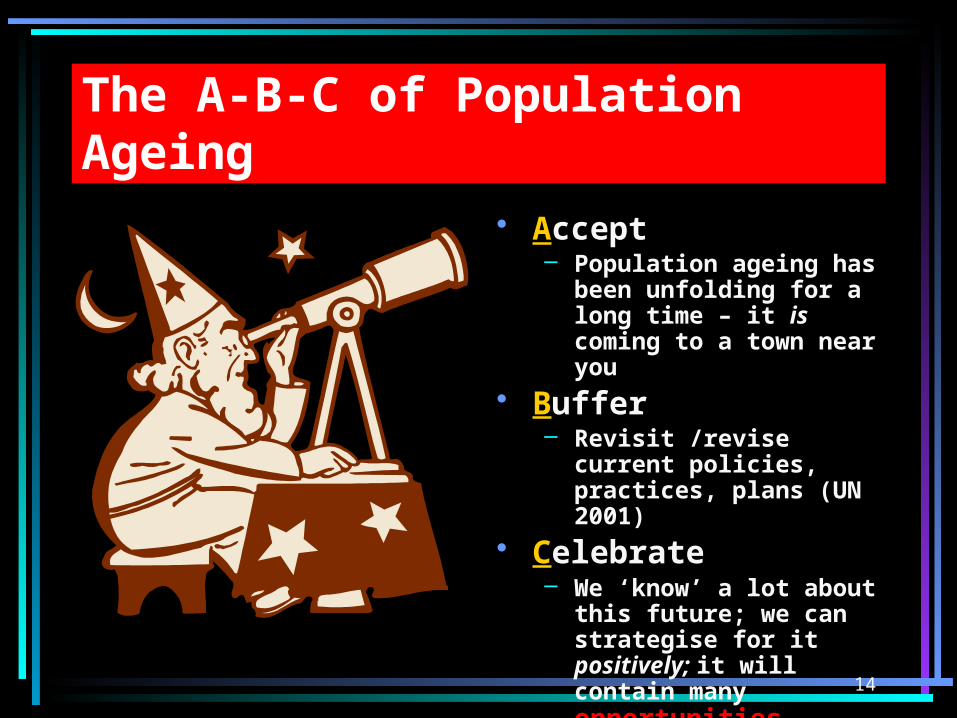
The A-B-C of Population Ageing
• Accept– Population ageing has
been unfolding for a long time – it is coming to a town near you
• Buffer – Revisit /revise current
policies, practices, plans (UN 2001)
• Celebrate– We ‘know’ a lot about
this future; we can strategise for it positively; it will contain many opportunities
Challenges and Opportunities
for the Waikato
A story in age structures
15
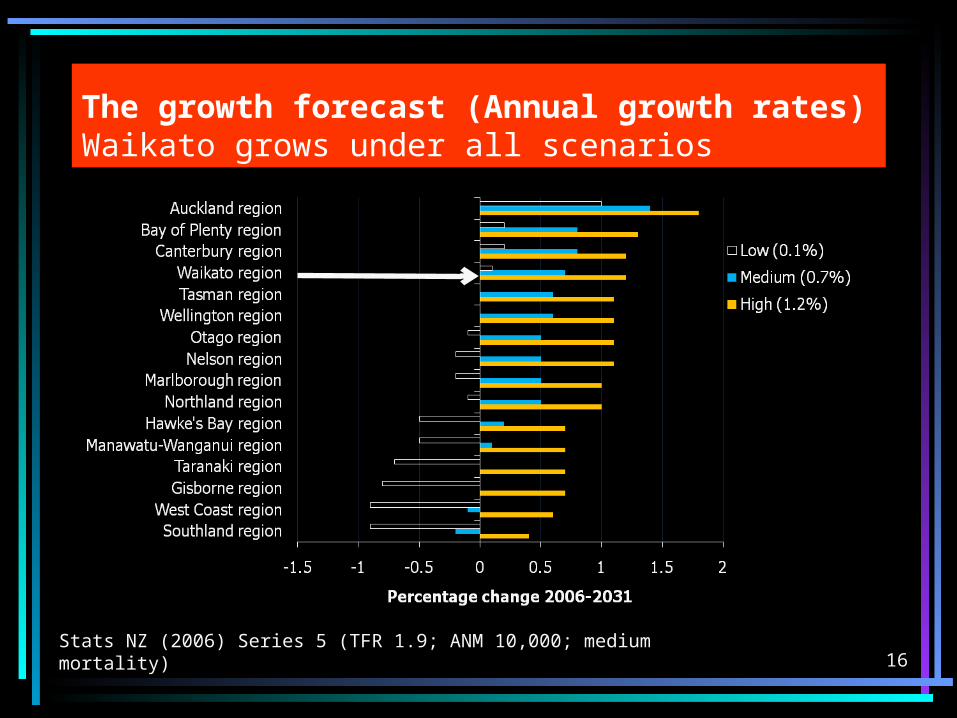
The growth forecast (Annual growth rates)Waikato grows under all scenarios
16Stats NZ (2006) Series 5 (TFR 1.9; ANM 10,000; medium mortality)
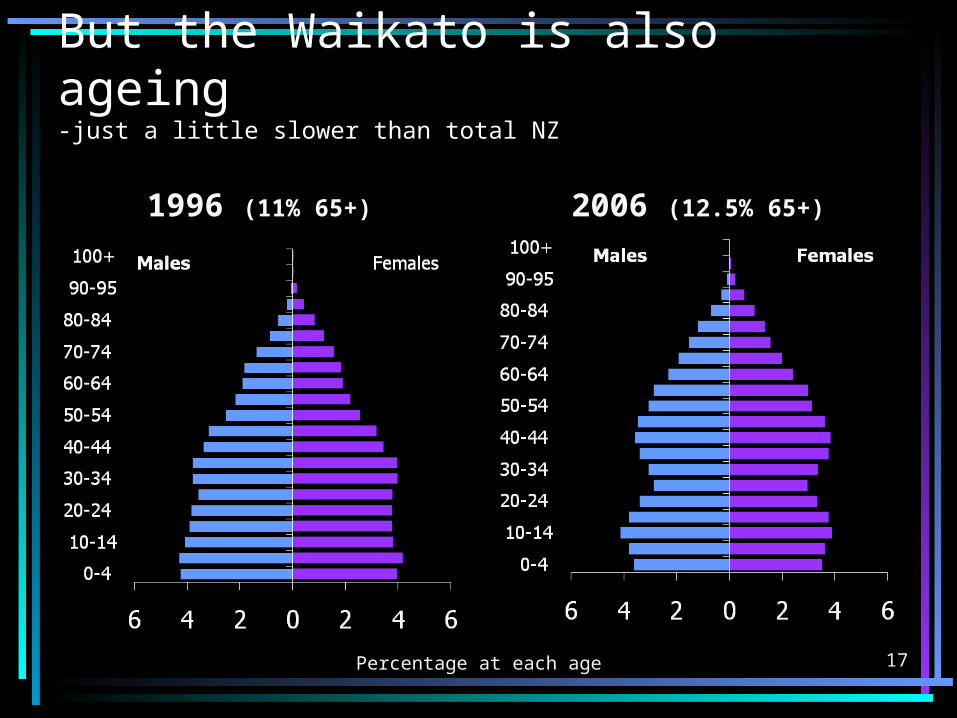
But the Waikato is also ageing-just a little slower than total NZ
1996 (11% 65+) 2006 (12.5% 65+)
Percentage at each age 17
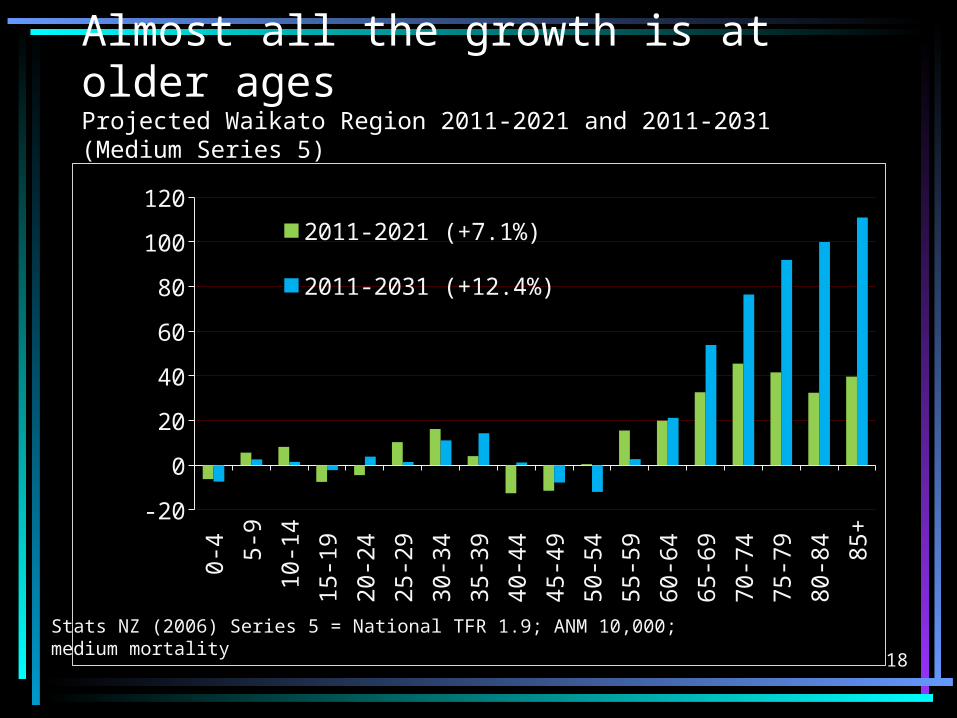
Almost all the growth is at older ages Projected Waikato Region 2011-2021 and 2011-2031 (Medium Series 5)
0-4
5-9
10-1
4
15-1
9
20-2
4
25-2
9
30-3
4
35-3
9
40-4
4
45-4
9
50-5
4
55-5
9
60-6
4
65-6
9
70-7
4
75-7
9
80-8
4
85+
-20
0
20
40
60
80
100
1202011-2021 (+7.1%)
2011-2031 (+12.4%)
age
Perc
enta
ge C
hang
e
18Stats NZ (2006) Series 5 = National TFR 1.9; ANM 10,000; medium mortality
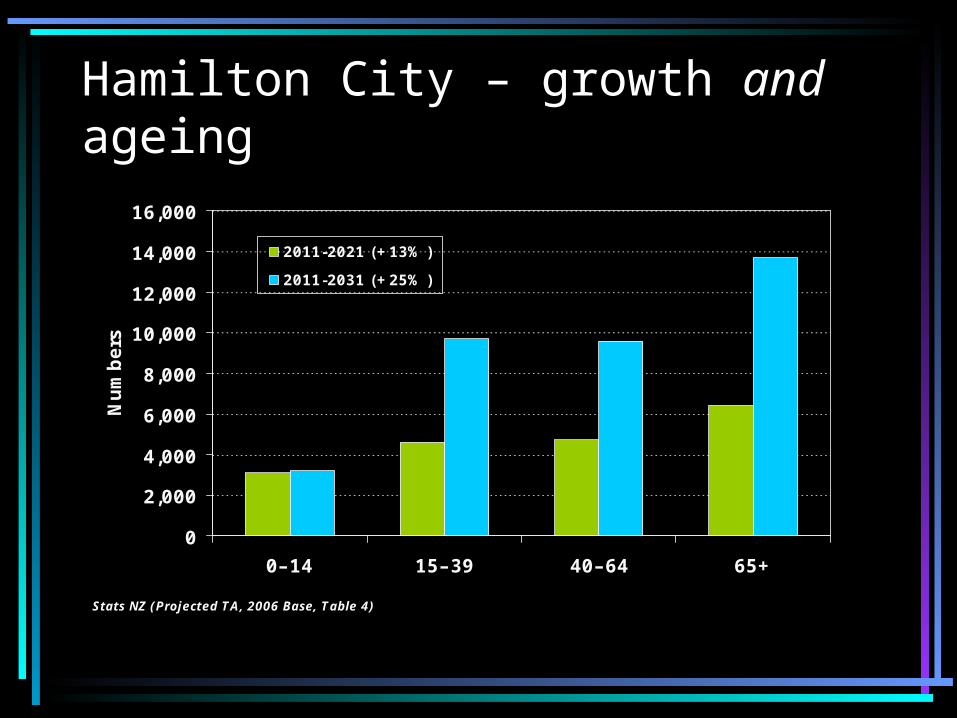
Hamilton City – growth and ageing
0
2,000
4,000
6,000
8,000
10,000
12,000
14,000
16,000
0–14 15–39 40–64 65+
Stats NZ (Projected TA, 2006 Base, Table 4)
Num
bers
2011-2021 (+13% )
2011-2031 (+25% )
20
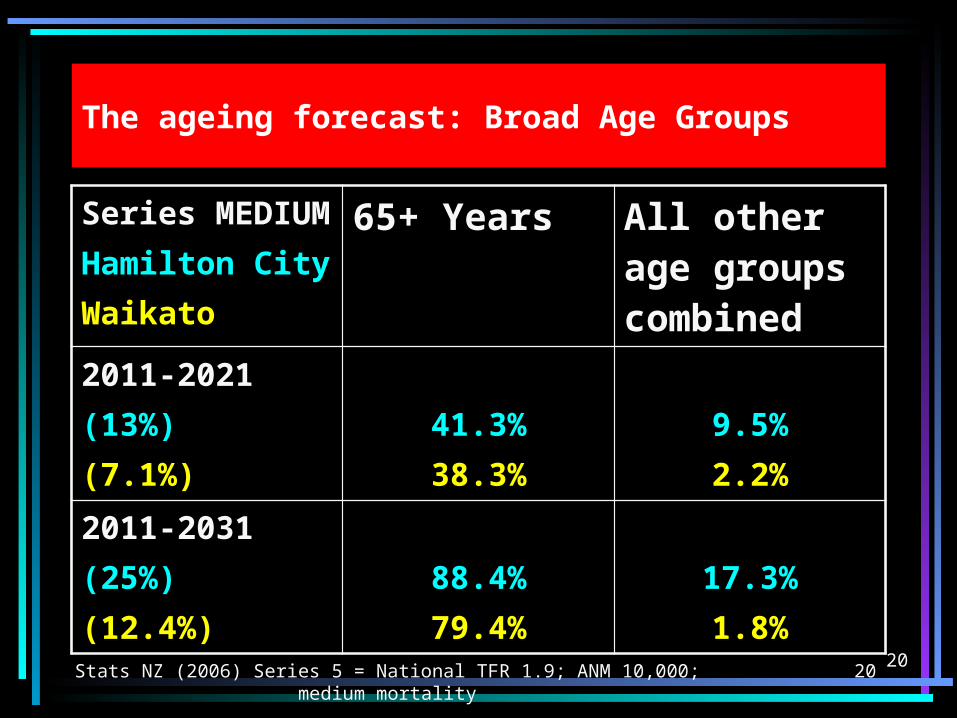
The ageing forecast: Broad Age Groups
Series MEDIUMHamilton CityWaikato
65+ Years All other age groups combined
2011-2021(13%)(7.1%)
41.3%38.3%
9.5%2.2%
2011-2031(25%)(12.4%)
88.4%79.4%
17.3%1.8%
20Stats NZ (2006) Series 5 = National TFR 1.9; ANM 10,000; medium mortality
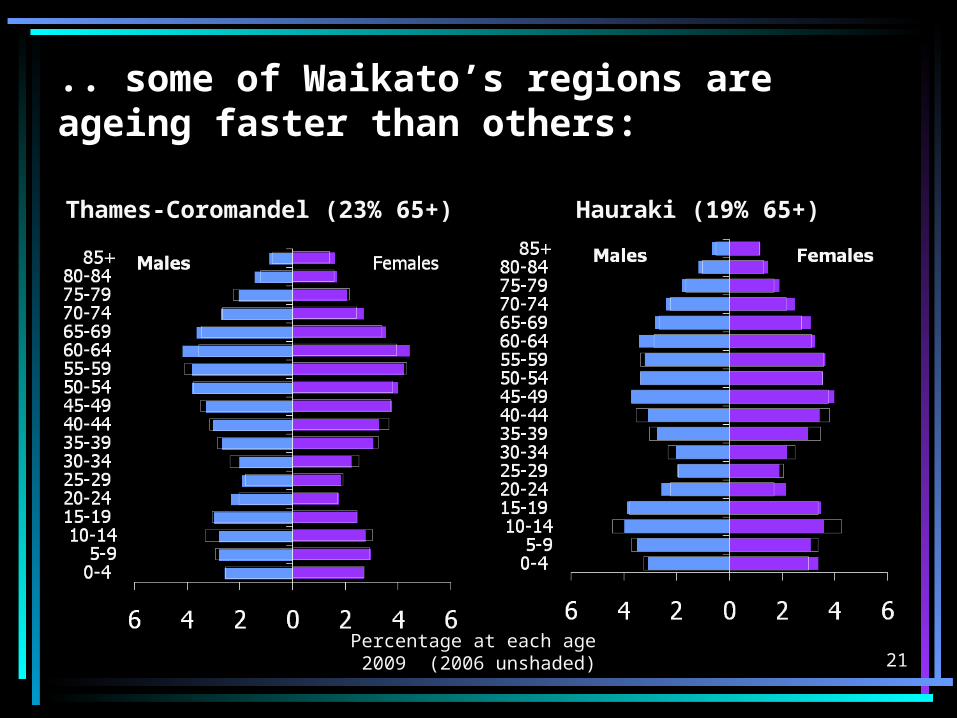
.. some of Waikato’s regions are ageing faster than others:
Thames-Coromandel (23% 65+) Hauraki (19% 65+)
Percentage at each age 2009 (2006 unshaded) 21
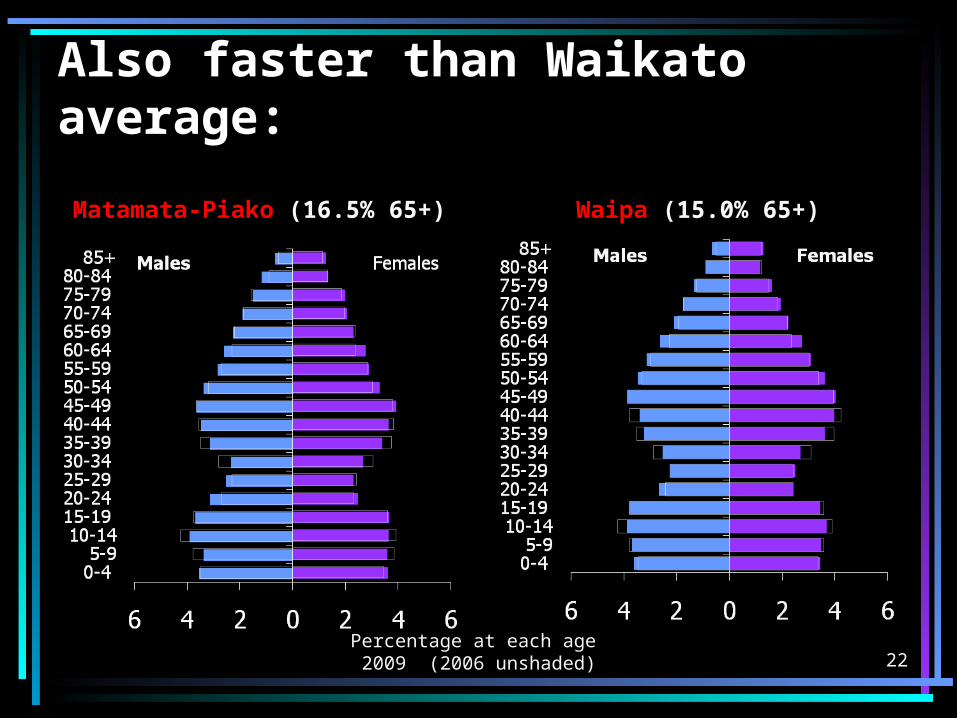
Also faster than Waikato average:
Matamata-Piako (16.5% 65+) Waipa (15.0% 65+)
Percentage at each age 2009 (2006 unshaded) 22
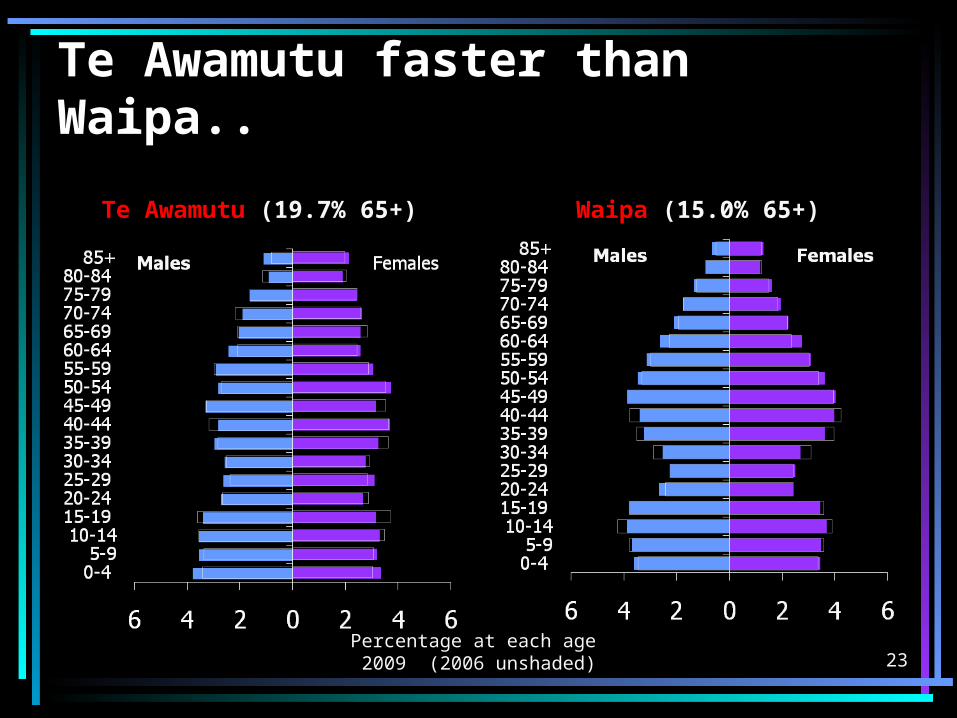
Te Awamutu faster than Waipa..
Te Awamutu (19.7% 65+) Waipa (15.0% 65+)
Percentage at each age 2009 (2006 unshaded) 23
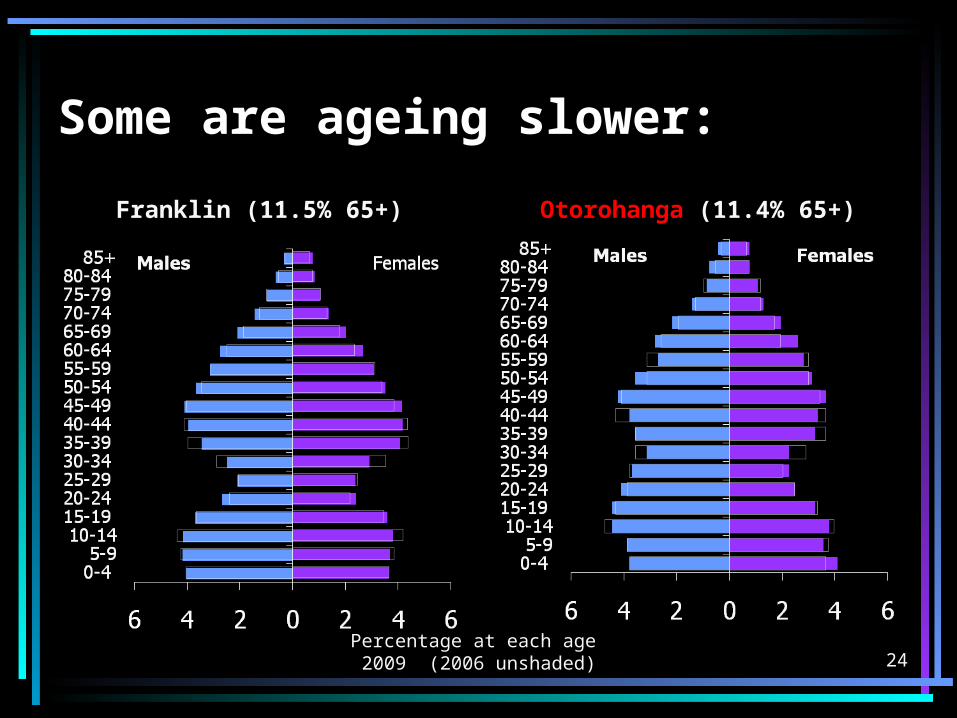
Some are ageing slower:
Franklin (11.5% 65+) Otorohanga (11.4% 65+)
Percentage at each age 2009 (2006 unshaded) 24
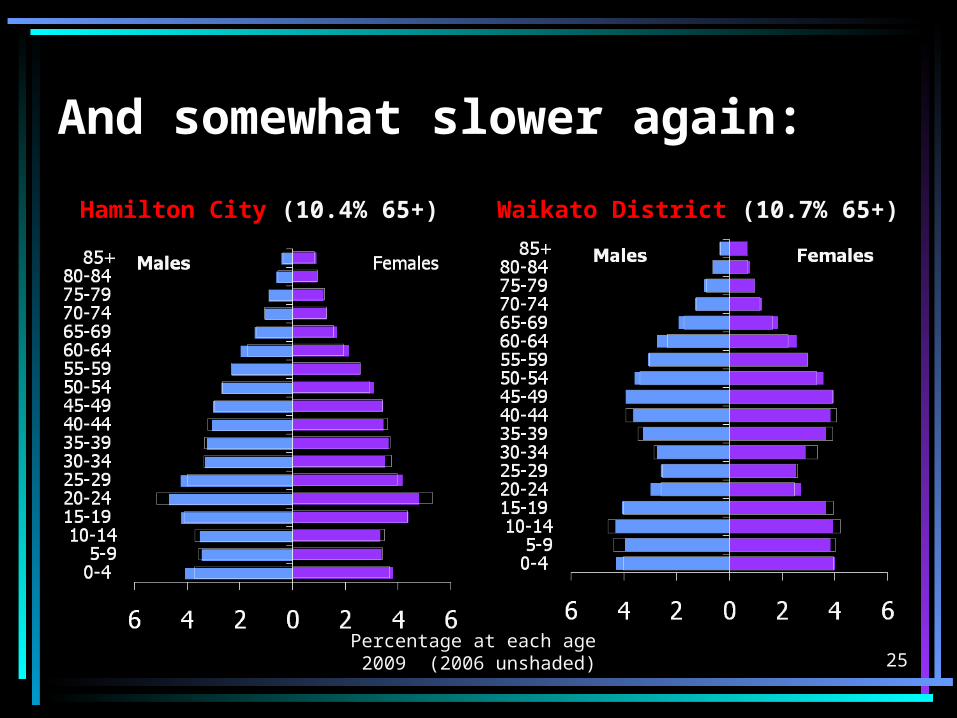
And somewhat slower again:
Hamilton City (10.4% 65+) Waikato District (10.7% 65+)
Percentage at each age 2009 (2006 unshaded) 25

26
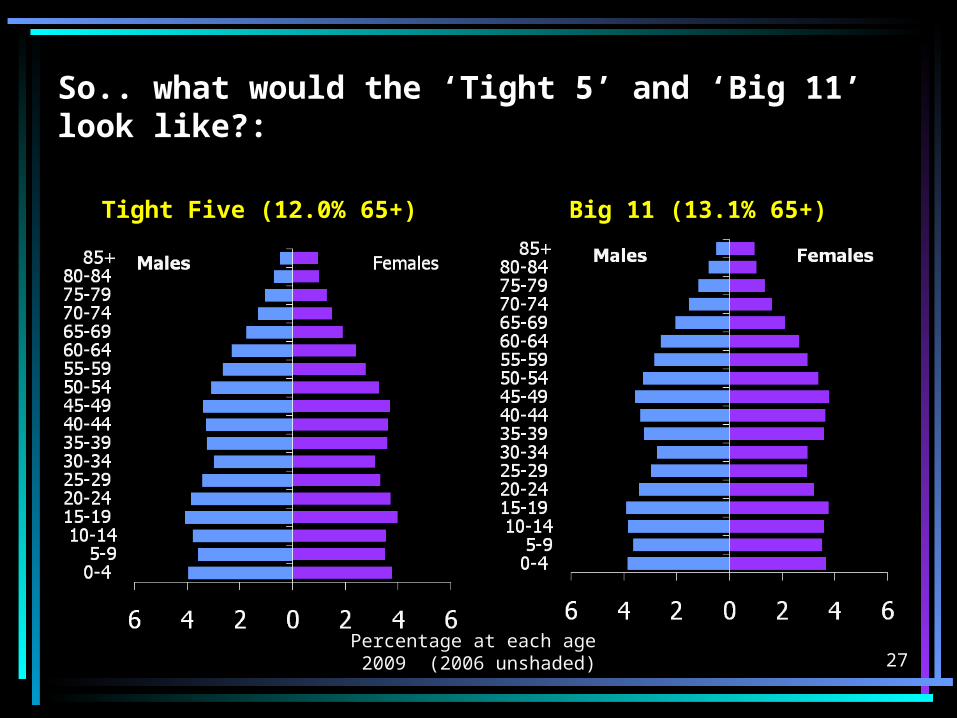
So.. what would the ‘Tight 5’ and ‘Big 11’ look like?:
Tight Five (12.0% 65+) Big 11 (13.1% 65+)
Percentage at each age 2009 (2006 unshaded) 27
How well would such amalgamations serve the underlying demographic constituencies?
Competition for workers
End of unemployment?
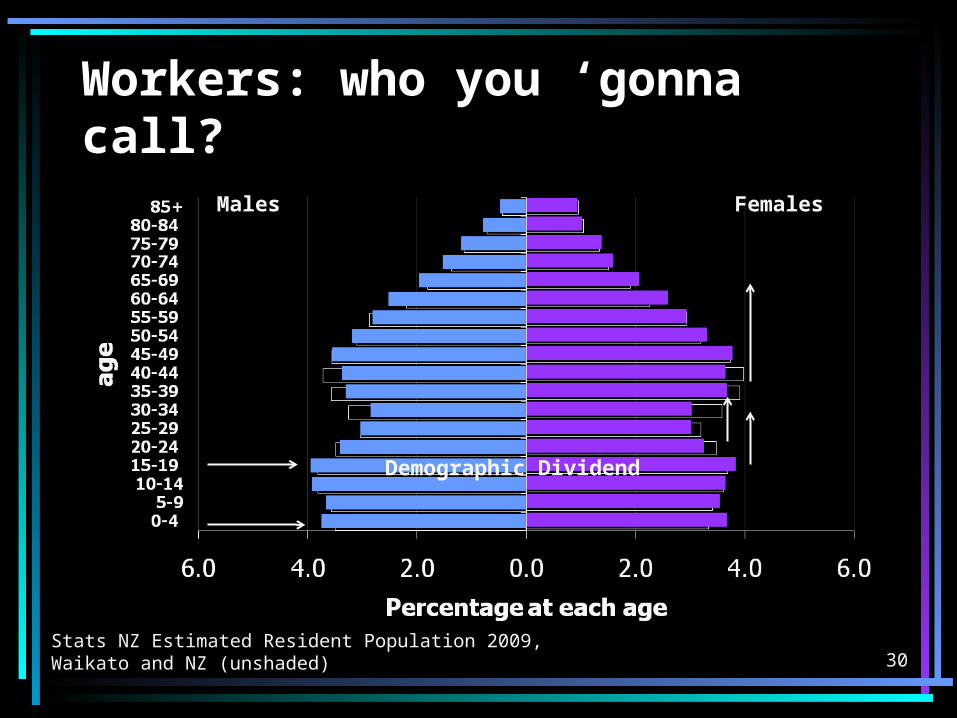
Workers: who you ‘gonna call?
30Stats NZ Estimated Resident Population 2009, Waikato and NZ (unshaded)
Males Females
Demographic Dividend

A challenge.. and an opportunity
31

Who will be the workers?
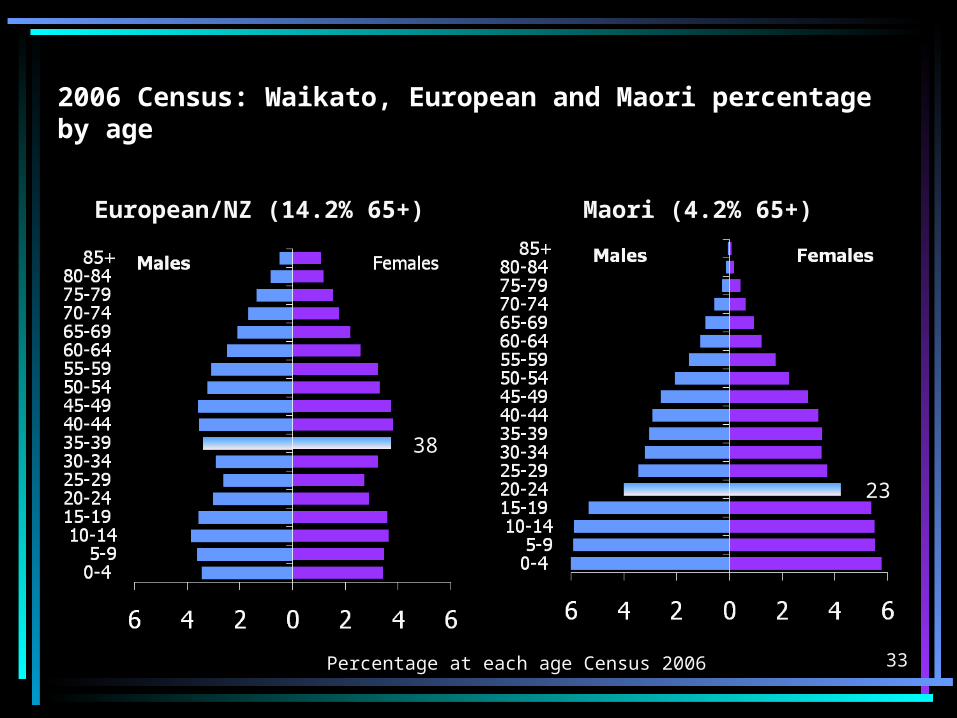
2006 Census: Waikato, European and Maori percentage by age
European/NZ (14.2% 65+) Maori (4.2% 65+)
Percentage at each age Census 2006 33
38
23
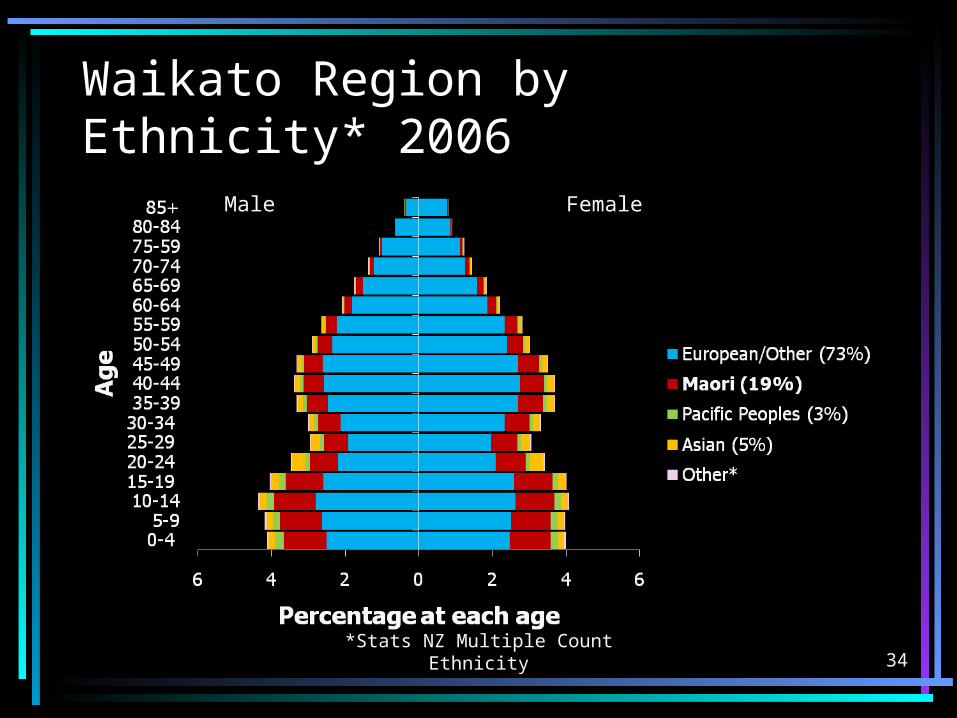
Waikato Region by Ethnicity* 2006
34
Male Female
*Stats NZ Multiple Count Ethnicity

Hamilton City by Ethnicity* 2006
35
Male Female
*Stats NZ Multiple Count Ethnicity

And what will be the industry?
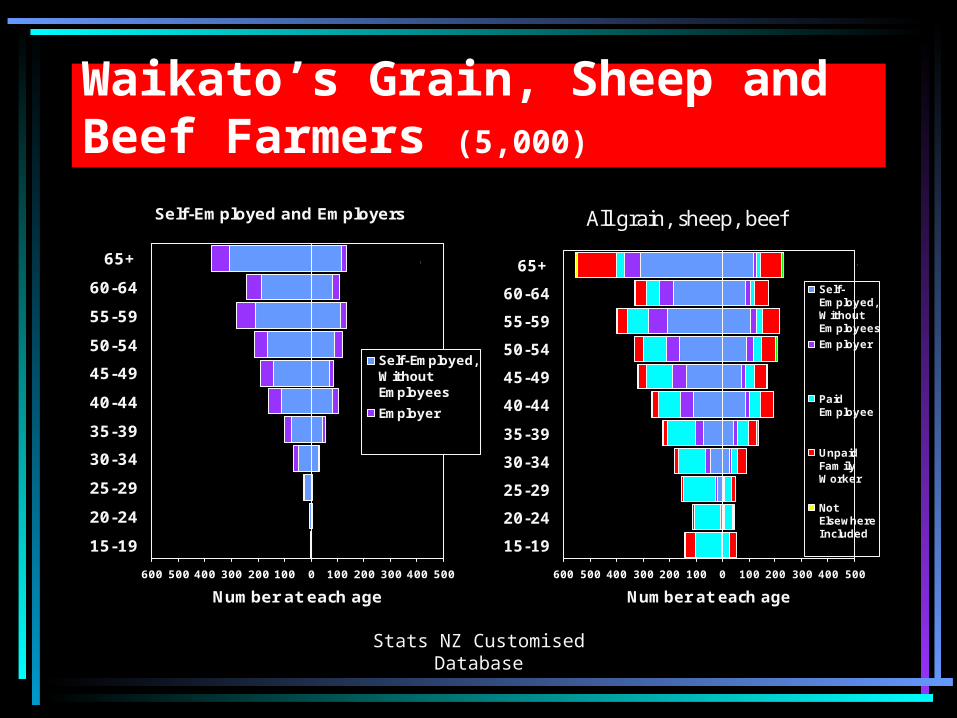
Stats NZ Customised Database
Waikato’s Grain, Sheep and Beef Farmers (5,000)
Self-Employed and Employers
600 500 400 300 200 100 0 100 200 300 400 500
15-19
20-24
25-29
30-34
35-39
40-44
45-49
50-54
55-59
60-64
65+
Number at each age
Self-Employed,WithoutEmployees
Employer
Male Female
All grain, sheep, beef
600 500 400 300 200 100 0 100 200 300 400 500
15-19
20-24
25-29
30-34
35-39
40-44
45-49
50-54
55-59
60-64
65+
Number at each age
Self-Employed,WithoutEmployeesEmployer
PaidEmployee
UnpaidFamilyWorker
NotElsewhereIncluded
Male Female
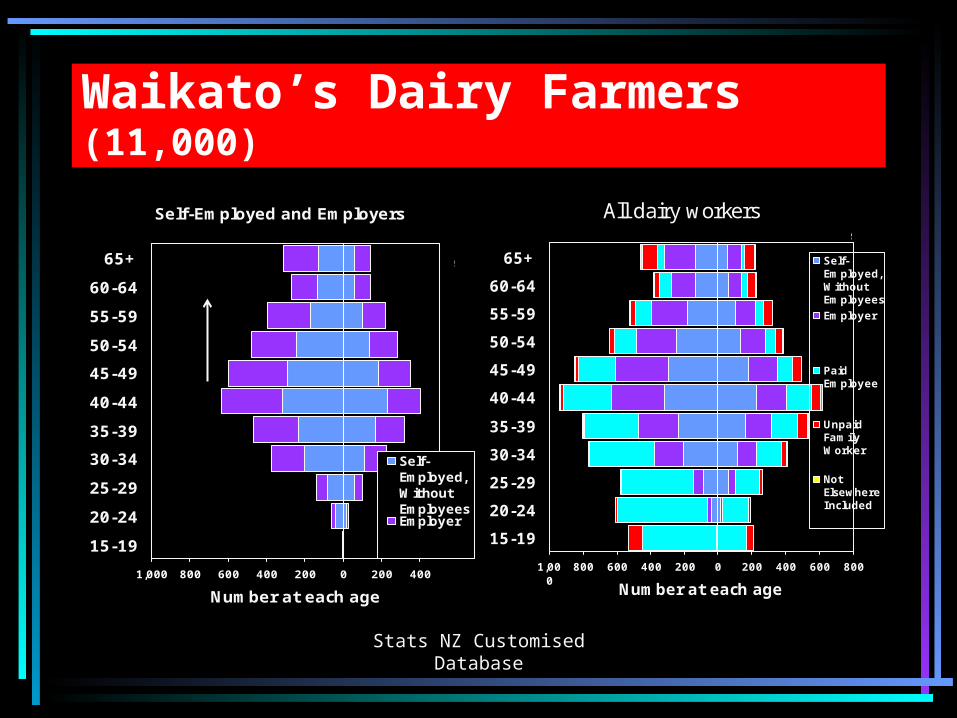
Stats NZ Customised Database
Waikato’s Dairy Farmers (11,000)
Self-Employed and Employers
1,000 800 600 400 200 0 200 400
15-19
20-24
25-29
30-34
35-39
40-44
45-49
50-54
55-59
60-64
65+
Number at each age
Self-Employed,WithoutEmployeesEmployer
Male Female
All dairy workers
1,000
800 600 400 200 0 200 400 600 800
15-19
20-24
25-29
30-34
35-39
40-44
45-49
50-54
55-59
60-64
65+
Number at each age
Self-Employed,WithoutEmployeesEmployer
PaidEmployee
UnpaidFamilyWorker
NotElsewhereIncluded
Male
Female
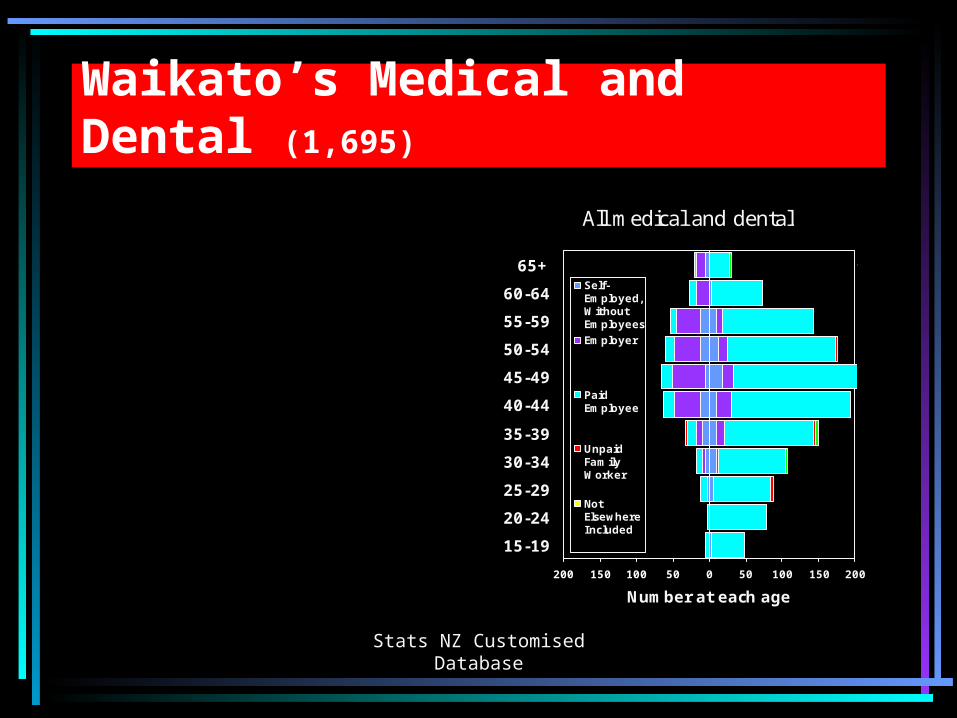
Stats NZ Customised Database
Waikato’s Medical and Dental (1,695)
All medical and dental
200 150 100 50 0 50 100 150 200
15-19
20-24
25-29
30-34
35-39
40-44
45-49
50-54
55-59
60-64
65+
Number at each age
Self-Employed,WithoutEmployeesEmployer
PaidEmployee
UnpaidFamilyWorker
NotElsewhereIncluded
Male Female

Watch this space..
Accept
Buffer (revisit those policies)
Celebrate (advance warning)
40
41
There is more to population ageing than meets the eye

• Population Studies Centre
• will become NIDEA – The National Institute for Demographic and Economic Analysis – on November 24th 2010
Thankyou
42