Democratic Republic of Congo: Greenhouse gas emissions ... · 2013 The International Institute for...
29
www.iisd.org © 2013 The International Institute for Sustainable Development Democratic Republic of Congo: Greenhouse gas emissions baseline projection Seton Stiebert March 2013
Transcript of Democratic Republic of Congo: Greenhouse gas emissions ... · 2013 The International Institute for...

www.iisd.org © 2013 The International Institute for Sustainable Development
Democratic Republic of Congo: Greenhouse gas emissions baseline projectionSeton Stiebert March 2013

© 2013 The International Institute for Sustainable DevelopmentIISD REPORT MARCH 2013Democratic Republic of Congo: Greenhouse gas emissions baseline projection ii
© 2013 The International Institute for Sustainable DevelopmentPublished by the International Institute for Sustainable Development.
International Institute for Sustainable DevelopmentThe International Institute for Sustainable Development (IISD) contributes to sustainable development by advancing policy recommendations on international trade and investment, economic policy, climate change and energy, and management of natural and social capital, as well as the enabling role of communication technologies in these areas. We report on international negotiations and disseminate knowledge gained through collaborative projects, resulting in more rigorous research, capacity building in developing countries, better networks spanning the North and the South, and better global connections among researchers, practitioners, citizens and policy-makers.
IISD’s vision is better living for all—sustainably; its mission is to champion innovation, enabling societies to live sustainably. IISD is registered as a charitable organization in Canada and has 501(c)(3) status in the United States. IISD receives core operating support from the Government of Canada, provided through the Canadian International Development Agency (CIDA), the International Development Research Centre (IDRC), and from the Province of Manitoba. The Institute receives project funding from numerous governments inside and outside Canada, United Nations agencies, foundations and the private sector.
Head Office161 Portage Avenue East, 6th Floor, Winnipeg, Manitoba, Canada R3B 0Y4 Tel: +1 (204) 958-7700 | Fax: +1 (204) 958-7710 | Website: www.iisd.org
Democratic Republic of Congo: Greenhouse gas emissions baseline projection
March 2013
Written by Seton Stiebert
This project was undertaken with financial support of:
This document is an output from a project funded by Environment Canada. However, the views expressed and information contained in it are not necessarily those of or endorsed by Environment Canada, who can accept no responsibility for such views or information or for any reliance placed on them.

© 2013 The International Institute for Sustainable DevelopmentIISD REPORT MARCH 2013Democratic Republic of Congo: Greenhouse gas emissions baseline projection iii
Table of Contents1.0 Introduction .................................................................................................................................................................................................. 1
2.0 Emissions Baseline ......................................................................................................................................................................................2
2.1 Historical GHG Emissions .................................................................................................................................................................2
2.2 Projection of Baseline Emissions .................................................................................................................................................. 6
3.0 Agriculture .....................................................................................................................................................................................................7
3.1 Methodology and Data ......................................................................................................................................................................7
3.2 Data and Assumptions ..................................................................................................................................................................... 8
3.3 Data Availability and Uncertainty .................................................................................................................................................11
4.0 LULUCF .........................................................................................................................................................................................................12
4.1 Methodology .......................................................................................................................................................................................12
4.2 Data and Assumptions ...................................................................................................................................................................12
4.3 Data Availability and Uncertainty................................................................................................................................................13
5.0 Electricity Generation ...............................................................................................................................................................................14
5.1 Methodology........................................................................................................................................................................................14
5.2 Data and Assumptions....................................................................................................................................................................14
5.3 Data Availability and Uncertainty ................................................................................................................................................15
6.0 Energy Demand ..........................................................................................................................................................................................16
6.1 Methodology .......................................................................................................................................................................................16
6.2 Data and Assumptions ...................................................................................................................................................................16
6.3 Data Availability and Uncertainty ................................................................................................................................................17
7.0 Transportation .............................................................................................................................................................................................18
7.1 Methodology ........................................................................................................................................................................................18
7.2 Data and Assumptions ....................................................................................................................................................................18
7.3 Data availability and Uncertainty .................................................................................................................................................19
8.0 Industrial Processes .................................................................................................................................................................................20
8.1 Methodology ......................................................................................................................................................................................20
8.2 Data and Assumptions ..................................................................................................................................................................20
8.3 Data Availability and Uncertainty ................................................................................................................................................21
9.0 Waste ............................................................................................................................................................................................................22
9.1 Methodology.......................................................................................................................................................................................22
9.2 Data and Assumptions...................................................................................................................................................................22
9.3 Data Availability and Uncertainty ...............................................................................................................................................23
Reference List ......................................................................................................................................................................................................24

© 2013 The International Institute for Sustainable DevelopmentIISD REPORT MARCH 2013Democratic Republic of Congo: Greenhouse gas emissions baseline projection iv
AbbreviationsAFOLU agriculture, forestry and other land use
BAU business as usual
CH4 methane
CO2 carbon dioxide
CO2e carbon dioxide equivalent
DRC Democratic Republic of Congo
FAO Food and Agricultural Organization of the United Nations
GDP gross domestic product
GHG greenhouse gas
Gt gigatonne
GWh gigawatt hour
IPCC Intergovernmental Panel on Climate Change
kg kilogram
ktoe kilotonne oil equivalent
LULUCF land use, land-use change and forestry
MT megatonne
MW megawatt
N2O nitrous oxide
NAMA nationally appropriate mitigation action
TJ terajoule
toe tonnes of oil equivalent

© 2013 The International Institute for Sustainable DevelopmentIISD REPORT MARCH 2013Democratic Republic of Congo: Greenhouse gas emissions baseline projection 1
1.0 Introduction The Democratic Republic of Congo (DRC) is interested in the development of nationally appropriate mitigation actions (NAMAs). This emissions baseline projection report helps to identify the potential of NAMAs to reduce emissions and contributes to building capacity in the DRC to select, design and implement NAMAs.
This report describes the methodology used to develop an emissions baseline projection out to 2030 for the entire DRC economy and by sector. The information is organized by seven sectors: agriculture, land use, land-use change and forestry, energy (both energy supply and energy demand), transportation, industrial processes and waste. This baseline scenario is not suitable for reporting to the United Nations Framework Convention on Climate Change, but is a very strong starting point and can easily be built on. The purpose of developing the baseline emissions projection is to provide a business-as-usual (BAU) or reference scenario against which mitigation policies and measures can be evaluated. As such, the baseline emissions projection should be a plausible and consistent description of how these sectors might evolve in the future in the absence of explicit new policies or regulations directed at greenhouse gas (GHG) emissions.
The report builds on the work the DRC has undertaken to prepare their third national communication to the United Nations Framework Convention on Climate Change. This work includes the development of a GHG inventory and identification of measures to mitigate climate change. Currently, the emissions inventory is only available in draft but includes estimates of GHG emissions between 2000 and 2010.
Section 2 describes and provides context for the overall emissions baseline projection. Sections 3 through 9 provide the specific methodologies and data used to generate an emissions baseline reference case (to 2030) for each of the seven sectors.

© 2013 The International Institute for Sustainable DevelopmentIISD REPORT MARCH 2013Democratic Republic of Congo: Greenhouse gas emissions baseline projection 2
2.0 Emissions BaselineAs illustrated in Figures 2 and Figure 3 on page 5, the reference case included the development of an inventory of historical emissions from 1990 to 2010, and the projection of annual emissions out to 2030. This formed the reference case—or the baseline—against which it is possible to demonstrate the abatement potential of low-carbon development options out to 2030. This baseline is meant to represent a conservative estimate of future emissions that considers existing climate policies and regulations in the DRC and does not reflect aspirational targets and goals under Vision 2030 that will require additional financing. This report focuses on a single baseline reference case for ease of analysis. A more detailed mitigation or low-carbon analysis might assess uncertainty by considering multiple baseline reference cases.
All emission data presented in this section is based on our own modelling results. Details on how these emissions were calculated by sector are provided in Sections 3 through 9.
2.1 Historical GHG EmissionsTrends in historical GHG emissions were based on and calibrated against the draft emissions inventory that is being prepared for the third national communication, which is referred to as the draft inventory in this document (Ministère de l’Environnement, 2012). The draft inventory divides emissions between five major sectors that align with the 1996 Intergovernmental Panel on Climate Change (IPCC) guidelines for conducting emission inventories (IPCC, 1996).
In order to develop this emissions baseline projection, it was necessary to reproduce historical emissions estimated in the draft inventory using appropriate activity data, emission factors and methodologies. We began this process by collecting this data and using a spreadsheet model to calculate historical emissions from 2000 to 2010 using the same Tier 1 methodology approaches undertaken in the draft inventory. This may seem like a duplication of effort; however, it is critically important when developing projections because future changes in emissions are dependent on changes in activity data, as well as potential changes in emission factors and parameters. Reliable emission projections therefore must be based on this type of bottom-up analysis. An additional advantage of reproducing the draft inventory is that assumptions and data are independently reviewed and critically examined, which may lead to more robust and accurate emission inventories in the future. Within this report, we discuss extensively how emission data may be improved over time.
In a few cases, emissions in this report deviate from the draft inventory. Differences between the draft inventory and the emissions baseline projection were informed by a review of the literature and are documented in this report for each of the seven sectors.
The relationship between the seven sectors of the low-carbon analysis and the major IPCC sectors in the draft inventory and 1996 guidelines is set out in Table 1.

© 2013 The International Institute for Sustainable DevelopmentIISD REPORT MARCH 2013Democratic Republic of Congo: Greenhouse gas emissions baseline projection 3
TABLE 1: RELATIONSHIP OF EMISSIONS BASELINE REFERENCE CASE SECTORS TO INVENTORY SECTORS
MITIGATION ANALYSIS SECTORS DRAFT INVENTORY SECTORS (BASED ON 1996 IPCC GUIDELINES)
Energy Demand
EnergyEnergy Supply
Transportation
Industrial Processes Industrial Processes
Agriculture Agriculture
Land Use, Land-Use Change and Forestry (LULUCF) Land Use, Land-Use Change and Forestry (LULUCF)
Waste Waste
Source: IPCC (1996); United Nations Framework Convention on Climate Change (1999)
As there is considerable uncertainty in emissions and removals from the land use, land-use change and forestry (LULUCF) sector, results are presented with and without the LULUCF sector in this report. Figure 1 and Table 2 illustrate the specific sources that contributed to the total estimated emissions in 2010.
FIGURE 1: TOTAL EMISSIONS BY SECTOR IN 2010 (IN MEGATONNES OF CARBON DIOXIDE EQUIVALENT [MTCO2E], EXCLUDING LULUCF)
Agriculture16.03 MTEnergy Demand
7.41 MT
Waste3.02 MT
Transportation1.70 MT
Industrial Processes0.25 MT
Energy Supply0.16 MT

© 2013 The International Institute for Sustainable DevelopmentIISD REPORT MARCH 2013Democratic Republic of Congo: Greenhouse gas emissions baseline projection 4
TABLE 2: HISTORICAL NET EMISSIONS: 2000, 2005 AND 2010 (MTCO2E)
SECTOR 2000 2005 2010
Agriculture 15.90 15.56 16.03
Energy Demand 4.84 6.00 7.41
Waste 2.15 2.54 3.02
Transportation 0.43 1.21 1.70
Industrial Processes 0.12 0.28 0.25
Energy Supply 0.04 0.06 0.16
LULUCF -120 -76.9 -11.5
Total (without LULUCF) 23.5 25.7 28.6
Total (with LULUCF) -96.5 -51.3 17.1
Note: Negative values in the table denote net removals
In the LULUCF sector, removals due to the sequestration of carbon or growth of biomass are larger than emissions resulting in a net sink every year from 2000 to 2010. LULUCF net emissions were estimated to be -120 MT in the year 2000 and -11.5 MT in 2010, where negative emissions denote emission removals or sinks. This historical trend is very significant, as it suggests that the DRC as a whole has moved from being a large net sink (-96 MT in 2000) to a small contributor to global emissions in 2010 (17 MT in 2010).
The agriculture sector is the largest emitting sector, accounting for approximately 56 per cent of non-LULUCF emissions in 2010, mainly due to emissions from livestock. Energy demand is the second largest emitting sector accounting for 25.9 per cent of non-LULUCF emissions in 2010. Energy demand emissions are dominated by methane and nitrous oxide (N2O) emissions from biomass combustion. Waste was the next largest emitting sector in 2010, accounting for about 11 per cent of non-LULUCF emissions, followed by transportation at about 6 per cent.
Figure 2 illustrates the trend in total emissions over time for non-LULUCF sectors and Figure 3 presents both emissions and removals including LULUCF and the resulting net emissions over time.

© 2013 The International Institute for Sustainable DevelopmentIISD REPORT MARCH 2013Democratic Republic of Congo: Greenhouse gas emissions baseline projection 5
FIGURE 2: TOTAL EMISSIONS BY SECTOR 2000-2010 (MTCO2E EXCLUDING LULUCF)
FIGURE 3: TOTAL EMISSIONS BY SECTOR IN 2000–2010 (MTCO2E)
2.2 Projection of Baseline Emissions Projections of growth in activity and changes in emission factors were then used to forecast annual emissions out to 2030 for a baseline or reference case scenario. These growth projections were based primarily on forecasts for economic growth and population change. Results of the baseline projection are illustrated in Figure 4, excluding LULUCF, and
0
5
10
15
20
25
30
2000 2002 2004 2006 2008 2010
Emis
siosn
MTC
O2e
Energy Supply
IndustrialProcessesTransportation
Waste
Energy Demand
Agriculture
-400
-300
-200
-100
0
100
200
300
2000 2002 2004 2006 2008 2010
Emis
sions
(MTC
O2e
)
LULUCFEmissions
Non-LULUCFEmissions
LULUCFRemovals
Net Emissions

© 2013 The International Institute for Sustainable DevelopmentIISD REPORT MARCH 2013Democratic Republic of Congo: Greenhouse gas emissions baseline projection 6
in Figure 5, including LULUCF. These projected emissions to 2030 shape the baseline reference case that is used as the counterfactual against which abatement potential of NAMAs can be demonstrated. Projections of LULUCF sources and removals of GHGs are highly uncertain and based on a simple model that assumes historical trends in changes to carbon stocks will continue. In-country experts may be able to provide better estimates based on more reliable data.
FIGURE 4: EMISSION BASELINE PROJECTIONS (EXCLUDING LULUCF)
FIGURE 5: TOTAL EMISSIONS AND REMOVALS BY SECTOR 2000–2030
0
10
20
30
40
50
60
2000 2005 2010 2015 2020 2025 2030
Emis
sios
n M
TCO
2e
Energy Supply
IndustrialProcessesTransportation
Waste
Energy Demand
Agriculture
-400
-300
-200
-100
0
100
200
300
400
500
2000 2005 2010 2015 2020 2025 2030
Emiss
ions
(MTC
O2e
)
LULUCF Emissions
Non-LULUCF Emissions
LULUCF Removals
Net Emissions

© 2013 The International Institute for Sustainable DevelopmentIISD REPORT MARCH 2013Democratic Republic of Congo: Greenhouse gas emissions baseline projection 7
3.0 Agriculture
3.1 Methodology and DataThe 2006 IPCC guidelines combine the agriculture sector with the forestry and other land-use sectors (AFOLU) for developing emission inventories. This report examines the agriculture sector separately from the forestry and other land-use sector to enable an assessment of agricultural emissions alone. The LULUCF sector analysis includes all carbon releases and sinks that are a result of a land conversion from one type to another.
The agricultural sector does not include energy emissions from fuel combustion, which are included within other sectors, such as the transportation and energy demand sectors.
The agricultural sector is currently the largest net source of GHG emissions of all sectors. More than half of total non-LULUCF emissions are from this sector alone. Despite its prevalence, data required to calculate GHG emissions is lacking and there is higher uncertainty in the calculation of agricultural emissions compared to the energy demand, energy supply and industrial processes.
Four different types of emission sources are considered in a draft inventory and in this analysis:
• Enteric fermentation and manure management from livestock
• Burning of savannah
• Burning of agricultural residues
• Cultivated soils
• Flooding rice
The emissions baseline uses the same Tier 1 methodologies, activity data and emission factors as the draft inventory with only a few differences. These differences and the impact on emissions are summarized in Table 3.
TABLE 3: DIFFERENCES BETWEEN DRAFT INVENTORY AND EMISSIONS BASELINE: THE AGRICULTURE SECTOR
EMISSION SOURCE CHANGE IN METHODOLOGY OR DATA REASON FOR CHANGE FROM DRAFT INVENTORY IMPACT ON EMISSIONS
Burning of savannah Uses default IPCC factors for percentage of area burned (38 per cent for soudano-zambezienne and 75 per cent for Guineene), as opposed to 100 per cent.
Assumption of 100 per cent of area burned annually was not substantiated
GHG emissions reduced 54 per cent compared to inventory
Burning of agricultural residues
Uses default IPCC factors for fraction of biomass burned in fields, as opposed to 100 per cent
Assumption of 100 per cent fraction of biomass burned in fields was not substantiated
GHG emissions reduced 20 per cent compared to inventory

© 2013 The International Institute for Sustainable DevelopmentIISD REPORT MARCH 2013Democratic Republic of Congo: Greenhouse gas emissions baseline projection 8
3.2 Data and Assumptions
Enteric Fermentation and Manure Management Emissions from LivestockHistoric livestock populations were obtained directly from the draft inventory and are summarized in Table 4.
TABLE 4: HISTORIC LIVESTOCK POPULATION (HEAD OF LIVESTOCK)
2000 2005 2006 2007 2008 2009 2010
Non-dairy cattle 822,355 758,940 755,500 754,630 752,638 751,200 749,779
Sheep 924,924 899,570 900,470 901,370 902,970 903,170 904,070
Goats 4,131,321 4,021,920 4,027,950 4,033,990 4,040,040 4,046,100 4,052,169
Pigs 1,048,716 959,080 961,090 963,110 965,130 967,160 969,182
Poultry 21,559,000 19,769,000 19,828,437 19,887,922 19,947,586 20,007,429 20,067,451
Source: Ministère de l’Environnement (2012)
Default emission factors to calculate emissions were taken from the 2006 IPCC guidelines, and are based on regional defaults for Africa and developing countries. They are provided in Table 5 below. Emission factors were not reported directly in the draft inventory, but overall emissions calculated with these values match those in the draft inventory.
TABLE 5: EMISSION FACTORS FOR DIFFERENT TYPES OF LIVESTOCK
TYPE OF LIVESTOCK EMISSIONS FACTOR: ENTERIC FERMENTATION KG CH4/HEAD/YR
EMISSIONS FACTOR: MANURE MANAGEMENT KG CH4/HEAD/YR
Non-dairy cattle 32 1
Sheep 5 0.21
Goats 5 0.22
Pigs 1 1
Poultry 0 0.023
Source: IPCC (2006)
Historic livestock populations were in decline between 2000 and 2010. It is likely that future growth rates of livestock will be positive due to growth in the agricultural sector; however, as available pasture land is a constrained resource, it is not likely that livestock growth will keep pace with the forecast GDP growth of the country (7.0 per cent between 2011 and 2017) (International Monetary Fund, 2012). The baseline forecast assumes that livestock populations will match estimated future population growth of 2.7 per cent between 2010 and 2030. Future population growth was estimated based on historic population growth between 2000 and 2010 (Ministère du Plan, 2007).
Burning of SavannahThe total area of savannah in the DRC is identified in Table 6 and was taken from the draft inventory.

© 2013 The International Institute for Sustainable DevelopmentIISD REPORT MARCH 2013Democratic Republic of Congo: Greenhouse gas emissions baseline projection 9
TABLE 6: AREA OF CROPLANDS IN 2010
TYPE OF CROP OR LAND 2010 KILO HECTARES
Soudano zambezienne 60,727
Guineene 22,140
TOTAL 82,867
Source: Ministère de l’Environnement (2012)
The fraction of savannah burned was based on an IPCC default values of 38 per cent for the soudano-zambezienne savannah and 70 per cent for the Guineene savannah (IPCC, 2006). Emission factors were the same as those used in the draft inventory.
The baseline projection assumes no changes in the area of savannah and the burning frequency over time, and as a result, emission levels do not change over time.
Burning of Agricultural ResiduesCrop production where agricultural residues may be burned is identified in Table 7.
TABLE 7: PRODUCTION OF CROPS IN 2010 (TONNES)
TYPE OF CROP OR LAND 2010
Maïs 771,210
Riz paddy 298,580
Millet 38,122
Manioc 37,545,440
Patate douce 72,028
Pomme de terre 13,825
Igname 15,693
Taro 15,114
Haricot 168,590
Niébé 89,826
Arachide 258,621
Soya 27,291
Banane plantain 510,798
Banane douce 329,029
Banane de bière 747,587
Sorgho 6,247
Courge 26,586
Pois cajan 12,331
Voandzou 5,502
Sesame 4,463
TOTAL 40,956,883
Source: Ministère de l’Environnement (2012)

© 2013 The International Institute for Sustainable DevelopmentIISD REPORT MARCH 2013Democratic Republic of Congo: Greenhouse gas emissions baseline projection 10
The default values presented in Table 8 were employed to estimate the emissions for all crops. The main variance with the DRC inventory is that a default value of the fraction of crop residues burned was set at 25 per cent (IPCC, 1996, p. 4.84), as opposed to the 50 per cent that was used in the draft inventory.
TABLE 8: DEFAULT VALUES FOR ESTIMATING EMISSIONS FROM BURNING OF AGRICULTURAL RESIDUES
CROP RESIDUE PARAMETERS CROP RESIDUE DEFAULT VALUES
Residue to crop production ratio (tonne/ tonne) 1.4:1
Dry matter 83%
Fraction of residue biomass burned 25%
Fraction oxidized 90%
Carbon fraction (% dry matter) 45%
Nitrogen-carbon (N-C) ratio 0.015:1
Source: IPCC (1996)
Future growth in the amount of agricultural residues burned in the baseline is directly correlated to an estimated future annual growth of 2.7 per cent in total population between 2010 and 2030. Future population growth was estimated based on historic population growth between 2000 and 2010 (Ministère du Plan, 2007).
Flooding RiceThe area of historic rice cultivation was taken from the draft inventory and is provided in Table 9 below.
TABLE 9: AREA OF RICE UNDER CULTIVATION BETWEEN 2001 AND 2010 (HECTARES)
METRIC 2001 2002 2003 2004 2005 2006 2007 2008 2009 2010
Area 13,200 13,000 10,781 13,322 15,940 23,106 16,457 16,734 21,829 20,181
Source: Ministère de l’Environnement (2012)
Emission factors were based on the same emission factors used in the draft inventory.
Future growth in the amount of rice cultivated in the baseline is directly correlated to an estimated future annual growth of 2.7 per cent in total population between 2010 and 2030. Future population growth was estimated based on historic population growth between 2000 and 2010 (Ministère du Plan, 2007).
Cultivated SoilsEmissions for cultivated soils were taken directly from the draft inventory. Future growth in emissions from cultivated soils is primarily dependent on the application of manure to soils and therefore, the population of livestock. Emissions are also dependent to a lesser degree on the application of artificial nitrogen fertilizers. Future growth in emissions was directly correlated to an estimated 2.7 per cent annual growth in total population because this was the same assumption used to estimate the growth in livestock.

© 2013 The International Institute for Sustainable DevelopmentIISD REPORT MARCH 2013Democratic Republic of Congo: Greenhouse gas emissions baseline projection 11
3.3 Data Availability and UncertaintyThe agricultural sector is the largest source of non-LULUCF GHG emissions of the sectors considered in this study. Despite the size and prevalence of the sector, data required to calculate GHG emissions is lacking and considerable uncertainty remains in the calculation of emissions when compared to the energy demand, energy supply, industrial processes and waste sectors.
Savannah-burning emissions account for approximately 34 per cent of total emissions in the DRC (excluding LULUCF) in 2010, yet it is necessary to use default emission factors that are not country specific to estimate these emissions. The uncertainty of these emission factors is reported to be in the range of ± 30 per cent to 50 per cent (IPCC, 2006). Estimates of savannah-burning emissions could be significantly improved by surveying the extent of area burned over a number of years and by applying country-specific crop residue parameters (see Table 8).

© 2013 The International Institute for Sustainable DevelopmentIISD REPORT MARCH 2013Democratic Republic of Congo: Greenhouse gas emissions baseline projection 12
4.0 LULUCF
4.1 MethodologyThe historic emissions baseline was taken directly from the draft inventory and is provided in Table 10. The DRC Inventory relies primarily on estimates of emissions and removals from the Food and Agricultural Organization of the United Nations (FAO) (FAO, 2010). The FAO data provide estimates of emissions and removals from forests for major carbon pools, including above-ground biomass, below-ground biomass, soil carbon and litter. The data considers a deforestation rate of approximately 0.109 per cent per year between 2000 and 2005 and 0.125 per cent between 2005 and 2010.
TABLE 10: NET EMISSIONS FROM LULUCF BETWEEN 2001 AND 2010 (KTCO2E/YR)
YEAR EMISSIONS (KTCO2E/YR) REMOVALS (KTCO2E/YR) NET EMISSIONS (KTCO2E/YR)
2000 201,732 -321,659 -119,926
2001 201,732 -310,402 -108,670
2002 201,732 -298,901 -97,169
2003 201,732 -287,157 -85,424
2004 201,732 -275,114 -73,382
2005 201,732 -278,642 -76,910
2006 193,055 -269,453 -76,398
2007 193,055 -256,351 -63,296
2008 193,055 -231,012 -37,957
2009 193,055 -217,928 -24,872
2010 193,055 -204,505 -11,450
Source: Ministère de l’Environnement (2012)
The calculation of annual changes in emissions is consistent with revised IPCC 1996 guideline methodologies (IPCC, 1996). This method considers the difference between biomass stocks, for a given land-use area and two points in time.
4.2 Data and AssumptionsFuture trends in LULUCF emissions are based on projected BAU trends reported in the draft inventory. These projections see emissions rise to 350 MTCO2e in 2020 and 400 MTCO2e in 2030 from current levels of 193 MTCO2e in 2010. Removals or sinks are not projected in the draft inventory. While the trend in removals between 2000 and 2010 shown in Table 11 demonstrates that removals have decreased an average of 4.5 per cent annually, this trend will be countered by increasing biomass growth from forestland areas remaining forest. A simple model was developed to estimate changes in carbon pools and emissions based on biomass growth and biomass removals over time. This model estimates that removals will continue to shrink until 2014 and then grow from approximately 190 MTCO2e in 2014 to 292 MTCO2e in 2030.

© 2013 The International Institute for Sustainable DevelopmentIISD REPORT MARCH 2013Democratic Republic of Congo: Greenhouse gas emissions baseline projection 13
TABLE 11: NET EMISSION PROJECTIONS FROM LULUCF BETWEEN 2010 AND 2030 (KTCO2E/YR)
YEAR EMISSIONS (KTCO2E/YR) REMOVALS (KTCO2E/YR) NET EMISSIONS (KTCO2E/YR)
2010 193,055 -204,505 -11,450
2015 294,484 -191,755 102,729
2020 350,000 -219,081 130,919
2025 375,000 -253,582 121,418
2030 400,000 -292,533 107,467
4.3 Data Availability and UncertaintyGHG emission trends in the forestry sector are hard to determine because of the difficulty in accurately measuring biomass carbon pools for the entire country. Conducting forest and land-use inventories of carbon stocks is complex and the resources required to conduct a detailed forestry inventory is beyond the scope of this project.
The model employed to estimate sequestration of carbon is very basic because resources or data were not available to conduct detailed modelling. The uncertainty in these estimates is very high, as the modelling doesn’t account for numerous important factors, including: conversions of land to different types (e.g., agriculture, settlement), the age of forests, specific biomass growth rates of different forest types and forest fires. In addition, small changes in model input values for the emissions baseline can lead to drastically different results. It is recommended that reliable estimates of LULUCF emissions be developed to reduce uncertainty. For example, detailed Tier 3 modelling could be conducted using consistent, spatially explicit observations of land use and land-use change using remote sensing and geographic information systems.
© 2013 The International Institute for Sustainable DevelopmentIISD REPORT MARCH 2013Democratic Republic of Congo: Greenhouse gas emissions baseline projection 14
5.0 Electricity Generation
5.1 MethodologyDeveloping a reference case for DRC’s electricity sector is challenging because there is considerable uncertainty in the amount of fossil fuels that are consumed by the sector and how the sector may grow in the future. The DRC has a large suppressed demand for electricity, but the main constraint on growth is being able to add capacity and connect potential customers. Historical annual growth in electricity consumption in the DRC was about 3.3 per cent between 2000 and 2010. However, there are plans for future expansion and much underutilized capacity.
An emissions baseline for the electricity sector is developed by estimating the total fossil fuel consumption of different generation technologies and then multiplying the total consumption by appropriate emission factors. This method is the same as the Tier 1 approach used in the draft inventory for stationary combustion sources.
5.2 Data and AssumptionsThe draft inventory does not estimate emissions for the electricity sector. In fact, all fossil fuels are allocated to other sectors such as transport, industry and energy demand.
The overwhelming supply of electricity in DRC is from hydro sources. Based on information from the 2015 Electricity Development Plan (Ministère des Ressources Hydrauliques et Électricité, 2012a), it is estimated that approximately 2,500 megawatts (MW) of hydro power was installed in 2010, compared to only 37 MW of thermal power plants in the DRC. These thermal plants are operated both by the public power company SNEL and by independent power producers. In addition to these thermal power plants, a large number of electric generators in the DRC supply power for cell phone towers, and are estimated to generate at least an additional 19 MW of electricity.
Most of these thermal power plants and electric generators use diesel fuel; however, there are no national statistics available to estimate how much diesel fuel is consumed, as suppliers of diesel fuel do not track the amount sold to these users. The national inventory also assumes that all diesel fuel is consumed by the transport industry. In the case of cell phone towers, data were acquired on the fuel usage of diesel generators operated by Vodacom. It was estimated that 6,000 tonnes oil equivalent (toe) were consumed in 2011. Based on assumptions regarding load and generator efficiency, it was estimated that the 37 MW of thermal plants used approximately 8,700 toe of diesel in 2011.
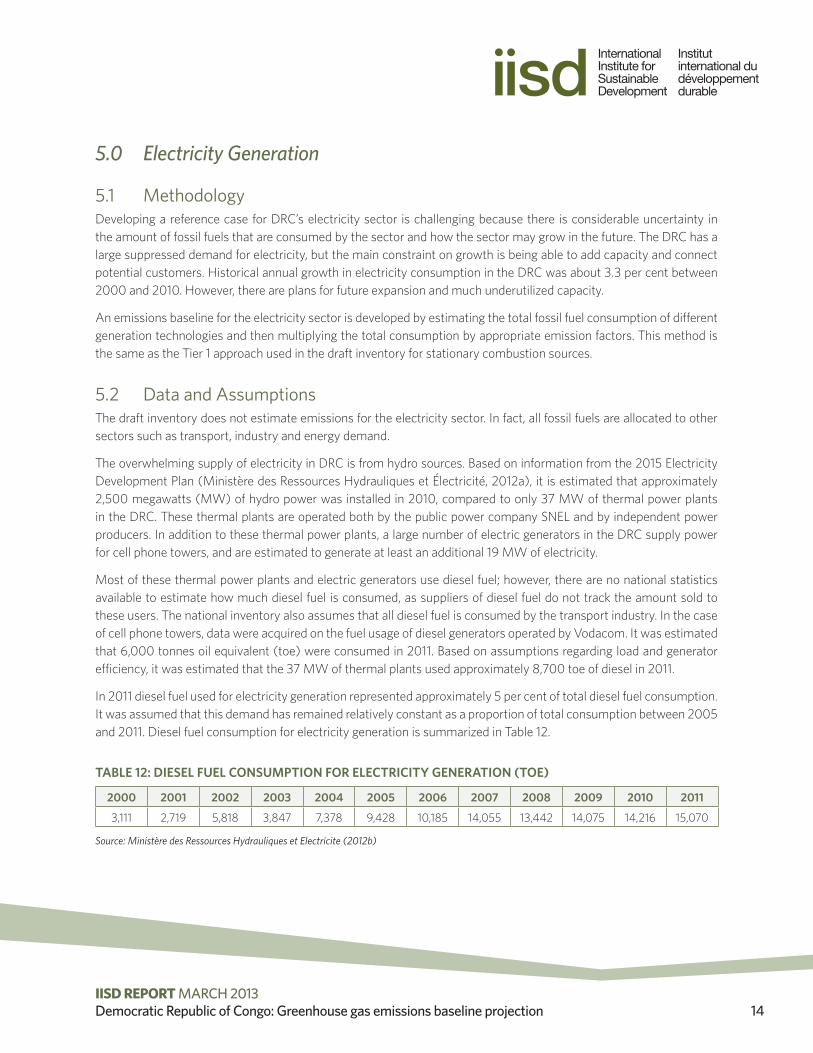
In 2011 diesel fuel used for electricity generation represented approximately 5 per cent of total diesel fuel consumption. It was assumed that this demand has remained relatively constant as a proportion of total consumption between 2005 and 2011. Diesel fuel consumption for electricity generation is summarized in Table 12.
TABLE 12: DIESEL FUEL CONSUMPTION FOR ELECTRICITY GENERATION (TOE)
2000 2001 2002 2003 2004 2005 2006 2007 2008 2009 2010 2011
3,111 2,719 5,818 3,847 7,378 9,428 10,185 14,055 13,442 14,075 14,216 15,070
Source: Ministère des Ressources Hydrauliques et Electricite (2012b)

© 2013 The International Institute for Sustainable DevelopmentIISD REPORT MARCH 2013Democratic Republic of Congo: Greenhouse gas emissions baseline projection 15
The data used to convert total future generation of fossil fuel technologies into GHG emissions is provided in Table 13 below; emission factors are from 2006 IPCC guidelines.
TABLE 13: EMISSION FACTORS FOR DIESEL GENERATORS
TECHNOLOGY AVERAGE CONVERSION EFFICIENCY (%) KGCO2E / TJ
KGCO2E / GWH (KGCO2E / TJ) X (3,6 GWH/TJ) X
(AVERAGE CONVERSION EFFICIENCY)
Diesel Generators 35% 74,100 762,171
Source: IPCC (2006)
Historic growth in domestic electricity consumption has been at approximately 8 per cent per year since 2001. It is likely that high growth will continue in the future as additional customers are added to the electricity grid. The emissions baseline assumes that demand for diesel fuel for electricity generation will increase until 2030 at the rate of forecasted GDP growth of 7.1 per cent per year between 2010 and 2015 (African Economic Outlook Database, n.d.).
5.3 Data Availability and UncertaintyThere are a number of studies available that examine electricity supply in the short term for the DRC. The Ministry of Hydro resources and Electricity reports anticipated projections in their annual Energy Information System Report (Ministère des Ressources Hydrauliques et Électricité, 2012b) as well as in the Electricity Development Plan to 2015 (Ministère des Ressources Hydrauliques et Électricité, 2012a). However, it is difficult to estimate fossil fuel demand from this information, as it focuses on the development of new hydro-electric resources. As a result, there is a high degree of uncertainty related to the installed capacity of thermal plants and their consumption of fossil fuels.

© 2013 The International Institute for Sustainable DevelopmentIISD REPORT MARCH 2013Democratic Republic of Congo: Greenhouse gas emissions baseline projection 16
6.0 Energy Demand
6.1 MethodologyAn emissions baseline for the energy demand sector is developed by estimating the total fossil fuel consumption and then multiplying the total consumption by appropriate emission factors. This method is the same as the Tier 1 approach used in the draft inventory.
6.2 Data and AssumptionsTotal energy use for each major fossil fuel consumed from the draft inventory was compared to total fuel consumption reported by national energy balances reported in the Ministry of Hydro Resources’ annual Energy Information System Report (Ministère des Ressources Hydrauliques et Électricité, 2012b). These sources of information were in general agreement; however, there were some discrepancies, in which case this analysis used the national energy balances as the main source of data. All fuel consumption was divided between specific sectors including household, transportation, electricity and industrial. Transportation fuels and fuels for electricity generation are included in the transportation and electricity supply sectors (see Section 7 and Section 5).
Table 14 identifies the total consumption of each specific fuel in the energy demand sector. Consumption is expressed as kilotonne oil equivalent (ktoe). This metric expresses the energy content of all fuels on a comparable basis, using the nominal energy content of crude oil by mass. Wood fuel consumed for charcoal production is also included.
TABLE 14: FUEL CONSUMPTION OF HOUSEHOLD AND INDUSTRIAL ENERGY SECTOR (KTOE)
FUEL TYPE 2005 2006 2007 2008 2009 2010
Kerosene 11,020 9,458 9,455 10,826 12,244 9,377
Fuel oil 38,926 41,245 40,993 40,193 40,720 44,542
Lubricants 1,503 1,827 2,448 2,400 2,314 2,520
Fuelwood 18,456,000 19,102,000 19,751,000 20,423,000 21,610,182 22,781,392
Charcoal consumption 51,677 53,485 55,303 57,184 118,272 174,682
Fuelwood for charcoal production 430,640 445,711 460,859 476,532 985,600 1,455,680
BUNKER FUELS 2005 2006 2007 2008 2009 2010
Jet kerosene 134,762 171,713 108,782 26,550 106,802 119,967
Source: Ministère de l’Environnement (2012)
Future growth in petroleum product consumption was estimated based on projected GDP growth and a correction for autonomous energy efficiency improvement. The forecast GDP growth between 2010 and 2015 is estimated to be 7.1 per cent (African Economic Outlook Database, n.d.). The autonomous energy efficiency improvement is estimated to be -1 per cent per year. This autonomous energy efficiency improvement is based on research that end-uses of fuels such as cookstoves become more fuel-efficient over time, reducing the overall demand for energy (Graus et al., 2009). Combining these two factors results in a total growth rate of 6.1 per cent per year for petroleum products. Future biomass consumption was not increased in the same manner. Historic growth in biomass fuels has been
© 2013 The International Institute for Sustainable DevelopmentIISD REPORT MARCH 2013Democratic Republic of Congo: Greenhouse gas emissions baseline projection 17
around 4 per cent between 2000 and 2010. There is a significant constraint of biomass growth based on the available supply of biomass fuels in the baseline. Without significant efforts to restore, protect and manage forests, demand for wood will continue to lead to deforestation in the DRC and deplete existing sustainable wood supplies. Because of these constraints we have limited growth in biomass fuels to half of the forecast GDP growth rate with a -1 per cent adjustment for autonomous energy efficiency improvement. This resulted in a growth rate of 2.5 per cent, which is roughly in line with estimated population growth.
Emission factors for fuel consumption are the same as the emission factors used in the draft inventory report and are based on IPCC default values.
6.3 Data Availability and UncertaintyUncertainty in the emissions reference case is relatively low for the total emissions of fossil fuels, as there is a low degree of uncertainty related to the total consumption of these fuels in DRC and the related emission factors. The uncertainty is higher for biomass fuels as the data on total biomass fuels consumed in DRC is based on limited surveys. It is likely that the range of uncertainty for these types of surveys is within 30–60 per cent (IPCC, 2006).
© 2013 The International Institute for Sustainable DevelopmentIISD REPORT MARCH 2013Democratic Republic of Congo: Greenhouse gas emissions baseline projection 18
7.0 Transportation
7.1 MethodologyAn emissions reference case for the transportation sector is developed for historical emissions by estimating the total fossil fuel consumption and then multiplying the total consumption by appropriate emission factors. This method is the same as the Tier 1 approach used in draft inventory for mobile combustion sources.
7.2 Data and AssumptionsTotal energy use for each major fossil fuel consumed from the draft inventory was compared to total fuel consumption reported by national energy balances reported in the Ministry of Hydro Resources annual Energy Information System Report (Ministère des Ressources Hydrauliques et Électricité, 2012b). These sources of information were in general agreement; however, there were some discrepancies, in which case the national energy balances were used as the main source of data.
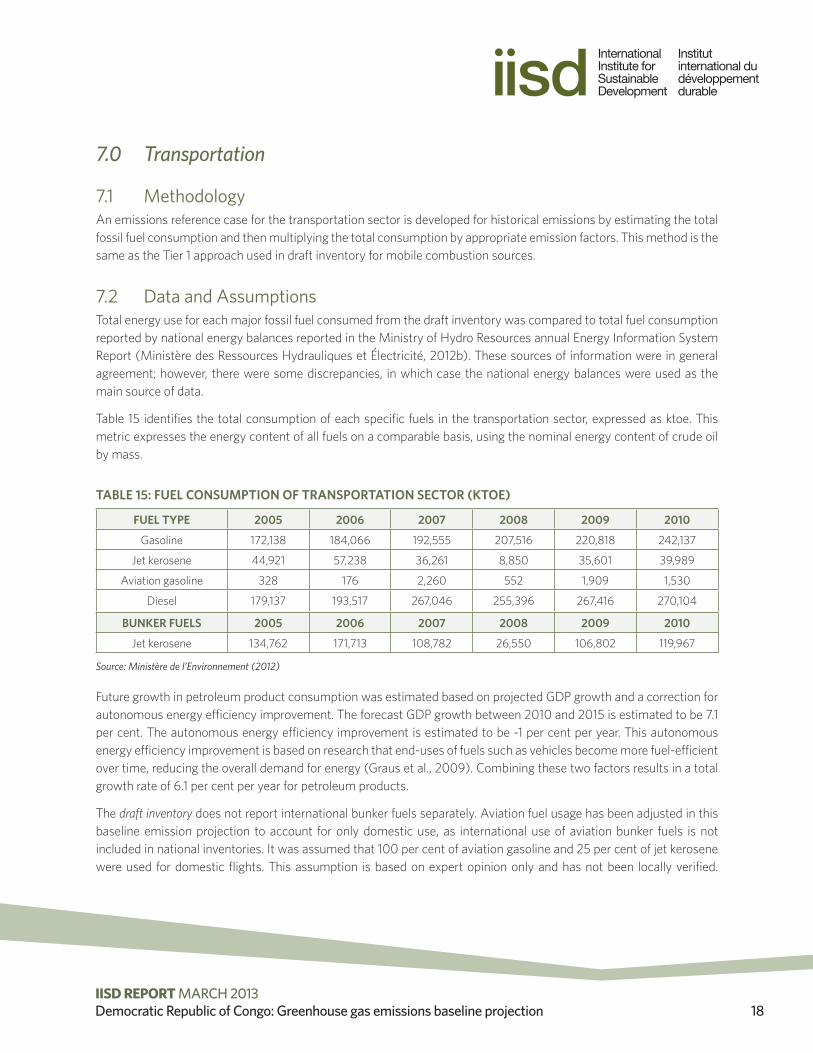
Table 15 identifies the total consumption of each specific fuels in the transportation sector, expressed as ktoe. This metric expresses the energy content of all fuels on a comparable basis, using the nominal energy content of crude oil by mass.
TABLE 15: FUEL CONSUMPTION OF TRANSPORTATION SECTOR (KTOE)
FUEL TYPE 2005 2006 2007 2008 2009 2010
Gasoline 172,138 184,066 192,555 207,516 220,818 242,137
Jet kerosene 44,921 57,238 36,261 8,850 35,601 39,989
Aviation gasoline 328 176 2,260 552 1,909 1,530
Diesel 179,137 193,517 267,046 255,396 267,416 270,104
BUNKER FUELS 2005 2006 2007 2008 2009 2010
Jet kerosene 134,762 171,713 108,782 26,550 106,802 119,967
Source: Ministère de l’Environnement (2012)
Future growth in petroleum product consumption was estimated based on projected GDP growth and a correction for autonomous energy efficiency improvement. The forecast GDP growth between 2010 and 2015 is estimated to be 7.1 per cent. The autonomous energy efficiency improvement is estimated to be -1 per cent per year. This autonomous energy efficiency improvement is based on research that end-uses of fuels such as vehicles become more fuel-efficient over time, reducing the overall demand for energy (Graus et al., 2009). Combining these two factors results in a total growth rate of 6.1 per cent per year for petroleum products.
The draft inventory does not report international bunker fuels separately. Aviation fuel usage has been adjusted in this baseline emission projection to account for only domestic use, as international use of aviation bunker fuels is not included in national inventories. It was assumed that 100 per cent of aviation gasoline and 25 per cent of jet kerosene were used for domestic flights. This assumption is based on expert opinion only and has not been locally verified.

© 2013 The International Institute for Sustainable DevelopmentIISD REPORT MARCH 2013Democratic Republic of Congo: Greenhouse gas emissions baseline projection 19
Improved estimates could be made by analyzing flight destinations between major airports in the DRC and aligning this with total fuel usage to determine domestic use.
Emission factors for transportation fuel consumption are the same as the emission factors used in the draft inventory report and are based on IPCC default values.
7.3 Data availability and UncertaintyUncertainty in the overall fuel demand and emissions from the transportation sector is fairly low, as these estimates are based on total reported fuel usage from national statistics. The national energy balances (Ministère des Ressources Hydrauliques et Électricité, 2012b) assume that all gasoline and diesel is used in transportation, whereas, some amount of this fuel will be used in other applications (e.g., diesel generators). While we have adjusted the diesel consumption in transportation to account for diesel fuel that is used in electricity generation we have not estimated other end-use allocations that may not be in the transportation sector. This likely over-allocates some emissions to the transportation sector. However, the overall emissions are still representative of the total estimated fuel consumption.
For the domestic aviation sector, estimates of the fuel demand were based on a crude approximation of the fuel demand for international bunker fuels for international aviation flights, which are not included in the domestic GHG inventory, and domestic usage. This split in fuel consumption could be improved if flight data for the entire country was available.

© 2013 The International Institute for Sustainable DevelopmentIISD REPORT MARCH 2013Democratic Republic of Congo: Greenhouse gas emissions baseline projection 20
8.0 Industrial Processes
8.1 MethodologyIn the DRC, the main industrial process emission sources are releases from processes that chemically or physically transform materials (for example, cement and lime are notable examples, releasing a significant amount of carbon dioxide [CO2]). Different GHGs—including CO2, methane (CH4), N2O, hydrofluorocarbons and perfluorocarbons—can be produced during these processes.
Only the major industries with significant emissions from industrial processes that were identified in the draft inventory were considered, including cement, lime, iron and steel production. Emissions from products such as refrigerators, foams or aerosol cans were not included in the analysis, as they were not included in the draft inventory. These emissions are likely to be relatively small.
In general, the emissions baseline for the industrial process sector was developed by estimating the total production of an industrial product that in its transformation contributes to GHG emissions, and then multiplying this value by appropriate emission factors. The methods used follow the same Tier 1 approach used in the draft inventory.
8.2 Data and AssumptionsHistorical production data was used to estimate emissions from industrial processes. The source and values of historical production data were taken from the draft inventory. An adjustment was made to the lime production, as additional data indicated that it was reported in kilotonnes in the draft report instead of tonnes, as stated (U.S. Geological Survey, 2011). This required an adjustment by a factor of 1,000, as identified in Table 16.
TABLE 16: DRC DOMESTIC INDUSTRIAL PRODUCTION DATA FOR SELECT INDUSTRIES (TONNES OF PRODUCT)
DRC DOMESTIC PRODUCTION (TONNES)
2000 2001 2002 2003 2004 2005 2006 2007 2008 2009 2010
Cement 168,927 201,426 249,708 330,794 411,293 523,999 521,253 530,196 411,212 460,344 489,745
Lime 51,705 20,315 31,789 26,938 16,733 25,135 12,140 8,994 16,600 4,560 4,423
Iron and steel 211 307 150 158 145 110 104 110 104 110 104
Source: Ministère de l’Environnement (2012); U.S. Geological Survey (2011)
Emission factors are based on the Tier 1, 1996 guidelines emission factors that were used in the draft inventory (IPCC, 1996). An annual average growth rate between 2010 and 2030 is based on projections of overall economic GDP growth in the economy under a baseline condition. The efficiency per unit of production for cement, lime, iron and steel does not change over time because the release of CO2 is an unavoidable aspect of the process.
Table 15 identifies default emission parameters and factors that were used to convert tonnes of production of the various industries into GHG emissions.

© 2013 The International Institute for Sustainable DevelopmentIISD REPORT MARCH 2013Democratic Republic of Congo: Greenhouse gas emissions baseline projection 21
TABLE 17: EMISSION PARAMETERS AND FACTORS
SECTOR TIER 1 EMISSION FACTORS TCO2 / T PRODUCED (2010)
FUTURE GROWTH RATE (2010 TO 2030)
Cement (t clinker) 0.4985 7.1%
Lime (t quicklime) 0.776 7.1%
Iron and steel (t production) 1.6 7.1%
Source: Ministère de l’Environnement (2012); IPCC (2006)
8.3 Data Availability and UncertaintyUncertainty is primarily associated with the use of default emission factors, and to a lesser degree, the production values available. The 2006 IPCC guidelines express the default uncertainty of production values for cement and lime to be likely in the range of 1 to 2 per cent, compared to an uncertainty in the range of 8 per cent to 20 per cent for their different emission factors. Specific uncertainty in production values may be higher in the DRC depending on the rigour of reporting requirements.
Emission estimates from GHGs used in products such as refrigerators, foams or aerosol cans have not been estimated in this analysis. These emissions were not estimated in the draft inventory.

© 2013 The International Institute for Sustainable DevelopmentIISD REPORT MARCH 2013Democratic Republic of Congo: Greenhouse gas emissions baseline projection 22
9.0 Waste
9.1 MethodologyThe emissions baseline for the waste sector is developed using Tier 1 approaches for solid waste disposal sites and wastewater and sludge treatment from the IPCC 1996 guidelines and is consistent with the draft inventory.
9.2 Data and Assumptions
Methane Emissions from Solid Waste DisposalThe composition of waste impacts the amount of organic material that is available for anaerobic decay and therefore the projected methane emissions released. The waste composition used in the modelling was taken from the draft inventory and is presented in Table 18.
TABLE 18: COMPOSITION OF WASTES IN DRC
WASTE CATEGORY TYPE COMPOSITION (%)
Biodegradable materials
Wood and organic materials 57%
Food waste 3%
Paper 1%
Textiles 3%
Non-biodegradable materials
Metals 3%
Plastic 3%
Glass and other inert materials 7%
Sand and gravel 8%
TOTAL 100%
Source: Ministère de l’Environnement (2012)
Waste generation rates in the DRC are based on estimates from the draft inventory and shown in Table 19.
TABLE 19: WASTE GENERATION RATES IN DRC
2000 2005 2010
Population with waste disposal 21,737,244 25,395,756 29,670,018
Kg/capita/yr 0.42 0.42 0.42
Waste generated (tonnes/day) 3,332 3,893 4,548
Source: Ministère de l’Environnement (2012)
Future growth in the amount of solid waste produced is based solely on the estimated urban population growth of 3.9 per cent. This estimate is derived from the shift of population from rural to urban areas experienced between 1984 and 2007 (Ministère du Plan, 2007) and combined with overall estimated population growth.
© 2013 The International Institute for Sustainable DevelopmentIISD REPORT MARCH 2013Democratic Republic of Congo: Greenhouse gas emissions baseline projection 23
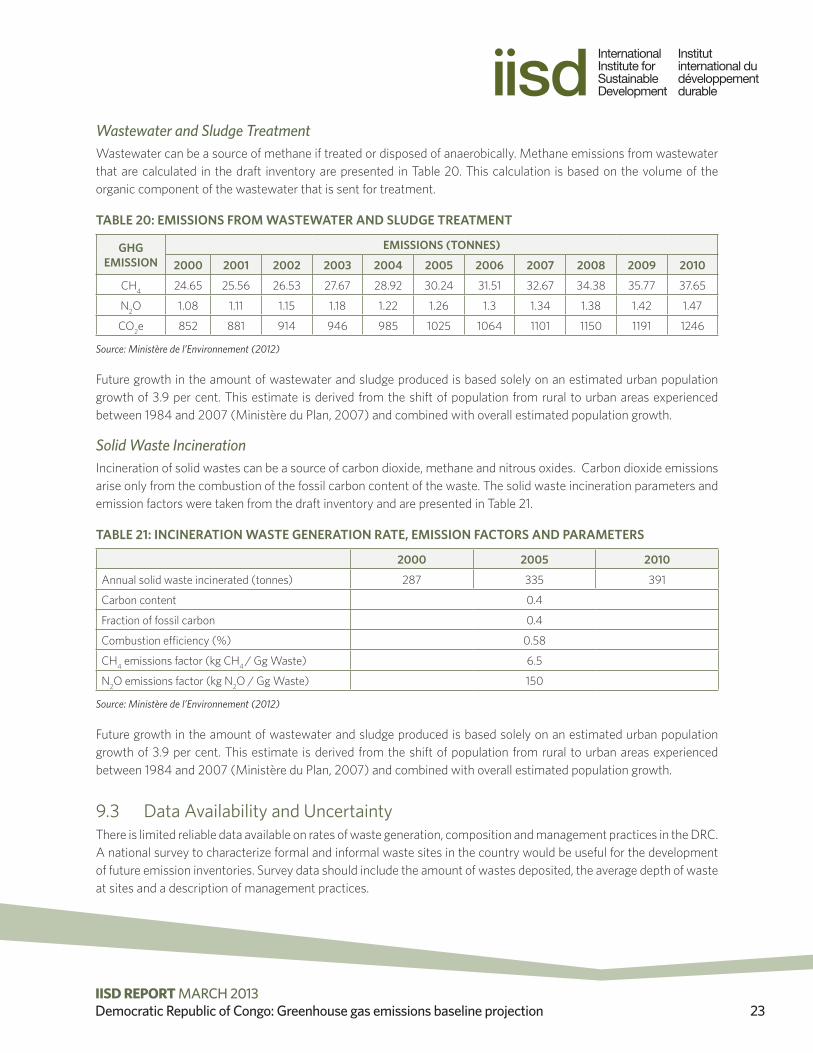
Wastewater and Sludge TreatmentWastewater can be a source of methane if treated or disposed of anaerobically. Methane emissions from wastewater that are calculated in the draft inventory are presented in Table 20. This calculation is based on the volume of the organic component of the wastewater that is sent for treatment.
TABLE 20: EMISSIONS FROM WASTEWATER AND SLUDGE TREATMENT
GHG EMISSION
EMISSIONS (TONNES)
2000 2001 2002 2003 2004 2005 2006 2007 2008 2009 2010
CH4 24.65 25.56 26.53 27.67 28.92 30.24 31.51 32.67 34.38 35.77 37.65
N2O 1.08 1.11 1.15 1.18 1.22 1.26 1.3 1.34 1.38 1.42 1.47
CO2e 852 881 914 946 985 1025 1064 1101 1150 1191 1246
Source: Ministère de l’Environnement (2012)
Future growth in the amount of wastewater and sludge produced is based solely on an estimated urban population growth of 3.9 per cent. This estimate is derived from the shift of population from rural to urban areas experienced between 1984 and 2007 (Ministère du Plan, 2007) and combined with overall estimated population growth.
Solid Waste IncinerationIncineration of solid wastes can be a source of carbon dioxide, methane and nitrous oxides. Carbon dioxide emissions arise only from the combustion of the fossil carbon content of the waste. The solid waste incineration parameters and emission factors were taken from the draft inventory and are presented in Table 21.
TABLE 21: INCINERATION WASTE GENERATION RATE, EMISSION FACTORS AND PARAMETERS
2000 2005 2010
Annual solid waste incinerated (tonnes) 287 335 391
Carbon content 0.4
Fraction of fossil carbon 0.4
Combustion efficiency (%) 0.58
CH4 emissions factor (kg CH4 / Gg Waste) 6.5
N2O emissions factor (kg N2O / Gg Waste) 150
Source: Ministère de l’Environnement (2012)
Future growth in the amount of wastewater and sludge produced is based solely on an estimated urban population growth of 3.9 per cent. This estimate is derived from the shift of population from rural to urban areas experienced between 1984 and 2007 (Ministère du Plan, 2007) and combined with overall estimated population growth.
9.3 Data Availability and UncertaintyThere is limited reliable data available on rates of waste generation, composition and management practices in the DRC. A national survey to characterize formal and informal waste sites in the country would be useful for the development of future emission inventories. Survey data should include the amount of wastes deposited, the average depth of waste at sites and a description of management practices.

© 2013 The International Institute for Sustainable DevelopmentIISD REPORT MARCH 2013Democratic Republic of Congo: Greenhouse gas emissions baseline projection 24
Reference ListAfrican Economic Outlook Database. (n.d.). Real GDP growth rates. Retrieved from http://www.africaneconomicoutlook.org/en/data-statistics/table-2-real-gdp-growth-rates-2003-2013/
Food and Agriculture Organization. (2010). Evaluation des ressources forestières mondiales, Édition 2010 (FRA-2010). Retrieved from http://www.fao.org/docrep/013/i1757f/i1757f.pdf
Graus, W., Blomen, E., Kleßmann, C., Capone, C. & Stricker, E. (2009). Global technical potentials for energy efficiency improvement. Presented at IAEE European Conference, September 2009. Retrieved from http://www.aaee.at/2009-IAEE/uploads/fullpaper_iaee09/P_176_Graus_Wina_31-Aug-2009,%2012:55.pdf
International Monetary Fund. (2012, October). World Economic Outlook Database. Retrieved from http://www.imf.org/external/pubs/ft/weo/data/changes.htm
Intergovernmental Panel on Climate Change. (1996.) Revised 1996 IPCC guidelines for national greenhouse gas inventories. Retrieved from http://www.ipcc-nggip.iges.or.jp/public/gl/invs6.html
Intergovernmental Panel on Climate Change. (2006). 2006 IPCC guidelines for national greenhouse gas inventories. Retrieved from http://www.ipcc-nggip.iges.or.jp/public/2006gl/vol4.html
Ministère de l’Environnement. (2012, October). Troisième inventaire des gaz à effet de serre rapport d’inventaire. 1er Draft. DRC: Conservation de la Nature et Tourisme.
Ministère des Ressources Hydrauliques et Électricité. (2012a). Plan Directeur 2015.
Ministère des Ressources Hydrauliques et Electricite (2012b, September). Systeme d’information énergetique: Rapport Annuel.
Ministère du Plan. (2007). Enqueste demographique et de santé (EDS-RDC). Retrieved from http://www.measuredhs.com/pubs/pdf/FR208/FR208.pdf
U.S. Geological Survey (2011) 2009 minerals yearbook, Congo (Kinshasa). Retrieved from http://minerals.usgs.gov/minerals/pubs/country/2009/myb3-2009-cg.pdf
United Nations Framework Convention on Climate Change (1999). Module 4: Measures to mitigate climate change. In UNFCCC resource guide for preparing the national communications of non-Annex I parties. Retrieved from http://unfccc.int/resource/docs/publications/08_resource_guide4.pdf
www.iisd.org © 2013 The International Institute for Sustainable Development
Published by the International Institute for Sustainable Development.
International Institute for Sustainable DevelopmentHead Office161 Portage Avenue East, 6th Floor, Winnipeg, Manitoba, Canada R3B 0Y4Tel: +1 (204) 958-7700 | Fax: +1 (204) 958-7710 | Website: www.iisd.org