DEMOCRACY AND CIVIC PARTICIPATION Public ... - osis.bg fileDEMOCRACY AND CIVIC PARTICIPATION Public...
40
DEMOCRACY AND CIVIC PARTICIPATION Public Attitudes towards Democracy, the Rule of Law and the Fundamental Human Rights in 2016 CONTENTS The present report summarizes the findings of a national representative public opinion survey conducted by the Open Society Institute – Sofia in the period 22 April – 14 May 2016. The survey was financed by the Complimentary Actions Fund of the NGO Program in Bulgaria under the Financial Mecha- nism of the European Economic Area 2009-2014. The views and opinions expressed in this paper are solely the responsi- bility of the authors and should by no means be interpreted as reflecting the standpoint of the Open Society Institute – Sofia, the donor countries or the Financial Mechanism of the European Economic Area. The survey was conducted by a team comprising: ● Georgi Stoytchev, editor ● Dr. Ivanka Ivanova, author ● Associate Prof. Dr. Alexey Pamporov, head of data collection unit ● Dr. Petia Braynova and Dr. Dragomira Belcheva, data processing ISBN 978-954-2933-39-7 Report Sofia, 28 February 2017 ▶ Executive Summary 2 ▶ About this survey 3 ▶ Political and economic context 4 ▶ Government efficiency 4 ▶ Confidence in democracy and the main democratic institutions 8 ▶ Political representation and participation of citizens in governance 14 ▶ Public attitude towards political parties 24 ▶ The rule of law 26 ▶ Democracy as a system of fundamental rights and freedoms 30 ▶ Reliable information on the business of government 36 ▶ Conclusion 38 © 2017 Open Society Institute – Sofia. All rights reserved. OPEN SOCIETY INSTITUTE SOFIA
Transcript of DEMOCRACY AND CIVIC PARTICIPATION Public ... - osis.bg fileDEMOCRACY AND CIVIC PARTICIPATION Public...
DEMOCRACY AND CIVIC PARTICIPATION Public Attitudes towards Democracy,
the Rule of Law and the Fundamental Human Rights in 2016
Contents
The present report summarizes the findings of a national representative public opinion survey conducted by the Open Society Institute – Sofia in the period 22 April – 14 May 2016.
The survey was financed by the Complimentary Actions Fund of the NGO Program in Bulgaria under the Financial Mecha-nism of the European Economic Area 2009-2014. The views and opinions expressed in this paper are solely the responsi-bility of the authors and should by no means be interpreted as reflecting the standpoint of the Open Society Institute – Sofia, the donor countries or the Financial Mechanism of the European Economic Area.
The survey was conducted by a team comprising:
● Georgi Stoytchev, editor
● Dr. Ivanka Ivanova, author
● Associate Prof. Dr. Alexey Pamporov, head of data collection unit
● Dr. Petia Braynova and Dr. Dragomira Belcheva, data processing
ISBN 978-954-2933-39-7
ReportSofia, 28 February 2017
▶ Executive Summary 2
▶ About this survey 3
▶ Political and economic context 4
▶ Government efficiency 4
▶ Confidence in democracy and the main democratic institutions 8
▶ Political representation and participation of citizens in governance 14
▶ Public attitude towards political parties 24
▶ The rule of law 26
▶ Democracy as a system of fundamental rights and freedoms 30
▶ Reliable information on the business of government 36
▶ Conclusion 38
© 2017 Open Society Institute – Sofia. All rights reserved.
OPEN SOCIETY INSTITUTESOFIA

2
REPOR T, 28 Februar y 2017OPEN SOCIETY INSTITUTE – SOFIA
The study* summarizes the findings of two nationally representative public opinion sur-
veys conducted by the Open Society Institute – Sofia in 2015 and in 2016 in order to identify trends in public attitudes towards the values of democratic governance.
Democracy is the best form of government for Bulgaria according to almost half of the respond-ents (49% in 2016, 52% in 2015), while the per-ception that constitutional rights of citizens are effectively protected constitutes the most sig-nificant achievement of democratic transition in the country so far. Three quarters of respondents share the belief that there is no risk for them to be imprisoned without trial, while the vast major-ity (between 70% and 80% of the respondents) feel they can freely exercise their civil and politi-cal rights, i.e. they can express their political af-filiations, participate in protests and criticize the government without fear of reprisal or dismissal.
At the same time, however, the vast majority of people have low confidence in the institutions of representative democracy, do not participate in decision-making and feel that the government is inefficient in solving the most persistent soci-etal problems.
In light of the public opinion, the main chal-lenges to the values of democratic governance can be summarized as follows:
▶ Rule of law: according to the majority of re-spondents, laws in the country are neither
fair, nor clear and do not apply equally to all citizens; the vast majority of the respondents share the view that organized crime influenc-es the decision making in the major political parties, while the courts are unable to limit possibilities for the government to violate the law.
▶ Inefficient governance: according to the ma-jority of respondents, the main problems con-fronting the country are poverty, unemploy-ment, lack of good governance and corrup-tion; the vast majority of people (80%-90%) believe that the government cannot cope with addressing these challenges. The discrepancy between the priorities of the citizens and the priorities of the government is an important symptom for an emerging crisis in which peo-ple do not consider democratic governance as a value per se and would sacrifice their free-doms for populist pledges for more security.
▶ Limited public participation in decision-making: due to poor education, poverty and discrimination, a significant share of citizens are excluded from decision-making. Although the majority of people believe their basic po-litical and civil rights are guaranteed, among certain social groups there is a clear tendency to self-censorship and fear of reprisals. Nearly 80% of Bulgarian citizens remain passive and uninvolved in any form of organized public life.
exeCutive summary
* We would like to extend our sincere gratitude to Associate Prof. Dr. Boriana Dimitrova who made important comments and recommendations to an earlier version of this report.
3
REPOR T, 28 Februar y 2017OPEN SOCIETY INSTITUTE – SOFIA
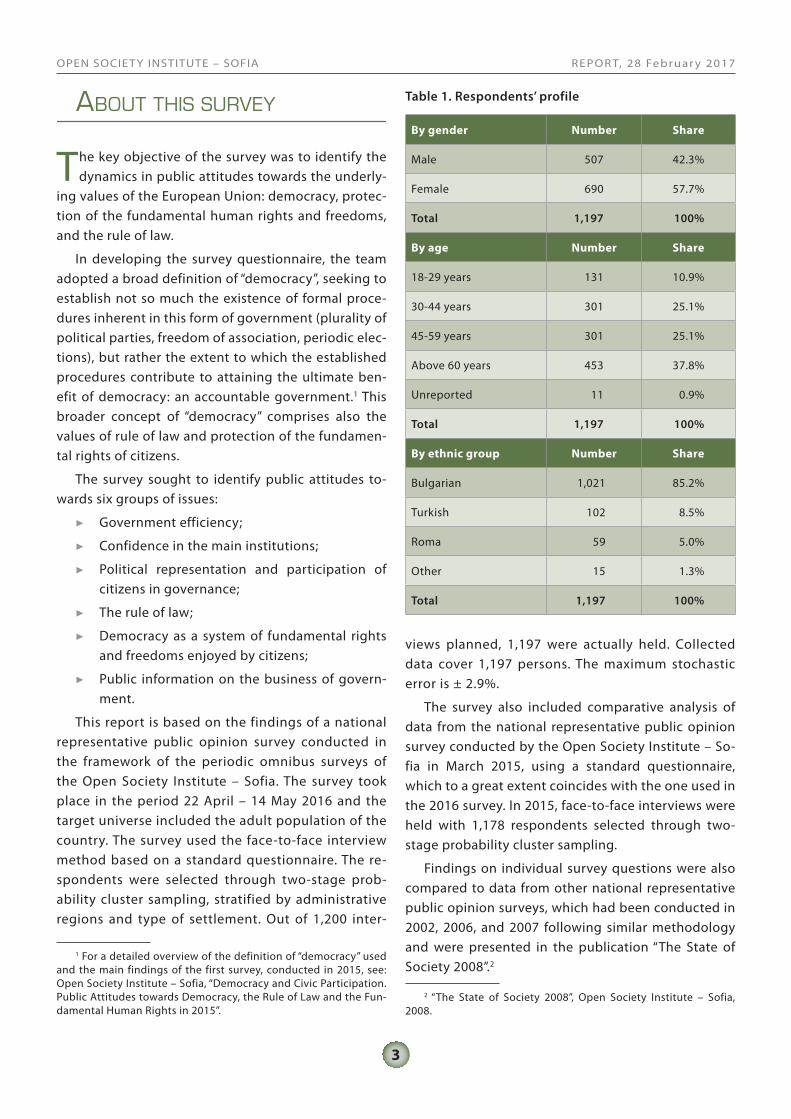
views planned, 1,197 were actually held. Collected data cover 1,197 persons. The maximum stochastic error is ± 2.9%.
The survey also included comparative analysis of data from the national representative public opinion survey conducted by the Open Society Institute – So-fia in March 2015, using a standard questionnaire, which to a great extent coincides with the one used in the 2016 survey. In 2015, face-to-face interviews were held with 1,178 respondents selected through two-stage probability cluster sampling.
Findings on individual survey questions were also compared to data from other national representative public opinion surveys, which had been conducted in 2002, 2006, and 2007 following similar methodology and were presented in the publication “The State of Society 2008”.2
2 “The State of Society 2008”, Open Society Institute – Sofia, 2008.
The key objective of the survey was to identify the dynamics in public attitudes towards the underly-
ing values of the European Union: democracy, protec-tion of the fundamental human rights and freedoms, and the rule of law.
In developing the survey questionnaire, the team adopted a broad definition of “democracy”, seeking to establish not so much the existence of formal proce-dures inherent in this form of government (plurality of political parties, freedom of association, periodic elec-tions), but rather the extent to which the established procedures contribute to attaining the ultimate ben-efit of democracy: an accountable government.1 This broader concept of “democracy” comprises also the values of rule of law and protection of the fundamen-tal rights of citizens.
The survey sought to identify public attitudes to-wards six groups of issues:
▶ Government efficiency;
▶ Confidence in the main institutions;
▶ Political representation and participation of citizens in governance;
▶ The rule of law;
▶ Democracy as a system of fundamental rights and freedoms enjoyed by citizens;
▶ Public information on the business of govern-ment.
This report is based on the findings of a national representative public opinion survey conducted in the framework of the periodic omnibus surveys of the Open Society Institute – Sofia. The survey took place in the period 22 April – 14 May 2016 and the target universe included the adult population of the country. The survey used the face-to-face interview method based on a standard questionnaire. The re-spondents were selected through two-stage prob-ability cluster sampling, stratified by administrative regions and type of settlement. Out of 1,200 inter-
1 For a detailed overview of the definition of “democracy” used and the main findings of the first survey, conducted in 2015, see: Open Society Institute – Sofia, “Democracy and Civic Participation. Public Attitudes towards Democracy, the Rule of Law and the Fun-damental Human Rights in 2015”.
Table 1. Respondents’ profile
By gender Number Share
Male 507 42.3%
Female 690 57.7%
Total 1,197 100%
By age Number Share
18-29 years 131 10.9%
30-44 years 301 25.1%
45-59 years 301 25.1%
Above 60 years 453 37.8%
Unreported 11 0.9%
Total 1,197 100%
By ethnic group Number Share
Bulgarian 1,021 85.2%
Turkish 102 8.5%
Roma 59 5.0%
Other 15 1.3%
Total 1,197 100%
About this survey

4
REPOR T, 28 Februar y 2017OPEN SOCIETY INSTITUTE – SOFIA
Bulgaria has been a member of the EU since 2007 and shares the common values of the Member
States laid out in Art. 2 of the Treaty on European Un-ion, namely: respect for human dignity, freedom, de-mocracy, equality, the rule of law and respect for hu-man rights, including the rights of persons belonging to minorities.
Ten years after its accession to the EU, Bulgaria remains the poorest country in the Union. According to Eurostat data, the GDP per capita of population in Bulgaria (measured by purchasing power parity) is 47% of the average for EU Member States.
In 2016, Bulgaria registered the third consecutive year of deflation; in November 2016, consumer pric-es marked a 0.8% decrease calculated on an annu-al basis. Since 2015, however, there have been signs of growing economic activity: throughout most of 2016, economic growth has been around 3.5% on an annual basis, while unemployment has been declin-ing from 13.2% (at the end of 2013) to 7.1% (in No-vember 2016). In 2016, Bulgaria was among the five EU Member States with highest economic growth. In the same year, the government reported a cash budget surplus of 1.6% of GDP for the first time since 2008.
Since November 2014, Bulgaria has been run by the second government of the GERB party, which was formed in coalition with the parties of the Reformist Bloc and the Alliance for Bulgarian Revival, with the parliamentary support of the Patriotic Front. On May 10, 2016 (at the time of the survey), the Alliance for Bulgarian Revival withdrew its support for the govern-ment but this did not lead to a break-up of the govern-ing coalition.
Due to the ongoing civil war in Syria and the gen-eral instability in the Middle East, since the fall of 2013, Bulgaria like other EU Member States has seen a grow-ing influx of refugees and migrants. This process was accompanied by an increase in the influence of na-tionalist and populist parties and movements, a grow-ing incidence of hate speech (especially against Roma
and Muslims), and occasional manifestations of racism and xenophobia.3
According to the Freedom House study “Nations in Transit”, in 2016, Bulgaria qualified as a “semi-consol-idated democracy” falling in the same category with Romania, Hungary and Croatia. All other EU Member States in Central and Eastern Europe were classified as “consolidated democracies”. The report indicated that “weighted for population, the average Democracy Score of the 29 formerly Communist countries sur-veyed has declined every year since 2004, for 12 years in a row, while in Central Europe and the Balkans, illib-eral leaders and strongmen challenged fundamental principles of democracy”.4
In 2016, Bulgaria was classified as a “country with obvious problems” in the Reporters Sans Frontières Press Freedom Index for Europe and ranked 113th among 180 countries monitored, falling seven posi-tions behind its 2015 score and ranking last among EU Member States. According to the Reporters Sans Frontières report, the main reason for the poor rat-ing of press freedom in Bulgaria is that the media environment in the country was “dominated by cor-ruption and collusion between media, politicians and oligarchs”.5
The 2015 survey indicated that in the opinion of the citizens, the two most serious problems con-
fronting Bulgaria were poverty and unemployment. Corruption ranked third as a major problem for the country but had less relative weight than poverty and unemployment.
The data of the 2016 survey confirm these findings with regard to the first two major problems. In 2016, a significant share of respondents (one third) identified poverty as the most serious problem confronting the
3 For more details on this issue, see: Open Society Institute – Sofia, “Public Attitudes towards Hate Speech in Bulgaria in 2016” (www.ngogrants.bg).
4 Freedom House, “Nations in Transit 2016” (www.freedom-house.org).
5 Reporters sans frontières, Classement mondial de la liberté de la presse 2016 (https://rsf.org/fr/bulgarie).
Government efficiency
PoliticAl And economic context

5
REPOR T, 28 Februar y 2017OPEN SOCIETY INSTITUTE – SOFIA
country at the time of the survey. Unemployment re-mained the second most serious problem but its rela-tive weight compared to poverty decreased: in 2015, nearly one third of the respondents had indicated that unemployment was the most critical problem for the country, whereas in 2016 this share was one fifth – 21%. Unemployment was cited as more severe a prob-lem than poverty only by respondents residing in the Northwestern Region (NWR).
For some social groups, poverty is a much more se-rious problem than the average for the country. Pover-ty was a major problem for 55% of the least educated people, 42% of the unemployed, 41% of the respond-ents above 60 years of age, and 39% of the people liv-ing in rural areas, against a national average of 33%.
In 2016, the average weight of poor governance as a major problem increased in the public perception. In 2015, only 10% of the respondents identified it as a challenge, while in 2016 this share reached 16%. The difference is not particularly large but in 2016 poor governance gets slightly ahead of corruption as the third most significant problem confronting the coun-try at the time of the survey.
Male, 30 years old, from Sofia:
(Municipal gardens are not an indicator of good
governance; author's note) In Oryahovo, a neighbor tells me, day in, day out someone commits suicide be-cause they had no money or had their property taken. Then again, there is a garden in Oryahovo.
Figure 1. Major problems in the country
Question: What is the most important problem confronting the country at the moment? (Please, choose only one answer.)
In 2016, corruption was a major problem for 15% of the respondents. As in 2015, some social groups tended to identify corruption as a major problem less often than the average for the country. Corruption seemed to be less of an issue for people with low edu-cation, for those who identified themselves as Turks, and for those who lived in the North Central Region (NCR) and the Northeastern Region (NER) – only 6% and 9%, respectively, of the residents of those two re-gions indicated that corruption was a major problem for the country, compared to a national average of 15% (fig. 1).
The respondents who lived in Sofia had a differ-ent perception of the major problems confronting the
Corruption
Other
Poor governance
Unemployment
Poverty
Crime
Inadequate quality of healthcare
Inadequate quality of education
0% 10%5% 15% 20% 25% 30% 40%35%
36
32
10
14
4
2
1
1
33
21
16
15
8
2
2
220162015

6
REPOR T, 28 Februar y 2017OPEN SOCIETY INSTITUTE – SOFIA
country at the time of the survey. Unemployment was less of an issue for the residents of Sofia than for the average citizen of the country. The second most often cited problem in Sofia was poor governance, rather than poverty, while corruption and crime were identi-fied as major problems slightly more often than the average for the country (fig. 2).
In both 2015 and 2016, public perception of the government’s efficiency in solving the major problems before the country remained highly negative. The sur-vey questionnaire gave respondents the possibility to assess the efficiency of the government in addressing seven major problems. In 2016, all seven categories
Figure 2. Major problems in the country according to the residents of Sofia
Question: What is the most important problem confronting the country at the moment? (Please, choose only one answer.)
marked an increase in firmly negative perceptions and a decline in moderately negative opinions.
The majority of respondents (87%) believed that the government failed to address the problem with corruption, 89% felt that the government failed to address the problem with poverty, while around 80% responded that the government failed to address the problems with unemployment, crime, and poor gov-ernance. In 2016, 77% of the respondents thought that the government failed to address the problem with the inadequate quality of healthcare, while 73% believed that the government failed to address the problem with the inadequate quality of education.
The share of those who gave a positive assessment of the government’s efficiency remained very low since 2015 and has even declined slightly in 2016 with regard to four of the seven major problems monitored. Only one percent of the respondents or less felt that the government coped well with all major problems surveyed. The share of moderately positive opinions on the government’s efficiency was somewhat higher when it came to issues that did not seem to be a prior-
Male, 56 years old, from a district town:
What are we talking about anyway? There are no
people left here. Who will pass through the Shipka tunnel? Why are they building this thing? To throw away money? And we’re struggling to survive with these taxes.
Corruption
Other
Poor governance
Unemployment
Poverty
Crime
Inadequate quality of healthcare
Inadequate quality of education
0% 10%5% 15% 20% 25% 30% 35%
32
11
20
17
10
4
2
2
33
21
16
15
8
2
2
2Sofia National
average

7
REPOR T, 28 Februar y 2017OPEN SOCIETY INSTITUTE – SOFIA
Figure 3. Government efficiency
Question: Please, rate the extent to which the government copes with the major problems confronting the country at the moment.
ity in the public perception – 17% of the respondents thought that the government rather coped with ad-dressing the problem with the inadequate quality of healthcare, while 19% felt that the government rather coped with addressing the problem with the inad-equate quality of education but these two problems have been identified as major problems by only 2% of the respondents. Data suggest divergence between the priorities of the government and the priorities of the public, as well as very low level of satisfaction with the efficiency of governance in general (fig. 3).
Although only 15% of the respondents identified corruption as a major problem for the country, corrup-tion was and remained a critical issue, since the major-ity of citizens cited it as the main reason for poverty in Bulgaria: half of the respondents in both 2015 and 2016 thought that Bulgaria is the poorest country in the EU because its politicians are corrupt.
The predefined answers to this multiple choice question allow for comparing several alternative ex-planations for poverty in the country, some of which
Female, 42 years old, from a district town:
Money has to be spent on more pressing things,
things that are needed for the city. They (the authorities, author’s note) should make a plan first, decide what is important. As I said before, education and healthcare. If a person is sick and bedridden, how can they be of any help for their family or the country. Not like it happens now: they give money for things like free courses for the unemployed… a course for this, a course for that... This money should be spent on more pressing things. We always put the horse before the cart, rather than begin from what is needed.
are rather consistent with the fundamental values of liberal democracy (“politicians are corrupt”, “there is no national unity”), while others contradict them ex-plicitly (“minorities have too many privileges”). As in 2015, the majority of respondents who participated in the 2016 survey chose answers that are rather consist-ent with the fundamental values of liberal democracy.
0% 20% 40% 60% 100%80%
1
1
0.3
0.3
0.3
0.4
0.4
6
10
17
6
11
19
9
34
31
36
34
31
33
34
55
56
49
49
49
44
39
4
6
4
5
9
5
7
Copes well with
Rather fails to cope with
Rather copes with
Fails to cope with
I don't know
Corruption
Poor governance
Unemployment
Poverty
Crime
Inadequate quality of healthcare
Inadequate quality of education
8
REPOR T, 28 Februar y 2017OPEN SOCIETY INSTITUTE – SOFIA
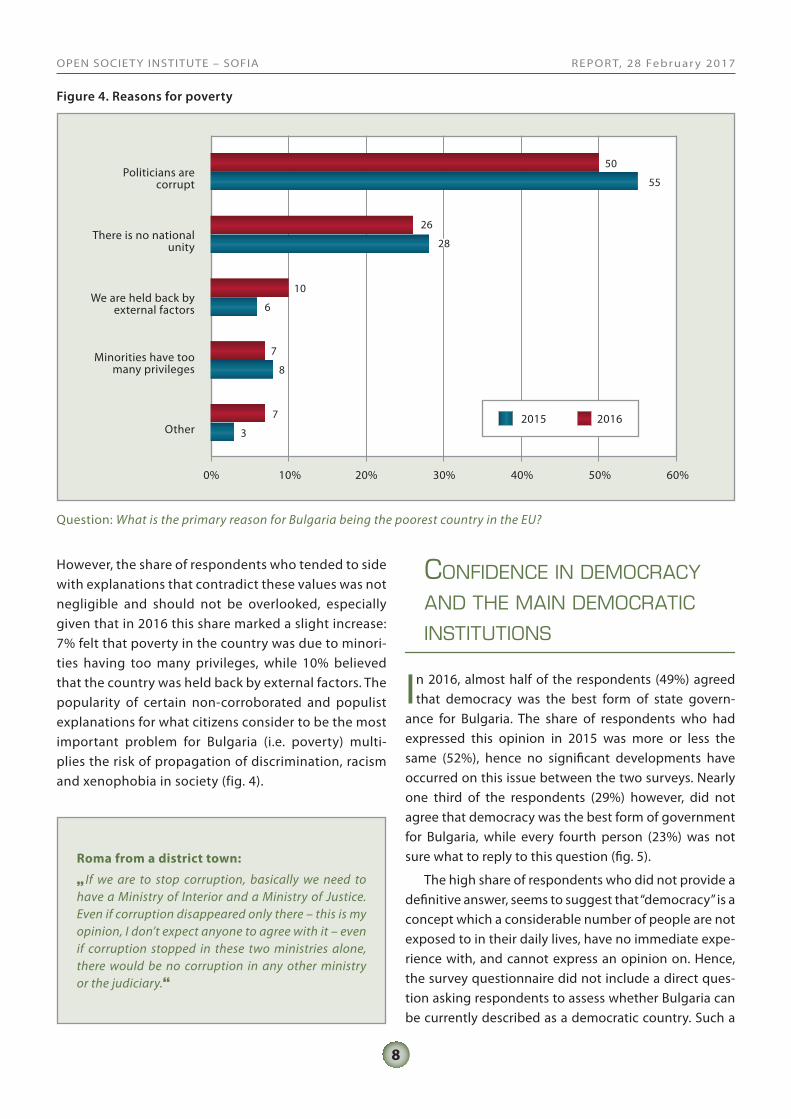
However, the share of respondents who tended to side with explanations that contradict these values was not negligible and should not be overlooked, especially given that in 2016 this share marked a slight increase: 7% felt that poverty in the country was due to minori-ties having too many privileges, while 10% believed that the country was held back by external factors. The popularity of certain non-corroborated and populist explanations for what citizens consider to be the most important problem for Bulgaria (i.e. poverty) multi-plies the risk of propagation of discrimination, racism and xenophobia in society (fig. 4).
Roma from a district town:
If we are to stop corruption, basically we need to
have a Ministry of Interior and a Ministry of Justice. Even if corruption disappeared only there – this is my opinion, I don’t expect anyone to agree with it – even if corruption stopped in these two ministries alone, there would be no corruption in any other ministry or the judiciary.
Figure 4. Reasons for poverty
Question: What is the primary reason for Bulgaria being the poorest country in the EU?
In 2016, almost half of the respondents (49%) agreed that democracy was the best form of state govern-
ance for Bulgaria. The share of respondents who had expressed this opinion in 2015 was more or less the same (52%), hence no significant developments have occurred on this issue between the two surveys. Nearly one third of the respondents (29%) however, did not agree that democracy was the best form of government for Bulgaria, while every fourth person (23%) was not sure what to reply to this question (fig. 5).
The high share of respondents who did not provide a definitive answer, seems to suggest that “democracy” is a concept which a considerable number of people are not exposed to in their daily lives, have no immediate expe-rience with, and cannot express an opinion on. Hence, the survey questionnaire did not include a direct ques-tion asking respondents to assess whether Bulgaria can be currently described as a democratic country. Such a
confidence in democrAcy And the mAin democrAtic institutions
Other
Politicians are corrupt
There is no national unity
We are held back by external factors
Minorities have too many privileges
0% 20%10% 30% 40% 50% 60%
55
28
6
8
3
50
26
10
7
7 20162015

9
REPOR T, 28 Februar y 2017OPEN SOCIETY INSTITUTE – SOFIA
question, however, was asked in the focus groups and all three groups (young people from Sofia, people liv-ing in the North Central Region and Roma from a district town) agreed that Bulgaria cannot be currently defined as a democracy.
The quantitative survey in both 2015 and 2016 re-vealed significant disparities in the confidence of dif-ferent social groups in democracy as the best form of government for Bulgaria. In 2015, six social groups had greater confidence in democracy than the average for the country: these included people living in Sofia, peo-ple living in the North Central Region, better educated persons, more well-to-do respondents, employed per-sons and young people between the age of 18 and 29 years. In 2016, confidence in democracy remained high-er than the national average in four of these groups: 56% of the people living in Sofia, 55% of the best educated persons, 55% of the well-to-do respondents and 52% of the employed persons agreed that democracy was the best form of government for the country, compared to a national average of 49% (fig. 6).
As mentioned above, better educated respondents were more likely to have confidence in democracy and the share of those who were not sure among them was
Figure 5. Confidence in democracy
Question: Do you believe that democracy is the best form of government for Bulgaria?
Question: Do you believe that democracy is the best form of government for Bulgaria?
Figure 6. Confidence in democracy (by place of residence)
2015
19
28
52
0%
10%
20%
30%
40%
50%
60%
70%
80%
90%
100%
23
29
49
2016
Yes No I don't know
Sofia
26
18
56
0%
10%
20%
30%
40%
50%
60%
70%
80%
90%
100%
19
31
49
District town
Yes No I don't know
23
29
49
National average
23
34
42
Other town
24
28
48
Village
10
REPOR T, 28 Februar y 2017OPEN SOCIETY INSTITUTE – SOFIA
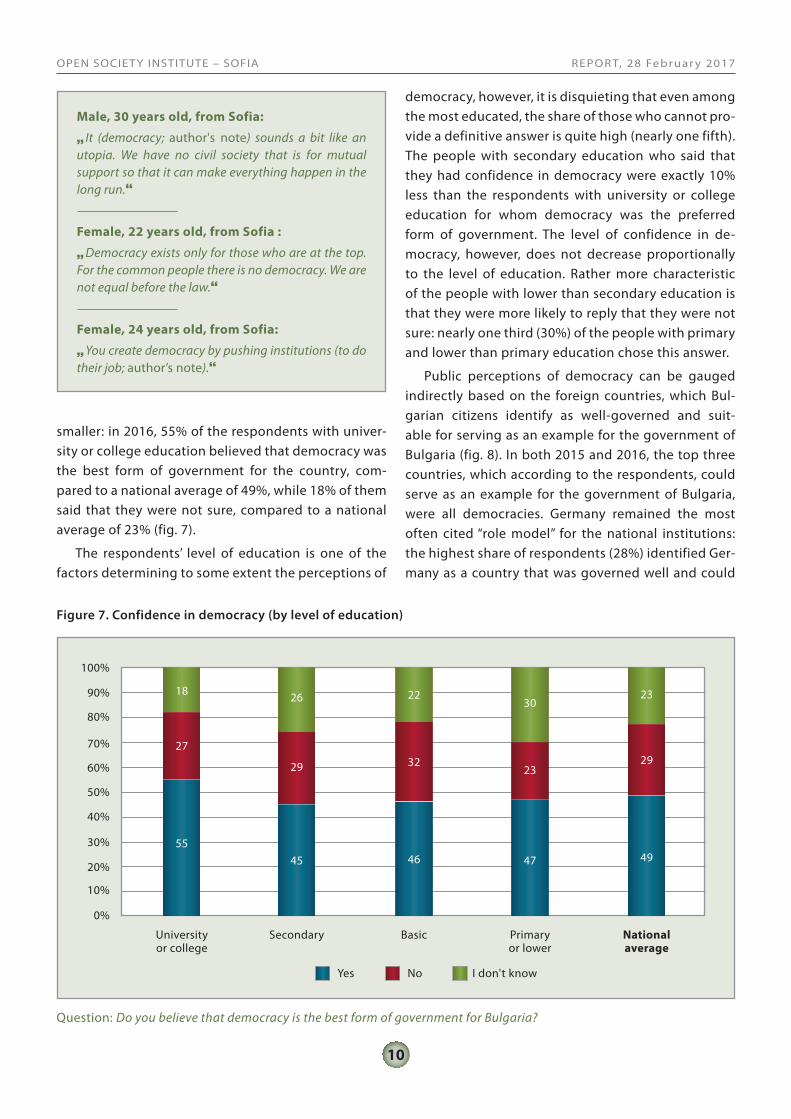
smaller: in 2016, 55% of the respondents with univer-sity or college education believed that democracy was the best form of government for the country, com-pared to a national average of 49%, while 18% of them said that they were not sure, compared to a national average of 23% (fig. 7).
The respondents’ level of education is one of the factors determining to some extent the perceptions of
Male, 30 years old, from Sofia:
It (democracy; author's note) sounds a bit like an
utopia. We have no civil society that is for mutual support so that it can make everything happen in the long run.
Female, 22 years old, from Sofia :
Democracy exists only for those who are at the top.
For the common people there is no democracy. We are not equal before the law.
Female, 24 years old, from Sofia:
You create democracy by pushing institutions (to do
their job; author’s note).
Question: Do you believe that democracy is the best form of government for Bulgaria?
Figure 7. Confidence in democracy (by level of education)
democracy, however, it is disquieting that even among the most educated, the share of those who cannot pro-vide a definitive answer is quite high (nearly one fifth). The people with secondary education who said that they had confidence in democracy were exactly 10% less than the respondents with university or college education for whom democracy was the preferred form of government. The level of confidence in de-mocracy, however, does not decrease proportionally to the level of education. Rather more characteristic of the people with lower than secondary education is that they were more likely to reply that they were not sure: nearly one third (30%) of the people with primary and lower than primary education chose this answer.
Public perceptions of democracy can be gauged indirectly based on the foreign countries, which Bul-garian citizens identify as well-governed and suit-able for serving as an example for the government of Bulgaria (fig. 8). In both 2015 and 2016, the top three countries, which according to the respondents, could serve as an example for the government of Bulgaria, were all democracies. Germany remained the most often cited “role model” for the national institutions: the highest share of respondents (28%) identified Ger-many as a country that was governed well and could
University or college
18
27
55
0%
10%
20%
30%
40%
50%
60%
70%
80%
90%
100%
26
29
45
Secondary
Yes No I don't know
23
29
49
National average
22
32
46
Basic
30
23
47
Primary or lower

11
REPOR T, 28 Februar y 2017OPEN SOCIETY INSTITUTE – SOFIA
provide an example for Bulgaria. The second and third best governed countries according to the respondents were Great Britain and Switzerland, which gathered between 12% and 13%. The top three countries per-ceived as examples of good governance by Bulgarian citizens remained the same as in 2015.
The quantitative survey, however, showed that the support for Germany as a perceived “role model” has declined considerably since 2015. In the first survey, 40% of the respondents identified Germany as an ex-ample to be followed, while in the second survey only 28% shared this opinion. The decline in Germany’s popularity as a country with good governance whose example should be followed, probably reflects the fact that Bulgarians tend to disapprove Chancellor Merkel’s “open doors” policy towards refugees from the Middle East. This assumption has to be tested in a subsequent quantitative survey. In 2016, in one of the three focus groups conducted together with the quantitative sur-vey, it was explicitly formulated as a plausible explana-tion for the decline of Germany’s popularity.
The main task in the three focus groups was to identify the factors based on which the governance of a foreign country can be determined as “good”; in oth-
er words, from the perspective of the Bulgarians what makes some countries a desired role model in good governance, and others not.
The participants in the focus group with young peo-ple from Sofia agreed that the best governed countries whose example Bulgaria should follow, were the Scan-dinavian countries and the Netherlands. The main rea-sons for which the focus group participants identified these countries as a desired role model included the broad personal freedom people enjoy there (expressed mainly through different aspects of the Dutch educa-tion system), “social security” and the lack of “osten-tatious display of social status”. The latter argument (“Politicians do not flaunt their cars”) was also made in the focus group with people living in a small town in the North Central Region, who cited lack of osten-tatiousness as one of the reasons for identifying Swit-zerland as an example of good governance. Lack of os-tentatiousness is an alternative way to formulate the concept of equality among citizens as a key element of the perception of “good governance” and a desired role model to be followed by national institutions.
The focus group with people living in a small town in the North Central Region and the focus group with
Figure 8. International example of good governance
Question: In your opinion, which country in the world is governed well and could serve as an example for Bulgaria?
Germany
United Kingdom
I don't know
Switzerland
Russia
USA
Other
Turkey
France
Italy
Greece
China
Spain
0% 10%5% 15% 20% 25% 30%
28
13
13
12
8
5
4
3
2
2
1
1
1
2016

12
REPOR T, 28 Februar y 2017OPEN SOCIETY INSTITUTE – SOFIA
Roma from a district town ranked Greece at a much higher position among the countries that could serve as an example of good governance than the results of the quantitative survey suggested. The partici-pants in the first focus group cited two main reasons for considering the governance of Greece “good” and a desired role model: national unity/solidarity when Greeks protest and want to achieve something as na-tion, and lack of fear that dissent may have adverse consequences.
In the focus group with Roma, the choice of Greece as a desired “role model” was also supported with argu-ments related to strong national unity in the pursuit of a common goal. In addition to Greece, the partici-pants in this focus group identified two other coun-
tries whose example in good governance should be followed: Romania and France. In the case of Romania, the determining factor cited was “the meaningful judi-cial system reform” that was carried out in this country, while in the case of France, equality among citizens again emerged as a key argument, albeit formulated differently: “[France] gives all the nations it had colo-nized centuries ago the opportunity to become equal and full part of the French society”.
Although citizens expressed support for democracy as the best form of government for Bulgaria and identi-fied only democratic countries as desired “role models” for the country’s government, the quantitative research revealed persistently low public confidence in the fun-damental institutions of representative democracy (fig. 9). Both surveys, in 2015 and in 2016, tested public attitudes towards 14 different institutions and in both cases the National Assembly and the political parties ranked lowest in terms of public confidence. The vast majority of respondents (76%) indicated that they did not trust political parties, while 71% said they did not trust the National Assembly.
Figure 9. Confidence in institutions
Question: To what extent do you trust the following institutions/organizations? (“I trust” includes the sum of respondents who have chosen the answers “I fully trust” and “I rather trust”, while “I don’t trust” includes the sum of respondents who have chosen the answers “I rather distrust” and “I don’t trust”.)
Male, 47 years old, from a district town:
The best thing now (when the government is
democratic; author's note) is that you can leave the country, hit the road and follow your own path.
0% 20% 40% 60% 100%80%
I trust I don't trust I don't know
Bulgarian Orthodox Church
NGOs
President
Courts
Government
Parliament
Political parties
Army
Universities
Police
Hospitals
EU
Bulgarian National Bank
Banks
55
55
50
50
47
44
41
35
33
32
32
27
22
17
31
30
35
35
45
50
45
54
39
58
57
65
71
76
12
13
13
14
5
5
12
9
25
7
9
6
6
6

13
REPOR T, 28 Februar y 2017OPEN SOCIETY INSTITUTE – SOFIA
The institutions of the European Union tradition-ally inspire greater confidence than national institutions. Only two of the institutions included in the survey rallied the confidence of the majority of respondents (55%): the European Union and the Bulgarian Orthodox Church. Half of the respondents tend to trust the army and the uni-versities, while the police enjoys the confidence of 47% of the respondents. As in 2015, the declared confidence in the Bulgarian police was much higher than the confi-dence in courts: only one third of the respondents (32%) indicated that they would rather trust the courts.
Approximately one third of the respondents declared that they would rather trust non-governmental organi-zations in the country. This level of confidence is around the average for the 14 institutions and organizations ex-amined. Public confidence in NGOs is higher than the confidence in political parties and the National Assem-bly, comparable to the confidence in the President and the courts, and much lower than the confidence in the police, the army and the Bulgarian Orthodox Church.
It is important to note that one fourth of the re-spondents (25%) replied that they were not sure whether they could trust non-governmental organi-zations. For all other institutions and organizations covered by the survey, the share of those who have chosen the answer “I’m not sure” was much smaller (ranging between 9% and 13%). The high percentage of people who were unable to express a clear opinion on non-governmental organizations can probably be explained with the fact that the NGO community is difficult to define. “Non-governmental organizations” are not a single organization or institution. This collec-tive term covers many different non-profit legal enti-ties and informal civic initiatives that perform a wide range of activities including sports clubs, organiza-tions providing social services, educational and human rights organizations, etc. which have little in common in their scope of activity but share a common principle of organization and work. Under these circumstances,
citizens find it difficult to perceive “non-governmental organizations” as a consolidated sector, while those of them who have replied that they trusted NGOs, most probably had a specific NGO in mind, hence their con-fidence should not necessarily be interpreted as de-clared confidence in the entire NGO sector.
The problem however is not limited only to the diffi-culties in perceiving “non-governmental organizations” as a consolidated sector. The share of respondents who were not sure whether they could trust non-govern-mental organizations varies by place of residence and this suggests that the access of citizens to information and serviced provided by specific non-governmental organizations also affects public perceptions. Nearly one third (32%) of the respondents who live in Sofia and in villages said that they were not sure whether they could trust non-governmental organizations, hence, one can assume that they have less access to information about NGOs or about the results of their activity. In district towns, the percentage of people who were unable to express a clear opinion was much lower – only 17%, and quite comparable with the share of those who have chosen the answer “I’m not sure” for the other institutions and organizations examined.
An important aspect of public attitudes towards democracy in Bulgaria is the clear discrepancy be-tween support for democracy in general as a form of government, and the low public confidence in the institutions of representative democracy.6 The de-clared confidence in democracy as a preferred form of government is not based on actual experience with participation in the democratic decision-making process and does not translate into confidence in the fundamental democratic institutions. Therefore, the
6 This discrepancy has been noted on multiple occasions in other research studies. See, for instance, Dimitrova, B. “The Shifting Sands of Public Opinion. Political, economic and status changes in the period 2002-2007“, in the publication The State of Society 2008, Open Society Institute – Sofia.
Elderly female Roma, from a district town:
I like Germany because it’s better there. All my
relatives are in Germany, you won’t believe the things they’re telling me about life there. They tell me people go to work, there are jobs with good, handsome pay, child benefits are higher, they give decent social benefits.
Female Roma, 23 years old, from a district town:
(To the question which country in the world is
governed well; author’s note) I would say Germany before Merkel let the migrants in. The state is weakened now, as if it is not protected enough. Before, I have never heard someone breaking the law there.

14
REPOR T, 28 Februar y 2017OPEN SOCIETY INSTITUTE – SOFIA
registered support for democracy is rather abstract, grounded more in wishful thinking than in reality, and may prove unsustainable over time.
In addition to the existence of democratic institu-tions, possible indicators for assessing the quality of democracy are also the principles, which underlie the establishment of national elites.7 The 2016 survey re-vealed that for the majority of respondents, the main factors for access to senior government positions in Bulgaria were the applicant’s personal connections and money/wealth. Public attitudes on this issue remained unchanged since 2015. According to the majority of respondents, the educational background, experience, knowledge or skills of the applicant are far less impor-tant for securing a senior governmental position than good personal connections and money (fig. 10).
7 See: Prodanov, G. “The Quality of Democracy as a Quality of Elites”, in: Kanev, D. and Todorov, A. (eds.), Quality of Democracy in Bulgaria, East – West, 2014, p. 391.
Figure 10. Main factors for access to senior government positions
Question: Which of the following factors have greater importance in the appointment of people to senior government positions?
As in 2015, the 2016 survey registered established public perceptions, which suggest that citizens
do not feel adequately represented in the governance of the country and have no confidence in their elected representatives. The majority of respondents (58%) could not agree that there was at least one member of Parliament whom they trusted and who represented
Young male, from Sofia :
I don’t see any good examples in politics. I don’t mean
to say that only people like us have to govern but we must, as a non-sick society, state what we want.
PoliticAl rePresentAtion And PArticiPAtion of citizens in GovernAnce
0% 20%10% 30% 40% 50% 60% 70%
The applicant's connections 65
65
The applicant's money/wealth 54
54
The applicant's popularity 29
26
The applicant's education 20
18
The applicant's experience 15
15
The applicant's knowledge/skills 12
14
I'm not sure11
14
Other1
2
20162015

15
REPOR T, 28 Februar y 2017OPEN SOCIETY INSTITUTE – SOFIA
Figure 11. Confidence in individual members of Parliament
Question: Do you agree with the following statements: “In the National Assembly there is at least one representa-tive from my constituency whom I trust and I am confident that he would defend the interest of people like me and my family”?
people like them. Only 21% of the respondents agreed with this statement (fig. 11).
There are significant variations in the perceived representation in decision-making and the citizens’ confidence in individual members of Parliament ac-cording to the age, employment status, education, ethnic background and place of residence of the re-spondents (fig. 12, 13 and 14). The residents of Sofia tend to have less confidence and to feel less repre-sented in the National Assembly than other citizens in the country. Only 12% of the respondents who live in Sofia agreed with the statement that there was at least one member of Parliament whom they trusted and who represented people like them, against a national average of 21%. The level of confidence and perceived representation is also low among young people be-tween 18 and 29 years of age, among unemployed persons, and among the respondents who identified themselves as Roma. For instance, only 13% of the people aged between 18 and 29 years felt that that there was at least one member of Parliament whom they trusted, the national average being 21%.
The respondents who identified themselves as Turks tend to feel more represented and to have great-er confidence in their elected representatives than the
Question: Do you agree with the following statements: “In the National Assembly there is at least one representative from my constituency whom I trust and I am confident that he would defend the interest of people like me and my family”?
Figure 12. Confidence in individual members of Parliament (by place of residence)
2015
22
54
24
0%
10%
20%
30%
40%
50%
60%
70%
80%
90%
100%
21
58
21
2016
Yes No I don't know
Sofia
28
59
120%
10%
20%
30%
40%
50%
60%
70%
80%
90%
100%
19
59
22
District town
Yes No I don't know
21
58
21
National average
14
59
27
Other town
23
56
21
Village

16
REPOR T, 28 Februar y 2017OPEN SOCIETY INSTITUTE – SOFIA
Question: Do you agree with the following statements: “In the National Assembly there is at least one representative from my constituency whom I trust and I am confident that he would defend the interest of people like me and my family”?
Figure 13. Confidence in individual members of Parliament (by employment status)
Question: Do you agree with the following statements: “In the National Assembly there is at least one representative from my constituency whom I trust and I am confident that he would defend the interest of people like me and my family”?
Figure 14. Confidence in individual members of Parliament (by level of education)
Employed
19
56
25
0%
10%
20%
30%
40%
50%
60%
70%
80%
90%
100%
Unemployed
Yes No I don't know
20
65
15
National average
21
58
21
Retired (and not working)
23
58
19
University or college
21
53
26
0%
10%
20%
30%
40%
50%
60%
70%
80%
90%
100%
19
63
18
Secondary
Yes No I don't know
21
58
21
National average
22
58
20
Basic
34
38
26
Primary or lower
17
REPOR T, 28 Februar y 2017OPEN SOCIETY INSTITUTE – SOFIA
average citizen: 36% of them agreed that there was at least one member of Parliament whom they trusted, against a national average of 21%. The level of con-fidence and perceived representation is also slightly higher among people with average income (400-600 BGN per household member per month), em-ployed persons and people living in towns other than the district centers.
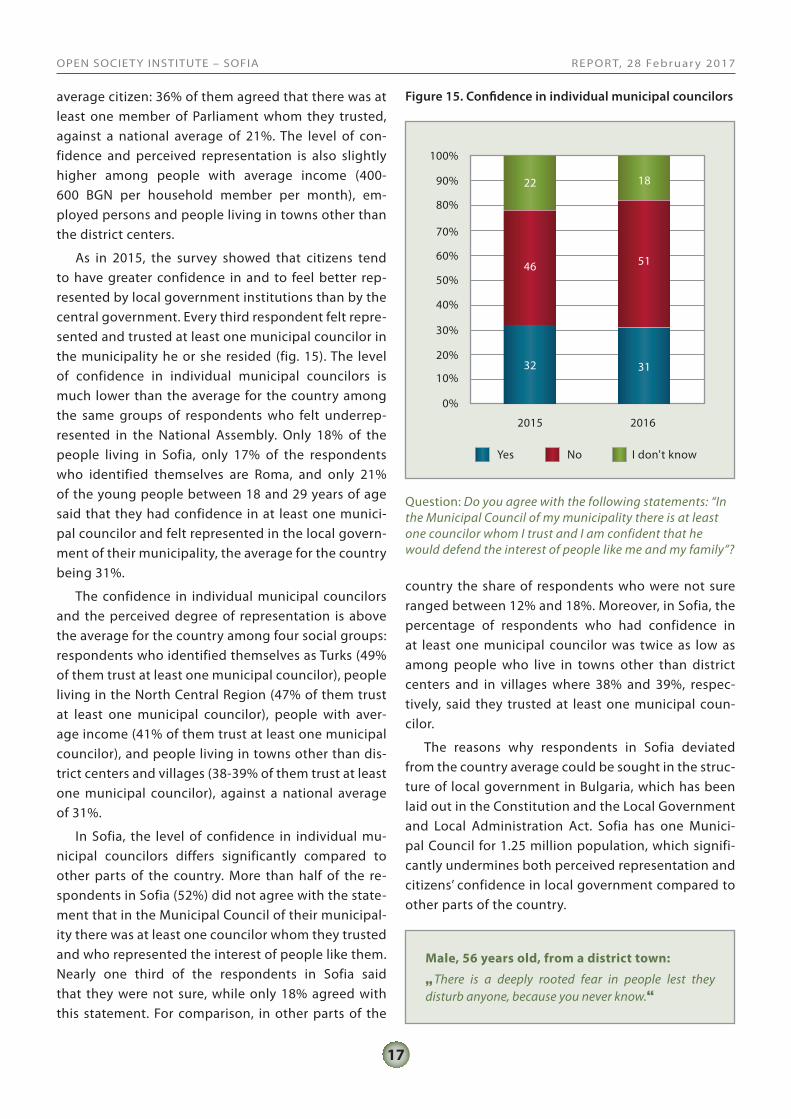
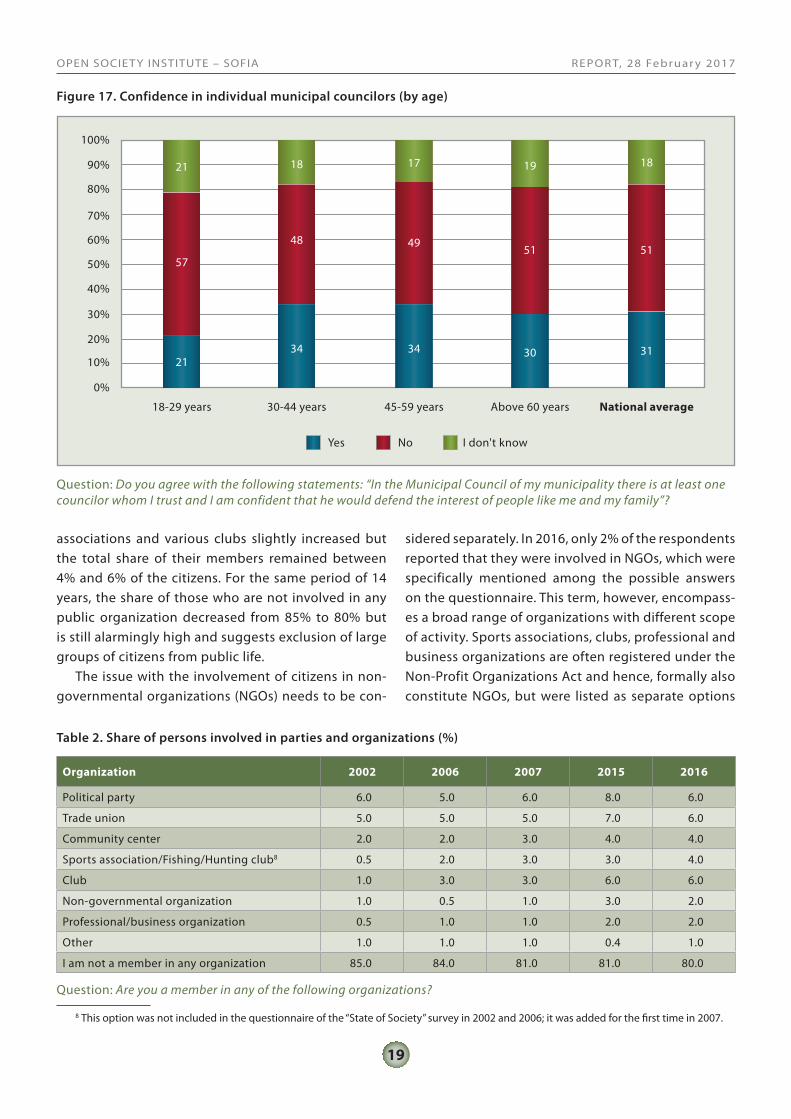
As in 2015, the survey showed that citizens tend to have greater confidence in and to feel better rep-resented by local government institutions than by the central government. Every third respondent felt repre-sented and trusted at least one municipal councilor in the municipality he or she resided (fig. 15). The level of confidence in individual municipal councilors is much lower than the average for the country among the same groups of respondents who felt underrep-resented in the National Assembly. Only 18% of the people living in Sofia, only 17% of the respondents who identified themselves are Roma, and only 21% of the young people between 18 and 29 years of age said that they had confidence in at least one munici-pal councilor and felt represented in the local govern-ment of their municipality, the average for the country being 31%.
The confidence in individual municipal councilors and the perceived degree of representation is above the average for the country among four social groups: respondents who identified themselves as Turks (49% of them trust at least one municipal councilor), people living in the North Central Region (47% of them trust at least one municipal councilor), people with aver-age income (41% of them trust at least one municipal councilor), and people living in towns other than dis-trict centers and villages (38-39% of them trust at least one municipal councilor), against a national average of 31%.
In Sofia, the level of confidence in individual mu-nicipal councilors differs significantly compared to other parts of the country. More than half of the re-spondents in Sofia (52%) did not agree with the state-ment that in the Municipal Council of their municipal-ity there was at least one councilor whom they trusted and who represented the interest of people like them. Nearly one third of the respondents in Sofia said that they were not sure, while only 18% agreed with this statement. For comparison, in other parts of the
Figure 15. Confidence in individual municipal councilors
Question: Do you agree with the following statements: “In the Municipal Council of my municipality there is at least one councilor whom I trust and I am confident that he would defend the interest of people like me and my family”?
country the share of respondents who were not sure ranged between 12% and 18%. Moreover, in Sofia, the percentage of respondents who had confidence in at least one municipal councilor was twice as low as among people who live in towns other than district centers and in villages where 38% and 39%, respec-tively, said they trusted at least one municipal coun-cilor.
The reasons why respondents in Sofia deviated from the country average could be sought in the struc-ture of local government in Bulgaria, which has been laid out in the Constitution and the Local Government and Local Administration Act. Sofia has one Munici-pal Council for 1.25 million population, which signifi-cantly undermines both perceived representation and citizens’ confidence in local government compared to other parts of the country.
Male, 56 years old, from a district town:
There is a deeply rooted fear in people lest they
disturb anyone, because you never know.
2015
22
46
32
0%
10%
20%
30%
40%
50%
60%
70%
80%
90%
100%
18
51
31
2016
Yes No I don't know

18
REPOR T, 28 Februar y 2017OPEN SOCIETY INSTITUTE – SOFIA
There are some differences in the perceived de-gree of representation and level of confidence in local government institutions depending on the respond-ents’ ethnic background. Nearly half (49%) of those who identified themselves as Turks agreed with the statement that in the Municipal Council of their mu-nicipality there was at least one councilor whom they trusted and who represented their interest, which is much higher than the average for the country (31%). At the opposite end of the spectrum are the respond-ents who identified themselves as Roma. The major-ity of them (63%) did not agree with the statement that there was at least one councilor whom they could trust to represent their interest. Only 17% of the re-spondents who identified themselves as Roma agreed with this statement, against a national average of 31% (fig. 16).
Question: Do you agree with the following statements: “In the Municipal Council of my municipality there is at least one councilor whom I trust and I am confident that he would defend the interest of people like me and my family”?
Figure 16. Confidence in individual municipal councilors (by self-declared ethnicity)
The respondents’ age also affects the degree of perceived representation and the level of confidence in individual municipal councilors. The youngest feel less represented in local government: only 21% of the respondents between 18 and 29 years of age agreed that in the Municipal Council of their municipality there was at least one councilor whom they trusted and who represented their interest. This is signifi-cantly below the national average of 31% (fig. 17). As mentioned earlier, young people feel less represented in the National Assembly as well and have less confi-dence in individual members of Parliament than the average citizen.
The low public confidence in institutions and the inadequate degree of perceived representation of citizens in decision-making are coupled by a third ma-jor challenge to the fundamental values of the EU in Bulgaria: the low level of citizens’ participation in all forms of public life. Only 5% to 6% of respondents re-ported that they were involved in a professional un-ion or a political party and this share has remained unchanged since previous similar surveys, the earliest of which was conducted in 2002. In the period 2002 – 2016, membership in community centers, sports
Female, 42 years old, from a district town:
Maybe they are afraid, maybe they think why should
I speak up first. I don’t know, maybe it’s anxiety, fear that if someone stood up first, there would be consequences for their job.
Bulgarians
18
52
29
0%
10%
20%
30%
40%
50%
60%
70%
80%
90%
100%
Turks
Yes No I don't know
19
32
49
National average
18
51
31
Roma
20
63
17
19
REPOR T, 28 Februar y 2017OPEN SOCIETY INSTITUTE – SOFIA
Question: Do you agree with the following statements: “In the Municipal Council of my municipality there is at least one councilor whom I trust and I am confident that he would defend the interest of people like me and my family”?
Figure 17. Confidence in individual municipal councilors (by age)
associations and various clubs slightly increased but the total share of their members remained between 4% and 6% of the citizens. For the same period of 14 years, the share of those who are not involved in any public organization decreased from 85% to 80% but is still alarmingly high and suggests exclusion of large groups of citizens from public life.
The issue with the involvement of citizens in non-governmental organizations (NGOs) needs to be con-
Organization 2002 2006 2007 2015 2016
Political party 6.0 5.0 6.0 8.0 6.0
Trade union 5.0 5.0 5.0 7.0 6.0
Community center 2.0 2.0 3.0 4.0 4.0
Sports association/Fishing/Hunting club8 0.5 2.0 3.0 3.0 4.0
Club 1.0 3.0 3.0 6.0 6.0
Non-governmental organization 1.0 0.5 1.0 3.0 2.0
Professional/business organization 0.5 1.0 1.0 2.0 2.0
Other 1.0 1.0 1.0 0.4 1.0
I am not a member in any organization 85.0 84.0 81.0 81.0 80.0
Table 2. Share of persons involved in parties and organizations (%)
sidered separately. In 2016, only 2% of the respondents reported that they were involved in NGOs, which were specifically mentioned among the possible answers on the questionnaire. This term, however, encompass-es a broad range of organizations with different scope of activity. Sports associations, clubs, professional and business organizations are often registered under the Non-Profit Organizations Act and hence, formally also constitute NGOs, but were listed as separate options
Question: Are you a member in any of the following organizations?
8 This option was not included in the questionnaire of the “State of Society” survey in 2002 and 2006; it was added for the first time in 2007.
18-29 years
21
57
21
0%
10%
20%
30%
40%
50%
60%
70%
80%
90%
100%
18
48
34
30-44 years
Yes No I don't know
18
51
31
National average
17
49
34
45-59 years
19
51
30
Above 60 years
20
REPOR T, 28 Februar y 2017OPEN SOCIETY INSTITUTE – SOFIA
on the survey questionnaire. Therefore, one can as-sume that the share of respondents who indicated that they were involved in NGOs, actually reflects involve-ment only in NGOs that are not clubs, special interest associations, professional or business organizations. If involvement in NGOs is measured by the membership in any legal entity registered under the Non-Profit Or-ganizations Act, then one can surmise that it covers anywhere between 10% and 20% of the citizens.
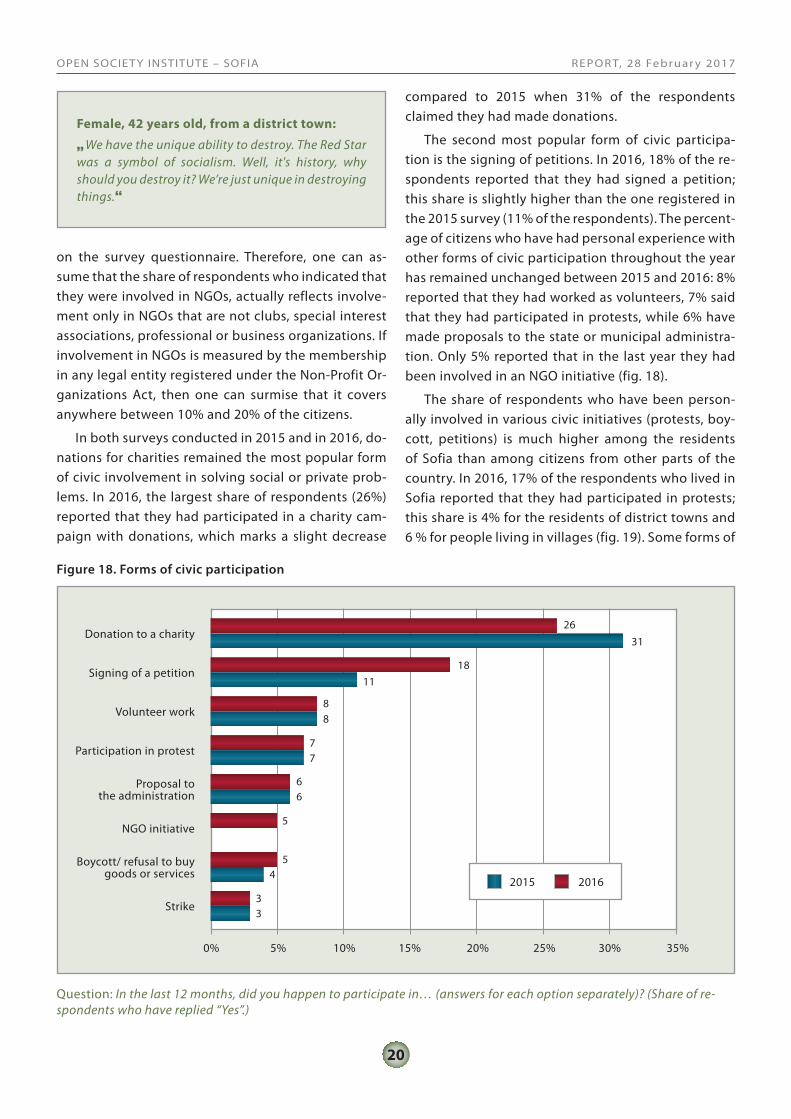
In both surveys conducted in 2015 and in 2016, do-nations for charities remained the most popular form of civic involvement in solving social or private prob-lems. In 2016, the largest share of respondents (26%) reported that they had participated in a charity cam-paign with donations, which marks a slight decrease
Female, 42 years old, from a district town:
We have the unique ability to destroy. The Red Star
was a symbol of socialism. Well, it's history, why should you destroy it? We’re just unique in destroying things.
Figure 18. Forms of civic participation
Question: In the last 12 months, did you happen to participate in… (answers for each option separately)? (Share of re-spondents who have replied “Yes”.)
compared to 2015 when 31% of the respondents claimed they had made donations.
The second most popular form of civic participa-tion is the signing of petitions. In 2016, 18% of the re-spondents reported that they had signed a petition; this share is slightly higher than the one registered in the 2015 survey (11% of the respondents). The percent-age of citizens who have had personal experience with other forms of civic participation throughout the year has remained unchanged between 2015 and 2016: 8% reported that they had worked as volunteers, 7% said that they had participated in protests, while 6% have made proposals to the state or municipal administra-tion. Only 5% reported that in the last year they had been involved in an NGO initiative (fig. 18).
The share of respondents who have been person-ally involved in various civic initiatives (protests, boy-cott, petitions) is much higher among the residents of Sofia than among citizens from other parts of the country. In 2016, 17% of the respondents who lived in Sofia reported that they had participated in protests; this share is 4% for the residents of district towns and 6 % for people living in villages (fig. 19). Some forms of
Proposal to the administration
Donation to a charity
NGO initiative
Boycott/ refusal to buy goods or services
Strike
Participation in protest
Volunteer work
Signing of a petition
0% 10%5% 15% 20% 25% 30% 35%
31
11
8
7
6
3
5
8
7
6
3
4
5
26
18
2015 2016

21
REPOR T, 28 Februar y 2017OPEN SOCIETY INSTITUTE – SOFIA
Elderly Roma male, from a district town:
We have a huge responsibility as citizens, all of
us, because we demonstrate weakness. We are disinterested. We want a lot but give nothing in return.
Question: In the last 12 months, did you happen to participate in… protest? (Share of respondents who have replied “Yes”.)
Figure 19. Participation in protests (by place of residence of the respondents)
civic activity such as boycott/refusal to buy goods and services are virtually unknown as forms of civic partici-pation outside Sofia.
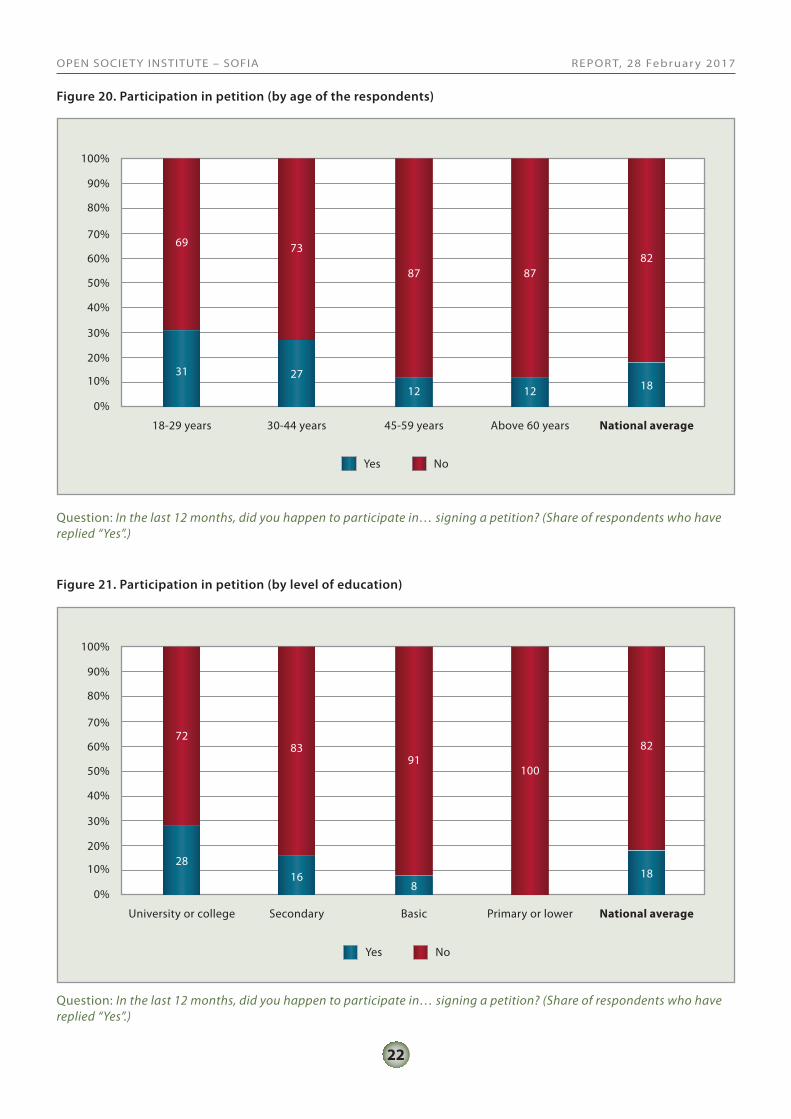
Personal involvement in and response to petitions is also higher among younger and better educated groups of respondents (fig. 20 and 21). At the opposite end of the spectrum are respondents who identified them-selves as Turks or Roma, people who live in villages, and unemployed persons whose reported participation in petitions is half as low as the average for the country (18%). Participation in petitions is most strongly influ-enced by the respondents’ level of education, being the highest among respondents with university or college education and declining as the level of completed edu-cation becomes lower. None of the respondents with primary or lower than primary education reported hav-ing participated in petitions in the last twelve months, compared to a national average of 18%.
With regard to young people in particular (respond-ents between 18 and 29 years of age), the findings reveal a somewhat contradictory picture: on the one hand, young people tend to participate quite actively in civic initiatives, while on the other hand, they do not feel they are adequately represented in local and central government and they have low confidence in institutions. Among other things, this creates the risk for every civic initiative targeted at institutions to be-come a battleground between “young” and “old”.
The surveys conducted between 2006 and 2016 show a decline in the percentage of citizens who tend to remain passive in the face of transgressions they might have witnessed. In the last 10 years, the share of those who reported that they would do nothing if someone broke the rules and created difficulties for them, and would rather accept that such things hap-pened in life, declined by 10%: in 2006, more than one third of respondents (36%) said that they would do nothing, while in 2016, every fourth person (26%) would remain passive.
The likelihood of actively seeking to address poten-tial wrongdoings increased over the ten-year period for each of the measures examined. For instance, the
Sofia
83
17
0%
10%
20%
30%
40%
50%
60%
70%
80%
90%
100%
96
4
District town
Yes No
93
7
National average
93
7
Other town
94
6
Village
22
REPOR T, 28 Februar y 2017OPEN SOCIETY INSTITUTE – SOFIA
Question: In the last 12 months, did you happen to participate in… signing a petition? (Share of respondents who have replied “Yes”.)
Figure 20. Participation in petition (by age of the respondents)
Question: In the last 12 months, did you happen to participate in… signing a petition? (Share of respondents who have replied “Yes”.)
Figure 21. Participation in petition (by level of education)
Yes No
18-29 years
69
31
0%
10%
20%
30%
40%
50%
60%
70%
80%
90%
100%
73
27
30-44 years
82
18
National average
87
12
45-59 years
87
12
Above 60 years
University or college
72
28
0%
10%
20%
30%
40%
50%
60%
70%
80%
90%
100%
83
16
Secondary
Yes No
82
18
National average
91
8
Basic
100
Primary or lower

23
REPOR T, 28 Februar y 2017OPEN SOCIETY INSTITUTE – SOFIA
share of those who would lodge a complaint rose by 13%, while the share of those who would talk to the transgressor and demand that they desisted increased by 17%.
The increased likelihood for citizens to act upon transgressions should be examined in light of the low confidence in institutions that was registered in the survey. Although the share of those who would seek a solution through institutional channels has increased, there has been also an increase in the percentage of those who would resort to mob law or would find
If someone broke the rules and created difficulties for you, you would…
2006 2007 2015 2016
Do nothing – that’s life 36 32 21 26
Complain to the relevant authorities 32 33 48 45
Talk to the transgressor/ demand that they desisted 22 23 37 39
Solve the problem alone when possible 21 23 26 32
Punish the transgressor or hire others to do it 5 7 7 8
Persistently call or write to the relevant authorities 5 5 15 11
Cause them damage by way of punishment 2 2 2 4
Organize a civic initiative (petition, protest) 1 2 4 3
Table 3. Civic activity in case of transgressions (%)
Table 4. Civic activity in case of poor governance (%)
other ways to punish the transgressor, taking justice in their own hands. In 2016, 8% of the respondents ad-mitted that they would personally seek retribution, if someone broke the rules and created difficulties for them.
Between 2006 and 2016 there has been a slight decline in the citizens’ tendency to accept and remain passive to acts of poor governance. In 2006, more than half of the respondents (52%) replied that they would do nothing if they were dissatisfied with the way the country is governed, while in 2016 this share has de-
If you were dissatisfied with the way the country is governed, would you take any action?
2002 2006 2007 2015 2016
I am satisfied with the way the country is governed 3 7 8 7 5
I would join a petition 35 23 26 38 41
I would join a rally/procession 23 21 19 26 30
I would join a strike 19 11 16 17 22
I am prepared to riot in the streets 9 5 7 8 13
I would insist on early elections 11 8 7 15 18
I would insist on early elections 6 4 5 4 5
I would turn to the European Court of Human Rights in Strasbourg - 3 5 8 8
I would turn to national or international media - 2 4 6 9
Other 1 1 1 1 1
I would do nothing 38 52 46 35 33

24
REPOR T, 28 Februar y 2017OPEN SOCIETY INSTITUTE – SOFIA
creased to one third of the citizens (33%). The percent-age of those who claimed that they would act against poor governance has increased for each of the exam-ined constitutional forms of protest: petition, rally, strike, plea to the European Court of Human Rights in Strasbourg or appeal to the media.
As with civic activity in case of transgressions, the increased likelihood for citizens to act against poor governance is at odds with the low confidence in in-stitutions and this creates certain risk for radical ac-tions, reflected in the higher share of respondents who claimed that they would riot in the streets: 13% in 2016, compared to 5% in 2006. On the other hand, support for the most radical action included in the questionnaire has remained the same: only 5% of the respondents would participate in an attack on Parlia-ment like the one that took place in 1997. The likeli-hood for citizens to launch an attack on Parliament has not changed over the last 10 years but affects quite a large number of the adult population in real terms.
As stated above, public confidence in political par-ties is low and few respondents have reported be-
ing members in political parties. A possible explanation for the low confidence and low participation in politi-cal parties is that citizens see political parties as leader-ship projects in which decisions are taken solely by the leader, while ordinary members are relatively power-less. More than one third of the respondents (38%) be-lieve that the members of the party for which they vot-ed in the last parliamentary elections have little or no influence on its leadership. According to the majority of respondents (46%) decisions within a political party are entirely at the discretion of the party leader. In the public perception, the second most influential group in party decision-making are the representatives of the business who are not even organs of the party but for
Figure 22. Decision making in political parties
Question: In your opinion, what influence do each of the following have on the decision making in the party you voted for in the last parliamentary elections?
Public Attitude towArds PoliticAl PArties
Members of the party's managing bodies
Representatives of the business
The leader of the party alone
Ordinary members
0% 10% 20% 30% 40% 50% 60% 70% 90% 100%80%
8 14 25 13 15 25
8 28 19 5 15 25
11 25 12 6 21 25
21 25 11 4 14 25
Very big influence
Little influence
Big influence
No influence at all
I don't know
I didn't vote

25
REPOR T, 28 Februar y 2017OPEN SOCIETY INSTITUTE – SOFIA
Figure 23. Competition among the parties
Question: Do you think that the change of parties in gov-ernment leads to actual changes in the overall government policy?
a considerable number of respondents have greater in-fluence on the decisions taken by a party than its ordi-nary members (fig. 22). Public perceptions on this issue have remained unchanged since 2015.
The share of respondents who feel that there is real competition of ideas among the political par-ties on possible government approaches is decreas-ing: in 2016, only 17% of the respondents agreed that the change of parties in government led to an actual change in government policies, while in 2015, this opinion was shared by 23% of the respondents (fig. 23).
Both studies (2015 and 2016) revealed that accord-ing to a significant majority of respondents organized crime exerted influence on the leadership of the major political parties in the country. In 2016, one third of the respondents believed that organized crime had a “big influence” on some of the major political parties in the country, while 31% believed it had a “very big influence”.
Considerable variations in the respondents’ percep-tion of the influence of organized crime on the major
Question: Do you believe that organized crime influences some of the major political parties in Bulgaria? (“Yes” includes the sum of those who have answered “very big influence” and “big influence”, while “No” includes the sum of those who have answered “little influence” and “no influence at all”.)
Figure 24. Perceived influence of organized crime on political parties (by income status)
2015
22
54
23
0%
10%
20%
30%
40%
50%
60%
70%
80%
90%
100%
21
62
17
2016
Yes No I don't know
Above 600 BGN
12
11
77
0%
10%
20%
30%
40%
50%
60%
70%
80%
90%
100%
20
14
66
400-600 BGN
Yes No I don't know
22
14
64
National average
22
17
61
290-400 BGN
27
16
57
Below 290 BGN

26
REPOR T, 28 Februar y 2017OPEN SOCIETY INSTITUTE – SOFIA
political parties exist among respondents from differ-ent regions and among citizens with different income status. More well-to-do people (with income above 600 BGN per household member per month) are more prone to agree that organized crime influences politi-cal parties than the average citizen (fig. 24).
In the dominant public perception, the free partici-pation of citizens in elections is undermined by cor-ruption and arbitrariness. Approximately 5% of the respondents reported that in the latest local elections in October 2015, someone had offered them money to vote for a particular party or coalition (fig. 25). This share was significantly higher (20%) among respond-ents who identified themselves as Roma.
Vote trading seems to affect more often people of working age (between 30 and 60 years), rather than older citizens (above 60 years), and is not limited to the poor. For instance, 6% of the respondents who live in the wealthiest households (with income above 600 BGN per household member per month) also reported that they had been offered money to vote one way or the other.
Vote trading seems to affect more often the unem-ployed but there are also employed persons who re-
ported they had been offered money. Almost 2% of re-spondents reported also that in the last local elections they had been threatened with dismissal or violence if they did not vote for a particular party or coalition. Extrapolated to the whole population of the country, the findings seem to suggest that in the recent local elections more than 300,000 people had been offered money, while approximately 120,000 people had been threatened with dismissal or violence in order to vote one way or the other.
Figure 25. Vote trading attempts
Question: During the campaign or on election day of latest local elections in October 2015 has anyone offered you money to vote for a particular political party or coalition?
In the study, the rule of law was examined as part of the concept of democratic governance and as one
of the EU values. For the purposes of the survey, the concept “rule of law” was limited to examining public attitudes towards the quality of legislation and public perceptions of the equality of citizens before the law and the independence of courts.
As stated above, public confidence in the courts is not high; moreover, public perceptions in Bulgaria dif-fer significantly from public attitudes in other Mem-ber States. In 2016, 32% of the respondents reported that trusted national courts (in much or lesser extend), which is much lower than the confidence in other in-stitutions such as the police, for instance (47% confi-dence), or the Bulgarian Orthodox Church (55%). How-ever, in 2016 confidence in the national courts was slightly higher than confidence in Parliament and in political parties.
The 2015 survey had revealed that the majority of respondents did not perceive the laws as fair, clear and comprehensible and did not think that they applied equally to all. These findings were fully corroborated by the 2016 survey, which suggests that they most
Female, 24 years old, Sofia:
Bureaucracy and red tape are a huge problem for
the administration. This is what delays the process. Sometimes, even if the institution is doing its job properly, the very rules and laws make it cumbersome and unreliable in the eyes of the people.
the rule of lAw
Yes
No
5%
95%

27
REPOR T, 28 Februar y 2017OPEN SOCIETY INSTITUTE – SOFIA
probably reflect a deeply rooted negative perception of the quality of legislation and the application of the constitutional principle of equality of citizens before the law. More than half of respondents (55%) disagreed with the statement that the laws in Bulgaria were fair (fig. 26). Those who agreed with this statement were more than those who disagreed only among the re-spondents from the North Central Region. Among the respondents who identified themselves as Roma, only 17% tended to agree that the laws in the country were fair, compared to a national average of 26%.
A significant majority (two thirds) of respondents disagreed with the statement that the laws in Bulgar-ian were clear and comprehensible to the citizens (fig. 27).
More than three quarters (78%) of the respondents disagreed with the statement that the laws in Bulgaria applied equally to all, while those who agreed were only 8% (fig. 28). The share of those who agree with this statement was twice as high as the national aver-age among the respondent living in the North Central Region and the South Eastern Region. The respond-
Figure 26. Are the laws fair?
Question: Would you agree with the following statement: “The laws in Bulgaria are fair”?
Figure 27. Are the laws clear and comprehensible?
Question: Would you agree with the following statement: “The laws in Bulgaria are clear and comprehensible to the citizens”?
Figure 28. Do laws apply equally to all?
Question: Would you agree with the following statement: “The laws in Bulgaria apply equally to all”?
2015
20
58
22
0%
10%
20%
30%
40%
50%
60%
70%
80%
90%
100%
18
55
26
2016
Yes No I don't know
2015
16
70
140%
10%
20%
30%
40%
50%
60%
70%
80%
90%
100%
17
67
16
2016
Yes No I don't know
2015
14
77
90%
10%
20%
30%
40%
50%
60%
70%
80%
90%
100%
13
78
8
2016
Yes No I don't know
28
REPOR T, 28 Februar y 2017OPEN SOCIETY INSTITUTE – SOFIA
Figure 29. The government acts within the law Figure 30. Courts restrain the government
Question: Would you agree with the following statement: “The government of Bulgaria acts within the law”?
Question: Would you agree with the following statement: “Courts can prevent the government from violating the law”.
ents who identified themselves as Roma and Turks were also slightly more likely than the average to agree that the laws applied equally to everyone.
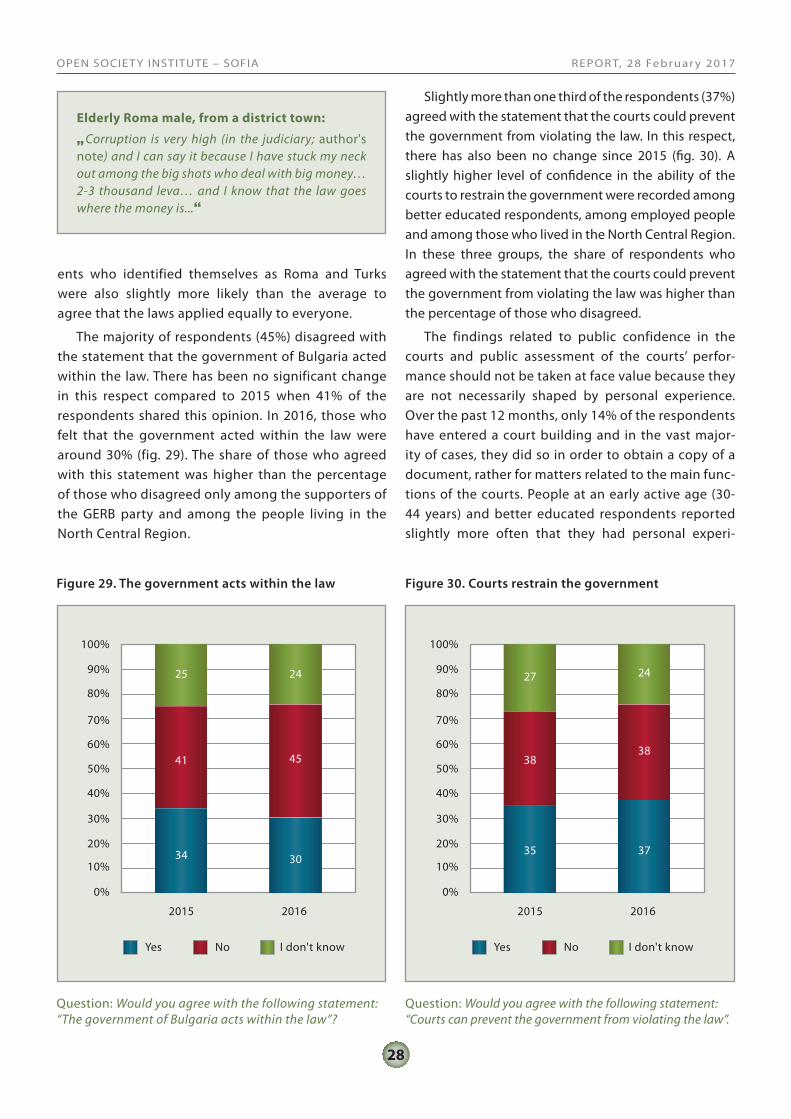
The majority of respondents (45%) disagreed with the statement that the government of Bulgaria acted within the law. There has been no significant change in this respect compared to 2015 when 41% of the respondents shared this opinion. In 2016, those who felt that the government acted within the law were around 30% (fig. 29). The share of those who agreed with this statement was higher than the percentage of those who disagreed only among the supporters of the GERB party and among the people living in the North Central Region.
Slightly more than one third of the respondents (37%) agreed with the statement that the courts could prevent the government from violating the law. In this respect, there has also been no change since 2015 (fig. 30). A slightly higher level of confidence in the ability of the courts to restrain the government were recorded among better educated respondents, among employed people and among those who lived in the North Central Region. In these three groups, the share of respondents who agreed with the statement that the courts could prevent the government from violating the law was higher than the percentage of those who disagreed.
The findings related to public confidence in the courts and public assessment of the courts’ perfor-mance should not be taken at face value because they are not necessarily shaped by personal experience. Over the past 12 months, only 14% of the respondents have entered a court building and in the vast major-ity of cases, they did so in order to obtain a copy of a document, rather for matters related to the main func-tions of the courts. People at an early active age (30-44 years) and better educated respondents reported slightly more often that they had personal experi-
Elderly Roma male, from a district town:
Corruption is very high (in the judiciary; author's
note) and I can say it because I have stuck my neck out among the big shots who deal with big money… 2-3 thousand leva… and I know that the law goes where the money is...
2015 2015
25 27
41 38
34 35
0% 0%
10% 10%
20% 20%
30% 30%
40% 40%
50% 50%
60% 60%
70% 70%
80% 80%
90% 90%
100% 100%
24 24
4538
3037
2016 2016
Yes YesNo NoI don't know I don't know

29
REPOR T, 28 Februar y 2017OPEN SOCIETY INSTITUTE – SOFIA
Question: In the last 12 months have you happened to enter into a court of law?
Figure 31. Personal experience with the courts (by level of education)
Question: If you had to go to court, do you believe that you would receive a fair trial? (“Yes” includes the sum of respon-dents who have chosen the answers “Definitely yes” and “Rather yes”, while “No” includes the sum of respondents who have chosen the answers “Definitely no” and “Rather no”.)
Figure 32. Expectations of a fair trial (by income status)
Yes No
University or college
78
21
0%
10%
20%
30%
40%
50%
60%
70%
80%
90%
100%
89
11
Secondary
86
14
National average
89
11
Basic
94
6
Primary or lower
Above 600 BGN
15
37
47
0%
10%
20%
30%
40%
50%
60%
70%
80%
90%
100%
24
46
30
400-600 BGN
Yes No I don't know
23
43
33
National average
23
48
29
290-400 BGN
26
46
27
Below 290 BGN

30
REPOR T, 28 Februar y 2017OPEN SOCIETY INSTITUTE – SOFIA
ence with the courts than other demographic groups (fig. 31).
The citizens’ expectations of a fair trial remain pessi-mistic and have not changed since 2015; asked wheth-er they expected a fair trial if they had to go to court, the majority of respondents (43%) answered “no” or “definitely no”. Only one third of the respondents felt that they would receive a fair trial, if they had to go to court. The survey registered some regional differences in public perceptions: both in 2015 and in 2016, the re-spondents from the North Central Region who expect-ed to receive a fair trial were far more (60%) than the national average (33%), while the respondents from North Western Region who expected to receive a fair trial were less (21%) than the average for the country.
Young Roma female, from a district town:
(In the judiciary; author's note) the deeper the
pocket, the easier the truth. For petty theft there’s no forgiveness, for millions (stolen) there are no laws.
Those who expected to receive a fair trial prevailed over the sceptics among the more wealthy respond-ents (with income above 600 BGN per household member per month – fig. 32) and among the better educated. The respondents who identified themselves as Turks and those who identified themselves as Roma had lower expectations of a fair trial compared to the national average – 26% of the respondents who identi-fied themselves as Turks and only 20% of the respond-ents who identified themselves as Roma expected to receive a fair trial, if they had to go to court, against an average of 33% for the country.
Figure 33. Risk of wrongful dismissal
Question: How likely it is for you to lose your job/business if … (answers for each option separately)? (“Yes” includes the sum of respondents who have chosen the answers “Highly likely” and “Rather likely”, while “No” includes the sum of respondents who have chosen the answers “Rather unlikely” and “Highly unlikely”.)
As in the 2015 survey, the predominant share of respondents were confident that their civil and
political rights were guaranteed. Almost 80% of the respondents believed that they faced no risk of los-
democrAcy As A system of fundAmentAl riGhts
0% 20% 40% 60% 100%80%
18
11
10
10
9
18
70
79
75
75
79
70
11
10
15
14
12
11
Yes No I don't know
If you publicly critized the decisions of the
current government
If you joined a trade union
If you participated in protests against the
current government
If you openly and publicly professed your
religious beliefs
If you run for an independent municipal councilor or a member
of Parliament
If you spoke a language other than
Bulgarian publicly
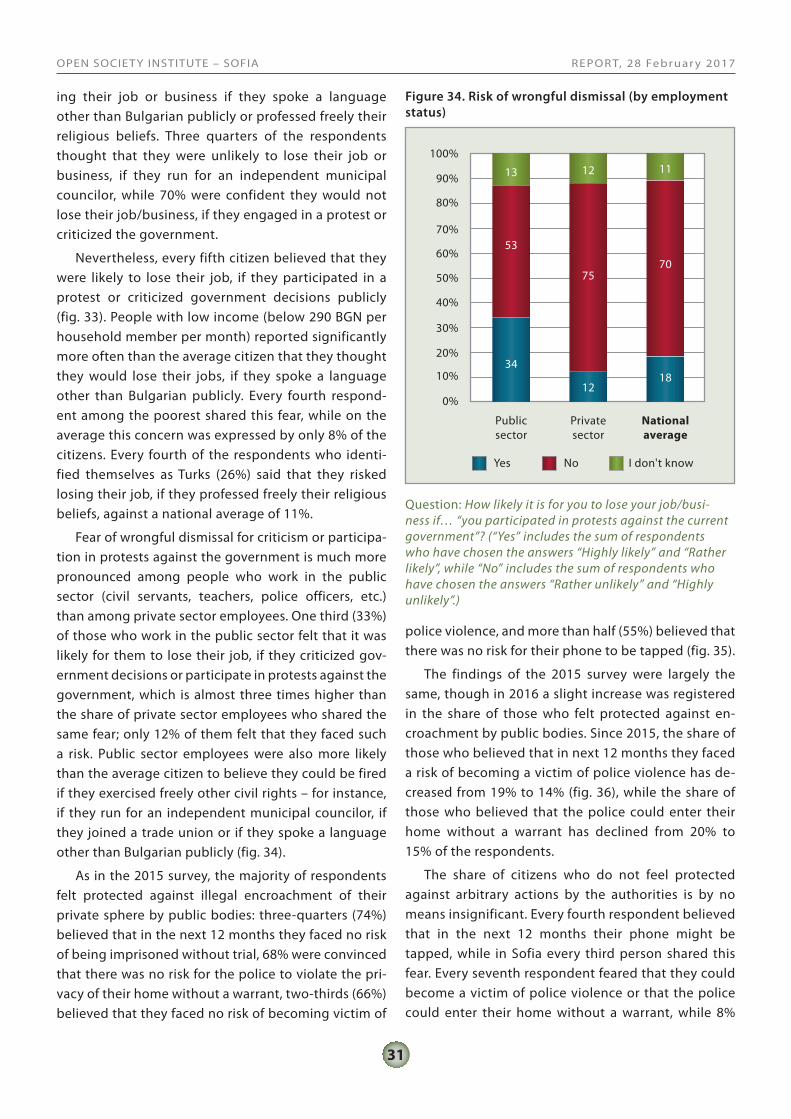
31
REPOR T, 28 Februar y 2017OPEN SOCIETY INSTITUTE – SOFIA
ing their job or business if they spoke a language other than Bulgarian publicly or professed freely their religious beliefs. Three quarters of the respondents thought that they were unlikely to lose their job or business, if they run for an independent municipal councilor, while 70% were confident they would not lose their job/business, if they engaged in a protest or criticized the government.
Nevertheless, every fifth citizen believed that they were likely to lose their job, if they participated in a protest or criticized government decisions publicly (fig. 33). People with low income (below 290 BGN per household member per month) reported significantly more often than the average citizen that they thought they would lose their jobs, if they spoke a language other than Bulgarian publicly. Every fourth respond-ent among the poorest shared this fear, while on the average this concern was expressed by only 8% of the citizens. Every fourth of the respondents who identi-fied themselves as Turks (26%) said that they risked losing their job, if they professed freely their religious beliefs, against a national average of 11%.
Fear of wrongful dismissal for criticism or participa-tion in protests against the government is much more pronounced among people who work in the public sector (civil servants, teachers, police officers, etc.) than among private sector employees. One third (33%) of those who work in the public sector felt that it was likely for them to lose their job, if they criticized gov-ernment decisions or participate in protests against the government, which is almost three times higher than the share of private sector employees who shared the same fear; only 12% of them felt that they faced such a risk. Public sector employees were also more likely than the average citizen to believe they could be fired if they exercised freely other civil rights – for instance, if they run for an independent municipal councilor, if they joined a trade union or if they spoke a language other than Bulgarian publicly (fig. 34).
As in the 2015 survey, the majority of respondents felt protected against illegal encroachment of their private sphere by public bodies: three-quarters (74%) believed that in the next 12 months they faced no risk of being imprisoned without trial, 68% were convinced that there was no risk for the police to violate the pri-vacy of their home without a warrant, two-thirds (66%) believed that they faced no risk of becoming victim of
Figure 34. Risk of wrongful dismissal (by employment status)
Question: How likely it is for you to lose your job/busi-ness if… “you participated in protests against the current government”? (“Yes” includes the sum of respondents who have chosen the answers “Highly likely” and “Rather likely”, while “No” includes the sum of respondents who have chosen the answers “Rather unlikely” and “Highly unlikely”.)
police violence, and more than half (55%) believed that there was no risk for their phone to be tapped (fig. 35).
The findings of the 2015 survey were largely the same, though in 2016 a slight increase was registered in the share of those who felt protected against en-croachment by public bodies. Since 2015, the share of those who believed that in next 12 months they faced a risk of becoming a victim of police violence has de-creased from 19% to 14% (fig. 36), while the share of those who believed that the police could enter their home without a warrant has declined from 20% to 15% of the respondents.
The share of citizens who do not feel protected against arbitrary actions by the authorities is by no means insignificant. Every fourth respondent believed that in the next 12 months their phone might be tapped, while in Sofia every third person shared this fear. Every seventh respondent feared that they could become a victim of police violence or that the police could enter their home without a warrant, while 8%
Public sector
13
53
34
0%
10%
20%
30%
40%
50%
60%
70%
80%
90%
100%12
75
12
Private sector
Yes No I don't know
11
70
18
National average

32
REPOR T, 28 Februar y 2017OPEN SOCIETY INSTITUTE – SOFIA
Question: Do you believe that there is a possibility for any of these events to happen to you in the next 12 months?
Figure 36. Risk of police violence
Question: Do you believe that there is a possibility for any of these events to happen to you in the next 12 months: you becoming victim of police violence?
felt that there was a possibility for them to be impris-oned without trial.
Respondents who identified themselves as Roma tended to feel two times more threatened by police violence than respondents who identified themselves as Bulgarians and three times more threatened than respondents who identified themselves as Turks. More than one fourth of the respondents who identified themselves as Roma (28%) believed that in the next 12 months they were likely to become a victim of police violence (fig. 37).
As regards the set of questions examining public attitudes towards fundamental civil rights, the major negative change in 2016 involves public perceptions of the protection of minority rights. In 2016, the share of those who believed that the rights of minorities in the country were protected decreased from 68% (2015) to 60% (fig. 38).
The decline in the share of respondents who agree that minority rights are adequately protected in Bul-garia is particularly pronounced for two demographic
Figure 35. Risk of encroachment of privacy
2015
20
61
19
0%
10%
20%
30%
40%
50%
60%
70%
80%
90%
100%
19
66
14
2016
Yes No I don't know
0% 20% 40% 60% 100%80%
25
15
14
8
55
68
66
74
19
17
19
17
Yes No I don't know
Your phone being tapped
You being imprisoned without trial
The police entering your home without a warrant
You becoming victim of police violence

33
REPOR T, 28 Februar y 2017OPEN SOCIETY INSTITUTE – SOFIA
Question: Do you believe that there is a possibility for any of these events to happen to you in the next 12 months: you becoming victim of police violence?
Figure 37. Risk of police violence (by ethnicity)
groups: among the respondents who identified them-selves as Roma this share has decreased by half, while among the respondents who identified themselves as Turks the decline is 10%. More than two thirds of those who identified themselves as Roma (70%) and almost half of those who identified themselves as Turks (47%) disagreed with the statement that the minority rights were adequately protected in the country, compared to a national average of 23% (fig. 39).
As in 2015, the 2016 survey established strong dis-criminatory attitudes towards members of certain mi-nority groups.Other things being equal, if people were to choose, 72% of them would not vote for a presi-dential candidate of Roma background, 70% would not vote for a presidential candidate of Turkish back-ground, 67% would not vote for a presidential candi-date who was gay/lesbian, 49% would not vote for a presidential candidate who is elderly (over 65 years), 43% would not vote for a presidential candidate who was physically disabled, while 12% would not vote for a woman candidate (fig. 40).
Figure 38. Protection of minority rights
Question: Do you agree with the following statement: “Minority rights are adequately protected in Bulgaria”?
Bulgarians
12
60
28
0%
10%
20%
30%
40%
50%
60%
70%
80%
90%
100%
Turks
Yes No I don't know
20
66
14
National average
19
66
14
Roma
22
72
7
2015
15
17
68
0%
10%
20%
30%
40%
50%
60%
70%
80%
90%
100%
17
23
60
2016
Yes No I don't know

34
REPOR T, 28 Februar y 2017OPEN SOCIETY INSTITUTE – SOFIA
Question: Do you agree with the following statement: “Minority rights are adequately protected in Bulgaria”?
Figure 39. Protection of minority rights (by self-declared ethnicity)
Figure 40. Discriminatory attitudes
Question: If you were to choose between two presidential candidates with similar qualification and political views, would you vote for someone who was…?
Turks
16
18
66
0%
10%
20%
30%
40%
50%
60%
70%
80%
90%
100%
Roma
Yes No I don't know
28
47
26
National average
17
23
60
Bulgarians
13
70
17
0% 20% 40% 60% 100%80%
18
19
19
42
46
83
67
72
70
49
43
12
15
9
10
9
11
5
Yes No I don't know
Bulgarian citizen of Turkish
background
Bulgarian citizen of Roma
background
Woman
Elderly citizen above 65 years
Gay/Lesbian
A person with physical disability

35
REPOR T, 28 Februar y 2017OPEN SOCIETY INSTITUTE – SOFIA
The confidence of citizens that their fundamen-tal rights are guaranteed by public institutions can be identified as the main achievement of democrat-ic reforms in Bulgaria after the fall of the totalitarian regime, but it is difficult to assess whether such atti-tudes are firmly and permanently rooted in the pub-lic perceptions of democracy in the country. Over the past seven years, approximately half of the respond-ents have been consistently reporting that they would agree to have their democratic rights and freedoms limited provisionally so as to bring order and security and to stabilize the country’s economy.
The responses given to this question in the frame-work of a national representative public opinion sur-vey should not be taken at face value because the question does not test an actual choice between specific policy alternatives. Some political decisions, such as the adoption of the Criminal Assets Forfei-
Question: Would you agree with some temporary restrictions of democratic rights and freedoms so as to bring order and security and to stabilize the economy? (“Yes” includes the sum of respondents who have chosen the answers “Definitely yes” and “Rather yes”, while “No” includes the sum of respondents who have chosen the answers “Rather no” and “Defi-nitely no”.)
Figure 41. Support for temporary restriction of fundamental rights and freedoms
ture Act9 or the building of a fence along the border with Turkey, for instance, have been criticized by ex-perts and non-governmental organizations as con-travening fundamental constitutional rights, but in both cases there has been no expert assessment of the impact of their implementation or unequivocal answer to the question whether they indeed provide more order and safety to citizens, or are simply used as a populist temporary solution to pressing social problems.
These concerns notwithstanding, the permanent-ly established tendency among approximately half of the respondents to support the restriction of civil rights and liberties in the interest of achieving specific policy goals seems to suggest that the relative value of fundamental rights and freedoms in society is not very high, while the guarantees for their protection are constantly being threatened (fig. 41).
9 Promulgated in State Gazette, No. 38 of 18 May 2012.
2011 2012 2013 2014 2015 2016
0%
10%
20%
30%
40%
50%
60%
Yes No I don't know
2009
48
26
24
53
30
16
56
27
16
46
38
15
46
35
18
51
31
18
53
30
17

36
REPOR T, 28 Februar y 2017OPEN SOCIETY INSTITUTE – SOFIA
Television is the main source of information on the situation in the country for the majority of re-
spondents; 74% reported that they relied primarily on television; one in five (20%) tend to rely on the Inter-net, while only 3% of the respondents reported that they trusted newspapers or radio each (fig. 42).
The majority of respondents (50%) agreed with the statement that they received sufficient informa-tion from newspapers and television to be able to assess whether the government was working well; those who disagreed amounted to 31%, while 18% gave no straight answer. In 2016, there has been a slight increase in the share of people who agreed that they were getting enough information about the performance of the government from newspa-pers and television; in the 2015 survey, the share of those who agreed and those who disagreed was equal (40%).
Figure 42. Confidence in the media
Question: Which media do you tend to trust most when you need information about the situation in the country?
Question: Would you agree with the following statement: “As a rule, newspapers in Bulgaria are free to criticize the government”?
Figure 43. Freedom of press (by political affiliation)
reliAble informAtion on the business of Government
74%
20%
3% 3%
Television Internet
RadioNewspapers
GERB
13
24
63
0%
10%
20%
30%
40%
50%
60%
70%
80%
90%
100%
21
24
55
BSP
Yes No I don't know
19
29
52
National average
14
36
50
Other
24
30
46
I won't vote
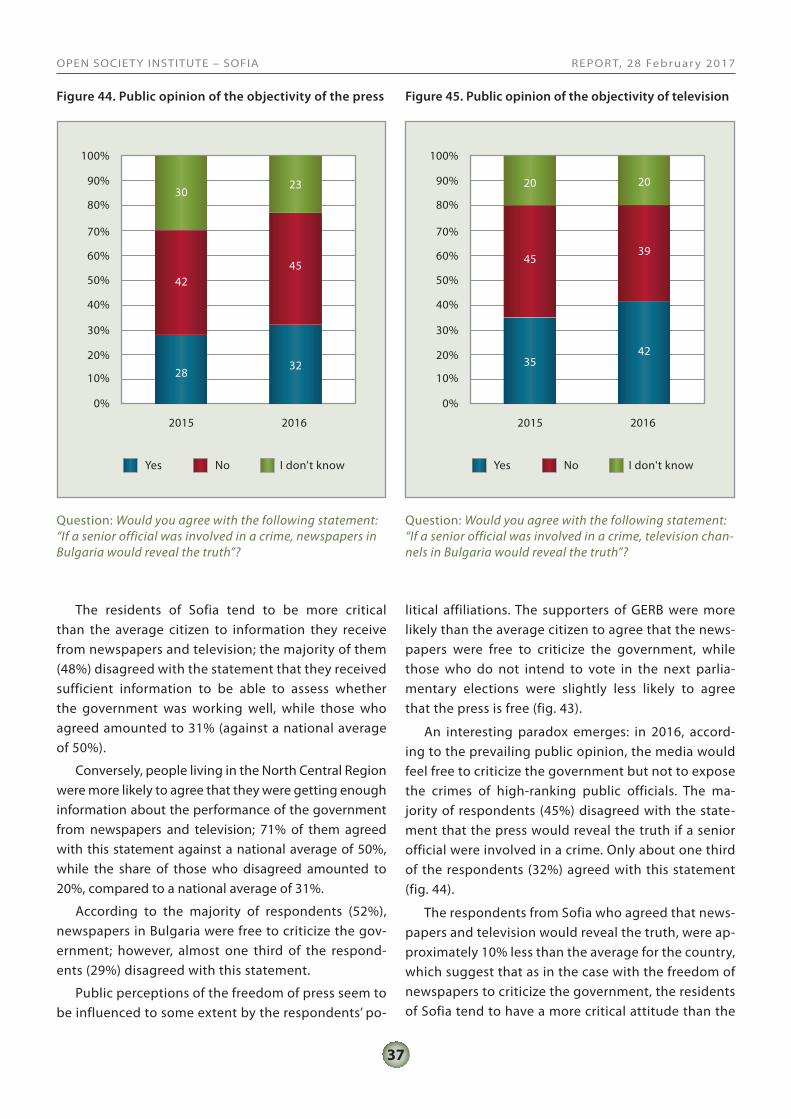
37
REPOR T, 28 Februar y 2017OPEN SOCIETY INSTITUTE – SOFIA
The residents of Sofia tend to be more critical than the average citizen to information they receive from newspapers and television; the majority of them (48%) disagreed with the statement that they received sufficient information to be able to assess whether the government was working well, while those who agreed amounted to 31% (against a national average of 50%).
Conversely, people living in the North Central Region were more likely to agree that they were getting enough information about the performance of the government from newspapers and television; 71% of them agreed with this statement against a national average of 50%, while the share of those who disagreed amounted to 20%, compared to a national average of 31%.
According to the majority of respondents (52%), newspapers in Bulgaria were free to criticize the gov-ernment; however, almost one third of the respond-ents (29%) disagreed with this statement.
Public perceptions of the freedom of press seem to be influenced to some extent by the respondents’ po-
litical affiliations. The supporters of GERB were more likely than the average citizen to agree that the news-papers were free to criticize the government, while those who do not intend to vote in the next parlia-mentary elections were slightly less likely to agree that the press is free (fig. 43).
An interesting paradox emerges: in 2016, accord-ing to the prevailing public opinion, the media would feel free to criticize the government but not to expose the crimes of high-ranking public officials. The ma-jority of respondents (45%) disagreed with the state-ment that the press would reveal the truth if a senior official were involved in a crime. Only about one third of the respondents (32%) agreed with this statement (fig. 44).
The respondents from Sofia who agreed that news-papers and television would reveal the truth, were ap-proximately 10% less than the average for the country, which suggest that as in the case with the freedom of newspapers to criticize the government, the residents of Sofia tend to have a more critical attitude than the
Figure 44. Public opinion of the objectivity of the press Figure 45. Public opinion of the objectivity of television
Question: Would you agree with the following statement: “If a senior official was involved in a crime, newspapers in Bulgaria would reveal the truth”?
Question: Would you agree with the following statement: “If a senior official was involved in a crime, television chan-nels in Bulgaria would reveal the truth”?
2015 2015
3020
42
45
2835
0% 0%
10% 10%
20% 20%
30% 30%
40% 40%
50% 50%
60% 60%
70% 70%
80% 80%
90% 90%
100% 100%
23 20
4539
3242
2016 2016
Yes YesNo NoI don't know I don't know

38
REPOR T, 28 Februar y 2017OPEN SOCIETY INSTITUTE – SOFIA
average citizen. It should be noted also that people who live in Sofia and in rural areas tend to read news-papers less often than in district centers and provin-cial towns. In Sofia and in rural areas, 17%-18% of the people reported that they read newspapers every day, while in district centers and provincial towns this share is around 27%-28%, the national average being 23%.
In the North Central Region and the North Eastern Region, the majority of respondents (52% and 41%, re-spectively) agreed with the statement that the press would reveal the truth if a senior official were involved in a crime, which is higher than the national average of 32%. In these two regions people also tend to read newspapers much more often than the average citi-zen. The share of those who reported that they read newspapers every day was 38% in the North Eastern Region and 36% in the North Central Region, against a national average of 23%. For comparison, in the North Western Region and the South Western Region (domi-nated by Sofia) only 15% of the respondents reported reading newspapers every day.
The results of the 2016 survey revealed that citi-zens tend to have greater confidence in the objectivity of television than the objectivity of the press. Moreo-ver, this tendency has increased significantly since 2015. Whereas in 2015 a little more than one third of the respondents (35%) agreed with the statement that television stations would reveal the truth if a senior official were involved in a crime, in 2016 this share has increased to 42%. However, those who remain skepti-cal about the objectivity of television are by no means few: 39% disagreed with the statement that television stations would reveal the truth if a senior official were involved in a crime (fig. 45).
The survey sought to identify the dynamics in pub-lic attitudes towards democracy, the rule of law,
and the protection of the fundamental human rights and freedoms, which are enshrined in the Constitu-tion of Bulgaria and reflect values that are shared by all EU Member States. The survey sought to identify public attitudes towards six groups of issues: govern-ment efficiency; confidence in the main institutions; political representation and participation of citizens in
governance; the rule of law; democracy as a system of fundamental rights and freedoms enjoyed by citizens; and access to public information on the business of government. The aim was to assess progress in demo-cratic reforms and to identify key risks and challenges to this process.
There are few differences between findings of the 2015 and the 2016 survey, which suggests that public attitudes to democracy, the rule of law and fundamen-tal human rights are permanently established and are not influenced significantly by changes in the political situation.
The findings of the 2016 survey confirmed that the major achievement of democratic reforms in the country so far is the confidence of the majority of citi-zens that their fundamental political and civil rights are guaranteed against arbitrary abuse by the authori-ties. Some social groups, however, tend to feel more threatened that police violence might be exercised against them or that they might lose their job if they expressed their opinion freely or participated in pro-tests.
As in the 2015 survey, the main challenges to dem-ocratic values in Bulgaria involve the exclusion of large groups from public and political life (due to poverty and low level of education but also due to discrimina-tion and fear of reprisal and job loss in case of dissent-ing opinion or participation in protests) and the dif-ficulties in ensuring accountability of the government.
In formal terms, the country belongs to the EU and shares the values of the Union. The government changes through periodic elections in which differ-ent political parties participate. Half of the citizens agree that democracy is the best form of government for the country. However, it appears that the priorities of society and the agenda of the government do not agree; confidence in the institutions of representative democracy is low, a significant share of the popula-tion do not participate in public life and in political decision- making, and feel that the country is not gov-erned efficiently.
This contradiction poses two specific challenges to the effective implementation of the common EU val-ues in Bulgaria.
The first risk stems from the fact that the opportu-nities to increase civic participation without deepen-ing democratic reforms of key institutions have been
conclusion

39
REPOR T, 28 Februar y 2017OPEN SOCIETY INSTITUTE – SOFIA
exhausted. The public opinion surveys conducted in 2015 and 2016 both revealed low level of public par-ticipation in decision-making and weak involvement in civic initiatives. However, compared to previous studies of the “State of Society” series (from 2002 and 2006), there is a small but noticeable shift towards more active civic participation, greater intolerance to violations and increased likelihood for citizens to engage with their own efforts and means in eliminat-ing transgressions or mitigating the consequences of poor governance.
Can one really expect civic participation in govern-ance to increase given the permanently low level of confidence in the institutions, the widespread percep-tions of incompetence and corruption in high-ranking government positions, and the low confidence in the ability of the judiciary to apply the law equally to all? These are the underlying causes behind the proclivity of citizens to seek solutions outside the institutions or in spite of them: the periodic calls for more direct de-mocracy in which institutions and experts are present-ed as undesirable participants in the process of deci-sion-making, as well as the increased risk of mob law and civil disobedience: the respondents who claimed that they would riot in the streets increased from 9%
in 2002 to 13% in 2016, while in 2016 around 6% of the citizens said that they were prepared to launch an at-tack on Parliament in case of poor governance.
The second challenge is related to the risk of an emerging and growing conflict between the themes of democratic governance and government efficiency. In literature, these two concepts do not contradict each other; according to many studies democracy is a more efficient form of government than autocracy.10
But when the government is nominally democratic, yet people perceive it as inefficient, there is a risk for the public discontent with the inefficiency of the gov-ernment to extend over to the concept of democratic governance, i.e. people to assume that the country is governed democratically, but democracy itself is not an efficient form of government. Such attitudes can be discerned in the periodic bursts of nostalgia for the totalitarian regime and the existence of certain public support for solutions that seek to make the govern-ment more efficient by limiting its democratic nature (support for authoritarian leaders, support for limiting civil rights for the sake of greater security promised). Such attitudes create a high and permanent risk of undermining democratic governance and paving the way for authoritarianism.
10 See, for instance, Schmitter, P. and Trechsel, A. (2004) The Future of Democracy in Europe: Trends, Analyses and Reforms. A Green Paper for the Council of Europe, p. 9.

40
© 2017 Open Society Institute – Sofia. All rights reserved.
Contact us:
Open Society Institute – Sofia 56, Solunska str., Sofia 1000
tel.: (+359 2) 930 66 19, fax: (+359 2) 951 63 48
www.osi.bg