DEMO SITE SUMMARY: RICHMOND, TASMANIA
10
This project has been funded by Hort Innovation using the vegetable, fresh potato and potato processing research and development levies and contributions from the Australian Government. Hort Innovation is the grower-owned, not-for-profit research and development corporation for Australian horticulture. KEY MESSAGES From 2018-2021, a demonstration site trial at Harvest Farms in Richmond, Tasmania explored the impact of organic soil amendments on baby leaf crop quality and yield. Potential benefits were observed from the compost in relation to nutrients (e.g. phosphorus and potassium availability), soil carbon levels and soil moisture holding capacity. However, results should be viewed with care given the trial was not fully replicated. While benefits of using compost can be observed within the first year after application in some situations, it can take years of regular applications to see clearly observable benefits. This applies if the soil has been low in organic matter to start with, had other limitations to productivity, tillage occurs frequently, and crop rotation is limited. At this demonstration site, regular application of relatively high rates of compost may be required, to achieve the desired effects. However, this might not be economically viable, if compost has to be bought at standard commercial costs. On the other hand, intensive production without attention to maintaining soil health may limit productivity. Refer to the Soil Wealth and Integrated Crop Protection website for information about the demonstration site, other compost trials and general information about compost use in vegetable crops. DEMO SITE SUMMARY: RICHMOND, TASMANIA 1 AUGUST 2021
Transcript of DEMO SITE SUMMARY: RICHMOND, TASMANIA

This project has been funded by Hort Innovation using the vegetable, fresh potato and potato processing research and development levies and contributions from the Australian Government. Hort Innovation is the grower-owned, not-for-profit research and development corporation for Australian horticulture.
KEY MESSAGES From 2018-2021, a demonstration site trial at Harvest Farms in Richmond, Tasmania explored
the impact of organic soil amendments on baby leaf crop quality and yield.
�Potential�benefits�were�observed�from�the�compost�in�relation�to�nutrients�(e.g.�phosphorus�and�potassium�availability),�soil�carbon�levels�and�soil�moisture�holding�capacity.�However,�results�should�be�viewed�with�care�given�the�trial�was�not�fully�replicated.
����While�benefits�of�using�compost�can�be�observed�within�the�first�year�after�application�in�some�situations,�it�can�take�years�of�regular�applications�to�see�clearly�observable�benefits.�This�applies�if�the�soil�has�been�low�in�organic�matter�to�start�with,�had�other�limitations�to�productivity, tillage occurs frequently, and crop rotation is limited.
At this demonstration site, regular application of relatively high rates of compost may be required,�to�achieve�the�desired�effects.�However,�this�might�not�be�economically�viable,�if compost has to be bought at standard commercial costs. On the other hand, intensive production�without�attention�to�maintaining�soil�health�may�limit�productivity.�
Refer to the Soil�Wealth�and�Integrated�Crop�Protection�website for information about the demonstration site, other compost trials and general information about compost use in vegetable crops.
DEMO SITE SUMMARY:
RICHMOND, TASMANIA
1
AUGUST 2021

INTRODUCTIONThe Richmond demonstration site in southern Tasmania is located in the Coal Valley and hosted by Harvest Farms.
The soil is a duplex soil, typical for the region. Within the trial area, topsoils varied from a sandy loam, to clay loam, and a loam with clay loam particles. The main challenges of these soils are low/declining organic carbon levels – especially under permanent cropping with baby leaf crops – with close rotations, relatively high levels of sodium and magnesium and as a result, poor structural stability and drainage. Soil conditions often vary within paddocks and management units (e.g. irrigation blocks or along beds).
The farm, which encompasses 60ha of croppable land, is intensively cropped with baby leaf crops with a focus on spinach due to market demand. A typical annual rotation is a winter cover crop of a single species monocotyledon (barley, ryecorn) followed by two cash crops of baby leaf spinach, lettuce or brassica.
The team at Harvest Farms were already using reduced tillage, controlled traffic and cover cropping to maintain soil condition. Figure 1: Trial layout, Block J.
This project has been funded by Hort Innovation using the vegetable, fresh potato and potato processing research and development levies and contributions from the Australian Government. Hort Innovation is the grower-owned, not-for-profit research and development corporation for Australian horticulture.
DEMO SITE SUMMARY:RICHMOND, TASAugust 2021
2
Irrigation water quality is mostly good. However, in very dry seasons, it may have increased salinity levels.
In addition to current conservative soil management practices, the team at Harvest Farms wanted to examine soil amendments to help maintain or build soil organic matter. This was expected to have a positive effect on overall soil and crop health.
A farm demonstration trial was established to examine the costs and benefits of using quality compost as an organic soil amendment on baby leaf spinach crop yield and quality.
For information about year one and year two of the compost trials at this demonstration site, refer to the Soil Wealth and Integrated Crop Protection website.
In year three, a barley cover crop was grown over the winter and the following treatments were applied in October 2020:
• Compost @ 30m³/ha
• Compost @ 60m³/ha
• Nil amendments (control).
There were two replicates of each treatment (Figure 1). Each compost treatment plot was 18 beds x 120m length. Control plots were smaller and were 18 beds x 60m length. The total area of the trial was approximately 1.7ha.
Compost was applied by a contractor using a spreader on a truck.
The Soil Wealth ICP demonstration site in Richmond, Tasmania.

CONSIDERATIONS WHEN USING COMPOSTTable 1 lists the main considerations when selecting and using compost.
This project has been funded by Hort Innovation using the vegetable, fresh potato and potato processing research and development levies and contributions from the Australian Government. Hort Innovation is the grower-owned, not-for-profit research and development corporation for Australian horticulture.
3
Quality of compost
Compost should be of good quality (Australian Standard AS4454 2012, or comparable procedures used and documented), have a degree of humification, and no or low level of contaminants (chemical, physical, biological). A compost analysis as per the Australian Standard should be made available by the compost producer for the batch sold.
Food safetyKnow what feedstocks were used for the compost. Avoid composts with animal manure or biosolids feedstocks – refer to this fact sheet on using compost safely for more information including withholding periods.
Cost : benefit
Costs include the compost product, transport (which is highly dependent on distance from the compost facility) and spreading.
Potential benefits include increased saleable yield and crop health. Consider longer term benefits from improved soil structure and nutrient cycling.
TimingConsider if compost should be applied ahead of a cash crop or a cover crop. When incorporating composts, aim to apply at a time that will minimise cultivation passes.
Application rate and frequency
Consider applying lower rates, more frequently (e.g. annually) or applying higher rates less frequently. You need to consider the logistics for each situation.
NutrientsSome composts may have nutrient levels that have to be considered in crop nutrient budgets; refer to the compost analysis.
IrrigationCompost increases water holding capacity in the rootzone. Ensure to adjust irrigation accordingly.
In this demonstration we started with lower rates (e.g. 2t/ha in year 1) and found no obvious benefits; so in year 3, we applied higher rates. Still, benefits were not immediately obvious. They may have been negated by cultivation for example (i.e. the added organic matter/carbon was lost due to soil aeration via tillage). Tillage and fallow periods are the main reasons for carbon loss in cropping.
Our results mean that even higher rates than used might be required at this site given soil and production imperatives, but it is unclear if that would be economic. One option that could be trialled is a more resilient organic amendment with or without compost (e.g. inert biochar or a brown coal based product that adds recalcitrant carbon to the soil).
In South Australia for instance, granulated compost/biochar products are available that can also be enriched with fertilisers. This provides a mix of carbon sources, and nutrients if added, and the granules are easy to transport and apply.
Another option for intensive production systems is to rest the soil for longer periods (e.g. introduction of a mixed pasture phase after cropping for a number of years). This approach might not be an option given the required focus on productivity and baby leaf crops. It certainly would require having access to more land (e.g. via leasing), and having the land and necessary processing infrastructure within close proximity. While this may not appear to be economical to do, doing nothing may be just as uneconomical due to increasing disease pressure, if soil health cannot be maintained.
DEMO SITE SUMMARY:RICHMOND, TASAugust 2021
Table 1: Considerations when using compost

4This project has been funded by Hort Innovation using the vegetable, fresh potato and potato processing research and development levies and contributions from the Australian Government. Hort Innovation is the grower-owned, not-for-profit research and development corporation for Australian horticulture.
Type of soil microbial test
Time of samplingComments
October 2020 – prior to applying compost January 2021 – at harvest spinach crop
Microbial indicators:
• Vesicular-arbuscular mycorrhiza (VAM)
• Residue breakdown rate
• Nutrient solubilisation rate
• Soil indicators ranged from poor (e.g. nutrient accessibility (VAM)) to good (e.g. residue breakdown rate) – this would also mean that compost is broken down quickly.
• Soil indicators ranged from poor to good.
• Nutrient accessibility (VAM) results were higher than in October 2020 in all plots (so not a treatment effect).
• Nutrient solubilisation rate was poorer than in October 2020 in four plots (including one of the control plots – so not a treatment effect).
• Residue breakdown rates were good, but this also would mean that compost is broken down quickly.
Total microbial biomass and total fungi and bacteria
• Total mass of microbes was very good. • Total mass of microbes was very good.
• Results for total bacteria and also for total fungi increased in January 2021 compared to October 2020.
• The control plots had overall lower levels of total microbes due to lower levels in each group.
• There was a somewhat increased total microbial biomass and a higher level of total fungi and bacteria in composted plots.
Other microbe groups • Biomasses of other key desirable microbe groups ranged from poor (e.g. gram negative bacteria and mycorrhizal fungi) to good (e.g. Protozoa).
• True anaerobes were elevated.
• Biomasses of other key desirable microbe groups were from poor (for pseudomonas in two plots) to good (Protozoa).
• Two out of the six plots showed different results to the others, for pseudomonas, and methane oxidisers.
• True anaerobes were elevated.
• Protozoa are important for nutrient transfer and cycling between soil trophic levels, and can be sensitive to agrochemicals, particularly herbicides. Protozoa levels were good at this site.
• True anaerobes were elevated at both sampling times. This indicates recent waterlogging or soil compaction. There was heavy rainfall in few weeks prior to the October sampling, and soil compaction/poor drainage is present in this paddock.
Microbial diversity and ratios • Microbial diversity was fair.
• The fungi to bacteria ratio was elevated here indicating an unbalance between both groups.
• Similar to October 2020. • Fungi:bacteria ratio is a good indicator of changes in the soil over time. The ratio is influenced by management practices.
– Tillage reduces fungal hyphae;
– Incorporation of residues e.g. green manures, favour bacteria;
– Residues with a high C:N ratio favour fungi.
FINDINGSSoil microbial test results – year 3Soil samples to 20cm were collected from each plot, for soil biological analysis in October 2020 (prior to compost application) and January 2021 (following the spinach crop).
Test results from October 2020, prior to compost application, were similar for all six plots. Test results for samples taken in January 2021 following the spinach crop indicated that some plots differed for some indicators. However, this result is most likely due to spatial variation in the paddock as it did not relate to the compost treatments.
Results are described for each sampling time in Table 2. The data is listed in Appendix 1.
DEMO SITE SUMMARY:RICHMOND, TASAugust 2021
Table 2: Soil microbial test results

This project has been funded by Hort Innovation using the vegetable, fresh potato and potato processing research and development levies and contributions from the Australian Government. Hort Innovation is the grower-owned, not-for-profit research and development corporation for Australian horticulture.
5
Pathogens
Time of sampling
ChangeOctober 2020: before
compost
(pgDNA/g sample)1 or (kDNA copies/g sample)2
January 2021: at harvest spinach crop
(pgDNA/g sample) or (kDNA copies/g sample)
Pythium Clade I (multiple species) (pgDNA/g Sample)
429 853 424
Pythium Clade F (multiple species) (pgDNA/g Sample)
102 100
Pythium sulcatum (kDNA copies/g Sample)
0 0
Pythium violae (kDNA copies/g Sample)
0.6 0.6
R. solani AG2.1 (pgDNA/g Sample)
0 0
R. solani AG2.2 (pgDNA/g Sample)
0.0 0.1
R. solani AG3 (pgDNA/g Sample)
4 4
R. solani AG4 (pgDNA/g Sample)
0 0
R. solani AG8 (pgDNA/g Sample)
10 2 8
S. sclerotiorum (kDNA copies/g Sample)
0.6 0.0
1 pgDNA = picograms of DNA2 kDNA copies = 1,000 DNA copies
Key: Low Low-moderate Moderate Moderate-high High
Soil�microbial�test�results�(continued)There were no major effects of the compost treatments on soil microbiology test results apart from a somewhat increased total microbial biomass and higher levels of total fungi and bacteria in composted plots.
The results suggested that management practices should continue to focus on building microbial diversity and mycorrhizal fungi. Use of composts as well as mixed cover crops will help to build microbial diversity. It is common to have low levels of mycorrhizal fungi in a vegetable production system where tillage is necessary.
Soil pathogen DNA results – year 3Soil borne diseases can cause significant damage and crop losses to vegetable growers. The most important, and potentially destructive, pathogens of baby leaf crops are Pythium spp, Phytophthora spp, Fusarium spp and Rhizoctonia spp.
There were no clear treatment effects on soil pathogen DNA results. Therefore, results are combined, and the average is reported for each sampling time (see Table 3).
DEMO SITE SUMMARY:RICHMOND, TASAugust 2021
Table 3: Soil pathogen DNA results

This project has been funded by Hort Innovation using the vegetable, fresh potato and potato processing research and development levies and contributions from the Australian Government. Hort Innovation is the grower-owned, not-for-profit research and development corporation for Australian horticulture.
6
Soil�pathogen�DNA�results�(continued)Pythium results
• Pythium Clade I results increased, with higher levels detected in January 2021 than in October 2020. This means that at least one of the species included in Clade I was hosted by the crop.
In previous research undertaken in a different block at this farm in 2017, two species of Pythium (P. ultimum var ultimum and P. irregulare) were detected and caused root rot symptoms in spinach plants. P. irregulare is included in Clade F and P. ultimum is included in Clade I, however we do not know if these species were included in the detections in the 2020/21 trial.
• Pythium Clade I results are not really high, unless they can be associated with clear root damage, which we were not able to do in this demonstration (due to limited resources and other factors affecting crop health). Healthy plants could sustain the level of Pythium in these results without showing symptoms.
• Not all Pythium species are encompassed in the suite of tests. Therefore, it is possible that other Pythium species that cause root disease in baby leaf crops is present at the site but was not tested here.
• Pythium Clade I and Clade F include some species that are concerning. We do not know which species were more prominent in those detected.
Rhizoctonia results
• R. solani AG8 levels declined between October 2020 and January 2021.
• R. solani AG3 will often have ‘hot spots’ (Mike Rettke, pers comm) and have not really changed in this trial between October 2020 and January 2021.
Note that not all pathogens are included in the suite of tests (for example, Fusarium was not tested).
Pythium, Rhizoctonia and Fusarium cause damping off diseases and often appear as a disease complex. High soil moisture and unbalanced soil microbiology may contribute to conducive conditions for soil borne diseases.
Conclusions about soil pathogen DNA
There were no clear effects on pathogen DNA levels from the compost treatment. Pythium Clade I results increased across all treatments, which means that at least one species within this clade was hosted by the crop. This may have affected productivity.
DEMO SITE SUMMARY:RICHMOND, TASAugust 2021
Compost is applied at the trial site in October 2020.
The trial spinach crop at harvest in January 2021.

This project has been funded by Hort Innovation using the vegetable, fresh potato and potato processing research and development levies and contributions from the Australian Government. Hort Innovation is the grower-owned, not-for-profit research and development corporation for Australian horticulture.
7
Conventional soil test results – year 3 Results from conventions soil tests, sampled in January 2021, are shown in Table 4.
Desirable range
Control (nil compost) Compost 30m3 Compost 60m3
Organic Carbon (W&B) %> 2 for this
soil type1.7 1.7 1.8
pH (1:5 CaCl2) 5.5 to 7 6.4 6.35 6.3
Nitrate nitrogen (mg/kg) 40 to 50 12 11 7
Ammonium nitrogen (mg/kg) < 25 3.5 3.5 4.4
Phosphorus (Colwell) (mg/kg) 70 to 100 97 105 110
Available Potassium (mg/kg) 110 to 250 190 210 230
Calcium (Amm-acet.) (cmol(+)/kg) 6 to 7.5 9 9 9
Magnesium (Amm-acet.) (cmol(+)/kg) 1.6 to 2.0 2.75 2.75 2.95
Sodium (Amm-acet.) (cmol(+)/kg) < 0.35 0.45 0.46 0.45
Calcium/Magnesium Ratio > 2.1 3.4 3.2 3.1
CEC (cmol(+)/kg) 5 to 20 13 13 13
Sodium % of Cations (ESP) < 4 3.5 3.6 3.5
EC (SE) (dS/m) < 1.5 2.8 2.7 2.35
Chloride (mg/kg) < 180 43 47 36
Sulphur (KCL40) (mg/kg) 10 to 20 235 240 210
% moisture 13.5 15.0 15.5
Soil test data showed:
• Organic carbon levels were low in all treatments tested in January 2021, even in the 60m3 compost treatment. Therefore, while carbon was added via the compost in October 2020, cultivation is most likely contributing to carbon losses.
• Available potassium was higher in compost treatment plots.
• Sulphur levels were very high in all treatments, probably due to the use of sulphate-based fertilisers.
• EC results were high in all treatments; they appear to be somewhat reduced with compost use compared
to the control. The high EC results were most likely due to sulphate salts which were very high, as the levels of sodium and chloride were not high.
• Soil moisture % results indicate that there may have been a slight improved soil moisture holding capacity in compost treated plots.
Conclusions about the soil tests
The soil test results suggest that there may have been some potential benefits from the compost in relation to nutrients (e.g. P and K), soil carbon and soil moisture. However, this should be viewed with care as the trial was not fully replicated.
DEMO SITE SUMMARY:RICHMOND, TASAugust 2021
Table 4: Conventional soil test results
Note: cmol/kg = meq/100g. Desirable ranges need to be considered together with the site information e.g. soil texture. In addition, you may need to look at two or more tests in combination when looking for potential issues. Refer to the Soil Wealth ICP Soil Testing and Interpretation for Vegetable Crops guide.
8
13 January 2021, at harvest of spinach crop
In mid-January, we conducted infiltration tests using a PVC pipe and timed the length of time for identical volumes of water to penetrate the soil. Results were highly variable and did not relate to compost treatments. This highlighted the variably in soil physical conditions across the demonstration site (Figure 3).
22 January 2021, at sowing of second spinach crop
Infiltration rates were re-tested. Again, the results were highly variable and did not relate to compost treatments (Figure 4).
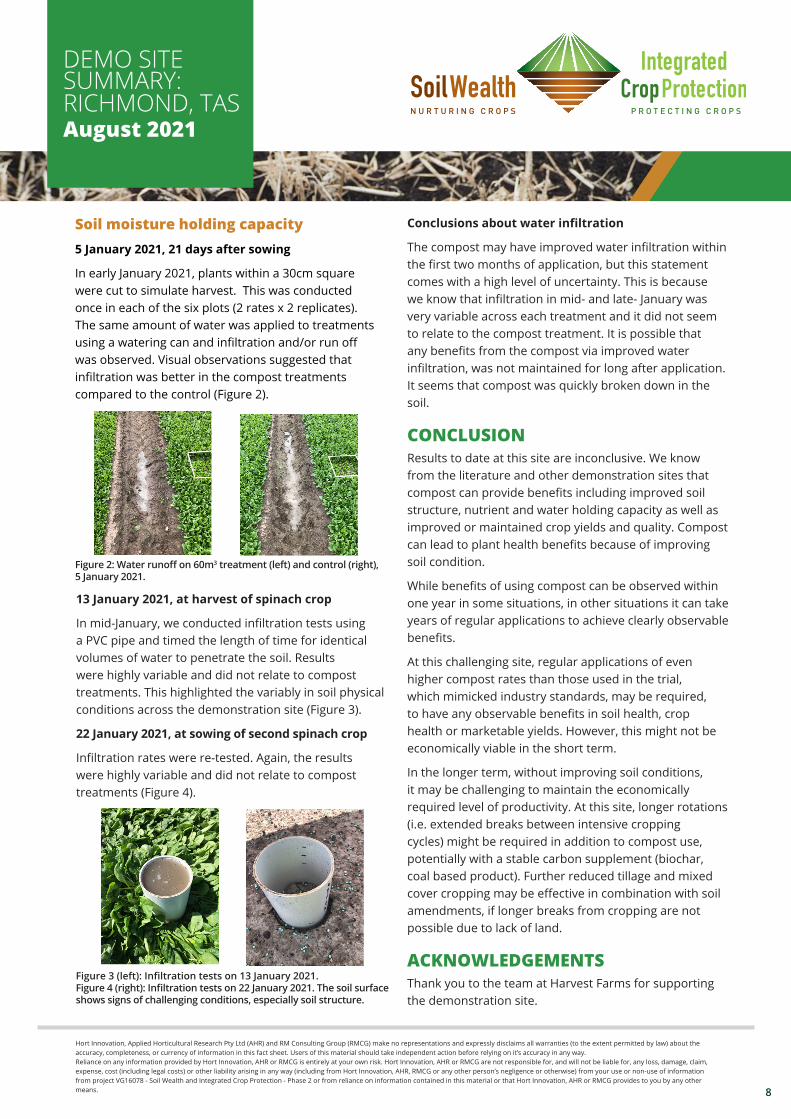
Soil moisture holding capacity5 January 2021, 21 days after sowing
In early January 2021, plants within a 30cm square were cut to simulate harvest. This was conducted once in each of the six plots (2 rates x 2 replicates). The same amount of water was applied to treatments using a watering can and infiltration and/or run off was observed. Visual observations suggested that infiltration was better in the compost treatments compared to the control (Figure 2).
Conclusions about water infiltration
The compost may have improved water infiltration within the first two months of application, but this statement comes with a high level of uncertainty. This is because we know that infiltration in mid- and late- January was very variable across each treatment and it did not seem to relate to the compost treatment. It is possible that any benefits from the compost via improved water infiltration, was not maintained for long after application. It seems that compost was quickly broken down in the soil.
CONCLUSIONResults to date at this site are inconclusive. We know from the literature and other demonstration sites that compost can provide benefits including improved soil structure, nutrient and water holding capacity as well as improved or maintained crop yields and quality. Compost can lead to plant health benefits because of improving soil condition.
While benefits of using compost can be observed within one year in some situations, in other situations it can take years of regular applications to achieve clearly observable benefits.
At this challenging site, regular applications of even higher compost rates than those used in the trial, which mimicked industry standards, may be required, to have any observable benefits in soil health, crop health or marketable yields. However, this might not be economically viable in the short term.
In the longer term, without improving soil conditions, it may be challenging to maintain the economically required level of productivity. At this site, longer rotations (i.e. extended breaks between intensive cropping cycles) might be required in addition to compost use, potentially with a stable carbon supplement (biochar, coal based product). Further reduced tillage and mixed cover cropping may be effective in combination with soil amendments, if longer breaks from cropping are not possible due to lack of land.
ACKNOWLEDGEMENTSThank you to the team at Harvest Farms for supporting the demonstration site.
Figure 2: Water runoff on 60m3 treatment (left) and control (right), 5 January 2021.
Figure 3 (left): Infiltration tests on 13 January 2021. Figure 4 (right): Infiltration tests on 22 January 2021. The soil surface shows signs of challenging conditions, especially soil structure.
DEMO SITE SUMMARY:RICHMOND, TASAugust 2021
Hort Innovation, Applied Horticultural Research Pty Ltd (AHR) and RM Consulting Group (RMCG) make no representations and expressly disclaims all warranties (to the extent permitted by law) about the accuracy, completeness, or currency of information in this fact sheet. Users of this material should take independent action before relying on it’s accuracy in any way. Reliance on any information provided by Hort Innovation, AHR or RMCG is entirely at your own risk. Hort Innovation, AHR or RMCG are not responsible for, and will not be liable for, any loss, damage, claim, expense, cost (including legal costs) or other liability arising in any way (including from Hort Innovation, AHR, RMCG or any other person’s negligence or otherwise) from your use or non-use of information from project VG16078 - Soil Wealth and Integrated Crop Protection - Phase 2 or from reliance on information contained in this material or that Hort Innovation, AHR or RMCG provides to you by any other means.

9
This project has been funded by Hort Innovation using the vegetable, fresh potato and potato processing research and development levies and contributions from the Australian Government. Hort Innovation is the grower-owned, not-for-profit research and development corporation for Australian horticulture.
DEMO SITE SUMMARY:RICHMOND, TASAugust 2021
Microbial Soil Indicators Group
Rep Treatment Time
Nutrient solubilisation
rate (out of 100)
Nutrient cycling rate (out of 100)
Disease resistance (out of 100)
Drought resistance (out of 100)
Nutrient accessibility
(VAM) (out of 100)
Residue breakdown
rate (out of 100)
Overall microbial balance
(out of 100)
Total microorganisms
(mg/kg)
Total bacteria (mg/kg)
Total fungi
(mg/kg)
R1 T30 Oct-20 44.7 77.4 63.1 59.8 19.7 100.0 65.9 44.4 8.1 35.2
R2 T30 Oct-20 41.4 74.8 60.9 59.9 19.9 88.8 62.9 34.4 6.9 26.2
R1 T60 Oct-20 48.9 72.1 55.7 59.9 19.8 79.7 63.5 39.2 7.3 30.5
R2 T60 Oct-20 57.7 83.4 71.8 62.1 24.1 100.0 72.0 51.2 9.2 40.7
R1 Control Oct-20 49.6 72.3 66.4 61.1 22.1 92.5 64.0 37.0 7.3 28.7
R2 Control Oct-20 50.9 68.3 53.7 55.9 20.6 79.7 60.9 42.0 6.9 34.0
R1 T30 Jan-21 15.7 81.1 43.8 65.7 31.3 100.0 63.3 70.5 11.7 57.7
R2 T30 Jan-21 16.7 83.7 44.5 66.7 33.4 100.0 64.3 65.1 11.5 52.4
R1 T60 Jan-21 68.6 87.2 79.1 68.6 37.3 100.0 78.6 68.8 12.2 53.2
R2 T60 Jan-21 17.7 82.8 45.1 67.7 35.4 100.0 65.1 85.4 13.2 71.1
R1 Control Jan-21 65.9 84.4 77.2 65.9 31.7 100.0 76.9 57.5 11.9 44.4
R2 Control Jan-21 16.0 81.2 44.0 66.0 31.9 100.0 62.0 61.2 10.4 49.6
GUIDE 50.0 15.0 33.8
Key: Good Good-fair Fair Fair-poor Poor
APPENDIX 1: SOIL MICROBIAL TEST RESULTSThis data was manually entered from the 12 test reports. Colours are similar to the colours used in the 12 test reports.

10
This project has been funded by Hort Innovation using the vegetable, fresh potato and potato processing research and development levies and contributions from the Australian Government. Hort Innovation is the grower-owned, not-for-profit research and development corporation for Australian horticulture.
DEMO SITE SUMMARY:RICHMOND, TASAugust 2021
Microbial Indicators Bacteria Eukaryotes
Rep Treatment TimeMicrobial diversity
Fungi : Bacteria
Bacterial stress
Pseudomonas (mg/kg)
Actinomycetes (mg/kg)
Gram positive (mg/kg)
Gram negative (mg/kg)
Methane oxidisers (mg/kg)
Sulphur reducers (mg/kg)
True anaerobes
(mg/kg)
Protozoa (mg/kg)
Mycorrhizal fungi
(including VAM) (mg/kg)
R1 T30 Oct-20 32.1 4.4 0.4 0.697 1.300 4.908 3.178 0.000 0.000 0.220 1.050 1.965
R2 T30 Oct-20 30.3 3.8 0.4 0.629 1.078 4.204 2.695 0.000 0.000 0.177 1.263 1.988
R1 T60 Oct-20 29.9 4.2 0.4 0.780 0.693 4.089 3.171 0.000 0.000 0.212 1.495 1.976
R2 T60 Oct-20 30.2 4.4 0.3 0.914 1.355 5.380 3.807 0.000 0.000 0.243 1.289 2.410
R1 Control Oct-20 30.9 3.9 0.3 0.770 1.070 4.220 3.066 0.000 0.000 0.204 0.994 2.213
R2 Control Oct-20 28.7 4.9 0.3 0.812 0.594 3.646 3.276 0.000 0.000 0.191 1.091 2.057
R1 T30 Jan-21 28.8 4.9 0.3 0.000 1.890 7.435 4.304 1.554 0.000 0.324 1.106 3.132
R2 T30 Jan-21 27.2 4.6 0.2 0.000 1.739 7.101 4.363 3.042 0.000 0.383 1.236 3.342
R1 T60 Jan-21 32.2 4.4 0.3 1.569 1.648 6.792 5.360 0.000 0.000 0.280 3.512 3.727
R2 T60 Jan-21 25.7 5.4 0.2 0.000 2.182 8.542 4.623 2.995 0.000 0.473 1.157 3.536
R1 Control Jan-21 34.2 3.7 0.4 1.007 1.719 6.955 4.958 0.000 0.000 0.300 1.205 3.172
R2 Control Jan-21 25.6 4.8 0.2 0.000 1.654 6.815 3.623 2.389 0.000 0.286 1.196 3.194
GUIDE 80.0 2.3 < 0.5 1.000 1.000 4.000 11.000 0.500 < 0.005 1.300 1.300 10.000
Key: Good Good-fair Fair Fair-poor Poor
APPENDIX�1:�SOIL�MICROBIAL�TEST�RESULTS�(CONTINUED)This data was manually entered from the 12 test reports. Colours are similar to the colours used in the 12 test reports.