Dementia – Diagnostic and Therapeutic Interventions€¦ · Dementia – Diagnostic and...
552
The Swedish Council on Technology Assessment in Health Care SBU • Statens beredning för medicinsk utvärdering Dementia – Diagnostic and Therapeutic Interventions A Systematic Review Volume 2 June 2008
Transcript of Dementia – Diagnostic and Therapeutic Interventions€¦ · Dementia – Diagnostic and...

The Swedish Council on Technology Assessment in Health Care
SBU • Statens beredning för medicinsk utvärdering
Dementia – Diagnostic and Therapeutic Interventions
A Systematic Review
Volume 2
June 2008

To order this report (No 172E/2) please contact:
SBUMailing Address: Box 5650, SE-114 86 Stockholm, SwedenStreet Address: Tyrgatan 7Tel: +46 8 412 32 00 Fax: +46 8 411 32 60Internet: www.sbu.se E-mail: [email protected]
Graphic Design: pmochco, www.pm.sePrinting: Elanders Infologistics Väst AB, Mölnlycke 2008ISBN 978-91-85413-24-9 • ISSN 1400-1403
SBU Evaluates Healthcare Technology
SBU (the Swedish Council on Technology Assessment in Health Care) is a government agency that assesses the methods employed by medical professionals and institutions. In addition to analyzing the costs and benefits of various health care measures, the agency weighs Swedish clinical practice against the findings of medical research. The objective of SBU’s activities is to provide everyone who is involved in decisions about the conduct of health care with more complete and accurate information. We welcome you to visit our homepage on the Internet at www.sbu.se.
SBU issues three series of reports. The first series, which appears in a yellow binding, presents assessments that have been carried out by the agency’s project groups. A lengthy summary, as well as a synopsis of measures proposed by the SBU Board of Directors and Scientific Advisory Committee, accompanies every assessment. Each report in the second, white-cover series focuses on current research in a parti- cular healthcare area for which assessments may be needed. The Alert Reports, the third series, focus on initial assessments of new healthcare measures.

The Swedish Council on Technology Assessment in Health Care
SBU • Statens beredning för medicinsk utvärdering
Dementia – Diagnostic and Therapeutic Interventions
A Systematic Review
Project GroupOlof Edhag (Chair)Hedda Aguero-EklundOve AlmkvistKenneth AsplundKaj BlennowSirkka-Liisa EkmanKnut EngedalElisabet EnglundSture ErikssonJohan Fastbom
Laura FratiglioniLars GustafsonIngrid Håkanson (Project Assistant)Aki JohansonIngvar KarlssonMona KihlgrenLena KilanderElisabet LondosJan MarcussonAstrid Norberg
Anders Norlund (Project Director)Liisa Palo-BengtssonMagnus SjögrenEva von StraussLars-Olof WahlundGunhild WaldemarAnders WallinAnders WimoDag Årsland
Scientific ReviewersPer EdebalkSerge GauthierLars LannfeltKim Lützén
Rurik LöfmarkHans MelanderIngalill Rahm Hallberg
Anneli SarvimäkiHilkka SoininenMatti Viitanen
Reference GroupAnn Hedberg Balkå (Swedish Association of Local Authorities and Regions)
P-O Sandman (Umeå University)
Bengt Winblad (Karolinska Institute)Members from the Alzheimer Associ-ation of Sweden and from the Dementia Association


Content9. Diagnosing Dementia Disorders 17
Background 17Diagnostic evaluation of dementia 17The concept of mild cognitive impairment (MCI) 17Guidelines for the diagnostic evaluation of dementia 19
European federation of neurological societies (EFNS) 19 guidelines [3]American Academy of Neurology guidelines [5] 20
Aims 21Methods 21
Selection of papers 21Classification of evidence 27
Summary of evidence 28Laboratory screening tests that might detect 28 reversible cognitive impairmentTests that can be used to detect a dementia disorder 28Single cognitive tests 28Tests that identify specific dementia disorders 29
ApoE 29Methods of diagnosing dementia disorders 29
Structural imaging (MRI/CT) 29Functional imaging (PET, SPECT) 29Neurophysiological methods (EEG, EEG) 29CSF analyses 29
Methodological considerations 30Lack of gold standard 31Selection bias 31Setting 31Circularity bias 32
Recommendations for future research 32References 34
Checklists regarding assessment of study quality for different chapters of this report are included in the electronic version of the SBU report on Dementia diseases at www.sbu.se

10. Identifying Secondary Dementia or Potential Reversible 35 Cognitive ImpairmentThyroid disease and dementia 35
Background 35Literature search for evidence 35Search strategy 36Results 36Comments 37References 46
11. Neurosyphilis and Dementia 49Background 49Literature search for evidence 50Search strategy 50Result 51Comments 51References 56
12. Vitamin B12, Folic Acid and Homocysteine, 57 Cognitive Impairment and Alzheimer’s DiseaseConclusions 57Background 57Literature search strategy 58Comments 60
Vitamin B12 60Folic acid 60Homocysteine 60Treatment with vitamin B12 or folate 60
References 76
13. Evidence for Tests that can be used to Diagnose Dementia 79Informant interview in the diagnostic 79 evaluation of patients with dementia
Background 79Literature search 80
Search strategy 80Results 80Comments 81References 88

14. Neuropsychological Tests as a Diagnostic Marker 91 of Dementia Conclusion 91Introduction 91Aim 91Search strategy 92Description of studies included and excluded 92Results 93Discussion 94References 102
15. Evidence-based Evaluation of Single Cognitive Tests 103 as a Diagnostic Marker of Dementia Conclusions 103Introduction 103Search strategy 104Results 105Discussion 106References 116
16. Genetic Markers 119Conclusion 119Causative genes for dementia disorders 119Apolipoprotein E ε4 as a diagnostic marker of AD 120
Background 120Literature search strategy 122Results 122ApoE ε4 allele as a marker of AD 123 in comparison with controlsApoE ε4 allele as marker of AD compared 124 to other dementia disordersApoE ε4 allele as marker of AD compared to MCI 125ApoE ε4 allele as marker of FTLD compared 125 to normal controls
References 162

17. Structural and Functional Imaging of the Brain 171 in Dementia Workup Conclusions 171Introduction 172Search strategy 172Structural imaging 173
Results 173References 188
18. Functional Imaging’s Diagnostic Tool in Dementia 193 Workup Search Strategies Conclusions 193Introduction 193Search strategy 194Results 195References 208
19. Evidence Based Evaluation of EEG (Quantitative EEG 211 and Visual Rated EEG)Conclusions 211Introduction 211Search strategy 211References 218
20. Cerebrospinal Fluid Biomarkers in AD 219Conclusion 219Background 219Search strategy 220Selection criteria 220Analytical principles for CSF T-tau, P-tau and Aß42 221
CSF total tau (T-tau) 221CSF ß-amyloid (Aß42) 222CSF phosphorylated tau (P-tau) 222
Diagnostic performance of CSF markers for AD 223CSF T-tau 223Aß42 224CSF P-tau 224Combination of CSF markers 224

CFS markers in early Alzheimer’s disease and MCI 225CFS markers in other cognitive, psychiatric 226 and neurological disordersReferences 276
21. Interventions in Dementia Disorders 285Background 285Questions of interest 286Study quality and levels of evidence 287Methodological aspects of pharmacological studies 288
Selection and setting 288Which patients were included in the efficacy analyses: 289 ITT, ITT-LOCF or OC?
Long-term effects 290Concepts of care 291
Quality of life 292References 293
22. Pharmacological Treatment of Dementia – 295 Established DrugsConclusions 295
Adverse events 296Other conclusions 296
Background 297Acetylcholinesterase inhibitors (AChEIs) 297Memantine 298
Aim 298Methods 298
Strategy for searching the literature 298Included trials: Acetylcholinesterase inhibitors in AD 299
Donepezil 299Rivastigmine 300Galantamine 300
Included trials: Memantine 300Measurements of efficacy 301
Global function 301Cognitive function 302ADL 303Behavioral disturbances and psychological symptoms 303
Measurements of acceptability and safety 303

Acetylcholinesterase inhibitors in AD 304Presentation of results 304Effects on global function, primary outcomes: 304 CIBIC+ and GBSEffects on global function, secondary outcomes 305Effects on cognitive function, primary outcomes: 305 ADAS-cogEffects on cognitive function: secondary outcomes 306Effects on ADL 307Effects on BPSD 308Moderate to severe dementia 308Acceptability and tolerability 309Results after short-term treatment, effects 311 of washout and placebo effectsPrediction of response 311Neuroimaging findings in RCTs 312Comparisons among different acetylcholinesterase 313 inhibitors
Memantine in AD and VaD 313Global function 313Cognitive function 314ADL function and BPSD 314Acceptability and tolerability 314Combined memantine and donepezil treatment 315
Acetylcholinesterase inhibitors in VaD 315Results for donepezil 315Results for galantamine 317
Other neurodegenerative dementia disorders 317Cholinesterase inhibitors in dementia with Lewy bodies 317 (DLB)Cholinesterase inhibitors in Parkinson’s disease (PD) 318 and dementiaFrontotemporal dementia (FTD) 318Cholinesterase inhibitors in Down syndrome 319Need for research 319
References 354

23. Hypertension and Dementia 361Conclusions 361Background 361Search of literature 361Results 362Need for research 363References 364
24. Treatment of Depression in Dementia 365Conclusions 365Background 365Search strategy 366Search results 366Effects of antidepressants on depression in dementia 367Effects of antidepressants on non-depressive symptoms 368References 378
25. Treatment of Psychotic and Behavioral Symptoms 381 in DementiaConclusions 381Background 382
Effects of antipsychotic treatment of psychotic 383 symptoms and BPSDSearch 383Results 383Study on withdrawal of antipsychotic 386 treatment in dementia
Treatment of BPSD with antidepressants 386Rate of decline of cognitive symptoms 387 during antipsychotic treatmentEffects of antipsychotics on cerebral 387 vascular events in patients with dementia
Treatment of BPSD symptoms with antiepileptic drugs 388Search 388Results 388
References 408

26. Drug-induced Cognitive Impairment 413Conclusions 413Background 414
Types of drug-induced cognitive impairment 414Pathophysiology 414Epidemiology 415
Aims 415Method 415Cognitive side-effects of specific drug classes 416
Anticholinergic drugs 416Anxiolytics and hypnotics/sedatives 418Antipsychotics 420Lithium 423Antidepressants 423Antiparkinsonian agents 425Antihistamines 426Anticonvulsants 426Opioids 427NSAIDs 428Corticosteroids 429Anti-ulcer agents 430Cardiovascular drugs 430Antibiotics, antiviral drugs and chemotherapy 432
References 472
27. Non-established Pharmacological Treatments 483 for Dementia DisordersConclusions 483Background 483Method 484Individual drugs 484
Lecithin 484Vitamin B12 484Folic acid 485Vitamin E 486Piracetam 486Dehydroepiandrosterone 488Propentophylline 489Estrogen 490

Non-steroidal anti-inflammatory drugs 491Ginkgo biloba 493Alpha lipoic acid and dementia 494Aspirin 495Statins 496Vaccine treatment 496
References 502
28. Dementia and Quality of Life 505Conclusions 505Questions of interest 505
Background 505Search strategy 506Results 507
What are the effects of pharmacological treatment 507 in terms of QoL?What are the effects of intervention programs on QoL 507 at the individual and community level?
Evidence grade 508Pharmacological treatment 508
Discussion 508Recommendations for future research 509References 515Appendices 520
29. Dementia and Mortality 527Conclusions 527Questions of interest 527Background 527Search results 528Results 529
Pharmacological treatment 529Programs 529Evidence grades for effects on mortality 530
Discussion 530Recommendations for future research 531References 547


C H A P T E R 9 • D I AG N O S I N G D E M E N T I A D I S O R D E R S 17
9. Diagnosing Dementia Disorders
Background
Diagnostic evaluation of dementiaCognitive complaints and symptoms may result from normal aging or from a wide range of neurological, psychiatric or internal medical conditions. The diagnostic workup and management of a patient with cognitive complaints and symptoms is a multidisciplinary task, involv-ing physicians from several medical specialties, as well as psychologists, occupational therapists, other health professions and other social care providers. A diagnostic evaluation should be initiated in all patients with subjective cognitive complaints and symptoms that seem to either persist or worsen, as well as in patients for whom the complaints are associated with other cognitive or behavioral changes or with impaired activities of daily living. Some patients with dementia have reduced insight into their own problems. If family members often report of memory loss or cognitive impairment in such patients, diagnostic evaluation should also be carried out. Diagnostic evaluation should be considered even when symptoms are not sufficiently severe to meet international criteria for dementia, given that patients with mild symptoms may have potentially reversible conditions and need appropriate management.
The dementia syndrome is diagnosed using specific criteria such as ICD-10 [1] or DSM-IV [2] criteria. There are no specific diagnostic markers for the most common dementia disorders. Therefore, the spe-cific underlying disorder causing cognitive impairment and dementia is diagnosed using operational diagnostic criteria.
The concept of mild cognitive impairment (MCI)One issue with the abovementioned criteria is that the degree of cog-nitive decline must be below a certain level. That leads to problems when cognitive impairment is present but not severe enough to meet

D E M E N T I A – D I AG N O S T I C A N D T H E R A P E U T I C I N T E RV E N T I O N S18
the criteria for dementia. The term MCI was one operational way to describe such patients. The vague terminology implies that MCI has a heterogeneous origin. A majority of MCI patients, though far from all, have very early Alzheimer’s disease (AD), given that the conversion from MCI to AD is around 15% per year.
In current diagnostic workups, different sources of information are used, the patient’s medical history being the most important. The history obtained from the patient should be complemented by information from relatives or other informants. A skilled, experienced specialist at a memory clinic has a high probability of correctly diagnosing the specific dementia disorder based on diagnostic criteria. A number of investi-gations are usually recommended as part of the diagnostic workup in general practice and at memory clinics.
• Physical, including neurological, examination• Neuropsychological assessment• Psychiatric/behavioral assessment• Evaluation of activities of daily living• Laboratory screening (blood) tests and ECG• Cranial CT (or MRI)
In experienced hands, these basic examinations help the clinician iden-tify the most common causes of cognitive impairment and dementia. However, up to 20% of all patients with dementia may have rarer con-ditions, the diagnosis of which may require a more extensive workup.
The prevalence of dementia in patients referred to memory clinics is often quite high, ranging from 50 to 100%. Prevalence is much lower in general practice, approaching that of the general population. However, many elderly people, including patients in general practice, have subjec-tive memory complaints. The most important role of the general prac-titioner is to identify patients who may have a dementia disorder and to initiate diagnostic evaluation, screening for potentially reversible causes. The role of the general practitioner in completing a diagnostic evaluation may vary according to local healthcare organization, as well as indivi-dual knowledge, skills and experience.

C H A P T E R 9 • D I AG N O S I N G D E M E N T I A D I S O R D E R S 19
Guidelines for the diagnostic evaluation of dementiaGuidelines for the diagnostic evaluation of dementia have been devel-oped on a regional or national level in many countries. However, there are only a few published guidelines in international journals. Only one guideline was developed by an international group [3]. The published guidelines represent a mixture of expert consensus and evidence-based recommendations. Most guidelines were developed for either general practitioners or a particular group of specialists. Only rarely were guide-lines based on evidence found in the literature, such as the guidelines recently published by the American Academy of Neurology [4,5].
“Evidence-based Dementia Practice”, published in 2002, Chui points out the lack of systematic analyses of diagnostic methods (likelihood ratios, predictive values sensitivity and specificity) for use in dementia workups [6].
European federation of neurological societies (EFNS) guidelines [3]
• Cognitive assessment is central to the diagnosis and management of dementia disorders.
• Assessment of behavioral disorders is essential for the diagnosis and management of dementia. Assessment of activities of daily living should be included in the diagnostic evaluation and management of dementia.
• Neuroimaging should be performed once in all cases of dementia. Non-contrast CT will suffice, but MRI is preferable if available and may be used to show specific abnormalities.
• Functional imaging should not be used routinely, but may be help- ful when there is clinical suspicion of degenerative disorders and structural imaging is normal.
• Laboratory screening should be included in the general screening of a patient who presents with cognitive disturbances. The following blood tests are generally proposed for all patients: blood sedimenta-tion rate, complete blood cell count, electrolytes, glucose, renal and
D E M E N T I A – D I AG N O S T I C A N D T H E R A P E U T I C I N T E RV E N T I O N S20
liver function tests, and thyroid-stimulating hormone. Serological tests for the detection of borrelia, syphilis and HIV, serum lipids, and vitamin B12 are optional. More extensive tests are often required in individual cases.
• Electrocardiography (ECG) is recommended in all patients aged 50 and above for screening purposes, in patients with cardiac symptoms or cerebrovascular lesions, and for monitoring possible side-effects in patients receiving drug therapy (such as acetylcholine-esterase-inhibi-tors). Chest X-ray is indicated if relevant to the symptoms.
• CSF analysis (with routine cell count, protein, glucose and protein electrophoresis) is optional and recommended in patients with clini-cal suspicion of certain diseases, as well as in those with atypical clinical presentations.
• Electrophysiological examination is not recommended on a routine basis.
• Brain biopsy is recommended in carefully selected cases only.
American Academy of Neurology guidelines [5]
• The clinical criteria for dementia (DSM-II-R) [7], AD (DSM-III-R and NINCDS-ADRDA [8]) and Creutzfeldt-Jakob disease have sufficient reliability and validity. They should be used, whereas the criteria for vascular dementia (VaD), dementia with Lewy bodies and frontotem-poral dementia may be used but have imperfect reliability and vali-dity.
• Structural neuroimaging should be performed as part of the initial evaluation of patients with dementia.
• Screening for depression, vitamin B12 deficiency and hypothyroidism should be performed.
• Other neuroimaging methods, genetic markers, CSF markers (except 14-3-3 protein for Creutzfeldt-Jakob disease) and screening for neuro-syphilis are not recommended on a routine basis.

C H A P T E R 9 • D I AG N O S I N G D E M E N T I A D I S O R D E R S 21
Aims
This evidence-based review has focused on the most commonly used methods in the diagnostic evaluation of patients who present with cog-nitive complaints and symptoms. The aims have been to assess the role and validity of the methods in:
• Identifying secondary and reversible causes of cognitive impairment• Confirming the presence of dementia• Identifying specific dementia disorders.
Methods Selection of papers
Diagnostic testsWe have selected the most commonly used diagnostic tests that can identify the most prevalent causes of dementia and conditions or rever-sible cognitive impairment. However, we have not searched for evidence that depression and drugs with anticholinergic effect can cause rever-sible cognitive impairment, given that there is general consensus among researchers and clinicians supporting this view [5]. Nor have we sought evidence for which diagnostic tests could be useful to identify rare metabolic and neurological causes of dementia (for instance, parathy-roid disease, Wilson’s disease). The following diagnostic tests have been evaluated:
• Caregiver information rating scales• Short cognitive mental tests• Neuropsychological tests• Selected laboratory screening tests• Computed tomography (CT) and magnetic resonance imaging
(MRI) of the brain• Single photon emission tomography (SPECT)• Electroenchephalography (EEG) • Apoliprotein genotyping• Examination of amyloid-beta and tau-protein in cerebrospinal fluid.

D E M E N T I A – D I AG N O S T I C A N D T H E R A P E U T I C I N T E RV E N T I O N S22
The selected laboratory screening tests were vitamin B12, folate, homo-cysteine, thyroid stimulating hormone (TSH) and tests for syphilis, given that vitamin B12 and folate deficiency, thyroid disease, and neu-rosyphilis are commonly referred to as potentially reversible causes of cognitive deficits [3,5].
Inclusion criteria for papers to be reviewed• The papers included in this study were to describe at least 20 cases
and 20 controls or at least 30 cases (in studies for which controls were not appropriate).
• The patients must have been properly examined for dementia, inclu-ding physical and psychiatric examinations, cognitive tests, blood tests and imaging of the brain.
• The patients must have been diagnosed according to well-known and standardized clinical or neuropathological criteria.
• Appropriate statistical methods must have been used. Except for tests that could detect reversible conditions causing cognitive impairment, information should be available to calculate the test’s sensitivity, spe-cificity and likelihood ratio.
• Only papers written in English published before July 2004 have been included.
Exclusion criteriaDue to differences in criteria regarding the selection of studies, meta-analysis papers have been excluded.
Quality assessment of papersThe papers have been classified according to the design of the study, the selection of patients, control and contrast groups and the setting – such as university hospitals, memory clinics or outpatient clinics – in which they have been carried out. The papers representing the highest class of study quality are defined as Ia papers, which describe prospective studies on a broad spectrum of patients and controls (population based studies and consecutive series of a broad spectrum of patients) who have been followed up with clinical diagnostic assessments over time and examined

C H A P T E R 9 • D I AG N O S I N G D E M E N T I A D I S O R D E R S 23
post-mortem. The lowest classs of study quality represents 2b papers from cross-sectional studies of highly selected patients and controls. The tables present the papers in hierarchical order according to how the patients were recruited and the gold standard of the dementia diagnosis.
Ia = Population based or consecutive-series prospective studies, diagnosis verified neuropathologically
Ib = Selected patients and controls, prospective studies, diagnosis verified neuropathologically
IIa = Population based or consecutive-series retrospective studies, diagnosis verified neuropathologically
IIb = Selected patients in retrospective studies, diagnosis verified neuropathologically1a = Population based or consecutive-series prospective studies,
clinical diagnosis 1b = Selected patients and controls, prospective studies, clinical
diagnosis2a = Population based or consecutive-series retrospective studies,
clinical diagnosis2b = Selected patients in retrospective studies, clinical diagnosis.
Presentation of the resultsExcept for the laboratory screening tests, the results are presented as the diagnostic test’s sensitivity, specificity and likelihood ratio (LR) for a positive test (LR+) or a negative test (LR–). The reason that results are presented with LRs and not negative and positive predictive values is that the LR is a robust measure independent of prevalence rates in the tested populations.
Sensitivity and specificitySensitivity is defined as a test’s probability of finding a target disease. According to Table 9.1, it can be expressed as “true test positive” or a/a + c. Specificity is defined as a test’s probability of finding a normal person without the target disease. According to Table 9.1, it can be ex-pressed as “true test negative” or d/b + d. The same table indicates that the false positive rate is b/b + d and the false negative rate is c/a + c.

D E M E N T I A – D I AG N O S T I C A N D T H E R A P E U T I C I N T E RV E N T I O N S24
Table 9.1 Validation of a diagnostic test against a target disease or gold standard of a target disease.
Target disease + –
Test positive a (true positive) b (false positive)Test negative c (false negative) d (true negative)
Pre-test probabilityThe clinician’s impression of a patient is important for the pre-test pro-bability of a disease such as dementia. Through an interview with the patient and a caregiver, an experienced clinician will have information that makes the pre-test probability of dementia very high. Because a less experienced clinician cannot take equal advantage of information from such an interview, the pre-test probability will be lower. If there is no information about the symptoms of a disease, the pre-test probability will be equal to the prevalence of the disease in the age-cohort of the person. For instance, the pre-test probability of dementia in an unexa-mined and unselected population of a cohort of people aged 50 will be very low (less than 1%), whereas the pre-test probability among people aged 80 and above who have been admitted to a memory clinic because of memory complaints will be very high (above 50%). In the first case, powerful tests are necessary to detect dementia, whereas less powerful tests may be beneficial among people in their 80s with memory com-plaints.
Likelihood ratio and post-test probabilityThe likelihood ratio for a positive test result (LR+) is defined as:The probability of a positive result in a person with the target disease/probability of a positive result in a person without the target disease.
This is equivalent to the ratio of true test positive to false test positive = sensitivity/(100% – specificity).

C H A P T E R 9 • D I AG N O S I N G D E M E N T I A D I S O R D E R S 25
The likelihood of a negative test result (LR–) is defined as: The probability of a negative result in a person with the target disease/probability of a negative result in a person without the target disease.
This is equivalent to the ratio of false negative to true negative = (100%– sensitivity)/specificity.
In other words, LR is a test’s discriminatory power and indicates the degree to which the pre-test probability will increase or decrease. There are practical guidelines for evaluating the power of LR+ and LR–.
LR = 1 The post-test probability will be equal to the pre-test probability – thus, the test is of no value.
LR+ = 1–2 (or LR– = 0.5–1.0) Alter pre-test probabilities to a small (and rarely important)
degree. LR+ = 2–5 (or LR– = 0.5–0.2) Have a small (but sometimes important) impact
on the pre-test probability. LR+ = 5–10 (or LR– = 0.1–0.2) Produce moderate shifts in the pre-test probability. LR+ = >10 (or LR– = <0.1) Will often conclusively change the pre-test probability.
To calculate how much the pre-test probability will increase after intro-ducing a test (post-test probability), a calculation can be performed by means of the test’s LR+. The post-test probability of a positive result = post-test odds/post-test odds + 1. Fagan has developed a simple nomo-gram for this purpose, making it possible to quickly and easily calculate the post-test probability (Figure 9.1 [9]).
A good diagnostic test must have a high LR+ and low LR–, but the test’s quality cannot be judge on the basis of those variables only. If the result of a test is specified in terms of a scale, the cut-off score can be manip-ulated so that the specificity is very high, etc. That could improve the LR+ but make the test less useful due to lower sensitivity. For instance, using MMSE as a diagnostic marker of dementia might entail a cut-off

D E M E N T I A – D I AG N O S T I C A N D T H E R A P E U T I C I N T E RV E N T I O N S26
value of 20. That would guarantee very high specificity, perhaps 98%, but low sensitivity, perhaps 50%. LR+ would be high at 50/100–98 = 25, but only half of the people with dementia would be detected. On the other hand, if the MMSE cut-off were 28, high sensitivity (maybe 90%) would be guaranteed but specificity could drop to 50%. In this case, LR– would be 0.1 (100–95/50). Thus, half of the patients without dementia would be defined as cognitively impaired.
Most studies have been performed in well-characterized groups of patients, defined by clinical criteria. Even with very high sensitivity, specificity and likelihood ratios, the added clinical value (above a strict clinical evaluation) in the routine clinical setting may not be known. In general, there is a lack of studies designed to address this issue.
Figure 9.1 Fagan’s nomogram shows the post-test probability of a disease (95%) applying a test with LR+ of about 20 in a person with a pre-test proba-bility of a disease of 50% [9]. (Copyright with permission from the American Medical Association.)
0.1
0.2
0.5
1
2
5
10
20304050607080
90
95
99
1000500200100
502010
521
0.50.20.10.050.020.010.0050.0020.001
99
95
90
80
7060504030
20
10
5
2
1
0.5
0.2
0.1
Likelihood ratio Post-testprobability (%)
Pretestprobability (%)

C H A P T E R 9 • D I AG N O S I N G D E M E N T I A D I S O R D E R S 27
Classification of evidenceTable 9.2 For each diagnostic test, the evidence was classified according to the table below.
Classification of evidence Criteria
General criteria for all classes of evidence* Sensitivity >80%, specificity >80%, LR+ ≥5
Evidence Grade 1 (strong evidence) 2 type 1a or Ia studies. All should meet the general criteria
Evidence Grade 2 (moderately strong evidence) ≥2 type 1a, Ia, 2a, or IIa OR ≥4 type 1b, Ib, 2b, or IIb studies. The majority of studies should meet the general criteria
Evidence Grade 3 (limited evidence) 1 type 1a or Ia study OR ≥2 type 2a or IIa studies OR ≥3 type 1b, Ib, 2b, IIb studies. The majority of studies should meet the general criteria
No evidence No type 1a or Ia study OR only 1, type 2a or IIa study OR <3 type 1b, Ib, 2b, or IIb studies. The majority of studies should meet the general criteria OR non, or only the minority, of the available studies meet the general criteria
* For laboratory screening tests the concepts of sensitivity and specificity and LR were not relevant, because the tests were done to exclude other conditions and not in order to diagnose dementia. Therefore the general criteria were not applied for these tests.

D E M E N T I A – D I AG N O S T I C A N D T H E R A P E U T I C I N T E RV E N T I O N S28
Summary of evidence
Laboratory screening tests that might detect reversible cognitive impairmentThere is no evidence of a relationship between marginally low vitamin B12 values in the blood and cognitive impairment and AD.
There is moderately strong evidence of an association between low levels of folic acid and cognitive impairment and limited evidence of an asso-ciation between low levels of folate and AD.
There is strong evidence of an association between raised homocysteine levels in the blood and poor cognitive function and moderately strong evidence of an association between raised homocysteine levels and AD.
Tests that can be used to detect a dementia disorderThere is strong evidence that neuropsychological tests contribute sub-stantially to the diagnosis of dementia and AD. There are few accepted studies on the diagnostic entity of MCI compared to dementia or AD and in relation to healthy people, so no conclusions can be drawn con-cerning this issue.
Single cognitive testsThere is moderately strong evidence that the single cognitive test CAMCOG contributes substantially to the diagnosis of dementia (LR+ 9.8, LR– 0.13). There is also strong evidence that Clock tests contribute significantly to the diagnosis of AD. There are no accepted studies on the diagnostic entity of MCI compared to dementia or AD and in relation to healthy people, so no conclusions can be drawn con-cerning this issue. There are no accepted studies or evidence concerning other single cognitive tests (although many are in use) for diagnosing dementia, AD or MCI.

C H A P T E R 9 • D I AG N O S I N G D E M E N T I A D I S O R D E R S 29
Tests that identify specific dementia disordersApoE
ApoE genotyping does not contribute significantly to the diagnosis of AD. Nor does the method differentiate AD from other dementia dis-orders. No study in this review had a sensitivity of 80% or above and a LR+ of 5 or above. Thus, there is no evidence for the use of ApoE genotyping in the diagnostic and differential diagnosis of AD.
Methods of diagnosing dementia disorders
Structural imaging (MRI/CT)There is strong evidence (Evidence Grade 1) that medial temporal lobe atrophy assessed with structural imaging (MRI and CT) contributes to the diagnostic workup in differentiating AD from controls and other dementia disorders.
Functional imaging (PET, SPECT)There is moderately strong evidence (Evidence Grade 2) that reduction in regional cerebral blood flow or glucose metabolism contributes to the diagnostic workup in differentiating AD from controls and other dementia disorders.
Neurophysiological methods (EEG, EEG)There is limited evidence (Evidence Grade 3) that visually rated EEG or quantitative EEG contribute to the diagnostic workup in differentiating AD from controls and other dementia disorders.
CSF analysesThere is strong evidence (Evidence Grade 1) that CSF T-tau (Total tau), CSF Aß42 and the combination of CSF T-tau and Aß42, and modera-tely strong evidence (Evidence Grade 2) that CSF P-tau (Phosphorylated tau), contribute to the diagnostic workup in differentiating AD patients from controls and other dementia disorders.

D E M E N T I A – D I AG N O S T I C A N D T H E R A P E U T I C I N T E RV E N T I O N S30
Table 9.3 Alzheimer’s disease vs Healthy control.
LR+ (median)
<5 5–10 >10
Informant interviewNP testSingle tests MMSE (only one study is included) ClocktestApoE genotypeMRI/CTSpect/PETEEGCFS AßT-tauP-tau
2.0
4.23.9
5.0
9.0
6.2
9.6
14
14.8
11.8
LR– (median)
<0.1 0.1–0.2 >0.2
Informant interviewNP testSingle tests MMSE (only one study is included) ClocktestApoE genotypeMRI/CTSpect/PETEEGCFS AßT-tauP-tau
0.200.18
0.12
0.210.18
0.180.100.12
0.64
0.25
The distribution of likelihood ratios from the different methods evaluated.High LR+ and low LR– indicate high diagnostic ability of the method (test).The LR values represent median values based on studies having variations of constructions of tests (for details, see the method section of each test).
Methodological considerations
One criterion for inclusion was the quality of the methods used in the various studies (design, selection of patients, comprehensiveness of clini-cal investigation, diagnostic procedure, statistical analysis, representati-

C H A P T E R 9 • D I AG N O S I N G D E M E N T I A D I S O R D E R S 31
veness and predictor variable). The classification of studies based on the methods used needs comment.
Lack of gold standardThe diagnoses of the different dementia disorders are based on clinical criteria. Definite diagnoses are possible only at histopathology, which should serve as a gold standard. Since histopathology was rarely available in the majority of studies, clinical diagnosis in accordance with specific criteria was used as a surrogate gold standard.
Selection biasStudies based on homogeneous sampling demonstrated higher LR+ values than studies based on heterogeneous sampling. Given that homo-geneous samples are characterized by a smaller standard deviation of the predictor variable than heterogeneous samples, differentiation of patient and control groups is more easily detected. That suggests higher sensiti-vity and specificity and thereby higher LR+ values. In order to ensure a homogeneous group, the selection procedure has to be more demanding and the clinical investigation more advanced.
SettingOne consequence of the above is the importance of a setting in which the patient is examined and diagnosed: primary care or a highly spe-cialized unit at a university hospital. In primary care, patients are more similar to the general population in terms of background characteristics, whereas a patient at a university hospital is usually highly selected by means of the referral procedure. This difference places varying demands on the diagnostic instruments. In general, there is a lack of studies on health care organization in terms of diagnostic evaluation in dementia, and many of the more advanced methods have not been evaluated in primary care. On the other hand, some of these methods (such as MRI and CSF studies) may not be relevant for introduction on a routine basis in primary care.

D E M E N T I A – D I AG N O S T I C A N D T H E R A P E U T I C I N T E RV E N T I O N S32
Circularity biasMoreover, many of the studies do not tell us whether the predictor (test) was judged independently of the outcome (workup bias). That could represent a significant problem when evaluating the studies included in the present review. Thus, the results of those studies should be interpre-ted with caution. Knowledge about predictor results may have influen-ced the diagnosis and confounded the estimate of sensitivity, specificity and likelihood ratio.
Most studies have been performed in well-characterized groups of patients, defined by clinical criteria. Even with very high sensitivity, specificity, and likelihood ratios, the added clinical value (above a strict clinical evalua-tion) in the routine clinical setting may not be known. In general, there is a lack of studies designed to address this issue.
Recommendations for future research
In terms of arriving at a conclusive diagnosis in cases of suspected dementia (early diagnosis), we have found evidence for inclusion of a variety of single predictive tests. However, we have little evidence for implementation of a certain combination of tests that might be recom-mended for the diagnostic workup. Thus, until such evidence has been established, we will have to rely on a number of tests and the diagnostic procedure will continue to be both costly and time-consuming.
Dementia symptoms defined in accordance with the clinical criteria of DSM-IV and ICD-10 provide a synthetic means of understanding dementia diseases. These criteria heavily influence the stage at which dementia diseases can be diagnosed and what diagnostic instruments may be useful, given that the requirement for making a dementia dia- gnosis is that the syndrome is present. The other problem that needs to be addressed involves the concepts of cognitive impairment and mild cognitive impairment (MCI). There are a variety of definitions of this syndrome, none of which is clear enough to be operational. Impaired memory is not necessarily part of the initial presentation of a dementia

C H A P T E R 9 • D I AG N O S I N G D E M E N T I A D I S O R D E R S 33
disorder, and MCI is not necessarily a preclinical stage of a dementia disorder. We have to get over this way of thinking and search for bio-logical diagnostic tests that can detect a specific dementia disorder in a very early phase, as well as distinguish dementia from non-progressive condition that cause cognitive impairment. If we cannot do so, we must study cognition in large groups of adults and the elderly in prospective population based studies to devise new definitions of cognitive impair-ment, MCI and dementia among people of various social classes, as well as cultural and ethnic backgrounds. The same holds true for the clini-cal criteria of the various dementia diseases, which are not defined well enough by DSM-IV, ICD-10, the American Academy of Neurology or others.
A minority of younger patients with a dementia disorder suffer from a single disease that causes the observed symptoms. For example, post-mortem studies of very old people, for whom the prevalence of demen- tia is high, have shown cerebrovascular pathology in a majority of those with AD. Thus, the observed symptoms in these patients could be a consequence of AD as well as structural changes due to a cerebrovascu-lar disease. It would appear that existing neuropathological criteria for the various dementia diseases are not gold standards and that they must be improved. If the goal is to diagnose a dementia disorder in asymptomatic indivi-duals for the purpose of intervening early, biomarkers for AD and other brain diseases that cause dementia are critically needed. Such tests must be validated, and a definite dementia diagnosis requires histopathological verification. Speculating about which diagnostic test(s) will be available in the future is beyond the scope of the present review. We recommend that various lines of development be followed in order to develop tests with better sensitivity and specificity than those currently in use. Thus, new biomarkers at the molecular level should be developed, explored and studied, along with imaging techniques for detection of brain pathology, specific cognitive features and behavioral abnormality, as well as discer-ning reports by close informants.

D E M E N T I A – D I AG N O S T I C A N D T H E R A P E U T I C I N T E RV E N T I O N S34
1. American Psychiatric Association. DSM-IV, Diagnostic and Statistical Manual of Mental Disorders. Washington DC: APA; 1994.
2. World Health Organization. ICD-10, World Health Organization Tenth Revi-sion of the International Classification of Diseases. Geneva: WHO; 1992.
3. Waldemar G, Dubois B, Emre M, Scheltens P, Tariska P, Rossor M. Diagno-sis and management of Alzheimer’s disease and other disorders associated with demen-tia. The role of neurologists in Europe. European Federation of Neurological Societies. Eur J Neurol 2000;7:133-44.
4. Practice parameter for diagnosis and evaluation of dementia. (summary state-ment) Report of the Quality Standards Subcommittee of the American Academy of Neurology. Neurology 1994;44:2203-6.
5. Knopman DS, DeKosky ST, Cummings JL, Chui H, Corey-Bloom J, Relkin N, et al. Practice parameter: diagnosis of de-
mentia (an evidence-based review). Report of the Quality Standards Subcommittee of the American Academy of Neurology. Neurology 2001;56:1143-53.
6. Chui H, Zhang Q. Evaluation of dementia: a systematic study of the usefulness of the American Academy of Neurology’s practice parameters. Neurology 1997;49:925-35.
7. American Psychiatric Association. DSM-III-R, Diagnostic and statistical manual of mental disorders. Washington DC: APA; 1987.
8. McKhann G, Drachman D, Folstein M, Katzman R, Price D, Stadlan EM. Clinical diagnosis of Alzheimer’s disease: report of the NINCDS-ADRDA Work Group under the auspices of Department of Health and Human Services Task Force on Alzheimer’s Disease. Neurology 1984;34:939-44.
9. Fagan TJ. Letter: Nomogram for Bayes theorem. N Engl J Med 1975; 293:257.
References

C H A P T E R 10 • I D E N T I F Y I N G S E C O N DA RY D E M E N T I A O R P OT E N T I A L R E V E R S I B L E C O G N I T I V E I M PA I R M E N T
35
10. Identifying Secondary Dementia or Potential Reversible Cognitive Impairment
Thyroid disease and dementia
BackgroundHypothyroidism may be associated with the slowing of mental func-tions, dementia-like symptoms and depression. Hyperthyroidism is asso-ciated with anxiety, restlessness and subjective cognitive symptoms, as well as depression and psychosis on occasion. The potential relationship between thyroid disease and dementia is also described in Section III.7.5, “Evidence-based Dementia Practice”.
Because hyperthyroidism and hypothyroidism, which are treatable dis-orders, may be associated with cognitive symptoms and a dementia-like syndrome, laboratory screening with TSH (thyroid stimulating hormone) is generally recommended in guidelines for the diagnostic evaluation of dementia.
Literature search for evidence
In searching the literature, the following three types of evidence for a potential relationship between thyroid disease and dementia were identi-fied as relevant.
• Evidence that clinical or subclinical thyroid disease may be associated with cognitive symptoms, memory loss or dementia.

D E M E N T I A – D I AG N O S T I C A N D T H E R P E U T I C I N T E RV E N T I O N S36
• Evidence that TSH screening in specific patient groups (the elderly, people with cognitive symptoms or dementia) helps to identify patients with abnormal TSH and/or clinically significant thyroid disease.
• Evidence that the treatment of thyroid disease improves cognitive functions.
Search strategy
“Cognition” [MeSH] OR“Delirium, Dementia, Amnestic, Cognitive Disorders” [MeSH] OR“Memory Disorders” [MeSH] OR“Memory” [MeSH] OR“Behavioral symptoms” [MeSH] AND “thyrotropin/blood” OR [MeSH Terms]“thyrotropin/analysis” OR [MeSH Terms]“thyrotropin/deficiency” OR [MeSH Terms]“thyrotropin/diagnostic use” OR [MeSH Terms]“thyroid diseases”Limits: Only papers with abstracts, English language, human.
Results
A total of 172 papers were found. Based on a review of titles and abstracts, 132 papers were excluded, due mainly to irrelevance to the topic or the absence of original research. The remaining 40 papers of potential rele- vance were reviewed in greater detail. Seventeen were reports of 1 to 7 cases and 6 were reviews. The evidence in the remaining 17 original papers was reviewed and classified together with 1 other report identi- fied from references in the papers (Table 10.1).

C H A P T E R 10 • I D E N T I F Y I N G S E C O N DA RY D E M E N T I A O R P OT E N T I A L R E V E R S I B L E C O G N I T I V E I M PA I R M E N T
37
Comments
Generally speaking, there is little evidence that hypothyroidism or hyperthyroidism causes dementia, and (for ethical reasons) no placebo- controlled treatment studies have investigated whether treatment can reverse cognitive symptoms. However, both hypothyroidism and hyper- thyroidism can cause cognitive and psychiatric symptoms and may the-reby mimic a dementia disorder with insidious onset. Untreated thyroid disease leads to other symptoms and risks. Despite the lack of data on dementia, detection of hypothyroidism remains important in patients with dementia in view of its high prevalence in the elderly and its asso-ciation with depression and psychotic symptoms. Thyroid replacement improves physical symptoms and general well-being. Treatment of co- existing medical problems in patients with dementia may improve both cognition and quality of life. Uncontrolled follow-up studies have shown that, while treatment of the thyroid disease may improve or reverse many symptoms, some patients continue to experience disabling cognitive and psychiatric symptoms. Although detection and management of thyroid failure should be a component of the general medical assessment of any elderly person, the available data indicate that the finding of hypothy-roidism in a patient with dementia should not lead to a confident prog-nosis of improved cognitive function. The same considerations apply to hyperthyroidism.
Thus, even if treatment does not reverse cognitive symptoms, thyroid disorders should be identified and treated.

D E M E N T I A – D I AG N O S T I C A N D T H E R P E U T I C I N T E RV E N T I O N S38
Table 10.1 Thyroid disease and dementia.
Author Topic Hypo- or hyper- Sample (N) Age mean Population/selection Setting Authors’ conclusion Reviewers’ Year thyroidism (years) comments Reference Country
Fäldt et al 1 Both NP = 173 79 Consecutively referred Psychogeriatric High prevalence (25%) of Objective of1996 Nc = 0 for possible organic department abnormal TSH and/or free the study not[1] brain disease thyroid hormones. No clearSweden significant difference between demented and non-demented
Wahlin et al 1 Both N = 200 83.9 Selected Population based In healthy volunteers Patients with1998 non-demented study there is a significant thyroid related[2] individuals from correlation between disease wereSweden population >75 years TSH and episodic excluded memory
Bommer et al 1 Hypothyroidism Np = 45 45 Formerly hyperthyroid Hospital based Remitted hyperthyroidism Long-term1990 Nc = 51 patients examined was associated with follow-up[3] when euthyroid cognitive and psychiatric neededGermany symptoms and with impaired neuropsycho- logical function in 43%
Kalmijn et al 1 Both N = 1 843 68.8 Epidemiological Population based Subclinical hyperthyroidism RR 3.5 for2000 population based study in Rotterdam was associated with an reduced TSH. [4] prospective study increased risk of dementia RR 23.7 forThe Netherlands and Alzheimer’s disease reduced TSH with positive TPO-Abs
Baldini et al 1+3 Hypothyroidism Nhypo = 19 52.9 Goiter patients with Out-patient Patients with subclinical Only 3 months1997 Neuthyroid = 17 either subclinical endocrinological hypothyroidism had follow-up. [5] hypothyroidism or clinic memory deficits which No psychiatricUSA normal thyroid function improved on treatment symptoms
Osterweil et al 1+3 Hypothyroidism Nhypo = 54 68.6 Referred patients with- Endocrine and Hypothyroidism is Treatment study1992 Neuthyroid = 30 63.7 out dementia, selected geriatric services associated with impaired uncontrolled for[6] controls learning, word fluency, ethical reasonsUSA visual-spatial abilities etc and lower MMSE. Treat- ment was associated with improvements in the cognitive tests

C H A P T E R 10 • I D E N T I F Y I N G S E C O N DA RY D E M E N T I A O R P OT E N T I A L R E V E R S I B L E C O G N I T I V E I M PA I R M E N T
39
Table 10.1 Thyroid disease and dementia.
Author Topic Hypo- or hyper- Sample (N) Age mean Population/selection Setting Authors’ conclusion Reviewers’ Year thyroidism (years) comments Reference Country
Fäldt et al 1 Both NP = 173 79 Consecutively referred Psychogeriatric High prevalence (25%) of Objective of1996 Nc = 0 for possible organic department abnormal TSH and/or free the study not[1] brain disease thyroid hormones. No clearSweden significant difference between demented and non-demented
Wahlin et al 1 Both N = 200 83.9 Selected Population based In healthy volunteers Patients with1998 non-demented study there is a significant thyroid related[2] individuals from correlation between disease wereSweden population >75 years TSH and episodic excluded memory
Bommer et al 1 Hypothyroidism Np = 45 45 Formerly hyperthyroid Hospital based Remitted hyperthyroidism Long-term1990 Nc = 51 patients examined was associated with follow-up[3] when euthyroid cognitive and psychiatric neededGermany symptoms and with impaired neuropsycho- logical function in 43%
Kalmijn et al 1 Both N = 1 843 68.8 Epidemiological Population based Subclinical hyperthyroidism RR 3.5 for2000 population based study in Rotterdam was associated with an reduced TSH. [4] prospective study increased risk of dementia RR 23.7 forThe Netherlands and Alzheimer’s disease reduced TSH with positive TPO-Abs
Baldini et al 1+3 Hypothyroidism Nhypo = 19 52.9 Goiter patients with Out-patient Patients with subclinical Only 3 months1997 Neuthyroid = 17 either subclinical endocrinological hypothyroidism had follow-up. [5] hypothyroidism or clinic memory deficits which No psychiatricUSA normal thyroid function improved on treatment symptoms
Osterweil et al 1+3 Hypothyroidism Nhypo = 54 68.6 Referred patients with- Endocrine and Hypothyroidism is Treatment study1992 Neuthyroid = 30 63.7 out dementia, selected geriatric services associated with impaired uncontrolled for[6] controls learning, word fluency, ethical reasonsUSA visual-spatial abilities etc and lower MMSE. Treat- ment was associated with improvements in the cognitive tests
The table continues on the next page

D E M E N T I A – D I AG N O S T I C A N D T H E R P E U T I C I N T E RV E N T I O N S40
Table 10.1 continued
Author Topic Hypo- or hyper- Sample (N) Age mean Population/selection Setting Authors’ conclusion Reviewers’ Year thyroidism (years) comments Reference Country
Yoshimasu et al 1 Hashimoto’s N = 198 NA All patients with tissue Hospital based Patients with thyroid Prospective study1991 thyroiditis proven HT who had disease did not have an with systematic[7] follow-up – retrospective significantly increased risk description ofStudy A review of medical records for developing AD (8 vs mental functionsUSA 5.3 expected) and dementia would be needed
Yoshimasu et al 2 Both NAD = 646 NA Retrospective case- Hospital based OR 0.45 for Grave’s Problem with1991 Nc = 646 control comparison disease – protective underreporting[8] association? No significant of previousStudy B relation with other disorders diseases in ADUSA patients not accounted for
Bahemuka et al 2 Hypothyroidism N = 2 000 80 Consecutive referrals, Geriatric 46 cases (2.3%) had Large sample.1975 all patients >60 department hypothyroidism, 13 with Symptoms[9] classical symptoms and described fromUnited Kingdom 23 with unspecific or medical records psychiatric symptoms only
Luboshitzky et al 2 Hypothyroidism Np = 751 76.4 All patients above 65 Population based Elevated TSH in 14% of Cognitive function1996 years in 9 kibbutzim. study – primary the elderly. Mild untreated measured with[10] Review of medical files health care hypothyroidism was not MMSE only. Israel associated with cognitive Patients not deficits stratified for occurrence of dementia
Schlote et al 2 Hyperthyroidism Nsubclinical = 35 NA Inpatients or outpatients Hospital Subclinical thyroid disease Selection of1992 Nmanifest = 60 referred during a certain was associated with euthyroid controls[11] Neuthyroid = 60 time period psychiatric symptoms but not well described, Germany not cognitive deficits consecutive referrals? Age not reported
Ganguli et al 2 Hypothyroidism NTOTAL = 194 78.6 First 194 patients Community-based Elevated TSH was Low TSH was1996 NCDR0 = 122 evaluated for possible population study significantly associated with not associated[12] NCDR0.5 = 29 dementia a large >65 years dementia. Elevated/low with dementiaUSA NCDR>1 = 43 population TSH was found in 14.4%/ 5.2% of all patients

C H A P T E R 10 • I D E N T I F Y I N G S E C O N DA RY D E M E N T I A O R P OT E N T I A L R E V E R S I B L E C O G N I T I V E I M PA I R M E N T
41
Table 10.1 continued
Author Topic Hypo- or hyper- Sample (N) Age mean Population/selection Setting Authors’ conclusion Reviewers’ Year thyroidism (years) comments Reference Country
Yoshimasu et al 1 Hashimoto’s N = 198 NA All patients with tissue Hospital based Patients with thyroid Prospective study1991 thyroiditis proven HT who had disease did not have an with systematic[7] follow-up – retrospective significantly increased risk description ofStudy A review of medical records for developing AD (8 vs mental functionsUSA 5.3 expected) and dementia would be needed
Yoshimasu et al 2 Both NAD = 646 NA Retrospective case- Hospital based OR 0.45 for Grave’s Problem with1991 Nc = 646 control comparison disease – protective underreporting[8] association? No significant of previousStudy B relation with other disorders diseases in ADUSA patients not accounted for
Bahemuka et al 2 Hypothyroidism N = 2 000 80 Consecutive referrals, Geriatric 46 cases (2.3%) had Large sample.1975 all patients >60 department hypothyroidism, 13 with Symptoms[9] classical symptoms and described fromUnited Kingdom 23 with unspecific or medical records psychiatric symptoms only
Luboshitzky et al 2 Hypothyroidism Np = 751 76.4 All patients above 65 Population based Elevated TSH in 14% of Cognitive function1996 years in 9 kibbutzim. study – primary the elderly. Mild untreated measured with[10] Review of medical files health care hypothyroidism was not MMSE only. Israel associated with cognitive Patients not deficits stratified for occurrence of dementia
Schlote et al 2 Hyperthyroidism Nsubclinical = 35 NA Inpatients or outpatients Hospital Subclinical thyroid disease Selection of1992 Nmanifest = 60 referred during a certain was associated with euthyroid controls[11] Neuthyroid = 60 time period psychiatric symptoms but not well described, Germany not cognitive deficits consecutive referrals? Age not reported
Ganguli et al 2 Hypothyroidism NTOTAL = 194 78.6 First 194 patients Community-based Elevated TSH was Low TSH was1996 NCDR0 = 122 evaluated for possible population study significantly associated with not associated[12] NCDR0.5 = 29 dementia a large >65 years dementia. Elevated/low with dementiaUSA NCDR>1 = 43 population TSH was found in 14.4%/ 5.2% of all patients
The table continues on the next page

D E M E N T I A – D I AG N O S T I C A N D T H E R P E U T I C I N T E RV E N T I O N S42
Table 10.1 continued
Author Topic Hypo- or hyper- Sample (N) Age mean Population/selection Setting Authors’ conclusion Reviewers’ Year thyroidism (years) comments Reference Country Heyman et al 2 Both NAD = 40 NA Case-control study in University hospital Higher frequency of prior Age not reported. 1984 NC = 80 patients with Alzheimer’s thyroid disease in women Selection of[13] disease and in community patients (25%) than in controls not wellUSA controls controls described. Type of thyroid disorder not well described
Lopez et al 2 Both NAD = 31 72.3 Retrospective record University hospital No relation between AD High frequency of1989 NC = 31 72.7 review of patients with longitudinal study and thyroid disease thyroid disease. [14] neuropathological on dementia Retrospective study.USA diagnosis of AD and Uncertain selection non-demented controls of controls
Tappy et al 2 Both Npsychog = 157 80.1 Consecutive referrals Psychogeriatric 6 hypothyroid patients in1987 Ncsurgical = 194 80.9 (controls were non- department (vs psychogeriatric group (all[15] consecutive) surgical dept) had dementia or neuroticSwitzerland depression) and 2 in surgical group. 1 patient had hyperthyroidism
Small et al 2 Both NAD = 61 71.7 Recruited from project University hospital No significant difference Small sample1985 NC = 38 73.6 between patients and [16] controls for prior thyroid USA disease (13%), history of thyroid medication (16%) or abnormal T4 (13%)
Fox et al 2 Both N = 40 75 Consecutive referrals Neurological dept, 2 patients with hypo- Senile dementia1975 where a diagnosis university hospital thyroidism were identi- syndrome not[17] of senile dementia was fied, both improved clearly definedUSA made – with the aim to study reversible dementia

C H A P T E R 10 • I D E N T I F Y I N G S E C O N DA RY D E M E N T I A O R P OT E N T I A L R E V E R S I B L E C O G N I T I V E I M PA I R M E N T
43
Table 10.1 continued
Author Topic Hypo- or hyper- Sample (N) Age mean Population/selection Setting Authors’ conclusion Reviewers’ Year thyroidism (years) comments Reference Country Heyman et al 2 Both NAD = 40 NA Case-control study in University hospital Higher frequency of prior Age not reported. 1984 NC = 80 patients with Alzheimer’s thyroid disease in women Selection of[13] disease and in community patients (25%) than in controls not wellUSA controls controls described. Type of thyroid disorder not well described
Lopez et al 2 Both NAD = 31 72.3 Retrospective record University hospital No relation between AD High frequency of1989 NC = 31 72.7 review of patients with longitudinal study and thyroid disease thyroid disease. [14] neuropathological on dementia Retrospective study.USA diagnosis of AD and Uncertain selection non-demented controls of controls
Tappy et al 2 Both Npsychog = 157 80.1 Consecutive referrals Psychogeriatric 6 hypothyroid patients in1987 Ncsurgical = 194 80.9 (controls were non- department (vs psychogeriatric group (all[15] consecutive) surgical dept) had dementia or neuroticSwitzerland depression) and 2 in surgical group. 1 patient had hyperthyroidism
Small et al 2 Both NAD = 61 71.7 Recruited from project University hospital No significant difference Small sample1985 NC = 38 73.6 between patients and [16] controls for prior thyroid USA disease (13%), history of thyroid medication (16%) or abnormal T4 (13%)
Fox et al 2 Both N = 40 75 Consecutive referrals Neurological dept, 2 patients with hypo- Senile dementia1975 where a diagnosis university hospital thyroidism were identi- syndrome not[17] of senile dementia was fied, both improved clearly definedUSA made – with the aim to study reversible dementia
The table continues on the next page

D E M E N T I A – D I AG N O S T I C A N D T H E R P E U T I C I N T E RV E N T I O N S44
Topic 1: Evidence that clinical or subclinical thyroid disease may be associated with cogni-tive symptoms, memory loss, or dementia.Topic 2: Evidence that TSH screening in patient groups (elderly patients, patients with cognitive symptoms or dementia) leads to identification of patients with abnormal TSH and/or clinical significant thyroid disease.Topic 3: Evidence that treatment of thyroid disease improves cognitive functions.
AD = Alzheimer’s disease; MCSAb = Antimicrosomial autoantibodies; MMSE = Mini-mental state examination; NA = Not applicable; Nc = Number of controls; Np = Number of psychogeriatric patients; OR = Odds ratio; RR = Relative risk; T4 = Thyroxine; TgAb = Thyroidea globulin antibodies (Antithyreoglobulin); Tpo-Abs = Antibodies to thyroid peroxidase; TSH = Thyroid stimulating hormone
Table 10.1 continued
Author Topic Hypo- or hyper- Sample (N) Age mean Population/selection Setting Authors’ conclusion Reviewers’ Year thyroidism (years) comments Reference Country Genovesi et al 2 Antithyroid NAD = 34 65.2 Selection of patients Hospital Significant increase in Presence of clinical1996 antibodies Nc = 30 and controls not TgAb and MCSAb thyroid disease in[18] reported the two groupsItaly not described
Clarfield 2+3 Hypothyroidism 2 781 NA Meta-analysis of cases Hospital settings 18 cases reported as Different criteria1988 from studies of etiology dementia due to hypothy- for dementia and[19] in dementia roidism (1 was reversible) for reversibility inCanada the various studies

C H A P T E R 10 • I D E N T I F Y I N G S E C O N DA RY D E M E N T I A O R P OT E N T I A L R E V E R S I B L E C O G N I T I V E I M PA I R M E N T
45
Table 10.1 continued
Author Topic Hypo- or hyper- Sample (N) Age mean Population/selection Setting Authors’ conclusion Reviewers’ Year thyroidism (years) comments Reference Country Genovesi et al 2 Antithyroid NAD = 34 65.2 Selection of patients Hospital Significant increase in Presence of clinical1996 antibodies Nc = 30 and controls not TgAb and MCSAb thyroid disease in[18] reported the two groupsItaly not described
Clarfield 2+3 Hypothyroidism 2 781 NA Meta-analysis of cases Hospital settings 18 cases reported as Different criteria1988 from studies of etiology dementia due to hypothy- for dementia and[19] in dementia roidism (1 was reversible) for reversibility inCanada the various studies

D E M E N T I A – D I AG N O S T I C A N D T H E R P E U T I C I N T E RV E N T I O N S46
1. Faldt R, Passant U, Nilsson K, Wattmo C, Gustafson L. Prevalence of thyroid hor-mone abnormalities in elderly patients with symptoms of organic brain disease. Aging (Milano) 1996;8:347-53.
2. Wahlin A, Wahlin TB, Small BJ, Backman L. Influences of thyroid stimul-ating hormone on cognitive functioning in very old age. J Gerontol B Psychol Sci Soc Sci 1998;53:P234-9.
3. Bommer M, Eversmann T, Pickardt R, Leonhardt A, Naber D. Psychopatho-logical and neuropsychological symptoms in patients with subclinical and remit-ted hyperthyroidism. Klin Wochenschr 1990;68:552-8.
4. Kalmijn S, Mehta KM, Pols HA, Hofman A, Drexhage HA, Breteler MM. Subclinical hyperthyroidism and the risk of dementia. The Rotterdam study. Clin Endocrinol (Oxf) 2000;53:733-7.
5. Baldini IM, Vita A, Mauri MC, Amodei V, Carrisi M, Bravin S, et al. Psychopathological and cognitive fea- tures in subclinical hypothyroidism. Prog Neuropsychopharmacol Biol Psychiatry 1997;21:925-35.
6. Osterweil D, Syndulko K, Cohen SN, Pettler-Jennings PD, Hershman JM, Cummings JL, et al. Cognitive func-tion in non-demented older adults with hypothyroidism. J Am Geriatr Soc 1992; 40:325-35.
7. Yoshimasu F, Kokmen E, Hay ID, Beard CM, Offord KP, Kurland LT. Study A: The association between Alzheimer’s
disease and thyroid disease in Rochester, Minnesota. Neurology 1991;41:1745-7.
8. Yoshimasu. Study B. 1991 (see [7]).
9. Bahemuka M, Hodkinson HM. Screen-ing for hypothyroidism in elderly inpa-tients. BMJ 1975;2:601-3.
10. Luboshitzky R, Oberman AS, Kaufman N, Reichman N, Flatau E. Prevalence of cognitive dysfunction and hypothyroidism in an elderly community population. Isr J Med Sci 1996;32:60-5.
11. Schlote B, Nowotny B, Schaaf L, Kleinbohl D, Schmidt R, Teuber J, et al. Subclinical hyperthyroidism: physical and mental state of patients. Eur Arch Psychiatry Clin Neurosci 1992;241: 357-64.
12. Ganguli M, Burmeister LA, Seaberg EC, Belle S, DeKosky ST. Association between dementia and elevated TSH: a community-based study. Biol Psychiatry 1996;40:714-25.
13. Heyman A, Wilkinson WE, Stafford JA, Helms MJ, Sigmon AH, Weinberg T. Alzheimer’s disease: a study of epi- demiological aspects. Ann Neurol 1984; 15:335-41.
14. Lopez O, Huff FJ, Martinez AJ, Bedetti CD. Prevalence of thyroid abnor-malities is not increased in Alzheimer’s disease. Neurobiol Aging 1989;10:247-51.
15. Tappy L, Randin JP, Schwed P, Wertheimer J, Lemarchand-Beraud T. Prevalence of thyroid disorders in psycho-
References

C H A P T E R 10 • I D E N T I F Y I N G S E C O N DA RY D E M E N T I A O R P OT E N T I A L R E V E R S I B L E C O G N I T I V E I M PA I R M E N T
47
geriatric inpatients. A possible relationship of hypothyroidism with neurotic depres-sion but not with dementia. J Am Geriatr Soc 1987;35:526-31.
16. Small GW, Matsuyama SS, Komanduri R, Kumar V, Jarvik LF. Thyroid disease in patients with dementia of the Alzheimer type. J Am Geriatr Soc 1985;33:538-9.
17. Fox JH, Topel JL, Huckman MS. Dementia in the elderly – a search for
treatable illnesses. J Gerontol 1975;30: 557-64.
18. Genovesi G, Paolini P, Marcellini L, Vernillo E, Salvati G, Polidori G, et al. Relationship between autoimmune thyroid disease Rand Alzheimer’s disease. Panminerva Med 1996;38:61-3.
19. Clarfield AM. The reversible demen-tias: do they reverse? Ann Intern Med 1988;109:476-86.


C H A P T E R 11 • N E U R O S Y P H I L I S A N D D E M E N T I A 49
11. Neurosyphilis and Dementia
Background
The introduction of antibiotics led not only to appropriate treatment of patients with primary syphilis, but to the incidental treatment of unidentified syphilis in patients treated for other infections. The inci-dence of neurosyphilis has fallen dramatically since then. Clinicians have become unfamiliar with the diversity of presentations, and neuro-syphilis continues to appear in various guises at many different hospital departments. In patients with untreated asymptomatic neurosyphilis, the overall cumulative probability of progression to clinical neurosyphilis is about 20% in the first 10 years but increases with time.
Although mixed features are common, the major clinical categories of symptomatic neurosyphilis are meningeal, meningovascular, and parenchymatous syphilis. The last category includes general paresis and tabes dorsalis. However, symptomatic neurosyphilis often presents not according to a classic concept, but as mixed and subtle or incomplete syndromes.
Patients with meningeal syphilis may present with headache, nausea, vomiting, neck stiffness, cranial nerve palsies, seizures and changes in mental status. Patients with meningovascular syphilis may present with a stroke syndrome. However, unlike the usual thrombotic or embolic stroke syndrome of sudden onset, meningovascular syphilis often mani-fests after a subacute encephalitic prodrome, followed by a progressive vascular syndrome. The manifestations of general paresis include abnor-malities corresponding to the mnemonic paresis: personality, affect, reflexes (hyperactive), eye (such as Argyll Robertson pupils), sensorium (illusions, delusions, hallucinations), intellect (deterioration of short-term memory and the capacity for orientation, calculations, judgment and

D E M E N T I A – D I AG N O S T I C A N D T H E R A P E U T I C I N T E RV E N T I O N S50
insight) and speech. Tabes dorsalis presents as ataxic wide-based gait and foot slap, paresthesia, bladder disturbances, impotence and areflexia, as well as loss of position, deep pain and temperature sensations.
Literature search for evidence
In searching the literature, the following three types of evidence for the potential relationship between thyroid disease and dementia were identi-fied as relevant
• Evidence that neurosyphilis may be associated with cognitive symp-toms, memory loss, behavioral symptoms or dementia.
• Evidence that laboratory screening in specific groups (elderly patients, patients with cognitive symptoms or patients with dementia) helps identify people with neurosyphilis.
• Evidence that the treatment of neurosyphilis improves cognitive functions.
Search strategy
“Cognition” [MeSH] OR“Delirium, Dementia, Amnestic, Cognitive Disorders” [MESH] OR“Memory Disorders” [MeSH] OR“Memory” [MeSH] OR“Behavioral symptoms” [MeSH] OR“Dementia” [MeSH Terms]AND“Syphilis” [MeSH] OR“Syphilis Serodiagnosis” [MeSH]Limits: Only papers with abstracts, English language, human.

C H A P T E R 11 • N E U R O S Y P H I L I S A N D D E M E N T I A 51
Result
Fiftytwo papers were found. Based on a review of titles and abstract, 27 papers were excluded, mainly due to irrelevance to the topic. The remaining 25 papers of potential relevance were reviewed in more detail. Twelve were reports of 1 to 10 cases and 3 were reviews or letters of correspondence. The evidence in the remaining 10 original papers was reviewed and categorized (Table 11.1).
Comments
Many case reports and reports on cohorts of patients with neurosyphilis confirm an association of neurosyphilis with cognitive and psychiatric symptoms, including a wide variety of presentations from one case to the other. There are no population based studies – and only a few hospital-based studies in patients referred for cognitive symptoms, neurological patients or psychiatric patients – from which the outcome of screening can be determined in terms of identifying neurosyphilis. In those stu-dies, 3–11% of elderly patients, as well as patients referred for evaluation of possible dementia, have positive serology. However, neurosyphilis was identified in less than 1% of patients referred for possible dementia. In the largest study, which included 672 referred patients – of whom 402 had lumbar puncture – 3% had positive serology, but only 1 patient (0.15%) was identified with neurosyphilis. However, none of them were systematic prospective studies. For ethical reasons, no randomized controlled trials have been conducted to confirm the effectiveness of treatment for cognitive symptoms. In case reports and two uncontrolled follow-up studies, treatment was followed by improvements in mental and psychiatric symptoms, although the condition may not have been reversed entirely.
In conclusion, neurosyphilis should be identified and treated, and aware-ness of the many different and subtle presentations is important. Because of the lack of sufficiently high quality studies, it is not possible to draw any firm conclusions as to the outcome of screening for neurosyphilis in populations with cognitive symptoms.

D E M E N T I A – D I AG N O S T I C A N D T H E R A P E U T I C I N T E RV E N T I O N S52
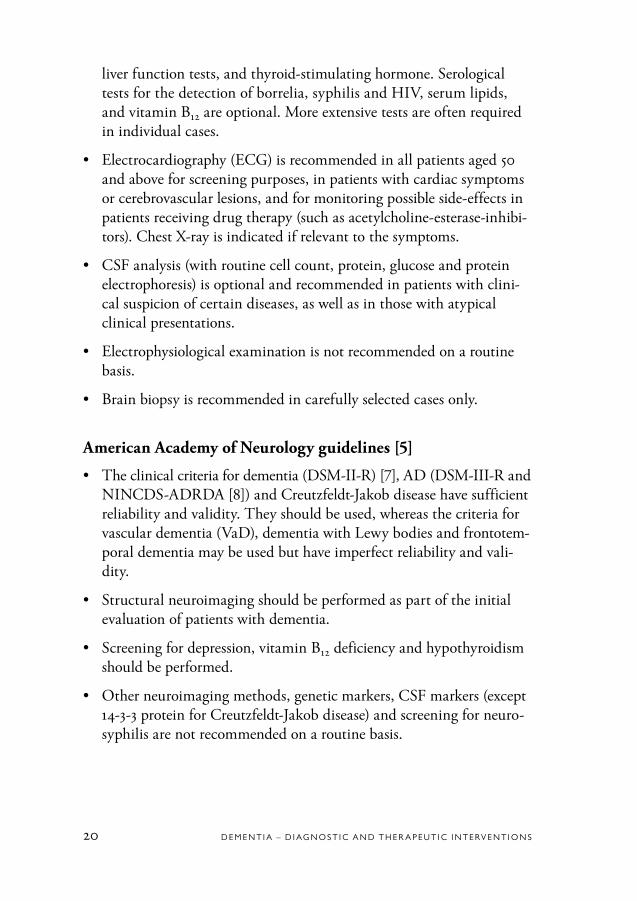
Table 11.1 Neurosyhpilis and dementia.
Author Topic Sample (N) Age mean Population/selection Setting Authors’ conclusion Reviewers’ comments Year (years) Reference Country
Nordenbo et al 1 N = 23 48.8 Hospital records Hospital departments Incidence was 0.3 per History of venereal infection1981 (neurology, 100 000 per year. General in only 50%[1] dermatovenereology, paresis and meningovascularDenmark neurosurgery) syphilis most common forms
Russouw et al 1 NNS = 20 36.9 Consecutive referrals General hospital Patients had dementia, Main aim of the study was MRI1997 NC = 20 with psychiatric delirium major depression, findings in neurosyphilis[2] symptoms hallucinations, mania orSouth Africa schizophrenic symptoms
Roberts et al 1+3 N = 19 38 Consecutive referrals. Psychiatric inpatients Median change in MMSE Small sample size and poor1995 Prospective, longitudinal was +4 and in BPRS –8 at follow-up rate[3] 12 months follow-up 12 months (not significant)South Africa
Rodgers et al 1 N = 172 50 Retrospective case note Hospital based. 10 patients diagnosed1997 review of patients with Dept of Genioto- with neurosyphilis[4] positive serology urinary MedicineUnited Kingdom
Rao 1+3 N = 34 NA First admissions with Hospital setting Many had mental/ Insufficient follow-up.1954 general paresis psychiatric symptoms. Uncontrolled treatment study[5] Improvement afterIndia treatment
Boodhoo 2 N = 800 NA Patients >65, medical Psychiatric and 21 (2.6%) had positive1989 records medical hospital serology[6] patientsUnited Kingdom
Powell et al 2 N = 376 74 Retrospective study in Neurological patients Positive serology in 371993 patients with dementia (10.9%), unlikely that[7] syphilis caused dementiaUSA
Freemon 2+3 N = 60 66.2 Consecutive referrals for Hospital setting 1 patient had neurosyphilis No change in cerebral function1976 intellectual deterioration after treatment[8] – searching for reversibleUSA causes
C H A P T E R 11 • N E U R O S Y P H I L I S A N D D E M E N T I A 53
Table 11.1 Neurosyhpilis and dementia.
Author Topic Sample (N) Age mean Population/selection Setting Authors’ conclusion Reviewers’ comments Year (years) Reference Country
Nordenbo et al 1 N = 23 48.8 Hospital records Hospital departments Incidence was 0.3 per History of venereal infection1981 (neurology, 100 000 per year. General in only 50%[1] dermatovenereology, paresis and meningovascularDenmark neurosurgery) syphilis most common forms
Russouw et al 1 NNS = 20 36.9 Consecutive referrals General hospital Patients had dementia, Main aim of the study was MRI1997 NC = 20 with psychiatric delirium major depression, findings in neurosyphilis[2] symptoms hallucinations, mania orSouth Africa schizophrenic symptoms
Roberts et al 1+3 N = 19 38 Consecutive referrals. Psychiatric inpatients Median change in MMSE Small sample size and poor1995 Prospective, longitudinal was +4 and in BPRS –8 at follow-up rate[3] 12 months follow-up 12 months (not significant)South Africa
Rodgers et al 1 N = 172 50 Retrospective case note Hospital based. 10 patients diagnosed1997 review of patients with Dept of Genioto- with neurosyphilis[4] positive serology urinary MedicineUnited Kingdom
Rao 1+3 N = 34 NA First admissions with Hospital setting Many had mental/ Insufficient follow-up.1954 general paresis psychiatric symptoms. Uncontrolled treatment study[5] Improvement afterIndia treatment
Boodhoo 2 N = 800 NA Patients >65, medical Psychiatric and 21 (2.6%) had positive1989 records medical hospital serology[6] patientsUnited Kingdom
Powell et al 2 N = 376 74 Retrospective study in Neurological patients Positive serology in 371993 patients with dementia (10.9%), unlikely that[7] syphilis caused dementiaUSA
Freemon 2+3 N = 60 66.2 Consecutive referrals for Hospital setting 1 patient had neurosyphilis No change in cerebral function1976 intellectual deterioration after treatment[8] – searching for reversibleUSA causes
The table continues on the next page

D E M E N T I A – D I AG N O S T I C A N D T H E R A P E U T I C I N T E RV E N T I O N S54
Table 11.1 continued
Author Topic Sample (N) Age mean Population/selection Setting Authors’ conclusion Reviewers’ comments Year (years) Reference Country
Hammerstrom 2 N = 80 NA All patients >55 years Psychiatric department 42% had lumbar puncture Small sample sizeet al with presumed dementia. – no cases of neurosyphilis1985 Retrospective review were detected[9] of medical records USA
Becker et al 2 N = 672 66 Retrospective chart review University hospital. 21 patients with abnormal1985 NCSF = 402 of all patients referred for Neurology, general serology, including 1 with[10] evaluation of dementia medicine and psychiatry neurosyphilis (an alreadyUSA known diagnosis)
Topic 1: Evidence that neurosyphilis may be associated with cognitive symptoms, memory loss, behavioral symptoms or dementia.Topic 2: Evidence that laboratory screening in patient groups (elderly patients, patients with cognitive symptoms or dementia) leads to identification of patients with neurosyphilis.Topic 3: Evidence that treatment of neurosyphilis improves cognitive functions.
BPRS = Brief psychiatric rating scale; C = Control; CSF = Cerebrospinal fluid; MMSE = Mini-mental state examination; MRI = Magnetic resonance imaging; NC = Normal controls

C H A P T E R 11 • N E U R O S Y P H I L I S A N D D E M E N T I A 55
Table 11.1 continued
Author Topic Sample (N) Age mean Population/selection Setting Authors’ conclusion Reviewers’ comments Year (years) Reference Country
Hammerstrom 2 N = 80 NA All patients >55 years Psychiatric department 42% had lumbar puncture Small sample sizeet al with presumed dementia. – no cases of neurosyphilis1985 Retrospective review were detected[9] of medical records USA
Becker et al 2 N = 672 66 Retrospective chart review University hospital. 21 patients with abnormal1985 NCSF = 402 of all patients referred for Neurology, general serology, including 1 with[10] evaluation of dementia medicine and psychiatry neurosyphilis (an alreadyUSA known diagnosis)

D E M E N T I A – D I AG N O S T I C A N D T H E R A P E U T I C I N T E RV E N T I O N S56
1. Nordenbo AM, Sorensen PS. The incidence and clinical presentation of neurosyphilis in Greater Copenhagen 1974 through 1978. Acta Neurol Scand 1981;63:237-46.
2. Russouw HG, Roberts MC, Emsley RA, Truter R. Psychiatric manifestations and magnetic resonance imaging in HIV-negative neurosyphilis. Biol Psychiatry 1997;41:467-73.
3. Roberts MC, Emsley RA. Cognitive change after treatment for neurosyphilis. Correlation with CSF laboratory measures. Gen Hosp Psychiatry 1995;17:305-9.
4. Rodgers CA, Murphy S. Diagnosis of neurosyphilis: appraisal of clinical caseload. Genitourin Med 1997;73: 528-32.
5. Rao S. Neurosyphilis; the common types in Hyderabad. J Indian med Assoc 1954;24:48-51.
6. Boodhoo JA. Syphilis serology screen-ing in a psychogeriatric population. Is the effort worthwhile? Br J Psychiatry 1989;155:259-62.
7. Powell AL, Coyne AC, Jen L. A retro-spective study of syphilis seropositivity in a cohort of demented patients. Alzheimer Dis Assoc Disord 1993;7:33-8.
8. Freemon FR. Evaluation of patients with progressive intellectual deterioration. Arch Neurol 1976;33:658-9.
9. Hammerstrom DC, Zimmer B. The role of lumbar puncture in the evaluation of dementia: the University of Pittsburgh Study. J Am Geriatr Soc 1985;33:397-400.
10. Becker PM, Feussner JR, Mulrow CD, Williams BC, Vokaty KA. The role of lum-bar puncture in the evaluation of dementia: the Durham Veterans Administration/Duke University Study. J Am Geriatr Soc 1985;33:392-6.
References

C H A P T E R 12 • V I TA M I N B 12 , F O L I C AC I D A N D H O M O C Y S T E I N E , C O G N I T I V E I M PA I R M E N T A N D A L Z H E I M E R ’ S D I S E A S E
57
12. Vitamin B12, Folic Acid and Homocysteine, Cognitive Impairment and Alzheimer’s Disease
Conclusions
There is no evidence of a relationship between marginally low vita-min B12 concentrations in the blood and cognitive impairment or AD (Alzheimer’s disease). There is moderately strong evidence of an association between low levels of folic acid and cognitive impairment, and limited evidence of an asso-ciation between low levels of folate and AD.
There is strong evidence of an association between elevated homocys-teine levels in the blood and poor cognitive function, and moderately strong evidence for an association between elevated homocysteine levels and AD.
No evidence exists that treatment with vitamin B12 or folate improves cognitive function in patients with cognitive impairment or dementia who have either low concentrations of vitamin B12 or folic acid or high levels of homocysteine.
Background
Vitamin B12 deficiency has been considered for decades to cause cogni-tive impairment or potential reversible dementia due to demyelination processes in the brain. An association has also been found between folate deficiency and cognitive impairment, but the extent to which it is cause
D E M E N T I A – D I AG N O S T I C A N D T H E R A P E U T I C I N T E RV E N T I O N S58
or effect is not yet clear. Low intake of folate could be a consequence of mental dysfunction. Two evidenced-based reports have found that the relationship between vitamin B12 and folic acid deficiencies and demen-tia is inconclusive [1,2].
Several studies in the last ten years have reported high levels of homo-cysteine in the blood of people with cognitive impairment and dementia. It has been suggested that homocysteine can be neurotoxic, but the pos-sible mechanism involved is far from being established.
Literature search strategy
In searching for evidence of an association between cognitive impair-ment or dementia and vitamin B12 or folic acid deficiencies, or high levels of homocysteine in the blood, papers were searched for that could answer the following three questions:
1. What is the evidence of an association between low concentrations of vitamin B12 or folic acid, or high levels of homocysteine, in the blood and cognitive impairment in the elderly?
2. What is the evidence of an association between low concentrations of vitamin B12 or folic acid, or high levels of homocysteine, in the blood and AD?
3. What is the evidence that treatment with vitamin B12 or folate can improve cognitive impairment or reverse dementia?
Searches were conducted in Medline among papers published up until June 1, 2004. The keywords were “dementia or cognitive impairment or cognition” and “cobalamin or vitamin B12, or vitamin B12 deficiency or folic acid or folic acid deficiency or homocysteine or elevated homo-cysteine”. Only papers written in English were requested. Additionally, a thorough review of Chapters III.7.6 and III.7.7 in “Evidence-based Dementia Practice” [2], and report results from the Cochrane Library was undertaken. Only original papers were included, neither those reporting meta-analysis or review articles nor case reports.

C H A P T E R 12 • V I TA M I N B 12 , F O L I C AC I D A N D H O M O C Y S T E I N E , C O G N I T I V E I M PA I R M E N T A N D A L Z H E I M E R ’ S D I S E A S E
59
Threehundredthirty titles were found, while a review of the abstracts indicated that 91 were relevant to answering the three questions. For various reasons 44 were excluded, such as insufficient description of clinical assessment, inadequate use of standardized diagnosis, reporting less than 20 + 20 subjects, lack of relevance to the three questions or the fact that they were case reports or review papers.
Many of the studies reported levels of vitamin B12, folate, and homo-cysteine in the blood of the same people. Thus, information for two or all three markers can be found in the same paper. Table 12.1 shows the main findings from 16 population based studies of the elderly that analyzed the association between vitamin B12 or folic acid concentra-tions, or homocysteine levels, in the blood and cognitive function. Ten studies reported on cross-sectional data, whereas six contained data from longitudinal studies. Nine studies reported results on Vitamin B12, 10 on folate and 13 on homocysteine levels.
Table 12.2 shows the results from 25 studies that reported on the asso-ciation between vitamin B12, folic acid or homocysteine levels in the blood and AD. Four were population based and 21 were patient-based. Eighteen examined the relationship between vitamin B12 and AD, 5 exa-mined folate and AD, and 16 provided information about homocysteine levels in the blood of AD patients as compared to controls.
The search for drugs trials revealed one unblinded placebo-controlled study by Kwok et al that included 50 patients [3]. Two double-blind pla-cebo controlled studies were included, one by Fioravanti et al [4] with 30 patients (exception from the rule of only reviewing papers with at least 40 patients) and the VITAL study [5], which included 147 patients (Table 12.3). The studies by Sommer et al and van Asselt et al included fewer than 20 patients and were thereby excluded from this review [6,7]. The study by Seal et al [8] and Bryan et al [9] were not included due to lack of information about either dementia diagnosis or mild cognitive impairment.

D E M E N T I A – D I AG N O S T I C A N D T H E R A P E U T I C I N T E RV E N T I O N S60
Comments
Vitamin B12
Three of the nine studies on vitamin B12 reported an association between marginally low levels of vitamin B12 and poor cognitive function. None of the three that correlated positively were of type 1a or 2a study quality. Eight of 18 studies reported an association between low levels of vitamin B12 and AD. One of the eight was a type 1a/2a study.
Folic acidSix of 10 studies reported an association between low levels of folate and poor cognitive function, and four of the six positive studies were either type 1a or 2a. In three of five studies, low levels of folate in the blood was associated with AD, but only one of the three was a type 1a/2a study.
Homocysteine Eleven of 13 studies reported an association between high levels of homo-cystein in the blood and cognitive impairment, while 7 of the 11 were type 1a or 2a studies. Fifteen out of 16 studies showed an association between high levels of homocysteine and AD, but only 1 of the 15 was a type 1a/2a study.
Treatment with vitamin B12 or folateNone of the three treatment studies demonstrated that treatment with vitamin B12 or folate improved cognition in people with cognitive im-pairment or dementia. Only one of the double-blind random controlled trials included more than 20 + 20 patients.

C H A P T E R 12 • V I TA M I N B 12 , F O L I C AC I D A N D H O M O C Y S T E I N E , C O G N I T I V E I M PA I R M E N T A N D A L Z H E I M E R ’ S D I S E A S E
61

D E M E N T I A – D I AG N O S T I C A N D T H E R A P E U T I C I N T E RV E N T I O N S62
Table 12.1 Studies of the relationships between low level of vitamin B12, folate acid or raised level of homocysteine and cognitive impairment.
Author Sample Age Blood Main results Quality Year (years) measure of study Reference Country
Goodwin et al 260 60+ Vitamin B12 Low levels of folate in blood was significantly associated with poorer 1b1983 Folate cognitive performance, also after controlling for age, gender, education[10] and level of incomeUSA
Riggs et al 70 54–81 Vitamin B12 Lower concentration of B12, folate, and higher concentration 2b1996 Folate of Hct were associated with poorer spatial copying skills[11] HctUSA
Kalmijn et al 702 55+ Hct No association was found between high levels of Hct and cognitive 1a1999 impairment after 2.7 years[12]The Netherlands
Lindeman et al 199 60+ Vitamin B12 Low level of folate was significantly associated with various meausures 1a2000 Folate of poor cognitive performance, even after adjustment for presence of[13] depressionUSA
Budge et al 156 60–91 Hct CAMCOG scores after 3 years follow-up were related to Hct 1b2000 independently of age, gender, mood and IQ[14]United Kingdom
Robins Wahlin et al 230 75–96 Vitamin B12 Low levels of folate and B12 were significantly associated with poorer 2a2001 Folate results measuring fast and accurate novel information[15]Sweden
McCaddon et al 32 65+ Vitamin B12 Hct predicted development of cognitive decline at 5 years 1b2001 Folate follow-up, measured by MMSE word recall, orientation and spatial[16] Hct copying skillsUnited Kingdom
Morris et al 1 227 60+ Vitamin B12 Raised Hct and lowered folate was significantly associated with 1a2001 Folate poor recall, and the association between hyperhomocysteinemi[17] Hct and poor recall was partly idenpendently offolate statusUSA

C H A P T E R 12 • V I TA M I N B 12 , F O L I C AC I D A N D H O M O C Y S T E I N E , C O G N I T I V E I M PA I R M E N T A N D A L Z H E I M E R ’ S D I S E A S E
63
Table 12.1 Studies of the relationships between low level of vitamin B12, folate acid or raised level of homocysteine and cognitive impairment.
Author Sample Age Blood Main results Quality Year (years) measure of study Reference Country
Goodwin et al 260 60+ Vitamin B12 Low levels of folate in blood was significantly associated with poorer 1b1983 Folate cognitive performance, also after controlling for age, gender, education[10] and level of incomeUSA
Riggs et al 70 54–81 Vitamin B12 Lower concentration of B12, folate, and higher concentration 2b1996 Folate of Hct were associated with poorer spatial copying skills[11] HctUSA
Kalmijn et al 702 55+ Hct No association was found between high levels of Hct and cognitive 1a1999 impairment after 2.7 years[12]The Netherlands
Lindeman et al 199 60+ Vitamin B12 Low level of folate was significantly associated with various meausures 1a2000 Folate of poor cognitive performance, even after adjustment for presence of[13] depressionUSA
Budge et al 156 60–91 Hct CAMCOG scores after 3 years follow-up were related to Hct 1b2000 independently of age, gender, mood and IQ[14]United Kingdom
Robins Wahlin et al 230 75–96 Vitamin B12 Low levels of folate and B12 were significantly associated with poorer 2a2001 Folate results measuring fast and accurate novel information[15]Sweden
McCaddon et al 32 65+ Vitamin B12 Hct predicted development of cognitive decline at 5 years 1b2001 Folate follow-up, measured by MMSE word recall, orientation and spatial[16] Hct copying skillsUnited Kingdom
Morris et al 1 227 60+ Vitamin B12 Raised Hct and lowered folate was significantly associated with 1a2001 Folate poor recall, and the association between hyperhomocysteinemi[17] Hct and poor recall was partly idenpendently offolate statusUSA
The table continues on the next page

D E M E N T I A – D I AG N O S T I C A N D T H E R A P E U T I C I N T E RV E N T I O N S64
Table 12.1 continued
Author Sample Age Blood Main results Quality Year (years) measure of study Reference Country
Stewart et al 248 55–75 Folate Raised Hct was associated with cognitive impairment, 2a2002 Hct but modified by educational level, not by vascular factors[18]United Kingdom
Prins et al 1 077 55+ Hct Elevated Hct was associated with cognitive impairment, 2a2002 most markedly for motor speed[19]The Netherlands
Duthie et al 183 75+ Vitamin B12 Elevated Hct and low B12 was associated with development 1b2002 148 60+ Folate of cognitive decline[20] HctScotland
Dufouil et al 1 241 61–73 Hct Elevated Hct was associated with cognitive impairment as measured 1a2003 by a variety of cognitive tests. The odds for developing cognitive[21] decline after 4 years was 2.8 for the people with the highest levelFrance of homocysteine
Ravaglia et al 650 65+ Vitamin B12 Elevated Hct was associated with cognitive impairment as 2a2003 Folate measured with MMSE. The association was graded and independently[22] Hct of age, medical condition and lifestyle factorsItaly
Miller et al 1 789 60+ Hct A modest inverse association between Hct and a variety of cognitive 1a2003 tests, including MMSE was found (p<0.05)[23]USA
Sachdev et al 385 60–64 Hct Hct level in blood was significantly associated to verbal memory 1a2004 and motor speed. After correction for levels of folate, vitamin B12, [24] creatinine and life-stile factors the association disappearedAustralia
Teunissen et al 144 30+ Vitamin B12 Hct level in blood was significantly associated with cognitive impairment 1a2003 Folate at baseline, and during 6 years follow-up. Folate was significantly associated[25] Hct with delay recall test, whereas vitamin B12 levels in blood was not associatedThe Netherlands with cognitive impairment
CAMCOG = Cambridge cognitive examination; Hct = Homocysteine; MMSE = Mini-mental state examination

C H A P T E R 12 • V I TA M I N B 12 , F O L I C AC I D A N D H O M O C Y S T E I N E , C O G N I T I V E I M PA I R M E N T A N D A L Z H E I M E R ’ S D I S E A S E
65
Table 12.1 continued
Author Sample Age Blood Main results Quality Year (years) measure of study Reference Country
Stewart et al 248 55–75 Folate Raised Hct was associated with cognitive impairment, 2a2002 Hct but modified by educational level, not by vascular factors[18]United Kingdom
Prins et al 1 077 55+ Hct Elevated Hct was associated with cognitive impairment, 2a2002 most markedly for motor speed[19]The Netherlands
Duthie et al 183 75+ Vitamin B12 Elevated Hct and low B12 was associated with development 1b2002 148 60+ Folate of cognitive decline[20] HctScotland
Dufouil et al 1 241 61–73 Hct Elevated Hct was associated with cognitive impairment as measured 1a2003 by a variety of cognitive tests. The odds for developing cognitive[21] decline after 4 years was 2.8 for the people with the highest levelFrance of homocysteine
Ravaglia et al 650 65+ Vitamin B12 Elevated Hct was associated with cognitive impairment as 2a2003 Folate measured with MMSE. The association was graded and independently[22] Hct of age, medical condition and lifestyle factorsItaly
Miller et al 1 789 60+ Hct A modest inverse association between Hct and a variety of cognitive 1a2003 tests, including MMSE was found (p<0.05)[23]USA
Sachdev et al 385 60–64 Hct Hct level in blood was significantly associated to verbal memory 1a2004 and motor speed. After correction for levels of folate, vitamin B12, [24] creatinine and life-stile factors the association disappearedAustralia
Teunissen et al 144 30+ Vitamin B12 Hct level in blood was significantly associated with cognitive impairment 1a2003 Folate at baseline, and during 6 years follow-up. Folate was significantly associated[25] Hct with delay recall test, whereas vitamin B12 levels in blood was not associatedThe Netherlands with cognitive impairment
CAMCOG = Cambridge cognitive examination; Hct = Homocysteine; MMSE = Mini-mental state examination

D E M E N T I A – D I AG N O S T I C A N D T H E R A P E U T I C I N T E RV E N T I O N S66
Table 12.2 Studies of the relationship between low levels of vitamin B12 or folate, or raised homocysteine in blood and Alzheimer’s disease (AD).
Author Sample Age Blood Clinical criteria Main results Quality Year (years) measure of study Reference Country
Cole et al AD = 20 65+ B12 <150 Roth/Hanchinski 6 of 20 AD patients had low level of B12 values 2b1984 OD = 20 compared to one of 40 without AD[26] Co = 20Canada
Levitt et al AD = 40 68 B12 ≤140 DSM-III-R B12 was significantly associated to MMSE score 2b1992 CIND = 26 72 NINCDS-ADRDA in AD patients, but not in the other groups[27] OD = 31 71Canada
Regland et al De = 102 B12, DSM-III-R B12 differed significantly across groups 2b1992 Co = 32 66 no cutpoint (AD, VaD, OD, controls)[28]Sweden
Kristensen et al AD = 26 73 B12 <135 DSM-III 7 of 26 AD patients had elevated MMA or low 2b1993 OD = 24 59 MMA >0.9 NINCDS-ADRDA level of B12, compared to 4 of 69 without AD[29] Co = 20 73Denmark
Basun et al De = 153 75+ B12 <150 DSM-III-R No differences were found between patients 1a1994 AD = 93 with AD, demented and controls regarding B12. [30] Co = 392 Those living at home had significantly lowerSweden level of B12 compared to the patients in nursing homes
Crystal et al De = 61 75–85 B12 <150 DSM-III-R During 5 years follow-up the incidence of AD 1b1994 Co = 349 NINCDS-ADRDA in patients with low levels of B12 was 4.5%, [31] compared to 7.5% in patients with high levelUSA of B12
Nilsson et al De = 295 77 B12 <110 DSM-III-R Hct was significantly associated with all 2b1996 Co = 215 76 Hct >15 forms of dementia. Patients with VaD or[32] dementia with CVD had the highest levels,Sweden and the control subjects the lowest

C H A P T E R 12 • V I TA M I N B 12 , F O L I C AC I D A N D H O M O C Y S T E I N E , C O G N I T I V E I M PA I R M E N T A N D A L Z H E I M E R ’ S D I S E A S E
67
Table 12.2 Studies of the relationship between low levels of vitamin B12 or folate, or raised homocysteine in blood and Alzheimer’s disease (AD).
Author Sample Age Blood Clinical criteria Main results Quality Year (years) measure of study Reference Country
Cole et al AD = 20 65+ B12 <150 Roth/Hanchinski 6 of 20 AD patients had low level of B12 values 2b1984 OD = 20 compared to one of 40 without AD[26] Co = 20Canada
Levitt et al AD = 40 68 B12 ≤140 DSM-III-R B12 was significantly associated to MMSE score 2b1992 CIND = 26 72 NINCDS-ADRDA in AD patients, but not in the other groups[27] OD = 31 71Canada
Regland et al De = 102 B12, DSM-III-R B12 differed significantly across groups 2b1992 Co = 32 66 no cutpoint (AD, VaD, OD, controls)[28]Sweden
Kristensen et al AD = 26 73 B12 <135 DSM-III 7 of 26 AD patients had elevated MMA or low 2b1993 OD = 24 59 MMA >0.9 NINCDS-ADRDA level of B12, compared to 4 of 69 without AD[29] Co = 20 73Denmark
Basun et al De = 153 75+ B12 <150 DSM-III-R No differences were found between patients 1a1994 AD = 93 with AD, demented and controls regarding B12. [30] Co = 392 Those living at home had significantly lowerSweden level of B12 compared to the patients in nursing homes
Crystal et al De = 61 75–85 B12 <150 DSM-III-R During 5 years follow-up the incidence of AD 1b1994 Co = 349 NINCDS-ADRDA in patients with low levels of B12 was 4.5%, [31] compared to 7.5% in patients with high levelUSA of B12
Nilsson et al De = 295 77 B12 <110 DSM-III-R Hct was significantly associated with all 2b1996 Co = 215 76 Hct >15 forms of dementia. Patients with VaD or[32] dementia with CVD had the highest levels,Sweden and the control subjects the lowest
The table continues on the next page

D E M E N T I A – D I AG N O S T I C A N D T H E R A P E U T I C I N T E RV E N T I O N S68
Table 12.2 continued
Author Sample Age Blood Clinical criteria Main results Quality Year (years) measure of study Reference Country
Joosten et al AD = 52 83 B12 <139 DSM-III-R Hct was significantly higher in AD patients 2b1997 Co = 50 81 Hct >13.9 NINCDS-ADRDA compared to non-demented elderly. MMA[33] Co = 80 80 MMA >247 was higher in AD patients compared to inBelgium institutions Nagga et al AD = 44 78 B12 <135 DSM-IV No differences were found between AD, 2b1998 VaD = 78 80 VaD and OD patients and elderly no-[34] OD = 28 79 demented regarding B12 level in bloodSweden Co = 42 79
Clarke et al AD = 164 73 B12, Hct, folate, NINCDS-ADRDA AD patients with a clinical or pathological IIb 1998 Co = 108 no cutpoint CERAD diagnosis had significantly lower levels of 2b[35] (path) in 76 B12 and folate and higher levels of Hct thanUnited Kingdom the controls
McCaddon et al AD = 30 79 Hct, no cutpoint DSM-III-R Hct was significantly higher in AD 2b1998 Co = 30 patients compared to controls, independently[36] of nutritional statusUnited Kingdom
Lehmann et al AD = 64 64–76 B12 <150 NINCDS-ADRDA Hct was elevated in patients with 2b1999 VaD = 66 77 Hct >15 NINDS-AIREN AD and CIND, and correlated inversely[37] CIND = 108 72 with cognitive performanceSweden Co = 69
Wang et al AD = 60 75+ B12 <150 DSM-IV Low level of B12 and folate was significantly 1a2001 Co = 310 Folate ≤10 associated with development of AD after[38] 3 years Sweden
Tripathi et al AD = 38 62 B12 <157 DSM-IV The prevalence of low level of B12 was 2b2001 VaD = 36 60 NINCDS-ADRDA significantly higher in AD patients (39.5%), [39] OD = 26 58 compared with VaD (13.9%), and OD (11.5%)Italy
Postiglione et al AD = 74 69 B12, Hct, NINCDS-ADRDA Hct was significantly higher and B12 and 2b2001 Co = 74 no cutpoint defined folate lower in AD patients compared to[40] controls. The differences disappeared whenItaly controlling for age, creatinine and duration of dementia

C H A P T E R 12 • V I TA M I N B 12 , F O L I C AC I D A N D H O M O C Y S T E I N E , C O G N I T I V E I M PA I R M E N T A N D A L Z H E I M E R ’ S D I S E A S E
69
Table 12.2 continued
Author Sample Age Blood Clinical criteria Main results Quality Year (years) measure of study Reference Country
Joosten et al AD = 52 83 B12 <139 DSM-III-R Hct was significantly higher in AD patients 2b1997 Co = 50 81 Hct >13.9 NINCDS-ADRDA compared to non-demented elderly. MMA[33] Co = 80 80 MMA >247 was higher in AD patients compared to inBelgium institutions Nagga et al AD = 44 78 B12 <135 DSM-IV No differences were found between AD, 2b1998 VaD = 78 80 VaD and OD patients and elderly no-[34] OD = 28 79 demented regarding B12 level in bloodSweden Co = 42 79
Clarke et al AD = 164 73 B12, Hct, folate, NINCDS-ADRDA AD patients with a clinical or pathological IIb 1998 Co = 108 no cutpoint CERAD diagnosis had significantly lower levels of 2b[35] (path) in 76 B12 and folate and higher levels of Hct thanUnited Kingdom the controls
McCaddon et al AD = 30 79 Hct, no cutpoint DSM-III-R Hct was significantly higher in AD 2b1998 Co = 30 patients compared to controls, independently[36] of nutritional statusUnited Kingdom
Lehmann et al AD = 64 64–76 B12 <150 NINCDS-ADRDA Hct was elevated in patients with 2b1999 VaD = 66 77 Hct >15 NINDS-AIREN AD and CIND, and correlated inversely[37] CIND = 108 72 with cognitive performanceSweden Co = 69
Wang et al AD = 60 75+ B12 <150 DSM-IV Low level of B12 and folate was significantly 1a2001 Co = 310 Folate ≤10 associated with development of AD after[38] 3 years Sweden
Tripathi et al AD = 38 62 B12 <157 DSM-IV The prevalence of low level of B12 was 2b2001 VaD = 36 60 NINCDS-ADRDA significantly higher in AD patients (39.5%), [39] OD = 26 58 compared with VaD (13.9%), and OD (11.5%)Italy
Postiglione et al AD = 74 69 B12, Hct, NINCDS-ADRDA Hct was significantly higher and B12 and 2b2001 Co = 74 no cutpoint defined folate lower in AD patients compared to[40] controls. The differences disappeared whenItaly controlling for age, creatinine and duration of dementia
The table continues on the next page

D E M E N T I A – D I AG N O S T I C A N D T H E R A P E U T I C I N T E RV E N T I O N S70
Table 12.2 continued
Author Sample Age Blood Clinical criteria Main results Quality Year (years) measure of study Reference Country
Seshadri et al De = 111 76 Hct >14 DSM-IV Hct >14 nearly doubled the risk for 1a2002 AD = 83 NINCDS-ADRDA developing AD during follow-up of 8 years[41] Co = 981 (OR 1.8)USA
McIlroy et al AD = 83 77 Hct, no cutpoint NINCDS-ADRDA Hct was elevated significantly in AD, 2b2002 VaD = 78 defined NINDS-AIREN VaD and stroke patients compared to [42] Co = 71 normal controls, also after adjusting for United Kingdom Stroke = 64 vascular factors, nutrition and creatinine
Miller et al AD = 43 78 Hct >12 NINCDS-ADRDA High levels of Hct and low levels of PLP 2b2002 Co = 37 PLP <25 (indicator of vitamin B6 deficiency) was[43] significantly associated with ADUSA
Nilsson et al De = 203 77 B12 <150 DSM-III-R Hct was significantly higher in patients 2b2002 Co = 62 72 Hct >19.9 with VaD and mixed AD/VaD compared[44] to controlsSweden
Selley AD = 25 76 Hct, no cutpoint NINCDS-ADRDA Hct was elevated significantly in AD 2b2003 Co = 25 75 defined DSM-IV patients compared to control people[45]Australia
Religa et al AD = 99 74 B12, Hct, folate, no NINCDS-ADRDA Hct was elevated significantly in AD patients 2b2003 MCI = 98 71 cutpoint defined DSM-IV compared to MCI patients and normal[46] Co = 100 71 controls, and depended on the MTHFR T/TPoland genotype in the presence of low folate levels
Nagga et al AD = 47 75 B12 <200, folate <75 ICD-10 Hct was significantly higher in the AD 2b2003 VaD = 59 78 Hct >18, MMA >0.37 and VaD group compared to the controls. [47] Co = 101 69 MMA was significantly higher in VaD patientsSweden compared to controls
Mizrahi et al AD = 64 74 Hct, no cutpoint NINCDS-ADRDA Hct did not differ significantly 2b2003 Co = 64 defined between AD patients and controls[48]USA

C H A P T E R 12 • V I TA M I N B 12 , F O L I C AC I D A N D H O M O C Y S T E I N E , C O G N I T I V E I M PA I R M E N T A N D A L Z H E I M E R ’ S D I S E A S E
71
Table 12.2 continued
Author Sample Age Blood Clinical criteria Main results Quality Year (years) measure of study Reference Country
Seshadri et al De = 111 76 Hct >14 DSM-IV Hct >14 nearly doubled the risk for 1a2002 AD = 83 NINCDS-ADRDA developing AD during follow-up of 8 years[41] Co = 981 (OR 1.8)USA
McIlroy et al AD = 83 77 Hct, no cutpoint NINCDS-ADRDA Hct was elevated significantly in AD, 2b2002 VaD = 78 defined NINDS-AIREN VaD and stroke patients compared to [42] Co = 71 normal controls, also after adjusting for United Kingdom Stroke = 64 vascular factors, nutrition and creatinine
Miller et al AD = 43 78 Hct >12 NINCDS-ADRDA High levels of Hct and low levels of PLP 2b2002 Co = 37 PLP <25 (indicator of vitamin B6 deficiency) was[43] significantly associated with ADUSA
Nilsson et al De = 203 77 B12 <150 DSM-III-R Hct was significantly higher in patients 2b2002 Co = 62 72 Hct >19.9 with VaD and mixed AD/VaD compared[44] to controlsSweden
Selley AD = 25 76 Hct, no cutpoint NINCDS-ADRDA Hct was elevated significantly in AD 2b2003 Co = 25 75 defined DSM-IV patients compared to control people[45]Australia
Religa et al AD = 99 74 B12, Hct, folate, no NINCDS-ADRDA Hct was elevated significantly in AD patients 2b2003 MCI = 98 71 cutpoint defined DSM-IV compared to MCI patients and normal[46] Co = 100 71 controls, and depended on the MTHFR T/TPoland genotype in the presence of low folate levels
Nagga et al AD = 47 75 B12 <200, folate <75 ICD-10 Hct was significantly higher in the AD 2b2003 VaD = 59 78 Hct >18, MMA >0.37 and VaD group compared to the controls. [47] Co = 101 69 MMA was significantly higher in VaD patientsSweden compared to controls
Mizrahi et al AD = 64 74 Hct, no cutpoint NINCDS-ADRDA Hct did not differ significantly 2b2003 Co = 64 defined between AD patients and controls[48]USA
The table continues on the next page

D E M E N T I A – D I AG N O S T I C A N D T H E R A P E U T I C I N T E RV E N T I O N S72
Table 12.2 continued
Author Sample Age Blood Clinical criteria Main results Quality Year (years) measure of study Reference Country
Quadri et al AD = 74 79 B12, folate, Hct, NINCDS-ADRDA Hct was significantly higher in AD patients 2b2004 MCI = 81 76 Hct >14.6 compared to controls, whereas folate was[49] Co = 55 76 significantly lower in AD and MCI (CDRSwitzerland 0.5) patients
Nilsson et al AD = 159 76 Hct, no cutpoint NINCDS-ADRDA Hct was significantly higher in AD patients 2b2004 Co = 59 75 defined with and without cardiovascular disease[50] compared to controls, after adjustmentSweden for creatinine levels
AD = Alzheimer’s disease; B12 = Vitamin B12; CDR = Clinical dementia rating scale; CIND = Cognitive impairment, no dementia; Co = Non-demented controls; CVD = Cerebrovascular disease; De = Dementia; Hct = Homocysteine; MCI = Mild cognitive impairment; MMA = Methtyl malonic acid; MMSE = Mini-mental state examination; OD = Other dementias; PLP = Indicator of vitamin B6 deficiency; VaD = Vascular dementia

C H A P T E R 12 • V I TA M I N B 12 , F O L I C AC I D A N D H O M O C Y S T E I N E , C O G N I T I V E I M PA I R M E N T A N D A L Z H E I M E R ’ S D I S E A S E
73
Table 12.2 continued
Author Sample Age Blood Clinical criteria Main results Quality Year (years) measure of study Reference Country
Quadri et al AD = 74 79 B12, folate, Hct, NINCDS-ADRDA Hct was significantly higher in AD patients 2b2004 MCI = 81 76 Hct >14.6 compared to controls, whereas folate was[49] Co = 55 76 significantly lower in AD and MCI (CDRSwitzerland 0.5) patients
Nilsson et al AD = 159 76 Hct, no cutpoint NINCDS-ADRDA Hct was significantly higher in AD patients 2b2004 Co = 59 75 defined with and without cardiovascular disease[50] compared to controls, after adjustmentSweden for creatinine levels

D E M E N T I A – D I AG N O S T I C A N D T H E R A P E U T I C I N T E RV E N T I O N S74
AD = Alzheimer’s disease; DB = Double blind; MCI = Mild cognitive impairment; MMSE = Mini-mental state examination; NB = Not blinded; OD = Other dementias; RCT = Randomized controlled trial
Table 12.3 Treatment with vitamin B12 or folate in patients with cognitive impairment or dementia.
AuthorYearReferenceCountry
Design Sample Clinical criteria
Treatment Main results
Fioravanti et al1997[4]Italy
DB-RCT N = 30 MMSE <20ads staging
Folate for 2 months No effects as measured by a variety of cognitive tests
Kwok et al1998[3]Hong Kong
NB-RCT N = 50 MMSE <20 B12 for 6 months No effects as measured by MMSE and a variety of cognitive tests
Clarke et al2003[5]United Kingdom
DB-RCT2x2x2factorial design
N = 147AD = 84OD = 12MCI = 51
DSM-IV B12 and folate for 12 weeks No effects as measured by MMSE and other tests

C H A P T E R 12 • V I TA M I N B 12 , F O L I C AC I D A N D H O M O C Y S T E I N E , C O G N I T I V E I M PA I R M E N T A N D A L Z H E I M E R ’ S D I S E A S E
75
Table 12.3 Treatment with vitamin B12 or folate in patients with cognitive impairment or dementia.
AuthorYearReferenceCountry
Design Sample Clinical criteria
Treatment Main results
Fioravanti et al1997[4]Italy
DB-RCT N = 30 MMSE <20ads staging
Folate for 2 months No effects as measured by a variety of cognitive tests
Kwok et al1998[3]Hong Kong
NB-RCT N = 50 MMSE <20 B12 for 6 months No effects as measured by MMSE and a variety of cognitive tests
Clarke et al2003[5]United Kingdom
DB-RCT2x2x2factorial design
N = 147AD = 84OD = 12MCI = 51
DSM-IV B12 and folate for 12 weeks No effects as measured by MMSE and other tests

D E M E N T I A – D I AG N O S T I C A N D T H E R A P E U T I C I N T E RV E N T I O N S76
1. Knopman DS, et al. Practice parameter: diagnosis of dementia (an evidence-based review). Report of the Quality Standards Subcommittee of the American Academy of Neurology. Neurology 2001;56:1143-53.
2. Wahlund LO, Basun H, Waldemar G. Reversible or arrestable dementias, in Evidence-based dementia practice. Editors. 2002, Blackwell Science: Oxford. p 330-40.
3. Kwok T, et al. Randomized trial of the effect of supplementation on the cognitive function of older people with subnormal cobalamin levels. Int J Geriatr Psychiatry 1998;13:611-6.
4. Fioravanti M, et al. Low folate levels in the cognitive decline of elderly patients and efficacy of folate as a treatment for improv-ing memory deficits. Arch Gerontol Geriatr 1997;26:1-13.
5. Clarke R, Harrison G, Richards S. Effect of vitamins and aspirin on mark-ers of platelet activation, oxidative stress and homocysteine in people at high risk of dementia. J Intern Med 2003;254:67-75.
6. Sommer BR, Hoff AL, Costa M. Folic acid supplementation in dementia a preliminary report. J Geriatrc Psychiatry Neurol 2003;16:156-9.
7. van Asselt DZ, et al. Cobalamin supple-mentation improves cognitive and cerebral function in older, cobalamin-deficient people. J Gerontol A Biol Sci Med Sci 2001;56:M775-9.
8. Seal EC, et al. A randomized, double-blind, placebo-controlled study of oral
vitamin B12 supplementation in older pateints with subnormal or borderline vitamin B12 concentrations. J Am Geriatr Soc 2002;50:146-51.
9. Bryan J, Calvaresi E, Hughes D. Short-term folate, vitamin B-12 or vitamin B-6 supplementation slightly affects memory performance but not mood in women of various ages. J Nutr 2002;132:1345-56.
10. Goodwin JS, Goodwin JM, Garry PJ. Association between nutritional status and cognitive functioning in a healthy elderly population. JAMA 1983;249:2917-21.
11. Riggs KM, et al. Relations of vitamin B-12, vitamin B-6, folate, and homo-cysteine to cognitive performance in the Normative Aging Study. Am J Clin Nutr 1996;63:306-14.
12. Kalmijn S, et al. Total homocysteine and cognitive decline in a commu-nity-based sample of elderly subjects: the Rotterdam Study. Am J Epidemiol 1999;150:283-9.
13. Lindeman RD, et al. Serum vitamin B12, C and folate concentrations in the New Mexico elder health survey: correla-tions with cognitive and affective func-tions. J Am Coll Nutr 2000;19:68-76.
14. Budge M, et al. Plasma total homo-cysteine and cognitive performance in volunteer elderly population. Anns N Y Acad Sci 2000;903:407-10.
15. Robins Wahlin TB, et al. The influence of serum vitamin B12 and folate status on cognitive functioning in very old age. Biol Psychol 2001;56:247-65.
References

C H A P T E R 12 • V I TA M I N B 12 , F O L I C AC I D A N D H O M O C Y S T E I N E , C O G N I T I V E I M PA I R M E N T A N D A L Z H E I M E R ’ S D I S E A S E
77
16. McCaddon A, et al. Homocysteine and cognitive decline in healthy elderly. Dement Geriatr Cogn Disord 2001; 12:309-13.
17. Morris MS, et al. Hyperhomocysteine-mia associated with poor recall in the third National Health and Nutrition Examina-tion Survey. Am J Clin Nutr 2001;73:927-33.
18. Stewart R, Asonganyi B, Sherwood R. Plasma homocysteine and cognitive impair-ment in an older British African-Caribean population. J Am Geriatr Soc 2002;50: 1227-32.
19. Prins ND, et al. Homocysteine and cognitive function in the elderly: the Rotterdam Scan Study. Neurology 2002; 59:1375-80.
20. Duthie SJ, et al. Homocysteine, B vita-min status, and cognitive function in the elderly. Am J Clin Nutr 2002;75:908-13.
21. Dufouil C. et al. Homocysteine, white matter hyperintensities, and cognition in healthy elderly people. Ann Neurol 2003;53:214-21.
22. Ravaglia G, et al. Homocysteine and cognitive function in healthy elderly com-munity dwellers in Italy. Am J Clin Nutr 2003;77:668-73.
23. Miller JW, et al. Homocysteine and cognitive function in the Sacramento Area Latino Study on Aging. Am J Clin Nutr 2003;78:441-7.
24. Sachdev P, et al. Homocysteine and the brain in midadult life: evidence for an increased risk of leukoaraiosis in men. Arch Neurol 2004;61:1369-76.
25. Teunissen CE, et al. Homocysteine: a marker for cognitive performance? A lon-gitudinal follow-up study. J Nutr Health Aging 2003;7:153-9.
26. Cole MG, Prchal JF. Low serum vita-min B12 in Alzheimer-type dementia. Age Ageing 1984;13:101-5.
27. Levitt AJ, Karlinsky H. Folate, vitamin B12 and cognitive impairment in patients with Alzheimer’s disease. Acta Psychiatr Scand 1992;86:301-5.
28. Regland B, et al. Vitamin B12 in CSF: reduced CSF/serum B12 ratio in demented men. Acta Neurol Scand 1992;85:276-81.
29. Kristensen MO, et al. Serum cobala-min and methylmalonic acid in Alzheimer dementia. Acta Neurol Scand 1993;87: 475-81.
30. Basun H, Fratiglioni L, Winblad B. Cobalamin levels are not reduced in Alzheimer’s disease: results from a Population based study. J Am Geriatr Soc 1994;42:132-6.
31. Crystal HA, et al. Serum vitamin B12 levels and incidence of dementia in a healthy elderly population: a report from the Bronx longitudinal aging study. J Am Geriatr Soc 1994;42:933-6.
32. Nilsson K, et al. Hyperhomocystein-aemia – a common finding in a psycho-geriatric population. Eur J Clin Invest 1996;26:853-9.
33. Joosten E, et al. Is metabolic evidence for vitamin B-12 and folate deficiency more frequent in elderly patients with Alzheimer’s disease? J Gerontol A Biol Sci Med Sci 1997;52:M76-9.

D E M E N T I A – D I AG N O S T I C A N D T H E R A P E U T I C I N T E RV E N T I O N S78
34. Nagga AK, Marcusson J. Associated physical disease in a demented population. Aging (Milano) 1998;10:440-4.
35. Clarke R, et al. Folate, vitamin B12, and serum total homocysteine levels in confirmed Alzheimer disease. Arch Neurol 1998;55:1449-55.
36. McCaddon A, et al. Total serum homo-cysteine in senile dementia of Alzheimer type. Int J Geriatr Psychiatry 1998;13: 235-9.
37. Lehmann M, Gottfries CG, Regland B. Identification of cognitive impairment in the elderly: homocysteine is an early marker. Dement Geriatr Cogn Disord 1999;10:12-20.
38. Wang HX et al. Vitamin B(12) and folate in relation to the develop-ment of Alzheimer’s disease. Neurology 2001;56:1188-94.
39. Tripathi M et al. Serum cobalamin levels in dementias. Neurol India 2001; 49:284-6.
40. Postiglione A et al. Plasma folate, vit- amin B(12), and total homocysteine and homozygosity for the C677T mutation of the 5,10-methylene tetrahydrofolate reduc- tase gene in patients with Alzheimer’s de-mentia. A case-control study. Gerontology 2001;47:324-9.
41. Seshadri S et al. Plasma homocysteine as a risk factor for dementia and Alzheim-er’s disease. N Engl J Med 2002;346: 476-83.
42. McIlroy SP et al. Moderately elevated plasma homocysteine, methylenetetrahy-drofolate reductase genotype, and risk for stroke, vascular dementia, and Alzhe-
imer disease in Northern Ireland. Stroke 2002;33:2351-6.
43. Miller JW et al. Homocysteine, vitamin B6, and vascular disease in AD patients. Neurology 2002;58:1471-5.
44. Nilsson K, Gustafson L, Hultberg B. Relation between plasma homocysteine and Alzheimer’s disease. Dement Geriatr Cogn Disord 2002;14:7-12.
45. Selley ML. Increased concentrations of homocysteine and asymmetric dimethy-larginine and decreased concentrations of nitric oxide in the plasma of patients with Alzheimer’s disease. Neurobiol Aging 2003;24:903-7.
46. Religa D, et al. Homocysteine, apolipo-proteine E and methylenetetrahydrofolate reductase in Alzheimer’s disease and mild cognitive impairment. Dement Geriatr Cogn Disord 2003;16:64-70.
47. Nagga K, et al. Cobalamin, folate, methylmalonic acid, homocysteine, and gastritis markers in dementia. Dement Geriatr Cogn Disord 2003;16:269-75.
48. Mizrahi EH, et al. Plasma total ho-mocysteine levels, dietary vitamin B6 and folate intake in AD and healthy aging. J Nutr Health Aging 2003;7:160-5.
49. Quadri P, et al. Homocysteine, folate, and vitamin B-12 in mild cognitive impair-ment, Alzheimer disease, and vascular dementia. Am J Clin Nutr 2004;80: 114-22.
50. Nilsson K, Gustafson L, Hultberg B. Plasma homocysteine concentration relates to the severity but not to the dura-tion of Alzheimer’s disease. Int J Geriatr Psychiatry 2004;19:666-72.

C H A P T E R 13 • E V I D E N C E F O R T E S T S T H AT C A N B E U S E D TO D I AG N O S E D E M E N T I A 79
13. Evidence for Tests that can be used to Diagnose Dementia
Informant interview in the diagnostic evaluation of patients with dementia
BackgroundThe inclusion of caregivers in the management of patients with demen-tia has obvious advantages. As for the diagnostic process, the initial interview of a patient with possible dementia will often include an interview with a caregiver. During the interview, important information about prior disease, medication, etc, can be checked and supplemented. Furthermore, the caregiver can often contribute important information about current condition and symptoms and has often noticed changes in the patient for a very long time. Brief cognitive tests, such as the MMSE, are used widely in screening for dementia. Informant reports on cogni- tive function and its impact on everyday life may provide relevant supp-lementary data for the detection of dementia. The advantages of inclu-ding a caregiver/informant interview are many:
• The patient may have reduced awareness of symptoms• Relevance to everyday life• Greater international cross-cultural and cross-educational
applicability• Direct assessment of changes from earlier stages in life• Possibility of assessment by mail or phone.
However, there are also disadvantages associated with the use of care-giver interviews: the results depend on the extent and quality of the rela-tionship between the patient and the caregiver, as well as the emotional state of the caregiver. Finally, a significant number of patients do not have a reliable caregiver. A series of questionnaires have been developed to quantify caregiver data. The aim of this review was to identify evid-

D E M E N T I A – D I AG N O S T I C A N D T H E R A P E U T I C I N T E RV E N T I O N S80
ence for the use of structured informant interviews as a diagnostic aid in patients with possible dementia. “Evidence-based Dementia Practice” did not review the evidence for the use of caregiver interviews [1].
Literature search
A search was planned for papers that describe the use of structured informant interviews in the diagnosis of dementia.
Search strategy“Informant” [Title] AND “dementia” [Title] OR“Dementia” [MeSH Terms] AND “Caregivers” [MeSH Terms]AND“Interview” OR “Interviews” OR “Interviewing” [Text Words] AND“Diagnosis” [MeSH Subheading] OR “Screening” [Text Word] Limits: English language.
Results
Fiftyfive papers were found. Based on a review of titles and abstracts, 37 papers were excluded, mainly due to lack of relevance to the topic or the fact that it was not an original research paper. The remaining 18 potentially relevant papers were reviewed in more detail. One was a meta-analysis of previous studies, and 5 were not relevant or did not contain sufficient data. The evidence in the remaining 12 original papers, all of which presented data from which the sensitivity, speci- ficity, and likelihood ratio could be derived, were reviewed and cate- gorized along with other reports identified from citations in the papers (see Table 13.1).

C H A P T E R 13 • E V I D E N C E F O R T E S T S T H AT C A N B E U S E D TO D I AG N O S E D E M E N T I A 81
Comments
The likelihood ratio in the studies with the highest quality ranged from 2 to 8, indicating a moderate impact on the diagnosis to separate AD patients from controls. Due to a lack of studies, there is little evidence for the predictive value of informant interviews in patients with MCI.
The brief structured caregiver interviews deserve to be used more fre-quently and may serve as a supplement to brief cognitive tests in primary health care.

D E M E N T I A – D I AG N O S T I C A N D T H E R A P E U T I C I N T E RV E N T I O N S82
Table 13.1 Studies on the diagnostic value of a structured informant interview in dementia. All studies with presentation of data, which enabled the calculation of sensitivity (SS), specificity (SP), and a positive likelihood ratio (LR+).
AuthorYearReferenceCountry
Name of interview/scale (num-ber of items)
Sample (N)
Age mean (year)*
Population/selection
Setting Diagnostic criteria
Condition SS%
SP%
LR+ LR– Quality of study
Reviewers’ comments
Krishnan et al2001[2] USA
BCS (18) NDEM = 66NMCI = 28NCON = 26
73.274.172.8
Other study populationsSelection?
University hospital
AD: NINCDS-ADRDAVaD: ?MCI: ?
Dementia vs controlMCI vs control
80
80
90
80
8.0
4.0
0.22
0.22
2b Small samples, no follow-up in MCI, criteria and selection not well descri-bed. Independent rater? Diagnostic classification not performed as a part of the study
Jorm et al1989[3]Australia
IQCODE (26) NAD = 362NCON = 613
NA Volunteer sample from general popu-lation and informants to AD patients from Alzheimer Association
Population study
NA Dementia vs general population
92.7 88.1 7.8 0.03 2a Cut-off score 4.5.7% in the control sample said they were reporting on a person with dementia. Diagnostic classification was not performed
Morales et al1995[4]Spain
S-IQCODE (26) NDEM = 7NCON = 61
74.872.9
Populationbased study
Population DSM-III-R Mild dementia vs controls
86 92 10.8 0.15 1b Independent rater.Small sample
Del-Ser et al1997[5]Spain
S-IQCODE (26) NDEM = 38(AD:24)NNOTDEM = 15
69.1ConsecutiveReferrals for possible demen-tia
Clinical settingoutpatients
DSM-III-R Dementia vs not demen-ted patientsS-IQCODEMMSE and S-IQCODE
8484
7393
3.112.0
0.22
1b Independent rater.Cut-off score 94.Small sample
Koss et al1993[6]USA
MSRQ (32) NAD = 83NCON = 39
72.470.1
All patients and healthy con-trols in an AD research center registry
Clinical setting NINCDS-ADRDA
AD vs control
94 100 NA 0.06 2b Control subjects completed the questionnaire on their own. Controls were also caregivers to patients. Cut-off score 40. Diagnostic classification was not part of the study

C H A P T E R 13 • E V I D E N C E F O R T E S T S T H AT C A N B E U S E D TO D I AG N O S E D E M E N T I A 83
Table 13.1 Studies on the diagnostic value of a structured informant interview in dementia. All studies with presentation of data, which enabled the calculation of sensitivity (SS), specificity (SP), and a positive likelihood ratio (LR+).
AuthorYearReferenceCountry
Name of interview/scale (num-ber of items)
Sample (N)
Age mean (year)*
Population/selection
Setting Diagnostic criteria
Condition SS%
SP%
LR+ LR– Quality of study
Reviewers’ comments
Krishnan et al2001[2] USA
BCS (18) NDEM = 66NMCI = 28NCON = 26
73.274.172.8
Other study populationsSelection?
University hospital
AD: NINCDS-ADRDAVaD: ?MCI: ?
Dementia vs controlMCI vs control
80
80
90
80
8.0
4.0
0.22
0.22
2b Small samples, no follow-up in MCI, criteria and selection not well descri-bed. Independent rater? Diagnostic classification not performed as a part of the study
Jorm et al1989[3]Australia
IQCODE (26) NAD = 362NCON = 613
NA Volunteer sample from general popu-lation and informants to AD patients from Alzheimer Association
Population study
NA Dementia vs general population
92.7 88.1 7.8 0.03 2a Cut-off score 4.5.7% in the control sample said they were reporting on a person with dementia. Diagnostic classification was not performed
Morales et al1995[4]Spain
S-IQCODE (26) NDEM = 7NCON = 61
74.872.9
Populationbased study
Population DSM-III-R Mild dementia vs controls
86 92 10.8 0.15 1b Independent rater.Small sample
Del-Ser et al1997[5]Spain
S-IQCODE (26) NDEM = 38(AD:24)NNOTDEM = 15
69.1ConsecutiveReferrals for possible demen-tia
Clinical settingoutpatients
DSM-III-R Dementia vs not demen-ted patientsS-IQCODEMMSE and S-IQCODE
8484
7393
3.112.0
0.22
1b Independent rater.Cut-off score 94.Small sample
Koss et al1993[6]USA
MSRQ (32) NAD = 83NCON = 39
72.470.1
All patients and healthy con-trols in an AD research center registry
Clinical setting NINCDS-ADRDA
AD vs control
94 100 NA 0.06 2b Control subjects completed the questionnaire on their own. Controls were also caregivers to patients. Cut-off score 40. Diagnostic classification was not part of the study
The table continues on the next page

D E M E N T I A – D I AG N O S T I C A N D T H E R A P E U T I C I N T E RV E N T I O N S84
Table 13.1 continued
AuthorYearCountryReference
Name of interview/scale (num-ber of items)
Sample (N)
Age mean (year)*
Population/selection
Setting Diagnostic criteria
Condition SS%
SP%
LR+ LR– Quality of study
Reviewers’ comments
Mulligan et al1996[7]Switzerland
IQCODE (26) NDEM = 33NDEPR = 11NDEPR+DEM = 2NOTHER = 30 81.8
Referred patients
Geriatric hospital
DSM-III-R Dementia vs not dementia
76 70 2.5 0.34 1a Cut off 3.6.Independent observer?
Morales et al1997[8]Spain
S-IQCODE (26) Urban: 97(NDEM = 11)Rural: 160(NDEM = 23)
75.2
73.5
Population based study
Population study
DSM-III-R Dementia vs not dementia
8283
9083
8.24.9
0.20.23
1a Cut-off 85/86
Ritchie et al1992[9] France
DECO (19) NDEM = 155NCON = 120 146>80
Recruited from different sources
DSM-III Dementia vs not dementia
90 80 4.5 0.13 1a Cut-off 31/32
Fuh et al1995[10] China
IQCODE (26) NDEM = 61NCON = 399
73.368.1
Population based study.Illiterate sub-jects
From commu-nity sources and memory clinic
DSM-III-R Dementia vs not dementia
89 88 7.4 1a Cut-off 3.4.Cases and controls were from two different popu-lations
Mackinnon et al1998[11]Switzerland
IQCODE (16) NDEM = 58NDEPR = 9NDEPR+DEM = 2NOTHER = 28 80.3
Hospital patients (selection?)
Geriatric hospital
DSM-IV Dementia vs not dementiaIQCODEMMSE and IQCODE
9086
6585
2.65.7
0.150.16
1a IQCODE cut-off score 3.6.MMSE cut-off 25.Independent observer.Cross sectional study.No information about informants
Carr et al 2000[12]USA
One simple question
NCDR0 = 158NCDR0.5 = 165NCDR0.5 = 159
77.074.473.2
Prospective with 2–5 years follow-up
University AD research center
Clinician evaluation
Dementia vs not dementia
92 86 6.6 0.09 1a Informant reported memory loss also predicted future diagnosis of AD
Jorm et al1991[13]Australia
IQCODE N = 29NCON = 40
80.0 Hospital and clinic
DSM-III-R Dementia vs not dementia
69 80 3.5 0.38

C H A P T E R 13 • E V I D E N C E F O R T E S T S T H AT C A N B E U S E D TO D I AG N O S E D E M E N T I A 85
AuthorYearCountryReference
Name of interview/scale (num-ber of items)
Sample (N)
Age mean (year)*
Population/selection
Setting Diagnostic criteria
Condition SS%
SP%
LR+ LR– Quality of study
Reviewers’ comments
Mulligan et al1996[7]Switzerland
IQCODE (26) NDEM = 33NDEPR = 11NDEPR+DEM = 2NOTHER = 30 81.8
Referred patients
Geriatric hospital
DSM-III-R Dementia vs not dementia
76 70 2.5 0.34 1a Cut off 3.6.Independent observer?
Morales et al1997[8]Spain
S-IQCODE (26) Urban: 97(NDEM = 11)Rural: 160(NDEM = 23)
75.2
73.5
Population based study
Population study
DSM-III-R Dementia vs not dementia
8283
9083
8.24.9
0.20.23
1a Cut-off 85/86
Ritchie et al1992[9] France
DECO (19) NDEM = 155NCON = 120 146>80
Recruited from different sources
DSM-III Dementia vs not dementia
90 80 4.5 0.13 1a Cut-off 31/32
Fuh et al1995[10] China
IQCODE (26) NDEM = 61NCON = 399
73.368.1
Population based study.Illiterate sub-jects
From commu-nity sources and memory clinic
DSM-III-R Dementia vs not dementia
89 88 7.4 1a Cut-off 3.4.Cases and controls were from two different popu-lations
Mackinnon et al1998[11]Switzerland
IQCODE (16) NDEM = 58NDEPR = 9NDEPR+DEM = 2NOTHER = 28 80.3
Hospital patients (selection?)
Geriatric hospital
DSM-IV Dementia vs not dementiaIQCODEMMSE and IQCODE
9086
6585
2.65.7
0.150.16
1a IQCODE cut-off score 3.6.MMSE cut-off 25.Independent observer.Cross sectional study.No information about informants
Carr et al 2000[12]USA
One simple question
NCDR0 = 158NCDR0.5 = 165NCDR0.5 = 159
77.074.473.2
Prospective with 2–5 years follow-up
University AD research center
Clinician evaluation
Dementia vs not dementia
92 86 6.6 0.09 1a Informant reported memory loss also predicted future diagnosis of AD
Jorm et al1991[13]Australia
IQCODE N = 29NCON = 40
80.0 Hospital and clinic
DSM-III-R Dementia vs not dementia
69 80 3.5 0.38
The table continues on the next page

D E M E N T I A – D I AG N O S T I C A N D T H E R A P E U T I C I N T E RV E N T I O N S86
AuthorYearCountryReference
Name of interview/scale (num-ber of items)
Sample (N)
Age mean (year)*
Population/selection
Setting Diagnostic criteria
Condition SS%
SP%
LR+ LR– Quality of study
Reviewers’ comments
Jorm1994[14]Australia
IQCODE N = 52NCON = 632
77.0 Community DSM-III-R Dementia vs not dementia
79 83 4.6 0.25
Law et al1995[15]Canada
IQCODE N = 49NCON = 114
81.0 Community NINCDS + ICD-10
Dementia vs not dementia
76 96 19 0.25
Jorm et al 1996[16]Australia
IQCODE N = 24NCON = 120
73.0 Community ICD-9 Dementia vs not dementia
79 65 2.3 0.32
Harwood et al1997[17]United Kingdom
IQCODE N = 21NCON = 180
76.0 Hospital DSM-III-R Dementia vs not dementia
100 86 7.1 0
None of the studies had neuropathological confirmation of diagnosis.* Age for index cases/controls/patients.
AD = Alzheimer’s disease; BCS = Behavioral cognitive scale; CDR = Clinical dementia rating scale; CON = Controls; DECO = Détérioration cognitive observée [9]; DEM = Dementia; DEPR = Depression; IQCODE = Informant questionnaire on cognitive decline in the elderly [3]; MCI = Mild cognitive impairment; MMSE = Mini-mental state examina-tion; MSRQ = Memory self report questionnaire [18]; NA = Not applicable; S-IQCODE = Spanish version of the IQCODE; VaD = Vascular dementia
Table 13.1 continued

C H A P T E R 13 • E V I D E N C E F O R T E S T S T H AT C A N B E U S E D TO D I AG N O S E D E M E N T I A 87
AuthorYearCountryReference
Name of interview/scale (num-ber of items)
Sample (N)
Age mean (year)*
Population/selection
Setting Diagnostic criteria
Condition SS%
SP%
LR+ LR– Quality of study
Reviewers’ comments
Jorm1994[14]Australia
IQCODE N = 52NCON = 632
77.0 Community DSM-III-R Dementia vs not dementia
79 83 4.6 0.25
Law et al1995[15]Canada
IQCODE N = 49NCON = 114
81.0 Community NINCDS + ICD-10
Dementia vs not dementia
76 96 19 0.25
Jorm et al 1996[16]Australia
IQCODE N = 24NCON = 120
73.0 Community ICD-9 Dementia vs not dementia
79 65 2.3 0.32
Harwood et al1997[17]United Kingdom
IQCODE N = 21NCON = 180
76.0 Hospital DSM-III-R Dementia vs not dementia
100 86 7.1 0
None of the studies had neuropathological confirmation of diagnosis.* Age for index cases/controls/patients.
AD = Alzheimer’s disease; BCS = Behavioral cognitive scale; CDR = Clinical dementia rating scale; CON = Controls; DECO = Détérioration cognitive observée [9]; DEM = Dementia; DEPR = Depression; IQCODE = Informant questionnaire on cognitive decline in the elderly [3]; MCI = Mild cognitive impairment; MMSE = Mini-mental state examina-tion; MSRQ = Memory self report questionnaire [18]; NA = Not applicable; S-IQCODE = Spanish version of the IQCODE; VaD = Vascular dementia

D E M E N T I A – D I AG N O S T I C A N D T H E R A P E U T I C I N T E RV E N T I O N S88
1. Qizilbash N, Schneider L, Chui H, Tariot P, Brodaty H, Kaye J, et al. Evid-ence-based Dementia Practice. Blackwell Publishing Company, UK; 2002.
2. Krishnan KR, Levy RM, Wagner HR, Chen G, Gersing K, Doraiswamy PM. Informant-rated cognitive symptoms in normal aging, mild cognitive impairment, and dementia. Initial development of an informant-rated screen (Brief Cognitive Scale) for mild cognitive impairment and dementia. Psychopharmacol Bull 2001;35: 79-88.
3. Jorm AF, Jacomb PA. The Informant Questionnaire on Cognitive Decline in the Elderly (IQCODE): socio-demogra-phic correlates, reliability, validity and some norms. Psychol Med 1989;19: 1015-22.
4. Morales JM, Gonzalez-Montalvo JI, Bermejo F, Del-Ser T. The screening of mild dementia with a shortened Spanish version of the “Informant Questionnaire on Cogni-tive Decline in the Elderly”. Alzheimer Dis Assoc Disord 1995;9:105-11.
5. Del-Ser T, Morales JM, Barquero MS, Canton R, Bermejo F. Application of a Spanish version of the “Informant Ques-tionnaire on Cognitive Decline in the Eld-erly” in the clinical assessment of dementia. Alzheimer Dis Assoc Disord 1997;11:3-8.
6. Koss E, Patterson MB, Ownby R, Stuckey JC, Whitehouse PJ. Memory evaluation in Alzheimer’s disease. Care-givers’ appraisals and objective testing. Arch Neurol 1993;50:92-7.
7. Mulligan R, Mackinnon A, Jorm AF, Giannakopoulos P, Michel JP. A compari-son of alternative methods of screening for dementia in clinical settings. Arch Neurol 1996;53:532-6.
8. Morales JM, Bermejo F, Romero M, Del-Ser T. Screening of dementia in community-dwelling elderly through informant report. Int J Geriatr Psychiatry 1997;12:808-16.
9. Ritchie K, Fuhrer R. A comparative study of the performance of screening tests for senile dementia using receiver operating characteristics analysis. J Clin Epidemiol 1992;45:627-37.
10. Fuh JL, Teng EL, Lin KN, Larson EB, Wang SJ, Liu CY, et al. The Informant Questionnaire on Cognitive Decline in the Elderly (IQCODE) as a screening tool for dementia for a predominantly illiterate Chinese population. Neurology 1995;45: 92-6.
11. Mackinnon A, Mulligan R. Combining cognitive testing and informant report to increase accuracy in screening for demen-tia. Am J Psychiatry 1998;155:1529-35.
12. Carr D, Gray S, Baty J, Morris JC. The value of informant versus individual’s complaints of memory impairment in early dementia. Neurology 2000;55:1724-6.
13. Jorm AF, Scott R, Cullen JS, MacKinnon AJ. Performance of the Inform-ant Questionnaire on Cognitive Decline in the Elderly (IQCODE) as a screening test for dementia. Psychol Med 1991;21:785-90.
References

C H A P T E R 13 • E V I D E N C E F O R T E S T S T H AT C A N B E U S E D TO D I AG N O S E D E M E N T I A 89
14. Jorm AF. A short form of the Inform-ant Questionnaire on Cognitive Decline in the Elderly (IQCODE): development and cross-validation. Psychol Med 1994; 24:145-53.
15. Law S, Wolfson C. Validation of a French version of an informant-based questionnaire as a screening test for Alzheimer’s disease. Br J Psychiatry 1995;167:541-4.
16. Jorm AF, Christensen H, Henderson AS, Jacomb PA, Korten AE, Mackinnon
A. Informant ratings of cognitive decline of elderly people: relationship to longitudi-nal change on cognitive tests. Age Ageing 1996;25:126-9.
17. Harwood D, Hope T, Jacoby R. Cogni-tive impairment in medical inpatients I: Screening for dementia – is history better than mental state? Age Ageing 1997;26: 31-5.
18. Riege W, Kelly, K, Klane, L. T. Age and error differences on Memory-for-De-signs. Percept Mot Skills 1981;52:507-13.


C H A P T E R 14 • N E U R O P S YC H O LO G I C A L T E S T S A S A D I AG N O S T I C M A R K E R O F D E M E N T I A
91
14. Neuropsychological Tests as a Diagnostic Marker of Dementia
Conclusion
There is strong evidence that neuropsychological tests contribute sub-stantially to the diagnosis of dementia and AD (Alzheimer’s disease). Because few accepted studies compare the diagnostic entity of MCI with dementia or AD, or relate it to healthy individuals, no conclusions can be stated on this issue.
Introduction
Chapter II.3.1 and II.4.4 of “Evidence-based Dementia Practice” descri-be state-of-the-art research regarding evidence-based evaluation of neuro-psychological tests as a means for predicting dementia [1]. In addition, there are a number of review articles on this issue [2,3]. These studies typically make use of various methods for evaluation. Many review studies refer to the likelihood ratio (LR). However, methods other than LR are frequently utilized as well. In these studies, regression analysis or predictive value or validity may be used as the operational means of evaluation [4].
Aim
The aim was to perform a systematic review of (sets of or single) neuro-psychological tests in order to predict dementia or allow a differential diagnosis of dementia.

D E M E N T I A – D I AG N O S T I C A N D T H E R A P E U T I C I N T E RV E N T I O N S92
Search strategy
A prerequisite for the present study is the definition of a neuropsycho-logical test. It is defined as a task-based assessment of cognitive func-tion, including documented scaling properties and norms that refer to a normal population. The search was performed on neuropsychological tests in the Medline database using a search profile (description) to cover research from 1966 through July 2004.
DementiaANDNeuropsychological TestsWechsler ScalesPsychiatric Status Rating ScalesMMSE [Text Word]ANDSensitivity and SpecificitySensitivity [Text Word]Specificity [Text Word]Accuracy [Text Word]NOT Letter [Publication Type]Editorial [Publication Type]Review [Publication Type]Case Report
Description of studies included and excluded
There were 399 articles found subjected to a selection procedure. First, all studies lacking information on sensitivity and specificity were exclu-ded. The remaining studies were evaluated with regard to methodologi-cal quality as described in Methods. Studies were excluded due primarily to a lack of comprehensiveness (at least 4 out of 6 domains: general, verbal, spatial, executive, attention and memory) of cognitive domains assessed (n = 27), as well as the absence of brain imaging (n = 15) and

C H A P T E R 14 • N E U R O P S YC H O LO G I C A L T E S T S A S A D I AG N O S T I C M A R K E R O F D E M E N T I A
93
insufficiently comprehensive clinical investigation (n = 11). Nine studies were ultimately included. Worth noting is that the selection procedure excluded studies, such as MMSE, and DRS, that use screening tests to assess cognitive function. A separate section entitled “Single tests as a diagnostic marker of dementia” deals with this topic.
The majority of accepted studies compared two or more levels of cog-nitive deterioration, starting with 1) unimpaired cognitive function and followed by 2) very mild and mild cognitive impairment and 3) pro-nounced cognitive deficits in moderate and severe dementia. Groups of patients with unspecified dementia were compared with controls (n = 3). Alternatively, patients with specified dementia (AD) were compared with controls (n = 5). Another group of studies investigated stages in the course of the disease. For instance, the focus might be on the transition from unimpaired to impaired cognitive function (n = 1), most often referred to as MCI. Worth noting is that the certainty of unimpaired cognitive function varies a good deal. Some studies include rigorous health screening, whereas others use a screening procedure or no evalua-tion of health status, although stating that the participants have normal cognitive function.
A minority of accepted studies concerned two or more diseases, such as a comparison of AD and VaD or AD and FTD.
Results
The mean and confidence interval of LR+ and LR– for various contrasts appear in Table 14.1.
The results (Table 14.1) indicate that strict methodological requirements left very few studies for our evidence-based assessment. In particular, few studies using neuropsychological methods are based on a definite neuro-pathological diagnosis. Furthermore, no studies were found that met the methodological requirements for specific dementia diseases other than AD. These findings may serve as a reminder for researchers to consider

D E M E N T I A – D I AG N O S T I C A N D T H E R A P E U T I C I N T E RV E N T I O N S94
the design of future studies in order to ensure valuable and reliable in- formation on diagnosis that uses neuropsychological methods. However, we should point out that many excluded studies contain valuable infor-mation that largely agree with the conclusion presented in this review.
Discussion
A number of concerns will be discussed briefly: the contrast between groups that were compared, the arbitrariness of cut-off in the predictor variable, and group-based vs individual-based prediction of impairment.
A major problem concerns the degree of deterioration in clinical groups and the possible enrichment of the control group with regard to health status. The contrast between the studied clinic group and the control group may be enhanced by selecting a more advanced disease group. Similarly, the selection of a healthy control group may further increase the contrast. Choosing groups that differ markedly in terms of cogni-tive function may make the resulting likelihood ratio very large, while the diagnostic value may be relatively low. On the other hand, when the contrast between groups in terms of cognitive function is relatively modest, the value of a diagnostic method may be high even when the likelihood ratio indicates a low level of diagnostic power.
In the neuropsychological assessment of individuals, there is no con-sensus regarding the cut-off level for abnormal test results. In relation to the normal distribution of performance for control subjects, should the cut-off be –2 standard deviations or something else, perhaps the 5th percentile? This choice will have a large impact on the specificity value and consequently on the value of LR+. Giving priority to a high specifi-city value may make the LR+ extremely large. So the dilemma is to have some standard for the cut-off in cognitive function. The solution to the dilemma might be the “area under the curve” analysis (AUC).

C H A P T E R 14 • N E U R O P S YC H O LO G I C A L T E S T S A S A D I AG N O S T I C M A R K E R O F D E M E N T I A
95
In the research reviewed, all comparison is directed towards mean values of a group in focus in relation to a control group, ie, an inter-individual comparison based on population data of normal performance. However, the true comparison should be the premorbid value, in relation to the morbid value, of the same individual, ie, an intra-individual comparison. The dilemma is that there is seldom any reliable knowledge about true premorbid functioning. This difference between optimal and feasible comparison will introduce an error in the prediction that is beyond the reach of present routines for assessing cognitive function.

D E M E N T I A – D I AG N O S T I C A N D T H E R A P E U T I C I N T E RV E N T I O N S96
Table 14.1 Summary of accepted studies on neuropsychological tests that fulfilled criteria of inclusion showing median SS and SP as well as mean LR+ and LR– and grade of evidence in comparison of groups varying in degree of cognitive dysfunction and diagnosis (D, AD, MCI, and C).
Comparison No of studies No of probands SS SP LR+ LR– Grade of evidence group (1 vs 2) median median median median
D-C 3 184/167 0.82 0.95 16.4 0.19 StrongAD-C 5 342/400 0.86 0.94 14.3 0.12 StrongD-MCI 1 16/104 0.83 0.85 15.7 0.2 No evidence, one study only
AD-MCI 0 (no study out of 3 accepted fulfilled the combined 3 criteria: SS >0,8 and SP >0,8 and LR+ >5).MCI-C 0 (no study out of 3 accepted fulfilled the combined 3 criteria: SS >0,8 and SP >0,8 and LR+ >5).
AD = Alzheimer’s disease; LR = Likelihood ratio; MCI = Mild cognitive impairment; SP = Specificity; SS = Sensitivity

C H A P T E R 14 • N E U R O P S YC H O LO G I C A L T E S T S A S A D I AG N O S T I C M A R K E R O F D E M E N T I A
97
Table 14.1 Summary of accepted studies on neuropsychological tests that fulfilled criteria of inclusion showing median SS and SP as well as mean LR+ and LR– and grade of evidence in comparison of groups varying in degree of cognitive dysfunction and diagnosis (D, AD, MCI, and C).
Comparison No of studies No of probands SS SP LR+ LR– Grade of evidence group (1 vs 2) median median median median
D-C 3 184/167 0.82 0.95 16.4 0.19 StrongAD-C 5 342/400 0.86 0.94 14.3 0.12 StrongD-MCI 1 16/104 0.83 0.85 15.7 0.2 No evidence, one study only
AD-MCI 0 (no study out of 3 accepted fulfilled the combined 3 criteria: SS >0,8 and SP >0,8 and LR+ >5).MCI-C 0 (no study out of 3 accepted fulfilled the combined 3 criteria: SS >0,8 and SP >0,8 and LR+ >5).
AD = Alzheimer’s disease; LR = Likelihood ratio; MCI = Mild cognitive impairment; SP = Specificity; SS = Sensitivity

D E M E N T I A – D I AG N O S T I C A N D T H E R A P E U T I C I N T E RV E N T I O N S98
Table 14.2 Neuropsychological test(s) as markers of type and degree of dementia based on studies with clinical (Arabic digit) and/or neuropathological verification (Roman digit) of diagnosis.
AuthorYearReference Country
Sample (n)Follow-up (y)
Age (years)
StageCDR/MMSE/GDS
Diagnostic criteriaClin/neuropath
Inde- pendence
Contrast Test(s) SS SP LR+/– Qualityof study
Reviewers’ comments
D–C n = 3
Derrer et al2001[5]USA
D, n = 37C, n = 37
7474
CDR: ICDR: 0
NINCDS/no DC
WlistALMVR
1 0.95 20/0.00 1a
Storandt et al1989[6]USA
mD, n = 66VmD, n = 41C, n = 83
72±574±572±5
CDR: ICDR: 0.5CDR: 0
DSM-III/no Yes mD-C
VmD-C
LM+BN+DiSy
0.82
0.65
0.95
0.95
16.4/0.19
13
1a
Swearer et al1998[7]USA
D, n = 40NoD, n = 47C, n = 53
736470
Mi-mod DSM-IV/noNINCDS
DNoD
OrientLM: Im+De
0.81 0.98 40.5/0.19 1a
AD-C n = 6
Albert et al2001[8]USA
qD, n = 123C, n = 42Follow-up: 3
72.271.4
CDR: 0.5CDR: 0
NINCDS/noCDR: ISP
C-AD
C-qD
qD-AD
CVLT,VR,TMTBCVLT,SOTCVLT,VR,TMTB
0.83
0.71
0.74
0.94
0.81
0.83
13.8/0.18
3.7
4.4
1a Plus: cogCommunitybased volunteer, selected samplesCovariance analysis: ApoE ns
Kluger et al1999[9]USA
Decl, n = 74NoDec, n = 139AD, n = 56NoDec, n = 123
72.7±8.669.7±8.2
GDS: >3GDS: 1–3
Follow-up: 3.6 years/no
Yes Dec
NoDec
DePRNoDeclDiSyDSf
0.73AL
0.89
0.91
0.97
8.1
27.9/0.12
1a Plus: demo incl
La Rue1989[10]USA
AD, n = 19DNUD, n = 20Depr, n = 41
60–9060–9060–90
17.2±5.619.8±4.723.9±4.0
DSM-III/no Yes AD vsdepr
Fuld:Learn + delMMSE
0.9
0.67
0.83
0.76
5.2/0.12
2.7
Cross-sectLim: mod cogdysf

C H A P T E R 14 • N E U R O P S YC H O LO G I C A L T E S T S A S A D I AG N O S T I C M A R K E R O F D E M E N T I A
99
Table 14.2 Neuropsychological test(s) as markers of type and degree of dementia based on studies with clinical (Arabic digit) and/or neuropathological verification (Roman digit) of diagnosis.
AuthorYearReference Country
Sample (n)Follow-up (y)
Age (years)
StageCDR/MMSE/GDS
Diagnostic criteriaClin/neuropath
Inde- pendence
Contrast Test(s) SS SP LR+/– Qualityof study
Reviewers’ comments
D–C n = 3
Derrer et al2001[5]USA
D, n = 37C, n = 37
7474
CDR: ICDR: 0
NINCDS/no DC
WlistALMVR
1 0.95 20/0.00 1a
Storandt et al1989[6]USA
mD, n = 66VmD, n = 41C, n = 83
72±574±572±5
CDR: ICDR: 0.5CDR: 0
DSM-III/no Yes mD-C
VmD-C
LM+BN+DiSy
0.82
0.65
0.95
0.95
16.4/0.19
13
1a
Swearer et al1998[7]USA
D, n = 40NoD, n = 47C, n = 53
736470
Mi-mod DSM-IV/noNINCDS
DNoD
OrientLM: Im+De
0.81 0.98 40.5/0.19 1a
AD-C n = 6
Albert et al2001[8]USA
qD, n = 123C, n = 42Follow-up: 3
72.271.4
CDR: 0.5CDR: 0
NINCDS/noCDR: ISP
C-AD
C-qD
qD-AD
CVLT,VR,TMTBCVLT,SOTCVLT,VR,TMTB
0.83
0.71
0.74
0.94
0.81
0.83
13.8/0.18
3.7
4.4
1a Plus: cogCommunitybased volunteer, selected samplesCovariance analysis: ApoE ns
Kluger et al1999[9]USA
Decl, n = 74NoDec, n = 139AD, n = 56NoDec, n = 123
72.7±8.669.7±8.2
GDS: >3GDS: 1–3
Follow-up: 3.6 years/no
Yes Dec
NoDec
DePRNoDeclDiSyDSf
0.73AL
0.89
0.91
0.97
8.1
27.9/0.12
1a Plus: demo incl
La Rue1989[10]USA
AD, n = 19DNUD, n = 20Depr, n = 41
60–9060–9060–90
17.2±5.619.8±4.723.9±4.0
DSM-III/no Yes AD vsdepr
Fuld:Learn + delMMSE
0.9
0.67
0.83
0.76
5.2/0.12
2.7
Cross-sectLim: mod cogdysf
The table continues on the next page

D E M E N T I A – D I AG N O S T I C A N D T H E R A P E U T I C I N T E RV E N T I O N S100
AuthorYearReference Country
Sample (n)Follow-up (y)
Age (years)
StageCDR/MMSE/GDS
Diagnostic criteriaClin/neuropath
Inde- pendence
Contrast Test(s) SS SP LR+/– Quality of study
Reviewers’ comments
Locascio et al1995[11]USA
NC, n = 60AD, n = 123Follow-up: 5.5
68.9±11.270.7±8.5MiModSev
IMC: 0.9IMC: 11.6IMC: 7.1IMC: 13.4IMC: 21.6
NINCDS/few NC vs miAD
NYUdRGeoFigR(Comb 2 test)
0.96 0.91 10.7/0.04 1b Plus: cogNo cog speedNo attention
Masur et al1989[12]USA
NE, n = 134AD, n = 21AD
79.5±3.068.3±11.2
NINCDS/no NE vs AD SRT:sum +del + 2
0.8 0.95 16.0/0.21 1a Bronx ASCross-secCut-off 2SD
D-MCI n = 1
Hänninen et al1995[13]Finland
AAMI, n = 104D, n = 16MCI, n = 13SubjM, n = 17OthDis, n = 15No, n = 9Follow-up: 3.6
71.7±5.0 AAMI/noDSM-III-R
No StAAMIprAAMI
AllSRTVRALVeFluLVeFluCBent
0.83 0.85 5.6/0.20 KuopioWide cog
AD-MCI n = 0
MCI-C n = 0
Table 14.2 continued
AD = Alzheimer’s disease; BN = Boston Naming test; C = Control; CDR = Clinical dementia rating scale; D = Dementia; Dec = Deceased; Decl = Declaration; DiSy = Diagnostic system; DNUD = Dementia no ultimate definition; GDS = Geriatric depres-sion scale; HD = Huntington’s disease; mD = Mild dementia; MMSE = Mini-mental state examination; NC = Normal controls; NE = Normal examination; NoD = Not demented; prAAMI = Age associated memory impairment; qD = Demented women; StAAMI = Age associated memory impairment; VmD = Very mild dementia

C H A P T E R 14 • N E U R O P S YC H O LO G I C A L T E S T S A S A D I AG N O S T I C M A R K E R O F D E M E N T I A
101
AuthorYearReference Country
Sample (n)Follow-up (y)
Age (years)
StageCDR/MMSE/GDS
Diagnostic criteriaClin/neuropath
Inde- pendence
Contrast Test(s) SS SP LR+/– Quality of study
Reviewers’ comments
Locascio et al1995[11]USA
NC, n = 60AD, n = 123Follow-up: 5.5
68.9±11.270.7±8.5MiModSev
IMC: 0.9IMC: 11.6IMC: 7.1IMC: 13.4IMC: 21.6
NINCDS/few NC vs miAD
NYUdRGeoFigR(Comb 2 test)
0.96 0.91 10.7/0.04 1b Plus: cogNo cog speedNo attention
Masur et al1989[12]USA
NE, n = 134AD, n = 21AD
79.5±3.068.3±11.2
NINCDS/no NE vs AD SRT:sum +del + 2
0.8 0.95 16.0/0.21 1a Bronx ASCross-secCut-off 2SD
D-MCI n = 1
Hänninen et al1995[13]Finland
AAMI, n = 104D, n = 16MCI, n = 13SubjM, n = 17OthDis, n = 15No, n = 9Follow-up: 3.6
71.7±5.0 AAMI/noDSM-III-R
No StAAMIprAAMI
AllSRTVRALVeFluLVeFluCBent
0.83 0.85 5.6/0.20 KuopioWide cog
AD-MCI n = 0
MCI-C n = 0

D E M E N T I A – D I AG N O S T I C A N D T H E R A P E U T I C I N T E RV E N T I O N S102
1. Qizilbash Nea. Evidence-based dementia practice. Oxford: Blackwell Publishing; 2002.
2. Collie A, Maruff P. The neuropsychol-ogy of preclinical Alzheimer’s disease and mild cognitive impairment. Neurosci Biobehav Rev 2000;24:365-74.
3. Tuokko H, Hadjistavropoulos T, Miller JA, Beattie BL. The Clock Test: a sensitive measure to differentiate normal elderly from those with Alzheimer disease. J Am Geriatr Soc 1992;40:579-84.
4. Knopman DS, DeKosky ST, Cummings JL, Chui H, Corey-Bloom J, Relkin N, et al. Practice parameter: diagnosis of de-mentia (an evidence-based review). Report of the Quality Standards Subcommittee of the American Academy of Neurology. Neurology 2001;56:1143-53.
5. Derrer DS, Howieson DB, Mueller EA, Camicioli RM, Sexton G, Kaye JA. Memory testing in dementia: how much is enough? J Geriatr Psychiatry Neurol 2001;14:1-6.
6. Storandt M, Hill RD. Very mild senile dementia of the Alzheimer type. II. Psy-chometric test performance. Arch Neurol 1989;46:383-6.
7. Swearer JM, O’Donnell BF, Kane KJ, Hoople NE, Lavoie M. Delayed recall in de-mentia: sensitivity and specificity in patients
with higher than average general intellectual abilities. Neuropsychiatry Neuropsychol Behav Neurol 1998;11:200-6.
8. Albert MS, Moss MB, Tanzi R, Jones K. Preclinical prediction of AD using neuro- psychological tests. J Int Neuropsychol Soc 2001;7:631-9.
9. Kluger A, Ferris SH, Golomb J, Mittelman MS, Reisberg B. Neuropsycho-logical prediction of decline to dementia in nondemented elderly. J Geriatr Psychiatry Neurol 1999;12:168-79.
10. La Rue A. Patterns of performance on the Fuld Object Memory Evaluation in eld-erly inpatients with depression or dementia. J Clin Exp Neuropsychol 1989;11:409-22.
11. Locascio JJ, Growdon JH, Corkin S. Cognitive test performance in detecting, staging, and tracking Alzheimer’s disease. Arch Neurol 1995;52:1087-99.
12. Masur DM, Fuld PA, Blau AD, Thal LJ, Levin HS, Aronson MK. Distinguish-ing normal and demented elderly with the selective reminding test. J Clin Exp Neuropsychol 1989;11:615-30.
13. Hanninen T, Hallikainen M, Koivisto K, Helkala EL, Reinikainen KJ, Soininen H, et al. A follow-up study of age-associat-ed memory impairment: neuropsychologi-cal predictors of dementia. J Am Geriatr Soc 1995;43:1007-15.
References

C H A P T E R 15 • E V I D E N C E - B A S E D E VA L U AT I O N O F S I N G L E C O G N I T I V E T E S T S A S A D I AG N O S T I C M A R K E R O F D E M E N T I A
103
15. Evidence-based Evaluation of Single Cognitive Tests as a Diagnostic Marker of Dementia
Conclusions
For Clock tests and CAMCOG, a sufficient number of studies could be included in order to summarize their effectiveness in diagnosing demen-tia and AD (Alzheimer’s disease). For other tests, data are lacking and further studies are needed before a conclusion can be drawn.
There is moderately strong evidence that single cognitive tests such as CAMCOG contribute substantially to the diagnosis of dementia. There is also moderately strong evidence that Clock tests contribute substanti-ally to the diagnosis of AD. There are no accepted studies on the dia- gnostic entity of MCI compared to dementia or AD and in relation to healthy individuals. Thus, no conclusions can be stated concerning this issue. There is no evidence and/or no accepted studies on other single cognitive tests (though many are in use) for diagnosing dementia, AD or MCI. Because there is only one study on MMSE that is of acceptable quality, no conclusion can be stated with regard to evidence.
Introduction
Previous studies regarding evidence-based evaluation of single cognitive tests as an aid in the diagnosis of dementia are presented in a chapter of “Evidence-based Dementia Practice” [1]. Single tests have been claimed to be useful in distinguishing between both specified and unspecified dementia and control subjects. However, the data are often based on a clinical setting where representative samples of patients with dementia

D E M E N T I A – D I AG N O S T I C A N D T H E R A P E U T I C I N T E RV E N T I O N S104
are compared to unrepresentative samples of normal, high-functioning controls. That may lead to an overestimate of likelihood ratios. The tests included in the present study were MMSE, various Clock tests, ADAS-Cog, CAMCOG, CERAD, and a single memory, fluency or other specific test of cognitive function. Before a final conclusion on the value of single cognitive tests in a dementia workup can be reached, future studies should be designed to include an appropriate spectrum of parti-cipants.
The aim was to review single cognitive tests in order 1) to predict demen-tia or a specific dementia disease and 2) to arrive at a differential diagno-sis of dementia.
Search strategy
Single cognitive tests were specified as a prerequisite for the present study. A single cognitive test was defined as any task-based assessment of global cognitive function or specific single cognitive function. The search was performed on tests in the Medline database using a profile of [dementia AND (ADAS-Cog OR CERAD OR CAMCOG OR Clock test OR 7MS OR any of many other tests) AND (sensitivity AND specificity)] to identify research dated from 1966 through January 2005. A total of 549 articles were found. The articles underwent a two-step selection procedure. First, all abstracts were read and evaluated in terms of relevance to the aim. Studies were excluded from further evaluation because they dealt with a combination of various cognitive tests, used psychiatric or non-behavioral methods, or did not correspond to the intentions of the review for some other reason. This step left 130 studies. In the second step, studies were evaluated with regard to methodologi-cal quality as described above. The primary reasons for exclusion were an insufficient number of clinical examinations and inadequate data to calculate sensitivity and specificity. After the methodological evaluation, 52 studies remained for evidence-based analysis of the value of single cognitive tests in dementia workups.
The majority of accepted studies concerned a comparison between two or more levels of cognitive deterioration, from 1) unimpaired cognitive

C H A P T E R 15 • E V I D E N C E - B A S E D E VA L U AT I O N O F S I N G L E C O G N I T I V E T E S T S A S A D I AG N O S T I C M A R K E R O F D E M E N T I A
105
function to 2) mild cognitive impairment (MCI) to 3) pronounced cog- nitive deficits in mild, moderate and severe dementia associated with certain disease (such as AD) or any type of cerebrovascular disorder. Most often (26 studies), groups of unspecified dementia patients were compared with controls. Another 19 studies compared specified demen-tia, such as AD with controls. Two studies investigated various stages in the course of the disease, such as the transition from unimpaired cog-nitive function to MCI. One study concerned the transition from MCI to mild dementia or from mild to more advance dementia. Finally, one study compared different dementia disorders, as exemplified by VaD and unspecified non-AD. Worth noting is that the certainty regarding unimpaired cognitive function varies considerably. Some studies inclu-ded rigorous health screening, whereas others use a simple screening pro-cedure or no clinical evaluation of health status, while stating that the participants had normal cognitive function. A couple of studies included more than one comparison.
The most frequently used single cognitive tests were MMSE [2], Clock tests (n = 11, including various formats of task and scoring), CAMCOG [3], Category fluency (n = 3), MIS [4] and 7MS [5]. Thirtynine dif-ferent tests were used in only 1 or 2 studies. These tests concerned epi-sodic memory (n = 12), any other specific cognitive function (n = 8) or a global measure of cognition (n = 19). Very high LR+ values (LR+ >20) were reported for some of the tests, the majority of which assess episodic memory. However, since the data were based on a single study, they are not presented in this review. Given that the instruments are common to clinical dementia research and clinical trials, neither ADAS-Cog nor CERAD appeared in the final set of studies to review. It was possible to obtain some information on the utility of various cut-off levels in MMSE and the scoring method for Clock tests.
Results
Below are data on sensitivity, specificity, LR+ and LR– for various con- trasts between groups and in terms of three single cognitive tests: MMSE, Clock tests, and CAMCOG (see Table 15.1). MMSE is a test of limi-ted evidence, particularly for assessing dementia compared to people

D E M E N T I A – D I AG N O S T I C A N D T H E R A P E U T I C I N T E RV E N T I O N S106
without dementia in similar age-groups. However, only one study on MMSE comparing Alzheimer to controls, corresponded to the criteria for inclusion. It is also obvious that a Clock test is valuable in diagnosing dementia. Both MMSE and Clock tests can be easily administered in a relatively short period of time by nurses, paramedical personnel, physici-ans, etc, without requiring extensive training. For CAMCOG, adminis-tration is more demanding and does not offer clear advantages in terms of utility, as documented by LR+.
Worth noting is that maximum LR+ and minimum LR– do not occur in the same study. Thus, LR+ or LR– must be prioritized before the test is chosen.
Furthermore, not only the specific test, but the way that it is to be admi-nistered, must be decided in advance, given the possible impact on LR+ and LR–. Some studies examined the effect on sensitivity and specificity by varying the cut-off level. These studies demonstrated greater sensiti-vity despite unchanged specificity when the cut-off level was increased [6,7].
Regarding the Clock test, considerable variation in terms of adminis-tration formats leads to varying degrees of difficulty (such as telling the time given the clock outline and hands, setting the hands given the time and clock outline, drawing clock outlines and hands given the time, etc). In addition, various scoring procedures have been suggested, and some studies have compared the effectiveness of different scoring procedures. According to these studies, the Wolf-Klein method [8] and the Sunder-land method [9] are associated with the most favorable LR+ in diagno-sing unspecified dementia.
Discussion
In summary, the results of the present review indicate that strict metho-dological requirements leave very few studies for our evidence-based eva-luation. Furthermore, no study was found that used diagnostic criteria based on a neuropathological examination. Another striking discovery was that the overwhelming majority of studies were on dementia and

C H A P T E R 15 • E V I D E N C E - B A S E D E VA L U AT I O N O F S I N G L E C O G N I T I V E T E S T S A S A D I AG N O S T I C M A R K E R O F D E M E N T I A
107
AD – only one was exclusively devoted to VaD. Moreover, no accepted study investigated MCI. These findings may serve as a reminder for future researchers when designing studies aimed at validating single cognitive tests for dementia. Finally, many excluded studies contained valuable information that largely agreed with the conclusion presented in this review.
Before stating a final conclusion, some critical points will be discussed. The typical age of patients and controls ranges from 70 to 90, whereas only few studies have examined younger people or a broader age range. Moreover, the stage of cognitive deterioration for people with and with-out dementia varies considerably among the studies, making a compa-rison difficult or even unjustified, given that large differences between contrast groups result in favorable LR+ values for the cognitive test under evaluation. This point is critical in the evidence-based evaluation of diagnostic procedures, since it can be influenced by increasing group contrasts. For instance, the dementia group may be biased by virtue of a conservative diagnosis and/or strict selection of people without demen-tia by health screening so as to avoid those on the borderline between cognitive intactness and pronounced impairment. As an example, in order to evaluate the utility of a Clock test, people with dementia who have MMSE <15 and people without dementia who have MMSE close to 30 are to be preferred, given that both the test and MMSE are asso-ciated with global cognitive function. As a result, there is not a clear correlation between the predictor in focus and the degree of cognitive deterioration in contrasting groups, but rather a confounding of the evidence-based evaluation.
In applications of single tests for screening purposes, there is no consen-sus concerning the cut-off level. In relation to the normal distribution of performance for control subjects, should the cut-off level be 2 SD below the mean for controls or something else, such as the 5th percentile? This choice will have a major impact on the specificity value and thereby on the LR+. Prioritizing a high specificity value may overstate the LR+. The challenge is to find a standard for the cut-off in various single tests. The solution might be to present the area under the curve (AUC).

D E M E N T I A – D I AG N O S T I C A N D T H E R A P E U T I C I N T E RV E N T I O N S108
A review of MMSE has pointed out that its performance is clearly rela-ted to both the age and education of the subject [10]. Thus, a universal cut-off point is inappropriate when diagnosing dementia – both age and education must be taken into account when making diagnostic deci-sions.
In the research reviewed, all test results for the patient group are compa-red to the control group (inter-individual comparison). That is based on the assumption that the two groups are similar in essential background factors. However, the true comparison should be between the premorbid and morbid value for the same person (intra-individual comparison). A second dilemma is that there is seldom any reliable knowledge about true premorbid functioning. This difference between an optimal and a possible comparison introduces an error in the prediction that is out of reach of present routines for assessing cognitive function. That suggests that future screening instruments should be based on intra-individual changes [11], be insensitive to demographic status, or take advantage of age-based and education-based norms.

C H A P T E R 15 • E V I D E N C E - B A S E D E VA L U AT I O N O F S I N G L E C O G N I T I V E T E S T S A S A D I AG N O S T I C M A R K E R O F D E M E N T I A
109

D E M E N T I A – D I AG N O S T I C A N D T H E R A P E U T I C I N T E RV E N T I O N S110
Table 15.1 Summary of accepted studies on single cognitive tests (MMSE, Clock tests, and CAMCOG) that fulfilled criteria of inclusion showing median SS and SP as well as mean LR+ and LR– and grade of evidence in comparison of groups varying in degree of cognitive dysfunction and diagnosis (D, AD, MCI, and C).
Comparison group No of studies No of probands SS median SP median LR+ median LR– median Grade of evidence 1 vs 2
MMSE
D vs C 5 321/1 167 0.86 0.85 5.7 0.16 Limited
AD vs C 1 68/114 0.85 0.98 42.5 0.15 No evidence. Only one study
Clock tests
D vs C 2 128/62 0.86 0.85 5.7 0.16 Limited
AD vs C 4 237/116 0.89 0.94 14.8 0.12 Moderate
CAMCOG
D vs C 3 203/315 0.88 0.91 9.8 0.13 Moderate
AD = Alzheimer’s disease; C = Control; D = Dementia; LR = Likelihood ratio; SP = Specificity; SS = Sensitivity

C H A P T E R 15 • E V I D E N C E - B A S E D E VA L U AT I O N O F S I N G L E C O G N I T I V E T E S T S A S A D I AG N O S T I C M A R K E R O F D E M E N T I A
111
Table 15.1 Summary of accepted studies on single cognitive tests (MMSE, Clock tests, and CAMCOG) that fulfilled criteria of inclusion showing median SS and SP as well as mean LR+ and LR– and grade of evidence in comparison of groups varying in degree of cognitive dysfunction and diagnosis (D, AD, MCI, and C).
Comparison group No of studies No of probands SS median SP median LR+ median LR– median Grade of evidence 1 vs 2
MMSE
D vs C 5 321/1 167 0.86 0.85 5.7 0.16 Limited
AD vs C 1 68/114 0.85 0.98 42.5 0.15 No evidence. Only one study
Clock tests
D vs C 2 128/62 0.86 0.85 5.7 0.16 Limited
AD vs C 4 237/116 0.89 0.94 14.8 0.12 Moderate
CAMCOG
D vs C 3 203/315 0.88 0.91 9.8 0.13 Moderate
AD = Alzheimer’s disease; C = Control; D = Dementia; LR = Likelihood ratio; SP = Specificity; SS = Sensitivity

D E M E N T I A – D I AG N O S T I C A N D T H E R A P E U T I C I N T E RV E N T I O N S112
Table 15.2 Single cognitive tests as markers of type and degree of dementia based on studies with clinical (A) and neuropathological verification (B) of diagnosis.
Author Sample (n) Age (years) Stage Diagnostic Indepen- Contrast Test(s) SS SP LR+/– Quality Reviewers Year Follow-up (y) CDR/ criteria dence of study comments Reference MMSE/ Clin/ Country GDS neuropath
Schramm et al D, 79 44–90 GDS DSM-IV/no No D-noD ClockShullman 0.81 0.79 3.86 2a Shulman meth2002 C, 44 D-noD ClockSunderland 0.56 0.91 6.22 recommended[12] D-noD ClockWolf-Klein 0.39 0.95 7.80Germany D-noD ClockWatson 0.56 0.80 2.80 D-noD ClockManos 0.67 0.86 4.79 D-noD CDT+SKT 0.92 0.98 46 D-noD CDT+MMSE 0.90 1.00 ∞
D-noD MMSE23/24 0.80 1.00 ∞/0.20 D-noD SKT8/9 0.75 0.98 37.5
Wolf-Klein et al AD, 105 76.8 <15MMSE NINCDS/no Yes AD-noD CDTWolf-Klein 0.867 0.927 11.9/14 Cross-sectional1989 NoD, x 28 MMSE
[8]USA
Heinik et al D, 88 78.3±6.0 18.5±4.8 DSM-IV/no Yes D-noD MMSE23/24 0.96 0.81 5.05/0.05 Cross-sectional2003 Dep/anx, 26 74.7±6.6 27.3±2.2 CDT-Fr11/12 0.85 0.89 7.7/0.17[13] CDT+MMSE 1.00 0.91 11.1Israel CAMCOG 1.00 0.91 11.1/0.00
Hogervorst et al D, 82 75±7 20.0±4.6 DSM-IV/no Yes D-noD HopVLTot/14.5 0.87 0.98 43.5 OPTIMA.2002 C, 114 28.5±1.5 NINCDS AD-noD HopVLMem/24.5 0.91 0.98 45.5 Cross-sectional[14] AD, 68 25.3±5.2 NINDS D-noD MMSE23/24 0.83 0.98 41.5/0.17United Kingdom Follow-up: ? AD-noD MMSE23/24 0.85 0.98 42.5/0.15
de Koning et al D, 55 73.0±7.3 19.9±5.2 DSM-III-R/no Yes D-noD CAMCOG69/70 0.85 0.90 8.5/0.17 Rott Stroke.1998 NoD, 229 68.2±8.0 26.7±2.7 MMSE23/24 0.75 0.15 5 Cross-sectional[15]The Netherlands
Tuokko et al AD, 58 70.6±7.5 15.5±7.7 NINCDS/no Yes AD-NE CDTdraw 0.92 0.86 6.6/0.09 Cut-off1992 NE, 62 71.3±8.1 DSM-III-R AD-NE CDTset 0.87 0.97 29.0/0.13 maximized.[16] AD-NE CDTread 0.92 0.85 6.1/0.09 Cross-sectionalUSA AD-NE CDTcomb 0.94 0.93 13.4/0.06
Watson et al D, 40 55–92 CDR NINCDS/no D-noD CDT 0.87 0.82 4.8/0.16 Cross-sectional1993 NoD, 36[17]USA

C H A P T E R 15 • E V I D E N C E - B A S E D E VA L U AT I O N O F S I N G L E C O G N I T I V E T E S T S A S A D I AG N O S T I C M A R K E R O F D E M E N T I A
113
Table 15.2 Single cognitive tests as markers of type and degree of dementia based on studies with clinical (A) and neuropathological verification (B) of diagnosis.
Author Sample (n) Age (years) Stage Diagnostic Indepen- Contrast Test(s) SS SP LR+/– Quality Reviewers Year Follow-up (y) CDR/ criteria dence of study comments Reference MMSE/ Clin/ Country GDS neuropath
Schramm et al D, 79 44–90 GDS DSM-IV/no No D-noD ClockShullman 0.81 0.79 3.86 2a Shulman meth2002 C, 44 D-noD ClockSunderland 0.56 0.91 6.22 recommended[12] D-noD ClockWolf-Klein 0.39 0.95 7.80Germany D-noD ClockWatson 0.56 0.80 2.80 D-noD ClockManos 0.67 0.86 4.79 D-noD CDT+SKT 0.92 0.98 46 D-noD CDT+MMSE 0.90 1.00 ∞
D-noD MMSE23/24 0.80 1.00 ∞/0.20 D-noD SKT8/9 0.75 0.98 37.5
Wolf-Klein et al AD, 105 76.8 <15MMSE NINCDS/no Yes AD-noD CDTWolf-Klein 0.867 0.927 11.9/14 Cross-sectional1989 NoD, x 28 MMSE
[8]USA
Heinik et al D, 88 78.3±6.0 18.5±4.8 DSM-IV/no Yes D-noD MMSE23/24 0.96 0.81 5.05/0.05 Cross-sectional2003 Dep/anx, 26 74.7±6.6 27.3±2.2 CDT-Fr11/12 0.85 0.89 7.7/0.17[13] CDT+MMSE 1.00 0.91 11.1Israel CAMCOG 1.00 0.91 11.1/0.00
Hogervorst et al D, 82 75±7 20.0±4.6 DSM-IV/no Yes D-noD HopVLTot/14.5 0.87 0.98 43.5 OPTIMA.2002 C, 114 28.5±1.5 NINCDS AD-noD HopVLMem/24.5 0.91 0.98 45.5 Cross-sectional[14] AD, 68 25.3±5.2 NINDS D-noD MMSE23/24 0.83 0.98 41.5/0.17United Kingdom Follow-up: ? AD-noD MMSE23/24 0.85 0.98 42.5/0.15
de Koning et al D, 55 73.0±7.3 19.9±5.2 DSM-III-R/no Yes D-noD CAMCOG69/70 0.85 0.90 8.5/0.17 Rott Stroke.1998 NoD, 229 68.2±8.0 26.7±2.7 MMSE23/24 0.75 0.15 5 Cross-sectional[15]The Netherlands
Tuokko et al AD, 58 70.6±7.5 15.5±7.7 NINCDS/no Yes AD-NE CDTdraw 0.92 0.86 6.6/0.09 Cut-off1992 NE, 62 71.3±8.1 DSM-III-R AD-NE CDTset 0.87 0.97 29.0/0.13 maximized.[16] AD-NE CDTread 0.92 0.85 6.1/0.09 Cross-sectionalUSA AD-NE CDTcomb 0.94 0.93 13.4/0.06
Watson et al D, 40 55–92 CDR NINCDS/no D-noD CDT 0.87 0.82 4.8/0.16 Cross-sectional1993 NoD, 36[17]USA
The table continues on the next page

D E M E N T I A – D I AG N O S T I C A N D T H E R A P E U T I C I N T E RV E N T I O N S114
Table 15.2 continued
Author Sample (n) Age (years) Stage Diagnostic Indepen- Contrast Test(s) SS SP LR+/– Quality Reviewers’ Year Follow-up (y) CDR/ criteria dence of study comments Reference MMSE/ Clin/ Country GDS Neuropath
Neri et al D, 60 ~75 10–26 DSM-III-R/no No D-noD CAMCOG79/80 0.983 0.750 3.93 Cross- 1998 noD, 60 ~75 27–30 D-noD CAMCOGorg79/80 0.817 1.00 ∞/0.18 sectional[18] Follow-up: 1 year D-noD CAMCOGshort 0.883 0.983 51.9/0.19Italy D-noD CAMCOGorgshort 0.933 1.000 ∞/0.07
van Gorp et al AD, 22 68.9±7.7 – DSM-III-R/no Yes D-NC MMSE25/26 0.71 1.00 ∞ Cross-1999 VaD, 19 69.8±7.7 – D-NC MMSE26/27 0.98 1.00 ∞/0.02 sectional[7] NC, 12 69.4±6.5 – Mattis133/134 0.83 1.00 ∞
USA NCSEtot 0.48 1.00 ∞
Mendez et al AD, 46 CDIS 13–21 NINCDS/no AD-NE CDTShulman 0.91 1.00 ∞/0.09 Cross-1992 NE, 26 sectional[19] USA
Cossa et al D, 35 60+ – DSM-III-R/no Yes D-noD MODA 1.00 0.716 3.52 Cross-1999 NoD, 733 60+ – D-noD MMSE 0.857 0.9 8.57/0.16 sectional[20] Italy
Heun et al D, 37 89.1±6.2 19.4±5.5 ICD-10/no Yes D-noD MMSE23/24 0.92 0.96 23.0/0.08 2a 1998 NoD, 250 74.7±10.0 27.9±1.7 DSM-III-R D-noD SIDAM42/43 0.97 0.91 10.8[21] Population based D-noD CatFlAn13/14 0.81 0.83 4.76Germany D-noD WoRecIm12/3 0.82 0.77 3.57 D-noD TMT39/40 0.81 0.71 2.79
Brodaty et al AD, 28 73.1±8.9 19.5±5.3 DSM-III-R/no Yes AD-C CDTShulman 0.2/3 0.86 0.96 6.1/0.15 2a Hospital1997 C, 28 69.5±7.7 28.7±1.4 NINCDS AD-C CDTSunderland 0.8/9 0.79 0.93 11.3[22] Hospital based AD-C CDTWolf-Klein 0.8/9 0.79 0.89 7.18Australia AD-C MMSE23/24 0.71 1.00 ∞
AD = Alzheimer’s disease; C = Control; CDR = Clinical dementia rating scale; CDT = Clock drawing task; D = Dementia; GDS = Global deterioration scale; HopVLT = Hopkins verbal learning test; MMSE = Mini-mental state examination; MODA = Milan overall dementia assessment; NE = Normal examination; NoD = Not demented; SKT = Syndrom kurztest (or syndrom short test)

C H A P T E R 15 • E V I D E N C E - B A S E D E VA L U AT I O N O F S I N G L E C O G N I T I V E T E S T S A S A D I AG N O S T I C M A R K E R O F D E M E N T I A
115
Table 15.2 continued
Author Sample (n) Age (years) Stage Diagnostic Indepen- Contrast Test(s) SS SP LR+/– Quality Reviewers’ Year Follow-up (y) CDR/ criteria dence of study comments Reference MMSE/ Clin/ Country GDS Neuropath
Neri et al D, 60 ~75 10–26 DSM-III-R/no No D-noD CAMCOG79/80 0.983 0.750 3.93 Cross- 1998 noD, 60 ~75 27–30 D-noD CAMCOGorg79/80 0.817 1.00 ∞/0.18 sectional[18] Follow-up: 1 year D-noD CAMCOGshort 0.883 0.983 51.9/0.19Italy D-noD CAMCOGorgshort 0.933 1.000 ∞/0.07
van Gorp et al AD, 22 68.9±7.7 – DSM-III-R/no Yes D-NC MMSE25/26 0.71 1.00 ∞ Cross-1999 VaD, 19 69.8±7.7 – D-NC MMSE26/27 0.98 1.00 ∞/0.02 sectional[7] NC, 12 69.4±6.5 – Mattis133/134 0.83 1.00 ∞
USA NCSEtot 0.48 1.00 ∞
Mendez et al AD, 46 CDIS 13–21 NINCDS/no AD-NE CDTShulman 0.91 1.00 ∞/0.09 Cross-1992 NE, 26 sectional[19] USA
Cossa et al D, 35 60+ – DSM-III-R/no Yes D-noD MODA 1.00 0.716 3.52 Cross-1999 NoD, 733 60+ – D-noD MMSE 0.857 0.9 8.57/0.16 sectional[20] Italy
Heun et al D, 37 89.1±6.2 19.4±5.5 ICD-10/no Yes D-noD MMSE23/24 0.92 0.96 23.0/0.08 2a 1998 NoD, 250 74.7±10.0 27.9±1.7 DSM-III-R D-noD SIDAM42/43 0.97 0.91 10.8[21] Population based D-noD CatFlAn13/14 0.81 0.83 4.76Germany D-noD WoRecIm12/3 0.82 0.77 3.57 D-noD TMT39/40 0.81 0.71 2.79
Brodaty et al AD, 28 73.1±8.9 19.5±5.3 DSM-III-R/no Yes AD-C CDTShulman 0.2/3 0.86 0.96 6.1/0.15 2a Hospital1997 C, 28 69.5±7.7 28.7±1.4 NINCDS AD-C CDTSunderland 0.8/9 0.79 0.93 11.3[22] Hospital based AD-C CDTWolf-Klein 0.8/9 0.79 0.89 7.18Australia AD-C MMSE23/24 0.71 1.00 ∞
AD = Alzheimer’s disease; C = Control; CDR = Clinical dementia rating scale; CDT = Clock drawing task; D = Dementia; GDS = Global deterioration scale; HopVLT = Hopkins verbal learning test; MMSE = Mini-mental state examination; MODA = Milan overall dementia assessment; NE = Normal examination; NoD = Not demented; SKT = Syndrom kurztest (or syndrom short test)

D E M E N T I A – D I AG N O S T I C A N D T H E R A P E U T I C I N T E RV E N T I O N S116
1. Qizilbash N et al. Evidence-based dementia practice. Oxford: Blackwell Publishing Company; 2002.
2. Folstein MF, Folstein SE, McHugh PR. “Mini-mental state”. A practical method for grading the cognitive state of patients for the clinician. J Psychiatr Res 1975;12:189-98.
3. Roth M, Tym E, Mountjoy CQ, Huppert FA, Hendrie H, Verma S, et al. CAMDEX. A standardised instrument for the diagnosis of mental disorder in the elderly with special reference to the early detection of dementia. Br J Psychiatry 1986;149:698-709.
4. Buschke H, Kuslansky G, Katz M, Stewart WF, Sliwinski MJ, Eckholdt HM, et al. Screening for dementia with the memory impairment screen. Neurology 1999;52:231-8.
5. Solomon PR, Hirschoff A, Kelly B, Relin M, Brush M, DeVeaux RD, et al. A 7 minute neurocognitive screening battery highly sensitive to Alzheimer’s disease. Arch Neurol 1998;55:349-55.
6. Monsch AU, Foldi NS, Ermini- Funfschilling DE, Berres M, Taylor KI, Seifritz E, et al. Improving the diagnostic accuracy of the Mini-Mental State Exami-nation. Acta Neurol Scand 1995;92:145-50.
7. van Gorp W, Marcotte TD, Sultzer D, Hinkin, C, Mahler, M, Cummings, JL. Screening for dementia: comparison of three commonly used instruments. J Clin Exp Neuropsychol 1999;21:29-38.
8. Wolf-Klein GP, Silverstone FA, Levy AP, Brod MS. Screening for Alzheimer’s disease by clock drawing. J Am Geriatr Soc 1989;37:730-4.
9. Sunderland T, Hill JL, Mellow AM, Lawlor BA, Gundersheimer J, Newhouse PA, et al. Clock drawing in Alzheimer’s disease. A novel measure of dementia severity. J Am Geriatr Soc 1989;37: 725-9.
10. Crum RM, Anthony JC, Bassett SS, Folstein MF. Population based norms for the Mini-Mental State Examination by age and educational level. JAMA 1993; 269:2386-91.
11. Jorm AF. The Informant Question-naire on cognitive decline in the elderly (IQCODE): a review. Int Psychogeriatr 2004;16:275-93.
12. Schramm U, Berger G, Muller R, Kratzsch T, Peters J, Frolich L. Psycho-metric properties of Clock Drawing Test and MMSE or Short Performance Test (SKT) in dementia screening in a memory clinic population. Int J Geriatr Psychiatry 2002;17:254-60.
13. Heinik J, Solomesh I, Bleich A, Berkman P. Are the clock-drawing test and the MMSE combined interchangeable with CAMCOG as a dementia evalua-tion instrument in a specialized outpa-tient setting? J Geriatr Psychiatry Neurol 2003;16:74-9.
14. Hogervorst E, Combrinck M, Lapuerta P, Rue J, Swales K, Budge M. The Hopkins
References

C H A P T E R 15 • E V I D E N C E - B A S E D E VA L U AT I O N O F S I N G L E C O G N I T I V E T E S T S A S A D I AG N O S T I C M A R K E R O F D E M E N T I A
117
Verbal Learning Test and screening for dementia. Dement Geriatr Cogn Disord 2002;13:13-20.
15. de Koning I, van Kooten F, Dippel DW, van Harskamp F, Grobbee DE, Kluft C, et al. The CAMCOG: a useful screen-ing instrument for dementia in stroke patients. Stroke 1998;29:2080-6.
16. Tuokko H, Hadjistavropoulos T, Miller JA, Beattie BL. The Clock Test: a sensitive measure to differentiate normal elderly from those with Alzheimer disease. J Am Geriatr Soc 1992;40:579-84.
17. Watson YI, Arfken CL, Birge SJ. Clock completion: an objective screening test for dementia. J Am Geriatr Soc 1993;41:1235-40.
18. Neri M, Rubichi S, DeVreese LP, Roth M, Cipolli C. Validation of the full and short forms of the CAMDEX interview for diagnosing dementia: evidence from a one-year follow-up
study. Dement Geriatr Cogn Disord 1998;9:339-46.
19. Mendez MF, Ala T, Underwood KL. Development of scoring criteria for the clock drawing task in Alzheimer’s disease. J Am Geriatr Soc 1992;40:1095-9.
20. Cossa FM, Sala SD, Musicco M, Spinnler H, Ubezio MC. The milan overall dementia assessment and the mini-mental state examination compared: an epidemio-logical investigation of dementia. Eur J Neurol 1999;6:289-94.
21. Heun R, Papassotiropoulos A, Jennssen F. The validity of psychometric instru-ments for detection of dementia in the elderly general population. Int J Geriatr Psychiatry 1998;13:368-80.
22. Brodaty H, Moore CM. The Clock Drawing Test for dementia of the Alzhe-imer’s type: A comparison of three scoring methods in a memory disorders clinic. Int J Geriatr Psychiatry 1997;12:619-27.


C H A P T E R 16 • G E N E T I C M A R K E R S 119
16. Genetic Markers
Conclusion
ApoE genotyping has a small impact on the pretest probability of AD (Alzheimer’s disease). It neither contributes significantly to the diagnosis of AD nor differentiates AD from other dementia disorders. No study in this review had a sensitivity of 80% or above and a LR+ of 5 or above. Thus, there is no evidence for the use of ApoE genotyping in the dia-gnostic and differential diagnostic of AD.
Causative genes for dementia disorders
Familial AD is rare, less than 1% of all patients with AD. Familial cases of VaD (cerebral autosomal arteriopathy with subcortical infarction and leucoencephalopathy = CADASIL), frontotemporal lobe dementia (FTLD) and dementia due to Creutzfeldt-Jakob disease (CJD) are even less frequent. For AD, mutations of three genes are known: presenilin genes 1 (Chromosome 14) and 2 (Chromosome 1) and the gene that codes for the amyloid precursor protein (Chromosome 21). For CADA-SIL, the only form of hereditary VaD, the Notch3 gene on chromosome 19 is identified. For FTLD, the tau gene on chromosome 17 and a yet unidentified gene on chromosome 3 is identified. For CJD, the prion gene on chromosome 20 is identified.
A search was conducted in Medline that included articles from 1975 to June 1, 2004. The keywords were “dementia/diagnosis”, “dementia/gene-tics”, “genetic counseling”, “genetic testing”, and “genetic screening”. The search produced 207 titles of relevance. None of the abstracts contained information that disagreed with the findings and recommendations de- scribed in Chapter II.4.5 of “Evidence-based Dementia Practice” [1].

D E M E N T I A – D I AG N O S T I C A N D T H E R A P E U T I C I N T E RV E N T I O N S120
That chapter and consensus guidelines established in the United States and United Kingdom may be summarized as follows:
1. People who have a family history of AD with early onset are candi- dates for genetic testing.
2. A person who tests positive for pathogenic mutation has a chance of developing AD that is close to 100%.
3. A genetic test cannot predict age at onset of AD.
4. AD can still develop in people who test negative for a specific patho-genic mutation.
5. Tau mutation analysis can be used for the differential diagnosis of FTLD, but only patients with a family history of FTLD and typical symptoms are candidates for genetic testing.
6. Notch3 gene testing can be performed to confirm CADASIL in patients with a family history and typical symptoms of the disease.
7. Genetic counseling should be offered both before and after testing by a genetic specialist.
Apolipoprotein E ε4 as a diagnostic marker of AD
BackgroundThe causes of sporadic AD, which is by far the most prevalent form, are not known. It is believed that genetic factors may interact with brain aging and various environmental factors, thus contributing to the deve-lopment of AD. Apolipoprotein E (ApoE) gene on chromosome 19 is involved. It has three alleles: ε2, ε3 and ε4. The frequency of the three alleles varies across from continent to continent. In the Western world, where frequency is studied the most, the prevalence is about 15% for ε4, 75% for ε3 and 10% for ε2 [2].
According to several studies over the last ten years, people with the ApoE ε4 allele have an increased risk of developing AD and there is a dosage effect [3]. ApoE ε4 has also been shown to lead to earlier onset of AD, an effect that is dosage dependent. ApoE ε2 reduces the risk of

C H A P T E R 16 • G E N E T I C M A R K E R S 121
AD more than ε3 [4]. Consistent with this finding, healthy centenarians have a higher frequency of ε2 than the general population [5]. We also know that 40–50% of all people with at least one ApoE ε4 will eventual-ly develop AD. But even among people who have the greatest risk, those with ε4/ε4 appear to have a 50% chance of escaping AD. The ApoE gene is a risk factor, not a cause of AD. We do not know exactly how the ApoE protein influences the pathophysiology of AD. One claim is that patients with AD who have ApoE ε4 deteriorate more rapidly than those without the allele, and that those with ε4 respond more poorly to acetylcholines-terase inhibitors, but the evidence for such assertions is not very good [6–10].
The use of ApoE as a diagnostic marker of AD has been addressed by several committees of experts, particularly in the United States and United Kingdom. The committees are from the American College of Medical Genetics, the Alzheimer’s Disease Genetic Consortium, the United Kingdom Alzheimer’s Disease Genetic Consortium, the Natio-nal Institute of Aging, and Alzheimer’s Disease International. So far, all consensus statements conclude that ApoE genotyping has no role in symptom-free people. This view is supported by a meta-analysis, which shows that with at least one ApoE ε4 allele, LR+ is 2.3, and that LR– of 0.55 separates AD patients from normal controls [4]. Using ε4/ε4 as a diagnostic marker in the same meta-analysis, LR+ rose to 8, whereas LR– was 0.87. A subcommittee of the American Academy of Neurology outlined guidelines and recommendations for the diagnostic workup of people with suspected dementia based on a literature review process [11]. The authors concluded that there is no evidence that Apo E geno-typing is useful in the diagnostic workup of patients with suspected AD. Payami [1], the author of chapter II.4.5, “Genetic markers in differential diagnosis” in “Evidence-based Dementia Practice” came to the same con-clusion after reviewing 69 case-control studies [1]. Some claims have been made that ApoE testing could be useful in dif-ferentiating AD from other dementia disorders. A study by Mayeux et al in 1998 on a large neuropathologically confirmed cohort of patients sug-gested that ApoE genotyping may be useful for this purpose in patients referred to a specialized assessment when the pre-test probability of AD

D E M E N T I A – D I AG N O S T I C A N D T H E R A P E U T I C I N T E RV E N T I O N S122
is very high [12]. The study demonstrated that the presence of at least one ε4 allele, along with clinical data, slightly increased the accuracy of a clinical diagnosis of AD, whereas the absence of an ApoE ε4 allele had little value in either confirming or refuting a clinical diagnosis of AD. Thus, ApoE testing seems to confer negligible diagnostic benefits. The groups in the United States and United Kingdom that have formulated consensus guidelines regarding ApoE genotyping do not recommend ApoE testing as part of the differential diagnostic assessment [13]. But Payami never concluded whether or not ApoE testing might be useful in the differential diagnostic workup [1]. He left the question open, poin-ting to a paper by Mayuex et al [12] and stated that “further research is needed to assess the applicability of this finding to the general popula-tion and to determine the predictive value of ApoE by gender, ethnicity and age”.
The aim of this literature review was to further investigate new evidence for the clinical utility of ApoE testing to 1) differentiate people with AD from normal elderly, 2) differentiate AD from other dementia disorders, and 3) differentiate AD patients from people with mild cognitive impair-ment (MCI). We also searched for evidence that gender, age and ethni-city influence the predictive value of ApoE genotyping.
Literature search strategySearches were conducted in Medline among papers published between January 1, 1990 and June 1, 2004. The keywords were “dementia/gene-tics”, “apolipoprotein”, “comparative or control studies” and “cohort and family studies”. Only papers written in English were requested. A thorough review of the references from “Evidence-based Dementia Practice” was also performed [14].
ResultsThere were 737 titles and abstracts found and reviewed for relevancy, 128 articles allowed calculation of the sensitivity, specificity and likelihood ratio (LR). Many high-quality papers reported only the frequency of the three alleles (ε2, ε3, ε4), making it impossible to calculate the sensi-tivity, specificity and likelihood ratio. Of the 128 papers, 28 more were

C H A P T E R 16 • G E N E T I C M A R K E R S 123
excluded because they did not use standardized criteria for the diagnosis of AD or other dementias, contain a description of a sufficient clinical diagnostic workup, include a comparison group, examine at least 20 + 20 individuals, or perform an independent blind evaluation of the test against the diagnosis. Some of these studies were significant [15–19].
Many studies have examined the utility of ApoE as a diagnostic marker both for AD and in the differential diagnosis of dementia. Thus, refe-rences appear in more than one table. To study age dependency, 80 was used as a cut-off. Early onset AD was compared with late onset AD. The results in Tables 16.1–5 are based on the assumption of at least one ApoE ε4 allele.
We found only one paper that included a sufficient number of patients and controls to permit calculation of sensitivity (19%), specificity (97%) and likelihood ratio (LR+ 5.7, LR– 0.84) for ε4/ε4 as a marker of AD [20]. No conclusions can be drawn from a single study.
ApoE ε4 allele as a marker of AD in comparison with controlsThe results of the grade I and II studies are shown in Table 16.2. Polvi-koski et al in Finland conducted the only grade Ia study [21]. It reported a LR+ of 2.07 and LR– of 0.69 and included a rather small number of AD patients. We found no association between LR and age in the five studies. All studies were conducted among Caucasians, so that the in- fluence of ethnicity cannot be estimated. Sufficient information was not reported in order to analyze the influence of gender.
Table 16.3 shows the results from Population based studies and from studies with highly-selected patients for which clinical diagnosis was the gold standard. Most studies were conducted in the United States and Europe on Caucasians. The few Population based studies of Afri-can-Americans showed a somewhat lower LR+ than those among Cau- casians, Asians and Hispanics. The only study of Arabs reported a very low prevalence of one ApoE ε4 allele: 5% in AD patients and 6% in elderly without dementia [22]. However, the differences for LR+ and

D E M E N T I A – D I AG N O S T I C A N D T H E R A P E U T I C I N T E RV E N T I O N S124
LR– among studies of different ethnicity, age and onset were not sta-tistically significant (ANOVA and independent t-test). Gender-specific prevalence rates of ApoE ε4 were reported in only few studies, rendering statistical testing meaningless.
LR+ test was highest and LR– test was lowest among grade 2b studies (Table 16.1). But those studies are not representative of any clinical set-ting, because the controls are not representative of the cohort referred to clinical settings such as memory clinics or specialized outpatient clinics. Only three studies reported LR+ above 5, which is a significant predic-tive value for a diagnostic test, whereas none of these studies showed LR– below 0.4. All three were grade 2b studies with an extremely low prevalence of ApoE ε4 alleles among the controls [23–26].
ApoE ε4 allele as marker of AD compared to other dementia disordersTable 16.4 shows the studies that compared ApoE ε4 allele as a marker for distinguishing AD from other dementias. Seventeen of the studies in Table 16.4 compared the presence of at least one ApoE ε4 allele in AD and VaD. The results of those studies averaged LR+ of 1.8 (1.4–2.2, 95% CI) and LR– of 0.74 (0.64–0.84, 95% CI), indicating that ApoE genotyping is a poor diagnostic method for differentiating AD from VaD. No differences in LR+ and LR– were found with regard to ethni-city and age. The information on gender and age at disease onset was not sufficient to allow for statistical testing.
Two grade Ib studies – one from the United States and one from the United Kingdom – were identified that contained reliable information regarding ApoE genotype in Diffuse Lewy Body Dementia (DLBD), with LR+ of 1.9 and LR– of 0.55 differentiating AD from DLBD in one study and LR+ of 1.0 and LR– of 1.0 differentiating AD from DLBD in the other study [27,28]. These results confirm that ApoE genotyping is not useful in the differential diagnostic workup of DLBD.

C H A P T E R 16 • G E N E T I C M A R K E R S 125
ApoE ε4 allele as marker of AD compared to MCIEight studies of sufficient quality were found that describe the discrimi-natory effect of having at least one ApoE ε4 allele between patients with AD and MCI. Four studies used the diagnostic term MCI, one used the term Age Associated Memory Impairment (AAMI) and one used the term Questionable Dementia (QD). As can be seen from Tables 16.1 and 16.5, LR+ varied between 0.7 and 2.4 and LR– varied between 0.64 and 1.1. This is not surprising given the suggestion that more than 50% of patients with MCI will develop AD. Comparisons of LR across ethnici-ty, gender and age at onset were not meaningful given the small number of patients and studies.
ApoE ε4 allele as marker of FTLD compared to normal controlsThe search revealed 16 studies that compared the ApoE genotype be-tween patients suffering from FTLD and elderly controls [29–45]. Two studies recruited their respondents from Population based studies, whereas the remaining 14 included highly-selected patients and controls. Most studies included very few patients and controls, and some did not report sufficient information in order to calculate sensitivity and specifi-city [29,33,35,37,41,43,45], leaving few studies with enough respondents to calculate sensitivity, specificity and LR+. Verpillat et al, 2002, who conducted the largest of these studies with 94 patients and 392 controls, reported a sensitivity of having at least one ApoE ε4 allele of 19.1% and a specificity of 69.1% [42]. A meta-analysis of seven case-control stu-dies yielded a sensitivity of 26.7%, specificity of 73.8%, LR+ of 1.0 and LR– of 1.0 [42]. According to the meta-analysis, ApoE genotyping is not helpful in diagnosing FTLD.

D E M E N T I A – D I AG N O S T I C A N D T H E R A P E U T I C I N T E RV E N T I O N S126
Table 16.1 ApoE ℇ4 as a diagnostic marker of Alzheimer’s disease (AD). Summary of results.
Comparison Number Number Sensitivity Specificity LR+ LR– Quality of groups of studies of people Median (range) Median (range) Median (range) Median (range) of study
AD vs 5 700 58% (43–65) 75% (70–79) 2.1 (2.0–2.7) 0.58 (0.37–0.72) I/II a+bcontrols 718
AD vs 32 3 860 45% (5–73) 74% (60–94) 1.7 (0.8–5.6) 0.73 (0.38–1.0) 1a+bcontrols 23 749
AD vs 44 5 220 55% (19–87) 79% (64–95) 2.4 (1.7–5.7) 0.60 (0.16–0.9) 2a+bcontrols 7 317
AD vs 81 9 780 49% (5–87) 77% (60–95) 2.1 (0.8–5.7) 0.64 (0.16–1.0) All gradescontrols 31 784
AD vs 9 2 807 58% (32–83) 67% (40–88) 1.9 (1.0–4.9) 0.77 (0.20–1.0) All gradesOD 823
AD vs 17 2 191 51% (32–65) 70% (50–88) 1.5 (0.8–3.6) 0.73 (0.46–1.2) All gradesVaD 1 045
AD vs 8 1 554 55% (5–62) 57% (39–93) 1.2 (0.7–2.4) 0.84 (0.64–1.1) All gradesMCI 856
AD = Alzheimer’s disease; MCI = Mild cognitive impairment; OD = Other dementias except VaD; VaD = Vascular dementia

C H A P T E R 16 • G E N E T I C M A R K E R S 127
Table 16.1 ApoE ℇ4 as a diagnostic marker of Alzheimer’s disease (AD). Summary of results.
Comparison Number Number Sensitivity Specificity LR+ LR– Quality of groups of studies of people Median (range) Median (range) Median (range) Median (range) of study
AD vs 5 700 58% (43–65) 75% (70–79) 2.1 (2.0–2.7) 0.58 (0.37–0.72) I/II a+bcontrols 718
AD vs 32 3 860 45% (5–73) 74% (60–94) 1.7 (0.8–5.6) 0.73 (0.38–1.0) 1a+bcontrols 23 749
AD vs 44 5 220 55% (19–87) 79% (64–95) 2.4 (1.7–5.7) 0.60 (0.16–0.9) 2a+bcontrols 7 317
AD vs 81 9 780 49% (5–87) 77% (60–95) 2.1 (0.8–5.7) 0.64 (0.16–1.0) All gradescontrols 31 784
AD vs 9 2 807 58% (32–83) 67% (40–88) 1.9 (1.0–4.9) 0.77 (0.20–1.0) All gradesOD 823
AD vs 17 2 191 51% (32–65) 70% (50–88) 1.5 (0.8–3.6) 0.73 (0.46–1.2) All gradesVaD 1 045
AD vs 8 1 554 55% (5–62) 57% (39–93) 1.2 (0.7–2.4) 0.84 (0.64–1.1) All gradesMCI 856
AD = Alzheimer’s disease; MCI = Mild cognitive impairment; OD = Other dementias except VaD; VaD = Vascular dementia

D E M E N T I A – D I AG N O S T I C A N D T H E R A P E U T I C I N T E RV E N T I O N S128
Table 16.2 ApoE ℇ4 (≥1 ℇ4) as a diagnostic marker. Alzheimer’s disease vs non-demented controls. Quality of study I and II (neuropathologic diagnosis).
Author Sample Age (years) Clinical criteria Path SS SP LR+ LR– Quality Comments Year Criteria of study Reference Country
Polvikoski et al AD = 41 85+ NINCDS CERAD 0.47 0.77 2.07 0.69 Ia2001 Co = 329 ADRDA[21] DSM-III-RFinland
Tsuang et al AD = 94 80±7 NINCDS CERAD 0.59 0.71 2.03 0.58 Ib1999 Co = 38 ADRDA[46] DSM-III-RUSA
Singleton et al AD = 194 41+ NINCDS >5 SP 0.58 0.75 2.3 0.56 Ib2002 Co = 111 ADRDA >1 NFT[28] EOAD = 40 0.53 0.74 2.1 0.64 EOADUnited Kingdom LOAD = 73 0.59 0.72 2.1 0.57 LOAD
Bennett et al AD = 51 NINCDS CERAD 0.43 0.79 2.1 0.72 Ib2003 Co = 77 ADRDA[47]USA
Nielsen et al AD = 320 DSM-III-R CERAD 0.65 0.7 2.7 0.37 IIb2003 Co = 163 Braak[48]Denmark
AD = Alzheimer’s disease; CERAD = Consortium to establish a registry for Alzheimer’s disease; Co = Non-demented controls; EOAD = Early onset Alzheimer’s disease; LOAD = Late onset Alzheimer’s disease; LR+ = Likelihood ratio; NFT = Neurofibrillary tangles; SN = Senile plaques; SS = Sensitivity; SP = Specificity
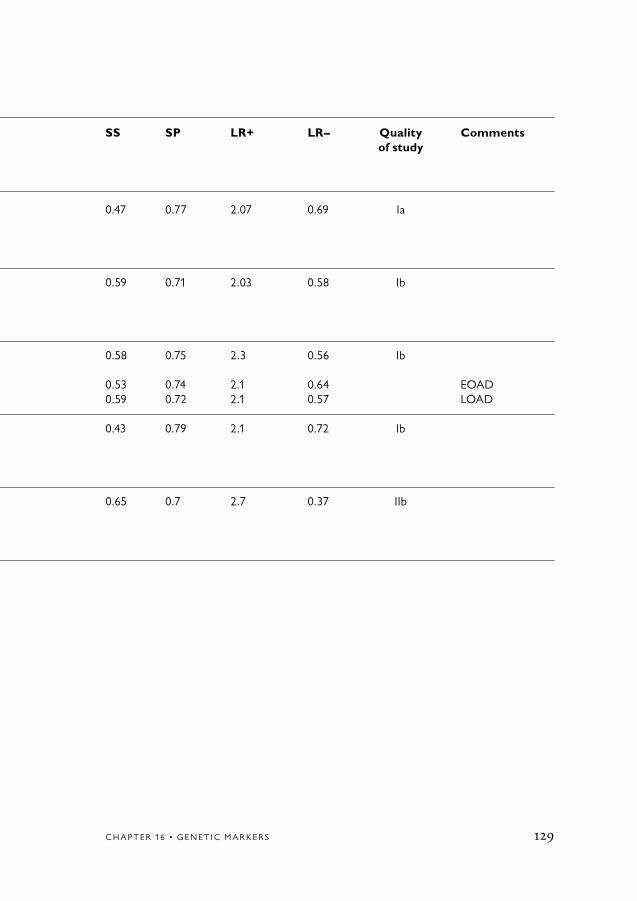
C H A P T E R 16 • G E N E T I C M A R K E R S 129
Table 16.2 ApoE ℇ4 (≥1 ℇ4) as a diagnostic marker. Alzheimer’s disease vs non-demented controls. Quality of study I and II (neuropathologic diagnosis).
Author Sample Age (years) Clinical criteria Path SS SP LR+ LR– Quality Comments Year Criteria of study Reference Country
Polvikoski et al AD = 41 85+ NINCDS CERAD 0.47 0.77 2.07 0.69 Ia2001 Co = 329 ADRDA[21] DSM-III-RFinland
Tsuang et al AD = 94 80±7 NINCDS CERAD 0.59 0.71 2.03 0.58 Ib1999 Co = 38 ADRDA[46] DSM-III-RUSA
Singleton et al AD = 194 41+ NINCDS >5 SP 0.58 0.75 2.3 0.56 Ib2002 Co = 111 ADRDA >1 NFT[28] EOAD = 40 0.53 0.74 2.1 0.64 EOADUnited Kingdom LOAD = 73 0.59 0.72 2.1 0.57 LOAD
Bennett et al AD = 51 NINCDS CERAD 0.43 0.79 2.1 0.72 Ib2003 Co = 77 ADRDA[47]USA
Nielsen et al AD = 320 DSM-III-R CERAD 0.65 0.7 2.7 0.37 IIb2003 Co = 163 Braak[48]Denmark
AD = Alzheimer’s disease; CERAD = Consortium to establish a registry for Alzheimer’s disease; Co = Non-demented controls; EOAD = Early onset Alzheimer’s disease; LOAD = Late onset Alzheimer’s disease; LR+ = Likelihood ratio; NFT = Neurofibrillary tangles; SN = Senile plaques; SS = Sensitivity; SP = Specificity

D E M E N T I A – D I AG N O S T I C A N D T H E R A P E U T I C I N T E RV E N T I O N S130
Table 16.3 ApoE ℇ4 (≥1 ℇ4) as a diagnostic test. Alzheimer’s disease (AD) vs non-demented controls. Quality of study 1 and 2 (clinical diagnosis).
Author Sample Age (years) Clinical SS SP LR+ LR– Quality Comments Year criteria of study Reference Country
Lannfelt et al AD = 124 80+ NINCDS 0.73 0.72 2.7 0.38 1a Familial 1994 Co = 508 ADRDA 0.38 0.72 1.3 0.86 Sporadic[49] DSM-III-RSweden
van Duijn et al AD = 175 63±4 NINCDS 0.53 0.73 1.96 0.64 1a1994 Co = 159 ADRDA[50]The Netherlands
Kukull et al AD = 234 80±7 DSM-III-R/IV 0.52 0.74 2.02 0.66 1a1996 Co = 304[51]USA
Myers et al AD = 43 80±6 NINCDS 0.49 0.79 2.37 0.65 1a1996 Co = 962 ADRDA[52]USA
Tang et al AD = 305 65+ NINCDS 0.36 0.61 0.92 1.0 1a Afro-American1996 Co = 485 ADRDA 0.47 0.82 2.66 0.65 Caucasian[53] 0.34 0.81 1.79 0.79 HispanicUSA
Evans et al AD = 88 79±6 NINCDS 0.23 0.84 1.70 0.92 1a1997 Co = 490 ADRDA[54]USA
Katzman et al AD = 65 60–96 NINCDS 0.46 0.80 2.62 0.68 1a Asian1997 Co = 363 ADRDA[55] DSM-III-RChina Sahota et al AD = 60 83±6 NINCDS 0.50 0.61 1.27 0.82 1a Afro-American 1997 Co = 216 ADRDA [56] DSM-III-R USA ICD-10

C H A P T E R 16 • G E N E T I C M A R K E R S 131
Table 16.3 ApoE ℇ4 (≥1 ℇ4) as a diagnostic test. Alzheimer’s disease (AD) vs non-demented controls. Quality of study 1 and 2 (clinical diagnosis).
Author Sample Age (years) Clinical SS SP LR+ LR– Quality Comments Year criteria of study Reference Country
Lannfelt et al AD = 124 80+ NINCDS 0.73 0.72 2.7 0.38 1a Familial 1994 Co = 508 ADRDA 0.38 0.72 1.3 0.86 Sporadic[49] DSM-III-RSweden
van Duijn et al AD = 175 63±4 NINCDS 0.53 0.73 1.96 0.64 1a1994 Co = 159 ADRDA[50]The Netherlands
Kukull et al AD = 234 80±7 DSM-III-R/IV 0.52 0.74 2.02 0.66 1a1996 Co = 304[51]USA
Myers et al AD = 43 80±6 NINCDS 0.49 0.79 2.37 0.65 1a1996 Co = 962 ADRDA[52]USA
Tang et al AD = 305 65+ NINCDS 0.36 0.61 0.92 1.0 1a Afro-American1996 Co = 485 ADRDA 0.47 0.82 2.66 0.65 Caucasian[53] 0.34 0.81 1.79 0.79 HispanicUSA
Evans et al AD = 88 79±6 NINCDS 0.23 0.84 1.70 0.92 1a1997 Co = 490 ADRDA[54]USA
Katzman et al AD = 65 60–96 NINCDS 0.46 0.80 2.62 0.68 1a Asian1997 Co = 363 ADRDA[55] DSM-III-RChina Sahota et al AD = 60 83±6 NINCDS 0.50 0.61 1.27 0.82 1a Afro-American 1997 Co = 216 ADRDA [56] DSM-III-R USA ICD-10
The table continues on the next page

D E M E N T I A – D I AG N O S T I C A N D T H E R A P E U T I C I N T E RV E N T I O N S132
Table 16.3 continued
Author Sample Age (years) Clinical SS SP LR+ LR– Quality Comments Year criteria of study Reference Country
Slooter et al AD = 70 80±7 NINCDS 0.39 0.73 1.45 0.84 1a1997 Co = 507 ADRDA[57] DSMIVUSA
Notkola et al AD = 27 70–89 NINCDS 0.45 0.74 1.73 0.74 1a1998 Co = 397 ADRDA[58] DSM-IVFinland
Skoog et al AD = 52 85 NINCDS 0.56 0.61 1.44 0.72 1a1998 Co = 303 ADRDA[59]Sweden
Slooter et al AD = 97 82±7 NINCDS 0.53 0.72 1.90 0.65 1a1998 Co = 997 ADRDA[60]The Netherlands
Tang et al AD = 221 75±6 NINCDS 0.34 0.60 0.85 1.00 1a Afro-American1998 Co = 1 079 ADRDA 0.30 0.77 1.30 0.91 Caucasian[61] 0.27 0.75 1.08 0.97 HispanicUSA
Tilvis et al AD = 41 75+ DSM-III-R 0.51 0.76 2.13 0.64 1a1998 Co = 474[62]Finland
Devi et al AD = 106 78±7 NINCDS 0.35 0.73 1.30 0.89 1a1999 Co = 220 ADRDA[63]USA
Tsuang et al AD = 94 80±7 NINCDS 0.49 0.84 3.06 0.61 1a1999 Co = 38 ADRDA[46] DSM-III-RUSA

C H A P T E R 16 • G E N E T I C M A R K E R S 133
Table 16.3 continued
Author Sample Age (years) Clinical SS SP LR+ LR– Quality Comments Year criteria of study Reference Country
Slooter et al AD = 70 80±7 NINCDS 0.39 0.73 1.45 0.84 1a1997 Co = 507 ADRDA[57] DSMIVUSA
Notkola et al AD = 27 70–89 NINCDS 0.45 0.74 1.73 0.74 1a1998 Co = 397 ADRDA[58] DSM-IVFinland
Skoog et al AD = 52 85 NINCDS 0.56 0.61 1.44 0.72 1a1998 Co = 303 ADRDA[59]Sweden
Slooter et al AD = 97 82±7 NINCDS 0.53 0.72 1.90 0.65 1a1998 Co = 997 ADRDA[60]The Netherlands
Tang et al AD = 221 75±6 NINCDS 0.34 0.60 0.85 1.00 1a Afro-American1998 Co = 1 079 ADRDA 0.30 0.77 1.30 0.91 Caucasian[61] 0.27 0.75 1.08 0.97 HispanicUSA
Tilvis et al AD = 41 75+ DSM-III-R 0.51 0.76 2.13 0.64 1a1998 Co = 474[62]Finland
Devi et al AD = 106 78±7 NINCDS 0.35 0.73 1.30 0.89 1a1999 Co = 220 ADRDA[63]USA
Tsuang et al AD = 94 80±7 NINCDS 0.49 0.84 3.06 0.61 1a1999 Co = 38 ADRDA[46] DSM-III-RUSA
The table continues on the next page

D E M E N T I A – D I AG N O S T I C A N D T H E R A P E U T I C I N T E RV E N T I O N S134
Table 16.3 continued
Author Sample Age (years) Clinical SS SP LR+ LR– Quality Comments Year criteria of study Reference Country
Lilius et al AD = 94 80±5 DSM-III-R 0.47 0.74 1.80 0.72 1a1999 Co = 176[64]Sweden
Ganguli et al AD = 115 70+ NINCDS 0.28 0.80 1.36 0.98 1a USA2000 Co = 754 ADRDA[65] AD = 28 DSM-III-R 0.29 0.86 2.03 0.83 IndiaUSA/India Co = 4 414
Johnston et al AD = 102 80±5 NINCDS 0.28 0.79 1.39 0.91 1a2000 Co = 375 ADRDA[66] DSM-III-RUSA
Kardaun et al AD = 105 71–93 NINCDS 0.31 0.82 1.70 0.84 1a Asian-American2000 Co = 3 459 ADRDA[67]USA/Honolulu
Molero et al AD = 121 78±9 NINCDS 0.32 0.80 1.60 0.85 1a Hispanic2001 Co = 1 165 ADRDA[68]Venezuela
Bowirrat et al AD = 98 60+ DSM-IV 0.05 0.94 0.80 1.00 1a Arab2002 Co = 173[22]Israel
Romas et al AD = 306 NINCDS 0.53 0.61 1.40 0.77 1a2002 Co = 218 ADRDA[69]Carribean

C H A P T E R 16 • G E N E T I C M A R K E R S 135
Table 16.3 continued
Author Sample Age (years) Clinical SS SP LR+ LR– Quality Comments Year criteria of study Reference Country
Lilius et al AD = 94 80±5 DSM-III-R 0.47 0.74 1.80 0.72 1a1999 Co = 176[64]Sweden
Ganguli et al AD = 115 70+ NINCDS 0.28 0.80 1.36 0.98 1a USA2000 Co = 754 ADRDA[65] AD = 28 DSM-III-R 0.29 0.86 2.03 0.83 IndiaUSA/India Co = 4 414
Johnston et al AD = 102 80±5 NINCDS 0.28 0.79 1.39 0.91 1a2000 Co = 375 ADRDA[66] DSM-III-RUSA
Kardaun et al AD = 105 71–93 NINCDS 0.31 0.82 1.70 0.84 1a Asian-American2000 Co = 3 459 ADRDA[67]USA/Honolulu
Molero et al AD = 121 78±9 NINCDS 0.32 0.80 1.60 0.85 1a Hispanic2001 Co = 1 165 ADRDA[68]Venezuela
Bowirrat et al AD = 98 60+ DSM-IV 0.05 0.94 0.80 1.00 1a Arab2002 Co = 173[22]Israel
Romas et al AD = 306 NINCDS 0.53 0.61 1.40 0.77 1a2002 Co = 218 ADRDA[69]Carribean
The table continues on the next page

D E M E N T I A – D I AG N O S T I C A N D T H E R A P E U T I C I N T E RV E N T I O N S136
Table 16.3 continued
Author Sample Age (years) Clinical SS SP LR+ LR– Quality Comments Year criteria of study Reference Country
Kukull et al AD = 151 65+ NINCDS 0.41 0.67 1.30 0.88 1a2002 Co = 215 ADRDA[70] DSM-IVUSA
Kim et al AD = 104 76±6 NINCDS 0.45 0.92 5.60 0.60 1a Asian2002 Co = 52 ADRDA[26]Korea
Chandak et al AD = 49 40+ NINCDS 0.35 0.83 2.00 0.78 1a Asian2002 Co = 100 ADRDA[71]India
Miech et al AD = 122 65+ NINCDS 0.43 0.70 1.40 0.81 1a2002 Co = 3 099 ADRDA[72] DSM-IIIUSA
Qui et al AD = 206 75+ DSM-III-R 0.35 0.83 2.10 0.50 1a2004 Co = 779[73]Sweden
Hsiung et al AD = 140 82.7 NINCDS 0.36 0.80 1.80 0.56 1a2004 Co = 582 75.6 ADRDA[74] DSM-III-RCanada
Jobst et al AD = 80 57–100 NINCDS 0.70 0.60 1.75 0.50 1b1997 Co = 105 ADRDA[75] DSM-III-RUnited Kingdom
Breitner et al AD = 37 62–73 NINCDS 0.57 0.73 2.10 0.59 1b1998 Co = 344 ADRDA[76]USA

C H A P T E R 16 • G E N E T I C M A R K E R S 137
Table 16.3 continued
Author Sample Age (years) Clinical SS SP LR+ LR– Quality Comments Year criteria of study Reference Country
Kukull et al AD = 151 65+ NINCDS 0.41 0.67 1.30 0.88 1a2002 Co = 215 ADRDA[70] DSM-IVUSA
Kim et al AD = 104 76±6 NINCDS 0.45 0.92 5.60 0.60 1a Asian2002 Co = 52 ADRDA[26]Korea
Chandak et al AD = 49 40+ NINCDS 0.35 0.83 2.00 0.78 1a Asian2002 Co = 100 ADRDA[71]India
Miech et al AD = 122 65+ NINCDS 0.43 0.70 1.40 0.81 1a2002 Co = 3 099 ADRDA[72] DSM-IIIUSA
Qui et al AD = 206 75+ DSM-III-R 0.35 0.83 2.10 0.50 1a2004 Co = 779[73]Sweden
Hsiung et al AD = 140 82.7 NINCDS 0.36 0.80 1.80 0.56 1a2004 Co = 582 75.6 ADRDA[74] DSM-III-RCanada
Jobst et al AD = 80 57–100 NINCDS 0.70 0.60 1.75 0.50 1b1997 Co = 105 ADRDA[75] DSM-III-RUnited Kingdom
Breitner et al AD = 37 62–73 NINCDS 0.57 0.73 2.10 0.59 1b1998 Co = 344 ADRDA[76]USA
The table continues on the next page

D E M E N T I A – D I AG N O S T I C A N D T H E R A P E U T I C I N T E RV E N T I O N S138
Table 16.3 continued
Author Sample Age (years) Clinical SS SP LR+ LR– Quality Comments Year criteria of study Reference Country
Moceri et al AD = 200 60+ NINCDS 0.56 0.74 2.12 0.59 1b2001 Co = 237 ADRDA[77] DSM-III-R/-IVUSA
Stengard et al AD = 27 70–89 DSM-III-R 0.44 0.74 1.72 0.76 2a1995 Co = 353[78]Finland
Mullan et al AD = 107 74±10 NINCDS 0.55 0.73 2.04 0.62 2a1996 Co = 248 ADRDA[79]USA
Bickeboller AD = 417 50+ NINCDS 0.57 0.72 2.04 0.60 2aet al Co = 1 030 ADRDA1997 DSM-III-R[80]France
Quiroga et al AD = 95 65+ NINCDS 0.62 0.64 1.73 0.59 2a Hispanic1999 Co = 187 ADRDA[81] DSM-IVChile ICD-10
Poirier et al AD = 91 75±10 NINCDS 0.63 0.78 2.86 0.47 2b1993 Co = 71 ADRDA[82]Canada
Payami et al AD = 53 60+ NINCDS 0.85 0.71 2.93 0.21 2b1993 Co = 56 ADRDA[83]USA
Ueki et al AD = 42 76±8 DSM-III-R 0.60 0.90 5.74 0.44 2b Asian1993 Co = 96[23]Japan

C H A P T E R 16 • G E N E T I C M A R K E R S 139
Table 16.3 continued
Author Sample Age (years) Clinical SS SP LR+ LR– Quality Comments Year criteria of study Reference Country
Moceri et al AD = 200 60+ NINCDS 0.56 0.74 2.12 0.59 1b2001 Co = 237 ADRDA[77] DSM-III-R/-IVUSA
Stengard et al AD = 27 70–89 DSM-III-R 0.44 0.74 1.72 0.76 2a1995 Co = 353[78]Finland
Mullan et al AD = 107 74±10 NINCDS 0.55 0.73 2.04 0.62 2a1996 Co = 248 ADRDA[79]USA
Bickeboller AD = 417 50+ NINCDS 0.57 0.72 2.04 0.60 2aet al Co = 1 030 ADRDA1997 DSM-III-R[80]France
Quiroga et al AD = 95 65+ NINCDS 0.62 0.64 1.73 0.59 2a Hispanic1999 Co = 187 ADRDA[81] DSM-IVChile ICD-10
Poirier et al AD = 91 75±10 NINCDS 0.63 0.78 2.86 0.47 2b1993 Co = 71 ADRDA[82]Canada
Payami et al AD = 53 60+ NINCDS 0.85 0.71 2.93 0.21 2b1993 Co = 56 ADRDA[83]USA
Ueki et al AD = 42 76±8 DSM-III-R 0.60 0.90 5.74 0.44 2b Asian1993 Co = 96[23]Japan
The table continues on the next page

D E M E N T I A – D I AG N O S T I C A N D T H E R A P E U T I C I N T E RV E N T I O N S140
Table 16.3 continued
Author Sample Age (years) Clinical SS SP LR+ LR– Quality Comments Year criteria of study Reference Country
Dai et al EOAD = 29 75±9 NINCDS 0.72 0.82 4.00 0.34 2b Asian1994 LOAD = 59 ADRDA 0.49 0.82 2.73 0.62[84] Co = 93Japan
Liddell et al AD = 86 74±10 NINCDS 0.48 0.78 2.16 0.67 2b1994 Co = 77 ADRDA[85]United Kingdom
Tsai et al AD = 77 81±9 NINCDS 0.58 0.74 2.25 0.57 2b1994 Co = 77 ADRDA[86] DSM-III-RUSA
Nunomura et al EOAD = 21 50–96 ICD-10 0.57 0.85 3.94 0.51 2b Asian1996 LOAD = 51 0.51 0.85 3.53 0.58[87] Co = 83Japan
Tsuang et al AD = 55 71±7 NINCDS 0.73 0.70 2.40 0.39 2b1996 Co = 99 ADRDA[88]USA
Yang et al AD = 30 NINCDS 0.87 0.80 4.33 0.16 2b1996 Co = 50 ADRDA[89]Australia
Almeida et al AD = 55 45–89 NINCDS 0.36 0.82 2.03 0.78 2b1997 Co = 56 ADRDA[90]Brazil
Kalman et al AD = 50 76±9 NINCDS 0.46 0.87 3.54 0.62 2b1997 Co = 71 ADRDA[91] DSM-II-RHungary

C H A P T E R 16 • G E N E T I C M A R K E R S 141
Table 16.3 continued
Author Sample Age (years) Clinical SS SP LR+ LR– Quality Comments Year criteria of study Reference Country
Dai et al EOAD = 29 75±9 NINCDS 0.72 0.82 4.00 0.34 2b Asian1994 LOAD = 59 ADRDA 0.49 0.82 2.73 0.62[84] Co = 93Japan
Liddell et al AD = 86 74±10 NINCDS 0.48 0.78 2.16 0.67 2b1994 Co = 77 ADRDA[85]United Kingdom
Tsai et al AD = 77 81±9 NINCDS 0.58 0.74 2.25 0.57 2b1994 Co = 77 ADRDA[86] DSM-III-RUSA
Nunomura et al EOAD = 21 50–96 ICD-10 0.57 0.85 3.94 0.51 2b Asian1996 LOAD = 51 0.51 0.85 3.53 0.58[87] Co = 83Japan
Tsuang et al AD = 55 71±7 NINCDS 0.73 0.70 2.40 0.39 2b1996 Co = 99 ADRDA[88]USA
Yang et al AD = 30 NINCDS 0.87 0.80 4.33 0.16 2b1996 Co = 50 ADRDA[89]Australia
Almeida et al AD = 55 45–89 NINCDS 0.36 0.82 2.03 0.78 2b1997 Co = 56 ADRDA[90]Brazil
Kalman et al AD = 50 76±9 NINCDS 0.46 0.87 3.54 0.62 2b1997 Co = 71 ADRDA[91] DSM-II-RHungary
The table continues on the next page

D E M E N T I A – D I AG N O S T I C A N D T H E R A P E U T I C I N T E RV E N T I O N S142
Table 16.3 continued
Author Sample Age (years) Clinical SS SP LR+ LR– Quality Comments Year criteria of study Reference Country
Palumbo et al EOAD = 32 50–88 NINCDS 0.19 0.90 1.88 0.90 2b1997 LOAD = 64 ADRDA 0.61 0.90 6.10 0.54[24] Co = 40Italy
Wang et al AD = 98 71±7 NINCDS 0.34 0.88 2.93 0.75 2b1997 Co = 98 ADRDA[92]Taiwan
Kowalska et al EOAD = 25 30–94 NINCDS 0.24 0.95 4.80 0.80 2b1998 LOAD = 39 ADRDA 0.56 0.95 11.2 0.46[25] Co = 43Poland
Lopez et al AD = 66 75±9 NINCDS 0.44 0.76 1.83 0.74 2b Caucasian1998 Co = 49 73±8 ADRDA[93] AD = 209 0.60 0.64 1.67 0.63 HispanicUSA Co = 58Spain
Bretsky et al AD = 80 81±7 NINCDS 0.71 0.64 2.00 0.45 2b1999 Co = 115 ADRDA[94]USACanada
Kim et al AD = 110 50–85 NINCDS 0.39 0.82 2.22 0.74 2b Asian1999 Co = 226 ADRDA[95]Korea
Lilius et al AD = 175 65±9 NINCDS 0.74 0.69 2.42 0.38 2b1999 Co = 62 ADRDA[64]Sweden

C H A P T E R 16 • G E N E T I C M A R K E R S 143
Table 16.3 continued
Author Sample Age (years) Clinical SS SP LR+ LR– Quality Comments Year criteria of study Reference Country
Palumbo et al EOAD = 32 50–88 NINCDS 0.19 0.90 1.88 0.90 2b1997 LOAD = 64 ADRDA 0.61 0.90 6.10 0.54[24] Co = 40Italy
Wang et al AD = 98 71±7 NINCDS 0.34 0.88 2.93 0.75 2b1997 Co = 98 ADRDA[92]Taiwan
Kowalska et al EOAD = 25 30–94 NINCDS 0.24 0.95 4.80 0.80 2b1998 LOAD = 39 ADRDA 0.56 0.95 11.2 0.46[25] Co = 43Poland
Lopez et al AD = 66 75±9 NINCDS 0.44 0.76 1.83 0.74 2b Caucasian1998 Co = 49 73±8 ADRDA[93] AD = 209 0.60 0.64 1.67 0.63 HispanicUSA Co = 58Spain
Bretsky et al AD = 80 81±7 NINCDS 0.71 0.64 2.00 0.45 2b1999 Co = 115 ADRDA[94]USACanada
Kim et al AD = 110 50–85 NINCDS 0.39 0.82 2.22 0.74 2b Asian1999 Co = 226 ADRDA[95]Korea
Lilius et al AD = 175 65±9 NINCDS 0.74 0.69 2.42 0.38 2b1999 Co = 62 ADRDA[64]Sweden
The table continues on the next page

D E M E N T I A – D I AG N O S T I C A N D T H E R A P E U T I C I N T E RV E N T I O N S144
Table 16.3 continued
Author Sample Age (years) Clinical SS SP LR+ LR– Quality Comments Year criteria of study Reference Country
Nakayama et al EOAD = 33 48±10 NINCDS 0.44 0.86 2.06 0.65 2b Asian1999 LOAD = 25 72±6 ADRDA 0.61 0.86 4.21 0.45[96] Co = 1 090Japan
Scacchi et al AD = 83 86±4 NINCDS 0.3 0.89 2.69 0.79 2b1999 Co = 152 ADRDA[97] DSM-III-RItaly
Traykov et al AD = 155 79±6 NINCDS 0.56 0.86 4.05 0.51 2b1999 Co = 51 ADRDA[98]France
Siest et al AD = 489 75±9 NINCDS 0.54 0.77 2.40 0.60 2b2000 Co = 429 ADRDA[99] DSM-IVItaly
Kim et al EOAD = 45 NINCDS 0.44 0.82 2.52 0.68 2b Asian2001 LOAD = 65 ADRDA 0.35 0.82 1.44 0.92[100] Co = 239 DSM-IVKorea
Rigaud et al AD = 42 68±5 NINCDS 0.57 0.71 2.00 0.61 2b2001 Co = 98 67±5 ADRDA[101]France
Zill et al AD = 89 73±9 NINCDS 0.57 0.71 1.99 0.61 2b2001 Co = 118 ADRDA[102]Germany
Yang et al AD = 191 65+ NINCDS 0.48 0.79 2.31 0.66 2b Asian2001 Co = 218 ADRDA[103]China

C H A P T E R 16 • G E N E T I C M A R K E R S 145
Table 16.3 continued
Author Sample Age (years) Clinical SS SP LR+ LR– Quality Comments Year criteria of study Reference Country
Nakayama et al EOAD = 33 48±10 NINCDS 0.44 0.86 2.06 0.65 2b Asian1999 LOAD = 25 72±6 ADRDA 0.61 0.86 4.21 0.45[96] Co = 1 090Japan
Scacchi et al AD = 83 86±4 NINCDS 0.3 0.89 2.69 0.79 2b1999 Co = 152 ADRDA[97] DSM-III-RItaly
Traykov et al AD = 155 79±6 NINCDS 0.56 0.86 4.05 0.51 2b1999 Co = 51 ADRDA[98]France
Siest et al AD = 489 75±9 NINCDS 0.54 0.77 2.40 0.60 2b2000 Co = 429 ADRDA[99] DSM-IVItaly
Kim et al EOAD = 45 NINCDS 0.44 0.82 2.52 0.68 2b Asian2001 LOAD = 65 ADRDA 0.35 0.82 1.44 0.92[100] Co = 239 DSM-IVKorea
Rigaud et al AD = 42 68±5 NINCDS 0.57 0.71 2.00 0.61 2b2001 Co = 98 67±5 ADRDA[101]France
Zill et al AD = 89 73±9 NINCDS 0.57 0.71 1.99 0.61 2b2001 Co = 118 ADRDA[102]Germany
Yang et al AD = 191 65+ NINCDS 0.48 0.79 2.31 0.66 2b Asian2001 Co = 218 ADRDA[103]China
The table continues on the next page

D E M E N T I A – D I AG N O S T I C A N D T H E R A P E U T I C I N T E RV E N T I O N S146
Table 16.3 continued
Author Sample Age (years) Clinical SS SP LR+ LR– Quality Comments Year criteria of study Reference Country
Huang et al AD = 99 NINCDS 0.32 0.84 2.00 0.81 2b Asian2002 Co = 96 ADRDA[104]Taiwan
Graff-Radford AD = 338 NINCDS 0.65 0.67 2.00 0.52 2b Afro-Americanet al Co = 301 ADRDA2002[20]USA
Frank et al AD = 83 NINCDS 0.54 0.87 4.20 0.53 2b Hispanic2002 Co = 97 ADRDA[105]Spain
Solfrizzi et al AD = 61 68±7 NINCDS 0.30 0.87 2.40 0.80 2b2002 Co = 63 ADRDA[106]Italy
Panza et al AD = 49 72±9 NINCDS 0.31 0.85 2.00 0.81 2b2003 Co = 45 ADRDA[107]Italy
Hawi et al AD = 110 65+ NINCDS 0.65 0.65 1.90 0.54 2b2003 Co = 217 ADRDA[108]Ireland
Styczynska et al AD = 100 70±7 NINCDS 0.58 0.79 2.80 0.36 2b2003 Co = 100 74±7 ADRDA[109]Poland

C H A P T E R 16 • G E N E T I C M A R K E R S 147
Table 16.3 continued
Author Sample Age (years) Clinical SS SP LR+ LR– Quality Comments Year criteria of study Reference Country
Huang et al AD = 99 NINCDS 0.32 0.84 2.00 0.81 2b Asian2002 Co = 96 ADRDA[104]Taiwan
Graff-Radford AD = 338 NINCDS 0.65 0.67 2.00 0.52 2b Afro-Americanet al Co = 301 ADRDA2002[20]USA
Frank et al AD = 83 NINCDS 0.54 0.87 4.20 0.53 2b Hispanic2002 Co = 97 ADRDA[105]Spain
Solfrizzi et al AD = 61 68±7 NINCDS 0.30 0.87 2.40 0.80 2b2002 Co = 63 ADRDA[106]Italy
Panza et al AD = 49 72±9 NINCDS 0.31 0.85 2.00 0.81 2b2003 Co = 45 ADRDA[107]Italy
Hawi et al AD = 110 65+ NINCDS 0.65 0.65 1.90 0.54 2b2003 Co = 217 ADRDA[108]Ireland
Styczynska et al AD = 100 70±7 NINCDS 0.58 0.79 2.80 0.36 2b2003 Co = 100 74±7 ADRDA[109]Poland
The table continues on the next page

D E M E N T I A – D I AG N O S T I C A N D T H E R A P E U T I C I N T E RV E N T I O N S148
Table 16.3 continued
Author Sample Age (years) Clinical SS SP LR+ LR– Quality Comments Year criteria of study Reference Country
Souza et al AD = 68 65–82 NINCDS 0.46 0.79 2.20 0.45 2b2003 Co = 58 ADRDA[110]Brazil
Wehr et al AD = 29 48–83 NINCDS 0.48 0.83 2.80 0.35 2b2003 Co = 41 ADRDA[111] DSM-IVPoland
Finckh et al AD = 347 74±9 NINCDS 0.60 0.75 2.40 0.42 2b2003 Co = 291 68±12 ADRDA[112]Germany
Feldman et al AD = 290 73.1+9 DSM-III-R 0.62 0.75 2.50 0.40 2b2003 Co = 65 61.3+12[113]Canada
Borroni et al AD = 157 72.2±8 NINCDS 0.41 0.84 2.60 0.70 2b2004 Co = 134 ADRDA[114]Italy
Luthra et al AD = 29 66.6±9 NINCDS 0.52 0.83 3.10 0.33 2b Asian2004 Co = 76 63,2±10 ADRDA[115]India
AD = Alzheimer’s disease; Co = Non-demented controls; EOAD = Early onset Alzheimer’s disease; LOAD = Late onset Alzheimer’s disease; LR+ = Likelihood ratio; SP = Specificity; SS = Sensitivity

C H A P T E R 16 • G E N E T I C M A R K E R S 149
Table 16.3 continued
Author Sample Age (years) Clinical SS SP LR+ LR– Quality Comments Year criteria of study Reference Country
Souza et al AD = 68 65–82 NINCDS 0.46 0.79 2.20 0.45 2b2003 Co = 58 ADRDA[110]Brazil
Wehr et al AD = 29 48–83 NINCDS 0.48 0.83 2.80 0.35 2b2003 Co = 41 ADRDA[111] DSM-IVPoland
Finckh et al AD = 347 74±9 NINCDS 0.60 0.75 2.40 0.42 2b2003 Co = 291 68±12 ADRDA[112]Germany
Feldman et al AD = 290 73.1+9 DSM-III-R 0.62 0.75 2.50 0.40 2b2003 Co = 65 61.3+12[113]Canada
Borroni et al AD = 157 72.2±8 NINCDS 0.41 0.84 2.60 0.70 2b2004 Co = 134 ADRDA[114]Italy
Luthra et al AD = 29 66.6±9 NINCDS 0.52 0.83 3.10 0.33 2b Asian2004 Co = 76 63,2±10 ADRDA[115]India
AD = Alzheimer’s disease; Co = Non-demented controls; EOAD = Early onset Alzheimer’s disease; LOAD = Late onset Alzheimer’s disease; LR+ = Likelihood ratio; SP = Specificity; SS = Sensitivity

D E M E N T I A – D I AG N O S T I C A N D T H E R A P E U T I C I N T E RV E N T I O N S150
Table 16.4 ApoE ℇ4 (≥1 ℇ4) as a diagnostic marker. Alzheimer’s disease vs other dementias.
Author Sample Age (years) Clinical criteria Path SS SP LR+ LR– Quality Comments Year criteria of study Reference Country
Polvikoski et al AD = 41 85+ NINCDS CERAD 0.47 0.59 1.16 0.90 Ia2001 OD = 47 ADRDA[21]Finland
Welsh-Bohmer AD = 139 77±8 NINCDS CERAD 0.83 0.83 4.88 0.20 Ibet al OD = 23 ADRDA1997[116]USA
Mayeux et al AD = 1 770 72±10 NINCDS CERAD 0.65 0.68 2.03 0.51 IIb CERAD used 1998 OD = 418 ADRDA Khachatu in some cases[12] DSM-III-RUSA
Rosenberg et al AD = 181 77 at death CERAD 0.63 0.67 1.90 0.55 IIb2001 LBD = 81 Braak[27]USA
Singleton et al AD = 194 41+ NINCDS >5 SP 0.58 0.40 1.00 1.00 Ib2002 LBD = 76 ADRDA >1 NFT[28] NewcastleUnited Kingdom
Nielsen et al AD = 320 DSM-III-R CERAD 0.65 0.70 2.20 0.46 IIb2003 VaD = 163 Braak[48]Denmark
Myers et al AD = 43 80±6 NINCDS 0.49 0.64 1.36 0.80 1a1996 OD = 25 ADRDA[52] DSM-IIIUSA

C H A P T E R 16 • G E N E T I C M A R K E R S 151
Table 16.4 ApoE ℇ4 (≥1 ℇ4) as a diagnostic marker. Alzheimer’s disease vs other dementias.
Author Sample Age (years) Clinical criteria Path SS SP LR+ LR– Quality Comments Year criteria of study Reference Country
Polvikoski et al AD = 41 85+ NINCDS CERAD 0.47 0.59 1.16 0.90 Ia2001 OD = 47 ADRDA[21]Finland
Welsh-Bohmer AD = 139 77±8 NINCDS CERAD 0.83 0.83 4.88 0.20 Ibet al OD = 23 ADRDA1997[116]USA
Mayeux et al AD = 1 770 72±10 NINCDS CERAD 0.65 0.68 2.03 0.51 IIb CERAD used 1998 OD = 418 ADRDA Khachatu in some cases[12] DSM-III-RUSA
Rosenberg et al AD = 181 77 at death CERAD 0.63 0.67 1.90 0.55 IIb2001 LBD = 81 Braak[27]USA
Singleton et al AD = 194 41+ NINCDS >5 SP 0.58 0.40 1.00 1.00 Ib2002 LBD = 76 ADRDA >1 NFT[28] NewcastleUnited Kingdom
Nielsen et al AD = 320 DSM-III-R CERAD 0.65 0.70 2.20 0.46 IIb2003 VaD = 163 Braak[48]Denmark
Myers et al AD = 43 80±6 NINCDS 0.49 0.64 1.36 0.80 1a1996 OD = 25 ADRDA[52] DSM-IIIUSA
The table continues on the next page

D E M E N T I A – D I AG N O S T I C A N D T H E R A P E U T I C I N T E RV E N T I O N S152
Table 16.4 continued
Author Sample Age (years) Clinical criteria Path SS SP LR+ LR– Quality Comments Year criteria of study Reference Country
Katzman et al AD = 65 60–96 NINCDS 0.46 0.67 1.38 0.81 1a1997 VaD = 27 ADRDA[55] DSM-III-RChina
Slooter et al AD = 70 80±7 NINCDS 0.39 0.64 1.08 0.95 1a1997 VaD = 90 ADRDA[57] NINDS-AIRENUSA
Notkola et al AD = 27 70–89 DSM-III-R 0.45 0.65 1.35 0.85 1a1998 VaD = 20[58]Finland
Skoog et al AD = 52 85 DSM-III-R 0.56 0.50 1.12 0.88 1a1998 MID = 34[59]Sweden
Tilvis et al AD = 41 75+ DSM-III-R 0.51 0.66 1.50 0.74 1a1998 VaD = 35[62]Finland
Molero et al AD = 121 78±9 NINCDS 0.32 0.88 2.75 0.77 1a2001 VaD = 34 ADRDA[68] ADDTCVenezuela
Hsiung et al AD = 140 82.7 NINCDS 0.36 0.57 0.80 1.20 1a2004 VaD = 51 77 ADRDA[74] DSM-III-RCanada
Kalman et al AD = 50 76±9 NINCDS 0.46 0.82 2.56 0.66 2b1997 OD = 60 ADRDA[91] DSM-III-RHungary
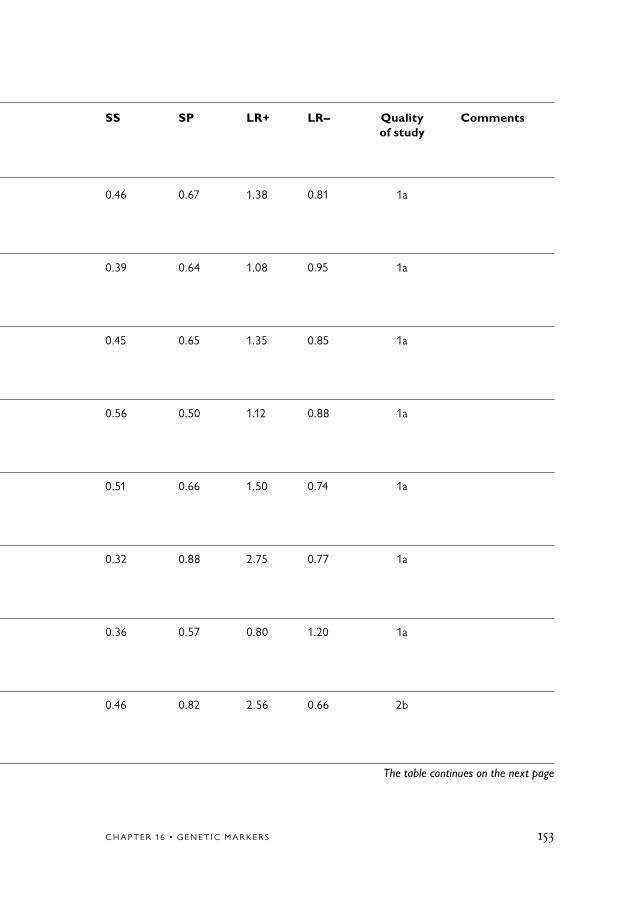
C H A P T E R 16 • G E N E T I C M A R K E R S 153
Table 16.4 continued
Author Sample Age (years) Clinical criteria Path SS SP LR+ LR– Quality Comments Year criteria of study Reference Country
Katzman et al AD = 65 60–96 NINCDS 0.46 0.67 1.38 0.81 1a1997 VaD = 27 ADRDA[55] DSM-III-RChina
Slooter et al AD = 70 80±7 NINCDS 0.39 0.64 1.08 0.95 1a1997 VaD = 90 ADRDA[57] NINDS-AIRENUSA
Notkola et al AD = 27 70–89 DSM-III-R 0.45 0.65 1.35 0.85 1a1998 VaD = 20[58]Finland
Skoog et al AD = 52 85 DSM-III-R 0.56 0.50 1.12 0.88 1a1998 MID = 34[59]Sweden
Tilvis et al AD = 41 75+ DSM-III-R 0.51 0.66 1.50 0.74 1a1998 VaD = 35[62]Finland
Molero et al AD = 121 78±9 NINCDS 0.32 0.88 2.75 0.77 1a2001 VaD = 34 ADRDA[68] ADDTCVenezuela
Hsiung et al AD = 140 82.7 NINCDS 0.36 0.57 0.80 1.20 1a2004 VaD = 51 77 ADRDA[74] DSM-III-RCanada
Kalman et al AD = 50 76±9 NINCDS 0.46 0.82 2.56 0.66 2b1997 OD = 60 ADRDA[91] DSM-III-RHungary
The table continues on the next page

D E M E N T I A – D I AG N O S T I C A N D T H E R A P E U T I C I N T E RV E N T I O N S154
Table 16.4 continued
Author Sample Age (years) Clinical criteria Path SS SP LR+ LR– Quality Comments Year criteria of study Reference Country
Nakayama et al AD = 55 72±10 NINCDS 0.53 0.76 1.67 0.62 2b1999 VaD = 45 ADRDA[96] NINDS-AIRENJapan
Traykov et al AD = 155 79±6 NINCDS 0.56 0.76 2.33 0.58 2b1999 VaD = 21 ADRDA[98] NINDS-AIRENFrance
Yang et al AD = 191 65+ NINCDS 0.48 0.71 1.40 0.73 2b2001 VaD = 124 ADRDA[103] NINDS-AIRENChina
Traykov et al AD = 219 78±6 DSM-IV 0.54 0.80 2.70 0.58 2b2002 VaD = 45 NINDS-AIREN[117]France
Huang et al AD = 99 NINCDS 0.32 0.82 1.70 0.83 2b2002 VaD = 70 ADRDA[104] DSM-IVTaiwan
Huang et al AD = 99 NINCDS 0.32 0.88 2.70 0.77 2b2002 OD = 23 ADRDA[104] DSM-IVTaiwan
Frank et al AD = 83 NINCDS 0.54 0.85 3.60 0.54 2b2002 VaD = 26 ADRDA[105] ICD-10Spain
Wehr et al AD = 29 48–83 DSM-IV 0.48 0.78 2.20 0.46 2b2003 VaD = 46[111]Poland

C H A P T E R 16 • G E N E T I C M A R K E R S 155
Table 16.4 continued
Author Sample Age (years) Clinical criteria Path SS SP LR+ LR– Quality Comments Year criteria of study Reference Country
Nakayama et al AD = 55 72±10 NINCDS 0.53 0.76 1.67 0.62 2b1999 VaD = 45 ADRDA[96] NINDS-AIRENJapan
Traykov et al AD = 155 79±6 NINCDS 0.56 0.76 2.33 0.58 2b1999 VaD = 21 ADRDA[98] NINDS-AIRENFrance
Yang et al AD = 191 65+ NINCDS 0.48 0.71 1.40 0.73 2b2001 VaD = 124 ADRDA[103] NINDS-AIRENChina
Traykov et al AD = 219 78±6 DSM-IV 0.54 0.80 2.70 0.58 2b2002 VaD = 45 NINDS-AIREN[117]France
Huang et al AD = 99 NINCDS 0.32 0.82 1.70 0.83 2b2002 VaD = 70 ADRDA[104] DSM-IVTaiwan
Huang et al AD = 99 NINCDS 0.32 0.88 2.70 0.77 2b2002 OD = 23 ADRDA[104] DSM-IVTaiwan
Frank et al AD = 83 NINCDS 0.54 0.85 3.60 0.54 2b2002 VaD = 26 ADRDA[105] ICD-10Spain
Wehr et al AD = 29 48–83 DSM-IV 0.48 0.78 2.20 0.46 2b2003 VaD = 46[111]Poland
The table continues on the next page

D E M E N T I A – D I AG N O S T I C A N D T H E R A P E U T I C I N T E RV E N T I O N S156
Table 16.4 continued
Author Sample Age (years) Clinical criteria Path SS SP LR+ LR– Quality Comments Year criteria of study Reference Country
Engelborghs AD = 504 78.9±8 NINCDS 0.56 0.57 1.30 0.77 2bet al Co = 189 58.8±17 ADRDA2003 DSM-IV[118] Belgium
Feldman et al AD = 290 73.1±9 DSM-III-R 0.62 0.49 1.20 0.79 2b2003 OD = 70[113]Canada
Luthra et al AD = 29 66.6±9 NINDS 0.52 0.56 1.20 0.85 2b Asian2004 VaD = 25 65.3±10 AIREN[115]India
AD = Alzheimer’s disease; LBD = Lewy body dementia; LR = Likelihood ratio; MID = Multiinfarct dementia; OD = Other dementias; SP = Specificity; SS = Sensitivity; VaD = Vascular dementia

C H A P T E R 16 • G E N E T I C M A R K E R S 157
Table 16.4 continued
Author Sample Age (years) Clinical criteria Path SS SP LR+ LR– Quality Comments Year criteria of study Reference Country
Engelborghs AD = 504 78.9±8 NINCDS 0.56 0.57 1.30 0.77 2bet al Co = 189 58.8±17 ADRDA2003 DSM-IV[118] Belgium
Feldman et al AD = 290 73.1±9 DSM-III-R 0.62 0.49 1.20 0.79 2b2003 OD = 70[113]Canada
Luthra et al AD = 29 66.6±9 NINDS 0.52 0.56 1.20 0.85 2b Asian2004 VaD = 25 65.3±10 AIREN[115]India
AD = Alzheimer’s disease; LBD = Lewy body dementia; LR = Likelihood ratio; MID = Multiinfarct dementia; OD = Other dementias; SP = Specificity; SS = Sensitivity; VaD = Vascular dementia

D E M E N T I A – D I AG N O S T I C A N D T H E R A P E U T I C I N T E RV E N T I O N S158
Table 16.5 ApoE ℇ4 (≥1 ℇ4) as a diagnostic marker. Alzheimer’s disease vs MCI.
Author Sample Age Clinical SS SP LR+ LR– Quality of study Year (years) criteria Reference Country
Katzman et al AD = 65 60–96 NINCDS 0.46 0.80 2.36 0.68 1a1997 QD = 72 ADRDA[55] DSM-III-RChina
Bowirrat et al AD = 92 60+ DSM-IV 0.05 0.93 0.70 1.00 1a2002 AAMI = 136[22]Israel
Hsiung et al AD = 140 82.7 NINCDS 0.36 0.77 1.60 0.64 1a2004 CIND = 337 75.6 ADRDA[74] DSM-III-RCanada
Traykov et al AD = 155 79±6 NINCDS 0.56 0.49 1.14 0.90 2b1999 MCI = 45 ADRDA[98] Mayo France
Zill et al AD = 89 73±9 NINCDS 0.57 0.44 1.02 0.98 2b2001 MCI = 32 ADRDA[102] Mayo Germany
Traykov et al AD = 219 79±7 NINCDS 0.54 0.61 1.40 0.75 2b2002 MCI = 45 ADRDA[117] MayoFrance

C H A P T E R 16 • G E N E T I C M A R K E R S 159
Table 16.5 ApoE ℇ4 (≥1 ℇ4) as a diagnostic marker. Alzheimer’s disease vs MCI.
Author Sample Age Clinical SS SP LR+ LR– Quality of study Year (years) criteria Reference Country
Katzman et al AD = 65 60–96 NINCDS 0.46 0.80 2.36 0.68 1a1997 QD = 72 ADRDA[55] DSM-III-RChina
Bowirrat et al AD = 92 60+ DSM-IV 0.05 0.93 0.70 1.00 1a2002 AAMI = 136[22]Israel
Hsiung et al AD = 140 82.7 NINCDS 0.36 0.77 1.60 0.64 1a2004 CIND = 337 75.6 ADRDA[74] DSM-III-RCanada
Traykov et al AD = 155 79±6 NINCDS 0.56 0.49 1.14 0.90 2b1999 MCI = 45 ADRDA[98] Mayo France
Zill et al AD = 89 73±9 NINCDS 0.57 0.44 1.02 0.98 2b2001 MCI = 32 ADRDA[102] Mayo Germany
Traykov et al AD = 219 79±7 NINCDS 0.54 0.61 1.40 0.75 2b2002 MCI = 45 ADRDA[117] MayoFrance
The table continues on the next page

D E M E N T I A – D I AG N O S T I C A N D T H E R A P E U T I C I N T E RV E N T I O N S160
Table 16.5 continued
Author Sample Age Clinical SS SP LR+ LR– Quality of study Year (years) criteria Reference Country
Engelborghs et al AD = 504 78.9±8 NINCDS 0.56 0.39 0.90 1.10 2b2003 MCI = 44 73.7±8 ADRDA[118] DSM-IVBelgium
Feldman et al AD = 290 73.1±9 DSM-III-R 0.62 0.52 1.30 0.77 2b2003 CIND = 145[113]Canada
AAMI = Age Associated Memory Impairment; AD = Alzheimer’s disease; CIND = Cognitive impairment, no dementia; LR+ = Likelihood ratio; MCI = Mild cognitive impairment; QD = Questionable dementia; SP = Specificity; SS = Sensitivity

C H A P T E R 16 • G E N E T I C M A R K E R S 161
Table 16.5 continued
Author Sample Age Clinical SS SP LR+ LR– Quality of study Year (years) criteria Reference Country
Engelborghs et al AD = 504 78.9±8 NINCDS 0.56 0.39 0.90 1.10 2b2003 MCI = 44 73.7±8 ADRDA[118] DSM-IVBelgium
Feldman et al AD = 290 73.1±9 DSM-III-R 0.62 0.52 1.30 0.77 2b2003 CIND = 145[113]Canada
AAMI = Age Associated Memory Impairment; AD = Alzheimer’s disease; CIND = Cognitive impairment, no dementia; LR+ = Likelihood ratio; MCI = Mild cognitive impairment; QD = Questionable dementia; SP = Specificity; SS = Sensitivity

D E M E N T I A – D I AG N O S T I C A N D T H E R A P E U T I C I N T E RV E N T I O N S162
1. Payami H. Genetic markers in differential diagnosis. In: Quizilbash N, Schneider L, Chui H, Tariot P, Brodaty H, Kaye J, et al, editors. Evidence-based dementia practice. Oxford: Blackwell Science; 2002. p 133-38.
2. St George-Hyslop PH. Genetic factors in the genesis of Alzheimer’s disease. Ann N Y Acad Sci 2000;924:1-7.
3. Saunders AM, Strittmatter WJ, Schmechel D, George-Hyslop PH, Pericak-Vance MA, Joo SH, et al. Association of apolipoprotein E allele epsilon 4 with late-onset familial and sporadic Alzheimer’s disease. Neurology 1993;43:1467-72.
4. Farrer LA, Cupples LA, Haines JL, Hyman B, Kukull WA, Mayeux R, et al. Effects of age, sex, and ethnicity on the association between apolipoprotein E genotype and Alzheimer disease. A meta-analysis. APOE and Alzheimer Disease Meta Analysis Consortium. JAMA 1997;278:1349-56.
5. Kehoe P, Wavrant-De Vrieze F, Crook R, Wu WS, Holmans P, Fenton I, et al. A full genome scan for late onset Alzheimer’s disease. Hum Mol Genet 1999;8:237-45.
6. Corder EH, Saunders AM, Strittmatter WJ, Schmechel DE, Gaskell PC, Jr, Rimmler JB, et al. Apolipoprotein E, sur-vival in Alzheimer’s disease patients, and the competing risks of death and Alzheim-er’s disease. Neurology 1995;45:1323-8.
7. Holmes C, Levy R, McLoughlin DM, Powell JF, Lovestone S. Apolipoprotein E: non-cognitive symptoms and cogni-tive decline in late onset Alzheimer’s
disease. J Neurol Neurosurg Psychiatry 1996;61:580-3.
8. Stern Y, Tang MX, Albert MS, Brandt J, Jacobs DM, Bell K, et al. Predicting time to nursing home care and death in individuals with Alzheimer disease. JAMA 1997;277:806-12.
9. Poirier J, Delisle MC, Quirion R, Aubert I, Farlow M, Lahiri D, et al. Apolipopro-tein E4 allele as a predictor of cholinergic deficits and treatment outcome in Alzhe-imer disease. Proc Natl Acad Sci U S A 1995;92:12260-4.
10. Farlow MR, Lahiri DK, Poirier J, Davignon J, Schneider L, Hui SL. Treat-ment outcome of tacrine therapy depends on apolipoprotein genotype and gender of the subjects with Alzheimer’s disease. Neurology 1998;50:669-77.
11. Knopman DS, DeKosky ST, Cummings JL, Chui H, Corey-Bloom J, Relkin N, et al. Practice parameter: diagnosis of dementia (an evidence-based review). Report of the Quality Standards Subcommittee of the American Academy of Neurology. Neurology 2001;56:1143-53.
12. Mayeux R, Saunders AM, Shea S, Mirra S, Evans D, Roses AD, et al. Utility of the apolipoprotein E genotype in the diagnosis of Alzheimer’s disease. Alzhe-imer’s Disease Centers Consortium on Apolipoprotein E and Alzheimer’s Disease. N Engl J Med 1998;338:506-11.
13. Liddell MB, Lovestone S, Owen MJ. Genetic risk of Alzheimer’s disease: advising relatives. Br J Psychiatry 2001;178:7-11.
References

C H A P T E R 16 • G E N E T I C M A R K E R S 163
14. Chui H, Zhang Q. Evaluation of dementia: a systematic study of the use- fulness of the American Academy of Neu-rology’s practice parameters. Neurology 1997;49:925-35.
15. Rebeck GW, Reiter JS, Strickland DK, Hyman BT. Apolipoprotein E in sporadic Alzheimer’s disease: allelic variation and re-ceptor interactions. Neuron 1993;11:575-80.
16. Nalbantoglu J, Gilfix BM, Bertrand P, Robitaille Y, Gauthier S, Rosenblatt DS, et al. Predictive value of apolipopro-tein E genotyping in Alzheimer’s disease: results of an autopsy series and an analysis of several combined studies. Ann Neurol 1994;36:889-95.
17. Fabian VA, Jones TM, Wilton SD, Dench JE, Davis MR, Lim L, et al. Alzheimer’s disease and apolipoprotein E genotype in Western Australia: an autopsy-verified series. Med J Aust 1996;165:77-80.
18. Benjamin R, Leake A, McArthur FK, Candy JM, Ince PG, Edwardson JA, et al. Apolipoprotein E genotype and Alzheim-er’s disease in an elderly Norwegian cohort. Neurodegeneration 1996;5:43-7.
19. Berg L, McKeel DW, Jr, Miller JP, Storandt M, Rubin EH, Morris JC, et al. Clinicopathologic studies in cognitively healthy aging and Alzheimer’s disease: relation of histologic markers to dementia severity, age, sex, and apolipoprotein E genotype. Arch Neurol 1998;55:326-35.
20. Graff-Radford NR, Green RC, Go RC, Hutton ML, Edeki T, Bachman D, et al. Association between apolipoprotein E genotype and Alzheimer disease in African American subjects. Arch Neurol 2002;59:594-600.
21. Polvikoski T, Sulkava R, Myllykangas L, Notkola IL, Niinisto L, Verkkoniemi A, et al. Prevalence of Alzheimer’s dis-ease in very elderly people: a prospec-tive neuropathological study. Neurology 2001;56:1690-6.
22. Bowirrat A, Friedland RP, Farrer L, Baldwin C, Korczyn A. Genetic and environmental risk factors for Alzheimer’s disease in Israeli Arabs. J Mol Neurosci 2002;19:239-45.
23. Ueki A, Kawano M, Namba Y, Kawakami M, Ikeda K. A high frequency of apolipoprotein E4 isoprotein in Japa-nese patients with late-onset nonfamil-ial Alzheimer’s disease. Neurosci Lett 1993;163:166-8.
24. Palumbo B, Parnetti L, Nocentini G, Cardinali L, Brancorsini S, Riccardi C, et al. Apolipoprotein-E genotype in normal aging, age-associated memory impairment, Alzheimer’s disease and vascular dementia patients. Neurosci Lett 1997;231:59-61.
25. Kowalska A, Florczak J, Pruchnik- Wolinska D, Kraszewski A, Wender M. Apolipoprotein E genotypes in sporadic early and late-onset Alzheimer’s disease. Arch Immunol Ther Exp (Warsz) 1998; 46:177-81.
26. Kim JM, Shin IS, Yoon JS. Apolipopro-tein E among Korean Alzheimer’s disease patients in community-dwelling and hos-pitalized elderly samples. Dement Geriatr Cogn Disord 2002;13:119-24.
27. Rosenberg CK, Cummings TJ, Saunders AM, Widico C, McIntyre LM, Hulette CM. Dementia with Lewy bodies and Alzheimer’s disease. Acta Neuropathol (Berl) 2001;102:621-6.

D E M E N T I A – D I AG N O S T I C A N D T H E R A P E U T I C I N T E RV E N T I O N S164
28. Singleton AB, Wharton A, O’Brien KK, Walker MP, McKeith IG, Ballard CG, et al. Clinical and neuropathological correlates of apolipoprotein E genotype in dementia with Lewy bodies. Dement Geriatr Cogn Disord 2002;14:167-75.
29. Frisoni GB, Calabresi L, Geroldi C, Bianchetti A, D’Acquarica AL, Govoni S, et al. Apolipoprotein E epsilon 4 allele in Alzheimer’s disease and vascular dementia. Dementia 1994;5:240-2.
30. Geschwind D, Karrim J, Nelson SF, Miller B. The apolipoprotein E epsilon4 allele is not a significant risk factor for frontotemporal dementia. Ann Neurol 1998;44:134-8.
31. Gomez-Isla T, West HL, Rebeck GW, Harr SD, Growdon JH, Locascio JJ, et al. Clinical and pathological correlates of apolipoprotein E epsilon 4 in Alzheimer’s disease. Ann Neurol 1996;39:62-70.
32. Gustafson L, Abrahamson M, Grubb A, Nilsson K, Fex G. Apolipoprotein-E genotyping in Alzheimer’s disease and frontotemporal dementia. Dement Geriatr Cogn Disord 1997;8:240-3.
33. Helisalmi S, Linnaranta K, Lehtovirta M, Mannermaa A, Heinonen O, Ryynanen M, et al. Apolipoprotein E polymorphism in patients with different neurodegenera-tive disorders. Neurosci Lett 1996;205: 61-4.
34. Kalman J, Juhasz A, Majtenyi K, Rimanoczy A, Jakab K, Gardian G, et al. Apolipoprotein E polymorphism in Pick’s disease and in Huntington’s dis- ease. Neurobiol Aging 2000;21:555-8.
35. Lehmann DJ, Smith AD, Combrinck M, Barnetson L, Joachim C. Apolipopro-
tein E epsilon2 may be a risk factor for spo-radic frontotemporal dementia. J Neurol Neurosurg Psychiatry 2000;69:404-5.
36. Masullo C, Daniele A, Fazio VM, Seripa D, Gravina C, Filippini V, et al. The Apolipoprotein E genotype in patients affected by syndromes with focal cortical atrophy. Neurosci Lett 2001;303:87-90.
37. Mesulam MM, Johnson N, Grujic Z, Weintraub S. Apolipoprotein E genotypes in primary progressive aphasia. Neurology 1997;49:51-5.
38. Minthon L, Hesse C, Sjogren M, Englund E, Gustafson L, Blennow K. The apolipoprotein E epsilon4 allele frequency is normal in fronto-temporal dementia, but correlates with age at onset of disease. Neurosci Lett 1997;226:65-7.
39. Pickering-Brown SM, Siddons M, Mann DM, Owen F, Neary D, Snowden JS. Apolipoprotein E allelic frequencies in patients with lobar atrophy. Neurosci Lett 1995;188:205-7.
40. Pickering-Brown SM, Owen F, Isaacs A, Snowden J, Varma A, Neary D, et al. Apolipoprotein E epsilon4 allele has no effect on age at onset or duration of disease in cases of frontotemporal dementia with pick- or microvacuolar-type histology. Exp Neurol 2000;163:452-6.
41. Short RA, Graff-Radford NR, Adamson J, Baker M, Hutton M. Differences in tau and apolipoprotein E polymorphism frequencies in sporadic frontotemporal lobar degeneration syn-dromes. Arch Neurol 2002;59:611-5.
42. Verpillat P, Camuzat A, Hannequin D, Thomas-Anterion C, Puel M, Belliard S, et al. Apolipoprotein E gene in fronto-

C H A P T E R 16 • G E N E T I C M A R K E R S 165
temporal dementia: an association study and meta-analysis. Eur J Hum Genet 2002;10:399-405.
43. Schneider JA, Gearing M, Robbins RS, de l’Aune W, Mirra SS. Apolipoprotein E genotype in diverse neurodegenerative disorders. Ann Neurol 1995;38:131-5.
44. Stevens M, van Duijn CM, de Knijff P, van Broeckhoven C, Heutink P, Oostra BA, et al. Apolipoprotein E gene and sporadic frontal lobe dementia. Neurology 1997;48:1526-9.
45. Farrer LA, Abraham CR, Volicer L, Foley EJ, Kowall NW, McKee AC, et al. Allele epsilon 4 of apolipoprotein E shows a dose effect on age at onset of Pick disease. Exp Neurol 1995;136:162-70.
46. Tsuang D, Larson EB, Bowen J, McCormick W, Teri L, Nochlin D, et al. The utility of apolipoprotein E genotyping in the diagnosis of Alzheimer disease in a community-based case series. Arch Neurol 1999;56:1489-95.
47. Bennett DA, Wilson RS, Schneider JA, Evans DA, Aggarwal NT, Arnold SE, et al. Apolipoprotein E epsilon4 allele, AD pathology, and the clinical expres-sion of Alzheimer’s disease. Neurology 2003;60:246-52.
48. Nielsen AS, Ravid R, Kamphorst W, Jorgensen OS. Apolipoprotein E epsilon 4 in an autopsy series of various dementing disorders. J Alzheimers Dis 2003;5:119-25.
49. Lannfelt L, Lilius L, Nastase M, Viitanen M, Fratiglioni L, Eggertsen G, et al. Lack of association between apolipoprotein E allele epsilon 4 and sporadic Alzheimer’s disease. Neurosci Lett 1994;169:175-8.
50. van Duijn CM, de Knijff P, Cruts M, Wehnert A, Havekes LM, Hofman A, et al. Apolipoprotein E4 allele in a Popula-tion based study of early-onset Alzheimer’s disease. Nat Genet 1994;7:74-8.
51. Kukull WA, Schellenberg GD, Bowen JD, McCormick WC, Yu CE, Teri L, et al. Apolipoprotein E in Alzheimer’s disease risk and case detection: a case-control study. J Clin Epidemiol 1996;49:1143-8.
52. Myers RH, Schaefer EJ, Wilson PW, D’Agostino R, Ordovas JM, Espino A, et al. Apolipoprotein E epsilon4 associa-tion with dementia in a Population based study: The Framingham study. Neurology 1996;46:673-7.
53. Tang MX, Maestre G, Tsai WY, Liu XH, Feng L, Chung WY, et al. Relative risk of Alzheimer disease and age-at-onset distributions, based on APOE genotypes among elderly African Americans, Cauca-sians, and Hispanics in New York City. Am J Hum Genet 1996;58:574-84.
54. Evans DA, Beckett LA, Field TS, Feng L, Albert MS, Bennett DA, et al. Apolipoprotein E epsilon4 and incidence of Alzheimer disease in a community population of older people. JAMA 1997;277:822-4.
55. Katzman R, Zhang MY, Chen PJ, Gu N, Jiang S, Saitoh T, et al. Effects of apoli-poprotein E on dementia and aging in the Shanghai Survey of Dementia. Neurology 1997;49:779-85.
56. Sahota A, Yang M, Gao S, Hui SL, Baiyewu O, Gureje O, et al. Apolipo-protein E-associated risk for Alzheimer’s disease in the African-American popula-tion is genotype dependent. Ann Neurol 1997;42:659-61.

D E M E N T I A – D I AG N O S T I C A N D T H E R A P E U T I C I N T E RV E N T I O N S166
57. Slooter AJ, Tang MX, van Duijn CM, Stern Y, Ott A, Bell K, et al. Apolipopro-tein E epsilon4 and the risk of dementia with stroke. A Population based investiga-tion. JAMA 1997;277:818-21.
58. Notkola IL, Sulkava R, Pekkanen J, Erkinjuntti T, Ehnholm C, Kivinen P, et al. Serum total cholesterol, apolipoprotein E epsilon 4 allele, and Alzheimer’s disease. Neuroepidemiology 1998;17:14-20.
59. Skoog I, Hesse C, Aevarsson O, Landahl S, Wahlstrom J, Fredman P, et al. A population study of apoE genotype at the age of 85: relation to dementia, cerebro-vascular disease, and mortality. J Neurol Neurosurg Psychiatry 1998;64:37-43.
60. Slooter AJ, Cruts M, Kalmijn S, Hofman A, Breteler MM, Van Broeckhoven C, et al. Risk estimates of dementia by apolipoprotein E geno-types from a Population based incidence study: the Rotterdam Study. Arch Neurol 1998;55:964-8.
61. Tang MX, Stern Y, Marder K, Bell K, Gurland B, Lantigua R, et al. The APOE-epsilon4 allele and the risk of Alzheimer disease among African Americans, whites, and Hispanics. JAMA 1998;279:751-5.
62. Tilvis RS, Strandberg TE, Juva K. Apolipoprotein E phenotypes, dementia and mortality in a prospective population sample. J Am Geriatr Soc 1998;46:712-5.
63. Devi G, Ottman R, Tang M, Marder K, Stern Y, Tycko B, et al. Influence of APOE genotype on familial aggregation of AD in an urban population. Neurology 1999;53:789-94.
64. Lilius L, Froelich Fabre S, Basun H, Forsell C, Axelman K, Mattila K, et al.
Tau gene polymorphisms and apolipopro-tein E epsilon4 may interact to increase risk for Alzheimer’s disease. Neurosci Lett 1999;277:29-32.
65. Ganguli M, Chandra V, Kamboh MI, Johnston JM, Dodge HH, Thelma BK, et al. Apolipoprotein E polymorphism and Alzheimer disease: The Indo-US Cross-National Dementia Study. Arch Neurol 2000;57:824-30.
66. Johnston JM, Nazar-Stewart V, Kelsey SF, Kamboh MI, Ganguli M. Relationships between cerebrovascular events, APOE polymorphism and Alzheimer’s disease in a community sample. Neuroepidemiology 2000;19:320-6.
67. Kardaun JW, White L, Resnick HE, Petrovitch H, Marcovina SM, Saunders AM, et al. Genotypes and phenotypes for apolipoprotein E and Alzheimer disease in the Honolulu-Asia aging study. Clin Chem 2000;46:1548-54.
68. Molero AE, Pino-Ramirez G, Maestre GE. Modulation by age and gender of risk for Alzheimer’s disease and vascular dementia associated with the apolipopro-tein E-epsilon4 allele in Latin Americans: findings from the Maracaibo Aging Study. Neurosci Lett 2001;307:5-8.
69. Romas SN, Santana V, Williamson J, Ciappa A, Lee JH, Rondon HZ, et al. Fa-milial Alzheimer disease among Caribbean Hispanics: a reexamination of its associa-tion with APOE. Arch Neurol 2002;59: 87-91.
70. Kukull WA, Higdon R, Bowen JD, McCormick WC, Teri L, Schellenberg GD, et al. Dementia and Alzheimer dis- ease incidence: a prospective cohort study. Arch Neurol 2002;59:1737-46.

C H A P T E R 16 • G E N E T I C M A R K E R S 167
71. Chandak GR, Sridevi MU, Vas CJ, Panikker DM, Singh L. Apolipoprotein E and presenilin-1 allelic variation and Alzheimer’s disease in India. Hum Biol 2002;74:683-93.
72. Miech RA, Breitner JC, Zandi PP, Khachaturian AS, Anthony JC, Mayer L. Incidence of AD may decline in the early 90s for men, later for women: The Cache County study. Neurology 2002;58:209-18.
73. Qiu C, Kivipelto M, Aguero-Torres H, Winblad B, Fratiglioni L. Risk and protec-tive effects of the APOE gene towards Alzheimer’s disease in the Kungsholmen project: variation by age and sex. J Neurol Neurosurg Psychiatry 2004;75:828-33.
74. Hsiung GY, Sadovnick AD, Feldman H. Apolipoprotein E epsilon4 genotype as a risk factor for cognitive decline and dementia: data from the Canadian Study of Health and Aging. CMAJ 2004;171:863-7.
75. Jobst KA, Barnetson LP, Shepstone BJ. Accurate prediction of histologically confirmed Alzheimer’s disease and the differential diagnosis of dementia: the use of NINCDS-ADRDA and DSM-III-R cri-teria, SPECT, X-ray CT, and APO E4 me-dial temporal lobe dementias. The Oxford Project to Investigate Memory and Aging. Int Psychogeriatr 1997;9 Suppl 1:191-222; discussion 247-52.
76. Breitner JC, Jarvik GP, Plassman BL, Saunders AM, Welsh KA. Risk of Alzhe-imer disease with the epsilon4 allele for apolipoprotein E in a Population based study of men aged 62–73 years. Alzheimer Dis Assoc Disord 1998;12:40-4.
77. Moceri VM, Kukull WA, Emanual I, van Belle G, Starr JR, Schellenberg GD, et al. Using census data and birth certifi-
cates to reconstruct the early-life socio- economic environment and the relation to the development of Alzheimer’s disease. Epidemiology 2001;12:383-9.
78. Stengard JH, Pekkanen J, Sulkava R, Ehnholm C, Erkinjuntti T, Nissinen A. Apolipoprotein E polymorphism, Alzheim-er’s disease and vascular dementia among elderly Finnish men. Acta Neurol Scand 1995;92:297-8.
79. Mullan M, Scibelli P, Duara R, Fallin D, Gold M, Schinka J, et al. Familial and Population based studies of apolipoprotein E and Alzheimer’s disease. Ann N Y Acad Sci 1996;802:16-26.
80. Bickeboller H, Campion D, Brice A, Amouyel P, Hannequin D, Didierjean O, et al. Apolipoprotein E and Alzheimer disease: genotype-specific risks by age and sex. Am J Hum Genet 1997;60:439-46.
81. Quiroga P, Calvo C, Albala C, Urquidi J, Santos JL, Perez H, et al. Apolipoprotein E polymorphism in elderly Chilean people with Alzheimer’s disease. Neuroepidemiology 1999;18: 48-52.
82. Poirier J, Davignon J, Bouthillier D, Kogan S, Bertrand P, Gauthier S. Apolipo-protein E polymorphism and Alzheimer’s disease. Lancet 1993;342:697-9.
83. Payami H, Kaye J, Heston LL, Bird TD, Schellenberg GD. Apolipoprotein E genotype and Alzheimer’s disease. Lancet 1993;342:738.
84. Dai XY, Nanko S, Hattori M, Fukuda R, Nagata K, Isse K, et al. Association of apolipoprotein E4 with sporadic Alzhe-imer’s disease is more pronounced in early onset type. Neurosci Lett 1994;175:74-6.

D E M E N T I A – D I AG N O S T I C A N D T H E R A P E U T I C I N T E RV E N T I O N S168
85. Liddell M, Williams J, Bayer A, Kaiser F, Owen M. Confirmation of association between the e4 allele of apolipoprotein E and Alzheimer’s disease. J Med Genet 1994;31:197-200.
86. Tsai MS, Tangalos EG, Petersen RC, Smith GE, Schaid DJ, Kokmen E, et al. Apolipoprotein E: risk factor for Alzheimer disease. Am J Hum Genet 1994;54:643-9.
87. Nunomura A, Chiba S, Eto M, Saito M, Makino I, Miyagishi T. Apolipopro-tein E polymorphism and susceptibility to early- and late-onset sporadic Alzheimer’s disease in Hokkaido, the northern part of Japan. Neurosci Lett 1996;206:17-20.
88. Tsuang D, Kukull W, Sheppard L, Barnhart RL, Peskind E, Edland SD, et al. Impact of sample selection on APOE epsi-lon 4 allele frequency: a comparison of two Alzheimer’s disease samples. J Am Geriatr Soc 1996;44:704-7.
89. Yang JG, Poropat RA, Brooks WS, Broe GA, Nicholson GA. Apolipoprotein E genotyping in Alzheimer’s disease in an Australian sample. Aust N Z J Med 1996;26:658-61.
90. Almeida OP, Shimokomaki CM. Apoli- poprotein E4 and Alzheimer’s disease in Sao Paulo-Brazil. Arq Neuropsiquiatr 1997;55:1-7.
91. Kalman J, Juhasz A, Csaszar A, Kanka A, Magloczky E, Bencsik K, et al. Apolipo-protein E allele frequencies in patients with late-onset sporadic Alzheimer’s dementia in Hungary. Acta Neurol Scand 1997;95:56-9.
92. Wang PN, Wang SJ, Hong CJ, Liu TT, Fuh JL, Chi CW, et al. Risk factors for Alzheimer’s disease: a case-control study. Neuroepidemiology 1997;16:234-40.
93. Lopez OL, Lopez-Pousa S, Kamboh MI, Adroer R, Oliva R, Lozano-Gallego M, et al. Apolipoprotein E polymorphism in Alzheimer’s disease: a comparative study of two research populations from Spain and the United States. Eur Neurol 1998;39:229-33.
94. Bretsky PM, Buckwalter JG, Seeman TE, Miller CA, Poirier J, Schellenberg GD, et al. Evidence for an interaction between apolipoprotein E genotype, gender, and Alzheimer disease. Alzheimer Dis Assoc Disord 1999;13:216-21.
95. Kim KW, Jhoo JH, Lee KU, Lee DY, Lee JH, Youn JY, et al. Association between apolipoprotein E polymorphism and Alzheimer’s disease in Koreans. Neurosci Lett 1999;277:145-8.
96. Nakayama S, Kuzuhara S. Apolipo-protein E phenotypes in healthy normal controls and demented subjects with Alzheimer’s disease and vascular dementia in Mie Prefecture of Japan. Psychiatry Clin Neurosci 1999;53:643-8.
97. Scacchi R, Gambina G, Ruggeri M, Martini MC, Ferrari G, Silvestri M, et al. Plasma levels of apolipoprotein E and genetic markers in elderly patients with Alzheimer’s disease. Neurosci Lett 1999;259:33-6.
98. Traykov L, Rigaud AS, Caputo L, Couderc R, Coste J, Michot JL, et al. Apolipoprotein E phenotypes in demented and cognitively impaired patients with and without cerebrovascular disease. Eur J Neurol 1999;6:415-21.
99. Siest G, Bertrand P, Qin B, Herbeth B, Serot JM, Masana L, et al. Apolipoprotein E polymorphism and serum concentration in Alzheimer’s disease in nine European

C H A P T E R 16 • G E N E T I C M A R K E R S 169
centres: the ApoEurope study. ApoEurope group. Clin Chem Lab Med 2000;38:721-30.
100. Kim KW, Jhoo JH, Lee JH, Lee DY, Lee KU, Youn JY, et al. Transferrin C2 variant does not confer a risk for Alzhe-imer’s disease in Koreans. Neurosci Lett 2001;308:45-8.
101. Rigaud AS, Traykov L, Caputo L, Coste J, Latour F, Couderc R, et al. As-sociation of the apolipoprotein E epsi-lon4 allele with late-onset depression. Neuroepidemiology 2001;20:268-72.
102. Zill P, Engel R, Hampel H, Behrens S, Burger K, Padberg F, et al. Polymor-phisms in the apolipoprotein E (APOE) gene in gerontopsychiatric patients. Eur Arch Psychiatry Clin Neurosci 2001; 251:24-8.
103. Yang J, Feng G, Zhang J, Hui Z, Breen G, St Clair D, et al. Is ApoE gene a risk factor for vascular dementia in Han Chinese? Int J Mol Med 2001;7:217-9.
104. Huang HM, Kuo YM, Ou HC, Lin CC, Chuo LJ. Apolipoprotein E polymor-phism in various dementias in Taiwan Chinese population. J Neural Transm 2002;109:1415-21.
105. Frank A, Diez-Tejedor E, Bullido MJ, Valdivieso F, Barreiro P. APOE genotype in cerebrovascular disease and vascular de-mentia. J Neurol Sci 2002;203-204:173-6.
106. Solfrizzi V, Panza F, D’Introno A, Colacicco AM, Capurso C, Basile AM, et al. Lipoprotein(a), apolipoprotein E genotype, and risk of Alzheimer’s dis-ease. J Neurol Neurosurg Psychiatry 2002;72:732-6.
107. Panza F, Solfrizzi V, Colacicco AM, Basile AM, D’Introno A, Capurso C, et al. Apolipoprotein E (APOE) poly-morphism influences serum APOE levels in Alzheimer’s disease patients and cente-narians. Neuroreport 2003;14:605-8.
108. Hawi Z, Sheehan K, Lynch A, Evans I, Lowe N, Lawlor B, et al. Late onset Alzheimer’s disease and apolipoprotein association in the Irish population: relative risk and attributable fraction. Ir J Med Sci 2003;172:74-6.
109. Styczynska M, Religa D, Pfeffer A, Luczywek E, Wasiak B, Styczynski G, et al. Simultaneous analysis of five genetic risk factors in Polish patients with Alzhe-imer’s disease. Neurosci Lett 2003;344: 99-102.
110. Souza DR, de Godoy HR, Hotta J, Tajara EH, Brandao AC, Pinheiro Junior S, Tognola WA, Dos Santos JE. Associa-tion of apolipoprotein E polymorphism in late-onset Alzheimer’s disease and vascular dementia in Brazilians. Braz J Med Biol Res 2003;36:919-923.
111. Wehr H, Bednarska-Makaruk M, Graban A, Kunicki PK, Lojkowska W, Rodo M, et al. Apolipoprotein E polymor-phism and low density lipoprotein (LDL) oxidation in patients with dementia. Folia Neuropathol 2003;41:65-8.
112. Finckh U, van Hadeln K, Muller- Thomsen T, Alberici A, Binetti G, Hock C, et al. Association of late-onset Alzheimer disease with a genotype of PLAU, the gene encoding urokinase- type plasminogen activator on chromo- some 10q22.2. Neurogenetics 2003;4: 213-7.

D E M E N T I A – D I AG N O S T I C A N D T H E R A P E U T I C I N T E RV E N T I O N S170
113. Feldman H, Levy AR, Hsiung GY, Peters KR, Donald A, Black SE, et al. A Canadian cohort study of cognitive impair-ment and related dementias (ACCORD): study methods and baseline results. Neuroepidemiology 2003;22:265-74.
114. Borroni B, Archetti S, Agosti C, Akkawi N, Brambilla C, Caimi L, et al. Intronic CYP46 polymorphiosm along with ApoE genotype in sporadic Alzheimer Disease: from risk factors to disease modu-lators. Neurobiol Aging 2004;25:747-51.
115. Luthra K, Tripathi M, Grover R, Dwivedi M, Kumar A, Dey AB. Apolipo-protein E gene polymorphism in Indian patients with Alzheimer’s disease and vas-cular dementia. Dement Geriatr Cogn Disord 2004;17:132-5.
116. Welsh-Bohmer KA, Gearing M, Saunders AM, Roses AD, Mirra S. Apoli-poprotein E genotypes in a neuropathologi-cal series from the Consortium to Establish a Registry for Alzheimer’s Disease. Ann Neurol 1997;42:319-25.
117. Traykov L, Rigaud AS, Baudic S, Smagghe A, Boller F, Forette F. Apolipo-protein E epsilon 4 allele frequency in de-mented and cognitively impaired patients with and without cerebrovascular disease. J Neurol Sci 2002;203-204:177-81.
118. Engelborghs S, Dermaut B, Goeman J, Saerens J, Marien P, Pickut BA, et al. Prospective Belgian study of neurodegen-erative and vascular dementia: APOE geno-type effects. J Neurol Neurosurg Psychiatry 2003;74:1148-51.

C H A P T E R 17 • S T R U C T U R A L A N D F U N C T I O N A L I M AG I N G O F T H E B R A I N I N D E M E N T I A WO R K U P
171
17. Structural and Functional Imaging of the Brain in Dementia Workup
Conclusions
There is strong evidence (Evidence Grade 1) that atrophy of the medial temporal lobe structures (whole medial temporal lobe, hippocampus, enthorinal cortex), estimated by means of MRI/CT, contributes to a diagnostic workup that differentiates AD (Alzheimer’s disease) patients from controls and AD from other dementia disorders (Tables 17.1–17.2).
The conclusion is based on studies that used clinical diagnosis as the gold standard. No studies were included that used histopathology as the gold standard.
The majority of studies were based on degree of quality 2b, reflecting populations at memory clinics, usually at university hospitals. There were no studies that could be referred to a general practitioner setting – of the 3 studies of quality 1a [1–3], 1 was population based [3] and the other 2 were at university hospitals with heterogeneous study popula-tions. Two of these studies investigated AD patients vs controls and 2 investigated patients with other dementia disorders vs controls. Both comparisons resulted in high LR+ values.
We cannot generalize these findings into a general practice setting, given that we found no studies that used medial temporal lobe atrophy or any other brain structure as a diagnostic method in such a setting.
For diagnostic workups performed in specialized settings, evaluating atrophy of medial temporal lobe structures contributed to diagnostic reliability.

D E M E N T I A – D I AG N O S T I C A N D T H E R A P E U T I C I N T E RV E N T I O N S172
Although we included more recent high-quality studies, our results do not differ from EBDP [4,5].
Introduction
This evaluation has investigated Computed Tomography (CT), Magne-tic Resonance Imaging (MRI), Single Photon Computed Tomography (SPECT), Positron Emission Tomography (PET) and Electro Encepha-lography (EEG) as diagnostic methods for the detection and differen-tiation of dementia disorders. The structural imaging methods (CT and MRI) are used to find secondary disorders, such as tumors, subdural hematomas and normal pressure hydrocephalus. That has not been add-ressed in the evaluation, since it is obvious that CT and MRI are effec-tive in detecting those diseases and are recommended by the American Association of Neurology.
Search strategy
Medline 1980–2004 (July)
Dementia/radionuclide imagingDementia AND Diagnostic ImagingDementia AND ElectroencephalographyANDComparative StudySensitivity and SpecificitySensitivity [Text Word]Specificity [Text Word]Accuracy [Text Word]AND Human >18 years

C H A P T E R 17 • S T R U C T U R A L A N D F U N C T I O N A L I M AG I N G O F T H E B R A I N I N D E M E N T I A WO R K U P
173
NOT Case Report Editorial [Publication Type] Letter [Publication Type] Review [Publication Type] HIV [Text Word]434 hits were found.
Structural imaging
ResultsAfter the screening procedure, we selected 36 articles concerning MRI or CT. Papers were excluded due to:
• inclusion of too few subjects• insufficient description of the investigation procedure or diagnostic
criteria• insufficient description of statistical methods or• irrelevance.
Generally, the papers presented a limited number of cases and focused largely on AD patients versus controls. Few studies proceeded from a longitudinal prospective. Most of the brain structures studied were part of the medial temporal lobe. That is most evident starting in 1990, probably reflecting the increased use of MRI, which allows for better visualization of the medial temporal lobes than computer tomography. During the “CT era” the size of lateral ventricles and other CSF spaces were most common studied structure. Diagnostic parameters are cluste-red around the medial temporal lobe.
No paper was found that addressed white matter changes or infarcts as diagnostic tools.
Studies on very early cases of AD, such as “mild cognitive impairment”, have been published recently [6–14]. The main focus in those papers is on studying the accuracy of imaging for detecting AD cases in the large

D E M E N T I A – D I AG N O S T I C A N D T H E R A P E U T I C I N T E RV E N T I O N S174
heterogeneous group of mild cognitive impairment subjects (conversion to dementia).
The majority of papers investigated hospital populations, and only two studies took a Population based approach [15,16].
As mentioned earlier, many of the papers compared AD patients with controls. That is a limitation in clinical practice. A method designed to differentiate between common dementia disorders (such as frontotem-poral dementia, Lewy Body Dementia LBD or VaD) and AD is more valuable. Several studies addressed this issue [17–25].
However, only a limited number of research groups contributed to the scientific literature, and several authors presented more than one paper. Whether or not the same population was used in the different studies is unknown.
One paper concerned diseases other than AD – Zidler et al studied Creutzfeldt-Jakob disease and a variant of Creutzfeldt-Jakob disease and the pulvinar sign [26]. This sign is found on MRI and yields a specificity value of 1.0 with an infinite positive likelihood ratio. One study used magnetic resonance spectroscopy as a diagnostic tool [25].
The question of workup bias (unreliable results due to the results of the imaging method having influenced the diagnostic procedure) was taken into consideration. Very few studies explicitly stated that the method was evaluated independently of the imaging results [14,17]. Given that a structural image is used routinely in clinical workup, we assumed a high risk of dependence between study results and diagnostic procedure.
We calculated the mean LR+ and LR– values and tabulated LR+ accor-ding to degree of quality (Table 17.1).
One problem with LR+ values is the dependency on sensitivity and specificity figures yielded by the test’s cut-off values. Cut-off values were rarely stated along with sensitivity and specificity values. Thus, the influence of various cut-off values is not known.

C H A P T E R 17 • S T R U C T U R A L A N D F U N C T I O N A L I M AG I N G O F T H E B R A I N I N D E M E N T I A WO R K U P
175
Table 17.1 MR-CT. Distribution of articles according to degree of quality.
Degree Not Reference Fulfilling basal Reference of quality fulfilling evidence criteria* basal evidence criteria
Ia 2 [15,16] –
Ib – 1 [27]
IIa – –
IIb – 1 [26+] 1a – 3 [14,17,28]
1b 2 [8,21] 3 [6,7,29++]
2a 5 [19,20,22,23,25] 3 [18,25,30]
2b 5 [9,10,12,24,31] 11 [11,32–41]
* Sensitivity >80%; specificity >80% LR+ ≥5.+ CJD (Creutzfeldt-Jakob disease) – “pulvinal sign”.++ Magnetic resonance spectroscopy.

D E M E N T I A – D I AG N O S T I C A N D T H E R A P E U T I C I N T E RV E N T I O N S176
Table 17.2 CT/MRI studies of brain morphology.
Author Method Sample Age Population/ Diagnostic Global Work up SS SP LR+ LR– Comparison Structure Quality Year (n) selection criteria cognitive bias of study Reference function Country
Barber et al MRI 26 DLB 76 Hospital referrals DSM-IV 13 No info 0.38 1.00 – 0.62 DLB-AD Visual MTA 2a1999 28 AD 77 NINDS-AIREN 15 0.28 0.88 2.3 0.81 DLB-VaD rating[23] 24 VaD 77 NINCDS 18United 26 C 76 LBD 28 Kingdom
Bigler et al MRI 175 mixed 65–99 Population based, – No info 0.95 0.96 23 0.05 OD-C Whole brainvolume 1a2001 dementia 68–87 random selection 0.91 0.94 11 0.09 OD-C Ventricle/brain[28] 375 controls “Cache County” – 0.91 0.90 10 0.09 OD-C Temporalhorn/brainUSA 0.86 0.87 6.6 0.16 OD-C Hippocampus/brain
Bottino et al MRI 39 AD 73 Hospital referrals DSM-III-R 20 No info 0.90 0.85 6 0.11 AD-C Hippocampus 2b2002 21 MCI 69 ICD-10 26 0.83 0.71 3 0.24 AD-MCI Amygdala[13] 20 C 69 29 0.81 0.80 4 0.23 MCI-CBrazil
de Leon et al MRI 54 C 70 Research, longi- NINCDS – No info 0.91 0.89 8.3 0.10 AD-C Visual rating of 1b1993 32 MCI 71 tudinal prospective – hippocampal [7] Follow-up: 4 years formationUSA
DeCarli et al MRI 31 AD 69 Hospital referrals NINCDS 20 No info 0.87 0.83 5.1 0.16 AD-C Temporal lobes 2b1995 29 C 68 – Visually rated 2b[37] ESD atrophyUSA
Denihan et al MRI 60 AD 74 Referrals from NINCDS (AD) 19 No info 0.75 0.90 7.5 0.28 AD-other Minimal distance 2a 2000 17 VaD 78 psychiatric and ADDTC (VaD) 20 0.61 0.91 6.7 0.42 Mild AD-other of MTL[20] 14 depression 73 memory clinics DSM-IV 25Ireland 9 paraphrenia 74 (Depression 25 and paraphrenia)
Du et al MRI 21 AD 74 Hospital referrals NINCDS 22 No info 0.78 0.76 3.3 0.28 AD-C Entorhinal cortex 2a2003 23 C 76 Follow-up: 2 years ADRDA 29 0.86 0.76 3.6 0.18 Rate of atrophy[40]USA

C H A P T E R 17 • S T R U C T U R A L A N D F U N C T I O N A L I M AG I N G O F T H E B R A I N I N D E M E N T I A WO R K U P
177
Table 17.2 CT/MRI studies of brain morphology.
Author Method Sample Age Population/ Diagnostic Global Work up SS SP LR+ LR– Comparison Structure Quality Year (n) selection criteria cognitive bias of study Reference function Country
Barber et al MRI 26 DLB 76 Hospital referrals DSM-IV 13 No info 0.38 1.00 – 0.62 DLB-AD Visual MTA 2a1999 28 AD 77 NINDS-AIREN 15 0.28 0.88 2.3 0.81 DLB-VaD rating[23] 24 VaD 77 NINCDS 18United 26 C 76 LBD 28 Kingdom
Bigler et al MRI 175 mixed 65–99 Population based, – No info 0.95 0.96 23 0.05 OD-C Whole brainvolume 1a2001 dementia 68–87 random selection 0.91 0.94 11 0.09 OD-C Ventricle/brain[28] 375 controls “Cache County” – 0.91 0.90 10 0.09 OD-C Temporalhorn/brainUSA 0.86 0.87 6.6 0.16 OD-C Hippocampus/brain
Bottino et al MRI 39 AD 73 Hospital referrals DSM-III-R 20 No info 0.90 0.85 6 0.11 AD-C Hippocampus 2b2002 21 MCI 69 ICD-10 26 0.83 0.71 3 0.24 AD-MCI Amygdala[13] 20 C 69 29 0.81 0.80 4 0.23 MCI-CBrazil
de Leon et al MRI 54 C 70 Research, longi- NINCDS – No info 0.91 0.89 8.3 0.10 AD-C Visual rating of 1b1993 32 MCI 71 tudinal prospective – hippocampal [7] Follow-up: 4 years formationUSA
DeCarli et al MRI 31 AD 69 Hospital referrals NINCDS 20 No info 0.87 0.83 5.1 0.16 AD-C Temporal lobes 2b1995 29 C 68 – Visually rated 2b[37] ESD atrophyUSA
Denihan et al MRI 60 AD 74 Referrals from NINCDS (AD) 19 No info 0.75 0.90 7.5 0.28 AD-other Minimal distance 2a 2000 17 VaD 78 psychiatric and ADDTC (VaD) 20 0.61 0.91 6.7 0.42 Mild AD-other of MTL[20] 14 depression 73 memory clinics DSM-IV 25Ireland 9 paraphrenia 74 (Depression 25 and paraphrenia)
Du et al MRI 21 AD 74 Hospital referrals NINCDS 22 No info 0.78 0.76 3.3 0.28 AD-C Entorhinal cortex 2a2003 23 C 76 Follow-up: 2 years ADRDA 29 0.86 0.76 3.6 0.18 Rate of atrophy[40]USA
The table continues on the next page

D E M E N T I A – D I AG N O S T I C A N D T H E R A P E U T I C I N T E RV E N T I O N S178
Table 17.2 continued
Author Method Sample Age Population/ Diagnostic Global Work up SS SP LR+ LR– Comparison Structure Quality Year (n) selection criteria cognitive bias of study Reference function Country
El Fakhri et al MRI 56 MCI 72 Longitudinal NINCDS CDR 0.5 No info 0.80 0.90 8 0.22 MCI-AD Combinded of 1b2003 26 AD 73 prospective ADRDA MMSE 29 predictiv value atrophy in limbic[11] 2–3 years CDR 5.25 systemUSA
Erkinjuntti et al MRI 34 AD 70 Hospital referrals NINCDS 193 No info 0.60 0.96 20 0.41 AD-C EC1993 39 C 70 DSM-III-R 245 0.80 0.82 4 0.24 TH[31] 0.60 0.87 4.6 0.46 HCFinland 0.35 0.92 4.4 0.70
Frisoni et al MRI 44 AD 71 Hospital referrals NINCDS 18 No info 0.86 0.95 20 0.15 Mild AD-C Combinded measure 2b1996 31 C 70 spouses 29 0.81 0.95 16 0.20 AD-C of linear measure-[35] ments of medialItaly temporal lobe
Frisoni et al MRI 42 AD 76 Hospital referrals NINCDS 21 No info 0.93 0.97 13 0.07 AD-C Radial width of 2b2002 29 C 70 Path 27 the temporal horn[38]Italy
Gao et al MRI 41 C 71 Hospital referred NINCDS- 28 No info 0.86 0.93 11.7 0.15 TMTL2004 49 AD 70 ADRDA 18 0.84 0.81 4.3 0.19 HC 2b[41] 0.84 0.76 3.4 0.21 AD-CCanada
Golebiowski MRI 50 AD 67 Hospital referrals NINCDS 20 No info 0.95 0.92 12 0.05 AD-C Hippocampus 2bet al 25 C 65 25 volume1999[36] Poland
Gosche et al MRI 24 AD 90 “Nun study” Khachaturian MMSE No info 0.83 0.80 6.3 0.21 AD-C Hippocampus Ib2002 32 C 88 10[27] 25USA

C H A P T E R 17 • S T R U C T U R A L A N D F U N C T I O N A L I M AG I N G O F T H E B R A I N I N D E M E N T I A WO R K U P
179
Table 17.2 continued
Author Method Sample Age Population/ Diagnostic Global Work up SS SP LR+ LR– Comparison Structure Quality Year (n) selection criteria cognitive bias of study Reference function Country
El Fakhri et al MRI 56 MCI 72 Longitudinal NINCDS CDR 0.5 No info 0.80 0.90 8 0.22 MCI-AD Combinded of 1b2003 26 AD 73 prospective ADRDA MMSE 29 predictiv value atrophy in limbic[11] 2–3 years CDR 5.25 systemUSA
Erkinjuntti et al MRI 34 AD 70 Hospital referrals NINCDS 193 No info 0.60 0.96 20 0.41 AD-C EC1993 39 C 70 DSM-III-R 245 0.80 0.82 4 0.24 TH[31] 0.60 0.87 4.6 0.46 HCFinland 0.35 0.92 4.4 0.70
Frisoni et al MRI 44 AD 71 Hospital referrals NINCDS 18 No info 0.86 0.95 20 0.15 Mild AD-C Combinded measure 2b1996 31 C 70 spouses 29 0.81 0.95 16 0.20 AD-C of linear measure-[35] ments of medialItaly temporal lobe
Frisoni et al MRI 42 AD 76 Hospital referrals NINCDS 21 No info 0.93 0.97 13 0.07 AD-C Radial width of 2b2002 29 C 70 Path 27 the temporal horn[38]Italy
Gao et al MRI 41 C 71 Hospital referred NINCDS- 28 No info 0.86 0.93 11.7 0.15 TMTL2004 49 AD 70 ADRDA 18 0.84 0.81 4.3 0.19 HC 2b[41] 0.84 0.76 3.4 0.21 AD-CCanada
Golebiowski MRI 50 AD 67 Hospital referrals NINCDS 20 No info 0.95 0.92 12 0.05 AD-C Hippocampus 2bet al 25 C 65 25 volume1999[36] Poland
Gosche et al MRI 24 AD 90 “Nun study” Khachaturian MMSE No info 0.83 0.80 6.3 0.21 AD-C Hippocampus Ib2002 32 C 88 10[27] 25USA
The table continues on the next page

D E M E N T I A – D I AG N O S T I C A N D T H E R A P E U T I C I N T E RV E N T I O N S180
Table 17.2 continued
Author Method Sample Age Population/ Diagnostic Global Work up SS SP LR+ LR– Comparison Structure Quality Year (n) selection criteria cognitive bias of study Reference function Country
Jobst et al CT 44 AD and 57– General practi- Khachaturian – No info 0.85 0.78 4 0.19 AD-C Min dist of MTL Ia1998 10 non-AD 94 tioners and criteria cut-off 0.79[15] drawn from hospital referrals United Kingdom 167 patients OPTIMA study and 75 C
Juottonen et al MRI 30 AD 70 Hospital referrals NINCDS- 20 No info 0.80 0.91 13 0.21 AD-C EC 2b1998 32 C 72 ADRDA 28 0.80 0.94 9 0.21 Hippocampus[34]Finland
Kantarci et al MRI 61 C 80 Hospital referred DSM-III-R MMSE No info 0.79 0.80 4 0.26 AD-C Hippocampus 2b2002 24 MCI 82 NINCDS 29 0.86 0.80 4.3 0.17 MCI-C[12] 22 AD 79 ADRDA 28 0.75 0.80 2.5 0.27 MCI-ADUSA 26
Killiany et al 136 70 Prospective, longi- DSM-IV MMSE No info 0.82 0.94 13 0.50 C-“MCI” Entohrinal cortex 1b2002 16 mild AD 74 tudinal study. NINCDS 24 0.76 0.76 3 0.91 C-AD Hippocampus[6] 21 converters 72 Follow-up: 3 years. 29USA to AD 72 Recruited thorough 29 73 question- advertisement – able (MCI) 28 controls
Kitagaki et al MRI 22 FTD 65.3 Hospital referrals NINCDS 17 No info 0.86 0.94 – 0.26 FTD-C T2-frontal WMH 2b1997 22 AD 65 Lund- 18 0.86 0.73 – 0.38 FTD-AD T2-frontal WMH[24] 16 NC 63.5 Manchester 0.64 1.00 16 FTD-C Frontal atrophyJapan 0.64 0.96 FTD-AD Frontal atrophy
Koslow et al CT 58 AD 68 Clinic/research NINCDS MMSE No info 0.83 0.30 5.9 0.22 AD-C Combination of 2b1992 59 C 19 CT measurement[39] 29France
Laakso et al MRI 57 AD 70 Hospital referrals NINCDS MMSE No info 0.86 0.85 6 0.16 AD-C Right Hippocampus 2b2000 34 C 72 22 0.83 0.94 13 0.18 Left Hippocampus[32] 28Finland

C H A P T E R 17 • S T R U C T U R A L A N D F U N C T I O N A L I M AG I N G O F T H E B R A I N I N D E M E N T I A WO R K U P
181
Table 17.2 continued
Author Method Sample Age Population/ Diagnostic Global Work up SS SP LR+ LR– Comparison Structure Quality Year (n) selection criteria cognitive bias of study Reference function Country
Jobst et al CT 44 AD and 57– General practi- Khachaturian – No info 0.85 0.78 4 0.19 AD-C Min dist of MTL Ia1998 10 non-AD 94 tioners and criteria cut-off 0.79[15] drawn from hospital referrals United Kingdom 167 patients OPTIMA study and 75 C
Juottonen et al MRI 30 AD 70 Hospital referrals NINCDS- 20 No info 0.80 0.91 13 0.21 AD-C EC 2b1998 32 C 72 ADRDA 28 0.80 0.94 9 0.21 Hippocampus[34]Finland
Kantarci et al MRI 61 C 80 Hospital referred DSM-III-R MMSE No info 0.79 0.80 4 0.26 AD-C Hippocampus 2b2002 24 MCI 82 NINCDS 29 0.86 0.80 4.3 0.17 MCI-C[12] 22 AD 79 ADRDA 28 0.75 0.80 2.5 0.27 MCI-ADUSA 26
Killiany et al 136 70 Prospective, longi- DSM-IV MMSE No info 0.82 0.94 13 0.50 C-“MCI” Entohrinal cortex 1b2002 16 mild AD 74 tudinal study. NINCDS 24 0.76 0.76 3 0.91 C-AD Hippocampus[6] 21 converters 72 Follow-up: 3 years. 29USA to AD 72 Recruited thorough 29 73 question- advertisement – able (MCI) 28 controls
Kitagaki et al MRI 22 FTD 65.3 Hospital referrals NINCDS 17 No info 0.86 0.94 – 0.26 FTD-C T2-frontal WMH 2b1997 22 AD 65 Lund- 18 0.86 0.73 – 0.38 FTD-AD T2-frontal WMH[24] 16 NC 63.5 Manchester 0.64 1.00 16 FTD-C Frontal atrophyJapan 0.64 0.96 FTD-AD Frontal atrophy
Koslow et al CT 58 AD 68 Clinic/research NINCDS MMSE No info 0.83 0.30 5.9 0.22 AD-C Combination of 2b1992 59 C 19 CT measurement[39] 29France
Laakso et al MRI 57 AD 70 Hospital referrals NINCDS MMSE No info 0.86 0.85 6 0.16 AD-C Right Hippocampus 2b2000 34 C 72 22 0.83 0.94 13 0.18 Left Hippocampus[32] 28Finland
The table continues on the next page

D E M E N T I A – D I AG N O S T I C A N D T H E R A P E U T I C I N T E RV E N T I O N S182
Table 17.2 continued
Author Method Sample Age Population/ Diagnostic Global Work up SS SP LR+ LR– Comparison Structure Quality Year (n) selection criteria cognitive bias of study Reference function Country
Laakso et al MRI 55 AD 70 Hospital referrals. NINCDS 22 0.84 0.90 12 0.17 AD-C Hippocampus 2a1998 44 AAMI 70 Random selection 28[30] 42 C 72 from population 28 AD-OD Finland based study
Laakso et al MRI 54 AD 70 Hospital referrals NINCSD 22 No info 0.37 0.72 1.3 0.90 AD-OD Interunctal 2b1995 40 AAMI 70 NIH-criteria 27 distance[9] 27 C 71 Spouses 28Finland
Laakso et al 1995 54 AD 70 Clinic, research NINCDS- 22 No info 0.76 0.72 2.7 0.33 AD-C Amygdala 2b1995 38 AAMI 70 ADRDA 23[10] (MCI) 28Finland 34 C old 72 20 C young 29
Lavenu et al MRI 77 AD 72 Hospital referrals NINCDS 19 No info 0.77 0.93 11 0.24 MMT <18 Combination of 2a1997 48 other 71 22 0.34 0.93 6 0.68 MMT >18 medial temp lobe[19] dementias atrophy and reducedFrance rCBFin par/temp area
O’Brien et al MRI 30 AD 71 Hospital referrals NINCDS 8 No info 0.93 0.86 7 0.08 AD-C SPECT+MR 1b2001 SPECT 22 C 72 Follow-up: 3 years 28 0.77 0.82 4 0.28 SPECT[29] spousesUnited Kingdom
O’Brien et al MRI 69 AD 80 Hospital referrals NINCDS 16 No info 0.51 0.72 2 0.68 AD-Depr Minimal of MTL 2a2000 25 VaD 77 NINDS-AIREN 20 0.56 0.32 1 1.37 AD-DLB width[22] 9 DLB 81 DLB 13 0.54 0.72 1 0.64 AD-VaDUnited 13 depression 76 DSM-IV 26 Kingdom
O’Brien et al MRI 77 AD 71 Consecutive NINCDS MMSE No info 0.83 0.88 7 0.19 AD-C Visual rating of 2a1997 61 major 71 referrals/research 17 0.83 0.97 27 0.17 AD-MD different temp[18] depression Mixed controls 25 0.83 0.98 41.5 0.17 AD-OD lobe structuresUnited 44 other 69 24Kingdom 40 C ? 28

C H A P T E R 17 • S T R U C T U R A L A N D F U N C T I O N A L I M AG I N G O F T H E B R A I N I N D E M E N T I A WO R K U P
183
Table 17.2 continued
Author Method Sample Age Population/ Diagnostic Global Work up SS SP LR+ LR– Comparison Structure Quality Year (n) selection criteria cognitive bias of study Reference function Country
Laakso et al MRI 55 AD 70 Hospital referrals. NINCDS 22 0.84 0.90 12 0.17 AD-C Hippocampus 2a1998 44 AAMI 70 Random selection 28[30] 42 C 72 from population 28 AD-OD Finland based study
Laakso et al MRI 54 AD 70 Hospital referrals NINCSD 22 No info 0.37 0.72 1.3 0.90 AD-OD Interunctal 2b1995 40 AAMI 70 NIH-criteria 27 distance[9] 27 C 71 Spouses 28Finland
Laakso et al 1995 54 AD 70 Clinic, research NINCDS- 22 No info 0.76 0.72 2.7 0.33 AD-C Amygdala 2b1995 38 AAMI 70 ADRDA 23[10] (MCI) 28Finland 34 C old 72 20 C young 29
Lavenu et al MRI 77 AD 72 Hospital referrals NINCDS 19 No info 0.77 0.93 11 0.24 MMT <18 Combination of 2a1997 48 other 71 22 0.34 0.93 6 0.68 MMT >18 medial temp lobe[19] dementias atrophy and reducedFrance rCBFin par/temp area
O’Brien et al MRI 30 AD 71 Hospital referrals NINCDS 8 No info 0.93 0.86 7 0.08 AD-C SPECT+MR 1b2001 SPECT 22 C 72 Follow-up: 3 years 28 0.77 0.82 4 0.28 SPECT[29] spousesUnited Kingdom
O’Brien et al MRI 69 AD 80 Hospital referrals NINCDS 16 No info 0.51 0.72 2 0.68 AD-Depr Minimal of MTL 2a2000 25 VaD 77 NINDS-AIREN 20 0.56 0.32 1 1.37 AD-DLB width[22] 9 DLB 81 DLB 13 0.54 0.72 1 0.64 AD-VaDUnited 13 depression 76 DSM-IV 26 Kingdom
O’Brien et al MRI 77 AD 71 Consecutive NINCDS MMSE No info 0.83 0.88 7 0.19 AD-C Visual rating of 2a1997 61 major 71 referrals/research 17 0.83 0.97 27 0.17 AD-MD different temp[18] depression Mixed controls 25 0.83 0.98 41.5 0.17 AD-OD lobe structuresUnited 44 other 69 24Kingdom 40 C ? 28
The table continues on the next page

D E M E N T I A – D I AG N O S T I C A N D T H E R A P E U T I C I N T E RV E N T I O N S184
Table 17.2 continued
Author Method Sample Age Population/ Diagnostic Global Work up SS SP LR+ LR– Comparison Structure Quality Year (n) selection criteria cognitive bias of study Reference function Country
O’Brien et al MRI 43 AD 70 Consecutive DSM-III-R MMSE No info 0.93 0.84 3.5 0.08 AD-MD Visually rated: 2b1994 32 major 71 referrals 15 No info 0.81 0.94 13.5 0.20 Ant HC[33] depression 26 0.81 0.94 13.5 0.20 AmygdalaUnited Kingdom MMSE 0.67 0.94 20 0.35 EC Cerebr cortex
Pennanen et al MRI 48 AD 71 Population based DSM-IV 21 No 0.60 0.71 2 0.84 MCI-C EC 1a2004 65 MCI 72 cohort NINCDS- 24 bias 0.88 0.93 17 0.13 AD-C HC + EC[14] 59 C 72 ADRDA 27 0.81 0.83 5 0.23 AD-MCI HCFinland Petersen criteria for MCI
Rossi et al CT 20 AD 75 OPTIMA CERAD 15 No info 0.80 0.83 4.7 0.24 AD-C rWTH Ia2004 23 C 35 study 28[16]United Kingdom/Italy
Shonk et al MRS 65 AD 73 Research, recruited NINCDS- – No info 0.83 0.95 16.6 0.18 AD-C MRS 2a1995 39 OD 75 from a clinical trial NINDS-AIREN – 0.82 0.64 2.3 0.28 AD-OD MI/Cr[25] 20 C 71 OD research –USA crit
Varma et al MRI 23 AD 63 Hospital referrals NINCDS 18 No info 0.71 0.93 10 0.31 FTD-non-FTD Frontal atrophy or 1b2002 21 FTD 63 Follow-up: 3 years NINDS-AIREN 21 0.71 0.76 3 0.38 FTD-non-FTD Asymetry.[21] 20 VaD 60 Lund- 21 Parietal atrophyUnited Kingdom Manchester and rCBF
Wahlund et al MRI 41 AD 63 Hospital referrals DSM-IV-R MMSE No bias 0.88 0.96 22 0.13 AD-C Volumetry MTL 2b2000 35 OD 69 Follow-up: 6 months NINCDS 18 0.93 0.98 46 0.07 OD-C Visual rating MTA[17] 66 C 68 NINDS-AIREN 21 0.78 0.96 19 0.22 OD-AD Volumetry MTLSweden Lund- 28 0.82 0.95 16 0.19 Visual rating MTA Manchester 0.68 0.53 1.5 0.60 Volumetry MTL 0.78 0.64 2.5 0.34 Visual rating MTA

C H A P T E R 17 • S T R U C T U R A L A N D F U N C T I O N A L I M AG I N G O F T H E B R A I N I N D E M E N T I A WO R K U P
185
Table 17.2 continued
Author Method Sample Age Population/ Diagnostic Global Work up SS SP LR+ LR– Comparison Structure Quality Year (n) selection criteria cognitive bias of study Reference function Country
O’Brien et al MRI 43 AD 70 Consecutive DSM-III-R MMSE No info 0.93 0.84 3.5 0.08 AD-MD Visually rated: 2b1994 32 major 71 referrals 15 No info 0.81 0.94 13.5 0.20 Ant HC[33] depression 26 0.81 0.94 13.5 0.20 AmygdalaUnited Kingdom MMSE 0.67 0.94 20 0.35 EC Cerebr cortex
Pennanen et al MRI 48 AD 71 Population based DSM-IV 21 No 0.60 0.71 2 0.84 MCI-C EC 1a2004 65 MCI 72 cohort NINCDS- 24 bias 0.88 0.93 17 0.13 AD-C HC + EC[14] 59 C 72 ADRDA 27 0.81 0.83 5 0.23 AD-MCI HCFinland Petersen criteria for MCI
Rossi et al CT 20 AD 75 OPTIMA CERAD 15 No info 0.80 0.83 4.7 0.24 AD-C rWTH Ia2004 23 C 35 study 28[16]United Kingdom/Italy
Shonk et al MRS 65 AD 73 Research, recruited NINCDS- – No info 0.83 0.95 16.6 0.18 AD-C MRS 2a1995 39 OD 75 from a clinical trial NINDS-AIREN – 0.82 0.64 2.3 0.28 AD-OD MI/Cr[25] 20 C 71 OD research –USA crit
Varma et al MRI 23 AD 63 Hospital referrals NINCDS 18 No info 0.71 0.93 10 0.31 FTD-non-FTD Frontal atrophy or 1b2002 21 FTD 63 Follow-up: 3 years NINDS-AIREN 21 0.71 0.76 3 0.38 FTD-non-FTD Asymetry.[21] 20 VaD 60 Lund- 21 Parietal atrophyUnited Kingdom Manchester and rCBF
Wahlund et al MRI 41 AD 63 Hospital referrals DSM-IV-R MMSE No bias 0.88 0.96 22 0.13 AD-C Volumetry MTL 2b2000 35 OD 69 Follow-up: 6 months NINCDS 18 0.93 0.98 46 0.07 OD-C Visual rating MTA[17] 66 C 68 NINDS-AIREN 21 0.78 0.96 19 0.22 OD-AD Volumetry MTLSweden Lund- 28 0.82 0.95 16 0.19 Visual rating MTA Manchester 0.68 0.53 1.5 0.60 Volumetry MTL 0.78 0.64 2.5 0.34 Visual rating MTA
The table continues on the next page

D E M E N T I A – D I AG N O S T I C A N D T H E R A P E U T I C I N T E RV E N T I O N S186
Table 17.2 continued
Author Method Sample Age Population/ Diagnostic Global Work up SS SP LR+ LR– Comparison Structure Quality Year (n) selection criteria cognitive bias of study Reference function Country
Xu et al MRI 30 C 79 Recruited from DSM-III-R MMSE No info 0.63 0.8 3 0.46 C-MCI Hippocampus 1b2000 30 MCI 78 prospective study, NINCDS 28 0.8 0.8 4 0.25[8] 30 AD 79 MCI Peterson 25 0.6 0.8 3 0.46 C-ADUSA criteria 20 0.6 0.8 3 0.50 AD-MCI 0.76 0.8 4 0.30 0.6 0.8 3 0.50 C-MCI Entorhinal cortex C-AD AD-MCI
Zeidler et al MR CJD 30 Hospital referrals Criteria for – 0.78 1 0 0.78 Variant CJD-C “Pulvinal sign” IIb2000 CJD and [26] Variant CJDGermany
AAMI = Age Associated Memory Impairment; AD = Alzheimer’s disease; C = Control; CDR = Clinical dementia rating; CJD = Creutzfeldt-Jakob disease; CR = Creatinine; CT = Computerized tomography; DLB = Dementia with Lewy body; EC = Entorhinal cortex; FTD = Frontotemporal dementia; HC = Hippocampus; MCI = Mild cognitive impairment; MD = Manic-depressiv disorder; MI = Myo-innositol; MMSE = Mini-mental state examination; MMT = Mini mental test; MRI = Magnetic resonance imaging; MRS = Magnetic resonance spectroscopy; MTA = Medral temporal lobe atrophy; MTL = Medral temporal lobe; NC = Normal controls; OD = Other dementias; rCBF = Regional cerebral blood flow; rWTH = Radical width of temporal horn; TH = Temporal horn; TMTL = Total medral temporal lobe; VaD = Vascular dementia; WMH = White matter MR

C H A P T E R 17 • S T R U C T U R A L A N D F U N C T I O N A L I M AG I N G O F T H E B R A I N I N D E M E N T I A WO R K U P
187
Table 17.2 continued
Author Method Sample Age Population/ Diagnostic Global Work up SS SP LR+ LR– Comparison Structure Quality Year (n) selection criteria cognitive bias of study Reference function Country
Xu et al MRI 30 C 79 Recruited from DSM-III-R MMSE No info 0.63 0.8 3 0.46 C-MCI Hippocampus 1b2000 30 MCI 78 prospective study, NINCDS 28 0.8 0.8 4 0.25[8] 30 AD 79 MCI Peterson 25 0.6 0.8 3 0.46 C-ADUSA criteria 20 0.6 0.8 3 0.50 AD-MCI 0.76 0.8 4 0.30 0.6 0.8 3 0.50 C-MCI Entorhinal cortex C-AD AD-MCI
Zeidler et al MR CJD 30 Hospital referrals Criteria for – 0.78 1 0 0.78 Variant CJD-C “Pulvinal sign” IIb2000 CJD and [26] Variant CJDGermany
AAMI = Age Associated Memory Impairment; AD = Alzheimer’s disease; C = Control; CDR = Clinical dementia rating; CJD = Creutzfeldt-Jakob disease; CR = Creatinine; CT = Computerized tomography; DLB = Dementia with Lewy body; EC = Entorhinal cortex; FTD = Frontotemporal dementia; HC = Hippocampus; MCI = Mild cognitive impairment; MD = Manic-depressiv disorder; MI = Myo-innositol; MMSE = Mini-mental state examination; MMT = Mini mental test; MRI = Magnetic resonance imaging; MRS = Magnetic resonance spectroscopy; MTA = Medral temporal lobe atrophy; MTL = Medral temporal lobe; NC = Normal controls; OD = Other dementias; rCBF = Regional cerebral blood flow; rWTH = Radical width of temporal horn; TH = Temporal horn; TMTL = Total medral temporal lobe; VaD = Vascular dementia; WMH = White matter MR
}
}
D E M E N T I A – D I AG N O S T I C A N D T H E R A P E U T I C I N T E RV E N T I O N S188
1. Herholz K, Salmon E, Perani D, Baron JC, Holthoff V, Frolich L, et al. Dis-crimination between Alzheimer demen-tia and controls by automated analysis of multicenter FDG PET. Neuroimage 2002;17:302-16.
2. Talbot PR, Lloyd JJ, Snowden JS, Neary D, Testa HJ. A clinical role for 99mTc-HMPAO SPECT in the investigation of dementia? J Neurol Neurosurg Psychiatry 1998;64:306-13.
3. Hoffman JM, Welsh-Bohmer KA, Hanson M, Crain B, Hulette C, Earl N, et al. FDG PET imaging in patients with pathologically verified dementia. J Nucl Med 2000;41:1920-8.
4. Silverman DH, Truong CT, Kim SK, Chang CY, Chen W, Kowell AP, et al. Prognostic value of regional cerebral me-tabolism in patients undergoing dementia evaluation: comparison to a quantifying parameter of subsequent cognitive per-formance and to prognostic assessment without PET. Mol Genet Metab 2003; 80:350-5.
5. Pasquier J, Michel BF, Brenot-Rossi I, Hassan-Sebbag N, Sauvan R, Gastaut JL. Value of (99m)Tc-ECD SPET for the dia-gnosis of dementia with Lewy bodies. Eur J Nucl Med Mol Imaging 2002;29:1342-8.
6. Killiany RJ, Hyman BT, Gomez-Isla T, Moss MB, Kikinis R, Jolesz F, et al. MRI measures of entorhinal cortex vs hippo-campus in preclinical AD. Neurology 2002;58:1188-96.
7. de Leon MJ, Golomb J, George AE, Convit A, Tarshish CY, McRae T, et al.
The radiologic prediction of Alzheimer dis-ease: the atrophic hippocampal formation. AJNR Am J Neuroradiol 1993;14:897-906.
8. Xu Y, Jack CR, Jr O’Brien PC, Kokmen E, Smith GE, Ivnik RJ, et al. Usefulness of MRI measures of entorhinal cortex versus hippocampus in AD. Neurology 2000;54:1760-7.
9. Laakso M, Soininen H, Partanen K, Hallikainen M, Lehtovirta M, Hanninen T, et al. The interuncal distance in Alzhe-imer disease and age-associated memory impairment. AJNR Am J Neuroradiol 1995;16:727-34.
10. Laakso MP, Partanen K, Lehtovirta M, Hallikainen M, Hanninen T, Vainio P, et al. MRI of amygdala fails to diagnose early Alzheimer’s disease. Neuroreport 1995;6:2414-8.
11. El Fakhri G, Kijewski MF, Johnson KA, Syrkin G, Killiany RJ, Becker JA, et al. MRI-guided SPECT perfusion measures and volumetric MRI in pro-dromal Alzheimer disease. Arch Neurol 2003;60:1066-72.
12. Kantarci K, Xu Y, Shiung MM, O’Brien PC, Cha RH, Smith GE, et al. Comparative diagnostic utility of different MR modalities in mild cognitive impair-ment and Alzheimer’s disease. Dement Geriatr Cogn Disord 2002;14:198-207.
13. Bottino CM, Castro CC, Gomes RL, Buchpiguel CA, Marchetti RL, Neto MR. Volumetric MRI measurements can differentiate Alzheimer’s disease, mild cognitive impairment, and normal aging. Int Psychogeriatr 2002;14:59-72.
References

C H A P T E R 17 • S T R U C T U R A L A N D F U N C T I O N A L I M AG I N G O F T H E B R A I N I N D E M E N T I A WO R K U P
189
14. Pennanen C, Kivipelto M, Tuomainen S, Hartikainen P, Hanninen T, Laakso MP, et al. Hippocampus and entorhinal cortex in mild cognitive impairment and early AD. Neurobiol Aging 2004;25: 303-10.
15. Jobst KA, Barnetson LP, Shepstone BJ. Accurate prediction of histologically confirmed Alzheimer’s disease and the differential diagnosis of dementia: the use of NINCDS-ADRDA and DSM-III-R criteria, SPECT, X-ray CT, and Apo E4 in medial temporal lobe dementias. Oxford Project to Investigate Memory and Aging. Int Psychogeriatr 1998;10: 271-302.
16. Rossi R, Joachim C, Smith AD, Frisoni GB. The CT-based radial width of the temporal horn: pathological validation in AD without cerebrovascular disease. Int J Geriatr Psychiatry 2004;19:570-4.
17. Wahlund LO, Julin P, Johansson SE, Scheltens P. Visual rating and volumetry of the medial temporal lobe on magnetic resonance imaging in dementia: a compara-tive study. J Neurol Neurosurg Psychiatry 2000;69:630-5.
18. O’Brien JT, Desmond P, Ames D, Schweitzer I, Chiu E, Tress B. Temporal lobe magnetic resonance imaging can dif-ferentiate Alzheimer’s disease from normal ageing, depression, vascular dementia and other causes of cognitive impairment. Psychol Med 1997;27:1267-75.
19. Lavenu I, Pasquier F, Lebert F, Jacob B, Petit H. Association between medial temporal lobe atrophy on CT and parieto-temporal uptake decrease on SPECT in Alzheimer’s disease. J Neurol Neurosurg Psychiatry 1997;63:441-5.
20. Denihan A, Wilson G, Cunningham C, Coakley D, Lawlor BA. CT measure-ment of medial temporal lobe atrophy in Alzheimer’s disease, vascular dementia, depression and paraphrenia. Int J Geriatr Psychiatry 2000;15:306-12.
21. Varma AR, Adams W, Lloyd JJ, Carson KJ, Snowden JS, Testa HJ, et al. Diagnos-tic patterns of regional atrophy on MRI and regional cerebral blood flow change on SPECT in young onset patients with Alzheimer’s disease, frontotemporal de-mentia and vascular dementia. Acta Neurol Scand 2002;105:261-9.
22. O’Brien JT, Metcalfe S, Swann A, Hobson J, Jobst K, Ballard C, et al. Medial temporal lobe width on CT scanning in Alzheimer’s disease: comparison with vas-cular dementia, depression and dementia with Lewy bodies. Dement Geriatr Cogn Disord 2000;11:114-8.
23. Barber R, Gholkar A, Scheltens P, Ballard C, McKeith IG, O’Brien JT. Medial temporal lobe atrophy on MRI in dementia with Lewy bodies. Neurology 1999;52:1153-8.
24. Kitagaki H, Mori E, Hirono N, Ikejiri Y, Ishii K, Imamura T, et al. Alteration of white matter MR signal intensity in frontotemporal dementia. AJNR Am J Neuroradiol 1997;18:367-78.
25. Shonk TK, Moats RA, Gifford P, Michaelis T, Mandigo JC, Izumi J, et al. Probable Alzheimer disease: diagnosis with proton MR spectroscopy. Radiology 1995;195:65-72.
26. Zeidler M, Sellar RJ, Collie DA, Knight R, Stewart G, Macleod MA, et al. The pulvinar sign on magnetic resonance

D E M E N T I A – D I AG N O S T I C A N D T H E R A P E U T I C I N T E RV E N T I O N S190
imaging in variant Creutzfeldt-Jakob disease. Lancet 2000;355:1412-8.
27. Gosche KM, Mortimer JA, Smith CD, Markesbery WR, Snowdon DA. Hippocampal volume as an index of Alzheimer neuropathology: findings from the Nun Study. Neurology 2002; 58:1476-82.
28. Bigler ED, Tate DF. Brain volume, intracranial volume, and dementia. Invest Radiol 2001;36:539-46.
29. O’Brien JT, Ames D, Desmond P, Lichtenstein M, Binns D, Schweitzer I, et al. Combined magnetic resonance imaging and single-photon emission tomography scanning in the discrimination of Alzheim-er’s disease from age-matched controls. Int Psychogeriatr 2001;13:149-61.
30. Laakso MP, Soininen H, Partanen K, Lehtovirta M, Hallikainen M, Hanninen T, et al. MRI of the hippocampus in Alzheimer’s disease: sensitivity, specificity, and analysis of the incorrectly classified subjects. Neurobiol Aging 1998;19:23-31.
31. Erkinjuntti T, Lee DH, Gao F, Steenhuis R, Eliasziw M, Fry R, et al. Temporal lobe atrophy on magnetic resonance imaging in the diagnosis of early Alzheimer’s disease. Arch Neurol 1993;50:305-10.
32. Laakso MP, Hallikainen M, Hanninen T, Partanen K, Soininen H. Diagnosis of Alzheimer’s disease: MRI of the hippocampus vs delayed recall. Neuropsychologia 2000;38:579-84.
33. O’Brien JT, Desmond P, Ames D, Schweitzer I, Tuckwell V, Tress B. The dif-ferentiation of depression from dementia by
temporal lobe magnetic resonance imaging. Psychol Med 1994;24:633-40.
34. Juottonen K, Laakso MP, Insausti R, Lehtovirta M, Pitkanen A, Partanen K, et al. Volumes of the entorhinal and perirhinal cortices in Alzheimer’s disease. Neurobiol Aging 1998;19:15-22.
35. Frisoni GB, Beltramello A, Geroldi C, Weiss C, Bianchetti A, Trabucchi M. Brain atrophy in frontotemporal de-mentia. J Neurol Neurosurg Psychiatry 1996;61:157-65.
36. Golebiowski M, Barcikowska M, Pfeffer A. Magnetic resonance imaging-based hippocampal volumetry in patients with dementia of the Alzheimer type. Dement Geriatr Cogn Disord 1999;10: 284-8.
37. DeCarli C, Murphy DG, McIntosh AR, Teichberg D, Schapiro MB, Horwitz B. Discriminant analysis of MRI measures as a method to determine the presence of dementia of the Alzheimer type. Psychiatry Res 1995;57:119-30.
38. Frisoni GB, Geroldi C, Beltramello A, Bianchetti A, Binetti G, Bordiga G, et al. Radial width of the temporal horn: a sensi-tive measure in Alzheimer disease. AJNR Am J Neuroradiol 2002;23:35-47.
39. Koslow SA, Swihart AA, Latchaw RE, Hirsch WL, Belle SH, Shim YK, et al. Quantitative computer tomography in Alzheimer’s disease: a re-evaluation. Gerontology 1992;38:174-84.
40. Du AT, Schuff N, Zhu XP, Jagust WJ, Miller BL, Reed BR, et al. Atrophy rates of entorhinal cortex in AD and normal aging. Neurology 2003;60:481-6.

C H A P T E R 17 • S T R U C T U R A L A N D F U N C T I O N A L I M AG I N G O F T H E B R A I N I N D E M E N T I A WO R K U P
191
41. Gao FQ, Black SE, Leibovitch FS, Callen DJ, Rockel CP, Szalai JP. Linear width of the medial temporal lobe can dis-
criminate Alzheimer’s disease from normal aging: the Sunnybrook dementia study. Neurobiol Aging 2004;25:441-8.


C H A P T E R 18 • F U N C T I O N A L I M AG I N G ’ S D I AG N O S T I C TO O L I N D E M E N T I A WO R K U P S E A R C H S T R AT E G I E S
193
18. Functional Imaging’s Diagnostic Tool in Dementia Workup Search Strategies
Conclusions
There is moderately strong evidence that SPECT/PET helps the dia-gnostic workup differentiate AD (Alzheimer’s disease) patients from controls and AD from non-AD dementia (Evidence Grade 2).
From this evaluation, it is not obvious that PET is superior to SPECT in differentiating AD patients from controls or AD from other dementia disorders. The likelihood ratios were similar regardless of whether PET (using glucose metabolism) or SPECT was employed.
Our results are in agreement with those in AAN’s guidelines, as well as Jagust et al in “Evidence–Based Dementia Practice” [1].
Moreover, a systematic review by Dougall et al calculated the LR+ as 7 for the comparison of AD patients to controls using SPECT and reduc-tion of blood flow in parietotemporal areas. Our results are in the same neighborhood.
Introduction
The American Academy of Neurology has suggested that the use of functional imaging (SPECT and PET in this evaluation) in dementia workup is not to be recommended as part of routine evaluation (guide-line). Nevertheless, it is often used, particularly in specialized memory clinics and as a complement to structural imaging in difficult differen-tial diagnostic evaluations.
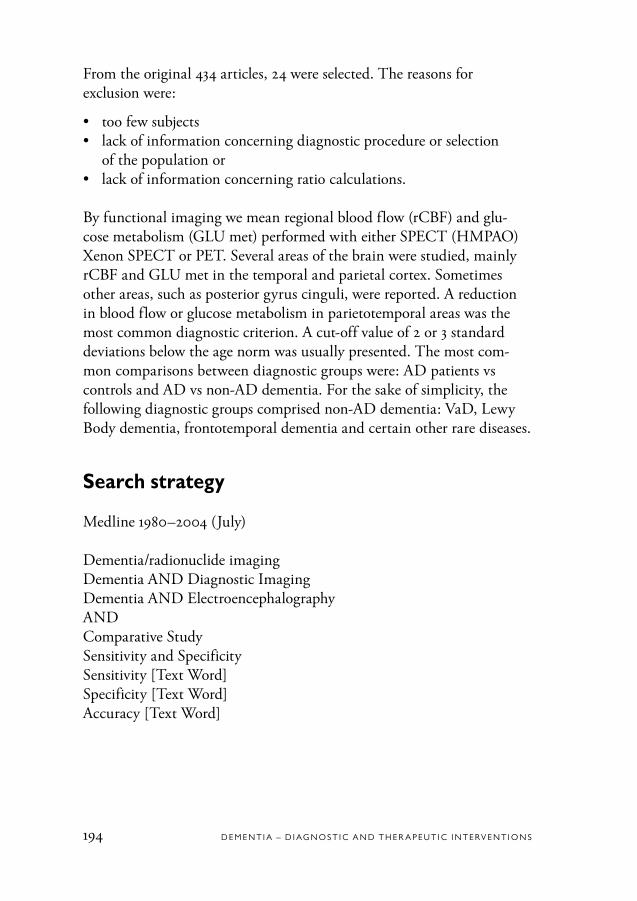
D E M E N T I A – D I AG N O S T I C A N D T H E R A P E U T I C I N T E RV E N T I O N S194
From the original 434 articles, 24 were selected. The reasons for exclusion were:
• too few subjects• lack of information concerning diagnostic procedure or selection
of the population or• lack of information concerning ratio calculations.
By functional imaging we mean regional blood flow (rCBF) and glu-cose metabolism (GLU met) performed with either SPECT (HMPAO) Xenon SPECT or PET. Several areas of the brain were studied, mainly rCBF and GLU met in the temporal and parietal cortex. Sometimes other areas, such as posterior gyrus cinguli, were reported. A reduction in blood flow or glucose metabolism in parietotemporal areas was the most common diagnostic criterion. A cut-off value of 2 or 3 standard deviations below the age norm was usually presented. The most com-mon comparisons between diagnostic groups were: AD patients vs controls and AD vs non-AD dementia. For the sake of simplicity, the following diagnostic groups comprised non-AD dementia: VaD, Lewy Body dementia, frontotemporal dementia and certain other rare diseases.
Search strategy
Medline 1980–2004 (July)
Dementia/radionuclide imagingDementia AND Diagnostic ImagingDementia AND ElectroencephalographyANDComparative StudySensitivity and SpecificitySensitivity [Text Word]Specificity [Text Word]Accuracy [Text Word]

C H A P T E R 18 • F U N C T I O N A L I M AG I N G ’ S D I AG N O S T I C TO O L I N D E M E N T I A WO R K U P S E A R C H S T R AT E G I E S
195
AND Human >18 yearsNOT Case Report Editorial [Publication Type] Letter [Publication Type] Review [Publication Type] HIV [Text Word]434 hits were found.
Results
Ten studies compared AD patients to controls [2–11] and 12 studies compared AD to non-AD dementia [5,12–22]. Two studies with a likelihood ratio of 2.6 [15,16] compared AD to MCI and 1 study with a likelihood ratio of 4 compared patients with frontotemporal dementia to controls. The majority of studies were classified as having a quality of 2b. Five studies were reported with histopathological verification Ia, IIb. There were no major difference in the likelihood ratio between stu-dies with histopathological verification and those with clinical diagnosis as the gold standard. The evidence is based on studies with quality 2b from memory clinic settings. Only 1 study reported results from a Popu-lation based setting [19]. There were no studies from general practice set-tings. As is the case with structural imaging, caution must be exercised when interpreting LR+ values. Workup bias: 6 studies stated explicitly that there was no workup bias [3,6,11,20,22,24]. The other studies did not provide any information in that regard.
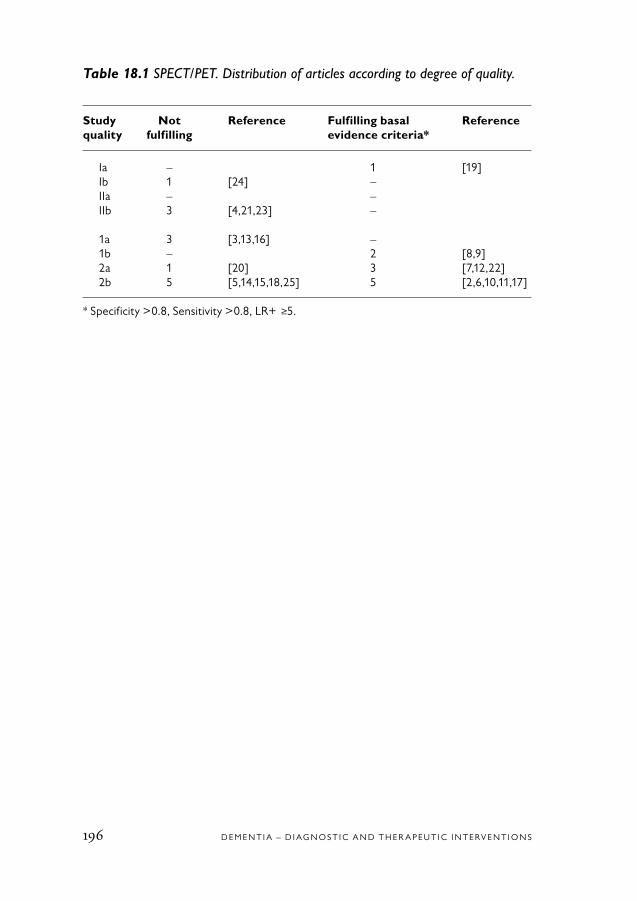
D E M E N T I A – D I AG N O S T I C A N D T H E R A P E U T I C I N T E RV E N T I O N S196
Table 18.1 SPECT/PET. Distribution of articles according to degree of quality.
Study Not Reference Fulfilling basal Reference quality fulfilling evidence criteria*
Ia – 1 [19] Ib 1 [24] – IIa – – IIb 3 [4,21,23] – 1a 3 [3,13,16] – 1b – 2 [8,9] 2a 1 [20] 3 [7,12,22] 2b 5 [5,14,15,18,25] 5 [2,6,10,11,17]
* Specificity >0.8, Sensitivity >0.8, LR+ ≥5.

C H A P T E R 18 • F U N C T I O N A L I M AG I N G ’ S D I AG N O S T I C TO O L I N D E M E N T I A WO R K U P S E A R C H S T R AT E G I E S
197

D E M E N T I A – D I AG N O S T I C A N D T H E R A P E U T I C I N T E RV E N T I O N S198
Table 18.2 Functional imaging (SPECT/PET).
Author Type Population/ Sample (n) Age Clinical Path Global Study Workup SS SP LR+ LR– Comments Quality Year of selection criteria criteria cognitive design bias of study Reference functional function Country imaging
Azari et al PET Referred to 19 probable AD 52–81 NINCDS- AD: Cross- No info 0.89 0.86 6.3 0.13 AD vs controls: 2b1993 university 22 controls 53–75 ADRDA MMSE = 20 sectional 0.80 0.81 4.2 0.25 – Frontal-parietal [2] hospital Subject at risk: for AD – – Other areasUSA MMSE = 28 and controls
Bergman et al SPECT Referred to 58 AD 76 NINCDS- MMSE = 22 Cross- No info 0.21 0.80 1.0 AD vs controls: 1a1997 university 17 VaD 79 ADRDA MMSE = 22.4 sectional 0.29 0.75 1.1 B pattern as[16] hospital 25 CIND/MCI 73 MMSE = 27 0.55 0.65 1.2 positive Canada Follow-up 20 controls 68 Controls: B or C as positive 6–2 months MMSE = 29 B or C or D as positive
(B: lateral posterior temporal and/or parietal cortex defects. C: bilateral posterior temporal and/or parietal cortex defects with additional defects. D: unilateral posterior temporal and/or parietal cortex defects with or without additional defects)
Bonte et al SPECT Referred to 54 AD 58–80 – Yes Cross- No info 0.86 0.73 3.1 0.19 AD vs controls IIb1997 university 29 controls 55–87 (54 patients) sectional Posterior regions[4] hospital Histo-Belgium pathology
Claus et al SPECT Referred to 48 AD 72 NINCDS- AD: Cross- No info 0.42 0.9 4.2 0.64 Temporal rCBF 2a1994 hospital 60 controls 74 ADRDA MMSE = 20 sectional 0.56 0.9 5.6 0.48 Mild AD[7] Controls: 0.79 0.9 7.9 0.23 Moderate AD-CThe Netherlands MMSE = 28 Severe AD-C
El Fakhri et al SPECT Prospective 83 MCI 72 NINCDS- MMSE No info 0.8 0.8 5.0 0.25 AD-nAD comb 1b2003 long hospital 27 AD 73 ADRDA 29 of areas[9] based CDR 0.5USA 5.25

C H A P T E R 18 • F U N C T I O N A L I M AG I N G ’ S D I AG N O S T I C TO O L I N D E M E N T I A WO R K U P S E A R C H S T R AT E G I E S
199
Table 18.2 Functional imaging (SPECT/PET).
Author Type Population/ Sample (n) Age Clinical Path Global Study Workup SS SP LR+ LR– Comments Quality Year of selection criteria criteria cognitive design bias of study Reference functional function Country imaging
Azari et al PET Referred to 19 probable AD 52–81 NINCDS- AD: Cross- No info 0.89 0.86 6.3 0.13 AD vs controls: 2b1993 university 22 controls 53–75 ADRDA MMSE = 20 sectional 0.80 0.81 4.2 0.25 – Frontal-parietal [2] hospital Subject at risk: for AD – – Other areasUSA MMSE = 28 and controls
Bergman et al SPECT Referred to 58 AD 76 NINCDS- MMSE = 22 Cross- No info 0.21 0.80 1.0 AD vs controls: 1a1997 university 17 VaD 79 ADRDA MMSE = 22.4 sectional 0.29 0.75 1.1 B pattern as[16] hospital 25 CIND/MCI 73 MMSE = 27 0.55 0.65 1.2 positive Canada Follow-up 20 controls 68 Controls: B or C as positive 6–2 months MMSE = 29 B or C or D as positive
(B: lateral posterior temporal and/or parietal cortex defects. C: bilateral posterior temporal and/or parietal cortex defects with additional defects. D: unilateral posterior temporal and/or parietal cortex defects with or without additional defects)
Bonte et al SPECT Referred to 54 AD 58–80 – Yes Cross- No info 0.86 0.73 3.1 0.19 AD vs controls IIb1997 university 29 controls 55–87 (54 patients) sectional Posterior regions[4] hospital Histo-Belgium pathology
Claus et al SPECT Referred to 48 AD 72 NINCDS- AD: Cross- No info 0.42 0.9 4.2 0.64 Temporal rCBF 2a1994 hospital 60 controls 74 ADRDA MMSE = 20 sectional 0.56 0.9 5.6 0.48 Mild AD[7] Controls: 0.79 0.9 7.9 0.23 Moderate AD-CThe Netherlands MMSE = 28 Severe AD-C
El Fakhri et al SPECT Prospective 83 MCI 72 NINCDS- MMSE No info 0.8 0.8 5.0 0.25 AD-nAD comb 1b2003 long hospital 27 AD 73 ADRDA 29 of areas[9] based CDR 0.5USA 5.25
The table continues on the next page

D E M E N T I A – D I AG N O S T I C A N D T H E R A P E U T I C I N T E RV E N T I O N S200
Table 18.2 continued
Author Type Population/ Sample (n) Age Clinical Path Global Study Workup SS SP LR+ LR– Comments Quality Year of selection criteria criteria cognitive design bias of study Reference functional function Country imaging
Hanyu et al SPECT Referred to 56 AD 75 NINCDS- Cross- No info 0.82 0.89 7.4 0.2 AD vs non-AD: 2a1993 university 81 VaD 73 ADRDA for sectional Parieto-temporal[12] hospital 165 OD ~70 AD diagnosis HypoperfusionJapan 25 normal 74 DSM-III-R – for other dementia diagnosis
Herholz et al PET Hospital based 110 C 57 NINCDS- >24 – No info 0.93 0.93 13 0.07 AD-C 2b2002 395 AD 69 ADRDA 19 0.84 0.93 12 0.17 Post cing temporo/[10] parietal glucoseGermany/ metabolUSA
Hoffman et al PET Referred to 22 patients with 65 NINCDS- Yes (all Cross- No info 0.93 0.63 2.5 0.11 AD vs non-AD IIb2000 university memory loss ADRDA patients) sectional 0.37 Bilateral temporo-[23] hospital or dementia (CERAD) parietal USA 15 AD hypometabolism 6 non AD
Ishii et al SPECT Referred to 42 AD 68 NINCDS- Cross- No info 0.95 0.57 2.1 0.08 AD vs non-AD 2b1996 university 51 non AD ADRDA sectional Temporoparietal[5] hospital for AD deficitsJapan
Jobst et al SPECT General practi- 200 dementia NINCDS- 118 dementia AD: Cross- 0.89 0.8 4.5 0.14 AD vs controls Ia1998 tioners and (104 autopsy) ADRDA (CERAD) CAMCOG sectional 0.85 0.78 3.9 0.19 Parietal temporal lobe[19] hospital-based 80 AD DSM-III-R = 45 Longi- 0.8 0.93 8.5 0.21 CT MTL atrophyUnited service. 14 controls Other tudinal Komb CT/SPECTKingdom Referred to 24 OD dementia: university CAMCOG hospital = 57
Johnson et al SPECT Referred to 29 AD 73 NINCDS- AD: Cross- No bias 0.91 0.86 6.5 0.1 AD vs controls 2b1993 university 78 controls 70 ADRDA (BDS) = 24.7 sectional[6] hospitalUSA

C H A P T E R 18 • F U N C T I O N A L I M AG I N G ’ S D I AG N O S T I C TO O L I N D E M E N T I A WO R K U P S E A R C H S T R AT E G I E S
201
Table 18.2 continued
Author Type Population/ Sample (n) Age Clinical Path Global Study Workup SS SP LR+ LR– Comments Quality Year of selection criteria criteria cognitive design bias of study Reference functional function Country imaging
Hanyu et al SPECT Referred to 56 AD 75 NINCDS- Cross- No info 0.82 0.89 7.4 0.2 AD vs non-AD: 2a1993 university 81 VaD 73 ADRDA for sectional Parieto-temporal[12] hospital 165 OD ~70 AD diagnosis HypoperfusionJapan 25 normal 74 DSM-III-R – for other dementia diagnosis
Herholz et al PET Hospital based 110 C 57 NINCDS- >24 – No info 0.93 0.93 13 0.07 AD-C 2b2002 395 AD 69 ADRDA 19 0.84 0.93 12 0.17 Post cing temporo/[10] parietal glucoseGermany/ metabolUSA
Hoffman et al PET Referred to 22 patients with 65 NINCDS- Yes (all Cross- No info 0.93 0.63 2.5 0.11 AD vs non-AD IIb2000 university memory loss ADRDA patients) sectional 0.37 Bilateral temporo-[23] hospital or dementia (CERAD) parietal USA 15 AD hypometabolism 6 non AD
Ishii et al SPECT Referred to 42 AD 68 NINCDS- Cross- No info 0.95 0.57 2.1 0.08 AD vs non-AD 2b1996 university 51 non AD ADRDA sectional Temporoparietal[5] hospital for AD deficitsJapan
Jobst et al SPECT General practi- 200 dementia NINCDS- 118 dementia AD: Cross- 0.89 0.8 4.5 0.14 AD vs controls Ia1998 tioners and (104 autopsy) ADRDA (CERAD) CAMCOG sectional 0.85 0.78 3.9 0.19 Parietal temporal lobe[19] hospital-based 80 AD DSM-III-R = 45 Longi- 0.8 0.93 8.5 0.21 CT MTL atrophyUnited service. 14 controls Other tudinal Komb CT/SPECTKingdom Referred to 24 OD dementia: university CAMCOG hospital = 57
Johnson et al SPECT Referred to 29 AD 73 NINCDS- AD: Cross- No bias 0.91 0.86 6.5 0.1 AD vs controls 2b1993 university 78 controls 70 ADRDA (BDS) = 24.7 sectional[6] hospitalUSA
The table continues on the next page

D E M E N T I A – D I AG N O S T I C A N D T H E R A P E U T I C I N T E RV E N T I O N S202
Table 18.2 continued
Author Type Population/ Sample (n) Age Clinical Path Global Study Workup SS SP LR+ LR– Comments Quality Year of selection criteria criteria cognitive design bias of study Reference functional function Country imaging
Lobotesis et al SPECT Community- 50 AD 82 NINCDS- 6 patients MMSE = 17 Cross- No info 0.63 0.95 13 0.39 Visual rating 2b2001 dwelling 23 DLB 79 ADRDA MMSE = 16 sectional Occ+medial+[18] population of 20 controls 78 DLB MMSE = 28 temporalUnited Kingdom patients referred consensus (AD+DLB) to local old-age criteria vs controls psychiatry services
Mattman et al SPECT Referred to 128 AD 70 NINCDS- FRS Cross- No info 0.6 0.66 2.6 0.59 AD vs not demented. 2b1997 university 54 not demented 65 ADRDA sectional 0.53 0.75 1.17 0.62 Left temporal lobe[15] hospital MCI Obs DSM-III-R Temp/or parietalCanada bilateral
O’Brien et al Hospital 33 C 75 NINCDS 28 No bias 0.78 0.94 15 C-DLB 2a2004 34 AD 79 “consensus 17 0.84 0.94 16 C-PD[22] 23 DLB 76 för DLB” 16 0.78 0.94 12 AD-KLBUnited Kingdom 38 PD 76 26 0.82 0.94 14 AD-PD R01 measurement of uptake in basal ganglia
Pasquier et al SPECT Hospital based 34 LBD 74 Mackeith MMSE – No info 0.70 0.70 2.0 0.43 AD-nAD 2b2002 28 AD 76 NINCDS- 16 Occipital/temporal[25] ADRDA 17 rCBFFrance
Sackeim et al 133Xe Referred to 30 AD 67 DSM-III-R AD: Cross- No info 0.97 0.7 3.2 0.04 AD-C 2b1993 techni- university 30 major 66 NINCDS- Modified sectional 0.78 0.84 5.0 0.26 AD-Depression[14] que hospital depression 64 ADRDA MMSE = USA 30 controls HRSD 30.80

C H A P T E R 18 • F U N C T I O N A L I M AG I N G ’ S D I AG N O S T I C TO O L I N D E M E N T I A WO R K U P S E A R C H S T R AT E G I E S
203
Table 18.2 continued
Author Type Population/ Sample (n) Age Clinical Path Global Study Workup SS SP LR+ LR– Comments Quality Year of selection criteria criteria cognitive design bias of study Reference functional function Country imaging
Lobotesis et al SPECT Community- 50 AD 82 NINCDS- 6 patients MMSE = 17 Cross- No info 0.63 0.95 13 0.39 Visual rating 2b2001 dwelling 23 DLB 79 ADRDA MMSE = 16 sectional Occ+medial+[18] population of 20 controls 78 DLB MMSE = 28 temporalUnited Kingdom patients referred consensus (AD+DLB) to local old-age criteria vs controls psychiatry services
Mattman et al SPECT Referred to 128 AD 70 NINCDS- FRS Cross- No info 0.6 0.66 2.6 0.59 AD vs not demented. 2b1997 university 54 not demented 65 ADRDA sectional 0.53 0.75 1.17 0.62 Left temporal lobe[15] hospital MCI Obs DSM-III-R Temp/or parietalCanada bilateral
O’Brien et al Hospital 33 C 75 NINCDS 28 No bias 0.78 0.94 15 C-DLB 2a2004 34 AD 79 “consensus 17 0.84 0.94 16 C-PD[22] 23 DLB 76 för DLB” 16 0.78 0.94 12 AD-KLBUnited Kingdom 38 PD 76 26 0.82 0.94 14 AD-PD R01 measurement of uptake in basal ganglia
Pasquier et al SPECT Hospital based 34 LBD 74 Mackeith MMSE – No info 0.70 0.70 2.0 0.43 AD-nAD 2b2002 28 AD 76 NINCDS- 16 Occipital/temporal[25] ADRDA 17 rCBFFrance
Sackeim et al 133Xe Referred to 30 AD 67 DSM-III-R AD: Cross- No info 0.97 0.7 3.2 0.04 AD-C 2b1993 techni- university 30 major 66 NINCDS- Modified sectional 0.78 0.84 5.0 0.26 AD-Depression[14] que hospital depression 64 ADRDA MMSE = USA 30 controls HRSD 30.80
The table continues on the next page

D E M E N T I A – D I AG N O S T I C A N D T H E R A P E U T I C I N T E RV E N T I O N S204
Table 18.2 continued
Author Type Population/ Sample (n) Age Clinical Path Global Study Workup SS SP LR+ LR– Comments Quality Year of selection criteria criteria cognitive design bias of study Reference functional function Country imaging
Silverman et al PET Hospital 97 AD – Histo- AD/nonAD – 0.94 0.73 3.5 0.08 AD-nAD IIB2001 23 non AD – pathology MMSE 0.94 0.78 4.3 0.08 Dem-nDem[21] 53% 26–30 “PET pattern”USA 25% 20–25 18% <20
Silverman et al PET Hospital 167 pat with Histo- 24 No work 0.95 0.79 5.0 Predictive value Ib2003 Follow-up cogn deficit pathology up bias for PET to fore-[24] 10 years cast progressionUSA Sjögren et al SPECT Mölndal 16 FTD 62 Lund- No degree Cross- No info 0.875F 0.786 4.0 0.15 FTD-C 2b2000 prospective 52 AD 67 Manchester of dementia sectional TD-C 0.85 6.0 0.14 FTD-AD[17] dementia study 19 SWD 71 criteria reported 0.875F 0.78 4.0 0.15 FTD-SWDSweden in the Dept of (subcortical NINCDS- TD-AD Neuropsychiatry white matter ADRDA 0.875F at Sahlgrenska dementia) History, TD- university CT risk SWD hospital factors, NINDS- AIREN
Smith et al PET Aging and 45 AD 68 NINCDS- Incipient Cross- No info 0.955 0.762 4.0 0.05 Controls vs AD: 1b1992 Dementia 20 controls 69 ADRDA + mild AD: sectional 0.886 0.810 4.7 0.15 Temporal lobe[8] Research GDS = 3.6 Longi- 0.886 0.524 1.8 0.21 metabolic rateUSA Center of Moderate + tudinal Parietal lobe the New York severe metabolic rate university AD: 0.864 0.857 6.1 0.16 Linear ventricular medical center GDS = 5.3 0.818 0.81 4.3 0.21 measure Controls: 0.773 0.667 1.8 0.34 Controls vs mild AD: GDS = 1.7 metabolic rate Temporal lobe Parietal lobe metabolic rate Linear ventricular measure

C H A P T E R 18 • F U N C T I O N A L I M AG I N G ’ S D I AG N O S T I C TO O L I N D E M E N T I A WO R K U P S E A R C H S T R AT E G I E S
205
Table 18.2 continued
Author Type Population/ Sample (n) Age Clinical Path Global Study Workup SS SP LR+ LR– Comments Quality Year of selection criteria criteria cognitive design bias of study Reference functional function Country imaging
Silverman et al PET Hospital 97 AD – Histo- AD/nonAD – 0.94 0.73 3.5 0.08 AD-nAD IIB2001 23 non AD – pathology MMSE 0.94 0.78 4.3 0.08 Dem-nDem[21] 53% 26–30 “PET pattern”USA 25% 20–25 18% <20
Silverman et al PET Hospital 167 pat with Histo- 24 No work 0.95 0.79 5.0 Predictive value Ib2003 Follow-up cogn deficit pathology up bias for PET to fore-[24] 10 years cast progressionUSA Sjögren et al SPECT Mölndal 16 FTD 62 Lund- No degree Cross- No info 0.875F 0.786 4.0 0.15 FTD-C 2b2000 prospective 52 AD 67 Manchester of dementia sectional TD-C 0.85 6.0 0.14 FTD-AD[17] dementia study 19 SWD 71 criteria reported 0.875F 0.78 4.0 0.15 FTD-SWDSweden in the Dept of (subcortical NINCDS- TD-AD Neuropsychiatry white matter ADRDA 0.875F at Sahlgrenska dementia) History, TD- university CT risk SWD hospital factors, NINDS- AIREN
Smith et al PET Aging and 45 AD 68 NINCDS- Incipient Cross- No info 0.955 0.762 4.0 0.05 Controls vs AD: 1b1992 Dementia 20 controls 69 ADRDA + mild AD: sectional 0.886 0.810 4.7 0.15 Temporal lobe[8] Research GDS = 3.6 Longi- 0.886 0.524 1.8 0.21 metabolic rateUSA Center of Moderate + tudinal Parietal lobe the New York severe metabolic rate university AD: 0.864 0.857 6.1 0.16 Linear ventricular medical center GDS = 5.3 0.818 0.81 4.3 0.21 measure Controls: 0.773 0.667 1.8 0.34 Controls vs mild AD: GDS = 1.7 metabolic rate Temporal lobe Parietal lobe metabolic rate Linear ventricular measure
The table continues on the next page

D E M E N T I A – D I AG N O S T I C A N D T H E R A P E U T I C I N T E RV E N T I O N S206
Table 18.2 continued
Author Type Population/ Sample (n) Age Clinical Path Global Study Workup SS SP LR+ LR– Comments Quality Year of selection criteria criteria cognitive design bias of study Reference functional function Country imaging
Talbot et al SPECT Referred to 132 AD 64 NINCDS- Yes: 8 Cross- No info No No Likeli- AD-non AD 1a1998 university 78 VaD 64 ADRDA + AD: 1 sectional info info hood[13] hospital. 24 LBD 68 according VaD: 3 ratiosUnited Follow-up 58 FTD 59 to estab- LBD: 4 See refKingdom 3 years 81 OD 65 lished FTD: 2 for criteria progressive details aphasia on LR+:s
Van Gool et al SPECTS Controls: 110 demented 79 DSM-III-R Dementia: Longi- No bias 0.43 0.89 4.0 0.64 AD vs controls: 1a1995 Amsterdam (68) AD 76 NINCDS- MMSE = 16 tudinal 0.56 0.89 5.0 0.49 Temporoparietal [3] study of elderly 18 controls ADRDA Controls: follow-up <80 0.89 2.6 0.79 perfusionThe (AMSTEL) + MMSE = 27 6 months 0.29 Netherlands referred to >80 university years hospital
Warkentin et al Hospital based 132 AD 74 NINCDS- 21 – No bias 0.86 0.9 9.0 0.15 AD-C Combination 2b2004 92 C 39 ADRDA – of rCBF pattern[11] “neuronal network”Sweden
Varma et al SPECT Hospital based 21 FTD 63 Lund-M 21 – No work- 0.77 0.63 2.3 0.36 AD-nAD 2a2002 23 AD 63 NINCDS 18 up bias 0.52 0.93 7.8 0.51 FTD-nFTD[20] 20 VaD 86 NINDS 21United Kingdom
AD = Alzheimer’s disease; BDS = Blessed dementia scale; C = Control; CAMCOG = Cambridge cognitive examination; CDR = Clinical dementia rating scale; CERAD = Consortium to establish a registry for Alzheimer’s disease; CIND = Cognitive impair- ment, no dementia; CT = Computerized tomography; DLB = Dementia with Lewy bodies; FTD = Frontotemporal dementia; KLB = Klotho with Lewy bodies; LBD = Lewy body dementia; LR = Likelihood ratio; MCI = Mild cognitive impairment; MMSE = Mini-mental state examination; MTL = Medral temporal lobe; OD = Other dementias; PD = Parkinson’s disease; PET = Positron emission tomography; rCBF = Regional cerebral blood flow; SP = Specificity; SPECT = Single photon emission computed tomo-graphy; SS = Sensitivity; SWD = Subcortical white matter dementia; VaD = Vascular dementia

C H A P T E R 18 • F U N C T I O N A L I M AG I N G ’ S D I AG N O S T I C TO O L I N D E M E N T I A WO R K U P S E A R C H S T R AT E G I E S
207
Table 18.2 continued
Author Type Population/ Sample (n) Age Clinical Path Global Study Workup SS SP LR+ LR– Comments Quality Year of selection criteria criteria cognitive design bias of study Reference functional function Country imaging
Talbot et al SPECT Referred to 132 AD 64 NINCDS- Yes: 8 Cross- No info No No Likeli- AD-non AD 1a1998 university 78 VaD 64 ADRDA + AD: 1 sectional info info hood[13] hospital. 24 LBD 68 according VaD: 3 ratiosUnited Follow-up 58 FTD 59 to estab- LBD: 4 See refKingdom 3 years 81 OD 65 lished FTD: 2 for criteria progressive details aphasia on LR+:s
Van Gool et al SPECTS Controls: 110 demented 79 DSM-III-R Dementia: Longi- No bias 0.43 0.89 4.0 0.64 AD vs controls: 1a1995 Amsterdam (68) AD 76 NINCDS- MMSE = 16 tudinal 0.56 0.89 5.0 0.49 Temporoparietal [3] study of elderly 18 controls ADRDA Controls: follow-up <80 0.89 2.6 0.79 perfusionThe (AMSTEL) + MMSE = 27 6 months 0.29 Netherlands referred to >80 university years hospital
Warkentin et al Hospital based 132 AD 74 NINCDS- 21 – No bias 0.86 0.9 9.0 0.15 AD-C Combination 2b2004 92 C 39 ADRDA – of rCBF pattern[11] “neuronal network”Sweden
Varma et al SPECT Hospital based 21 FTD 63 Lund-M 21 – No work- 0.77 0.63 2.3 0.36 AD-nAD 2a2002 23 AD 63 NINCDS 18 up bias 0.52 0.93 7.8 0.51 FTD-nFTD[20] 20 VaD 86 NINDS 21United Kingdom
AD = Alzheimer’s disease; BDS = Blessed dementia scale; C = Control; CAMCOG = Cambridge cognitive examination; CDR = Clinical dementia rating scale; CERAD = Consortium to establish a registry for Alzheimer’s disease; CIND = Cognitive impair- ment, no dementia; CT = Computerized tomography; DLB = Dementia with Lewy bodies; FTD = Frontotemporal dementia; KLB = Klotho with Lewy bodies; LBD = Lewy body dementia; LR = Likelihood ratio; MCI = Mild cognitive impairment; MMSE = Mini-mental state examination; MTL = Medral temporal lobe; OD = Other dementias; PD = Parkinson’s disease; PET = Positron emission tomography; rCBF = Regional cerebral blood flow; SP = Specificity; SPECT = Single photon emission computed tomo-graphy; SS = Sensitivity; SWD = Subcortical white matter dementia; VaD = Vascular dementia

D E M E N T I A – D I AG N O S T I C A N D T H E R A P E U T I C I N T E RV E N T I O N S208
1. Jagust W, Chui H, Lee A-Y. Functional Imaging in Dementia. Evidence-based Dementia Practice. Oxford: Blackwell Publishing Company, UK; 2002. p 162-170.
2. Azari NP, Pettigrew KD, Schapiro MB, Haxby JV, Grady CL, Pietrini P, et al. Early detection of Alzheimer’s disease: a statistical approach using positron emis-sion tomographic data. J Cereb Blood Flow Metab 1993;13:438-47.
3. Van Gool WA, Walstra GJ, Teunisse S, Van der Zant FM, Weinstein HC, Van Royen EA. Diagnosing Alzheim-er’s disease in elderly, mildly demented patients: the impact of routine single photon emission computed tomography. J Neurol 1995;242:401-5.
4. Bonte FJ, Weiner MF, Bigio EH, White CL, 3rd. Brain blood flow in the dementias: SPECT with histopathologic correlation in 54 patients. Radiology 1997;202:793-7.
5. Ishii K, Mori E, Kitagaki H, Sakamoto S, Yamaji S, Imamura T, et al. The clinical utility of visual evaluation of scintigraphic perfusion patterns for Alzheimer’s disease using I-123 IMP SPECT. Clin Nucl Med 1996;21:106-10.
6. Johnson KA, Kijewski MF, Becker JA, Garada B, Satlin A, Holman BL. Quantitative brain SPECT in Alzheimer’s disease and normal aging. J Nucl Med 1993;34:2044-8.
7. Claus JJ, van Harskamp F, Breteler MM, Krenning EP, de Koning I, van der Cammen TJ, et al. The diagnostic value of SPECT with Tc 99m HMPAO in Alzhe-
imer’s disease: a Population based study. Neurology 1994;44:454-61.
8. Smith GS, de Leon MJ, George AE, Kluger A, Volkow ND, McRae T, et al. Topography of cross-sectional and lon-gitudinal glucose metabolic deficits in Alzheimer’s disease. Pathophysiologic im-plications. Arch Neurol 1992;49:1142-50.
9. El Fakhri G, Kijewski MF, Johnson KA, Syrkin G, Killiany RJ, Becker JA, et al. MRI-guided SPECT perfusion measures and volumetric MRI in prodromal Alzheim-er disease. Arch Neurol 2003;60:1066-72.
10. Herholz K, Salmon E, Perani D, Baron JC, Holthoff V, Frolich L, et al. Dis-crimination between Alzheimer demen-tia and controls by automated analysis of multicenter FDG PET. Neuroimage 2002;17:302-16.
11. Warkentin S, Ohlsson M, Wollmer P, Edenbrandt L, Minthon L. Regional cerebral blood flow in Alzheimer’s dis-ease: classification and analysis of het-erogeneity. Dement Geriatr Cogn Disord 2004;17:207-14.
12. Hanyu H, Abe S, Arai H, Asano T, Iwamoto T, Takasaki M. Diagnostic ac-curacy of single photon emission com-puted tomography in Alzheimer’s disease. Gerontology 1993;39:260-6.
13. Talbot PR, Lloyd JJ, Snowden JS, Neary D, Testa HJ. A clinical role for 99mTc-HMPAO SPECT in the investi-gation of dementia? J Neurol Neurosurg Psychiatry 1998;64:306-13.
14. Sackeim HA, Prohovnik I, Moeller JR, Mayeux R, Stern Y, Devanand DP.
References

C H A P T E R 18 • F U N C T I O N A L I M AG I N G ’ S D I AG N O S T I C TO O L I N D E M E N T I A WO R K U P S E A R C H S T R AT E G I E S
209
Regional cerebral blood flow in mood disorders. II. Comparison of major depres-sion and Alzheimer’s disease. J Nucl Med 1993;34:1090-101.
15. Mattman A, Feldman H, Forster B, Li D, Szasz I, Beattie BL, et al. Regional HmPAO SPECT and CT measurements in the diagnosis of Alzheimer’s disease. Can J Neurol Sci 1997;24:22-8.
16. Bergman H, Chertkow H, Wolfson C, Stern J, Rush C, Whitehead V, et al. HM-PAO (CERETEC) SPECT brain scanning in the diagnosis of Alzheimer’s disease. J Am Geriatr Soc 1997;45:15-20.
17. Sjogren M, Gustafson L, Wikkelso C, Wallin A. Frontotemporal dementia can be distinguished from Alzheimer’s disease and subcortical white matter dementia by an anterior-to-posterior rCBF-SPET ratio. Dement Geriatr Cogn Disord 2000;11: 275-85.
18. Lobotesis K, Fenwick JD, Phipps A, Ryman A, Swann A, Ballard C, et al. Occipital hypoperfusion on SPECT in dementia with Lewy bodies but not AD. Neurology 2001;56:643-9.
19. Jobst KA, Barnetson LP, Shepstone BJ. Accurate prediction of histologically confirmed Alzheimer’s disease and the differential diagnosis of dementia: the use of NINCDS-ADRDA and DSM-III-R criteria, SPECT, X-ray CT, and Apo E4 in medial temporal lobe dementias. Oxford Project to Investigate Memory and Aging. Int Psychogeriatr 1998;10:271-302.
20. Varma AR, Adams W, Lloyd JJ, Carson KJ, Snowden JS, Testa HJ, et al.
Diagnostic patterns of regional atrophy on MRI and regional cerebral blood flow change on SPECT in young onset patients with Alzheimer’s disease, frontotemporal dementia and vascular dementia. Acta Neurol Scand 2002;105:261-9.
21. Silverman DH, Small GW, Chang CY, Lu CS, Kung De Aburto MA, Chen W, et al. Positron emission tomography in evaluation of dementia: Regional brain metabolism and long-term outcome. JAMA 2001;286:2120-7.
22. O’Brien JT, Colloby S, Fenwick J, Williams ED, Firbank M, Burn D, et al. Dopamine transporter loss visualized with FP-CIT SPECT in the differential diagnosis of dementia with Lewy bodies. Arch Neurol 2004;61:919-25.
23. Hoffman JM, Welsh-Bohmer KA, Hanson M, Crain B, Hulette C, Earl N, et al. FDG PET imaging in patients with pathologically verified dementia. J Nucl Med 2000;41:1920-8.
24. Silverman DH, Truong CT, Kim SK, Chang CY, Chen W, Kowell AP, et al. Prognostic value of regional cere-bral metabolism in patients undergoing dementia evaluation: comparison to a quantifying parameter of subsequent cognitive performance and to prognos-tic assessment without PET. Mol Genet Metab 2003;80:350-5.
25. Pasquier J, Michel BF, Brenot-Rossi I, Hassan-Sebbag N, Sauvan R, Gastaut JL. Value of (99m)Tc-ECD SPET for the diagnosis of dementia with Lewy bodies. Eur J Nucl Med Mol Imaging 2002;29:1342-8.


C H A P T E R 19 • E V I D E N C E B A S E D E VA L U AT I O N O F E E G ( Q U A N T I TAT I V E E E G A N D V I S U A L R AT E D E E G )
211
19. Evidence Based Evaluation of EEG (Quantitative EEG and Visual Rated EEG)
Conclusions
There is limited evidence that either visually rated EEG or qEEG helps the diagnostic workup differentiate AD (Alzheimer’s Disease) patients from controls or AD from other dementia disorders (Evidence Grade 3).
Introduction
EEG and qEEG have been used in dementia workup for many years. The frequency varies, but generally they are associated with lower costs and less discomfort for patients than methods such as MRI, CT, SPECT and PET.
The American Academy of Neurology did not address EEG or qEEG in its Practice Parameter of 2001.
Search strategy
Medline 1980–2004 (July)
Dementia/radionuclide imagingDementia AND Diagnostic ImagingDementia AND ElectroencephalographyANDComparative StudySensitivity and SpecificitySensitivity [Text Word]
D E M E N T I A – D I AG N O S T I C A N D T H E R A P E U T I C I N T E RV E N T I O N S212
Specificity [Text Word]Accuracy [Text Word]AND Human >18 yearsNOT Case Report Editorial [Publication Type] Letter [Publication Type] Review [Publication Type] HIV [Text Word]434 hits were found.
Twentyone articles were selected that contained information about sen-sitivity and specificity, eight of them were of high enough quality to be included.
The majority of the papers presented data on AD patients vs controls or patients with other dementia disorders vs controls. AD vs depression and Creutzfeldt-Jakob disease vs other dementia were also found. Two of the studies presented visually rated EEG, and the remaining pre- sented quantitative EEG calculations [1,2]. The most common qEEG parameters were relative power alfa, beta, teta and delta power. One study presented evoked response potentials (EVP) [3] and one study presented data from EEG registrations during sleep [4].
The only Creutzfeldt-Jakob disease study included histopathological evaluation and was performed on a large population. However, the basal criteria for evidence (sensitivity, specificity >80%, LR+ >5) were not met. Another limitation is that there are no studies that present data on discriminating between AD and other dementia disorders.

C H A P T E R 19 • E V I D E N C E B A S E D E VA L U AT I O N O F E E G ( Q U A N T I TAT I V E E E G A N D V I S U A L R AT E D E E G )
213
Table 19.1 EEG/qEEG. Distribution of articles according to degree of quality.
Degree Not Reference Fulfilling basal Reference of fulfilling evidence criteria* quality
Ia – –Ib 1 [1] –IIa – –IIb – –
1a – –1b – –2a 1 [2] 2 [3**]2b 5 [4–8] –
* Sensitivity >80%; Specificity >80%; LR+≥5.** Combination of CT and P200.

D E M E N T I A – D I AG N O S T I C A N D T H E R A P E U T I C I N T E RV E N T I O N S214
Table 19.2 Quantitative EEG (qEEG) and visual rated EEG.
Author Settings Sample (n) Age Clinical Path Global Study Workup SS SP LR+ LR– Comments Quality Year criteria criteria cognitive design bias ot study Reference function Country
Anderer et al No info 111 dementia 82 DSM-III Cross- No info Optimal Dementia vs 2b1994 (Study I) sectional selection controls: The[5] 96 dementia 82 0.78 0.8 3.9 0.22 absolute delta+Austria/ (Study II) 0.74 0.9 7.4 0.28 theta powerGermany 56 controls 68 0.83 0.9 8.3 0.19EEG (qEEG)
Engedal et al Population 20 AD 81.7 NINCDS- 7 dementia Dementia: Cross- No info 0.92 0.75 3.68 0.1 AD vs controls: 2a1989 based 10 MID (median) ADRDA & 2 controls MMS = 19.8 sectional[3] 11 other 81 DSM-III Controls: Longitudinal 0.96 0.83 Cortical atrophyNorway dementia (median) MMS = 28.8 5.6 0.05 on CAT & FVEREEG 38 controls P200 latency (EVP)
Houck et al University 61 AD 73.6 DSM-III Blessed Dementia: Cross- No info AD vs depressed 2b1991 based 77 elderly 70.8 SADS/RDC Rating Scale sectional patients:[4] depressed AD = 9.9 EEG sleep data:USA patients Depressed 0.80 0.77 3.5 0.25 The area under ROCEEG patients = 2.7 5.0 curve is 0.86 (qEEG: sleep)
Poser et al Population 364 suspected ? Probable CJD: Probable Cross- No info CJD vs others: Ib1999 based CJD (6 was dementia, EEG CJD: 95 sectional[1] excluded later) periodic sharp Possible Longitudinal 0.65 0.86 4.64 0.4 Periodic sharp waveGermany waves, two of CJD: 21 complexes in the EEGEEG the following Other findings: disease: (Visual EEG) myoclonus, 20 visual/cere- bellar symp- toms, pyra- midal/extra- pyramidal signs
Possible CJD: fulfill above criteria, but did not have typical EEG

C H A P T E R 19 • E V I D E N C E B A S E D E VA L U AT I O N O F E E G ( Q U A N T I TAT I V E E E G A N D V I S U A L R AT E D E E G )
215
Table 19.2 Quantitative EEG (qEEG) and visual rated EEG.
Author Settings Sample (n) Age Clinical Path Global Study Workup SS SP LR+ LR– Comments Quality Year criteria criteria cognitive design bias ot study Reference function Country
Anderer et al No info 111 dementia 82 DSM-III Cross- No info Optimal Dementia vs 2b1994 (Study I) sectional selection controls: The[5] 96 dementia 82 0.78 0.8 3.9 0.22 absolute delta+Austria/ (Study II) 0.74 0.9 7.4 0.28 theta powerGermany 56 controls 68 0.83 0.9 8.3 0.19EEG (qEEG)
Engedal et al Population 20 AD 81.7 NINCDS- 7 dementia Dementia: Cross- No info 0.92 0.75 3.68 0.1 AD vs controls: 2a1989 based 10 MID (median) ADRDA & 2 controls MMS = 19.8 sectional[3] 11 other 81 DSM-III Controls: Longitudinal 0.96 0.83 Cortical atrophyNorway dementia (median) MMS = 28.8 5.6 0.05 on CAT & FVEREEG 38 controls P200 latency (EVP)
Houck et al University 61 AD 73.6 DSM-III Blessed Dementia: Cross- No info AD vs depressed 2b1991 based 77 elderly 70.8 SADS/RDC Rating Scale sectional patients:[4] depressed AD = 9.9 EEG sleep data:USA patients Depressed 0.80 0.77 3.5 0.25 The area under ROCEEG patients = 2.7 5.0 curve is 0.86 (qEEG: sleep)
Poser et al Population 364 suspected ? Probable CJD: Probable Cross- No info CJD vs others: Ib1999 based CJD (6 was dementia, EEG CJD: 95 sectional[1] excluded later) periodic sharp Possible Longitudinal 0.65 0.86 4.64 0.4 Periodic sharp waveGermany waves, two of CJD: 21 complexes in the EEGEEG the following Other findings: disease: (Visual EEG) myoclonus, 20 visual/cere- bellar symp- toms, pyra- midal/extra- pyramidal signs
Possible CJD: fulfill above criteria, but did not have typical EEG
The table continues on the next page

D E M E N T I A – D I AG N O S T I C A N D T H E R A P E U T I C I N T E RV E N T I O N S216
Table 19.2 continued
Author Settings Sample (n) Age Clinical Path Global Study Workup SS SP LR+ LR– Comments Quality Year criteria criteria cognitive design bias of study Reference function Country
Prinz et al Community 41 AD 70.9 NINCDS- AD: Cross- No info AD vs controls: 2b1989 based 22 depression 62.3 ADRDA & MMS = 22.8 sectional 0.71 0.82 3.94 0.35 Dominant occipital[7] 50 controls 67.5 DSM-III Depression: alpha rhythmUSA RDC MMS = 29.2 AD vs depression:EEG Controls: Dominant occipital MMS = 29.7 0.66 0.83 3.88 0.40 alpha rhythm (qEEG)
Reynolds et al University 49 AD 72.8 DSM-III AD: Cross- No info AD vs depressed 2b1988 based 67 depressed 70.3 RDC MMSE = 16.5 sectional[8] 42 mixed 72.6 Depressed: Longitudinal 0.8 0.8 4.0 0.25USA dementia & MMSE = 28.3EEG depression Mixed: 77 controls 69.3 MMSE = 19.2 Controls: MMSE = 29.4 (qEEG: sleep)
Robinson et al Population 86 AD 73.4 DSM-III-R 105 AD: Cross- No info 0.87 0.63 2.38 0.20 AD vs controls 2a1994 based 17 mixed AD 8.0 ischemic patients ESD = 56.69 sectional 0.50 3.0 12.2 0.52 AD subgroup (4 years[2] & MID 75.9 score Mixed AD & MID: Longitudinal 0.95 illness) vs controlsCanada 56 controls 4.0 ESD = 97.88EEG Controls 1: (Visual EEG) ESD = 237.42 Controls 2: ESD = 242.71
Stevens et al Hospital 31 elderly 69.6 DSM-III-R MMSE was Cross- No info 0.84 0.60 2.1 0.27 Dementia vs healthy 2b1998 based. patients (cogni- ICD-10 done, but no sectional elderly:[6] Controls tivelyimpaired/ SIDAM mean scores Microstate duration Germany/ are from demented were reported & number of singleUnited newspaper 30 elderly 68.6 peak segments duringKingdom advertise- controls the resting state withEEG ment 35 young 31.1 eyes closed controls (qEEG)
AD = Alzheimer’s disease; CAT = Computer aided tomography; CJD = Creutzfeldt-Jakob disease; ESD = Extended scale for dementia; EVP = Electroencephalography, visual, eva-lued potentials; FVER = Functional verification; LR+ = Likelihood ratio; MID = Multiinfarct dementia; MMSE = Mini-mental state examination

C H A P T E R 19 • E V I D E N C E B A S E D E VA L U AT I O N O F E E G ( Q U A N T I TAT I V E E E G A N D V I S U A L R AT E D E E G )
217
Table 19.2 continued
Author Settings Sample (n) Age Clinical Path Global Study Workup SS SP LR+ LR– Comments Quality Year criteria criteria cognitive design bias of study Reference function Country
Prinz et al Community 41 AD 70.9 NINCDS- AD: Cross- No info AD vs controls: 2b1989 based 22 depression 62.3 ADRDA & MMS = 22.8 sectional 0.71 0.82 3.94 0.35 Dominant occipital[7] 50 controls 67.5 DSM-III Depression: alpha rhythmUSA RDC MMS = 29.2 AD vs depression:EEG Controls: Dominant occipital MMS = 29.7 0.66 0.83 3.88 0.40 alpha rhythm (qEEG)
Reynolds et al University 49 AD 72.8 DSM-III AD: Cross- No info AD vs depressed 2b1988 based 67 depressed 70.3 RDC MMSE = 16.5 sectional[8] 42 mixed 72.6 Depressed: Longitudinal 0.8 0.8 4.0 0.25USA dementia & MMSE = 28.3EEG depression Mixed: 77 controls 69.3 MMSE = 19.2 Controls: MMSE = 29.4 (qEEG: sleep)
Robinson et al Population 86 AD 73.4 DSM-III-R 105 AD: Cross- No info 0.87 0.63 2.38 0.20 AD vs controls 2a1994 based 17 mixed AD 8.0 ischemic patients ESD = 56.69 sectional 0.50 3.0 12.2 0.52 AD subgroup (4 years[2] & MID 75.9 score Mixed AD & MID: Longitudinal 0.95 illness) vs controlsCanada 56 controls 4.0 ESD = 97.88EEG Controls 1: (Visual EEG) ESD = 237.42 Controls 2: ESD = 242.71
Stevens et al Hospital 31 elderly 69.6 DSM-III-R MMSE was Cross- No info 0.84 0.60 2.1 0.27 Dementia vs healthy 2b1998 based. patients (cogni- ICD-10 done, but no sectional elderly:[6] Controls tivelyimpaired/ SIDAM mean scores Microstate duration Germany/ are from demented were reported & number of singleUnited newspaper 30 elderly 68.6 peak segments duringKingdom advertise- controls the resting state withEEG ment 35 young 31.1 eyes closed controls (qEEG)
AD = Alzheimer’s disease; CAT = Computer aided tomography; CJD = Creutzfeldt-Jakob disease; ESD = Extended scale for dementia; EVP = Electroencephalography, visual, eva-lued potentials; FVER = Functional verification; LR+ = Likelihood ratio; MID = Multiinfarct dementia; MMSE = Mini-mental state examination

D E M E N T I A – D I AG N O S T I C A N D T H E R A P E U T I C I N T E RV E N T I O N S218
1. Poser S, Mollenhauer B, Kraubeta A, Zerr I, Steinhoff BJ, Schroeter A, et al. How to improve the clinical dia-gnosis of Creutzfeldt-Jakob disease. Brain 1999;122:2345-51.
2. Robinson DJ, Merskey H, Blume WT, Fry R, Williamson PC, Hachinski VC. Electroencephalography as an aid in the exclusion of Alzheimer’s disease. Arch Neurol 1994;51:280-4.
3. Engedal K, Oftedal SI, Lilleaas F, Laake P. Electroencephalography, visual evoked potentials, and cerebral CAT-scan as dia-gnostic tools in senile dementia of Alzhe-imer type. Aging (Milano) 1989;1:139-45.
4. Houck PR, Reynolds CF, 3rd, Mazumdar S, Kupfer DJ. Receiver operating characteristic analysis for validating EEG sleep discrimination of elderly depressed and demented patients. J Geriatr Psychiatry Neurol 1991;4:30-3.
5. Anderer P, Saletu B, Kloppel B, Semlitsch HV, Werner H. Discrimi-
nation between demented patients and normals based on topographic EEG slow wave activity: comparison between z statistics, discriminant analysis and artificial neural network classifiers. Electroencephalogr Clin Neurophysiol 1994;91:108-17.
6. Stevens A, Kircher T. Cognitive de-cline unlike normal aging is associated with alterations of EEG temporo-spatial characteristics. Eur Arch Psychiatry Clin Neurosci 1998;248:259-66.
7. Prinz PN, Vitiello MV. Dominant occipital (alpha) rhythm frequency in early stage Alzheimer’s disease and depression. Electroencephalogr Clin Neurophysiol 1989;73:427-32.
8. Reynolds CF, 3rd, Kupfer DJ, Houck PR, Hoch CC, Stack JA, Berman SR, et al. Reliable discri- mination of elderly depressed and demented patients by electroence-phalographic sleep data. Arch Gen Psychiatry 1988;45:258-64.
References

C H A P T E R 2 0 • C E R E B R O S P I N A L F L U I D B I O M A R K E R S I N A D 219
20. Cerebrospinal Fluid Biomarkers in AD
Conclusion
There is strong evidence (Evidence Grade 1) that CSF T-tau, CSF Aß42 and the combination of CSF T-tau and Aß42 contribute, and moderate-ly strong evidence (Evidence Grade 2) that CSF P-tau contributes, to the diagnostic workup in differentiating AD (Alzheimer’s disease) patients from controls and from other dementia disorders.
Background
The CSF is in direct contact with the extracellular space of the brain and thus reflects biochemical changes in the brain. Because AD patho-logy is restricted to the brain, CSF is an obvious source of biomarkers for AD. Various studies have evaluated numerous potential CSF biomarkers for AD, but this review will focus on tau and ß-amyloid only, for reasons outlined below.
Tau protein is a microtubule-associated protein located in the neuronal axons. Due to alternative splicing of tau mRNA, there are 6 isoforms ranging from 352 to 441 amino acids, with molecular weights of ≈50– 65 kDa (for review, see Buée et al, 2000 [1]). In AD, an abnormally hyperphosphorylated form of tau is the principal component of the pai-red helical filaments (PHFs), which make up the neurofibrillary tangles, neuropil threads and senile plaque neurites (for review, see Buée et al, 2000 [1]). Using different techniques, more than 30 phosphorylation sites have been described on tau in the brain (for review, see Buée et al, 2000 [1]). The CSF level of Total tau (T-tau) probably reflects the inten-sity of neuronal degeneration, while indirect evidence suggests that CSF P-tau (Phosphorylated tau) may specifically reflect the phosphorylation state of tau (for review, see Blennow and Hampel, 2003 [2]).

D E M E N T I A – D I AG N O S T I C A N D T H E R A P E U T I C I N T E RV E N T I O N S220
ß-amyloid (Aß) is the main protein constituent of plaques and is genera-ted by proteolytic cleavage of its precursor, the amyloid precursor protein (APP) (for review see Andreasen and Blennow, 2002 [3]). There are seve-ral C-terminal forms of Aß. The longest form, ending at Ala42 (Aß42), has been found to aggregate more rapidly than shorter Aß variants and to be the initial form of Aß deposited in diffuse plaques (for review, see Andreasen and Blennow, 2002 [3]). The reduced CSF level of Aß42 in AD was initially hypothesized to be caused by deposition of Aß42 in plaques, with lower levels diffusing to CSF, while subsequent studies have questioned this explanation (for review, see Blennow and Hampel, 2003 [2]).
Search strategy
Studies were identified by searches on Medline and from references in relevant articles. Numerous papers on potential CSF markers for AD have been published. For example, the terms “Alzheimer” and “cere-brospinal fluid” yielded 1 230 hits. This review considered only CSF biomarkers that have been evaluated in more than 10 publications by independent research groups. The biomarkers must also have been evaluated using different methods available to the research community. Thus, this review is restricted to the CSF markers T-tau, P-tau and the 42 amino-acid form of ß-amyloid (Aß42). Thus, the Medline searches used “Alzheimer”, “CSF”, and either “tau” or “amyloid”.
Selection criteria
To be evaluated in this review, papers had to include a sufficient number of patients and controls. For studies on AD patients versus controls, the papers had to include more than 20 AD patients and 20 controls – or if the number of controls was insufficient, at least 30 cases total. For studies on early AD, the papers had to include more than 10 AD patients with an MMSE score of 25 or higher. For studies on MCI, the papers had to include more than 10 MCI patients that were followed clinically in order to verify progression to AD with dementia. For studies on other

C H A P T E R 2 0 • C E R E B R O S P I N A L F L U I D B I O M A R K E R S I N A D 221
dementia, psychiatric or neurological disorders, the papers had to inclu-de more than 10 patients.
Papers also had to contain an adequate description of the clinical in- vestigation procedure and diagnostic criteria for both patients and con-trols, analytical methods and statistical methods. All papers had to be in English. Papers were excluded if they did not present sensitivity and specificity figures, if such figures could not be calculated from graphs, or if they included control groups consisting of patients with neurologi-cal or psychiatric symptoms.
The definition of Evidence Grade, which is also the basis for the subdivi-sion of the papers in the tables, is outlined by Chui H in chapter II:1 of “Evidence-based Dementia Practice” [4].
Around half of the papers focused on the differentiation between AD patients and controls, while the other half also included other differen-tial diagnoses. The majority of papers investigated hospital populations, while only a few were based on Population based materials or longitudi-nal prospective studies.
Analytical principles for CSF T-tau, P-tau and Aß42
The following section presents a short description of the analytical met-hods, along with a summary of protein level changes in CSF in AD.
CSF total tau (T-tau)The first report on CSF T-tau as a biomarker for AD was published in 1993. This paper used an ELISA with a polyclonal reporter antibody [5]. Subsequent studies used ELISA methods based on monoclonal antibo-dies that detect all isoforms of tau, independent of the phosphorylation state of tau [6–8]. Thus, they measure the total tau level in CSF.

D E M E N T I A – D I AG N O S T I C A N D T H E R A P E U T I C I N T E RV E N T I O N S222
Using all of these different ELISA methods, more than 80 studies con-sistently found a moderate to marked increase in CSF T-tau in AD. For the 2 most commonly used ELISA methods, the Innogenetics ELISA [6] and the Athena ELISA [8], the mean CSF T-tau level in the 36 evaluated studies was around 300% of that in controls (Table 20.1).
CSF ß-amyloid (Aß42)Eleven different methods have been published for quantification of Aß42 in CSF (Table 20.2). These include 6 different ELISA methods [9–14]. Other methods include variants of SDS-PAGE combined with Western blot [15–17], and SELDI-TOF [18].
Using these different methods, the majority of studies found a mode-rate to marked decrease in CSF Aß42 in AD, but 1 study found a 161% increase [12]. For the 2 most commonly used ELISA methods, the Inno-genetics ELISA [9] and the Athena ELISA [10], the mean CSF Aß42 level in the 15 evaluated studies was around 50% of that in controls (Table 20.2).
CSF phosphorylated tau (P-tau)Several ELISA methods have been developed for the measurement of P-tau phosphorylated on different epitopes. These include threo-nine 181+231 (Thr181+231) [6], Thr181, [19], Thr231 and serine 235 (Thr231+Ser235) [20], Ser199 [20], Thr231 [21], and Ser396+404 [22].
Using all these different ELISA methods, 25 studies have consistently found a moderate to marked increase in CSF P-tau in AD. For the 6 different ELISA methods in the 14 evaluated studies, the mean CSF P-tau level was around 430% of that in controls (Table 20.3).
Whether there is a difference in the diagnostic performance among ELISA methods for different P-tau epitopes has been discussed. How-ever, a study that directly compared P-Tau181, P-Tau199 and P-Tau231 in the same patient material found strong correlations among the ELISA methods [23].

C H A P T E R 2 0 • C E R E B R O S P I N A L F L U I D B I O M A R K E R S I N A D 223
Diagnostic performance of CSF markers for AD
The diagnostic performance of T-tau, Aß42 and P-tau is reviewed below. In general, one important factor for the variation in sensitivity, specifi-city, LR+ and LR– among studies is that several different principles were used to set the cut-off level. The International Federation of Clinical Chemistry (IFCC) recommends the use of a rank-based method, the 0.95 fractile, for reference values [24]. In the papers of CSF biomarkers for AD, the principles for setting the cut-off included variants of “best separation”, ROC curves, and the highest or lowest value in controls. If the highest or lowest value in controls was used, i e as specificity of 100%, it yielded an infinite LR+ value and an LR– value of 0. In these instances, the LR+ value was set to 40 and the LR– value to 0.025.
Results on sensitivity, specificity, LR+ and LR– for the differentiation between AD patients and controls are shown in Tables 20.1–20.4, for the performance of the CSF markers in early AD and MCI in Table 20.5, and for specificity vs other cognitive, psychiatric and neurological disorders in Table 20.6. A summary of the diagnostic validity of the CSF markers appears in Table 20.7.
CSF T-tauThe majority of studies used the Innogenetics ELISA method for CSF T-tau [6], which is also part of the clinical routine in Sweden, while two studies used the Athena ELISA method [8]. Sensitivity and specificity figures are available from 36 studies for CSF T-tau (Table 20.1). The mean sensitivity to differentiate AD patients from controls was 77.1%, while the specificity was 90%, resulting in an LR+ of 16.4 and an LR– of 0.16 (Table 20.1).
In the 9 class 1a studies (Table 20.1), the mean sensitivity to differentiate AD patients from controls was 83% at a specificity of 92%, yielding an LR+ of 16.0 and an LR– of 0.11. Thus, there is strong evidence that CSF T-tau is useful in the clinical diagnosis of AD.

D E M E N T I A – D I AG N O S T I C A N D T H E R A P E U T I C I N T E RV E N T I O N S224
Aß42The majority of studies used the Innogenetics ELISA method for CSF Aß42 [9] (Table 20.2). This method is part of clinical routine in Swe-den. Two studies used the Athena ELISA method for Aß42 [10]. Sensi-tivity and specificity figures for CSF Aß42 are available from 15 studies (Table 20.2). The mean sensitivity to differentiate AD patients from controls was 87%, while the specificity was also 87%, resulting in an LR+ of 11.7 and an LR– of 0.16 (Table 20.2).
In the 5 class 1a studies (Table 20.2), the mean sensitivity was 88% at a specificity of 89%, yielding an LR+ of 10.5 and an LR– of 0.13. Thus, there is strong evidence that CSF Aß42 is useful in the clinical diagnosis of AD.
CSF P-tauAlthough 14 papers presented sensitivity and specificity figures for CSF P-tau, there are few studies on each ELISA method or the P-tau epitope (Table 20.3). The 3 class 1a studies (Table 20.3) had a mean sensitivity of 62% at a specificity of 91%, yielding an LR+ of 7.9 and an LR– of 0.14. In the 14 studies, including 8 other class 2a studies, the mean sensiti-vity was 80.5% at a specificity of 91.7%, yielding an LR+ of 16.3 and an LR– of 0.12 (Table 20.3). Thus, there is moderately strong evidence that CSF T-tau is useful in the clinical diagnosis of AD.
In a specific comparison of the diagnostic performance of P-Tau181, P-Tau199 and P-Tau231 in the same patient material, all three perfor-med equally well in discriminating AD patients from controls without dementia [23].
Combination of CSF markersEighteen studies evaluated the diagnostic potential of combining CSF T-tau and Aß42, P-tau and Aß42, and T-tau and P-tau (Table 20.4). The most common combination was CSF T-tau and Aß42 (Table 20.4). Several different methods of combining results, such as discrimination lines or quadrants in plots of T-tau and Aß42, and cut-off levels were

C H A P T E R 2 0 • C E R E B R O S P I N A L F L U I D B I O M A R K E R S I N A D 225
used. The mean sensitivity to differentiate AD patients from controls was 85%, while the specificity was 92%, resulting in an LR+ of 18.1 and an LR– of 0.14 (Table 20.4).
Six class 1a studies examined the combination of CSF T-tau and Aß42 (Table 20.2), with a mean sensitivity of 90% at a specificity of 89%, yiel-ding an LR+ of 14.8 and an LR– of 0.17. Thus, there is strong evidence that the combination of CSF T-tau and Aß42 is useful in the clinical diagnosis of AD.
Another diagnostic application for the combination of CSF markers is the identification of Creutzfeldt-Jakob disease (CJD). Several papers found a highly pronounced increase in CSF T-tau in CJD [25–31]. In contrast, there was only a mild to moderate increase in the CSF level of P-tau [27,30,31]. Thus, there is a significantly higher ratio of T-tau/P-tau in CSF in CJD, which has been found to discriminate CJD from AD and other dementia disorders with 100% accuracy [31,32].
CFS markers in early Alzheimer’s disease and MCI
Nineteen studies examined CSF markers in early AD (with MMSE sco-res above 25) and MCI cases with progression to AD (Table 20.5). Only studies in which the CSF tap was taken at baseline and patients were monitored clinically to verify progression to AD with dementia were included in the present evaluation.
The mean sensitivity in these studies was 80% for CSF T-tau, 71% for CSF Aß42, 79% for CSF P-tau and 78% for the combination of CSF T-tau and Aß42 (Table 20.5).

D E M E N T I A – D I AG N O S T I C A N D T H E R A P E U T I C I N T E RV E N T I O N S226
CFS markers in other cognitive, psychiatric and neurological disorders
Fourtysix papers including a total of 1 116 cases evaluated the specificity of the CSF markers in other cognitive, psychiatric and neurological disorders (Table 20.6).
The specificity figures varied among different papers – both the number of cases with high or low CSF levels for the markers, depending on the cut-off level, and the degree of increase or decrease.
The data are summarized below. For Lewy body dementia, there is a mild to moderate increase in both CSF T-tau and P-tau in about 25% of cases, while CSF Aß42 decreases in the majority of cases (Table 20.6). That may be due to the large overlap in pathology between AD and Lewy body dementia [33].
For VaD, about half of the studies found a clear increase in CSF T-tau in the majority of cases, while the other half found normal levels (Table 20.6). The three studies on CSF Aß42 found a mild to moderate decrease in the majority of cases, while most of the 6 studies on CSF P-tau found a mild increase in around 25% of cases. These divergent results may reflect difficulties in making a clinical diagnosis of “pure” VaD. Indeed, neuropathological studies have shown that a high percen-tage (40–80%) of patients clinically diagnosed with VaD have notable concomitant AD pathology [34,35].
For frontotemporal dementia, most studies found a mild increase in CSF T-tau and P-tau and a mild decrease in Aß42 (Table 20.6). Normal levels of CSF T-tau, or a mild increase in a minority of cases, have been found in cerebrovascular disease without dementia, amyo-trophic lateral sclerosis, Parkinson’s disease without dementia, pro-gressive supranuclear palsy, corticobasal degeneration, depression and alcoholism with dementia (Table 20.6).

C H A P T E R 2 0 • C E R E B R O S P I N A L F L U I D B I O M A R K E R S I N A D 227
In general, the specificity of CSF P-tau to differentiate AD from other dementias, as well as from other neurological and psychiatric disorders, seems to be higher than for T-tau and Aß42 (Table 20.6). However, the sensitivity and specificity figures of P-tau vary among different studies. Thus, additional large studies are needed to determine whether there is a difference in sensitivity and specificity figures for the various ELISA methods for P-tau. However, group separation was maximized between AD and FTD using P-Tau231 and between AD and DLB using P-Tau181 [23]. Thus, differences in the phosphorylation of specific tau epitopes among various dementia disorders may be reflected in the CSF level of the corresponding P-tau variant.
As mentioned above, for sporadic CJD, there is a very pronounced in-crease in CSF T-tau but normal or only mildly to moderately increased CSF P-tau levels, resulting in a markedly higher ratio of T-tau/P-tau, which has been found to discriminate CJD from AD and other demen-tia disorders with 100% accuracy [31,32].
The systematic review on CSF-tau, as part of the dementia-project, was one of the first to be finished (Februari 2004). An updated search of the literature reveals that addictional studies have been published, and that these studies give support to the evidence that CSF p-tau can differen-tiate Alzheimer’s disease from other forms of dementia (see [92–97]).

D E M E N T I A – D I AG N O S T I C A N D T H E R A P E U T I C I N T E RV E N T I O N S228
Table 20.1 CSF-total tau in Alzheimer’s disease and controls.
Author Method AD Controls Change in AD Sensitivity Specificity LR+ LR– Quality Comments Year (n) (n) (% of controls) of study Reference
Andreasen et al Innog 43 18 419 95 94 15.8 0.06 1a Community-based1998 patient sample [36]
Sjögren et al Innog 60 32 242 79 82 4.4 0.23 1a Prospective, 2000 consecutive cases [37]
Sjögren et al Innog 41 17 145 85 95 17.1 0.06 1a Prospective, 2001 consecutive cases [38]
Sjögren et al Innog 47 12 237 77 92 9.6 0.10 1a Prospective, 2001 consecutive cases [39]
Riemenschneider Innog 74 40 355 95 98 47.5 0.02 1a Consecutive caseset al 2002 [40]
Sjögren et al Innog 19 17 269 84 94 14.0 0.07 1a Prospective, 2002 consecutive cases [41]
Gomez-Tortosa Innog 33 46 250 73 80 3.7 0.27 1a Prospective studyet al 2003 [42]
Kapaki et al Innog 49 49 360 88 96 22.0 0.05 1a Clinical practice, 2003 3-year follow-up [43]
Wallin et al Innog 39 12 237 72 93 10.3 0.10 1a Prospective study2003 [44]

C H A P T E R 2 0 • C E R E B R O S P I N A L F L U I D B I O M A R K E R S I N A D 229
Table 20.1 CSF-total tau in Alzheimer’s disease and controls.
Author Method AD Controls Change in AD Sensitivity Specificity LR+ LR– Quality Comments Year (n) (n) (% of controls) of study Reference
Andreasen et al Innog 43 18 419 95 94 15.8 0.06 1a Community-based1998 patient sample [36]
Sjögren et al Innog 60 32 242 79 82 4.4 0.23 1a Prospective, 2000 consecutive cases [37]
Sjögren et al Innog 41 17 145 85 95 17.1 0.06 1a Prospective, 2001 consecutive cases [38]
Sjögren et al Innog 47 12 237 77 92 9.6 0.10 1a Prospective, 2001 consecutive cases [39]
Riemenschneider Innog 74 40 355 95 98 47.5 0.02 1a Consecutive caseset al 2002 [40]
Sjögren et al Innog 19 17 269 84 94 14.0 0.07 1a Prospective, 2002 consecutive cases [41]
Gomez-Tortosa Innog 33 46 250 73 80 3.7 0.27 1a Prospective studyet al 2003 [42]
Kapaki et al Innog 49 49 360 88 96 22.0 0.05 1a Clinical practice, 2003 3-year follow-up [43]
Wallin et al Innog 39 12 237 72 93 10.3 0.10 1a Prospective study2003 [44]
The table continues on the next page

D E M E N T I A – D I AG N O S T I C A N D T H E R A P E U T I C I N T E RV E N T I O N S230
Table 20.1 continued
Author Method AD Controls Change in AD Sensitivity Specificity LR+ LR– Quality Comments Year (n) (n) (% of controls) of study Reference
Andreasen et al Innog 407 93 304 93 86 6.6 0.15 1b Community-based1999 patient sample [45] Arai et al Innog 70 19 858 100 100 40.0 0.025 2a1995 [46]
Blennow et al Innog 44 31 283 84 97 28 0.04 2a1995[6]
Vigo-Pelfrey et al Athena 71 59 190 39 100 40 0.025 2a1995 [8]
Arai et al Innog 69 17 443 89 100 40 0.025 2a “Old” tau standard*1998[47]
Galasko et al Athena 82 60 171 57 83 3.4 0.30 2a Multicenter study1998 [48]
Kanai et al Innog 93 41 226 40 100 40 0.025 2a Multicenter study1998 [49]
Mecocci et al Innog 29 23 205 59 83 3.5 0.29 2a1998 [50]
Shoji et al Innog 55 34 214 49 97 16.3 0.06 2a Adjusted IFCC1998 cut-off from graph [51]
Vanderstichele Innog 81 15 178 90 67 2.7 0.37 2aet al 1998 [9]

C H A P T E R 2 0 • C E R E B R O S P I N A L F L U I D B I O M A R K E R S I N A D 231
Table 20.1 continued
Author Method AD Controls Change in AD Sensitivity Specificity LR+ LR– Quality Comments Year (n) (n) (% of controls) of study Reference
Andreasen et al Innog 407 93 304 93 86 6.6 0.15 1b Community-based1999 patient sample [45] Arai et al Innog 70 19 858 100 100 40.0 0.025 2a1995 [46]
Blennow et al Innog 44 31 283 84 97 28 0.04 2a1995[6]
Vigo-Pelfrey et al Athena 71 59 190 39 100 40 0.025 2a1995 [8]
Arai et al Innog 69 17 443 89 100 40 0.025 2a “Old” tau standard*1998[47]
Galasko et al Athena 82 60 171 57 83 3.4 0.30 2a Multicenter study1998 [48]
Kanai et al Innog 93 41 226 40 100 40 0.025 2a Multicenter study1998 [49]
Mecocci et al Innog 29 23 205 59 83 3.5 0.29 2a1998 [50]
Shoji et al Innog 55 34 214 49 97 16.3 0.06 2a Adjusted IFCC1998 cut-off from graph [51]
Vanderstichele Innog 81 15 178 90 67 2.7 0.37 2aet al 1998 [9]
The table continues on the next page

D E M E N T I A – D I AG N O S T I C A N D T H E R A P E U T I C I N T E RV E N T I O N S232
Table 20.1 continued
Author Method AD Controls Change in AD Sensitivity Specificity LR+ LR– Quality Comments Year (n) (n) (% of controls) of study Reference
Nishimura et al Innog 163 65 227 66 83 3.9 0.26 2a Multicenter study1998 [52]
Hulstaert et al Innog 150 100 218 79 70 2.6 0.38 2a Multicenter study1999 [53] Kahle et al Innog 30 16 247 63 75 2.5 0.40 2a2000 [54]
Kanemaru et al Innog 24 19 400 83 95 16.6 0.06 2a2000 [55]
Sjögren et al Innog 21 18 200 76 85 5.1 0.20 2a Early onset AD2000 [56]
Sjögren et al Innog 21 18 186 57 85 3.8 0.26 2a Late onset AD2000 [56]
Kapaki et al Innog 38 47 358 90 92 11.3 0.09 2a2001[28]
Rösler et al Innog 27 49 320 89 100 40 0.025 2a2001[57]
Buerger et al Innog 80 21 N g 81 91 8.6 0.12 2a2002[58]
Hu et al Innog 52 56 226 79 100 40 0.025 2a2002 [22]

C H A P T E R 2 0 • C E R E B R O S P I N A L F L U I D B I O M A R K E R S I N A D 233
Table 20.1 continued
Author Method AD Controls Change in AD Sensitivity Specificity LR+ LR– Quality Comments Year (n) (n) (% of controls) of study Reference
Nishimura et al Innog 163 65 227 66 83 3.9 0.26 2a Multicenter study1998 [52]
Hulstaert et al Innog 150 100 218 79 70 2.6 0.38 2a Multicenter study1999 [53] Kahle et al Innog 30 16 247 63 75 2.5 0.40 2a2000 [54]
Kanemaru et al Innog 24 19 400 83 95 16.6 0.06 2a2000 [55]
Sjögren et al Innog 21 18 200 76 85 5.1 0.20 2a Early onset AD2000 [56]
Sjögren et al Innog 21 18 186 57 85 3.8 0.26 2a Late onset AD2000 [56]
Kapaki et al Innog 38 47 358 90 92 11.3 0.09 2a2001[28]
Rösler et al Innog 27 49 320 89 100 40 0.025 2a2001[57]
Buerger et al Innog 80 21 N g 81 91 8.6 0.12 2a2002[58]
Hu et al Innog 52 56 226 79 100 40 0.025 2a2002 [22]
The table continues on the next page

D E M E N T I A – D I AG N O S T I C A N D T H E R A P E U T I C I N T E RV E N T I O N S234
Table 20.1 continued
Author Method AD Controls Change in AD Sensitivity Specificity LR+ LR– Quality Comments Year (n) (n) (% of controls) of study Reference
Shoji et al Innog 366 316 290 59 97 19.7 0.05 2a Multicenter study2002[59]
Motter et al Athena 37 20 192 59 95 11.8 0.08 2b Multicenter study1995[10]
Kurz et al Innog 40 36 442 89 97 29.7 0.03 2b1998[60]
Burger née Buch et al Innog 38 47 212 84 62 2.20 0.45 2b1999[61]
Hampel et al Innog 25 19 231 80 85 5.3 0.19 2b1999[62]
Morikawa et al Innog 36 23 505 92 95 18.4 0.05 2b1999 [63]
Mulder et al Innog 20 20 223 90 90 9 0.11 2b2002 [64]
Maruyama et al Innog 54 15 351 87 93 12.4 0.08 2b Prospective2001 follow-up [65] Sum 2 628 1 540 Mean 289.3 77.1 89.9 16.4 0.16 * The “old” standard gave lower CSF tau levels.
AD = Alzheimer’s disease; Athena = Athena ELISA method [8]; IFCC = International Federation of Clinical chemistry; Innog = Innogenetics ELISA method [6]; LR = Likelihood ratio; N g = Not given

C H A P T E R 2 0 • C E R E B R O S P I N A L F L U I D B I O M A R K E R S I N A D 235
Table 20.1 continued
Author Method AD Controls Change in AD Sensitivity Specificity LR+ LR– Quality Comments Year (n) (n) (% of controls) of study Reference
Shoji et al Innog 366 316 290 59 97 19.7 0.05 2a Multicenter study2002[59]
Motter et al Athena 37 20 192 59 95 11.8 0.08 2b Multicenter study1995[10]
Kurz et al Innog 40 36 442 89 97 29.7 0.03 2b1998[60]
Burger née Buch et al Innog 38 47 212 84 62 2.20 0.45 2b1999[61]
Hampel et al Innog 25 19 231 80 85 5.3 0.19 2b1999[62]
Morikawa et al Innog 36 23 505 92 95 18.4 0.05 2b1999 [63]
Mulder et al Innog 20 20 223 90 90 9 0.11 2b2002 [64]
Maruyama et al Innog 54 15 351 87 93 12.4 0.08 2b Prospective2001 follow-up [65] Sum 2 628 1 540 Mean 289.3 77.1 89.9 16.4 0.16 * The “old” standard gave lower CSF tau levels.
AD = Alzheimer’s disease; Athena = Athena ELISA method [8]; IFCC = International Federation of Clinical chemistry; Innog = Innogenetics ELISA method [6]; LR = Likelihood ratio; N g = Not given

D E M E N T I A – D I AG N O S T I C A N D T H E R A P E U T I C I N T E RV E N T I O N S236
Table 20.2 CSF-Aß42 in Alzheimer’s disease and controls.
Author Variant Method AD Controls Change in AD Sensitivity Specificity LR+ LR– Quality Comments Year of Aß42 (n) (n) (% of controls) of study Reference
Maddalena et al Aß 1–42 Innog 51 31 57 78 90 7.8 0.13 1a Consecutive cases2003[66]
Riemenschneider Aß 1–42 Innog 74 40 37 89 95 17.8 0.06 1a Consecutive caseset al 2002 [40]
Sjögren et al Aß 1–42 Innog 60 32 49 93 85 6.2 0.16 1a Prospective, 2000 consecutive cases[37]
Sjögren et al Aß 1–42 Innog 19 17 42 100 94 16.7 0.06 1a Prospective, 2002 consecutive cases[41]
Kapaki et al Aß 1–42 Innog 49 49 49 82 80 4.1 0.24 1a Clinical practice, 2003 3-year follow-up[43]
Andreasen et al Aß 1–42 Innog 53 21 42 92 95 18.4 0.05 1b Community-based1999 sample[67]
Hulstaert et al Aß 1–42 Innog 150 100 57 78 81 4.1 0.24 2a Multicenter study1999[53]
Vanderstichele Aß 1–42 Innog 81 51 75 81 80 4.1 0.25 2aet al 1998 [9]
Galasko et al Aß X–42 Athena 82 60 56 78 83 4.6 0.22 2a Multicenter study1998[48]

C H A P T E R 2 0 • C E R E B R O S P I N A L F L U I D B I O M A R K E R S I N A D 237
Table 20.2 CSF-Aß42 in Alzheimer’s disease and controls.
Author Variant Method AD Controls Change in AD Sensitivity Specificity LR+ LR– Quality Comments Year of Aß42 (n) (n) (% of controls) of study Reference
Maddalena et al Aß 1–42 Innog 51 31 57 78 90 7.8 0.13 1a Consecutive cases2003[66]
Riemenschneider Aß 1–42 Innog 74 40 37 89 95 17.8 0.06 1a Consecutive caseset al 2002 [40]
Sjögren et al Aß 1–42 Innog 60 32 49 93 85 6.2 0.16 1a Prospective, 2000 consecutive cases[37]
Sjögren et al Aß 1–42 Innog 19 17 42 100 94 16.7 0.06 1a Prospective, 2002 consecutive cases[41]
Kapaki et al Aß 1–42 Innog 49 49 49 82 80 4.1 0.24 1a Clinical practice, 2003 3-year follow-up[43]
Andreasen et al Aß 1–42 Innog 53 21 42 92 95 18.4 0.05 1b Community-based1999 sample[67]
Hulstaert et al Aß 1–42 Innog 150 100 57 78 81 4.1 0.24 2a Multicenter study1999[53]
Vanderstichele Aß 1–42 Innog 81 51 75 81 80 4.1 0.25 2aet al 1998 [9]
Galasko et al Aß X–42 Athena 82 60 56 78 83 4.6 0.22 2a Multicenter study1998[48]
The table continues on the next page

D E M E N T I A – D I AG N O S T I C A N D T H E R A P E U T I C I N T E RV E N T I O N S238
Table 20.2 continued
Author Variant Method AD Controls Change in AD Sensitivity Specificity LR+ LR– Quality Comments Year of Aß42 (n) (n) (% of controls) of study Reference
Kanemaru et al Aß 1–42 Innog 24 19 40 96 95 19.2 0.05 2a2000[55]
Kapaki et al Aß 1–42 Innog 38 47 51 76 85 5.1 0.2 2a2001[28]
Rösler et al Aß 1–42 Innog 27 49 48 78 100 40 0.025 2a2001[57]
Motter et al Aß X–42 Athena 37 20 61 100 80 5 0.2 2b Multicenter study1995[10]
Mulder et al Aß 1–42 Innog 20 20 46 100 95 20 0.05 2b2002[64]
Maruyama et al Aß 1–42 Innog 54 15 71 89 67 2.7 0.37 2b Prospective2001 follow-up[65]
Sum 819 571Mean 52.1 87.3 87 11.7 0.16
AD = Alzheimer’s disease; Athena = Athena ELISA method [10]; Innog = Innogenetics ELISA method [9]; LR = Likelihood ratio

C H A P T E R 2 0 • C E R E B R O S P I N A L F L U I D B I O M A R K E R S I N A D 239
Table 20.2 continued
Author Variant Method AD Controls Change in AD Sensitivity Specificity LR+ LR– Quality Comments Year of Aß42 (n) (n) (% of controls) of study Reference
Kanemaru et al Aß 1–42 Innog 24 19 40 96 95 19.2 0.05 2a2000[55]
Kapaki et al Aß 1–42 Innog 38 47 51 76 85 5.1 0.2 2a2001[28]
Rösler et al Aß 1–42 Innog 27 49 48 78 100 40 0.025 2a2001[57]
Motter et al Aß X–42 Athena 37 20 61 100 80 5 0.2 2b Multicenter study1995[10]
Mulder et al Aß 1–42 Innog 20 20 46 100 95 20 0.05 2b2002[64]
Maruyama et al Aß 1–42 Innog 54 15 71 89 67 2.7 0.37 2b Prospective2001 follow-up[65]
Sum 819 571Mean 52.1 87.3 87 11.7 0.16
AD = Alzheimer’s disease; Athena = Athena ELISA method [10]; Innog = Innogenetics ELISA method [9]; LR = Likelihood ratio

D E M E N T I A – D I AG N O S T I C A N D T H E R A P E U T I C I N T E RV E N T I O N S240
Table 20.3 CSF-phospho tau in Alzheimer’s disease and controls.
Author P-tau epitope AD Controls Change in AD Sensitivity Specificity LR+ LR– Quality Comments Year (n) (n) (% of controls) of study Reference
Sjögren et al Thr181 41 17 145 44 95 8.8 0.11 1a Prospective, 2001 consecutive cases[38]
Sjögren et al Thr181 19 17 164 58 94 9.7 0.1 1a Prospective, 2002 consecutive cases[41]
Maddalena et al Thr181 51 31 193 84 84 5.3 0.19 1a Consecutive cases2003 [66]
Parnetti et al Thr181 80 40 N g 84 88 7 0.14 2a2001[68]
Hampel et al Thr181 108 23 186 85 91 9.4 0.11 2a Two-center study2004[23]
Riemenschneider Thr181 42 43 359 88 100 40 0.025 2aet al 2003[31]
Hampel et al Ser199 108 23 212 85 82 4.7 0.21 2a Two-center study2004[23]
Ishiguro et al Ser199 36 20 N g 94 80 4.7 0.21 2b “Non-AD” controls1999[20]

C H A P T E R 2 0 • C E R E B R O S P I N A L F L U I D B I O M A R K E R S I N A D 241
Table 20.3 CSF-phospho tau in Alzheimer’s disease and controls.
Author P-tau epitope AD Controls Change in AD Sensitivity Specificity LR+ LR– Quality Comments Year (n) (n) (% of controls) of study Reference
Sjögren et al Thr181 41 17 145 44 95 8.8 0.11 1a Prospective, 2001 consecutive cases[38]
Sjögren et al Thr181 19 17 164 58 94 9.7 0.1 1a Prospective, 2002 consecutive cases[41]
Maddalena et al Thr181 51 31 193 84 84 5.3 0.19 1a Consecutive cases2003 [66]
Parnetti et al Thr181 80 40 N g 84 88 7 0.14 2a2001[68]
Hampel et al Thr181 108 23 186 85 91 9.4 0.11 2a Two-center study2004[23]
Riemenschneider Thr181 42 43 359 88 100 40 0.025 2aet al 2003[31]
Hampel et al Ser199 108 23 212 85 82 4.7 0.21 2a Two-center study2004[23]
Ishiguro et al Ser199 36 20 N g 94 80 4.7 0.21 2b “Non-AD” controls1999[20]
The table continues on the next page

D E M E N T I A – D I AG N O S T I C A N D T H E R A P E U T I C I N T E RV E N T I O N S242
Table 20.3 continued
Author P-tau epitope AD Controls Change in AD Sensitivity Specificity LR+ LR– Quality Comments Year (n) (n) (% of controls) of study Reference
Buerger et al Thr231 82 21 N g 100 91 10.5 0.1 2a Multicenter study2002[58]
Hampel et al Thr231 108 23 1 906 85 96 21.3 0.05 2a Two-center study2004[23]
Kohnken et al Thr231 27 31 N g 85 97 28.3 0.04 2b “Non-AD” controls2000[21]
Hu et al Ser396+404 52 56 346 94 89 8.5 0.12 2a Cut-off P-tau 2002 >100 pg/mL[22]
Ishiguro et al Thr231 + Ser235 36 20 N g 53 100 40 0.025 2b “Non-AD” controls1999[20]
Blennow et al Thr181 + Thr231 40 31 348 88 97 29.3 0.03 2a1995[6]
Sum 830 396Mean 428.8 80.5 91.7 16.3 0.12
AD = Alzheimer’s disease; LR = Likelihood ratio; N g = Not given

C H A P T E R 2 0 • C E R E B R O S P I N A L F L U I D B I O M A R K E R S I N A D 243
Table 20.3 continued
Author P-tau epitope AD Controls Change in AD Sensitivity Specificity LR+ LR– Quality Comments Year (n) (n) (% of controls) of study Reference
Buerger et al Thr231 82 21 N g 100 91 10.5 0.1 2a Multicenter study2002[58]
Hampel et al Thr231 108 23 1 906 85 96 21.3 0.05 2a Two-center study2004[23]
Kohnken et al Thr231 27 31 N g 85 97 28.3 0.04 2b “Non-AD” controls2000[21]
Hu et al Ser396+404 52 56 346 94 89 8.5 0.12 2a Cut-off P-tau 2002 >100 pg/mL[22]
Ishiguro et al Thr231 + Ser235 36 20 N g 53 100 40 0.025 2b “Non-AD” controls1999[20]
Blennow et al Thr181 + Thr231 40 31 348 88 97 29.3 0.03 2a1995[6]
Sum 830 396Mean 428.8 80.5 91.7 16.3 0.12
AD = Alzheimer’s disease; LR = Likelihood ratio; N g = Not given

D E M E N T I A – D I AG N O S T I C A N D T H E R A P E U T I C I N T E RV E N T I O N S244
Table 20.4 Combination of CSF markers in Alzheimer’s disease and controls.
Author Marker and method AD Controls Sensitivity Specificity LR+ LR– Quality Comments Year (n) (n) of study Reference
Sjögren et al Tau + Aß42 (Innog) 60 32 73 84 4.6 0.22 1a Prospective, 2000 consecutive cases[37]
Andreasen et al Tau + Aß42 (Innog) 105 N a 94 N a N a N a 1a Community-based sample2001 [39]
Riemenschneider Tau + Aß42 (Innog) 74 40 92 95 18.4 0.05 1a Consecutive caseset al 2002[40]
Sjögren et al Tau + Aß42 (Innog) 19 17 100 100 40 0.025 1a Prospective, 2002 consecutive cases[41]
Gomez-Tortosa Tau + Aß42 (Innog) 33 46 84 79 4 0.25 1a Prospective studyet al 2003[42]
Kapaki et al Tau + Aß42 (Innog) 49 49 96 86 6.9 0.15 1a Clinical practice, 2003 3-year follow-up[43]
Andreasen et al Tau + Aß42 (Innog) 35 19 92 90 9.2 0.11 1b2001 [69]
Galasko et al Tau + Aß42 (Athena) 82 60 90 80 4.1 0.22 2a Multicenter study1998[48]
Vanderstichele Tau + Aß42 (Innog) 81 15 74 93 10.6 0.09 2aet al 1998 [9]

C H A P T E R 2 0 • C E R E B R O S P I N A L F L U I D B I O M A R K E R S I N A D 245
Table 20.4 Combination of CSF markers in Alzheimer’s disease and controls.
Author Marker and method AD Controls Sensitivity Specificity LR+ LR– Quality Comments Year (n) (n) of study Reference
Sjögren et al Tau + Aß42 (Innog) 60 32 73 84 4.6 0.22 1a Prospective, 2000 consecutive cases[37]
Andreasen et al Tau + Aß42 (Innog) 105 N a 94 N a N a N a 1a Community-based sample2001 [39]
Riemenschneider Tau + Aß42 (Innog) 74 40 92 95 18.4 0.05 1a Consecutive caseset al 2002[40]
Sjögren et al Tau + Aß42 (Innog) 19 17 100 100 40 0.025 1a Prospective, 2002 consecutive cases[41]
Gomez-Tortosa Tau + Aß42 (Innog) 33 46 84 79 4 0.25 1a Prospective studyet al 2003[42]
Kapaki et al Tau + Aß42 (Innog) 49 49 96 86 6.9 0.15 1a Clinical practice, 2003 3-year follow-up[43]
Andreasen et al Tau + Aß42 (Innog) 35 19 92 90 9.2 0.11 1b2001 [69]
Galasko et al Tau + Aß42 (Athena) 82 60 90 80 4.1 0.22 2a Multicenter study1998[48]
Vanderstichele Tau + Aß42 (Innog) 81 15 74 93 10.6 0.09 2aet al 1998 [9]
The table continues on the next page

D E M E N T I A – D I AG N O S T I C A N D T H E R A P E U T I C I N T E RV E N T I O N S246
Table 20.4 continued
Author Marker and method AD Controls Sensitivity Specificity LR+ LR– Quality Comments Year (n) (n) of study Reference
Hulstaert et al Tau + Aß42 (Innog) 150 100 85 87 6.5 0.15 2a Multicenter study 1999 [53]
Rösler et al Tau + Aß42 (Innog) 27 49 85 100 40.0 0.025 2a 2001 [57]
Takeda et al Tau + Aß42 (Innog) 189 27 80 100 40 0.025 2a Multicenter study2001[70]
Motter et al Tau + Aß42 (Athena) 37 20 59 95 7.4 0.08 2b Multicenter study1995[10]
Mulder et al Tau + Aß42 (Innog) 20 20 100 95 20 0.05 2b2002[64]
Sunderland et al Tau (Innog) + AßX-42 131 72 92 82 5.1 0.2 2b 31 AD with2003 (IGEN) neuropathological[14] diagnosis
Kanai et al Tau + Aß42 (Innog + Jap) 93 54 40 90 9.3 0.25 2a Multicenter study1998[49]
Maddalena et al P-Tau181 + Aß42 (Innog) 51 31 86 97 28.7 0.03 1a Consecutive cases2003 [66]
Hu et al T-tau + P-tau396/404 52 56 96 100 40 0.025 2a2002[22]
Sum 1 228 675Mean 85 91.8 18.1 0.14
AD = Alzheimer’s disease; Athena = Athena ELISA method [8]; Innog = Innogenetics ELISA method [6]; LR = Likelihood ratio; N a = Not applicable

C H A P T E R 2 0 • C E R E B R O S P I N A L F L U I D B I O M A R K E R S I N A D 247
Table 20.4 continued
Author Marker and method AD Controls Sensitivity Specificity LR+ LR– Quality Comments Year (n) (n) of study Reference
Hulstaert et al Tau + Aß42 (Innog) 150 100 85 87 6.5 0.15 2a Multicenter study 1999 [53]
Rösler et al Tau + Aß42 (Innog) 27 49 85 100 40.0 0.025 2a 2001 [57]
Takeda et al Tau + Aß42 (Innog) 189 27 80 100 40 0.025 2a Multicenter study2001[70]
Motter et al Tau + Aß42 (Athena) 37 20 59 95 7.4 0.08 2b Multicenter study1995[10]
Mulder et al Tau + Aß42 (Innog) 20 20 100 95 20 0.05 2b2002[64]
Sunderland et al Tau (Innog) + AßX-42 131 72 92 82 5.1 0.2 2b 31 AD with2003 (IGEN) neuropathological[14] diagnosis
Kanai et al Tau + Aß42 (Innog + Jap) 93 54 40 90 9.3 0.25 2a Multicenter study1998[49]
Maddalena et al P-Tau181 + Aß42 (Innog) 51 31 86 97 28.7 0.03 1a Consecutive cases2003 [66]
Hu et al T-tau + P-tau396/404 52 56 96 100 40 0.025 2a2002[22]
Sum 1 228 675Mean 85 91.8 18.1 0.14
AD = Alzheimer’s disease; Athena = Athena ELISA method [8]; Innog = Innogenetics ELISA method [6]; LR = Likelihood ratio; N a = Not applicable

D E M E N T I A – D I AG N O S T I C A N D T H E R A P E U T I C I N T E RV E N T I O N S248
Table 20.5 CSF markers in early Alzheimer’s disease and MCI.
Author, year, reference Marker Criteria n Change in AD (% of controls)
Sensitivity Qualityof study
Comments
Andreasen et al, 1999 [45] T-tau AD et al, MMSE >23 205 288 94 1b Community-basedpatient sample
Galasko et al, 1997 [71] T-tau AD et al, MMSE >25 12 N g 75 2a
Riemenschneider et al, 1996 [72] T-tau AD et al, MMSE >25 11 284 91 2b
Kurz et al, 1998 [60] T-tau AD et al, MMSE >25 19 384 84 2b
Arai et al, 2000 [73] T-tau MCI with progr to AD 20 N a 80 1b Consecutive cases
Andreasen et al, 2003 [74] T-tau MCI with progr to AD 44 212 80 1b Community-based patient sample
Maruyama et al, 2001 [65] T-tau MCI et al, 70% with progr to AD
19 291 68 2a
Gottfries et al, 2001 [75] T-tau MCI with progr to AD 32 267 60 2a
Arai et al, 1997 [76] T-tau MCI with progr to AD 10 N a 90 2b
SumMean
372287.7 80.2
Andreasen et al, 1999 [67] Aß42 AD et al, MMSE >25 24 N g 88 1b Community-based sample
Andreasen et al, 2003 [74] Aß42 MCI with progr to AD 44 57 77 1b Community-basedsample
Maruyama et al, 2001 [65] Aß42 MCI 70% with progr to AD 19 94 47 2b
SumMean
8775.5 70.7

C H A P T E R 2 0 • C E R E B R O S P I N A L F L U I D B I O M A R K E R S I N A D 249
Table 20.5 CSF markers in early Alzheimer’s disease and MCI.
Author, year, reference Marker Criteria n Change in AD (% of controls)
Sensitivity Qualityof study
Comments
Andreasen et al, 1999 [45] T-tau AD et al, MMSE >23 205 288 94 1b Community-basedpatient sample
Galasko et al, 1997 [71] T-tau AD et al, MMSE >25 12 N g 75 2a
Riemenschneider et al, 1996 [72] T-tau AD et al, MMSE >25 11 284 91 2b
Kurz et al, 1998 [60] T-tau AD et al, MMSE >25 19 384 84 2b
Arai et al, 2000 [73] T-tau MCI with progr to AD 20 N a 80 1b Consecutive cases
Andreasen et al, 2003 [74] T-tau MCI with progr to AD 44 212 80 1b Community-based patient sample
Maruyama et al, 2001 [65] T-tau MCI et al, 70% with progr to AD
19 291 68 2a
Gottfries et al, 2001 [75] T-tau MCI with progr to AD 32 267 60 2a
Arai et al, 1997 [76] T-tau MCI with progr to AD 10 N a 90 2b
SumMean
372287.7 80.2
Andreasen et al, 1999 [67] Aß42 AD et al, MMSE >25 24 N g 88 1b Community-based sample
Andreasen et al, 2003 [74] Aß42 MCI with progr to AD 44 57 77 1b Community-basedsample
Maruyama et al, 2001 [65] Aß42 MCI 70% with progr to AD 19 94 47 2b
SumMean
8775.5 70.7
The table continues on the next page

D E M E N T I A – D I AG N O S T I C A N D T H E R A P E U T I C I N T E RV E N T I O N S250
Table 20.5 continued
Author, year, reference Marker Criteria n Change in AD (% of controls)
Sensitivity Qualityof study
Comments
Galasko et al, 1998 [48] T-tau + Abß42 AD et al, MMSE >23 24 N a 62 2a Multicenter study
Hulstaert et al, 1999 [53] T-tau + Abß42 AD et al, MMSE >23 23 N a 70 2a Multicenter
Andreasen et al, 1999 [77] T-tau + Abß42 MCI with progr to AD 16 N a 88 1b Community-basedpatient sample
Riemenschneider et al, 2002 [78] T-tau + Abß42 MCI with progr to AD 10 N a 90 2a
SumMean
7377.5
Riemenschneider et al, 2003 [31] P-Thr181 AD et al, MMSE >25 29 303 97 2a
Arai et al, 2000 [73] P-Thr231 + P-Ser235
MCI with progr to AD 20 N a 70 1b Consecutive cases
Andreasen et al, 2003 [74] P-Thr181 MCI with progr to AD 44 202 70 1b Community-basedpatient sample
SumMean
9379.0
AD = Alzheimer’s disease; MCI = Mild cognitive impairment; MMSE = Mini-mental state examination; N a = Not applicable; N g = Not given

C H A P T E R 2 0 • C E R E B R O S P I N A L F L U I D B I O M A R K E R S I N A D 251
Author, year, reference Marker Criteria n Change in AD (% of controls)
Sensitivity Qualityof study
Comments
Galasko et al, 1998 [48] T-tau + Abß42 AD et al, MMSE >23 24 N a 62 2a Multicenter study
Hulstaert et al, 1999 [53] T-tau + Abß42 AD et al, MMSE >23 23 N a 70 2a Multicenter
Andreasen et al, 1999 [77] T-tau + Abß42 MCI with progr to AD 16 N a 88 1b Community-basedpatient sample
Riemenschneider et al, 2002 [78] T-tau + Abß42 MCI with progr to AD 10 N a 90 2a
SumMean
7377.5
Riemenschneider et al, 2003 [31] P-Thr181 AD et al, MMSE >25 29 303 97 2a
Arai et al, 2000 [73] P-Thr231 + P-Ser235
MCI with progr to AD 20 N a 70 1b Consecutive cases
Andreasen et al, 2003 [74] P-Thr181 MCI with progr to AD 44 202 70 1b Community-basedpatient sample
SumMean
9379.0
AD = Alzheimer’s disease; MCI = Mild cognitive impairment; MMSE = Mini-mental state examination; N a = Not applicable; N g = Not given

D E M E N T I A – D I AG N O S T I C A N D T H E R A P E U T I C I N T E RV E N T I O N S252
Table 20.6 CFS markers in other brain disorders.
AuthorYearReference
Numberof cases
CSF total tau Percent withincrease
Degreeof increase
Numberof cases
CSF Aß42 Percentwithdecrease
Degree of decrease
Numberof cases
CSF phos- pho tau Percent with increase
Degreeof increase
Qualityof
study
Comments
Lewy body dementia
Kanemaru et al2000[55]
11 18 Normal-mild 11 73 Mild-moderate
2a
Itoh et al2001[27]
13 15 Normal-mild 13 15 Normal-mild
2a P-Ser199
Saez-Valero et al2003[79]
19 16 Normal-mild 19 74 Moderate 19 11 Normal 2a P-Thr181
Shoji et al2002[59]
14 7 Mild- moderate
2a
Buerger et al2002[58]
17 53 Moderate 17 59 2a P-Thr231
Hampel et al2004[23]
22 36 Mild-moderate
2a P-Thr231
Hampel et al2004[23]
22 32 Mild-moderate
2a P-Thr181
Hampel et al2004[23]
22 50 Mild-moderate
2a P-Ser199

C H A P T E R 2 0 • C E R E B R O S P I N A L F L U I D B I O M A R K E R S I N A D 253
AuthorYearReference
Numberof cases
CSF total tau Percent withincrease
Degreeof increase
Numberof cases
CSF Aß42 Percentwithdecrease
Degree of decrease
Numberof cases
CSF phos- pho tau Percent with increase
Degreeof increase
Qualityof
study
Comments
Lewy body dementia
Kanemaru et al2000[55]
11 18 Normal-mild 11 73 Mild-moderate
2a
Itoh et al2001[27]
13 15 Normal-mild 13 15 Normal-mild
2a P-Ser199
Saez-Valero et al2003[79]
19 16 Normal-mild 19 74 Moderate 19 11 Normal 2a P-Thr181
Shoji et al2002[59]
14 7 Mild- moderate
2a
Buerger et al2002[58]
17 53 Moderate 17 59 2a P-Thr231
Hampel et al2004[23]
22 36 Mild-moderate
2a P-Thr231
Hampel et al2004[23]
22 32 Mild-moderate
2a P-Thr181
Hampel et al2004[23]
22 50 Mild-moderate
2a P-Ser199
The table continues on the next page

D E M E N T I A – D I AG N O S T I C A N D T H E R A P E U T I C I N T E RV E N T I O N S254
Table 20.6 continued
AuthorYearReference
Numberof cases
CSF total tau Percent withincrease
Degreeof increase
Numberof cases
CSF Aß42 Percentwithdecrease
Degree of decrease
Numberof cases
CSF phos- pho tau Percent with increase
Degreeof increase
Qualityof
study
Comments
Riemenschneider et al2003[31]
18 N g Mild 2a 15 with mild, 3 high P-tau
Sum Mean
7421.8
3073.5
13333.8
Fronto-temporal dementia
Sjögren et al2000[37]
17 24 Normal-mild 17 41 Mild 1a
Sjögren et al2001[38]
18 0 Normal 18 0 Normal 1a P-Thr181
Sjögren et al2001 [39]
14 14 Normal-mild 1a
Sjögren et al2002[41]
14 14 Mild 14 50 Moderate 14 0 Normal 1a P-Thr181
Wallin et al2003[44]
14 21 Normal-mild 1a
Blennow et al1995[6]
11 36 Mild 11 55 Mild incr 2a P-Thr181+ 231
Mecocci et al1998[50]
10 0 Normal 2a

C H A P T E R 2 0 • C E R E B R O S P I N A L F L U I D B I O M A R K E R S I N A D 255
AuthorYearReference
Numberof cases
CSF total tau Percent withincrease
Degreeof increase
Numberof cases
CSF Aß42 Percentwithdecrease
Degree of decrease
Numberof cases
CSF phos- pho tau Percent with increase
Degreeof increase
Qualityof
study
Comments
Riemenschneider et al2003[31]
18 N g Mild 2a 15 with mild, 3 high P-tau
Sum Mean
7421.8
3073.5
13333.8
Fronto-temporal dementia
Sjögren et al2000[37]
17 24 Normal-mild 17 41 Mild 1a
Sjögren et al2001[38]
18 0 Normal 18 0 Normal 1a P-Thr181
Sjögren et al2001 [39]
14 14 Normal-mild 1a
Sjögren et al2002[41]
14 14 Mild 14 50 Moderate 14 0 Normal 1a P-Thr181
Wallin et al2003[44]
14 21 Normal-mild 1a
Blennow et al1995[6]
11 36 Mild 11 55 Mild incr 2a P-Thr181+ 231
Mecocci et al1998[50]
10 0 Normal 2a
The table continues on the next page

D E M E N T I A – D I AG N O S T I C A N D T H E R A P E U T I C I N T E RV E N T I O N S256
Table 20.6 continued
AuthorYearReference
Numberof cases
CSF total tau Percent withincrease
Degreeof increase
Numberof cases
CSF Aß42 Percentwithdecrease
Degree of decrease
Numberof cases
CSF phos- pho tau Percent with increase
Degreeof increase
Qualityof
study
Comments
Green et al1999[80]
23 69 Moderate 2a
Hulstaert et al1999[53]
11 27 Mild- moderate
11 45 Mild- moderate
2a
Vanmechelen et al2000[19]
18 0 Normal 18 0 Normal 2a P-Thr181 Low P-tauin FTD
Sjögren et al2000[56]
18 11 Normal-mild 2a
Itoh et al2001[27]
16 25 Normal-mild 16 37 Mild-moderate
2a P-Ser199
Shoji et al2002[59]
14 36 Mild 2a
Buerger et al2002 [58]
26 38 Mild 26 12 Mild 2a P-Thr231
Rosso et al2003[81]
17 35 Moderate 17 12 Mild 17 29 Mild-moderate
2a
Hampel et al2004[23]
24 8 Normal-mild
2a P-Thr231

C H A P T E R 2 0 • C E R E B R O S P I N A L F L U I D B I O M A R K E R S I N A D 257
AuthorYearReference
Numberof cases
CSF total tau Percent withincrease
Degreeof increase
Numberof cases
CSF Aß42 Percentwithdecrease
Degree of decrease
Numberof cases
CSF phos- pho tau Percent with increase
Degreeof increase
Qualityof
study
Comments
Green et al1999[80]
23 69 Moderate 2a
Hulstaert et al1999[53]
11 27 Mild- moderate
11 45 Mild- moderate
2a
Vanmechelen et al2000[19]
18 0 Normal 18 0 Normal 2a P-Thr181 Low P-tauin FTD
Sjögren et al2000[56]
18 11 Normal-mild 2a
Itoh et al2001[27]
16 25 Normal-mild 16 37 Mild-moderate
2a P-Ser199
Shoji et al2002[59]
14 36 Mild 2a
Buerger et al2002 [58]
26 38 Mild 26 12 Mild 2a P-Thr231
Rosso et al2003[81]
17 35 Moderate 17 12 Mild 17 29 Mild-moderate
2a
Hampel et al2004[23]
24 8 Normal-mild
2a P-Thr231
The table continues on the next page

D E M E N T I A – D I AG N O S T I C A N D T H E R A P E U T I C I N T E RV E N T I O N S258
Table 20.6 continued
AuthorYearReference
Numberof cases
CSF total tau Percent withincrease
Degreeof increase
Numberof cases
CSF Aß42 Percentwithdecrease
Degree of decrease
Numberof cases
CSF phos- pho tau Percent with increase
Degreeof increase
Qualityof
study
Comments
Hampel et al2004 [23]
24 29 Mild 2a P-Thr181
Hampel et al2004 [23]
24 58 Mild-moderate
2a P-Ser199
Fabre et al2001[82]
47 49 Mild-moderate
2b
SumMean
28824.9
5937
19222.8
Vascular dementia
Andreasen et al1998[36]
21 86 Moderate 1a
Sjögren et al2000 [37]
25 52 Mild- moderate
25 68 Mild-moderate
1a
Sjögren et al2001[38]
17 0 Normal 17 6 Mild 1a P-Thr181
Sjögren et al2001[39]
16 50 Mild 1a 2 cases with marked increase
Wallin et al2003[44]
17 47 Normal-mild 1a

C H A P T E R 2 0 • C E R E B R O S P I N A L F L U I D B I O M A R K E R S I N A D 259
AuthorYearReference
Numberof cases
CSF total tau Percent withincrease
Degreeof increase
Numberof cases
CSF Aß42 Percentwithdecrease
Degree of decrease
Numberof cases
CSF phos- pho tau Percent with increase
Degreeof increase
Qualityof
study
Comments
Hampel et al2004 [23]
24 29 Mild 2a P-Thr181
Hampel et al2004 [23]
24 58 Mild-moderate
2a P-Ser199
Fabre et al2001[82]
47 49 Mild-moderate
2b
SumMean
28824.9
5937
19222.8
Vascular dementia
Andreasen et al1998[36]
21 86 Moderate 1a
Sjögren et al2000 [37]
25 52 Mild- moderate
25 68 Mild-moderate
1a
Sjögren et al2001[38]
17 0 Normal 17 6 Mild 1a P-Thr181
Sjögren et al2001[39]
16 50 Mild 1a 2 cases with marked increase
Wallin et al2003[44]
17 47 Normal-mild 1a
The table continues on the next page

D E M E N T I A – D I AG N O S T I C A N D T H E R A P E U T I C I N T E RV E N T I O N S260
Table 20.6 continued
AuthorYearReference
Numberof cases
CSF total tau Percent withincrease
Degreeof increase
Numberof cases
CSF Aß42 Percentwithdecrease
Degree of decrease
Numberof cases
CSF phos- pho tau Percent with increase
Degreeof increase
Qualityof
study
Comments
Blennow et al1995[6]
17 76 Moderate 17 65 Moderate incr
2a P-Thr181+ 231
Mori et al1995[7]
12 0 Normal 2a
Arai et al1998[47]
21 5 Normal 2a
Mecocci et al1998[50]
10 20 Normal-mild 2a
Hulstaert et al1999[53]
33 27 Moderate 33 67 Mild-moderate
2a
Itoh et al2001[27]
23 39 Mild- moderate
23 17 Mild 2a P-Ser199
Gottfries et al2001[75]
14 44 Mild- moderate
2a
Shoji et al2002[59]
63 13 Normal 2a
Buerger et al2002[58]
20 40 Moderate 20 35 Moderate 2a P-Thr231

C H A P T E R 2 0 • C E R E B R O S P I N A L F L U I D B I O M A R K E R S I N A D 261
AuthorYearReference
Numberof cases
CSF total tau Percent withincrease
Degreeof increase
Numberof cases
CSF Aß42 Percentwithdecrease
Degree of decrease
Numberof cases
CSF phos- pho tau Percent with increase
Degreeof increase
Qualityof
study
Comments
Blennow et al1995[6]
17 76 Moderate 17 65 Moderate incr
2a P-Thr181+ 231
Mori et al1995[7]
12 0 Normal 2a
Arai et al1998[47]
21 5 Normal 2a
Mecocci et al1998[50]
10 20 Normal-mild 2a
Hulstaert et al1999[53]
33 27 Moderate 33 67 Mild-moderate
2a
Itoh et al2001[27]
23 39 Mild- moderate
23 17 Mild 2a P-Ser199
Gottfries et al2001[75]
14 44 Mild- moderate
2a
Shoji et al2002[59]
63 13 Normal 2a
Buerger et al2002[58]
20 40 Moderate 20 35 Moderate 2a P-Thr231
The table continues on the next page

D E M E N T I A – D I AG N O S T I C A N D T H E R A P E U T I C I N T E RV E N T I O N S262
Table 20.6 continued
AuthorYearReference
Numberof cases
CSF total tau Percent withincrease
Degreeof increase
Numberof cases
CSF Aß42 Percentwithdecrease
Degree of decrease
Numberof cases
CSF phos- pho tau Percent with increase
Degreeof increase
Qualityof
study
Comments
Hu et al2002[22]
46 50 Mild- moderate
46 7 Mild 2a P-Ser396+ 404
Saez-Valero et al2003[79]
12 17 Normal-mild 12 58 Mild-moderate
7 14 Normal-mild
2a P-Thr181
SumMean
36735.4
7064.3
13024
Cerebrovascular disease without dementia
Vigo-Pelfrey et al1995[8]
16 0 Normal 2a
Arai et al1995[46]
19 16 Normal 2a 16/19normal tau
Nishimura et al1998[52]
38 13 Normal-mild 2a
SumMean
739.7
Normal pressure hydrocephalus
Hulstaert et al1999[53]
20 20 Mild- moderate
20 50 Mild-moderate
2a

C H A P T E R 2 0 • C E R E B R O S P I N A L F L U I D B I O M A R K E R S I N A D 263
AuthorYearReference
Numberof cases
CSF total tau Percent withincrease
Degreeof increase
Numberof cases
CSF Aß42 Percentwithdecrease
Degree of decrease
Numberof cases
CSF phos- pho tau Percent with increase
Degreeof increase
Qualityof
study
Comments
Hu et al2002[22]
46 50 Mild- moderate
46 7 Mild 2a P-Ser396+ 404
Saez-Valero et al2003[79]
12 17 Normal-mild 12 58 Mild-moderate
7 14 Normal-mild
2a P-Thr181
SumMean
36735.4
7064.3
13024
Cerebrovascular disease without dementia
Vigo-Pelfrey et al1995[8]
16 0 Normal 2a
Arai et al1995[46]
19 16 Normal 2a 16/19normal tau
Nishimura et al1998[52]
38 13 Normal-mild 2a
SumMean
739.7
Normal pressure hydrocephalus
Hulstaert et al1999[53]
20 20 Mild- moderate
20 50 Mild-moderate
2a
The table continues on the next page

D E M E N T I A – D I AG N O S T I C A N D T H E R A P E U T I C I N T E RV E N T I O N S264
Table 20.6 continued
AuthorYearReference
Numberof cases
CSF total tau Percent withincrease
Degreeof increase
Numberof cases
CSF Aß42 Percentwithdecrease
Degree of decrease
Numberof cases
CSF phos- pho tau Percent with increase
Degreeof increase
Qualityof
study
Comments
Kudo et al2000[83]
20 55 Mild- moderate
2b
Tullberg et al2000[84]
43 N g Normal-mild 2b
Sum Mean
8337.5
20 50
Amyotrophic lateral sclerosis
Sjögren et al2002[41]
19 45 Mild- moderate
19 100 Moderate-severe
19 9 Mild 1a P-Thr181
Vigo-Pelfrey et al1995[8]
20 10 Normal-mild 2a
Kanai et al1998[49]
12 0 Normal 2a
Kapaki et al2000[85]
17 0 Normal 2a
SumMean
6813.8
19100
19 9

C H A P T E R 2 0 • C E R E B R O S P I N A L F L U I D B I O M A R K E R S I N A D 265
AuthorYearReference
Numberof cases
CSF total tau Percent withincrease
Degreeof increase
Numberof cases
CSF Aß42 Percentwithdecrease
Degree of decrease
Numberof cases
CSF phos- pho tau Percent with increase
Degreeof increase
Qualityof
study
Comments
Kudo et al2000[83]
20 55 Mild- moderate
2b
Tullberg et al2000[84]
43 N g Normal-mild 2b
Sum Mean
8337.5
20 50
Amyotrophic lateral sclerosis
Sjögren et al2002[41]
19 45 Mild- moderate
19 100 Moderate-severe
19 9 Mild 1a P-Thr181
Vigo-Pelfrey et al1995[8]
20 10 Normal-mild 2a
Kanai et al1998[49]
12 0 Normal 2a
Kapaki et al2000[85]
17 0 Normal 2a
SumMean
6813.8
19100
19 9
The table continues on the next page

D E M E N T I A – D I AG N O S T I C A N D T H E R A P E U T I C I N T E RV E N T I O N S266
Table 20.6 continued
AuthorYearReference
Numberof cases
CSF total tau Percent withincrease
Degreeof increase
Numberof cases
CSF Aß42 Percentwithdecrease
Degree of decrease
Numberof cases
CSF phos- pho tau Percent with increase
Degreeof increase
Qualityof
study
Comments
Parkinson’s disease without dementia
Sjögren et al2000 [37]
23 22 Mild 23 26 Mild 1a
Sjögren et al2001[38]
15 0 Normal 15 0 Normal 1a P-Thr181
Sjögren et al2002[41]
15 0 Normal 15 27 Mild 15 0 Normal 1a P-Thr181
Blennow et al1995[6]
15 27 Mild 15 27 Mild 2a P-Thr181+ 231
Holmberg et al2003[86]
48 4 Normal 2a
Sum Mean
6812.3
8619
459
Parkinson’s disease without dementia
Holmberg et al2003[86]
15 0 Normal 2a
Itoh et al2001[27]
21 0 Normal 21 19 Mild 2a P-Ser199

C H A P T E R 2 0 • C E R E B R O S P I N A L F L U I D B I O M A R K E R S I N A D 267
AuthorYearReference
Numberof cases
CSF total tau Percent withincrease
Degreeof increase
Numberof cases
CSF Aß42 Percentwithdecrease
Degree of decrease
Numberof cases
CSF phos- pho tau Percent with increase
Degreeof increase
Qualityof
study
Comments
Parkinson’s disease without dementia
Sjögren et al2000 [37]
23 22 Mild 23 26 Mild 1a
Sjögren et al2001[38]
15 0 Normal 15 0 Normal 1a P-Thr181
Sjögren et al2002[41]
15 0 Normal 15 27 Mild 15 0 Normal 1a P-Thr181
Blennow et al1995[6]
15 27 Mild 15 27 Mild 2a P-Thr181+ 231
Holmberg et al2003[86]
48 4 Normal 2a
Sum Mean
6812.3
8619
459
Parkinson’s disease without dementia
Holmberg et al2003[86]
15 0 Normal 2a
Itoh et al2001[27]
21 0 Normal 21 19 Mild 2a P-Ser199
The table continues on the next page

D E M E N T I A – D I AG N O S T I C A N D T H E R A P E U T I C I N T E RV E N T I O N S268
Table 20.6 continued
AuthorYearReference
Numberof cases
CSF total tau Percent withincrease
Degreeof increase
Numberof cases
CSF Aß42 Percentwithdecrease
Degree of decrease
Numberof cases
CSF phos- pho tau Percent with increase
Degreeof increase
Qualityof
study
Comments
Shoji et al2002[59]
14 7 Normal 2a
Urakami et al2001[87]
30 0 Normal 2b
SumMean
652.3
150
Corticobasal degeneration
Itoh et al2001[27]
15 33 Normal-mild 15 47 Mild-moderate
2a P-Ser199
Shoji et al2002[59]
14 14 Normal-mild 2a
SumMean
2923.5
1547
Depression
Sjögren et al2000[37]
19 10 Normal-mild 19 0 Normal 1a
Andreasen et al1999[45]
28 18 Normal-mild 1b
Blennow et al1995[6]
10 0 Normal 10 0 2a P-Thr181+231

C H A P T E R 2 0 • C E R E B R O S P I N A L F L U I D B I O M A R K E R S I N A D 269
AuthorYearReference
Numberof cases
CSF total tau Percent withincrease
Degreeof increase
Numberof cases
CSF Aß42 Percentwithdecrease
Degree of decrease
Numberof cases
CSF phos- pho tau Percent with increase
Degreeof increase
Qualityof
study
Comments
Shoji et al2002[59]
14 7 Normal 2a
Urakami et al2001[87]
30 0 Normal 2b
SumMean
652.3
150
Corticobasal degeneration
Itoh et al2001[27]
15 33 Normal-mild 15 47 Mild-moderate
2a P-Ser199
Shoji et al2002[59]
14 14 Normal-mild 2a
SumMean
2923.5
1547
Depression
Sjögren et al2000[37]
19 10 Normal-mild 19 0 Normal 1a
Andreasen et al1999[45]
28 18 Normal-mild 1b
Blennow et al1995[6]
10 0 Normal 10 0 2a P-Thr181+231
The table continues on the next page

D E M E N T I A – D I AG N O S T I C A N D T H E R A P E U T I C I N T E RV E N T I O N S270
Table 20.6 continued
AuthorYearReference
Numberof cases
CSF total tau Percent withincrease
Degreeof increase
Numberof cases
CSF Aß42 Percentwithdecrease
Degree of decrease
Numberof cases
CSF phos- pho tau Percent with increase
Degreeof increase
Qualityof
study
Comments
Rösler et al1996[88]
11 9 Normal-mild 2a
Burger née Buch et al1999[61]
19 26 Normal-mild 2b
Buerger et al2003[89]
34 N g Normal-mild
2a
Schonknecht et al2003[90]
25 0 Normal 2a
SumMean
11210.5
19 440
Alcoholism
Morikawa et al1999[63]
20 5 Normal 2b Withdementia
SumMean
205
Creutzfeldt-Jakob disease
Otto et al1997[25]
21 100 Very high IIB Tau cut-off = 1 530 pg/mL
Otto et al2000[91]
27 89 Moderate IIB

C H A P T E R 2 0 • C E R E B R O S P I N A L F L U I D B I O M A R K E R S I N A D 271
AuthorYearReference
Numberof cases
CSF total tau Percent withincrease
Degreeof increase
Numberof cases
CSF Aß42 Percentwithdecrease
Degree of decrease
Numberof cases
CSF phos- pho tau Percent with increase
Degreeof increase
Qualityof
study
Comments
Rösler et al1996[88]
11 9 Normal-mild 2a
Burger née Buch et al1999[61]
19 26 Normal-mild 2b
Buerger et al2003[89]
34 N g Normal-mild
2a
Schonknecht et al2003[90]
25 0 Normal 2a
SumMean
11210.5
19 440
Alcoholism
Morikawa et al1999[63]
20 5 Normal 2b Withdementia
SumMean
205
Creutzfeldt-Jakob disease
Otto et al1997[25]
21 100 Very high IIB Tau cut-off = 1 530 pg/mL
Otto et al2000[91]
27 89 Moderate IIB
The table continues on the next page

D E M E N T I A – D I AG N O S T I C A N D T H E R A P E U T I C I N T E RV E N T I O N S272
Table 20.6 continued
AuthorYearReference
Numberof cases
CSF total tau Percent withincrease
Degreeof increase
Numberof cases
CSF Aß42 Percentwithdecrease
Degree of decrease
Numberof cases
CSF phos- pho tau Percent with increase
Degreeof increase
Qualityof
study
Comments
Kapaki et al2001[28]
14 100 Very high 14 64 Moderate-marked
IIB Tau cut-off = 2 131 pg/mL
Otto et al2002[29]
109 96 Very high 89 IIB Tau cut-off = 1 300 pg/mL
van Everbroeck et al1999[26]
29 74 Very high 29 N g Moderate 2a Tau cut-off = 1 530 pg/mL
Itoh et al2001[27]
11 100 Very high 11 36 Mild 2a P-Ser199
van Everbroeck et al2002[30]
75 92 Very high 75 Ng Mild-moderate
2a Tau cut-off = 1 350 pg/mL
Riemenschneider et al2003[31]
20 100 Very high 20 85 Mild 2a P-Thr181
SumMean
27994.6
7080.7
10660.5
N g = Not given

C H A P T E R 2 0 • C E R E B R O S P I N A L F L U I D B I O M A R K E R S I N A D 273
AuthorYearReference
Numberof cases
CSF total tau Percent withincrease
Degreeof increase
Numberof cases
CSF Aß42 Percentwithdecrease
Degree of decrease
Numberof cases
CSF phos- pho tau Percent with increase
Degreeof increase
Qualityof
study
Comments
Kapaki et al2001[28]
14 100 Very high 14 64 Moderate-marked
IIB Tau cut-off = 2 131 pg/mL
Otto et al2002[29]
109 96 Very high 89 IIB Tau cut-off = 1 300 pg/mL
van Everbroeck et al1999[26]
29 74 Very high 29 N g Moderate 2a Tau cut-off = 1 530 pg/mL
Itoh et al2001[27]
11 100 Very high 11 36 Mild 2a P-Ser199
van Everbroeck et al2002[30]
75 92 Very high 75 Ng Mild-moderate
2a Tau cut-off = 1 350 pg/mL
Riemenschneider et al2003[31]
20 100 Very high 20 85 Mild 2a P-Thr181
SumMean
27994.6
7080.7
10660.5
N g = Not given

D E M E N T I A – D I AG N O S T I C A N D T H E R A P E U T I C I N T E RV E N T I O N S274
Table 20.7 Summary of diagnostic validity of CSF markers.
CSF marker Degree Studies AD Controls Sensitivity Specificity LR+ LR– Grade of of quality (n) (n) (n) evidence
T-tau 1-a 9 405 243 83.2 91.6 16 0.11 Grade 1 1-a, 1b, 2a, 2b 36 2 628 1 540 77.1 89.9 16.4 0.16 (strong)
Aß1-42 1-a 5 253 169 88.4 88.8 10.5 0.13 Grade 1 1-a, 1b, 2a, 2b 15 819 571 87.3 87 11.7 0.16 (strong)
P-tau 1-a 3 111 65 62 91 7.9 0.14 Grade 2 1-a, 1b, 2a, 2b 14 830 396 80.5 91.7 16.3 0.12 (moderately strong)
Combination of 1-a 6 340 184 89.8 88.8 14.8 0.17 Grade 1T-tau, P-tau or Aß1-42 1-a, 1b, 2a, 2b 18 1 228 675 85 91.8 18.1 0.14 (strong)
AD = Alzheimer’s disease; LR = Likelihood ratio

C H A P T E R 2 0 • C E R E B R O S P I N A L F L U I D B I O M A R K E R S I N A D 275
Table 20.7 Summary of diagnostic validity of CSF markers.
CSF marker Degree Studies AD Controls Sensitivity Specificity LR+ LR– Grade of of quality (n) (n) (n) evidence
T-tau 1-a 9 405 243 83.2 91.6 16 0.11 Grade 1 1-a, 1b, 2a, 2b 36 2 628 1 540 77.1 89.9 16.4 0.16 (strong)
Aß1-42 1-a 5 253 169 88.4 88.8 10.5 0.13 Grade 1 1-a, 1b, 2a, 2b 15 819 571 87.3 87 11.7 0.16 (strong)
P-tau 1-a 3 111 65 62 91 7.9 0.14 Grade 2 1-a, 1b, 2a, 2b 14 830 396 80.5 91.7 16.3 0.12 (moderately strong)
Combination of 1-a 6 340 184 89.8 88.8 14.8 0.17 Grade 1T-tau, P-tau or Aß1-42 1-a, 1b, 2a, 2b 18 1 228 675 85 91.8 18.1 0.14 (strong)
AD = Alzheimer’s disease; LR = Likelihood ratio

D E M E N T I A – D I AG N O S T I C A N D T H E R A P E U T I C I N T E RV E N T I O N S276
1. Buee L, Bussiere T, Buee-Scherrer V, Delacourte A, Hof PR. Tau protein isoforms, phosphorylation and role in neu-rodegenerative disorders. Brain Res Brain Res Rev 2000;33:95-130.
2. Blennow K, Hampel H. CSF markers for incipient Alzheimer’s disease. Lancet Neurol 2003;2: 605-13.
3. Andreasen N, Blennow K. Beta-amyloid (Abeta) protein in cerebrospinal fluid as a biomarker for Alzheimer’s disease. Peptides 2002;23:1205-14.
4. Qizilbash Nea. Evidence-based dementia practice. Oxford: Blackwell Publishing; 2002.
5. Vandermeeren M, Mercken M, Vanmechelen E, Six J, van de Voorde A, Martin JJ, et al. Detection of tau proteins in normal and Alzheimer’s disease cere-brospinal fluid with a sensitive sandwich enzyme-linked immunosorbent assay. J Neurochem 1993;61:1828-34.
6. Blennow K, Wallin A, Agren H, Spenger C, Siegfried J, Vanmechelen E. Tau protein in cerebrospinal fluid: a biochemical marker for axonal degeneration in Alzhe-imer disease? Mol Chem Neuropathol 1995;26:231-45.
7. Mori H, Hosoda K, Matsubara E, Nakamoto T, Furiya Y, Endoh R, et al. Tau in cerebrospinal fluids: establishment of the sandwich ELISA with antibody specific to the repeat sequence in tau. Neurosci Lett 1995;186:181-3.
8. Vigo-Pelfrey C, Seubert P, Barbour R, Blomquist C, Lee M, Lee D, et al. Eleva
tion of microtubule-associated protein tau in the cerebrospinal fluid of patients with Alzheimer’s disease. Neurology 1995;45:788-93.
9. Vanderstichele H, Blennow K, D’Heuvaert ND, Buyse MA Wallin A, Andreasen N, et al. E. Eds: Fisher, A, Hanin, I, Yoshida, M. Development of a specific diagnostic test for measurement of B-amyloid (1–42) in CSF. Progress in Alzheimer’s and Parkinson’s Diseases. Plenum Press, New York. 1998:v773- 778.
10. Motter R, Vigo-Pelfrey C, Kholodenko D, Barbour R, Johnson-Wood K, Galasko D, et al. Reduction of beta-amyloid pep-tide42 in the cerebrospinal fluid of patients with Alzheimer’s disease. Ann Neurol 1995;38:643-8.
11. Tamaoka A, Sawamura N, Fukushima T, Shoji S, Matsubara E, Shoji M, et al. Amyloid beta protein 42(43) in cerebro-spinal fluid of patients with Alzheimer’s disease. J Neurol Sci 1997;148:41-5.
12. Jensen M, Schroder J, Blomberg M, Engvall B, Pantel J, Ida N, et al. Cerebro-spinal fluid A beta42 is increased early in sporadic Alzheimer’s disease and declines with disease progression. Ann Neurol 1999;45:504-11.
13. Mehta PD, Pirttila T, Mehta SP, Sersen EA, Aisen PS, Wisniewski HM. Plasma and cerebrospinal fluid levels of amyloid beta proteins 1-40 and 1-42 in Alzheimer disease. Arch Neurol 2000;57:100-5.
14. Sunderland T, Linker G, Mirza N, Putnam KT, Friedman DL, Kimmel LH,
References

C H A P T E R 2 0 • C E R E B R O S P I N A L F L U I D B I O M A R K E R S I N A D 277
et al. Decreased beta-amyloid1-42 and increased tau levels in cerebrospinal fluid of patients with Alzheimer disease. JAMA 2003;289:2094-103.
15. Ida N, Hartmann T, Pantel J, Schroder J, Zerfass R, Forstl H, et al. Analysis of heterogeneous A4 peptides in human cerebrospinal fluid and blood by a newly developed sensitive Western blot assay. J Biol Chem 1996;271:22908-14.
16. Schroder J, Pantel J, Ida N, Essig M, Hartmann T, Knopp MV, et al. Cerebral changes and cerebrospinal fluid beta-amy-loid in Alzheimer’s disease: a study with quantitative magnetic resonance imaging. Mol Psychiatry 1997;2:505-7.
17. Wiltfang J, Esselmann H, Bibl M, Smirnov A, Otto M, Paul S, et al. Highly conserved and disease-specific patterns of carboxyterminally truncated Abeta pep-tides 1–37/38/39 in addition to 1–40/42 in Alzheimer’s disease and in patients with chronic neuroinflammation. J Neurochem 2002;81:481-96.
18. Lewczuk P, Esselmann H, Meyer M, Wollscheid V, Neumann M, Otto M, et al. The amyloid-beta (Abeta) peptide pattern in cerebrospinal fluid in Alzheimer’s dis-ease: evidence of a novel carboxyterminally elongated Abeta peptide. Rapid Commun Mass Spectrom 2003;17:1291-6.
19. Vanmechelen E, Vanderstichele H, Davidsson P, Van Kerschaver E, Van Der Perre B, Sjogren M, et al. Quantification of tau phosphorylated at threonine 181 in human cerebrospinal fluid: a sandwich ELISA with a synthetic phosphopeptide for standardization. Neurosci Lett 2000; 285:49-52.
20. Ishiguro K, Ohno H, Arai H, Yamaguchi H, Urakami K, Park JM, et al. Phosphorylated tau in human cerebrospinal fluid is a diagnostic marker for Alzheimer’s disease. Neurosci Lett 1999;270:91-4.
21. Kohnken R, Buerger K, Zinkowski, R, Miller, C, Kerkman, D DeBernardis J, et.al. Detection of tau phosphorylated at threonine 231 in cerebrospinal fluid of Alzheimer’s disease patients. Neurosci Lett 2000;287:187-90.
22. Hu YY, He SS, Wang X, Duan QH, Grundke-Iqbal I, Iqbal K, et al. Levels of nonphosphorylated and phosphorylated tau in cerebrospinal fluid of Alzheimer’s disease patients : an ultrasensitive bienzyme-sub-strate-recycle enzyme-linked immunosorb-ent assay. Am J Pathol 2002;160:1269-78.
23. Hampel H, Buerger K, Zinkowski R, Teipel SJ, Goernitz A, Andreasen N, et al. Measurement of phosphorylated tau epitopes in the differential diagnosis of Alzheimer disease: a comparative cerebro-spinal fluid study. Arch Gen Psychiatry 2004;61:95-102.
24. Approved recommendation on the theory of reference values. Part 5. Statisti-cal treatment of collected reference values. Determination of reference limits. Clin Chem Lab Med 1987;170:13-32.
25. Otto M, Wiltfang J, Tumani H, Zerr I, Lantsch M, Kornhuber J, et al. Elevated levels of tau-protein in cerebrospinal fluid of patients with Creutzfeldt-Jakob disease. Neurosci Lett 1997;225:210-2.
26. Van Everbroeck B, Green AJ, Pals P, Martin JJ, Cras P. Decreased Levels of Amyloid-beta 1-42 in Cerebrospinal Fluid

D E M E N T I A – D I AG N O S T I C A N D T H E R A P E U T I C I N T E RV E N T I O N S278
of Creutzfeldt-Jakob Disease Patients. J Alzheimers Dis 1999;1:419-24.
27. Itoh N, Arai H, Urakami K, Ishiguro K, Ohno H, Hampel H, et al. Large-scale, multicenter study of cerebrospinal fluid tau protein phosphorylated at serine 199 for the antemortem diagnosis of Alzheimer’s disease. Ann Neurol 2001;50:150-6.
28. Kapaki E, Kilidireas K, Paraskevas GP, Michalopoulou M, Patsouris E. Highly increased CSF tau protein and decreased beta-amyloid (1–42) in sporadic CJD: a discrimination from Alzheimer’s disease? J Neurol Neurosurg Psychiatry 2001;71:401-3.
29. Otto M, Wiltfang J, Cepek L, Neumann M, Mollenhauer B, Steinacker P, et al. Tau protein and 14-3-3 protein in the differential diagnosis of Creutzfeldt-Jakob disease. Neurology 2002;58:192-7.
30. Van Everbroeck B, Green AJ, Vanmechelen E, Vanderstichele H, Pals P, Sanchez-Valle R, et al. Phosphorylated tau in cerebrospinal fluid as a marker for Creutzfeldt-Jakob disease. J Neurol Neurosurg Psychiatry 2002;73:79-81.
31. Riemenschneider M, Wagenpfeil S, Vanderstichele H, Otto M, Wiltfang J, Kretzschmar H, et al. Phospho-tau/total tau ratio in cerebrospinal fluid discrimi-nates Creutzfeldt-Jakob disease from other dementias. Mol Psychiatry 2003;8:343-7.
32. Zetterberg H, Blennow K. Elevated total tau/phospho-tau ratio in autopsy-proven Creutzfeldt-Jakob disease with negative 14-3-3 test results. Neurol Sci 2004;25:301-2.
33. Lopez OL, Becker JT, Kaufer DI, Hamilton RL, Sweet RA, Klunk W, et al. Research evaluation and prospective dia-gnosis of dementia with Lewy bodies. Arch Neurol 2002;59:43-6.
34. Jellinger KA. Diagnostic accuracy of Alzheimer’s disease: a clinicopatho-logical study. Acta Neuropathol (Berl) 1996;91:219-20.
35. Kosunen O, Soininen H, Paljarvi L, Heinonen O, Talasniemi S, Riekkinen PJ, Sr. Diagnostic accuracy of Alzheimer’s disease: a neuropathological study. Acta Neuropathol (Berl) 1996;91:185-93.
36. Andreasen N, Vanmechelen E, Van de Voorde A, Davidsson P, Hesse C, Tarvonen S, et al. Cerebrospinal fluid tau protein as a biochemical marker for Alzheimer’s dis-ease: a community based follow up study. J Neurol Neurosurg Psychiatry 1998;64: 298-305.
37. Sjogren M, Minthon L, Davidsson P, Granerus AK, Clarberg A, Vanderstichele H, et al. CSF levels of tau, beta-amyloid (1–42) and GAP-43 in frontotemporal dementia, other types of dementia and normal aging. J Neural Transm 2000; 107:563-79.
38. Sjogren M, Davidsson P, Tullberg M, Minthon L, Wallin A, Wikkelso C, et al. Both total and phosphorylated tau are increased in Alzheimer’s disease. J Neurol Neurosurg Psychiatry 2001;70:624-30.
39. Sjogren M, Davidsson P, Gottfries J, Vanderstichele H, Edman A, Vanmechelen E, et al. The cerebrospinal fluid levels of tau, growth-associated protein-43 and

C H A P T E R 2 0 • C E R E B R O S P I N A L F L U I D B I O M A R K E R S I N A D 279
soluble amyloid precursor protein correlate in Alzheimer’s disease, reflecting a com-mon pathophysiological process. Dement Geriatr Cogn Disord 2001;12:257-64.
40. Riemenschneider M, Wagenpfeil S, Diehl J, Lautenschlager N, Theml T, Heldmann B, et al. Tau and Abeta42 pro-tein in CSF of patients with frontotemporal degeneration. Neurology 2002;58:1622-8.
41. Sjogren M, Davidsson P, Wallin A, Granerus AK, Grundstrom E, Askmark H, et al. Decreased CSF-beta-amyloid 42 in Alzheimer’s disease and amyotrophic lateral sclerosis may reflect mismetabo-lism of beta-amyloid induced by disparate mechanisms. Dement Geriatr Cogn Disord 2002;13:112-8.
42. Gomez-Tortosa E, Gonzalo I, Fanjul S, Sainz MJ, Cantarero S, Cemillan C, et al. Cerebrospinal fluid markers in dementia with lewy bodies compared with Alzheimer disease. Arch Neurol 2003;60:1218-22.
43. Kapaki E, Paraskevas GP, Zalonis I, Zournas C. CSF tau protein and beta-amy-loid (1–42) in Alzheimer’s disease diagno-sis: discrimination from normal ageing and other dementias in the Greek population. Eur J Neurol 2003;10:119-28.
44. Wallin A, Sjogren M, Blennow K, Davidsson P. Decreased cerebrospinal fluid acetylcholinesterase in patients with subcor-tical ischemic vascular dementia. Dement Geriatr Cogn Disord 2003;16:200-7.
45. Andreasen N, Minthon L, Clarberg A, Davidsson P, Gottfries J, Vanmechelen E, et al. Sensitivity, specificity, and stability of CSF-tau in AD in a community-based pa-tient sample. Neurology 1999;53:1488-94.
46. Arai H, Terajima M, Miura M, Higuchi S, Muramatsu T, Machida N, et al. Tau in cerebrospinal fluid: a potential diagnostic marker in Alzheimer’s disease. Ann Neurol 1995;38:649-52.
47. Arai H, Satoh-Nakagawa T, Higuchi M, Morikawa Y, Miura M, Kawakami H, et al. No increase in cerebrospinal fluid tau protein levels in patients with vascular dementia. Neurosci Lett 1998;256:174-6.
48. Galasko D, Chang L, Motter R, Clark CM, Kaye J, Knopman D, et al. High cere-brospinal fluid tau and low amyloid beta42 levels in the clinical diagnosis of Alzheimer disease and relation to apolipoprotein E genotype. Arch Neurol 1998;55:937-45.
49. Kanai M, Matsubara E, Isoe K, Urakami K, Nakashima K, Arai H, et al. Longitudinal study of cerebrospinal fluid levels of tau, A beta1-40, and A beta1-42(43) in Alzheimer’s disease: a study in Japan. Ann Neurol 1998;44:17-26.
50. Mecocci P, Cherubini A, Bregnocchi M, Chionne F, Cecchetti R, Lowenthal DT, et al. Tau protein in cerebrospinal fluid: a new diagnostic and prognostic marker in Alzheimer disease? Alzheimer Dis Assoc Disord 1998;12:211-4.
51. Shoji M, Matsubara E, Kanai M, Watanabe M, Nakamura T, Tomidokoro Y, et al. Combination assay of CSF tau, A beta 1–40 and A beta 1–42(43) as a biochemical marker of Alzheimer’s disease. J Neurol Sci 1998;158:134-40.
52. Nishimura T, Takeda M, Nakamura Y, Yosbida Y, Arai H, Sasaki H, et al. Basic and clinical studies on the measurement of tau protein in cerebrospinal fluid as a

D E M E N T I A – D I AG N O S T I C A N D T H E R A P E U T I C I N T E RV E N T I O N S280
biological marker for Alzheimer’s disease and related disorders: multicenter study in Japan. Methods Find Exp Clin Pharmacol 1998;20:227-35.
53. Hulstaert F, Blennow K, Ivanoiu A, Schoonderwaldt HC, Riemenschneider M,
De Deyn PP, et al. Improved discrimina-tion of AD patients using beta-amyloid(1-42) and tau levels in CSF. Neurology 1999;52:1555-62.
54. Kahle PJ, Jakowec M, Teipel SJ, Hampel H, Petzinger GM, Di Monte DA, et al. Combined assessment of tau and neu-ronal thread protein in Alzheimer’s disease CSF. Neurology 2000;54:1498-504.
55. Kanemaru K, Kameda N, Yamanouchi H. Decreased CSF amyloid beta42 and normal tau levels in dementia with Lewy bodies. Neurology 2000;54:1875-6.
56. Sjogren M, Rosengren L, Minthon L, Davidsson P, Blennow K, Wallin A. Cytoskeleton proteins in CSF distin-guish frontotemporal dementia from AD. Neurology 2000;54:1960-4.
57. Rosler N, Wichart I, Jellinger KA. Clinical significance of neurobiochemical profiles in the lumbar cerebrospinal fluid of Alzheimer’s disease patients. J Neural Transm 2001;108:231-46.
58. Buerger K, Zinkowski R, Teipel SJ, Tapiola T, Arai H, Blennow K, et al. Dif-ferential diagnosis of Alzheimer disease with cerebrospinal fluid levels of tau pro-tein phosphorylated at threonine 231. Arch Neurol 2002;59:1267-72.
59. Shoji M, Matsubara E, Murakami T, Manabe Y, Abe K, Kanai M, et al. Cere-brospinal fluid tau in dementia disor-
ders: a large scale multicenter study by a Japanese study group. Neurobiol Aging 2002;23:363-70.
60. Kurz A, Riemenschneider M, Buch K, Willoch F, Bartenstein P, Muller U, et al. Tau protein in cerebrospinal fluid is signifi-cantly increased at the earliest clinical stage of Alzheimer disease. Alzheimer Dis Assoc Disord 1998;12:372-7.
61. Burger née Buch K, Padberg F, Nolde T, Teipel SJ, Stubner S, Haslinger A, et al. Cerebrospinal fluid tau protein shows a better discrimination in young old (<70 years) than in old old patients with Alzhe-imer’s disease compared with controls. Neurosci Lett 1999;277:21-4.
62. Hampel H, Teipel SJ, Padberg F, Haslinger A, Riemenschneider M, Schwarz MJ, et al. Discriminant power of combined cerebrospinal fluid tau protein and of the soluble interleukin-6 receptor complex in the diagnosis of Alzheimer’s disease. Brain Res 1999;823:104-12.
63. Morikawa Y, Arai H, Matsushita S, Kato M, Higuchi S, Miura M, et al. Cerebrospinal fluid tau protein levels in demented and nondemented alcoholics. Alcohol Clin Exp Res 1999;23: 575-7.
64. Mulder C, Schoonenboom SN, Wahlund LO, Scheltens P, van Kamp GJ, Veerhuis R, et al. CSF markers related to pathogenetic mechanisms in Alzheimer’s disease. J Neural Transm 2002;109:1491-8.
65. Maruyama M, Arai H, Sugita M, Tanji H, Higuchi M, Okamura N, et al. Cerebrospinal fluid amyloid beta(1-42) levels in the mild cognitive impairment stage of Alzheimer’s disease. Exp Neurol 2001;172:433-6.

C H A P T E R 2 0 • C E R E B R O S P I N A L F L U I D B I O M A R K E R S I N A D 281
66. Maddalena A, Papassotiropoulos A, Muller-Tillmanns B, Jung HH, Hegi T, Nitsch RM, et al. Biochemical diagnosis of Alzheimer disease by measuring the cer-ebrospinal fluid ratio of phosphorylated tau protein to beta-amyloid peptide42. Arch Neurol 2003;60:1202-6.
67. Andreasen N, Hesse C, Davidsson P, Minthon L, Wallin A, Winblad B, et al. Cerebrospinal fluid beta-amyloid(1-42) in Alzheimer disease: differences between early- and late-onset Alzheimer disease and stability during the course of disease. Arch Neurol 1999;56:673-80.
68. Parnetti L, Lanari A, Amici S, Gallai V, Vanmechelen E, Hulstaert F. CSF phosphorylated tau is a possible marker for discriminating Alzheimer’s disease from dementia with Lewy bodies. Phospho-Tau International Study Group. Neurol Sci 2001;22:77-8.
69. Andreasen N, Gottfries J, Vanmechelen E, Vanderstichele H, Davidson P, Blennow K, et al. Evaluation of CSF biomarkers for axonal and neuronal degeneration, gliosis, and beta-amyloid metabolism in Alzheim-er’s disease. J Neurol Neurosurg Psychiatry 2001;71:557-8.
70. Takeda M, Tanaka, T, Arai H, Sasaki, H, Shoji, M, Okamoto, K. Basic and clinical studies on the measure-ment of b-amyloid (1–42) in cerebrospinal fluid as a diagnostic marker for Alzheimer’s disease and related disorders: multi center study in Japan. Psychogeriatrics 2001;1: 56-63.
71. Galasko D, Clark C, Chang L, Miller B, Green RC, Motter R, et al. Assessment of CSF levels of tau protein in mildly de-
mented patients with Alzheimer’s disease. Neurology 1997;48:632-5.
72. Riemenschneider M, Buch K, Schmolke M, Kurz A, Guder WG. Cerebrospinal protein tau is elevated in early Alzheimer’s disease. Neurosci Lett 1996;212:209-11.
73. Arai H, Ishiguro K, Ohno H, Moriyama M, Itoh N, Okamura N, et al. CSF phosphorylated tau protein and mild cognitive impairment: a prospective study. Exp Neurol 2000;166:201-3.
74. Andreasen N, Vanmechelen E, Vanderstichele H, Davidsson P, Blennow K. Cerebrospinal fluid levels of total-tau, phospho-tau and A beta 42 predicts devel-opment of Alzheimer’s disease in patients with mild cognitive impairment. Acta Neurol Scand Suppl 2003;179:47-51.
75. Gottfries J, Blennow K, Lehmann MW, Regland B, Gottfries CG. One- carbon metabolism and other biochem- ical correlates of cognitive impairment as visualized by principal component analysis. J Geriatr Psychiatry Neurol 2001;14:109-14.
76. Arai H, Nakagawa, T, Kosaka, Y, Higuchi, M, Matsui, T, Okamura, N, et al. Elevated cerebrospinal fluid tau protein level as a predictor of dementia in memory- impaired patients. Alzheimer’s Res 1997; 3:211-213.
77. Andreasen N, Minthon L, Vanmechelen E, Vanderstichele H, Davidsson P, Winblad B, et al. Cerebrospinal fluid tau and Abeta42 as predictors of development of Alzheimer’s disease in patients with mild cognitive im- pairment. Neurosci Lett 1999;273:5-8.

D E M E N T I A – D I AG N O S T I C A N D T H E R A P E U T I C I N T E RV E N T I O N S282
78. Riemenschneider M, Lautenschlager N, Wagenpfeil S, Diehl J, Drzezga A, Kurz A. Cerebrospinal fluid tau and beta-amyloid 42 proteins identify Alzheimer disease in subjects with mild cognitive impairment. Arch Neurol 2002;59:1729-34.
79. Saez-Valero J, Fodero LR, Sjogren M, Andreasen N, Amici S, Gallai V, et al. Glycosylation of acetylcholinesterase and butyrylcholinesterase changes as a function of the duration of Alzheimer’s disease. J Neurosci Res 2003;72:520-6.
80. Green AJ, Harvey RJ, Thompson EJ, Rossor MN. Increased tau in the cerebro-spinal fluid of patients with frontotemporal dementia and Alzheimer’s disease. Neurosci Lett 1999;259:133-5.
81. Rosso SM, van Herpen E, Pijnenburg YA, Schoonenboom NS, Scheltens P, Heutink P, et al. Total tau and phospho-rylated tau 181 levels in the cerebrospinal fluid of patients with frontotemporal dementia due to P301L and G272V tau mutations. Arch Neurol 2003;60:1209-13.
82. Fabre SF, Forsell C, Viitanen M, Sjogren M, Wallin A, Blennow K, et al. Clinic-based cases with frontotemporal de-mentia show increased cerebrospinal fluid tau and high apolipoprotein E epsilon4 frequency, but no tau gene mutations. Exp Neurol 2001;168:413-8.
83. Kudo T, Mima T, Hashimoto R, Nakao K, Morihara T, Tanimukai H, et al. Tau protein is a potential biological marker for normal pressure hydrocephalus. Psychiatry Clin Neurosci 2000;54:199-202.
84. Tullberg M, Mansson JE, Fredman P, Lekman A, Blennow K, Ekman R, et al. CSF sulfatide distinguishes between nor-mal pressure hydrocephalus and subcortical arteriosclerotic encephalopathy. J Neurol Neurosurg Psychiatry 2000;69:74-81.
85. Kapaki E, Paraskevas GP, Michalopoulou M, Kilidireas K. Increased cerebrospinal fluid tau protein in multiple sclerosis. Eur Neurol 2000;43:228-32.86. Holmberg B, Johnels B, Blennow K, Rosengren L. Cerebrospinal fluid Abeta42 is reduced in multiple system atrophy but normal in Parkinson’s disease and pro-gressive supranuclear palsy. Mov Disord 2003;18:186-90.
87. Urakami K, Wada K, Arai H, Sasaki H, Kanai M, Shoji M, et al. Diagnostic significance of tau protein in cerebrospi-nal fluid from patients with corticobasal degeneration or progressive supranuclear palsy. J Neurol Sci 2001;183:95-8.
88. Rosler N, Wichart I, Jellinger KA. Total tau protein immunoreactivity in lumbar cerebrospinal fluid of patients with Alzheimer’s disease. J Neurol Neurosurg Psychiatry 1996;60:237-8.
89. Buerger K, Zinkowski R, Teipel SJ, Arai H, DeBernardis J, Kerkman D, et al. Differentiation of geriatric major depres-sion from Alzheimer’s disease with CSF tau protein phosphorylated at threonine 231. Am J Psychiatry 2003;160:376-9.
90. Schonknecht P, Pantel J, Hartmann T, Werle E, Volkmann M, Essig M, et al. Cerebrospinal fluid tau levels in Alzheim-

C H A P T E R 2 0 • C E R E B R O S P I N A L F L U I D B I O M A R K E R S I N A D 283
er’s disease are elevated when compared with vascular dementia but do not corre-late with measures of cerebral atrophy. Psychiatry Res 2003;120:231-8.
91. Otto M, Esselmann H, Schulz-Shaeffer W, Neumann M, Schroter A, Ratzka P, et al. Decreased beta-amyloid1-42 in cerebro-spinal fluid of patients with Creutzfeldt-Ja-kob disease. Neurology 2000;54:1099-102.
92. Olsson A, Vanderstichele H, Andreasen N, de Meyer G, Wallin A, Holmberg B et al. Simultaneous measurement of ß – amyloid (1–42), tau and phosphorylated tau (Thr181) in cerebrospinal fluid by the xMAP technology. Clin Chem 2005;51: 336-45.
93. Vanderstichele H, de Meyer G, Andreasen N, Kostanjevecki V, Wallin A, Olson A et al. CSF amino-modified ß – amyloid 42 peptides and prediction of progression of mild cognitive impairment. Clin Chem 2005;51:1650-60.
94. Buerger K, Otto M, Twipel S, Zinkowski R, Blennow K, DeBernardis J et al. Dissociation between CSF total tau and tau protein phosphorylated at
threonine 231 in Creutzfeldt-Jakob disease. Neurobiol Aging 2006;27:10-5.
95. Blennow K, Johansson A, Zetterberg H. Diagnostic value of 14-3-3beta immu-noblot and T-tau/P-tau ratio in clinically suspected Creutzfeldt-Jakob disease. Int J Mol Med 2005;16:1147-9.
96. Hansson O, Zetterberg H, Buchhave P, Londos E, Blennow K, Minthon L. Association between CFS biomarkers and incipient Alzheimer’s disease in patients with mild cognitive impairment: a follow-up study. Lancet Neurol 2006;5:228-34.
97. Vanderstichele H, De Vreese K, Blennov K, Andreasen N, Sindic C, Ivanoui A et al. Analytical performance and clinical utility of INNOTEST PHOS-PHU-TAU (181P) for alzheimer’s disease and dementia with Lewy bodies. Clin Chem Lab Med 2006;44:1472-80.
98. de Jong D, Jansen RW, Kremer BP, Verbeek MM. Cerebrospinal fluid amyloid beta42/phosphorylated tau ration dis- criminates between Alzheimer’s disease and vascular dementia. J Gerontol A Biol Sci Med Sci. 2006;61:755-8.


C H A P T E R 2 1 • I N T E RV E N T I O N S I N D E M E N T I A D I S O R D E R S 285
21. Interventions in Dementia Disorders
Background
Treatment of dementia is defined as any planned action to improve func-tion, symptoms or other aspects of a dementia disorder, such as quality of life and economic consequences.
From a broad perspective, the treatment of cognitive decline in demen-tia can be described in terms of prevention (Figure 21.1). Primary prevention may be defined as averting a shift from normal cognitive functioning to a state of mild cognitive impairment (MCI). Secondary prevention is aimed at preventing or postponing a shift to cognitive impairment that is sufficient for a diagnosis of dementia. Tertiary pre-vention includes the treatment of manifest dementia. Primary prevention is included in the chapter on risk factors for dementia. This section on interventions focuses on tertiary prevention only, as well as other consi-derations in treating manifest dementia.
Normal cognitive MCI Dementia functioning
Ò Ò Ò Primary Secondary Tertiary prevention prevention prevention
Figure 21.1 Forms of prevention.
One important aspect of intervention concerns pharmacological stra-tegies to improve cognitive function. The negative impact of drugs on cognitive function is another important aspect, as are depression and behavioral and psychological symptoms in dementia (BPSD).

D E M E N T I A – D I AG N O S T I C A N D T H E R A P E U T I C I N T E RV E N T I O N S286
The environment also has an impact on the function of a person with dementia. Thus, strategies to adapt interpersonal communication or the physical environment to counteract some of the reduced function are important aspects of treatment.
Both pharmacological treatment and environmental intervention may influence function in dementia, though normally in different – someti-mes complementary – ways. The relationship between environment and function is important, and different symptoms may be influenced by different intervention strategies.
A pharmacological study will lead to environmental changes, paying more attention to wellbeing, testing and regular visits. That is the only difference for the placebo group, while the treatment group is affected by the drug treatment as well.
Thus, interventions in dementia disorders include a variety of strategies, both pharmacological and non-pharmacological. An intervention can have a multifaceted impact, including cognitive function, non-cogni-tive symptoms, ADL functions, resource utilization and quality of life. Among the targets of an intervention may be biological functions of the brain, personal wellbeing and social performance, as well as existential questions and ethical considerations.
Questions of interest
The main questions of interest concerning interventions in dementia were framed as follows:
Questions regarding pharmacological interventions:
• What drugs have been tested for interventions in cognitive and non-cognitive disturbances in AD; VaD and other dementia disorders?
• What drugs have a significant impact on cognitive disturbances (defined as ADL functions, global scales, etc)?

C H A P T E R 2 1 • I N T E RV E N T I O N S I N D E M E N T I A D I S O R D E R S 287
• What drugs have a significant impact on non-cognitive disturbances (such as depression or quality of life)?
• What are the effects of drug treatment at different stages (mild, moderate, severe) of AD?
• Can drugs cause states of confusion (delirium) (with or without dementia)?
Specific questions regarding non-pharmacological interventions:
• What types of interventions in the physical environment have a relevant clinical effect in terms of patient outcome; day care, caregi-ver support, dementia-specific residential accommodations, nursing homes?
• Is there evidence for the impact of non-pharmacological intervention, such as reality orientation, validation, reminiscence therapy, music, dance, tactile massage, caring activities that promote integrity, mental training, physical activities, communication, debriefing and coping strategies?
• Is there evidence for the impact of professional caregiver support, such as education and instructions?
• Is there evidence for informal caregiver interventions, such as educa-tion, support, coping and dementia teams?
Study quality and levels of evidence
All included quantitative studies were analyzed for quality with regard to the reporting of specific aspects. On a general level, the study analysis concerned external validity, internal validity and precision. Included studies were rated on the basis of specific criteria as high, moderate or limited quality. Using a checklist, members of the project group inde-pendently rated each study. They did not assess their own published studies.

D E M E N T I A – D I AG N O S T I C A N D T H E R A P E U T I C I N T E RV E N T I O N S288
Given the quantitative studies included, the scientific evidence was assigned one of four evidence grades:
Evidence Grade 1, strong scientific evidence: Based on two or more RCTs of high quality or one systematic review based on RCTs of high quality, with all studies having the same orien-tation.
Evidence Grade 2, moderate scientific evidence:One study of high quality and at least one study of medium quality, or three or more studies of medium quality, or a meta-analysis of studies of medium quality, with all studies having the same orientation.
Evidence Grade 3, limited scientific evidence:Two studies of medium quality, with all studies having the same orien-tation.
Insufficient evidence:None of above.
Methodological aspects of pharmacological studies
Selection and settingThe results of a study should be generalizable, ie the effects in the study population should hold true in any other population with the same diagnosis (high external validity). However, patients in clinical trials are highly selected with respect to both inclusion and exclusion crite-ria. They commonly come from a university hospital memory clinic. Furthermore, they have dedicated caregivers with expected high comp-liance and a low rate of non-cognitive symptoms (BPSD) that interfere with participation. They have a “pure” diagnosis, fewer other concomi-tant medical conditions and less medication. The results of the various trials must also be evaluated in light of the different settings, whether

C H A P T E R 2 1 • I N T E RV E N T I O N S I N D E M E N T I A D I S O R D E R S 289
memory clinics in Western Europe, nursing homes in the United States or institutions in other parts of the world.
Thus, a study population differs from a “clinical” population. However, how that may affect the results is difficult to assess. On one hand, the expected prognosis may be more favorable than for patients with demen-tia disease in general. On the other hand, patients with more rapid pro- gression and thus a more unfavorable prognosis may be more inclined to go to a specialized memory clinic, so that their expected prognosis would be more favorable than for patients with dementia diseases in general.
Which patients were included in the efficacy analyses: ITT, ITT-LOCF or OC?In all studies, some patients will drop out at some point and some will not. Dropouts stand out in several respects, including non-response to treatment, adverse events, impaired compliance due to BPSD or care-giver-related factors and severe disease. Analysis based on ITT (inten-tion-to-treat) populations include all randomised patients (regardless of whether they dropped out or not) who received at least one dose of study medication and had at least one assessment after baseline while taking the medication. Many publications also show the results of ITT-LOCF analyses (Last Observation Carried Forward). This method replaces the results of a missing scheduled assessment with those of the immediately preceding assessment, provided that the patient was still on treatment at that time. For instance, if patients drop out before the study end at 6 months, their results from the previous assessment at 3 months are carried forward to the final analysis. Because dementia patients are expected to deteriorate over time, ITT-LOCF analyses underestimate the expected decline. That is a minor problem if patients in the active and placebo group drop out of the study at similar times. However, in the case of frequent early dropouts due to a higher rate of adverse events in patients receiving active treatment, and frequent late dropouts due to lack of efficacy in placebo patients, ITT-LOCF analyses may yield a false, excessively high, favorable impact of active treatment. Conversely, ITT-LOCF analyses do not differ substantially from ITT analyses if the

D E M E N T I A – D I AG N O S T I C A N D T H E R A P E U T I C I N T E RV E N T I O N S290
rates and times of discontinuation due to adverse events are similar in the active treatment and placebo groups. A retrieved dropout analysis (RDO) would be preferable, but the motivation to participate in fol-low-up studies is lower among patients with diseases that are gradually becoming more severe, so that they do not attend the follow-ups.
In contrast to ITT analyses, analyses of the OC population (observed cases, or TPP, treated per protocol) refer to all randomised patients who were still on treatment at the designated assessment time, such as at the end of the study. Thus, the analyses exclude all patients who dropped out due to adverse effects, lack of efficacy or other reasons. Thus, OC analyses are based on selected patients and do not reflect how all ran-domised patients responded. In the case of a large dropout rate due to adverse effects in the group receiving active treatment, OC results yield a false, excessively favorable impression of the active compound.
In summary, the efficacy results in each trial must be assessed in terms of the types of patients who participated, the number of – and reasons for – dropouts, and the rate of adverse events.
Long-term effects
In order to analyze the effects of any intervention in dementia (or other incurable, chronic, progressive disorders, such as diabetes and rheuma-toid arthritis), the entire course of the disease should ideally be covered, from the early signs to death. There are two reasons for this theoretical position. First, early interventions may influence survival in a way that is of interest for analytical purposes. Second, there may be transitions of outcomes during the course of the disease. Thus, the desirable time frame for the analysis might be 10–15 years or more. Due to practical (and perhaps ethical) considerations, it is difficult to maintain an RCT design for patients who have dementia disorders for extended periods of time. Thus, if describing long-term effects is of interest, alternative designs must be used even if validity in terms of evidence is poorer. In the case of open follow-up studies, or pragmatic design, longer periods of empirical data may be used. Due to selection effects, high attrition and problems in finding controls, such studies are subject to certain

C H A P T E R 2 1 • I N T E RV E N T I O N S I N D E M E N T I A D I S O R D E R S 291
limitations such that whether they may be regarded as controlled beco-mes questionable. Observational studies are by definition uncontrolled, and how patients are selected for treatment or comparison groups is insufficiently known. Models can describe potential long-term effects, and their sensitivity analyses can examine various effects. But such studies are not ultimately empirical. Meta-analysis and sequence-ana-lysis (which incorporates studies covering different stages of dementia) may be an option, but the selection of studies is crucial. To sum up, no ideal method exists for describing long term-effects, so that a synthetic approach using a variety of designs may be needed.
Concepts of care
Interventions in dementia consist of both pharmacological and non-pharmacological strategies. This report follows that structure in order to identify evidence based on assessments of published scientific studies.
Because biological changes differ among various dementia disorders, the effects of pharmacological interventions might be specific to a particular diagnosis. Some pharmacological interventions, and a majority of non-pharmacological interventions, are valid for a broad range of disorders. Thus, the need for specification of the diagnosis differs among various types of intervention.
Different kinds of social programs/environmental interventions and care concepts have been used in dementia care for several decades. The concepts refer to a variety of interventions, such as day care, caregiver support/counseling and long-term care (LTC)/housing programs. Due to the heterogeneity of such programs, formulating a general statement about them is often difficult. Furthermore, the programs must also be seen in the light of their social context. It may be of interest to study the effects of institutions, such as caregiver time by professional staff, or of emergency hospital care. Following is a brief presentation of different programs. The programs may be the aim of the studies, but they may also form the basis for evaluating various intervention settings.

D E M E N T I A – D I AG N O S T I C A N D T H E R A P E U T I C I N T E RV E N T I O N S292
Quality of lifeQuality of life (QOL) is regarded as one of the most important and clinically most relevant outcomes when analyzing interventions in dementia care [1].
The QOL dimension encompasses physical health, functional status, psychological and cognitive health, social wellbeing, etc [2]. The assess-ment of QOL in dementia has its own special difficulties. Assessments of QOL are normally self-rated, but that is often impossible to achieve in the case of dementia, so that the results – such as the subjective well-being of the patient as compared to the views of proxies – may be unre-liable [3]. Alternatively, or as a complement, observations of the patient’s behavior can be used [4].

C H A P T E R 2 1 • I N T E RV E N T I O N S I N D E M E N T I A D I S O R D E R S 293
1. Winblad B, Hill S, Beermann B, Post SG, Wimo A. Issues in the economic evaluation of treatment for dementia. Posi-tion paper from the International Working Group on Harmonization of Dementia Drug Guidelines. Alzheimer Dis Assoc Disord 1997;11(Suppl 3):39-45.
2. Winblad B, Wimo A, Almkvist O. Out-come measures in Alzheimer’s disease: do they go far enough? Dement Geriatr Cogn Disord 2000;11 Suppl 1:310.
3. Jönsson L. Economic evaluation of treatments for Alzheimer’s disease. Stockholm: Karolinska Institutet; 2003.
4. Albert SM, Del Castillo- Castaneda C, Sano M, Jacobs DM, Marder K, Bell K, et al. Quality of life in patients with Alzheimer’s disease as reported by patient proxies. J Am Geriatr Soc 1996; 44:1342-7.
References


C H A P T E R 2 2 • P H A R M AC O LO G I C A L T R E AT M E N T O F D E M E N T I A – E S TA B L I S H E D D R U G S
295
22. Pharmacological Treatment of Dementia – Established Drugs
Conclusions
The following may be concluded on the basis of this systematic review of randomised, placebo-controlled clinical trials:
There is moderately strong evidence that treatment with donepezil for 6–12 months and with galantamine for 6 months improves or maintains global function in Alzheimer’s disease (AD) with mild to moderate de- mentia. The effect can be expressed as a mean rate of stabilization or improvement of symptoms in 57–75% of patients with active treatment, as opposed to 42–56% of placebo patients.
There is moderately strong evidence of limited effects on cognitive per- formance after 6 months of donepezil, rivastigmine or galantamine treat- ment (12 months as well when it comes to donepezil). The magnitude of the effect is 1 to 1.5 points better on the Mini-mental state examination (MMSE).
There is limited evidence that treatment with memantine for 6 months has some effect in improving or maintaining global and cognitive func-tion in AD with moderate to severe dementia (MMSE 3–14 points).
Patients with AD and concomitant cerebrovascular respond similarly to treatment as patients with pure AD. The efficacy of acetylcholinesterase inhibitors in patients with pure VaD is small.
There is moderately strong evidence that memantine treatment is equi-valent to placebo with respect to global function in VaD. The small positive effect that memantine has on the cognitive function of these patients is considered to be of doubtful clinical value.

D E M E N T I A – D I AG N O S T I C A N D T H E R A P E U T I C I N T E RV E N T I O N S296
Adverse eventsWith the exception of donepezil 5 mg daily, there is moderately strong evidence that nausea and vomiting are more common in patients recei-ving acetylcholinesterase inhibitors than placebo. Adverse events are generally mild and transient.
There is strong evidence that rates of adverse events are equal in treat-ment with memantine 20 mg daily and placebo.
Other conclusionsThe patient and his/her caregiver/informant must be motivated to make follow-up appointments. Impressions of global and cognitive function (MMSE) should be documented before treatment starts.
The short-term purpose of treatment is an improvement in or mainte-nance of functions over several months. The long-term treatment is to slow the rate of deterioration. If those goals are not achieved, treatment should be interrupted.
The deterioration rate in patients who were treated with placebo and who completed the trials was slower than previously assumed about the natural course of AD. That may be due to the selection of patients or to the effects of participation in a clinical trial.
Enhancing acetylcholinergic transmission would enhance alertness. This effect may be reflected as an increased ability to focus and thus to perform better on cognitive tests dealing with immediate memory and recall, as well as improved initiation and participation in ADL and social activities. However, the effects compared to placebo are small. Further-more, rates of progression in AD are highly variable and functions may even be preserved over several months in untreated patients. In other words, the effects may be difficult to determine for the individual patient.
For all trials that compared rivastigmine with placebo, discontinuation due to adverse events was more common in patients who received active

C H A P T E R 2 2 • P H A R M AC O LO G I C A L T R E AT M E N T O F D E M E N T I A – E S TA B L I S H E D D R U G S
297
treatment. That can be partly avoided by means of a slower dose titra-tion rate.
Only one study found a beneficial effect of combining memantine and donepezil as opposed to monotherapy. Thus, no evidence may currently be adduced.
Regarding potential effects on behavioral disturbances and psychologi-cal symptoms, the results of trials on acetylcholinesterase inhibitors and memantine are conflicting. There is a lack of studies that specifically address this issue.
Background
Currently (July 2004), 4 agents are registered in Sweden with sympto-matic treatment of dementia as a primary target. Donepezil (Aricept), rivastigmine (Exelon), and galantamine (Reminyl) are acetylcholines-terase inhibitors indicated for mild to moderate dementia due to AD. Memantine (Ebixa) is indicated for moderate to severe dementia due to Alzheimer’s disease (AD).
Acetylcholinesterase inhibitors (AChEIs)Among the widespread neuronal damage and neurotransmitter losses in AD are cholinergic neurons. Based on the cholinergic deficit hypothesis, one therapeutic strategy has been to enhance cholinergic neurotransmis-sion by using acetylcholinesterase inhibitors to delay the breakdown of acetylcholine released into synaptic clefts. A pilot study published in 1986 showed the benefits of treatment with the acetylcholinesterase in- hibitor tetrahydroamminoacridine (THA, tacrine) [1], which later be- came the first agent registered for treatment of mild to moderate AD in Sweden (1995). However, the benefits of tacrine in clinical practice were small, due to a high frequency of adverse effects, including vomit-ing and hepatotoxicity, and it was withdrawn a few years later. Several other acetylcholinesterase inhibitors – including oral physostigmine, metrifonate, and eptastigmine – have been investigated in clinical trials but have not been approved by the regulatory authorities. The results of

D E M E N T I A – D I AG N O S T I C A N D T H E R A P E U T I C I N T E RV E N T I O N S298
these studies have been reviewed elsewhere [2,3]. Donepezil (Aricept, registered in 1997) was the first, second-generation acetylcholinesterase inhibitor that is selective to the central nervous system. It was followed by rivastigmine (Exelon, registered in 1998) which is an inhibitor of acetyl- and butyrylcholinesterase, and by galantamine (Reminyl, regi-stered in 2000), which also acts as a modulator at nicotinic cholinergic receptor sites.
MemantineThe excitatory activity of L-glutamate plays a role in the pathogenesis of AD and in the damage caused by ischemic brain lesions. Memantine (Ebixa, registered in 2002) is a low affinity antagonist to N-Methyl-D-aspartate (NMDA) type receptors intended to prevent excitatory amino acid neurotoxicity while not interfering with the physiological action of glutamate that is required for memory and learning.
Aim
The aim of this review is to assess the extent to which these compounds improve the wellbeing of patients with dementia due to AD and with other dementia disorders. At the time of the literature search, there were no published studies on AD patients with mild cognitive impairment.
Methods
Strategy for searching the literatureMedline (1970 through July 1, 2004) was searched on “donepezil”, “rivastigmine”, “galantamine”, and “memantine” for all RCTs published in English. As a second step, Medline was searched without limiting it to these four agents. Additional references and data from unpublished studies were collected from the Cochrane reviews, most recent amend-ments, September 2003 [4–7]. Data on efficacy measurements and adverse events were gathered from both the original publications and the Cochrane reviews, after which they were checked for agreement.

C H A P T E R 2 2 • P H A R M AC O LO G I C A L T R E AT M E N T O F D E M E N T I A – E S TA B L I S H E D D R U G S
299
Included trials: Acetylcholinesterase inhibitors in ADThe majority of the hits in the literature search were discarded because they did not meet the quality criteria. Many were open-label extension studies. With this design, all patients that remain at the end of the double-blind phase are offered treatment with the active drug. During the extension phase, patients are compared to a fictive placebo group based on calculations of the disease progression or on historical controls. Thus, the design does not allow for an efficacy evaluation given that the patients are not randomised and the treatments are not concealed. Furthermore, patients are highly selected. Only double-blind, placebo-controlled RCTs were included in this review. All were rated as either high or medium quality. Almost all were multicenter studies, and all were parallel, with the exception of one that had a crossover design. All studies defined AD according to at least one of the following criteria: NINCDS-ADRDA, ICD-10 and DSM-III, DSM-III-R or DSM-IV. Other inclusion criteria varied, but the most recent studies on mild to moderate dementia patients state that CT or MR should be consistent with a diagnosis of AD, and a modified Hachinski ischemic score <5 was commonly used to further differentiate AD from VaD [8]. Mild to moderate dementia was defined as CDR 1 to 2, with most patients in CDR 1, and/or as MMSE 10 to 26 p or narrower. Most studies sta-ted that they only included patients with a reliable caregiver who could monitor medications, report AEs and attend evaluations of ADL. Infor-mation on AEs was collected by questioning the caregiver at each assess-ment, but the papers rarely described this procedure in detail.
Donepezil
Searching on “donepezil” for RCTs produced 70 hits. Fourteen publi-cations covering 4 159 patients were considered to be original reports on AD patients and met the qualitative inclusion criteria for evaluation. The Cochrane review identified three more RCTs [4]. They were excluded from this review due to inadequate dosage (study 134) or because they are unpublished and not amenable to checking: studies 205 and 306, with 51 patients altogether [4]. Twelve of the 14 studies enrolled mild to modera-te dementia cases (mean MMSE 17–21, ranges 10–26 points). One of the

D E M E N T I A – D I AG N O S T I C A N D T H E R A P E U T I C I N T E RV E N T I O N S300
other two trials studied patients with moderate to severe dementia who lived at home or at assisted living facilities (mean MMSE 12–14 points) [8], while the other one included very old patients in US nursing homes with mild to severe dementia (MMSE 5–26 points) [9]. The long-term AD2000 study differed from the others in that there was a large dropout rate and the inclusion criteria specified that “the doctor had to be sub-stantially uncertain that the individual would obtain worthwhile clinical benefit from donepezil” [10]. Three pilot studies included patients who were able to participate in investigations with SPECT [11], PET [12] and MRI [13]. In addition to these placebo-controlled studies, one compara-tive study between donepezil and rivastigmine [14] and one study com-paring donepezil with galantamine [15] are commented on.
Rivastigmine
Medline yielded 29 hits, including 6 original RCTs. In addition, data from 2 large unpublished trials were collected from the Cochrane review [5], for a total of 3 397 patients (Table 22.1). All trials covered mild to moderate AD (mean MMSE 18–20, range 10–26 points).
Galantamine
Six published, original RCTs were among 31 hits on Medline, together with data from one unpublished trial from the Cochrane review [6]. These trials assessed mild to moderate dementia due to AD (n = 3 587, mean MMSE 17–19, ranges 10–24 points) (Table 22.1).
Included trials: MemantineOut of 28 hits for “memantine”, 7 trials were identified that met the required quality criteria (Table 22.2). These studies were heterogeneous with regard to dementia diagnosis – vascular or unspecified dementia in the three early studies – severity (mild to severe), duration (6–28 weeks), setting (Latvian nursing homes, US and Western European outpatients), and memantine dosage (10–30 mg/day). Randomization procedures, concomitant disorders and medications were not described in detail in the earlier publications. Two large recent studies on mild to moderate VaD had equivalent designs [16,17]. The Latvian nursing home trial

C H A P T E R 2 2 • P H A R M AC O LO G I C A L T R E AT M E N T O F D E M E N T I A – E S TA B L I S H E D D R U G S
301
lasted for 12 weeks and included AD and MID patients in equal propor-tions [18]. Only one longer trial included (community dwelling) patients with severe AD [19]. One recent trial examined the effects of meman-tine/placebo when added to a stable dosage of donepezil in patients with moderate to severe AD [20].
Measurements of efficacyEfficacy was assessed in most cases by measurements of global function and cognitive tests as primary outcomes. Measures of ADL and beha-vioral disturbances were mainly used as secondary outcome parameters. Following is a brief presentation of the most commonly used rating scales.
Global function
A Clinician’s Interview-Based Impression of Change with caregiver input (CIBIC-plus) provides a global rating of patient function in four areas: general, cognitive, behavioral and ADL [21]. All patients are scored on global severity at baseline, and subsequent assessments are made on a scale of 1 to 7, with 1 indicating pronounced improvement, 3 mild im- provement, 4 no change and 7 pronounced deterioration. Information, which is obtained from the caregiver and the patient, is generally rated by an independent clinician who is blinded to all other measurements. Rather than mean CIBIC scores, results are commonly presented as the percentage of responders in treatment and placebo groups, defined either as “improved” (1–3) or “unchanged or improved” (1–4). The older studies used a Clinician’s Global Impression of Change (CGI-C) scale without specifying any details. A global measurement of dementia seve-rity, the Clinical Dementia Rating Scale (CDR) is usually reported as a score of 0.5, 1, 2, or 3, indicating questionable, mild, moderate or severe dementia. The scores are derived from ratings in 6 domains (memory, orientation, judgment and problem solving, community affairs, home and hobbies, and personal care), each scored from 0 (normal) to 3 (severe dementia). The sum of the ratings (0–18) provides the CDR Sum of Boxes (CDR-SB) [22]. The Global Deterioration Scale (GDS) is a crude measurement of disease severity [23]. The Gottfries, Bråne, and Steen scale (GBS) is a comprehensive scale for rating dementia symptoms

D E M E N T I A – D I AG N O S T I C A N D T H E R A P E U T I C I N T E RV E N T I O N S302
based on a semi-structured interview with the caregiver [24]. A 7-point scoring system from 0 (normal function) to 6 (maximum disturbance/presence of symptoms) measures orientation, memory and concentration (12 items), ADL (6 items), emotional function (3 items), and pathological aspects of behavior (6 items). The Mental Function Impairment Scale (MENFIS) is a modification of the GBS [25]. The BGP care depen-dency subscale reflects cognitive and functional characteristics associated with increased need for care [26]. Other global assessment scales are the Sandoz Clinical Assessment Geriatric Scale (SCAG) [27], the Functional Rating Scale (FRS) [28], and NOSGER [29].
Cognitive function
The Cognitive part of the Alzheimer’s Disease Assessment Scale (ADAS-cog) is the most widely used test to evaluate changes in cognitive fun-ction in AD over time [30]. Notably, this scale was also used in VaD trials, although its sensitivity to changes in VaD has been insufficiently studied. The most common version of ADAS-cog consists of 11 individu-al tests: spoken language ability (0–5 points), comprehension of spoken language (0–5 points), recall of test instructions (0–5 points), word fin-ding difficulty (0–5 points), following commands (0–5 points), naming object (0–5 points), construction drawing (0–5 points), ideational praxis (0–5 points), orientation (0–8 points), word recall (0–10 points) and word recognition (0–12 points). The total score ranges from 0 to 70 points in ascending degree of impairment. The results are commonly presented as a comparison of changes from the baseline between active treatment and placebo or as responders in each group. A 2 point change on the ADAS-cog scale roughly reflects a 1 point change on the Mini-mental state examination (MMSE) [31,32], a widely used screening test for dementia in clinical practice [33]. MMSE is easy to administer, the score ranging from 0 (severe impairment) to 30 (normal). MMSE was used to define the study populations, as well as a secondary endpoint in several studies. The Severe Impairment Battery (SIB) is designed to assess changes in cognitive function in patients with severe dementia (0–100 points in descending level of performance) [34]. Early meman-tine trials used the Syndrom-Kurtztest (SKT) as a cognitive test [27].

C H A P T E R 2 2 • P H A R M AC O LO G I C A L T R E AT M E N T O F D E M E N T I A – E S TA B L I S H E D D R U G S
303
ADL
Virtually all ADL scales are based on information provided by the caregiver regarding performance in basic (personal) and instrumental (complex) ADL. The Progressive Deterioration Scale (PDS) is a disease-specific measure of changes in 29 items of ADL [35]. The Disability Assessment for Dementia (DAD) is a 10-domain, 40-item instrument that measures instrumental and basic ADL proceeding from a caregi-ver interview of what the patient actually did during the weeks before assessment [36]. A wide variety of other ADL scales were used in the reviewed trials: among them were Interview for Deterioration in Daily living activities in Dementia (IDDD) [37], AD Cooperative Study Activities of Daily Living (ADCS-ADL) [38], IADL+ and PSMS+ [39], the Alzheimer’s Disease Functional Assessment and Change Scale (ADFACS) [40] and the Caregiver Modified Chrichton Scale (CMCS) [41]. Many of the global scales also include ADL measurements.
Behavioral disturbances and psychological symptoms
The Neuropsychiatric Instrument (NPI) is a 12-item, caregiver-rated instrument to evaluate behavioral and neuropsychiatric symptoms, including delusions, hallucinations, agitation/aggression, depression/dysphoria, anxiety, elation/euphoria, apathy, disinhibition, irritability, aberrant motor behavior, nighttime behavior, and appetite/eating disor-der [42]. A lower score indicates improvement. The Behavioral Rating Scale for Geriatric Patients (BGP) is an observer-rated scale for geriatric inpatients that measures ADL and behavioral disturbances [18].
Measurements of acceptability and safetyAcceptability of treatment was measured by rates of withdrawal from trial. Safety was measured by rates of withdrawal due to adverse events (AE), and by the numbers of different AEs in a comparison between active treatment and placebo groups. Information on AEs was collected by questioning the caregiver at each assessment.

D E M E N T I A – D I AG N O S T I C A N D T H E R A P E U T I C I N T E RV E N T I O N S304
Acetylcholinesterase inhibitors in AD
Presentation of resultsWe focused on studies that lasted 6 months or longer and used the doses that are recommended for clinical practice in the Nordic countries, ie, donepezil 5 to 10 mg/day, rivastigmine 6 to 12 mg/day and galantamine 16 to 24 mg/day. Table 22.3 shows all primary and secondary outco-mes, as well as rates of discontinuation (all causes, including AEs), in each study. Unless otherwise indicated, all figures are based on ITT or ITT-LOCF analyses. Results are presented as the measurement diffe-rences between baseline and end of the study for each treatment group. Although the results for the three cholinesterase inhibitors appear in the same table, the data cannot be used to compare the various agents, but only to show the differences between active treatment and placebo in each study.
Effects on global function, primary outcomes: CIBIC+ and GBSEleven included studies that lasted 6 months had CIBIC+ as a primary efficacy measurement of global function (Table 22.3). For studies with donepezil 5 or 10 mg daily, global function improved (CIBIC+ 1–3) in 21–26% of patients on active treatment and 11–14% of patients on pla-cebo [31,43]. Treatment effects were higher in the Japanese study [41]. One rivastigmine study showed significant differences between active treatment (37% improvement) and placebo (20% improvement) [32]. But rivastigmine treated patients did not significantly improve on CIBIC+ (22–25% for active treatment and 15–25% for placebo) in the other 3 studies. Two galantamine trials reported CIBIC+ 1–3 as an endpoint, and the differences between active and placebo treatment were not significant (17–22% and 12–16%) [44,45]. When responders were de-fined as those who were unchanged or improved (CIBIC+ 1–4), the results significantly favored galantamine in all 3 studies [44–46].
Unchanged/improved global ratings averaged 66% (62–73%) for galan-tamine 24 mg/day and 52% (49–57%) for placebo. These figures are

C H A P T E R 2 2 • P H A R M AC O LO G I C A L T R E AT M E N T O F D E M E N T I A – E S TA B L I S H E D D R U G S
305
comparable to donepezil studies, for which 57–67% (5 mg/day) and 63–75% (24 mg/day) were unchanged or improved for active treatment, as opposed to 49–55% for placebo. The rivastigmine publications did not state this endpoint. In the Nordic study, 31% of donepezil patients and 22% of placebo patients had improved from baseline on the GBS total score after 52 weeks [47].
Effects on global function, secondary outcomesTreatment with 5 mg and 10 mg donepezil daily had significantly greater effects than placebo in terms of disease severity in terms of CDR-SB in all 24–54-week studies [9,31,41,43,48]. A meta-analysis based on these studies found that patients treated with donepezil 10 mg/day (n = 511) were virtually unchanged after 24 weeks (–0.09 to –0.02), while the scores of placebo patients (n = 517) had declined by 0.36 to 0.70 p [4]. For the Nordic study, twice as many patients in the active group showed post-baseline improvement on the GDS after 52 weeks as in the placebo group [47].
The rate of progression to moderate/severe dementia or worse (GDS ≥5) after 26 weeks did not differ between rivastigmine treatment and pla-cebo in study B304 (Unpublished I) [49] or B352 [50], but it was signifi-cantly lower among patients treated with rivastigmine in the B303 [32] and B351 (Unpublished II) [49] studies. The B352 study showed that patients treated with rivastigmine deteriorated significantly less than placebo patients on the GDS (mean scores) [50]. Thus, these 4 studies yielded conflicting results.
Effects on cognitive function, primary outcomes: ADAS-cogTen studies showed a change in ADAS-cog (70 point scale) from base-line as a primary endpoint (Table 22.3). The mean differences between active treatment and placebo groups varied from 1.4 to 3.9 points (ITT). After 6 months of treatment, the mean ADAS-cog scores tended to be slightly better than baseline in patients treated with donepezil and

D E M E N T I A – D I AG N O S T I C A N D T H E R A P E U T I C I N T E RV E N T I O N S306
slightly worse in placebo patients [13,31,41,43]. A meta-analysis found the mean differences between active treatment and placebo after 24 weeks to be –2.02 (–2.77 to –1.26) for donepezil 5 mg/day and –2.92 (–3.74 to –2.10) for donepezil 10 mg/day (minus denotes better results, ITT-LOCF) [4]. The results of all four 26-week rivastigmine trials sho-wed a significantly smaller impairment in active treatment than placebo. A meta-analysis showed the mean difference between active treatment and placebo after 26 weeks to be –2.09 p (–2.65 to –1.54) for rivastig-mine 6 to 12 mg/day, ITT [5]. A meta-analysis of 3 trials [32,49,50] found that the main items in ADAS-cog that differed between active and placebo treatment were word recall, word recognition, orientation, remembering test instructions and concentration [51]. The differences in ADAS-cog from baseline after 6 months of treatment with galantamine 16 to 24 mg/day and placebo were significant in all 3 trials [44–46], ranging from 2.9 to 3.9 points, ITT. A meta-analysis of these studies showed the mean differences between active treatment and placebo after 5 to 6 months to be –3.1 (–4.1 to –2.1) p for galantamine 16 mg/day and –3.3 (–3.9 to –2.7) points for galantamine 24 mg/day, ITT [6].
A meta-analysis by SBU of 4 RCTs with dropout rates of <30% and ADAS-cog as primary outcome (Figure 22.1) [31,41,44,45] examined the effect size. A moderate statistical and clinical difference between drug treatment and placebo was identified from an effect size of 0.49.
Effects on cognitive function: secondary outcomesAs a secondary outcome, some studies reported the rates of ‘responders’ in ADAS-cog, in actively treated patients compared to placebo patients. The figures are shown in Table 22.3.
Some of the donepezil and rivastigmine studies measured the change in MMSE from baseline to the end of the study. Two of the three 24-week studies found patients treated with donepezil to have significantly higher MMSE scores than placebo patients. The mean differences for 10 mg donepezil vs placebo were 1.4–1.8 points (Table 22.3). The third (nursing home) study yielded results favoring donepezil at weeks 8 to 20

C H A P T E R 2 2 • P H A R M AC O LO G I C A L T R E AT M E N T O F D E M E N T I A – E S TA B L I S H E D D R U G S
307
but not at the end [9]. After 1 year, donepezil-treated patients performed 0.5 points worse and placebo patients performed 2.2 points worse (∆1.7 points) [47]. In the AD2000 study, the donepezil group’s mean MMSE had improved by 0.9 points from baseline after 12 weeks. Scores dete-riorated over time, but a significant difference between treatment and placebo of approximately 0.8 points was maintained over 2 years. All 4 rivastigmine studies showed the difference in MMSE between rivas-tigmine 6–12 mg and placebo after 26 weeks to be significant, mean 0.7–0.8 p (Table 22.3).
Effects on ADLThe 54-week donepezil study used time to clinically evident decline in ADL (ADFACS) as a primary endpoint [48]. There was a signifi-cant delay in time to decline in patients who received active treatment: 41% (n = 84/207) reached the endpoint in 1 year, as opposed to 56% (n = 116/206) of placebo patients (Table 22.3). The median time to decli-ne (Kaplan-Meier survival curves) was 5 months longer in the donepezil group. In 4 donepezil studies over 6–12 months, ADL measurements were secondary outpoints. Three of these showed that donepezil patients had a slower rate of ADL decline than placebo patients [41,43,47]. The Winblad study found that 3 single items of the PDS – memory, using the phone and self-care – differed significantly between the treatment and placebo group [47]. The nursing home study did not detect any signifi-cant differences in basic ADL preservation (PSMS) between patients tre-ated with donepezil and placebo [9]. In the AD2000 study, the primary endpoint of progress of disability – defined as loss of 2/4 basic ADLs or 6/11 instrumental ADLs – was equal for donepezil and placebo patients after 2 years. Donepezil showed small, statistically significant advan-tage in mean scores on the BADL scale (secondary endpoint), persisting from week 24 to week 108. With respect to the efficacy of rivastigmine on ADL function, the results were conflicting (Table 22.3). There were significant differences between patients treated with galantamine (16 mg and 24 mg/day) and placebo patients on the ADCS-ADL 6 months after baseline [45]. In terms of the DAD, changes in ADL functions did not reach statistical significance for galantamine 24 mg daily versus placebo in the other 2 studies [44,46]. Thus, the results were conflicting.

D E M E N T I A – D I AG N O S T I C A N D T H E R A P E U T I C I N T E RV E N T I O N S308
Effects on BPSDMany trials on community-living patients with mild to moderate AD did not aim to examine the potential effects on behavioral disturbances and emotional symptoms. Behavioral problems are expected to be infre-quent at baseline in these patients. The nursing home version of NPI was the primary outcome measurement in the US nursing home study [9]. Total NPI scores did not differ significantly between donepezil and placebo treatment after 24 weeks. Donepezil showed significant effects in one variable, agitation/aggression. Similarly, in the Nordic Study, NPI scores did not differ between placebo and active treatment at 1-year follow-up [47]. Nor were there any differences in NPI scores between groups in the AD2000 study [10]. The moderate-severe AD study found significant improvements for donepezil, in contrast to placebo, on the total NPI score (∆5.6 points out of 144 points) [52]. A meta-analysis of this study, including patients with moderate AD only (MMSE 10–17 points, n = 290), showed positive effects for donepezil on the NPI items of delusions, apathy and aberrant motor behavior [53]. NPI scores in patients treated with 16 mg and 24 mg galantamine were unchanged after 6 months, while placebo patients exhibited a small deterioration, mean difference 2.1 points [45].
Moderate to severe dementiaThe donepezil study on moderate to severe AD included patients with MMSE 5 to 17 points [52]. The results favored donepezil vs placebo in all included measurements: global function (unchanged or improved CIBIC+ in 63% vs 42%), cognitive function, ADL and NPI scales, as well as caregiver strain (Table 22.3). Rates of withdrawal, as well as withdrawals due to AE, did not differ between treatment groups. A meta-analysis of patients with moderate to severe AD (GDS 5) in 3 rivastigmine studies [32,49,50] showed significant differences after 6 months between active treatment (n = 819) and placebo (n = 642) on the PDS [54]. When patients from the same studies were stratified according to GDS stage, those with moderate to severe dementia sho-wed greater benefits from rivastigmine compared to placebo than those with mild dementia [55]. A post hoc analysis of 4 galantamine studies

C H A P T E R 2 2 • P H A R M AC O LO G I C A L T R E AT M E N T O F D E M E N T I A – E S TA B L I S H E D D R U G S
309
[44–46,56] looked at patients with advanced moderate AD, ie, MMSE 10 to 12 points and/or ADAS-cog >30 points [14]. The mean change in ADAS-cog score from baseline was 6.5 points better after 5 to 6 months in patients treated with galantamine 24 mg/day (n = 705) than placebo patients (n = 714). The rates of unchanged or improved global functio-ning (CIBIC+ 1–4) were 49% to 55% in the treatment groups and 23% to 32% in the placebo groups, ie, the differences were greater than for patients with mild dementia.
Acceptability and tolerabilityTable 22.3 shows rates of discontinuation before the end of the study for any reason. Donepezil treatment for 24 weeks was not associated with an increased risk of all-cause discontinuation in 4 of the 5 larger studies over 6 months (5 mg/day 12–22%, 10 mg/day 16–26%, placebo 14–26%). In the fifth study, dropouts were significantly more frequent for donepezil 10 mg daily (32%) than placebo (20%) [31]. After 52-week treatment in the Nordic Study, dropouts were equal for the donepezil (33%) and placebo groups (33%) [47]. The AD2000 study found discon-tinuation during the 12-week run-in period to be more frequent in the donepezil group. But after re-randomization and 48 weeks of treatment, the groups did not differ. Attrition was high, partly due to physicians’ attitudes to treatment having changed during the course of the trial, and many patients were switched to open-label treatment. The total rates of withdrawal for patients treated for 6 months with 6–12 mg rivastigmine daily were significantly higher in all 4 trials (24–43%) than for placebo (13–25%). The total number of dropouts among patients treated with galantamine 16 or 24 mg/day for 6 months did not differ from placebo in 2 studies (20–22% vs 14–16%) but was significantly higher in the third one (32 vs 19%).
When it came to discontinuation due to adverse events (AE), no diffe-rence between donepezil 5 mg/day (2–9%) and placebo (4–10%) emerged in any study (Table 22.3). Patients treated with 10 mg daily had rates of 8–18%, a significant difference compared to placebo, in 2 of 4 studies. However, the 52-week Nordic study showed significantly lower corre- sponding figures of 7% and 6%. In the rivastigmine studies, 17–29%

D E M E N T I A – D I AG N O S T I C A N D T H E R A P E U T I C I N T E RV E N T I O N S310
of the patients on active treatment with 6–12 mg daily for 26 weeks withdrew before the end due to AE, significantly more often than pla-cebo patients (7–12%). Patients treated with galantamine 16 mg/day for 6 months did not discontinue due to AE more often (7%) than placebo patients (7%). The rate was higher for patients on 24 mg/day (10–23%), a significant difference vs placebo in 1 study.
The two most frequent AEs for all 3 acetylcholinesterase inhibitors, as well as the most common reasons for early withdrawal, were nausea and vomiting. The rates of discontinuation due to AEs were related to the speed at which the doses were raised. In most studies with slow titration, dropout rates were the same between active and placebo patients. Fre-quencies of nausea did not differ between treatment with donepezil 5 mg/day and placebo in any study, nor between donepezil 10 mg/day and placebo in the Nordic study (11% vs 9%). Mean rates of nausea in the other studies comparing donepezil 10 mg/day and placebo were 17% vs 5%, OR 3.31 (2.34–4.68). The total frequency of nausea in the 4 rivastigmine studies comparing 6–12 mg daily with placebo was 47% vs placebo 12%, OR 5.40 (4.44–6.58). Nausea rates in the galantamine studies varied from 16% to 37% (24 mg/day), as opposed to 3% to 13% in the placebo groups. In no study did rates of vomiting differ between donepezil 5 mg/day and placebo. Mean frequencies of vomiting in the 24-week studies were 12% for donepezil 10 mg/day and 5% for placebo. However, in the 52-week Nordic study, vomiting occurred in less than 5% of patients in both groups. Mean rates of vomiting in all four rivas-tigmine studies were 30% vs 6%, OR 5.28 (4.19–6.65). Rates of vomiting were significantly higher in all galantamine studies comparing 16 to 24 mg/day (15–21%) with placebo (4–7%). The less frequent AEs of ano-rexia, diarrhea, weight loss, muscle cramp, fatigue, and insomnia were slightly more frequent in patients treated with donepezil, rivastigmine or galantamine [4–6]. Some studies found rhinitis, dizziness, headache, abdominal pain and tremor to be overrepresented among patients recei-ving acetylcholinesterase inhibitors, but there was no consistent pattern. The rates of abnormal gait, agitation, confusion, bradycardia, and synco-pe did not differ in most studies between active and placebo treatment.

C H A P T E R 2 2 • P H A R M AC O LO G I C A L T R E AT M E N T O F D E M E N T I A – E S TA B L I S H E D D R U G S
311
Results after short-term treatment, effects of washout and placebo effectsSignificant differences between active treatment (donepezil, rivastigmi-ne, galantamine) and placebo on cognitive scales were generally detected after 6 to 12 weeks. There was no evidence of a prolonged beneficial tre-atment effect for donepezil, rivastigmine or galantamine after washout for 3 to 6 weeks. For example, scores returned toward baseline within 3 weeks of drug washout [57], and no differences between former placebo and donepezil patients were detected after 6 weeks of washout [31]. In the AD2000 study, washout for 4–6 weeks did not lead to irreversible deterioration. All trials showed a clear positive placebo effect at the first post-baseline assessments. Noticeably, placebo patients generally impro-ved their performance on ADAS-cog 3 to 6 weeks after baseline by 1.0 to 1.5 points. The improvement was particularly evident for caregiver-rated scales. For instance, after 6 weeks of treatment in a clinical prac-tice study, 23% of placebo patients and 24% of donepezil patients were deemed to have improved according to the caregiver-rated global impres-sion [57]. Furthermore, mean (caregiver-rated) NPI-scores improved among both placebo and rivastigmine patients at 12 and 20 weeks after baseline [58].
Prediction of responseThe AD2000 study reported that early response, defined as MMSE improvement ≥4 points from baseline after 12 weeks, did not predict positive subsequent treatment effects [10]. We did not find any results in the other reviewed studies that either supported or contradicted this finding. None of the studies indicated that advanced age was associated with poorer response. For instance, the donepezil nursing home study that recruited patients with a very high mean age, 85.7 years, found the treatment effects to be similar in patients above 85 (n = 133/208) and younger, ie, the results on the CDR-SB and MMSE significantly favored donepezil [9]. The presence of an apo E e4 allele was previously suggested to be associated with lack of response to tacrine treatment. But that view was refuted by several of the reviewed trials [10,44,57].

D E M E N T I A – D I AG N O S T I C A N D T H E R A P E U T I C I N T E RV E N T I O N S312
One report stated that patients who had more rapid disease progres-sion during the 6 months before the start of treatment obtained greater benefits from rivastigmine, as measured by ADAS-cog, than those with slowly progressive cognitive decline [59]. Several studies showed that patients with moderate to severe dementia obtained greater benefits than those with milder disease (see above). We did not find any studies that contradicted this finding. The presence of vascular risk factors was not associated with impaired response in any of the reviewed trials. Two post hoc analyses of the rivastigmine study B352 [50] concluded that AD patients with concomitant hypertension, as well as AD patients with a modified HIS >0, had the same treatment effects as other AD patients [60,61]. In AD + CVD, 32% of galantamine, and 19% of pla-cebo, patients improved in terms of CIBIC+ after 6 months, while the ∆ADAS-cog was significant and similar to the results of pure AD stu-dies, 2.8 points [62] (Table 22.6).
Neuroimaging findings in RCTs An RCT with SPECT showed regional cerebral blood flow (rCBF) in placebo patients to decline significantly in the anterior cingulate gyri, inferior parietal and middle temporal cortex, and prefrontal cortex after 12 months, while rCBF in patients treated with donepezil 5 mg/day remained unchanged (Table 22.3) [11]. Donepezil study 203 reported significant differences in the regional cerebral metabolic rate of glu-cose (rCMRglu), as measured by positron emission tomography (PET), favoring donepezil over placebo [12]. Another donepezil study associa-ted active treatment with significantly smaller decreases than placebo in total hippocampal volumes (MRI) after 6 months [13]. In an RCT with PET, patients who responded to rivastigmine treatment, defined as CIBIC 1–4 after 26 weeks, showed greater global CMRglu and grea-ter regional CMRglu in the hippocampus and parahippocampal gyrus than non-responders to rivastigmine [63]. The results of the 2 studies are conflicting with respect to prediction of response. Reduction of frontal rCBF (SPECT) was associated with non-response to donepezil in one study [64], but another study found that responders had significantly lower lateral orbital and dorsolateral frontal perfusion bilaterally [65].
C H A P T E R 2 2 • P H A R M AC O LO G I C A L T R E AT M E N T O F D E M E N T I A – E S TA B L I S H E D D R U G S
313
Comparisons among different acetylcholinesterase inhibitorsOne RCT compared donepezil with rivastigmine [14], while another compared donepezil with galantamine [15]. Pfizer sponsored Wilkinson’s study [14]. Twice as many patients receiving rivastigmine discontinued due to AE (22% vs 11% donepezil). Nausea occurred 4 times as often in the rivastigmine group as in the donepezil group (42% vs 11%). Scores on ADAS-cog and MMSE were similar in the 2 groups after 12 weeks of treatment. The Wilcock study was sponsored by Janssen-Cilag and was blinded to the rater but not the physician [15]. After 52 weeks, MMSE had decreased more from the baseline in the donepezil group than in the galantamine group, but the difference was not significant when the two groups were compared in between. Measurements of ADL function did not differ between the groups. Rates of discontinuation for all causes, including AEs, were the same in both groups.
Memantine in AD and VaD
Table 22.4 presents the main results from the longest studies (12–28 weeks).
Global functionThe moderate to severe AD study found that memantine treatment (29%) had significantly better effects than placebo (10%) regarding the percentage of patient who reached the main pre-specified indivi- dual response, which was a compound measurement of global, ADL and cognitive functions [19]. However, the difference between the groups in terms of CIBIC+ (mean change from baseline) was of border- line significance. The shorter Latvian nursing home study, which in- cluded both VaD and AD patients, showed 73% of memantine patients and 45% of placebo patients to have improved on the CGI-C after 12 weeks [18]. The differences in improvement (59% vs 40%) after 4 weeks of treatment were also significant. In neither of the two recent trials on mild to moderate VaD did global measurements (CIBIC+ or CGI-C) differ between memantine and placebo [16,17].

D E M E N T I A – D I AG N O S T I C A N D T H E R A P E U T I C I N T E RV E N T I O N S314
Cognitive functionIn terms of AD, moderate to severe memantine patients maintained their abilities better than placebo patients on the SIB (∆7 points, range 0–100 points), a cognitive test battery designed for severe dementia. But no significant differences were detected on the MMSE (∆0.7 points). The two VaD studies showed small but significant differences (∆1.8 points and ∆2.0 points) favoring memantine with regard to the change in ADAS-cog from baseline, ie, of approximately the same magnitude as in the AChEI trials [16,17]. A pooled analysis of the 2 studies found the difference between memantine and placebo in ADAS-cog to be significant for the 553 patients classified as having small vessel disease but non-significant in the 214 patients with large vessel disease [66]. The difference was due to impairment over time for small-vessel disease patients, while the other VaD patients remained unchanged, compared to baseline. Memantine had the greatest positive effects on cognition in patients with severe dementia, MMSE <15 points.
ADL function and BPSDADL deteriorated significantly more in placebo than memantine patients in the moderate to severe AD study [19]. The main outcome (improve-ment >15% on BGP care dependency) in the Latvian nursing home study fell short of statistical significance, but the results favored memantine when the mean scores on BGP care dependency and the total BGP scores were calculated [18]. Furthermore, 8 of the 16 items on the D-scale for ADL were significantly better in memantine than placebo patients. Worth noting is that even the placebo patients improved during the 3-month study. The two VaD studies did not include ADL measure-ments [16,17]. There was a non-significant difference between active treatment and placebo of 3.3 points favoring memantine in the NPI scores of moderate-severe AD patients [19].
Acceptability and tolerabilityAs shown in Table 22.4, no study showed a difference between meman-tine and placebo patients in terms of the rate of premature discontinua-tion due to any cause or to AE. For all included trials, the rates of AEs

C H A P T E R 2 2 • P H A R M AC O LO G I C A L T R E AT M E N T O F D E M E N T I A – E S TA B L I S H E D D R U G S
315
and SAEs were equal or higher for the placebo group: agitation was reported in 18% of memantine patients and 32% of placebo patients [19].
Combined memantine and donepezil treatmentOne recent study investigated the effects of adding memantine to sta-ble doses of donepezil (treatment for at least 6 months, stable doses or at least 3 months) in 404 patients with moderate to severe AD [20]. Memantine had small but significant beneficial effects on global fun-ction (55% vs 45% unchanged or improved on the CIBIC+), cognitive function (SIB, ∆3.4 points), ADL function and BPSD (∆NPI 3.8 points) (Table 22.4). For ADCS-ADL, significant differences showed up after only 4 weeks. In addition, caregivers in the memantine group reported spending significantly less time helping patients with ADL. The average difference with the placebo group was 46 hours a month. Rates of dis- continuation due to all causes and to AE were lower in the donepezil/memantine group than in the donepezil/placebo group. The only AEs that occurred in at least 5% of the donepezil/memantine group at least twice as often as the donepezil/placebo group were confusion (8% vs 2%) and headache (6% vs 2%). The rates of discontinuation due to confusion were 2% and 1.5% respectively. The rates of diarrhea and fecal inconti-nence were higher in placebo patients than memantine patients.
Acetylcholinesterase inhibitors in VaD
Two large randomised 6-month trials assessed the efficacy of donepe-zil in VaD patients. The trials started in 1997 but were published only recently [67,68]. One large 6-month galantamine trial included patients with both VaD and AD with CVD [62] (Table 22.5). At present, there are no published RCTs on the effects of rivastigmine in VaD.
Results for donepezilIn study VaD308, 67% of included patients had suffered a clinical stroke, and 76% showed evidence of cerebral infarct(s) on CT/MRI [67]. Patients were allocated to treatment with placebo or donepezil 5 mg or 10 mg daily (dose increase after 4 weeks, no reduction was tolerated).

D E M E N T I A – D I AG N O S T I C A N D T H E R A P E U T I C I N T E RV E N T I O N S316
In study VaD307, the protocol and baseline population characteristics were equal to those of VaD308 [68]. More than 75% of included patients had an abrupt onset of cognitive impairment, and 45% were classified as having mild dementia.
In VaD308, 39% of the patients treated with donepezil 5 mg daily were rated as having improved on the CIBIC+ at the end of the study. That was higher than placebo (25%) (Table 22.6). However, treatment with donepezil 10 mg daily had no significant benefits when all CIBIC+ cate-gories were compared. Results from VaD307 were similar: global impro-vement was recorded in 36%, 28% and 30% of the patients treated with donepezil 5 mg, donepezil 10 mg and placebo respectively [68]. Only a minority of the patients deteriorated during the trial: 23%, 28% and 31% for donepezil 5 mg, donepezil 10 mg and placebo respectively. The bene-fits on the CDR-SB scale were significant in both studies for the 10 mg/day group only. Regarding cognitive function, donepezil treatment with 5 mg and 10 mg showed benefits compared to placebo starting in week 6 of both trials. The differences compared to placebo between baseline and the end of the study were 1.6–1.7 points for the 5 mg groups and 2.1–2.2 points for the 10 mg groups (Table 22.6). All treatment groups improved on the MMSE compared to baseline: approximately 0.4 points for placebo patients, 1.2 points for 5 mg donepezil daily and 1.6 points for 10 mg donepezil daily. A subgroup analysis including all 893 patients with probable VaD (ie, those with possible VaD were excluded) from studies VaD307 (70% of all patients) and VaD308 (76% of all patients) showed similar global and cognitive outcomes [69]. Donepezil patients had better ADL function (ADFACS total scores) in study VaD307 but not in VaD308. Discontinuation rates for any reason and due to AE did not differ between patients treated with donepezil 5 mg and placebo but were higher in patients treated with 10 mg daily. Of importance is that the rates of syncope, bradycardia, and stroke were low and equally distributed among the treatment groups. Nausea, diarrhea, leg cramps, anorexia, vomiting, rhinitis, headache, and abnormal dreams occurred more frequently in donepezil patients.

C H A P T E R 2 2 • P H A R M AC O LO G I C A L T R E AT M E N T O F D E M E N T I A – E S TA B L I S H E D D R U G S
317
Results for galantamineOne published RCT included a heterogeneous patient population [62]. Out of 592 randomised patients, 42% had probable VaD, 48% had AD with CVD and 9% had an intermediate diagnosis according to the NINDS-AIREN or NINCDS-ADRDA criteria. CT findings of mul-tiple, large-vessel infarcts, at least two lacunar infarcts, a single strategi-cally placed infarct or extensive WMC were compulsory for inclusion. Among all patients, significantly more were stable or had improved on the CIBIC+ in the galantamine group (74%) than in the placebo group (59%) (Table 22.6). Subgroup analyses were performed even though the study was underpowered in that respect. Only 31% of galantamine patients VaD and 23% of placebo patients with VaD had improved after 6 months (ns). Similarly, the difference between galantamine and place-bo patients on the ADAS-cog was non-significant at ∆1.9 points. Galan-tamine AD + CVD patients improved by –1.0 points on the ADAS-cog, whereas placebo patients deteriorated by 1.8 points, ∆2.8 points. All VaD patients improved on the ADAS-cog – patients on galantamine by –2.4 points, and placebo patients by –0.4 points, no significant difference between the groups. For AD + CVD and VaD patients together, active treatment had small, favorable effects on the DAD and NPI scales. Of the galantamine patients 24% suffered from nausea and 13% from vomi-ting (7% and 6% for placebo). Of the galantamine patients 20% discon-tinued due to AEs, generally before week 6, as opposed to 8% of placebo patients. Doses were escalated from 4 mg/day to 24 mg/day in week 6.
Other neurodegenerative dementia disorders
Cholinesterase inhibitors in dementia with Lewy bodies (DLB)Only one RCT, the McKeith rivastigmine study, has assessed AChEI in DLB [58] (Table 22.7–22.8). The 20-week trial, which included 120 European patients, compared rivastigmine 6 to 12 mg/day with placebo. Dropout rates were higher in the rivastigmine group (18/59, 30%) than in the placebo group (10/61, 16%). Rivastigmine showed better effects than placebo on four pre-selected NPI items (NPI-4: delusions, halluci-nations, apathy and depression) in OC analyses but not in ITT analyses.

D E M E N T I A – D I AG N O S T I C A N D T H E R A P E U T I C I N T E RV E N T I O N S318
There were no significant differences between groups on the MMSE and global ratings, nor on Parkinson symptoms according to the UPDRS motor scale. Rivastigmine had small, beneficial effects on cognitive speed, as well as on tests measuring attention, working memory and episodic secondary memory [70].
Cholinesterase inhibitors in Parkinson’s disease (PD) and dementiaOne Norwegian pilot RCT that had a crossover design included 14 patients with mild to severe PD, a mean disease duration of 10.8 years and cognitive decline with onset at least one year after onset [71] (Table 22.7–22.8). Patients received donepezil 5 to 10 mg/day or placebo for two periods of 10 weeks each, with no washout period. In ITT-LOCF analyses, 42% of donepezil patients and 17% of placebo-treated patients had improved CIBIC+. The MMSE results also favored donepezil. There was no worsening of parkinsonian symptoms according to the UPDRS. NPI scores were low at baseline and did not change during treatment. One large RCT that compared rivastigmine with placebo in PD with dementia was included in this review even though it was published in December 2004 [72] (Table 22.7–22.8). The inclusion criteria were dementia according to DSM-IV with onset at least two years after a PD diagnosis. The effects of rivastigmine were significantly better on all primary and secondary endpoints, but the rates of cholinergic AEs were higher in the rivastigmine group. One donepezil RCT that had a cross-over design included 21 patients with progressive supranuclear paralysis (PSP). The study concluded that memory improved but ADL and mobi-lity worsened. Thus, donepezil was not recommended for PSP patients [73].
Frontotemporal dementia (FTD)No study has attempted to assess the efficacy of AChEIs, memantine, or any other agent on cognitive or functional deficits in FTD. One open trial found no effects of paroxetine on behavioral symptoms [74].

C H A P T E R 2 2 • P H A R M AC O LO G I C A L T R E AT M E N T O F D E M E N T I A – E S TA B L I S H E D D R U G S
319
Cholinesterase inhibitors in Down syndromeOne 24-week pilot RCT compared donepezil 10 mg daily with placebo in patients with Down syndrome and AD, mean age 54 years [75]. Twentyseven patients out of 30 completed the study. No statistically significant effects were detected on the global, cognitive (SIB), ADL or BPSD scales. Donepezil treatment significantly improved function (Down Syndrome Dementia Scale) for 3–5 months in an open-label trial [76].
Need for researchThere is a need for new, more efficient pharmacological agents to treat symptoms and slow down deterioration in AD, VaD and other dementia disorders.
Further studies are needed in order to elucidate the effects of pharmaco-logical treatment in patients with mild cognitive impairment, as well as those with severe dementia.
There is a need for better tools to evaluate efficacy, and to predict response, in the individual patient. That is particularly true for the majority of dementia patients who live alone.
There is a need for studies on combining pharmacological treatment and non-pharmacological interventions.
There is a need for studies that address the potential effects of pharma-cological treatment on behavioral disturbances associated with psycho-logical symptoms.

D E M E N T I A – D I AG N O S T I C A N D T H E R A P E U T I C I N T E RV E N T I O N S320
Figure 22.1 Meta-analysis on ADAS-cog as outcome of drug treatment on Alzheimer’s disease.
Review: DemensComparison: 01 Pharmaceutical effectsOutcome: 01 ADAS
Study Treatment Control SMD (fixed) Weight SMD (fixed)or sub-category N Mean (SD) N Mean (SD) 95% CI % 95% CI
01 Donezepil Homma [41] 134 –2.43 (5.10) 129 0.11 (5.20) 17.30 –0.49 [–0.74, –0.25] Rogers [31] (5 mg) 156 –2.10 (5.40) 155 0.40 (5.30) 20.53 –0.47 [–0.69, –0.24]Subtotal (95% CI) 290 284 37.83 –0.48 [–0.64, –0.31]Test for heterogeneity: Chi? = 0.02, df = 1 (P = 0.88), I? = 0%Test for overall effect: Z = 5.64 (P < 0.00001)
02 Galantamine Tariot [45] 253 –1.40 (6.20) 255 1.70 (6.23) 33.41 –0.50 [-0.67, –0.32] Wilcock [44] 220 –0.50 (5.80) 217 2.40 (6.00) 28.76 –0.49 [-0.68, –0.30]Subtotal (95% CI) 473 472 62.17 –0.49 [-0.62, –0.37]Test for heterogeneity: Chi? = 0.00, df = 1 (P = 0.96), I? = 0%Test for overall effect: Z = 7.49 (P < 0.00001)
Total (95% CI) 763 756 100.00 –0.49 [-0.59, –0.39]Test for heterogeneity: Chi? = 0.05, df = 3 (P = 1.00), I? = 0%Test for overall effect: Z = 9.37 (P < 0.00001)
–1 –0.5 0 0.5 1
Favourstreatment
Favourscontrol

C H A P T E R 2 2 • P H A R M AC O LO G I C A L T R E AT M E N T O F D E M E N T I A – E S TA B L I S H E D D R U G S
321
Review: DemensComparison: 01 Pharmaceutical effectsOutcome: 01 ADAS
Study Treatment Control SMD (fixed) Weight SMD (fixed)or sub-category N Mean (SD) N Mean (SD) 95% CI % 95% CI
01 Donezepil Homma [41] 134 –2.43 (5.10) 129 0.11 (5.20) 17.30 –0.49 [–0.74, –0.25] Rogers [31] (5 mg) 156 –2.10 (5.40) 155 0.40 (5.30) 20.53 –0.47 [–0.69, –0.24]Subtotal (95% CI) 290 284 37.83 –0.48 [–0.64, –0.31]Test for heterogeneity: Chi? = 0.02, df = 1 (P = 0.88), I? = 0%Test for overall effect: Z = 5.64 (P < 0.00001)
02 Galantamine Tariot [45] 253 –1.40 (6.20) 255 1.70 (6.23) 33.41 –0.50 [-0.67, –0.32] Wilcock [44] 220 –0.50 (5.80) 217 2.40 (6.00) 28.76 –0.49 [-0.68, –0.30]Subtotal (95% CI) 473 472 62.17 –0.49 [-0.62, –0.37]Test for heterogeneity: Chi? = 0.00, df = 1 (P = 0.96), I? = 0%Test for overall effect: Z = 7.49 (P < 0.00001)
Total (95% CI) 763 756 100.00 –0.49 [-0.59, –0.39]Test for heterogeneity: Chi? = 0.05, df = 3 (P = 1.00), I? = 0%Test for overall effect: Z = 9.37 (P < 0.00001)
–1 –0.5 0 0.5 1
Favourstreatment
Favourscontrol

D E M E N T I A – D I AG N O S T I C A N D T H E R A P E U T I C I N T E RV E N T I O N S322
Table 22.1 Cholinesterase inhibitors in Alzheimer’s disease: Description of randomised placebo-controlled trials.
Author Year, reference
Type of study Setting Mean MMSE (range)
Randomised patients (n)
Mean age (range) Length of study Intervention
Donepezil
Homma et al2000 [41]
RCT Japan 17.2 (10–26) 268 69.8 (48–90) 24 weeks Donepezil5 mg
Rockwood et al 2002 [56]
RCT USA (10–26) 161 71.5 (55–85) 12 weeks Donepezil 1, 3, 5 mg
Rogers et al 1998 [77]
RCT USA 19.5 (10–26) 468 73.8 (50–94) 12 weeks Donepezil 5, 10 mg
Rogers et al 1998 [31]
RCT USA 19.0 (10–26) 473 73.5 (51–94) 24 weeks Donepezil 5, 10 mg
Burns et al 1999 [43]
RCT Europe 20.2 (10–26) 818 71.7 (50–93) 24 weeks Donepezil 5, 10 mg
Tariot et al 2001 [9]
RCT USA, nursing homes 14.4 (5–26) 208 85.7 (64–102) 24 weeks Donepezil 10 mg
Winblad et al 2001 [47] “Nordic study”
RCT Europe 19 (10–26) 286 72.5 (49–88) 52 weeks Donepezil 10 mg
Mohs et al 2001 [48]
RCT USA 17.1 (12–20) 431 75.4 (49–94) 54 weeks Donepezil 10 mg
Feldman et al 2001 [8]
RCT Canada, Australia 11.8 (5–17) 291 73.6 (48–92) 24 weeks Donepezil 10 mg
Courtney et al 2004 [10] “AD2000”
RCT United Kingdom 19 (10–26) 565 75.5 (46–93) 2 (–3) years Donepezil 5–10 mg

C H A P T E R 2 2 • P H A R M AC O LO G I C A L T R E AT M E N T O F D E M E N T I A – E S TA B L I S H E D D R U G S
323
The table continues on the next page
Table 22.1 Cholinesterase inhibitors in Alzheimer’s disease: Description of randomised placebo-controlled trials.
Author Year, reference
Type of study Setting Mean MMSE (range)
Randomised patients (n)
Mean age (range) Length of study Intervention
Donepezil
Homma et al2000 [41]
RCT Japan 17.2 (10–26) 268 69.8 (48–90) 24 weeks Donepezil5 mg
Rockwood et al 2002 [56]
RCT USA (10–26) 161 71.5 (55–85) 12 weeks Donepezil 1, 3, 5 mg
Rogers et al 1998 [77]
RCT USA 19.5 (10–26) 468 73.8 (50–94) 12 weeks Donepezil 5, 10 mg
Rogers et al 1998 [31]
RCT USA 19.0 (10–26) 473 73.5 (51–94) 24 weeks Donepezil 5, 10 mg
Burns et al 1999 [43]
RCT Europe 20.2 (10–26) 818 71.7 (50–93) 24 weeks Donepezil 5, 10 mg
Tariot et al 2001 [9]
RCT USA, nursing homes 14.4 (5–26) 208 85.7 (64–102) 24 weeks Donepezil 10 mg
Winblad et al 2001 [47] “Nordic study”
RCT Europe 19 (10–26) 286 72.5 (49–88) 52 weeks Donepezil 10 mg
Mohs et al 2001 [48]
RCT USA 17.1 (12–20) 431 75.4 (49–94) 54 weeks Donepezil 10 mg
Feldman et al 2001 [8]
RCT Canada, Australia 11.8 (5–17) 291 73.6 (48–92) 24 weeks Donepezil 10 mg
Courtney et al 2004 [10] “AD2000”
RCT United Kingdom 19 (10–26) 565 75.5 (46–93) 2 (–3) years Donepezil 5–10 mg

D E M E N T I A – D I AG N O S T I C A N D T H E R A P E U T I C I N T E RV E N T I O N S324
Table 22.1 continued
Author Year, reference
Type of study Setting Mean MMSE (range)
Randomised patients (n)
Mean age (range) Length of study Intervention
Greenberg et al 2000 [57]
RCT USA 21.8 60 75.0 4 x 6 weeks, c–o Donepezil 5 mg
Nakano et al 2001 [11]
RCT Japan 22 (>16 points) 35 70 (57–80) 12 months Donepezil5 mg
Krishnan et al 2003 [13]
RCT USA 67 24 weeks Donepezil10 mg
Tune et al 2003 [12]
RCT USA 28 24 weeks Donepezil10 mg
Rivastigmine
Agid et al 1998 [78]
RCT Europe Not stated 402 69.4 (50–90) 13 weeks Rivastigmine4, 6 mg
Forette et al 1999 [29]
RCT EuropeCanada
19.5 (10–26) 114 71.2 18 weeks Rivastigmine6, 12 mg
Anand et al 1996 [79]
RCT USA (10–26) 50 68 (45–90) 9 weeks Rivastigmine6, 12 mg
Rösler et al 1999 [32]
RCT Europe, USA, Canada
19.9 (10–26) 725 72.0 (45–95) 26 weeks Rivastigmine1–4, 6–12 mg
“Unpublished I” B304 [49]
RCT Europe 18.5 678 71.4 26 weeks Rivastigmine2–12 mg
“Unpublished II” B351 [49]
RCT USA 20.0 (10–26) 702 74.5 (45–89) 26 weeks Rivastigmine3, 6, 9 mg

C H A P T E R 2 2 • P H A R M AC O LO G I C A L T R E AT M E N T O F D E M E N T I A – E S TA B L I S H E D D R U G S
325
Table 22.1 continued
Author Year, reference
Type of study Setting Mean MMSE (range)
Randomised patients (n)
Mean age (range) Length of study Intervention
Greenberg et al 2000 [57]
RCT USA 21.8 60 75.0 4 x 6 weeks, c–o Donepezil 5 mg
Nakano et al 2001 [11]
RCT Japan 22 (>16 points) 35 70 (57–80) 12 months Donepezil5 mg
Krishnan et al 2003 [13]
RCT USA 67 24 weeks Donepezil10 mg
Tune et al 2003 [12]
RCT USA 28 24 weeks Donepezil10 mg
Rivastigmine
Agid et al 1998 [78]
RCT Europe Not stated 402 69.4 (50–90) 13 weeks Rivastigmine4, 6 mg
Forette et al 1999 [29]
RCT EuropeCanada
19.5 (10–26) 114 71.2 18 weeks Rivastigmine6, 12 mg
Anand et al 1996 [79]
RCT USA (10–26) 50 68 (45–90) 9 weeks Rivastigmine6, 12 mg
Rösler et al 1999 [32]
RCT Europe, USA, Canada
19.9 (10–26) 725 72.0 (45–95) 26 weeks Rivastigmine1–4, 6–12 mg
“Unpublished I” B304 [49]
RCT Europe 18.5 678 71.4 26 weeks Rivastigmine2–12 mg
“Unpublished II” B351 [49]
RCT USA 20.0 (10–26) 702 74.5 (45–89) 26 weeks Rivastigmine3, 6, 9 mg
The table continues on the next page

D E M E N T I A – D I AG N O S T I C A N D T H E R A P E U T I C I N T E RV E N T I O N S326
Table 22.1 continued
Author Year, reference
Type of study Setting Mean MMSE (range)
Randomised patients (n)
Mean age (range) Length of study Intervention
Corey-Bloom et al 1998 [50]
RCT USA 19.6 (10–26) 699 74.5 (45–89) 26 weeks Rivastigmine1–4, 6–12 mg
Potkin et al 2001 [63]
RCT USA 20.4 (15–26) 27 75.9 (64–89) 26 weeks Rivastigmine3, 6, 9 mg
Galantamine
Kewitz et al 1994 [80]
RCT Mild–moderate dementia
95 (60–87) 13 weeks Galantamine50 mg
Wilkinson et al 2001 [81]
RCT United Kingdom (13–24) 285 73 12 weeks Galantamine18, 24, 36 mg
“Unpublished” GAL-95–05 [82]
RCT International (12–24) 554 72.9 29 weeks Galantamine32 mg
Wilcock et al 2000 [44]
RCT Europe, Canada
19.5 (11–24) 653 72 26 weeks Galantamine24, 32 mg
Rockwood et al2001 [83]
RCT USA, Europe 19.6 (11–24) 386 75 12 weeks Galantamine24–32 mg
Raskind et al 2000 [46]
RCT USA 19.2 (11–24) 636 75 26 weeks Galantamine24, 32 mg
Tariot et al 2000 [45]
RCT USA 17.8 (10–22) 978 77 5 months Galantamine8, 16, 24 mg
c–o = Crossover; MMSE = Mini-mental state examination; RCT = Randomised controlled trial
Comments to Table 22.1The proportion of female patients was 50–67%, except for in Tariot 2001 (82%) [9].Dose titration: Treatment with donepezil started with 5 mg/day and was raised to 10 mg/day after one week (301, 302, 304) or after four weeks (311, 312, F2000, Nordic study). Rivastigmine was titrated to target dose over 2–3 weeks (B103, B304); over 7 weeks (B303, B352); over 9–10 weeks (B104, B105) or over 12 weeks (B351). Galantamine was rapidly titrated (increase 8 mg weekly to target dose) in GAL-93–01, GAL-95–05, GAL-INT-1, GAL-INT-2, GAL-US-1, while GAL-USA-10 used slow titration (increase 8 mg per 4 weeks).

C H A P T E R 2 2 • P H A R M AC O LO G I C A L T R E AT M E N T O F D E M E N T I A – E S TA B L I S H E D D R U G S
327
Table 22.1 continued
Author Year, reference
Type of study Setting Mean MMSE (range)
Randomised patients (n)
Mean age (range) Length of study Intervention
Corey-Bloom et al 1998 [50]
RCT USA 19.6 (10–26) 699 74.5 (45–89) 26 weeks Rivastigmine1–4, 6–12 mg
Potkin et al 2001 [63]
RCT USA 20.4 (15–26) 27 75.9 (64–89) 26 weeks Rivastigmine3, 6, 9 mg
Galantamine
Kewitz et al 1994 [80]
RCT Mild–moderate dementia
95 (60–87) 13 weeks Galantamine50 mg
Wilkinson et al 2001 [81]
RCT United Kingdom (13–24) 285 73 12 weeks Galantamine18, 24, 36 mg
“Unpublished” GAL-95–05 [82]
RCT International (12–24) 554 72.9 29 weeks Galantamine32 mg
Wilcock et al 2000 [44]
RCT Europe, Canada
19.5 (11–24) 653 72 26 weeks Galantamine24, 32 mg
Rockwood et al2001 [83]
RCT USA, Europe 19.6 (11–24) 386 75 12 weeks Galantamine24–32 mg
Raskind et al 2000 [46]
RCT USA 19.2 (11–24) 636 75 26 weeks Galantamine24, 32 mg
Tariot et al 2000 [45]
RCT USA 17.8 (10–22) 978 77 5 months Galantamine8, 16, 24 mg

D E M E N T I A – D I AG N O S T I C A N D T H E R A P E U T I C I N T E RV E N T I O N S328
Table 22.2 Memantine: Description of randomised placebo-controlled trials.
Author Year, reference
Type of study Setting Dementia diagnosis
Severity MMSE points
Randomised patients (n)
Mean age (range)
Length of study
Intervention
Ditzler1991 [27]
RCT Germany 79% MID Mild-moderate 66 72.2 (65–80) 6 weeks Memantine30 mg/day
Gortelmeyer1992 [84]
RCT Germany 76% VaD Mild-moderate24 p
88 71.5 (59–96) 6 weeks Memantine20 mg/day
Pantev1993 [85]
RCT Germany Dementia Mild–severe 60 72.4 6 weeks Memantine30 mg/day
Winblad1999 [18]
RCT Latvianursing homes
52% VaD48% AD
Moderate-severe, MMSE <10 p, GDS 5–7
166 70 12 weeks Memantine10 mg/day
Orgogozo2002 [16]
RCT France, Belgium, Switzerland
VaD Mild-moderate17 p(12–20 p)
321 76 28 weeks Memantine20 mg/day
Wilcock2002 [17]
RCT United Kingdom VaD Mild-moderate18 p(10–22 p)
579 77 (54–97) 28 weeks Memantine20 mg/day
Reisberg2003 [19]
RCT USAcommunity residents
AD Moderate-severe8 p(3–14 p)
252 76 (50–) 28 weeks Memantine20 mg/day
Tariot2004 [20]
RCT USAcommunityresidents
AD Moderate-severe10 p(5–14 p)
404 76 (50–) 24 weeks Adding memantine20 mg/day to stable dose of donepezil
Comments to Table 22.2* Diagnostic criteriaDementia syndrome according to the Lausanne scheme [27], according to DSM-III [84], DSM-III-R [16,17,18,85], DSM-IV [19] or NINCDS-ADRDA [20] MID according to Hachinski IS [27]. AD according to modified Hachinski IS ≤4 [18,19,20], and to CT/MRI [19,20]. Probable VaD according to NINDS-AIREN [16,17]. Proportions of female patients 47–75%.

C H A P T E R 2 2 • P H A R M AC O LO G I C A L T R E AT M E N T O F D E M E N T I A – E S TA B L I S H E D D R U G S
329
Table 22.2 Memantine: Description of randomised placebo-controlled trials.
Author Year, reference
Type of study Setting Dementia diagnosis
Severity MMSE points
Randomised patients (n)
Mean age (range)
Length of study
Intervention
Ditzler1991 [27]
RCT Germany 79% MID Mild-moderate 66 72.2 (65–80) 6 weeks Memantine30 mg/day
Gortelmeyer1992 [84]
RCT Germany 76% VaD Mild-moderate24 p
88 71.5 (59–96) 6 weeks Memantine20 mg/day
Pantev1993 [85]
RCT Germany Dementia Mild–severe 60 72.4 6 weeks Memantine30 mg/day
Winblad1999 [18]
RCT Latvianursing homes
52% VaD48% AD
Moderate-severe, MMSE <10 p, GDS 5–7
166 70 12 weeks Memantine10 mg/day
Orgogozo2002 [16]
RCT France, Belgium, Switzerland
VaD Mild-moderate17 p(12–20 p)
321 76 28 weeks Memantine20 mg/day
Wilcock2002 [17]
RCT United Kingdom VaD Mild-moderate18 p(10–22 p)
579 77 (54–97) 28 weeks Memantine20 mg/day
Reisberg2003 [19]
RCT USAcommunity residents
AD Moderate-severe8 p(3–14 p)
252 76 (50–) 28 weeks Memantine20 mg/day
Tariot2004 [20]
RCT USAcommunityresidents
AD Moderate-severe10 p(5–14 p)
404 76 (50–) 24 weeks Adding memantine20 mg/day to stable dose of donepezil
** Dose titrationDitzler: 10 mg/day–30 mg/day in 2 weeks, Gortelmeyer: 10 mg/day–20 mg in 3 days, Pantev: 20 mg/day–30 mg in 7 days, Winblad: 5 mg/day–10 mg in 7 days, Orgogozo, Wilcock, Tariot: 5 mg/day–20 mg in 3 weeks, Reisberg: 20 mg/day, titration not stated.
AD = Alzheimer’s disease; GDS = Global deterioration scale; MMSE = Mini-mental state examination; p = points; RCT = Randomised controlled trial; VaD = Vascular dementia

D E M E N T I A – D I AG N O S T I C A N D T H E R A P E U T I C I N T E RV E N T I O N S330
Table 22.3 Cholinesterase inhibitors in Alzheimer’s disease: Outcomes, adverse events and attrition in six months RCTs.
Author Year, reference
Intervention, length of study
Results active vs placebo or baseline vs end point I = primary, II = secondary outcomes Significant differences unless otherwise stated
Drop-outs any cause (active treatment vs placebo)
Drop-outs due to AEs (active treatment vs placebo)
Remarks from reviewer
Assessed quality
Donepezil
Homma et al2000 [41]
5 mg/day, 24 weeks
I: CGIC improved:48% vs 19%Unchanged/improved:81% vs 58%∆ADAS-cog 2.54 pII: CDR-SB don > placebo, ADL (CMCS) slower declineMENFIS don > placebo
5 mg:17/136 (12%) Placebo:22/132 (17%)ns
5 mg:2/136 (2%)vs placebo:6/132 (4%)ns
Significantly more improved and unchanged/improved global function and ADAS-cog donepezil 5 mg/day > placebo.Equal rates of withdrawals
High
Rogers et al1998 [31]
5,10 mg/day, 24 weeks
I: CIBIC 1–3:5 mg: 26% vs 11%10 mg: 25% vs 11%CIBIC 1–4:5 mg: 67% vs 55%10 mg: 75% vs 55%∆ADAS-cog 5 mg: 2.5 p, 10 mg: 2.9 pII: CDR-SB don > placeboADAS-cog ≥0 p: 80–81% vs 58%∆MMSE 1.2 p 5 mg∆MMSE 1.4 p 10 mgQoL ns
5 mg:23/154 (15%) ns10 mg:51/157 (32%) placebo32/162 (20%) OR 1.93(1.17–3.19)
5 mg:9/154 (6%)ns10 mg:26/157 (17%) vs placebo:11/162 (7%)OR 2.59(1.30–5.13)
Significantly more improved and un-changed/improved global function 5 and 10 mg/day and ADAS-cog donepezil 5–10 mg/day >placebo.Significantly more drop-outs any cause and due to AE 10 mg/day, ns 5 mg/day
Moderate

C H A P T E R 2 2 • P H A R M AC O LO G I C A L T R E AT M E N T O F D E M E N T I A – E S TA B L I S H E D D R U G S
331
The table continues on the next page
Table 22.3 Cholinesterase inhibitors in Alzheimer’s disease: Outcomes, adverse events and attrition in six months RCTs.
Author Year, reference
Intervention, length of study
Results active vs placebo or baseline vs end point I = primary, II = secondary outcomes Significant differences unless otherwise stated
Drop-outs any cause (active treatment vs placebo)
Drop-outs due to AEs (active treatment vs placebo)
Remarks from reviewer
Assessed quality
Donepezil
Homma et al2000 [41]
5 mg/day, 24 weeks
I: CGIC improved:48% vs 19%Unchanged/improved:81% vs 58%∆ADAS-cog 2.54 pII: CDR-SB don > placebo, ADL (CMCS) slower declineMENFIS don > placebo
5 mg:17/136 (12%) Placebo:22/132 (17%)ns
5 mg:2/136 (2%)vs placebo:6/132 (4%)ns
Significantly more improved and unchanged/improved global function and ADAS-cog donepezil 5 mg/day > placebo.Equal rates of withdrawals
High
Rogers et al1998 [31]
5,10 mg/day, 24 weeks
I: CIBIC 1–3:5 mg: 26% vs 11%10 mg: 25% vs 11%CIBIC 1–4:5 mg: 67% vs 55%10 mg: 75% vs 55%∆ADAS-cog 5 mg: 2.5 p, 10 mg: 2.9 pII: CDR-SB don > placeboADAS-cog ≥0 p: 80–81% vs 58%∆MMSE 1.2 p 5 mg∆MMSE 1.4 p 10 mgQoL ns
5 mg:23/154 (15%) ns10 mg:51/157 (32%) placebo32/162 (20%) OR 1.93(1.17–3.19)
5 mg:9/154 (6%)ns10 mg:26/157 (17%) vs placebo:11/162 (7%)OR 2.59(1.30–5.13)
Significantly more improved and un-changed/improved global function 5 and 10 mg/day and ADAS-cog donepezil 5–10 mg/day >placebo.Significantly more drop-outs any cause and due to AE 10 mg/day, ns 5 mg/day
Moderate

D E M E N T I A – D I AG N O S T I C A N D T H E R A P E U T I C I N T E RV E N T I O N S332
Table 22.3 continued
Author Year, reference
Intervention, length of study
Results active vs placebo or baseline vs end point I = primary, II = secondary outcomes Significant differences unless otherwise stated
Drop-outs any cause (active treatment vs placebo)
Drop-outs due to AEs (active treatment vs placebo)
Remarks from reviewer
Assessed quality
Burns et al1999 [43]
5, 10 mg/day, 24 weeks
I: CIBIC 1–3:5 mg: 21% vs 14%10 mg: 25% vs 14%CIBIC 1–4:5 mg: 57% vs 49%10 mg: 63% vs 49%∆ADAS-cog 5 mg 1.5 p, 10 mg 2.9 pII: CDR-SB don > placebo∆MMSE 1.8 p 10 mgLess ADL decline (IDDD) 10 mg, ns 5 mgQoL: ns
5 mg:60/271 (22%)10 mg:72/273 (26%)Placebo:55/274 (20%)ns
5 mg:24/271 (9%)ns10 mg:50/273 (18%) vs placebo:27/274 (10%) OR 2.01(1.24–3.25)
Significantly more improved and un-changed/improved global function 5 and 10 mg and ADAS-cog donepezil 5 and 10 mg/day > placebo.Significantly less ADL decline 10 mg/day.Significantly more dropouts due to AE 10 mg/day
Moderate
Tariot et al2001 [9]
Nursing home10 mg/day, 24 weeks
I: Total NPI-NH ns agitation/aggression sign improved (45% vs 28%)II: CDR-SB don > placebo MMSE nsBasic ADL (PSMS) ns
10 mg:19/103 (18%) Placebo:27/105 (26%)ns
10 mg:11/103 (10%) Placebo:19/105 (18%)ns
Nursing home patients. Only single item in NPI significant, ADL ns.Lower rates of withdrawals in donepezil group
Moderate
Winblad et al2001 [47] “Nordic study”
10 mg/day, 52 weeks
I: GBS improvement 31% don, 22% placeboII: GDS improvement don > placebo∆MMSE 1.7 pADL (PDS) better preserved, OR 0.53 (0.36–0.78). NPI ns
10 mg:47/142 (33%) Placebo:47/144 (33%)ns
10 mg:10/142 (7%)Placebo:9/144 (6%)ns
Small, significant improvement global function. MMSE and ADL better pre-served. Low rates of discontinuation due to AEs over 1 year
Moderate

C H A P T E R 2 2 • P H A R M AC O LO G I C A L T R E AT M E N T O F D E M E N T I A – E S TA B L I S H E D D R U G S
333
The table continues on the next page
Table 22.3 continued
Author Year, reference
Intervention, length of study
Results active vs placebo or baseline vs end point I = primary, II = secondary outcomes Significant differences unless otherwise stated
Drop-outs any cause (active treatment vs placebo)
Drop-outs due to AEs (active treatment vs placebo)
Remarks from reviewer
Assessed quality
Burns et al1999 [43]
5, 10 mg/day, 24 weeks
I: CIBIC 1–3:5 mg: 21% vs 14%10 mg: 25% vs 14%CIBIC 1–4:5 mg: 57% vs 49%10 mg: 63% vs 49%∆ADAS-cog 5 mg 1.5 p, 10 mg 2.9 pII: CDR-SB don > placebo∆MMSE 1.8 p 10 mgLess ADL decline (IDDD) 10 mg, ns 5 mgQoL: ns
5 mg:60/271 (22%)10 mg:72/273 (26%)Placebo:55/274 (20%)ns
5 mg:24/271 (9%)ns10 mg:50/273 (18%) vs placebo:27/274 (10%) OR 2.01(1.24–3.25)
Significantly more improved and un-changed/improved global function 5 and 10 mg and ADAS-cog donepezil 5 and 10 mg/day > placebo.Significantly less ADL decline 10 mg/day.Significantly more dropouts due to AE 10 mg/day
Moderate
Tariot et al2001 [9]
Nursing home10 mg/day, 24 weeks
I: Total NPI-NH ns agitation/aggression sign improved (45% vs 28%)II: CDR-SB don > placebo MMSE nsBasic ADL (PSMS) ns
10 mg:19/103 (18%) Placebo:27/105 (26%)ns
10 mg:11/103 (10%) Placebo:19/105 (18%)ns
Nursing home patients. Only single item in NPI significant, ADL ns.Lower rates of withdrawals in donepezil group
Moderate
Winblad et al2001 [47] “Nordic study”
10 mg/day, 52 weeks
I: GBS improvement 31% don, 22% placeboII: GDS improvement don > placebo∆MMSE 1.7 pADL (PDS) better preserved, OR 0.53 (0.36–0.78). NPI ns
10 mg:47/142 (33%) Placebo:47/144 (33%)ns
10 mg:10/142 (7%)Placebo:9/144 (6%)ns
Small, significant improvement global function. MMSE and ADL better pre-served. Low rates of discontinuation due to AEs over 1 year
Moderate

D E M E N T I A – D I AG N O S T I C A N D T H E R A P E U T I C I N T E RV E N T I O N S334
Table 22.3 continued
Author Year, reference
Intervention, length of study
Results active vs placebo or baseline vs end point I = primary, II = secondary outcomes Significant differences unless otherwise stated
Drop-outs any cause (active treatment vs placebo)
Drop-outs due to AEs (active treatment vs placebo)
Remarks from reviewer
Assessed quality
Mohs2001 [48]
10 mg/day, 54 weeks
I: 41% vs 56% reached time to clinically evident functional decline in 1 yearMedian time don > placebo (357 vs 208 days)II: CDR-SB don > placeboMMSE don > placebo
10 mg:60/214 (28%)Placebo:56/217 (26%)ns
10 mg:23/214 (11%)Placebo:16/217 (7%)ns
5 months delay donepezil vs placebo in time to clinically evident functional decline defined as decline in ≥1 basic ADL or ≥20% decline in IADL or ≥1 p increase in CDR. Most cases due to IADL decline.Equal rates of withdrawals
Moderate
Feldman2001 [8]
Moderate-severe AD10 mg/day, 24 weeks
I: CIBIC 1–4: 63% vs 42%CIBIC + mean 0.54II: FRS don > placebosev–MMSE and SIB don > placeboLess ADL decline (DAD, IADL +, PSMS +)NPI don > placebo, mean diff 5.6 p (out of 144 p)Less caregiver strain don vs placebo
10 mg:23/144 (16%) Placebo:20/147 (14%)ns
10 mg:12/144 (8%)Placebo:9/147 (6%)ns
Results favouring donepezil 10 mg in global, cognitive, ADL and BPSD scales.Low rates of discontinuation and AEs in this study on moderate-severe dementia
Moderate
Courtney2004 [10] “AD2000”
5–10 mg/day, 3 years
I: Entry to institution ns (9% vs 14% 1 year, 42% vs 44% 3 years)Loss of ADL function ns (13% vs 19% 1 year, 55% vs 53% 3 years)II: ∆MMSE 0.8 p 2 yearsBADLs mean don > placeboMMSE < 10 p nsNPI ns, cg wellbeing ns
After 12 weeks:5 mg:36/286 (13%)Placebo:18/283 (6%)signAfter 48 weeks:5–10 mg:90/242 (37%)Placebo:103/244(42%)ns
After 12 weeks:5 mg:17/282 (6%)Placebo:3/283 (1%)From week 13:5–10 mg:18/242 (7%)Placebo:8/244 (3%)p = 0.05
Largest trial in terms of person-years. Peculiar inclusion criteria (doctor should be uncertain of that treatment would be beneficial). Underpowered for primary endpoint, aimed to recruite 3000 patients but included 565 only. Many patients switched to open-label treatment.Small positive effects on cognition and ADL still after 2 years, no effect on insti-tutionalisation or significant ADL loss.No permanent cognitive deterioration after 4–6 weeks wash-out
Moderate

C H A P T E R 2 2 • P H A R M AC O LO G I C A L T R E AT M E N T O F D E M E N T I A – E S TA B L I S H E D D R U G S
335
The table continues on the next page
Table 22.3 continued
Author Year, reference
Intervention, length of study
Results active vs placebo or baseline vs end point I = primary, II = secondary outcomes Significant differences unless otherwise stated
Drop-outs any cause (active treatment vs placebo)
Drop-outs due to AEs (active treatment vs placebo)
Remarks from reviewer
Assessed quality
Mohs2001 [48]
10 mg/day, 54 weeks
I: 41% vs 56% reached time to clinically evident functional decline in 1 yearMedian time don > placebo (357 vs 208 days)II: CDR-SB don > placeboMMSE don > placebo
10 mg:60/214 (28%)Placebo:56/217 (26%)ns
10 mg:23/214 (11%)Placebo:16/217 (7%)ns
5 months delay donepezil vs placebo in time to clinically evident functional decline defined as decline in ≥1 basic ADL or ≥20% decline in IADL or ≥1 p increase in CDR. Most cases due to IADL decline.Equal rates of withdrawals
Moderate
Feldman2001 [8]
Moderate-severe AD10 mg/day, 24 weeks
I: CIBIC 1–4: 63% vs 42%CIBIC + mean 0.54II: FRS don > placebosev–MMSE and SIB don > placeboLess ADL decline (DAD, IADL +, PSMS +)NPI don > placebo, mean diff 5.6 p (out of 144 p)Less caregiver strain don vs placebo
10 mg:23/144 (16%) Placebo:20/147 (14%)ns
10 mg:12/144 (8%)Placebo:9/147 (6%)ns
Results favouring donepezil 10 mg in global, cognitive, ADL and BPSD scales.Low rates of discontinuation and AEs in this study on moderate-severe dementia
Moderate
Courtney2004 [10] “AD2000”
5–10 mg/day, 3 years
I: Entry to institution ns (9% vs 14% 1 year, 42% vs 44% 3 years)Loss of ADL function ns (13% vs 19% 1 year, 55% vs 53% 3 years)II: ∆MMSE 0.8 p 2 yearsBADLs mean don > placeboMMSE < 10 p nsNPI ns, cg wellbeing ns
After 12 weeks:5 mg:36/286 (13%)Placebo:18/283 (6%)signAfter 48 weeks:5–10 mg:90/242 (37%)Placebo:103/244(42%)ns
After 12 weeks:5 mg:17/282 (6%)Placebo:3/283 (1%)From week 13:5–10 mg:18/242 (7%)Placebo:8/244 (3%)p = 0.05
Largest trial in terms of person-years. Peculiar inclusion criteria (doctor should be uncertain of that treatment would be beneficial). Underpowered for primary endpoint, aimed to recruite 3000 patients but included 565 only. Many patients switched to open-label treatment.Small positive effects on cognition and ADL still after 2 years, no effect on insti-tutionalisation or significant ADL loss.No permanent cognitive deterioration after 4–6 weeks wash-out
Moderate

D E M E N T I A – D I AG N O S T I C A N D T H E R A P E U T I C I N T E RV E N T I O N S336
Table 22.3 continued
Author Year, reference
Intervention, length of study
Results active vs placebo or baseline vs end point I = primary, II = secondary outcomes Significant differences unless otherwise stated
Drop-outs any cause (active treatment vs placebo)
Drop-outs due to AEs (active treatment vs placebo)
Remarks from reviewer
Assessedquality
Nakano et al2001 [11]“SPECT study”
5 mg/day, 12 months
I: rCBF don > placeboII: MMSE decline from base-line: 5 mg 2.2 p, ns placebo 3.5 p, sign
(Pilot study)
Tune et al2003 [12]“PET study”
10 mg/day, 24 weeks
I: CMRglu don > placeboII: ∆ADAS-cog 2.1 p(OC, ns)
0/14 (0%)vs 2/14 (14%)
(Pilot study)
Krishnan et al2003 [13]“MRI study”
10 mg/day, 24 weeks
I: hippocampal volume don > placeboII: ∆ADAS-cog 3.9 p (OC, sign)
6/34 (18%) vs 10/33 (30%)
0/34vs1/33
(Pilot study)
Rivastigmine
Rösler et al1999 [32]
6–12 mg/day, 26 weeks
I: CIBIC 1–3:37% vs 20%∆ADAS-cog 1.6 p, nsII: Progression to GDS ≥5 riva < placebo∆MMSE 0.7 pADL decline (PDS) ns
79/242 (33%) vs31/239 (13%) OR 3.94(1.99–4.66)
55/242 (22%) vs16/239 (7%) OR 3.57(2.26–5.90)
Significantly more improved global function. ADAS-cog and ADL ns.High rates of drop-outs any cause and due to AE in rivastigmine-group
High
“Unpublished I”B304 [49]
6–12 mg/day, 26 weeks
I: CIBIC 1–3:23% vs 19%, ns∆ADAS-cog 1.6 pII: Progression to GDS ≥5 ns∆MMSE 0.8 pNear sign less ADL decline (PDS)
54/228 (24%) vs33/222 (15%) OR 1.76(1.10–2.81)
39/228 (17%)vs20/222 (9%) OR 2.03(1.18–3.51)
Ns effect global function, ADAS-cog higher scores in rivastigmine. Signi-ficantly more drop-outs any cause and due to AE in rivastigmine-group
Moderate

C H A P T E R 2 2 • P H A R M AC O LO G I C A L T R E AT M E N T O F D E M E N T I A – E S TA B L I S H E D D R U G S
337
The table continues on the next page
Table 22.3 continued
Author Year, reference
Intervention, length of study
Results active vs placebo or baseline vs end point I = primary, II = secondary outcomes Significant differences unless otherwise stated
Drop-outs any cause (active treatment vs placebo)
Drop-outs due to AEs (active treatment vs placebo)
Remarks from reviewer
Assessedquality
Nakano et al2001 [11]“SPECT study”
5 mg/day, 12 months
I: rCBF don > placeboII: MMSE decline from base-line: 5 mg 2.2 p, ns placebo 3.5 p, sign
(Pilot study)
Tune et al2003 [12]“PET study”
10 mg/day, 24 weeks
I: CMRglu don > placeboII: ∆ADAS-cog 2.1 p(OC, ns)
0/14 (0%)vs 2/14 (14%)
(Pilot study)
Krishnan et al2003 [13]“MRI study”
10 mg/day, 24 weeks
I: hippocampal volume don > placeboII: ∆ADAS-cog 3.9 p (OC, sign)
6/34 (18%) vs 10/33 (30%)
0/34vs1/33
(Pilot study)
Rivastigmine
Rösler et al1999 [32]
6–12 mg/day, 26 weeks
I: CIBIC 1–3:37% vs 20%∆ADAS-cog 1.6 p, nsII: Progression to GDS ≥5 riva < placebo∆MMSE 0.7 pADL decline (PDS) ns
79/242 (33%) vs31/239 (13%) OR 3.94(1.99–4.66)
55/242 (22%) vs16/239 (7%) OR 3.57(2.26–5.90)
Significantly more improved global function. ADAS-cog and ADL ns.High rates of drop-outs any cause and due to AE in rivastigmine-group
High
“Unpublished I”B304 [49]
6–12 mg/day, 26 weeks
I: CIBIC 1–3:23% vs 19%, ns∆ADAS-cog 1.6 pII: Progression to GDS ≥5 ns∆MMSE 0.8 pNear sign less ADL decline (PDS)
54/228 (24%) vs33/222 (15%) OR 1.76(1.10–2.81)
39/228 (17%)vs20/222 (9%) OR 2.03(1.18–3.51)
Ns effect global function, ADAS-cog higher scores in rivastigmine. Signi-ficantly more drop-outs any cause and due to AE in rivastigmine-group
Moderate

D E M E N T I A – D I AG N O S T I C A N D T H E R A P E U T I C I N T E RV E N T I O N S338
Table 22.3 continued
Author Year, reference
Intervention, length of study
Results active vs placebo or baseline vs end point I = primary, II = secondary outcomes Significant differences unless otherwise stated
Drop-outs any cause (active treatment vs placebo)
Drop-outs due to AEs (active treatment vs placebo)
Remarks from reviewer
Assessed quality
“Unpublished II”B351 [49]
6–12 mg/day, 26 weeks
I: CIBIC 1–3:25% vs 25%, ns∆ADAS-cog 1.4 pII: Progression to GDS ≥5 riva < placebo∆MMSE 0.7 pADL decline (PDS) ns
152/352 (43%) vs43/172 (25%) OR 2.17(1.49–3.17)
97/352 (27%) vs21/172 (12%) OR 2.41(1.56–3.72)
High rates of drop-outs in both groups and significantly more drop-outs any cause and due to AE in rivastigmine-group. Conflicting results global function, ADAS-cog higher scores in rivastigmine. ADL ns
Moderate
Corey-Bloom et al1998 [50]
6–12 mg/day, 26 weeks
I: CIBIC 1–3:22% vs 15%, ns∆ADAS-cog 3.8 p, signII: Progression to GDS ≥5 ns, mean GDS riva better than placebo.∆MMSE 0.7 p∆ADAS-cog ≥0 p 56% vs 27%ADL decline (PDS) sign less
82/230 (36%)vs38/235 (17%) OR 2.76(1.82–4.18)
66/230 (29%) vs17/235 (7%) OR 4.31(2.68–6.92)
Significantly more drop-outs any cause and due to AE in rivastigmine-group. Conflicting results global function, ADAS-cog higher scores in rivastigmine. Less decline in ADL
Moderate
Potkin et al2001 [63]“PET study”
3–9 mg, 26 weeks
I: global CMRglu 26% increased riva, 6% placeboII: CIBIC 1–4 15/20 riva, 2/7 placebo
Galantamine
Wilcock et al2000 [44]
24 mg/day, 26 weeks
I: CIBIC 1–3:17% vs 16%, nsCIBIC 1–4:62% vs 50%∆ADAS-cog: 2.9 pII: ADAS-cog ≥4 p29% vs 15%ADL (DAD) ns
44/220 (20%) vs29/215 (14%)ns
31/220 (14%) vs19/215 (9%)ns
Ns effect improved global function, sign effect improved/unchanged. ADAS-cog higher scores in galantamine. ADL ns.Equal rates of withdrawals
Moderate

C H A P T E R 2 2 • P H A R M AC O LO G I C A L T R E AT M E N T O F D E M E N T I A – E S TA B L I S H E D D R U G S
339
The table continues on the next page
Table 22.3 continued
Author Year, reference
Intervention, length of study
Results active vs placebo or baseline vs end point I = primary, II = secondary outcomes Significant differences unless otherwise stated
Drop-outs any cause (active treatment vs placebo)
Drop-outs due to AEs (active treatment vs placebo)
Remarks from reviewer
Assessed quality
“Unpublished II”B351 [49]
6–12 mg/day, 26 weeks
I: CIBIC 1–3:25% vs 25%, ns∆ADAS-cog 1.4 pII: Progression to GDS ≥5 riva < placebo∆MMSE 0.7 pADL decline (PDS) ns
152/352 (43%) vs43/172 (25%) OR 2.17(1.49–3.17)
97/352 (27%) vs21/172 (12%) OR 2.41(1.56–3.72)
High rates of drop-outs in both groups and significantly more drop-outs any cause and due to AE in rivastigmine-group. Conflicting results global function, ADAS-cog higher scores in rivastigmine. ADL ns
Moderate
Corey-Bloom et al1998 [50]
6–12 mg/day, 26 weeks
I: CIBIC 1–3:22% vs 15%, ns∆ADAS-cog 3.8 p, signII: Progression to GDS ≥5 ns, mean GDS riva better than placebo.∆MMSE 0.7 p∆ADAS-cog ≥0 p 56% vs 27%ADL decline (PDS) sign less
82/230 (36%)vs38/235 (17%) OR 2.76(1.82–4.18)
66/230 (29%) vs17/235 (7%) OR 4.31(2.68–6.92)
Significantly more drop-outs any cause and due to AE in rivastigmine-group. Conflicting results global function, ADAS-cog higher scores in rivastigmine. Less decline in ADL
Moderate
Potkin et al2001 [63]“PET study”
3–9 mg, 26 weeks
I: global CMRglu 26% increased riva, 6% placeboII: CIBIC 1–4 15/20 riva, 2/7 placebo
Galantamine
Wilcock et al2000 [44]
24 mg/day, 26 weeks
I: CIBIC 1–3:17% vs 16%, nsCIBIC 1–4:62% vs 50%∆ADAS-cog: 2.9 pII: ADAS-cog ≥4 p29% vs 15%ADL (DAD) ns
44/220 (20%) vs29/215 (14%)ns
31/220 (14%) vs19/215 (9%)ns
Ns effect improved global function, sign effect improved/unchanged. ADAS-cog higher scores in galantamine. ADL ns.Equal rates of withdrawals
Moderate

D E M E N T I A – D I AG N O S T I C A N D T H E R A P E U T I C I N T E RV E N T I O N S340
Table 22.3 continued
Author Year, reference
Intervention, length of study
Results active vs placebo or baseline vs end point I = primary, II = secondary outcomes Significant differences unless otherwise stated
Drop-outs any cause (active treatment vs placebo)
Drop-outs due to AEs (active treatment vs placebo)
Remarks from reviewer
Assessedquality
Tariot et al2000 [45]
16, 24 mg/day, 5 months
I: CIBIC 1–3:20% 16 mg, 22% 24 mg, 12% placeboCIBIC 1–4:66% 16 mg, 64% 24 mg,49% placebo∆ADAS-cog:16 mg and 24 mg: 3.1 pII: ≥4 p ADAS-cog36–37% 16–24 mg vs 20% placeboADCS-ADL better pre- served 16 and 24 mg.NPI less deterioration 16 and 24 mg (∆2.0 p)
16 mg:60/279 (22%)24 mg:61/273 (22%) Placebo:446/286 (16%) ns
16 mg:19/279 (7%)24 mg:27/273 (10%) Placebo:20/286 (7%)ns
Significantly more improved and impro-ved/unchanged global function. ADAS-cog higher scores in galantamine and ADL better preserved. Equal rates of withdrawals
High
All analyses are ITT or ITT-LOCF.
AD = Alzheimer’s disease; ADAS = Alzheimer’s disease assessment scale–cognitive; ADL = Activities of daily living; AE = Adverse events; BADL = Basic activities of daily living; BPSD = Behavioral and psychological signs and symptoms of dementia; CBF = Cerebral blood flow; CDR = Clinical dementia rating (scale); CGIC = Clinical global impression of change (scale); CIBIC = Clinician’s interview-based impression of change; CMCS = Caregiver Modified Chrichton Scale; CMR = Cerebral metabolic rate; DAD = Disability assessment for dementia (scale); GBS = Gottfries-Brane-Steen (scale); GDS = Global Deterioration Scale; IADL = Instrumental activities of daily living; IDDD = Interview for deterioration in daily living activities in dementia; MENFIS = Mental function impair-ment scale; MMSE = Mini-mental state examination; NPI = Neuropsychiatric inventory; ns = Not stated; OC = Observed cases; OR = Odds ratio; PDS = Progressive deteriora-tion scale; PSMS = Physical self maintenance scale; QoL = Quality of Life; SB = Single-blind

C H A P T E R 2 2 • P H A R M AC O LO G I C A L T R E AT M E N T O F D E M E N T I A – E S TA B L I S H E D D R U G S
341
Table 22.3 continued
Author Year, reference
Intervention, length of study
Results active vs placebo or baseline vs end point I = primary, II = secondary outcomes Significant differences unless otherwise stated
Drop-outs any cause (active treatment vs placebo)
Drop-outs due to AEs (active treatment vs placebo)
Remarks from reviewer
Assessedquality
Tariot et al2000 [45]
16, 24 mg/day, 5 months
I: CIBIC 1–3:20% 16 mg, 22% 24 mg, 12% placeboCIBIC 1–4:66% 16 mg, 64% 24 mg,49% placebo∆ADAS-cog:16 mg and 24 mg: 3.1 pII: ≥4 p ADAS-cog36–37% 16–24 mg vs 20% placeboADCS-ADL better pre- served 16 and 24 mg.NPI less deterioration 16 and 24 mg (∆2.0 p)
16 mg:60/279 (22%)24 mg:61/273 (22%) Placebo:446/286 (16%) ns
16 mg:19/279 (7%)24 mg:27/273 (10%) Placebo:20/286 (7%)ns
Significantly more improved and impro-ved/unchanged global function. ADAS-cog higher scores in galantamine and ADL better preserved. Equal rates of withdrawals
High

D E M E N T I A – D I AG N O S T I C A N D T H E R A P E U T I C I N T E RV E N T I O N S342
Table 22.4 Memantine: Outcomes, adverse events and attrition.
Author Year, referenceType of dementia disorder
Intervention Length of study
Results I = primary, II = secon-dary outcomes Significant differences unless otherwise stated
Drop-outs any cause (active treatment vs placebo)
Drop-outs due to AEs (active treatment vs placebo)
Remarks from reviewer Assessed quality
Winblad et al 1999 [18] MID + AD
10 mg/day, 12 weeks
I: BGP “care dependency” improved >15%: 65% vs 40%, ns BGP “care dependency” score –3.1 +/–12.2 p vs –1.1 +/–11.8 p CGI-C 1–3: 73% vs 45% CGI-C 1–4: 96% vs 90% ns II: BGP total score –7.2 +/–7.1 p vs –4.6 +/–7
7/82 (8%) vs 8/84 (9%) ns
ns Ns primary outcome care dependency, significantly more in memantine-group globally improved. Almost all participants were rated globally unchanged after 12 weeks. Equal rates of withdrawals
Moderate
Wilcock et al 2002 [17] VaD
20 mg/day, 28 weeks
I: CGI-C ns ∆ADAS-cog 1.8 p II: GBS ns NOSGER ns ∆MMSE 0.3 p (OC) ns
57/295 (19%) vs 58/284 (20%) ns
27/295 (9%) vs 20/284 (7%) ns
Small positive effect ADAS-cog, all other endpoints ns. Equal rates of withdrawals
Moderate
Orgogozo et al 2002 [16] VaD
20 mg/day, 28 weeks
I: CIBIC+ mean 3.8+/–1.4 p vs 4.1 +/–1.5 p, ns CIBIC+ 1–4: 60% vs 52%, ns ∆ADAS-cog: 2.0 p II: GBS mem > placebo NOSGER ns ∆MMSE 1.2 p (OC)
49/165 (30%) vs 38/156 (24%) ns
19/165 (12%) vs 20/156 (13%) ns
Small positive effect ADAS-cog and GBS, all other endpoints ns. Equal rates of withdrawals
Moderate

C H A P T E R 2 2 • P H A R M AC O LO G I C A L T R E AT M E N T O F D E M E N T I A – E S TA B L I S H E D D R U G S
343
The table continues on the next page
Table 22.4 Memantine: Outcomes, adverse events and attrition.
Author Year, referenceType of dementia disorder
Intervention Length of study
Results I = primary, II = secon-dary outcomes Significant differences unless otherwise stated
Drop-outs any cause (active treatment vs placebo)
Drop-outs due to AEs (active treatment vs placebo)
Remarks from reviewer Assessed quality
Winblad et al 1999 [18] MID + AD
10 mg/day, 12 weeks
I: BGP “care dependency” improved >15%: 65% vs 40%, ns BGP “care dependency” score –3.1 +/–12.2 p vs –1.1 +/–11.8 p CGI-C 1–3: 73% vs 45% CGI-C 1–4: 96% vs 90% ns II: BGP total score –7.2 +/–7.1 p vs –4.6 +/–7
7/82 (8%) vs 8/84 (9%) ns
ns Ns primary outcome care dependency, significantly more in memantine-group globally improved. Almost all participants were rated globally unchanged after 12 weeks. Equal rates of withdrawals
Moderate
Wilcock et al 2002 [17] VaD
20 mg/day, 28 weeks
I: CGI-C ns ∆ADAS-cog 1.8 p II: GBS ns NOSGER ns ∆MMSE 0.3 p (OC) ns
57/295 (19%) vs 58/284 (20%) ns
27/295 (9%) vs 20/284 (7%) ns
Small positive effect ADAS-cog, all other endpoints ns. Equal rates of withdrawals
Moderate
Orgogozo et al 2002 [16] VaD
20 mg/day, 28 weeks
I: CIBIC+ mean 3.8+/–1.4 p vs 4.1 +/–1.5 p, ns CIBIC+ 1–4: 60% vs 52%, ns ∆ADAS-cog: 2.0 p II: GBS mem > placebo NOSGER ns ∆MMSE 1.2 p (OC)
49/165 (30%) vs 38/156 (24%) ns
19/165 (12%) vs 20/156 (13%) ns
Small positive effect ADAS-cog and GBS, all other endpoints ns. Equal rates of withdrawals
Moderate

D E M E N T I A – D I AG N O S T I C A N D T H E R A P E U T I C I N T E RV E N T I O N S344
Table 22.4 continued
Author Year, reference
Intervention Length of study
Results I = primary, II = secon-dary outcomes Significant differences unless otherwise stated
Drop-outs any cause (active treatment vs placebo)
Drop-outs due to AEs (active treatment vs placebo)
Remarks from reviewer Assessedquality
Reisberg et al 2003 [19] Moderate/Severe AD
20 mg/day, 28 weeks I: CIBIC+ and ADCS or SIB repsonders*:29% vs 10%CIBIC+ mean: 45 +/–1.1 p vs 4.8 +/–1.1, p = 0.06ADCS-ADLsev –3.1 +/–6.8 p vs –5.2 +/–6.3 pII: FAST 0.2 +/–1.2 +/–0.6 +/–1.4 signGDS nsSIB –4.0 +/–11.3 p vs–10.1 +/–13.5 p, sign∆MMSE 0.7 p, ns∆NPI 3.3 p, ns
29/126 (23%) vs 42/126 (33%) ns
13/126 (10%)vs 22/126 (17%) ns
Memantine significant effect on one of the primary outcomes:* prespecified individual rep-sonse defined as improved or unchanged CIBIC+ and improved or unchanged ADCS or SIB, but CIVIC+ ns. SIB memantine >pla-cebo, but no clear differences on other secondary outcomes. Equal rates of withdrawals
Moderate
Tariot et al 2004 [20]
20 mg/day or placebo added to donepezil 28 weeks
I: SIB + 0.9 p (0.67) vs –2.5 p (0.67) ADCS-ADL –2.0 (0.5) vs –3.4 (0.5) II: Mean CIBIC+ 4.41 (0.07) vs 4.66 (0.08) CIBIC+ 1–4 55% vs 45% ∆NPI 3.8 p BGP dependency subscale 0.8 (0.4) vs 2.3 (0.4), sign
31/203 (15%) vs 51/201 (25%) ns
15/203 (7%) vs 25/201 (12%) ns
Small positive effect on global ratings (55% vs 45% improved or better), cognitive function, ADL and BPSD. Equal rates of withdrawals
Moderate
ITT-LOCF analyses unless otherwise stated.
ADAS = Alzheimer’s disease assessment scale; ADL = Activities of daily living; ADCS = Alzheimer’s disease cooperative study; BGP = The behavioral rating scale for geriatric patients; BPSD = Behavioral and psychological signs and symptoms of dementia; CGI = Clinical global impression (scale); CIBIC = Clinician’s interview-based impression of change; FAST = Functional assessment staging; GBS = Gottfries-Brane-Steen; MMSE = Mini-mental state examination; NOSGER = Nurses’ observation scale for geriatric patients; NPI = Neuropsychiatric inventory; ns = Not stated; p = Points; SIB =The severe impairment battery

C H A P T E R 2 2 • P H A R M AC O LO G I C A L T R E AT M E N T O F D E M E N T I A – E S TA B L I S H E D D R U G S
345
Table 22.4 continued
Author Year, reference
Intervention Length of study
Results I = primary, II = secon-dary outcomes Significant differences unless otherwise stated
Drop-outs any cause (active treatment vs placebo)
Drop-outs due to AEs (active treatment vs placebo)
Remarks from reviewer Assessedquality
Reisberg et al 2003 [19] Moderate/Severe AD
20 mg/day, 28 weeks I: CIBIC+ and ADCS or SIB repsonders*:29% vs 10%CIBIC+ mean: 45 +/–1.1 p vs 4.8 +/–1.1, p = 0.06ADCS-ADLsev –3.1 +/–6.8 p vs –5.2 +/–6.3 pII: FAST 0.2 +/–1.2 +/–0.6 +/–1.4 signGDS nsSIB –4.0 +/–11.3 p vs–10.1 +/–13.5 p, sign∆MMSE 0.7 p, ns∆NPI 3.3 p, ns
29/126 (23%) vs 42/126 (33%) ns
13/126 (10%)vs 22/126 (17%) ns
Memantine significant effect on one of the primary outcomes:* prespecified individual rep-sonse defined as improved or unchanged CIBIC+ and improved or unchanged ADCS or SIB, but CIVIC+ ns. SIB memantine >pla-cebo, but no clear differences on other secondary outcomes. Equal rates of withdrawals
Moderate
Tariot et al 2004 [20]
20 mg/day or placebo added to donepezil 28 weeks
I: SIB + 0.9 p (0.67) vs –2.5 p (0.67) ADCS-ADL –2.0 (0.5) vs –3.4 (0.5) II: Mean CIBIC+ 4.41 (0.07) vs 4.66 (0.08) CIBIC+ 1–4 55% vs 45% ∆NPI 3.8 p BGP dependency subscale 0.8 (0.4) vs 2.3 (0.4), sign
31/203 (15%) vs 51/201 (25%) ns
15/203 (7%) vs 25/201 (12%) ns
Small positive effect on global ratings (55% vs 45% improved or better), cognitive function, ADL and BPSD. Equal rates of withdrawals
Moderate

D E M E N T I A – D I AG N O S T I C A N D T H E R A P E U T I C I N T E RV E N T I O N S346
Table 22.5 Acetylcholinesterase inhibitors in vascular dementia: Description of randomised, placebo-controlled trials.
Author Year, reference
Type of study Setting Mean MMSE (range)
Randomised patients (n)
Mean age (range) Length of study Intervention
Wilkinson et al 2003 [67]
RCT USA, Europe, Canada, Australia
22 (10–26) 616 VaD
75 (38–95)
24 weeks Donepezil 5, 10 mg/day
Black et al 2003 [68]
RCT USA, Europe, Canada, Australia
22 (10–26) 603 VaD
74 24 weeks Donepezil 5, 10 mg/day
Erkinjuntti et al 2002 [60,62]
RCT Europe, Canada, USA 20.5 (10–25) 592 VaD and AD + CVD
75 6 months Galantamine 24 mg/day
Females 40–48%.
AD = Alzheimer’s disease; CVD = Cerebrovascular disease; RCT = Randomised controlled trial; VaD = Vascular dementia

C H A P T E R 2 2 • P H A R M AC O LO G I C A L T R E AT M E N T O F D E M E N T I A – E S TA B L I S H E D D R U G S
347
Table 22.5 Acetylcholinesterase inhibitors in vascular dementia: Description of randomised, placebo-controlled trials.
Author Year, reference
Type of study Setting Mean MMSE (range)
Randomised patients (n)
Mean age (range) Length of study Intervention
Wilkinson et al 2003 [67]
RCT USA, Europe, Canada, Australia
22 (10–26) 616 VaD
75 (38–95)
24 weeks Donepezil 5, 10 mg/day
Black et al 2003 [68]
RCT USA, Europe, Canada, Australia
22 (10–26) 603 VaD
74 24 weeks Donepezil 5, 10 mg/day
Erkinjuntti et al 2002 [60,62]
RCT Europe, Canada, USA 20.5 (10–25) 592 VaD and AD + CVD
75 6 months Galantamine 24 mg/day

D E M E N T I A – D I AG N O S T I C A N D T H E R A P E U T I C I N T E RV E N T I O N S348
Table 22.6 Actylcholinesterase inhibitors in vascular dementia: Outcomes, adverse events and attrition.
Author Year, reference
Intervention, length of study
Results I = primary, II = secondary outcomes Significant differences unless otherwise stated
Drop-outs any cause (active treatment vs placebo)
Drop-outs due to AEs (active treatment vs placebo)
Remarks from reviewer Assessedquality
Wilkinson et al 2003 [67]
Donepezil 5, 10 mg/day, 24 weeks
I: CIBIC 1–3: 39% 5 mg, 32% 10 mg, 25% placebo ∆ADAS-cog: 1.6 p 5 mg, 2.1 p 10 mg, sign II: CDR-SB improved 10 mg ∆MMSE:1.0 p 5 mg, 1.3 p 10 mg ADL (ADFACS) ns
5 mg: 40/203 (19%) 10 mg: 53/203 (25%) Placebo: 32/189 (17%)
5 mg: 21/203 (10%) 10 mg: 35/203 (16%) Placebo: 17/189 (9%)
Small but significant global impro-vement 5 and 10 mg, cognitive tests donepezil > placebo, ADL ns. Equal rates of withdrawals
Moderate
Black et al 2003 [68]
Donepezil 5, 10 mg/day, 24 weeks
I: CIBIC 1–3: 36% 5 mg, 28% 10 mg, 30% placebo CIBIC 1–4: 77% 5 mg 72% 10 mg, 69% placebo, ns ∆ADAS-cog: 1.7 p 5 mg, 2.2 p 10 mg II: CDR-SB ns 5 mg, sign 10 mg ∆MMSE: 0.65 p 5 mg, 1.10 p 10 mg Better ADL (ADFACS) 5 and 10 mg
5 mg: 37/196 (19%) 10 mg: 58/195 (28%) Placebo: 30/194 (15%)
5 mg: 22/196 (11%) 10 mg: 45/195 (22%) Placebo: 22/194 (11%)
Small significant global improvement 5 mg, ns 10 mg, cognitive tests and ADL donepezil > placebo. More withdrawals in 10 mg
Moderate
Erkinjuntti et al 2002 [86] VaD and AD + CVD
Galantamine 24 mg/day, 6 months
I: CIBIC 1–3: AD + CVD 32% vs 19% VaD 31% vs 23%, ns CIBIC 1–4: All patients: 74% vs 59%, sign ∆ADAS-cog: All patients 2.7 p (sign), AD + CVD (n = 239) 2.8 p (sign), VaD (n = 188) 1.9 p, ns II: ADAS-cog ≥0 p all patients: 64% vs 51% ADAS-cog ≥4 p all patients: 35% vs 22% ADL (DAD) less decline ∆NPI 2.2 p
102/396 (26%) vs 33/196 (17%) sign
78/396 (20%) vs 16/196 (8%) sign
Two different diagnoses in the same study, too small sample for subana-lyses. VaD patients did not benefit from galantamine. More withdrawals in galantamine
Medium
ITT-LOCF or ITT analyses.
AD = Alzheimer’s disease; ADAS = Alzheimer’s disease assessment scale; ADFACS = The Alzheimer’s disease functional assessment and change scale; ADL = Activities of daily living; CDR = Clinical dementia rating; CIBIC = Clinician’s interview-based impression of change;

C H A P T E R 2 2 • P H A R M AC O LO G I C A L T R E AT M E N T O F D E M E N T I A – E S TA B L I S H E D D R U G S
349
CVD = Cerebrovascular disease; DAD = Disability assessment for dementia (scale); MMSE = Mini-mental state examination; NPI = Neuropsychiatric inventory; ns = Not stated; p = points; SB = Single-blind; VaD = Vascular dementia
Table 22.6 Actylcholinesterase inhibitors in vascular dementia: Outcomes, adverse events and attrition.
Author Year, reference
Intervention, length of study
Results I = primary, II = secondary outcomes Significant differences unless otherwise stated
Drop-outs any cause (active treatment vs placebo)
Drop-outs due to AEs (active treatment vs placebo)
Remarks from reviewer Assessedquality
Wilkinson et al 2003 [67]
Donepezil 5, 10 mg/day, 24 weeks
I: CIBIC 1–3: 39% 5 mg, 32% 10 mg, 25% placebo ∆ADAS-cog: 1.6 p 5 mg, 2.1 p 10 mg, sign II: CDR-SB improved 10 mg ∆MMSE:1.0 p 5 mg, 1.3 p 10 mg ADL (ADFACS) ns
5 mg: 40/203 (19%) 10 mg: 53/203 (25%) Placebo: 32/189 (17%)
5 mg: 21/203 (10%) 10 mg: 35/203 (16%) Placebo: 17/189 (9%)
Small but significant global impro-vement 5 and 10 mg, cognitive tests donepezil > placebo, ADL ns. Equal rates of withdrawals
Moderate
Black et al 2003 [68]
Donepezil 5, 10 mg/day, 24 weeks
I: CIBIC 1–3: 36% 5 mg, 28% 10 mg, 30% placebo CIBIC 1–4: 77% 5 mg 72% 10 mg, 69% placebo, ns ∆ADAS-cog: 1.7 p 5 mg, 2.2 p 10 mg II: CDR-SB ns 5 mg, sign 10 mg ∆MMSE: 0.65 p 5 mg, 1.10 p 10 mg Better ADL (ADFACS) 5 and 10 mg
5 mg: 37/196 (19%) 10 mg: 58/195 (28%) Placebo: 30/194 (15%)
5 mg: 22/196 (11%) 10 mg: 45/195 (22%) Placebo: 22/194 (11%)
Small significant global improvement 5 mg, ns 10 mg, cognitive tests and ADL donepezil > placebo. More withdrawals in 10 mg
Moderate
Erkinjuntti et al 2002 [86] VaD and AD + CVD
Galantamine 24 mg/day, 6 months
I: CIBIC 1–3: AD + CVD 32% vs 19% VaD 31% vs 23%, ns CIBIC 1–4: All patients: 74% vs 59%, sign ∆ADAS-cog: All patients 2.7 p (sign), AD + CVD (n = 239) 2.8 p (sign), VaD (n = 188) 1.9 p, ns II: ADAS-cog ≥0 p all patients: 64% vs 51% ADAS-cog ≥4 p all patients: 35% vs 22% ADL (DAD) less decline ∆NPI 2.2 p
102/396 (26%) vs 33/196 (17%) sign
78/396 (20%) vs 16/196 (8%) sign
Two different diagnoses in the same study, too small sample for subana-lyses. VaD patients did not benefit from galantamine. More withdrawals in galantamine
Medium

D E M E N T I A – D I AG N O S T I C A N D T H E R A P E U T I C I N T E RV E N T I O N S350
Table 22.7 Acetylcholinesterase inhibitors in Lewy body dementia and Parkinsons disease with dementia. Description of randomised placebo-controlled trials.
Author Year, references
Diagnosis Type of study Setting Mean MMSE (range)
Randomised patients (n)
Mean age (range) Length of study Intervention
McKeith et al 2000 [58]
DLB RCT United Kingdom, Spain, Italy
(9–) Mild-moderate
120 73.9 (57–87) 20 weeks Rivastigmine 6–12 mg/day
Aarsland et al 2002 [71]
PD + memory impairment
RCT Crossover
Norway, single-center
20.8 (16–26) 14 2 x 10 weeks Donepezil 5–10 mg/day
Emre et al 2004 [72]
PD dementia RCT Several European countries
19.3 (10–24) 541 72.7 24 weeks Rivastigmine 3–12 mg/day
DLB = Dementia with Lewy body; PD = Parkinson’s disease; RCT = Randomised controlled trial

C H A P T E R 2 2 • P H A R M AC O LO G I C A L T R E AT M E N T O F D E M E N T I A – E S TA B L I S H E D D R U G S
351
Table 22.7 Acetylcholinesterase inhibitors in Lewy body dementia and Parkinsons disease with dementia. Description of randomised placebo-controlled trials.
Author Year, references
Diagnosis Type of study Setting Mean MMSE (range)
Randomised patients (n)
Mean age (range) Length of study Intervention
McKeith et al 2000 [58]
DLB RCT United Kingdom, Spain, Italy
(9–) Mild-moderate
120 73.9 (57–87) 20 weeks Rivastigmine 6–12 mg/day
Aarsland et al 2002 [71]
PD + memory impairment
RCT Crossover
Norway, single-center
20.8 (16–26) 14 2 x 10 weeks Donepezil 5–10 mg/day
Emre et al 2004 [72]
PD dementia RCT Several European countries
19.3 (10–24) 541 72.7 24 weeks Rivastigmine 3–12 mg/day

D E M E N T I A – D I AG N O S T I C A N D T H E R A P E U T I C I N T E RV E N T I O N S352
Table 22.8 Acetylcholinesterase inhibitors in LBD and PDD: Outcomes, adverse events and attrition.
Author Year, reference
Diagnosis Results active vs pla-cebo or baseline vs end point I = primary, II = secon-dary outcomes Significant differences unless otherwise stated
Drop-outs any cause (active treatment vs placebo)
Drop-outs due to AEs (active treatment vs placebo)
Remarks from reviewer Assessedquality
McKeith et al 2000 [58]
DLB I: ∆NPI-4 1.7 p (ns ITT, sign ITT-LOCF) Cognitive speed score riva > placebo II: NPI-4 >30% improve-ment: 48% vs 28%, sign NPI-10 ns (ITT), MMSE ns, CGC + ns
18/59 (30%) vs 10/61 (16%)
7/59 (12%) vs 7/61 (12%)
Non-significant differences in ITT analyses of one of the primary outcomes. High discontinuation rate and AEs (37% nausea, 25% vomiting) in rivastigmine group
Moderate
Aarsland et al 2002 [71]
PD + memory impairment
I: ∆MMSE 1.8 p CIBIC + mean score 3.3 don, 4.1 placebo CIBIC 1–3: 42% vs 17%
2/14 (14%) vs 0
2/14 (14%) vs 0
No worsening of parkin-sonism in donepezil group
Moderate
Emre et al 2004 [72]
PD dementia I: ∆ADAS-cog 2.8 p CGIC 1–3: 20% vs 14% CGIC 1–4: 87% vs 77% mean score 3.8 vs 4.3 II: ADCS-ADL, NPI, MMSE riva > placebo
99/362 (27%) vs 32/179 (18%)
62/162 (17%) vs 14/179 (8%)
Similar small positive effects on global and cognitive func-tion as in AD studies. ADL and BPSD rivastigmine > placebo AEs: 29% vs 11% nausea, 17% vs 2% vomiting, 10% vs 4% tremor in rivastigmine vs placebo patients
Moderate
AD = Alzheimer’s disease; ADAS = Alzheimer’s disease assessment scale; ADCS = Alzheimer’s disease cooperative study; AE = Adverse events; ADL = Activities of daily living; BPSD = Behavioral and psychological signs and symptoms of dementia; CGIC = Clinical global impression of change (scale); CIBIC = Clinician’s interview-based impression of change; ITT = intention-to-treat; LOCF = Last observation carried forward; MMSE = Mini-mental state examination; NPI = Neuropsychiatric inventory; ns = Not stated

C H A P T E R 2 2 • P H A R M AC O LO G I C A L T R E AT M E N T O F D E M E N T I A – E S TA B L I S H E D D R U G S
353
Table 22.8 Acetylcholinesterase inhibitors in LBD and PDD: Outcomes, adverse events and attrition.
Author Year, reference
Diagnosis Results active vs pla-cebo or baseline vs end point I = primary, II = secon-dary outcomes Significant differences unless otherwise stated
Drop-outs any cause (active treatment vs placebo)
Drop-outs due to AEs (active treatment vs placebo)
Remarks from reviewer Assessedquality
McKeith et al 2000 [58]
DLB I: ∆NPI-4 1.7 p (ns ITT, sign ITT-LOCF) Cognitive speed score riva > placebo II: NPI-4 >30% improve-ment: 48% vs 28%, sign NPI-10 ns (ITT), MMSE ns, CGC + ns
18/59 (30%) vs 10/61 (16%)
7/59 (12%) vs 7/61 (12%)
Non-significant differences in ITT analyses of one of the primary outcomes. High discontinuation rate and AEs (37% nausea, 25% vomiting) in rivastigmine group
Moderate
Aarsland et al 2002 [71]
PD + memory impairment
I: ∆MMSE 1.8 p CIBIC + mean score 3.3 don, 4.1 placebo CIBIC 1–3: 42% vs 17%
2/14 (14%) vs 0
2/14 (14%) vs 0
No worsening of parkin-sonism in donepezil group
Moderate
Emre et al 2004 [72]
PD dementia I: ∆ADAS-cog 2.8 p CGIC 1–3: 20% vs 14% CGIC 1–4: 87% vs 77% mean score 3.8 vs 4.3 II: ADCS-ADL, NPI, MMSE riva > placebo
99/362 (27%) vs 32/179 (18%)
62/162 (17%) vs 14/179 (8%)
Similar small positive effects on global and cognitive func-tion as in AD studies. ADL and BPSD rivastigmine > placebo AEs: 29% vs 11% nausea, 17% vs 2% vomiting, 10% vs 4% tremor in rivastigmine vs placebo patients
Moderate

D E M E N T I A – D I AG N O S T I C A N D T H E R A P E U T I C I N T E RV E N T I O N S354
1. Summers WK, Majovski L, Marsh GM, Tachiki K, Kling A. Oral tetrahydro- aminoacridine in long-term treatment of senile dementia Alzheimer type. N Engl J Med 1986;315:1241-5.
2. Coelho Filho JM, Birks J. Physostigmine for Alzheimer’s disease. Cochrane Database Syst Rev 2003.
3. Lopez-Arrieta JM, Schneider L. Metri-fonate for Alzheimer’s disease. Cochrane Database Syst Rev 2006.
4. Birks JS, Harvey R. Donepezil for dementia due to Alzheimer’s disease. Cochrane Database Syst Rev 2006.
5. Birks J, Grimley Evans J, Iakovidou V, Tsolaki M. Rivastigmine for Alzheimer’s disease. Cochrane Database Syst Rev 2003.
6. Olin SL. Galantamine for Alzheimer’s disease. Cochrane Database Syst Rev 2003.
7. Areosa Sastre A, Sherriff F. Memantine for dementia. Cochrane Database Syst Rev 2003.
8. Feldman H, Gauthier S, Hecker J, Vellas B, Subbiah P, Whalen E. A 24-week, ran-domised, double-blind study of donepezil in moderate to severe Alzheimer’s disease. Neurology 2001;57:613-20.
9. Tariot PN, Cummings J, Katz IR, MIntzer J, Perdomo CA, Schwam EM, Whalen E. A randomised, double-blind, placebo-controlled study of the efficacy and safety of donepezil in patients with Alzheimer’s disease in the nursing home setting. J Am Geriatr Soc 2001;49:1590-9.
10. Courtney C, Farrell D, Gray R, Hills R, Lynch L, Sellwood E, et al. Long-term donepezil treatment in 565 patients with Alzheimer’s disease (AD2000): rando- mised double-blind trial. Lancet 2004;3 63:2105-15.
11. Nakano S, Asada T, Matsuda H, Uno M, Takasaki M. Donepezil hydrochloride preserves regional cerebral blood flow in patients with Alzheimer’s disease. J Nucl Med 2001;42:1441-5.
12. Tune L, Tiseo P, Ieni J, Perdomo C, Pratt RD, Votaw JR, Jewart R, Hoffman JM. Donepezil HCl (E2020) maintains functional brain activity in patients with Alzheimer disease: results of a 24-week, double-blind, placebo-controlled study. Am J Geriatr Psychiatry 2003;11:169-77.
13. Krishnan KR, Charles H, Doraiswamy PM, Mintzer J, Weisler R, Yu X et al. Ran-domised, placebo-controlled trial of the effects of donepezil on neuronal markers and hippocampal volumes in Alzheimer’s disease. Am J Psychiatry 2003;160:2003-11.
14. Wilkinson DG, Hock C, Farlow M, van Baelen B, Schwalen S. Galantamine provides broad benefits in patients with ‘advanced moderate’ Alzheimer’s disease (MMSE <or = 12) for up to six months. Int J Clin Pract 2002;56:509-14.
15. Wilcock G, Howe I, Coles H, Lilienfeld S, Truyen L, Zhu Y, Bullock R, Kershaw P, GAL-GBR-2 Study Group. A long-term comparison of galantamine and donepezil in the treatment of Alzheimer’s disease. Drugs Aging 2003;20:777-89.
References

C H A P T E R 2 2 • P H A R M AC O LO G I C A L T R E AT M E N T O F D E M E N T I A – E S TA B L I S H E D D R U G S
355
16. Orgogozo J-M, Rigaud A-S, Stöffler A, Mobius HJ, Forette F. Efficacy and safety of memantine in patients with mild to moderate vascular dementia. A ran-domised, placebo-controlled trial (MMM 300). Stroke 2002;33:1834-39.
17. Wilcock G, Mobius H, Stoffler A. A double-blind, placebo-controlled multicen-tre study of memantine in mild to moder-ate vascular dementia (MMM 500). Int Clin Psychopharmacol 2002;17:297-305.
18. Winblad B, Poritis N. Memantine in severe dementia: results of the 9M-Best Study (Benefit and efficacy in severely demented patients during treatment with memantine). Int J Geriatr Psychiatry 1999;14:135-46.
19. Reisberg B, Doody R, Stoffler A, Schmitt F, Ferris S, Mobius HJ. Meman-tine in moderate-to-severe Alzheimer’s disease. N Engl J Med 2003;348:1333-41.
20. Tariot PN, Farlow M, Grossberg GT, Graham SM, McDonald S, Gergel I, Memantine Study Group. Memantine treatment in patients with moderate to severe Alzheimer disease already receiving donepezil: a randomised controlled trial. JAMA 2004;291:317-24.
21. Schneider LS, Olin J, Doody RS et al, and the Alzheimer’s Disease Coopera-tive Study. Validity and reliability of the Alzheimer’s Disease Cooperative Study – Clinical Global Impression of Change. Alzheimer Dis Assoc Disord 1997;11(suppl 2):S22-S32.
22. Berg L, Miller J, Baty J, Rubin EH, Morris JC, Figiel G. Mild senile dementia of the Alzheimer type: 4 evaluations of intervention. Ann Neurol 1992;31:242-9.
23. Reisberg B, Ferris S, de Leon MJ, Crook T. The Global Deterioration Scale for assess-ment of primary degenerative dementia. Am J Psychiatry 1982;139:1136-9.
24. Gottfries CG, Bråne G, Gullberg B et al. A new rating scale for dementia syndromes. Arch Gerontol Geriatr 1982;1:311-30.
25. Homma A, Niina R, Ishii T, Hasegawa K. Development of a new rating scale for dementia in the elderly: Mental Function Impairment Scale (MENFIS). Jpn J Geriatr Psychiatry 1991;2:1217-22.
26. van der Kam P, Mol F, Wimmers M. Beoordelingsschaal voor Oudere Patienten (BOP). Deventer, the Netherlands, van Loghum Slaterus; 1971.
27. Ditzler K. Efficacy and tolerability of memantine in patients with dementia syn-drome: a double-blind, placebo controlled trial. Arzneimittelforschung 1991;41: 773-80.
28. Feldman H, Schulzer M, Wang S Twokko H, Beattie BL. The Functional Rating Scale in Alzheimer’s disease assess-ment: a longitudinal study. In: Iqbal K MJ, Winblad B, Wisniewski HM, editor. Research Advances in Alzheimer’s Disease and Related Disorders. Chichester, UK: Wiley; 1995. p 235-41.
29. Forette F, Anand R, Gharabawi G. A phase II study in patients with Alzheimer’s disease to assess the preliminary efficacy and maximum tolerated dose of rivastigmine (Exelon). Eur J Neurol 1999;6:423-9.
30. Mohs RC, Davis B, Johns CA et al. Oral physostigmine treatment of patients with Alzheimer’s disease. Am J Psychiatry 1985;142:28-33.

D E M E N T I A – D I AG N O S T I C A N D T H E R A P E U T I C I N T E RV E N T I O N S356
31. Rogers SL, Farlow M, Doody RS, Mohs R, Friedhoff LT. A 24-week, double-blind, placebo-controlled trial of donepe- zil in patients with Alzheimer’s disease. Neurology 1998;50:136-45.
32. Rösler M, Anand R, Cicin-Sain A, Gauthier S, Agid Y, Dal-Bianco P, Stahelin HB, Hartman R, Gharabawi M. Efficacy and safety of rivastigmine in patients with Alzheimer’s disease: interna-tional randomised controlled trial. BMJ 1999;318:633-8.
33. Folstein NF, Folstein S, McHugh PR. Mini-Mental State: a practical method for grading the cognitive state of patients for the clinician. J Psychiatr Res 1975;12: 189-98.
34. Panisset M, Roudier M, Saxton J, Boller F. Severe Impairment Battery: a neurological test for severely demented patients. Arch Neurol 1994;51:41-5.
35. DeJong R, Osterlund O, Roy GW. Measurement of quality-of-life changes in patients with Alzheimer’s disease. Clin Ther 1989;11:545-54.
36. Gelinas I, Gauthier L, McIntyre M, Gauthier S. Development of a functional measure for persons with Alzheimer’s dis-ease: the disability assessment for demen-tia. Am J Occup Ther 1999;53:471-81.
37. Teunisse S, Derix M, van Crevel H. Assessing the severity of dementia, patient and caregiver. Arch Neurol 1991;48:274-7.
38. Galasko D, Bennett D, Sano M et al. An inventory to assess the activities of daily living for clinical trials in Alzheimer’s dis- ease. The Alzheimer’s Disease Coopera- tive Study. Alz Dis Assoc Disord 1997;11 (suppl 2):S33-9.
39. Lawton MP, Brody E. Assessment of older people: self-maintaing and instru-mental activities of daily living. Gerontol 1969;9:179-86.
40. Schmeidler J, Mohs R, Aryan M. Re-lationship of disease severity to decline on specific cognitive and functional measures in Alzheimer’s disease. Alzheimer Dis Assoc Disord 1998;12:146-51.
41. Homma A, Takeda M, Imai Y, Udaka F, Hasegawa K, Kameyama M, Nishimura T. Clinical efficacy and safety of donepe- zil on cognitive and global function in pa-tients with Alzheimer’s disease. A 24-week, multicenter, double-blind, placebo-control-led study in Japan. E2020 Study Group. Dement Geriatr Cogn Disord 2000;11: 299-313.
42. Cummings JL, Mega M, Gray K, Rosenberg-Thompson S, Carusi DA, Gornberg J. The Neuropsychiatric Inven-tory: comprehensive assessment of psycho-pathology in dementia. Neurology 1994; 44:2308-14.
43. Burns A, Rossor M, Hecker J, Gauthier S, Petit H, Möller HJ, Rogers SL, Friedhoff LT. The effects of donepezil in Alzhe-imer’s disease – results from a multina-tional trial. Dement Geriatr Cogn Disord 1999;10:237-44.
44. Wilcock GK, Lilienfeld S, Gaens E. Ef-ficacy and safety of galantamine in patients with mild to moderate Alzheimer’s disease: multicentre randomised controlled trial. BMJ 2000;321:1445-9.
45. Tariot PN, Solomon P, MOrris JC, Kershaw P, Lilienfeld S, Ding C. A 5-month, randomised, placebo-controlled trial of galantamine in AD. Neurology 2000;54:2269-76.

C H A P T E R 2 2 • P H A R M AC O LO G I C A L T R E AT M E N T O F D E M E N T I A – E S TA B L I S H E D D R U G S
357
46. Raskind MA, Peskind E, Wessel T, Yuan W. Galantamine in AD. A 6-month randomised, placebo-controlled trial with a 6-month extension. Neurology 2000;54:2261-8.
47. Winblad B, Engedal K, Soininen H, Verhey F, Waldemar G, Wimo A, Wetterholm AL, Zhang R, Haglund A, Subbiah P. A 1-year, randomised, placebo-controlled study of donepezil in patients with mild to moderate AD. Neurology 2001;57:489-95.
48. Mohs RC, Doody R, Morris JC, Ieni JR, Rogers SL, Perdomo CA, Pratt RD. A 1-year, placebo-controlled preservation of function survival study of donepezil in AD patients. Neurology 2001;57:481-8.
49. Unpublished I and II. Study trial numbers B304 and 351.
50. Corey-Bloom J, Anand R, Veach J. A randomised trial evaluating the efficacy and safety of ENA 713 (rivastigmine tar-trate), a new acetylcholinesterase inhibi- tor, in patients with mild to moderately severe Alzheimer’s disease. Int J Ger Psychopharmacol 1998;1:55-65.
51. Schneider LS, Anand R, Farlow MR. Systematic review of the efficacy of rivastigmine for patients with Alzheim-er’s disease. Int J Ger Psychopharmacol 1998;1(suppl 1):S26-S34.
52. Feldman H, Gauthier S, Hecker J, Vellas B, Emir B, Mastey V, Subbiah P, Donepezil MSAD Study Investigators Group. Efficacy of donepezil on mainte-nance of activities of daily living in patients with moderate to severe Alzheimer’s disease and the effect on caregiver burden. J Am Geriatr Soc 2003;51:737-44.
53. Gauthier S, Feldman H, Hecker J, Vellas B, Ames D, Subbiah P, Whalen E, Emir B, Donepezil MSAD Study Inves-tigators Group. Efficacy of donepezil on behavioral symptoms in patients with moderate to severe Alzheimer’s disease. Int Psychogeriatr 2002;14:389-404.
54. Potkin SG, Anand R, Hartman R, Veach J, Grossberg G. Impact of Alzhe-imer’s disease and rivastigmine treatment on activities of daily living over the course of mild to moderately severe disease. Prog Neuropsychopharm Biol Psychiatry 2002;26:713-20.
55. Doraiswamy PM, Krishnan K, Anand R, Sohn H, Danyluk J, Hartman RD, Veach J. Long-term effects of rivastigmine in moderately severe Alzheimer’s disease – does early initiation of therapy offer sus-tained benefits? Prog Neuropsychopharm Biol Psychiatry 2002;26:705-12.
56. Rockwood K, Graham J, Fay S. Goal setting and attainment in Alzheimer’s disease patients treated with donepezil. J Neurol Neurosurg Psychiatry 2002; 73:500-7.
57. Greenberg SM, Tennis M, Brown LB, Gomez-Isla T, Hayden DL, Schoenfeld DA, Walsh KL, et al. Donepezil therapy in clinical practice: a randomised cross-over study. Arch Neurol 2000;57:94-9.
58. McKeith I, Del Ser T, Spano P, Emre M, Wesnes K, Anand R, Cicin-Sain A, et al. Efficacy of rivastigmine in dementia with Lewy bodies: a randomised, double-blind, placebo-controlled international study. Lancet 2000;356:2031-6.
59. Farlow MR, Hake A, Messina J, Hartman R, Veach J, Anand R. Response

D E M E N T I A – D I AG N O S T I C A N D T H E R A P E U T I C I N T E RV E N T I O N S358
of patients with Alzheimer disease to rivastigmine treatment is predicted by the rate of disease progression. Arch Neurol 2001;58:417-22.
60. Erkinjuntti T, Skoog I, Lane R, Andrews C. Rivastigmine in patients with Alzheimer’s disease and concurrent hyper-tension. Int J Clin Pract 2002;56:791-6.
61. Kumar V, Anand R, Messina J, Hartman R, Veach J. An efficacy and safety analysis of Exelon in Alzheimer’s disease patients with concurrent vascular risk factors. Eur J Neurol 2000;7:159-69.
62. Erkinjuntti T, Kurz A, Gauthier S, Bullock R, Lilienfeld S, Damaraju CV. Efficacy of galantamine in probable vascular dementia and Alzheimer’s dis- ease combined with cerebrovascular dis-ease: a randomised trial. Lancet 2002; 359:1283-90.
63. Potkin SG, Anand R, Fleming K, Alva G, Keator D, Carreon D, Messina J, et al. Brain metabolic and clinical effects of rivastigmine in Alzheimer’s disease. Int J Neuropsychopharmacol 2001;4:223-30.
64. Hanyu H, Shimizu T, Tanaka Y, Takasaki M, Koizumi K, Abe K. Regional cerebral blood flow patterns and response to donepezil treatment in patients with Alzheimer’s disease. Dement Geriatr Cogn Disord 2003;15:177-82.
65. Mega SM, Dinoz I, Lee L, O’Connor SM, Masterman DM, Wilen B, Mishkin F, et al. Orbital and dorsolateral frontal perfusion defect associated with behavioral response to cholinesterase inhibitor therapy in Alzheimer’s disease. J Neuropsychiatry Clin Neurosci 2000;12:209-18.
66. Möbius HJ, Stöffler A. New approaches to clinical trials in vascular dementia: Mem- antine in small vessel disease. Cerebrovasc Dis 2002;13(suppl 2):61-6.
67. Wilkinson D, Doody R, Helme R, Taubman K, Mintzer J, Kertesz A, Pratt RD, the Donepezil 308 Study Group. Donepezil in vascular dementia. A ran-domised, placebo-controlled trial. Neurology 2003;61:479-86.
68. Black S, Roman G, Geldmacher DS, Salloway S, Hecker J, Burns A, Perdomo C, et al. Efficacy and tolerability of donepezil in vascular dementia. Positive results of a 24-week, multicenter, international, ran-domized, placebo-controlled clinical trial. Stroke 2003;34:2323-32.
69. Pratt RD, Perdomo C. Donepezil-treat-ed patients with probable vascular demen-tia demonstrate cognitive benefits. Ann N Y Acad Sci 2002;977:513-22.
70. Wesnes KA, McKeith I, Ferrara R, Emre M, Del Ser T, Spano PF, Cicin-Sain A, et al. Effects of rivastigmine on cognitive function in dementia with lewy bodies: a randomised placebo-controlled international study using the cognitive drug research computerised assessment system. Dement Geriatr Cogn Disord 2002;13:183-92.
71. Aarsland D, Laake K, Larsen JP, Janvin C. Donepezil for cognitive impairment in Parkinson’s disease: a randomised control-led study. J Neurol Neurosurg Psychiatry 2002;72:708-12.
72. Emre M, Aarsland D, Albanese A, Byrne EJ, Deuschl G, De Deyn PP, et al. Rivastigmine for dementia associated

C H A P T E R 2 2 • P H A R M AC O LO G I C A L T R E AT M E N T O F D E M E N T I A – E S TA B L I S H E D D R U G S
359
with Parkinson’s disease. N Engl J Med 2004;351:2509-18.
73. Litvan I, Phipps M, Pharr VL, Hallett M, Grafman J, Salazar A. Randomised placebo-controlled trial of donepezil in pa-tients with progressive supranuclear palsy. Neurology 2001;57:467-73.
74. Moretti R, Torre P, Antonello RM, Cazzato G, Bava A. Frontotemporal de-mentia: paroxetine as a possible treatment of behavioral symptoms. A randomised, controlled, open 14-month study. Eur Neurol 2003;49:13-9.
75. Prasher VP, Huxley A, Haque MS. A 24-week, double-blind, placebo-control-led trial of donepezil in patients with Down syndrome and Alzheimer’s disease – pilot study. Int J Geriatr Psychiatry 2002;17:270-8.
76. Lott IT, Osann K, Doran E, Nelson L. Down syndrome and Alzheimer dis-ease: response to donepezil. Arch Neurol 2002;59:1133-6.
77. Rogers SL, Doody R, Mohs RC, Friedhoff LT. Donepezil improves cogni-tion and global function in Alzheimer disease: 12-week, double-blind, placebo-controlled study. Arch Intern Med 1998; 158:1021-31.
78. Agid Y, Dubois B, Anand R, Gharabawi G. Efficacy and tolerability of rivastigmine in patients with dementia of the Alzheimer type. Current Therapeutic Res 1998;59:837-44.
79. Anand R, Gharabawi G, Enz A. Ef-ficacy and safety results of the early phase studies with Exelon (ENA-713) in Alzhe-
imer’s disease: an overview. J Drug Dev Clin Pract 1996;8:109-16.
80. Kewitz H, Berzewski H, Rainer M, Dal-Bianco P, Friedl E, Deisenhammer J, et al. Galantamine, a selective non-toxic acetylcholinesterase inhibitor is signifi-cantly superior over placebo in treatment of SDAT. Neuropsychopharmacology 1994;10(3S):130S.
81. Wilkinson D, Murray J. Galantamine: a randomised, double-blind, dose compari-son in patients with Alzheimer’s disease. Int J Geriatr Psychiatry 2001;16:852-7.
82. Unpublished. Study trial reference GAL-95-05.
83. Rockwood K, Mintzer J, Truyen L, Wessel T, Wilkinson D. Effects of a flex-ible galantamine dose in Alzheimer’s dis-ease: a randomised controlled trial. J Neurol Neurosurg Psychiatry 2001;71:589-95.
84. Gortelmeyer R, Erbler H. Memantine in the treatment of mild to moderate de-mentia syndrome. A double-blind placebo-controlled study. Arzneimittelforschung 1992;42:904-13.
85. Pantev M, Ritter R, Gortelmeyer R. Clinical and behavioral evaluation in long-term care patients with mild to moderate dementia under memantine treatment. Zeitschrift fuer Gerontopsychologie und Psychiatrie 1993;6:103-17.
86. Erkinjuntti T, Kurz A, Gauthier S, Bullock R, Lilienfeld S, Damaraju CV. Ef-ficacy of galantamine in probable vascular dementia and Alzheimer’s disease combined with cerebrovascular disease: a randomised trial. Lancet 2002;359:1283-90.


C H A P T E R 2 3 • H Y P E RT E N S I O N A N D D E M E N T I A 361
23. Hypertension and Dementia
Conclusions
There is moderately strong evidence that blood pressure lowering treatment prevents stroke-associated cognitive decline and dementia in patients who have had a stroke.
There is insufficient evidence that antihypertensive treatment protects patients from non-stroke associated cognitive decline.
Background
Hypertension is the leading risk factor for stroke, and dementia due to cerebrovascular causes (VaD and AD + CVD) is common. Several population-based longitudinal studies have shown a relationship be-tween hypertension and increased risk of dementia [1] and impaired cognitive function later in life [2]. High blood pressure is also linked to both stroke-related dementia and late-onset AD (LOAD) [1].
Search of literature
Medline (1970–July 1, 2004) was searched for RCTs addressing “hyper-tension and dementia” or “blood pressure and dementia” (57 hits) and “hypertension and cognitive function” or “blood pressure and cognitive function” (142 hits), most of which did not deal with this issue. Below are the results of all relevant studies that lasted at least 1 year and met the quality criteria.

D E M E N T I A – D I AG N O S T I C A N D T H E R A P E U T I C I N T E RV E N T I O N S362
Results
Early studies focused on possible side-effects on cognition due to blood pressure lowering agents. The Systolic Hypertension in the Elderly Program (SHEP) did not show a difference between the treatment and placebo groups after 1 year [3]. A substudy of the MRC’s trial of hyper-tension in older adults did not find a difference in performance on cog-nitive tests between patients treated with diuretics or beta blockers and placebo after a mean of 54 months [4].
The Systolic Hypertension in Europe (Syst-Eur) trial randomised patients with very high systolic blood pressure (160–219 mm Hg) to placebo or antihypertensive treatment [5]. The study ended after only 2 years due to favorable effects in the active group with respect to mor-tality and prevention of vascular endpoints. The initial report showed incident all-cause dementia to be lower in the active treatment group (11) than the placebo group (21, p = 0.05) [5]. When patients were fol- lowed for 2 years after the end of double-blind treatment, antihyper- tensive treatment of 1 000 patients turned out to have prevented 20 cases of dementia (95% CI 7–33) [6].
The Perindopril Protection Against Recurrent Stroke (PROGRESS) Study randomised 6 105 patients with normal or high blood pressure, with or without treatment, with prior stroke or transient ischemic at- tack to either placebo or treatment with an ACE inhibitor +/– diure- tics (indapamide) [7]. The population was followed over a mean of 3.9 years. Neither incident dementia from any cause nor cognitive de- cline (measured by MMSE) differed between the treatment groups (dementia was found in 6.3% of the active group and 7.1% of the pla- cebo group). But even in patients with normal blood pressure at the outset, active treatment lowered the risk of recurrent stroke. Further- more, the risk of dementia associated with recurrent stroke decreased by 34% (95% CI 3–55%), and the risk of stroke-associated cognitive decline decreased by 45% (95% CI 21%–61%) in the group that re- ceived perindopril +/– indapamide.

C H A P T E R 2 3 • H Y P E RT E N S I O N A N D D E M E N T I A 363
The Study on Cognition and Prognosis in the Elderly (SCOPE) compa-red the angiotensin II receptor blocker candesartan cilexitil with placebo in terms of reducing the risk of vascular events, cognitive decline, and dementia in elderly patients with borderline hypertension [8]. A total of 4 964 patients were randomised, but the protocol was changed after the study had started. As a result, most of the “placebo” patients were actu-ally treated with blood pressure lowering agents. After a mean follow-up time of 3.7 years, neither MMSE scores nor incident cognitive decline and dementia differed between the treatment groups.
A small RCT (n = 69) found that hypertensive patients allocated to los-artan treatment performed significantly better on the MMSE and SCAG than those who were treated with hydrochlorothiazide [9].
A pilot study randomised 72 elderly patients treated for hypertension who had evidence of leukoaraiosis on CT to treatment with nicergoline or placebo [10]. After 24 months, the performance of nicergoline patients on several cognitive tests had improved, or deteriorated less, than pla-cebo patients.
Need for research
Large, long-term (several years) treatment studies focusing on patients at high risk are needed to examine the protection offered by antihyperten-sive treatment from non-stroke associated cognitive decline. Such studies must deal with the problem of premature discontinuation and non-com-pliance among those in whom cognition deteriorates.

D E M E N T I A – D I AG N O S T I C A N D T H E R A P E U T I C I N T E RV E N T I O N S364
1. Skoog I, Lernfelt B, Landahl S, Palmertz B, Andreasson L. 15 year longi- tudinal study of blood pressure and de- mentia. Lancet 1996;347:1141-5.
2. Kilander L, Nyman H, Boberg M, Hansson L, Lithell H. Hypertension is related to cognitive impairment: a 20-year follow-up of 999 men. Hypertension 1998;31:780-6.
3. Gurland BJ, Teresi J, Smith WM, Black D, Hughes G, Edlavitch S. Effects of treat-ment for isolated systolic hypertension and depression in the elderly. J Am Geriatr Soc 1988;36:1015-22.
4. Prince MJ, Bird AS, Blizard RA, Mann AH. Is the cognitive function of older patients affected by antihypertensive treatment? Results from 54 months of the Medical Research Council’s trial of hyper-tension in older adults. BMJ 1996;312: 801-5.
5. Forette F, Seux ML, Staessen JA, Thijs L, Birkenhager WH, Babarskiene MR, et al. Prevention of dementia in randomised double-blind placebo-controlled Systolic Hypertension in Europe (Syst-Eur) trial. Lancet 1998;352:1347-51.
6. Forette F, Seux ML, Staessen JA, Thijs L, Babarskiene MR, Babeanu S, et al. The prevention of dementia with antihyper-
tensive treatment: new evidence from the Systolic Hypertension in Europe study. Arch Intern Med 2002;162:2046-52.
7. Tzourio C, Anderson C, Chapman N, Woodward M, Neal B, MacMahon S, Chalmers J. Effects of blood pressure lowering with perindopril and indapamide treatment on dementia and cognitive decline in patients with cerebrovascular disease. Arch Intern Med 2003;163: 1069-75.
8. Lithell H, Hansson L, Skoog I, Elmfeldt D, Hofman A, Olofsson B, et al. The Study on Cognition and Prognosis in the Elderly (SCOPE): principal results of a rando-mized double-blind intervention trial. J Hypertens 2003;21:875-86.
9. Tedesco MA, Ratti G, Mennella S, Manzo G, Grieco M, Rainone AC, Iarussi D, Iacono A. Comparison of losartan and hydrochlorothiazide on cognitive function and quality of life in hypertensive patients. Am J Hypertens 1999;12:1130-4.
10. Bes A, Orgogozo JM, Poncet M, Rancurel G, Weber M, Bertholom N, Calvez R, Stehle B., A 24-month, double-blind, placebo-controlled multicenter pilot study of the efficacy and safety of nicergo-line 60 mg per day in elderly hypertensive patients with leukoaraiosis. Eur J Neurol 1999;6:313-22.
References

C H A P T E R 24 • T R E AT M E N T O F D E P R E S S I O N I N D E M E N T I A 365
24. Treatment of Depression in Dementia
Conclusions
Depressive symptoms are frequent in dementia. Studies of depression in dementia have primarily focused on mild to moderate dementia. The research on the treatment of depression in patients with severe dementia is inconclusive.
There is limited evidence that SSRIs are tolerated well and are effective in mild to moderate dementia (Evidence Grade 3).
Tricyclic antidepressants have shown conflicting results, and there is only limited evidence for an effect on depressive symptoms in dementia (Evidence Grade 3).
Tricyclic antidepressants produce prominent side-effects, including reduced cognitive functions, in dementia (Evidence Grade 3).
There is limited evidence that serotonin-active antidepressants reduce behavioral symptoms in dementia (Evidence Grade 3).
Background
Depressive symptoms are common in dementia. According to Wragg et al, the reported frequency has varied among different investigations from 0–87%, with a mean of 30–40% [1]. Lyketsos et al studied minor depres-sion, as well as major depression in AD, and found that 51% of the patients showed no signs of depression, 27% had minor depression and 22% had major depressive disorder [2]. Signs of depression are more frequent in VaD than AD [3]. Depression in dementia often includes symptoms of

D E M E N T I A – D I AG N O S T I C A N D T H E R A P E U T I C I N T E RV E N T I O N S366
anxiety, creating an anxiety/depressive state [4]. Given that depressive sym- ptoms are so frequent, it is debated if they should be regarded as part of the dementia syndrome or a superimposed disorder [5].
Search strategy
Medline was searched for RCT by combining either “dementia” or “Alzheimer’s disease” with the MeSH term “antidepressive agents”. “Dementia” or “Alzheimer’s disease” was also searched in combination with the antidepressives citalopram, fluoxetine, fluvoxamine, mirtaza-pine, reboxetine and trazodone. Review articles and studies concerning treatment of depression in the elderly were searched for subgroups of patients with dementia. Although the cutoff date was July 2004, later studies were also included if regarded as important for conclusions made.
Search results
Twentytwo studies were identified, of which one had been published twice. The majority of the studies concerned effects on depressive symp-toms in dementia. A few studies concerned effects on other non-cogni-tive symptoms or behavioral aspects in dementia.
Most studies were assessed as having limited quality, and a few were considered to have moderately high quality. Treatment of depression in dementia is complex, given that the dementia diagnosis, degree of cog-nitive decline, depression diagnosis and severity of depressive symptoms must be considered. Thus, even well-designed studies might not be of high quality.

C H A P T E R 24 • T R E AT M E N T O F D E P R E S S I O N I N D E M E N T I A 367
Effects of antidepressants on depression in dementia
The majority of studies concerning antidepressant treatment of the cog-nitively impaired elderly were on patients with mild or mild to moderate dementia. Only one study was on patients with severe dementia.
Reifler et al conducted the first study of depression in dementia using a relatively low dose of imipramine [6]. However, both groups improved identically, demonstrating a major placebo response and no further effect of imipramine. Petracca et al also found a high placebo response [7]. Tricyclic antidepressants have had conflicting results when it comes to the treatment of depression in dementia. Reifler et al reported no effect from imipramine [6], and Fuchs et al found no effect from maprotiline, a similar drug [8]. Branconnier et al found positive effects of amitripty-line [9,10] and Petracca et al found positive effects from clomipramine in comparison with placebo [7]. Although all these studies used a low dose of tricyclic antidepressants, side-effects with reduced cognitive functions [7,9,11] and delirium [7] were prominent.
Sertraline was superior to placebo [13,14] while citalopram was more effective than placebo in a subgroup with dementia [12]. Moclobemide was also found to be superior to placebo [15]. A comparison of fluoxe- tine and placebo did not find any differences but reported an unusually large placebo response [16]. One study found no effect from sertraline in depressive nursing home patients [17]. The included patients had severe dementia, and the ratings were difficult to perform in this population.
No difference was reported among the various antidepressants that have been studied in the treatment of depression in dementia. Amitriptyline did not differ from mianserin but induced more cognitive problems [9]. Imipramine had the same effect on depression as paroxetine but reduced cognitive functions more [18]. Low dose amitriptyline did not differ from fluoxetine in terms of antidepressive response [11]. Citalopram and mianserine were compared with the inclusion of a subgroup with demen-tia, but no difference of effect was seen [19].

D E M E N T I A – D I AG N O S T I C A N D T H E R A P E U T I C I N T E RV E N T I O N S368
Roth et al reported improvement of cognitive functions concomitant with reduced degree of depression [15]. Two other studies found similar effects [11,20]. However, Lyketsos et al found no difference in cognitive functions when depressive symptoms improved in the patients with de- mentia [21]. Citalopram did not have any influence on cognitive fun-ctions in patients with dementia with no diagnose of depression [22]. Steinberg et al studied psychological symptoms at baseline but found no correlation to response to sertraline [23]. Lanctot et al found that aggression, female gender and serotonin function correlated with re- sponse to sertraline [24].
Effects of antidepressants on non-depressive symptoms
Treatment with citalopram significantly reduced anxiety, fear, panic, depressive symptoms, restlessness and symptoms of confusion [22]. Olafsson et al found no such improvement from fluvoxamine compared to placebo in patients with dementia but not depression [25]. Finkel et al studied patients with AD who were treated with donepezil [26]. The addition of sertraline reduced behavioral symptoms compared with pla-cebo. Trazodone has been compared with haloperidol for the treatment of behavioral symptoms in dementia. Neither Sultzer et al [27,28] nor Teri et al [29] found any difference. Effects in the latter study were no different from placebo.
Lyketsos et al found depressive symptoms to be closely associated with aggressive behavior [30]. Antidepressants have been tried for the mana-gement of behavioral symptoms. Although fluvoxamine significantly improved the effects on psychotic symptoms in dementia compared with placebo, the study was very small [31]. Both groups were treated with perphenazine 12 mg. Sultzer et al found 50–250 mg of trazodone to be as effective as haloperidol 1–5 mg for agitated behavior and produced fewer side-effects [27]. A subsequent article by them reported that mild to moderate depressive symptoms were associated with greater behavioral improvement from trazodone.

C H A P T E R 24 • T R E AT M E N T O F D E P R E S S I O N I N D E M E N T I A 369

D E M E N T I A – D I AG N O S T I C A N D T H E R A P E U T I C I N T E RV E N T I O N S370
Table 24.1 Treatment of depression in dementia.
Author Year, reference
Type of study
Setting Dementia and depression Diagnosis
Severity of dementia
Patients (n) included (attrition)
Age-groups Mean, SD/range
Study period
Inter- vention (end)
Primary outcome
Effects (end) Remarks from reviewer
Qua-lity of study
Branconnier et al1981, 1982 [9,10] Double publication
RCT Outpatient TestingHAM-D (17) >14
“Light cognitive disturbance”
75 68Range 60–85
7 w Amitripty-line 150 mgMianserin 60 mgPlacebo
Zung Amitriptyline = mianserine > placebo
Amitriptyline reduced cogni-tive functions
1
Finkel et al 2004 [26]
RCT Outpatient NINCDS NPI >5 MMSE = 8–23
244 76.3SD = 7.6
12 w Sertraline 50–150 mg + donepezil 10 mgPlacebo + donepezil 10 mg
NPICGI-ICGI-S
Sertraline + donepezil > placebo + donepazil
Study of behavioral symptoms in dementia
2
Fuchs et al 1993 [8]
RCT Hospital Alzheimer’s disease and major depression disorder accor-ding to DSM-III
Light-moderate 120 80Range 48–96
8 w Maprotiline 75 mgPlacebo
Videorating No difference 1
Karlsson et al 2000 [19]
RCT In- and out-patients
Dementia and MDD or dysthy-mia according to DSM-III-R
Light-moderate 53 demented of 336 in the study
75Range 64–95
12 w Citalopram 20–40 mgMianserine 30–60 mg
MADRS No difference Demented subgroup
2
Katona et al 1998 [18]
RCT In- and out-patients
Dementia according to DSM-III-R.Major or minor depressionaccording to research criteria
Light 198 77Range 59–98
8 w Paroxetine 20–40 mgImipramine 50–100 mg
MADRS No difference 2
Lanctôt et al2002 [24]
RCTCrosso-ver
Nursing home
NINCDS Dementia according to DSM-IV
Severe 22 82.4Range 74–95
2 x 4 w Sertraline 100 mgPlacebo
NPI Aggression, female gender and serotonine function asso-ciated with response
Study of markers for response only
2

C H A P T E R 24 • T R E AT M E N T O F D E P R E S S I O N I N D E M E N T I A 371
Table 24.1 Treatment of depression in dementia.
Author Year, reference
Type of study
Setting Dementia and depression Diagnosis
Severity of dementia
Patients (n) included (attrition)
Age-groups Mean, SD/range
Study period
Inter- vention (end)
Primary outcome
Effects (end) Remarks from reviewer
Qua-lity of study
Branconnier et al1981, 1982 [9,10] Double publication
RCT Outpatient TestingHAM-D (17) >14
“Light cognitive disturbance”
75 68Range 60–85
7 w Amitripty-line 150 mgMianserin 60 mgPlacebo
Zung Amitriptyline = mianserine > placebo
Amitriptyline reduced cogni-tive functions
1
Finkel et al 2004 [26]
RCT Outpatient NINCDS NPI >5 MMSE = 8–23
244 76.3SD = 7.6
12 w Sertraline 50–150 mg + donepezil 10 mgPlacebo + donepezil 10 mg
NPICGI-ICGI-S
Sertraline + donepezil > placebo + donepazil
Study of behavioral symptoms in dementia
2
Fuchs et al 1993 [8]
RCT Hospital Alzheimer’s disease and major depression disorder accor-ding to DSM-III
Light-moderate 120 80Range 48–96
8 w Maprotiline 75 mgPlacebo
Videorating No difference 1
Karlsson et al 2000 [19]
RCT In- and out-patients
Dementia and MDD or dysthy-mia according to DSM-III-R
Light-moderate 53 demented of 336 in the study
75Range 64–95
12 w Citalopram 20–40 mgMianserine 30–60 mg
MADRS No difference Demented subgroup
2
Katona et al 1998 [18]
RCT In- and out-patients
Dementia according to DSM-III-R.Major or minor depressionaccording to research criteria
Light 198 77Range 59–98
8 w Paroxetine 20–40 mgImipramine 50–100 mg
MADRS No difference 2
Lanctôt et al2002 [24]
RCTCrosso-ver
Nursing home
NINCDS Dementia according to DSM-IV
Severe 22 82.4Range 74–95
2 x 4 w Sertraline 100 mgPlacebo
NPI Aggression, female gender and serotonine function asso-ciated with response
Study of markers for response only
2
The table continues on the next page

D E M E N T I A – D I AG N O S T I C A N D T H E R A P E U T I C I N T E RV E N T I O N S372
Table 24.1 continued
Author Year, reference
Type of study
Setting Dementia and depression Diagnosis
Severity of dementia
Patients (n) included (attrition)
Age-groups Mean, SD/range
Study period
Inter- vention (end)
Primary outcome
Effects (end) Remarks from reviewer
Qua-lity of study
Levkovitz et al 2001 [31]
RCT Outpatients NINCDS BPRS ≥18
Not mentioned 20 78.1Range 65–93
3 w Perphena-cine 12 mg + fluvoxamine 50 mgPerphena-cine 12 mg + placebo
BPRS Fluvoxamine-group, fewer psychotic symptoms
Pilot study 1
Lyketsos et al2000 [13]
RCT Outpatients NINCDSMajor depression disorder accor-ding to DSM-IV
Light-moderate 22 77SD = 8.4
12 w Sertraline 50–150 mgPlacebo
Cornell Sertraline > placebo
Preliminary study
1
Lyketsos et al2003 [21]
RCT Outpatients NINCDSMajor depression disorder accor-ding to DSM-IV
Light-moderate 44 79SD = 5.276SD = 9.5
12 w Sertraline 50–150 mgPlacebo
Cornell Sertraline > placebo
No improve-ment of cogni-tive functions of treatment
2
Magai et al 2000 [17]
RCT Nursing home
NINCDSMinor or major depres-sion according to DSM-IV
Severe 31 89SD = 6.3
8 w Sertraline 100 mgPlacebo
Cornell No difference Severely demented patients, uncertain testing
1
Nyth et al 1990 [22]
RCT In- and out-patients
Dementia accor-ding to DSM-III-R
Moderate 98 4 w Citalopram 10–30 mgPlacebo
Gottfries-Bråne-Steen-rating scale
Reduced anxiety/depression and irritabi-lity. No effect on cognitive functions
Study of citalopram in non-depres-sive dementia
1
Nyth et al 1992 [20]
RCT In- and out-patients
“Mild and mode-rate dementia”HDRS ≥14
Mild-moderate 29 demented of 149 in the study
76.7Range 65–91
6 w Citalopram 20–30 mgPlacebo
MADRS Citalopram > placebo
Improvement of cognitive functions con-comitant with antidepressive effect
1

C H A P T E R 24 • T R E AT M E N T O F D E P R E S S I O N I N D E M E N T I A 373
Table 24.1 continued
Author Year, reference
Type of study
Setting Dementia and depression Diagnosis
Severity of dementia
Patients (n) included (attrition)
Age-groups Mean, SD/range
Study period
Inter- vention (end)
Primary outcome
Effects (end) Remarks from reviewer
Qua-lity of study
Levkovitz et al 2001 [31]
RCT Outpatients NINCDS BPRS ≥18
Not mentioned 20 78.1Range 65–93
3 w Perphena-cine 12 mg + fluvoxamine 50 mgPerphena-cine 12 mg + placebo
BPRS Fluvoxamine-group, fewer psychotic symptoms
Pilot study 1
Lyketsos et al2000 [13]
RCT Outpatients NINCDSMajor depression disorder accor-ding to DSM-IV
Light-moderate 22 77SD = 8.4
12 w Sertraline 50–150 mgPlacebo
Cornell Sertraline > placebo
Preliminary study
1
Lyketsos et al2003 [21]
RCT Outpatients NINCDSMajor depression disorder accor-ding to DSM-IV
Light-moderate 44 79SD = 5.276SD = 9.5
12 w Sertraline 50–150 mgPlacebo
Cornell Sertraline > placebo
No improve-ment of cogni-tive functions of treatment
2
Magai et al 2000 [17]
RCT Nursing home
NINCDSMinor or major depres-sion according to DSM-IV
Severe 31 89SD = 6.3
8 w Sertraline 100 mgPlacebo
Cornell No difference Severely demented patients, uncertain testing
1
Nyth et al 1990 [22]
RCT In- and out-patients
Dementia accor-ding to DSM-III-R
Moderate 98 4 w Citalopram 10–30 mgPlacebo
Gottfries-Bråne-Steen-rating scale
Reduced anxiety/depression and irritabi-lity. No effect on cognitive functions
Study of citalopram in non-depres-sive dementia
1
Nyth et al 1992 [20]
RCT In- and out-patients
“Mild and mode-rate dementia”HDRS ≥14
Mild-moderate 29 demented of 149 in the study
76.7Range 65–91
6 w Citalopram 20–30 mgPlacebo
MADRS Citalopram > placebo
Improvement of cognitive functions con-comitant with antidepressive effect
1
The table continues on the next page

D E M E N T I A – D I AG N O S T I C A N D T H E R A P E U T I C I N T E RV E N T I O N S374
Table 24.1 continued
Author Year, reference
Type of study
Setting Dementia and depression Diagnosis
Severity of dementia
Patients (n) included (attrition)
Age-groups Mean, SD/range
Study period
Inter- vention (end)
Primary outcome
Effects (end) Remarks from reviewer
Qua-lity of study
Olafsson et al1992 [25]
RCT AD or multi infarct dementia according to DSM-III
46 81Range 65–93
6 w Fluvoxamine 150 mgPlacebo
Gottfries-Bråne-Steen-rating scale
Fluvoxamine = placebo
Study of fluvoxamine on behavioral symptoms
1
Petracca et al1996 [7]
RCT Outpatients Alzheimer’s disease and major depr dis-order according to DSM-III-R
Mild 21 72SD = 7.2
6 w Clomiprami-ne 100 mgPlacebo
HAM-D Clomipramine > placebo
10/18 showed delirium in clomipramine group
1
Petracca et al2001 [16]
RCT Outpatients NINCDSMajor or minor depr disorder according to DSM-IV
Mild 41 71SD = 6.6
6 w Fluoxetine 40 mgPlacebo
HAM-D No difference Great placebo response
1
Pollock et al2002 [32]
RCT Hospital Dementia accor-ding to DSM-IV
Severe- moderate
85 80.1SD = 8.1
17 d Perphena-zine M = 6.5 mgCitalopram 20 mgPlacebo
Neurobe-hav rating scale
Citalopram > perphenazine.Citalopram > placebo. Perphenazine > placebo
High disconti-nuation rate
1
Reifler et al 1989 [6]
RCT Outpatients Alzheimer’s disease and major depr dis-order according to DSM-III
Mild-moderate 28 72SD = 8
8 w ImipramineM = 83 mg/day Placebo
HAM-D No difference Great placebo response
1
Steinberg et al2004 [23]
RCT Outpatients NINDCS MDD according to DSM-IV
Light-moderate 44 77.3 12 w Sertraline 50–150 mgPlacebo
CornellNeuropsy-chological testing
No baseline symptom cor-related with response
More respon-ders in sertra-line group
1
Sultzer et al 1997 [27]
RCT Gero-psy-chiatric inpatients
“Dementia and aggression or agitation”
MMSE = 11.0SD = 7.0
28 72.3SD = 6.9
9 w HaloperidolM = 2.5 mgTrazodoneM = 218 mg
CMAT No difference in effect
Haloperidol more side-effects
1

C H A P T E R 24 • T R E AT M E N T O F D E P R E S S I O N I N D E M E N T I A 375
The table continues on the next page
Table 24.1 continued
Author Year, reference
Type of study
Setting Dementia and depression Diagnosis
Severity of dementia
Patients (n) included (attrition)
Age-groups Mean, SD/range
Study period
Inter- vention (end)
Primary outcome
Effects (end) Remarks from reviewer
Qua-lity of study
Olafsson et al1992 [25]
RCT AD or multi infarct dementia according to DSM-III
46 81Range 65–93
6 w Fluvoxamine 150 mgPlacebo
Gottfries-Bråne-Steen-rating scale
Fluvoxamine = placebo
Study of fluvoxamine on behavioral symptoms
1
Petracca et al1996 [7]
RCT Outpatients Alzheimer’s disease and major depr dis-order according to DSM-III-R
Mild 21 72SD = 7.2
6 w Clomiprami-ne 100 mgPlacebo
HAM-D Clomipramine > placebo
10/18 showed delirium in clomipramine group
1
Petracca et al2001 [16]
RCT Outpatients NINCDSMajor or minor depr disorder according to DSM-IV
Mild 41 71SD = 6.6
6 w Fluoxetine 40 mgPlacebo
HAM-D No difference Great placebo response
1
Pollock et al2002 [32]
RCT Hospital Dementia accor-ding to DSM-IV
Severe- moderate
85 80.1SD = 8.1
17 d Perphena-zine M = 6.5 mgCitalopram 20 mgPlacebo
Neurobe-hav rating scale
Citalopram > perphenazine.Citalopram > placebo. Perphenazine > placebo
High disconti-nuation rate
1
Reifler et al 1989 [6]
RCT Outpatients Alzheimer’s disease and major depr dis-order according to DSM-III
Mild-moderate 28 72SD = 8
8 w ImipramineM = 83 mg/day Placebo
HAM-D No difference Great placebo response
1
Steinberg et al2004 [23]
RCT Outpatients NINDCS MDD according to DSM-IV
Light-moderate 44 77.3 12 w Sertraline 50–150 mgPlacebo
CornellNeuropsy-chological testing
No baseline symptom cor-related with response
More respon-ders in sertra-line group
1
Sultzer et al 1997 [27]
RCT Gero-psy-chiatric inpatients
“Dementia and aggression or agitation”
MMSE = 11.0SD = 7.0
28 72.3SD = 6.9
9 w HaloperidolM = 2.5 mgTrazodoneM = 218 mg
CMAT No difference in effect
Haloperidol more side-effects
1

D E M E N T I A – D I AG N O S T I C A N D T H E R A P E U T I C I N T E RV E N T I O N S376
Table 24.1 continued
Author Year, reference
Type of study
Setting Dementia and depression Diagnosis
Severity of dementia
Patients (n) included (attrition)
Age-groups Mean, SD/range
Study period
Inter- vention (end)
Primary outcome
Effects (end) Remarks from reviewer
Quality of study
Sultzer et al 2001 [28]
RCT Gero- psychiatric inpatients
“Dementia and aggression or agitation”
MMSE = 11.0SD = 7.0
28 72.3SD = 6.9
9 w Trazodone 50–150 mg Haloperidol 1–5 mg
CMAI Trazodone response related slight depressive symptoms
Same data as Sultzer et al 1997 [27]
1
Roth et al 1996 [15]
RCT Outpatients Dementia according to DSM-III or “cog-nitive decline” and major depressive epi-sode according to DSM-III
Mild-moderate 694 60–98M = 78
7 w Moclobemi-de 400 mgPlacebo
HAM-D Moclobemide > placebo
Improvement of cognitive functions con-comitant with antidepressive effect
1
Taragano et al1997 [11]
RCT Outpatients NINCDSMajor depression disorder accor-ding to DSM-III
Mild 37 72SD = 5
9 w Amitripty-line 25 mgFluoxetine 10 mg
HAM-D No difference High drop-out level (59% in amitriptyline group)Cognitive improvement
1
Teri et al 2000 [29]
RCT Outpatients AD according to NINCDS
Moderate-light 149 74.9SD = 7.0
16 w HaloperidolM = 1.8 mgTrazodoneM = 200 mgBehavior management techniquesPlacebo
CGI No diffe-rence between groups
High drop-out level
1
AD = Alzheimer’s disease; BPRS = Brief Psychiatric Rating Scale; CGI = Clinical Global Impression Scale; CMAI = Cohen-Mansfield Agitation Inventory; DSM = Diagnostic and Statistical Manual; HAM-D = Hamilton Rating Scale for Depression; HDRS = Hamilton Depression Rating Scale; MADRS = Montgomery Åsberg Depression Rating Scale; MDD = Major depressive disorder; MMSE = Mini-mental state exam- ination; NINCDS = National institute of neurological and communicable diseases; NPI = Neuropsychiatric inventory; RCT = Randomised controlled trial; SD = Standard deviation

C H A P T E R 24 • T R E AT M E N T O F D E P R E S S I O N I N D E M E N T I A 377
Table 24.1 continued
Author Year, reference
Type of study
Setting Dementia and depression Diagnosis
Severity of dementia
Patients (n) included (attrition)
Age-groups Mean, SD/range
Study period
Inter- vention (end)
Primary outcome
Effects (end) Remarks from reviewer
Quality of study
Sultzer et al 2001 [28]
RCT Gero- psychiatric inpatients
“Dementia and aggression or agitation”
MMSE = 11.0SD = 7.0
28 72.3SD = 6.9
9 w Trazodone 50–150 mg Haloperidol 1–5 mg
CMAI Trazodone response related slight depressive symptoms
Same data as Sultzer et al 1997 [27]
1
Roth et al 1996 [15]
RCT Outpatients Dementia according to DSM-III or “cog-nitive decline” and major depressive epi-sode according to DSM-III
Mild-moderate 694 60–98M = 78
7 w Moclobemi-de 400 mgPlacebo
HAM-D Moclobemide > placebo
Improvement of cognitive functions con-comitant with antidepressive effect
1
Taragano et al1997 [11]
RCT Outpatients NINCDSMajor depression disorder accor-ding to DSM-III
Mild 37 72SD = 5
9 w Amitripty-line 25 mgFluoxetine 10 mg
HAM-D No difference High drop-out level (59% in amitriptyline group)Cognitive improvement
1
Teri et al 2000 [29]
RCT Outpatients AD according to NINCDS
Moderate-light 149 74.9SD = 7.0
16 w HaloperidolM = 1.8 mgTrazodoneM = 200 mgBehavior management techniquesPlacebo
CGI No diffe-rence between groups
High drop-out level
1

D E M E N T I A – D I AG N O S T I C A N D T H E R A P E U T I C I N T E RV E N T I O N S378
1. Wragg RW, Jeste DV. Overview of depression and psychosis in Alzheimer’s disease. Am J Psychiatry 1989;146:577-87.
2. Lyketsos CG, Steele C, Baker L, Galik E, Kopunek S, Steinberg M, et al. Major and minor depression in Alzhei- mer’s disease: prevalence and impact. J Neuropsychiatry Clin Neurosci 1997; 9:556-61.
3. Rao R. Cerebrovascular disease and late life depression: an age old associ- ation revisited. Int J Geriatr Psychiatry 2000;15:419-33.
4. Weiss KJ. Management of anxiety and depression syndromes in the elderly. J Clin Psychiatry 1994;55 Suppl:5-12.
5. Moretti R, Torre P, Antonello RM, Cazzato G, Bava A. Depression and Alzheimer’s disease: symptom or co- morbidity? Am J Alzheimers Dis Other Demen 2002;17:338-44.
6. Reifler BV, Teri L, Raskind M, Veith R, Barnes R, White E, et al. Double- blind trial of imipramine in Alzheimer’s disease with and without depression. Am J Psychiatry 1989;156:45-9.
7. Petracca G, Tesón A, Chemerinski E, Leiguarda R, Starkstein SE. A double-blind placebo-controlled study of clomipramine in depressed patients with Alzheimer’s disease. J Neuropsychiatry Clin Neurosci 1996;8:270-5.
8. Fuchs A, Hehnke U, Schell C, Pramsholder B, Danninger B, Schautzer
F. Videorating analysis of effect of mapro-tiline in patients with dementia and depres-sion. Pharmacopsychiat 1993;26:37-41.
9. Branconnier RJ, Cole JO, Ghazvinian S. The Therapeutic profile of mianserin in mild elderly depressives. Psychopharmacol Bull 1981;17:129-31.
10. Branconnier RJ, Cole JO, Ghazvinian S, Rosenthal S. Treating the depressed elderly patient: the comparative behavioral pharmacology of mianserin and amitripty- line. In: Costa E, Racagni G, editors. Typi- cal and Atypical Antidepressants: Clinical Practice. New York: Raven Press; 1982.
11. Taragano FE, Lyketos CG, Mangone CA, Allegri RF, Comesana-Diaz E. A double-blind, randomised, fixed-dose trial of fluoxetine vs. amitriptyline in the treatment of major depression complicat-ing Alzheimer’s disease. Psychosomatics 1997;38:246-52.
12. Gottfries CG, Karlsson I, Nyth AL. Treatment of depression in elderly with and without dementia disorder. Int Clin Psychopharmacol 1992;6:55-64.
13. Lyketsos CG, Sheppard JM, Steele CD, Kopunek S, Steinberg M, Baker AS, et al. Randomised, placebo-controlled, double-blind clinical trial of sertraline in the treatment of depression complicating Alzheimer’s disease: initial results from the Depression in Alzheimer’s Disease study. Am J Psychiatry 2000;157:1686-9.
14. Charney DS, Reynolds CF, 3rd, Lewis L, Lebowitz BD, Sunderland T,
References

C H A P T E R 24 • T R E AT M E N T O F D E P R E S S I O N I N D E M E N T I A 379
Alexopoulos GS, et al. Depression and Bipolar Support Alliance consensus state-ment on the unmet needs in diagnosis and treatment of mood disorders in late life. Arch Gen Psychiatry 2003;60:664-72.
15. Roth M, Mountjoy CQ, Amerin R, Group TICS. Moclobemide in elderly patients with cognitive decline and de-pression: an international double-blind placebo-controlled trial. Br J Psychiatry 1996;168:149-7.
16. Petracca GM, Chemerinski E, Starkstein SE. A double-blind, placebo-controlled study of fluoxetine in depressed patients with Alzheimer’s disease. Int Psychogeriatr 2001;13:233-40.
17. Magai C, Kennedy G, Cohen CI, Gomberg D. A controlled clinical trial of sertraline in the treatment of depression in nursing home patients with late-stage Alzheimer’s disease. Am J Geriatr Psychiatry 2000;8:66-74.
18. Katona CLE, Hunter BN, Bray J. A double-blind comparison of the efficacy and safety of paroxetine and imipramine in the treatment of depression with dementia. Int J Geriatr Psychiatry 1998;13:100-8.
19. Karlsson I, Godderis J, Augusto De Mendonca Lima C, Nygaard H, Simanyi M, Taal M, et al. A randomised, double-blind comparison of the efficacy and safety of citalopram compared to mianserin in elderly, depressed patients with or without mild to moderate dementia. Int J Geriatr Psychiatry 2000;15:295-305.
20. Nyth AL, Gottfries CG, et al. A controlled multicenter clinical study of citalopram and placebo in elderly depressed patients with and without concomitant
dementia. Acta Psychiatrica Scandinavica 1992;86:138-45.
21. Lyketsos CG, DelCampo L, Steinberg M, Miles Q, Steele CD, Munro C, et al. Treating depression in Alzheimer disease: efficacy and safety of sertraline therapy, and the benefits of depression reduc-tion: the DIADS. Arch Gen Psychiatry 2003;60:737-46.
22. Nyth AL, Gottfries CG. The clinical efficacy of citalopram in treatment of emo-tional disturbances in dementia disorders. a Nordic Multicentre study. Br J Psychiatry 1990;157:894-901.
23. Steinberg M, Munro CA, Samus Q, V Rabins P, Brandt J, Lyketsos CG. Pa- tient predictors of response to treatment of depression in Alzheimer’s disease: the DIADS study. Int J Geriatr Psychiatry 2004;19:144-50.
24. Lanctôt KL, Herrmann N, van Reekum R, Eryavec G, Naranjo CA. Gen-der, aggression and serotonergic function are associated with response to sertraline for behavioral disturbances in Alzheimer’s disease. Int J Geriatr Psychiatry 2002;17: 531-41.
25. Olafsson K, Jørgensen S, Jensen HV, Bille A, Arup P, Andersen J. Fluvoxamine in the treatment of demented elderly pa-tients: a double-blind, placebo-controlled study. Acta Psychiatr Scand 1992;85: 453-6.
26. Finkel SI, Mintzer JE, Dysken M, Krishnan KR, Burt T, McRae T. A ran-domised, placebo-controlled study of the efficacy and safety of sertraline in the treat-ment of the behavioral manifestations of Alzheimer’s disease in outpatients treated

D E M E N T I A – D I AG N O S T I C A N D T H E R A P E U T I C I N T E RV E N T I O N S380
with donepezil. Int J Geriatr Psychiatry 2004;19:9-18.
27. Sultzer DL, Gray KF, Gunay I, Berisford MA, Mahler ME. A double- blind comparison of trazodone and haloperidol for treatment of agitation in patients with dementia. Am J Geriatr Psychiatry 1997;5:60-9.
28. Sultzer DL, Gray KF, Gunay I, Wheatley MV, Mahler ME. Does beha- vioral improvement with haloperidol or trazodone treatment depend on psychosis or mood symptoms in patients with de-mentia? J Am Geriatr Soc 2001;49: 1294-300.
29. Teri L, Logsdon RG, Peskind E, Raskind M, Weiner MF, Tractenberg RE, et al. Treatment of agitation in AD: a ran-
domised, placebo-controlled clinical trial. Neurology 2000;55:1271-8.
30. Lyketsos CG, Steele C, Galik E, Rosenblatt A, Steinberg M, Warren A, et al. Physical aggression in dementia patients and its relationship to depression. Am J Psychiatry 1999;156:66-71.
31. Levkovitz Y, Bloch Y, Kaplan D, Diskin A, Abramovitchi I. Fluvoxamine for psy-chosis in Alzheimer’s disease. J Nerv Ment Dis 2001;189:126-9.
32. Pollock BG, Mulsant BH, Rosen J, Sweet RA, Mazumdar S, Bharucha A. Comparison of citalopram, perphenazine, and placebo for the acute treatment of psychosis and behavioral disturbances in hospitalized, demented patients. Am J Psychiatry 2002;159:460-5.

C H A P T E R 2 5 • T R E AT M E N T O F P S YC H OT I C A N D B E H AV I O R A L S Y M P TO M S I N D E M E N T I A
381
25. Treatment of Psychotic and Behavioral Symptoms in Dementia
Conclusions
There is strong evidence of an increased risk of death following atypical antipsychotic drug treatment (Evidence Grade 1).
There was a significant but small effect on behavioral symptoms in dementia from moderate and high doses of traditional antipsychotics (Evidence Grade 3). However, haloperidol up to 1.1 mg did not differ from placebo, while reduction of symptoms was found in doses 1.5 mg and higher.
Moderate and high doses of haloperidol induce clinically relevant extra pyramidal side-effects (Evidence Grade 3).
Low doses of other traditional antipsychotics have not been shown to differ from placebo. Risperidone in doses around 1 mg reduces behavio-ral symptoms to a small but significant degree, with generally acceptable side-effects. Olanzapine, 5–10 mg reduces psychotic or behavioral symp-toms (Evidence Grade 3).
Few RCTs have been published on BPSD with antiepileptic drugs. No evidence of effects can be concluded based on 1 study of medium quality and 4 of low quality.
Although no evidence can be adduced, only carbamazepin had small but significant effects on behavioral symptoms. Valproate and divalproex had no clinical value, while RCTs have not analyzed other antiepileptics for their effect on behavioral and psychological symptoms in dementia.

D E M E N T I A – D I AG N O S T I C A N D T H E R A P E U T I C I N T E RV E N T I O N S382
Background
Cognitive reduction is the most prominent symptom in dementia dis-orders, but several non-cognitive symptoms are also common. Such symptoms are often problematic for others and may cause considerable stress for caregivers. Although non-cognitive symptoms in dementia have many different aspects, they are collectively described as Behavioral and Psychological Signs and Symptoms of dementia (BPSD) [1]. BPSD includes all significant non-cognitive symptoms of dementia, including aggressiveness, psychotic symptoms, reduced mood, sleep/wakefulness disturbances, wandering or other signs of overactivity. The concept of BPSD is symptomatic and does not include any possible association with a superimposed disease state, such as affective disorder, depression, delirium or psychosis.
The concept of BPSD focuses mainly on biological factors as the cause of disturbing symptoms. Many symptoms develop in a disturbed rela-tion between the patient and others. Reduced cognitive functions often give rise to misunderstanding or misinterpretation by others. Thus, examining the quality of the relation between the patient and others is essential to evaluating and treating BPSD. The concept of BPSD can overestimate the dementia disorder as a cause of behavioral symptoms. Evaluating the separate influence of biological and environmental factors on BPSD is difficult, but strategies for treating BPSD should consider both nursing care and drugs. The section of this report concerning nursing care evaluates the environmental aspects of BPSD. This section is confined to the pharmacological treatment of non-cognitive symp-toms in dementia: the effects of antipsychotic treatment for psychotic symptoms and BPSD, the treatment of BPSD with antiepileptics, the treatment of depression in dementia and the treatment of BPSD with antidepressants.

C H A P T E R 2 5 • T R E AT M E N T O F P S YC H OT I C A N D B E H AV I O R A L S Y M P TO M S I N D E M E N T I A
383
Effects of antipsychotic treatment of psychotic symptoms and BPSDPsychotic symptoms are common in dementia, with a mean of 34% in a meta-analysis (range 10–73%), but antipsychotic drugs have been mainly used in dementia for the treatment of behavioral symptoms included in the concept of BPSD [2,3].
SearchMedline was searched for the MeSH terms “antipsychotic agents” and dementia or Alzheimer’s disease through July 2004. Studies later in 2004 were included only if they provided new information. However, the search strategy failed to identify several studies, mostly old ones. For that reason, “dementia” and “Alzheimer’s disease” were combined with the generic name of any single antipsychotic agent that might have been used in patients with dementia. Only RCTs were included. Studies of the elderly who had not been diagnosed as demented were not included.
A total of 34 publications of RCTs with antipsychotic treatment in dementia were identified. Different results from one study appeared in four publications, and two other studies appeared in two publications. Three systematic meta-analyses were found, as well as two Cochrane reviews, one concerning thioridazine and one concerning haloperidol. Seven studies followed the effect of withdrawal from antipsychotic treat-ment in patients with dementia.
ResultsThe majority of the studies did not differentiate dementia diagnoses. Some studies included more than one dementia diagnosis, such as AD, VaD or mixed dementia. Eleven studies included AD patients only. Due to the heterogeneity of the studies, the various diagnoses cannot be ana-lyzed separately. The degree of cognitive reduction among the included patients varied from mild to severe dementia. Behavioral symptoms were present in all studies. Sixteen of the studies were rated as moderate qual-

D E M E N T I A – D I AG N O S T I C A N D T H E R A P E U T I C I N T E RV E N T I O N S384
ity and one as acceptable quality. Although several studies were well-designed, a high discontinuation rate reduced their quality. However, a high discontinuation rate is to be expected in this patient group.
Several studies concerned haloperidol. A mean dose of at least 2 mg was superior to placebo, while 0.5–1.8 mg was not [4–10]. Coccaro et al reported a small effect from a mean of 1.5 mg haloperidol [11]. Devanand et al found that the serum concentration of haloperidol predicted effect better than the dose administered [12].
All studies showed more extra pyramidal symptoms (EPS) in haloperi-dol groups than in placebo groups, and one study reported that 2–3 mg could cause severe extra pyramidal symptoms [7]. Chan et al found EPS in mean as low as 0.9 mg haloperidol [13]. Thus extra pyramidal side-effects are found at doses lower than those reported to reduce agitation, as well as at levels where clinical effects are evident.
Barnes et al did not find more improvement with thioridazine (63 mg) or loxapine (10.5 mg) than in the placebo group [14]. Petrie et al found equal effects of loxatine (21.9 mg) and haloperidol (4.6 mg), significantly better than the placebo group [4]. Carlyle et al found equal effects of haloperidol 7 mg and loxapine 36 mg, but with more side-effects in the haloperidol group [15]. Gutzmann et al found equal effects of tiapride 200 mg and 100 mg melperone [16], while Allain et al found equal effects of 200 mg tiapride and 4 mg haloperidol, both active groups improving more than placebo [5]. Extra pyramidal side-effects were more prominent with haloperidol than with tiapride.
A comparison of risperidone with placebo found significant effects [6,17,18]. Flexible doses were used, and the mean was 1.1 and 0.95 mg respectively [6,18]. DeDeyn et al used fixed doses and found effects of 1 and 2 mg risperidone, while 0.5 mg only showed significant effect on the aggression item at 12 weeks [6]. The same study did not find a signi-ficant effect for haloperidol, as opposed to risperidone, on the primary effect variable. A subgroup analysis of patients with psychotic symptoms in a study by Katz [17], Schneider et al found significant effects of 1 and 2 mg risperidone on psychotic symptoms [2]. A study by Meguro et al

C H A P T E R 2 5 • T R E AT M E N T O F P S YC H OT I C A N D B E H AV I O R A L S Y M P TO M S I N D E M E N T I A
385
on wandering behavior in patients with dementia found 1 mg risperidone to be more effective than placebo [19].
Comparing 5, 10 and 15 mg of olanzapine with placebo in nursing home patients, Street et al found 5 and 10 mg to be superior to placebo, par-ticularly 5 mg [20]. The study was analyzed further. One study found effects on anxiety symptoms [21], a second study showed reduced psy-chotic symptoms [22], and a third study found effects in a subgroup of patients that met the criteria for Lewy body dementia [23]. Fontaine et al compared olanzapine and risperidone in a two-week study [24]. Both substances were individually adjusted. Similar effects were found with a mean dose of olanzapine 6.65 mg and risperidone 1.47 mg. Meehan et al found 2.5 mg or 5 mg of intramuscular olanzapine superior to 1 mg lorazepam or placebo [25], and the same group published similar data in a study with identical design [26]. A comparison of risperidone and olanzapine by Mulsant et al found no difference in effect or side-effects among comparable doses [27].
Three meta-analyses of antipsychotic treatment in dementia were identi- fied [28–30]. Schneider et al found that treatment with traditional anti- psychotics was superior to placebo but that the effect size was small (0.18) – of 100 treated patients, only 18 improved [29]. Lanctot et al found that low-potency, medium-potency, and high-potency antipsychotics had similar therapeutic effects, concluding that antipsychotic treatment had a significant but small positive effect compared to placebo for behavioral symptoms in dementia [28].
Kirchner et al performed a Cochrane review of thioridazine for dementia [31]. They also included old studies. They concluded that thioridazine reduced anxiety but had no significant effect on clinical global change. Side-effects were not systematically analyzed.
Lonergan et al performed a Cochrane review of haloperidol for agitation in dementia [32]. They concluded that there was no significant impro-vement in agitation among haloperidol patients compared with controls. Aggression was reduced with haloperidol, but other aspects of agitation were not affected.

D E M E N T I A – D I AG N O S T I C A N D T H E R A P E U T I C I N T E RV E N T I O N S386
No meta-analysis has been performed on treatment with atypical antipsychotics in dementia.
Study on withdrawal of antipsychotic treatment in dementiaRay et al and Thapa et al compared the withdrawal of antipsycho-tics with control groups in combination with an educational program [33,34]. Both studies concluded that withdrawal had no, or a positive, effect on behavioral symptoms, but their quality was low. Bridget-Parlet et al performed a blind withdrawal and reported no significant effect on behavioral symptoms, except for two patients who had to drop out [35]. A double-blind crossover study of antipsychotic withdrawal in nursing home patients with dementia by Cohn-Mansfield et al observed no sig-nificant difference [36]. van Reekum et al reported that a double-blind withdrawal of antipsychotics increased apathetic behavior in the placebo group, while behavioral symptoms became more frequent in the active treatment group [37]. Ballard et al studied withdrawal of antipsychotics over a period of 3 months and found no difference compared with blind continued treatment [38]. The best effect was found in patients with only a few behavioral symptoms. Ruths et al reported that 11 out of the 15 patients in a withdrawal study improved, while 4 exhibited additional symptoms [39].
Treatment of BPSD with antidepressants
Antidepressives were compared with antipsychotics in patients with dementia and behavioral symptoms. Citalopram 20 mg was equivalent to perphenazine 6.5 mg [40]. Trazodone, mean dose 218 mg, had the same effect as haloperidol, mean dose 2.5 mg [41,42], while trazodone 200 mg and haloperidol 1.8 mg [10] were equivalent.

C H A P T E R 2 5 • T R E AT M E N T O F P S YC H OT I C A N D B E H AV I O R A L S Y M P TO M S I N D E M E N T I A
387
Rate of decline of cognitive symptoms during antipsychotic treatmentMcShane et al studied the effect of antipsychotic treatment on the rate of cognitive decline in patients with dementia in nursing homes [43]. They found evidence of a more rapid cognitive decline in patients trea-ted with antipsychotics. However, the group was small and the study design questionable.
Effects of antipsychotics on cerebral vascular events in patients with dementiaWooltorton et al reported an increase in the rate of cerebral vascular events from 1.2% to 3.3% in patients with dementia who had received risperidone [44]. A similar threefold increase in cerebral vascular events, as well as twice as much mortality, was found for olanzapine in this patient group [45]. Similar data have been reported for aripirazol [46].
Herrmann et al studied the risk of cerebral vascular accidents with atypical antipsychotics in patients older than 66 [47]. No differences between risperidone, olanzapine and older antipsychotics were found. Kozma et al studied the risk of stroke in patients older than 60 who were treated with antipsychotics (n = 1 818), benzodiazepines (n = 2 419) and acetyl cholinesterase inhibitors (n = 8 733) [48]. No difference was found between risperidone and olanzapine, haloperidol or benzodiazepines. A lower risk was found in patients treated with acetyl cholinesterase inhibi-tors. Gill et al studied the risk of ischemic stroke in 32 710 patients with dementia who had been given antipsychotics [49]. They found no dif-ference between older (traditional) and newer (atypical) antipsychotics. A recently published meta-analysis by Schneider et al found that atypical antipsychotic drugs may be associated with a small increased risk of death compared with placebo [50].

D E M E N T I A – D I AG N O S T I C A N D T H E R A P E U T I C I N T E RV E N T I O N S388
Treatment of BPSD symptoms with antiepileptic drugs
SearchMedline was searched for RCTs with the terms “dementia” and “anti-epileptics”. Seven studies were identified, of which 2 were open pilot studies [51,52]. Tekin et al studied the effects of lamotrigine on cognitive functions [52]. The terms “phenantoin”, “carmabazepine”, “valproate”, “lamotrigine” and “topiramate” were all searched with “dementia,” and additional open studies were identified [53,54].
ResultsThe study by Tariot et al included 51 patients with dementia and agi-tation [55]. Over 6 weeks, the mean total BPSD scores decreased by 7.7 points for the carbamazepine group and 0.9 points for the placebo group. The CGI ratings showed a global improvement in 77% of the patients taking carbamazepine and 21% of those taking placebo. The two groups were followed in a withdrawal study, and those who had previously shown behavioral improvement with carbamazepine therapy reverted to their baseline state after washout, whereas there was no change in the patients previously treated with placebo [56]. But a pilot study by Olin et al reported only modest positive effects on a group that had shown no response to antipsychotic treatment [57].
Porsteinsson et al performed a 6-week, randomised study of 56 nursing home patients with agitation and dementia who received either placebo or individualized doses of divalproex [58]. The effects were modest, and side-effects were considerably more common with divalproex. Sival et al found no effect of valproate compared to placebo on aggressive behavior in dementia [54]. A 12-week open follow-up study reported some effect, but 7 of the 39 analyzed patients died [53]. All 4 studies were of limited quality. Lonergan et al published a Cochrane review on the effects of valproate for the treatment of agitation in dementia [59]. They identified

C H A P T E R 2 5 • T R E AT M E N T O F P S YC H OT I C A N D B E H AV I O R A L S Y M P TO M S I N D E M E N T I A
389
the abovementioned studies, except for the non-placebo controlled study [53]. Their conclusion was that the reviewed trials should be regarded as preliminary. Individual reports suggest that low dose sodium valproate is ineffective in treating agitation among patients with dementia and that high dose divalproex sodium is associated with an unacceptable rate of adverse effects.

D E M E N T I A – D I AG N O S T I C A N D T H E R A P E U T I C I N T E RV E N T I O N S390
Table 25.1 Treatment of behavioral symptoms with antipsychotic drugs.
Author Year, reference
Type of study
Setting Dementia/diagnosis
Severity of dementia
Patients (n) included (attrition)
Age-groups Range (SD)
Study period
Intervention (end)
Primary outcome
Effects (end) Remarks from reviewer
Quality of study
Allain et al2000 [5]
RCT Out-patients
Dementia according to DSM-III-R
Moderate-severe
316 79.6SD 7.6
3 w Haloperidol 4 mgTiapride 200 mgPlacebo
MOSES Haloperidol = tiapride > placebo
EPS: Haloperidol > tiapride
1
Auchus et al1997 [8]
RCT Out-patients
AD according to NINCDS
Moderate 15 75.7SD 7.5
6 w Fluoxetine 20 mgHaloperidol 3 mgPlacebo
CMAI No diffe-rence between groups
Too small groups.Haloperiol and fluoxetin more side-effects
1
Barnes et al 1982 [14]
RCT Nursing home
Dementia according to DSM-III
Not men-tioned
60 >65 8 w Thioridazine 62.5 mgLoxapine 10.5 mgPlacebo
BPRS Small impro-vement in all three groups, no significant difference be- tween groups
Prominent side-effects of active treatment
1
Battaglia et al 2003 [26]
RCT Hospital AD according to NINCDS
Not men-tioned
206 ≥55 Acute treat-ment only
Olanzapine 2.5 mg/doseLorazepam 1 mg/dosePlacebo
Doses needed for effect
Olanzapine= lorazepam > placebo
Acutely agi-tated patients
1
Brodaty et al 2003 [18]
RCT Nursing home
AD or vascu-lar dementia according to DSM-IV
Light-severe 337 83.0SD 0.58
12 w RisperidoneM = 0.95 mgPlacebo
CMAI Risperidone > placebo
Few side-effects
2
Carlyle et al 1993 [15]
RCT Hospital Dementia according to DSM-III-R
Not recorded
40 7965–91
4 w HaloperidolM = 7 mgLoxapineM = 36 mg
CMAI No difference in effect
More side-effects with haloperiol
1

C H A P T E R 2 5 • T R E AT M E N T O F P S YC H OT I C A N D B E H AV I O R A L S Y M P TO M S I N D E M E N T I A
391
Table 25.1 Treatment of behavioral symptoms with antipsychotic drugs.
Author Year, reference
Type of study
Setting Dementia/diagnosis
Severity of dementia
Patients (n) included (attrition)
Age-groups Range (SD)
Study period
Intervention (end)
Primary outcome
Effects (end) Remarks from reviewer
Quality of study
Allain et al2000 [5]
RCT Out-patients
Dementia according to DSM-III-R
Moderate-severe
316 79.6SD 7.6
3 w Haloperidol 4 mgTiapride 200 mgPlacebo
MOSES Haloperidol = tiapride > placebo
EPS: Haloperidol > tiapride
1
Auchus et al1997 [8]
RCT Out-patients
AD according to NINCDS
Moderate 15 75.7SD 7.5
6 w Fluoxetine 20 mgHaloperidol 3 mgPlacebo
CMAI No diffe-rence between groups
Too small groups.Haloperiol and fluoxetin more side-effects
1
Barnes et al 1982 [14]
RCT Nursing home
Dementia according to DSM-III
Not men-tioned
60 >65 8 w Thioridazine 62.5 mgLoxapine 10.5 mgPlacebo
BPRS Small impro-vement in all three groups, no significant difference be- tween groups
Prominent side-effects of active treatment
1
Battaglia et al 2003 [26]
RCT Hospital AD according to NINCDS
Not men-tioned
206 ≥55 Acute treat-ment only
Olanzapine 2.5 mg/doseLorazepam 1 mg/dosePlacebo
Doses needed for effect
Olanzapine= lorazepam > placebo
Acutely agi-tated patients
1
Brodaty et al 2003 [18]
RCT Nursing home
AD or vascu-lar dementia according to DSM-IV
Light-severe 337 83.0SD 0.58
12 w RisperidoneM = 0.95 mgPlacebo
CMAI Risperidone > placebo
Few side-effects
2
Carlyle et al 1993 [15]
RCT Hospital Dementia according to DSM-III-R
Not recorded
40 7965–91
4 w HaloperidolM = 7 mgLoxapineM = 36 mg
CMAI No difference in effect
More side-effects with haloperiol
1
The table continues on the next page

D E M E N T I A – D I AG N O S T I C A N D T H E R A P E U T I C I N T E RV E N T I O N S392
Table 25.1 continued
Author Year, reference
Type of study
Setting Dementia/diagnosis
Severity of dementia
Patients (n) included (attrition)
Age-groups Range (SD)
Study period
Intervention (end)
Primary outcome
Effects (end) Remarks from reviewer
Quality of study
Chan et al2001 [13]
RCT Hospital AD or vascu-lar dementia according to DSM-IV
Moderate-severe
58 80.5SD 8.2
12 w RisperidoneM = 0.85HaloperidolM = 0.9
CMAI No difference More side-effects with haloperiol
2
Clark et al 2001 [22] (data from Street et al [20])
RCT Nursing home
AD according to NINCDS.Subgroups without hal-lucinations or delusions
Severe-moderate
206 82.7SD 6.6
6 w Olanzapine 5 mgOlanzapine 10 mgOlanzapine 15 mgPlacebo
NPI Olanzapine > placebo
Further analy-ses of Street et al [20]
Coccaro et al 1990 [11]
RCT Nursing home
Dementia according to DSM-III
Not mentioned
59 75.358–99
8 w HaloperidolM = 1.5 mgOxazepamM = 30 mgDiphen- hydramineM = 49 mg
BPRS Small effects with all three drugs
Side-effects not mentioned
1
Cummings et al2002 [23]
RCT Nursing home
AD according to NINCDS.Criteria for Lewy body dementia
Light- severe
29 83.9SD 5.4
6 w Olanzapine 5, 10 and 15 mgPlacebo
NPI-NH 5 and 10 mg > placebo
Subgroup of Street et al [20] with Lewy body dementia
2
De Deyn et al1999 [6]
RCT Nursing home
AD or vascu-lar dementia according to DSM-IV
Light- severe
344 8163–97
12 w RisperidoneM = 1.1 mgHaloperidolM = 1.2 mgPlacebo
Behave-AD Risperidone > placeboHaloperidol = placebo
EPS: Halo-peridol > risperidone = placebo
2
De Deyn et al2004 [60]
RCT Nursing home
AD according to NINCDS andpsychotic symptoms
Light- severe
625 76.6SD 10.6
10 w Olanzapine 1, 2.5, 5, and 7.5 mgPlacebo
NPI/NHCGI
Olanzapine 2.5, 5, 7.5 mg > olanza- pine 1 mg = placebo
Study of effect on psychotic symptoms
2

C H A P T E R 2 5 • T R E AT M E N T O F P S YC H OT I C A N D B E H AV I O R A L S Y M P TO M S I N D E M E N T I A
393
Table 25.1 continued
Author Year, reference
Type of study
Setting Dementia/diagnosis
Severity of dementia
Patients (n) included (attrition)
Age-groups Range (SD)
Study period
Intervention (end)
Primary outcome
Effects (end) Remarks from reviewer
Quality of study
Chan et al2001 [13]
RCT Hospital AD or vascu-lar dementia according to DSM-IV
Moderate-severe
58 80.5SD 8.2
12 w RisperidoneM = 0.85HaloperidolM = 0.9
CMAI No difference More side-effects with haloperiol
2
Clark et al 2001 [22] (data from Street et al [20])
RCT Nursing home
AD according to NINCDS.Subgroups without hal-lucinations or delusions
Severe-moderate
206 82.7SD 6.6
6 w Olanzapine 5 mgOlanzapine 10 mgOlanzapine 15 mgPlacebo
NPI Olanzapine > placebo
Further analy-ses of Street et al [20]
Coccaro et al 1990 [11]
RCT Nursing home
Dementia according to DSM-III
Not mentioned
59 75.358–99
8 w HaloperidolM = 1.5 mgOxazepamM = 30 mgDiphen- hydramineM = 49 mg
BPRS Small effects with all three drugs
Side-effects not mentioned
1
Cummings et al2002 [23]
RCT Nursing home
AD according to NINCDS.Criteria for Lewy body dementia
Light- severe
29 83.9SD 5.4
6 w Olanzapine 5, 10 and 15 mgPlacebo
NPI-NH 5 and 10 mg > placebo
Subgroup of Street et al [20] with Lewy body dementia
2
De Deyn et al1999 [6]
RCT Nursing home
AD or vascu-lar dementia according to DSM-IV
Light- severe
344 8163–97
12 w RisperidoneM = 1.1 mgHaloperidolM = 1.2 mgPlacebo
Behave-AD Risperidone > placeboHaloperidol = placebo
EPS: Halo-peridol > risperidone = placebo
2
De Deyn et al2004 [60]
RCT Nursing home
AD according to NINCDS andpsychotic symptoms
Light- severe
625 76.6SD 10.6
10 w Olanzapine 1, 2.5, 5, and 7.5 mgPlacebo
NPI/NHCGI
Olanzapine 2.5, 5, 7.5 mg > olanza- pine 1 mg = placebo
Study of effect on psychotic symptoms
2
The table continues on the next page

D E M E N T I A – D I AG N O S T I C A N D T H E R A P E U T I C I N T E RV E N T I O N S394
Table 25.1 continued
Author Year, reference
Type of study
Setting Dementia/diagnosis
Severity of dementia
Patients (n) included (attrition)
Age-groups Range (SD)
Study period
Intervention (end)
Primary outcome
Effects (end) Remarks from reviewer
Quality of study
Devanand et al 1989 [9]
Cross-over with blind rating
Out-patients
AD according to NINCDS
Light- severe
9 Presenile and senile
4 + 8 + 4 w Haloperidol 4 mgPlacebo
BPRS Haloperidol > placebo
Prominent side-effects
1
Devanand et al 1992 [12]
Drug concen-tration Corre-lation
Out-patients
AD according to NINCDS
Not mentioned
19 67.6SD 9.7
6–8 w Haloperidol 0.5–5 mg
BPRS Blood level corr better than dose with effect
EPS corr with blood level
1
Devanand et al 1998 [7]
RCT + Cross-over
Out-patients
AD according to NINCDS
Severe-moderate
71 72.1SD 9.6
6 + 6 w Haloperidol 2–3 mgHaloperidol 0.5–0.75 mgPlacebo
BPRS Haloperidol 2–3 mg > haloperidol 0.5–0.75 mg= placebo
EPS: 2–3 mg > 0.5–0.75 mg = placebo
2
Gutzmann et al 1997 [16]
RCT Hospital Dementia according to DSM-III-R
Light- severe
175 74.8SD 11.5
4 w Tiapride 400 mgMelperone 100 mg
CGI No difference No placebo-group
1
Fontaine et al 2003 [24]
RCT Nursing home
Dementia according to DSM-IV
Severe-moderate
39 83.2SD 7.6
2 w Olanzapine 2.5–10 mg(M = 6.7)Risperidone 0.5–2 mg(M = 1.5)
CGINPI
No difference No placebo-group
2
Frank et al 2004 [61]
RCT Nursing home
Dementia and behavioral symptoms
Light- severe
279 82.8SEM 0.7
12 w Risperidone 0.5–2.0 mgPlacebo
Modified nursing care assessment scale
Risperidone > placebo
Nursing care burden
2

C H A P T E R 2 5 • T R E AT M E N T O F P S YC H OT I C A N D B E H AV I O R A L S Y M P TO M S I N D E M E N T I A
395
Table 25.1 continued
Author Year, reference
Type of study
Setting Dementia/diagnosis
Severity of dementia
Patients (n) included (attrition)
Age-groups Range (SD)
Study period
Intervention (end)
Primary outcome
Effects (end) Remarks from reviewer
Quality of study
Devanand et al 1989 [9]
Cross-over with blind rating
Out-patients
AD according to NINCDS
Light- severe
9 Presenile and senile
4 + 8 + 4 w Haloperidol 4 mgPlacebo
BPRS Haloperidol > placebo
Prominent side-effects
1
Devanand et al 1992 [12]
Drug concen-tration Corre-lation
Out-patients
AD according to NINCDS
Not mentioned
19 67.6SD 9.7
6–8 w Haloperidol 0.5–5 mg
BPRS Blood level corr better than dose with effect
EPS corr with blood level
1
Devanand et al 1998 [7]
RCT + Cross-over
Out-patients
AD according to NINCDS
Severe-moderate
71 72.1SD 9.6
6 + 6 w Haloperidol 2–3 mgHaloperidol 0.5–0.75 mgPlacebo
BPRS Haloperidol 2–3 mg > haloperidol 0.5–0.75 mg= placebo
EPS: 2–3 mg > 0.5–0.75 mg = placebo
2
Gutzmann et al 1997 [16]
RCT Hospital Dementia according to DSM-III-R
Light- severe
175 74.8SD 11.5
4 w Tiapride 400 mgMelperone 100 mg
CGI No difference No placebo-group
1
Fontaine et al 2003 [24]
RCT Nursing home
Dementia according to DSM-IV
Severe-moderate
39 83.2SD 7.6
2 w Olanzapine 2.5–10 mg(M = 6.7)Risperidone 0.5–2 mg(M = 1.5)
CGINPI
No difference No placebo-group
2
Frank et al 2004 [61]
RCT Nursing home
Dementia and behavioral symptoms
Light- severe
279 82.8SEM 0.7
12 w Risperidone 0.5–2.0 mgPlacebo
Modified nursing care assessment scale
Risperidone > placebo
Nursing care burden
2
The table continues on the next page

D E M E N T I A – D I AG N O S T I C A N D T H E R A P E U T I C I N T E RV E N T I O N S396
Table 25.1 continued
Author Year, reference
Type of study
Setting Dementia/diagnosis
Severity of dementia
Patients (n) included (attrition)
Age-groups Range (SD)
Study period
Intervention (end)
Primary outcome
Effects (end) Remarks from reviewer
Quality of study
Katz et al1999 [17]
RCT Nursing home
AD or vascu-lar dementia according to DSM-IV
Light- severe
625 82.7SD 7.7
12 w Risperidone fix dose 0.5, 1.0, 2.0 mg, placebo
Behave-AD Risperidone > placebo
EPS increased with dose
2
Katz et al2004 [62]
RCT Nursing home
AD or vascu-lar dementia according to DSM-IV
Light- Severe
537 82.7SD 7.7
12 w Risperidone fix dose 0.5, 1.0, 2.0 mg, placebo
Rating of falls Risperidone 1 mg better than placebo.Placebo better than risperi-done 2 mg
Subanalysis of Katz et al [17]
2
Kennedy et al 2001 [63](Data from Street et al [20])
RCT Nursing home
AD according to NINCDS
Moderate-severe
206 82.761–97
6 w Olanzapine 5, 10, 15 mgPlacebo
5 items from adverse event list
No significant difference
Not valida-ted efficacy variable
1
Meguro et al 2004 [19]
RCT Nursing home
AD according to NINCDS.Wandering or aggressive-ness
34 78 1 month Risperidone 1 mgPlacebo
Behave-AD Risperidone > placebo
Study of wandering behavior
2
Meehan et al 2002 [25]
RCT Nursing home
AD or vascu-lar dementia according to DSM-IV for AD
Light- severe
272 77.6SD 9.7
Acute treat-ment
Olanzapine 2.5, 5.0 mg intramuscular, lorazepam 1.0 mg intra muscular and placebo
CMAI After 24 h: Olanzapine 2.5 and 5 mg = lorazepam > placebo
Short-term effect
1
Mintzer et al 2001 [21](Data from Street et al 2000 [20])
RCT Nursing home
AD according to NINCDS
Moderate-severe
206 82.761–97
6 w Olanzapine 5, 10, 15 mgPlacebo
NPI/NH anxiety
Olanzapine 5 mg > placebo Olanzapine 5, 10 mg = placebo
Post-hoc analy-ses
2

C H A P T E R 2 5 • T R E AT M E N T O F P S YC H OT I C A N D B E H AV I O R A L S Y M P TO M S I N D E M E N T I A
397
Table 25.1 continued
Author Year, reference
Type of study
Setting Dementia/diagnosis
Severity of dementia
Patients (n) included (attrition)
Age-groups Range (SD)
Study period
Intervention (end)
Primary outcome
Effects (end) Remarks from reviewer
Quality of study
Katz et al1999 [17]
RCT Nursing home
AD or vascu-lar dementia according to DSM-IV
Light- severe
625 82.7SD 7.7
12 w Risperidone fix dose 0.5, 1.0, 2.0 mg, placebo
Behave-AD Risperidone > placebo
EPS increased with dose
2
Katz et al2004 [62]
RCT Nursing home
AD or vascu-lar dementia according to DSM-IV
Light- Severe
537 82.7SD 7.7
12 w Risperidone fix dose 0.5, 1.0, 2.0 mg, placebo
Rating of falls Risperidone 1 mg better than placebo.Placebo better than risperi-done 2 mg
Subanalysis of Katz et al [17]
2
Kennedy et al 2001 [63](Data from Street et al [20])
RCT Nursing home
AD according to NINCDS
Moderate-severe
206 82.761–97
6 w Olanzapine 5, 10, 15 mgPlacebo
5 items from adverse event list
No significant difference
Not valida-ted efficacy variable
1
Meguro et al 2004 [19]
RCT Nursing home
AD according to NINCDS.Wandering or aggressive-ness
34 78 1 month Risperidone 1 mgPlacebo
Behave-AD Risperidone > placebo
Study of wandering behavior
2
Meehan et al 2002 [25]
RCT Nursing home
AD or vascu-lar dementia according to DSM-IV for AD
Light- severe
272 77.6SD 9.7
Acute treat-ment
Olanzapine 2.5, 5.0 mg intramuscular, lorazepam 1.0 mg intra muscular and placebo
CMAI After 24 h: Olanzapine 2.5 and 5 mg = lorazepam > placebo
Short-term effect
1
Mintzer et al 2001 [21](Data from Street et al 2000 [20])
RCT Nursing home
AD according to NINCDS
Moderate-severe
206 82.761–97
6 w Olanzapine 5, 10, 15 mgPlacebo
NPI/NH anxiety
Olanzapine 5 mg > placebo Olanzapine 5, 10 mg = placebo
Post-hoc analy-ses
2
The table continues on the next page

D E M E N T I A – D I AG N O S T I C A N D T H E R A P E U T I C I N T E RV E N T I O N S398
Table 25.1 continued
Author Year, reference
Type of study
Setting Dementia/diagnosis
Severity of dementia
Patients (n) included (attrition)
Age-groups Range (SD)
Study period
Intervention (end)
Primary outcome
Effects (end) Remarks from reviewer
Quality of study
Mulsant et al 2004 [27]
RCT Long term care
AD, VaD or mixed dementia according to DSM-IV
Light- severe
85 84range63–96
6 w Risperidone 0.75–1.5 mgOlanzapine 5–10 mg
UKUNPI
No difference in side-effects or behavioral symptoms
Anticholinergic effects seen with olanza-pine
1
Nygaard et al1994 [64]
RCT Nursing home
Clinical dementia rating scale
Light- severe
73 8370– >90
4 w Zuclopentixol 2.0, 4, 6 and 4–20 mg
CGI illness All groups improved
1
Pelton et al 2003 [65]
RCT Out-patients
AD according to NINCDS
Severe-moderate
71 72.1SD 9.6
6 w Haloperidol 2–3 mgHaloperidol 0.5–0.75 mgPlacebo
BPRS Serum level of haloperidol correlated with effect
Same material as Devanand et al [7]
2
Petrie et al 1982 [4]
RCT Hospital Dementia according to DSM-III
Severe-moderate
61 72.7SD 7.0
8 w HaloperidolM = 4.6 mgLoxepineM = 21.9 mgPlacebo
BPRS Haloperidol= loxapine > placebo
45% EPS in both active groups
1
Pollock et al 2002 [40]
RCT Hospital Dementia according to DSM-IV
Severe-moderate
85 80.1SD 8.1
17 d Perphenazine M = 6.5 mgCitalopram 20 mgPlacebo
Neurobehav rating scale
Citalopram > perphenazineCitalopram > placeboPerphenazine > placebo
High disconti-nuation rate
1
Schneider et al 2003 [2]
RCT Nursing home
AD or vascu-lar dementia according to DSM-IV and psychotic symptoms
Light- severe
12 w Risperidone fix dose 0.5, 1.0, 2.0 mgPlacebo
Behave-AD Risperidone 1 and 2 mg > placebo
Subgroup of Katz et al [17]
2

C H A P T E R 2 5 • T R E AT M E N T O F P S YC H OT I C A N D B E H AV I O R A L S Y M P TO M S I N D E M E N T I A
399
Table 25.1 continued
Author Year, reference
Type of study
Setting Dementia/diagnosis
Severity of dementia
Patients (n) included (attrition)
Age-groups Range (SD)
Study period
Intervention (end)
Primary outcome
Effects (end) Remarks from reviewer
Quality of study
Mulsant et al 2004 [27]
RCT Long term care
AD, VaD or mixed dementia according to DSM-IV
Light- severe
85 84range63–96
6 w Risperidone 0.75–1.5 mgOlanzapine 5–10 mg
UKUNPI
No difference in side-effects or behavioral symptoms
Anticholinergic effects seen with olanza-pine
1
Nygaard et al1994 [64]
RCT Nursing home
Clinical dementia rating scale
Light- severe
73 8370– >90
4 w Zuclopentixol 2.0, 4, 6 and 4–20 mg
CGI illness All groups improved
1
Pelton et al 2003 [65]
RCT Out-patients
AD according to NINCDS
Severe-moderate
71 72.1SD 9.6
6 w Haloperidol 2–3 mgHaloperidol 0.5–0.75 mgPlacebo
BPRS Serum level of haloperidol correlated with effect
Same material as Devanand et al [7]
2
Petrie et al 1982 [4]
RCT Hospital Dementia according to DSM-III
Severe-moderate
61 72.7SD 7.0
8 w HaloperidolM = 4.6 mgLoxepineM = 21.9 mgPlacebo
BPRS Haloperidol= loxapine > placebo
45% EPS in both active groups
1
Pollock et al 2002 [40]
RCT Hospital Dementia according to DSM-IV
Severe-moderate
85 80.1SD 8.1
17 d Perphenazine M = 6.5 mgCitalopram 20 mgPlacebo
Neurobehav rating scale
Citalopram > perphenazineCitalopram > placeboPerphenazine > placebo
High disconti-nuation rate
1
Schneider et al 2003 [2]
RCT Nursing home
AD or vascu-lar dementia according to DSM-IV and psychotic symptoms
Light- severe
12 w Risperidone fix dose 0.5, 1.0, 2.0 mgPlacebo
Behave-AD Risperidone 1 and 2 mg > placebo
Subgroup of Katz et al [17]
2
The table continues on the next page

D E M E N T I A – D I AG N O S T I C A N D T H E R A P E U T I C I N T E RV E N T I O N S400
Table 25.1 continued
Author Year, reference
Type of study
Setting Dementia/diagnosis
Severity of dementia
Patients (n) included (attrition)
Age-groups Range (SD)
Study period
Intervention (end)
Primary outcome
Effects (end) Remarks from reviewer
Quality of study
Street et al 2000 [20]
RCT Nursing home
AD according to NINCDS
Severe-moderate
206 82.7SD 6.6
6 w Olanzapine 5 mgOlanzapine 10 mgOlanzapine 15 mgPlacebo
NPI Olanzapine 5 and 10 mg > placebo
2
Sultzer et al2001 [41]
RCT Hospital Dementia diagnoses by clinical research investigator
Severe- light
28 72.3SD 6.9
9 w HaloperidolM = 2.5 mgTrazodoneM = 218 mg
CMAT No difference in effect
Halopridol more side-effects
1
Sultzer et al 2001 [42]
RCT Hospital Dementia diagnoses by clinical research investigator
Severe- light
28 72.3SD 6.9
9 w HaloperidolM = 2.5 mgTrazodoneM = 218 mg
CMAT Mild depres-sive symptom associated with more impro-vement with trazodone
Further analyses of the material in Sultzer et al [41]
1
Teri et al 2000 [10]
RCT Out-patients
AD according to NINCDS
Moderate-light
149 74.9SD 7.0
16 w HaloperidolM = 1.8 mgTrazodoneM = 200 mgBehavior management techniquesPlacebo
CGI No differ-ence between groups
2
AD = Alzheimer’s disease; BPRS = Brief Psychiatric Rating Scale; CGI = Clinical Global Impression Scale; CMAI = Cohen-Mansfield Agitation Inventory; CMAT = Cognitive multidisciplinary assessment team; DSM = Diagnostic and Statistical Manual; EPS = Extra pyramidal symptoms; MOSES = Multidimentional Observation Scale for Elderly Subjects; NINCDS = National institute of neurological and communicable diseases; NPI = Neuro-psychiatric inventory; NPI-NH = Neuropsychiatric inventory, Nursing Home version; RCT = Randomised controlled trial; SD = Standard deviation; UKU = Udvalg for kliniska undersogelser (Danish for selection of clinical investigations); VaD = Vascular dementia

C H A P T E R 2 5 • T R E AT M E N T O F P S YC H OT I C A N D B E H AV I O R A L S Y M P TO M S I N D E M E N T I A
401
Table 25.1 continued
Author Year, reference
Type of study
Setting Dementia/diagnosis
Severity of dementia
Patients (n) included (attrition)
Age-groups Range (SD)
Study period
Intervention (end)
Primary outcome
Effects (end) Remarks from reviewer
Quality of study
Street et al 2000 [20]
RCT Nursing home
AD according to NINCDS
Severe-moderate
206 82.7SD 6.6
6 w Olanzapine 5 mgOlanzapine 10 mgOlanzapine 15 mgPlacebo
NPI Olanzapine 5 and 10 mg > placebo
2
Sultzer et al2001 [41]
RCT Hospital Dementia diagnoses by clinical research investigator
Severe- light
28 72.3SD 6.9
9 w HaloperidolM = 2.5 mgTrazodoneM = 218 mg
CMAT No difference in effect
Halopridol more side-effects
1
Sultzer et al 2001 [42]
RCT Hospital Dementia diagnoses by clinical research investigator
Severe- light
28 72.3SD 6.9
9 w HaloperidolM = 2.5 mgTrazodoneM = 218 mg
CMAT Mild depres-sive symptom associated with more impro-vement with trazodone
Further analyses of the material in Sultzer et al [41]
1
Teri et al 2000 [10]
RCT Out-patients
AD according to NINCDS
Moderate-light
149 74.9SD 7.0
16 w HaloperidolM = 1.8 mgTrazodoneM = 200 mgBehavior management techniquesPlacebo
CGI No differ-ence between groups
2

D E M E N T I A – D I AG N O S T I C A N D T H E R A P E U T I C I N T E RV E N T I O N S402
Table 25.2 Effects of withdrawal of antipsychotic drugs in dementia.
Author Year, reference
Type of study
Setting Dementia/diagnosis
Severity of dementia
Patients (n)
included
Age-groups Range (SD)
Study period
Intervention Primary outcome
Effects (end) Remarks from reviewer
Quality of study
Ballard et al 2004 [38]
RCT Nursing home
AD accor-ding to NINCDS
Severe 100 83.4SD 8.2
3 months Withdrawal of antipsychotic treatment.Placebo
NPI No differ-ence between groups. Best effects of withdrawal in those with low NPI
1
Bridges-Parlet et al 1997 [35]
RCT Nursing home
“Demented aggres-sive nur-sing home patients”
Severe 36 82.8SD 6.1
4 w Withdrawal of antipsychotic treatment.Placebo
Global measure of untolerable symptoms
No difference 1
Cohen-Mansfield et al 1999 [36]
RCT Nursing home
Residents in nursing home receiving antipsychotic treatment or lorazepam
Mean MMSE 8.7
58 86 7 w Withdrawal of antipsychotic treatment or lorazepam
BPRS No difference Very high rate of non-completers
1
Ray et al 1993 [33]
Inter- vention
Nursing home
Nursing home residents
Not given 278 82SD 0.8
4 months Implemen-tation of behavioral techniques to reduce use of antipsychotic treatment
Use of anti-psychotics
Reduced use of antipsychotic agents without increase of behavioral symptoms
No definition of dementia in material
0

C H A P T E R 2 5 • T R E AT M E N T O F P S YC H OT I C A N D B E H AV I O R A L S Y M P TO M S I N D E M E N T I A
403
Table 25.2 Effects of withdrawal of antipsychotic drugs in dementia.
Author Year, reference
Type of study
Setting Dementia/diagnosis
Severity of dementia
Patients (n)
included
Age-groups Range (SD)
Study period
Intervention Primary outcome
Effects (end) Remarks from reviewer
Quality of study
Ballard et al 2004 [38]
RCT Nursing home
AD accor-ding to NINCDS
Severe 100 83.4SD 8.2
3 months Withdrawal of antipsychotic treatment.Placebo
NPI No differ-ence between groups. Best effects of withdrawal in those with low NPI
1
Bridges-Parlet et al 1997 [35]
RCT Nursing home
“Demented aggres-sive nur-sing home patients”
Severe 36 82.8SD 6.1
4 w Withdrawal of antipsychotic treatment.Placebo
Global measure of untolerable symptoms
No difference 1
Cohen-Mansfield et al 1999 [36]
RCT Nursing home
Residents in nursing home receiving antipsychotic treatment or lorazepam
Mean MMSE 8.7
58 86 7 w Withdrawal of antipsychotic treatment or lorazepam
BPRS No difference Very high rate of non-completers
1
Ray et al 1993 [33]
Inter- vention
Nursing home
Nursing home residents
Not given 278 82SD 0.8
4 months Implemen-tation of behavioral techniques to reduce use of antipsychotic treatment
Use of anti-psychotics
Reduced use of antipsychotic agents without increase of behavioral symptoms
No definition of dementia in material
0
The table continues on the next page

D E M E N T I A – D I AG N O S T I C A N D T H E R A P E U T I C I N T E RV E N T I O N S404
Table 25.2 continued
Author Year, reference
Type of study
Setting Dementia/diagnosis
Severity of dementia
Patients (n)
included
Age-groups Range (SD)
Study period
Intervention Primary outcome
Effects (end) Remarks from reviewer
Quality of study
Ruths et al 2004 [39]
RCT Nursing home
Dementia according to ICD-10-R
Severe 30 83.5 4 w Blind with-drawal of antipsychotic treatment
NPI-Q 11/15 in study group stable or improved, 4 worse
1
Thapa et al 1994 [34]
Inter- vention
Nursing home
Nursing home recidents receiving antipsychotic treatment
Mean MMSE 13.2
271 78.9 6 months Withdrawal on antipsychotic treatment
NHBPS, BPRS
No difference in behavioral symptoms, depressive symptoms reduced after withdrawal
No definition of patient diagnoses, no randomization
0
van Reekum et al 2002 [37]
RCT Nursing home
Nursing home reci-dents with dementia receiving antipsychotic treatment
MMSE 7.6 SD 8.2
31 83.7 SD 5.8
6 months Withdrawal of antipsychotic treatment
Behave-AD Group on antipsychotic treatment had more behavio-ral symptoms
High rate of noncompleters
1
AD = Alzheimer’s disease; BPRS = Brief Psychiatric Rating Scale; ICD = International classification of diseases; MMSE = Mini-mental state examination; NHBPS = Nursing home behavior problem scale; NINCDS = National institute of neurological and commu-nicable diseases; NPI = Neuropsychiatric inventory; RCT = Randomised controlled trial; SD = Standard deviation

C H A P T E R 2 5 • T R E AT M E N T O F P S YC H OT I C A N D B E H AV I O R A L S Y M P TO M S I N D E M E N T I A
405
Table 25.2 continued
Author Year, reference
Type of study
Setting Dementia/diagnosis
Severity of dementia
Patients (n)
included
Age-groups Range (SD)
Study period
Intervention Primary outcome
Effects (end) Remarks from reviewer
Quality of study
Ruths et al 2004 [39]
RCT Nursing home
Dementia according to ICD-10-R
Severe 30 83.5 4 w Blind with-drawal of antipsychotic treatment
NPI-Q 11/15 in study group stable or improved, 4 worse
1
Thapa et al 1994 [34]
Inter- vention
Nursing home
Nursing home recidents receiving antipsychotic treatment
Mean MMSE 13.2
271 78.9 6 months Withdrawal on antipsychotic treatment
NHBPS, BPRS
No difference in behavioral symptoms, depressive symptoms reduced after withdrawal
No definition of patient diagnoses, no randomization
0
van Reekum et al 2002 [37]
RCT Nursing home
Nursing home reci-dents with dementia receiving antipsychotic treatment
MMSE 7.6 SD 8.2
31 83.7 SD 5.8
6 months Withdrawal of antipsychotic treatment
Behave-AD Group on antipsychotic treatment had more behavio-ral symptoms
High rate of noncompleters
1

D E M E N T I A – D I AG N O S T I C A N D T H E R A P E U T I C I N T E RV E N T I O N S406
Table 25.3 Randomised controlled studies of antiepileptic drugs in dementia.
Author Year, reference
Type of study
Setting Demen-tia/dia-gnosis
Severity of dementia
Patients (n) included
Age-groups Mean
Study period
Intervention Primary outcome
Effects (end) Remarks from reviewer
Quality of study
Olin et al 2001 [57]
RCT University clinic, out- patient
NINCDS Light-severe 21 74.7SD 6.2
6 w Carbama-zepine 300 mg/day
BPRS Modest clinical benefit in the carbamazepine group
Pilot study 1
Porsteinsson et al 2001 [58]
RCT Long term care
AD, VD, mixed dementia, BPRS ≥3
MMSE = 6.9 SD 6.7
56 85.0SD 7.1
6 w Divalproex, mean dose 826 mgSD 216Placebo
BPRS Treatment resulted in lower score
High degree of side-effects
1
Sival et al 2002 [54]
RCT Double-blind, crossover
Short term geropsychi-atric ward
Dementia according to DSM-IV and aggressive behavior
MMSE = 11.4SD 5.0
28 80.4SD 6.8
2 x 3 w ValproatePlacebo
SDAS-9 CGI
No difference in aggressi-veness bet-ween groups. Improvements in restlessness, melancholic state and anxiety
1
Tariot et al 1998 [55]
RCT Nursing home
AD according to DSM- III and NINCDS
MMSE = 6.0 SD 6.4
51 86.0 SD 5.2
6 w Carbama-zepine 300 mg/day Placebo
BPRS CGI
Carbama- zepine > placebo
2
Tariot et al 1999 [56]
RCT Nursing home
AD according to DSM- III and NINCDS
45 3 w Withdrawal of carbamazepine treatment
BPRSCGI
Recurrence of previous symptoms
Extension of Tariot et al [55]
1
AD = Alzheimer’s disease; BPRS = Brief Psychiatric Rating Scale; CGI = Clinical Global Impression Scale; DSM = Diagnostic and Statistical Manual; MMSE = Mini-mental state examination; NINCDS = National institute of neurological and communicable diseases; RCT = Randomised controlled trial; SD = Standard deviation; SDAS = Social dysfunction and aggression scale; VaD = Vascular dementia
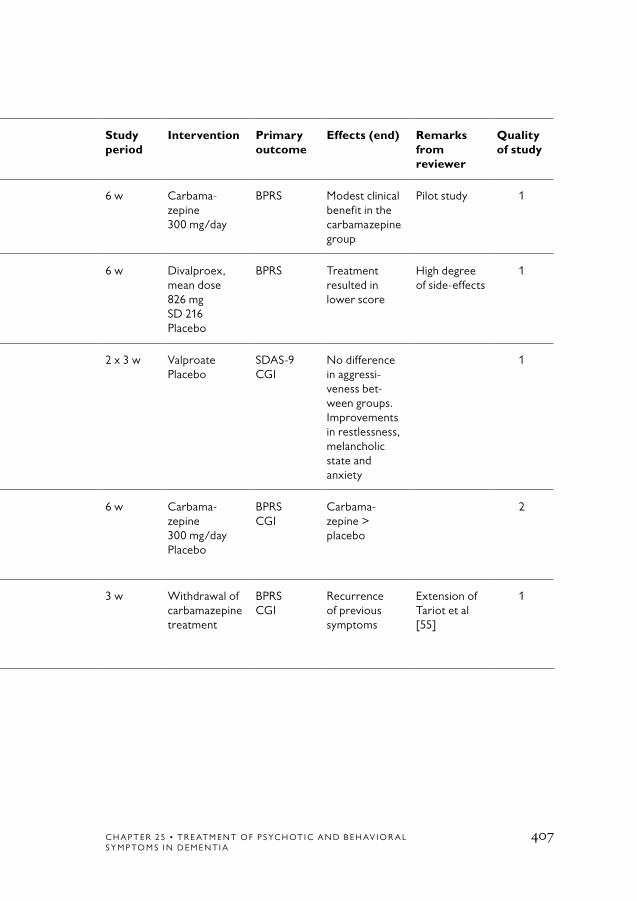
C H A P T E R 2 5 • T R E AT M E N T O F P S YC H OT I C A N D B E H AV I O R A L S Y M P TO M S I N D E M E N T I A
407
Table 25.3 Randomised controlled studies of antiepileptic drugs in dementia.
Author Year, reference
Type of study
Setting Demen-tia/dia-gnosis
Severity of dementia
Patients (n) included
Age-groups Mean
Study period
Intervention Primary outcome
Effects (end) Remarks from reviewer
Quality of study
Olin et al 2001 [57]
RCT University clinic, out- patient
NINCDS Light-severe 21 74.7SD 6.2
6 w Carbama-zepine 300 mg/day
BPRS Modest clinical benefit in the carbamazepine group
Pilot study 1
Porsteinsson et al 2001 [58]
RCT Long term care
AD, VD, mixed dementia, BPRS ≥3
MMSE = 6.9 SD 6.7
56 85.0SD 7.1
6 w Divalproex, mean dose 826 mgSD 216Placebo
BPRS Treatment resulted in lower score
High degree of side-effects
1
Sival et al 2002 [54]
RCT Double-blind, crossover
Short term geropsychi-atric ward
Dementia according to DSM-IV and aggressive behavior
MMSE = 11.4SD 5.0
28 80.4SD 6.8
2 x 3 w ValproatePlacebo
SDAS-9 CGI
No difference in aggressi-veness bet-ween groups. Improvements in restlessness, melancholic state and anxiety
1
Tariot et al 1998 [55]
RCT Nursing home
AD according to DSM- III and NINCDS
MMSE = 6.0 SD 6.4
51 86.0 SD 5.2
6 w Carbama-zepine 300 mg/day Placebo
BPRS CGI
Carbama- zepine > placebo
2
Tariot et al 1999 [56]
RCT Nursing home
AD according to DSM- III and NINCDS
45 3 w Withdrawal of carbamazepine treatment
BPRSCGI
Recurrence of previous symptoms
Extension of Tariot et al [55]
1

D E M E N T I A – D I AG N O S T I C A N D T H E R A P E U T I C I N T E RV E N T I O N S408
1. Finkel SI, Costa e Silva J, Cohen G, Miller S, Sartorius N. Behavioral and psychological signs and symptoms of de- mentia: a consensus statement on current knowledge and implications for research and treatment. Int Psychogeriatr 1996;8 Suppl 3:497-500.
2. Schneider LS, Katz IR, Park S, Napolitano J, Martinez RA, Azen SP. Psychosis of Alzheimer disease: validity of the construct and response to risperidone. Am J Geriatr Psychiatry 2003;11:414-25.
3. Schneider LS, Dagerman KS. Psycho-sis of Alzheimer’s disease: clinical char-acteristics and history. J Psychiatr Res 2004;38:105-11.
4. Petrie WM, Ban TA, Berney S, Fujimori M, Guy W, Ragheb M, et al. Loxapine in psychogeriatrics: a placebo- and standard-controlled clinical investigation. J Clin Psychopharmacol 1982;2:122-6.
5. Allain H, Dautzenberg PH, Maurer K, Schuck S, Bonhomme D, Gerard D. Double blind study of tiapride versus haloperidol and placebo in agitation and aggressiveness in elderly patients with cog-nitive impairment. Psychopharmacology (Berl) 2000;148:361-6.
6. De Deyn PP, Rabheru K, Rasmussen A, Bocksberger JP, Dautzenberg PL, Eriksson S, et al. A randomised trial of risperidone, placebo, and haloperidol for behavioral symptoms of dementia. Neurology 1999; 53:946-55.
7. Devanand DP, Marder K, Michaels KS, Sackeim HA, Bell K, Sullivan MA, et al. A randomised, placebo-controlled dose-com-
parison trial of haloperidol for psychosis and disruptive behaviors in Alzheimer’s disease. Am J Psychiatry 1998;155: 1512-20.
8. Auchus AP, Bissey-Black C. Pilot study of haloperidol, fluoxetine, and placebo for agitation in Alzheimer’s disease. J Neuropsychiatry Clin Neurosci 1997;9:591-3.
9. Devanand DP, Sackeim HA, Brown RP, Mayeux R. A pilot study of haloperi-dol treatment of psychosis and behavioral disturbance in Alzheimer’s disease. Arch Neurol 1989;46:854-7.
10. Teri L, Logsdon RG, Peskind E, Raskind M, Weiner MF, Tractenberg RE, et al. Treatment of agitation in AD: a ran-domised, placebo-controlled clinical trial. Neurology 2000;55:1271-8.
11. Coccaro EF, Kramer E, Zemishlany Z, Thorne A, Rice CM, 3rd, Giordani B, et al. Pharmacologic treatment of noncognitive behavioral disturbances in elderly demented patients. Am J Psychiatry 1990;147:1640-5.
12. Devanand DP, Cooper T, Sackeim HA, Taurke E, Mayeux R. Low dose oral haloperidol and blood levels in Alzheimer’s disease: a preliminary study. Psychopharmacol Bull 1992;28:169-73.
13. Chan WC, Lam LC, Choy CN, Leung VP, Li SW, Chiu HF. A double-blind randomised comparison of risperidone and haloperidol in the treatment of behavioral and psychological symptoms in Chinese dementia patients. Int J Geriatr Psychiatry 2001;16:1156-62.
References

C H A P T E R 2 5 • T R E AT M E N T O F P S YC H OT I C A N D B E H AV I O R A L S Y M P TO M S I N D E M E N T I A
409
14. Barnes R, Veith R, Okimoto J, Raskind M, Gumbrecht G. Efficacy of antipsy-chotic medications in behaviorally dis-turbed dementia patients. Am J Psychiatry 1982;139:1170-4.
15. Carlyle W, Ancill RJ, Sheldon L. Ag-gression in the demented patient: a double-blind study of loxapine versus haloperidol. Int Clin Psychopharmacol 1993;8:103-8.
16. Gutzmann H, Kuhl KP, Kanowski S, Khan-Boluki J. Measuring the efficacy of psychopharmacological treatment of psychomotoric restlessness in de- mentia: clinical evaluation of tiapride. Pharmacopsychiatry 1997;30:6-11.
17. Katz IR, Jeste DV, Mintzer JE, Clyde C, Napolitano J, Brecher M. Comparison of risperidone and placebo for psychosis and behavioral disturbances associated with dementia: a randomised, double- blind trial. Risperidone Study Group. J Clin Psychiatry 1999;60:107-15.
18. Brodaty H, Ames D, Snowdon J, Woodward M, Kirwan J, Clarnette R, et al. A randomised placebo-controlled trial of risperidone for the treatment of aggres-sion, agitation, and psychosis of dementia. J Clin Psychiatry 2003;64:134-43.
19. Meguro K, Meguro M, Tanaka Y, Akanuma K, Yamaguchi K, Itoh M. Risperidone is effective for wandering and disturbed sleep/wake patterns in Alzheimer’s disease. J Geriatr Psychiatry Neurol 2004;17:61-7.
20. Street JS, Clark WS, Gannon KS, Cummings JL, Bymaster FP, Tamura RN, et al. Olanzapine treatment of psychotic
and behavioral symptoms in patients with Alzheimer disease in nursing care facilities: a double-blind, randomised, placebo-con-trolled trial. The HGEU Study Group. Arch Gen Psychiatry 2000;57:968-76.
21. Mintzer J, Faison W, Street JS, Sutton VK, Breier A. Olanzapine in the treatment of anxiety symptoms due to Alzheimer’s disease: a post hoc analysis. Int J Geriatr Psychiatry 2001;16 Suppl 1:S71-7.
22. Clark WS, Street JS, Feldman PD, Breier A. The effects of olanzapine in re- ducing the emergence of psychosis among nursing home patients with Alzheimer’s disease. J Clin Psychiatry 2001;62:34-40.
23. Cummings JL, Street J, Masterman D, Clark WS. Efficacy of olanzapine in the treatment of psychosis in dementia with lewy bodies. Dement Geriatr Cogn Disord 2002;13:67-73.
24. Fontaine CS, Hynan LS, Koch K, Martin-Cook K, Svetlik D, Weiner MF. A double-blind comparison of olanzapine versus risperidone in the acute treatment of dementia-related behavioral disturbances in extended care facilities. J Clin Psychiatry 2003;64:726-30.
25. Meehan KM, Wang H, David SR, Nisivoccia JR, Jones B, Beasley CM, Jr, et al. Comparison of rapidly acting intra-muscular olanzapine, lorazepam, and placebo: a double-blind, randomised study in acutely agitated patients with dementia. Neuropsychopharmacology 2002;26:494-504.
26. Battaglia J, Lindborg SR, Alaka K, Meehan K, Wright P. Calming versus

D E M E N T I A – D I AG N O S T I C A N D T H E R A P E U T I C I N T E RV E N T I O N S410
sedative effects of intramuscular olanza-pine in agitated patients. Am J Emerg Med 2003;21:192-8.
27. Mulsant BH, Gharabawi GM, Bossie CA, Mao L, Martinez RA, Tune LE, et al. Correlates of anticholinergic activity in pa-tients with dementia and psychosis treated with risperidone or olanzapine. J Clin Psychiatry 2004;65:1708-14.
28. Lanctot KL, Best TS, Mittmann N, Liu BA, Oh PI, Einarson TR, et al. Efficacy and safety of neuroleptics in behavioral disorders associated with dementia. J Clin Psychiatry 1998;59:550-61; quiz 562-3.
29. Schneider LS, Pollock VE, Lyness SA. A metaanalysis of controlled trials of neuroleptic treatment in dementia. J Am Geriatr Soc 1990;38:553-63.
30. Schneider LS. Meta-analysis of control-led pharmacologic trials. Int Psychogeriatr 1996;8 Suppl 3:375-9; discussion 381-2.
31. Kirchner V, Kelly CA, Harvey RJ. Thioridazine for dementia. Cochrane Database Syst Rev 2001:CD000464.
32. Lonergan E, Luxenberg J, Colford J. Haloperidol for agitation in demen-tia. Cochrane Database Syst Rev 2002:CD002852.
33. Ray WA, Taylor JA, Meador KG, Lichtenstein MJ, Griffin MR, Fought R, et al. Reducing antipsychotic drug use in nursing homes. A controlled trial of provider education. Arch Intern Med 1993;153:713-21.
34. Thapa PB, Meador KG, Gideon P, Fought RL, Ray WA. Effects of antipsy-chotic withdrawal in elderly nursing home residents. J Am Geriatr Soc 1994;42:280-6.
35. Bridges-Parlet S, Knopman D, Steffes S. Withdrawal of neuroleptic medications from institutionalized dementia patients: results of a double-blind, baseline-treat-ment-controlled pilot study. J Geriatr Psychiatry Neurol 1997;10:119-26.
36. Cohen-Mansfield J, Lipson S, Werner P, Billig N, Taylor L, Woosley R. With-drawal of haloperidol, thioridazine, and lorazepam in the nursing home: a con-trolled, double-blind study. Arch Intern Med 1999;159:1733-40.
37. van Reekum R, Clarke D, Conn D, Herrmann N, Eryavec G, Cohen T, et al. A randomised, placebo-controlled trial of the discontinuation of long-term anti- psychotics in dementia. Int Psychogeriatr 2002;14:197-210.
38. Ballard CG, Thomas A, Fossey J, Lee L, Jacoby R, Lana MM, et al. A 3-month, randomised, placebo-controlled, neuro-leptic discontinuation study in 100 people with dementia: the neuropsychiatric in- ventory median cutoff is a predictor of clinical outcome. J Clin Psychiatry 2004; 65:114-9.
39. Ruths S, Straand J, Nygaard HA, Bjorvatn B, Pallesen S. Effect of antipsy-chotic withdrawal on behavior and sleep/wake activity in nursing home residents with dementia: a randomised, placebo- controlled, double-blinded study. The Bergen District Nursing Home Study. J Am Geriatr Soc 2004;52:1737-43.
40. Pollock BG, Mulsant BH, Rosen J, Sweet RA, Mazumdar S, Bharucha A, et al. Comparison of citalopram, perphena-zine, and placebo for the acute treatment of psychosis and behavioral disturbances in hospitalized, demented patients. Am J Psychiatry 2002;159:460-5.
C H A P T E R 2 5 • T R E AT M E N T O F P S YC H OT I C A N D B E H AV I O R A L S Y M P TO M S I N D E M E N T I A
411
41. Sultzer DL, Gray KF, Gunay I, Berisford MA, Mahler ME. A double- blind comparison of trazodone and haloperidol for treatment of agitation in patients with dementia. Am J Geriatr Psychiatry 1997;5:60-9.
42. Sultzer DL, Gray KF, Gunay I, Wheatley MV, Mahler ME. Does behav-ioral improvement with haloperidol or trazodone treatment depend on psychosis or mood symptoms in patients with de-mentia? J Am Geriatr Soc 2001;49: 1294-300.
43. McShane R, Keene J, Gedling K, Fairburn C, Jacoby R, Hope T. Do neuroleptic drugs hasten cognitive decline in dementia? Prospective study with necropsy follow up. BMJ 1997; 314:266-70.
44. Wooltorton E. Risperidone (Risperdal): increased rate of cerebrovascular events in dementia trials. CMAJ 2002;167:1269-70.
45. Lilly E. http://www.hc-sc.gc.ca/dhp-mps/medeff/advisories-avis/prof/2004/zyprexa_hpc-cps_e.html.
46. Bristol-Meyers Squibb Company. 2005. Data on file.
47. Herrmann N, Mamdani M, Lanctot KL. Atypical antipsychotics and risk of cerebrovascular accidents. Am J Psychiatry 2004;161:1113-5.
48. Kozma C, Engelhart, LM, Long, S, Greenspan, A, Hahmoud, R, Baser, O. Absence of increased of relative stroke risk in elderly dementia patients treated with
risperidone versus other antipsychotics. Abstract from Third Annual ICGP Meet-ing, San Juan 2003. 2003.
49. Gill SS, Rochon PA, Herrmann N, Lee PE, Sykora K, Gunraj N, et al. Atypical antipsychotic drugs and risk of ischaemic stroke: population based retrospective cohort study. BMJ 2005;330:445.
50. Schneider LS, Dagerman K, Insel PS. Efficacy and adverse effects of atypical antipsychotics for dementia: meta-analysis of randomised, placebo-controlled trials. Am J Geriatr Psychiatry 2006;14:191-210.
51. Porsteinsson AP, Tariot PN, Erb R, Gaile S. An open trial of valproate for agitation in geriatric neuropsychiatric disorders. Am J Geriatr Psychiatry 1997;5:344-51.
52. Tekin S, Aykut-Bingol C, Tanridag T, Aktan S. Antiglutamatergic therapy in Alzheimer’s disease – effects of lamotrigine. Short communication. J Neural Transm 1998;105:295-303.
53. Sival RC, Duivenvoorden HJ, Jansen PA, Haffmans PM, Duursma SA, Eikelenboom P. Sodium valproate in aggressive behavior in dementia: a twelve-week open label follow-up study. Int J Geriatr Psychiatry 2004;19:305-12.
54. Sival RC, Haffmans PM, Jansen PA, Duursma SA, Eikelenboom P. Sodium valproate in the treatment of aggressive behavior in patients with dementia – a randomised placebo controlled clinical trial. Int J Geriatr Psychiatry 2002;17:579-85.

D E M E N T I A – D I AG N O S T I C A N D T H E R A P E U T I C I N T E RV E N T I O N S412
55. Tariot PN, Erb R, Podgorski CA, Cox C, Patel S, Jakimovich L, et al. Efficacy and tolerability of carbama- zepine for agitation and aggression in dementia. Am J Psychiatry 1998;155: 54-61.
56. Tariot PN, Jakimovich LJ, Erb R, Cox C, Lanning B, Irvine C, et al. With-drawal from controlled carbamazepine therapy followed by further carbama- zepine treatment in patients with de- mentia. J Clin Psychiatry 1999;60: 684-9.
57. Olin JT, Fox LS, Pawluczyk S, Taggart NA, Schneider LS. A pilot randomised trial of carbamazepine for behavioral symptoms in treatment-resistant outpatients with Alzheimer disease. Am J Geriatr Psychiatry 2001;9:400-5.
58. Porsteinsson AP, Tariot PN, Erb R, Cox C, Smith E, Jakimovich L, et al. Placebo-controlled study of divalproex sodium for agitation in dementia. Am J Geriatr Psychiatry 2001;9:58-66.
59. Lonergan ET, Cameron M, Luxenberg J. Valproic acid for agitation in dementia. Cochrane Database Syst Rev 2004: CD003945.
60. De Deyn PP, Carrasco MM, Deberdt W, Jeandel C, Hay DP, Feldman PD, et al. Olanzapine versus placebo in the treat-ment of psychosis with or without associ-ated behavioral disturbances in patients
with Alzheimer’s disease. Int J Geriatr Psychiatry 2004;19:115-26.
61. Frank L, Kleinman L, Ciesla G, Rupnow MF, Brodaty H. The effect of risperidone on nursing burden associated with caring for patients with dementia. J Am Geriatr Soc 2004;52:1449-55.
62. Katz IR, Rupnow M, Kozma C, Schneider L. Risperidone and falls in ambulatory nursing home residents with dementia and psychosis or agitation: sec-ondary analysis of a double-blind, placebo-controlled trial. Am J Geriatr Psychiatry 2004;12:499-508.
63. Kennedy JS, Bymaster FP, Schuh L, Calligaro DO, Nomikos G, Felder CC, et al. A current review of olanzapine s safety in the geriatric patient: from pre-clinical pharmacology to clinincal data. Int J Geriatr Psychiatry 2001;16:33-61.
64. Nygaard HA, Bakke K, Brudvik E, Elgen K, Lien GK. Dosing of neuroleptics in elderly demented patients with aggres-sive and agitated behavior: a double-blind study with zuclopenthixol. Curr Med Res Opin 1994;13:222-32.
65. Pelton GH, Devanand DP, Bell K, Marder K, Marston K, Liu X, et al. Usefulness of plasma haloperidol levels for monitoring clinical efficacy and side effects in Alzheimer patients with psychosis and behavioral dyscontrol. Am J Geriatr Psychiatry 2003;11:186-93.

C H A P T E R 2 6 • D R U G - I N D U C E D C O G N I T I V E I M PA I R M E N T 413
26. Drug-induced Cognitive Impairment
Conclusions
The literature presents a vast array of studies addressing the cognitive side-effects of drugs, some of them dealing with cognitive impairment and others with delirium. Several are case reports or observational stu-dies, but there are also many RCTs.
For some drugs – such as anticholinergics, benzodiazepines, corticos-teroids and opioids – there is strong evidence of cognitive side-effects (Evidence Grade 1). A dose-dependent effect was observed for some of them, including anticholinergics and opioids. For others, such as anti-convulsants and antipsychotics, the evidence is moderate or limited. When it comes to the remainder of the drugs investigated – such as NSAID and beta-blockers – the results have less support or are contra-dictory. Table 26.1 summarizes drug groups for which there is scientific evidence of adverse effects on cognitive function.
However, not all drugs have been the subject of well-executed RCTs, and poor evidence does not automatically mean that a drug cannot have sig-nificant adverse effects on cognition. An important general limitation is that most drug groups have not been properly studied in elderly subjects. With respect to drug sensitivity, elderly patients can be very different from healthy adults by virtue of pharmacokinetic and pharmacodynamic changes, as well as polypharmacy and multiple diseases.

D E M E N T I A – D I AG N O S T I C A N D T H E R A P E U T I C I N T E RV E N T I O N S414
Background
Many different types of drugs can cause cognitive impairment, ranging from mild symptoms such as memory disturbances to obvious deli-rium or dementia. Generally speaking, the elderly are more sensitive to these side-effects by virtue of multiple drug use, age-related changes in pharmacokinetics and the central nervous system (CNS) function, and disease. Patients with dementia, particularly AD (Alzheimer’s disease) in which a loss of cholinergic activity is found, are at particular risk due to neurodegeneration and the consequent impairment of neurotransmis-sion.
Types of drug-induced cognitive impairmentDelirium is the most dramatic form of drug-induced cognitive impair-ment. Onset is rapid, and the cognitive disturbances, which typically have a fluctuating course, are associated with disorientation and an altered state of consciousness. Some patients experience hallucinations, delusions, hyperactivity or hypoactivity.
Drug toxicity can manifest as dementia. Drugs are generally one of several factors contributing to cognitive impairment, but they may also be the sole cause.
In other cases, drugs may cause more subtle cognitive disturbances that can be measured by neuropsychological tests but might otherwise go undetected.
PathophysiologyDelirium is caused by a global decrease in the oxidative metabolism of the brain and an imbalance in several neurotransmitter systems.
The brain’s cholinergic pathways play an important role in cognitive processes. The significance of cholinergic dysfunction for the cognitive deficits observed in AD is well established. Anticholinergic drugs are also known to cause delirium and other types of cognitive disturbances,

C H A P T E R 2 6 • D R U G - I N D U C E D C O G N I T I V E I M PA I R M E N T 415
particularly in AD patients. According to one hypothesis, choliner-gic blockade is the final common pathway of drug-induced cognitive impairment. But many other neurotransmitters – including GABA, dopamine, and noradrenaline – are likely contributors.
EpidemiologyStudies in elderly hospital patients reported that drugs are the cause of delirium in 10–30% of the cases [1]. Drug-induced cognitive impairment was found in 35 of 308 outpatients with suspected dementia. Cognition improved in each case when the suspected drugs were withdrawn [2]. Of 157 cognitively impaired patients in a residential care facility, 6–12% were found to have a reversible component. In 7 of the cases that showed the greatest improvement, adverse drug reaction (ADR) was deemed to be the likely cause [3]. According to estimates, more than 10% of patients attending memory clinics have iatrogenic disease [4].
Aims
The aim of the present inquiry was to review the literature for evidence of cognitive impairment and/or delirium induced by drugs.
Method
The primary search was in MEDLINE search covering 1975 to June 2004. The following search strategies were used, either alone or in com-bination:
• Aged OR Alzheimer disease
• Cognition/*drug effects OR Confusion/*drug effects OR Delirium/*drug effects
• Cognition disorders OR Delirium, dementia, amnestic, cognitive disorders OR Confusion
• Pharmaceutical preparations/*adverse effects OR Drug therapy/*adverse effects

D E M E N T I A – D I AG N O S T I C A N D T H E R A P E U T I C I N T E RV E N T I O N S416
• Confusion/*chemically induced OR Cognition disorders/*chemically induced OR Delirium/*chemically induced OR Dementia/*chemically induced OR Amnestic disorders/*chemically induced.
When appropriate, relevant references in the identified studies were also included.
Because this chapter deals with side-effects of drugs, which have not been extensively investigated in RCTs, we have included a wider range of studies. Studies were reviewed if they were at least prospective – even those with low quality are included in the tables. Case reports and the like are sometimes cited for the sake of completeness, but we do not accord them any evidentiary value.
Cognitive side-effects of specific drug classes
Anticholinergic drugsSeveral different types of drugs used by the elderly have anticholinergic properties. The drugs include not only the classic belladonna derivati-ves such as scopolamine, but a range of medications for example drugs against incontinence, tricyclic antidepressants and low-potency neuro-leptics.
Several RCTs have investigated the effect of scopolamine on cognitive function in humans, most comparing elderly and young normal sub-jects. A double-blind, placebo-controlled study by Zemishlany et al gave scopolamine 0.2 mg and placebo to 12 elderly and 14 young subjects [5] (Table 26.2). A comprehensive test battery measuring verbal memory, practice and language that was administered 45 minutes after the injec-tion showed significant impairment of new learning and practice in the elderly but not in the young. Language function was not impaired [5]. A study by Flicker et al compared three doses of scopolamine to glyco-pyrrolate, a peripheral-acting anticholinergic drug that penetrates the blood-brain barrier poorly [6]. The elderly performed worse than the young in all memory tests, although two tests also found impairment in young subjects at the highest dose. In contrast, attentional tasks were

C H A P T E R 2 6 • D R U G - I N D U C E D C O G N I T I V E I M PA I R M E N T 417
affected similarly in the elderly and young. A double-blind study by Sunderland et al compared the effect of three doses of scopolamine and placebo in 10 AD patients and 10 matched elderly controls [7]. Two test batteries were administered, one 90 minutes after injection and the other repeatedly during the treatment period. For most cognitive tasks, the AD patients were impaired at lower doses than the controls and appea-red to be more impaired at higher doses. The differences were most obvious in tests of new learning and semantic knowledge. Behavioral symptoms such as mild euphoria, motor incoordination and hostility were found in the AD patients but not in the controls. The differences in cognitive and behavioral measures between the two groups generally became more pronounced after scopolamine had been administered.
Several studies have related cognitive function or signs of cognitive impairment to serum anticholinergic levels. The levels are analyzed in blood serum by incubating it with a radioactively labeled muscarinic receptor antagonist – [3H]quinuclidinyl benzilate (QNB) and a suspen-sion of rat striatal membranes rich in muscarinic receptors. The degree of competition with the radio-labeled QNB reflects the anticholinergic levels. Using this assay, many drugs have been found to possess anticho-linergic activity. A number of them – including cimetidine, theophylline, prednisolone and digoxin – have previously gone unrecognized in this respect [8].
A study of 29 patients (aged 29–75, mean 55) undergoing cardiac surgery, found that 8 of the 25 who gave blood samples became delirious during the first postoperative week. High serum anticholinergic levels were found in 7 of those 8 patients, as opposed to only 4 of the patients who had not become delirious [8]. A low dose (0.005 mg/kg) of scopolamine administered to 18 patients in a randomised, double-blind, placebo-con-trolled study of 36 elderly presurgical patients yielded low levels of serum anticholinergic activity and cognitive impairment, which was measurable in two of the tests. These mild changes were not detected by two other tests, including the MMSE [9]. Rovner et al related serum anticholin-ergic levels in 22 nursing home patients with dementia to cognition and capacity for self-care, finding that patients with high levels had a signi-ficantly lower self-care score on the Psychogeriatric Dependency Rating

D E M E N T I A – D I AG N O S T I C A N D T H E R A P E U T I C I N T E RV E N T I O N S418
Scales [10]. Because this study was cross-sectional, a causal relationship cannot be established. However, the authors pointed out that other factors – including dementia severity, medical conditions, and number of anticholinergic drugs – were similar in the two groups.
Anxiolytics and hypnotics/sedativesA prospective study by Larson et al covering 308 outpatients with sus-pected dementia found that 35 were having adverse drug reactions that caused cognitive impairment (Table 26.3). Use of sedatives/hypnotics, of which long-acting benzodiazepines were the most common, was the strongest predictor of adverse reactions [2]. A prospective cohort study of 2 765 subjects from the Duke EPESE showed that current users of benzodiazepines performed worse on memory tests (Short Portable Mental Status Questionnaire and Orientation-Memory-Concentration Test) and that those with recommended and higher dose, as well as long-term users, made more errors [11]. Memory impairment was found with both short-acting and long-acting agents. A study from the Boston Collaborative Drug Surveillance Program (BCDSP) examined 2 111 users of nitrazepam among 11 000 hospitalized medical patients in 5 countries. Signs of CNS depression (drowsiness, fatigue, confusion and ataxia) were reported in 49 patients (2.3%). However, the frequency was much higher in the elderly (11% in the 80 and over age group). That was attributed to the high doses. Among those aged 80 or over who took 10 mg or more, 55% experienced unwanted CNS depression [12]. Another study from the BCDSP that examined 2 542 patients using flurazepam showed similar results, with higher prevalence of CNS depression in the elderly, particularly at higher doses [13]. However, both studies were unblinded and lacked control groups. In addition, the extent to which CNS depres-sion involved cognitive impairment is unknown.
Several double-blind, placebo-controlled trials have investigated the effects of benzodiazepines on cognitive functioning and/or psychomotor skills. But only some of them included elderly subjects and cognitive measures. Pomara et al gave 12 normal elderly volunteers single doses of 2.5 or 5 mg diazepam or placebo in three separate sessions. Memory was tested using the Buschke selective reminding task (immediate and delayed), a visual memory task (immediate and delayed) and a digit

C H A P T E R 2 6 • D R U G - I N D U C E D C O G N I T I V E I M PA I R M E N T 419
span/supraspan task. Five of the measures were significantly impaired at all doses of diazepam [14,15]. Hinrichs and Ghoneim studied the effect of diazepam versus placebo in three age-groups of 12 healthy sub-jects (aged 19–28, 40–45 and 61–73) each [16]. Each subject was given diazepam (0.2 mg/kg) or placebo in two sessions. A large number of tests – including addition, card rotation and number learning, as well as immediate and delayed free recall – assessed cognitive performance. Diazepam had a detrimental impact on virtually all tasks. Many of them showed a similar effect of aging, while diazepam and its effect appeared to be additive rather than synergistic in older subjects.
Patterson reported five cases of triazolam syndrome, ie, reversible deli-rium, automatic movement and anterograde amnesia following ingestion of the short-acting benzodiazepine triazolam [17].
Barker et al reported a meta-analysis of 13 studies using neuropsycholo-gical tests to evaluate the cognitive effects of long-term use of benzodia-zepines [18]. The mean number of benzodiazepine users was 33.5, and the mean number of controls was 27.9. The mean duration of use was 9.9 years. Long-term benzodiazepine users were consistently found to be more impaired in all cognitive categories.
The newer hypnotics, which are structurally different from the benzo-diazepines but have the same mode of action via the GABA receptor, are increasingly prescribed for the elderly. One study found zolpidem (10 mg) to have no impact on cognitive function in elderly volunteers as measured by Sternberg Memory Scanning Task [19]. A randomised crossover study tested Zopiclone against placebo in 12 healthy elderly volunteers. A single dose of 7.5 mg had no effect on memory perfor- mance [20]. A recent double-blind, randomised, four-way, crossover study competed zolpidem (5 mg), zopiclone (3.75 mg), lormetazepam (1 mg) and placebo in 48 healthy elderly volunteers. The Learning Memory Tasks were unaffected by both zopiclone and zolpidem. The effects were not different from placebo in the Sternberg Memory Scan-ning Test either, with the exception of one item on which both zopi- clone and lormetazepam increased the mean reaction time [21]. How- ever, there are also some case reports of zolpidem-associated delirium [22–24].

D E M E N T I A – D I AG N O S T I C A N D T H E R A P E U T I C I N T E RV E N T I O N S420
In conclusion, there is firm evidence from RCTs that diazepam can cause cognitive impairment in the elderly. The evidence is weaker for two of the other long-acting benzodiazepines, nitrazepam and flurazepam as it is based on observational data, although in a very large number of patients. Case reports suggest that triazolam may cause delirium. RCTs to date indicate that the newer hypnotics of zopiclone and zolpidem have no or little effect on cognition, although case reports suggest that zolpi-dem may cause delirium.
AntipsychoticsAntipsychotics may cause cognitive impairment through several different mechanisms. The low-potency drugs, such as thioridazine, have signifi-cant anticholinergic properties (see above). Antipsychotics may also cause sedation through histamine H1-receptor antagonism that in turn could lead to impaired cognition.
Few systematic studies have been conducted on the cognitive side-effects of antipsychotics in the elderly. Most of the available data are from clini-cal trials, most of which have examined different antipsychotics in trea-ting the behavioral symptoms of dementia. Traditional agents have been the focus of some, mostly small, studies. An early open crossover study by Steele et al compared the efficacy and side-effects of haloperidol and thioridazine in 16 AD patients with serious behavioral symptoms [25]. None of the drugs produced any significant effects on cognition. How-ever, the study population was small. Moreover, only 6 patients comple-ted the crossover. A single-blind, placebo-controlled pilot study gave 9 AD patients with psychosis or behavioral disturbance haloperidol for 8 weeks, preceded and followed by placebo for 4 weeks. Haloperidol (1–5 mg/day) showed a statistical trend (p<0.10) towards cognitive im- pairment with only partial recovery during the placebo phase [26]. How- ever, the study was also small. No effect on cognitive status (MMSE) emerged in a later 6-week, double-blind, crossover trial by Devanand and Marder comparing two doses of haloperidol and placebo among 71 AD patients [27]. A more recent study compared the acute effects of haloperidol (2 mg) and amisulpiride (50 and 200 mg) on cognition in 16 healthy, elderly volunteers. Cognitive functions were measured using

C H A P T E R 2 6 • D R U G - I N D U C E D C O G N I T I V E I M PA I R M E N T 421
a test battery (CDR computerized assessment system). Amisulpiride did not produce any significant impairment of cognition. Haloperidol pro-duced a significant decrease for two tasks compared to amisulpiride, but no change compared to placebo [28].
The newer antipsychotics have been the subject of several double-blind RCTs. Risperidone (0.5, 1, or 2 mg daily for 12 weeks) was compared with placebo in 625 patients with different types of dementia, as well as significant psychotic and behavioral symptoms [29]. Risperidone was found to cause no significant decrease in cognitive performance as measured by the MMSE. A 13-week, double-blind study compared ris-peridone to haloperidol and placebo in 344 patients with dementia and behavioral symptoms. No significant decline in cognition was found due to risperidone (mean dose 1.1 mg daily), whereas haloperidol (1.2 mg daily) caused a significant decline in the MMSE score compared to placebo [30]. A recent study compared the effects of single doses of ris-peridone (0.25 and 0.5 mg) on psychomotor performance and cognitive functions to placebo and lorazepam in 12 healthy elderly subjects. Rispe-ridone had no effect on speed of reaction, vigilance, sustained attention, working or long-term memory and caused only minor impairment on information processing [21].
A 6-week, double-blind study compared olanzapine to placebo in 206 AD patients in nursing care [31]. The MMSE scores in the three olan-zapine groups (5, 10, and 15 mg daily) did not differ significantly from baseline or placebo. A prospective, open-label, 8-week trial of olanzapine in 27 elderly schizophrenic patients found no significant change in the MMSE [32]. Olanzapine has also been tested in healthy, elderly volun-teers. With the specific aim of investigating cognitive and psychomotor effects, a double-blind, crossover study of 14 subjects compared olan-zapine 3 mg with haloperidol 3 mg and placebo. Each treatment lasted for 4 days, with a 16-day interval in between. Cognitive functions were measured using the CDR computerized assessment system. Both olan-zapine and haloperidol were found to affect cognition. However, while olanzapine produced acute effects that generally returned to pre-dosing levels after 24 hours, the effects of haloperidol tended to increase up to day 4 and even to carry over [33].

D E M E N T I A – D I AG N O S T I C A N D T H E R A P E U T I C I N T E RV E N T I O N S422
Besides these RCTs, there are some case reports of delirium with both risperidone [34–36] and olanzapine [37].
The atypical antipsychotic clozapine has central anticholinergic proper-ties. The fact that physostigmine reversed clozapine-induced delirium suggests that these anticholinergic effects were involved [38]. A study based on pharmacy records diagnosed 10% of clozapine patients with delirium. The risk was higher in those who had received other drugs with central anticholinergic effects [39]. The combination with benzo-diazepines also seems to augment the risk of delirium [40].
Based on previous findings of a more rapid decline in cognitive function among AD patients showing psychotic symptoms, sleep disturbance and aggression, a 2-year prospective study by McShane et al investigated whether antipsychotic treatment might accelerate cognitive decline in 71 community-dwelling elderly with dementia [41]. Cognitive function was measured every 4 months using an expanded version of the MMSE. The 16 patients who took antipsychotics (mainly thioridazine, promazine, haloperidol, and chlorpromazine) showed a mean decline in the MMSE score twice that of the others. In addition, the start of antipsychotic treatment coincided with a more rapid decline. However, as discussed by the authors, these results did not prove a causal relationship between antipsychotic use and cognitive decline. Perhaps those receiving anti-psychotics had a more severe disease and a steeper cognitive decline in general.
In conclusion, few of the studies presenting data about cognitive side-effects of antipsychotics were specifically designed to address this ques-tion. In addition, most studies used only the MMSE as a measure of cognitive functioning. Studies on traditional antipsychotics were gene-rally small and examined only a few of these drugs, mostly haloperi- dol. The results did not reveal any major effects on cognition. However, later studies that compared new antipsychotics to haloperidol observed a significant cognitive impairment from this drug. Generally speaking, the newer antipsychotics, including risperidone and olanzapine, have proven to have little impact on cognitive function.

C H A P T E R 2 6 • D R U G - I N D U C E D C O G N I T I V E I M PA I R M E N T 423
LithiumDelirium is a well known consequence of lithium intoxication. Cogni-tive deficits tend to persist for long after the lithium concentrations have declined [42,43].
Honig et al reviewed the literature on cognitive side-effects of lithium therapy in bipolar disorder, identifying 4 out of 17 studies with adequate methodological quality. Analysis of the 4 studies showed that lithium had a negative effect on memory and speed of information processing [44].
AntidepressantsCognitive impairment in depression is a complex matter given that both medication and the disease itself may be the cause. Antidepressants can be broken down into two major groups with different pharmacological and side-effect profiles: the older tricyclic agents (TCAs) and the newer selective serotonin reuptake inhibitors (SSRIs). Each group has been studied, mostly by double-blind RCTs, in both healthy elderly and those with depression.
Several studies using varying types of neuropsychological tests have shown amitriptyline, which has the most potent anticholinergic effects of all TCAs, to cause cognitive impairment. A placebo-controlled cross-over study by Branconnier et al found that amitriptyline 50 mg marked-ly disrupted verbal recall from secondary memory but did not affect re- cognition [45] (Table 26.5). The profile of anterograde memory impair- ment was similar to that of the antimuscarinic agent scopolamine. An- other study found that the same single dose of amitriptyline produced more pronounced impairment on several cognitive tasks than trazodone [46]. Ogura et al concluded that a relatively low dose of amitriptyline (25 mg) significantly decreased critical flicker fusion (CFF) for up to 24 hours [47]. Some TCAs may have less impact on cognitive functioning. Ghose and Sedman found that lofepramine, as opposed to amitriptyline, had no negative effect on psychomotor performance or CFF [48]. How- ever, the study was small.

D E M E N T I A – D I AG N O S T I C A N D T H E R A P E U T I C I N T E RV E N T I O N S424
Studies in elderly patients with depression examined several types of TCAs. Amitriptyline was found to impair memory retrieval [49]. A com-parison with the SSRI fluoxetine in 66 elderly depressed patients showed that memory improved, although more slowly in the case of amitripty-line [50]. TCAs other than amitriptyline have been shown to have less or no significant effects on cognition. Imipramine (300 mg daily for 25 days) had no effect in most tests of intellectual function [51]. Imipra-mine actually improved short-term memory in another placebo-con-trolled study [52]. Treatment with maprotiline improved cognition in a study of 75 elderly with depression, although the degree of improvement was less than for mianserin and nomifensine [53]. Nortriptyline has also been reported to have little effect on cognition. No significant effect was observed in an extensive battery of tests after 7 weeks of treatment [54]. However, another study reported a dose-dependent effect on immediate free recall [55].
Several studies have investigated the cognitive effects of SSRIs. Hind-march et al compared 9 days of sertraline and mianserin treatment in elderly volunteers and found no effects of sertraline (up to 200 mg) on psychomotor and cognitive performance [56]. However, 10 subjects dis-continued the mianserin treatment due to pronounced intolerance, such as hypotension. Sertraline was also shown to improve vigilance compa-red with amitriptyline and placebo. A study by Kerr et al found memory performance to improve faster in fluoxetine than amitriptyline patients [50].
Mianserin has been shown to induce transient impairment of immediate memory [57]. Bailer et al reported three cases of mirtazapin-induced delirium [58]. However, these patients had subclinical brain disease that may have favored the occurrence of delirium.
In conclusion, the TCA amitriptyline has been clearly linked to cogni- tive impairment in both healthy elderly and those with depression. Some other TCAs – including imipramine, lofepramine and maprotiline – may have less impact on cognitive performance. However, the detrimental effects of antidepressant therapy may be underestimated due to improve-ment in the disease itself. The available studies on SSRI show no signi-

C H A P T E R 2 6 • D R U G - I N D U C E D C O G N I T I V E I M PA I R M E N T 425
ficant negative effect on cognitive performance. Some data suggest that mianserin, and possibly mirtazapin, can cause cognitive impairment or delirium.
Antiparkinsonian agentsAnticholinergic drugs for Parkinson’s disease (PD) can clearly cause cognitive impairment. A double-blind crossover trial in elderly normal subjects found that trihexyphenidyl caused memory impairment on several tests, ie, the subjects rated their memory function as significantly more impaired [59]. A study by Van Spaendonck et al found that PD patients taking anticholinergic antiparkinsonian drugs performed worse than matched controls on tests of cognitive shifting [60] (Table 26.6). Another study showed that patients on combined therapy or anticholin-ergics alone performed worse in a series of psychometric tests than those on L-Dopa monotherapy [61].
The effects of L-Dopa vary among the different studies. The DATATOP study compared cognitive status before and after 6 months of L-Dopa therapy in 387 subjects, but no significant difference was found on any of the tests [62]. However, another study found acute L-Dopa treatment to delay cognitive processing compared to matched controls, as mea-sured by simple reaction time [63]. There is also reliable evidence that L-Dopa may cause hallucinations [64] and delirium [65].
Other dopaminergic drugs have also been investigated. A study on advanced PD found that bromocriptine caused mental changes in 17 of 66 patients, 3 of whom manifested organic confusional syndrome and 3 of whom manifested schizophreniform psychosis [66]. A study by Goetz et al found concomitant use of agonists to be more common among patients with hallucinations [64].
A small study of PD patients on long-term L-Dopa treatment showed that the MAO-B-inhibitor selegiline improved memory, motor speed, and naming performance in patients without progressive dementia, while some functions – such as set shifting and vigilance – deteriorated [67]. Selegiline has also been reported to cause delirium.

D E M E N T I A – D I AG N O S T I C A N D T H E R A P E U T I C I N T E RV E N T I O N S426
AntihistaminesAntihistamines can impair cognitive function in several ways. First, they can cause sedation by blocking histamine H1 receptors in the CNS. Second, some of the drugs have anticholinergic effects. Generally spea-king, the degree of CNS impact is related to ability to penetrate the blood-brain barrier. The first-generation agents – including diphenhy-dramine, hydroxyzine, chlorpheniramine, promethazine and clemastine – penetrate more readily and are therefore more prone to cause sedation. In addition, many first-generation drugs not only block histamine recep-tors, but have significant anticholinergic properties.
A comprehensive study reviewed 55 placebo-controlled and verum-con-trolled trials on sedative effects and other CNS side-effects of antihista-mines between 1965 and 1977 [68]. All trials had a double-blind crossover design. Twenty-one different antihistamines were included, of which 14 were second-generation. The cognitive tests included short-term and con-tinuous memory tasks, and several tests of CNS arousal included mental arithmetic and logical reasoning. The authors concluded that although most antihistamines possessed some sedative effect, the first-generation agents clearly had more side-effects, consistently impairing performance at all doses tested. Very few antihistamine studies have been conducted in the elderly. However, a reasonable assumption is that elderly are particularly sensitive to the CNS effects of antihistamines, especially first-generation drugs with potent sedative and anticholinergic effects.
AnticonvulsantsEssentially all anticonvulsants can cause dose-dependent cognitive im-pairment [69]. However, the drugs appear to have some differences. A 5-year prospective multicenter study of 622 patients showed that carba-mazepine had fewer cognitive side-effects than phenytoin, phenobarbital or primidone [70] (Table 26.7). However, another study with a double-blind RCT design did not find any major difference between carbama-zepine and phenytoin [71]. Dodrill and Troupin reported a difference favoring carbamazepine over phenytoin, but discrepancies in serum levels were later identified as the true explanation [72]. Thus, there is

C H A P T E R 2 6 • D R U G - I N D U C E D C O G N I T I V E I M PA I R M E N T 427
no evidence of any major difference between these two anticonvulsants in terms of cognitive side-effects.
A more consistent result from several RCTs is that phenobarbital causes more pronounced cognitive impairment than other anticonvulsants, while there are only slight, if any, differences among carbamazepine, phenytoin and valproate [73,74]. The newer anticonvulsant vigabatrin has been found to have no, or only modest, effects on cognitive function [75,76].
OpioidsLawlor reviewed the cognitive effects of opioids [77]. Several studies have been carried out in healthy elderly, as well as those with non-malignant and cancer pain. Table 26.8 lists some of the RCTs in healthy elderly [78–82]. The results vary, but it would appear that there are more cog-nitive side-effects with parenteral administration and higher doses. The results are contradictory for non-malignant pain. One RCT showed no difference between morphine and placebo [83].
Prospective studies must be relied on when it comes to cancer pain. Again the results vary. For example, one study by Banning et al showed a prolongation of continuous reaction time in patients taking peroral morphine compared to those who did not [84]. On the other hand, a larger study by Sjögren et al showed that long-term opioid use had no effect per se on cognitive performance [85].
One problem with investigating the cognitive effects of opioids is that the outcome depends on a number of factors – such as type of opioid, dose and regimen, and route of administration – that may vary. More-over, the cognitive effects may be more pronounced at the start of ther-apy and as the dose increases [77].
As is the case with many other drug groups, another problem is that these studies included very few elderly. Risks of cognitive disturbances and delirium may be greater in the elderly due to age changes in terms of pharmacokinetics – particularly a decrease in renal function – phar-macodynamics, polypharmacy, and multiple diseases. Opioid use has

D E M E N T I A – D I AG N O S T I C A N D T H E R A P E U T I C I N T E RV E N T I O N S428
been found to be an independent risk factor for delirium in the elderly [86]. Opioids may also cause, or contribute to, postoperative delirium. A prospective controlled trial of 83 higher-risk elderly men found that postoperative confusion occurred in 18% of those receiving intramuscu-lar morphine injections compared to 2.3% on patient-controlled anal- gesia [87].
NSAIDsContradictory effects of NSAIDs on cognitive function have been described in the literature. Several studies have reported that long-term therapy may protect against AD or slow the cognitive decline associated with AD and ageing. These findings are described in Chapter 8 on Risk Factors and are not discussed further here. Other studies have reported that short-term NSAID use may cause cognitive impairment. How-ever, the evidence is rather scarce. A cognitive assessment before and after three weeks of naproxene treatment in a prospective study showed a decline among 4 of 12 osteoarthritic elderly patients. However, the change was not statistically significant. In addition, the sample size was small and the trial was uncontrolled [88] (Table 26.9). Two prospective cohort studies of similar design have been published. From the Duke EPESE, Hanlon et al reported that elderly patients taking moderate or high NSAID doses performed significantly worse on memory tests [89]. Another EPESE study by Saag et al found high-dose NSAID use to be strongly associated with a decline in word recall [90]. However, these studies are observational, and their concomitant assessment of NSAID use and cognitive measures makes it difficult to draw any conclusions about the causal relationship. Some studies have reported a lack of deleterious effect of NSAIDs on cognitive function. May et al found no association between NSAID or aspirin use on MMSE scores and items in 1 310 ambulatory elderly [91]. A double-blind crossover study of 20 healthy elderly patients receiving indomethacin or placebo for 7 days suggested that tests of sensorimotor coordination and short-term memory may have improved, whereas tests of attention and psychot-motor speed remained unaffected [92]. In summary, few studies have provided evidence that NSAIDS have major negative effects on cogni- tive function. However, that does not rule out the risk of CNS effects in individual patients.

C H A P T E R 2 6 • D R U G - I N D U C E D C O G N I T I V E I M PA I R M E N T 429
CorticosteroidsCorticosteroids have several different effects on brain function, inclu-ding modulation of various transmitter systems, as well as implications for myelin synthesis, neuronal glucose uptake, dendritic branching and synapse formation. The hippocampus is an important receptor site for corticosteroids, where they are known to play an important role in long-term potentiation. While corticosteroids are integral to memory processes, such as interpreting and storing new information, prolonged exposure to, or elevated levels of, glucocorticoids may lead to hippocam-pal degeneration, which could cause cognitive impairment [93].
The BCDSP examined more than 700 consecutively hospitalized patients on corticosteroids and found significant psychiatric disturb- ances in 1.6% of those receiving <40 mg, 4.6% in those receiving 40– 80 mg and 18.4% in those receiving >80 mg prednisolone daily [94] (Table 26.10).
Several placebo-controlled, experimental studies on healthy subjects demonstrated that corticosteroids (prednisone, dexamethasone and hydrocortisone) have adverse effects on memory processes, such as immediate and delayed free recall, working memory, and declarative memory [95–101].
Several studies also reported various cognitive disturbances following corticosteroid therapy for medical diseases, including rheumatoid arthritis, asthma, and ulcerative colitis. In a series of 14 cases, Hall et al found that patients treated with corticosteroids – daily doses of pred-nisone 40 mg or its equivalent – were more likely to develop psychotic symptoms [102]. Another study by Keenan et al found that 25 patients using prednisone for at least 1 year performed worse than controls on tests of hippocampal-dependent memory tasks [103]. Varney et al identi-fied 6 patients who developed dementia-like cognitive changes following corticosteroid treatment. All of them recovered after discontinuation or reduction of the medications [104].

D E M E N T I A – D I AG N O S T I C A N D T H E R A P E U T I C I N T E RV E N T I O N S430
Anti-ulcer agentsCantu and Korek reviewed the incidence of risk factors for CNS reac-tions to histamine H2 blockers in 1991 and concluded that all H2 block-ers can induce CNS toxicities. The estimated incidence was low (0.2%) in outpatients, but 1.6% to 80% in inpatients. The association was more frequent for cimetidine, although there was no firm evidence for diffe-rences among the drugs. Advanced age was the only, albeit limited, risk factor [105]. Catalano et al reported six cases of famotidine-associated delirium in hospitalized patients who returned to normal upon removal of the drug [106].
An RCT in 12 healthy volunteers reported that increasing doses of cimeti-dine up to 1 600 mg had no significant impact on cognitive performance [107] (Table 26.11). However, the H2 antagonists are dependent on renal function, and there is evidence that renal impairment may increase the risk of CNS reactions. Schentag found moderate to severe mental status changes in 6 of 36 patients on cimetidine, all of whom had both renal and hepatic dysfunction, as well as high serum levels of cimetidine. The chan-ges became more severe as levels rose [108]. A prospective, observational open study of 41 patients on ranitidine showed that CNS adverse reactions such as confusion and disorientation were more frequent in patients with renal function impairment and higher plasma levels [109].
H2 blockers possess anticholinergic effects, and the fact that physo-stigmine has been shown to resolve delirium in users of H2 blockers suggests that it may be an important mechanism for the adverse CNS effects of these drugs [110].
Some case reports suggest that proton pump inhibitors [111,112] and misoprostol [113] can also cause delirium [112].
Cardiovascular drugsAdvanced age has been shown to be an independent risk factor for digitalis toxicity [114]. Several case reports of digitalis-induced delirium appear in the literature, mostly in elderly patients [115]. Delirium may be the first symptom of digitalis intoxication [116].

C H A P T E R 2 6 • D R U G - I N D U C E D C O G N I T I V E I M PA I R M E N T 431
A study in the Netherlands reported on 179 patients with digitalis toxi-city, of whom 12 presented transient psychosis and 4 delirium [117]. Important to note is that CNS disturbances may occur in the elderly even at normal digoxin concentrations [118,119].
Disopyramide and quinidine both have significant anticholinergic effects and have been reported to cause delirium [1,115].
A review of 55 studies on the cognitive side-effects of beta-blockers found inconsistent results. Sixteen percent of the studies showed improved fun-ction, seventeen percent worsened function and the rest no significant effect [120]. One placebo-controlled RCT of propranolol showed only limited effects on cognitive function [121] (Table 26.12). A double-blind crossover study on the cognitive effects of six different antihypertensives (six-week treatment periods with atenolol, metoprolol, hydrochlorothia-zide, methyldopa, enalapril and verapamil) showed that – irrespective of the type of medication – treatment reduced simple motor speed, as well as slowing completion of two tests measuring perceptuomotor speed and mental flexibility. On the other hand, all antihypertensive agents favora-bly affected performance on several tests that required working memory [122]. However, there are also case reports of insidious mental impair-ment [123] and delirium [124].
Whether lipophilic beta-blockers may be more prone to cause CNS effects has been a subject of discussion. A double-blind crossover study by Westerlund in 14 patients with a previous history of nightmares or hallucinations when taking lipophilic beta-blockers, compared the hydrophilic beta-blocker atenolol with the lipophilic agents metoprolol and propranolol. The number of episodes was significantly lower for patients receiving atenolol, thereby supporting the hypothesis [125]. However, the study by Dimsdale et al found no difference, too [120].
Nygaard reviewed studies on adverse drug events (ADE) related to topical administration of beta-blockers for glaucoma and found several reports of not only congestive heart failure, arrhythmias and respiratory symptoms, but depression, hallucinations and confusion, too [126].

D E M E N T I A – D I AG N O S T I C A N D T H E R A P E U T I C I N T E RV E N T I O N S432
Antibiotics, antiviral drugs and chemotherapyNumerous case reports indicate that quinolone antibiotics can cause delirium [127–130]. Moreover, the macrolide antibiotics clarithromycin [131] and azithromycin [132] have been reported to cause delirium in geriatric patients. Because the macrolides are potent inhibitors of the cytochrome P450 isoenzyme CYP 3A4, they may also indirectly cause cognitive disturbances by increasing the levels of other drugs with po- tential CNS effects [133]. There are also a few case reports of psychotic symptoms following administration of sulfonamides [134].
Case reports have associated the antiviral drugs acyclovir, ganciclovir and famciclovir with delirium [135–137].
There is growing evidence that chemotherapy can cause long-term cognitive changes in breast cancer patients [138,139]. Survivors treated with systemic chemotherapy scored significantly lower on the battery of neuropsychological tests than those who had received local therapy only. They were also more likely to self-report greater problems with working memory [139].

C H A P T E R 2 6 • D R U G - I N D U C E D C O G N I T I V E I M PA I R M E N T 433
Drug group Drugs studied Scientific evidence
Anticholinergic drugs Scopolamine Strong
Benzodiazepines Diazepam Strong
Antihistamines First-generation, eg diphenhydramine, hydroxyzine, prometha-zine
Strong
Corticosteroids Hydrocortisone, cortisone, cortisol, prednisolone, dexa- metasone
Strong
Opioids Morphine, hydromor-phone, oxycodone
Strong
Anticonvulsants Carbamazepine, phenytoin, pheno- barbital
Moderately strong
Tricyclic antidepressants Amitriptyline Moderately strong
Antiparkinsonian drugs L-dopa, anticholinergic drugs
Limited
Antipsychotic drugs Haloperidol Limited
Table 26.1 Drug groups for which there is scientific evidence for adverse effects on cognitive function.

D E M E N T I A – D I AG N O S T I C A N D T H E R A P E U T I C I N T E RV E N T I O N S434
Table 26.2 Anticholinergic drugs.
Author Year Reference
Type of study
Setting Disease/diagnosis
Severity No of individuals
Age- groups
Follow-up time
Intervention Primary outcome measures
Results Remarks Quality of study
Zemishlany et al 1991 [5]
RCT, DB, PC
Com N – 12 elderly, 14 young
57–73 22–35
2 h Scopolamine 0.2 mg/placebo
Verbal mem-ory, praxis and language
Impairment of new learning and praxis in the elderly
High
Flicker et al 1992 [6]
RCT, DB Com N – 10 elderly, 10 young
60–85 18–30
4 h Scopolamine/glycopyrrolate
Memory and attentional tests
Elderly impaired in all tests, young in two with highest dose
High
Sunderland et al 1987 [7]
RCT, DB, PC
Nh, Com
AD/N Mild- moderate
10 AD, 10 N
Mean 58.8 61.3
30 min Scopolamine/placebo
Cognitive and behavioral tests
AD more impaired. Particularly new learning and semantic knowledge. Behavioral symp-toms in AD
High
Tune et al 1981 [8]
Pro Ho Cardiac surgery
– 29 29–75 1 week – Diagnosis of delirium
7/8 with delirium had high serum anticholinergic levels. 4/17 in controls
Low
Miller et al 1988 [9]
RCT, DB, PC
Ho Pre-surgical patients
– 36 59–81 1 h Scopolamine 0.005 mg/kg/placebo
Cognitive tests: MMSE
Low serum anticholinergic levels and cognitive impair- ment in two tests, in scopola-mine treated
Moderate
Rovner et al 1988 [10]
CS Nh D Ns 22 Mean 80.8
– – Cognition and self-care capa-city (PDRS)
High levels of serum anticholi- nergic activity associated with lower self-care score
CS Low
AD = Alzheimer’s disease; Com = Community dwelling; CS = Cross sectional; D = Dementia; DB = Double blinded; Ho = Hospital; MMSE = Mini-mental state examination; N = Normal subjects; Nh = Nursing home; ns = Not stated; PC = Placebo-controlled; Pro = Prospective study; RCT = Randomised controlled trial

C H A P T E R 2 6 • D R U G - I N D U C E D C O G N I T I V E I M PA I R M E N T 435
Table 26.2 Anticholinergic drugs.
Author Year Reference
Type of study
Setting Disease/diagnosis
Severity No of individuals
Age- groups
Follow-up time
Intervention Primary outcome measures
Results Remarks Quality of study
Zemishlany et al 1991 [5]
RCT, DB, PC
Com N – 12 elderly, 14 young
57–73 22–35
2 h Scopolamine 0.2 mg/placebo
Verbal mem-ory, praxis and language
Impairment of new learning and praxis in the elderly
High
Flicker et al 1992 [6]
RCT, DB Com N – 10 elderly, 10 young
60–85 18–30
4 h Scopolamine/glycopyrrolate
Memory and attentional tests
Elderly impaired in all tests, young in two with highest dose
High
Sunderland et al 1987 [7]
RCT, DB, PC
Nh, Com
AD/N Mild- moderate
10 AD, 10 N
Mean 58.8 61.3
30 min Scopolamine/placebo
Cognitive and behavioral tests
AD more impaired. Particularly new learning and semantic knowledge. Behavioral symp-toms in AD
High
Tune et al 1981 [8]
Pro Ho Cardiac surgery
– 29 29–75 1 week – Diagnosis of delirium
7/8 with delirium had high serum anticholinergic levels. 4/17 in controls
Low
Miller et al 1988 [9]
RCT, DB, PC
Ho Pre-surgical patients
– 36 59–81 1 h Scopolamine 0.005 mg/kg/placebo
Cognitive tests: MMSE
Low serum anticholinergic levels and cognitive impair- ment in two tests, in scopola-mine treated
Moderate
Rovner et al 1988 [10]
CS Nh D Ns 22 Mean 80.8
– – Cognition and self-care capa-city (PDRS)
High levels of serum anticholi- nergic activity associated with lower self-care score
CS Low

D E M E N T I A – D I AG N O S T I C A N D T H E R A P E U T I C I N T E RV E N T I O N S436
Table 26.3 Anxiolytics, hypnotics-sedatives.
Author Year Reference
Type of study
Setting Disease/diagnosis
Severity No of indivi-duals
Age- groups
Follow-up time
Intervention Primary outcome measures
Results Remarks Quality of study
Larson et al 1987 [2]
Pro Com D (sus-pected)
Ns 308 60+ ≥1 y – Probable ADR as cause of cognitive impairment
35 with probable ADR cau-sing cognitive impairment. Sedatives-hypnotics use strongest predictor
Low
Hanlon et al 1998 [11]
Pro Com – – 2 765 <74 (1 873) 75–84 (775) 85+ (117)
3 y – Memory tests (SPMSQ, OMC)
Current use of Bz perfor-med worse on memory tests. More errors if higher dose or long term use
Low
Greenblatt et al 1978 [12]
Pro, MCT
Com – – 2 111 Mean 57 – Nitrazepam Signs of CNS depression
Signs of CNS depression in 11% of elderly 80+ using nitrazepam
Low
Greenblatt et al 1977 [13]
Pro Com – – 2 542 Mean 54.5
– Flurazepam Signs of CNS depression
Signs of CNS depression in 7.1% of elderly 80+ using flurazepam
Low
Pomara et al 1984 [14,15]
RCT, DB, PC, C–O
Com N – 12 60–77 1 h, 3 h Diazepam 2.5, 5, 10 mg/ placebo
Buschke selective reminding, visual memory, digit span/supraspan
Five tasks significantly impaired with all doses
High
Hinrichs et al 1987 [16]
RCT, DB, PC, C–O
Com N – 12 + 12 + 12
19–28 40–45 61–73
3.5 h Diazepam 0.2 mg/kg/ placebo
Addition, number learning, imme-diate and delayed free recall etc
Negative effect of diazepam in almost all tasks
High
Fairweather et al 1992 [19]
RCT, DB, PC
Com N – 24 63–80 7 d Zolpidem 5, 10 mg/ placebo
Sternberg memory scanning
No impact on cognitive function
High
Hemmeter et al 2000 [20]
RCT, DB, PC
Com N 12 60–70 10 h Zopiclone 7.5 mg/temazepam 20 mg/placebo
No effect on memory performance
High

C H A P T E R 2 6 • D R U G - I N D U C E D C O G N I T I V E I M PA I R M E N T 437
Table 26.3 Anxiolytics, hypnotics-sedatives.
Author Year Reference
Type of study
Setting Disease/diagnosis
Severity No of indivi-duals
Age- groups
Follow-up time
Intervention Primary outcome measures
Results Remarks Quality of study
Larson et al 1987 [2]
Pro Com D (sus-pected)
Ns 308 60+ ≥1 y – Probable ADR as cause of cognitive impairment
35 with probable ADR cau-sing cognitive impairment. Sedatives-hypnotics use strongest predictor
Low
Hanlon et al 1998 [11]
Pro Com – – 2 765 <74 (1 873) 75–84 (775) 85+ (117)
3 y – Memory tests (SPMSQ, OMC)
Current use of Bz perfor-med worse on memory tests. More errors if higher dose or long term use
Low
Greenblatt et al 1978 [12]
Pro, MCT
Com – – 2 111 Mean 57 – Nitrazepam Signs of CNS depression
Signs of CNS depression in 11% of elderly 80+ using nitrazepam
Low
Greenblatt et al 1977 [13]
Pro Com – – 2 542 Mean 54.5
– Flurazepam Signs of CNS depression
Signs of CNS depression in 7.1% of elderly 80+ using flurazepam
Low
Pomara et al 1984 [14,15]
RCT, DB, PC, C–O
Com N – 12 60–77 1 h, 3 h Diazepam 2.5, 5, 10 mg/ placebo
Buschke selective reminding, visual memory, digit span/supraspan
Five tasks significantly impaired with all doses
High
Hinrichs et al 1987 [16]
RCT, DB, PC, C–O
Com N – 12 + 12 + 12
19–28 40–45 61–73
3.5 h Diazepam 0.2 mg/kg/ placebo
Addition, number learning, imme-diate and delayed free recall etc
Negative effect of diazepam in almost all tasks
High
Fairweather et al 1992 [19]
RCT, DB, PC
Com N – 24 63–80 7 d Zolpidem 5, 10 mg/ placebo
Sternberg memory scanning
No impact on cognitive function
High
Hemmeter et al 2000 [20]
RCT, DB, PC
Com N 12 60–70 10 h Zopiclone 7.5 mg/temazepam 20 mg/placebo
No effect on memory performance
High
The table continues on the next page

D E M E N T I A – D I AG N O S T I C A N D T H E R A P E U T I C I N T E RV E N T I O N S438
Table 26.3 continued
Author Year Reference
Type of study
Setting Disease/diagnosis
Severity No of indivi-duals
Age- groups
Follow-up time
Intervention Primary outcome measures
Results Remarks Quality of study
Allain et al 2003 [21]
RCT, DB, PC, C–O
Com N 48 65+ 10 h Zopiclone 3.75 mg/ zolpidem 5 mg/lormetazepam 1 mg/placebo
Sternberg memory scanning, learning memory
No effect on all tests but one item in Sternbergs test (zopiclone)
High
ADR = Adverse drug reaction; Bz = Com = Community dwelling; C–O = Crossover; D = Dementia; DB = Double-blind; MCT = Multi-centre trial; N = Normal subjects; ns = Not stated; PC = Placebo-controlled; Pro = Prospective study; RCT = Randomised controlled trial

C H A P T E R 2 6 • D R U G - I N D U C E D C O G N I T I V E I M PA I R M E N T 439
Table 26.3 continued
Author Year Reference
Type of study
Setting Disease/diagnosis
Severity No of indivi-duals
Age- groups
Follow-up time
Intervention Primary outcome measures
Results Remarks Quality of study
Allain et al 2003 [21]
RCT, DB, PC, C–O
Com N 48 65+ 10 h Zopiclone 3.75 mg/ zolpidem 5 mg/lormetazepam 1 mg/placebo
Sternberg memory scanning, learning memory
No effect on all tests but one item in Sternbergs test (zopiclone)
High

D E M E N T I A – D I AG N O S T I C A N D T H E R A P E U T I C I N T E RV E N T I O N S440
Table 26.4 Antipsychotics.
Author Year Reference
Type of study
Setting Disease/diagnosis
Seve-rity
No of indi-viduals
Age-groups
Follow-up time
Intervention Primary outcome measures
Results Remarks Quality of study
Devanand et al1989 [26]
SB,PC,C–O
Com AD, psy-chosis or behavioral symptoms
Ns 9 Mean 71.6
8 w Haloperidol 1–5 mg/placebo
Cognition measured by MMSE
Trend towards cognitive decline, only partial re- covery
Small study Low
Devanand et al1998 [27]
RCT, DB, PC
Com Probable AD, psy-chotic or disruptive behavior
CDR 1–2 (43)CDR 3 (28)
71 6 w Haloperidol 0.5–0.75 mg; 2–3 mg/placebo
Cognition measured by MMSE
No effect observed High
Legangneux et al2000 [28]
RCT, DB, PC, C–O
Com N – 16 65–80 24 h Haloperidol 2 mg/amisulpi- ride 50, 200 mg/ placebo
Cognition mea-sured by CDR computerized assessment
Significant impair-ment by halope-ridol compared to amisulpiride (but not placebo)
Small sample. One drop-out, replaced
Moderate
Katz et al1999 [29]
RCT, DB, PC
Nh AD, psy-chosis or behavioral symptoms
Severe FAST ≥7A
625 82.7 12 w Risperidon 0.5, 1, 2 mg/ placebo
Cognition measured by MMSE
No significant effect
High
De Deyn et al1999 [30]
RCT, DB, PC
Nh AD, behavioral symptoms
Severe FAST ≥6(92%)
344 56–97 13 w Risperidon 0.25–4 mg/ haloperidol 0.25–4 mg/ placebo
Cognition measured by MMSE
No significant effect of risperi-done but with haloperidol com- pared to placebo
High
Street et al2000 [31]
RCT, DB, PC
Nh AD, psychotic and/or behavioralsymptoms
Ns 206 61–97 6 w Olanzapine 5, 10, 15 mg/ placebo
Cognition measured by MMSE
No significant effect
High
Sajatovic et al1998 [32]
O, C–O
Schizo-phrenia
Ns 27 65–80 8 w Olanzapine 2.5–20 mg
Cognition measured by MMSE
No significant effect
Low

C H A P T E R 2 6 • D R U G - I N D U C E D C O G N I T I V E I M PA I R M E N T 441
The table continues on the next page
Table 26.4 Antipsychotics.
Author Year Reference
Type of study
Setting Disease/diagnosis
Seve-rity
No of indi-viduals
Age-groups
Follow-up time
Intervention Primary outcome measures
Results Remarks Quality of study
Devanand et al1989 [26]
SB,PC,C–O
Com AD, psy-chosis or behavioral symptoms
Ns 9 Mean 71.6
8 w Haloperidol 1–5 mg/placebo
Cognition measured by MMSE
Trend towards cognitive decline, only partial re- covery
Small study Low
Devanand et al1998 [27]
RCT, DB, PC
Com Probable AD, psy-chotic or disruptive behavior
CDR 1–2 (43)CDR 3 (28)
71 6 w Haloperidol 0.5–0.75 mg; 2–3 mg/placebo
Cognition measured by MMSE
No effect observed High
Legangneux et al2000 [28]
RCT, DB, PC, C–O
Com N – 16 65–80 24 h Haloperidol 2 mg/amisulpi- ride 50, 200 mg/ placebo
Cognition mea-sured by CDR computerized assessment
Significant impair-ment by halope-ridol compared to amisulpiride (but not placebo)
Small sample. One drop-out, replaced
Moderate
Katz et al1999 [29]
RCT, DB, PC
Nh AD, psy-chosis or behavioral symptoms
Severe FAST ≥7A
625 82.7 12 w Risperidon 0.5, 1, 2 mg/ placebo
Cognition measured by MMSE
No significant effect
High
De Deyn et al1999 [30]
RCT, DB, PC
Nh AD, behavioral symptoms
Severe FAST ≥6(92%)
344 56–97 13 w Risperidon 0.25–4 mg/ haloperidol 0.25–4 mg/ placebo
Cognition measured by MMSE
No significant effect of risperi-done but with haloperidol com- pared to placebo
High
Street et al2000 [31]
RCT, DB, PC
Nh AD, psychotic and/or behavioralsymptoms
Ns 206 61–97 6 w Olanzapine 5, 10, 15 mg/ placebo
Cognition measured by MMSE
No significant effect
High
Sajatovic et al1998 [32]
O, C–O
Schizo-phrenia
Ns 27 65–80 8 w Olanzapine 2.5–20 mg
Cognition measured by MMSE
No significant effect
Low

D E M E N T I A – D I AG N O S T I C A N D T H E R A P E U T I C I N T E RV E N T I O N S442
Table 26.4 continued
Author Year Reference
Type of study
Setting Disease/diagnosis
Seve-rity
No of indi-viduals
Age-groups
Follow-up time
Intervention Primary outcome measures
Results Remarks Quality of study
McShane et al1997 [41]
Pro Com D Mean MMSE 15.5 at entry
71 Mean 72.6
2 years – Cognition measured by expanded MMSE
Double mean decline in anti- psychotic users
Cogntive decline and antipsychotic use measured concomitantly
Low
Allain et al2003 [21]
RCT, DB, PC, C–O
Com N – 12 8 h Risperidone 0.25, 0.5 mg/lorazepam 1 mg /placebo
Battery including psycho-motor and cognitive tests
No effect on wor-king or long-term memory. Minor impairment of information pro-cessing
Small sample Moderate
AD = Alzheimer’s disease; ADR = Adverse drug reaction; Bz = Border Zone; Com = Community dwelling; C–O = Crossover; D = Dementia; DB = Double-blind; FAST = Functional assessment staging; MCT = Multi-centre trial; MMSE = Mini-mental state examination; N = Normal subjects; Nh = Nursing home; ns = Not stated; O = Open study; PC = Placebo-controlled; Pro = Prospective study; RCT = Randomised controlled trial

C H A P T E R 2 6 • D R U G - I N D U C E D C O G N I T I V E I M PA I R M E N T 443
Table 26.4 continued
Author Year Reference
Type of study
Setting Disease/diagnosis
Seve-rity
No of indi-viduals
Age-groups
Follow-up time
Intervention Primary outcome measures
Results Remarks Quality of study
McShane et al1997 [41]
Pro Com D Mean MMSE 15.5 at entry
71 Mean 72.6
2 years – Cognition measured by expanded MMSE
Double mean decline in anti- psychotic users
Cogntive decline and antipsychotic use measured concomitantly
Low
Allain et al2003 [21]
RCT, DB, PC, C–O
Com N – 12 8 h Risperidone 0.25, 0.5 mg/lorazepam 1 mg /placebo
Battery including psycho-motor and cognitive tests
No effect on wor-king or long-term memory. Minor impairment of information pro-cessing
Small sample Moderate

D E M E N T I A – D I AG N O S T I C A N D T H E R A P E U T I C I N T E RV E N T I O N S444
Table 26.5 Antidepressants.
Author Year Reference
Type of study
Setting Disease/diagnosis
Severity No of indi-viduals
Age-groups Follow-up time
Intervention Primary outcome measures
Results Remarks Quality of study
Branconnier et al 1982 [45]
RCT, DB, PC, C–O
Com N – 15 60–75 4 h Amitriptyline 50 mg/placebo
Battery of tests for episodic, sensory, primary and secondary memory
Marked disruption of verbal recall (no effect on recognition) from secon-dary memory
High
Moskowitz et al 1986 [46]
DB, PC, C–O
Com N – 15 Mean 63 4 h Amitriptyline 50 mg/trazo- done 100 mg/ placebo, in 3 sessions
Test battery for visual search, attention, track-ing, information processing and vigilance
Amitriptyline impaired vigi-lance, divided attention and critical tracking tasks
No info about randomi-zation
Moderate
Ghose et al 1987 [48]
RCT, DB, PC, C–O
Com N – 6 66–72 24 h Lofepramine 70, 105, 140 mg/ amitriptyline 50 mg/placebo
Choice reaction time (CRT), CFF, letter cancella-tion, short term memory tests
Lofepramine (140) impro-ved CRT and letter cancel-lation. No difference from placebo in other tests. Negative ef- fects of ami-triptyline in several tests
Moderate
Ogura et al 1983 [47]
DB, C–O Students, Nh
N – 7 young, 7 elderly
21–2565–74
24 h Dotheipine 25 mg; ami- triptyline 25 mg
Decreased CFF by ami- triptyline for up to 24 h
No pla-cebo
Moderate
Marcopulos et al 1990 [49]
CS, CC Com Depres-sion
Ns 27 treated, 27 matched controls
– Amitriptyline 10–150 mg; doxepin 50–200 mg; miscellaneous
WAIS battery Mild, but signi-ficant, deficit in 6 measures of memory performance
Low

C H A P T E R 2 6 • D R U G - I N D U C E D C O G N I T I V E I M PA I R M E N T 445
Table 26.5 Antidepressants.
Author Year Reference
Type of study
Setting Disease/diagnosis
Severity No of indi-viduals
Age-groups Follow-up time
Intervention Primary outcome measures
Results Remarks Quality of study
Branconnier et al 1982 [45]
RCT, DB, PC, C–O
Com N – 15 60–75 4 h Amitriptyline 50 mg/placebo
Battery of tests for episodic, sensory, primary and secondary memory
Marked disruption of verbal recall (no effect on recognition) from secon-dary memory
High
Moskowitz et al 1986 [46]
DB, PC, C–O
Com N – 15 Mean 63 4 h Amitriptyline 50 mg/trazo- done 100 mg/ placebo, in 3 sessions
Test battery for visual search, attention, track-ing, information processing and vigilance
Amitriptyline impaired vigi-lance, divided attention and critical tracking tasks
No info about randomi-zation
Moderate
Ghose et al 1987 [48]
RCT, DB, PC, C–O
Com N – 6 66–72 24 h Lofepramine 70, 105, 140 mg/ amitriptyline 50 mg/placebo
Choice reaction time (CRT), CFF, letter cancella-tion, short term memory tests
Lofepramine (140) impro-ved CRT and letter cancel-lation. No difference from placebo in other tests. Negative ef- fects of ami-triptyline in several tests
Moderate
Ogura et al 1983 [47]
DB, C–O Students, Nh
N – 7 young, 7 elderly
21–2565–74
24 h Dotheipine 25 mg; ami- triptyline 25 mg
Decreased CFF by ami- triptyline for up to 24 h
No pla-cebo
Moderate
Marcopulos et al 1990 [49]
CS, CC Com Depres-sion
Ns 27 treated, 27 matched controls
– Amitriptyline 10–150 mg; doxepin 50–200 mg; miscellaneous
WAIS battery Mild, but signi-ficant, deficit in 6 measures of memory performance
Low
The table continues on the next page

D E M E N T I A – D I AG N O S T I C A N D T H E R A P E U T I C I N T E RV E N T I O N S446
Table 26.5 continued
Author Year Reference
Type of study
Setting Disease/diagnosis
Severity No of indi-viduals
Age-groups Follow-up time
Intervention Primary outcome measures
Results Remarks Quality of study
Kerr et al 1993 [50]
RCT, DB, parallel-group
Ns Depres-sion
MADRS 15–20
66 42 d Amitriptyline 75 mg; fluoxe-tine 20 mg/ placebo
MADRS, HAM-D, CFF, CRT, word recognition, memory scanning
CFF threshold improved in fluoxetine but not amitripty-line group. Bet-ter memory improvement with fluoxetine
12 with- drawn due to ADE. Little info about subjects
Low
Legg et al 1976 [51]
RCT, DB, PC
Ho Depres-sion
Ns 49 16–70 3 w Imipramine 300 mg; chlorproma- zine 600 mg/ placebo, 5 weeks
Six WAIS-sub-tests, Wechsler memory scale, Benton visual retention etc
Impairment of short term visual memory (Benton). Also failure to improve in tests of new learning
32% drop-out due to poor effect.Randomi-zation not described
Low
Glass et al1981 [52]
RCT, DB, PC, C–O
Com Major (n = 25) or minor depressive disorder.Matched N
Ns 32 + 32 30–63 3 w Imipramine 75 mg/placebo, 3 weeks
Tapping speed, lift-off reaction time, item recog-nition procedure
Improvement in short-term memory. Else no effects
High
Georgotas et al 1989 [54]
RCT, DB, PC
Com Unipolar major depres-sion
Hamilton ≥16
78 55–82 7 w Nortriptyline; phenelzine/ placebo
Cognitive battery including WAIS, Guild memory scale etc
No effect on any measure
Doses not given
Moderate
Siegfried et al 1986 [53]
RCT, DB Nh, Ho Major depres-sion
Hamilton ≥18
75 67–83 4 w Maprotiline 100 mg; mian-serin 40 mg; nomifensine 100 mg, 4 weeks
HAM-D, CFF, digit span CRT, Test d2, paired associated lear-ning
All drugs gave cognitive improvement, but most slowly with maprotiline
No pla-cebo
Moderate

C H A P T E R 2 6 • D R U G - I N D U C E D C O G N I T I V E I M PA I R M E N T 447
Table 26.5 continued
Author Year Reference
Type of study
Setting Disease/diagnosis
Severity No of indi-viduals
Age-groups Follow-up time
Intervention Primary outcome measures
Results Remarks Quality of study
Kerr et al 1993 [50]
RCT, DB, parallel-group
Ns Depres-sion
MADRS 15–20
66 42 d Amitriptyline 75 mg; fluoxe-tine 20 mg/ placebo
MADRS, HAM-D, CFF, CRT, word recognition, memory scanning
CFF threshold improved in fluoxetine but not amitripty-line group. Bet-ter memory improvement with fluoxetine
12 with- drawn due to ADE. Little info about subjects
Low
Legg et al 1976 [51]
RCT, DB, PC
Ho Depres-sion
Ns 49 16–70 3 w Imipramine 300 mg; chlorproma- zine 600 mg/ placebo, 5 weeks
Six WAIS-sub-tests, Wechsler memory scale, Benton visual retention etc
Impairment of short term visual memory (Benton). Also failure to improve in tests of new learning
32% drop-out due to poor effect.Randomi-zation not described
Low
Glass et al1981 [52]
RCT, DB, PC, C–O
Com Major (n = 25) or minor depressive disorder.Matched N
Ns 32 + 32 30–63 3 w Imipramine 75 mg/placebo, 3 weeks
Tapping speed, lift-off reaction time, item recog-nition procedure
Improvement in short-term memory. Else no effects
High
Georgotas et al 1989 [54]
RCT, DB, PC
Com Unipolar major depres-sion
Hamilton ≥16
78 55–82 7 w Nortriptyline; phenelzine/ placebo
Cognitive battery including WAIS, Guild memory scale etc
No effect on any measure
Doses not given
Moderate
Siegfried et al 1986 [53]
RCT, DB Nh, Ho Major depres-sion
Hamilton ≥18
75 67–83 4 w Maprotiline 100 mg; mian-serin 40 mg; nomifensine 100 mg, 4 weeks
HAM-D, CFF, digit span CRT, Test d2, paired associated lear-ning
All drugs gave cognitive improvement, but most slowly with maprotiline
No pla-cebo
Moderate
The table continues on the next page

D E M E N T I A – D I AG N O S T I C A N D T H E R A P E U T I C I N T E RV E N T I O N S448
Table 26.5 continued
Author Year Reference
Type of study
Setting Disease/diagnosis
Severity No of indi-viduals
Age-groups Follow-up time
Intervention Primary outcome measures
Results Remarks Quality of study
Hindmarch et al 1990 [56]
RCT, DB, PC, C–O
Com N – 10 women,21 men
25–4560–75
9 d Sertraline 25–100 mg; mianserin 10–30 mg
CFF, CRT, imme-diate memory tests, sensori- motor tracking
No effect of sertraline on any objective measure of performance
10 drop-outs in 2nd study mianserin group
Moderate
ADE = Adverse drug event; CC = Case-control; CFF = Critical flicker fusion; Com = Community dwelling; C–O = Crossover; CS = Cross-sectional; DB = Double-blind; Ho = Hospital; MCT = Multi-center trial; MMSE = Mini-mental state examination; N = Normal subjects; Nh = Nursing home; ns = Not stated; O = Open study; PC = Placebo-controlled; RCT = Randomised controlled trial; WAIS = Wechsler adult intelligence scale

C H A P T E R 2 6 • D R U G - I N D U C E D C O G N I T I V E I M PA I R M E N T 449
Table 26.5 continued
Author Year Reference
Type of study
Setting Disease/diagnosis
Severity No of indi-viduals
Age-groups Follow-up time
Intervention Primary outcome measures
Results Remarks Quality of study
Hindmarch et al 1990 [56]
RCT, DB, PC, C–O
Com N – 10 women,21 men
25–4560–75
9 d Sertraline 25–100 mg; mianserin 10–30 mg
CFF, CRT, imme-diate memory tests, sensori- motor tracking
No effect of sertraline on any objective measure of performance
10 drop-outs in 2nd study mianserin group
Moderate

D E M E N T I A – D I AG N O S T I C A N D T H E R A P E U T I C I N T E RV E N T I O N S450
Table 26.6 Antiparkinsonian drugs.
Author Year Reference
Type of study
Setting Disease/diagnosis
Severity No of individuals
Age-groups Follow-up time
Intervention Primary outcome measures
Results Remarks Quality of study
Van Spaen-donck et al 1993 [60]
CS Com PD Ns 11 on anti-cholinergic therapy 30 de novo
Mean 61.5 and 58.1
– – WAIS-R and card sorting test
Patients on anticholinergic therapy perfor-med worse on card sorting test
Low
Meco et al 1984 [61]
CS Com PD and healthy controls
Hoehn and Yahr stage 2–3
33 PD14 controls
Mean 66.2 and 62.9
– – Bender visual motor gestalt, Wechsler-Bel-levue, Tou-louse-Pieron
Patients on anticholinergics, alone or in com-bination perfor-med the worst. Best results with L-Dopa alone
Low
Growdon et al 1998 [62]
Pro Com PD Hoehn and Yahr mean 2.2
387 Mean 63.7 6 months L-Dopa (mean 286 mg daily)
Digit span, digit symbol, selec-tive reminding, verbal fluency etc
No impairment on any test
Low
Müller et al 2001 [63]
DB, PC Ho PD, treated or untreated
Hoehn and Yahr 2.10–2.29
16 + 14 + 10 29–69 47–72 37–74
90 min L-Dopa 250 mg/ placebo
Simple reaction time (SRT)
Significant increase in SRT
Randomization not described
Moderate
Goetz et al 2001 [64]
Pro Com PD Hoehn and Yahr stage 2–3
89 Mean 67.7 48 months – Rush Hallucina-tion Inventory
Association of persistent hal-lucinations with L-Dopa + ago-nist treatment
Low
Serby et al 1980 [66]
RCT? Ns Advanced PD
Advanced 81 Ns – Bromocriptine mean 33 mg; lergotrile mean 39 mg
Ns In both bromo-criptine and ler-gotril patients, 26% developed mental changes
Very poor method description
Low

C H A P T E R 2 6 • D R U G - I N D U C E D C O G N I T I V E I M PA I R M E N T 451
The table continues on the next page
Table 26.6 Antiparkinsonian drugs.
Author Year Reference
Type of study
Setting Disease/diagnosis
Severity No of individuals
Age-groups Follow-up time
Intervention Primary outcome measures
Results Remarks Quality of study
Van Spaen-donck et al 1993 [60]
CS Com PD Ns 11 on anti-cholinergic therapy 30 de novo
Mean 61.5 and 58.1
– – WAIS-R and card sorting test
Patients on anticholinergic therapy perfor-med worse on card sorting test
Low
Meco et al 1984 [61]
CS Com PD and healthy controls
Hoehn and Yahr stage 2–3
33 PD14 controls
Mean 66.2 and 62.9
– – Bender visual motor gestalt, Wechsler-Bel-levue, Tou-louse-Pieron
Patients on anticholinergics, alone or in com-bination perfor-med the worst. Best results with L-Dopa alone
Low
Growdon et al 1998 [62]
Pro Com PD Hoehn and Yahr mean 2.2
387 Mean 63.7 6 months L-Dopa (mean 286 mg daily)
Digit span, digit symbol, selec-tive reminding, verbal fluency etc
No impairment on any test
Low
Müller et al 2001 [63]
DB, PC Ho PD, treated or untreated
Hoehn and Yahr 2.10–2.29
16 + 14 + 10 29–69 47–72 37–74
90 min L-Dopa 250 mg/ placebo
Simple reaction time (SRT)
Significant increase in SRT
Randomization not described
Moderate
Goetz et al 2001 [64]
Pro Com PD Hoehn and Yahr stage 2–3
89 Mean 67.7 48 months – Rush Hallucina-tion Inventory
Association of persistent hal-lucinations with L-Dopa + ago-nist treatment
Low
Serby et al 1980 [66]
RCT? Ns Advanced PD
Advanced 81 Ns – Bromocriptine mean 33 mg; lergotrile mean 39 mg
Ns In both bromo-criptine and ler-gotril patients, 26% developed mental changes
Very poor method description
Low

D E M E N T I A – D I AG N O S T I C A N D T H E R A P E U T I C I N T E RV E N T I O N S452
Table 26.6 continued
Author Year Reference
Type of study
Setting Disease/diagnosis
Severity No of individuals
Age-groups Follow-up time
Intervention Primary outcome measures
Results Remarks Quality of study
Portin et al1983 [67]
Pro Ns PD Ns 7 with L-Dopa18 de novo
58–7450–76
8–10 y Selegiline 5–10 mg daily, 4 weeks
Various memory tests, tests for cog-nitive function, vigilance and motor speed
Improvement in memory and motor speed in patients without progressive dementia, but deterioration in vigilance and set shifting
Poor method description (eg randomi-zation)
Low
McEvoy et al 1987 [59]
RCT, DB, C–O
Com N – 30 60–72 4 d Amantadine 100 mg; tri-hexyphenidyl 4 mg, twice daily for 4 days
Digit span, free recall, recog-nition-signal detection, retrieval-fami-liar categories
Memory deficits and subjective memory loss and confusion with trihexy- phenidyl
Moderate
CFF = Critical flicker fusion; Com = Community dwelling; C–O = Crossover; CS = Cross-sectional; DB = Double-blind; Ho = Hospital; N = Normal subjects; ns = Not stated; PC = Placebo-controlled; PD = Parkinson’s disease; Pro = Prospective study; RCT = Randomised controlled trial; WAIS = Wechsler adult intelligence scale

C H A P T E R 2 6 • D R U G - I N D U C E D C O G N I T I V E I M PA I R M E N T 453
Table 26.6 continued
Author Year Reference
Type of study
Setting Disease/diagnosis
Severity No of individuals
Age-groups Follow-up time
Intervention Primary outcome measures
Results Remarks Quality of study
Portin et al1983 [67]
Pro Ns PD Ns 7 with L-Dopa18 de novo
58–7450–76
8–10 y Selegiline 5–10 mg daily, 4 weeks
Various memory tests, tests for cog-nitive function, vigilance and motor speed
Improvement in memory and motor speed in patients without progressive dementia, but deterioration in vigilance and set shifting
Poor method description (eg randomi-zation)
Low
McEvoy et al 1987 [59]
RCT, DB, C–O
Com N – 30 60–72 4 d Amantadine 100 mg; tri-hexyphenidyl 4 mg, twice daily for 4 days
Digit span, free recall, recog-nition-signal detection, retrieval-fami-liar categories
Memory deficits and subjective memory loss and confusion with trihexy- phenidyl
Moderate

D E M E N T I A – D I AG N O S T I C A N D T H E R A P E U T I C I N T E RV E N T I O N S454
Table 26.7 Anticonvulsants.
Author Year Reference
Type of study
Setting Disease/ diagnosis
Severity No of indi-viduals
Age- groups
Follow-up time
Intervention Primary outcome measures
Results Remarks Quality of study
Smith et al 1987 [70]
RCT, DB Multicenter Com
Simple, complex or generalised seizures. Controls
Ns 622 patients, 75 controls
18–82, 17–72
36 m Phenobarbital, carbamaze-pine, phenyoin and primidone
Tests of intel-lectual ability (WAIS), behavi-or (CFF etc) and mood/emotion (POMS)
Less effects of carbamaze-pine on tests of attention/con-centration and motor perfor-mance
High
Meador et al 1991 [71]
RCT, DB, PC, C–O
Com N – 21 21–48 1 m Carbamaze-pine 200 mg; phenytoin 100 mg, 1 month/ placebo
Extensive bat-tery of cognitive tests and POMS
Impairment of Stroop, CRT, grooved peg-board, Hopkins and POMS. Only small diffe-rences between the drugs
9 of 30 drop-ped out due to ADE
Moderate
Meador et al 1990 [73]
RCT, DB, C–O
Com Partial complex epilepsy
Ns 15 19–62 3 m Carbamazepi-ne 6–12 µg/ml; phenobarbital 10–20 µg/ml; phenytoin 15–40 µg/ml
Digit span, selective reminding, digit symbol, CRT, POMS etc
Phenobarbital gave significantly more impair-ment of digit symbol
6 patients discontinued
Moderate
Meador et al 1995 [74]
RCT, DB, C–O
Com N – 59 19–46 7,5 m Phenobarbital 120–360 mg; phenytoin 200–600 mg; valproate 500–1 500 mg, 1 month
Large test battery for cog-nitive and motor speed, memory, other cognitive tasks, mood and symptoms
All three drugs gave some untoward effect compared to baseline. Phenobarbital gave worst per-formance. No difference bet-ween phenytoin and valproate
16 patients discontinued
Moderate

C H A P T E R 2 6 • D R U G - I N D U C E D C O G N I T I V E I M PA I R M E N T 455
Table 26.7 Anticonvulsants.
Author Year Reference
Type of study
Setting Disease/ diagnosis
Severity No of indi-viduals
Age- groups
Follow-up time
Intervention Primary outcome measures
Results Remarks Quality of study
Smith et al 1987 [70]
RCT, DB Multicenter Com
Simple, complex or generalised seizures. Controls
Ns 622 patients, 75 controls
18–82, 17–72
36 m Phenobarbital, carbamaze-pine, phenyoin and primidone
Tests of intel-lectual ability (WAIS), behavi-or (CFF etc) and mood/emotion (POMS)
Less effects of carbamaze-pine on tests of attention/con-centration and motor perfor-mance
High
Meador et al 1991 [71]
RCT, DB, PC, C–O
Com N – 21 21–48 1 m Carbamaze-pine 200 mg; phenytoin 100 mg, 1 month/ placebo
Extensive bat-tery of cognitive tests and POMS
Impairment of Stroop, CRT, grooved peg-board, Hopkins and POMS. Only small diffe-rences between the drugs
9 of 30 drop-ped out due to ADE
Moderate
Meador et al 1990 [73]
RCT, DB, C–O
Com Partial complex epilepsy
Ns 15 19–62 3 m Carbamazepi-ne 6–12 µg/ml; phenobarbital 10–20 µg/ml; phenytoin 15–40 µg/ml
Digit span, selective reminding, digit symbol, CRT, POMS etc
Phenobarbital gave significantly more impair-ment of digit symbol
6 patients discontinued
Moderate
Meador et al 1995 [74]
RCT, DB, C–O
Com N – 59 19–46 7,5 m Phenobarbital 120–360 mg; phenytoin 200–600 mg; valproate 500–1 500 mg, 1 month
Large test battery for cog-nitive and motor speed, memory, other cognitive tasks, mood and symptoms
All three drugs gave some untoward effect compared to baseline. Phenobarbital gave worst per-formance. No difference bet-ween phenytoin and valproate
16 patients discontinued
Moderate
The table continues on the next page

D E M E N T I A – D I AG N O S T I C A N D T H E R A P E U T I C I N T E RV E N T I O N S456
Table 26.7 continued
Author Year Reference
Type of study
Setting Disease/ diagnosis
Severity No of indi-viduals
Age-groups Follow-up time
Intervention Primary outcome measures
Results Remarks Quality of study
Grünewald et al 1994 [76]
RCT, DB, PC, C–O
Com Refrac-tory partial seizures
Ns 45 15–61 68 w Vigabatrin 1.5 g twice daily, 20 weeks/ placebo
Measures for memory, concentration, mood behavior
Small but signi-ficant reduction in motor speed and design learning
High
AED = Astheno emotional disorder; Com = Community dwelling; C–O = Crossover; CRT = Choice reaction time; DB = Double-blind; N = Normal subjects; ns = Not stated; PC = Placebo-controlled; RCT = Randomised controlled trial

C H A P T E R 2 6 • D R U G - I N D U C E D C O G N I T I V E I M PA I R M E N T 457
Table 26.7 continued
Author Year Reference
Type of study
Setting Disease/ diagnosis
Severity No of indi-viduals
Age-groups Follow-up time
Intervention Primary outcome measures
Results Remarks Quality of study
Grünewald et al 1994 [76]
RCT, DB, PC, C–O
Com Refrac-tory partial seizures
Ns 45 15–61 68 w Vigabatrin 1.5 g twice daily, 20 weeks/ placebo
Measures for memory, concentration, mood behavior
Small but signi-ficant reduction in motor speed and design learning
High

D E M E N T I A – D I AG N O S T I C A N D T H E R A P E U T I C I N T E RV E N T I O N S458
Table 26.8 Opioids.
Author Year Reference
Type of study
Setting Disease/diagnosis
Severity No of individuals
Age- groups
Follow-up time
Intervention Primary outcome measures
Results Remarks Quality of study
Hanks et al 1995 [78]
RCT, DB, PC, C–O
Com N 12 30–47 6 h Morphine 10, 15 mg, po/lorazepam 1 mg, po/ placebo
CRT, memory scanning, picture recog-nition etc
Morphine (10, 15 mg) impaired word recall and picture recogni-tion. CRT impro-ved with 15 mg
High
O’Neill et al 2000 [79]
RCT, DB, PC, C–O
Com N 10 25–40 36 h Morphine 10 mg, po/ dextropro- poxiphene 100 mg, po/ lorazepam 1 mg, po/ placebo
CRT, memory scanning, picture recog-nition etc
No substantial effect of any opioid on cogni-tion, compared with lorazepam
High
Zacny et al 1994 [80]
RCT, DB, PC, C–O
Com N 12 21–33 5 h Morphine 0–10 mg/ 70 kg
Digit symbol substitution (DSST), reac-tion times
Morphine impaired DSST, mostly dose dependently
High
Walker et al 1999 [81]
RCT, DB, PC, C–O
Com N 16 21–32 7 h Morphine, meperidine, hydromor-phone, graded iv doses
DSST, logical reasoning
All three gave dose-dependent impairment of DSST, least with morphine
High
Saarialho-Kere et al 1989 [82]
RCT, DB, PC, C–O
Com N 9 20–26 4.5 h Oxycodone 0.13 mg/kg, im/diphenhy-dramine 100 mg, po/pla-cebo
DSST, reaction time, divided attention
Reaction time and attention transiently im- paired by oxy-codone
High
Moulin et al 1996 [83]
RCT, DB, PC, C–O
Com Chronic non-malig-nant pain
5/10 on VAS
46 22–67 22 w Morphine 60 mg twice a day/benz-tropine 1 mg twice a day
High sensiti-vity cognitive screen
No difference between mor-phine and pla-cebo
15 drop-outs
Moderate

C H A P T E R 2 6 • D R U G - I N D U C E D C O G N I T I V E I M PA I R M E N T 459
The table continues on the next page
Table 26.8 Opioids.
Author Year Reference
Type of study
Setting Disease/diagnosis
Severity No of individuals
Age- groups
Follow-up time
Intervention Primary outcome measures
Results Remarks Quality of study
Hanks et al 1995 [78]
RCT, DB, PC, C–O
Com N 12 30–47 6 h Morphine 10, 15 mg, po/lorazepam 1 mg, po/ placebo
CRT, memory scanning, picture recog-nition etc
Morphine (10, 15 mg) impaired word recall and picture recogni-tion. CRT impro-ved with 15 mg
High
O’Neill et al 2000 [79]
RCT, DB, PC, C–O
Com N 10 25–40 36 h Morphine 10 mg, po/ dextropro- poxiphene 100 mg, po/ lorazepam 1 mg, po/ placebo
CRT, memory scanning, picture recog-nition etc
No substantial effect of any opioid on cogni-tion, compared with lorazepam
High
Zacny et al 1994 [80]
RCT, DB, PC, C–O
Com N 12 21–33 5 h Morphine 0–10 mg/ 70 kg
Digit symbol substitution (DSST), reac-tion times
Morphine impaired DSST, mostly dose dependently
High
Walker et al 1999 [81]
RCT, DB, PC, C–O
Com N 16 21–32 7 h Morphine, meperidine, hydromor-phone, graded iv doses
DSST, logical reasoning
All three gave dose-dependent impairment of DSST, least with morphine
High
Saarialho-Kere et al 1989 [82]
RCT, DB, PC, C–O
Com N 9 20–26 4.5 h Oxycodone 0.13 mg/kg, im/diphenhy-dramine 100 mg, po/pla-cebo
DSST, reaction time, divided attention
Reaction time and attention transiently im- paired by oxy-codone
High
Moulin et al 1996 [83]
RCT, DB, PC, C–O
Com Chronic non-malig-nant pain
5/10 on VAS
46 22–67 22 w Morphine 60 mg twice a day/benz-tropine 1 mg twice a day
High sensiti-vity cognitive screen
No difference between mor-phine and pla-cebo
15 drop-outs
Moderate

D E M E N T I A – D I AG N O S T I C A N D T H E R A P E U T I C I N T E RV E N T I O N S460
Table 26.8 continued
Author Year Reference
Type of study
Setting Disease/diagnosis
Severity No of individuals
Age- groups
Follow-up time
Intervention Primary outcome measures
Results Remarks Quality of study
Banning et al 1992 [84]
Pro Ns Cancer pain
Ns 16 on opioids 16 controls
Ns Morphine 30–400 mg
Continuous reaction time
Prolongation in morphine group
Low
Sjögren et al 2000 [85]
Pro Ns Cancer pain
60–90/ 100 on VAS
130 40–76 7 h Morphine 20–420 mg
Continuous reaction time, finger tapping, paced auditory serial addition task
Long term opioid use per se did not influence test performance
Low
Schor et al 1992 [86]
Pro Ho 234 65+ 14 d – Instrument for detection of delirium
Delirium developed in 91 patients, narcotic use was one risk factor
Low
Egbert et al 1990 [87]
RCT Ho After major elective surgery
83 Mean 67 3 d Morphine intra muscular or in patient-con-trolled anal- gesia (PCA)
Postoperative confusion
Significant postoperative confusion in 18% of intra muscular and 2.3% of PCA treated
Moderate
CFF = Critical flicker fusion; Com = Community dwelling; C–O = Crossover; CRT = Choice reaction time; CS = Cross-sectional; DB = Double-blind; Ho = Hospital; N = Normal subjects; ns = Not stated; PC = Placebo-controlled; PCA = patient-controlled analgesia; Pro = Prospective study; RCT = Randomised controlled trial; VAS = Visual analogue scale

C H A P T E R 2 6 • D R U G - I N D U C E D C O G N I T I V E I M PA I R M E N T 461
Table 26.8 continued
Author Year Reference
Type of study
Setting Disease/diagnosis
Severity No of individuals
Age- groups
Follow-up time
Intervention Primary outcome measures
Results Remarks Quality of study
Banning et al 1992 [84]
Pro Ns Cancer pain
Ns 16 on opioids 16 controls
Ns Morphine 30–400 mg
Continuous reaction time
Prolongation in morphine group
Low
Sjögren et al 2000 [85]
Pro Ns Cancer pain
60–90/ 100 on VAS
130 40–76 7 h Morphine 20–420 mg
Continuous reaction time, finger tapping, paced auditory serial addition task
Long term opioid use per se did not influence test performance
Low
Schor et al 1992 [86]
Pro Ho 234 65+ 14 d – Instrument for detection of delirium
Delirium developed in 91 patients, narcotic use was one risk factor
Low
Egbert et al 1990 [87]
RCT Ho After major elective surgery
83 Mean 67 3 d Morphine intra muscular or in patient-con-trolled anal- gesia (PCA)
Postoperative confusion
Significant postoperative confusion in 18% of intra muscular and 2.3% of PCA treated
Moderate

D E M E N T I A – D I AG N O S T I C A N D T H E R A P E U T I C I N T E RV E N T I O N S462
Table 26.9 Non-steroidal anti-inflammatory drug (NSAID).
Author Year, reference
Type of study
Setting Disease/ diagnosis
Severity No of individuals
Age- groups
Follow-up time
Inter- vention
Primary outcome measures
Results Remarks Quality of study
Hanlon et al 1997 [89]
Pro, Co Com N (cogniti-vely intact at baseline)
– 2 765 Ns 3 y – Short portable mental status questionnaire
Moderate or high NSAID doses significantly worse in memory tests
NSAID use and cognitive mea-sures assessed concomitantly
Low
Saag et al 1995 [90]
Pro, Co Com N (cogniti-vely intact at baseline)
– 2 087 67–97 4 y – Immediate word recall
High dose NSAID associated with decline in word recall
NSAID use and cognitive mea-sures assessed concomitantly
Low
Wysenbeek et al 1988 [88]
Pro Com Osteo-arthritis
Ns 12 Mean 70.1 3 w Naproxen 750 mg/d
WAIS, Bender Gestalt test
Four subjects dete-riorated in one test and one of them in two
Small sample, non-controlled
Low
May et al 1992 [91]
Pro, Co Com Miscell-aneous
– 1 310 – – MMSE No effect of NSAID or aspirin use on MMSE score or in the five dimensions of cognition
Low
Bruce-Jones et al 1994 [92]
RCT, DB, PC, C–O
Com N – 20 55–65 65+
7 d Indome-thacin 75 mg/ d/placebo
Test bat-tery of arousal, attention, integration, coordination, memory and mood
No effect on atten-tion and psychomo-tor speed. Signs of improvement of sen-sorimotor coordina-tion and short-term memory
Moderate
Com = Community dwelling; C–O = Crossover; Co = Cohort study; CRT = Choice reac-tion time; CS = Cross-sectional; DB = Double-blind; MMSE = Mini-mental state examina-tion; N = Normal subjects; ns = Not stated; NSAID = Non-steroidal anti-inflammatory drug; PC = Placebo-controlled; PCA = patient-controlled analgesia; Pro = Prospective study; RCT = Randomised controlled trial; VAS = Visual analogue scale; WAIS = Wechsler adult intelligence scale

C H A P T E R 2 6 • D R U G - I N D U C E D C O G N I T I V E I M PA I R M E N T 463
Table 26.9 Non-steroidal anti-inflammatory drug (NSAID).
Author Year, reference
Type of study
Setting Disease/ diagnosis
Severity No of individuals
Age- groups
Follow-up time
Inter- vention
Primary outcome measures
Results Remarks Quality of study
Hanlon et al 1997 [89]
Pro, Co Com N (cogniti-vely intact at baseline)
– 2 765 Ns 3 y – Short portable mental status questionnaire
Moderate or high NSAID doses significantly worse in memory tests
NSAID use and cognitive mea-sures assessed concomitantly
Low
Saag et al 1995 [90]
Pro, Co Com N (cogniti-vely intact at baseline)
– 2 087 67–97 4 y – Immediate word recall
High dose NSAID associated with decline in word recall
NSAID use and cognitive mea-sures assessed concomitantly
Low
Wysenbeek et al 1988 [88]
Pro Com Osteo-arthritis
Ns 12 Mean 70.1 3 w Naproxen 750 mg/d
WAIS, Bender Gestalt test
Four subjects dete-riorated in one test and one of them in two
Small sample, non-controlled
Low
May et al 1992 [91]
Pro, Co Com Miscell-aneous
– 1 310 – – MMSE No effect of NSAID or aspirin use on MMSE score or in the five dimensions of cognition
Low
Bruce-Jones et al 1994 [92]
RCT, DB, PC, C–O
Com N – 20 55–65 65+
7 d Indome-thacin 75 mg/ d/placebo
Test bat-tery of arousal, attention, integration, coordination, memory and mood
No effect on atten-tion and psychomo-tor speed. Signs of improvement of sen-sorimotor coordina-tion and short-term memory
Moderate

D E M E N T I A – D I AG N O S T I C A N D T H E R A P E U T I C I N T E RV E N T I O N S464
Table 26.10 Corticosteroides.
Author Year Reference
Type of study
Setting Disease diagnosis
Severity No of individuals
Age- groups
Follow-up time
Intervention Primary outcome measures
Results Quality of study
Newcomer et al 1994 [96]
RCT, DB, PC
Com N – 19 Mean 38.3 11 d Dexamethasone 0.5, 1, 1, 1 mg/ placebo, for 4 days
Verbal declarative memory perfor-mance, attention, vigilance and visuoperceptual function
Impairment of verbal declarative memory performance (para- graph recall test) in dexamethasone treated
High
Kirschbaum et al 1996 [99]
RCT, PC Com N – 40 Mean 24.7 30 min Hydrocortisone 10 mg/placebo
Procedural, decla-rative memory and spatial thinking
Impairment of declara- tive memory and spatial thinking in cortisol trea-ted
High
Newcomer et al 1999 [97]
RCT, DB, PC
Com N – 51 18–30 6 d Cortisol 40, 160 mg/ placebo for 4 days
Paragraph recall, Stroop CW test, verbal fluency etc
Impairment of verbal declarative memory with higher cortisol dose
High
Schmidt et al 1999 [98]
RCT, DB, PC
Com N – 24 18–38 8 d Prednisone 160 mg/placebo for 4 days
EEG, mood rating, attention task, memory recall
Greater increase in negative emotion, recalled fewer objects, greater frontal EEG alpha act
High
Young et al 1999 [101]
RCT, DB, PC, C–O
Com N – 20 21–44 4 w Hydrocortisone twice daily for 10 days/placebo
Cambridge Neu-ropsychological Test Automated Battery
Impairments of visuo- spatial memory and paired associate learning subtest
High
de Quervain et al 2000 [95]
RCT, DB, PC, C–O
Com N – 36 20–40 1 h Cortisone 25 mg/placebo
Free recall test and recognition test
Impaired free recall but not recognition
High
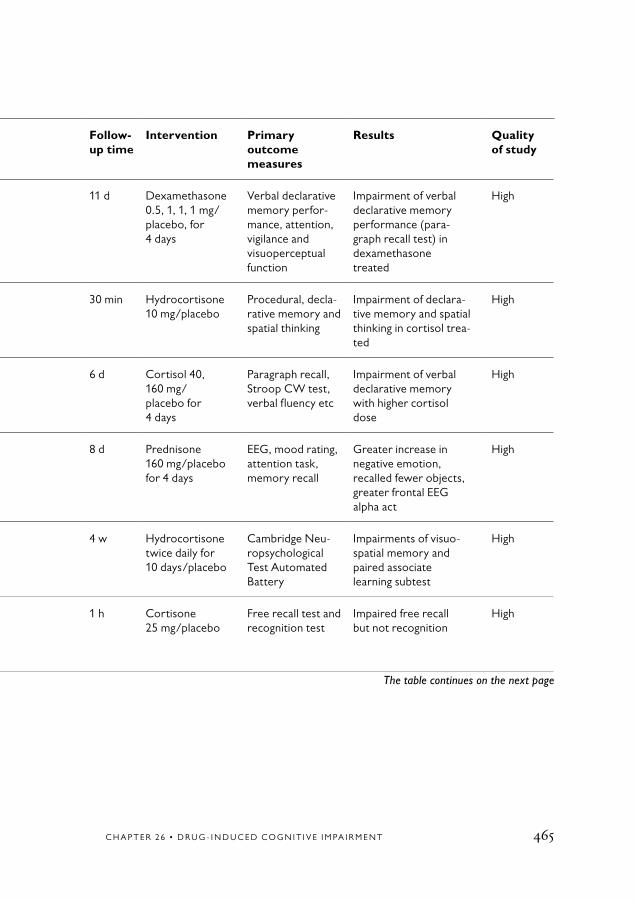
C H A P T E R 2 6 • D R U G - I N D U C E D C O G N I T I V E I M PA I R M E N T 465
The table continues on the next page
Table 26.10 Corticosteroides.
Author Year Reference
Type of study
Setting Disease diagnosis
Severity No of individuals
Age- groups
Follow-up time
Intervention Primary outcome measures
Results Quality of study
Newcomer et al 1994 [96]
RCT, DB, PC
Com N – 19 Mean 38.3 11 d Dexamethasone 0.5, 1, 1, 1 mg/ placebo, for 4 days
Verbal declarative memory perfor-mance, attention, vigilance and visuoperceptual function
Impairment of verbal declarative memory performance (para- graph recall test) in dexamethasone treated
High
Kirschbaum et al 1996 [99]
RCT, PC Com N – 40 Mean 24.7 30 min Hydrocortisone 10 mg/placebo
Procedural, decla-rative memory and spatial thinking
Impairment of declara- tive memory and spatial thinking in cortisol trea-ted
High
Newcomer et al 1999 [97]
RCT, DB, PC
Com N – 51 18–30 6 d Cortisol 40, 160 mg/ placebo for 4 days
Paragraph recall, Stroop CW test, verbal fluency etc
Impairment of verbal declarative memory with higher cortisol dose
High
Schmidt et al 1999 [98]
RCT, DB, PC
Com N – 24 18–38 8 d Prednisone 160 mg/placebo for 4 days
EEG, mood rating, attention task, memory recall
Greater increase in negative emotion, recalled fewer objects, greater frontal EEG alpha act
High
Young et al 1999 [101]
RCT, DB, PC, C–O
Com N – 20 21–44 4 w Hydrocortisone twice daily for 10 days/placebo
Cambridge Neu-ropsychological Test Automated Battery
Impairments of visuo- spatial memory and paired associate learning subtest
High
de Quervain et al 2000 [95]
RCT, DB, PC, C–O
Com N – 36 20–40 1 h Cortisone 25 mg/placebo
Free recall test and recognition test
Impaired free recall but not recognition
High

D E M E N T I A – D I AG N O S T I C A N D T H E R A P E U T I C I N T E RV E N T I O N S466
Table 26.10 continued
Author Year Reference
Type of study
Setting Disease diagnosis
Severity No of individuals
Age- groups
Follow-up time
Intervention Primary outcome measures
Results Quality of study
TBCDS 1972 [94]
Pro Com – – 700 – – – Significantly more psy-chiatric disturbances in prednisolone treated
Low
Com = Community dwelling; C–O = Crossover; Co = Cohort study; CRT = Choice reac-tion time; CS = Cross-sectional; DB = Double-blind; MMSE = Mini-mental state examina-tion; N = Normal subjects; ns = Not stated; NSAID = Non-steroidal anti-inflammatory drug; PC = Placebo-controlled; PCA = patient-controlled analgesia; Pro = Prospective study; RCT = Randomised controlled trial; VAS = Visual analogue scale; WAIS = Wechsler adult intelligence scale

C H A P T E R 2 6 • D R U G - I N D U C E D C O G N I T I V E I M PA I R M E N T 467
Table 26.10 continued
Author Year Reference
Type of study
Setting Disease diagnosis
Severity No of individuals
Age- groups
Follow-up time
Intervention Primary outcome measures
Results Quality of study
TBCDS 1972 [94]
Pro Com – – 700 – – – Significantly more psy-chiatric disturbances in prednisolone treated
Low

D E M E N T I A – D I AG N O S T I C A N D T H E R A P E U T I C I N T E RV E N T I O N S468
Table 26.11 Anti-ulcer agents.
Author Year Reference
Type of study
Setting Disease/diagnosis
Severity No of individuals
Age- groups
Follow-up time
Intervention Primary outcome measures
Results Quality of study
Oslin et al1999 [107]
RCT, DB, PC, C–O
Com N – 12 Mean 71.2 2.5 h Cimetidine 400–1 600 mg in increasing doses/placebo
Cognitive test battery
No observable decrements
Moderate
Slugg et al1992 [109]
Pro Ho Various medical and surgical
– 41 using ranitidine
Mean 62.4 68.4
ns – CNS-ADR evaluated by Naranjo rating system
Confusion, disorientation etc more frequent in renal impairment and higher plasma levels
Low
CNS–ADR = Central nervous system-adverse drug reactions; C-O = Crossover; Com = Community dwelling; DB = Double-blind; Ho = Hospital; ns = Not stated; PC = Placebo-controlled; Pro = Prospective study; RCT = Randomised controlled trial

C H A P T E R 2 6 • D R U G - I N D U C E D C O G N I T I V E I M PA I R M E N T 469
Table 26.11 Anti-ulcer agents.
Author Year Reference
Type of study
Setting Disease/diagnosis
Severity No of individuals
Age- groups
Follow-up time
Intervention Primary outcome measures
Results Quality of study
Oslin et al1999 [107]
RCT, DB, PC, C–O
Com N – 12 Mean 71.2 2.5 h Cimetidine 400–1 600 mg in increasing doses/placebo
Cognitive test battery
No observable decrements
Moderate
Slugg et al1992 [109]
Pro Ho Various medical and surgical
– 41 using ranitidine
Mean 62.4 68.4
ns – CNS-ADR evaluated by Naranjo rating system
Confusion, disorientation etc more frequent in renal impairment and higher plasma levels
Low

D E M E N T I A – D I AG N O S T I C A N D T H E R A P E U T I C I N T E RV E N T I O N S470
Table 26.12 Beta-receptor blocking agents.
Author Year Reference
Type of study
Setting Disease/ diagnosis
Severity No of individuals
Age- groups
Follow-up time
Intervention Primary outcome measures
Results Quality of study
Perez-Stable et al 2000 [121]
RCT, DB, PC
Com Hyper- tension
– 312 22–59 12 m Propranolol 80–400 mg/ d/placebo
Cognitive test battery with digital symbol substitution Californian verbal learning test etc
No significant difference in 11 out of 13 tests
High
Muldoon et al 2002 [122]
RCT, DB, PC, C–O
Com Hyperten-sion + nor-motensive
– 98 + 32 25–55 8 w Atenolol, metoprolol, hydrochlorothi-azide, methyl-dopa, enalapril and verapamil
In-depth neu-ropsychological assessments
Reduction of simple motor speed slowed completion of two tests measuring perceptuo-motor speed and mental flexibility. Favorably affected performance on several tests requiring working memory
High
C-O = Crossover; Com = Community dwelling; DB = Double-blind; PC = Placebo- controlled; RCT = Randomised controlled trial

C H A P T E R 2 6 • D R U G - I N D U C E D C O G N I T I V E I M PA I R M E N T 471
Table 26.12 Beta-receptor blocking agents.
Author Year Reference
Type of study
Setting Disease/ diagnosis
Severity No of individuals
Age- groups
Follow-up time
Intervention Primary outcome measures
Results Quality of study
Perez-Stable et al 2000 [121]
RCT, DB, PC
Com Hyper- tension
– 312 22–59 12 m Propranolol 80–400 mg/ d/placebo
Cognitive test battery with digital symbol substitution Californian verbal learning test etc
No significant difference in 11 out of 13 tests
High
Muldoon et al 2002 [122]
RCT, DB, PC, C–O
Com Hyperten-sion + nor-motensive
– 98 + 32 25–55 8 w Atenolol, metoprolol, hydrochlorothi-azide, methyl-dopa, enalapril and verapamil
In-depth neu-ropsychological assessments
Reduction of simple motor speed slowed completion of two tests measuring perceptuo-motor speed and mental flexibility. Favorably affected performance on several tests requiring working memory
High

D E M E N T I A – D I AG N O S T I C A N D T H E R A P E U T I C I N T E RV E N T I O N S472
1. Moore AR, O’Keeffe ST. Drug-induced cognitive impairment in the elderly. Drugs Aging 1999;15:15-28.
2. Larson EB, Kukull WA, Buchner D, Reifler BV. Adverse drug reactions associ-ated with global cognitive impairment in elderly persons. Ann Intern Med 1987; 107:169-73.
3. Katz IR, Parmelee P, Brubaker K. Toxic and metabolic encephalopathies in long-term care patients. Int Psychogeriatr 1991;3:337-47.
4. Starr JM, Whalley LJ. Drug-induced dementia. Incidence, management and prevention. Drug Saf 1994;11:310-7.
5. Zemishlany Z, Thorne AE. Anticholi-nergic challenge and cognitive functions: a comparison between young and elderly normal subjects. Isr J Psychiatry Relat Sci 1991;28:32-41.
6. Flicker C, Ferris SH, Serby M. Hyper-sensitivity to scopolamine in the elderly. Psychopharmacology (Berl) 1992;107: 437-41.
7. Sunderland T, Tariot PN, Cohen RM, Weingartner H, Mueller EA, 3rd, Murphy DL. Anticholinergic sensitivity in patients with dementia of the Alzheimer type and age-matched controls. A dose-response study. Arch Gen Psychiatry 1987;44:418-26.
8. Tune LE, Damlouji NF, Holland A, Gardner TJ, Folstein MF, Coyle JT. As-sociation of postoperative delirium with raised serum levels of anticholinergic drugs. Lancet 1981;2:651-3.
9. Miller PS, Richardson JS, Jyu CA, Lemay JS, Hiscock M, Keegan DL. As-sociation of low serum anticholinergic levels and cognitive impairment in elderly presurgical patients. Am J Psychiatry 1988;145:342-5.
10. Rovner BW, David A, Lucas- Blaustein MJ, Conklin B, Filipp L, Tune L. Self-care capacity and anti- cholinergic drug levels in nursing home patients. Am J Psychiatry 1988; 145:107-9.
11. Hanlon JT, Horner RD, Schmader KE, Fillenbaum GG, Lewis IK, Wall WE, Jr, et al. Benzodiazepine use and cognitive function among community-dwelling elderly. Clin Pharmacol Ther 1998; 64: 684-92.
12. Greenblatt DJ, Allen MD. Toxicity of nitrazepam in the elderly: a report from the Boston Collaborative Drug Surveil-lance Program. Br J Clin Pharmacol 1978;5:407-13.
13. Greenblatt DJ, Allen MD, Shader RI. Toxicity of high-dose flurazepam in the elderly. Clin Pharmacol Ther 1977;21: 355-61.
14. Pomara N, Stanley B, Block R, Guido J, Russ D, Berchou R, et al. Adverse effects of single therapeutic doses of diazepam on performance in normal geriatric subjects: relationship to plasma concentrations. Psychopharmacology (Berl) 1984;84: 342-6.
15. Pomara N, Stanley B, Block R, Guido J, Stanley M, Greenblatt DJ, et al. Dia-zepam impairs performance in normal
References

C H A P T E R 2 6 • D R U G - I N D U C E D C O G N I T I V E I M PA I R M E N T 473
elderly subjects. Psychopharmacol Bull 1984;20:137-9.
16. Hinrichs JV, Ghoneim MM. Dia-zepam, behavior, and aging: increased sensitivity or lower baseline perform- ance? Psychopharmacology (Berl) 1987; 92:100-5.
17. Patterson JF. Triazolam syndrome in the elderly. South Med J 1987;80:1425-6.
18. Barker MJ, Greenwood KM, Jackson M, Crowe SF. Cognitive effects of long-term benzodiazepine use: a meta-analysis. CNS Drugs 2004;18:37-48.
19. Fairweather DB, Kerr JS, Hindmarch I. The effects of acute and repeated doses of zolpidem on subjective sleep, psychomo-tor performance and cognitive function in elderly volunteers. Eur J Clin Pharmacol 1992;43:597-601.
20. Hemmeter U, Muller M, Bischof R, Annen B, Holsboer-Trachsler E. Effect of zopiclone and temazepam on sleep EEG parameters, psychomotor and memory functions in healthy elderly volunteers. Psychopharmacology (Berl) 2000;147: 384-96.
21. Allain H, Tessier C, Bentue-Ferrer D, Tarral A, Le Breton S, Gandon M, et al. Effects of risperidone on psychometric and cognitive functions in healthy elderly volunteers. Psychopharmacology (Berl) 2003;165:419-29.
22. Hill KP, Oberstar JV, Dunn ER. Zolpidem-induced delirium with mania in an elderly woman. Psychosomatics 2004;45:88-9.
23. Brodeur MR, Stirling AL. Deli- rium associated with zolpidem. Ann Pharmacother 2001;35:1562-4.
24. Freudenreich O, Menza M. Zolpi- dem-related delirium: a case report. J Clin Psychiatry 2000;61:449-50.
25. Steele C, Lucas MJ, Tune L. Haloperi-dol versus thioridazine in the treatment of behavioral symptoms in senile dementia of the Alzheimer’s type: preliminary findings. J Clin Psychiatry 1986;47:310-2.
26. Devanand DP, Sackeim HA, Brown RP, Mayeux R. A pilot study of haloperi-dol treatment of psychosis and behavioral disturbance in Alzheimer’s disease. Arch Neurol 1989;46:854-7.
27. Devanand DP, Marder K, Michaels KS, Sackeim HA, Bell K, Sullivan MA, et al. A randomised, placebo-controlled dose-comparison trial of haloperidol for psycho-sis and disruptive behaviors in Alzheimer’s disease. Am J Psychiatry 1998;155:1512-20.
28. Legangneux E, McEwen J, Wesnes KA, Bergougnan L, Miget N, Canal M, et al. The acute effects of amisulpride (50 mg and 200 mg) and haloperidol (2 mg) on cognitive function in healthy elderly volunteers. J Psychopharmacol 2000;14:164-71.
29. Katz IR, Jeste DV, Mintzer JE, Clyde C, Napolitano J, Brecher M. Comparison of risperidone and placebo for psychosis and behavioral disturbances associated with dementia: a randomised, double- blind trial. Risperidone Study Group. J Clin Psychiatry 1999;60:107-15.

D E M E N T I A – D I AG N O S T I C A N D T H E R A P E U T I C I N T E RV E N T I O N S474
30. De Deyn PP, Rabheru K, Rasmussen A, Bocksberger JP, Dautzenberg PL, Eriksson S, et al. A randomised trial of risperidone, placebo, and haloperidol for behavioral symptoms of dementia. Neurology 1999;53:946-55.
31. Street JS, Clark WS, Gannon KS, Cummings JL, Bymaster FP, Tamura RN, et al. Olanzapine treatment of psychotic and behavioral symptoms in patients with Alzheimer disease in nursing care facilities: a double-blind, randomised, placebo-controlled trial. The HGEU Study Group. Arch Gen Psychiatry 2000; 57:968-76.
32. Sajatovic M, Perez D, Brescan D, Ramirez LF. Olanzapine therapy in elderly patients with schizophrenia. Psychopharmacol Bull 1998;34:819-23.
33. Beuzen JN, Taylor N, Wesnes K, Wood A. A comparison of the effects of olanzapine, haloperidol and pla- cebo on cognitive and psychomotor functions in healthy elderly volunteers. J Psychopharmacol 1999;13:152-8.
34. Ravona-Springer R, Dolberg OT, Hirschmann S, Grunhaus L. Delirium in elderly patients treated with risperi- done: a report of three cases. J Clin Psychopharmacol 1998;18:171-2.
35. Tavcar R, Dernovsek MZ. Risperi-done-induced delirium. Can J Psychiatry 1998;43:194.
36. Morikawa M, Kishimoto T. Probable dementia with Lewy bodies and risperi-done-induced delirium. Can J Psychiatry 2002;47:976.
37. Samuels S, Fang M. Olanzapine may cause delirium in geriatric patients. J Clin Psychiatry 2004;65:582-3.
38. Schuster P, Gabriel E, Kufferle B, Strobl G, Karobath M. Reversal by physo-stigmine of clozapine-induced delirium. Clin Toxicol 1977;10:437-41.
39. Centorrino F, Albert MJ, Drago- Ferrante G, Koukopoulos AE, Berry JM, Baldessarini RJ. Delirium during cloza- pine treatment: incidence and associated risk factors. Pharmacopsychiatry 2003; 36:156-60.
40. Jackson CW, Markowitz JS, Brewerton TD. Delirium associated with clozapine and benzodiazepine combinations. Ann Clin Psychiatry 1995;7:139-41.
41. McShane R, Keene J, Gedling K, Fairburn C, Jacoby R, Hope T. Do neuro- leptic drugs hasten cognitive decline in de- mentia? Prospective study with necropsy follow up. BMJ 1997;314:266-70.
42. DePaulo JR, Jr., Folstein MF, Correa EI. The course of delirium due to lithium intoxication. J Clin Psychiatry 1982;43:447-9.
43. Bartha L, Marksteiner J, Bauer G, Benke T. Persistent cognitive deficits asso-ciated with lithium intoxication: a neuro-psychological case description. Cortex 2002;38:743-52.
44. Honig A, Arts BM, Ponds RW, Riedel WJ. Lithium induced cognitive side-effects in bipolar disorder: a qualitative analysis and implications for daily practice. Int Clin Psychopharmacol 1999;14:167-71.

C H A P T E R 2 6 • D R U G - I N D U C E D C O G N I T I V E I M PA I R M E N T 475
45. Branconnier RJ, DeVitt DR, Cole JO, Spera KF. Amitriptyline selectively disrupts verbal recall from secondary memory of the normal aged. Neurobiol Aging 1982;3: 55-9.
46. Moskowitz H, Burns MM. Cognitive performance in geriatric subjects after acute treatment with antidepressants. Neuropsychobiology 1986;15 Suppl 1: 38-43.
47. Ogura C, Kishimoto A, Mizukawa R, Kunimoto N, Hazama H, Ryoke K, et al. Influence of single doses of dothiepin and amitriptyline on physiological meas-ures and psychomotor performance in normal young and elderly volunteers. Neuropsychobiology 1983;10:103-7.
48. Ghose K, Sedman E. A double-blind comparison of the pharmacodynamic ef- fects of single doses of lofepramine, ami- triptyline and placebo in elderly subjects. Eur J Clin Pharmacol 1987;33:505-9.
49. Marcopulos BA, Graves RE. Anti-depressant effect on memory in depressed older persons. J Clin Exp Neuropsychol 1990;12:655-63.
50. Kerr JS, Fairweather DB, Hindmarch I. Effects of fluoxetine on psychomotor performance, cognitive function and sleep in depressed patients. Int Clin Psychopharmacol 1993;8:341-3.
51. Legg JF, Stiff MP. Drug-related test patterns of depressed patients. Psychopharmacology (Berl) 1976;50: 205-10.
52. Glass RM, Uhlenhuth EH, Hartel FW, Matuzas W, Fischman MW. Cognitive dysfunction and imipramine in outpa-
tient depressive. Arch Gen Psychiatry 1981;38:1048-51.
53. Siegfried K, O’Connolly M. Cogni-tive and psychomotor effects of different antidepressants in the treatment of old age depression. Int Clin Psychopharmacol 1986;1:231-43.
54. Georgotas A, McCue RE, Reisberg B, Ferris SH, Nagachandran N, Chang I, et al. The effects of mood changes and antidepressants on the cognitive capacity of elderly depressed patients. Int Psychogeriatr 1989;1:135-43.
55. Young RC, Mattis S, Alexopoulos GS, Meyers BS, Shindledecker RD, Dhar AK. Verbal memory and plasma drug con-centrations in elderly depressives treated with nortriptyline. Psychopharmacol Bull 1991;27:291-4.
56. Hindmarch I, Shillingford J, Shillingford C. The effects of sertraline on psychomotor performance in elderly volunteers. J Clin Psychiatry 1990;51 Suppl B:34-6.
57. Branconnier RJ, Cole JO, Ghazvinian S, Rosenthal S. Treating the depressed elderly patient: the compa- rative behavioral pharmacology of mian-serin and amitriptyline. Adv Biochem Psychopharmacol 1982;32:195-212.
58. Bailer U, Fischer P, Kufferle B, Stastny J, Kasper S. Occurrence of mirtazapine-induced delirium in organic brain disorder. Int Clin Psychopharmacol 2000;15:239-43.
59. McEvoy JP, McCue M, Spring B, Mohs RC, Lavori PW, Farr RM. Effects of aman-tadine and trihexyphenidyl on memory in

D E M E N T I A – D I AG N O S T I C A N D T H E R A P E U T I C I N T E RV E N T I O N S476
elderly normal volunteers. Am J Psychiatry 1987;144:573-7.
60. Van Spaendonck KP, Berger HJ, Horstink MW, Buytenhuijs EL, Cools AR. Impaired cognitive shifting in parkinso-nian patients on anticholinergic therapy. Neuropsychologia 1993;31:407-11.
61. Meco G, Casacchia M, Lazzari R, Franzese A, Castellana F, Carta A, et al. Mental impairment in Parkinson’s disease. The role of anticholinergic drugs. Acta Psychiatr Belg 1984;84:325-35.
62. Growdon JH, Kieburtz K, McDermott MP, Panisset M, Friedman JH. Levodopa improves motor function without impair-ing cognition in mild non-demented Par-kinson’s disease patients. Parkinson Study Group. Neurology 1998;50:1327-31.
63. Müller T, Benz S, Bornke C. Delay of simple reaction time after levodopa intake. Clin Neurophysiol 2001;112:2133-7.
64. Goetz CG, Leurgans S, Pappert EJ, Raman R, Stemer AB. Prospective longitudinal assessment of hallucina-tions in Parkinson’s disease. Neurology 2001;57:2078-82.
65. Bush DF, Liss CL, Morton A. An open multicenter long-term treatment evaluation of Sinemet CR. Sinemet CR Multicenter Study Group. Neurology 1989;39(11 Suppl 2):101-4; discussion 105.
66. Serby M, Angrist B, Lieberman A. Psychiatric effects of bromocriptine and lergotrile in Parkinsonian patients. Adv Biochem Psychopharmacol 1980;23: 287-92.
67. Portin R, Rinne UK. The effect of deprenyl (selegiline) on cognition and
emotion in parkinsonian patients under- going long-term levodopa treatment. Acta Neurol Scand Suppl 1983;95:135-44.
68. Hindmarch I, Shamsi Z. Antihista-mines: models to assess sedative properties, assessment of sedation, safety and other side-effects. Clin Exp Allergy 1999;29 Suppl 3:133-42.
69. Devinsky O. Cognitive and behavioral effects of antiepileptic drugs. Epilepsia 1995;36 Suppl 2:S46-65.
70. Smith DB, Mattson RH, Cramer JA, Collins JF, Novelly RA, Craft B. Results of a nationwide Veterans Administration Cooperative Study comparing the efficacy and toxicity of carbamazepine, phenobar-bital, phenytoin, and primidone. Epilepsia 1987;28 Suppl 3:S50-8.
71. Meador KJ, Loring DW, Allen ME, Zamrini EY, Moore EE, Abney OL, et al. Comparative cognitive effects of carbamazepine and phenytoin in healthy adults. Neurology 1991;41:1537-40.
72. Dodrill CB, Troupin AS. Neuropsy-chological effects of carbamazepine and phenytoin: a reanalysis. Neurology 1991;41:141-3.
73. Meador KJ, Loring DW, Huh K, Gallagher BB, King DW. Comparative cognitive effects of anticonvulsants. Neurology 1990;40(3 Pt 1):391-4.
74. Meador KJ, Loring DW, Moore EE, Thompson WO, Nichols ME, Oberzan RE, et al. Comparative cognitive effects of phenobarbital, phenytoin, and valproate in healthy adults. Neurology 1995;45:1494-9.
75. Gillham RA, Blacklaw J, McKee PJ, Brodie MJ. Effect of vigabatrin on sedation

C H A P T E R 2 6 • D R U G - I N D U C E D C O G N I T I V E I M PA I R M E N T 477
and cognitive function in patients with refractory epilepsy. J Neurol Neurosurg Psychiatry 1993;56:1271-5.
76. Grünewald RA, Thompson PJ, Corcoran R, Corden Z, Jackson GD, Duncan JS. Effects of vigabatrin on partial seizures and cognitive function J Neurol Neurosurg Psychiatry 1994; 57:1057-63.
77. Lawlor PG. The panorama of opioid-related cognitive dysfunction in patients with cancer: a critical literature appraisal. Cancer 2002;94:1836-53.
78. Hanks GW, O’Neill WM, Simpson P, Wesnes K. The cognitive and psycho-motor effects of opioid analgesics. II. A randomised controlled trial of single doses of morphine, lorazepam and placebo in healthy subjects. Eur J Clin Pharmacol 1995;48:455-60.
79. O’Neill WM, Hanks GW, Simpson P, Fallon MT, Jenkins E, Wesnes K. The cognitive and psychomotor effects of mor- phine in healthy subjects: a randomised controlled trial of repeated (four) oral doses of dextropropoxyphene, morphine, lorazepam and placebo. Pain 2000;85: 209-15.
80. Zacny JP, Lichtor JL, Flemming D, Coalson DW, Thompson WK. A dose- response analysis of the subjective, psycho- motor and physiological effects of intra- venous morphine in healthy volunteers. J Pharmacol Exp Ther 1994;268:1-9.
81. Walker DJ, Zacny JP. Subjective, psychomotor, and physiological effects of cumulative doses of opioid mu agonists in healthy volunteers. J Pharmacol Exp Ther 1999;289:1454-64.
82. Saarialho-Kere U, Mattila MJ, Seppala T. Psychomotor, respiratory and neuroendocrinological effects of a mu-opioid receptor agonist (oxycodone) in healthy volunteers. Pharmacol Toxicol 1989;65:252-7.
83. Moulin DE, Iezzi A, Amireh R, Sharpe WK, Boyd D, Merskey H. Randomised trial of oral morphine for chronic non- cancer pain. Lancet 1996;347:143-7.
84. Banning A, Sjogren P, Kaiser F. Reaction time in cancer patients re- ceiving peripherally acting analgesics alone or in combination with opioids. Acta Anaesthesiol Scand 1992;36:480-2.
85. Sjögren P, Olsen AK, Thomsen AB, Dalberg J. Neuropsychological perform-ance in cancer patients: the role of oral opioids, pain and performance status. Pain 2000;86:237-45.
86. Schor JD, Levkoff SE, Lipsitz LA, Reilly CH, Cleary PD, Rowe JW, et al. Risk factors for delirium in hospitalized elderly. JAMA 1992;267:827-31.
87. Egbert AM, Parks LH, Short LM, Burnett ML. Randomised trial of postop-erative patient-controlled analgesia vs in-tramuscular narcotics in frail elderly men. Arch Intern Med 1990;150:1897-903.
88. Wysenbeek AJ, Klein Z, Nakar S, Mane R. Assessment of cognitive function in elderly patients treated with naproxen. A prospective study. Clin Exp Rheumatol 1988;6:399-400.
89. Hanlon JT, Schmader KE, Landerman LR, Horner RD, Fillenbaum GG, Pieper CF, et al. Relation of prescription nonster-oidal antiinflammatory drug use to cogni-

D E M E N T I A – D I AG N O S T I C A N D T H E R A P E U T I C I N T E RV E N T I O N S478
tive function among community-dwelling elderly. Ann Epidemiol 1997;7:87-94.
90. Saag KG, Rubenstein LM, Chrischilles EA, Wallace RB. Nonsteroidal antiinflam-matory drugs and cognitive decline in the elderly. J Rheumatol 1995;22:2142-7.
91. May FE, Moore MT, Stewart RB, Hale WE. Lack of association of non- steroidal anti-inflammatory drug use and cognitive decline in the elderly. Gerontology 1992;38:275-9.
92. Bruce-Jones PN, Crome P, Kalra L. Indomethacin and cognitive function in healthy elderly volunteers. Br J Clin Pharmacol 1994;38:45-51.
93. Belanoff JK, Gross K, Yager A, Schatzberg AF. Corticosteroids and cognition. J Psychiatr Res 2001;35: 127-45.
94. Program TBCDS. Acute adverse reactions to prednisone in relation to dosage. Clin Pharmacol Ther 1972;13: 694-8.
95. de Quervain DJ, Roozendaal B, Nitsch RM, McGaugh JL, Hock C. Acute cortisone administration impairs retrieval of long-term declarative memory in humans. Nat Neurosci 2000;3:313-4.
96. Newcomer JW, Craft S, Hershey T, Askins K, Bardgett ME. Glucocorticoid-induced impairment in declarative memory performance in adult humans. J Neurosci 1994;14:2047-53.
97. Newcomer JW, Selke G, Melson AK, Hershey T, Craft S, Richards K, et al. Decreased memory performance in healthy humans induced by stress-level
cortisol treatment. Arch Gen Psychiatry 1999;56:527-33.
98. Schmidt LA, Fox NA, Goldberg MC, Smith CC, Schulkin J. Effects of acute prednisone administration on memory, attention and emotion in healthy human adults. Psychoneuroendocrinology 1999; 24:461-83.
99. Kirschbaum C, Wolf OT, May M, Wippich W, Hellhammer DH. Stress- and treatment-induced elevations of cortisol levels associated with impaired declarative memory in healthy adults. Life Sci 1996;58:1475-83.
100. Wolkowitz OM, Reus VI, Weingartner H, Thompson K, Breier A, Doran A, et al. Cognitive effects of corti-costeroids. Am J Psychiatry 1990;147: 1297-303.
101. Young AH, Sahakian BJ, Robbins TW, Cowen PJ. The effects of chronic administration of hydrocortisone on cog-nitive function in normal male volunteers. Psychopharmacology (Berl) 1999;145: 260-6.
102. Hall RC, Popkin MK, Stickney SK, Gardner ER. Presentation of the steroid psychoses. J Nerv Ment Dis 1979;167: 229-36.
103. Keenan PA, Jacobson MW, Soleymani RM, Newcomer JW. Com-monly used therapeutic doses of gluco-corticoids impair explicit memory. Ann N Y Acad Sci 1995;761:400-2.
104. Varney NR, Alexander B, MacIndoe JH. Reversible steroid dementia in patients without steroid psychosis. Am J Psychiatry 1984;141:369-72.

C H A P T E R 2 6 • D R U G - I N D U C E D C O G N I T I V E I M PA I R M E N T 479
105. Cantu TG, Korek JS. Central ner- vous system reactions to histamine-2 receptor blockers. Ann Intern Med 1991; 114:1027-34.
106. Catalano G, Catalano MC, Alberts VA. Famotidine-associated delirium. A series of six cases. Psychosomatics 1996;37:349-55.
107. Oslin DW, Katz IR, Sands LP, Bilker W, DiFilippo SD, D’Angelo K. Examina-tion of the cognitive effects of cimetidine in normal elderly volunteers. Am J Geriatr Psychiatry 1999;7:160-5.
108. Schentag JJ, Cerra FB, Calleri G, DeGlopper E, Rose JQ, Bernhard H. Phar-macokinetic and clinical studies in patients with cimetidine-associated mental confu-sion. Lancet 1979;1:177-81.
109. Slugg PH, Haug MT, 3rd, Pippenger CE. Ranitidine pharmacokinetics and adverse central nervous system reactions. Arch Intern Med 1992;152:2325-9.
110. Jenike MA, Levy JC. Physostigmine reversal of cimetidine-induced delirium and agitation. J Clin Psychopharmacol 1983;3:43-4.
111. Fireman Z, Kopelman Y, Sternberg A. Central nervous system side effects after proton pump inhibitor treatment. J Clin Gastroenterol 1997;25:718.
112. Heckmann JG, Birklein F, Neundorfer B. Omeprazole-induced delirium. J Neurol 2000;247:56-7.
113. Morton MR, Robbins ME. Delirium in an elderly woman possibly associated
with administration of misoprostol. Dicp 1991;25:133-4.
114. Pahor M, Guralnik JM, Gambassi G, Bernabei R, Carosella L, Carbonin P. The impact of age on risk of adverse drug reactions to digoxin. For The Gruppo Italiano di Farmacovigilanza nell’ Anziano. J Clin Epidemiol 1993; 46:1305-14.
115. Gray SL, Lai KV, Larson EB. Drug-induced cognition disorders in the elderly: incidence, prevention and management. Drug Saf 1999;21:101-22.
116. Cooke DM. The use of central nervous system manifestations in the early detection of digitalis toxicity. Heart Lung 1993;22:477-81.
117. Lely AH, van Enter C. Non-cardiac symptoms of digitalis intoxication. Am Heart J 1972;83:149-52.
118. Eisendrath SJ, Sweeney MA. Toxic neuropsychiatric effects of digoxin at therapeutic serum concentrations. Am J Psychiatry 1987;144:506-7.
119. Eisenman DP, McKegney FP. De-lirium at therapeutic serum concentrations of digoxin and quinidine. Psychosomatics 1994;35:91-3.
120. Dimsdale JE, Newton RP, Joist T. Neuropsychological side effects of beta-blockers. Arch Intern Med 1989;149: 514-25.
121. Perez-Stable EJ, Halliday R, Gardiner PS, Baron RB, Hauck WW, Acree M, et al. The effects of proprano-

D E M E N T I A – D I AG N O S T I C A N D T H E R A P E U T I C I N T E RV E N T I O N S480
lol on cognitive function and quality of life: a randomised trial among patients with diastolic hypertension. Am J Med 2000;108:359-65.
122. Muldoon M, Waldstein SR et al. Ef-fects of six anti-hypertensive medications on cognitive performance. J Hypertens 2002;20:1643-52.
123. Rogers TK, Bowman CE. Cogni-tive impairment associated with beta-blockade in the elderly. Postgrad Med J 1990;66:1050-2.
124. Fisher CM. Amnestic syndrome associated with propranolol toxicity: a case report. Clin Neuropharmacol 1992;15:397-403.
125. Westerlund A. Central nervous system side-effects with hydrophilic and lipophilic beta-blockers. Eur J Clin Pharmacol 1985;28 Suppl:73-6.
126. Nygaard HA, Hovding G. [Adverse effects of local use of beta-blockaders in glaucoma. A literature review and a sur- vey of reports to the adverse drug reac- tion authority 1986–95]. Tidsskr Nor Laegeforen 1997;117:2019-21.
127. Bagon JA. Neuropsychiatric com- plications following quinolone overdose in renal failure. Nephrol Dial Transplant 1999;14:1337.
128. Dasgupta R, Mukhopadhyay S, Ganguly S. Adverse effects of quinolone antibiotics. J Assoc Physicians India 1994; 42:348.
129. Jay GT, Fitzgerald JM. Ciprofloxacin-induced delirium. Ann Pharmacother 1997;31:252.
130. McDermott JL, Gideonse N, Campbell JW. Acute delirium associated with ciprofloxacin administration in a hospitalized elderly patient. J Am Geriatr Soc 1991;39:909-10.
131. Mermelstein HT. Clarithromycin-induced delirium in a general hospital. Psychosomatics 1998;39:540-2.
132. Cone LA, Padilla L, Potts BE. Delirium in the elderly resulting from azithromycin therapy. Surg Neurol 2003; 59:509-11.
133. Pollak PT, Sketris IS, MacKenzie SL, Hewlett TJ. Delirium probably induced by clarithromycin in a patient receiving fluoxetine. Ann Pharmacother 1995;29: 486-8.
134. Gregor JC, Zilli CA, Gotlib IH. Acute psychosis associated with oral trimethoprim-sulfamethoxazole ther- apy. Can J Psychiatry 1993;38:56-8.
135. Gales BJ, Gales MA. Confusion and bradykinesia associated with fam- ciclovir therapy for herpes zoster. Am J Health Syst Pharm 1996;53:1454, 1456.
136. Johnson GL, Limon L, Trikha G, Wall H. Acute renal failure and neuro-toxicity following oral acyclovir. Ann Pharmacother 1994;28:460-3.
137. Southworth MR, Dunlap SH. Psychotic symptoms and confusion associated with intravenous ganci- clovir in a heart transplant recipient. Pharmacotherapy 2000;20:479-83.
138. Ahles TA, Saykin AJ. Breastcancer chemotherapy-related cognitive dysfunc-

C H A P T E R 2 6 • D R U G - I N D U C E D C O G N I T I V E I M PA I R M E N T 481
tion. Clin Breast Cancer 2002;3 Suppl 3:S84-90.
139. Ahles TA, Saykin AJ, Furstenberg CT, Cole B, Mott LA, Skalla K, et al.
Neuropsychologic impact of standard- dose systemic chemotherapy in long- term survivors of breast cancer and ymphoma. J Clin Oncol 2002;20: 485-93.


C H A P T E R 2 7 • N O N - E S TA B L I S H E D P H A R M AC O LO G I C A L T R E AT M E N T S F O R D E M E N T I A D I S O R D E R S
483
27. Non-established Pharmacological Treatments for Dementia Disorders
Conclusions
Table 27.1 summarizes the current scientific evidence for the effects of various kinds of non-established treatments on cognitive function in dementia disorders. There is limited evidence for Ginkgo biloba and for propentophylline. Small effects have been observed for vitamin E and estrogen, but the evidence is insufficient. No RCTs have been re- ported for a number of treatments, including dehydroepiandrosterone, alpha lipoic acid, aspirin, statins and vaccine. Thus, there is no evid- ence either for or against an effect in the case of these drugs. On the other hand, two or more RCTs have been conducted that provide evid- ence of no effect on cognitive function when it comes to certain substan-ces, including lecithin, vitamin B12, folate, piracetam and NSAIDs.
Background
Apart from the established treatments for AD (Alzheimer’s disease), several other drugs have been reported to have beneficial effects in dementia disorders, either by alleviating the symptoms of cognitive decline or modifying the pathological process. The evidence for some of the drugs is weak. For some, most results are from epidemiological studies. For others, RCTs have been conducted but the results are in some cases contradictory. This chapter reviews the most important non-established pharmacological treatments for AD and other dementia disorders. Because vaccine treatment of AD has received considerable attention, a description of those data is also provided.
D E M E N T I A – D I AG N O S T I C A N D T H E R A P E U T I C I N T E RV E N T I O N S484
Method
The data presented is based primary on systematic reviews from the Cochrane Institute. An updated Medline literature search of published studies and systematic reviews through July 2004 changed none of the conclusions.
Individual drugs
LecithinLecithin is a major dietary source of choline, which is part of the acetyl-choline molecule. Since AD patients are reported to have a deficiency of the enzyme that converts choline to acetylcholine in the brain, lecithin supplementation could conceivably slow the progression of the disease.
The Cochrane Collaboration conducted a systematic review to determi-ne the efficacy of lecithin in treating dementia or cognitive impairment [1] (Table 27.1). The review included all unconfounded, randomised trials that compared lecithin with placebo for treating patients with Alz-heimer-type dementia, VaD, mixed AD and VaD, unclassified or other dementia, as well as unclassified cognitive impairment.
Twelve randomised trials were identified, including patients with AD (n = 265), parkinsonian dementia (n = 21) and subjective memory pro-blems (n = 90). None of the trials reported a clear clinical benefit of lecithin in treating AD. However, lecithin produced a dramatic im- provement in a trial that included subjects with subjective memory problems.
The conclusion was that evidence from randomised trials does not sup-port the use of lecithin in treating patients with dementia.
Vitamin B12 Cobalamin (vitamin B12) deficiency, which has been found to be present in 5–15% of the elderly population, is even more common in dementia conditions [2]. Vitamin B12 deficiency as measured by either low levels

C H A P T E R 2 7 • N O N - E S TA B L I S H E D P H A R M AC O LO G I C A L T R E AT M E N T S F O R D E M E N T I A D I S O R D E R S
485
of vitamin B12 [3] or increased levels of plasma Hcyb [4] has been discus-sed as a risk factor for developing dementia.
Because vitamin B12 is a common treatment for dementia and cognitive symptoms, the literature was searched for evidence of its effectiveness [5]. The Cochrane Collaboration examined the effect of B12 supplementa-tion on the cognitive function of healthy elderly subjects and those with dementia in terms of preventing the onset or slowing the progression of cognitive impairment or dementia [6]. In September 2002, the Cochrane group searched for all available randomised double-blind trials in which vitamin B12 of any dose was compared to placebo. Only two studies were found [6,7]. The meta-analysis of data from the two studies on patients with dementia and low serum vitamin B12 levels showed no statistically significant evidence of effects on cognitive function when vitamin B12 was compared with placebo.
Thus, despite several indications of the relation between vitamin B12 deficiency and the development of cognitive symptoms or dementia, no prospective double-blind studies on people without dementia were found. Neither of the placebo-controlled studies on dementia and low serum B12 levels offered evidence that cognitive function improved.
Folic acid Homocysteine, vitamin B12 (cobalamin) and folate are all involved in the one-carbon cycle. Normal functioning of the cycle is essential for proper development and maintenance of the CNS. Folate acts as a methyl-group donator in a reaction catalyzed by the enzyme methionine synthase to produce the methylcoboloamin needed for the methylation of homocysteine to methionine. As a result, folate deficiency may – in addition to impairing one-carbon metabolism – cause high homocystei-ne levels in the blood and cells. That is a risk factor for atherosclerosis and cerebrovascular disease.
In light of the above considerations, a Cochrane report investigated the effects of folic acid supplementation – with or without vitamin B12 – on healthy elderly and those with dementia for the purpose of preventing cognitive impairment or retarding its progression [8].

D E M E N T I A – D I AG N O S T I C A N D T H E R A P E U T I C I N T E RV E N T I O N S486
All double-blind placebo-controlled randomised trials were included. Four randomised trials were found [9,10].
The reviewer concluded that the available studies were limited in size and provided no evidence that folic acid – with or without vitamin B12 – had any beneficial effect on cognitive function or mood in either healthy sub- jects or those with cognitive impairment or dementia.
Vitamin EVitamin E is a group of naturally occurring chemical derivatives of to- copherol and tocotrienol. Vitamin E occurs in oils, fats, nuts and other seeds. The biological function of vitamin E is that of an antioxidant, neutralizing the effects of peroxide and free radicals in the cell that would otherwise damage proteins, DNA and cell membranes. Since free radical damage is a potential mechanism in the degeneration of neurons in AD, etc, antioxidants like vitamin E might be expected to either prevent the disease or delay its progression. Therefore, a Cochrane report focused on vitamin E for the prevention and treatment of AD [11].
All double-blind, placebo-controlled randomised studies with any dose of vitamin E were included. Only one study met all of the inclusion criteria [12]. Vitamin E appeared to produce some benefit – fewer parti-cipants reached 1 out of 4 endpoints (death, institutionalization, loss of 2 out of 3 basic activities or severe dementia). However, more participants who took vitamin E suffered from falls.
The conclusion was that the evidence on vitamin E sufficed to justify further study but that evidence of its efficacy in the treatment of AD was inadequate.
PiracetamPiracetam is believed to have properties that enhance memory and other intellectual functions. However, the mechanism of action is not well known. Piracetam has been suggested to act by increasing oxygen and glucose utilization. At higher doses, it is also believed to enhance

C H A P T E R 2 7 • N O N - E S TA B L I S H E D P H A R M AC O LO G I C A L T R E AT M E N T S F O R D E M E N T I A D I S O R D E R S
487
microcirculation and antithrombotic properties by affecting platelets and erythrocytes. The effects on AD and other types of dementia remain uncertain, although larger trials have shown some positive results.
A Cochrane review was carried out to determine the clinical efficacy of piracetam for the features of dementia or cognitive impairment classified according to the major subtypes of AD, mixed AD and VaD, unclassi-fied dementia or cognitive impairment that failed to meet the criteria for dementia [13].
Apart from searching the Specialized Register of the Cochrane Demen-tia and Cognitive Improvement Group, several studies (many of which unpublished) were obtained from UCB Pharma, the pharmaceutical company responsible for marketing most piracetam worldwide. All unconfounded, randomised trials were included in which piracetam was administered for more than 1 day and compared with placebo, in patients with Alzheimer-type dementia, VaD, mixed AD and VaD, unclassified dementia or cognitive impairment that failed to meet the criteria for dementia. Whenever feasible, studies were pooled, and the pooled odds ratios or average differences were estimated. Intention-to-treat analyses were performed wherever possible.
A total of 68 studies were reviewed. Many were crossover studies, and first-phase data were unavailable or could not be extracted. Only 3 studies had a treatment duration of more than three months. Global Impression of Change was the only outcome with a significant amount of evidence from the pooled data. Using a fixed effects model, the odds ratio for improvement in the piracetam group compared with the pla-cebo group was 3.55 (95% CI 2.45–5.16). Using a random effects model, the odds ratio was 3.47 (1.29–9.30). The evidence of effects on cognition and other measures was inconclusive.
The reviewers concluded that available evidence did not support the use of piracetam in treating people with either dementia or cognitive impair-ment. Although effects were found on global impression of change, no benefit was shown from any of the more specific measures.

D E M E N T I A – D I AG N O S T I C A N D T H E R A P E U T I C I N T E RV E N T I O N S488
DehydroepiandrosteroneDehydroepiandrosterone (DHEA) and its sulphate form (DHEA/S) are the most abundant hormones in both men and women. Each hor-mone is found in the brain and adrenal gland. The hormones have been shown to increase the effect of the excitatory transmitter glutamate and to decrease the effect of the inhibitory transmitter GABA. They also appear to have neuroprotective properties and stimulate the immune system. Both hormones possess strong antiglucocorticoid action, possibly explaining their neuroprotective effects. Some evidence from epidemio-logical studies suggests that DHEA may protect against heart disease and increase longevity. Dementia patients have been reported to have lower levels of DHEA.
Thus there is a theoretical basis, but very little evidence, for believing that DHEA may have beneficial effects. Nevertheless, health food stores in many countries sell DHEA as a possible enhancer of cognitive func-tion in aging and dementia.
The Cochrane Collaboration undertook a review of well-executed stu- dies in the pursuit of evidence that cognitive function improved or cog-nitive decline slowed in the healthy older adults or those with dementia [14]. Another aim was to provide a scientific basis for effective dosage, acceptable route and duration of administration, and side-effect profiles. All relevant RCTs concerning the effect of DHEA/S on cognition in older adults were searched among relevant electronic databases, journals, personal communications and conference abstracts.
Four studies were found. Three addressed cognition in healthy older people and one in perimenopausal women with decreased well-being, but none in people with dementia. Some significant findings were identi-fied. One crossover trial reported significant improvement after 2 weeks of treatment with both DHEA and placebo, following DHEA compared with placebo in both immediate recall (MD 0.8, 95% CI 0.16–1.44) and delayed recall (MD 0.9; 0.09–1.71) for a visual memory test in women. However, there was no significant improvement in men, or a significant effect on a verbal memory test or four other cognitive tests. Another study showed that placebo group performance deteriorated significantly

C H A P T E R 2 7 • N O N - E S TA B L I S H E D P H A R M AC O LO G I C A L T R E AT M E N T S F O R D E M E N T I A D I S O R D E R S
489
on a test of selective attention following a psychosocial stressor (p <0.05). But that was not observed in the DHEA group (p = 0.85) after 2 weeks of treatment. However, DHEA led to significant impairment on a visual memory test and no significant effect was detected on a third cognitive task. A third study found no significant effect of DHEA compared with placebo on 3 cognitive measures after 3 months. The findings to date suggest that DHEA has no significant side-effects.
The reviewers concluded that there was no support for improved mem- ory or other aspects of cognitive function following DHEA treatment in healthy older people. But since it is possible that any neuroprotective effect of DHEA/S may be evident only in the long term, they identified a need for trials on DHEA treatment for longer than 1 year. Recently completed trials on DHEA supplementation in AD patients (United States), postmenopausal women (United States), healthy older men (United Kingdom), and healthy older adults (France – 1-year) will be reviewed and included as soon as the results are available.
PropentophyllinePropentophylline is a dementia drug with a unique mechanism of action. At the molecular level, it blocks the uptake of adenosine and inhibits the enzyme phosphodiesterase. In vitro and in vivo, it both inhibits the production of free radicals and reduces the activation of microglial cells. Thus, propentophylline interacts with inflammatory processes that are believed to contribute to dementia. As a result, it might be a disease-modifying agent.
A Cochrane review was conducted to determine the clinical efficacy and safety of propentophylline in people with dementia [15]. Trials were searched in the Specialized Register of the Cochrane Dementia and Cognitive Improvement Group. In addition, Aventis, the manufacturer, was asked for data from unpublished studies. All 9 unconfounded, dou-ble-blind RCTs of propentophylline compared with placebo or another treatment group, were included. Detailed reports were found for only 4 of them. The efficacy of propentophylline was reviewed for undiffe-rentiated dementia, given that the data were insufficient to analyze the individual types.

D E M E N T I A – D I AG N O S T I C A N D T H E R A P E U T I C I N T E RV E N T I O N S490
Several significant treatment effects favoring propentophylline were reported: cognition at 3, 6, and 12 months, including MMSE at 12 months (MD 1.2, 95% CI 0.12 to 2.28, p = 0.03); severity of dementia at 3, 6, and 12 months, including CGI at 12 months (MD –0.21, –0.39; –0.03, p = 0.03), ADL (NAB) at 6 and 12 months (MD –1.20, –2.22; –0.18, p = 0.02), and Global Assessment (CGI) at 3 months (MD –0.48, –0.75 to –0.21, p = 0.0006) but not afterwards.
The reviewers concluded that there is limited evidence that propento-phylline benefits cognition, global function, and ADL in people with AD and/or VaD. Considering that there is unpublished data on another 1 200 patients in randomised trials, the meta-analyses did not satisfacto-rily summarize the efficacy of propentophylline. Unfortunately, Aventis representatives were unwilling to correspond with the authors. Accor-ding to the authors, that significantly limited the scope of the review.
EstrogenEstrogen has several effects on the CNS – including modulation of neurotransmitter systems, regulation of synaptogenesis, neuroprotection, increased cerebral blood flow, anti-inflammatory actions and antioxi-dant properties – that may have implications for neurodegenerative disorders.
A reasonable assumption is that maintaining estrogen levels in post-menopausal women by means of estrogen replacement therapy (ERT) could protect against cognitive decline and the development of AD or other types of dementia.
The Cochrane Collaboration conducted a review aimed at investigating the effects of ERT (estrogens only) or hormone replacement therapy (HRT – estrogens combined with a progestagen) compared with pla-cebo in RCTs on the cognitive function of postmenopausal women with dementia [16]. The CDCIG Specialized Register, Medline, EMBASE, and PsycInfo were searched for all double-blind RCTs concerning the effect of ERT or HRT on cognitive function that included treatment of at least 2 weeks in postmenopausal women with AD or other types of dementia.

C H A P T E R 2 7 • N O N - E S TA B L I S H E D P H A R M AC O LO G I C A L T R E AT M E N T S F O R D E M E N T I A D I S O R D E R S
491
At total of 5 trials that included 210 women were analyzed. Meta-ana-lyses showed a small positive effect from a low dosage of conjugated equine estrogens (CEE, 0.625 mg once daily) but not from higher doses (1.25 mg once daily) on the MMSE after 2 months (WMD = 1.28, 95% CI
0.26–2.30, z = 2.45, p <0.01). However, the effect disappeared after 3, 6, and 12 months of treatment. The effect was small (1 point on the MMSE compared to placebo). In addition, there were short-term effects of 1.25 mg from CEE on tests of concentration and executive function. When it came to memory tests, only cued delayed recall of a word list was positi-vely affected by 2 months of transdermal diestradiol (E2) (WMD = 6.50, 95% CI 4.04–8.96, z = 5.19, p <0.0001). No effects were observed on language functions, most speeded tests, clinical rating scales or depres-sion. Controls scored better on a dementia rating scale (CDR, overall WMD = 0.35, 95% CI 0.01–0.69, z = 1.99, p <0.05). According to the authors, the positive findings might have been random effects caused by multiple analyses. After correction for multiple testing, only the short-term positive treatment effect of E2 on memory remained.
The reviewers concluded that neither HRT nor ERT is indicated for cognitive improvement or maintenance in women with AD. Other types of dementia remain to be investigated. It is also possible that different types or preparations of ERT and HRT, as well as other durations of treatment, would have different effects. Another question is whether ERT or HRT can delay the time to onset of dementia. Studies addres-sing this question are under way in the United Kingdom, United States and Canada.
Non-steroidal anti-inflammatory drugsSeveral lines of evidence suggest that inflammatory processes play a role in the pathogenesis of AD. One of the immune responses in the brain is the activation of the prostaglandin pathways. Non-steroidal anti-inflam-matory drugs (NSAIDs) act by inhibiting the cyclooxygenase (COX) involved in prostaglandin synthesis. Thus, they could conceivably have protective effects against the development of AD, and several epidemio-logical studies suggest that this may be the case. However, the results of many clinical trials have been discouraging.

D E M E N T I A – D I AG N O S T I C A N D T H E R A P E U T I C I N T E RV E N T I O N S492
In light of these conflicting results, two Cochrane reviews were carried out to examine the efficacy of the NSAIDs indomethacin and ibuprofen in treating patients with AD [17,18]. Searches were conducted in the Specialized Register of the Cochrane Dementia and Cognitive Improve-ment Group. Additional searches involved other relevant computerized databases, websites, manual techniques and additional references from selected papers. Furthermore, an effort was made to find data from on- going trials. Single-center or multicenter, placebo-controlled, rando-mised trials examining the efficacy of indomethacin or ibuprofen in patients diagnosed with AD were included.
Only one study was selected for indomethacin. No significant difference was found between indomethacin treatment and placebo for the indi-vidual cognitive tests of MMSE, Alzheimer’s Disease Assessment Scale (ADAS), Boston Naming Test (BNT) or Token Test (TK). The dropout rate was higher and the gastrointestinal side-effects more prevalent in the indomethacin group. There was no statistically significant difference in mortality. No completed randomised, double-blind, placebo-controlled trial on ibuprofen met the inclusion criteria for review.
The reviewers concluded that there was no evidence to recommend in- domethacin for the treatment of mild to moderate AD. At doses of 100 to 150 mg daily, serious side-effects limit its use. There are no data yet available from RCTs on ibuprofen. Studies on other NSAIDs are ongo-ing. However, the use of NSAIDs carries a significant risk of potentially serious side-effects such as gastrointestinal bleeding that must be weig-hed against any beneficial effect in the treatment of AD.
After the Cochrane review, one RCT has been published on the effect of rofecoxib for slowing the progression of dementia in 692 patients with established AD. Four hundred eighty-one patients (70%) completed assessments and remained on treatment at 12 months. No significant differences between treatments were found in terms of mean change from the baseline error score for the ADAS-cog or the mean score on the CIBIC+ [19].

C H A P T E R 2 7 • N O N - E S TA B L I S H E D P H A R M AC O LO G I C A L T R E AT M E N T S F O R D E M E N T I A D I S O R D E R S
493
Ginkgo bilobaGinkgo biloba contains extracts of the leaves of the maidenhair tree. It has long been used in China for various health disorders. Ginkgo biloba is also widely prescribed in Germany and France for several conditions, including memory and concentration problems, confusion, depression, anxiety, dizziness, tinnitus and headache. The extract is believed to act by dilating blood vessels, thereby increasing blood supply, reducing blood viscosity, modifying neurotransmitter systems and reducing oxygen-free radicals.
A Cochrane review investigated the efficacy and safety of Ginkgo biloba in treating dementia or cognitive decline [20]. A search was conducted of the CDCIG Specialized Register which contains records from all main medical databases (Medline, EMBASE, Cinahl, PsycInfo, Sigle, Lilacs), databases of ongoing trials, such as Clinicaltrials.gov and Cur-rent Controlled Trials, and several other sources. All relevant, uncon-founded, randomised, double-blind controlled studies were included in which extracts of Ginkgo biloba (at any strength and over any period of time) were compared with placebo for the effects on people with acqui-red cognitive impairment, including dementia (at any degree of severity). Meta-analyses were based on reported summary statistics for each study. Both intention-to-treat analyses (ITT) and analyses of completers were performed. Because there were few attempts at ITT analyses, only com-pleters were analyzed.
A total 33 studies with a treatment duration of 3–52 weeks were revie-wed. Benefits were associated with Ginkgo (<200 mg daily) compared with placebo at less than 12 weeks and with Ginkgo (>200 mg daily) at 24 weeks. Cognition benefited from Ginkgo (at both less than and more than 200 mg daily) compared with placebo at 12 weeks and at 24 weeks, as well as for Ginkgo less than 200 mg daily at 52 weeks. ADL benefited from Ginkgo (<200 mg daily) compared with placebo at 12, 24, and 52 weeks. Measures of mood and emotional function benefited from Ginkgo (<200 mg daily) compared with placebo at less than 12 weeks and at 12 weeks. Overall, there were no significant dif- ferences between Ginkgo and placebo with respect to the percentage of participants experiencing adverse events.

D E M E N T I A – D I AG N O S T I C A N D T H E R A P E U T I C I N T E RV E N T I O N S494
The reviewers concluded that Ginkgo biloba does not appear to have more side-effects than placebo. Generally speaking, there is promising evidence of improvement in cognition and function associated with Ginkgo biloba. However, the three more recent trials showed inconsis-tent results. There is a need for a large trial that uses the latest methodo-logy and permits ITT analysis.
After the Cochrane review, a 24-week, multicenter, double-blind, pla-cebo-controlled, randomised trial has been published on the effects of the special Ginkgo biloba extract EGb 761 (240 mg daily) in outpatients with Alzheimer-type dementia and multi-infarct dementia of mild to moderate severity. An ITT analysis showed a significant decrease in Syn-drom-Kurztest (SKT) and estimated ADAS-cog scores, while there was only a minimal change in the placebo group, indicating that EGb 761 improved cognitive function in dementia patients [21].
We performed a meta-analysis of the latter study [21] together with a previous RCT [22] using ADAS-Cog as evaluation instrument. Both studies made an ITT analysis of the effects of treatment with Egb 761 (240 mg/day for 24 weeks and 120 mg/day for 26 weeks respectively) on cognitive function in dementia. This meta-analysis showed a mean improvement compared to placebo of 1.3 points (–1.3 (95% CI –2,0; –0.6)).
In conclusion, the Cochrane review and our meta-analysis of two larger RCTs would provide at least a moderately strong support for an effect of Ginkgo Biloba on cognition in dementia. However, overall, the studies on Ginkgo have used a range of different instruments to measure the outcome, and very few of them were ADAS-Cog. There are also nume-rous other variations, in for example diagnostic criteria and treatment doses. In addition, some of the more recent studies show conflicting results. Altogether this decreases the level of evidence.
Alpha lipoic acid and dementiaAlpha lipoic acid (ALA) is a potent antioxidant that is intimately con-nected to cell metabolism and the redox state. It is essential to oxidative metabolism and serves as a co-factor in mitochondrial dehydrogenase

C H A P T E R 2 7 • N O N - E S TA B L I S H E D P H A R M AC O LO G I C A L T R E AT M E N T S F O R D E M E N T I A D I S O R D E R S
495
reactions. ALA can also chelate metals that may be involved in oxidative reactions [23,24]. Because oxidative stress and free radicals can be part of the disease mechanism of degenerative disorders, ALA may also be of value in the treatment or prevention of dementia [25].
Thus, a Cochrane report was published on ALA and dementia [26]. All double-blind randomised placebo-controlled trials examining ALA in dementia were reviewed. However, no trials that met the inclusion criteria were identified. The reviewers concluded that in the absence of evidence of the potential effects of ALA in dementia, it cannot be recommended as treatment.
Aspirin A key mechanism in the pathogenesis of dementia is ischemia of the brain tissue. Ischemia has been described in AD, as well as mixed AD and VaD, and is the major pathogenic mechanism in VaD. When it comes to clinical practice, separating different pathogenic mechanisms in individual cases is often very difficult given that several may contribu-te to the condition [27]. Aspirin reduces the risk of ischemic stroke [28]. Because different ischemic mechanisms may contribute to dementia, aspirin has been widely prescribed for patients with a diagnosis of VaD, as well as for those with dementia and vascular risk factors.
However, two overriding questions remain to be answered in terms of treating dementia with aspirin. First, is there sufficient evidence sup-porting the clinical efficacy of aspirin for preventing the further progress of VaD or improving cognitive function? Second, are the risks of aspirin treatment, such as cerebral and gastrointestinal hemorrhage, acceptable in view of the possible treatment effects?
In order to address these questions, a Cochrane report assessed the evid- ence of the efficacy of aspirin for treating VaD [29]. The report was most recently amended in November 2003.
All RCTs investigating the efficacy of aspirin for treating VaD were sear-ched. However, no trials eligible for inclusion were found. Thus, there

D E M E N T I A – D I AG N O S T I C A N D T H E R A P E U T I C I N T E RV E N T I O N S496
appears to be no evidence that aspirin is effective in treating patients with VaD. Further research must be conducted to generate evidence for the current medical practice of using aspirin to treat VaD.
Statins Statins have been investigated for their preventive effect on dementia. Statins have also been investigated for their clinical effect in the treat-ment of patients with AD and normal serum lipids. Apart from some studies on biochemical measurements, no data have been published on the clinical efficacy of statins (simvastatin, pravastatin, atorvastatin or fluvastatin) in the treatment of AD.
Thus, there does not appear to be any evidence for statins in treating patients with AD and normal serum lipids.
Vaccine treatmentNo placebo-controlled data have been published on vaccine treatment of AD. But since the treatment attempts that have been made suggest a new approach, a brief overview of the literature is provided.
Because formation of fibrillar beta-amyloid (Aβ) and neuritic plaques is believed to play a key role in the pathogenesis of AD, one therapeutic approach would be to develop antibodies against the Aβ protein. It was shown that active immunization against the Aβ protein could decrease Aβ deposition in the brains of a mouse model [30]. That, as well as other findings, preceded the development of a synthetic Aβ 1–42 (AN–1792) protein for use in human vaccination trials. A phase 1 study showed that some of the 70 patients produced measurable antibodies against the vaccine [31]. A subsequent phase 2 study that immunized 300 out of 375 patients with 225 βgAN–1792 at baseline and different time points there-after found that a subgroup (19 patients, 6%) of the immunized patients developed a meningoencephalitis. The study was discontinued after only a few months [32]. A postmortem follow-up of one of the patients

C H A P T E R 2 7 • N O N - E S TA B L I S H E D P H A R M AC O LO G I C A L T R E AT M E N T S F O R D E M E N T I A D I S O R D E R S
497
indicated clearance of Aβ plaques, as well as a T-lymphocyte meningo-encephalitis that had been identified as a side-effect in some of the other patients [33]. A major obstacle to vaccination with Aβ protein analogues is that the immune response is directed against a naturally occurring tar-get (like Aβ protein) that is present in healthy tissue. That could trigger a more unwanted, generalized immune response [34].

D E M E N T I A – D I AG N O S T I C A N D T H E R A P E U T I C I N T E RV E N T I O N S498
Table 27.1 Scientific evidence for the effect of different types of non-established treatments on cognitive function in dementia disorders.
Author Year, reference
Compound Population No of RCTs Conclusion Scientific evidence
Higgins et al 2003 [1]
Lecithin Alzheimer/Parkinsonian dementia
12 No study reported clear benefit in AD. Dramatic result in subjective memory problems
Insufficient
Malouf et al 2003 [6]
Vitamin B12 Dementia/Alzheimer 2 Insufficient evidence for benefits of Vitamin B12 supplementation on cognitive function
Insufficient
Malouf et al 2004 [8]
Folic acid Dementia 3 Folic acid with or without vitamin B12 gave no benefits on cognitive function, but was effective in reducing serum homocysteine.
Insufficient
Tabet et al 2002 [17]
Vitamin E Alzheimer 1 Insufficient evidence of efficacy Insufficient
Flicker et al 2003 [13]
Piracetam Dementia 3 (>3 months) Effects on global impression of change but not on more specific measures
Insufficient
Huppert et al 2003 [14]
Dehydroepiandrosterone Dementia 0 No study in dementia. No evidence for effect in normal old people
No
Frampton et al 2003 [15]
Propentophylline Dementia 4 Limited evidence of effects on cognition, global function and ADL
Limited
Hogervorst et al 2003 [16]
Estrogen Alzheimer 5 Small positive effect of short-term treatment with E2 on memory
Insufficient
Tabet et al 2003 [18]
NSAIDs Alzheimer 2 No evidence for effect on cognitive function
Insufficient

C H A P T E R 2 7 • N O N - E S TA B L I S H E D P H A R M AC O LO G I C A L T R E AT M E N T S F O R D E M E N T I A D I S O R D E R S
499
Table 27.1 Scientific evidence for the effect of different types of non-established treatments on cognitive function in dementia disorders.
Author Year, reference
Compound Population No of RCTs Conclusion Scientific evidence
Higgins et al 2003 [1]
Lecithin Alzheimer/Parkinsonian dementia
12 No study reported clear benefit in AD. Dramatic result in subjective memory problems
Insufficient
Malouf et al 2003 [6]
Vitamin B12 Dementia/Alzheimer 2 Insufficient evidence for benefits of Vitamin B12 supplementation on cognitive function
Insufficient
Malouf et al 2004 [8]
Folic acid Dementia 3 Folic acid with or without vitamin B12 gave no benefits on cognitive function, but was effective in reducing serum homocysteine.
Insufficient
Tabet et al 2002 [17]
Vitamin E Alzheimer 1 Insufficient evidence of efficacy Insufficient
Flicker et al 2003 [13]
Piracetam Dementia 3 (>3 months) Effects on global impression of change but not on more specific measures
Insufficient
Huppert et al 2003 [14]
Dehydroepiandrosterone Dementia 0 No study in dementia. No evidence for effect in normal old people
No
Frampton et al 2003 [15]
Propentophylline Dementia 4 Limited evidence of effects on cognition, global function and ADL
Limited
Hogervorst et al 2003 [16]
Estrogen Alzheimer 5 Small positive effect of short-term treatment with E2 on memory
Insufficient
Tabet et al 2003 [18]
NSAIDs Alzheimer 2 No evidence for effect on cognitive function
Insufficient
The table continues on the next page

D E M E N T I A – D I AG N O S T I C A N D T H E R A P E U T I C I N T E RV E N T I O N S500
AD = Alzheimer’s disease; ADL = Activities of daily living; NSAIDs = non-steroidal anti-inflammatory drug; RCT = Randomised controlled trial
Table 27.1 continued
Author Year, reference
Compound Population No of RCTs Conclusion Scientific evidence
Reines et al 2004 [19]
Ginkgo biloba Dementia 34 Promising evidence of improvement of cognition and function. However variations in study design, and some conflicting results
Limited
Sauer et al 2004 [26]
Alpha lipoic acid Dementia 0 No data available No
Rands 2004 [29]
Aspirin Vascular dementia 0 No data available No
Ongoing studies Statins Alzheimer 0 No data available No
Ongoing studier Vaccine Alzheimer 0 No data available No

C H A P T E R 2 7 • N O N - E S TA B L I S H E D P H A R M AC O LO G I C A L T R E AT M E N T S F O R D E M E N T I A D I S O R D E R S
501
Table 27.1 continued
Author Year, reference
Compound Population No of RCTs Conclusion Scientific evidence
Reines et al 2004 [19]
Ginkgo biloba Dementia 34 Promising evidence of improvement of cognition and function. However variations in study design, and some conflicting results
Limited
Sauer et al 2004 [26]
Alpha lipoic acid Dementia 0 No data available No
Rands 2004 [29]
Aspirin Vascular dementia 0 No data available No
Ongoing studies Statins Alzheimer 0 No data available No
Ongoing studier Vaccine Alzheimer 0 No data available No

D E M E N T I A – D I AG N O S T I C A N D T H E R A P E U T I C I N T E RV E N T I O N S502
1. Higgins J, Flicker, L. Lecithin for dementia and cognitive impairment. Cochrane Methodology Review 2003(4).
2. Nagga K, Rajani R, Mardh E, Borch K, Mardh S, Marcusson J. Cobalamin, folate, methylmalonic acid, homocysteine, and gastritis markers in dementia. Dement Geriatr Cogn Disord 2003;16:269-75.
3. Wang HX, Wahlin A, Basun H, Fastbom J, Winblad B, Fratiglioni L. Vitamin B(12) and folate in relation to the development of Alzheimer’s disease. Neurology 2001;56:1188-94.
4. Seshadri S, Beiser A, Selhub J, Jacques PF, Rosenberg IH, D’Agostino RB, et al. Plasma homocysteine as a risk factor for dementia and Alzheimer’s disease. N Engl J Med 2002;346:476-83.
5. Nagga AK, Marcusson J. Associated physical disease in a demented population. Aging (Milano) 1998;10:440-4.
6. Malouf R, Areosa Sastre A. Vitamin B12 for cognition. Cochrane Database Syst Rev 2003:CD004326.
7. Seal EC, Metz J, Flicker L, Melny J. A randomised, double-blind, placebo-con-trolled study of oral vitamin B12 supple-mentation in older patients with subnormal or borderline serum vitamin B12 concen-trations. J Am Geriatr Soc 2002;50:146-51.
8. Malouf R, Grimley, Evans J, Aerosa Sastre, A. Folic acid with or without vita-min B12 for cognition and dementia. The Cochrane Library 2004(1).
9. Bryan J, Calvaresi E, Hughes D. Short-term folate, vitamin B-12 or vitamin B-6
supplementation slightly affects memory performance but not mood in women of various ages. J Nutr 2002;132:1345-56.
10. Sommer BR, Hoff AL, Costa M. Folic acid supplementation in dementia: a preliminary report. J Geriatr Psychiatry Neurol 2003;16:156-9.
11. Tabet N, Birks, J, Grimley Evans, J, Orrel, M, Spector, A. Vitamin E for Alzhe-imer’s disease (Cochrane Review). The Cochrane Library 2004(1).
12. Sano M, Ernesto C, Thomas RG, Klauber MR, Schafer K, Grundman M, et al. A controlled trial of selegiline, alpha-tocopherol, or both as treatment for Alzheimer’s disease. The Alzheimer’s Disease Cooperative Study. N Engl J Med 1997;336:216-22.
13. Flicker L, Grimley Evans, J. Piracetam for dementia or cognitive impairment. Cochrane Methodology Review 2003(4).
14. Huppert F, van Niekerk, JK. Dehydroe-piandrosterone (DHEA) supplementation for cognitive function. Cochrane Method-ology Review 2003(4).
15. Frampton M, Harvey, RJ, Kirchner, V. Propentofylline for dementia. Cochrane Methodology Review 2003(4).
16. Hogervorst E, Yaffe, K, Richards, M, Huppert, F. Hormone replacement therapy to maintain cognitive function in women with dementia. Cochrane Methodology Review 2003(4).
17. Tabet N, Feldman, H. Indomethacin for Alzheimer’s disease. The Cochrane Database of Systematic Reviews 2002(2).
References
C H A P T E R 2 7 • N O N - E S TA B L I S H E D P H A R M AC O LO G I C A L T R E AT M E N T S F O R D E M E N T I A D I S O R D E R S
503
18. Tabet N, Feldman, H. Ibuprofen for Alzheimer’s disease. The Cochrane Data-base of Systematic Reviews 2003(2).
19. Reines S, Block GA, et al. Rofecoxib: no effect on Alzheimer’s disease in a 1-year, randomised, blinded, controlled study. Neurology 2004;62:66-71.
20. Birks J, Grimley Evans, J, van Dongen, M. Ginkgo biloba for Cognitive Impair-ment and Dementia. Cochrane Methodo- logy Review 2003(4).
21. Kanowski S, Hoerr, R. Ginkgo biloba extract EGb 761 in dementia: intent-to-treat analyses of a 24-week, multi-center, double-blind, placebo-controlled, randomised trial. Pharmacopsychiatry 2003;36:297-303.
22. Le Bars PL, Kieser M, Itil KZ. A 26-week analysis of a double-blind, placebo-controlled trial of the Ginkgo biloba extract EGb 761 in dementia. Dement Geriatr Cogn Disord 2000;11:230-7.
23. Moini H, Packer L, Saris NE. Anti- oxidant and prooxidant activities of alpha-lipoic acid and dihydrolipoic acid. Toxicol Appl Pharmacol 2002;182:84-90.
24. Bast A, Haenen GR. Lipoic acid: a multifunctional antioxidant. Biofactors 2003;17:207-13.
25. Brunk UT, Terman A. The mito-chondrial-lysosomal axis theory of aging: accumulation of damaged mitochondria as a result of imperfect autophagocytosis. Eur J Biochem 2002;269:1996-2002.
26. Sauer J, Tabet N, Howard R. Alpha lipoic acid for dementia. Cochrane Data-base Syst Rev 2004(1):CD004244.
27. Nägga K, Rådberg, C, Marcusson, J. CT brain findings in clinical dementia investigation – underestimation of mixed dementia. Dement Geriatr Cogn Disord 2004;18:59-66.
28. Sandercock P, Gubitz G, Foley P, Counsell C. Antiplatelet therapy for acute ischaemic stroke. Cochrane Database Syst Rev 2003(2):CD000029.
29. Rands G, Orrel, M, Spector, A, Williams, P. Aspirin for vascular demen- tia (Cochrane Review). The Cochrane Library 2004(1).
30. Schenk D, Barbour R, Dunn W, Gordon G, Grajeda H, Guido T, et al. Immunization with amyloid-beta attenu-ates Alzheimer-disease-like pathology in the PDAPP mouse. Nature 1999;400: 173-7.
31. Schenk D. Amyloid-beta immuno-therapy for Alzheimer’s disease: the end of the beginning. Nat Rev Neurosci 2002;3:824-8.
32. Orgogozo JM, Gilman S, Dartigues JF, Laurent B, Puel M, Kirby LC, et al. Subacute meningoencephalitis in a subset of patients with AD after Abeta42 immu-nization. Neurology 2003;61:46-54.
33. Nicoll JA, Wilkinson D, Holmes C, Steart P, Markham H, Weller RO. Neuropathology of human Alzheimer disease after immunization with amyl- oid-beta peptide: a case report. Nat Med 2003;9:448-52.
34. Robinson SR, Bishop GM, Lee HG, Munch G. Lessons from the AN 1792 Alzheimer vaccine: lest we forget. Neurobiol Aging 2004;25:609-15.


C H A P T E R 2 8 • D E M E N T I A A N D Q U A L I T Y O F L I F E 505
28. Dementia and Quality of Life
Conclusions
There is moderately strong scientific evidence that treatment with rofe-coxib or naproxen has no significant effect on quality of life (QoL) for a period of 12 months in patients with mild to moderate AD (Evidence Grade 2).
There is no scientific evidence that donepezil has any significant effect on quality of life (QoL) in patients with AD. No QoL studies QoL have been published on the other CHEIs or memantine.
There is no scientific evidence for any other QoL interventions.
Questions of interest
• What are the effects of pharmacological treatment in terms of quality of life (QoL)?
• What impact do various intervention programs at a community and individual level have on QoL?
BackgroundQOL is regarded as one of the most important and clinically relevant outcomes when analyzing interventions in dementia [1].
Among the variables that the QoL dimension encompasses are physical, psychological and cognitive health, as well as functional status and social well-being [2]. Evaluating QoL in dementia poses difficulties of its own. Assessments of QoL are normally self-rated, but that is often impossible

D E M E N T I A – D I AG N O S T I C A N D T H E R A P E U T I C I N T E RV E N T I O N S506
when it comes to dementia. Thus, results – such as the subjective well-being of the patient as compared to the views of proxies – may be unre-liable [3]. The use of proxies often produces different ratings than what the patient may be able to offer [3,4]. The patient’s behavior may serve as an alternative or complement [5].
Two types of approaches can be used to assess QoL. Generic scales are applied to all kinds of patients, independently of their disease. Such instruments are exemplified by the sickness impact profile [6], the QLA scale [7], the Short Form 36 (SF-36) [8], the Health Utilities Index (HUI) [9,10], the EuroQoL/EQ-5D [11] and the Index of well- being quality of wellbeing scale (QWBS) [12]. HUI, EQ-5D and QWBS can be used to calculate Quality Adjusted Life Years (QALYs) [13]. The caregiver quality of life index (CQLI) [14] calculates QALYs (effects on caregivers are the focus of an upcoming SBU report).
Scales are customized to analyze the specific disease of interest, demen-tia in this case. Several dementia-specific scales, generally with proxies, have been used for the assessment of QoL [15,16]. Among them are the Dementia Quality of Life Instrument (DQoL) [17], the Quality of Life – AD (QoL-AD) [18,19], the Progressive Deterioration scale (PDS) [20] (which is not included here because it is an ADL rather than a QoL instrument) and Dementia Care Mapping [21]. The Dementia Quality of Life Instrument (DQoL) [17,72] has emerged recently to assess QoL directly from the patient.
Search strategyThe search focused on controlled clinical trials that employed the con-cept of QoL. PubMed, Ingenta, Cochrane Library, NHSEED/THA, HEED, PsycInfo, ERIC, Societal services abstracts and Sociological abstracts were search for studies published in English. The search period was from 1960 (with slight variations depending on the database) to July 31, 2004.
Papers with other concepts such as well-being were not included in the final analysis. Cost-effectiveness/cost utility studies that contained empirical data and identified QALYs/quality of life measurements were

C H A P T E R 2 8 • D E M E N T I A A N D Q U A L I T Y O F L I F E 507
reviewed. The scales mentioned above were also used as search terms in PubMed. The other search terms/MeSH terms/subheadings were dementia/Alzheimer’s disease/Alzheimer disease/Alzheimer and control-led clinical trial.
Studies in the database of this dementia project containing assessments of QoL were also reviewed. Each abstract was reviewed by two people. A total of 2 614 hits were identified in the first round among various databases and 341 in a second, narrower round (duplicates not excluded). For the search terms and results, see Appendix 28.1.
Of the 32 studies that were assessed for quality, 10 were ultimately included (6 regarding programs and 4 regarding drug interventions). Table 28.3 lists the papers that were excluded.
Results
What are the effects of pharmacological treatment in terms of QoL?
Four studies, three on donepezil and one on coxiber, used the same QoL instrument (Table 28.1) [7]. The 3 donepezil studies were considered to be of low quality, given that the appropriateness of the QoL instrument for AD was questionable. Variability was high. Although there were some indications of improved QoL, the results were inconclusive. The study on coxiber was well conducted and showed no significant differ- ence between the groups [22]. While employed by some studies, the PDS scale is not regarded as a QoL instrument (see above) [20]. Thus, such studies were not included.
What are the effects of intervention programs on QoL at the individual and community level?
Six studies were identified – five that was low quality and concerned the present research question, and one that was of medium quality. Four studies were randomised. Generally speaking, the study groups were rather small and thus of low power (Table 28.2). The study by Spector et al was well designed, but the duration and evaluation period were short (7 weeks) [23].

D E M E N T I A – D I AG N O S T I C A N D T H E R A P E U T I C I N T E RV E N T I O N S508
Evidence grade
Pharmacological treatment
There is moderately strong scientific evidence that treatment with rofe-coxib or naproxen has no significant effect on QoL for a period of 12 months in patients with mild to moderate AD (Evidence Grade 2).
There is no evidence, mainly due to the lack of sufficient studies, that donepezil has any significant effect on QoL in patients with AD. No studies have been published on QoL with either the other CHEIs or memantine.
Programs
The evidence is insufficient when it comes to the effects of cognitive stimulation on QoL.
The evidence is insufficient with respect to the effect of other programs (not enough studies) on QoL.
Discussion
Scientific evidence offers no support that pharmacological treatments or intervention programs improve QoL in dementia, probably due to methodological issues and the lack of publications in the field. Almost everyone engaged in dementia research stresses the importance of QoL, while not neglecting methodological issues [1,15,16,24–32]. Neverthe-less, the number of controlled clinical studies in which QoL was exam- ined is quite limited. However, QoL evaluations are more common in connection with various models.
The focus of pharmacological trials is on efficacy outcomes that are important for approval, and perhaps on reimbursement issues (including cognition and global judgments such as CIBIC). Because QoL is not included in these formal requirements, the number of studies with QoL assessments is limited.

C H A P T E R 2 8 • D E M E N T I A A N D Q U A L I T Y O F L I F E 509
Most drug trials are well-designed and based on established principles with regard to efficacy, safety and ethics. The internal validity of such studies is generally high. Discussions about drug trials focus mainly on external validity (generalizability and inclusion/exclusion criteria) and the presentation of results (such as principles for ITT analysis).
Due primarily to methodological issues, programs in the broad sense of the word face many more problems than pharmacologic interventions. For practical reasons, it may be difficult to include a sufficient number of patients (causing low power), the studied intervention may be conta-minated by other interventions, drop-ins and drop-outs may be frequent, the intervention may be difficult to operationalize, and it may be hard to demonstrate the extent to which the program has been completed. Blindness is problematic (single-blinded at best), and randomization is not always possible. Thus, even though a program has certain advan- tages, it may be difficult to satisfy the evidentiary criteria.
Recommendations for future research
There is a need for methodological development (both generic and diagnosis-specific instruments) regarding the assessment of QoL in dementia.
There is a need for studies with combined approaches (such as drugs and programs) and for comparative studies (different CHEIs and CHEIs with other drugs).
The database on programs in general is limited and RCTs are badly needed.

D E M E N T I A – D I AG N O S T I C A N D T H E R A P E U T I C I N T E RV E N T I O N S510
Table 28.1 Studies focusing on effects of pharmacological interventions on quality of life.
Author Year Reference Country
Type of study
Setting Dementia/ Diagnosis
Severity of dementia
Patients (n) included (attrition). Active treat-ment first (treatment(s), placebo)
Age-groups Mean/Range (SD) (treat- ment(s), placebo)
Study period
Drug Primary outcome*
Effects (end) Remarks from reviewer
Quality of study
Rogers et al 1998 [33] USA
RCT Com-munity?
Alzheimer’s disease (NINCDS, DSM-III-R)
Mild-moderate
162+154 +157 (20%, 15%, 32%)
72.6 (56–88), 72.9 (51–86), 74.6 (53–94)
6 months Donepezil, 5 mg, 10 mg, placebo
Patient rated QoL (well-being scale; not spe-cified, but with reference [7])
NS (but rend for donepezil 5 mg at week 24: p = 0.05)
Rather high attrition in 10 mg group
1
Rogers et al 1998 [34] USA
RCT Com-munity?
Alzheimer’s disease (NINCDS, DSM-III-R)
Mild-moderate
157+158+153 (11%, 24%, 12%)
73.8 (50–94), 73.4 (50–92), 74.0 (50–92)
15 weeks Donepezil, 5 mg, 10 mg, placebo
Patient rated QoL (well-being scale; not spe-cified, but with reference [7])
At week 12, QoL better for placebo and donepezil 5 mg vs done-pezil 10 mg (p<0.05)
Short duration. QoL effects due to side-effects of 10 mg?
1
Burns et al 1999 [35] United Kingdom
RCT Com-munity
Alzheimer’s disease (NINCDS, DSM-III-R)
Mild-moderate
271+273+274 (22%, 26%, 20%)
71 (50–90), 72 (51–91), 72 (53–93)
6 months Donepezil Patient rated QoL (well-being scale; not spe-cified, but with reference(7])
NS Placebo, 5, 10 mg donepezil. Rather high attri-tion in donepezil 10 mg. Great variability
1
Aisen et al 2003 [22] USA
RCT Com-munity
Alzheimer’s disease (NINCDS, DSM-III-R)
Mild-moderate
118+122+111 (24%, 27%, 21%)
73.7 (7.2), 74.1 (7.8), 73.8 (8.0)
12 months Naproxen, rofecoxib, placebo
QoLAD NS Well conducted study
3
* From the perspective of this analysis, these outcomes may be secondary in original trials.** Chi2 test own calculations.*** Based on study population in original publication [36].Study quality: 1 = Limited study quality; 2 = Moderately high study quality; 3 = High study quality.
DSM = Diagnostic and statistical manual; NINCDS = National institute of neurological and communicable diseases; ns = Not stated; QoL = Quality of Life; QoLAD = Quality of life Alzheimer’s disease; RCT = Randomised controlled trial; SD = Standard deviation

C H A P T E R 2 8 • D E M E N T I A A N D Q U A L I T Y O F L I F E 511
Table 28.1 Studies focusing on effects of pharmacological interventions on quality of life.
Author Year Reference Country
Type of study
Setting Dementia/ Diagnosis
Severity of dementia
Patients (n) included (attrition). Active treat-ment first (treatment(s), placebo)
Age-groups Mean/Range (SD) (treat- ment(s), placebo)
Study period
Drug Primary outcome*
Effects (end) Remarks from reviewer
Quality of study
Rogers et al 1998 [33] USA
RCT Com-munity?
Alzheimer’s disease (NINCDS, DSM-III-R)
Mild-moderate
162+154 +157 (20%, 15%, 32%)
72.6 (56–88), 72.9 (51–86), 74.6 (53–94)
6 months Donepezil, 5 mg, 10 mg, placebo
Patient rated QoL (well-being scale; not spe-cified, but with reference [7])
NS (but rend for donepezil 5 mg at week 24: p = 0.05)
Rather high attrition in 10 mg group
1
Rogers et al 1998 [34] USA
RCT Com-munity?
Alzheimer’s disease (NINCDS, DSM-III-R)
Mild-moderate
157+158+153 (11%, 24%, 12%)
73.8 (50–94), 73.4 (50–92), 74.0 (50–92)
15 weeks Donepezil, 5 mg, 10 mg, placebo
Patient rated QoL (well-being scale; not spe-cified, but with reference [7])
At week 12, QoL better for placebo and donepezil 5 mg vs done-pezil 10 mg (p<0.05)
Short duration. QoL effects due to side-effects of 10 mg?
1
Burns et al 1999 [35] United Kingdom
RCT Com-munity
Alzheimer’s disease (NINCDS, DSM-III-R)
Mild-moderate
271+273+274 (22%, 26%, 20%)
71 (50–90), 72 (51–91), 72 (53–93)
6 months Donepezil Patient rated QoL (well-being scale; not spe-cified, but with reference(7])
NS Placebo, 5, 10 mg donepezil. Rather high attri-tion in donepezil 10 mg. Great variability
1
Aisen et al 2003 [22] USA
RCT Com-munity
Alzheimer’s disease (NINCDS, DSM-III-R)
Mild-moderate
118+122+111 (24%, 27%, 21%)
73.7 (7.2), 74.1 (7.8), 73.8 (8.0)
12 months Naproxen, rofecoxib, placebo
QoLAD NS Well conducted study
3

D E M E N T I A – D I AG N O S T I C A N D T H E R A P E U T I C I N T E RV E N T I O N S512
Table 28.2 Studies focusing on effects of “programs” on quality of life.
Author Year, reference Country
Type of study
Setting Dementia/ diagnosis
Severity of dementia
Patients (n) included (attrition)
Age-groups (patients) Mean (range or SD)
Study period
Inter-vention (end)
Primary outcome*
Effects (end) Remarks from reviewer
Quality of study
Wimo et al 1995 [37] Sweden
Quasi-experi-mental
Institution (group living)
Clinical (geriatrician)
Mild-moderate-severe
46+62 (0%, 0%)
79 (7), 79 (6)
1 year Group living
QALYs (Index of well-being [12], mapped from GDS [38])
GL less deteriora-tion in QALYs than controls, but no significant calcula-tion given
Empirical part of model. Non-randomised
1
Wimo et al 1994 [39] Sweden
Quasi-experi-mental
Com-munity
Clinical (geriatrician)
Moderate 55+45 (0%) 78 (76–80), 79 (77–81)
1 year Day care QALYs (index of well-being [12] and Rosser index [40], mapped from dif-ferent scales
NS Non-randomised, low power
1
Davis et al 2001 [41] USA
RCT Com- munity (?)
Alzheimer’s disease (NINCDS)
Mild- moderate
19+18 (0%) 68.7 (3.9), 72.6 (7.6)
5 weeks Cognitive stimula-tion
QLA-P [7] NS Small sample-low power, short duration, differen-ce in age between groups
1
Teri et al 2003 [42] USA
RCT Com-munity
Alzheimer’s disease (NINCDS)
Moderate-severe
76+77 (41%, 43%)
78 (6),78 (8)
2 years BPSD + training
SF-36 (part) SF 36 better in program group at 3 months (ITT; p<0.001). After 2 years (completers) SF 36 still better in program group (p<0.01)
Rather low power. Proxy rated SF-36 (by caregivers). 2 years results doubtful due to attrition (eg insti-tutionalized were excluded)
1
Spector et al 2003 [23] United Kingdom
RCT Com-munity
DSM-IV Mild- moderate
115+86 (16%, 19%)
85.7 (6.2), 84.7 (7.9)
7 weeks Cognitive stimula-tion
QoL-AD Treatment group better (p = 0.028) than controls
Short duration 2
Politis et al 2004 [43] USA
RCT Institution DSM-IV Moderate (GDS 3–5)
18+18 (1/37) 84.4 (4.5), 83.5 (4.9)
4 weeks Activity therapy
ADQRL NS Low power, short duration
1
* From the perspective of this analysis, these outcomes may be secondary in original trials.Study quality: 1 = Limited study quality; 2 = Moderately high study quality; 3 = High study quality.

C H A P T E R 2 8 • D E M E N T I A A N D Q U A L I T Y O F L I F E 513
Table 28.2 Studies focusing on effects of “programs” on quality of life.
Author Year, reference Country
Type of study
Setting Dementia/ diagnosis
Severity of dementia
Patients (n) included (attrition)
Age-groups (patients) Mean (range or SD)
Study period
Inter-vention (end)
Primary outcome*
Effects (end) Remarks from reviewer
Quality of study
Wimo et al 1995 [37] Sweden
Quasi-experi-mental
Institution (group living)
Clinical (geriatrician)
Mild-moderate-severe
46+62 (0%, 0%)
79 (7), 79 (6)
1 year Group living
QALYs (Index of well-being [12], mapped from GDS [38])
GL less deteriora-tion in QALYs than controls, but no significant calcula-tion given
Empirical part of model. Non-randomised
1
Wimo et al 1994 [39] Sweden
Quasi-experi-mental
Com-munity
Clinical (geriatrician)
Moderate 55+45 (0%) 78 (76–80), 79 (77–81)
1 year Day care QALYs (index of well-being [12] and Rosser index [40], mapped from dif-ferent scales
NS Non-randomised, low power
1
Davis et al 2001 [41] USA
RCT Com- munity (?)
Alzheimer’s disease (NINCDS)
Mild- moderate
19+18 (0%) 68.7 (3.9), 72.6 (7.6)
5 weeks Cognitive stimula-tion
QLA-P [7] NS Small sample-low power, short duration, differen-ce in age between groups
1
Teri et al 2003 [42] USA
RCT Com-munity
Alzheimer’s disease (NINCDS)
Moderate-severe
76+77 (41%, 43%)
78 (6),78 (8)
2 years BPSD + training
SF-36 (part) SF 36 better in program group at 3 months (ITT; p<0.001). After 2 years (completers) SF 36 still better in program group (p<0.01)
Rather low power. Proxy rated SF-36 (by caregivers). 2 years results doubtful due to attrition (eg insti-tutionalized were excluded)
1
Spector et al 2003 [23] United Kingdom
RCT Com-munity
DSM-IV Mild- moderate
115+86 (16%, 19%)
85.7 (6.2), 84.7 (7.9)
7 weeks Cognitive stimula-tion
QoL-AD Treatment group better (p = 0.028) than controls
Short duration 2
Politis et al 2004 [43] USA
RCT Institution DSM-IV Moderate (GDS 3–5)
18+18 (1/37) 84.4 (4.5), 83.5 (4.9)
4 weeks Activity therapy
ADQRL NS Low power, short duration
1
AD = Alzheimer’s disease; DSM = Diagnostic and statistical manual; GDS = Global deterioration scale; GL = Group living; ITT = Intention to treat; NINCDS = National institute of neurological and communicable diseases; ns = Not stated; QoL = Quality of life; RCT = Randomised controlled trial; SF = Short form

D E M E N T I A – D I AG N O S T I C A N D T H E R A P E U T I C I N T E RV E N T I O N S514
Table 28.3 Excluded papers*.
Author, year, reference Exclusion reason 1
Exclusion reason 2
Exclusion reason 3
Ballard et al, 2002 [44] 3
Ballard et al, 2004 [45] 3
Bottini et al, 1992 [46] 4
Brodaty et al, 2004 [47] 4 1
Challis et al, 2002 [48] 3
Fontaine et al, 2003 [49] 4 1
Knapp et al, 1994 [50] 3
Lawton et al, 1989 [51] 3
Reimer et al, 2004 [52] 3
Sano et al, 1992 [53] 1
Thorgrimsen et al, 2002 [54] 4 1
Wesnes et al, 1987 [55] 2 3
* Furthermore, 4 papers were excluded due to exclusion class 0 (not relevant for the question of interest) and 6 due to exclusion class 9 (no original data presented), a total of 10 papers excluded due to these reasons.See Appendix 2 The Exclusion list.

C H A P T E R 2 8 • D E M E N T I A A N D Q U A L I T Y O F L I F E 515
1. Winblad B, Hill S, Beermann B, Post SG, Wimo A. Issues in the economic evaluation of treatment for dementia. Posi-tion paper from the International Working Group on Harmonization of Dementia Drug Guidelines. Alzheimer Dis Assoc Disord 1997;11:39-45.
2. Winblad B, Wimo A, Almkvist O. Out-come measures in Alzheimer’s disease: do they go far enough? Dement Geriatr Cogn Disord 2000;11 Suppl 1:3-10.
3. Jönsson L. Economic evaluation of treat-ments for Alzheimer’s disease. Stockholm: Karolinska Institutet; 2003.
4. Sands LP, Ferreira P, Stewart AL, Brod M, Yaffe K. What explains differences between dementia patients’ and their care-givers’ ratings of patients’ quality of life? Am J Geriatr Psychiatry 2004;12:272-80.
5. Albert SM, Del Castillo-Castaneda C, Sano M, Jacobs DM, Marder K, Bell K, et al. Quality of life in patients with Alzheim-er’s disease as reported by patient proxies. J Am Geriatr Soc 1996;44:1342-7.
6. Bergner M, Bobbitt RA, Carter WB, Gilson BS. The Sickness Impact Profile: development and final revision of a health status measure. Med Care 1981;19:787-805.
7. Blau TH. Quality of Life, social indica-tors and criteria of change. Prof Psychol 1977;8:464-473.
8. Ware JE, Jr, Sherbourne CD. The MOS 36-item short-form health survey (SF-36). I. Conceptual framework and item selec-tion. Med Care 1992;30:473-83.
9. Torrance GW, Feeny DH, Furlong WJ, Barr RD, Zhang Y, Wang Q. Multiat-tribute utility function for a comprehen-sive health status classification system. Health Utilities Index Mark 2. Med Care 1996;34:702-22.
10. Neumann PJ, Sandberg EA, Araki SS, Kuntz KM, Feeny D, Weinstein MC. A comparison of HUI2 and HUI3 utility scores in Alzheimer’s disease. Med Decis Making 2000;20:413-22.
11. Coucill W, Bryan S, Bentham P, Buckley A, Laight A. EQ-5D in patients with dementia: an investigation of inter-rater agreement. Med Care 2001;39: 760-71.
12. Kerner DN, Patterson TL, Grant I, Kaplan RM. Validity of the Quality of Well-Being Scale for patients with Alzhe-imer’s disease. J Aging Health 1998; 10:44-61.
13. Torrance GW. Preferences for health outcomes and cost-utility analysis. Am J Manag Care 1997;3 Suppl:S8-20.
14. Mohide EA, Torrance GW, Streiner DL, Pringle DM, Gilbert R. Measuring the wellbeing of family caregivers using the time trade-off technique. J Clin Epidemiol 1988;41:475-82.
15. Walker MD, Salek SS, Bayer AJ. A review of quality of life in Alzheimer’s disease. Part 1: Issues in assessing disease impact. Pharmacoeconomics 1998;14: 499-530.
16. Salek SS, Walker MD, Bayer AJ. A review of quality of life in Alzheimer’s
References

D E M E N T I A – D I AG N O S T I C A N D T H E R A P E U T I C I N T E RV E N T I O N S516
disease. Part 2: Issues in assessing drug ef-fects. Pharmacoeconomics 1998;14:613-27.
17. Brod M, Stewart AL, Sands L, Walton P. Conceptualization and measurement of quality of life in dementia: the dementia quality of life instrument (DQoL). Gerontologist 1999;39:25-35.
18. Logsdon RG, Gibbons LE, McCurry SM, Teri L. Assessing quality of life in older adults with cognitive impairment. Psychosom Med 2002;64:510-9. 19. Selai C, Vaughan A, Harvey RJ, Logsdon R. Using the QOL-AD in the UK. Int J Geriatr Psychiatry 2001;16:537-8.
20. DeJong R, Osterlund OW, Roy GW. Measurement of quality-of-life changes in patients with Alzheimer’s disease. Clin Ther 1989;11:545-54.
21. Fossey J, Lee L, Ballard C. Demen-tia Care Mapping as a research tool for measuring quality of life in care settings: psychometric properties. Int J Geriatr Psychiatry 2002;17:1064-70.
22. Aisen PS, Schafer KA, Grundman M, Pfeiffer E, Sano M, Davis KL, et al. Effects of rofecoxib or naproxen vs pla- cebo on Alzheimer disease progression: a randomised controlled trial. JAMA 2003;289:2819-26.
23. Spector A, Thorgrimsen L, Woods B, Royan L, Davies S, Butterworth M, et al. Efficacy of an evidence-based cogni-tive stimulation therapy programme for people with dementia: randomised con-trolled trial. Br J Psychiatry 2003;183:248-54.
24. Howard K, Rockwood K. Quality of life in Alzheimer’s disease. Dementia 1995;6:113-6.
25. Jonsson L, Jonsson B, Wimo A, Whitehouse P, Winblad B. Second inter-national pharmacoeconomic conference on Alzheimer’s disease. Alzheimer Dis Assoc Disord 2000;14:137-40.
26. Lawton MP. Assessing quality of life in Alzheimer disease research. Alzheimer Dis Assoc Disord 1997;11 Suppl 6:91-9.
27. Lawton MP. Quality of life in Alzhe-imer disease. Alzheimer Dis Assoc Disord 1994;8 Suppl 3:138-50.
28. Mack JL, Whitehouse PJ. Quality of Life in Dementia: state of the art – report of the International Working Group for Harmonization of Dementia Drug Guide-lines and the Alzheimer’s Society satellite meeting. Alzheimer Dis Assoc Disord 2001;15:69-71.
29. Adler C, Gunzelmann T, Machold C, Schumacher J, Wilz G. [Perception of stress by caregiving relatives of dementia pa- tients]. Z Gerontol Geriatr 1996;29:143-9.
30. Selai C. Assessing quality of life in dementia. Med Care 2001;39:753-5.
31. Selai C. Assessing quality of life in de-mentia. Aging Ment Health 1999;3:101-11.
32. Whitehouse PJ, Winblad B, Shostak D, Bhattacharjya A, Brod M, Brodaty H, et al. First International Pharmacoeconomic Conference on Alzheimer’s Disease: report and summary. Alzheimer Dis Assoc Disord 1998;12:266-80.

C H A P T E R 2 8 • D E M E N T I A A N D Q U A L I T Y O F L I F E 517
33. Rogers SL, Farlow MR, Doody RS, Mohs R, Friedhoff LT. A 24-week, double-blind, placebo-controlled trial of donepe-zil in patients with Alzheimer’s disease. Donepezil Study Group. Neurology 1998;50:136-45.
34. Rogers SL, Doody RS, Mohs RC, Friedhoff LT. Donepezil improves cogni-tion and global function in Alzheimer disease: a 15-week, double-blind, placebo-controlled study. Donepezil Study Group. Arch Intern Med 1998;158:1021-31.
35. Burns A, Rossor M, Hecker J, Gauthier S, Petit H, Moller HJ, et al. The effects of donepezil in Alzheimer’s disease – results from a multinational trial. Dement Geriatr Cogn Disord 1999;10:237-44.
36. Corey-Bloom J, Anand R, Veach J. A randomised trial evaluating the efficacy and safety of ENA 713 (rivastigmine tar-trate), a new acetylcholineesterase inhibi-tor, in patients with mild to moderately severe Alzheimer’s disease. International Journal of Geriatric Psychopharmacology 1998;1:55-65.
37. Wimo A, Mattson B, Krakau I, Eriksson T, Nelvig A, Karlsson G. Cost-utility analysis of group living in dementia care. Int J Technol Assess Health Care 1995;11:49-65.
38. Reisberg B, Ferris SH, de Leon MJ, Crook T. Global Deterioration Scale (GDS). Psychopharmacol Bull 1988; 24:661-3.
39. Wimo A, Mattsson B, Krakau I, Eriksson T, Nelvig A. Cost-effective-
ness analysis of day care for patients with dementia disorders. Health Econ 1994;3:395-404.
40. Kind P, Rosser R, Williams A. Valu-ation of quality of life: some psycho-metric evidence. In: Jones-Lee M, editor. The value of life and safety. Amsterdam-New York-Oxford: North-Holland Publishing; 1982.
41. Davis RN, Massman PJ, Doody RS. Cognitive intervention in Alzheimer disease: a randomised placebo-control-led study. Alzheimer Dis Assoc Disord 2001;15:1-9.
42. Teri L, Gibbons LE, McCurry SM, Logsdon RG, Buchner DM, Barlow WE, et al. Exercise plus behavioral manage-ment in patients with Alzheimer disease: a randomised controlled trial. JAMA 2003;290:2015-22.
43. Politis AM, Vozzella S, Mayer LS, Onyike CU, Baker AS, Lyketsos CG. A randomised, controlled, clinical trial of activity therapy for apathy in patients with dementia residing in long-term care. Int J Geriatr Psychiatry 2004;19:1087-94.
44. Ballard CG, O’Brien JT, Reichelt K, Perry EK. Aromatherapy as a safe and effective treatment for the management of agitation in severe dementia: the results of a double-blind, placebo-controlled trial with Melissa. J Clin Psychiatry 2002;63:553-8.
45. Ballard CG, Thomas A, Fossey J, Lee L, Jacoby R, Lana MM, et al. A 3-month, randomised, placebo-controlled, neuroleptic discontinuation study in 100 people with dementia: the neuropsychiat-

D E M E N T I A – D I AG N O S T I C A N D T H E R A P E U T I C I N T E RV E N T I O N S518
ric inventory median cutoff is a predictor of clinical outcome. J Clin Psychiatry 2004;65:114-9.
46. Bottini G, Vallar G, Cappa S, Monza GC, Scarpini E, Baron P, et al. Oxirace-tam in dementia: a double-blind, pla-cebo-controlled study. Acta Neurol Scand 1992;86:237-41.
47. Brodaty H, Low LF. Making Mem-ories: pilot evaluation of a new program for people with dementia and their care-givers. Australas J Ageing 2004;23:144-6.
48. Challis D, von Abendorff R, Brown P, Chesterman J, Hughes J. Care manage-ment, dementia care and specialist mental health services: an evaluation. Int J Geriatr Psychiatry 2002;17:315-25.
49. Fontaine CS, Hynan LS, Koch K, Martin-Cook K, Svetlik D, Weiner MF. A double-blind comparison of olanzapine versus risperidone in the acute treatment of dementia-related behavioral disturbances in extended care facilities. J Clin Psychiatry 2003;64:726-30.
50. Knapp MJ, Knopman DS, Solomon PR, Pendlebury WW, Davis CS, Gracon SI. A 30-week randomised controlled trial of high-dose tacrine in patients with Alzhe-
imer’s disease. The Tacrine Study Group. JAMA 1994;271:985-91.
51. Lawton MP, Brody EM, Saperstein AR. A controlled study of respite service for caregivers of Alzheimer’s patients. Gerontologist 1989;29:8-16.
52. Reimer MA, Slaughter S, Donaldson C, Currie G, Eliasziw M. Special care facility compared with traditional environ-ments for dementia care: a longitudinal study of quality of life. J Am Geriatr Soc 2004;52:1085-92.
53. Sano M, Bell K, Cote L, Dooneief G, Lawton A, Legler L, et al. Double-blind parallel design pilot study of acetyl levo- carnitine in patients with Alzheimer’s dis-ease. Arch Neurol 1992;49:1137-41.
54. Thorgrimsen L, Schweitzer P, Orrell M. Evaluating reminiscence for people with dementia: A pilot study. Arts in Psychotherapy 2002;29:93-7.
55. Wesnes K, Simmons D, Rook M, Simpson P. A double-blind placebo- controlled trial of Tanakan in the treat-ment of idiopathic cognitive impairment in the elderly. Human Psychopharma- cology: Clinical & Experimental 1987; 2:159-69.

C H A P T E R 2 8 • D E M E N T I A A N D Q U A L I T Y O F L I F E 519

D E M E N T I A – D I AG N O S T I C A N D T H E R A P E U T I C I N T E RV E N T I O N S520
Appendix 28.1 Search strategy.
Database Search term 1 Search term 2 Search term 3 Results
PubMed Dementia (MeSH) Quality of life (MeSH) 382 (only titles reviewed)
Dementia (MeSH) Controlled clinical trial (MeSH) 525 (only titles reviewed)
Dementia (MeSH) Controlled clinical trial (MeSH) Treatment 491 (only titles reviewed)
Dementia Quality of life Controlled trial 13
Dementia (MeSH) Quality of life (MeSH) Controlled clinical trial (MeSH) 3
Dementia (MeSH) Quality-adjusted life years (MeSH)
Controlled clinical trial (MeSH) 0
Dementia (MeSH) Short form/SF-36/SF-20/SF-12 Controlled clinical trial (MeSH) 0
Dementia (MeSH) Health utilities index/HUI Controlled clinical trial (MeSH) 0
Dementia (MeSH) EuroQol/EQ-5D Controlled clinical trial (MeSH) 0
Dementia (MeSH) QWBS/Index of wellbeing/ quality of well-being scale
Controlled clinical trial (MeSH) 0
Dementia (MeSH) CQLI/Caregiver quality of life index
Controlled clinical trial (MeSH) 0
Dementia (MeSH) DQOL/Dementia Quality of Life Instrument
Controlled clinical trial (MeSH) 0
Dementia (MeSH) PDS/ Progressive Deterioration scale
Controlled clinical trial (MeSH) 0
Dementia (MeSH) QOL-AD/The Quality of Life AD
Controlled clinical trial (MeSH) 0
Alzheimer Disease (MeSH) Quality of life (MeSH) 249 (only titles reviewed)
Appendices

C H A P T E R 2 8 • D E M E N T I A A N D Q U A L I T Y O F L I F E 521
Appendix 28.1 Search strategy.
Database Search term 1 Search term 2 Search term 3 Results
PubMed Dementia (MeSH) Quality of life (MeSH) 382 (only titles reviewed)
Dementia (MeSH) Controlled clinical trial (MeSH) 525 (only titles reviewed)
Dementia (MeSH) Controlled clinical trial (MeSH) Treatment 491 (only titles reviewed)
Dementia Quality of life Controlled trial 13
Dementia (MeSH) Quality of life (MeSH) Controlled clinical trial (MeSH) 3
Dementia (MeSH) Quality-adjusted life years (MeSH)
Controlled clinical trial (MeSH) 0
Dementia (MeSH) Short form/SF-36/SF-20/SF-12 Controlled clinical trial (MeSH) 0
Dementia (MeSH) Health utilities index/HUI Controlled clinical trial (MeSH) 0
Dementia (MeSH) EuroQol/EQ-5D Controlled clinical trial (MeSH) 0
Dementia (MeSH) QWBS/Index of wellbeing/ quality of well-being scale
Controlled clinical trial (MeSH) 0
Dementia (MeSH) CQLI/Caregiver quality of life index
Controlled clinical trial (MeSH) 0
Dementia (MeSH) DQOL/Dementia Quality of Life Instrument
Controlled clinical trial (MeSH) 0
Dementia (MeSH) PDS/ Progressive Deterioration scale
Controlled clinical trial (MeSH) 0
Dementia (MeSH) QOL-AD/The Quality of Life AD
Controlled clinical trial (MeSH) 0
Alzheimer Disease (MeSH) Quality of life (MeSH) 249 (only titles reviewed)
The table continues on the next page

D E M E N T I A – D I AG N O S T I C A N D T H E R A P E U T I C I N T E RV E N T I O N S522
Appendix 28.1 continued
Database Search term 1 Search term 2 Search term 3 Results
Alzheimer Disease (MeSH) Controlled clinical trial (MeSH) 315 (only titles reviewed)
Alzheimer Disease Quality of life Controlled trial 4
Alzheimer Disease (MeSH) Quality of life Controlled clinical trial (MeSH) 2
Alzheimer Disease (MeSH) Quality-adjusted life years (MeSH)
Controlled clinical trial (MeSH)
Alzheimer Disease (MeSH) Short form/SF-36/SF-20/SF-12 Controlled clinical trial (MeSH) 0
Alzheimer Disease (MeSH) Health utilities index/HUI Controlled clinical trial (MeSH) 0
Alzheimer Disease (MeSH) EuroQol/EQ-5D Controlled clinical trial (MeSH) 0
Alzheimer Disease (MeSH) QWBS/Index of wellbeing/ quality of well-being scale
Controlled clinical trial (MeSH) 0
Alzheimer Disease (MeSH) CQLI/Caregiver quality of life index
Controlled clinical trial (MeSH) 0
Alzheimer Disease (MeSH) DQOL/Dementia Quality of Life Instrument
Controlled clinical trial (MeSH) 0
Alzheimer Disease (MeSH) PDS/Progressive Deterioration scale
Controlled clinical trial (MeSH) 0
Alzheimer Disease (MeSH) QOL-AD/The Quality of Life – AD
Controlled clinical trial (MeSH) 3
PsycInfo Dementia Quality of life 311 (titles reviewed, abstracts selected)
Dementia Quality of life Controlled trial 6
Alzheimer(’s) (Disease) Quality of life 31
Alzheimer(’s) (Disease) Quality of life Controlled trial 3

C H A P T E R 2 8 • D E M E N T I A A N D Q U A L I T Y O F L I F E 523
Appendix 28.1 continued
Database Search term 1 Search term 2 Search term 3 Results
Alzheimer Disease (MeSH) Controlled clinical trial (MeSH) 315 (only titles reviewed)
Alzheimer Disease Quality of life Controlled trial 4
Alzheimer Disease (MeSH) Quality of life Controlled clinical trial (MeSH) 2
Alzheimer Disease (MeSH) Quality-adjusted life years (MeSH)
Controlled clinical trial (MeSH)
Alzheimer Disease (MeSH) Short form/SF-36/SF-20/SF-12 Controlled clinical trial (MeSH) 0
Alzheimer Disease (MeSH) Health utilities index/HUI Controlled clinical trial (MeSH) 0
Alzheimer Disease (MeSH) EuroQol/EQ-5D Controlled clinical trial (MeSH) 0
Alzheimer Disease (MeSH) QWBS/Index of wellbeing/ quality of well-being scale
Controlled clinical trial (MeSH) 0
Alzheimer Disease (MeSH) CQLI/Caregiver quality of life index
Controlled clinical trial (MeSH) 0
Alzheimer Disease (MeSH) DQOL/Dementia Quality of Life Instrument
Controlled clinical trial (MeSH) 0
Alzheimer Disease (MeSH) PDS/Progressive Deterioration scale
Controlled clinical trial (MeSH) 0
Alzheimer Disease (MeSH) QOL-AD/The Quality of Life – AD
Controlled clinical trial (MeSH) 3
PsycInfo Dementia Quality of life 311 (titles reviewed, abstracts selected)
Dementia Quality of life Controlled trial 6
Alzheimer(’s) (Disease) Quality of life 31
Alzheimer(’s) (Disease) Quality of life Controlled trial 3
The table continues on the next page

D E M E N T I A – D I AG N O S T I C A N D T H E R A P E U T I C I N T E RV E N T I O N S524
Appendix 28.2 The exclusion list
0. Outside the research question, so quality is not assessed. The appa-rent irrelevance is a result of insufficient coding in databases or an insufficient search strategy
1. Insufficient number of subjects/low power
2. Inadequate description/selection of subjects, abstracts
3. Inadequate methods/instruments to measure outcomes/effects/ consequences
Appendix 28.1 continued
Database Search term 1 Search term 2 Search term 3 Results
CRD: NHSEED/HTA
Dementia Quality of life 10
Alzheimer(’s) (Disease) Quality of life 12
Alzheimer(’s) (Disease) Quality of life 42
Ingenta Dementia Quality of life 125
Alzheimer(’s) (Disease) Quality of life 39
Cochrane Dementia Quality of life 2
Alzheimer(’s) (Disease) Quality of life 1

C H A P T E R 2 8 • D E M E N T I A A N D Q U A L I T Y O F L I F E 525
Appendix 28.1 continued
Database Search term 1 Search term 2 Search term 3 Results
CRD: NHSEED/HTA
Dementia Quality of life 10
Alzheimer(’s) (Disease) Quality of life 12
Alzheimer(’s) (Disease) Quality of life 42
Ingenta Dementia Quality of life 125
Alzheimer(’s) (Disease) Quality of life 39
Cochrane Dementia Quality of life 2
Alzheimer(’s) (Disease) Quality of life 1
4. Inadequate design
5. Inadequate data collection/high attrition/drop-out/drop-in rate
6. Inadequate statistical methods/calculations
7. Inadequate ethics
8. Serious conflict of interest
9. No original data (such as reviews)
10. Miscellaneous.


C H A P T E R 2 9 • D E M E N T I A A N D M O RTA L I T Y 527
29. Dementia and Mortality
Conclusions
There is moderately strong scientific evidence that interventions with acetylcholine esterase inhibitors, coxiber and memantine, as well as caregiver support programs, have no effect on mortality for a period of 6–12 months (Evidence Grade 2).
There is strong evidence that treatment with antipsychotics (as a group) carries a small risk of increased death (Evidence Grade 1).
Questions of interest
• Do pharmacological interventions have any effect on mortality in dementia?
• Do environmental interventions (programs) have any effect on mortality in dementia?
Background
Whether intervention effects on mortality (prolonging life) is a rele-vant clinical outcome in dementia care is a matter for discussion [1]. The outcomes discussed in other sections of this report – such as QoL, severity and institutionalization – may be regarded as more meaningful. Nevertheless, while mortality may be a traditional aspect of safety, pro-longed survival also has implications for resource utilization, costs and outcome. As a definite end-point in any intervention, mortality influ-ences long-term resource utilization and costs but is seldom presented as such in studies with short duration/follow-up. This section includes

D E M E N T I A – D I AG N O S T I C A N D T H E R A P E U T I C I N T E RV E N T I O N S528
only studies that contain empirical data on mortality and that lasted for 6 months or more. Models were not considered. The focus is on patient mortality. Because many studies did not regard mortality as the primary outcome, the statistical significance of the effect on mortality was often estimated on the basis of the reviewers’ Chi-2 calculations. This review did not include studies on mild cognitive impairment (MCI).
Search results
PubMed, Ingenta, Cochrane Library, NHSEED/THA, HEED, PsycInfo, ERIC, Societal services abstracts and Sociological abstracts were searched for studies published in English. The search period was 1960 (or the years immediately before and after, depending on database) through July 31, 2004. For the search terms and results, see Appendix 29.1. A total of 286 hits were identified (excluding the first broad search). Mortality was seldom the main focus of the studies. Thus, mortality figures were extracted from the database of intervention studies (drug and interventions programs). Altogether, 39 studies (21 with drug treat-ment and 18 with programs) of acceptable quality and duration of 6 or more months were included. Due to the somewhat unsystematic search approach, it is not meaningful to list the excluded papers. However, since there have been reports of mortality when people with dementia were given atypical antipsychotic drugs, a recently published systematic review was included [2]. Furthermore, new searches in PubMed were undertaken with a focus on atypical antipsychotic drugs and antidepres-sive agents, second-generation (mainly SSRIs), with the following search terms:
“Dementia” [MeSH] AND “Antipsychotic Agents” [MeSH] AND “Mortality” [MeSH] (nine hits, none of interest).
“Dementia” [MeSH] AND “Mortality” [MeSH] AND “Antidepressive Agents, Second-Generation” [MeSH] (no hits).

C H A P T E R 2 9 • D E M E N T I A A N D M O RTA L I T Y 529
Results
Pharmacological treatmentEffects on mortality were identified in 21 pharmacological studies with a duration of 6 months or more (Table 29.1). Seventeen of them were RCTs with a duration of 6–24 months. AD 2000 was a three-year study [3]. One study lasted for 2 years [4] and the others for 6–12 months. Few deaths occurred during a well conducted study on rofecoxib and naproxen vs placebo [5]. Different methods were used to postpone the observation period, and to create comparison groups, in the observa-tional studies. Two of them were extensions of RCTs [6,7], while the other two were non-RCTs from the beginning [8,9]. All 4 observational studies may be characterized as low-quality. The RCTs showed any effects on survival. Fewer than 100 out of almost 7 000 patients died during the RCTs on cholinesterase inhibitors (some trials were published in more than one paper, making the calculations somewhat difficult), yielding a mortality rate of less than 1.5%. One observational study on nursing home residents showed that those treated with tacrine survived longer [8]. Two studies found indications of prolonged survival in cer-tain analyzed CHEI treatment options [7,9]. The fourth study showed prolonged survival from tacrine treatment that was almost significant (p = 0.06) [6]. Two 6-month studies with memantine detected no effects on mortality.
The systematic review of atypical antipsychotic drug treatment (which focused on drugs marketed in the United States) included 15 trials (9 unpublished). The meta-analysis showed a small increased risk for death in those treated with the drugs as a group (odds ratio 1.54, 95% confi-dence interval 1.06–2.23) [2]. However, the results were not significant for individual drugs.
ProgramsEighteen studies on programs identified effects on mortality (Table 29.2).The observation periods were 6 to 39 months. Nine of these studies were RCTs and eight were quasi-experimental. Four studies were regarded as moderate quality and the others as low quality. Many of the studies had

D E M E N T I A – D I AG N O S T I C A N D T H E R A P E U T I C I N T E RV E N T I O N S530
rather small populations, leading to power problems. Only one study (of low quality) observed effects on mortality [10].
Evidence grades for effects on mortalityPharmacological treatment: There is moderately strong scientific evid- ence (Evidence Grade 2) that pharmacological interventions with acetyl-choline esterase inhibitors have no effect on mortality within the time span studied (6–12 months). No statement concerning evidence can be made for longer treatment periods.
There is moderately strong scientific evidence that pharmacological interventions with rofecoxib or naproxen have no effect on mortality for a period of one year (Evidence Grade 2).
There is moderately strong scientific evidence (Evidence Grade 2) that pharmacological interventions with memantine have no effect on mor- tality for a period of 6 months.
There is strong evidence that treatment with antipsychotics (as a group) carries a small risk of increased death (Evidence Grade 1).
Programs: There is moderately strong scientific evidence that caregiver support programs have no effect on mortality for a period of one year (Evidence Grade 2). No statement concerning evidence can be made for longer treatment periods or other programs.
Discussion
There is no support based on scientific evidence that pharmacological treatments or intervention programs either reduce or increase mortality in dementia care.
Mortality is generally not regarded as an outcome of interest per se, but most studies include information on mortality as a safety consideration (drug trials) or in flow charts of the way in which their populations changed over time. Mortality is likely to occur over a period of years.

C H A P T E R 2 9 • D E M E N T I A A N D M O RTA L I T Y 531
Thus, it is not surprising (given that duration is often rather short) that the available information is limited. Long-term studies are difficult to conduct, and practical problems arise when it comes to collecting data over an extended period of time. It is also difficult to maintain an RCT design for several years. Thus, finding valid control groups/comparators is no easy task. That is unsatisfactory from a long-term resource utiliza-tion point of view. Because dementia disorders are expensive to treat, a prolonged period of survival as the result of any intervention may affect resource utilization and costs. This does not necessarily imply poorer cost effectiveness, given that the outcome may justify prolonged survival. Institutionalization and mortality interact in a complex manner – for instance, reduced mortality may increase the period of institutional care.
Recommendations for future research
There is a need for studies that focus on the long-term effects of diffe-rent interventions on mortality.

D E M E N T I A – D I AG N O S T I C A N D T H E R A P E U T I C I N T E RV E N T I O N S532
Table 29.1 Studies focusing on effects of pharmacological treatment on mortality.
Author Year, reference Country
Type of study
Setting Dementia/ diagnosis
Severity of dementia
Patients (n) included (attrition). Active treatment first (treatment(s), placebo)
Age-groups Mean/Range (SD) (treatment(s), placebo)
Study period
Drug Primary out-come*
Effects (end) Remarks from reviewer
Quality of study
Sano et al 1997 [4]USA
RCT Com-munity
Alzheimer’s disease (CDR)
Moderate 341 (7%) 72.7–73.9 (7.1–8.9)
2 years Selege- line (S), Vita-mine E, S + E
Mortality NS in all com-binations ** (41 deaths)
Significant effects only after baseline adjustments. Vitamin E dose high
2
Knopman et al1996 [6]USA
Obser- vational study
Com-munity
Alzheimer’s disease (NINCDS)
Mild-moderate
663 (10%) 71.5–73.9 (7.5–8.2)
≥2 years
Tacrine high dose vs low dose
Mortality NS (p = 0.06 for increased survival with high dose tacrine vs low dose) 81 deaths
Initial RCT not main- tained
1
Ott et al2002 [8]USA
Obser- vational study
Nursing home
Clinical Mild-moderate-severe
1 449+6 119 82 (7.2), 84 (7.6)
3 years Tacrine Mortality Tacrine users, particularly high dose users, have longer survival (HRR 0.76, 95% CI 0.70–0.83)
Not an RCT. Retrospective. Only nursing home residents. Validity of diagnoses questionable
1
Rogers et al1998 [11]USA
RCT Com-munity
Alzheimer’s disease (NINCDS, DSM-III-R)
Mild-moderate
162+154+157 (20%, 15%, 32%)
72.6 (56–88), 72.9 (51–86), 74.6 (53–94)
6 months
Done-pezil
Mortality NS (2 deaths in total)
Placebo, 5, 10 mg donepezil. Rather high attrition in 10 mg group. Short duration
2
Burns et al1999 [12]United Kingdom
RCT Com-munity
Alzheimer’s disease (NINCDS, DSM-III-R)
Mild-moderate
274+271+273 (20%, 22%, 26%)
71 (50–90), 72 (51–91), 72 (53–93)
6 months
Done-pezil
Mortality NS (5 deaths in total)
Placebo, 5, 10 mg donepezil. Rather high attrition
2
Feldman et al2001 [13]Canada
RCT Com-munity
Alzheimer’s disease (NINCDS)
Moderate-severe
144+146 (16%, 14%)
73.3 (52–92), 74.0 (48–92)
6 months
Done-pezil
Mortality NS (1 death) Rather low power
2

C H A P T E R 2 9 • D E M E N T I A A N D M O RTA L I T Y 533
Table 29.1 Studies focusing on effects of pharmacological treatment on mortality.
Author Year, reference Country
Type of study
Setting Dementia/ diagnosis
Severity of dementia
Patients (n) included (attrition). Active treatment first (treatment(s), placebo)
Age-groups Mean/Range (SD) (treatment(s), placebo)
Study period
Drug Primary out-come*
Effects (end) Remarks from reviewer
Quality of study
Sano et al 1997 [4]USA
RCT Com-munity
Alzheimer’s disease (CDR)
Moderate 341 (7%) 72.7–73.9 (7.1–8.9)
2 years Selege- line (S), Vita-mine E, S + E
Mortality NS in all com-binations ** (41 deaths)
Significant effects only after baseline adjustments. Vitamin E dose high
2
Knopman et al1996 [6]USA
Obser- vational study
Com-munity
Alzheimer’s disease (NINCDS)
Mild-moderate
663 (10%) 71.5–73.9 (7.5–8.2)
≥2 years
Tacrine high dose vs low dose
Mortality NS (p = 0.06 for increased survival with high dose tacrine vs low dose) 81 deaths
Initial RCT not main- tained
1
Ott et al2002 [8]USA
Obser- vational study
Nursing home
Clinical Mild-moderate-severe
1 449+6 119 82 (7.2), 84 (7.6)
3 years Tacrine Mortality Tacrine users, particularly high dose users, have longer survival (HRR 0.76, 95% CI 0.70–0.83)
Not an RCT. Retrospective. Only nursing home residents. Validity of diagnoses questionable
1
Rogers et al1998 [11]USA
RCT Com-munity
Alzheimer’s disease (NINCDS, DSM-III-R)
Mild-moderate
162+154+157 (20%, 15%, 32%)
72.6 (56–88), 72.9 (51–86), 74.6 (53–94)
6 months
Done-pezil
Mortality NS (2 deaths in total)
Placebo, 5, 10 mg donepezil. Rather high attrition in 10 mg group. Short duration
2
Burns et al1999 [12]United Kingdom
RCT Com-munity
Alzheimer’s disease (NINCDS, DSM-III-R)
Mild-moderate
274+271+273 (20%, 22%, 26%)
71 (50–90), 72 (51–91), 72 (53–93)
6 months
Done-pezil
Mortality NS (5 deaths in total)
Placebo, 5, 10 mg donepezil. Rather high attrition
2
Feldman et al2001 [13]Canada
RCT Com-munity
Alzheimer’s disease (NINCDS)
Moderate-severe
144+146 (16%, 14%)
73.3 (52–92), 74.0 (48–92)
6 months
Done-pezil
Mortality NS (1 death) Rather low power
2
The table continues on the next page

D E M E N T I A – D I AG N O S T I C A N D T H E R A P E U T I C I N T E RV E N T I O N S534
Table 29.1 continued
Author Year, reference Country
Type of study
Setting Dementia/ diagnosis
Severity of dementia
Patients (n) included (attrition). Active treatment first (treatment(s), placebo)
Age-groups Mean/Range (SD) (treatment(s), placebo)
Study period
Drug Primary out- come*
Effects (end) Remarks from reviewer
Quality of study
Mohs et al2001 [14]USA
RCT Com-munity
Alzheimer’s disease (NINCDS, DSM-IV)
Moderate 217+214 (28%, 26%) 75.3 (49–94), 75.4 (50–91)
12 months
Done-pezil
Mortality NS (7 deaths) External validity questionable due to exclusion criteria
2
Winblad et al 2001 [15]Europe
RCT Com-munity
Alzheimer’s disease (NINCDS, DSM-IV)
Mild-moderate
142+144 (33%, 33%) 72.1 (49–86), 72.9 (51–88)
12 months
Done-pezil
Mortality NS (7 deaths) High attrition, rather low power
1
Geldmacher et al2003 [7]USA
Obser-vational study
Com-munity
Alzheimer’s disease (NINCDS, DSM-IV)
Mild-moderate
1 115 (40%) 73.3 Max 96 months
Done-pezil
Mortality 266 deaths. Delayed start group lower mortality than minimum use (p = 0.013)
High attrition, initial RCT not maintained, pooled data from several studies, four groups (minimum use to maximal use of donepezil)
1
Corey-Bloom et al1998 [16]USA
RCT Com-munity
Alzheimer’s disease (NINCDS, DSM-IV)
Mild-moderate
233+231+235 (15%, 35%, 16%)
74.8 (45–89), 74.9 (45–89), 73.8 (50–89)
6 months
Rivastig-mine
Mortality NS (1 death) 1–4 mg, 6–12 mg, placebo. High attrition in 6–12 mg group
2
Rösler et al1999 [17]Germany
RCT Com-munity
Alzheimer’s disease (NINCDS, DSM-IV)
Mild-moderate
243+243+239 (13%, 33%, 14%)
72 (45–95) 6 months
Rivastig-mine
Mortality NS (1 death) 1–4 mg, 6–12 mg, placebo. High attrition in 6–12 mg group
2

C H A P T E R 2 9 • D E M E N T I A A N D M O RTA L I T Y 535
Table 29.1 continued
Author Year, reference Country
Type of study
Setting Dementia/ diagnosis
Severity of dementia
Patients (n) included (attrition). Active treatment first (treatment(s), placebo)
Age-groups Mean/Range (SD) (treatment(s), placebo)
Study period
Drug Primary out- come*
Effects (end) Remarks from reviewer
Quality of study
Mohs et al2001 [14]USA
RCT Com-munity
Alzheimer’s disease (NINCDS, DSM-IV)
Moderate 217+214 (28%, 26%) 75.3 (49–94), 75.4 (50–91)
12 months
Done-pezil
Mortality NS (7 deaths) External validity questionable due to exclusion criteria
2
Winblad et al 2001 [15]Europe
RCT Com-munity
Alzheimer’s disease (NINCDS, DSM-IV)
Mild-moderate
142+144 (33%, 33%) 72.1 (49–86), 72.9 (51–88)
12 months
Done-pezil
Mortality NS (7 deaths) High attrition, rather low power
1
Geldmacher et al2003 [7]USA
Obser-vational study
Com-munity
Alzheimer’s disease (NINCDS, DSM-IV)
Mild-moderate
1 115 (40%) 73.3 Max 96 months
Done-pezil
Mortality 266 deaths. Delayed start group lower mortality than minimum use (p = 0.013)
High attrition, initial RCT not maintained, pooled data from several studies, four groups (minimum use to maximal use of donepezil)
1
Corey-Bloom et al1998 [16]USA
RCT Com-munity
Alzheimer’s disease (NINCDS, DSM-IV)
Mild-moderate
233+231+235 (15%, 35%, 16%)
74.8 (45–89), 74.9 (45–89), 73.8 (50–89)
6 months
Rivastig-mine
Mortality NS (1 death) 1–4 mg, 6–12 mg, placebo. High attrition in 6–12 mg group
2
Rösler et al1999 [17]Germany
RCT Com-munity
Alzheimer’s disease (NINCDS, DSM-IV)
Mild-moderate
243+243+239 (13%, 33%, 14%)
72 (45–95) 6 months
Rivastig-mine
Mortality NS (1 death) 1–4 mg, 6–12 mg, placebo. High attrition in 6–12 mg group
2
The table continues on the next page

D E M E N T I A – D I AG N O S T I C A N D T H E R A P E U T I C I N T E RV E N T I O N S536
Table 29.1 continued
Author Year, reference Country
Type of study
Setting Dementia/ diagnosis
Severity of dementia
Patients (n) included (attrition). Active treatment first (treatment(s), placebo)
Age-groups Mean/Range (SD) (treatment(s), placebo)
Study period
Drug Primary out-come*
Effects (end) Remarks from reviewer
Quality of study
Farlow et al2000 [18]USA
RCT Com-munity
Alzheimer’s disease (NINCDS, DSM-IV)
Mild- moderate
233+231+235 (35%, 46%, 39%)***
74.8 (45–89), 74.9 (45–89), 73.8 (50–89)
12 months
Rivastig-mine
Mortality NS (5 deaths) Extension of Corey-Bloom [16]. High attrition in 6–12 mg group
2
Wilcock et al2000 [19]United Kingdom
RCT Com-munity
Alzheimer’s disease (NINCDS)
Mild-moderate
220+218+215(20%, 25%, 13%)
71.9 (8.3), 72.1 (8.6), 72.7 (7.6)
6 months
Galan- tamine (24 mg, 32 mg)
Mortality NS (no deaths) External validity questionable due to exclusion criteria
2–3
Raskind et al2000 [20]USA
RCT Com-munity?
Alzheimer’s disease (NINCDS)
Mild-moderate
212 (32% 6 months, 55% 12 months, 211 (42% 6 months, 59% 12 months), 213 (19% 6 months, 60% 12 months)
75.3, 75.9, 75.0
6 months (+ 6 months open label)
Galan- tamine (24 mg, 32 mg)
Mortality NS (2 deaths) Rather high attrition, particularly in 12 months
2
Erkinjuntti et al2002 [21]
RCT ? AD with CVD-disease and VaD (NINDS-AIREN, NINCDS-ADRDA)
Mild-moderate
396 (26%), 196 (17%) 75.0 (6.8), 75.2 (7.3)
6 months
Galan- tamine 24 mg
Mortality NS (9 deaths)**
Higher attrition in galantamine group (p<0.05)**
2
Bullock et al 2004 [22]United Kingdom
RCT ? AD with CVD-disease and VaD (NINDS-AIREN, NINCDS-ADRDA)
Mild-moderate
188 (19% 6 months, 35% 12 months), 97 (11% 6 months, 44% 12 months)
77.6, 75.8 6 months (+6 months open label)
Galan- tamine 24 mg
Mortality NS? (1.6%, group differences not specified)
Rather low power, high attrition in 12 months
2

C H A P T E R 2 9 • D E M E N T I A A N D M O RTA L I T Y 537
Table 29.1 continued
Author Year, reference Country
Type of study
Setting Dementia/ diagnosis
Severity of dementia
Patients (n) included (attrition). Active treatment first (treatment(s), placebo)
Age-groups Mean/Range (SD) (treatment(s), placebo)
Study period
Drug Primary out-come*
Effects (end) Remarks from reviewer
Quality of study
Farlow et al2000 [18]USA
RCT Com-munity
Alzheimer’s disease (NINCDS, DSM-IV)
Mild- moderate
233+231+235 (35%, 46%, 39%)***
74.8 (45–89), 74.9 (45–89), 73.8 (50–89)
12 months
Rivastig-mine
Mortality NS (5 deaths) Extension of Corey-Bloom [16]. High attrition in 6–12 mg group
2
Wilcock et al2000 [19]United Kingdom
RCT Com-munity
Alzheimer’s disease (NINCDS)
Mild-moderate
220+218+215(20%, 25%, 13%)
71.9 (8.3), 72.1 (8.6), 72.7 (7.6)
6 months
Galan- tamine (24 mg, 32 mg)
Mortality NS (no deaths) External validity questionable due to exclusion criteria
2–3
Raskind et al2000 [20]USA
RCT Com-munity?
Alzheimer’s disease (NINCDS)
Mild-moderate
212 (32% 6 months, 55% 12 months, 211 (42% 6 months, 59% 12 months), 213 (19% 6 months, 60% 12 months)
75.3, 75.9, 75.0
6 months (+ 6 months open label)
Galan- tamine (24 mg, 32 mg)
Mortality NS (2 deaths) Rather high attrition, particularly in 12 months
2
Erkinjuntti et al2002 [21]
RCT ? AD with CVD-disease and VaD (NINDS-AIREN, NINCDS-ADRDA)
Mild-moderate
396 (26%), 196 (17%) 75.0 (6.8), 75.2 (7.3)
6 months
Galan- tamine 24 mg
Mortality NS (9 deaths)**
Higher attrition in galantamine group (p<0.05)**
2
Bullock et al 2004 [22]United Kingdom
RCT ? AD with CVD-disease and VaD (NINDS-AIREN, NINCDS-ADRDA)
Mild-moderate
188 (19% 6 months, 35% 12 months), 97 (11% 6 months, 44% 12 months)
77.6, 75.8 6 months (+6 months open label)
Galan- tamine 24 mg
Mortality NS? (1.6%, group differences not specified)
Rather low power, high attrition in 12 months
2
The table continues on the next page

D E M E N T I A – D I AG N O S T I C A N D T H E R A P E U T I C I N T E RV E N T I O N S538
* From the perspective of this analysis, these outcomes may be secondary in original trials.** Chi2 test own calculations.*** Based on study population in original publication [16].Study quality: 1 = Limited study quality; 2 = Moderately high study quality; 3 = High study quality.
Table 29.1 continued
Author Year, reference Country
Type of study
Setting Dementia/ diagnosis
Severity of dementia
Patients (n) included (attrition). Active treatment first (treatment(s), placebo)
Age-groups Mean/Range (SD) (treatment(s), placebo)
Study period
Drug Primary out-come*
Effects (end) Remarks from reviewer
Quality of study
Lopez2002 [9]USA
Obser- vational
Com-munity
Clinical Mild- moderate (?)
135+135 72.7 (7.2), 72.8 (8.4)
3 years (aver- age)
CHEIs Mortality Endpoint mortality significantly lower in CHEI-group (p <0.001), but survival analysis NS (RR 0.38, 95% CI 0.14–1.08). 69 deaths
Not a RCT, diagnose accurancy not clear. Odd under- inter-preta-tion of mortality figures
1
Reisberg et al2003 [23]USA
RCT Com-munity
DSM-IV, Alzheimer’s disease (NINCDS), 283
Moderate-severe
126 (23%), 126 (33%) 75.5 (8.2), 75.8 (7.3)
6 months
Meman-tine
Mortality NS (7 deaths) High attrition, rather low power
2
Tariot et al2004 [24]USA
RCT Com-munity
Alzheimer’s disease (NINCDS)
Moderate-severe
203 (15%), 201 (25%) 75.5 (8.5), 75.5 (8.7)
6 months
Done-pezil, meman-tine
Mortality NS (no deaths) No placebo group
2
Courtney et al “AD 2000”2004 [3]United Kingdom
RCT Com-munity
DSM IV-AD Mild- moderate
282 (32% withdrawn), 283 (31% withdrawn)
76 (54–93), 75 (46–90)
3 years Done-pezil
Mortality NS (22 in each group)
High attrition, unusual inclusion criteria
1
Aisen et al2003 [5]USA
RCT Com-munity
Alzheimer’s disease (NINCDS, DSM-III-R)
Mild- moderate
118+122+111 (24%, 27%, 21%)
73.7 (7.2), 74.1 (7.8), 73.8 (8.0)
12 months
Napro- xen, rofe-coxib, placebo
Mortality NS (4 deaths) Well conduc-ted study
3

C H A P T E R 2 9 • D E M E N T I A A N D M O RTA L I T Y 539
Table 29.1 continued
Author Year, reference Country
Type of study
Setting Dementia/ diagnosis
Severity of dementia
Patients (n) included (attrition). Active treatment first (treatment(s), placebo)
Age-groups Mean/Range (SD) (treatment(s), placebo)
Study period
Drug Primary out-come*
Effects (end) Remarks from reviewer
Quality of study
Lopez2002 [9]USA
Obser- vational
Com-munity
Clinical Mild- moderate (?)
135+135 72.7 (7.2), 72.8 (8.4)
3 years (aver- age)
CHEIs Mortality Endpoint mortality significantly lower in CHEI-group (p <0.001), but survival analysis NS (RR 0.38, 95% CI 0.14–1.08). 69 deaths
Not a RCT, diagnose accurancy not clear. Odd under- inter-preta-tion of mortality figures
1
Reisberg et al2003 [23]USA
RCT Com-munity
DSM-IV, Alzheimer’s disease (NINCDS), 283
Moderate-severe
126 (23%), 126 (33%) 75.5 (8.2), 75.8 (7.3)
6 months
Meman-tine
Mortality NS (7 deaths) High attrition, rather low power
2
Tariot et al2004 [24]USA
RCT Com-munity
Alzheimer’s disease (NINCDS)
Moderate-severe
203 (15%), 201 (25%) 75.5 (8.5), 75.5 (8.7)
6 months
Done-pezil, meman-tine
Mortality NS (no deaths) No placebo group
2
Courtney et al “AD 2000”2004 [3]United Kingdom
RCT Com-munity
DSM IV-AD Mild- moderate
282 (32% withdrawn), 283 (31% withdrawn)
76 (54–93), 75 (46–90)
3 years Done-pezil
Mortality NS (22 in each group)
High attrition, unusual inclusion criteria
1
Aisen et al2003 [5]USA
RCT Com-munity
Alzheimer’s disease (NINCDS, DSM-III-R)
Mild- moderate
118+122+111 (24%, 27%, 21%)
73.7 (7.2), 74.1 (7.8), 73.8 (8.0)
12 months
Napro- xen, rofe-coxib, placebo
Mortality NS (4 deaths) Well conduc-ted study
3
AD = Alzheimer’s disease; CHEIs = cholinesterase inhibitor; CI = Confidence interval; CVD = Cerebrovascular disease; DSM = Diagnostic and statistical manual; NINCDS = National institute of neurological and communicable diseases; ns = not stated; p = points; RCT = Randomised controlled trial; SD = Standard deviation; VaD = Vascular dementia

D E M E N T I A – D I AG N O S T I C A N D T H E R A P E U T I C I N T E RV E N T I O N S540
Table 29.2 Studies focusing on “programs’’ effects on mortality.
Author Year, reference Country
Type of study
Setting Dementia/diagnosis
Severity of demen-tia
Patients (n) included (attrition)
Age-groups (patients) Mean (range or SD)
Study period
Intervention (end)
Out-come*
Effects (end)
Remarks from reviewer
Quality of study
Engedal 1989 [25]Norway
RCT Community, Norway
DSM-III – 38+39 (0%) 79 (75–88), 80 (75–89)
1 year Day care Mortality NS** (10 deaths)
Low power 1
Lawton et al1989 [26]USA
RCT Community, USA
Clinical AD?, MSQ***
? 315+317 76.7, 76.1
1 year Respite care Mortality NS** (126 deaths)
Patient description limited
2
Mohide et al1990 [27]Canada
RCT Community, Canada
Clinical, DRS****, GDS
87.90% moderate, moderate-severe
30+30 (0% for inst follow-up)
77.8 (9.2),75.9 (7.7)
6 months
CGS Mortality NS** (no deaths)
Low power 1
Brodaty et al1991 [28]Australia
Quasi-experi-mental
Community, Australia
DSM-III, CDR
Mild- moderate
100 (4%) 70.2 (49–79) 39 months
Caregiver sup-port (CGS), memory training (MT), waiting list (WL)
Mortality NS** (between CGS and other groups) 22 deaths
Non ran- domized, low power
1
O´Connor et al1991 [29]United Kingdom
Quasi-experi-mental
Community, United Kingdom
MMSE, Camdex
Mild- moderate-severe
86+73 (44%, 42%) (0% for mor-tality analysis)
83.7, 83.7
2 years CGS/Social support
Mortality NS (69 deaths)
Rather low power, non randomised, 69% in the action group received the intervention
1
Wimo et al1993 [30]Sweden
Quasi-experi-mental
Institution Clinical Severe 43+40 82 (62–96), 83 (63–92)
10 months
Multifaceted Mortality NS** (20 deaths)
Rather low power, non-randomised
0–1
Mittelman1993 [31]USA
RCT Community, USA
Clinical AD, GDS
Mild-moderate-severe
103+103 (0.5%)
(age class proportions)
1 year CGS/Social support
Mortality NS** (18 deaths)
Diagnose clinical
2
Wimo et al1993 [32]Sweden
Quasi-experi-mental
Community, Sweden
Clinical (Geriatri-cian)
Moderate 55+44 (0%) 77.9 (76.0–77.9),78.6 (77.1–80.5)
1 year Day care Mortality NS** (21 deaths)
Non ran- domized, low power
1

C H A P T E R 2 9 • D E M E N T I A A N D M O RTA L I T Y 541
Table 29.2 Studies focusing on “programs’’ effects on mortality.
Author Year, reference Country
Type of study
Setting Dementia/diagnosis
Severity of demen-tia
Patients (n) included (attrition)
Age-groups (patients) Mean (range or SD)
Study period
Intervention (end)
Out-come*
Effects (end)
Remarks from reviewer
Quality of study
Engedal 1989 [25]Norway
RCT Community, Norway
DSM-III – 38+39 (0%) 79 (75–88), 80 (75–89)
1 year Day care Mortality NS** (10 deaths)
Low power 1
Lawton et al1989 [26]USA
RCT Community, USA
Clinical AD?, MSQ***
? 315+317 76.7, 76.1
1 year Respite care Mortality NS** (126 deaths)
Patient description limited
2
Mohide et al1990 [27]Canada
RCT Community, Canada
Clinical, DRS****, GDS
87.90% moderate, moderate-severe
30+30 (0% for inst follow-up)
77.8 (9.2),75.9 (7.7)
6 months
CGS Mortality NS** (no deaths)
Low power 1
Brodaty et al1991 [28]Australia
Quasi-experi-mental
Community, Australia
DSM-III, CDR
Mild- moderate
100 (4%) 70.2 (49–79) 39 months
Caregiver sup-port (CGS), memory training (MT), waiting list (WL)
Mortality NS** (between CGS and other groups) 22 deaths
Non ran- domized, low power
1
O´Connor et al1991 [29]United Kingdom
Quasi-experi-mental
Community, United Kingdom
MMSE, Camdex
Mild- moderate-severe
86+73 (44%, 42%) (0% for mor-tality analysis)
83.7, 83.7
2 years CGS/Social support
Mortality NS (69 deaths)
Rather low power, non randomised, 69% in the action group received the intervention
1
Wimo et al1993 [30]Sweden
Quasi-experi-mental
Institution Clinical Severe 43+40 82 (62–96), 83 (63–92)
10 months
Multifaceted Mortality NS** (20 deaths)
Rather low power, non-randomised
0–1
Mittelman1993 [31]USA
RCT Community, USA
Clinical AD, GDS
Mild-moderate-severe
103+103 (0.5%)
(age class proportions)
1 year CGS/Social support
Mortality NS** (18 deaths)
Diagnose clinical
2
Wimo et al1993 [32]Sweden
Quasi-experi-mental
Community, Sweden
Clinical (Geriatri-cian)
Moderate 55+44 (0%) 77.9 (76.0–77.9),78.6 (77.1–80.5)
1 year Day care Mortality NS** (21 deaths)
Non ran- domized, low power
1
The table continues on the next page

D E M E N T I A – D I AG N O S T I C A N D T H E R A P E U T I C I N T E RV E N T I O N S542
Table 29.2 continued
Author Year, reference Country
Type of study
Setting Dementia/diagnosis
Severity of dementia
Patients (n) included (attrition)
Age-groups (patients) Mean (range or SD)
Study period
Intervention (end)
Out-come*
Effects (end)
Remarks from reviewer
Quality of study
Volicer et al1994 [10]USA
Quasi-experi-mental
LTC/SCU DSM-III-R Severe 113+50 (17% + 14%)
71.5 (6.7), 74.1 (10.9)
2 years SCU-care Mortality Higher mortality in SCU-group. p<0.05** (65 deaths)
Groups not similar
1
Rovner et al1996 [33]USA
RCT LTC (nursing home)
DSM-III-R Severe (?) 42+39 (89 randomised)
82.0 (8.0), 81.2 (7.2)
6 months
AGE (Activiti-es, guidelines, education)
Mortality NS** (2 deaths)
Rather low power
1
Eloniemi- Sulkava et al2001 [34]Finland
RCT Community, USA
DSM-III-R, MMSE
Mild- moderate-severe
53+47 (0%) 78.8 (65–97),80.1 (67–91)
2 years CGS Mortaliy NS** (17 deaths)
Rather low power
2
Challis et al2002 [35]United Kingdom
Quasi-experi-mental
Community, United Kingdom
OBS score 70% severe 43+43 (0%) 79.8–80.4 2 years Case management
Mortality NS** Low power 1
Teri et al2003 [36]USA
RCT Community, USA
Alzheimer’s disease (NINCDS)
Moderate-severe
76+77 (41%, 43%) (0% for mor-tality analysis)
78 (6),78 (8)
2 years BPSD + training
Mortality NS** (4 deaths)
Rather low power
2
Keller et al2003 [37]USA
Quasi-experi-mental
Nursing home/SCU
Clinical Severe (?) 33+49 80 (7), 80 (7)
9 months
Nutritional program
Mortality NS (10 deaths)
Diagnostics unclear, low power
1
Huusko et al2000 [38]Finland
RCT Community MMSE, clinical?
Mild- moderate-severe
130+130 (8%, 5%)
80 (67–92), 80 (66–97)
1 year Geriatric rehabilitation
Mortality NS (35 deaths)
Dementia diagnostics unclear, diffe-rence in MMSE between groups
1

C H A P T E R 2 9 • D E M E N T I A A N D M O RTA L I T Y 543
Table 29.2 continued
Author Year, reference Country
Type of study
Setting Dementia/diagnosis
Severity of dementia
Patients (n) included (attrition)
Age-groups (patients) Mean (range or SD)
Study period
Intervention (end)
Out-come*
Effects (end)
Remarks from reviewer
Quality of study
Volicer et al1994 [10]USA
Quasi-experi-mental
LTC/SCU DSM-III-R Severe 113+50 (17% + 14%)
71.5 (6.7), 74.1 (10.9)
2 years SCU-care Mortality Higher mortality in SCU-group. p<0.05** (65 deaths)
Groups not similar
1
Rovner et al1996 [33]USA
RCT LTC (nursing home)
DSM-III-R Severe (?) 42+39 (89 randomised)
82.0 (8.0), 81.2 (7.2)
6 months
AGE (Activiti-es, guidelines, education)
Mortality NS** (2 deaths)
Rather low power
1
Eloniemi- Sulkava et al2001 [34]Finland
RCT Community, USA
DSM-III-R, MMSE
Mild- moderate-severe
53+47 (0%) 78.8 (65–97),80.1 (67–91)
2 years CGS Mortaliy NS** (17 deaths)
Rather low power
2
Challis et al2002 [35]United Kingdom
Quasi-experi-mental
Community, United Kingdom
OBS score 70% severe 43+43 (0%) 79.8–80.4 2 years Case management
Mortality NS** Low power 1
Teri et al2003 [36]USA
RCT Community, USA
Alzheimer’s disease (NINCDS)
Moderate-severe
76+77 (41%, 43%) (0% for mor-tality analysis)
78 (6),78 (8)
2 years BPSD + training
Mortality NS** (4 deaths)
Rather low power
2
Keller et al2003 [37]USA
Quasi-experi-mental
Nursing home/SCU
Clinical Severe (?) 33+49 80 (7), 80 (7)
9 months
Nutritional program
Mortality NS (10 deaths)
Diagnostics unclear, low power
1
Huusko et al2000 [38]Finland
RCT Community MMSE, clinical?
Mild- moderate-severe
130+130 (8%, 5%)
80 (67–92), 80 (66–97)
1 year Geriatric rehabilitation
Mortality NS (35 deaths)
Dementia diagnostics unclear, diffe-rence in MMSE between groups
1
The table continues on the next page

D E M E N T I A – D I AG N O S T I C A N D T H E R A P E U T I C I N T E RV E N T I O N S544
* From the viewpoint of this analysis, it may be secondary in original trials.** Chi2 test own calculations.*** Mental State Questionnaire.**** Dementia Rating Scale.Study quality: 1 = Limited study quality; 2 = Moderately high study quality; 3 = High study quality.
AD = Alzheimer’s disease; AGE = Activities, guidelines, education; BPSD = Behavioral and psychological symptoms in dementia; CDR = Clinical Dementia Rating Scale; CGS = Ca-regiver support; DRS = Dementia rating scale; DSM = Diagnostic and statistical manual; GDS = Global deterioration scale; LTC = Long-term care; MMSE = Mini-mental state examination; NINCDS = National institute of neurological and communicable diseases; ns = not stated; RCT = Random controlled trial; SCU = Special care unit; SD = Standard deviation
Table 29.2 continued
Author Year, reference Country
Type of study
Setting Dementia/diagnosis
Severity of dementia
Patients (n) included (attrition)
Age-groups (patients) Mean (range or SD)
Study period
Intervention (end)
Out-come*
Effects (end)
Remarks from reviewer
Quality of study
Shaw et al2003 [39]United Kingdom
RCT Mixed MMSE, clinical?
Moderate-severe
150+158(31%, 28%)
84 (71–97)84 (71–97)
1 year Fall prevention program
Mortality NS (56 deaths)
Dementia diagnostics unclear, MMSE based, not all study patients demented
1
Reimer et al2004 [40]USA
Quasi-experi-mental
Institution GDS Mode-rate-severe (GDS 5–7)
62+64+59 (31%, 27%, 20%)
80.2(7.2), 83.2 (7.2), 81.7 (8.0)
1 year Special Care Facility
Mortality NS (44 deaths)
Non rando-mised
1
Mcdonald et al2004 [41]United Kingdom
Quasi-experi-mental
Interme-diate care, home for rest of life
Geriatric mental scale
“Significant dementia”
24+37 – 1 year Relocation Mortality NS (17 deaths)
Differences founding sub-groups. Small study, non- randomised
1

C H A P T E R 2 9 • D E M E N T I A A N D M O RTA L I T Y 545
Table 29.2 continued
Author Year, reference Country
Type of study
Setting Dementia/diagnosis
Severity of dementia
Patients (n) included (attrition)
Age-groups (patients) Mean (range or SD)
Study period
Intervention (end)
Out-come*
Effects (end)
Remarks from reviewer
Quality of study
Shaw et al2003 [39]United Kingdom
RCT Mixed MMSE, clinical?
Moderate-severe
150+158(31%, 28%)
84 (71–97)84 (71–97)
1 year Fall prevention program
Mortality NS (56 deaths)
Dementia diagnostics unclear, MMSE based, not all study patients demented
1
Reimer et al2004 [40]USA
Quasi-experi-mental
Institution GDS Mode-rate-severe (GDS 5–7)
62+64+59 (31%, 27%, 20%)
80.2(7.2), 83.2 (7.2), 81.7 (8.0)
1 year Special Care Facility
Mortality NS (44 deaths)
Non rando-mised
1
Mcdonald et al2004 [41]United Kingdom
Quasi-experi-mental
Interme-diate care, home for rest of life
Geriatric mental scale
“Significant dementia”
24+37 – 1 year Relocation Mortality NS (17 deaths)
Differences founding sub-groups. Small study, non- randomised
1

D E M E N T I A – D I AG N O S T I C A N D T H E R A P E U T I C I N T E RV E N T I O N S546
Appendix 29.1 Search strategy.
Database Search term 1 Search term 2 Search term 3 Results
PubMed Dementia or Alzheimer´s Disease (MeSH)
Mortality (MeSH)
548 (only titles reviewed)
Dementia or Alzheimer´s Disease (MeSH)
Mortality (MeSH)
Controlled clinical trial (MeSH)
1
Dementia Mortality Controlled trial 12
Alzheimer´s disease
Mortality Controlled trial 1
PsycInfo Dementia Mortality Controlled trial 4
Dementia Mortality Treatment 35
Alzheimer(’s) (Disease)
Mortality Treatment 3
CRD: NHSEED/HTA
Dementia Mortality 20
Alzheimer(’s) (Disease)
Mortality 10
Sociological abstracts/social services abstract/ERIC
Dementia or Alzheimer(’s) (Disease)
Mortality 28
Ingenta Dementia Mortality 106
Alzheimer(’s) (Disease)
Mortality 32
Cochrane Dementia Mortality 25
Alzheimer(’s) (Disease)
Mortality 9

C H A P T E R 2 9 • D E M E N T I A A N D M O RTA L I T Y 547
1. Post SG. Slowing the progression of Alzheimer disease: ethical issues. Alzhei- mer Dis Assoc Disord 1997;11 Suppl 5:S34-6; discussion S37-9.
2. Schneider LS, Dagerman KS, Insel P. Risk of death with atypical antipsychotic drug treatment for dementia: meta-analysis of randomised placebo-controlled trials. JAMA 2005;294:1934-43.
3. Courtney C, Farrell D, Gray R, Hills R, Lynch L, Sellwood E, et al. Long-term donepezil treatment in 565 patients with Alzheimer’s disease (AD2000): randomised double-blind trial. Lancet 2004;363:2105-15.
4. Sano M, Ernesto C, Thomas RG, Klauber MR, Schafer K, Grundman M, et al. A controlled trial of selegiline, alpha- tocopherol, or both as treatment for Alzhei- mer’s disease. The Alzheimer’s Disease Cooperative Study. N Engl J Med 1997; 336:1216-22.
5. Aisen PS, Schafer KA, Grundman M, Pfeiffer E, Sano M, Davis KL, et al. Effects of rofecoxib or naproxen vs placebo on Alzheimer disease progres- sion: a randomised controlled trial. JAMA 2003;289:2819-26.
6. Knopman D, Schneider L, Davis K, Talwalker S, Smith F, Hoover T, et al. Long-term tacrine (Cognex) treatment: effects on nursing home placement and mortality, Tacrine Study Group. Neurology 1996;47:166-77.
7. Geldmacher DS, Provenzano G, McRae T, Mastey V, Ieni JR. Donepezil is associ-ated with delayed nursing home placement
in patients with Alzheimer’s disease. J Am Geriatr Soc 2003;51:937-44.
8. Ott BR, Lapane KL. Tacrine therapy is associated with reduced mortality in nursing home residents with dementia. J Am Geriatr Soc 2002;50:35-40.
9. Lopez OL, Becker JT, Wisniewski S, Saxton J, Kaufer DI, DeKosky ST. Cholinesterase inhibitor treatment al-ters the natural history of Alzheimer’s disease. J Neurol Neurosurg Psychiatry 2002;72:310-4.
10. Volicer L, Collard A, Hurley A, Bishop C, Kern D, Karon S. Impact of special care unit for patients with advanced Al- zheimer’s disease on patients’ discomfort and costs. J Am Geriatr Soc 1994;42: 597-603.
11. Rogers SL, Farlow MR, Doody RS, Mohs R, Friedhoff LT. A 24-week, double-blind, placebo-controlled trial of donepe-zil in patients with Alzheimer’s disease. Donepezil Study Group. Neurology 1998;50:136-45.
12. Burns A, Rossor M, Hecker J, Gauthier S, Petit H, Moller HJ, et al. The effects of donepezil in Alzheimer’s disease – results from a multinational trial. Dement Geriatr Cogn Disord 1999;10:237-44.
13. Feldman H, Gauthier S, Hecker J, Vellas B, Subbiah P, Whalen E. A 24-week, randomised, double-blind study of donepezil in moderate to severe Alzheimer’s disease. Neurology 2001;57:613-20.
14. Mohs RC, Doody RS, Morris JC, Ieni JR, Rogers SL, Perdomo CA, et al.
References

D E M E N T I A – D I AG N O S T I C A N D T H E R A P E U T I C I N T E RV E N T I O N S548
A 1-year, placebo-controlled preservation of function survival study of donepezil in AD patients. Neurology 2001;57:481-8.
15. Winblad B, Engedal K, Soininen H, Verhey F, Waldemar G, Wimo A, et al. A 1-year, randomised, placebo-controlled study of donepezil in patients with mild to moderate AD. Neurology 2001;57:489-95.
16. Corey-Bloom J, Anand R, Veach J. A randomised trial evaluating the efficacy and safety of ENA 713 (rivastigmine tar-trate), a new acetylcholineesterase inhibi-tor, in patients with mild to moderately severe Alzheimer’s disease. International Journal of Geriatric Psychopharmacology 1998;1:55-65.
17. Rösler M, Anand R, Cicin-Sain A, Gauthier S, Agid Y, Dal-Bianco P, et al. Efficacy and safety of rivastigmine in patients with Alzheimer’s disease: inter- national randomised controlled trial. BMJ 1999;318:633-8.
18. Farlow M, Anand R, Messina J, Jr, Hartman R, Veach J. A 52-week study of the efficacy of rivastigmine in patients with mild to moderately severe Alzheimer’s disease. Eur Neurol 2000;44:236-41.
19. Wilcock GK, Lilienfeld S, Gaens E. Ef-ficacy and safety of galantamine in patients with mild to moderate Alzheimer’s disease: multicentre randomised controlled trial. Galantamine International-1 Study Group. BMJ 2000;321:1445-9.
20. Raskind MA, Peskind ER, Wessel T, Yuan W. Galantamine in AD: A 6-month randomised, placebo-controlled trial with a 6-month extension. The Galan-tamine USA-1 Study Group. Neurology 2000;54:2261-8.
21. Erkinjuntti T, Kurz A, Gauthier S, Bullock R, Lilienfeld S, Damaraju CV. Ef-ficacy of galantamine in probable vascular dementia and Alzheimer’s disease combined with cerebrovascular disease: a randomised trial. Lancet 2002;359:1283-90.
22. Bullock R, Erkinjuntti T, Lilienfeld S. Management of patients with Alzheimer’s disease plus cerebrovascular disease: 12-month treatment with galantamine. Dement Geriatr Cogn Disord 2004;17:29-34.
23. Reisberg B, Doody R, Stoffler A, Schmitt F, Ferris S, Mobius HJ. Meman-tine in moderate-to-severe Alzheimer’s disease. N Engl J Med 2003;348:1333-41.
24. Tariot PN, Farlow MR, Grossberg GT, Graham SM, McDonald S, Gergel I. Memantine treatment in patients with moderate to severe Alzheimer disease already receiving donepezil: a randomised controlled trial. JAMA 2004;291:317-24.
25. Engedal K. Day care for demented patients in general nursing homes. Effects on admissions to institutions and men-tal capacity. Scand J Prim Health Care 1989;7:161-6.
26. Lawton MP, Brody EM, Saperstein AR. A controlled study of respite service for caregivers of Alzheimer’s patients. Gerontologist 1989;29:8-16.
27. Mohide EA, Pringle DM, Streiner DL, Gilbert JR, Muir G, Tew M. A randomised trial of family caregiver support in the home management of dementia. J Am Geriatr Soc 1990;38:446-54.
28. Brodaty H, Peters KE. Cost effective-ness of a training program for dementia caregivers. Int Psychogeriatr 1991;3:11-22.

C H A P T E R 2 9 • D E M E N T I A A N D M O RTA L I T Y 549
29. O’Connor DW, Pollitt PA, Brook CP, Reiss BB, Roth M. Does early intervention reduce the number of elderly people with dementia admitted to institutions for long term care? BMJ 1991;302:871-5.
30. Wimo A, Nelvig A, Nelvig J, Adolfsson R, Mattsson B, Sandman PO. Can changes in ward routines affect the severity of de-mentia? A controlled prospective study. Int Psychogeriatr 1993;5:169-80.
31. Mittelman MS, Ferris SH, Steinberg G, Shulman E, Mackell JA, Ambinder A, et al. An intervention that delays institutionalization of Alzheimer’s disease patients: treatment of spouse-caregivers. Gerontologist 1993;33:730-40.
32. Wimo A, Mattsson B, Adolfsson R, Eriksson T, Nelvig A. Dementia day care and its effects on symptoms and institu-tionalization – a controlled Swedish study. Scand J Prim Health Care 1993;11:117-23.
33. Rovner BW, Steele CD, Shmuely Y, Folstein MF. A randomised trial of demen-tia care in nursing homes. J Am Geriatr Soc 1996;44:7-13.
34. Eloniemi-Sulkava U, Notkola IL, Hentinen M, Kivela SL, Sivenius J, Sulkava R. Effects of supporting community-liv-ing demented patients and their caregiv-ers: a randomised trial. J Am Geriatr Soc 2001;49:1282-7.
35. Challis D, von Abendorff R, Brown P, Chesterman J, Hughes J. Care manage-ment, dementia care and specialist mental health services: an evaluation. Int J Geriatr Psychiatry 2002;17:315-25.
36. Teri L, Gibbons LE, McCurry SM, Logsdon RG, Buchner DM, Barlow WE, et al. Exercise plus behavioral manage-ment in patients with Alzheimer disease: a randomised controlled trial. JAMA 2003;290:2015-22.
37. Keller HH, Gibbs AJ, Boudreau LD, Goy RE, Pattillo MS, Brown HM. Pre- vention of weight loss in dementia with comprehensive nutritional treatment. J Am Geriatr Soc 2003;51:945-52.
38. Huusko TM, Karppi P, Avikainen V, Kautiainen H, Sulkava R. Randomised, clinically controlled trial of intensive geriatric rehabilitation in patients with hip fracture: subgroup analysis of patients with dementia. BMJ 2000;321:1107-11.
39. Shaw FE, Bond J, Richardson DA, Dawson P, Steen IN, McKeith IG, et al. Multifactorial intervention after a fall in older people with cognitive impairment and dementia presenting to the accident and emergency department: randomised controlled trial. BMJ 2003;326:73.
40. Reimer MA, Slaughter S, Donaldson C, Currie G, Eliasziw M. Special care facility compared with traditional environ-ments for dementia care: a longitudinal study of quality of life. J Am Geriatr Soc 2004;52:1085-92.
41. Macdonald A, Philpot M, Briggs C. An attempt to determine the benefits of a ‘home-for-life’ principle in residential care for people with dementia and behavioral problems: a comparative cohort study. Dement Geriatr Cogn Disord 2004; 18:6-14.

D E M E N T I A – D I AG N O S T I C A N D T H E R A P E U T I C I N T E RV E N T I O N S550
Reports published by SBU
SBU Reports in EnglishDementia (2008), three volumes, no 172e/1+2+3Obstructive Sleep Apnoea Syndrome (2007), no 184eInterventions to Prevent Obesity (2005), no 173eModerately Elevated Blood Pressure (2004), Volume 2, no 172/2Sickness Absence – Causes, Consequences, and Physicians’ Certification Practice, Scandinavian Journal of Public Health, supp 63 (2004), 167/supplRadiotherapy for Cancer (2003), Volume 2, no 162/2Treating and Preventing Obesity (2003), no 160eTreating Alcohol and Drug Abuse (2003), no 156eEvidence Based Nursing: Caring for Persons with Schizophrenia (1999/2001), no 4eChemotherapy for Cancer (2001), Volume 2, no 155/2CABG/PTCA or Medical Therapy in Anginal Pain (1998), no 141eBone Density Measurement, Journal of Internal Medicine, Volume 241 Suppl 739 (1997), no 127/supplCritical Issues in Radiotherapy (1996), no 130eRadiotherapy for Cancer, Volume 1, Acta Oncologica, Suppl 6 (1996), no 129/1/supplRadiotherapy for Cancer, Volume 2, Acta Oncologica, Suppl 7 (1996), no 129/2/supplMass Screening for Prostate Cancer, International Journal of Cancer, Suppl 9 (1996), no 126/supplHysterectomy – Ratings of Appropriateness... (1995), no 125eModerately Elevated Blood Pressure, Journal of Internal Medicine, Volume 238 Suppl 737 (1995), no 121/supplCABG and PTCA. A Literature Review and Ratings... (1994), no 120eLiterature Searching and Evidence Interpretation (1993), no 119e Stroke (1992), no 116eThe Role of PTCA (1992), no 115eThe Problem of Back Pain – Conference Report (1989), no 107ePreoperative Routines (1989), no 101e
SBU Summaries in EnglishCaries – Diagnosis, Risk Assessment and Non-Invasive Treatment (2008), no 501-39Methods of Prenatal Diagnosis (2007), no 510-38Light Therapy for Depression, and Other Treatment of Seasonal Affective Disorder (2007), no 510-37Dyspepsia and Gastro-oesophageal Reflux (2007), no 510-36

C H A P T E R 2 9 • D E M E N T I A A N D M O RTA L I T Y 551
Obstructive Sleep Apnoea Syndrome (2007), 510-35Benefits and Risks of Fortifying Flour with Folic Acid to Reduce the Risk of Neural Tube Defects (2007), no 510-34Methods of Promoting Physical Activity (2007), no 510-33Mild Head Injury – In-hospital Observation or Computed Tomography? (2007), no 510-32Methods of Treating Chronic Pain (2006), no 510-31Malocclusions and Orthodontic Treatment in a Health Perspective (2006), no 510-30Psychiatric Risk Assessment Methods – Are Violent Acts Predictable? (2006), no 510-29Treatment of Anxiety Disorders (2006), no 510-28Interventions to Prevent Obesity (2005), no 510-27Chronic Periodontitis – Prevention, Diagnosis and Treatment (2004), no 510-26Moderately Elevated Blood Pressure (2004), no 510-25Treatment of Depression (2004), no 510-24Prescribed Sick Leave – Causes, Consequences, and Practices (2004), no 510-23Osteoporosis – Prevention, Diagnosis and Treatment (2003), no 510-22Radiotherapy for Cancer (2003), no 510-21Hearing Aids for Adults (2003), no 510-20Prevention of Dental Caries (2002), no 510-19Prevention, Diagnosis & Treatment of Venous Thromboembolism (2002), no 510-18Obesity – Problems and Interventions (2002), no 510-17Hormone Replacement Therapy (2002), no 510-16 Treatment of Alcohol and Drug Abuse (2001), no 510-15Chemotherapy for Cancer (2001), no 510-14Treatment of Asthma and COPD (2000), no 510-13Dyspepsia – Methods of Diagnosis and Treatment (2000), no 510-12Back Pain, Neck Pain (2000), no 510-11Urinary Incontinence (2000), no 510-9The Patient – Doctor Relationship (2000), no 510-8Prognostic Methods for Acute Coronary Artery Disease (1999), no 510-10Smoking Cessation Methods (1998), no 510-7Routine Ultrasound Examination During Pregnancy (1998), no 510-6Smoking Cessation Methods (1998), no 510-5Surgical Treatment of Rheumatic Diseases (1998), no 510-2Preventing Disease with Antioxidants (1997), no 510-4Community Intervention – Cardiovascular Disease (1997), no 510-3The Use of Neuroleptics (1997), no 510-1

D E M E N T I A – D I AG N O S T I C A N D T H E R A P E U T I C I N T E RV E N T I O N S552
SBU Reports in SwedishYellow reports (1996–2008)
Rörbehandling vid inflammation i mellanörat (2008), nr 189Karies – diagnostik, riskbedömning och icke-invasiv behandling (2007), nr 188Benartärsjukdom – diagnostik och behandling (2007), nr 187Ljusterapi vid depression samt övrig behandling av årstidsbunden depression (Uppdatering av Kapitel 9 i SBU-rapport 166/2 från 2004) (2007), nr 186. Publicerad endast i elektronisk version på www.sbu.seDyspepsi och reflux (2007), nr 185Nyttan av att berika mjöl med folsyra i syfte att minska risken för euralrörsdefekter (2007), nr 183Metoder för att främja fysisk aktivitet (2007), nr 181Måttligt förhöjt blodtryck (Uppdatering av SBU-rapporten 2004 170/1) (2007), nr 170/1uMetoder för tidig fosterdiagnostik (2006), nr 182Hjärnskakning – övervakning på sjukhus eller datortomografi och hemgång? (Uppdatering av rapport från 2000) (2006), nr 180Metoder för behandling av långvarig smärta (2006), nr 177/1+2Demenssjukdomar (2006), nr 172Bettavvikelser och tandreglering i ett hälsoperspektiv (2005), nr 176Riskbedömningar inom psykiatrin – kan våld i samhället förutsägas? (2005), nr 175Behandling av ångestsyndrom (2005), nr 171/1+2Förebyggande åtgärder mot fetma (2004), nr 173Måttligt förhöjt blodtryck (2004), två volymer, nr 170/1+2Kronisk parodontit – prevention, diagnostik och behandling (2004), nr 169Behandling av depressionssjukdomar (2004), tre volymer, nr 166/1+2+3Sjukskrivning – orsaker, konsekvenser och praxis (2003), nr 167Osteoporos – prevention, diagnostik och behandling (2003), två volymer, nr 165/1+2Hörapparat för vuxna – nytta och kostnader (2003), nr 164Strålbehandling vid cancer (2003), två volymer, nr 162/1+2Att förebygga karies (2002), nr 161Fetma – problem och åtgärder (2002), nr 160Behandling med östrogen (2002), nr 159Blodpropp – förebyggande, diagnostik och behandling av venös tromboembolism (2002), tre volymer, nr 158/1+2+3Behandling av alkohol- och narkotikaproblem (2001), två volymer, nr 156/1+2Cytostatikabehandling vid cancer/Chemotherapy for cancer (2001), två volymer, nr 155/1+2

C H A P T E R 2 9 • D E M E N T I A A N D M O RTA L I T Y 553
Behandling av astma och KOL (2000), nr 151Ont i magen – metoder för diagnos och behandling av dyspepsi (2000), nr 150Ont i ryggen, ont i nacken (2000), två volymer, nr 145/1+2Behandling av urininkontinens (2000), nr 143Avancerad hemsjukvård och hemrehabilitering (1999), nr 146Prognostiska metoder vid akut kranskärlssjukdom (1999), nr 142Rutinmässig ultraljudsundersökning under graviditet (1998), nr 139Metoder för rökavvänjning (1998), nr 138Reumatiska sjukdomar, Volym 1, Analys av området (1998), nr 136/1 Reumatiska sjukdomar, Volym 2, Litteraturgranskning (1998), nr 136/2Att förebygga sjukdom – med antioxidanter, Volym 1 (1997), nr 135/1Antioxidanter, Cancersjukdomar (1997), två volymer, nr 135/2:1+2:2Att förebygga sjukdom i hjärta och kärl (1997), nr 134Behandling med neuroleptika (1997), två volymer, nr 133/1+2Behandling med östrogen (1996), nr 131Strålbehandling vid cancer, Volym 1 (1996), nr 129/1Strålbehandling vid cancer, Volym 2, Litteraturgranskning (1996), 129/2Mätning av bentäthet (1995), nr 127
White Reports (1998–2008)Behandling med vitamin D och kalcium (2006), nr 178 Volym och kvalitet (2005), nr 179 ADHD hos flickor (2005), nr 174Evidensbaserad äldrevård (2003), nr 163Rökning och ohälsa i munnen (2002), nr 157Placebo (2000), Ges ut av Liber, nr 154 Behov av utvärdering i tandvården (2000), nr 152Sveriges ekonomi och sjukvårdens III, Konferensrapport (2000), nr 149Alert – Nya medicinska metoder (2000), nr 148Barn födda efter konstgjord befruktning (IVF) (2000), nr 147Patient–läkarrelationen (1999), Ges ut av Natur och Kultur, nr 144Evidensbaserad omvårdnad: Behandling av patienter med schizofreni (1999), nr 4Evidensbaserad omvårdnad: Patienter med depressionssjukdomar (1999), nr 3Evidensbaserad omvårdnad: Patienter med måttligt förhöjt blodtryck (1998), nr 2Evidensbaserad omvårdnad: Strålbehandling av patienter med cancer (1998), nr 1

D E M E N T I A – D I AG N O S T I C A N D T H E R A P E U T I C I N T E RV E N T I O N S554
Evidensbaserad sjukgymnastik: Patienter med ländryggsbesvär (1999), nr 102Evidensbaserad sjukgymnastik: Patienter med nackbesvär (1999), nr 101Smärtor i bröstet: Operation, ballongvidgning, medicinsk behandling (1998), nr 140 Sveriges ekonomi och sjukvårdens II, Konferensrapport (1998), nr 137
SBU Alert ReportsEarly assessment of new health technologies. Find them at www.sbu.se/alert in PDF format.