DEMANDING TIMES FOR ENERGY IN THE UK - Gas & Electricity Energy …w… · ·...
37
DEMANDING TIMES FOR ENERGY IN THE UK A report commissioned by RWE npower
-
Upload
hoangthuan -
Category
Documents
-
view
212 -
download
0
Transcript of DEMANDING TIMES FOR ENERGY IN THE UK - Gas & Electricity Energy …w… · ·...

DEMANDING TIMES FOR ENERGY IN THE UK
A report commissioned by RWE npower

A Report Commissioned by RWE npower. Page 3
Introduction 4
1 The end of a golden age of cheap energy 5
2 A glimpse into the future 7
3 How energy users can take control 18
4 Conclusions 28
5. References 29
6. ‘Energy UK: Into the 2020s’ - Commentary by Dr James Bellini 30
List of tables
Table 1. Under-utilised self-generation capacity projection in the UK 25
List of figures
Figure 1. Over the past decade, real energy prices have risen, particularly prices of oil and gas 6
Figure 2. Four scenarios, spanning high and low costs today and high and low environmental
costs tomorrow 7
Figure 3. Current Intent has a balanced portfolio, while New Dash for Gas and Investment Shortfall
are short on low-carbon technologies, and in Spiralling Costs the power sector takes the
greatest burden of the national emissions reduction effort 12
Figure 4. The amount of power generation capacity shrinks under New Dash for Gas and Investment
Shortfall, and balloons under Spiralling Costs as low load-factor renewables capacity is added 13
Figure 5. Current Intent reduces emissions considerably and by almost as much as the more expensive
Spiralling Costs scenario 14
Figure 6. Policies will have a significant impact on electricity prices faced by large energy-intensive users 15
Figure 7. Wholesale electricity prices rise under all scenarios, and lower prices come at the risk of price
spikes and environmental costs later on 16
Figure 8. Current STOR requirement and projected STOR requirement, this winter and in 2025 19
Figure 9. Grid reserve requirements show a significant growth to 2020 20
Figure 10. Controllable capacity by 2020 22
Figure 11. Untapped market potential saving £1 billion a year of capital expenditure on conventional
power generation 26
Figure 12. Vision for the evolution of electricity market over the next decade or two 27
List of boxes
Box 1. Demand management using contracts 23
CONTENTS

Page 4. Demanding Times for Energy in the UK
Much has been written about Britain’s energy challenge. Rising energy prices. The need to replace ageing power stations. The imperative to decarbonise. The clarion call to be more energy efficient. Myriads of new regulations to respond to these challenges. It adds up to a transformed but also uncertain and complex energy future.
Uncertainty is bad for business. But fortunately
for firms the best response to the impending energy
transformation is clear. The key is to understand and
manage energy well. Firms that do this will thrive
whatever the future holds. Traditionally, good energy
management meant canny contracting, cost-
consciousness and energy efficiency. Now there is
a new way to become competitive in energy use:
to sell services back to the energy market.
This Future Report sketches out what the energy future
might hold and how forward looking businesses can
begin to take control.
The potential scenarios for the UK’s energy future that
are investigated include:
- Current Intent – what is happening now and if the
UK continues on the planned route
- New Dash for Gas – abundant shale gas supplies
combine with other factors to make gas the fuel
of choice
- Investment Shortfall – the fall out of high investment
uncertainty and ill-defined and poorly implemented
policies
- Spiralling Costs – a number of factors lead to energy
prices rising steeply and varying greatly over time.
INTRODUCTION
A Report Commissioned by RWE npower. Page 5
British businesses have had nearly thirty years to forget the shock of high oil prices in the 1970s. It is the distant memory of a generation of managers who have passed into retirement.
A global investment surge in the production of fossil
fuels followed the oil crisis. This bore fruit in a golden
period of bountiful supply and low energy prices.
Production of crude oil in the North Sea increased by
over 50 per cent between 1980 and 2000, and the
production of natural gas tripled. For the UK, it was
augmented by the liberalisation of the power sector in
the late 1980s, forcing energy companies to slash costs.
Industrial consumers came to benefit from steadily
falling fuel and electricity prices. At times, prices barely
covered the ongoing cost of production.
By the late 1990s, the picture began to change.
The world economy steamed onwards on a course of
uninterrupted growth. Although advanced economies,
particularly in the EU, tried to damp down their appetite
for fuel, rapidly-growing developing economies drove
it up again. Prices for oil, gas, coal and electricity
reached record heights. Then, of course, economic
output collapsed. For fossil fuels, however, the shudder
in prices in the global downturn was short-lived. As the
emerging economies continued to grow, so did the
demand for fossil fuels, and investment was not
keeping up.
While demand for energy has and will continue to drive
prices, there is another factor which has made its
presence felt: decarbonisation. Decarbonisation – near-
to-zero greenhouse gas emissions – requires great
swathes of investment, particularly in electricity supply.
Massive capital spending is planned and prices are
already rising in order to attract finance. The UK has
gone further than most in committing to this agenda.
It has statutory greenhouse gas reduction targets of
34 per cent by 2020 (compared with 1990 levels),
50 per cent by 2027 and 80 per cent by 2050. Since
other sectors such as aviation, industry and agriculture
are harder to decarbonise, the government’s statutory
advisor, the Committee on Climate Change, has called
for the virtual decarbonisation of UK power generation
over the next 20 years (Committee on Climate Change
2010).
Counteracting this trend is the appearance of a large,
relatively cheap new source of energy: shale gas. Over
the last two decades, gas has emerged as a major fuel
in the power sector and shale gas, in particular, is likely
to play an important role. In the United States, for
example, the extraction of shale gas is projected to
triple by 2035 helping to eliminate net imports of
natural gas (EIA, 2011). Countries, such as France,
Poland and Turkey, which rely heavily on natural gas
imports, may be able to exploit their substantial
recoverable shale gas resources, and so gas prices may
be rather static, even as power prices surge ahead.
1 THE END OF A GOLDEN AGE OF CHEAP ENERGY

Page 6. Demanding Times for Energy in the UK
Note: Average real prices for all manufacturing industry consumers in Great Britain and the averaged quarterly prices for Brent crude. Base year 2010.
Source DECC (2011a)
Figure 1. Over the past decade, real energy prices have risen, particularly prices of oil and gas

A Report Commissioned by RWE npower. Page 7
The uncertain prospects for the energy sector are a worry for energy suppliers, investors and market professionals. Energy consumers watch from the sidelines, but they too have concerns.
They wonder what will happen to energy prices,
contractual arrangements and the security of supply.
Let us therefore take a glimpse into the future. The
further out one looks the more uncertain the picture
becomes. Although 2020 is only eight years away,
even then there is significant uncertainty.
While there are tremendous hopes for a record flow
of investment into power generation and transmission
over the next eight years, replacing some of the
legacy coal fleet and engineering a massive expansion
of renewables, there are no guarantees this will all
happen. Firstly, it will be costly, and as consumers’ bills
go up, so political pressure will build to turn down the
pace of investment. Secondly, the incentives set before
investors are extraordinary in their complexity. No one
can judge investors’ appetite for this smorgasbord of
returns and risk.
This raises several questions. What is the policy intent?
What happens if the UK back-tracks from the
renewables targets, or renewable and low carbon
investment does not materialise to fulfil them? What
if the UK cuts its cloth according to its new, tighter
budget, and switches to cheaper natural gas instead?
What if some of the new technologies we anticipate are
more problematic or more expensive than expected?
Here we have the basis for four scenarios of the next
decade, as set out in Figure 2.
2 A GLIMPSE INTO THE FUTURE
Figure 2. Four scenarios, spanning high and low costs today and high and low environmental costs tomorrow
The rest of this section briefly describes these possible
outcomes by 2020. Current policy is described by the
Current Intent scenario while other scenarios are
extreme departures from this central scenario.

Page 8. Demanding Times for Energy in the UK
Low to moderate consumer cost. Low future environmental cost.
In 2020, under the Current Intent scenario, the UK takes
its energy and decarbonisation challenges seriously and
approaches them rationally. Efforts are spread equally
across demand and supply side sectors of the economy.
On the demand side, households increasingly insulate
their homes and are slowly beginning to use plug-in
vehicles. Industrial processes are more efficient and are
beginning to use electricity where natural gas was used
before. The initial works to enable a programme of
carbon capture storage (CCS) to capture power station
and eventually, industrial emissions, are just rolling out.
In energy supply, power generation is poised for a
decade of almost total decarbonisation during which
time energy companies will invest substantially in
renewable energy. Offshore wind especially is growing
rapidly. In addition, nuclear power generation capacity
is expanding, and some coal generators are co-firing
biomass. Solar PV is becoming more common as costs
fall worldwide. CCS for coal and gas is moving into full
commercial deployment. Marine power technologies
are emerging.
There is a package of UK and European policies which
stimulate investment in low carbon technologies,
including a strengthened EU Emissions Trading Scheme,
a carbon price floor for the power sector (HM Treasury,
2011), a dedicated green investment bank (HM
Government, 2011), the Renewables Obligation and
Feed-in-Tariffs. Total investment required is reaching
around £200 billion in the energy system alone (HM
Government, 2011).
The massive investment needs and relentless drive
to decarbonisation keeps prices high for consumers.
A substantial rise in energy prices has already taken
place over the decade to 2011. Underlying fuel prices
have stabilised at levels higher than the average over
the 1990s and 2000s. In this scenario, the trend
continues, driven by market fundamentals, legislation
and initiatives from policy targets, and the need to
replace ageing power plants. But costs could possibly
be contained by sharing the burden across sectors
and over time, and by aggressive demand side
management.
2.1 CURRENT INTENT

A Report Commissioned by RWE npower. Page 9
Low to moderate consumer cost. High future environmental cost.
In the New Dash for Gas scenario by 2020 the
government backtracks on its decarbonisation
commitments and in particular its renewable energy
target. The combined pressures from an ailing
economy, precarious public finances and deadlock
in the international climate negotiations mean that
by 2020 the UK is off-track and neglecting its
environmental commitments.
There is insufficient attention to the demand side of the
energy economy. Home and commercial spaces remain
heated primarily by conventional natural gas. As for
electricity generation, investment is directed towards
new gas-fired generation, which enjoys a renaissance
– a new dash for gas – on the back of abundant shale
gas supplies. This provides security of supply and the
lights stay on, but there is little reduction in emissions.
Renewables capacity falls behind the current ambition
and the emission intensity of electricity generation
remains high.
As a consequence, troubles are stored up for tomorrow.
Environmental NGOs are threatening a judicial review,
creating further policy uncertainty. While this reinforces
gas turbines as the low-risk investment of choice, power
generators worry that fossil fuel assets will have to be
scrapped before they are expired, which is putting
upward pressure on prices. As environmental targets
and obligations are missed, the UK risks diplomatic
opprobrium and European Commission fines. UK
industry is no longer considered a leader in low-carbon,
green growth.
Nevertheless, the New Dash For Gas gives relief from
higher costs, at least in the short term, and sees some
improvement in emissions versus Investment Shortfall
scenario (detailed in 2.3).
2.2 NEW DASH FOR GAS

Page 10. Demanding Times for Energy in the UK
High consumer cost. High future environmental cost.
In 2020, in the Investment Shortfall scenario, the UK
suffers the consequences of ill-defined and poorly
implemented policies and the high investment
uncertainty that goes with it. As in the New Dash for
Gas scenario there is little attention for demand side
improvements, and energy usage has not been
curtailed.
On the supply side, strained balance sheets and capital
market fright have resulted in under-investments, and
instead of an efficient fleet of power stations with
stable prices, there are frequent price spikes, sometimes
for extended periods, which choke off industrial
demand to balance the system. Mothballed coal-fired
plants are reopened to cope and some call the situation
a crisis. The market arrangements are under review
(again). Uncharitable observers make the comparison
with the ageing, overstretched and underfunded public
transport system of the early 21st century.
Renewable energy ambitions are sent to the bottom
of the list of priorities. Compliance with environmental
targets and obligations is not achieved. Environmental
NGOs threaten a judicial review and the European
Commission levies fines. Blame flies in all directions.
Energy consumers pay the price in the form of higher
bills, as money is raised to make up the investment
shortfall, and unreliable levels of service. Bigger energy
consumers invest in self-generation capacity and
back-up facilities to try to mitigate against these costs.
2.3 INVESTMENT SHORTFALL

A Report Commissioned by RWE npower. Page 11
High consumer cost. Low future environmental cost.
In the Spiralling Costs scenario the government’s
commitment to its environmental targets remains
intact. The policy environment to deliver is effective
and targets both the supply-side and the demand-side.
In this respect it matches the Current Intent scenario.
However, it turns out that the technology and cost
forecasts of the 2010s were overly optimistic. CCS has
not lived up to its promise and a large-scale deployment
in the 2020s is no longer on the cards. Nuclear energy
is much more expensive than anticipated and, perhaps
because of safety scares, public sentiment in 2020 has
turned against the technology, as it had in Germany a
decade earlier.
In contrast, renewable energy technologies, in
particular off-shore wind, are delivering, although costs
have remained stubbornly high, perhaps due to global
supply bottlenecks. To play its role in a renewed
European and global effort to combat climate change,
the UK is now aiming towards 80 per cent power
generation from renewables. This requires additional
investment to make up for low load factors in all forms
of renewable energy. Wind, solar, tidal, geothermal,
biomass. All at once.
As a consequence, prices rise steeply and vary greatly
over time. There are stronger incentives for energy
users to improve energy efficiency and optimise usage
across times of day because of higher prices and also
encouraged by policy. Environmental targets and
obligations are satisfied, but at a high cost.
2.4 SPIRALLING COSTS

Page 12. Demanding Times for Energy in the UK
The four scenarios lead to very different energy outcomes.
It is important to now look at each of the scenarios in
more detail and investigate their impact on generation,
capacity, emissions and costs. The Current Intent
scenario has the greatest power supplied, as a secure
policy and market regime attracts consumers to switch
to electricity and prices rise but in a controlled manner.
A mixture of generation sources is seen, allowing the
system to manage variations in renewables without
passing severe load-shedding costs onto consumers,
see Figure 3.
2.5 COMPARISON OF SCENARIOS
Figure 3. The 2020 view - Generation Impact – Current Intent has a balanced portfolio, while New Dash for
Gas and Investment Shortfall are short on low-carbon technologies, and in Spiralling Costs the power sector
takes the greatest burden of the national emissions reduction effort

A Report Commissioned by RWE npower. Page 13
The Current Intent scenario entails investment in more
capacity than is needed to keep the lights on, but
delivers lower carbon emissions, see Figure 5. It is
not the lowest cost solution to carbon targets in the
short-term, but it satisfies legal obligations to supply
renewable energy, and prepares Britain for the further
decarbonisation challenges ahead. It avoids the even
larger investment programme of the Spiralling Costs
scenario, see Figure 4, and the environmental costs
and long-term risks of remaining two scenarios.
Figure 4. The 2020 view - Capacity Impact – the amount of power generation capacity shrinks under New
Dash for Gas and Investment Shortfall, and balloon under Spiralling Costs as low load-factor renewables
capacity is added.

Page 14. Demanding Times for Energy in the UK
Figure 5. The 2020 view - Emissions Impact – Current Intent reduces emissions considerably and by almost
as much as the more expensive Spiralling Costs scenario
A Report Commissioned by RWE npower. Page 15
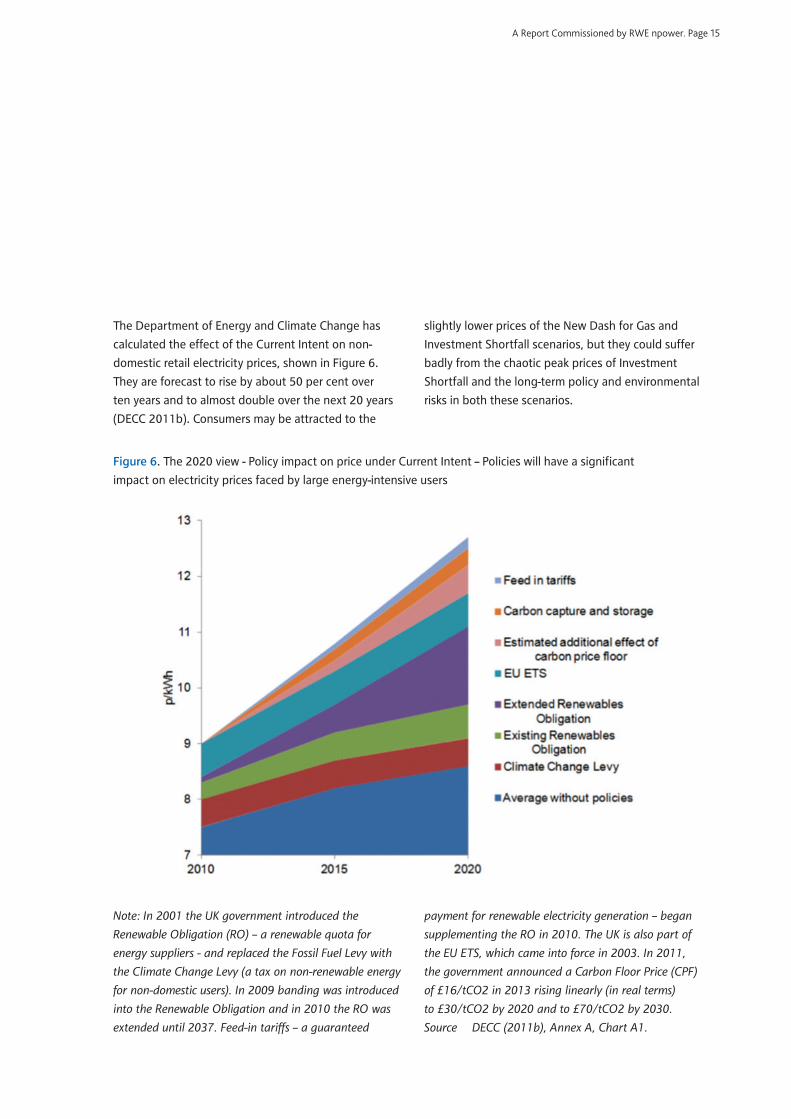
Note: In 2001 the UK government introduced the
Renewable Obligation (RO) – a renewable quota for
energy suppliers - and replaced the Fossil Fuel Levy with
the Climate Change Levy (a tax on non-renewable energy
for non-domestic users). In 2009 banding was introduced
into the Renewable Obligation and in 2010 the RO was
extended until 2037. Feed-in tariffs – a guaranteed
payment for renewable electricity generation – began
supplementing the RO in 2010. The UK is also part of
the EU ETS, which came into force in 2003. In 2011,
the government announced a Carbon Floor Price (CPF)
of £16/tCO2 in 2013 rising linearly (in real terms)
to £30/tCO2 by 2020 and to £70/tCO2 by 2030.
Source DECC (2011b), Annex A, Chart A1.
Figure 6. The 2020 view - Policy impact on price under Current Intent – Policies will have a significant
impact on electricity prices faced by large energy-intensive users
The Department of Energy and Climate Change has
calculated the effect of the Current Intent on non-
domestic retail electricity prices, shown in Figure 6.
They are forecast to rise by about 50 per cent over
ten years and to almost double over the next 20 years
(DECC 2011b). Consumers may be attracted to the
slightly lower prices of the New Dash for Gas and
Investment Shortfall scenarios, but they could suffer
badly from the chaotic peak prices of Investment
Shortfall and the long-term policy and environmental
risks in both these scenarios.

Page 16. Demanding Times for Energy in the UK
Figure 7. The 2020 view - Wholesale electricity prices rise under all scenarios, and lower prices come
at the risk of price spikes and environmental costs later on
Note: The index of wholesale electricity price gives an
indication of relative prices in the future. It is constructed
from a weighted average of the levelised costs of each
technology from Mott Macdonald (2010).
Source DECC carbon calculator and Vivid Economics

A Report Commissioned by RWE npower. Page 17
2.6 CONCLUSIONS
The Current Intent of energy policy is tremendously ambitious in the scale of capital investment programme over the remainder of this decade.
It is possible that the programme will slip, because the
cost and feasibility of achieving environmental targets
forces a change of direction. If it slips, there could
either be an orderly adjustment of the strategy towards
natural gas, allowing prices to moderate but with a
clear environmental penalty, or a more chaotic
outcome, where the UK falls back on its legacy coal
fleet, prices fluctuate and emissions rise. The next
section explores what these scenarios mean for
energy users.
Page 18. Demanding Times for Energy in the UK
3 HOW ENERGY USERS CAN TAKE CONTROL
The range of future energy scenarios may be wide, but fortunately the best response for energy users is the same in all of them: Pay attention to energy use and manage it wisely.
All scenarios entail massive new investments, higher
prices and the potential for more price volatility, caused
either by high renewables or under-investment.
The recovery of the costs of all this investment will not
be spread evenly across time periods. Day-to-day and
even hour-by-hour, there will also be times when the
number of network balancing actions that National Grid
has to take will increase potentially coinciding with peak
times when power prices are high and more of the cost
is recovered, and times when power prices are low, even
zero, when less of the cost is recovered.
This creates opportunities for larger electricity
customers. They can mitigate their exposure to these
costs in three ways:
− by becoming more energy efficient,
− by controlling the timing of their consumption, and
− by relying on their own stand-by generation when
it is economic to do so.
The first one of these options is well-known and well
understood. There is great scope to improve energy
efficiency through advances in technology, good
management and appropriate levels of capital
investment. As electricity prices rise, the return on
energy efficiency investment becomes more attractive.
Likewise, advances in technology reduce the costs and
improve the quality of energy efficiency investment. As
a result, consumers can expect to allocate more to their
energy efficiency budgets to take advantage of the
higher returns available.
The second and third options are less well-known, and
they are the focus of the narrative here. The principal
way in which firms can realise value from fluctuating
prices is through the market for short-term operating
reserve, known as STOR. The STOR market is becoming
more important as the generation mix swings towards
renewables. The normal market mechanisms of the
electricity system – which clear supply and demand
throughout each day, every day – will experience
increasing variations in price as wind capacity is added
to the grid. As a consequence, the opportunities to play
a part in the main power market also rise in value. Prices
also become more volatile in the Investment Shortfall
scenario, but for different reasons.
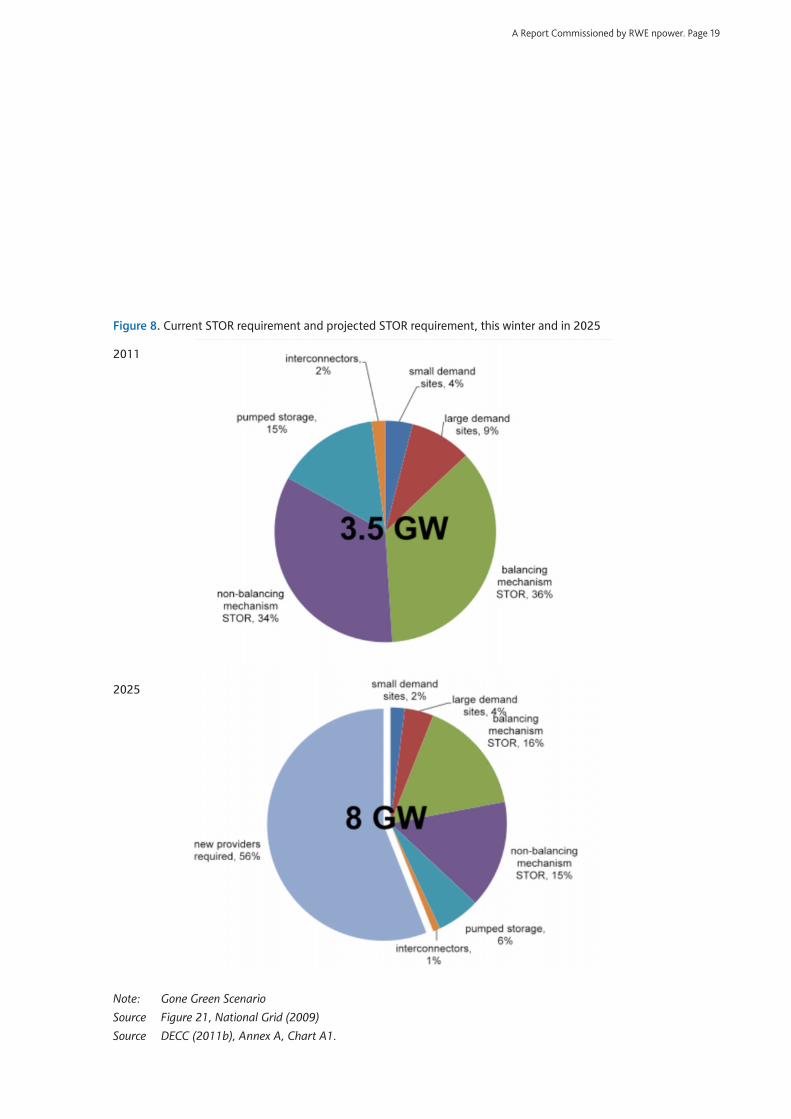
The STOR market is projected to grow rapidly, reaching
£565 to £945 millon a year by 2020. National Grid
expects it to be made up from around one third
capacity from large generators through the balancing
mechanism, one third from outside the balancing
mechanism, one sixth from pumped storage, and one
sixth from demand-side management, see Figure 8.
Impressively, between now and 2025, the amount of
reserve needed will more than double from 3.5 GW to
around 8 GW for a wind load factor of 30 per cent,
and to over 16 GW for a wind load factor of 100 per
cent, and new sources of capacity will have to be found.
Rewards will be paid through the reserve market to
stimulate investment in this capacity allowing
participants in demand side management and the
operators of generation assets to benefit.
A Report Commissioned by RWE npower. Page 19
Note: Gone Green Scenario
Source Figure 21, National Grid (2009)
Source DECC (2011b), Annex A, Chart A1.
Figure 8. Current STOR requirement and projected STOR requirement, this winter and in 2025
2011
2025

Page 20. Demanding Times for Energy in the UK
Note: reserve for response is the largest loss of load or
in-feed loss; basic reserve is demand forecasting error and
conventional plant loss; reserve for wind is wind volatility
Source National Grid (2011a)
Figure 9. Grid reserve requirements show a significant growth to 2020
The stark forecast and influence of wind volatility
shown in the Grid’s illustration above were evidenced
as recently as September 2011 while Grid had to take
significant numbers of emergency actions to manage
the tail-end effects of high wind in the UK from
Hurricane Irene and Hurricane Katia – causing
operational concern regarding future operations
when more than 20GW of Wind is connected
compared to the current 3GW.
A Report Commissioned by RWE npower. Page 21
3.1 PAYMENT FOR DEMAND-SIDE RESPONSE
3.1.1 What is changingAmong electricity buyers, a few early adopters have
begun to sell reserve services back to the power market.
They adjust their demand by trimming consumption
at peak times or when reserve capacity is thin. And
they are paid for it. Some of these canny buyers do
something else too. When there are gaps in supply
from large, grid-based power stations, they make
stand-by generation available. For this, they also receive
payment. All this has become possible for the first time
because of innovation in technology and power market
operation, coupled with increasing demand for services.
These two effects are dramatically increasing the payoff
and extending access to the opportunity. Experts
predict its adoption across British industry, to the
benefit of the firms, the UK’s competitiveness and
consumers.
3.1.2 New demand-side opportunitiesA good place to start is with the demand-side
opportunities. These have evolved from the simple
but disruptive interruptible contracts that were popular
with large gas users in the late 1990s and early 2000s.
Popular, that is, until the interruptions were called and
production was interrupted. Load management has
become much more sophisticated and convenient
since then.
Now, after a few years in development, energy suppliers
offer to purchase services back from buyers over a
whole range of activities, such as air conditioning of
buildings, industrial refrigeration in warehouses and
industrial processes. The supplier is given a degree of
remote control of the facilities and can adjust the load
in response to power market conditions. The costs of
setting up the control mechanics have fallen
dramatically as telemetry and control systems,
computerised aggregation and automation have
plummeted. As the costs have fallen, so the value-
added has risen.
By 2020, pundits are expecting that the costs of
administering these services will have fallen so low
that even individual appliances in households such as
cold and wet white goods will be able to sell services,
together with plug-in vehicles and heat pumps. In fact,
by 2020, up to around 12 GW of demand-side capacity
could be selling into the market, under the most
optimistic, greenest scenario developed by the
National Grid. This is shown in Figure 10. Around
half of the opportunity before 2020 is in industry
and commerce.

Page 22. Demanding Times for Energy in the UK
Note: Gone Green Scenario
Source National Grid (2011a)
Figure 10. Controllable capacity by 2020

A Report Commissioned by RWE npower. Page 23
3.1.3 How the contracts workThe majority of demand-side opportunities arise
through an arrangement known as ‘load shift’. The idea
is this. Load shift moves the time when the power is
consumed, perhaps bringing it forward or backward by
an hour or so. By this means, it is possible to smooth
out imbalances in supply and demand on the grid. For it
to work for the buyer, it must not matter too much
exactly when the power is consumed, at least to within
an hour or two. For it to be monetised on the operating
reserve market, the power consumption has to be
controllable so that it is available on demand, ready to
be sold into the market.
Good examples are air conditioning and refrigeration.
By running the plant harder in the time before the
demand reduction is needed, plant can be turned down
for an hour or two, to trim demand on the grid, without
causing problems. It can be turned up again later to
make up for lost time. The thermal inertia of the
building or refrigerated goods allows the temperature
to be kept within its target range across the whole
cycle. Appropriate operating agreements and remote
control allow the load to be turned up and down while
keeping the system within its required operating range,
so that the chilled goods stay in good condition and/or
people remain comfortable.
The National Grid has estimated that up to around
5.5 GW of load could be time-shifted in this way by
2020, which is two thirds of the expected operating
reserve requirement. The practicalities of the
arrangements are described in Box 1.
These arrangements are easier to install in modern
plants which have control systems capable of remote
control and monitoring, and because of economies of
scale, they offer higher returns for larger plants. Hence,
larger, modern plants are the likely candidates to take
advantage of the opportunity. Over the next few years,
as the technology becomes more widely adopted, the
price will fall and it will begin to make sense on a
smaller scale. Whilst there is still a need for
development and fine tuning, for larger plants,
the opportunities are already present.
Box 1. Demand management using contracts
Under one of these operating reserve contracts, the buyer, such as a large retailer, agrees to allow an
electricity supplier or other agent to install telemetry and control systems on its air conditioning or
refrigeration units. It also agrees acceptable temperature ranges which the equipment must achieve.
The control of the equipment is then passed to the supplier or agent, who will turn down or boost
power consumption in response to market needs and the temperature requirement. The buyer
receives a payment for having reserve response available and further payments when it is called upon.
These payments offset part of the user’s electricity bill, boosting profits, or for the non-profit sector,
enhancing value for money.

Page 24. Demanding Times for Energy in the UK
3.2 NEW REVENUE FROM STAND-BY GENERATION
Self-generation offers buyers a chance to make money
from their stand-by generation.
3.2.1 What is changingIn the same way that information and communications
technology and market changes are realising value from
load shift, stand-by generation can now similarly be
brought into play, thus creating revenue.
3.2.2 Stand-by generation capacity is used to reduce system costsStand-by generation has, until now, been used almost
exclusively as protection against unplanned
interruption, particularly from faults in the local
distribution grid. Many organisations maintain stand-by
generation ready to come into operation if the power
supply fails. Examples include: data warehouses, water
and sewerage pumping stations and treatment works,
telephone infrastructure, large offices, hospitals,
research laboratories, factories, manufacturing facilities
and the military. There is no official data on the amount
of capacity which exists in this form because it has
never before played a public role, but EA Technology
has estimated that total UK capacity of emergency
diesel generation at 20 GW. This is an impressive figure.
It is almost equal to all the UK’s coal-fired generation
fleet today (DECC, 2011a, Table 5.7).
Standby generation is normally only used in
emergencies. This is simply down to the economics: the
fuel (diesel) is more expensive and the generation units
less efficient than the main grid-connected power
stations. When the market becomes short of power and
power prices rise, they can rise to well above the levels
at which it is economic to run stand-by generation. Until
recently, there was no way to convey this price to
stand-by generation and to call it to run, without
administratively cumbersome bilateral communication
by fax or telephone. Now, however, with the advent
of telemetry and remote control systems, suppliers
and other agents can despatch small distributed power
generation units remotely, and handle the logistics
of keeping them supplied with fuel.
An example is Wessex Water, the water utility. The
firm has 550 generators totalling 100 MW. Of these,
18 MW across 18 units are linked to a control system
for automatic operation at times of high electricity
prices (Scottish Government, 2010).
Having solved the technical challenges, commercial
arrangements have been put in place to make the
despatch of stand-by generation a reality. The facilities
or utilities manager of a large office building,
manufacturing site or hospital can now place a contract
with an energy supplier or agent, making some
stand-by generation available. In return, the telemetry
is installed and an operating system agreed, and
payments are received for the time when the generation
is available to be used, even if it is not called upon.
When it is called upon, further payments are made, and
fuel re-supply is arranged. The highest payments are
available for those plants that can be relied upon to
generate when called to do so. Older, perhaps less
reliable assets, and those not well suited to telemetry
and remote control, may not command such a full price
or may not find a place in the market at all. Of the 20
GW installed in the UK, it is not known precisely how
much is suitable for operation in this way. npower’s
estimate this year is around 3 GW, and its estimate for
2020 is 5 GW. This seems quite conservative when
placed alongside EA Technology’s figure.

A Report Commissioned by RWE npower. Page 25
Table 1. Under-utilised self-generation capacity projection in the UK
Sector 2011 2015 2020
Self-generation capacity 3 GW 4 GW 5 GW
Note: 2010-2011
Source: npower
For those with existing stand-by generation, this new
source of revenue is a way of covering the costs of
maintenance and improving reliability. For those buying
new stand-by generation assets, it increases the returns
to the project, which may make stand-by generation
economic for new sites, and may instigate the purchase
of a larger plant.
3.2.3 The value of the opportunityNational Grid (2011b) sets out reserve tender outcomes
and RWE npower has estimated that the price paid
when stand-by generation capacity is called for by the
short-term operating reserve market mechanism was
£180-280/MWh in 2010. There is also a payment of
around £7-10/MWh. This is worth around £30,000-
45,000/MW of capacity per annum to an owner of
stand-by generation (RWE npower, personal
communication). That is roughly eight times the
industrial tariff for power. As demand for operating
reserve increases, shown in Figure 8, the price will rise
and the incentive to participate will grow stronger.
Indeed, by 2015, National Grid (2011b) estimates that
the utilisation payment will have risen to £544/MWh,
and by 2020 the figure is £685/MWh, all in real terms in
2010/11 money. That is an increase of 96 per cent in
ten years providing a strong incentive for new owners
of generation to participate. Across the whole market,
the total payments for being available and for
generating could reach £945 million per annum by
2020, up from £205 million in 2010. That is an increase
of 350 per cent in ten years.
There are profitable opportunities to be seized and they
are open to existing generation assets which have
already been paid for and sometimes even depreciated.
While the firms benefit, society does too. The
mechanism allows the market to find the cheapest way
to maintain an uninterrupted power supply whichever
scenario the UK finds itself in. It will be to the benefit
of all consumers if stand-by generation is put to its best
possible use.

Page 26. Demanding Times for Energy in the UK
3.3 AWAKENING THE GRID’S HINTERLAND
The total potential untapped load shift and stand-by
generation capacity that can be brought into the power
market for the first time is considerable relative to the
total capacity of the UK generation system. By 2020,
the UK’s industrial, commercial and public sector
hinterland, dispersed across the distribution networks,
could contribute the best part of 20 GW of controllable
power. A plausible estimate is that 12 GW already exists
and will enter the market as the practice becomes
known and is adopted. For this to happen, commercial
arrangements perceived as novel today must become
standard, and telemetry commonplace.
Note: Gone Green Scenario
Source National Grid (2011a)
Figure 11. Untapped market potential saving £1 billion a year of capital expenditure on
conventional power generation
A Report Commissioned by RWE npower. Page 27
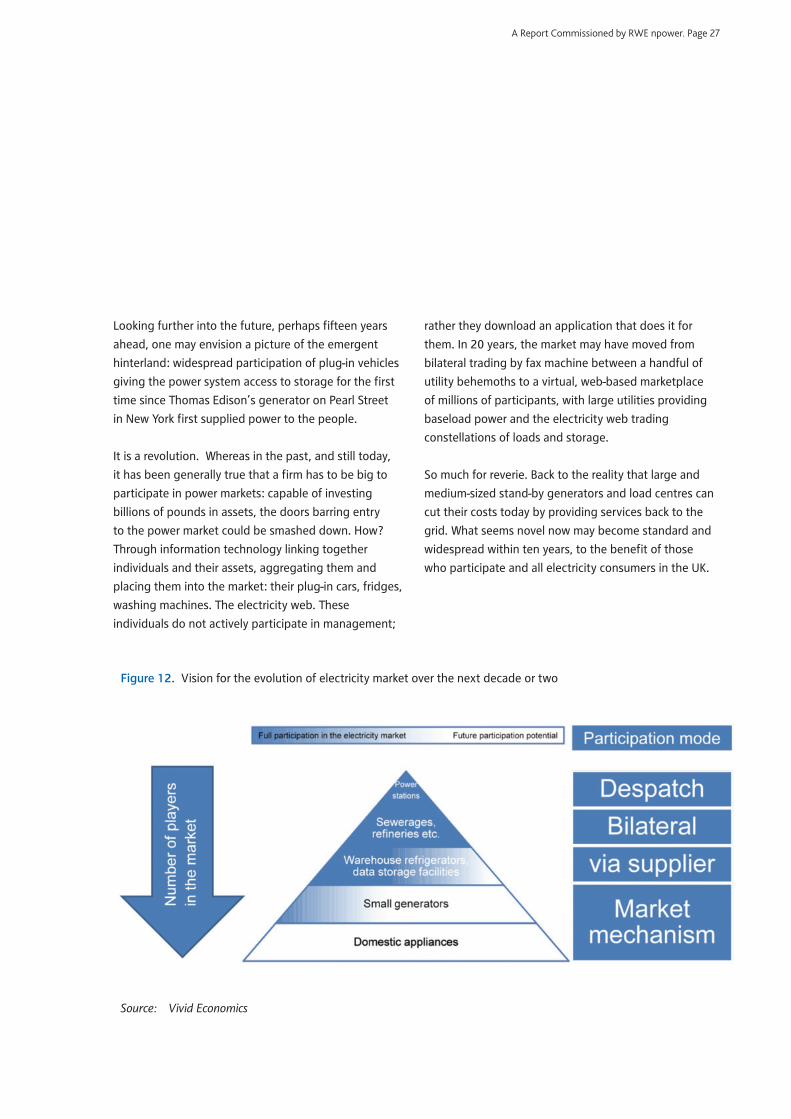
Figure 12. Vision for the evolution of electricity market over the next decade or two
Looking further into the future, perhaps fifteen years
ahead, one may envision a picture of the emergent
hinterland: widespread participation of plug-in vehicles
giving the power system access to storage for the first
time since Thomas Edison’s generator on Pearl Street
in New York first supplied power to the people.
It is a revolution. Whereas in the past, and still today,
it has been generally true that a firm has to be big to
participate in power markets: capable of investing
billions of pounds in assets, the doors barring entry
to the power market could be smashed down. How?
Through information technology linking together
individuals and their assets, aggregating them and
placing them into the market: their plug-in cars, fridges,
washing machines. The electricity web. These
individuals do not actively participate in management;
rather they download an application that does it for
them. In 20 years, the market may have moved from
bilateral trading by fax machine between a handful of
utility behemoths to a virtual, web-based marketplace
of millions of participants, with large utilities providing
baseload power and the electricity web trading
constellations of loads and storage.
So much for reverie. Back to the reality that large and
medium-sized stand-by generators and load centres can
cut their costs today by providing services back to the
grid. What seems novel now may become standard and
widespread within ten years, to the benefit of those
who participate and all electricity consumers in the UK.
Source: Vivid Economics

Page 28. Demanding Times for Energy in the UK
4 CONCLUSIONS
Electricity prices are rising despite the arrival on world
markets of shale gas. In the UK, the programme to
decarbonise power within 20 years requires huge
investment, clear legislation and prices will rise to pay
for it. Global energy policies particularly those across
our European neighbours, will also influence UK prices
and system stability. No one can be quite sure whether
all the targets will be met, whether consumers will
stomach rising costs or whether investors will take the
bait. The report outlined four conceivable scenarios of
how the UK energy sector might evolve. Implementing
the government’s current intent would create a clean
and secure, if somewhat more expensive, energy sector.
But it is also possible that costs will spiral or investment
fall short. The government’s commitment to its
environmental objectives may falter.
Whichever it is, energy users can take control by
becoming more energy efficient, by controlling the
timing of their consumption and by relying on their own
stand-by generation when it is economic to do so. Firms
that actively manage their energy demand do not only
reduce risks for themselves. They become part of the
solution and help energy companies to continuously
match supply and demand.
The UK possesses a substantial hinterland of
controllable electricity assets distributed across its
network. Some are stand-by generators, perhaps some
20 GW in total, sitting quietly waiting to step in if the
power to a sewage treatment works, refrigerated
warehouse, industrial process or data hotel is
interrupted. Mostly they lie idle. They could be put to
work. Others are air conditioning units and refrigeration
systems coupled to large thermal masses. They work
continuously or follow a common, regular pattern. They
could be used differently. The value of the services they
could provide to the electricity system is rising to
perhaps £1.5 billion a year by 2020, and the capital
investment saved by the adoption of new services could
be in the region of £0.5 billion a year for each of the
next ten years.
The technology which makes all this possible is the
same information and communications technology
which delights so many smartphone users. For the first
time, energy suppliers can take control of distributed
assets, and offer attractive payments for access to
reliable generation capacity, both when it is called to
operate and when it is idle. The early-adopters who
have taken up the offer so far are enjoying lower
power bills.
It is likely to become common practice as more get to
hear about it and as the rewards increase, which they
are predicted to do, with the price paid for reserve
power expected to double over the next ten years.
These possibilities may be only the first of a wave of
transformations in the electricity market, as smart
appliances and plug-in vehicles offer an amazing
prospect: an electricity web in which millions
participate. In this vision of the future, the market is
no longer a private club for utilities, but is open for all.

A Report Commissioned by RWE npower. Page 29
Committee on Climate Change (2010), The Fourth
Carbon Budget – Reducing emission through the 2020s,
December
Committee on Climate Change (2011a), Meeting
Carbon Budgets – 3rd Progress Report to Parliament,
June
Committee on Climate Change (2011b), The Renewable
Energy Review, May
DECC (2011a), Digest of United Kingdom Energy
Statistics, London: TSO
DECC (2011b), Provisional estimates of the impacts
of energy and climate change policies on energy prices
and bills of large energy intensive users, July
EIA (2011), Annual Energy Outlook, April
HM Government (2011), Update on the design of
the Green Investment Bank, Department for Business,
Innovation and Skills
HM Treasury (2011), Carbon price floor consultation:
the Government response, March
House of Lords (2008), Economic Affairs - Fourth
Report: The Economics of Renewable Energy, November
Mott MacDonald (2010), UK Electricity Generation
Costs Update, June
National Grid (2009), Operating the Electricity
Transmission Networks in 2020 – Initial Consultation,
June
National Grid (2011a), Operating the Electricity
Transmission Networks in 2020, June
National Grid (2011b), STOR Market Information Report:
TR 14, August
Scottish Government (2010), Energy Storage and
Management Study, October
5 REFERENCES
Page 30. Demanding Times for Energy in the UK
Overview
The npower Future Report, ‘Demanding Times
for Energy in the UK’, with its four scenarios –
or ‘possible futures’ - makes interesting reading.
The UK’s energy future is one of the country’s crucial
challenges as we look ahead to the 2020s and beyond.
As the report makes clear we confront ‘the end of a
golden age of cheap energy’. The world’s demand for
energy is expected to double by 2050. As it happens,
the same argument goes for food, with world prices
being pushed steadily upwards by the burgeoning
growth of population in developing nations,
accompanied by equally rapid urbanisation [UN, World
Bank]. This same urban explosion, incidentally, will
create a phenomenal increase in global demand for
electricity, however this is generated in years to come.
In both cases we need to find radical solutions over
the coming decade and beyond.
As a futurist I take a more holistic approach to the
factors influencing the shape of things to come. So
my commentary on the npower Future Report adds a
broader context to the deliberations of the Report’s
authors and gives a wider perspective on the possible
evolution of the UK’s energy scene over the next ten to
fifteen years.
One thing we need to recognise at the outset is the
sheer scale of the challenge of creating a ‘post-carbon’
world. In global terms, if we are to shift away from oil
and coal in the coming years we need to replace the
annual equivalent of a cubic mile of oil. That may not
sound too much to most of us but in reality it would
be a colossal challenge. China’s Three Gorges Dam
project, the world’s biggest power station in terms
of installed capacity, took 14 years to build and
commission at a cost of $26 billion. We would need
two hundred of them to match that cubic mile of oil.
Or we would need to build 2,600 new nuclear plants,
hardly a popular option after the catastrophe in
Japan in early 2011 [IEA]. The UK faces choices on
a comparable scale if it is to transform its energy
equation to a post-carbon alternative.
There are three key drivers of the UK’s energy future
as we look ahead to the next ten to fifteen years:
– The momentum towards a low- or post-carbon
economy
– How the built environment evolves in response to
changes in: demographic and social norms; digital
connected technologies; business models and
organisational structures; working practices;
– The economic and financial conditions and options
of UK PLC.
The characteristics of the UK energy landscape in
the 2020s will be shaped by the interplay by these
factors and the degree to which one or the other
predominates. Let’s briefly look at these three factors
and consider the possible future outcomes.
6 ‘ENERGY UK: INTO THE 2020S - A COMMENTARY BY FUTURIST DR JAMES BELLINI
A Report Commissioned by RWE npower. Page 31
The UK government has set itself a target of reducing carbon dioxide emissions by 60 per cent by 2050 compared to 2000, with ‘real progress by 2020’.
More recently an additional government commitment
was made to cut greenhouse gas emissions by 80 per
cent by mid-century. What is the likelihood of these
goals being achieved?
There are five essential elements in a post-carbon
strategy, all of them imprecise and unpredictable.
In looking ahead to the UK’s energy developments
in the 2020s we need to assess how these elements
will figure in energy decision-making over the coming
decade or so.
The first element is greater energy efficiency – making
our available energy work harder and reducing waste.
Despite the cynics, considerable progress has been
made in this area over the past few decades. In the
United States, for example, the amount of energy
needed to produce an extra dollar of GDP has halved
since the end of World War II. [US Energy Information
Administration]
Work by the McKinsey Global Institute shows that by
investing in such priorities as better building efficiency,
low-energy lighting, more fuel-efficient vehicles, and
best-practice industrial processes, world energy
demand growth can be cut by more than 64 million
barrels of oil per day – a saving equal to more than
one-and-a-half times current US consumption.
Unfortunately, the UK has a less than impressive history
of energy efficiency. For example, domestic dwellings
in the UK, account for 27 per cent of the country’s
carbon dioxide emissions. More than half of UK homes
have insufficient insulation, and around 50 per cent
more energy is used to heat and power homes than
is used to power UK industry [ONS]. As of today, the
UK consumes more than twice the world average in
energy use per capita.
In 2006, before the economic crisis set in, the
government announced its ambition to have all new
homes constructed after 2016 conform to zero carbon
standards. This gave rise to the Code for Sustainable
Homes. Given the current economic circumstances,
which seem set to prevail for the greater part of this
decade, it is highly unlikely such an ambition will be met
on broad scale this side of 2020. But even if this 2016
step-change happens, it still leaves the vast majority
of the UK’s housing stock reflecting earlier, energy-
inefficient standards of build and insulation. This
housing stock is among the least energy efficient in
Europe. It is also old: 62 per cent of all dwellings were
built before 1965, while 35 per cent date back to
before World War II. [ONS]
The UK’s business community could also do much
better in the area of energy efficiency, especially
small and medium-sized enterprises. A recent study
revealed Britain’s SMEs were losing out on £7.7 billion
in efficiency savings through failing to take a number
of basic steps.
The second element is decarbonising the energy
supply. This means switching over to a broad range
of technologies already familiar to us: solar, wind,
geothermal and the rest. Given cost and other
constraints it is unlikely the UK will have made this
transition on any meaningful scale by 2020; it is
likely to be the later 2020s before we begin to see
real progress.
TOWARDS A POST-CARBON ECONOMY
Page 32. Demanding Times for Energy in the UK
According to EU estimates, solar energy will still only be
producing around 4 per cent of electricity worldwide by
2030. Even so, we need to record the considerable shift
to cleaner energy sources over the past half century. In
the 1940s some 90 per cent of UK electricity generation
came from coal. Today the figure is less than a third. But
so far coal has been replaced by clean renewables on a
very small scale. The UK’s Renewable Energy Directive
aims to have just 15 per cent of the country’s energy
consumption provided by renewable sources by 2020.
Of that percentage faddish sources like solar will make
a minute contribution.
One factor assuming increasing importance in this
debate is the growing availability of newly discovered
fossil fuel reserves in and around the UK. I note, for
example, the Report’s comments on the growing role
of gas – especially shale gas – as a relatively cheap
energy source. The recent discovery of over 5 trillion
cubic meters of shale gas in north west England
around the Blackpool area adds to this momentum,
notwithstanding the considerable environment hurdles
involved. There are also successes in finding oil in new
areas of the North Sea, some of them described as ‘the
largest ever’.
Third is the huge contribution to energy consumption
and carbon emissions made by the transportation
sector. Improved automotive technologies, with more
fuel-efficient engines, will help. So too will be electric
vehicles. One forecast published recently suggests that
by 2025 electric vehicles will account for 25 per cent of
all cars produced, although there are concerns we
cannot build the associated infrastructure [plug points
and the rest] to support such an expansion in the
electric car population.
Fourth is an issue only indirectly linked to the UK’s
own energy future but still important: the preservation
and recovery of the world’s forests. These forests act as
the planet’s lungs, inhaling carbon dioxide and exhaling
oxygen. The depletion of these forests is a major reason
we confront a climate change challenge in the years
ahead.
The fifth element, though, is very much in our hands:
our behaviour and patterns of living. As a society we
have become profligate with our energy use, in much
the same way as we became oblivious to our household
finances in the years running into the credit crunch crisis
A key part of the solution here is a significant change in
our lifestyles over coming years away from transport-
dependency, everything from the school run and
commuting [according to a survey by IT firm Citrix,
Britons currently spend 4.6 million hours every weekday
travelling to and from work] right through to the food
miles churned out by our supermarket food culture.

A Report Commissioned by RWE npower. Page 33
Energy consumption is, of course, a reflection of how we live, work and socialise.
And changing how we conduct our lives in the future
is likely to play a key role in curbing our energy appetite
and help deliver a better energy consumption profile.
As we look ahead to the 2020s we encounter many
and important changes in the built environment we
will inhabit, with equally important implications for our
patterns of energy use. Let us briefly consider them:
– Demographics: the UK is growing older. The fastest-
growing age groups are the over-80s and over-90s.
[ONS] Older people now outnumber children. These
are unprecedented developments we have no
previous experience of managing. An older society
needs a different kind of built environment – fewer
schools, different healthcare facilities, greater focus
on access and mobility.
– Household living: the fastest-growing household type
is single person occupation. The nuclear family of two
parents and small children is steadily declining.
Perhaps the most endangered species in the UK
looking forward is the semi-detached house.
Currently, one in three UK homes is a semi. This shift
in household types could well stimulate a move
towards high-density housing in new urban
communities.
– What futurists call the ‘Internet of Things’ will offer
infinite possibilities in the years ahead to the business
community and our wider society. This second phase
of the Internet sees billions of devices and sensors
connected to each other, collecting and
communicating vast amounts of data. There are now
more inanimate objects connected to the Internet
than people. This rapidly growing digital connected
world will drive new business models and new ways
of working. By the 2020s any forward-looking
company could well have no headquarters and no
CEO; it will own no IT; its employed headcount will
be a fraction of what it is today; its most important
business asset will be its networked ecosystem of
partners, collaborators and customers.
– Many companies will increasingly move away from
old-style fixed-place offices to more flexible and
‘extended’ ways of working. The number of ‘free
agent’ workers, who are neither employer nor
employed and work in a flexible way without
recourse to fixed-place office facilities, will increase.
Government figures tell us there are already over 4
million such free agents in the UK; expect this to rise
to more than 8 million by the 2020s. The implications
for office size and location, commuting patterns and
associated energy use will be considerable.
– UK business must also work harder to drive the
sustainability agenda it professes to follow. Green
office buildings currently make up just two per cent
of the market but there are signs companies are keen
to practice what they preach. A report published in
early 2011 by PriceWaterhouseCoopers and the Urban
Land Institute found that, on top of lower costs,
sustainable office space engendered smoother
relationships between real estate firms and planners
and gave businesses an advantage when recruiting
as candidates are increasingly taking environmental
policies into account when making employment
decisions. Even so, the era of the green workplace
will probably dawn not in this decade but in the
2020s, when UK PLC has recovered its confidence
and the country’s financial straitjacket has eased.
– Nevertheless, ‘smart’ households and communities
will increasingly be a feature of the UK as we assess
our future prospects. New technologies will help
ENERGY AND THE UK’S FUTURE BUILT ENVIRONMENT

Page 34. Demanding Times for Energy in the UK
create a built environment where energy use can be
monitored and managed intelligently, both within
homes and across entire communities. The compact
‘smart’ kitchen of tomorrow will be hooked up to the
Internet of Things – everything will talk to everything
else, saving precious time, effort, water, energy and
waste. The long term vision is that every appliance
and device will eventually be controlled and
monitored via a smart grid and supervised by
self-organising robots that will look after everything
from minimising electricity consumption and running
appliances to checking household food and drink
inventories and ordering up new supplies online
when they are running low. Advances such as wireless
electricity will cut down on the clutter of cables and
wall sockets of today’s kitchen environment. This may
be a vision for the more distant future but it is
nonetheless a blueprint of what we can one day
achieve.
– Smart communities also promise radical changes in
how we manage energy consumption in homes,
places of work and across our everyday infrastructure.
Such a goal is as radical as the shift from small local
supply networks to electricity grids a century ago. For
a flavour of this 2020s smart future take a look at the
city of Mannheim. The Model City of Mannheim
(MoMA) is one of six model regions that have received
funding under the German federal government’s
E-Energy technology incentive programme. This is
focused on evaluating how information technology
can be used to intelligently control electricity supply
and demand. The project uses this technology for
real-time monitoring and management of power
generation, distribution and consumption, to create a
virtual energy marketplace in which all stakeholders
can participate.

A Report Commissioned by RWE npower. Page 35
Since the 2003 energy White Paper, and its vision of ‘creating a low carbon economy’, UK official policies have sharpened their focus on the ideal of developing a new energy equation designed to significantly reduce the country’s carbon footprint.
But such policies need considerable financial and other
resources if they are to be achieved.
It is no secret that, since the onset of the credit crunch
crisis, the UK economy and financial system confront
unprecedented challenges that are set to have a severe
knock-on effect in areas like public spending and the
availability of funds for new investment, as well as
household and individual spending.
Macro-economic analysis of the next one to two years
paints a negative picture of flat economic growth and
continued serious pressures on the public purse. But
what of the longer term? Looking ahead to 2020 what
observations can be made about the UK’s ability to
invest in a new energy future?
The underlying challenges are straightforward. UK PLC
has to pay down unprecedented levels of public and
household debt, rebalance the economy towards a
more sustainable sectoral spread and develop pathways
to longer-term job creation. Again, the sheer scale of
these problems needs to be recorded. For instance, at
the start of the credit crunch UK household and
personal debt had reached around £1.4 trillion, about
the same size as Britain’s GDP. Households could well
spend the rest of the decade reducing this colossal
debt mountain. It seems clear that for the better part of
this decade energies will be focused primarily on
repayment, recovery and rebuilding. In this respect the
years to 2020 will not be a time of exuberant spending
– public or private – and will probably be marked by a
mood of austerity, risk-aversion and caution. We may
be in the midst of a ‘lost decade’ like that afflicting
Japan in the 1990s, a period of stumbling growth
and financial retrenchment.
This unappealing scenario is supported by the
International Labour Organisation [ILO]. In a report
published in October 2011 it suggests the economic
landscape will not start improving before the middle
of this decade: ‘It will take at least five years for
employment in advanced economies to return to
pre-crisis levels.’ The OECD, meanwhile, told world
leaders ahead of the G20 summit in November it
predicted a sharp slowdown in growth in the eurozone
and warned that some countries in the 17-nation bloc
were likely to face negative growth.
So while the emerging digital, connected world
described above will no doubt transform how we live,
work, consume and socialise in the future, this is not
the same as saying it will bring with it a new prosperity.
Apart from the immense financial and economic
challenges facing UK PLC our ageing population will
have increasing financial impact as we approach the
2020s. For one thing our fast-growing number of older
people will draw down on savings plans and other
investments to fund their needs in retirement.
Meanwhile, our largest trading partner, the EU [it buys
nearly 60 per cent of Britain’s exports], is not only
troubled by current and near-term financial woes, it is
also a shrinking marketplace blighted by a future of
lower growth over the next few decades. A key reason
for this is that Europe’s population is expected to fall
by between 50 and 100 million people over the next
thirty years or so. Countries like Italy have been falling
FUTURE ENERGY OPTIONS AND THE STATE OF UK PLC
Page 36. Demanding Times for Energy in the UK
in absolute numbers since 2005. So we face a future
of increasing costs to support our ageing societies and
a steady decrease in the number of consumers for our
traded products and services.
Such economic prospects could drive a shift in popular
opinion about our energy future. There is a clear public
consensus about our need to build a carbon-free future,
in a similar way to the growth of the anti-smoking lobby
and its impact on public policy and popular acceptance.
But the smoking issue has been influenced by health
concerns, not financial constraints. Of the four
Scenarios described in the npower Future Report,
Scenario 3 -- Investment Shortfall – best reflects this
future economic perspective.
But one other factor tempts me towards Scenario 2 –
Dash For Gas. This is where the UK government,
pressured by considerable financial shortfalls,
backtracks away from a decarbonised and renewable
option. I take this to describe a future energy outlook
that parks worthy post-carbon policies – backed by UK
governments and parties of all political persuasions –
and pursues lower cost and more dependable reliance
on existing and known fossil fuel reserves.
This same possibility is raised in a June 2011 report
from the IEA entitled ‘Are We Entering a Golden Age of
Gas?’ that points to significant role for gas up to 2035,
with ‘unconventional gas’ playing an increasingly
important part in meeting burgeoning global gas
demand driven above all by strong growth in places
like China, India and the Middle East.
A key factor shaping the future energy equation is cost.
A recent report from the UK Energy Research Centre,
for instance, points out that offshore wind generation
is 90 per cent more expensive than fossil fuels and 50
per cent more than nuclear. More to the point, the
report concludes that wind generation will not reach
cost parity with oil or gas until the 2030s at the earliest.
It casts serious doubts over the government’s aim to
have renewable producing one third of our electricity
by 2020. Energy commentators insist gas will be the
mainstay of electricity generation for years to come.
Meanwhile, energy companies are following the same
logic. Shell, for example, has been synonymous with the
oil industry for over a century. Yet from 2010 Shell will
produce more cleaner-burning natural gas than oil. It is
a sign of the times – and probably of the future.
Sources:
IEA - International Energy Agency
ONS - Office of National Statistics

NOTES