DEMAND FOR DECISION AUTONOMY AND WILLINGNESS … · DEMAND FOR DECISION AUTONOMY AND WILLINGNESS TO...
24
D EMAND FOR D ECISION AUTONOMY AND W ILLINGNESS TO T AKE R ESPONSIBILITY IN R ISKY E NVIRONMENTS : E XPERIMENTAL E VIDENCE August 30, 2016 Abstract This paper experimentally studies individuals’ willingness to pay for the authority to make risky decisions (1) for themselves, and (2) on behalf of another person, as primary determinants of leadership willingness. We consider a setup involving a pair of individuals, where one individual is designated to make both parties’ decisions by default. However, depending on treatment, either party can express a willingness to pay to change this situation. If one’s willingness to pay to make her own decision herself is positive, we interpret it as a demand for autonomy; whereas if it is negative, it shows a desire to delegate. On the flip side, if the willingness to pay to make a decision on behalf of another person is positive (negative), we interpret it as a demand for taking (desire to avoid) responsibility. Results suggest that (1) the demand for autonomy is significantly positive, (2) the willingness to take responsibility is significantly positive but lower than that for autonomy, (3) the willingness to pay for both autonomy and responsibility are lower among women, (4) men demand more autonomy when the person making the decision for them is male. We also explore differences between individuals’ own decisions, the decisions they make on behalf of others, and their correlates. The results have implications for the allocation of decision-making authority in groups and leadership. Keywords: delegation, responsibility, experiments, decision-making under risk, group decisions, gen- der, leadership. JEL Classification Numbers: C91, C92, D81, J16. 1
-
Upload
nguyenthuy -
Category
Documents
-
view
219 -
download
0
Transcript of DEMAND FOR DECISION AUTONOMY AND WILLINGNESS … · DEMAND FOR DECISION AUTONOMY AND WILLINGNESS TO...
DEMAND FOR DECISION AUTONOMY AND WILLINGNESS
TO TAKE RESPONSIBILITY IN RISKY ENVIRONMENTS:EXPERIMENTAL EVIDENCE
August 30, 2016
Abstract
This paper experimentally studies individuals’ willingness to pay for the authority to make riskydecisions (1) for themselves, and (2) on behalf of another person, as primary determinants of leadershipwillingness. We consider a setup involving a pair of individuals, where one individual is designatedto make both parties’ decisions by default. However, depending on treatment, either party can expressa willingness to pay to change this situation. If one’s willingness to pay to make her own decisionherself is positive, we interpret it as a demand for autonomy; whereas if it is negative, it shows adesire to delegate. On the flip side, if the willingness to pay to make a decision on behalf of anotherperson is positive (negative), we interpret it as a demand for taking (desire to avoid) responsibility.Results suggest that (1) the demand for autonomy is significantly positive, (2) the willingness to takeresponsibility is significantly positive but lower than that for autonomy, (3) the willingness to pay forboth autonomy and responsibility are lower among women, (4) men demand more autonomy whenthe person making the decision for them is male. We also explore differences between individuals’own decisions, the decisions they make on behalf of others, and their correlates. The results haveimplications for the allocation of decision-making authority in groups and leadership.
Keywords: delegation, responsibility, experiments, decision-making under risk, group decisions, gen-der, leadership.JEL Classification Numbers: C91, C92, D81, J16.
1
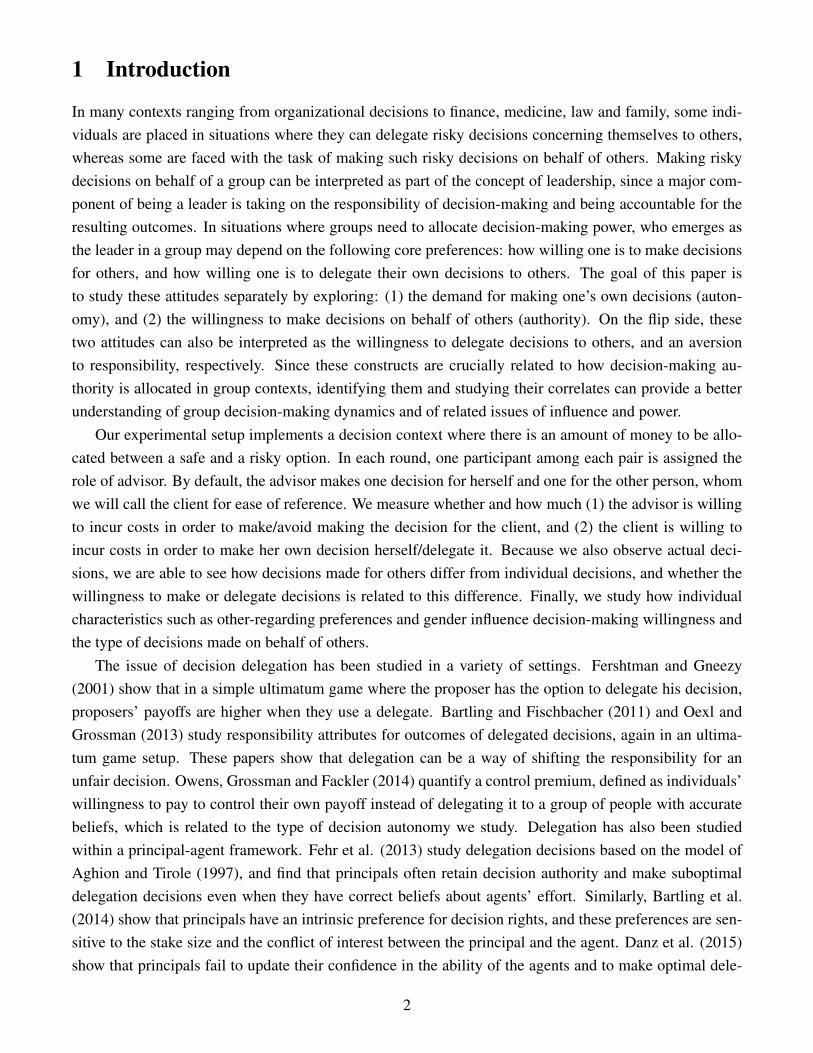
1 Introduction
In many contexts ranging from organizational decisions to finance, medicine, law and family, some indi-viduals are placed in situations where they can delegate risky decisions concerning themselves to others,whereas some are faced with the task of making such risky decisions on behalf of others. Making riskydecisions on behalf of a group can be interpreted as part of the concept of leadership, since a major com-ponent of being a leader is taking on the responsibility of decision-making and being accountable for theresulting outcomes. In situations where groups need to allocate decision-making power, who emerges asthe leader in a group may depend on the following core preferences: how willing one is to make decisionsfor others, and how willing one is to delegate their own decisions to others. The goal of this paper isto study these attitudes separately by exploring: (1) the demand for making one’s own decisions (auton-omy), and (2) the willingness to make decisions on behalf of others (authority). On the flip side, thesetwo attitudes can also be interpreted as the willingness to delegate decisions to others, and an aversionto responsibility, respectively. Since these constructs are crucially related to how decision-making au-thority is allocated in group contexts, identifying them and studying their correlates can provide a betterunderstanding of group decision-making dynamics and of related issues of influence and power.
Our experimental setup implements a decision context where there is an amount of money to be allo-cated between a safe and a risky option. In each round, one participant among each pair is assigned therole of advisor. By default, the advisor makes one decision for herself and one for the other person, whomwe will call the client for ease of reference. We measure whether and how much (1) the advisor is willingto incur costs in order to make/avoid making the decision for the client, and (2) the client is willing toincur costs in order to make her own decision herself/delegate it. Because we also observe actual deci-sions, we are able to see how decisions made for others differ from individual decisions, and whether thewillingness to make or delegate decisions is related to this difference. Finally, we study how individualcharacteristics such as other-regarding preferences and gender influence decision-making willingness andthe type of decisions made on behalf of others.
The issue of decision delegation has been studied in a variety of settings. Fershtman and Gneezy(2001) show that in a simple ultimatum game where the proposer has the option to delegate his decision,proposers’ payoffs are higher when they use a delegate. Bartling and Fischbacher (2011) and Oexl andGrossman (2013) study responsibility attributes for outcomes of delegated decisions, again in an ultima-tum game setup. These papers show that delegation can be a way of shifting the responsibility for anunfair decision. Owens, Grossman and Fackler (2014) quantify a control premium, defined as individuals’willingness to pay to control their own payoff instead of delegating it to a group of people with accuratebeliefs, which is related to the type of decision autonomy we study. Delegation has also been studiedwithin a principal-agent framework. Fehr et al. (2013) study delegation decisions based on the model ofAghion and Tirole (1997), and find that principals often retain decision authority and make suboptimaldelegation decisions even when they have correct beliefs about agents’ effort. Similarly, Bartling et al.(2014) show that principals have an intrinsic preference for decision rights, and these preferences are sen-sitive to the stake size and the conflict of interest between the principal and the agent. Danz et al. (2015)show that principals fail to update their confidence in the ability of the agents and to make optimal dele-
2
gation decisions. Taken together, these papers highlight the importance of the allocation of decision rightsand responsibility for outcomes in diverse contexts. Studying the willingness to obtain, retain or give updecision rights as individual traits and exploring their correlates as we do in the current paper can there-fore have implications for a variety of economic settings ranging from allocation games to principal-agentcontexts.
A major setting where issues of authority and autonomy are central is group decision-making. In thisliterature, comparing individual decisions with group decisions or with decisions made for others in riskyenvironments has been a major focus (Stone et al. 2002; Eriksen and Kvaly, 2010; Chakravarty et. al,2011; Charness et. al, 2007; Daruvala, 2007; Trautmann and Vieider, 2011; Harrison et al., 2012; Rohdeand Rohde, 2011; Nioeber, 2015). Our study contributes to this literature by identifying individual char-acteristics that influence the difference between decisions made for oneself and for others, including thedemand for autonomy/authority. Understanding whether individuals who are averse to making decisionsfor others or who are more altruistic are more likely to ”shift” their decisions in a certain way in a groupcontext can help understand group dynamics better.
It is well-documented that gender is an individual characteristic that can play a major role both inindividual and group decisions, especially under risk. Given that women are found less in positions ofdecision-making power or leadership, a question that arises is whether the demand for decision auton-omy and/or authority may be among the preference parameters that differ among gender and influenceself-selection into positions of authority (Croson and Gneezy, 2009). In the leadership context, there areseveral papers that document gender differences, hinting at such a possibility. Reuben et. al. (2010) findthat women become leaders less often than men in competitive environments, although their performanceis not significantly different than men’s. The observed difference in this context is explained by overcon-fidence differences across gender. Cettolin and Riedl (2010) document a significant gender difference indelegation, whereby women are more likely to delegate risky and ambiguous choices than men. Arbakand Villeval (2013) show that women are less likely to be willing to lead in public goods contributiongames. Finally, Ertac and Gurdal (2012) show that, in a risky decision context, women are significantlyless likely to make decisions on behalf of a group. In addition to replicating this result, Ertac and Gurdal(2014) consider treatments with and without preference communication, and find that the gender differ-ence is invariant to whether others can communicate their preferences to the leader. Alan et al. (2016)show that the gender difference appears in adolescence, concurrently with a gender difference in aversionto social scrutiny. The current paper implements a setup where individuals know the gender of the personfor whom a decision might be made or to whom a decision might be delegated. Therefore, in addition tounderstanding whether the lower leadership propensity of women is due to lower demand for autonomyor a higher aversion to responsibility or both, we are able to analyze how the demand for decision-makingautonomy and authority changes according to whether one is delegating to or deciding on behalf of a manor a woman.
The current paper separates the leadership decision into two components: decision autonomy (whenone does not lead in a group, she by default delegates her own decision to others), and the willingnessto take responsibility (when one leads, her decision affects everyone’s payoffs). The design allows us to
3
study both the demand for autonomy and the willingness to take decision-making responsibility for otherswithin-person, study their individual and contextual correlates such as social preferences, client’s/advisor’sgender, and the probability of loss in the risky decision setting, and thereby construct a complete pictureof these important components of group decision-making dynamics and leadership. We find that on av-erage individuals are willing to pay positive amounts of money to make their decisions themselves, anda positive but smaller amount to be able to make decisions for others.1 Men have both a higher demandfor autonomy and a higher willingness to take responsibility than women. We also find that males de-mand more autonomy when the person making the decision for them is male. Altruistic subjects have alower willingness to decide on behalf of others, and they are also more likely to change their decisions ina cautious way when deciding for others. These insights about the correlates of leadership willingness,autonomy and authority can be policy-relevant for designing institutions and interventions that can leadto more efficient and/or more equitable allocations of decision-making power in groups, or to achieve acertain type of decision outcome in group contexts.
The paper is organized as follows: Section 2 reviews the experimental design and procedures, Section3 describes the data and the results of the analysis and Section 4 concludes.
2 Experimental Design and Procedures
The main decision context in our experiment is based on the allocation task of Gneezy and Potters (1997).Here, subjects are asked to allocate 10 Turkish Liras (TL) between a risk-free and a risky option. Whilethe money invested in the riskless option (S) is safe, the amount allocated to the risky option is eithermultiplied by 2.5 (good state) or lost (bad state). The probability of the good state, p, takes on the valueof either 0.3 or 0.7 in a given round. Earnings from this task are the amount kept in the safe option (S) inthe bad state, and that plus 2.5 times the amount invested into the risky option (S+2.5(10-S)) in the goodstate.
The experiment consists of two main treatments, each lasting for 4 periods, and a dictator game that isplayed after these treatments. At the beginning of each period, two-person groups are randomly formedand one of the subjects is assigned the role of advisor (she). The default role of the advisor is to makeone allocation for herself and one for the other subject, which we will call the client (he). In Treatment1, clients can have a say in delegating their risk decisions to the advisor, or making their own decisions.Specifically, clients’ willingness to make (or delegate) their decisions are elicited using a price list thatinvolves monetary costs or gains, which will be explained in detail below. In Treatment 2, it is the advisorsthat have a say in demanding to make or refraining from making a decision for the client. Again, a pricelist that involves monetary costs or gains is used to measure the willingness to take (or avoid) responsibility
1In a concurrent paper, Neri and Rommeswinkel (2014) separate the preference for decision rights into three components:freedom (the degree that a player’s preferences determine his outcome), power (causally influencing the outcomes of others)and non-interference (making decisions without intervention of others). They find, consistently with our results, that peoplevalue non-interference more than freedom and power, albeit in a different decision context that involves bidding for the decisionright to choose among payoff distributions.
4
for another subject.Each subject participates in both treatments. The order of the treatments is randomly determined
across sessions in order to counterbalance potential order effects. Matching is randomized such that ineach treatment, all subjects make decisions once as advisor and once as client, for each of the two winningprobabilities (0.3 and 0.7). We therefore get four decisions per treatment from each subject. At the end,one among 8 periods is chosen randomly and subjects are paid according to their payoffs in the chosenperiod. Table 1 provides an example of the types of decisions that a single subject goes through duringTreatment 1.
Table 1: Sample Decisions for a Single Subject in Treatment 1
Period 1 Period 2 Period 3 Period 4
p=0.3 p=0.7 p=0.3 p=0.7Advisor Advisor Client Client
At the very beginning of the experiment, subjects choose an avatar that will represent them throughoutthe experiment. The avatar is a gendered cartoon figure that may or may not be consistent with the subject’sactual gender (two sample avatars are given in the Appendix, Section D). In a given period, subjects in thesame group are able to see each other’s avatar on the screen. This procedure is used to study the effect ofthe other party’s gender on advisors’ or clients’ decisions, without explicitly drawing attention to gender.2
2.1 Treatment 1: The Demand for Autonomy/Delegation
In this treatment,
• The advisor makes two investment decisions: one to determine her own payoff, and one the client’s.These decisions are made for separate endowments (10 TL’s each).
• The client makes a series of choices between delegating his decision to the advisor, and making hisown decision himself (see Table 2).
• If the client ends up delegating his decision, his payoff is determined according to the advisor’sdecision. Otherwise, he makes the risk decision that determines his own payoff.
As can be seen in Table 2, the client can state a positive willingness to pay or a positive willingnessto accept to make his decision himself. Specifically, for each of the 17 rows in the form depicted in Table2, the client chooses one option. The computer then randomly selects one row, and based on the client’schoice in that row, his payoff is determined for that round. The form measures how much money the clientis willing to pay (or receive) in order to make his own decision, by using the switch point from left column
2Results show that 13 out of 92 female subjects chose male avatars while 14 out of 90 male subjects chose female avatars.In response to a survey question at the end of the experiment, participants who chose avatars opposite to their gender oftenstated that it was the appearance of the avatar that induced them to choose it.
5
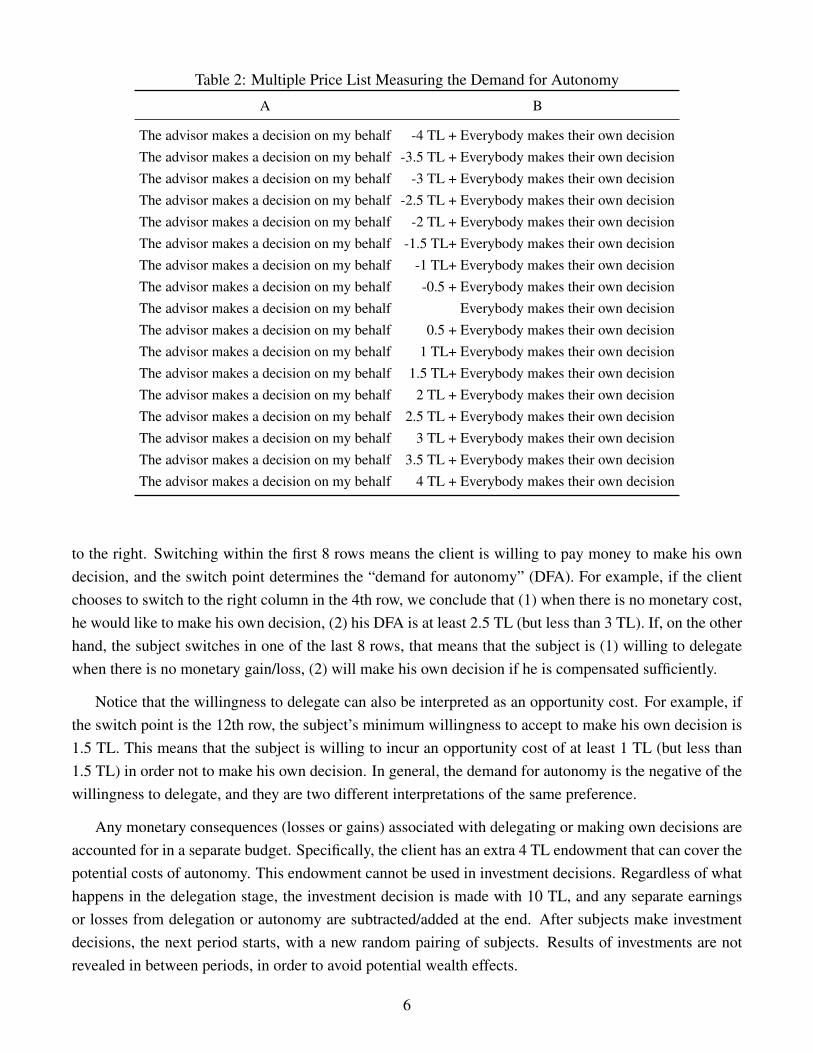
Table 2: Multiple Price List Measuring the Demand for Autonomy
A B
The advisor makes a decision on my behalf -4 TL + Everybody makes their own decisionThe advisor makes a decision on my behalf -3.5 TL + Everybody makes their own decisionThe advisor makes a decision on my behalf -3 TL + Everybody makes their own decisionThe advisor makes a decision on my behalf -2.5 TL + Everybody makes their own decisionThe advisor makes a decision on my behalf -2 TL + Everybody makes their own decisionThe advisor makes a decision on my behalf -1.5 TL+ Everybody makes their own decisionThe advisor makes a decision on my behalf -1 TL+ Everybody makes their own decisionThe advisor makes a decision on my behalf -0.5 + Everybody makes their own decisionThe advisor makes a decision on my behalf Everybody makes their own decisionThe advisor makes a decision on my behalf 0.5 + Everybody makes their own decisionThe advisor makes a decision on my behalf 1 TL+ Everybody makes their own decisionThe advisor makes a decision on my behalf 1.5 TL+ Everybody makes their own decisionThe advisor makes a decision on my behalf 2 TL + Everybody makes their own decisionThe advisor makes a decision on my behalf 2.5 TL + Everybody makes their own decisionThe advisor makes a decision on my behalf 3 TL + Everybody makes their own decisionThe advisor makes a decision on my behalf 3.5 TL + Everybody makes their own decisionThe advisor makes a decision on my behalf 4 TL + Everybody makes their own decision
to the right. Switching within the first 8 rows means the client is willing to pay money to make his owndecision, and the switch point determines the “demand for autonomy” (DFA). For example, if the clientchooses to switch to the right column in the 4th row, we conclude that (1) when there is no monetary cost,he would like to make his own decision, (2) his DFA is at least 2.5 TL (but less than 3 TL). If, on the otherhand, the subject switches in one of the last 8 rows, that means that the subject is (1) willing to delegatewhen there is no monetary gain/loss, (2) will make his own decision if he is compensated sufficiently.
Notice that the willingness to delegate can also be interpreted as an opportunity cost. For example, ifthe switch point is the 12th row, the subject’s minimum willingness to accept to make his own decision is1.5 TL. This means that the subject is willing to incur an opportunity cost of at least 1 TL (but less than1.5 TL) in order not to make his own decision. In general, the demand for autonomy is the negative of thewillingness to delegate, and they are two different interpretations of the same preference.
Any monetary consequences (losses or gains) associated with delegating or making own decisions areaccounted for in a separate budget. Specifically, the client has an extra 4 TL endowment that can cover thepotential costs of autonomy. This endowment cannot be used in investment decisions. Regardless of whathappens in the delegation stage, the investment decision is made with 10 TL, and any separate earningsor losses from delegation or autonomy are subtracted/added at the end. After subjects make investmentdecisions, the next period starts, with a new random pairing of subjects. Results of investments are notrevealed in between periods, in order to avoid potential wealth effects.
6
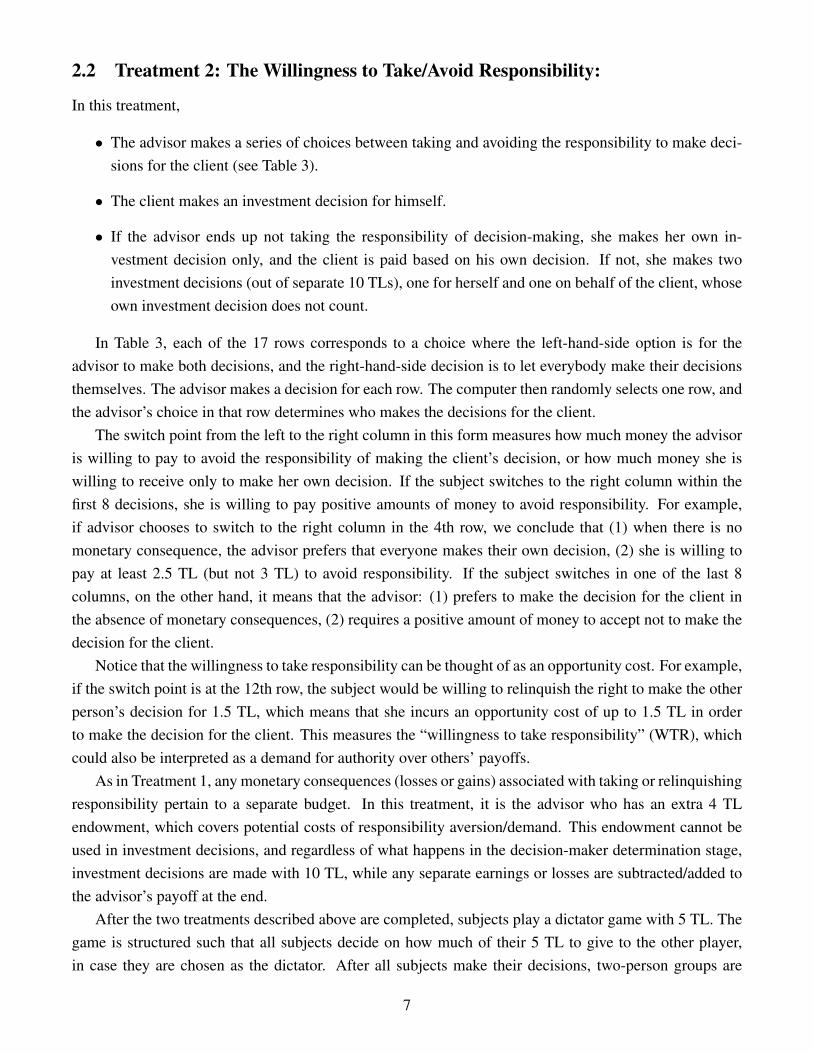
2.2 Treatment 2: The Willingness to Take/Avoid Responsibility:
In this treatment,
• The advisor makes a series of choices between taking and avoiding the responsibility to make deci-sions for the client (see Table 3).
• The client makes an investment decision for himself.
• If the advisor ends up not taking the responsibility of decision-making, she makes her own in-vestment decision only, and the client is paid based on his own decision. If not, she makes twoinvestment decisions (out of separate 10 TLs), one for herself and one on behalf of the client, whoseown investment decision does not count.
In Table 3, each of the 17 rows corresponds to a choice where the left-hand-side option is for theadvisor to make both decisions, and the right-hand-side decision is to let everybody make their decisionsthemselves. The advisor makes a decision for each row. The computer then randomly selects one row, andthe advisor’s choice in that row determines who makes the decisions for the client.
The switch point from the left to the right column in this form measures how much money the advisoris willing to pay to avoid the responsibility of making the client’s decision, or how much money she iswilling to receive only to make her own decision. If the subject switches to the right column within thefirst 8 decisions, she is willing to pay positive amounts of money to avoid responsibility. For example,if advisor chooses to switch to the right column in the 4th row, we conclude that (1) when there is nomonetary consequence, the advisor prefers that everyone makes their own decision, (2) she is willing topay at least 2.5 TL (but not 3 TL) to avoid responsibility. If the subject switches in one of the last 8columns, on the other hand, it means that the advisor: (1) prefers to make the decision for the client inthe absence of monetary consequences, (2) requires a positive amount of money to accept not to make thedecision for the client.
Notice that the willingness to take responsibility can be thought of as an opportunity cost. For example,if the switch point is at the 12th row, the subject would be willing to relinquish the right to make the otherperson’s decision for 1.5 TL, which means that she incurs an opportunity cost of up to 1.5 TL in orderto make the decision for the client. This measures the “willingness to take responsibility” (WTR), whichcould also be interpreted as a demand for authority over others’ payoffs.
As in Treatment 1, any monetary consequences (losses or gains) associated with taking or relinquishingresponsibility pertain to a separate budget. In this treatment, it is the advisor who has an extra 4 TLendowment, which covers potential costs of responsibility aversion/demand. This endowment cannot beused in investment decisions, and regardless of what happens in the decision-maker determination stage,investment decisions are made with 10 TL, while any separate earnings or losses are subtracted/added tothe advisor’s payoff at the end.
After the two treatments described above are completed, subjects play a dictator game with 5 TL. Thegame is structured such that all subjects decide on how much of their 5 TL to give to the other player,in case they are chosen as the dictator. After all subjects make their decisions, two-person groups are
7
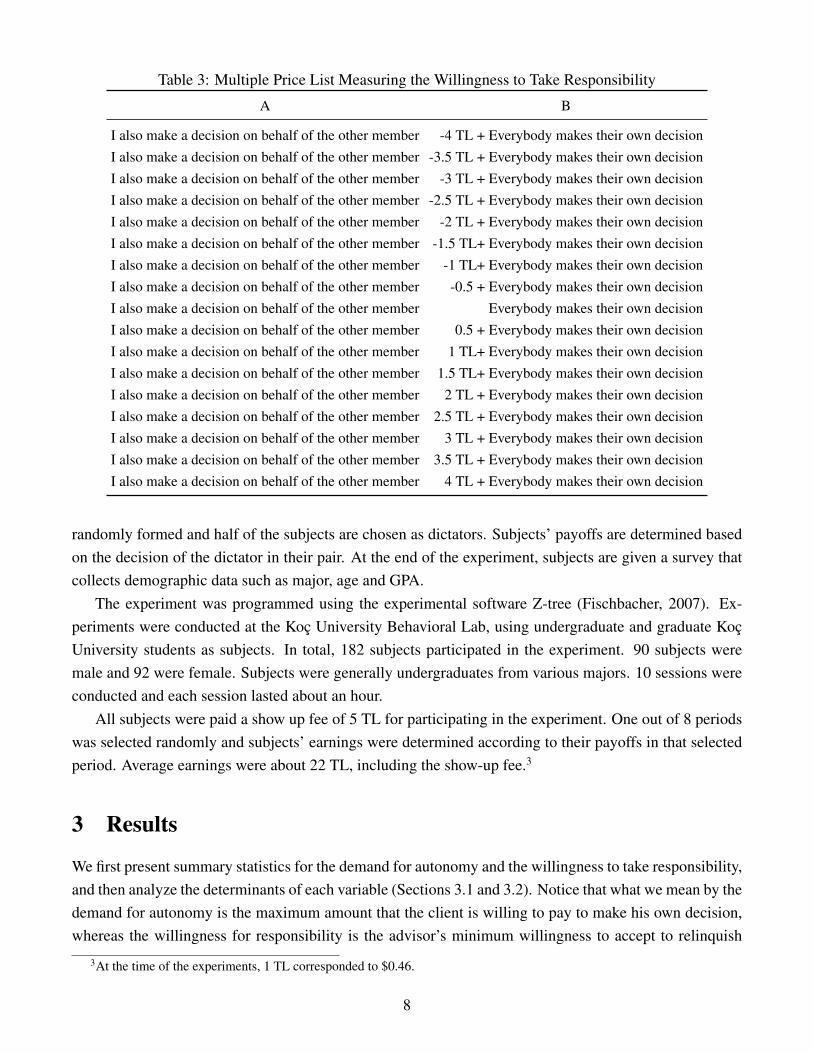
Table 3: Multiple Price List Measuring the Willingness to Take Responsibility
A B
I also make a decision on behalf of the other member -4 TL + Everybody makes their own decisionI also make a decision on behalf of the other member -3.5 TL + Everybody makes their own decisionI also make a decision on behalf of the other member -3 TL + Everybody makes their own decisionI also make a decision on behalf of the other member -2.5 TL + Everybody makes their own decisionI also make a decision on behalf of the other member -2 TL + Everybody makes their own decisionI also make a decision on behalf of the other member -1.5 TL+ Everybody makes their own decisionI also make a decision on behalf of the other member -1 TL+ Everybody makes their own decisionI also make a decision on behalf of the other member -0.5 + Everybody makes their own decisionI also make a decision on behalf of the other member Everybody makes their own decisionI also make a decision on behalf of the other member 0.5 + Everybody makes their own decisionI also make a decision on behalf of the other member 1 TL+ Everybody makes their own decisionI also make a decision on behalf of the other member 1.5 TL+ Everybody makes their own decisionI also make a decision on behalf of the other member 2 TL + Everybody makes their own decisionI also make a decision on behalf of the other member 2.5 TL + Everybody makes their own decisionI also make a decision on behalf of the other member 3 TL + Everybody makes their own decisionI also make a decision on behalf of the other member 3.5 TL + Everybody makes their own decisionI also make a decision on behalf of the other member 4 TL + Everybody makes their own decision
randomly formed and half of the subjects are chosen as dictators. Subjects’ payoffs are determined basedon the decision of the dictator in their pair. At the end of the experiment, subjects are given a survey thatcollects demographic data such as major, age and GPA.
The experiment was programmed using the experimental software Z-tree (Fischbacher, 2007). Ex-periments were conducted at the Koc University Behavioral Lab, using undergraduate and graduate KocUniversity students as subjects. In total, 182 subjects participated in the experiment. 90 subjects weremale and 92 were female. Subjects were generally undergraduates from various majors. 10 sessions wereconducted and each session lasted about an hour.
All subjects were paid a show up fee of 5 TL for participating in the experiment. One out of 8 periodswas selected randomly and subjects’ earnings were determined according to their payoffs in that selectedperiod. Average earnings were about 22 TL, including the show-up fee.3
3 Results
We first present summary statistics for the demand for autonomy and the willingness to take responsibility,and then analyze the determinants of each variable (Sections 3.1 and 3.2). Notice that what we mean by thedemand for autonomy is the maximum amount that the client is willing to pay to make his own decision,whereas the willingness for responsibility is the advisor’s minimum willingness to accept to relinquish
3At the time of the experiments, 1 TL corresponded to $0.46.
8
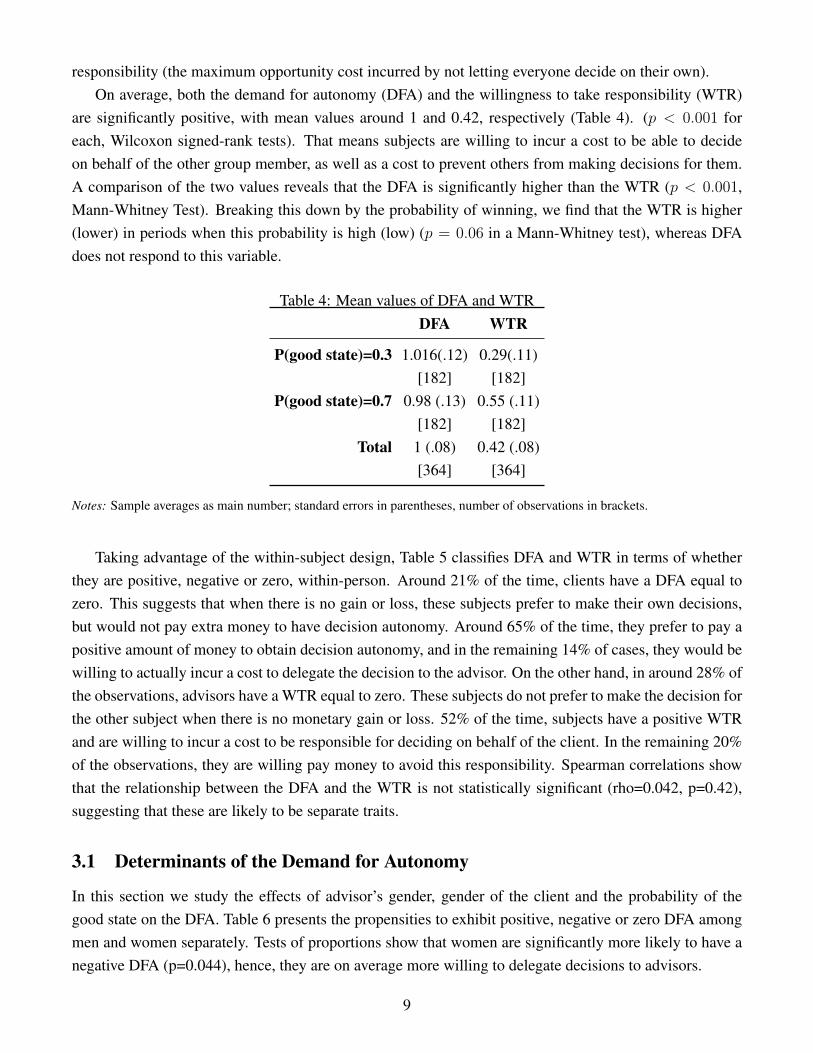
responsibility (the maximum opportunity cost incurred by not letting everyone decide on their own).On average, both the demand for autonomy (DFA) and the willingness to take responsibility (WTR)
are significantly positive, with mean values around 1 and 0.42, respectively (Table 4). (p < 0.001 foreach, Wilcoxon signed-rank tests). That means subjects are willing to incur a cost to be able to decideon behalf of the other group member, as well as a cost to prevent others from making decisions for them.A comparison of the two values reveals that the DFA is significantly higher than the WTR (p < 0.001,Mann-Whitney Test). Breaking this down by the probability of winning, we find that the WTR is higher(lower) in periods when this probability is high (low) (p = 0.06 in a Mann-Whitney test), whereas DFAdoes not respond to this variable.
Table 4: Mean values of DFA and WTRDFA WTR
P(good state)=0.3 1.016(.12) 0.29(.11)[182] [182]
P(good state)=0.7 0.98 (.13) 0.55 (.11)[182] [182]
Total 1 (.08) 0.42 (.08)[364] [364]
Notes: Sample averages as main number; standard errors in parentheses, number of observations in brackets.
Taking advantage of the within-subject design, Table 5 classifies DFA and WTR in terms of whetherthey are positive, negative or zero, within-person. Around 21% of the time, clients have a DFA equal tozero. This suggests that when there is no gain or loss, these subjects prefer to make their own decisions,but would not pay extra money to have decision autonomy. Around 65% of the time, they prefer to pay apositive amount of money to obtain decision autonomy, and in the remaining 14% of cases, they would bewilling to actually incur a cost to delegate the decision to the advisor. On the other hand, in around 28% ofthe observations, advisors have a WTR equal to zero. These subjects do not prefer to make the decision forthe other subject when there is no monetary gain or loss. 52% of the time, subjects have a positive WTRand are willing to incur a cost to be responsible for deciding on behalf of the client. In the remaining 20%of the observations, they are willing pay money to avoid this responsibility. Spearman correlations showthat the relationship between the DFA and the WTR is not statistically significant (rho=0.042, p=0.42),suggesting that these are likely to be separate traits.
3.1 Determinants of the Demand for Autonomy
In this section we study the effects of advisor’s gender, gender of the client and the probability of thegood state on the DFA. Table 6 presents the propensities to exhibit positive, negative or zero DFA amongmen and women separately. Tests of proportions show that women are significantly more likely to have anegative DFA (p=0.044), hence, they are on average more willing to delegate decisions to advisors.
9
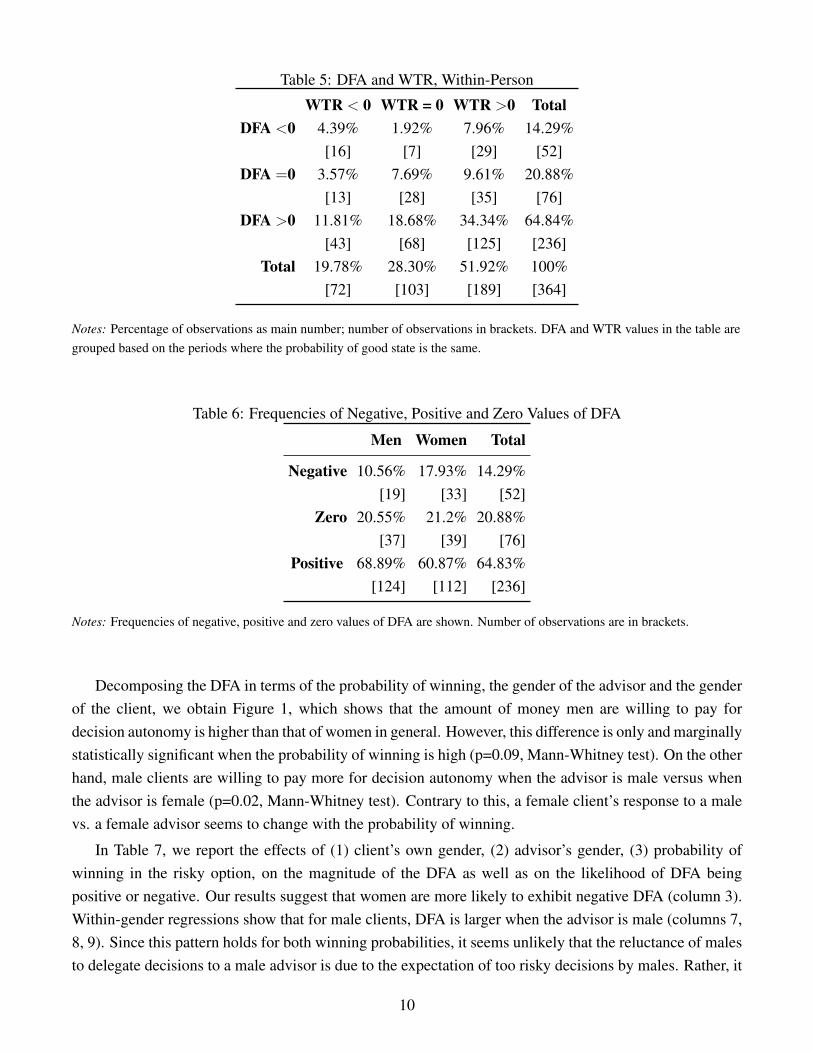
Table 5: DFA and WTR, Within-Person
WTR < 0 WTR = 0 WTR >0 TotalDFA <0 4.39% 1.92% 7.96% 14.29%
[16] [7] [29] [52]DFA =0 3.57% 7.69% 9.61% 20.88%
[13] [28] [35] [76]DFA >0 11.81% 18.68% 34.34% 64.84%
[43] [68] [125] [236]Total 19.78% 28.30% 51.92% 100%
[72] [103] [189] [364]
Notes: Percentage of observations as main number; number of observations in brackets. DFA and WTR values in the table aregrouped based on the periods where the probability of good state is the same.
Table 6: Frequencies of Negative, Positive and Zero Values of DFA
Men Women Total
Negative 10.56% 17.93% 14.29%[19] [33] [52]
Zero 20.55% 21.2% 20.88%[37] [39] [76]
Positive 68.89% 60.87% 64.83%[124] [112] [236]
Notes: Frequencies of negative, positive and zero values of DFA are shown. Number of observations are in brackets.
Decomposing the DFA in terms of the probability of winning, the gender of the advisor and the genderof the client, we obtain Figure 1, which shows that the amount of money men are willing to pay fordecision autonomy is higher than that of women in general. However, this difference is only and marginallystatistically significant when the probability of winning is high (p=0.09, Mann-Whitney test). On the otherhand, male clients are willing to pay more for decision autonomy when the advisor is male versus whenthe advisor is female (p=0.02, Mann-Whitney test). Contrary to this, a female client’s response to a malevs. a female advisor seems to change with the probability of winning.
In Table 7, we report the effects of (1) client’s own gender, (2) advisor’s gender, (3) probability ofwinning in the risky option, on the magnitude of the DFA as well as on the likelihood of DFA beingpositive or negative. Our results suggest that women are more likely to exhibit negative DFA (column 3).Within-gender regressions show that for male clients, DFA is larger when the advisor is male (columns 7,8, 9). Since this pattern holds for both winning probabilities, it seems unlikely that the reluctance of malesto delegate decisions to a male advisor is due to the expectation of too risky decisions by males. Rather, it
10
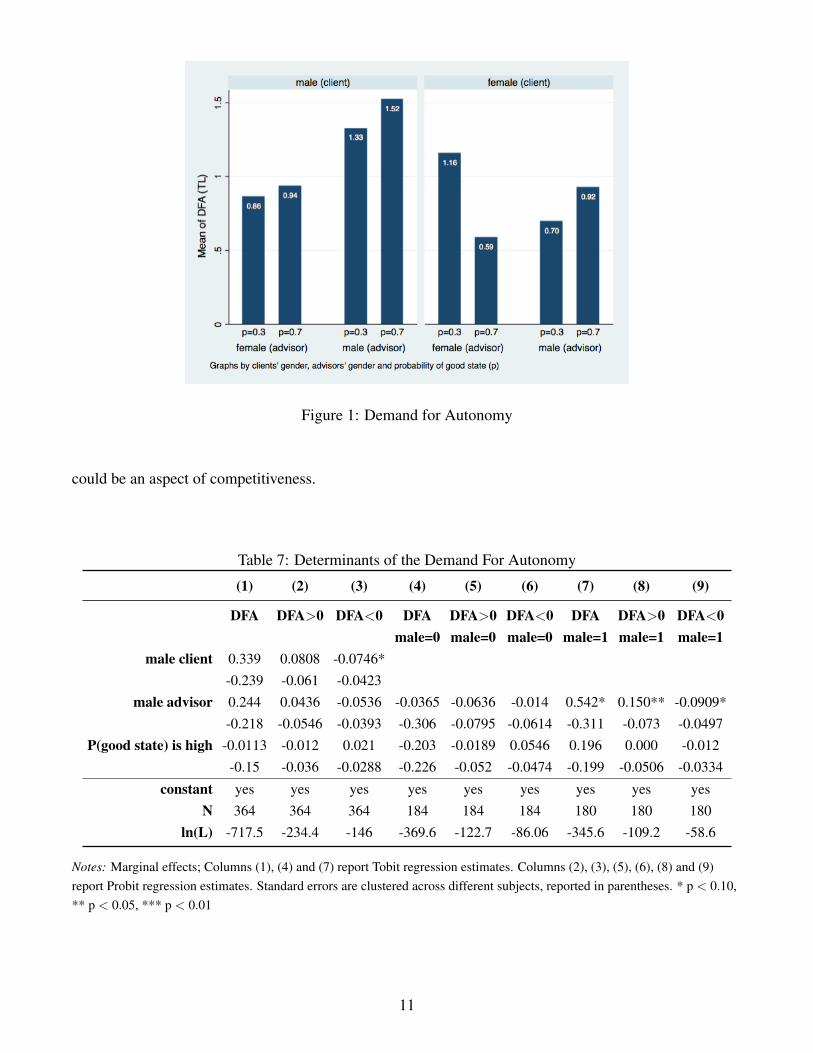
Figure 1: Demand for Autonomy
could be an aspect of competitiveness.
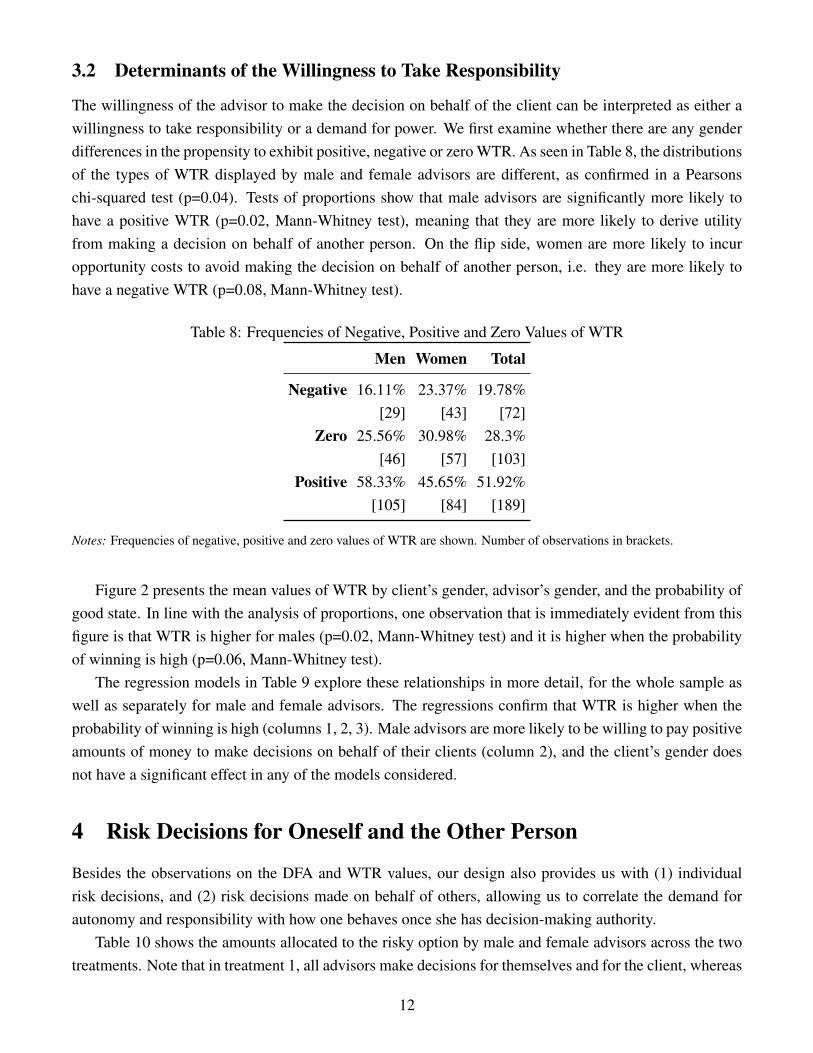
Table 7: Determinants of the Demand For Autonomy
(1) (2) (3) (4) (5) (6) (7) (8) (9)
DFA DFA>0 DFA<0 DFA DFA>0 DFA<0 DFA DFA>0 DFA<0male=0 male=0 male=0 male=1 male=1 male=1
male client 0.339 0.0808 -0.0746*-0.239 -0.061 -0.0423
male advisor 0.244 0.0436 -0.0536 -0.0365 -0.0636 -0.014 0.542* 0.150** -0.0909*-0.218 -0.0546 -0.0393 -0.306 -0.0795 -0.0614 -0.311 -0.073 -0.0497
P(good state) is high -0.0113 -0.012 0.021 -0.203 -0.0189 0.0546 0.196 0.000 -0.012-0.15 -0.036 -0.0288 -0.226 -0.052 -0.0474 -0.199 -0.0506 -0.0334
constant yes yes yes yes yes yes yes yes yesN 364 364 364 184 184 184 180 180 180
ln(L) -717.5 -234.4 -146 -369.6 -122.7 -86.06 -345.6 -109.2 -58.6
Notes: Marginal effects; Columns (1), (4) and (7) report Tobit regression estimates. Columns (2), (3), (5), (6), (8) and (9)report Probit regression estimates. Standard errors are clustered across different subjects, reported in parentheses. * p < 0.10,** p < 0.05, *** p < 0.01
11
3.2 Determinants of the Willingness to Take Responsibility
The willingness of the advisor to make the decision on behalf of the client can be interpreted as either awillingness to take responsibility or a demand for power. We first examine whether there are any genderdifferences in the propensity to exhibit positive, negative or zero WTR. As seen in Table 8, the distributionsof the types of WTR displayed by male and female advisors are different, as confirmed in a Pearsonschi-squared test (p=0.04). Tests of proportions show that male advisors are significantly more likely tohave a positive WTR (p=0.02, Mann-Whitney test), meaning that they are more likely to derive utilityfrom making a decision on behalf of another person. On the flip side, women are more likely to incuropportunity costs to avoid making the decision on behalf of another person, i.e. they are more likely tohave a negative WTR (p=0.08, Mann-Whitney test).
Table 8: Frequencies of Negative, Positive and Zero Values of WTR
Men Women Total
Negative 16.11% 23.37% 19.78%[29] [43] [72]
Zero 25.56% 30.98% 28.3%[46] [57] [103]
Positive 58.33% 45.65% 51.92%[105] [84] [189]
Notes: Frequencies of negative, positive and zero values of WTR are shown. Number of observations in brackets.
Figure 2 presents the mean values of WTR by client’s gender, advisor’s gender, and the probability ofgood state. In line with the analysis of proportions, one observation that is immediately evident from thisfigure is that WTR is higher for males (p=0.02, Mann-Whitney test) and it is higher when the probabilityof winning is high (p=0.06, Mann-Whitney test).
The regression models in Table 9 explore these relationships in more detail, for the whole sample aswell as separately for male and female advisors. The regressions confirm that WTR is higher when theprobability of winning is high (columns 1, 2, 3). Male advisors are more likely to be willing to pay positiveamounts of money to make decisions on behalf of their clients (column 2), and the client’s gender doesnot have a significant effect in any of the models considered.
4 Risk Decisions for Oneself and the Other Person
Besides the observations on the DFA and WTR values, our design also provides us with (1) individualrisk decisions, and (2) risk decisions made on behalf of others, allowing us to correlate the demand forautonomy and responsibility with how one behaves once she has decision-making authority.
Table 10 shows the amounts allocated to the risky option by male and female advisors across the twotreatments. Note that in treatment 1, all advisors make decisions for themselves and for the client, whereas
12
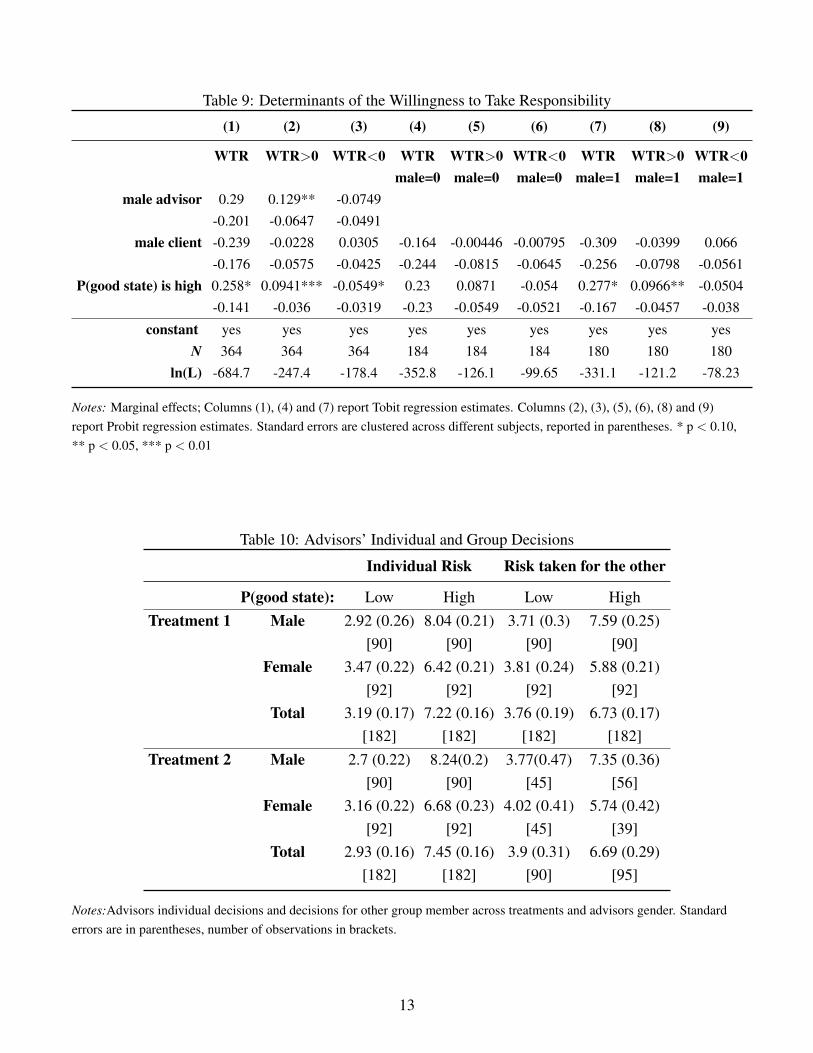
Table 9: Determinants of the Willingness to Take Responsibility
(1) (2) (3) (4) (5) (6) (7) (8) (9)
WTR WTR>0 WTR<0 WTR WTR>0 WTR<0 WTR WTR>0 WTR<0male=0 male=0 male=0 male=1 male=1 male=1
male advisor 0.29 0.129** -0.0749-0.201 -0.0647 -0.0491
male client -0.239 -0.0228 0.0305 -0.164 -0.00446 -0.00795 -0.309 -0.0399 0.066-0.176 -0.0575 -0.0425 -0.244 -0.0815 -0.0645 -0.256 -0.0798 -0.0561
P(good state) is high 0.258* 0.0941*** -0.0549* 0.23 0.0871 -0.054 0.277* 0.0966** -0.0504-0.141 -0.036 -0.0319 -0.23 -0.0549 -0.0521 -0.167 -0.0457 -0.038
constant yes yes yes yes yes yes yes yes yesN 364 364 364 184 184 184 180 180 180
ln(L) -684.7 -247.4 -178.4 -352.8 -126.1 -99.65 -331.1 -121.2 -78.23
Notes: Marginal effects; Columns (1), (4) and (7) report Tobit regression estimates. Columns (2), (3), (5), (6), (8) and (9)report Probit regression estimates. Standard errors are clustered across different subjects, reported in parentheses. * p < 0.10,** p < 0.05, *** p < 0.01
Table 10: Advisors’ Individual and Group Decisions
Individual Risk Risk taken for the other
P(good state): Low High Low HighTreatment 1 Male 2.92 (0.26) 8.04 (0.21) 3.71 (0.3) 7.59 (0.25)
[90] [90] [90] [90]Female 3.47 (0.22) 6.42 (0.21) 3.81 (0.24) 5.88 (0.21)
[92] [92] [92] [92]Total 3.19 (0.17) 7.22 (0.16) 3.76 (0.19) 6.73 (0.17)
[182] [182] [182] [182]Treatment 2 Male 2.7 (0.22) 8.24(0.2) 3.77(0.47) 7.35 (0.36)
[90] [90] [45] [56]Female 3.16 (0.22) 6.68 (0.23) 4.02 (0.41) 5.74 (0.42)
[92] [92] [45] [39]Total 2.93 (0.16) 7.45 (0.16) 3.9 (0.31) 6.69 (0.29)
[182] [182] [90] [95]
Notes:Advisors individual decisions and decisions for other group member across treatments and advisors gender. Standarderrors are in parentheses, number of observations in brackets.
13
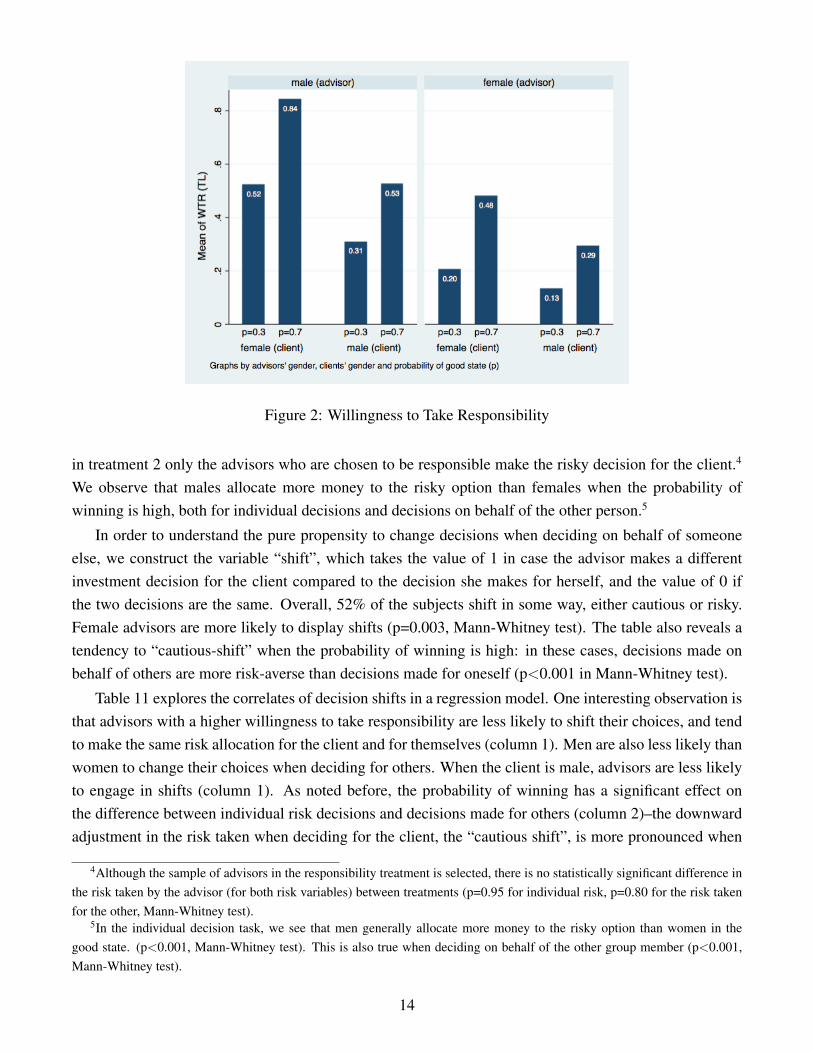
Figure 2: Willingness to Take Responsibility
in treatment 2 only the advisors who are chosen to be responsible make the risky decision for the client.4
We observe that males allocate more money to the risky option than females when the probability ofwinning is high, both for individual decisions and decisions on behalf of the other person.5
In order to understand the pure propensity to change decisions when deciding on behalf of someoneelse, we construct the variable “shift”, which takes the value of 1 in case the advisor makes a differentinvestment decision for the client compared to the decision she makes for herself, and the value of 0 ifthe two decisions are the same. Overall, 52% of the subjects shift in some way, either cautious or risky.Female advisors are more likely to display shifts (p=0.003, Mann-Whitney test). The table also reveals atendency to “cautious-shift” when the probability of winning is high: in these cases, decisions made onbehalf of others are more risk-averse than decisions made for oneself (p<0.001 in Mann-Whitney test).
Table 11 explores the correlates of decision shifts in a regression model. One interesting observation isthat advisors with a higher willingness to take responsibility are less likely to shift their choices, and tendto make the same risk allocation for the client and for themselves (column 1). Men are also less likely thanwomen to change their choices when deciding for others. When the client is male, advisors are less likelyto engage in shifts (column 1). As noted before, the probability of winning has a significant effect onthe difference between individual risk decisions and decisions made for others (column 2)–the downwardadjustment in the risk taken when deciding for the client, the “cautious shift”, is more pronounced when
4Although the sample of advisors in the responsibility treatment is selected, there is no statistically significant difference inthe risk taken by the advisor (for both risk variables) between treatments (p=0.95 for individual risk, p=0.80 for the risk takenfor the other, Mann-Whitney test).
5In the individual decision task, we see that men generally allocate more money to the risky option than women in thegood state. (p<0.001, Mann-Whitney test). This is also true when deciding on behalf of the other group member (p<0.001,Mann-Whitney test).
14
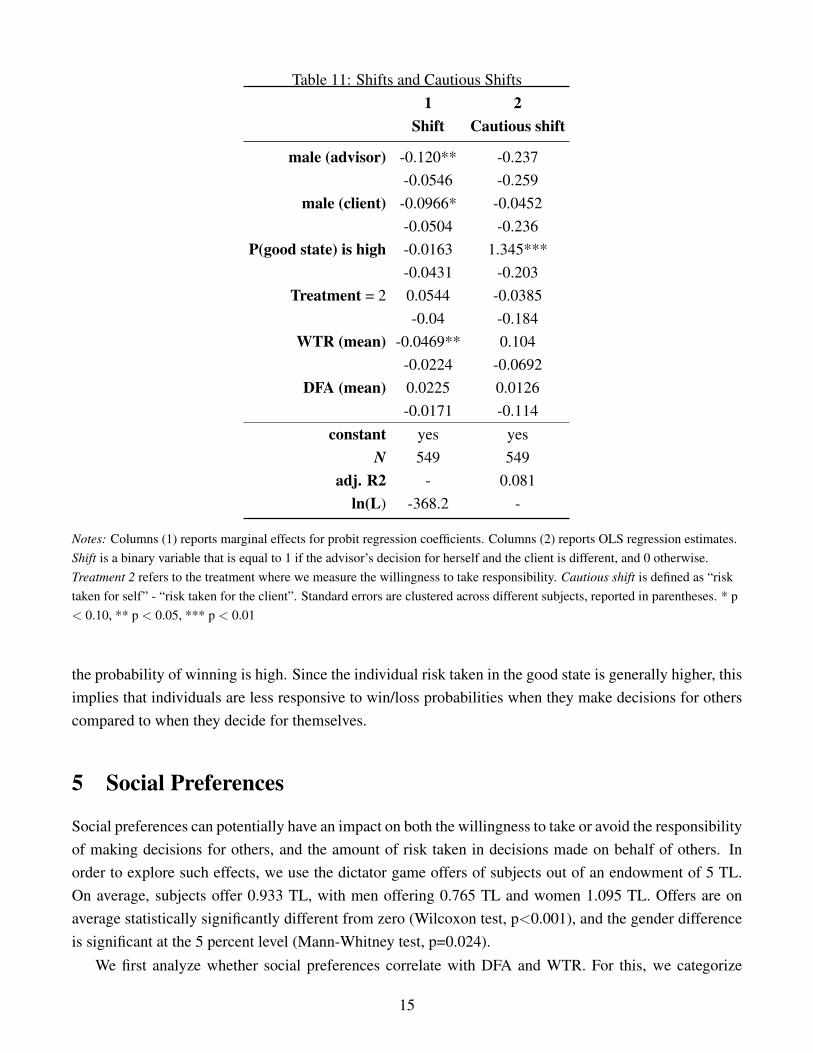
Table 11: Shifts and Cautious Shifts1 2
Shift Cautious shift
male (advisor) -0.120** -0.237-0.0546 -0.259
male (client) -0.0966* -0.0452-0.0504 -0.236
P(good state) is high -0.0163 1.345***-0.0431 -0.203
Treatment = 2 0.0544 -0.0385-0.04 -0.184
WTR (mean) -0.0469** 0.104-0.0224 -0.0692
DFA (mean) 0.0225 0.0126-0.0171 -0.114
constant yes yesN 549 549
adj. R2 - 0.081ln(L) -368.2 -
Notes: Columns (1) reports marginal effects for probit regression coefficients. Columns (2) reports OLS regression estimates.Shift is a binary variable that is equal to 1 if the advisor’s decision for herself and the client is different, and 0 otherwise.Treatment 2 refers to the treatment where we measure the willingness to take responsibility. Cautious shift is defined as “risktaken for self” - “risk taken for the client”. Standard errors are clustered across different subjects, reported in parentheses. * p< 0.10, ** p < 0.05, *** p < 0.01
the probability of winning is high. Since the individual risk taken in the good state is generally higher, thisimplies that individuals are less responsive to win/loss probabilities when they make decisions for otherscompared to when they decide for themselves.
5 Social Preferences
Social preferences can potentially have an impact on both the willingness to take or avoid the responsibilityof making decisions for others, and the amount of risk taken in decisions made on behalf of others. Inorder to explore such effects, we use the dictator game offers of subjects out of an endowment of 5 TL.On average, subjects offer 0.933 TL, with men offering 0.765 TL and women 1.095 TL. Offers are onaverage statistically significantly different from zero (Wilcoxon test, p<0.001), and the gender differenceis significant at the 5 percent level (Mann-Whitney test, p=0.024).
We first analyze whether social preferences correlate with DFA and WTR. For this, we categorize
15
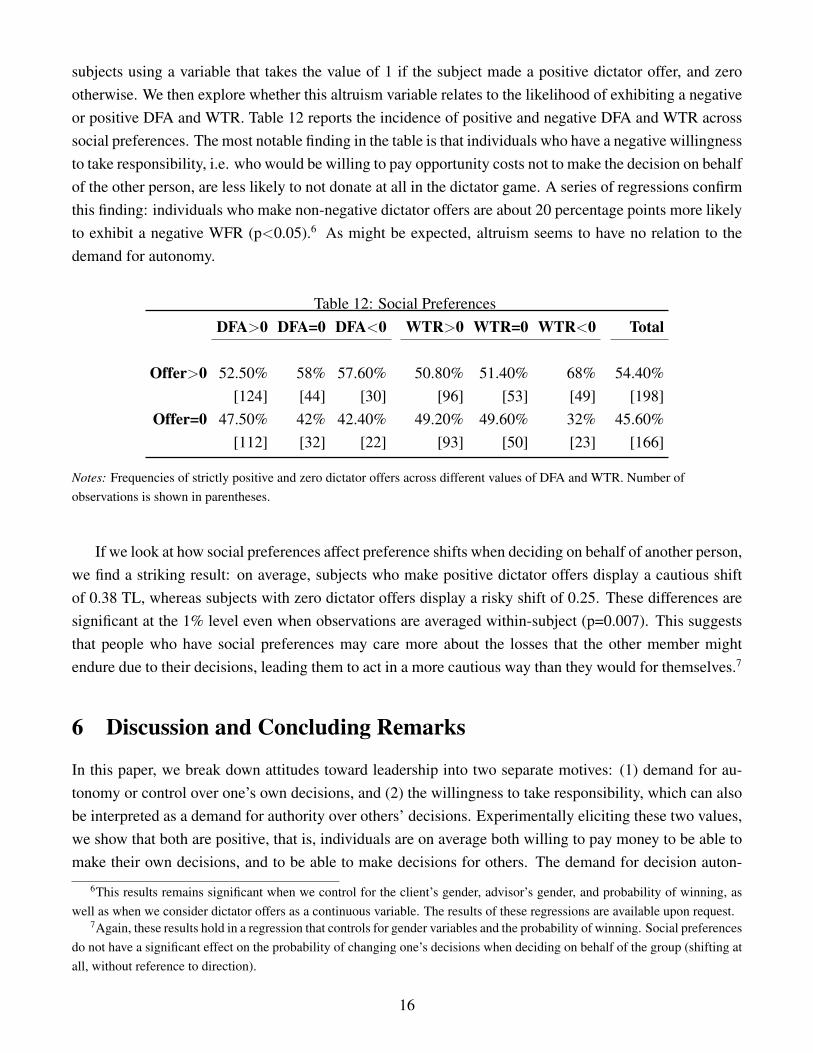
subjects using a variable that takes the value of 1 if the subject made a positive dictator offer, and zerootherwise. We then explore whether this altruism variable relates to the likelihood of exhibiting a negativeor positive DFA and WTR. Table 12 reports the incidence of positive and negative DFA and WTR acrosssocial preferences. The most notable finding in the table is that individuals who have a negative willingnessto take responsibility, i.e. who would be willing to pay opportunity costs not to make the decision on behalfof the other person, are less likely to not donate at all in the dictator game. A series of regressions confirmthis finding: individuals who make non-negative dictator offers are about 20 percentage points more likelyto exhibit a negative WFR (p<0.05).6 As might be expected, altruism seems to have no relation to thedemand for autonomy.
Table 12: Social PreferencesDFA>0 DFA=0 DFA<0 WTR>0 WTR=0 WTR<0 Total
Offer>0 52.50% 58% 57.60% 50.80% 51.40% 68% 54.40%[124] [44] [30] [96] [53] [49] [198]
Offer=0 47.50% 42% 42.40% 49.20% 49.60% 32% 45.60%[112] [32] [22] [93] [50] [23] [166]
Notes: Frequencies of strictly positive and zero dictator offers across different values of DFA and WTR. Number ofobservations is shown in parentheses.
If we look at how social preferences affect preference shifts when deciding on behalf of another person,we find a striking result: on average, subjects who make positive dictator offers display a cautious shiftof 0.38 TL, whereas subjects with zero dictator offers display a risky shift of 0.25. These differences aresignificant at the 1% level even when observations are averaged within-subject (p=0.007). This suggeststhat people who have social preferences may care more about the losses that the other member mightendure due to their decisions, leading them to act in a more cautious way than they would for themselves.7
6 Discussion and Concluding Remarks
In this paper, we break down attitudes toward leadership into two separate motives: (1) demand for au-tonomy or control over one’s own decisions, and (2) the willingness to take responsibility, which can alsobe interpreted as a demand for authority over others’ decisions. Experimentally eliciting these two values,we show that both are positive, that is, individuals are on average both willing to pay money to be able tomake their own decisions, and to be able to make decisions for others. The demand for decision auton-
6This results remains significant when we control for the client’s gender, advisor’s gender, and probability of winning, aswell as when we consider dictator offers as a continuous variable. The results of these regressions are available upon request.
7Again, these results hold in a regression that controls for gender variables and the probability of winning. Social preferencesdo not have a significant effect on the probability of changing one’s decisions when deciding on behalf of the group (shifting atall, without reference to direction).
16
omy, however, is stronger than the demand for decision authority. The elicited values for autonomy andauthority have low correlation within-person, indicating that these are likely to be two separate traits thatpotentially guide leadership decisions and the dynamics of group decision-making.
We then explore the relationship of these two motives with individual characteristics such as gender andother-regarding preferences, as well as the characteristics of the decision context such as the probabilityof loss in the risky option. The results point to gender differences in both the demand for autonomy andthe willingness to take responsibility: women are more likely than men to pay money to avoid makingrisky decisions for another person, and they have a lower demand for autonomy in their own decisions.Differences in these two attitudes can explain why males are more likely to emerge as leaders in groupcontexts. When the probability of loss is higher, individuals have a lower willingness to make decisionson behalf of others. This resonates with our finding that altruistic individuals are more likely to displayan aversion to taking responsibility for others’ outcomes, since altruistic individuals may be especiallysensitive to the possibility of causing a negative outcome for others.
The data reveal interesting links between social preferences and group decisions also. Comparing theamount of risk taken individually versus on behalf of others, we see that cautious shifts are prevalentand are strongly tied to social preferences: altruistic individuals tend to reduce the amount of risk theytake when deciding on behalf of others. This is again consistent with them taking care not to cause aloss for others. In addition, women, and individuals with a lower willingness to demand power are morelikely to change their decisions when deciding for others. These results point to interesting links betweenthe willingness to make decisions for others, altruism, and a propensity to take others’ preferences intoaccount when deciding for them.
Taken together, the results contribute to a better understanding of issues of leadership, influence, dele-gation and authority in group decision-making. In particular, the results can inform organizations on howto form groups or allocate decision-making responsibility, in order to achieve a certain type of decisionoutcome. For example, having mixed-gender groups or teams might lower the potential for conflict sincemen seem to want more autonomy when in a group with other males, and women’s demand for autonomydoes not depend on others’ gender. The results on altruism suggest that when allocating decision-makingrights in a company or a team, cautious leaders might be detected based on previous indicators of other-regarding preferences.
Given that achieving gender parity in leadership is usually a policy goal, giving women experiencein decision-making roles by assigning them tasks involving advising others or using incentives to rewardtaking responsibility might induce women to self-select more into leadership positions. Further researchcan explore the impact of such policies.
References
[1] Aghion, Philippe and Jean Tirole, “Formal and Real Authority in Organizations”, Journal of PoliticalEconomy, 105(1), 129.
17
[2] Bartling, B., Fehr, E., and Herz, H. (2014), “The intrinsic value of decision rights,” Econometrica,82(6), 2005-2039.
[3] Alan, S., Ertac, S., Kubilay, E., Loranth, G. (2016), “Understanding Gender Differences in Leader-ship Willingness: Evidence from Children and Adolescents”.
[4] Bartling, B., Fischbacher, U., (2012), “Shifting the Blame: On Delegation and Responsibility”, Re-view of Economic Studies, 79(1), 67–87.
[5] Cettolin, E., Riedl, A., (2010), “Delegation in decision making under uncertainty: Are preferencesincomplete?”, mimeo
[6] Chakravarty, S., Harrison, G.W., Haruvy, E.E., Rutstrm, E.E., (2005), “Are you risk averse over otherpeoples money?”, Southern Economic Journal, 77(4), 901–913.
[7] Charness, G., Rigotti, L., Rustichini, A., (2007), “Individual Behavior and Group Membership”,American Economic Review, 97(4), 1340–1352.
[8] Croson, R., Gneezy, U., (2009), “Gender differences in preferences”, Journal of Economic Litera-ture, 47, 448-474.
[9] Danz, D., Kbler, D., Mechtenberg, L., and Schmid, J. (2015), “On the failure of hindsight-biasedprincipals to delegate optimally”, Management Science, 61(8), 1938–1958.
[10] Daruvala, D., (2007), “Gender, risk and stereotypes”, Journal of Risk and Uncertainty, 35, 265283.
[11] Ertac, S., Gurdal, M.Y., (2012), “Deciding to Decide: Gender, Leadership and Risk-Taking inGroups”, Journal of Economic Behavior and Organization, 83, 24-30.
[12] Ertac, S., Gurdal, M.Y., (2014), “Preference Communication and Leadership in Group Decision-Making”.
[13] Ertac, S., Szentes, B., (2011), “The Effect of Information on Gender Differences in Competitiveness:Experimental Evidence”, mimeo.
[14] Fehr, E., Herz, H., and Wilkening, T. (2013), “The lure of authority: Motivation and incentive effectsof power”, American Economic Review, 103(4),
[15] Fershtman, C., Gneezy, U., (2001), “Strategic Delegation: An Experiment”, The RAND Journal ofEconomics, 32(2), 352–368.
[16] Fischbacher, U. (2007), “z-Tree: Zurich Toolbox for Ready-made Economic Experiments”, Experi-mental Economics, 10(2), 171-78.
[17] Gneezy, U., and Potters, J., (1997), “An Experiment on Risk Taking and Evaluation Periods”, Quar-terly Journal Of Economics, 112. 631-645.
18
[18] Gneezy, U., Leonard, K.L., List, J.A., (2009), “Gender differences in competition: evidence from amatrilineal and a patriarchal society”, Econometrica, 77, 1637-1664.
[19] Harrison, G. W., Lau, M. I., Rutstrm, E. E., and Tarazona-Gmez, M. (2013), “Preferences over socialrisk”, Oxford Economic Papers, 65(1), 25–46
[20] Neri, C., Rommeswinkel, H. (2014). Freedom, Power and Interference: An Experiment on DecisionRights. mimeo.
[21] Niederle, M., Vesterlund, L., (2007), “Do women shy away from competition? Do men compete toomuch?”, The Quarterly Journal of Economics, 122, 1067-1101.
[22] Oexl, R., and Grossman, Z. J. (2013). Shifting the blame to a powerless intermediary. ExperimentalEconomics, 16(3), 306-312.
[23] Owens, D., Grossman, Z., Fackler, R., (2014), “The Control Premium: A Preference for PayoffAutonomy” American Economic Journal: Microeconomics, 6(4), 138-161.
[24] Reuben, E., Rey-Biel, P., Sapienza, P., Zingales, L., (2012), “The emergence of male leadership incompetitive environments”, Journal of Economic Behavior and Organization, 83, 111-117.
[25] Trautmann, S.T., F. M. Vieider, (2011), Social Influences on Risk Attitudes: Applications in Eco-nomics, In: S. Roeser (ed.), Handbook of Risk Theory, Springer.
[26] Rohde, I.M.T., Rohde, K.M. (2011), “Risk attitudes in a social context”, Journal of Risk and Uncer-tainty, 43, 205-225.
[27] Eriksen, K.W., Kvaly, O., (2010), “Myopic investment management”, Review of Finance, 14(3),521-542
[28] Stone, E.R.,Yates A., Caruthers, A.S., (2002), “Risk taking in decision making for others versus theself”, Journal of Applied Social Psychology, 32, 1797-1824
[29] Nieboer, J. (2015), “Group member characteristics and risk taking by consensus”, Journal of Behav-ioral and Experimental Economics, 57, 81–88.
19
A Instructions - Main Treatments
[Original instructions are in Turkish and available upon request. It should be noted that Turkish does nothave gender pronouns, and therefore language does not suggest gender. In the below translation, ”she” isused for advisor and ”he” for non-advisor for convenience. ]
Welcome.
Thank you for participating in this study. The experiment will be about economic decision-making.You will earn 5 TL for your participation. Your earnings besides the show up fee will be based on yourdecisions and chance. Payments will be done at the end of the experiment, in cash.
Your participation in this study is completely voluntary. You are free to quit any time during theexperiment. Your decisions throughout the experiment will not be linked to your identity; it will berecorded with an anonymous subject number.
The experiment will consist of two main parts. Each part will consist of 4 periods. One of these 8periods will be selected randomly and your earnings from the experiment will be equal to the earningsfrom that period. Because of this random selection, you should pay equal attention to your decisions inevery period.
Investment Decision: There will be an investment decision in every period. This decision involvesallocating a 10 TL endowment between a risky and a riskless option. The amount invested in the riskyoption is either multiplied by 2.5 or lost. The loss probability will change from period to period. It will beeither 0.3 or 0.7. The amount that is kept in the riskless option does not change. In each period, you willbe able to see the loss probability of the risky option on your screen.
PART I
Roles
In each of the first 4 periods of the experiment, you will be randomly matched with another person.Your matched participant will change in each period.
In each pair, one person will be in the role of “advisor”. The default is that the advisor makes oneinvestment decision for herself and one investment decision for the other person she is matched with. Thatis, she allocates her own 10 TL between a risky and riskless option. In addition, she allocates the otherperson’s 10 TL between a risky and riskless option, determining the other person’s payoff too.
The person that is not chosen as the advisor will make a series of choices relating to whether he willleave his investment decision to the advisor, or make his decision himself. These choices will be associatedwith certain monetary costs or benefits.
[Show the table below] Specifically, the non-advisor will indicate whether he chooses the option onthe left or option on the right for each row.
20
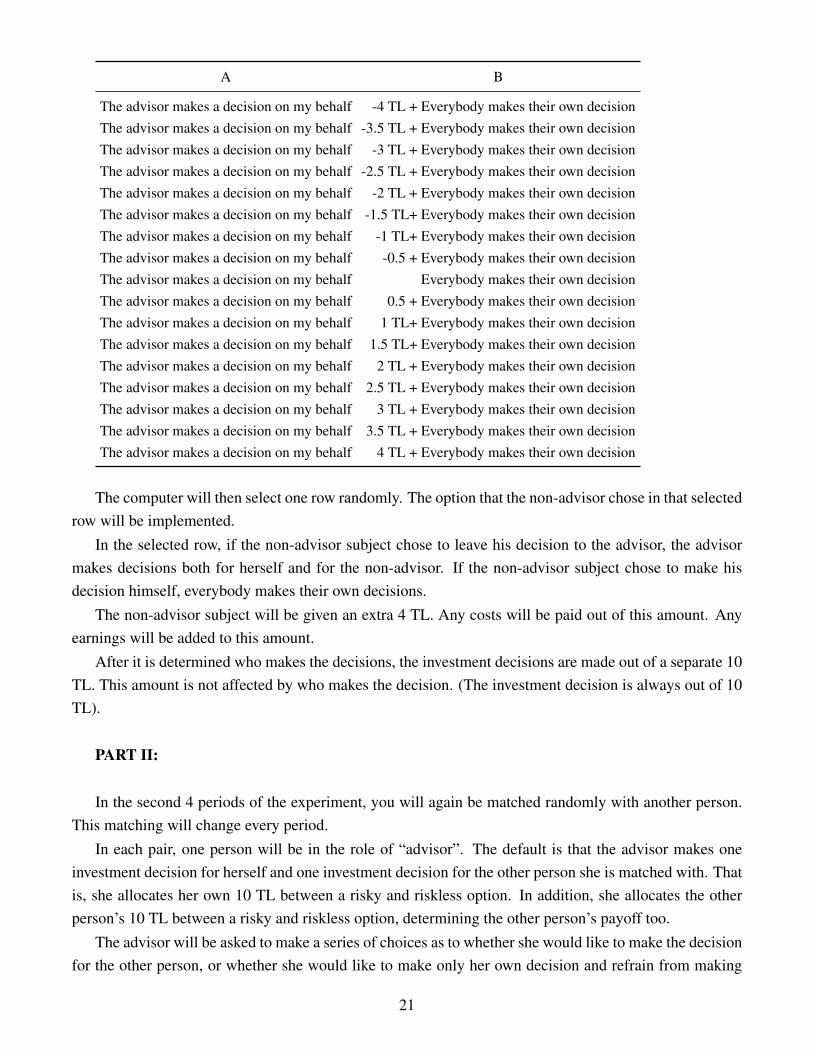
A B
The advisor makes a decision on my behalf -4 TL + Everybody makes their own decisionThe advisor makes a decision on my behalf -3.5 TL + Everybody makes their own decisionThe advisor makes a decision on my behalf -3 TL + Everybody makes their own decisionThe advisor makes a decision on my behalf -2.5 TL + Everybody makes their own decisionThe advisor makes a decision on my behalf -2 TL + Everybody makes their own decisionThe advisor makes a decision on my behalf -1.5 TL+ Everybody makes their own decisionThe advisor makes a decision on my behalf -1 TL+ Everybody makes their own decisionThe advisor makes a decision on my behalf -0.5 + Everybody makes their own decisionThe advisor makes a decision on my behalf Everybody makes their own decisionThe advisor makes a decision on my behalf 0.5 + Everybody makes their own decisionThe advisor makes a decision on my behalf 1 TL+ Everybody makes their own decisionThe advisor makes a decision on my behalf 1.5 TL+ Everybody makes their own decisionThe advisor makes a decision on my behalf 2 TL + Everybody makes their own decisionThe advisor makes a decision on my behalf 2.5 TL + Everybody makes their own decisionThe advisor makes a decision on my behalf 3 TL + Everybody makes their own decisionThe advisor makes a decision on my behalf 3.5 TL + Everybody makes their own decisionThe advisor makes a decision on my behalf 4 TL + Everybody makes their own decision
The computer will then select one row randomly. The option that the non-advisor chose in that selectedrow will be implemented.
In the selected row, if the non-advisor subject chose to leave his decision to the advisor, the advisormakes decisions both for herself and for the non-advisor. If the non-advisor subject chose to make hisdecision himself, everybody makes their own decisions.
The non-advisor subject will be given an extra 4 TL. Any costs will be paid out of this amount. Anyearnings will be added to this amount.
After it is determined who makes the decisions, the investment decisions are made out of a separate 10TL. This amount is not affected by who makes the decision. (The investment decision is always out of 10TL).
PART II:
In the second 4 periods of the experiment, you will again be matched randomly with another person.This matching will change every period.
In each pair, one person will be in the role of “advisor”. The default is that the advisor makes oneinvestment decision for herself and one investment decision for the other person she is matched with. Thatis, she allocates her own 10 TL between a risky and riskless option. In addition, she allocates the otherperson’s 10 TL between a risky and riskless option, determining the other person’s payoff too.
The advisor will be asked to make a series of choices as to whether she would like to make the decisionfor the other person, or whether she would like to make only her own decision and refrain from making
21
the other person’s decision.
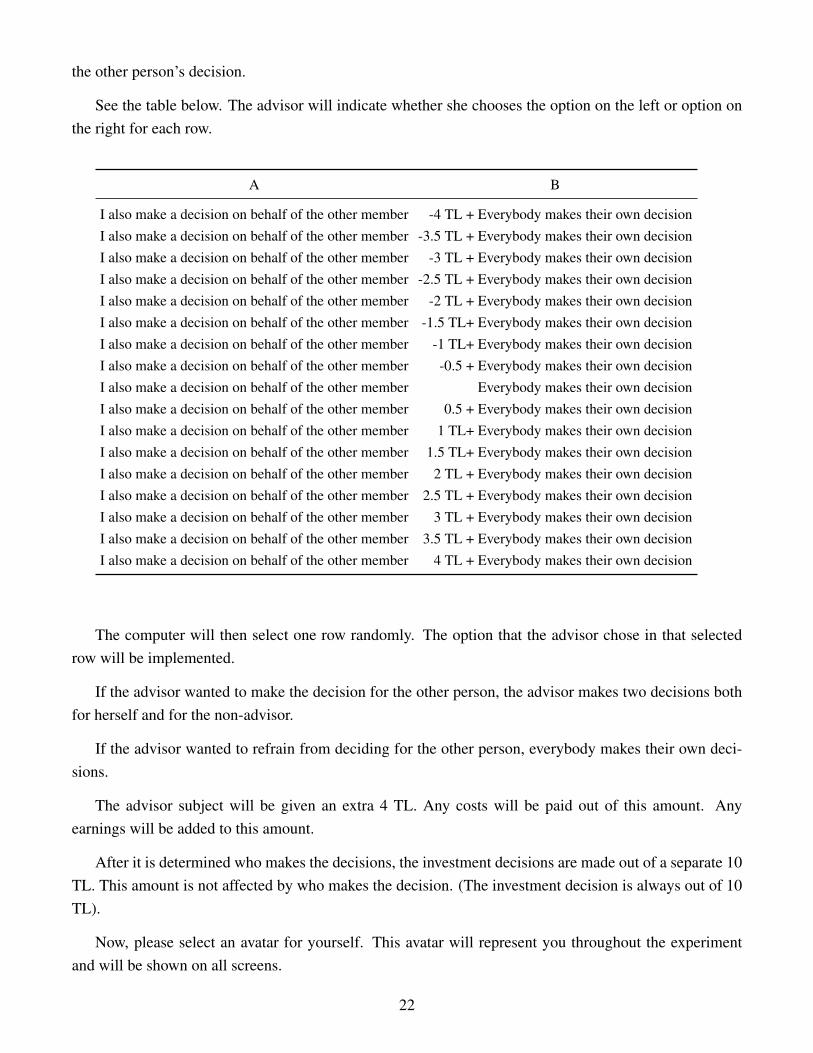
See the table below. The advisor will indicate whether she chooses the option on the left or option onthe right for each row.
A B
I also make a decision on behalf of the other member -4 TL + Everybody makes their own decisionI also make a decision on behalf of the other member -3.5 TL + Everybody makes their own decisionI also make a decision on behalf of the other member -3 TL + Everybody makes their own decisionI also make a decision on behalf of the other member -2.5 TL + Everybody makes their own decisionI also make a decision on behalf of the other member -2 TL + Everybody makes their own decisionI also make a decision on behalf of the other member -1.5 TL+ Everybody makes their own decisionI also make a decision on behalf of the other member -1 TL+ Everybody makes their own decisionI also make a decision on behalf of the other member -0.5 + Everybody makes their own decisionI also make a decision on behalf of the other member Everybody makes their own decisionI also make a decision on behalf of the other member 0.5 + Everybody makes their own decisionI also make a decision on behalf of the other member 1 TL+ Everybody makes their own decisionI also make a decision on behalf of the other member 1.5 TL+ Everybody makes their own decisionI also make a decision on behalf of the other member 2 TL + Everybody makes their own decisionI also make a decision on behalf of the other member 2.5 TL + Everybody makes their own decisionI also make a decision on behalf of the other member 3 TL + Everybody makes their own decisionI also make a decision on behalf of the other member 3.5 TL + Everybody makes their own decisionI also make a decision on behalf of the other member 4 TL + Everybody makes their own decision
The computer will then select one row randomly. The option that the advisor chose in that selectedrow will be implemented.
If the advisor wanted to make the decision for the other person, the advisor makes two decisions bothfor herself and for the non-advisor.
If the advisor wanted to refrain from deciding for the other person, everybody makes their own deci-sions.
The advisor subject will be given an extra 4 TL. Any costs will be paid out of this amount. Anyearnings will be added to this amount.
After it is determined who makes the decisions, the investment decisions are made out of a separate 10TL. This amount is not affected by who makes the decision. (The investment decision is always out of 10TL).
Now, please select an avatar for yourself. This avatar will represent you throughout the experimentand will be shown on all screens.
22
B Instructions - Dictator Game
Extra Game:
Now we will play an extra game. The computer will form 2 person groups among all participants. Foreach group, the computer will randomly select one of the group members and this person will have a 5 TLendowment, while the other person will have zero. Until the end of the game, you will not know who hasthe 5 TL in your group. Everyone will be asked the following question:“In case you are the one who has the 5 TL, how much of your 5 TL would you like to give to the otherperson in your group?” Please note that you can state any amount, including zero.After all the participants make their choices, the decision made by the group member who has the 5 TLwill determine the earnings from this part for both group members.
23
C Post-experiment Survey
1. How old are you?2. What is your gender?3. What year/class are you in?4. Which faculty are you in?5. What is your current GPA?6. Were the experiment and the rules understandable? (Please answer on a scale of 1 to 10: 1= notunderstandable at all, 10= absolutely understandable)7. Did you choose an avatar that does not match with your gender? If so, why?
D Sample Avatars
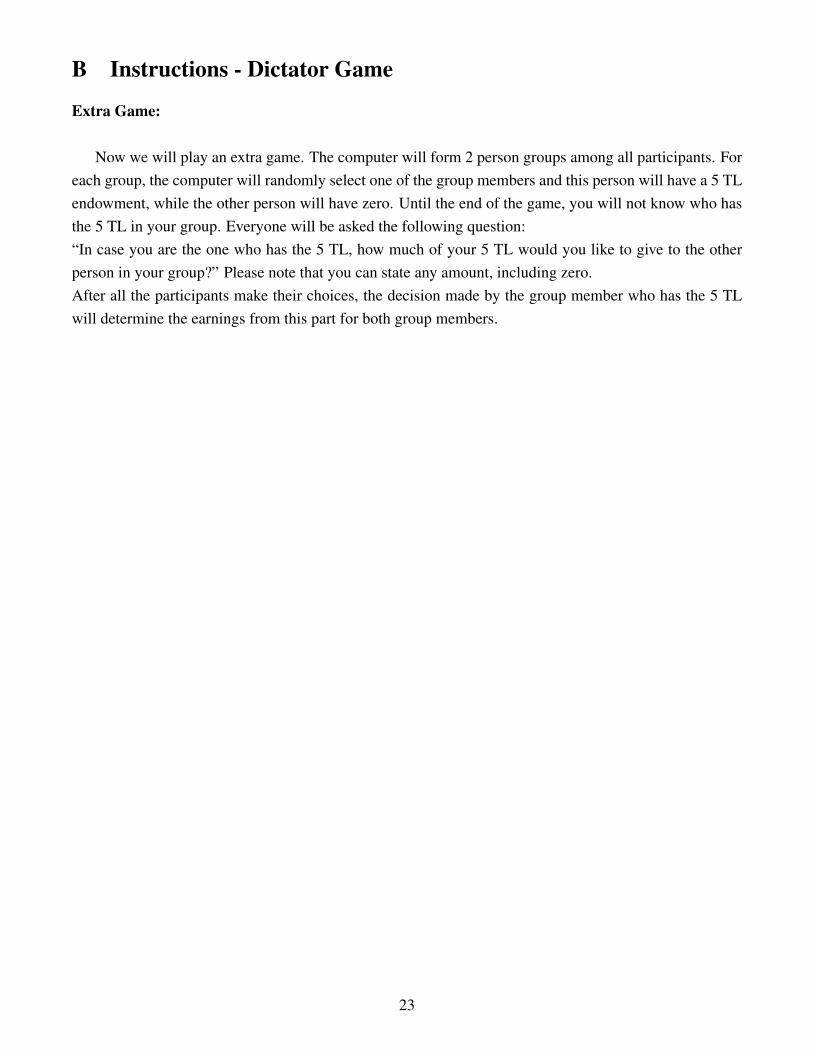
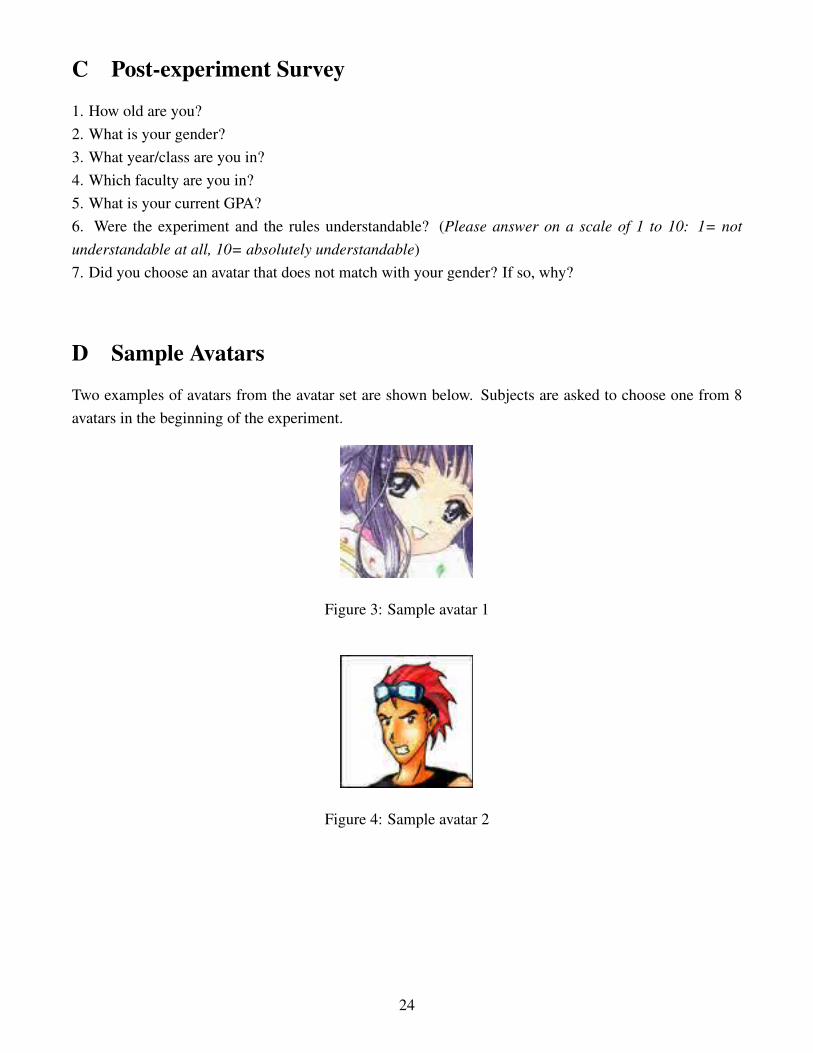
Two examples of avatars from the avatar set are shown below. Subjects are asked to choose one from 8avatars in the beginning of the experiment.
Figure 3: Sample avatar 1
Figure 4: Sample avatar 2
24