Demand Control Systems Deliver Efficiency in Commercial...
34
Welcome Conservation Applied Research & Development (CARD) Webinar February 6, 2018 Demand Control Systems Deliver Efficiency in Commercial Hot Water Use
Transcript of Demand Control Systems Deliver Efficiency in Commercial...

Welcome
Conservation Applied Research & Development (CARD) Webinar
February 6, 2018Demand Control Systems Deliver Efficiency in
Commercial Hot Water Use
Presenter
Presentation Notes
Welcome to this Conservation Applied Research and Development (CARD) Webinar.

Demand Control Systems Deliver Efficiency in Commercial Hot Water Use
Mary Sue LobensteinR&D Program Administrator
Mark GarofanoEnergy Engineer
Ben SchoenbauerSenior Research Engineer
Center for Energy and Environment (CEE)[email protected]
2
Presenter
Presentation Notes
I am Mary Sue Lobenstein, the R&D Program Administrator at the Minnesota Department of Commerce, Division of Energy Resources. With us today is Mark Garofano who is an Energy Engineer at the Division of Energy Resources where he performs engineering reviews of custom efficiency projects, and leads the Department’s efforts to maintain and update the technical reference manual (TRM) that utilities use to calculate the savings and cost-effectiveness of their conservation improvement programs. Mark is helping us out today by leading the Q&A section of the webinar. As the TRM lead he’ll also be able to answer any of your questions related to inclusion of the technology we’ll be talking about today in the TRM. Our topic today is: Demand Control Systems that Deliver Efficiency in Service Hot Water Systems of Commercial Buildings Our presenter is Ben Schoenbauer from the Center for Energy and Environment (CEE), where he is a Senior Research Engineer. At CEE Ben conducts research on new and innovative technologies and ideas dealing with residential and commercial energy efficiency. His work includes identifying new opportunities, conducting field research, identifying and pursuing funding opportunities and disseminating the results of research he’s conducted. Ben’s areas of focus include water heater performance, service water heating, residential HVAC systems, and beneficial electrification.

Minnesota Applied Research & Development Fund
• Purpose to help Minnesota utilities achieve 1.5% energy savings goal by:
• Identifying new technologies or strategies to maximize energy savings;
• Improving effectiveness of energy conservation programs;• Documenting CO2 reductions from energy conservation
programs.Minnesota Statutes §216B.241, Subd. 1e
• Utility may reach its energy savings goal• Directly through its Conservation Improvement Program (CIP)• Indirectly through energy codes, appliance standards, behavior,
and other market transformation programs
3State Capitol Image: Courtesy Minnesota Department of Administration
Presenter
Presentation Notes
This webinar is one in an ongoing series designed to summarize the results from research projects funded by Minnesota’s Applied Research and Development Fund, which was established in the Next Generation Energy Act of 2007. The purpose of the fund is to help Minnesota utilities achieve their 1.5% energy savings goal. $2.6 million of this fund is set aside annually for the CARD program which awards research grants in a competitive Request for Proposal process. Results from CARD projects provide utilities with informative and timely information to enhance energy efficiency program designs within their CIP portfolios. In turn CIP helps to conserve energy resources while reducing harmful emissions, minimizing the need for new utility infrastructure, and generating positive economic value for Minnesota’s citizens.

CARD RFP Spending by Sectorthru mid-FY2017
Multi-sector (21), 25.3%
Commercial (36), 37.6%
Residential 1 - 4 unit (15), 18.7%
Industrial (10), 8.6%
Multifamily 5+ unit (4), 6.6%
Agricultural (6), 3.1%
• 8 Funding Cycles• Nearly 380 proposals• 92 projects funded• Over $21 million in research 4
Presenter
Presentation Notes
Projects funded by CARD have quantified the savings, cost-effectiveness and field performance of advanced technologies; characterized market and technical potential of products and technologies in the State; investigated and piloted innovative Conservation Improvement Program (CIP) strategies; and performed research on other issues related to the fund’s purpose. As you can see by the pie chart, CARD projects to date have been in all building sectors. The subject of today’s webinar is the commercial sector and details Ben’s evaluation of a demand-based controls for central domestic hot water systems with recirculation loops. Now, I’ll turn it over to Ben and today’s presentation.

Demand Control Systems Deliver Efficiency inCommercial Hot Water Use
Project Team also included:
Merry Sweeney and Alejandro Baez Guada from the Gas Technology Institute
Alex Haynor from CEE
Gabe Alaya from the Enovative Group
Ben SchoenbauerSenior Research Engineer

Pg. 6
What is Demand Control Recirculation?
• Reduces pumping costs and thermal losses from recirculation loops through reduced pump runtime
• Controller measures real-time loop temperature and hot water usage
• Uses both temperature and demand data to reduce runtime without impacting hot water delivery
Presenter
Presentation Notes
Demand Control Recirculation is a control strategy designed to reduce energy waste in central DHW systems. Hot water distribution systems in non-residential buildings, including MF, office, school, hotels, etc are often designed to connect one central water heater with many end use fixtures spread throughout the building. In order to have hot water ready at the taps these systems often have long uninsulated plumping runs with constantly recirculated hot water. Demand control is a type of control that reduces this waste without impacting the hot water delivery of the system. These systems can reduce pumping energy and reduce the thermal heat lost by constant recirculation. The control sense hot water demand as well as temperature to optimize pumps runtime. The diagram here shows the 3 parts of the control system. 1 a flow sensor, 2 a temperature sensor, and 3 the controller itself with built in logic.

Pg. 7
Controller Operation
1. The flow sensor senses a hot water draw in the system2. The controller checks system return line temperature3. If return line is hot, then the pump stays off4. If return line temperature is below target then the
pumps turns on5. Auto-Prime feature ensure the system is reheated after
a set period
Presenter
Presentation Notes
How does demand recirculation actually work? With the controller in operation the recirculation pump is off by default. Then, first off, the flow sensor senses any hot water flow in the building. Next the controller checks the system recirculation return temperature If the recirc return temperature is hot the pump remaining off. If the return temperature is below the target temperature the controller turns on the recirc pump. The pump remains on until the return temperature recovers into an acceptable range Additionally, there controller has an auto prime feature that can be set up to circulate hot water at a fixed interval since the last hot water event. This feature keeps the loop temperature from dropping two low even if there is not demand present to trigger the controller. These controls have benefits compared to other control strategies. Some buildings have timer or temperature based controls. These controls can reduce waste and therefor if in use limit the savings of a demand controller. But demand controls have 2 major benefits over other controller types. Demand controls sense both hot water demand as well as loop temperature allowing maximum savings while ensuring opponent comfort. Aquastats do not deliver as much savings because they control only on temperature and therefor can over heat during long periods with no demand. Timer-based controls reduce temperatures for a set period of time. These controllers are much more likely to be by passed because they do not have an ability to correct for unexpected demand. IE if you take a shower in the middle of the cold period, the whole loop must be reheated before the shower will be hot.

Pg. 8
Building on Past Success
• Several studies on mutlifamily buildings around the county.
• Mostly in California and New York• California code encourages control of recirculation
• Multifamily buildings studies have found:• 90% + reductions in recirculation loop runtime
• Reduce pump runtime to less than 2 hours per day• On average 10% to 30% reduction in thermal energy use for
DHW• Average savings for mid-sized MF were 1450 therms and 750
kWhs per year• About $1300 per year savings
Presenter
Presentation Notes
The controller is designed for large central DHW systems with recirculation. Past projects have show good success in MF and this project looks to build on past success an verify similar performance in additional building types, including Commercial, Education, and hospitality. There have been several studies on the MF application of these controls. Most work has been in New York and California. Californian codes and programs strongly encourage some type of control on recirculation loops and these controllers are fairly common. Studies have found significant savings: The control reduces pump runtime by 90% resulting in run timeless less than 2 hours per day. Drastically reducing the pumping energy required by the systems. The majority of cost savings come from the reduction in thermal loses, that is the heat lost off the pipes during the circulation process. The studies found that these losses were typically between 10 and 30% of the total system hot water energy use. For mid-sized MF builds (50-100 units) the project found an average savings of 1450 therms per year and 750 kWhs, which would be about $1300 per year savings. This level of savings makes it worthwhile to look at other applications and therefore why we wanted to look at commercial and hospitality systems.

Pg. 9
Our Minnesota Field Study
• Site visits and survey details of 17 central DHW systems
• Preliminary monitoring at 10 of them
• Installed controllers at 6 sites• Collected data for ~12 months• Alternating mode operation
Building ID Type Loop Use Size
Hosp_01 Hotel Guest rooms 5 floors - 250 rooms
Hosp_02 Hotel Guest rooms 3 floors - 125 rooms
Hosp_03 Hotel Guest rooms 3 floors - 60 rooms
Ed_01 School Classrooms and bathroom All sinks
Ed_02 School Bathrooms and locker rooms 2 large shower rooms and sinks
Com_03 Office Offices and bathrooms 80,000 Sq Feet
Presenter
Presentation Notes
Our field study consisted of 2 phases. The first phase included the assessment and surveying of 17 different central DHW systems of assessment of the feasibility and savings potential of each system. Of these 17 systems, preliminary short term monitoring of 10 systems was completed. The second phase looked at 6 of the 10 phase 1 systems in more detail. At these sites a demand controller and detailed monitoring equipment were installed and the systems were monitored in baseline and controlled operation for about 12 months.

Pg. 10
Hospitality Buildings
• All surveyed and monitored systems were on 24/7• One aqua stat installed, but set temperature too high to
actually turn off pump
• Five stories and less had “simple” systems with <3/4 HP pumps
• Larger buildings more complex systems• Booster pumps• More loops
• Top priority occupant satisfaction
Presenter
Presentation Notes
Start by talking a bit about the characterization and survey info from phase 1 by building type. Starting with hospitality buildings or hotels. All the systems we looked at were running continuously 24/7. One system, had a temperature based control, but the set points had been modified so that the controller would never shut the system down. At that site, none of the building operators knew anything about the control systems, so it had likely been off for a while. System complexity also scaled with system size. Hotels with 5 stories or les had straight forward recirc loops with pumps around ¾ HP or less. Larger systems were much more complex, bigger pumps, booster pumps, multiple zones etc. We will get more into these details later on in the presentation. One additional detail, hotel operators top priority is guest satisfaction. Most people we interacted were very concerned with water temperatures, system down time, etc

Pg. 11
Schools
• Most systems had time-of-day controls• On average, systems ran for 18.75 hours per day
• One system was shut down completely during summer months
• Most uses are small and concentrated• Large variety of fixture uses
• Locker facilities• Bathrooms• Dining/Kitchen• Classrooms
Presenter
Presentation Notes
School buildings were the most likely to have operation controls. We only had a small sample size, but multiple systems ran on time of day controls and some were also on seasonal controls. Time of day controls were part of the building automation system and turned off recirculation over night periods when builds were empty. Additionally, one build that expected little use in the summer, turned the pump off for about 4 months per year. Of the systems that ran time of day controllers, on average they turned the recirculation pumps off for 5.25 hours per day. These systems had a larger variety of uses, but in general the loads were small and intermittent.

Pg. 12
Commercial Buildings
• Half of systems had time of day controls• On average systems ran for 16 hours per day when
controlled• Several buildings with time-of-day controllers were adjusted or
disabled due to early/late workers
• Large variety of systems• Buildings were older or had changing use• Multiple loops from same source were more common
Presenter
Presentation Notes
Again, a relatively small sample size, but we saw time of day controls in commercial/office builds as well. Recirculation pumps ran for 16 hours per day when controlled. We also heard anecdotal evidence of the control schemes being changed to accommodate a single worker, with a typical hours, severely limiting their impact. Again there was a large variety of systems with complexity scaling with size and age of building. Larger systems had more components and older systems had changed over time with changing needs and equipment replacement.

Pg. 13
Typical Controller Installation
Presenter
Presentation Notes
Take a couple minutes to walk through the typical installation. Again we see the three pieces mentioned earlier. 1) flow sensor, 2) temperature sensor, and 3 the controller itself. The flow sensor is installed on the cold water inlet to the system. This installation requires the cold water line be cut and the flow sensor installed in a tee fitting. the location on the cold inlet to the system allows the sensor to measure any hot water use from the system. The second piece is a temperature sensor. For the simplest installation, this sensor is secured to the surface of the recirculation loop return just upstream of the recirculation pump. This temperature is used to judge the minimum temperature in the loop. In the ideal installation the sensor would be installed just downstream of the last hot water fixture on the recirculation loop, but that location is often impractical. This sensor tells the controller when the loop temperature has dropped below the target range. Finally the controller itself is mounted to the water heater, or near by. The controller is designed to with a circulation pump, wither by direct wiring the pump to the controller and then to the power source, or through electrical plugs if the plug is wired for an outlet. Once the controller is physically installed it has two setting that can be changed by the controller. One setting controls the return temperature target, which by default sets the minimum return water temperature around 98 deg F. The other sets the dead-band which controls how long the pump remains on when a reheat is triggered.

Pg. 14
Field Study: Instrumentation
Presenter
Presentation Notes
In addition to the controller sensors (shown here in pink) the project team added a extra instrumentation for data analysis. These sensors included: 1. Water heater runtime and energy consumption (electric, gas, boiler, etc) 2. Water temperatures from the recirculation loop 3. Recirculation runtime 4. Hot water flow

Pg. 15
Current System Operation
• Constant circulation, higher water temperatures, and large capacity systems kept loop temperatures very consistent
• The average temperature drop in the loop was 15ºF in idle periods
• Temp drops reach 30ºF in some cases• In many cases these losses required higher set temperatures
• In about 1/3 of the measured systems return water temperatures were higher than 125ºF
• Loop losses expected to be 10% to 30% of total use
Presenter
Presentation Notes
Before we move into the controller performance and savings potential, I wanted to provide a bit more info on how the recirc systems were typically running. Most systems were on constant circulation. An the ones that were not always circulating were running about 70% of the time. Most systems were kept at hot water temperatures hotter than what is necessary for most end uses. The average temperature drop in the circulation loops were 15F during periods without hot water use. We measured temperature drops of 30 degrees in some cases. These large temperature drops give and indication for the heat loss through those loops. If temp drops are that large in the loop it often requires the supply temperature be increased in order to keep uses at the end of the loop warm. In about 1/3 of the measured systems return water temperatures were higher than 125F These operating characteristics are consistent with other building measured in similar projects. Energy waste associated with recirculation loses is between 13 and 30% for these systems.

Pg. 16
Continous Operation
24/7 Operation
Presenter
Presentation Notes
Measured data from one test site. This chart shows 2 hours of operation with relatively low heating use (grey line). It also shows the supply water temperature (in red) and the recirc return temperature (purple) and the cold inlet temperature in blue. This first plot looks at the base case of recirc pumping 24/7. In this case in periods with no use we can see the temperature drops about 10deg F. We can see that things stay pretty uniform with constant circulation. In this second figure we see the same system during a similar low use period, but in the demand control mode. Here there recirc pump only turns on when the return temp (purple) is below the target (set to 105 F) and there is hot water active. The pump only runs for ~10 minutes of the two hours. The system maintains usable hot water temperature and uses far less energy to do so.

Pg. 17
Controlled Operation
24/7 Operation
Controlled
Presenter
Presentation Notes
Measured data from one test site. This chart shows 2 hours of operation with relatively low heating use (grey line). It also shows the supply water temperature (in red) and the recirc return temperature (purple) and the cold inlet temperature in blue. This first plot looks at the base case of recirc pumping 24/7. In this case in periods with no use we can see the temperature drops about 10deg F. We can see that things stay pretty uniform with constant circulation. In this second figure we see the same system during a similar low use period, but in the demand control mode. Here there recirc pump only turns on when the return temp (purple) is below the target (set to 105 F) and there is hot water active. The pump only runs for ~10 minutes of the two hours. The system maintains usable hot water temperature and uses far less energy to do so.

Pg. 18
Thermal Energy Use
Presenter
Presentation Notes
Site Com 2 Here is the summary data from a test site. This plot shows the daily energy used in controlled mode (red) vs 24/7 continuous runtime (blue). On the x axis we have the btus delivered in hot water to the building, that is energy out of the recirculation loop. On the y-axis we have the energy used by the system. That is btus consumed to heat the water. The plot shows clearly that the system is consuming significantly less energy to deliver the same hot water quality to the building when in the controlled mode.
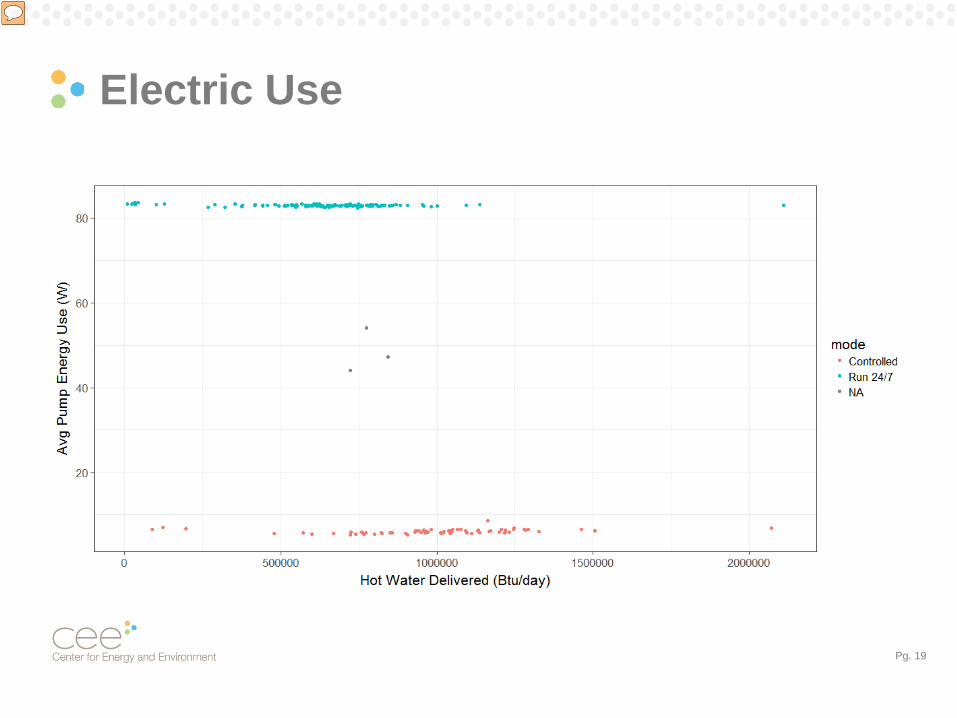
Pg. 19
Electric Use
Presenter
Presentation Notes
Hosp_3 This is a similar plot for the same site, but here we are looking at the electrical pump energy used in each mode. We can see the drastic reduction in power. At this site we have a pretty efficiency pump that is only using ~85 W. So the magnitude of savings is not a huge number, but the percentage reduction is over 90%.

Pg. 20
Recovery Time
35 sec full loop recovery from full cold

Pg. 21
Program development
• Opportunity identification• Installation
• Install equipment• Set parameters• Integration with other systems
• Ensure operation
Presenter
Presentation Notes
In general this technology works well and delivers energy savings to the building, without sacrificing the occupant performance. But there a couple of key areas to consider when approaching this technology from a programmatic stand point Identifying the opportunity: Build must have a central DHW system with contestant or uncontrolled recirculation The system needs to have a large enough energy use to be a practical target for savings (more on this in a bit) Installation: We’ve talked about straight forward installations already, but as buildings get larger and older the systems get more complicated. I’ll send a bit more time on this in the next few slides as well. Ensuring good operation: There are a few things that should be done in order to ensure the system will work as intended. Make sure building staff understands how the controller is working and how to adjust it is issues arise, or else it will just be turned off

Pg. 22
Installation Examples
• A few examples of potential issues• A best case example• A view to the future
Presenter
Presentation Notes
I want to walk through a couple of installation examples. Starting with some difficult cases, then highlighting the easier case, and finally touching on some technological solutions.

Pg. 23
No Shut Off Valves
Presenter
Presentation Notes
Differences in the heating source and system age can introduce difficulties. This system had an old indirect storage tank off of a district steam heating system. The inlet side water connections were old and large diameter. There was concern with sizing an tee to fit for the flow sensor and with integrating with the old cast iron pipes. Additionally there were no shut off valves located close the storage tank on the cold side. And installation was possible here with the flow sensor on the hot side of the storage tank, but in required some adjustment to the controller algorithm.

Pg. 24
Multiple Water Heaters
Presenter
Presentation Notes
Another situation where the controller can work well, but installation specifics required more time during the installation. It is important that the flow sensor is able to detect any hot water flow in the system. On a multiple water heater installation the plumbing connections are particularly important to make sure all flow is captured. On this system, due to the location on the pipes and the various pieces of equipment the best installation was to use a flow sensor for each water heater and use an active flow on any of the three WHs to indicate flow in the system.

Pg. 25
Complex Plumbing and Duplicate Heating
* Operator cooperation also important
Presenter
Presentation Notes
Another example of a complex system. This is a type of system that is common in older buildings where it changes over time as the intended use changes and the system is keep on-line through maintenance. This system prioritized no down/offline time over all else, so over time as heating sources failed or needed maintenance, new systems were added. So we see several redundant heaters, with complex plumbing connections. We also see secondary heating zones that feed of the same recirculation pump. Operators/owners of the property might not understand how all parts of the system work. This system can be operated by the demand control, but it takes extra time to understand the implications of an installation. It is also important to determine if the system is operating correctly prior to adding in a controller. This site was one of the six installed, but we ended up collecting very little data, mostly due to change in ownership of the property. But also because the new owner did not understand the DHW system operation completely and was hesitant to make any changes to what was working.

Pg. 26
Balancing and Cross-Over
Presenter
Presentation Notes
The two issues that can impact the controller operation are: balancing and cross over First we need to consider zone balancing. Without proper balancing with check and balancing valves a system with a single pump and multiple zones can operate at a range of recirc flows and temperatures. In this example at the top of the page zone 1 will have higher temperatures and flows than zone 2 and zone 2 will be higher than zone 3 if not properly balanced. In practice the recirc and WH controls are often turned to higher temperatures to ensure zone 3 receives hot enough water. Installing a demand control value on this unbalanced system could lead to problems, because controller would control on the return temps from the mixed system of zone 1 and zone 3 would be considerably cooler. This system will work fine with a controller, but it must be balanced first. Similarly with cross over, if the system has an issues, it might be hidden by over heating and over circulating. Controlling circulation can expose a problem. Cross-over is the phenomeom in central systems where, water is crossing from the cold side of the system into the hot, or vice versa. This typically happens through a pressure imbalance and a failure in a mixing valve. For example, in this figure if the missing valve in the shower has failed, cold water may pass through the cold side into the hot water supply line. This cools the hot supply line. If the problem is large enough this can effect the whole loop. In 24/7 continuous recirc this problem can be hidden, because the hot supply from the water heater keeps circulating and reheating the hot line. If controlled, cross-over can cool a larger portion of the central loop, leading to issues. In both of these cases, continuous recirculation can cover problems in the DHW loop. Both of these cases can lead to large energy losses through over heating. These loses can be much greater than the normal distribution losses one would expect from reciculation.

Pg. 27
Good Installations
Presenter
Presentation Notes
Here is a simple example of a good easy installation. This is fairly typical in small to mid MF and in small commercial applications and makes for a good fit for this control technology. Single recirculation loop makes plumbing easy to understand and identify Lots of shut off valves makes the installation clear, easy, and quick A single WH/heating source makes flow and temperature sensor location easy to identify and install

Pg. 28
Future Installs
• New non-obtrusive flow meters• Ultrasonics• Acoustics• Vibration
• All traditionally very expensive, but costs are coming down• Would allow for cheaper and easier solutions
Presenter
Presentation Notes
Improving technology may make these systems even easier to install and able to collect additional information at little additional cost. Surface mount flow sensing technology such as ultrasonic flow meters have existed for a long time, but are very expensive. But utlrasonic, as well as other acoustic tech, and vibration based sensors are becoming cheaper and more available. Incorporating this technology into a demand controller would remove the need to cut into the plumbing to install the flow sensor and potentially eliminate the need for a plumber.

Pg. 29
Analysis
y = -0.3719x + 28.308R² = 0.8255
y = -0.2951x + 24.828R² = 0.8761
012345678
50 55 60 65 70 75 80 85
Hot W
ater
Del
iver
y, T
herm
s/w
eek
Cold Water Inlet Temperature, F
Baseline Active On-demand Active
y = 1.6637x + 0.2281R² = 0.97
y = 1.6002x - 0.7775R² = 0.986
0
2
4
6
8
10
12
0 1 2 3 4 5 6 7 8
Ener
gy C
onsu
mpt
ion,
ther
ms/
wee
k
Hot Water Delivery, Therms/week
Baseline Active On-demand Active
Presenter
Presentation Notes
AS discussed earlier we collected a large amount of data on all of these systems in baseline and controlled mode. Systems were characterized in each mode and analyzed to determine their weather normalized annual performance. This included looking at the impacts of changing inlet water conditions on the system as well as changing hot water demands during the year. This data was summarized and compared to understand the impact on DHW demand control.

Pg. 30
Savings
Baseline Controlled Savings
Thermal Use (therms/yr)
Electrical Use (kWh/yr)
HW Used (gal/day)
Avg Sup Temp
Avg RtnTemp
therm (therms/yr
Electric (kWhr/yr)
HW Used (gal/day)
Avg Sup Temp
Avg Rtn Temp %therm %pump $/yr
Hosp_02 9,965 3,269 3,106 118.5 117.6 8,713 970 3,756 117.7 114.3 12.6% 70.3% $ 1,356.2
Hosp_03 6,658 109 1,720 126.3 122.2 5,551 7 1,855 131.2 108.7 16.6% 93.3% $ 1,006.4
Ed_02 344 862 137 109.8 105.8 297 32 148 111.2 89.9 13.6% 96.3% $ 125.2
Com_03 1,439 117 74 114.8 106.8 1,173 14 109 115.6 96.8 18.5% 87.9% $ 249.6
Presenter
Presentation Notes
Here is a summary of the sites studied in this project. I want to highlight a few pieces of information from this table. First I want to point out the percentage savings. Each site saved between 13 and 19% of the water heater energy when in control mode. This was in line with our expected thermal recirculation loses estimates. The controllers capture the majority of the thermal waste due to recirculation. Additionally, three of the sites had about 90% reduction in there electrical pump energy, which was also inline with our expectations. These numbers are very comparable percentage wise to those reported in CA and NY for multi-family buildings. The one site that was lower in both savings categories, Hosp_2, was very concerned about occupant satisfaction and we there for turned the controls to as conservative settings as possible at that site. �The second thing I want to highlight is the huge difference in hot water use in these building types. The commercial buildings were schools and office buildings with mostly bathroom sinks and kitchenettes, while hospitality buildings had full bathrooms with showers and tubs. This huge difference in hot water use thousands of gallons a day in hotels to hundreds in commercial impacts the designs and loads of the systems, which much less load, systems has smaller distribution and water heater sizes, so even though the percentage savings are similar the dollars saved are very different. Also, there are only 4 sites listed here. As I mentioned we had very little data at an additional Hotel property (Hosp_1) and we have data from an additional school building (Ed_01) that also had some additional complications in the data collection process. The savings at both additional sites suggest the same range of savings, but analysis has higher error that the data presented here. These two sites will be addressed in more detail in the final report.
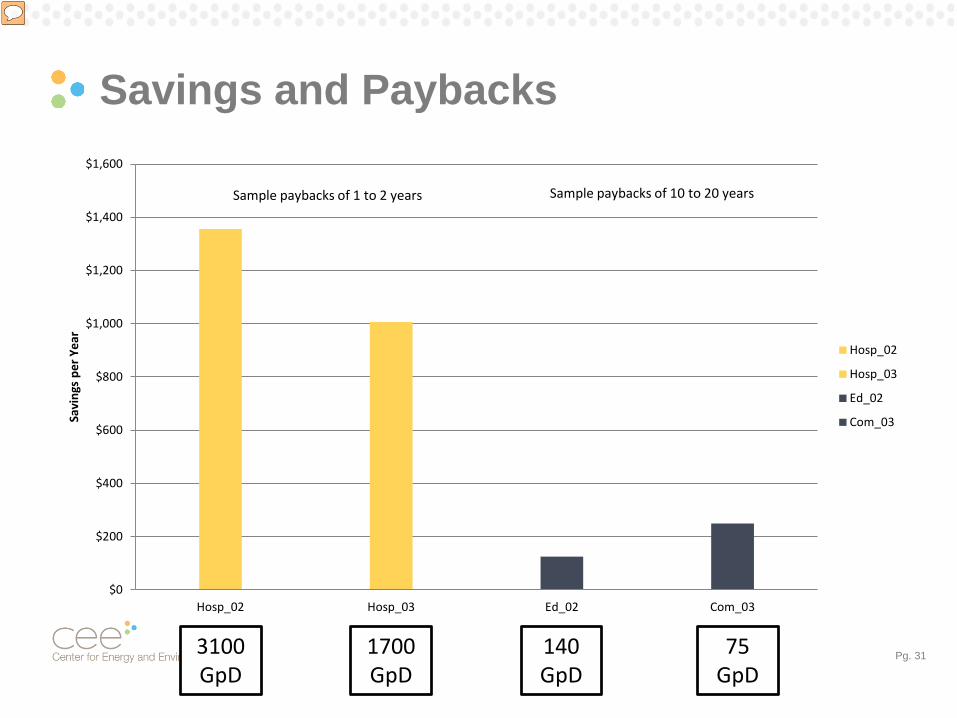
Pg. 31
Savings and Paybacks
$0
$200
$400
$600
$800
$1,000
$1,200
$1,400
$1,600
Hosp_02 Hosp_03 Ed_02 Com_03
Savi
ngs
per Y
ear
Hosp_02
Hosp_03
Ed_02
Com_03
Sample paybacks of 1 to 2 years Sample paybacks of 10 to 20 years
3100 GpD
1700 GpD
140 GpD
75 GpD
Presenter
Presentation Notes
Commercial buildings use less hot water, so the systems are designed for smaller loads.

Send us your questions usingGoToWebinar question box
Questions?
32
Demand Control Systems Deliver Efficiency inCommercial Hot Water Use
Ben SchoenbauerSenior Research Engineer
Center for Energy and Environment (CEE)[email protected]
Presenter
Presentation Notes
Thanks Ben for that great overview of your research on the demand-based controls for DHW system. Now we’ll turn it over to Mark who has been monitoring the questions as they’ve come in. If you have a question for Ben, please type it into the question box on the GoToWebinar panel and send it to us. Mark, do you have any questions for Ben? Thanks, Ben and Mark. If you have follow-up questions about this research after the webinar, feel free to email Ben with them.

CARD Project Resources
R&D Web Page (https://mn.gov/commerce/industries/energy/utilities/cip/applied-research-development/)
For Reports use CARD Search Quick Link
For Webinars use CARD Webinars & Videos Quick Link
Webinar Recording &Final Report
available in few weeks
33
Presenter
Presentation Notes
The recording of this webinar and the final report will be available on the Department’s Applied Research and Development web page in a few weeks. When available, you can link to them from either the Webinar quick link or the CARD Search quick link as indicated on this slide. This R&D web page has additional resources and information related to the CARD program and to CARD research projects which you can check out. The address is at the bottom of this slide.

Thanks for Participating!Upcoming CARD Webinars:• Feb 22: Compressed air demand reduction through air tool replacement• Mar 14: Increasing Energy Code Compliance through Support & Assistance• Mar 28: Increasing Residential Boiler Efficiency with QI & Retro-Cx
Commerce Division of Energy Resources e-mail list sign-upIf you have questions or feedback on the CARD program contact:
Mary Sue [email protected]
651-539-187234
Presenter
Presentation Notes
Thanks for participating today! We appreciate your interest in the results of CARD projects. Before we leave, I want to take this opportunity to mention a number of upcoming CARD webinars: On February 22 – the Minnesota Technical Assistance Project will discuss an often overlooked opportunity to reduce energy use in industrial facilities by replacing pneumatic power tools with direct electric motor-driven tools On March 14 – the Center for Energy and Environment will report on two approaches to improve energy code compliance of individual newly constructed commercial buildings through tools and technical assistance to building design, construction and code enforcement professionals. On March 28 – the Center for Energy and Environment will be back to review the results from a project which sought to improve the operating performance of residential high-efficiency condensing boilers through quality installation and retrocomissioning. Announcements about upcoming webinars and other news related to the Minnesota Conservation Improvement Program can be found in the CIP Newsletter. You can use the link on this slide to sign up for the Newsletter. In the meantime, contact me if you want more information on these upcoming webinars or if you have questions, feedback or suggestions for the CARD program or CARD webinars. Thanks, again!