DEMAND AND SUPPLY OF PRIMARY AND …educationcouncil.edu.au/site/DefaultSite/filesystem...Demand and...
137
12 th MCEETYA Meeting Melbourne, 26-27th July, 2001 Paper 4.7 SECTION 1 DEMAND AND SUPPLY OF PRIMARY AND SECONDARY SCHOOL TEACHERS IN AUSTRALIA Prepared by the Department of Education, Training and Youth Affairs on behalf of the CESCEO Working Party on Supply and Demand for Teachers
Transcript of DEMAND AND SUPPLY OF PRIMARY AND …educationcouncil.edu.au/site/DefaultSite/filesystem...Demand and...
12th MCEETYA Meeting Melbourne, 26-27th July, 2001
Paper 4.7
SECTION 1
DEMAND AND SUPPLY OF PRIMARY AND SECONDARY SCHOOL TEACHERS
IN AUSTRALIA
Prepared by the
Department of Education, Training and Youth Affairs
on behalf of the
CESCEO Working Party on Supply and Demand for Teachers
Demand and supply of primary and secondary school teachers in Australia
2
Contents
Executive Summary ................................................................................................................................. 6
Introduction .............................................................................................................................................. 10
PART A THE RECENT PAST
Chapter 1 A profile of the Australian teaching workforce in 1999 .................................................... 12
Distribution of teachers by State and Territory, sector and type of school .......................................... 12 Distribution of teachers by age and sex ............................................................................................... 13
Chapter 2 Trends in the teacher labour market in the 1990s ............................................................. 15
National trends in students and (regular) teachers ............................................................................... 15 State and Territory trends in (regular) teachers .................................................................................. 16 Teachers in government and non-government schools ........................................................................ 19 Contract teachers .................................................................................................................................. 19 Teacher supply and demand imbalances in the 1990s ......................................................................... 19
PART B THE TEACHER LABOUR MARKET IN 2000
Chapter 3 The state of the teacher labour market in Australia in 2000 ............................................ 22
Overall assessment of the teacher labour market ................................................................................. 22 Summaries of the labour market for teachers in each State and Territory ........................................... 23 State and Territory recruitment strategies for dealing with hard-to-fill teacher vacancies .................. 29
Chapter 4 The teacher labour market in selected overseas countries ............................................... 32
United Kingdom ................................................................................................................................... 32 United States of America ..................................................................................................................... 33 New Zealand ........................................................................................................................................ 34 Canada .................................................................................................................................................. 34 Summary of teacher supply and demand in overseas countries ........................................................... 34
PART C FUTURE OUTLOOK
Chapter 5 Factors affecting the demand for teachers ......................................................................... 37
Growth demand for teachers ................................................................................................................ 37 Replacement demand for teachers ....................................................................................................... 39
Chapter 6 Factors affecting the supply of teachers ............................................................................. 44
New graduates ...................................................................................................................................... 44 Teachers returning from leave and former teachers returning to teaching .......................................... 48 The teacher pool – relief, casual and contract teachers ........................................................................ 49 Overseas migration .............................................................................................................................. 50 Relative importance of various sources of teacher supply ................................................................... 52
Demand and supply of primary and secondary school teachers in Australia
3
Chapter 7 Projections of teacher demand and supply to 2003 ........................................................... 54
Outlook for the teacher labour market at the national level ................................................................. 54 Projected trends in teacher requirements and graduations by State and Territory ............................... 59 Flexibilities and scope for adjustment in the teacher labour market .................................................... 65 Summary .............................................................................................................................................. 67
Chapter 8 Longer term pressures on the teacher labour market ...................................................... 69
Future student enrolment trends ........................................................................................................... 69 The implications of baby boomers approaching retirement ................................................................. 70 Shortage of mathematics and science teachers .................................................................................... 74
PART D CONCLUSIONS
Chapter 9 Summary and conclusions ................................................................................................... 80
The state of the teacher labour market in 2000 .................................................................................... 80 Projections of demand and supply of teachers to 2003 ........................................................................ 80 Some longer term sources of pressure on the teacher labour market ................................................... 81 Improving data on teachers for supply and demand analyses .............................................................. 81
Bibliography ............................................................................................................................................. 84
Acronyms and Abbreviations ................................................................................................................. 86
Glossary of Terms .................................................................................................................................... 87
ATTACHMENTS Attachment 1: Detailed State and Territory reports ................................................................................ 90
Attachment 2: Past student enrolment trends – 1995 to 1999 ................................................................. 122 Attachment 3: Projected student enrolments – 2000 to 2004 ................................................................. 123
Attachment 4: Projected number of teachers required (FTE) to 2003 .................................................... 124
Attachment 5: Commencements of postgraduate and undergraduate initial teacher training courses1989 to 1999 ........................................................................................................ 126
Attachment 6: Completions from postgraduate and undergraduate initial teacher training courses 1989 to 1999 .................................................................................................................... 132
Attachment 7: Projections of completions from postgraduate and undergraduate initial teacher training courses 2000 to 2003 ............................................................................................. 134
Demand and supply of primary and secondary school teachers in Australia
4
List of Tables
Table 1: Employment of teachers (FTE) by State/Territory, sector and category of school, 1999
Table 2: Sex and age characteristics of the government and non-government teaching workforce, 1999
Table 3: Long term trends in numbers of students, teachers and student/teaching staff ratios
Table 4: Balance between demand and supply in the teachers labour market by State
Table 5: Subject area recruitment difficulties/shortages in secondary schools
Table 6: Student to teacher ratios by sector and category of school, 1999
Table 7: Separations (other than through leave of absence) from the government permanent teaching workforce, as a proportion of that workforce, 1996 and 1999.
Table 8: Destination of graduates from initial teacher education courses, 1998
Table 9: Arrival of teachers to Australia by migration category
Table 10: Departure of teachers from Australia by migration category
Table 11: Previous year’s graduates as a proportion of all new teachers recruited into the government sector during 1999
Table 12: Estimated annual recruitment of teachers (head count), 2000 to 2003.
Table 13: Projected graduates from Initial Teacher Education courses and those available for teaching positions, 1999 to 2003
Table 14: Employed graduate teachers – State of graduation and State of employment (1999)
Table 15: Interstate movements between 1991 and 1996 of employed teachers as a proportion of employed teachers in each State and Territory (per cent)
Table 16: Percentage of teachers in government schools aged 45 and over and 50 and over, 1999
Table 17: Students in the first year of secondary teaching courses studying selected subjects, 1992 to 1999.
Table 18: Commencing non-overseas students in science courses by discipline, 1989 to 1999
List of Charts
Chart 1: Employed primary teachers (FTE), 1984 to 1999
Chart 2: Employed secondary teachers (FTE), 1984 to 1999
Chart 3: Teacher graduates working in full-time employment as a proportion of those available for full-time employment
Chart 4: Employed teachers and new graduates, 1990 to 1999, New South Wales
Chart 5: Employed Teachers and new graduates, 1990 to 1999, Victoria
Chart 6: Employed Teachers and new graduates, 1990 to 1999, Queensland
Chart 7: Employed Teachers and new graduates, 1990 to 1999, South Australia
Chart 8: Employed Teachers and new graduates, 1990 to 1999, Western Australia
Chart 9: Employed Teachers and new graduates, 1990 to 1999, Tasmania
Demand and supply of primary and secondary school teachers in Australia
5
Chart 10: Employed teachers and new graduates, 1990 to 1999, Northern Territory
Chart 11: Employed Teachers and new graduates, 1990 to 1999, Australian Capital Territory
Chart 12: Student/to teacher ratio, 1984 to 1999, Australia
Chart 13: Total teacher commencements and completions, 1989 to 1998, Australia
Chart 14: Undergraduate teacher commencements, 1989 to 1999, Australia
Chart 15: Postgraduate teacher commencements, 1989 to 1999, Australia
Chart 16: Undergraduate course completions in teaching, 1988 to 1998, Australia
Chart 17: Postgraduate course completions in teaching, 1988 to 1998, Australia
Chart 18: Projected students (FT) and teachers (FTE), 1998 to 2003, Australia
Chart 19: Teacher course completions by course type, actual and projected, 1998 to 2003, Australia
Chart 20: Projected teacher workforce and new graduates, 1999 to 2003, New South Wales
Chart 21: Projected teacher workforce and new graduates, 1999 to 2003, Victoria
Chart 22: Projected teacher workforce and new graduates, 1999 to 2003, Queensland
Chart 23: Projected teacher workforce and new graduates, 1999 to 2003, South Australia
Chart 24: Projected teacher workforce and new graduates, 1999 to 2003, Western Australia
Chart 25: Projected teacher workforce and new graduates, 1999 to 2003, Tasmania
Chart 26: Projected teacher workforce and new graduates, 1999 to 2003, Northern Territory
Chart 27: Projected teacher workforce and new graduates, 1999 to 2003, Australian Capital Territory
Chart 28:Average annual increase in enrolments 1989–1999 (actual), and 1999–2010 (projected)
Chart 29: Annual enrolment increases 1995 to 2010
Chart 30: Age distribution of primary school teachers, 1999
Chart 31: Age distribution of secondary school teachers, 1999
Chart 32: Annual retirements in the government primary school sector as a percentage of the permanent government primary teaching workforce (head count), 1996 to 2004.
Chart 33: Annual retirements in the government secondary school sector as a percentage of the permanent government secondary teaching workforce 1996 to 2004.
List of Figures
Figure 1: Teacher labour markets – main stocks and flows
List of Boxes
Box 1: Two Queensland case studies of teacher separations
Demand and supply of primary and secondary school teachers in Australia
6
Executive summary
The report examines the state of the teacher labour market in each Australian State and Territory in 2000, projects demand and supply for teachers to 2003 and, for the longer term period to 2010, considers some issues which are likely to have a significant impact on the balance between demand and supply. The analysis is based on information provided by the State and Territory education authorities and data from other sources.
Trends during the 1990s
During the 1990s, the teaching workforce increased by about 11 per cent across Australia with most of the increase occurring in the primary sector. While total teacher employment grew in every State and Territory, growth was especially strong in New South Wales, Queensland, Western Australia and the Northern Territory. Primary sector teacher employment grew in all jurisdictions but secondary sector teacher employment fell in three, namely Victoria, South Australia and Tasmania.
By 1999 there were 239 000 teachers (215 000 in FTE terms) employed in Australian schools, divided almost equally between primary and secondary schools. Almost 80 per cent of teachers were employed on a permanent full-time basis, with 10 per cent employed on a permanent part-time basis and 11 per cent on a fixed term contract. Almost 80 per cent of teachers in primary schools were female while the gender balance was about even in secondary schools. The average age of teachers was around 42.
The state of the teacher labour market in 2000
The early 1990s were a period of teacher surplus in Australia. More rapid growth in teacher demand during the later part of the 1990s led to a gradual tightening of the teacher labour market. By the end of 2000 the education authorities in the States and Territories reported that the teacher labour market was broadly in balance across Australia, both in the primary and secondary sectors.
Recruitment difficulties were nonetheless being experienced during 2000 in a number of disciplines and in rural and remote regions. Vacancies for mathematics, science and information technology (IT) secondary school teachers have been hard to fill in all States and Territories. Mathematics teachers have been the hardest to fill but recruitment difficulties in this and the science and IT areas are of long standing. Other subject areas experiencing some recruitment problems, although not necessarily in all States and Territories, include modern foreign languages and industrial arts/technology. Most States and Territories indicate that, in addition to these specialisations, teachers in general are hard to recruit for positions outside the metropolitan and larger urban centres.
States and Territory governments have used a number of initiatives to address these recruitment difficulties. Broadly these initiatives have been aimed at attracting more well-qualified young people into teaching, through financial and other incentives. These measures also generally include an element of targeting specialisations in short supply. Some States and Territories also have measurers designed to attract teachers to country locations.
Other English speaking countries are experiencing similar trends in their teacher labour markets. New Zealand, the USA, the UK and, to a lesser extent, Canada all report some recruitment difficulties in the kind of subject areas that are hard to fill in Australia as well. In New Zealand and the USA teachers from particular ethnic backgrounds, such as Maori in New Zealand, and Spanish and black
Demand and supply of primary and secondary school teachers in Australia
7
American in the USA, are also highly sought after. The UK has been reported as having been actively recruiting in Australia in certain specialisations.
Demand and supply projections to 2003
The report makes an assessment of the possible trends in demand and supply of teachers to 2003. This year was chosen because it is the most forward year for which estimates of future graduate numbers can be made from existing enrolments in initial teacher training courses. This leads to greater accuracy in the projections for teacher supply.
Methodology for projecting demand and supply of teachers Demand in the report was estimated as the sum of growth demand and replacement demand.
Growth demand accounts for increases in the teacher workforce and is determined by enrolment trends and Student to Teaching Staff ratios (STRs), which are a function of government policies. For the purpose of the report, STRs were assumed to remain at 1999 levels. Growth demand for the period to 2003 was estimated at less than 1 per cent of the workforce.
Replacement demand accounts for retirements, resignations and other forms of separation. Data on government schools indicates that separation rates, which include mainly retirements and resignations, have been of the order of 3 per cent of the permanent workforce nationally, although there is wide variation between States and Territories. Somewhat higher separation rates were used for the period to 2003, due mainly to an expected increase in the retirement rates during that period. Separation rates for non-government schools were set at lower rates because resignation rates have been assumed to be lower in non-government schools. For the purposes of projections in this study, it was assumed that teachers taking extended leave (who represent between 6 and 8 per cent of the permanent workforce in any one year) are replaced by teachers returning from extended leave.
Supply of new teachers comes from new graduates, migration, teachers registered with the education authorities for positions in government schools, the pool of casual and relief teachers, former teachers outside the labour force or not working in the profession who may move into teaching, and teachers returning from leave. The report has been able to quantify the significance of most of these sources.
Graduates from initial teacher training courses at undergraduate and postgraduate level have comprised around 4-5 per cent of the teaching workforce annually; net migration has been contributing another one half of a per cent of the workforce per year; the number of teachers on employment lists in the four States which have such a system (namely New South Wales, Queensland, Western Australia and South Australia) was over 33 000; and the pool of relief and casual teachers has some 30 000-40 000 teachers in it. However, no reliable information is available on the number of teachers outside the profession who could be available for teaching.
Data provided by the States and Territories indicate that graduates are the largest single source of new recruits to government schools in any one year. In 1999 they comprised 45 per cent of all recruits into permanent and contract positions of at least one term in length. The remaining 55 per cent came from one of the several other sources described above.
Adequacy of graduations for meeting future teacher needs Using the assumptions described above the report estimates that recruitment needs in government and non-government schools will be of the order of 12 000-13 000 in the years between 2000 to 2003. Most of this will be replacement demand.
Demand and supply of primary and secondary school teachers in Australia
8
Some of this recruitment arises because of movement of teachers between government and non-government schools, across states and between jurisdictions. The level of recruitment due to growth in teacher requirements and losses from teaching (i.e. net demand) is difficult to estimate but recent work suggests that it could be of the order of 2.9 per cent of the teacher workforce plus growth demand, or 8500 teachers on average in each of the four years to 2003.
The number of graduates available to take up positions during the same period is estimated to rise from 8300 in 2000 to 9800 in 2003. Comparing this level of teacher graduations to the estimated demand for new teachers suggests that graduations should be adequate to meet the need for new teachers at the national level. The same conclusion would be reached if one applied the finding that, in recent years, experienced teachers have filled just over half the recruitment needs in the government sector and graduates just under half.
It is not possible to undertake a similar analysis for each State and Territory because of data limitations. The principal data deficiency is the absence of accurate data on net demand for teachers within each jurisdiction. Consequently it has not been possible to assess with confidence whether, despite an expected adequate number of teacher graduations at the national level, some States and Territories might face a tightening in their teacher labour market. There is some mobility of teachers, especially new graduates, across State and Territory boundaries which can assist in the allocation of teachers to where they are most needed. Also, the education authorities and schools have other options at their disposal for overcoming recruitment difficulties, should these arise, in the short term.
Pressures on the teacher labour market in the longer term (to 2010)
Although detailed projections were not made for the period post 2003, the report examined three key issues that have been identified as likely to impact significantly on the teacher labour market within the next five to ten years (i.e. between 2005 to 2010). These key issues were student enrolment trends, the ageing of the teacher workforce and the outlook for science and mathematics teachers.
Student enrolments over the next ten years are expected to grow at a slower rate than in the 1990s. Moreover, unlike the 1990s, a greater proportion of the increase will be in the secondary school sector (60 per cent). Overall, these enrolment trends suggest that the demand for teachers arising from enrolment growth in the period to 2010 will be relatively modest.
A more important source of demand for teachers during this decade will be the expected upsurge in retirements. In 1999 over 45 per cent of secondary school teachers were over the age of 45 and over 23 per cent were over the age of 50. Based on past experience and retirement intentions, the 50 years and over group will retire by 2010 as will some in the age group 45 to 50 years. Accordingly retirements as a proportion of the workforce is expected to rise significantly with the impact starting to be felt in the early years of the current decade and accelerating in the second half of the decade. This has significant implications for the teacher labour market in all States and Territories.
Mathematics and science teachers have been difficult to recruit for a long time. There is some evidence, analysed in this report, to suggest that the supply of mathematics and science teachers could in the next decade fall below existing levels. This, combined with the ageing of the existing teacher workforce, would place this segment of the teacher labour market under severe pressure.
Demand and supply of primary and secondary school teachers in Australia
9
Limitations of data on the teacher labour market
The report has identified some deficiencies in existing data on teachers which limit the kind of supply and demand analyses that can be undertaken. The report identifies five broad areas for improvement:
consistent and quantitative information on recruitment difficulties being experienced, including by subject area and location;
better and more frequent data on the specialisation of teachers and graduates and more information on the characteristics of teachers in the non-government sector;
more comprehensive information on teachers in the teaching pool, that is those teachers not currently employed as permanent or contract teachers but who are available for such positions;
more reliable data on inflows and outflows from teaching, particularly on losses from teaching at the State and Territory level; and
information on practices within the education system used to adjust to recruitment difficulties.
Some of these areas are being addressed by State and Commonwealth authorities. More work needs to be done on others.
Demand and supply of primary and secondary school teachers in Australia
10
Introduction
This is the second report on teacher supply and demand prepared on behalf of the Conference of Education Systems Chief Executive Officers (CESCEO). The first report was published by the Ministerial Council on Education, Employment, Training and Youth Affairs (MCEETYA) in 1999.
In 1997 MCEETYA requested CESCEO to establish arrangements for the regular monitoring of supply and demand in the teacher labour market. In response to this request, in September 1997 CESCEO set up the Working Party on Supply and Demand for Teachers with responsibility for preparing a report on the supply and demand for teachers in association with the then Department of Employment, Education, Training and Youth Affairs (DEETYA). The Working Party comprised representatives from each of the State and Territory education departments.
The first supply and demand report was prepared by DEETYA in conjunction with the Working Party. This second report was prepared by the Department of Education, Training and Youth Affairs (DETYA) and the Working Party.
The report focuses on three principal matters:
The state of the teacher labour market in 2000, nationally and by State and Territory (chapters 1 to 4);
The outlook for the teacher labour market to 2003 (chapters 5 to 7); and
Possible sources of significant pressure in this labour market into the latter part of the current decade (chapter 8).
The conclusions of the report are at Chapter 9. That chapter also comments on the limitations of the available data for supply and demand studies.
In preparing this report DETYA has made considerable use of data and information about government schools provided by the State and Territory education authorities through their Working Party representatives. These data were provided as part of a survey of the education authorities conducted in the second half of 2000. Use was also made of information from the State Labour Economics Offices (LEOs) of the Department of Employment, Workplace Relations and Small Business (DEWRSB).
Note: Unless otherwise stated, all data about teachers in this report refers to teachers in
government and non-government schools. Where data specifically relates to government schools, they are described as such.

Demand and supply of primary and secondary school teachers in Australia
11
PART A
THE RECENT PAST
Demand and supply of primary and secondary school teachers in Australia
12
Chapter 1
A profile of the Australian teaching workforce in 1999
School teachers can be divided broadly into two categories:
teachers employed by the school authorities on a permanent or fixed term basis (i.e. ‘regular’ or core teachers) and;
temporary relief or casual teachers, who are employed to fill in for regular teachers (who are away on sick leave or undertaking training or for some other reason) and who are located in the ‘teacher pool’.
In 1999 (latest available data), there were 239 300 teachers employed on a permanent and fixed term contract basis in Australian primary and secondary schools (ABS 2000). The vast majority of these teachers are employed on a full-time and permanent basis. According to data from the 1999 Australian College of Education (ACE) survey of teachers (Dempster et al 2000, in process of publication), 78.7 per cent of teachers (excluding temporary relief and casual teachers) were employed on a permanent full-time basis, 9.9 per cent were employed as permanent part-time staff and 11.4 were on a fixed term contract (either full or part-time).
The proportion of part-time teachers appears to have grown over time, especially in the primary sector. This reflects both an increase in the availability of permanent part-time teaching positions as well as the fact that often primary schools are not able to offer specialist teachers more than a part-time job. The proportion of part-time teachers and the number of hours they work is reflected in the number of teachers, measured in full-time equivalent (FTE) units, being 9.9 per cent less in 1999 than the actual number of teachers.
The number of relief teachers is difficult to estimate, although they are an essential part of the teaching workforce and the labour market’s flexibility. Data from a number of sources suggest that in 2000 there were at least 30 000 such teachers in Australia.1 Much more is known about permanent and fixed term contract teachers. The following discussion relates to these teachers.
Distribution of regular teachers by State, sector and type of school
The distribution of teachers by sector (primary and secondary), State and Territory and whether the school is government or non-government, is shown in Table 1.
The number of teachers in both the primary and secondary sectors is almost equal, with the primary sector exceeding the secondary sector by just over 2 000 teachers (or just under 2 per cent). New South Wales and Victoria are the dominant employers of teachers in both the government and non-government sectors. These two States accounted for 58 per cent of all teachers in 1999, although this proportion has declined over time as the share of States such as Queensland and Western Australia has grown.
1 See Discussion in Chapter 6.
Demand and supply of primary and secondary school teachers in Australia
13
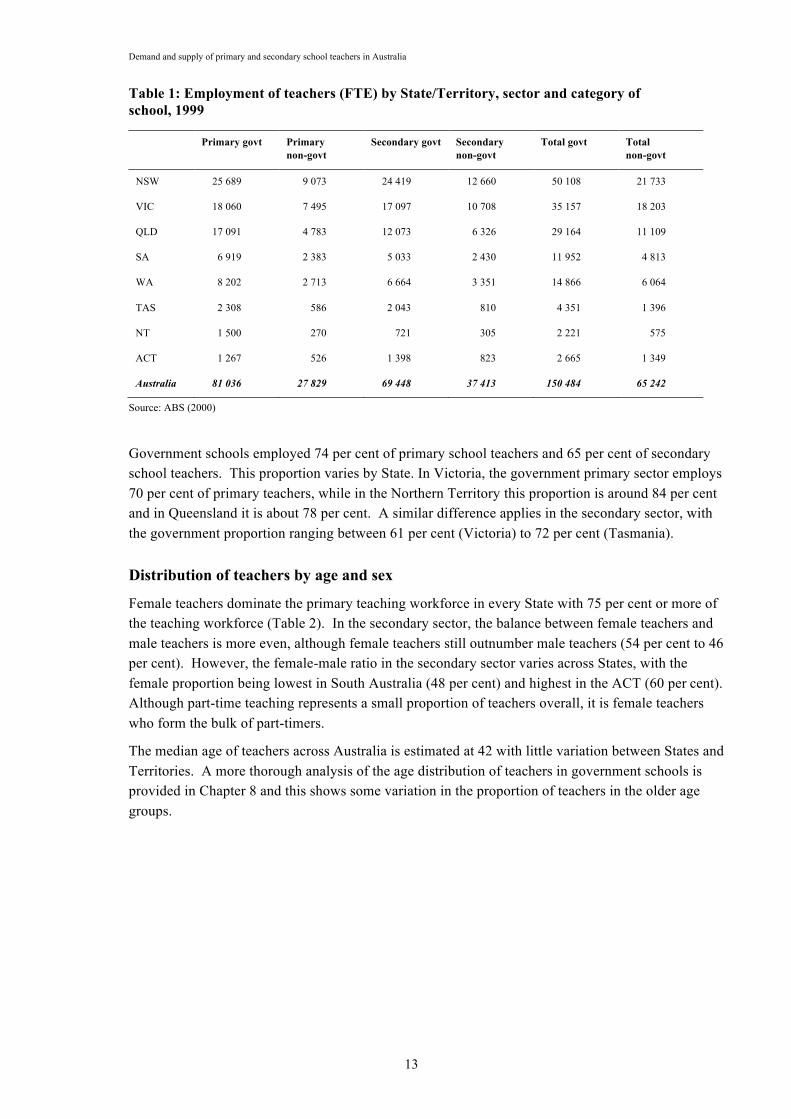
Table 1: Employment of teachers (FTE) by State/Territory, sector and category of school, 1999
Primary govt Primary non-govt
Secondary govt Secondary non-govt
Total govt Total non-govt
NSW 25 689 9 073 24 419 12 660 50 108 21 733
VIC 18 060 7 495 17 097 10 708 35 157 18 203
QLD 17 091 4 783 12 073 6 326 29 164 11 109
SA 6 919 2 383 5 033 2 430 11 952 4 813
WA 8 202 2 713 6 664 3 351 14 866 6 064
TAS 2 308 586 2 043 810 4 351 1 396
NT 1 500 270 721 305 2 221 575
ACT 1 267 526 1 398 823 2 665 1 349
Australia 81 036 27 829 69 448 37 413 150 484 65 242
Source: ABS (2000)
Government schools employed 74 per cent of primary school teachers and 65 per cent of secondary school teachers. This proportion varies by State. In Victoria, the government primary sector employs 70 per cent of primary teachers, while in the Northern Territory this proportion is around 84 per cent and in Queensland it is about 78 per cent. A similar difference applies in the secondary sector, with the government proportion ranging between 61 per cent (Victoria) to 72 per cent (Tasmania).
Distribution of teachers by age and sex
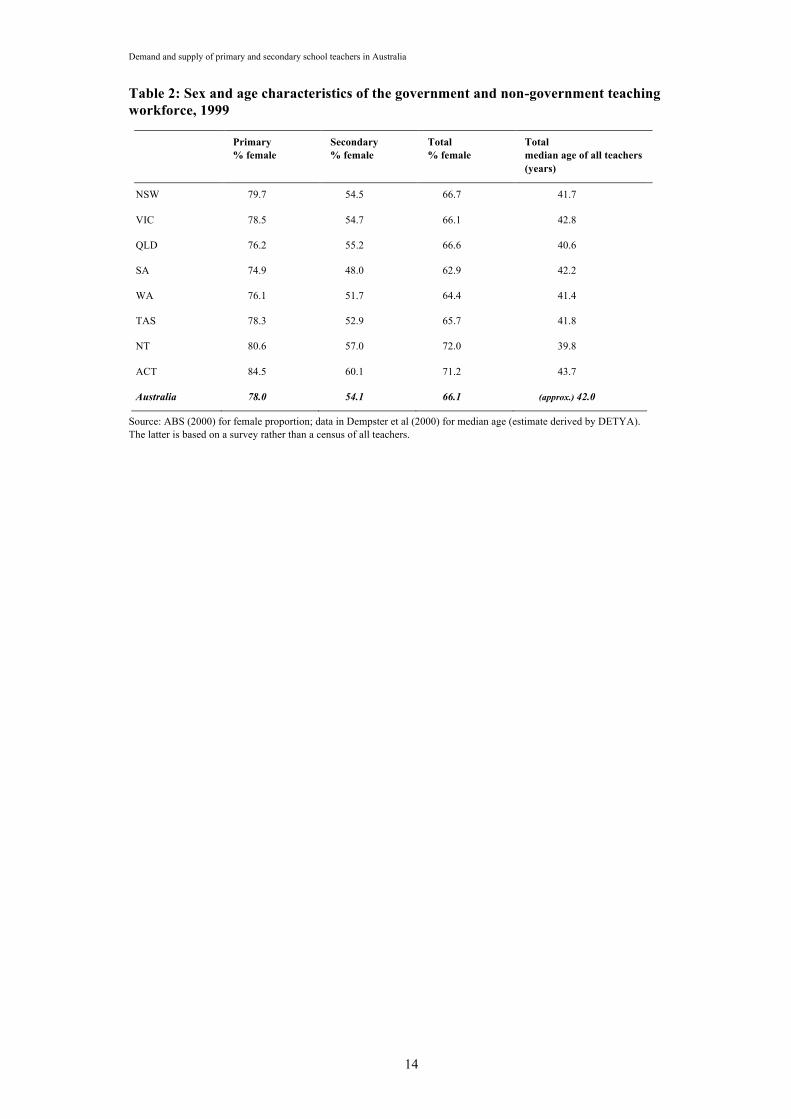
Female teachers dominate the primary teaching workforce in every State with 75 per cent or more of the teaching workforce (Table 2). In the secondary sector, the balance between female teachers and male teachers is more even, although female teachers still outnumber male teachers (54 per cent to 46 per cent). However, the female-male ratio in the secondary sector varies across States, with the female proportion being lowest in South Australia (48 per cent) and highest in the ACT (60 per cent). Although part-time teaching represents a small proportion of teachers overall, it is female teachers who form the bulk of part-timers.
The median age of teachers across Australia is estimated at 42 with little variation between States and Territories. A more thorough analysis of the age distribution of teachers in government schools is provided in Chapter 8 and this shows some variation in the proportion of teachers in the older age groups.
Demand and supply of primary and secondary school teachers in Australia
14
Table 2: Sex and age characteristics of the government and non-government teaching workforce, 1999
Primary % female
Secondary % female
Total % female
Total median age of all teachers (years)
NSW 79.7 54.5 66.7 41.7
VIC 78.5 54.7 66.1 42.8
QLD 76.2 55.2 66.6 40.6
SA 74.9 48.0 62.9 42.2
WA 76.1 51.7 64.4 41.4
TAS 78.3 52.9 65.7 41.8
NT 80.6 57.0 72.0 39.8
ACT 84.5 60.1 71.2 43.7
Australia 78.0 54.1 66.1 (approx.) 42.0
Source: ABS (2000) for female proportion; data in Dempster et al (2000) for median age (estimate derived by DETYA). The latter is based on a survey rather than a census of all teachers.
Demand and supply of primary and secondary school teachers in Australia
15
Chapter 2
Trends in the teacher labour market in the 1990s
National trends in students and (regular) teachers
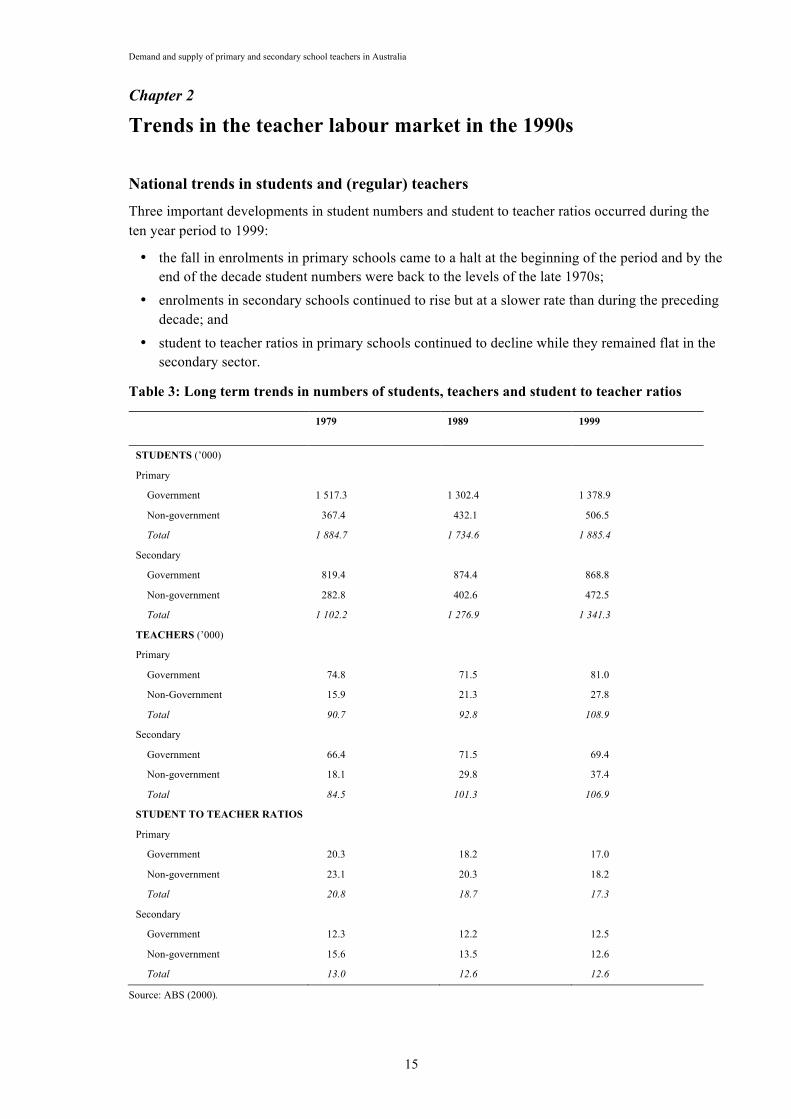
Three important developments in student numbers and student to teacher ratios occurred during the ten year period to 1999:
the fall in enrolments in primary schools came to a halt at the beginning of the period and by the end of the decade student numbers were back to the levels of the late 1970s;
enrolments in secondary schools continued to rise but at a slower rate than during the preceding decade; and
student to teacher ratios in primary schools continued to decline while they remained flat in the secondary sector.
Table 3: Long term trends in numbers of students, teachers and student to teacher ratios
1979 1989 1999
STUDENTS (’000)
Primary
Government
Non-government
Total
1 517.3
367.4
1 884.7
1 302.4
432.1
1 734.6
1 378.9
506.5
1 885.4
Secondary
Government
Non-government
Total
819.4
282.8
1 102.2
874.4
402.6
1 276.9
868.8
472.5
1 341.3
TEACHERS (’000)
Primary
Government
Non-Government
Total
74.8
15.9
90.7
71.5
21.3
92.8
81.0
27.8
108.9
Secondary
Government
Non-government
Total
66.4
18.1
84.5
71.5
29.8
101.3
69.4
37.4
106.9
STUDENT TO TEACHER RATIOS
Primary
Government
Non-government
Total
20.3
23.1
20.8
18.2
20.3
18.7
17.0
18.2
17.3
Secondary
Government
Non-government
Total
12.3
15.6
13.0
12.2
13.5
12.6
12.5
12.6
12.6
Source: ABS (2000).
Demand and supply of primary and secondary school teachers in Australia
16
As a result of these trends, employment of teachers (in FTE terms) in Australia grew by 11.1 per cent during the decade from 1989. This far exceeded the growth of employment in the economy at large. A large part of this increase in teacher employment was concentrated in the primary school sector, where employment of teachers rose by 17.2 per cent compared to 5.4 per cent for secondary school teachers. This contrasts with the previous ten year period (1979 to 1989), when the growth of teachers overall was much the same, although in that period it occurred predominantly in the secondary school sector.
The difference in growth between the primary and secondary sectors in the 1990s was due to two factors. First, there was a slightly greater increase during that period in the number of students at primary school level than in the secondary sector (8.6 per cent compared to 5.0 per cent). Second, and more significantly, there was a fall in the overall student to teacher ratio in the primary school sector while the student to teacher ratio remained unchanged in the secondary sector.
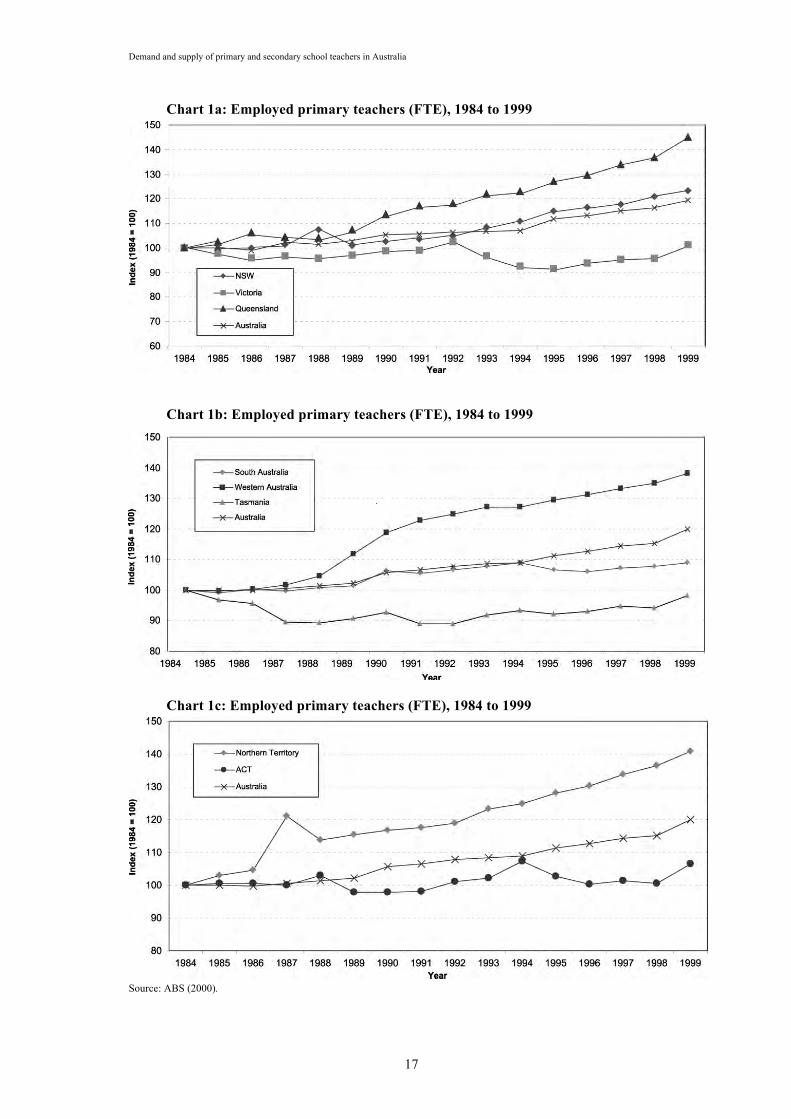
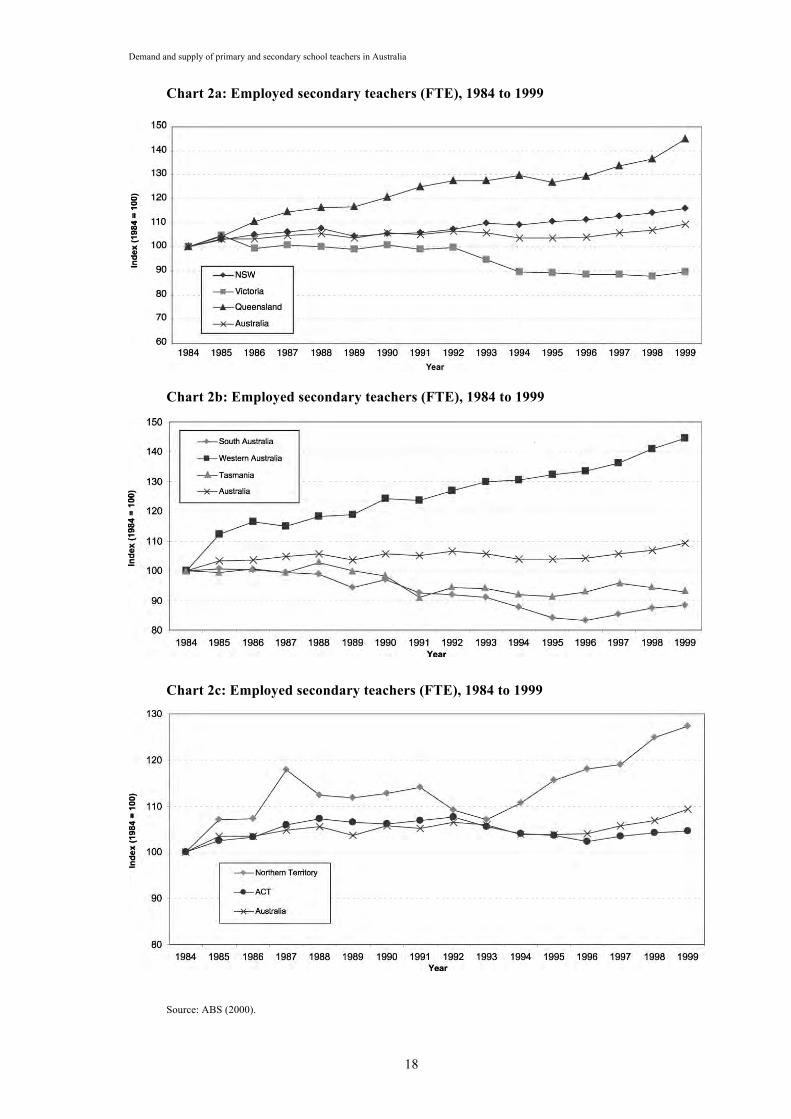
State and Territory trends in (regular) teachers
National figures mask significant differences in trends between the States and Territories as shown in Chart 1 (a to c) for the primary and Chart 2 (a to c) for the secondary sector (See Attachment 1 for detailed tables of teachers employed). These charts show that, essentially, States and Territories fell into two broad groups: the high teacher employment group represented by NSW, Queensland, Western Australia and the Northern Territory, and the low teacher employment group represented by the remaining States and Territories.
Although all States and Territories increased their primary teacher workforces, each of the States and Territories in the high growth group increased their teacher workforce by over 20 per cent while the States and Territories in the low growth group experienced growths of less than 10 per cent.
In the secondary school sector, the high growth group increased their teaching workforces, but generally by less than in the primary sector, while in the case of the low growth group there was an actual decline in the number of secondary teachers employed. In three of the four States in this group, this followed a fall in secondary school numbers. The largest decline in teacher employment occurred in Victoria (which also had the smallest increase in primary school teachers). By contrast, both Queensland and Western Australia had growths of over 20 per cent in both primary and secondary school teachers.
Demand and supply of primary and secondary school teachers in Australia
17
Chart 1a: Employed primary teachers (FTE), 1984 to 1999
Chart 1b: Employed primary teachers (FTE), 1984 to 1999
Chart 1c: Employed primary teachers (FTE), 1984 to 1999
Source: ABS (2000).
Demand and supply of primary and secondary school teachers in Australia
18
Chart 2a: Employed secondary teachers (FTE), 1984 to 1999
Chart 2b: Employed secondary teachers (FTE), 1984 to 1999
Chart 2c: Employed secondary teachers (FTE), 1984 to 1999
Source: ABS (2000).
Demand and supply of primary and secondary school teachers in Australia
19
Teachers in government and non-government schools
A further significant development during the decade was the continuation of the shift in the proportion of students towards non-government schools in both the primary and secondary sectors. The proportion of students in the non-government sector reached 30 per cent in 1999, up from 28 per cent ten years earlier and just under 22 per cent twenty years earlier. In the secondary sector, non-government schools provided for 35 per cent of all students in 1999, up from 32 per cent ten years earlier and 25 per cent twenty years earlier.
These trends were replicated in the case of teachers. The percentage point change for teachers (3.9 percentage points) over the decade is larger than for students (2.7 percentage points) because teacher student ratios fell by a greater proportion in the non-government sector.
Contract teachers
Results from the DETYA (2000 b) survey of State education authorities suggest that close to 10 per cent of the Government schools core workforce in most State/Territories in 1999 was contracted. This is roughly the proportion of contract teachers identified by the survey conducted by the ACE in 1999 (see Dempster et al 2000) which applied to teachers across the government and non-government sectors.
The experience with contract teachers in the 1990s varied across the States. In Western Australia, for example, the proportion of teachers on contract decreased, while it increased in Victoria. These trends appear to have reflected State Government policy and objectives at the time and may accordingly change in the current decade. The education authorities in Victoria, for instance, have indicated that a greater proportion of vacancies are now being offered on a permanent rather than contract basis.
Teacher supply and demand imbalances during the 1990s
In the first half of the 1990s, the requirement for new teachers was reduced by the impact of the recession which affected particularly full-time employment opportunities in the labour market. Bourke (1994) and Preston (2000) noted that, as result, resignations from teaching fell. Together with the slowing in the steady improvement in student-teacher ratios of the previous decade, this led to a decline in the requirement for new teachers. As a consequence, there appeared a substantial surplus of new teacher graduates and others seeking teaching appointments.
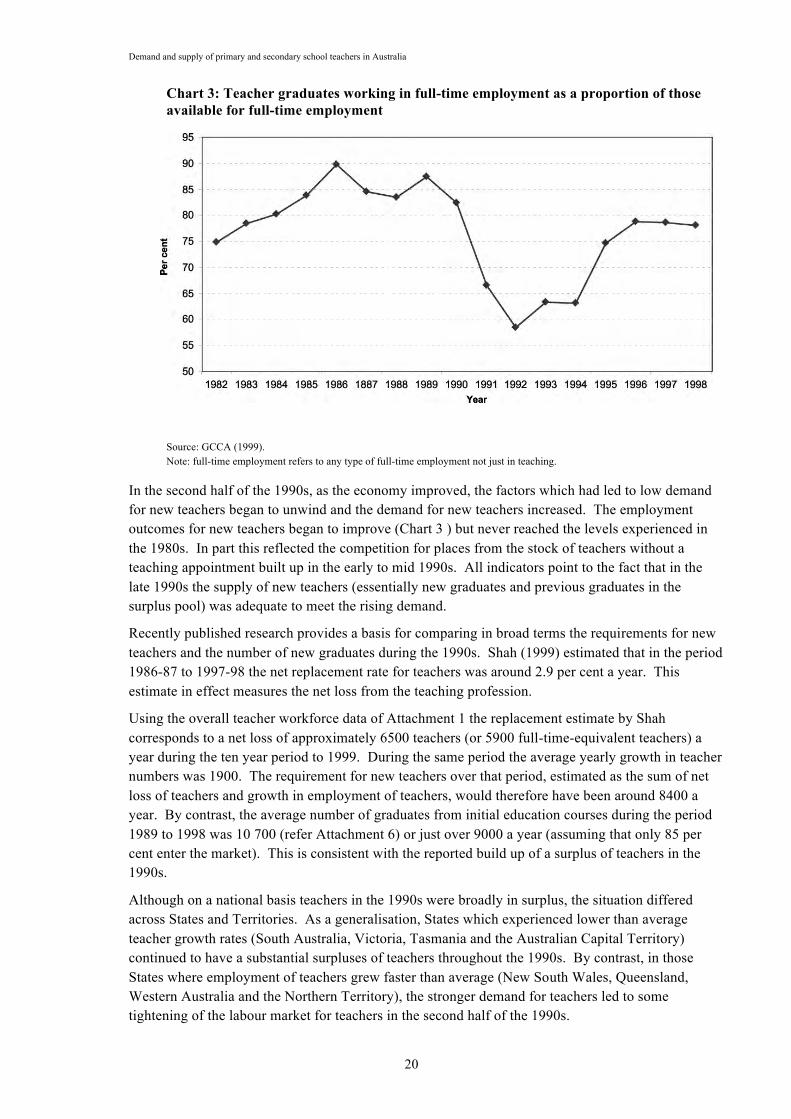
This is largely confirmed by data from the Graduate Destination survey reported annually by the Graduate Careers Council of Australia (GCCA). The employment outcomes for the period 1989 to 1998 shown in Chart 3 indicate that slightly less than 60 per cent of all new 1991 teacher graduates available for full-time work had obtained a full-time job by April of the year after graduation. This was down from 88 per cent two years before. The proportion stayed relatively low until the mid 1990s, especially for graduates trained as primary school teachers. In part reflecting these trends, places in university initial teacher education courses fell although Burke (1994) notes that university course restructuring at about this time also had an impact on initial teacher training course places on offer.
Demand and supply of primary and secondary school teachers in Australia
20
Chart 3: Teacher graduates working in full-time employment as a proportion of those available for full-time employment
Source: GCCA (1999). Note: full-time employment refers to any type of full-time employment not just in teaching.
In the second half of the 1990s, as the economy improved, the factors which had led to low demand for new teachers began to unwind and the demand for new teachers increased. The employment outcomes for new teachers began to improve (Chart 3 ) but never reached the levels experienced in the 1980s. In part this reflected the competition for places from the stock of teachers without a teaching appointment built up in the early to mid 1990s. All indicators point to the fact that in the late 1990s the supply of new teachers (essentially new graduates and previous graduates in the surplus pool) was adequate to meet the rising demand.
Recently published research provides a basis for comparing in broad terms the requirements for new teachers and the number of new graduates during the 1990s. Shah (1999) estimated that in the period 1986-87 to 1997-98 the net replacement rate for teachers was around 2.9 per cent a year. This estimate in effect measures the net loss from the teaching profession.
Using the overall teacher workforce data of Attachment 1 the replacement estimate by Shah corresponds to a net loss of approximately 6500 teachers (or 5900 full-time-equivalent teachers) a year during the ten year period to 1999. During the same period the average yearly growth in teacher numbers was 1900. The requirement for new teachers over that period, estimated as the sum of net loss of teachers and growth in employment of teachers, would therefore have been around 8400 a year. By contrast, the average number of graduates from initial education courses during the period 1989 to 1998 was 10 700 (refer Attachment 6) or just over 9000 a year (assuming that only 85 per cent enter the market). This is consistent with the reported build up of a surplus of teachers in the 1990s.
Although on a national basis teachers in the 1990s were broadly in surplus, the situation differed across States and Territories. As a generalisation, States which experienced lower than average teacher growth rates (South Australia, Victoria, Tasmania and the Australian Capital Territory) continued to have a substantial surpluses of teachers throughout the 1990s. By contrast, in those States where employment of teachers grew faster than average (New South Wales, Queensland, Western Australia and the Northern Territory), the stronger demand for teachers led to some tightening of the labour market for teachers in the second half of the 1990s.

Demand and supply of primary and secondary school teachers in Australia
21
PART B
THE TEACHER LABOUR MARKET IN 2000
Demand and supply of primary and secondary school teachers in Australia
22
Chapter 3
The state of the teacher labour market in Australia in 2000
This chapter discusses the current state of the teacher labour market at the national level and by State and Territory. The last section of the chapter provides information on recruitment measures taken by the State and Territory education authorities to deal with difficult-to-fill vacancies.
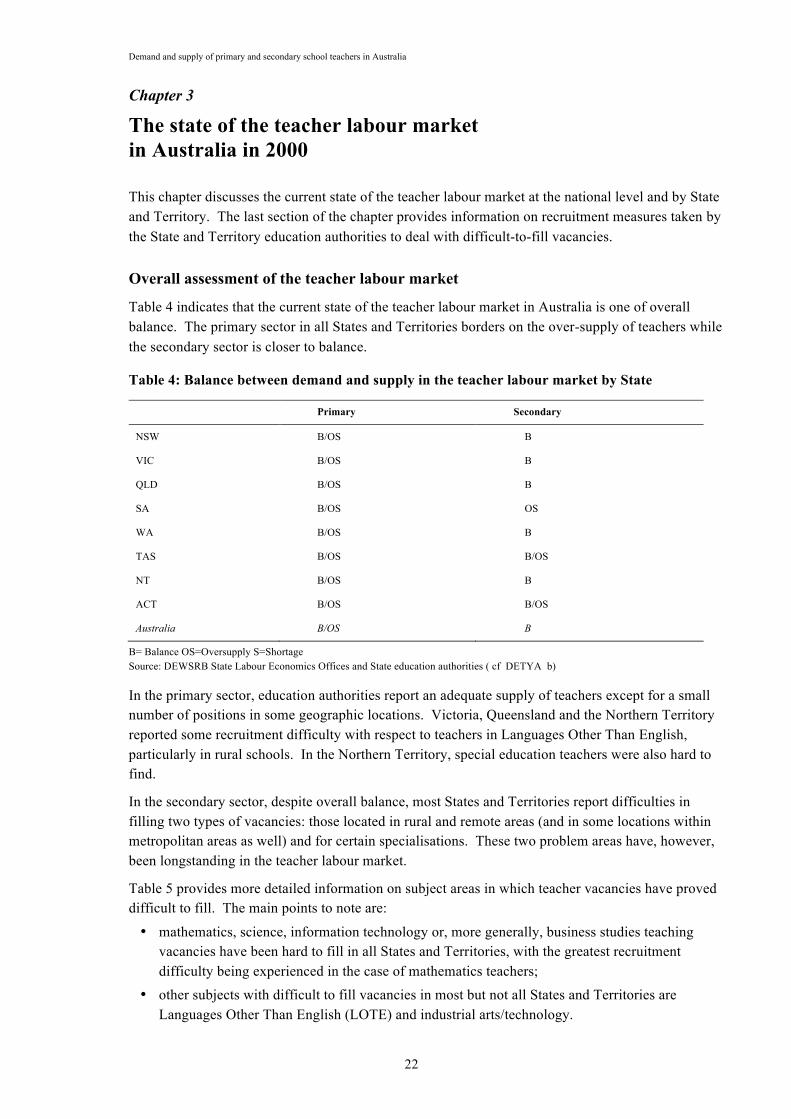
Overall assessment of the teacher labour market
Table 4 indicates that the current state of the teacher labour market in Australia is one of overall balance. The primary sector in all States and Territories borders on the over-supply of teachers while the secondary sector is closer to balance.
Table 4: Balance between demand and supply in the teacher labour market by State
Primary Secondary
NSW B/OS B
VIC B/OS B
QLD B/OS B
SA B/OS OS
WA B/OS B
TAS B/OS B/OS
NT B/OS B
ACT B/OS B/OS
Australia B/OS B
B= Balance OS=Oversupply S=Shortage Source: DEWSRB State Labour Economics Offices and State education authorities ( cf DETYA b)
In the primary sector, education authorities report an adequate supply of teachers except for a small number of positions in some geographic locations. Victoria, Queensland and the Northern Territory reported some recruitment difficulty with respect to teachers in Languages Other Than English, particularly in rural schools. In the Northern Territory, special education teachers were also hard to find.
In the secondary sector, despite overall balance, most States and Territories report difficulties in filling two types of vacancies: those located in rural and remote areas (and in some locations within metropolitan areas as well) and for certain specialisations. These two problem areas have, however, been longstanding in the teacher labour market.
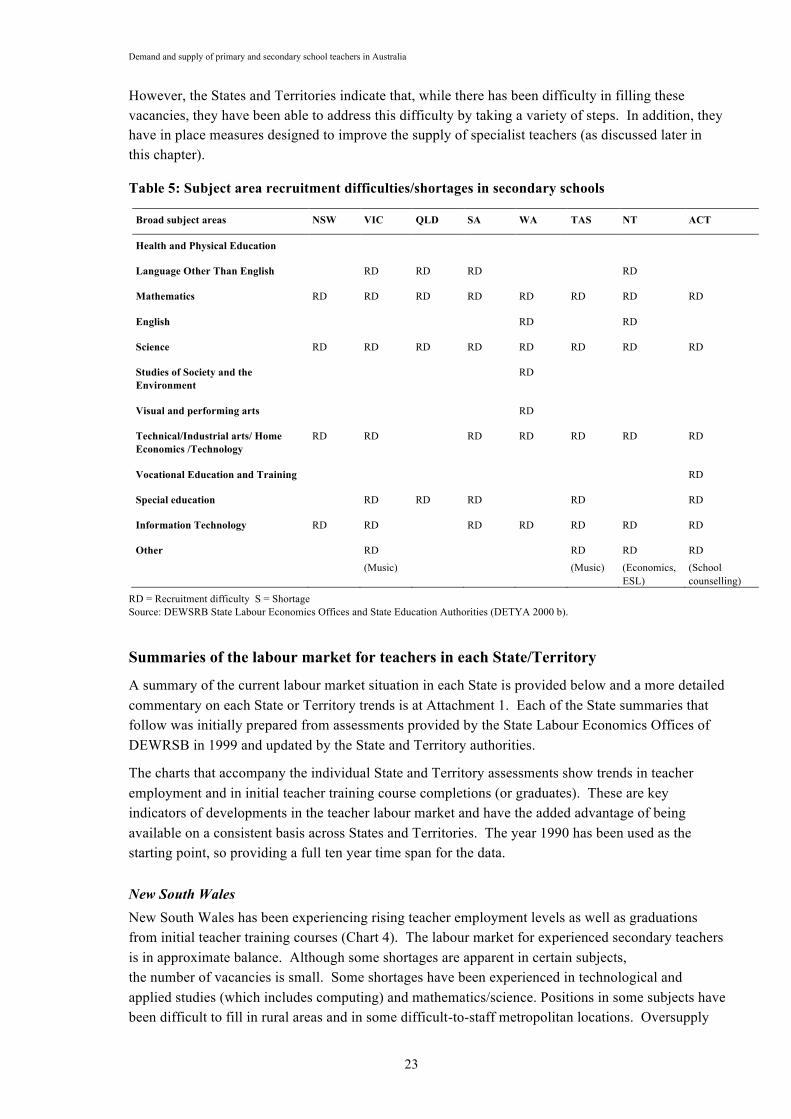
Table 5 provides more detailed information on subject areas in which teacher vacancies have proved difficult to fill. The main points to note are:
mathematics, science, information technology or, more generally, business studies teaching vacancies have been hard to fill in all States and Territories, with the greatest recruitment difficulty being experienced in the case of mathematics teachers;
other subjects with difficult to fill vacancies in most but not all States and Territories are Languages Other Than English (LOTE) and industrial arts/technology.
Demand and supply of primary and secondary school teachers in Australia
23
However, the States and Territories indicate that, while there has been difficulty in filling these vacancies, they have been able to address this difficulty by taking a variety of steps. In addition, they have in place measures designed to improve the supply of specialist teachers (as discussed later in this chapter).
Table 5: Subject area recruitment difficulties/shortages in secondary schools
Broad subject areas NSW VIC QLD SA WA TAS NT ACT
Health and Physical Education
Language Other Than English RD RD RD RD
Mathematics RD RD RD RD RD RD RD RD
English RD RD
Science RD RD RD RD RD RD RD RD
Studies of Society and the Environment
RD
Visual and performing arts RD
Technical/Industrial arts/ Home Economics /Technology
RD RD RD RD RD RD RD
Vocational Education and Training RD
Special education RD RD RD RD RD
Information Technology RD RD RD RD RD RD RD
Other RD (Music)
RD (Music)
RD (Economics, ESL)
RD (School counselling)
RD = Recruitment difficulty S = Shortage Source: DEWSRB State Labour Economics Offices and State Education Authorities (DETYA 2000 b).
Summaries of the labour market for teachers in each State/Territory
A summary of the current labour market situation in each State is provided below and a more detailed commentary on each State or Territory trends is at Attachment 1. Each of the State summaries that follow was initially prepared from assessments provided by the State Labour Economics Offices of DEWRSB in 1999 and updated by the State and Territory authorities.
The charts that accompany the individual State and Territory assessments show trends in teacher employment and in initial teacher training course completions (or graduates). These are key indicators of developments in the teacher labour market and have the added advantage of being available on a consistent basis across States and Territories. The year 1990 has been used as the starting point, so providing a full ten year time span for the data.
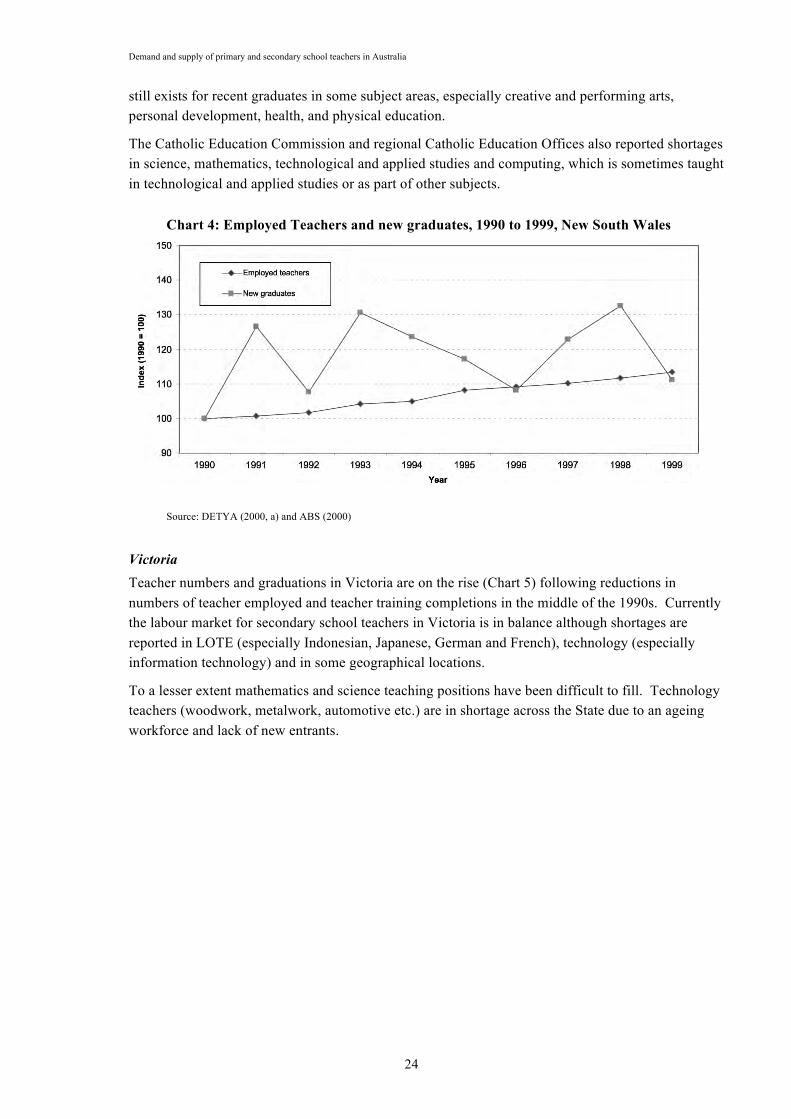
New South Wales New South Wales has been experiencing rising teacher employment levels as well as graduations from initial teacher training courses (Chart 4). The labour market for experienced secondary teachers is in approximate balance. Although some shortages are apparent in certain subjects, the number of vacancies is small. Some shortages have been experienced in technological and applied studies (which includes computing) and mathematics/science. Positions in some subjects have been difficult to fill in rural areas and in some difficult-to-staff metropolitan locations. Oversupply
Demand and supply of primary and secondary school teachers in Australia
24
still exists for recent graduates in some subject areas, especially creative and performing arts, personal development, health, and physical education.
The Catholic Education Commission and regional Catholic Education Offices also reported shortages in science, mathematics, technological and applied studies and computing, which is sometimes taught in technological and applied studies or as part of other subjects.
Chart 4: Employed Teachers and new graduates, 1990 to 1999, New South Wales
Source: DETYA (2000, a) and ABS (2000)
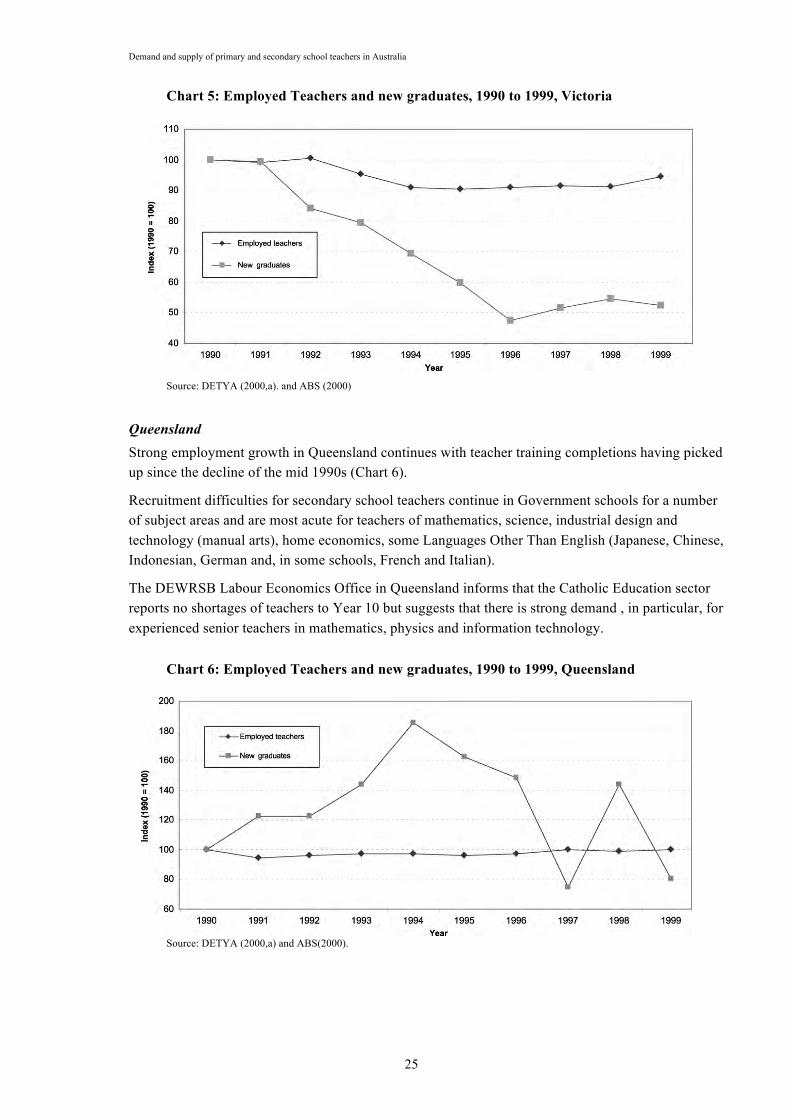
Victoria Teacher numbers and graduations in Victoria are on the rise (Chart 5) following reductions in numbers of teacher employed and teacher training completions in the middle of the 1990s. Currently the labour market for secondary school teachers in Victoria is in balance although shortages are reported in LOTE (especially Indonesian, Japanese, German and French), technology (especially information technology) and in some geographical locations.
To a lesser extent mathematics and science teaching positions have been difficult to fill. Technology teachers (woodwork, metalwork, automotive etc.) are in shortage across the State due to an ageing workforce and lack of new entrants.
Demand and supply of primary and secondary school teachers in Australia
25
Chart 5: Employed Teachers and new graduates, 1990 to 1999, Victoria
Source: DETYA (2000,a). and ABS (2000)
Queensland Strong employment growth in Queensland continues with teacher training completions having picked up since the decline of the mid 1990s (Chart 6).
Recruitment difficulties for secondary school teachers continue in Government schools for a number of subject areas and are most acute for teachers of mathematics, science, industrial design and technology (manual arts), home economics, some Languages Other Than English (Japanese, Chinese, Indonesian, German and, in some schools, French and Italian).
The DEWRSB Labour Economics Office in Queensland informs that the Catholic Education sector reports no shortages of teachers to Year 10 but suggests that there is strong demand , in particular, for experienced senior teachers in mathematics, physics and information technology.
Chart 6: Employed Teachers and new graduates, 1990 to 1999, Queensland
Source: DETYA (2000,a) and ABS(2000).

Demand and supply of primary and secondary school teachers in Australia
26
South Australia Employment levels in South Australia have been static reflecting the trend in student numbers and there has been a significant winding down of overall teacher training completions in the 1990s (Chart 7). While in aggregate the supply of secondary school teachers exceeds demand, the Department of Education, Training and Employment and, to a lesser extent, the non-government schools are experiencing difficulties in filling some vacancies.
Recruitment difficulties are usually due to location or conditions of employment i.e. non-metropolitan area and contract or part-time positions respectively, but there are also problems with some subject areas including English, mathematics, specific science subjects (chemistry, biology etc.), computing & information technology, commerce subjects (economics, accounting and legal), humanities subjects (art, music, drama), physical education and religious education.
Chart 7: Employed Teachers and new graduates, 1990 to 1999, South Australia
Source: DETYA (2000,a) and ABS (2000)
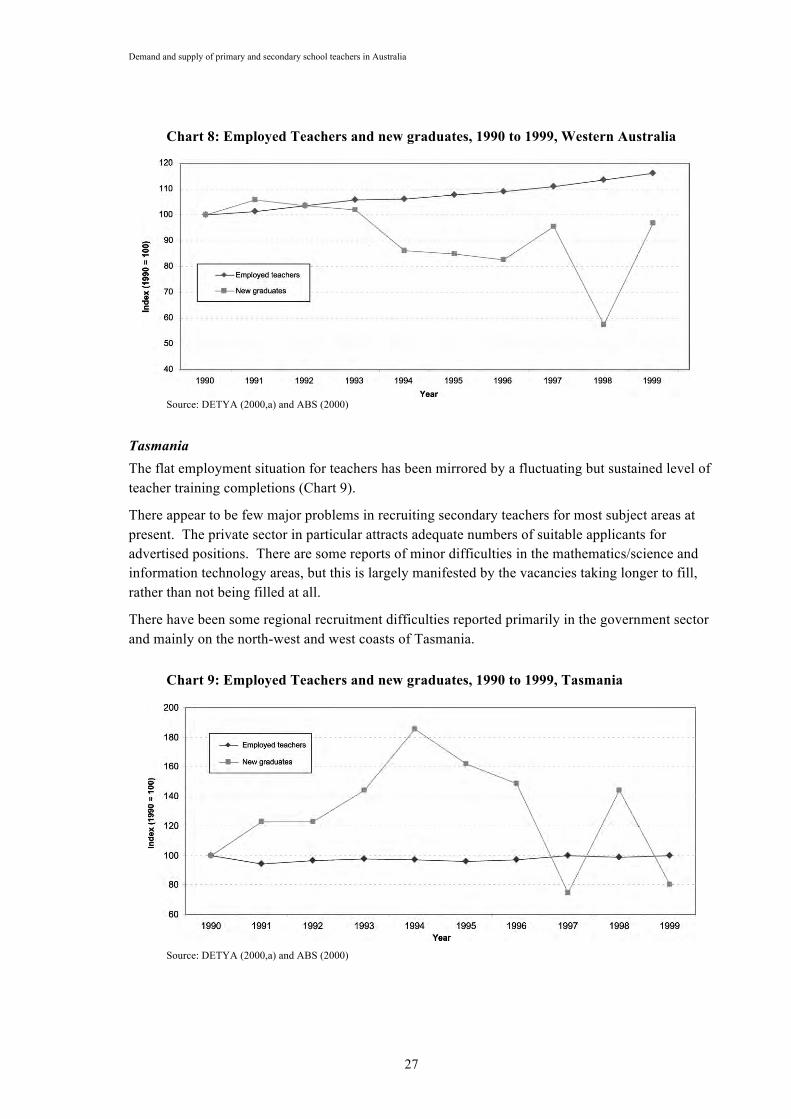
Western Australia Employment has continued to expand in Western Australia and overall teacher training completions have been fairly much sustained (Chart 8). Whilst the overall labour market for secondary school teachers in Western Australia is one of balance, there are some difficulties in filling positions for mathematics, science (physics and chemistry), technology and enterprise, and home economics, largely in country areas.
The Western Australian Education Department considered positions in the Goldfields and the Pilbara have been the most difficult to fill during 1999. Generally the further schools are from Perth and other larger population centres, the greater the likelihood of recruitment difficulties.
Demand and supply of primary and secondary school teachers in Australia
27
Chart 8: Employed Teachers and new graduates, 1990 to 1999, Western Australia
Source: DETYA (2000,a) and ABS (2000)
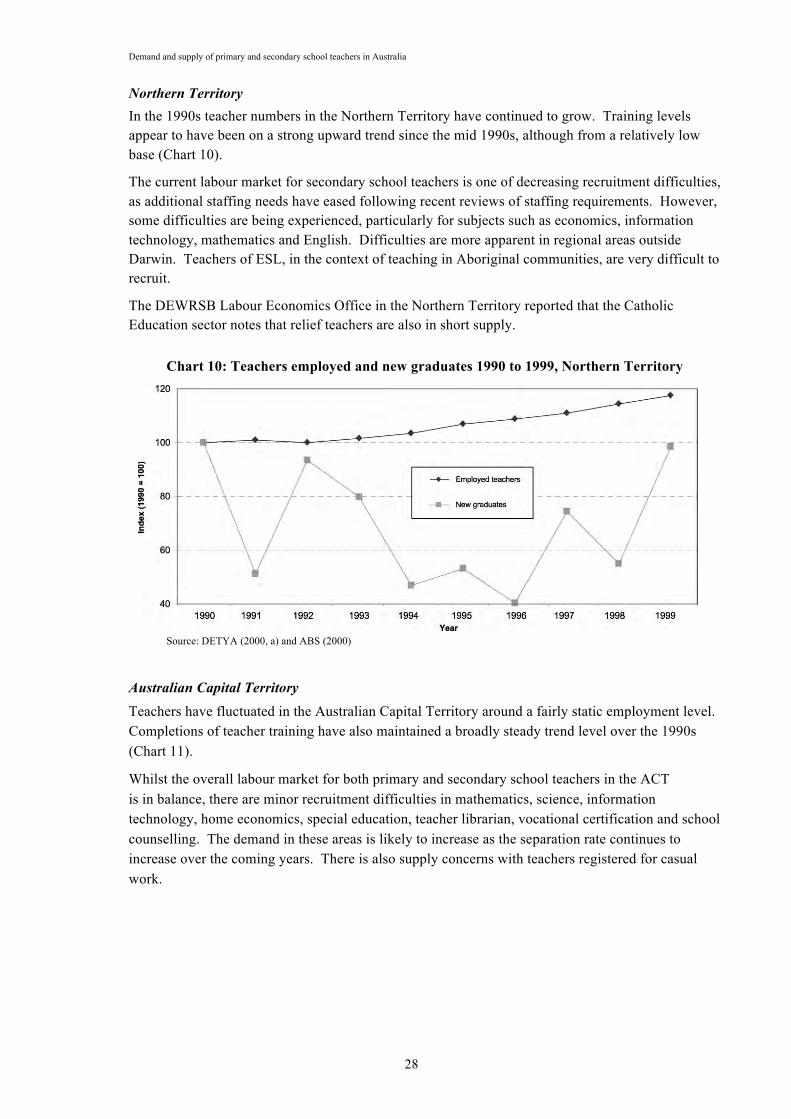
Tasmania The flat employment situation for teachers has been mirrored by a fluctuating but sustained level of teacher training completions (Chart 9).
There appear to be few major problems in recruiting secondary teachers for most subject areas at present. The private sector in particular attracts adequate numbers of suitable applicants for advertised positions. There are some reports of minor difficulties in the mathematics/science and information technology areas, but this is largely manifested by the vacancies taking longer to fill, rather than not being filled at all.
There have been some regional recruitment difficulties reported primarily in the government sector and mainly on the north-west and west coasts of Tasmania.
Chart 9: Employed Teachers and new graduates, 1990 to 1999, Tasmania
Source: DETYA (2000,a) and ABS (2000)
Demand and supply of primary and secondary school teachers in Australia
28
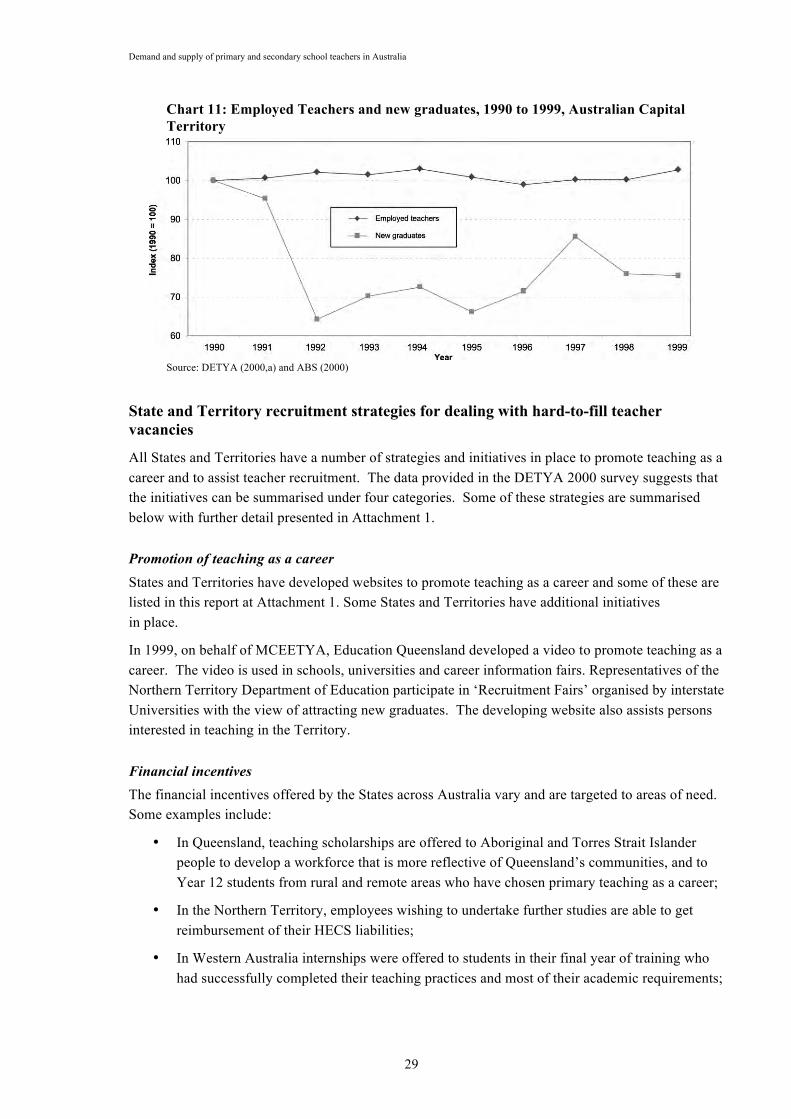
Northern Territory In the 1990s teacher numbers in the Northern Territory have continued to grow. Training levels appear to have been on a strong upward trend since the mid 1990s, although from a relatively low base (Chart 10).
The current labour market for secondary school teachers is one of decreasing recruitment difficulties, as additional staffing needs have eased following recent reviews of staffing requirements. However, some difficulties are being experienced, particularly for subjects such as economics, information technology, mathematics and English. Difficulties are more apparent in regional areas outside Darwin. Teachers of ESL, in the context of teaching in Aboriginal communities, are very difficult to recruit.
The DEWRSB Labour Economics Office in the Northern Territory reported that the Catholic Education sector notes that relief teachers are also in short supply.
Chart 10: Teachers employed and new graduates 1990 to 1999, Northern Territory
Source: DETYA (2000, a) and ABS (2000)
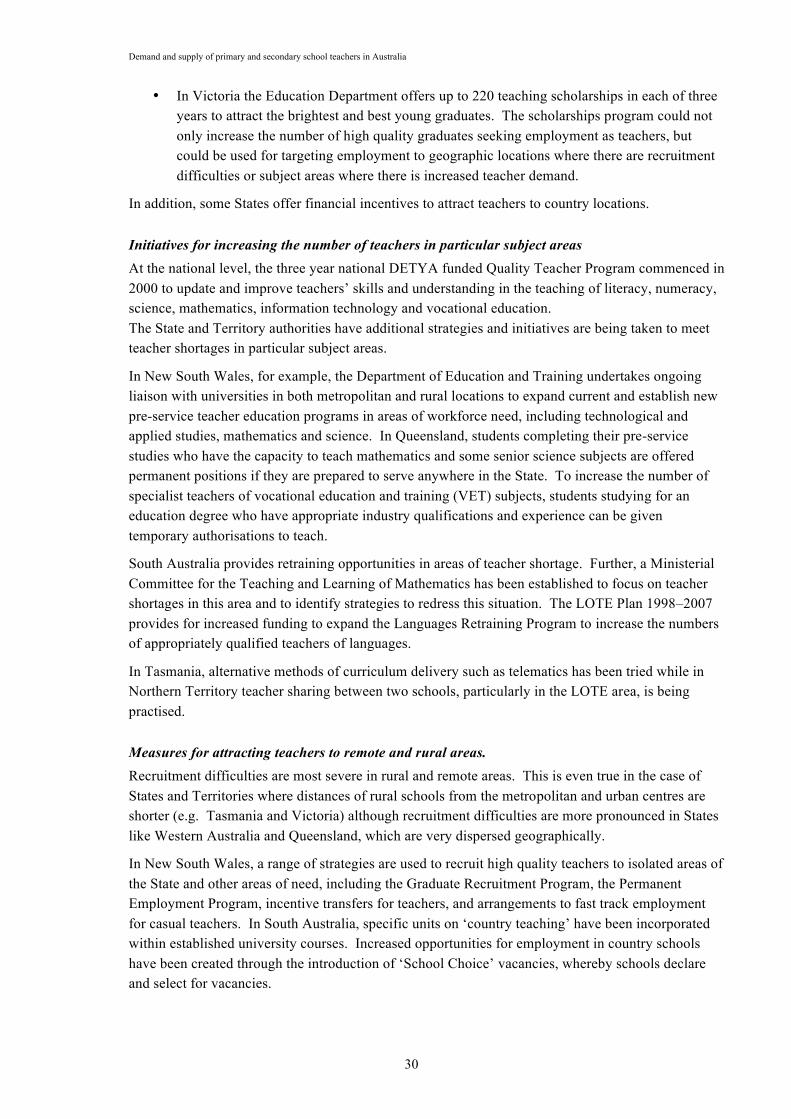
Australian Capital Territory Teachers have fluctuated in the Australian Capital Territory around a fairly static employment level. Completions of teacher training have also maintained a broadly steady trend level over the 1990s (Chart 11).
Whilst the overall labour market for both primary and secondary school teachers in the ACT is in balance, there are minor recruitment difficulties in mathematics, science, information technology, home economics, special education, teacher librarian, vocational certification and school counselling. The demand in these areas is likely to increase as the separation rate continues to increase over the coming years. There is also supply concerns with teachers registered for casual work.
Demand and supply of primary and secondary school teachers in Australia
29
Chart 11: Employed Teachers and new graduates, 1990 to 1999, Australian Capital Territory
Source: DETYA (2000,a) and ABS (2000)
State and Territory recruitment strategies for dealing with hard-to-fill teacher vacancies
All States and Territories have a number of strategies and initiatives in place to promote teaching as a career and to assist teacher recruitment. The data provided in the DETYA 2000 survey suggests that the initiatives can be summarised under four categories. Some of these strategies are summarised below with further detail presented in Attachment 1.
Promotion of teaching as a career States and Territories have developed websites to promote teaching as a career and some of these are listed in this report at Attachment 1. Some States and Territories have additional initiatives in place.
In 1999, on behalf of MCEETYA, Education Queensland developed a video to promote teaching as a career. The video is used in schools, universities and career information fairs. Representatives of the Northern Territory Department of Education participate in ‘Recruitment Fairs’ organised by interstate Universities with the view of attracting new graduates. The developing website also assists persons interested in teaching in the Territory.
Financial incentives The financial incentives offered by the States across Australia vary and are targeted to areas of need. Some examples include:
In Queensland, teaching scholarships are offered to Aboriginal and Torres Strait Islander people to develop a workforce that is more reflective of Queensland’s communities, and to Year 12 students from rural and remote areas who have chosen primary teaching as a career;
In the Northern Territory, employees wishing to undertake further studies are able to get reimbursement of their HECS liabilities;
In Western Australia internships were offered to students in their final year of training who had successfully completed their teaching practices and most of their academic requirements;
Demand and supply of primary and secondary school teachers in Australia
30
In Victoria the Education Department offers up to 220 teaching scholarships in each of three years to attract the brightest and best young graduates. The scholarships program could not only increase the number of high quality graduates seeking employment as teachers, but could be used for targeting employment to geographic locations where there are recruitment difficulties or subject areas where there is increased teacher demand.
In addition, some States offer financial incentives to attract teachers to country locations.
Initiatives for increasing the number of teachers in particular subject areas At the national level, the three year national DETYA funded Quality Teacher Program commenced in 2000 to update and improve teachers’ skills and understanding in the teaching of literacy, numeracy, science, mathematics, information technology and vocational education. The State and Territory authorities have additional strategies and initiatives are being taken to meet teacher shortages in particular subject areas.
In New South Wales, for example, the Department of Education and Training undertakes ongoing liaison with universities in both metropolitan and rural locations to expand current and establish new pre-service teacher education programs in areas of workforce need, including technological and applied studies, mathematics and science. In Queensland, students completing their pre-service studies who have the capacity to teach mathematics and some senior science subjects are offered permanent positions if they are prepared to serve anywhere in the State. To increase the number of specialist teachers of vocational education and training (VET) subjects, students studying for an education degree who have appropriate industry qualifications and experience can be given temporary authorisations to teach.
South Australia provides retraining opportunities in areas of teacher shortage. Further, a Ministerial Committee for the Teaching and Learning of Mathematics has been established to focus on teacher shortages in this area and to identify strategies to redress this situation. The LOTE Plan 1998–2007 provides for increased funding to expand the Languages Retraining Program to increase the numbers of appropriately qualified teachers of languages.
In Tasmania, alternative methods of curriculum delivery such as telematics has been tried while in Northern Territory teacher sharing between two schools, particularly in the LOTE area, is being practised.
Measures for attracting teachers to remote and rural areas. Recruitment difficulties are most severe in rural and remote areas. This is even true in the case of States and Territories where distances of rural schools from the metropolitan and urban centres are shorter (e.g. Tasmania and Victoria) although recruitment difficulties are more pronounced in States like Western Australia and Queensland, which are very dispersed geographically.
In New South Wales, a range of strategies are used to recruit high quality teachers to isolated areas of the State and other areas of need, including the Graduate Recruitment Program, the Permanent Employment Program, incentive transfers for teachers, and arrangements to fast track employment for casual teachers. In South Australia, specific units on ‘country teaching’ have been incorporated within established university courses. Increased opportunities for employment in country schools have been created through the introduction of ‘School Choice’ vacancies, whereby schools declare and select for vacancies.

Demand and supply of primary and secondary school teachers in Australia
31
In Western Australia, most vacancies are in rural or remote locations. The Remote Teaching Service has been successful in recruiting new graduates and experienced teachers into these locations. In 1998 a country incentives package was introduced to assist teachers prepared to teach in these locations.
Demand and supply of primary and secondary school teachers in Australia
32
Chapter 4
The state of the teacher labour market in selected overseas countries
In order to place the Australian teacher labour market in a broader context, this chapter provides a short review of the state of the teacher labour market in four English speaking countries – the UK, the USA, New Zealand and Canada – whose teacher labour market arrangements are similar to those in Australia. Information from other countries, while useful, are more difficult to obtain.
United Kingdom
In the UK the annual school-based Survey of Teacher Vacancies provides information on vacancies by type of school, region and subject area. The survey results are published by the Department for Employment and Education (DfEE).
An important measure derived from this survey is the “vacancy rate” which is the ratio of vacancies to the number of permanent full-time teachers employed. The survey results do not refer to shortages as such but recruitment difficulties can be expected to be greater when the vacancy rate is high.
Between 1995 and 2000 the overall vacancy rate more than doubled from 0.3 per cent to 0.7 per cent. It rose for all subject areas, with the highest vacancy rates being in four subject areas: mathematics, computer studies, languages other than French and German, and craft, design and technology. These subject areas are also those where recruitment fell short of the target by the greatest margin.
Vacancy rates were also higher in some geographical areas than others. London and the South East areas have consistently experienced high vacancy rates over time.
The study of the UK teacher labour market by Straker (1991), while somewhat dated, noted that in subject areas of recruitment difficulty such as mathematics, physics and craft, design and technology, many teachers did not have specialist qualifications in their subject area. He used the term “hidden shortage” to describe this situation. Currently some subject areas in the UK could fall in this category.
The UK Government has taken a number of steps to address these recruitment difficulties and the details are available on the DfEE website at www.dfee.gov.uk. These initiatives include:
The Teacher Training Agency, established in 1994, which promotes teaching as a profession and sets out to raise the standard of teaching and the quality of teacher training courses;
Financial incentives to encourage the take-up of teacher training especially in areas of high demand. These incentives include the waiving of tuition fees for postgraduate certificate of education courses; and the provision of an incentive payment (of 5000 pounds) for those who take up teaching in mathematics and science;
Encouragement of mature individuals to enter teacher training by offering them employment as “unqualified teachers” while they are training by way of an individualised training programme. The school receives an incentive payment of 2000 pounds to cover the costs of the training; and
Refresher courses for returners to teaching, including help with childcare, and a welcome back bonus for qualified teachers who have been out of teaching for more than a year and return to the profession.
Demand and supply of primary and secondary school teachers in Australia
33
While immigration is not cited as a measure adopted by the UK Government for increasing its supply of teachers, reports have appeared in the Australian media about recruitment agencies hiring teachers in Australia for UK schools. The extent of this is difficult to gauge.
The recruitment difficulties in the London region have led to the Government instituting a special recruitment strategy for that area. This is described at www.teachers4london.com.
United States of America
The most authoritative information on teacher demand supply comes from the Schools and Staffing Survey (SASS) conducted on behalf of the National Centre for Education Statistics (NCES). The survey covers public and private schools and has components providing information about teacher demand and shortages, the view of schools principals and of teachers, and data on the school and school district. The information is published by the NCES on their web site http://nces.ed.gov.
Analysis of these data has not produced a general consensus in the USA about the extent of teacher recruitment difficulty. However, the most comprehensive and widely quoted study on this issue What Matters Most: Teaching for America’s Future published by the National Commission on Teaching and America’s Future (NCT&AF) in 1996, stated that recurring shortages of teachers have characterised the US labour market for most of the 20th century. According to that report, shortages as measured by the vacancy rate and more qualitative measures of recruitment difficulty, were most pronounced in 1996 in bilingual education, special education, physics, chemistry, mathematics and computer science. Black American teachers were also particularly highly sought after. Shortages were most severe in the poorest districts.
Individual States in the USA have the responsibility for addressing teacher demand and supply but information on the State measures taken are difficult to assemble. The federal government also assists schools in “approved teacher shortage areas” to meet their recruitment needs but its efforts are mainly directed at improving the overall quality of teachers. This emphasis seems to reflect the finding from the NCT&AF that upward of 27 per cent of all new teachers lacked a “proper licence” in their teaching field. In 1997 the federal government provided $350m to recruit new teachers in the neediest areas, especially in rural and poor urban neighbourhoods.
New Zealand
New Zealand has a rich data source on teachers and teacher movements, including in and out of teaching and between schools. This is derived from their annual surveys of schools conducted by the Ministry of Education.
During the 1990s New Zealand experienced teacher shortages in primary schools due to the sharp rise in student enrolments associated with a “demographic bulge” centred around the early years of schooling. This group of young people are now of secondary school age and some teacher shortages in the secondary sector are expected in the early years of the current decade.
Currently teachers in the primary sector are in over supply. In the secondary sector, teachers of mathematics, science, technology, information and communications technology are in great demand and so are teachers from Tereo, Maori and Pacific Islander backgrounds.
New Zealand has been active in assisting the growth in the supply of teachers which as a result increased markedly in the 1990s. Some of the key measures have included:
A nationwide program of TV advertising to boost the profile of teaching;
Demand and supply of primary and secondary school teachers in Australia
34
A $10 000 scholarship paid to those commencing a teacher training course in subjects in high demand;
Funding schools to build up a pool of relief teachers;
Retraining of teachers who have been out of teaching for some years, with preference given to those qualified in “shortage” specialisations;
A national relocation grant for teachers moving into priority teaching positions and a recruitment bonus to schools which take on these teachers. Teachers coming to New Zealand also qualify for an international relocation grant; and
A grant for persons returning to a full-time position after an absence of 3 years or more;
Further details are available on the website www.teachnz.govt.nz.
Canada
There is not the same depth of coverage and quality of information on teacher shortages in Canada as in the other three countries discussed above. There also appears to be a lack of official sources of information at the national level.
The most recent analysis of the teacher labour market was commissioned by the Canadian Teachers’ Federation in 2000. In its report the Federation claimed that schools in Canada face acute teacher shortages, especially in science, chemistry, biology and physics. Speech therapists were also ranked as in short supply. Retaining teachers was perceived as a problem and schools in Newfoundland and the North West Territory all expected that recruitment difficulties would continue into the following year.
While now somewhat dated, a contrary view of the severity of teacher shortages in Canada was presented by Press (1997). His study of schools reveals that of the 136 school districts which responded to the survey, 98.5 per cent reported no teacher shortage and 92.4 per cent reported that they did not expect to have a teacher shortage in the next five years. Press concluded that in Canada there was a surplus of teachers which would continue for a few years.
Summary of teacher supply and demand in overseas countries
While the available evidence from the four English speaking countries is not of a consistent quality and currency, it appears that some teacher recruitment difficulties are being faced by all of them. These difficulties are mostly in areas such as mathematics, some sciences and languages, information technology and crafts and design. Rural areas and remote regions face greater difficulties and generally for a wider range of teachers. In North America and New Zealand teachers from minority backgrounds are also in short supply. The UK and New Zealand governments appear to be the most active in terms of initiatives to increase supply.

Demand and supply of primary and secondary school teachers in Australia
35
PART C
FUTURE OUTLOOK
Demand and supply of primary and secondary school teachers in Australia
36
This part of the report examines the outlook for the demand and supply of teachers in Australia over the period to 2003. This is the last year for which estimates of graduations can be based on actual commencements. The first two chapters of this part, Chapters 5 and 6, discuss the factors that need to be taken into account in estimating demand and supply of teachers respectively. Chapter 7 uses the framework developed in the previous two chapters to calculate estimates of demand and supply up to 2003.
No estimates are provided for the period post 2003. However, Chapter 8 explores a number of issues which are likely to have a significant impact on teacher supply and demand at least in the period immediately after 2003 and going towards 2010.
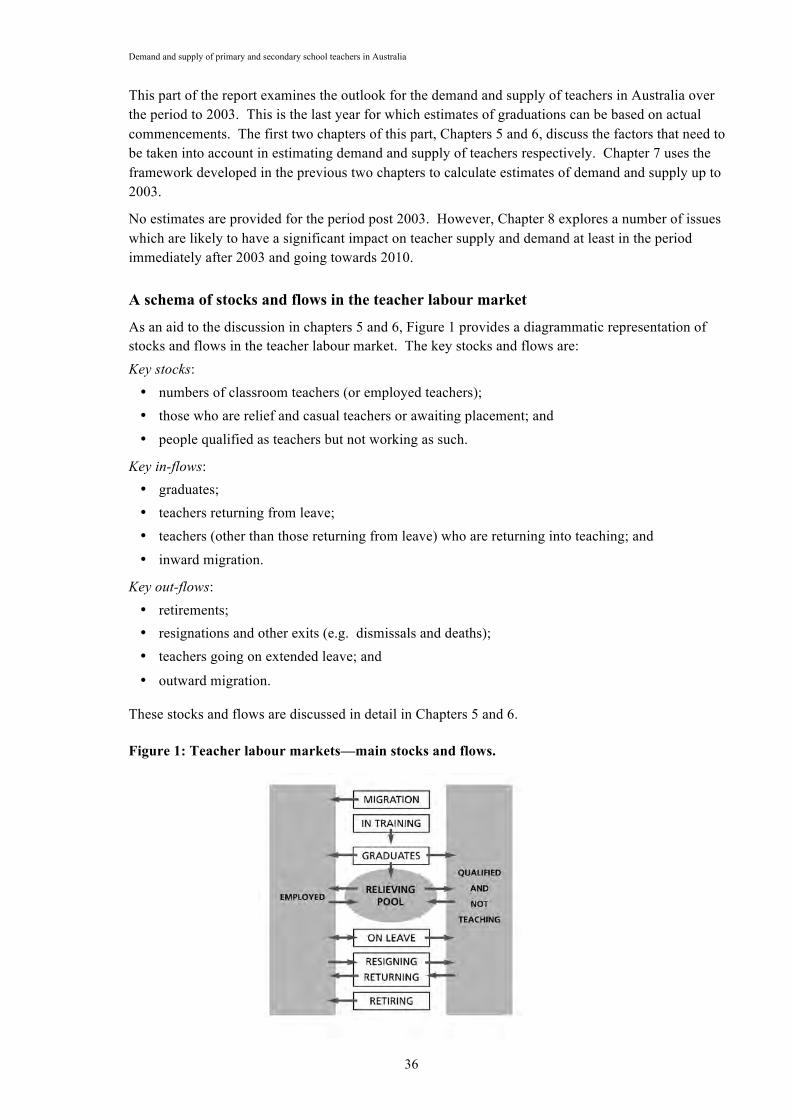
A schema of stocks and flows in the teacher labour market
As an aid to the discussion in chapters 5 and 6, Figure 1 provides a diagrammatic representation of stocks and flows in the teacher labour market. The key stocks and flows are: Key stocks:
numbers of classroom teachers (or employed teachers); those who are relief and casual teachers or awaiting placement; and
people qualified as teachers but not working as such.
Key in-flows: graduates; teachers returning from leave; teachers (other than those returning from leave) who are returning into teaching; and
inward migration.
Key out-flows: retirements; resignations and other exits (e.g. dismissals and deaths); teachers going on extended leave; and
outward migration.
These stocks and flows are discussed in detail in Chapters 5 and 6.
Figure 1: Teacher labour markets—main stocks and flows.
Demand and supply of primary and secondary school teachers in Australia
37
Chapter 5
Factors affecting the demand for teachers
Most of the annual requirement for teachers is met by teachers returning to the classroom who were employed in schools in the previous year. Each year, however, new teachers have to be found because some teachers leave and also because the requirement for teachers changes up or down due to a number of factors. Changes in requirements, generally upwards because of population increases, is referred to as ‘growth demand’ for teachers. Teachers leaving and needing to be replaced generates the replacement demand for teachers. These two together make up the demand for new teachers.
Growth demand for teachers
During the 1990s growth in the teaching workforce was of the order of 1.1 per cent a year. This was only slightly higher than during the previous decade (1.0 per cent a year).
The total number of teachers required and whether or not additional teachers are required depends on a number of factors. These include: the size of the school age population; participation rates at various ages and especially the retention rate to Year 12; the level of government and private funding of schools, and teacher and ancillary costs; and policies regarding class sizes and curricula (which can affect class sizes). These factors can be encapsulated in two variables which together determine the number of teachers:
enrolment levels; and
student to teacher ratios (STRs).
Between 1989 and 1999, enrolments grew and STRs generally declined. This combination led to a relatively strong growth in teacher employment, with the two factors reinforcing each other. The enrolment growth effect was stronger, with two-thirds of the teacher employment growth being due to the growth in enrolments and one-third to the decline in the STRs (DETYA estimates).
Enrolment trends Detailed enrolments changes in the last five years (1995 to 1999) are shown in Attachment 2. During this time, enrolments increased by 3.7 per cent, with secondary enrolments growing more strongly (5.1 per cent) than primary enrolments (2.8 per cent). Senior secondary school student enrolments grew faster (8.3 per cent) than junior secondary student enrolments (3.8 per cent). The strongest growth was experienced by secondary student enrolments in the non-government sector.
Student to teacher ratios Education authorities do not normally use STRs as targets to be achieved. Rather, the STRs are the outcome of decisions made by the education authorities and governments about curricula, learning outcomes and the allocation of resources. However, the STR is useful for projection purposes because it captures all of these factors in a single indicator.
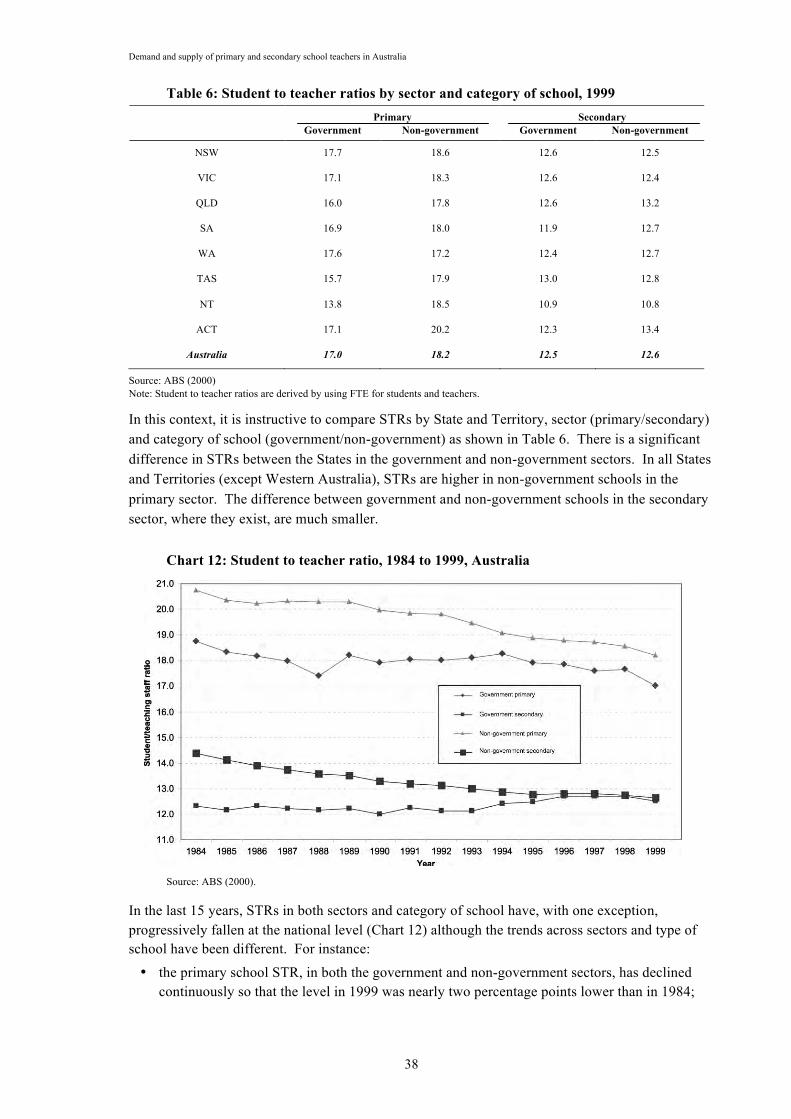
Demand and supply of primary and secondary school teachers in Australia
38
Table 6: Student to teacher ratios by sector and category of school, 1999 Primary Secondary Government Non-government Government Non-government
NSW 17.7 18.6 12.6 12.5
VIC 17.1 18.3 12.6 12.4
QLD 16.0 17.8 12.6 13.2
SA 16.9 18.0 11.9 12.7
WA 17.6 17.2 12.4 12.7
TAS 15.7 17.9 13.0 12.8
NT 13.8 18.5 10.9 10.8
ACT 17.1 20.2 12.3 13.4
Australia 17.0 18.2 12.5 12.6
Source: ABS (2000) Note: Student to teacher ratios are derived by using FTE for students and teachers.
In this context, it is instructive to compare STRs by State and Territory, sector (primary/secondary) and category of school (government/non-government) as shown in Table 6. There is a significant difference in STRs between the States in the government and non-government sectors. In all States and Territories (except Western Australia), STRs are higher in non-government schools in the primary sector. The difference between government and non-government schools in the secondary sector, where they exist, are much smaller.
Chart 12: Student to teacher ratio, 1984 to 1999, Australia
Source: ABS (2000).
In the last 15 years, STRs in both sectors and category of school have, with one exception, progressively fallen at the national level (Chart 12) although the trends across sectors and type of school have been different. For instance:
the primary school STR, in both the government and non-government sectors, has declined continuously so that the level in 1999 was nearly two percentage points lower than in 1984;
Demand and supply of primary and secondary school teachers in Australia
39
the secondary school STR for government and non-government schools declined to 1994 but the government secondary STR then rose for a few years before falling again in 1999. As a result in 1999 the government secondary STR was higher than at the beginning of the decade; and
the non-government school STRs have declined at a faster rate than the government STR.
The fall in the STRs over time has had the effect of increasing the demand for teachers above what they would be with steady STRs. For example, if STRs were the same in 1999 as they were ten years earlier, there would be a need for eight per cent fewer teachers in the primary sector.
Replacement demand for teachers
Replacement demand arises because of losses to the teaching service or teaching jurisdiction from retirements, resignations and absences due to leave. The sum of these components is referred to technically as total separations.
Assessment of annual replacement demand relative to growth demand shows that replacement demand has generally been the major source of demand for teachers. In the government sector, (gross) annual separations have been in the range of 3-5 per cent of the teaching workforce per year, and in some years higher. By contrast, growth demand has tended to average slightly more than 1 per cent a year. A separation rate of 3-5 per cent of the current teaching workforce (of 215 000) represents the need to replace between 6450 and 10 750 teachers a year.
Separation rates vary by State, sector and type of school; by the demographic composition of the teaching workforce; and by conditions in the teaching workforce relative to the wider economy. These are discussed further below.
Teachers separating from teaching There has been some confusion in the literature on what does and does not constitute separation from teaching. This has sometimes led to misleading assessments of the replacement demand for teachers. The two major sources of confusion are, first, which components of separation should be included and, second, whether total separations measured are ‘gross’ or ‘net’ (i.e. include returning teachers or not).
In preparing this report States and Territories were asked to provide information on every year between 1995 and 1999 on the following categories of (gross) separation:
Age retirement.
Resignations which includes: leaving teaching; leaving to take up a position in another teaching jurisdiction or overseas; leaving but intends to continue as a relief, casual or emergency teacher; leaving the workforce to travel, look after children, etc; leaving for personal reasons; taking a Voluntary separation package; leaving for other reasons.
Redundancy.
Contract expired (and not renewed).
Going on extended leave of at least one term duration.
Other.
Demand and supply of primary and secondary school teachers in Australia
40
The data provided by the education authorities form the basis for estimating the extent of separations and the relative importance of the various categories.
Categories of separation and their importance Redundancy has played a small part in teacher separations in recent years and then only in some States.
Contract teachers are a significant part of the teaching workforce in some States, like Victoria and Western Australia, where contract teaching has been an established institutional arrangement especially for new teachers. In these instances, contract teachers were used both to fill in for teachers going on leave and to occupy an on-going position. In most States, however, only teachers going on leave are backfilled from the casual teaching labour force. These casual teachers may be employed on contract for the period of the break or, most often, as a casual for the entire period. For these reasons, contract teacher separations can be quite numerous.2
Resignations can occur for a number of reasons and not all are associated with moves out of teaching. Some resignations actually involve teachers moving from one education system to another or from one State to another, as discussed in more detail in Chapter 5.
Research indicates that resignations out of teaching are affected significantly by the state of the economy and the characteristics of the teaching labour force. During the recession of the early 1990s resignations fell and this was ascribed largely to the reduced opportunities for other employment in the labour market (Burke 1994). When this happens, other teachers, who may have wished to take some time off teaching with the intention of re-entering at a later date, may be deterred from doing so, knowing that in the future opportunities for re-entering may be curtailed if fewer teachers resign. As a corollary, resignation rates tend to rise when the general labour market conditions, such as low unemployment rates, favour job seekers.
There are also indications that resignations are more common for younger male teachers in the early part of their careers, say to the age of 35 years or so. After this age teachers have reached a reasonable level of seniority in the school system and may find it more difficult to secure jobs with similar pay and conditions outside teaching. In addition, teachers may not wish to relinquish superannuation benefits they have accrued. It has been suggested that the older age distribution of the teaching workforce has reduced separation levels, which may provide an explanation for the fairly low current levels of separation noted in this report.
Age retirement depends on the age distribution of teachers, their retirement intentions and superannuation arrangements. Table 7 provides data on retirement, resignations and other forms of separations (other than leave of absence) for permanent teachers in government schools. These data show that:
retirements have not have been as important a reason for separations among the teaching profession as resignations. As discussed in greater detail in Chapter 8, this relationship could change in the future because of the rapid ageing of the teaching workforce: and
while retirement rates are not too different in the primary and secondary government sectors, the resignation rates have been higher in the secondary sector. This is the major reason for the higher separation rates in the secondary compared to the primary government sector.
2 In Victoria the standard mode of employment for teachers now is ongoing except where the position is
genuinely of a fixed-term nature.
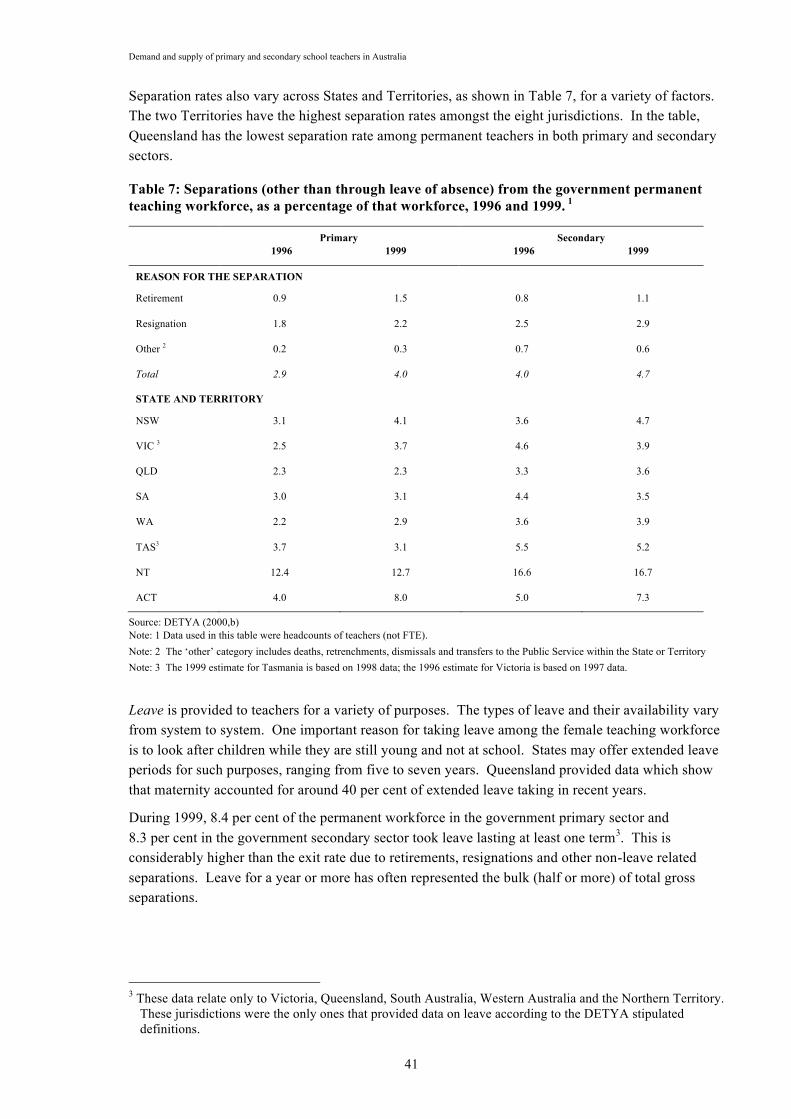
Demand and supply of primary and secondary school teachers in Australia
41
Separation rates also vary across States and Territories, as shown in Table 7, for a variety of factors. The two Territories have the highest separation rates amongst the eight jurisdictions. In the table, Queensland has the lowest separation rate among permanent teachers in both primary and secondary sectors.
Table 7: Separations (other than through leave of absence) from the government permanent teaching workforce, as a percentage of that workforce, 1996 and 1999. 1
Primary 1996 1999
Secondary 1996 1999
REASON FOR THE SEPARATION
Retirement 0.9 1.5 0.8 1.1
Resignation 1.8 2.2 2.5 2.9
Other 2 0.2 0.3 0.7 0.6
Total 2.9 4.0 4.0 4.7
STATE AND TERRITORY
NSW 3.1 4.1 3.6 4.7
VIC 3 2.5 3.7 4.6 3.9
QLD 2.3 2.3 3.3 3.6
SA 3.0 3.1 4.4 3.5
WA 2.2 2.9 3.6 3.9
TAS3 3.7 3.1 5.5 5.2
NT 12.4 12.7 16.6 16.7
ACT 4.0 8.0 5.0 7.3
Source: DETYA (2000,b) Note: 1 Data used in this table were headcounts of teachers (not FTE). Note: 2 The ‘other’ category includes deaths, retrenchments, dismissals and transfers to the Public Service within the State or Territory Note: 3 The 1999 estimate for Tasmania is based on 1998 data; the 1996 estimate for Victoria is based on 1997 data.
Leave is provided to teachers for a variety of purposes. The types of leave and their availability vary from system to system. One important reason for taking leave among the female teaching workforce is to look after children while they are still young and not at school. States may offer extended leave periods for such purposes, ranging from five to seven years. Queensland provided data which show that maternity accounted for around 40 per cent of extended leave taking in recent years.
During 1999, 8.4 per cent of the permanent workforce in the government primary sector and 8.3 per cent in the government secondary sector took leave lasting at least one term3. This is considerably higher than the exit rate due to retirements, resignations and other non-leave related separations. Leave for a year or more has often represented the bulk (half or more) of total gross separations.
3 These data relate only to Victoria, Queensland, South Australia, Western Australia and the Northern Territory.
These jurisdictions were the only ones that provided data on leave according to the DETYA stipulated definitions.
Demand and supply of primary and secondary school teachers in Australia
42
Estimate of net separations from the government sector The findings of the DETYA 2000 survey and other studies suggest that typically in the government sector:
around 8 per cent of teachers go on leave each year. However, while some teachers go on leave others return. It can be expected that some teachers going on leave will resign while they are on leave, so that there will be a net loss of teachers through this process. Data from the States and Territories indicates that separations arising from (net) leave movements have been in the vicinity of 2 per cent a year;
resignations fluctuate over the business cycle and across States, with the rate being somewhere between 2 and 4 per cent a year. A commonly accepted rate for the average resignation rate is 2 per cent a year and, as Table 7 shows, it is on the lower side for primary and on the higher side for secondary;
in the 1990s retirements appear to be have been just below 1 per cent a year and reached 1 per cent in 1999. Results from the DETYA 2000 survey and other analyses suggest retirements are likely to rise in the future as baby boomers start to retire.
This data suggests that exits from teaching through leave, retirements and resignations can amount to typically between 8 and 11 per cent a year within the government school system. When teachers returning from leave are taken into account, however, the estimate for net separations from the government school system falls to typically around 5 to 7 per cent a year.
Estimate of net separations from the teacher labour market as a whole The above estimate of net separations provides an indication of replacement demand for the government school sector only. No data have been collected from the non-government sector for this report. Caution, therefore, needs to be applied to the use of data on replacement demand for the government sector in drawing implications about replacement demand in the non-government sector. More importantly, though, the estimate of replacement demand for the government sector added to the replacement demand from the non-government sector is likely to be an over-estimate for the replacement demand for the teacher labour market as a whole.
Replacement demand for the teacher labour market as a whole can be quite different to the replacement demand for each sector within it because there is considerable movement of teachers between sectors. When a teacher resigns from a sector to move to another, the movement counts towards the replacement demand for the sector from which the resignation occurs, but it does not contribute to the replacement demand for the teacher labour market as a whole. Only resignations which lead to exits from the teaching profession contribute to replacement demand for the teacher labour market.
Because of this churning effect, replacement demand for the teacher labour market can be substantially lower than the sum of replacement demand for the sectors within it. For instance, even though replacement demand in the government sector can be, say, five per cent of the workforce nationally and four per cent in the non-government sector, replacement demand for the national teacher labour market could be two or three per cent of the workforce according to the extent of movement between sectors.
Some indication of the net separation from the teaching profession is provided by work undertaken by Monash University on ‘net replacement demand’ for various occupations, including teaching. That research suggested that ‘net replacement demand’ for teachers in Australia averaged around 2.9 per cent a year over the ten year period to 1996. Net replacement demand in that study was estimated
Demand and supply of primary and secondary school teachers in Australia
43
by analysis of labour force data by age and was calculated, effectively, as exits from the teaching profession (gross replacement demand) net of entries (other than new graduates) and re-entries into the teaching workforce—hence the term “net replacement demand”. Because net replacement demand so calculated incorporates additional entry and re-entry categories such as the return of teachers from leave, the Monash University net replacement demand provides a lower bound for the rate of net separation of teachers as defined above.4
Box 1: Two Queensland case studies of teacher separations The most detailed published Australian sources of separations data are contained in the teacher labour market studies for Queensland. These studies include an Office of Higher Education (OOHE) report published in 1997 and the Pacific Analytics report prepared for Education Queensland in 2000. The Pacific Analytics report provides the most in-depth analysis of supply and demand of teachers produced in Australia to date and draws on expertise developed in Canadian studies.
The OOHE report provides a detailed graphical profile of net separations. Elements in the total include:
resignations and retirements which rise from about two per cent in 1991 to 3 per cent in 2000; expired contracts, terminations and dismissals which run at about one per cent a year;
net leave composed of persons going onto leave (averaging 6 per cent a year less returners of just over three per cent a year).
This gives overall projected net separations from the Queensland Government school system of the order of 3+1+(6-3)=7 per cent a year in 2000.
While the average projected net separations or replacement rate for all teachers was estimated at just over seven per cent a year, the actual replacement rates for 1990 to 1996 were as high as 6.35 per cent a year and as low as 3.74 per cent a year, emphasising the variability in these rates over time.
One conclusion from the OOHE study is that trend separations in Queensland were rising. This was confirmed by the Pacific Analytics report which provided forecasts to 2009.
In particular, he Pacific Analytics report shows that separations almost doubled over the period 1981 to 1996. For the forecast period between 1999 and 2009, separations (referred to as attrition in the report) was projected to rise from 2800 teachers a year to over 3500 a year. This was made up from a steady level of resignations (about 450 a year) and of leave of absence (about 1800 a year) and a strong rise in retirements from 300 a year in 1996 to nearly 800 a year by 2006. This corresponds to approximate attrition (separation) rates of about 9 per cent in 1999 and 9.4 per cent in 2009. (Net of leave of absence, the separation rates were around 3-4 per cent).
Both of these studies offer slightly differing measures of separations and serve to emphasise problems of definitions and measurement. Actual levels of separation provided by these two studies need to be seen in context and are not typical of Australia where other studies and sources suggest that separation levels seem to be much less than for Queensland.
4 As discussed in Chapter 6, the net replacement demand provides a reasonable estimate of the net loss of
teachers to the profession. This net loss would need to subtract from net separations entries into teaching from other losses as well, including teachers re-entering teaching and immigration.
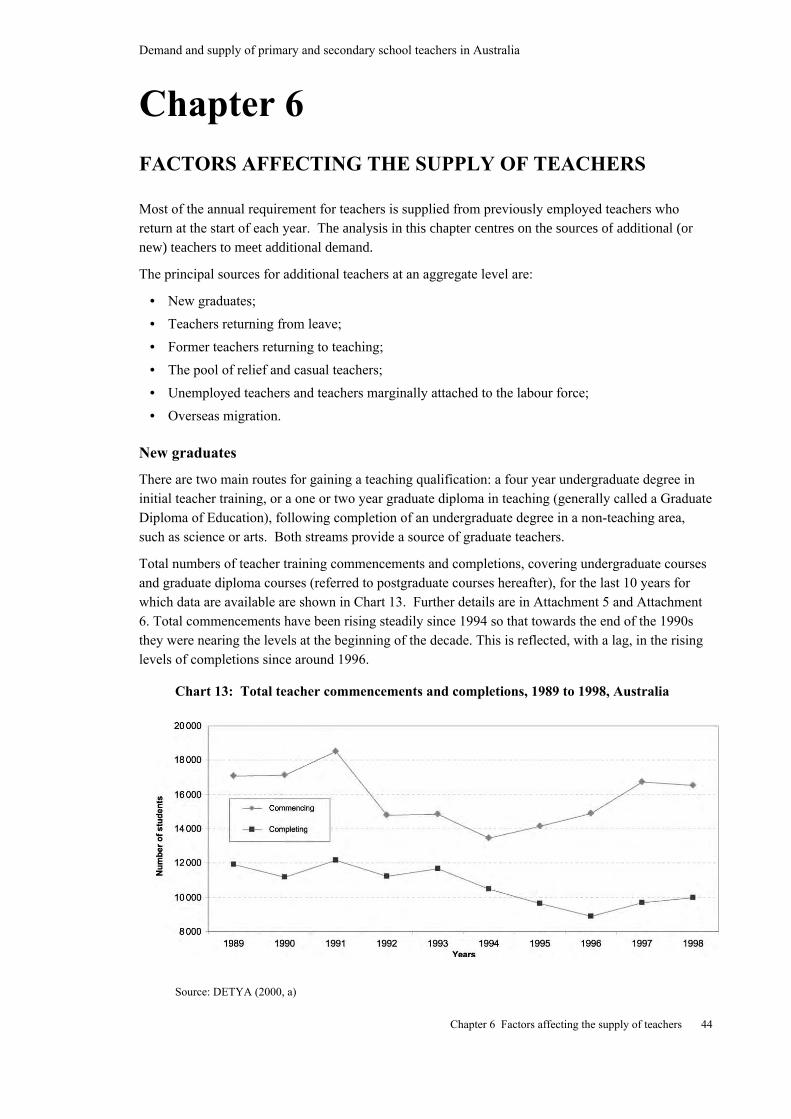
Demand and supply of primary and secondary school teachers in Australia
Chapter 6 Factors affecting the supply of teachers 44
Chapter 6
FACTORS AFFECTING THE SUPPLY OF TEACHERS
Most of the annual requirement for teachers is supplied from previously employed teachers whoreturn at the start of each year. The analysis in this chapter centres on the sources of additional (ornew) teachers to meet additional demand.
The principal sources for additional teachers at an aggregate level are:
• New graduates;
• Teachers returning from leave;
• Former teachers returning to teaching;
• The pool of relief and casual teachers;
• Unemployed teachers and teachers marginally attached to the labour force;
• Overseas migration.
New graduates
There are two main routes for gaining a teaching qualification: a four year undergraduate degree ininitial teacher training, or a one or two year graduate diploma in teaching (generally called a GraduateDiploma of Education), following completion of an undergraduate degree in a non-teaching area,such as science or arts. Both streams provide a source of graduate teachers.
Total numbers of teacher training commencements and completions, covering undergraduate coursesand graduate diploma courses (referred to postgraduate courses hereafter), for the last 10 years forwhich data are available are shown in Chart 13. Further details are in Attachment 5 and Attachment6. Total commencements have been rising steadily since 1994 so that towards the end of the 1990sthey were nearing the levels at the beginning of the decade. This is reflected, with a lag, in the risinglevels of completions since around 1996.
Chart 13: Total teacher commencements and completions, 1989 to 1998, Australia
Source: DETYA (2000, a)
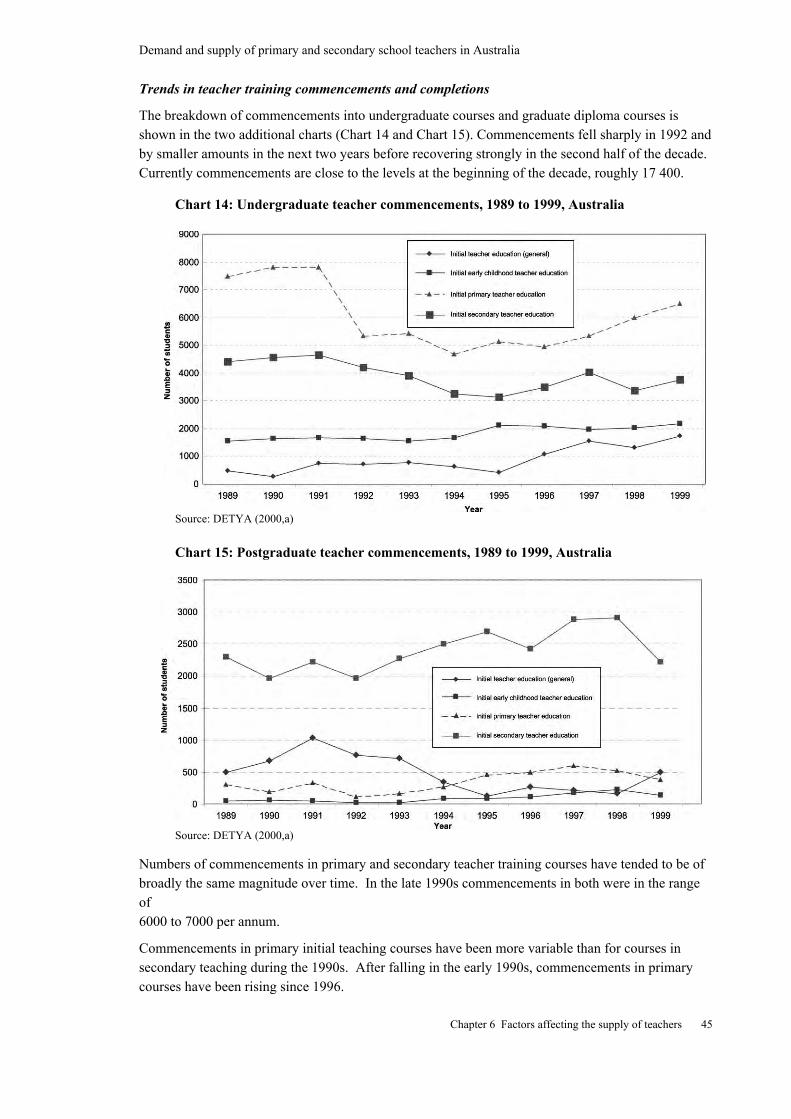
Demand and supply of primary and secondary school teachers in Australia
Chapter 6 Factors affecting the supply of teachers 45
Trends in teacher training commencements and completions
The breakdown of commencements into undergraduate courses and graduate diploma courses isshown in the two additional charts (Chart 14 and Chart 15). Commencements fell sharply in 1992 andby smaller amounts in the next two years before recovering strongly in the second half of the decade.Currently commencements are close to the levels at the beginning of the decade, roughly 17 400.
Chart 14: Undergraduate teacher commencements, 1989 to 1999, Australia
Source: DETYA (2000,a)
Chart 15: Postgraduate teacher commencements, 1989 to 1999, Australia
Source: DETYA (2000,a)
Numbers of commencements in primary and secondary teacher training courses have tended to be ofbroadly the same magnitude over time. In the late 1990s commencements in both were in the rangeof6000 to 7000 per annum.
Commencements in primary initial teaching courses have been more variable than for courses insecondary teaching during the 1990s. After falling in the early 1990s, commencements in primarycourses have been rising since 1996.
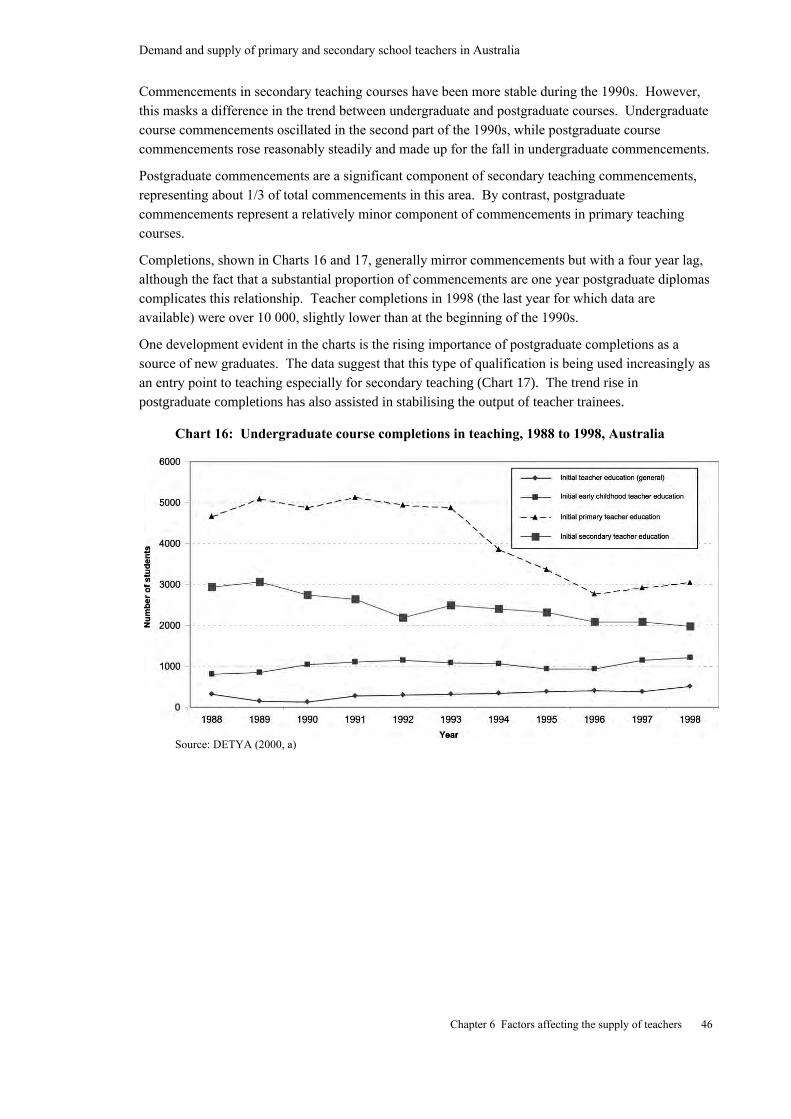
Demand and supply of primary and secondary school teachers in Australia
Chapter 6 Factors affecting the supply of teachers 46
Commencements in secondary teaching courses have been more stable during the 1990s. However,this masks a difference in the trend between undergraduate and postgraduate courses. Undergraduatecourse commencements oscillated in the second part of the 1990s, while postgraduate coursecommencements rose reasonably steadily and made up for the fall in undergraduate commencements.
Postgraduate commencements are a significant component of secondary teaching commencements,representing about 1/3 of total commencements in this area. By contrast, postgraduatecommencements represent a relatively minor component of commencements in primary teachingcourses.
Completions, shown in Charts 16 and 17, generally mirror commencements but with a four year lag,although the fact that a substantial proportion of commencements are one year postgraduate diplomascomplicates this relationship. Teacher completions in 1998 (the last year for which data areavailable) were over 10 000, slightly lower than at the beginning of the 1990s.
One development evident in the charts is the rising importance of postgraduate completions as asource of new graduates. The data suggest that this type of qualification is being used increasingly asan entry point to teaching especially for secondary teaching (Chart 17). The trend rise inpostgraduate completions has also assisted in stabilising the output of teacher trainees.
Chart 16: Undergraduate course completions in teaching, 1988 to 1998, Australia
Source: DETYA (2000, a)

Demand and supply of primary and secondary school teachers in Australia
Chapter 6 Factors affecting the supply of teachers 47
Chart 17: Postgraduate course completions in teaching, 1988 to 1998, Australia
Source: DETYA (2000, a)
Destination of new graduates
Not all persons graduating from teaching (completing courses) are available as additional teachers.
Data from the Graduate Destination Survey conducted by the Graduate Careers Council of Australia(GCCA) indicate that most but not all teaching graduates go into the labour market immediately aftergraduating. The majority of graduates who do not enter the labour market undertake further study.A small proportion take time off before looking for work. Both of these groups effectively delaytheir entry into the labour market, some by a year and others (e.g. Masters and PhD students) forlonger.
Of the graduates who enter the labour market immediately after graduating, almost all are looking forfull-time employment. The Graduate Destination Survey gathers information about the job obtainedand this shows that in 1998 around 87 percent of all graduates in full-time employment had obtaineda job in education. The rest took up positions in government and the private sector, although it is notknown whether this is by choice or involuntary.
No information is available from the Graduate Destination Survey about the job of the smallproportion of graduates who are only seeking part-time work, although it may be assumed that theirpreferences are similar to those of the full-time job seekers.
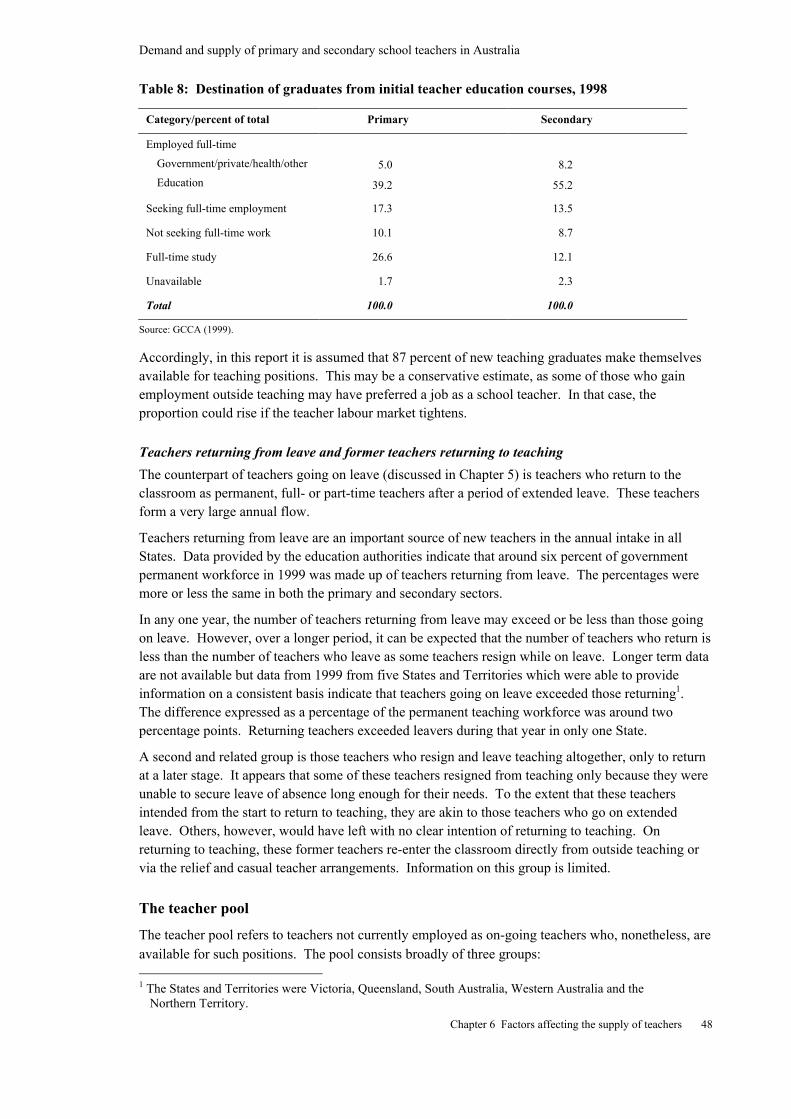
Demand and supply of primary and secondary school teachers in Australia
Chapter 6 Factors affecting the supply of teachers 48
Table 8: Destination of graduates from initial teacher education courses, 1998
Category/percent of total Primary Secondary
Employed full-time
Government/private/health/other
Education
5.0
39.2
8.2
55.2
Seeking full-time employment 17.3 13.5
Not seeking full-time work 10.1 8.7
Full-time study 26.6 12.1
Unavailable 1.7 2.3
Total 100.0 100.0
Source: GCCA (1999).
Accordingly, in this report it is assumed that 87 percent of new teaching graduates make themselvesavailable for teaching positions. This may be a conservative estimate, as some of those who gainemployment outside teaching may have preferred a job as a school teacher. In that case, theproportion could rise if the teacher labour market tightens.
Teachers returning from leave and former teachers returning to teaching
The counterpart of teachers going on leave (discussed in Chapter 5) is teachers who return to theclassroom as permanent, full- or part-time teachers after a period of extended leave. These teachersform a very large annual flow.
Teachers returning from leave are an important source of new teachers in the annual intake in allStates. Data provided by the education authorities indicate that around six percent of governmentpermanent workforce in 1999 was made up of teachers returning from leave. The percentages weremore or less the same in both the primary and secondary sectors.
In any one year, the number of teachers returning from leave may exceed or be less than those goingon leave. However, over a longer period, it can be expected that the number of teachers who return isless than the number of teachers who leave as some teachers resign while on leave. Longer term dataare not available but data from 1999 from five States and Territories which were able to provideinformation on a consistent basis indicate that teachers going on leave exceeded those returning1.The difference expressed as a percentage of the permanent teaching workforce was around twopercentage points. Returning teachers exceeded leavers during that year in only one State.
A second and related group is those teachers who resign and leave teaching altogether, only to returnat a later stage. It appears that some of these teachers resigned from teaching only because they wereunable to secure leave of absence long enough for their needs. To the extent that these teachersintended from the start to return to teaching, they are akin to those teachers who go on extendedleave. Others, however, would have left with no clear intention of returning to teaching. Onreturning to teaching, these former teachers re-enter the classroom directly from outside teaching orvia the relief and casual teacher arrangements. Information on this group is limited.
The teacher pool
The teacher pool refers to teachers not currently employed as on-going teachers who, nonetheless, areavailable for such positions. The pool consists broadly of three groups: 1 The States and Territories were Victoria, Queensland, South Australia, Western Australia and the
Northern Territory.

Demand and supply of primary and secondary school teachers in Australia
Chapter 6 Factors affecting the supply of teachers 49
• teachers on waiting lists for on-going jobs;
• relief and casual teachers who may be available for on-going positions; and
• former teachers not currently actively involved in teaching who may be encouraged to return toteaching.
Number of teachers on ‘employment lists’ and other recording mechanisms in government schools
New South Wales, Queensland, Western Australia and South Australia are the only States with arecording system whereby people with teaching qualifications who are not employed as teachers canindicate their interest in teaching and be placed on an employment list for permanent positions inteaching.
In March 2000 there were over 18 000 seeking employment as teachers in New South Walesgovernment schools, which represents over 35 per cent of the permanent teaching workforce. This isa substantial and significant reserve on which to draw, although it is recognised that not all seekingemployment are available to teach in all areas of the State, or qualified to teach in all subjects.
Queensland maintains a comprehensive list of applicants for employment with EducationQueensland. In 1999 there were 10 815 active applications from qualified teachers not employed bythe department.
South Australia provides for all applicants for teaching positions to be placed on a list. The list alsorecords up to two subject areas. In 2000, there were some 3000 applicants in this pool seekingpermanent or contract teaching positions.
In Western Australia the Education Department keeps a computerised, centralised system of qualifiedteachers who are seeking employment. Experience suggests that there are usually between 1500 to2000 graduates and re-entrants who are not currently employed.
Relief and casual teachers in government schools
Some indication of the size of the stock of teachers who may be available for permanent positions inteaching can be obtained by looking at the pool of relief and casual teachers. Every State andTerritory has a system of relief and casual teachers, some of whom are only available for relief work,but others are available for permanent and/or contract positions.
An indicative estimate of the national pool of relief and casual teachers can be obtained by comparingthe ABS data from the Labour Force Survey and the ABS Schools Collections. This indicates that inAugust 2000 there were at least 29 500 relief and casual teachers in Australia2. It must beemphasised that this figure is a snapshot. The figure is likely to be substantially larger, however,because not all relief teachers get work during the ABS survey period and therefore do not get pickedup in the employed stock.
More direct evidence on the number of relief and casual teachers is available from the State andTerritory education authorities. For instance, Tasmania maintains a Temporary Teacher Register forthose interested in undertaking temporary (for replacement or short term contracts) or relief work.Currently about 1000 people have registered (or 18 per cent of the government workforce). In SouthAustralia, 1200 teachers were on a list as seeking only casual relief teaching. In Western Australia,
2 The Labour Force Survey counts as employed teachers all those who were employed or had worked during the
survey period, whether they were permanent, on contract or casual. The School Collection counts onlypermanent and contract teachers and those casual teachers who were relieving teachers on extended leave.The difference between the two estimates therefore equals the number of relief and casual workers who hadbeen called in during the survey period.
Demand and supply of primary and secondary school teachers in Australia
Chapter 6 Factors affecting the supply of teachers 50
there are approximately 6000 teachers currently available for relief teaching however the locationsand type of teaching they are willing to undertake are often heavily restricted.
Relief and casual teaching has often been a way for teachers who did not want an ongoing position(for a variety of reasons) to stay in the teaching labour market until they were ready to apply forongoing positions. In Queensland, for example, permanent teachers are subject to the transfersystem. Teachers may prefer to remain as casuals in order to avoid the possibility of beingtransferred. This suggests that much of casual teaching may be voluntary. Nevertheless, it could beassumed that under appropriate circumstances some relief and casual staff could be encouraged toreturn to ongoing teaching sooner than they may have intended.
Other pool teachers
There are three other groups which can add usefully to the supply of teachers and teachers’ time:
• those recorded as unemployed by the ABS ;
• teachers who are not actively seeking employment but would be available to take up teaching ifa suitable job came up; and
• contract teachers on less than their desired annual hours of work.
In the August 2000 Labour Force Survey the number of officially unemployed teachers was just over3000. This is a relatively small number and most of these would be picked up in the employmentlists mentioned above.
There are a relatively high number of teacher qualified persons not working in the profession. Theirnumber exceeds the number of teachers themselves. Some of them are working in teacher-relatedpositions within education organisations while others are in generally unrelated jobs. The fact thatthe number is large suggests that, in principle at least, there may be some scope for pulling back intoteaching some of these former teachers under certain circumstances, as suggested by evidence fromthe United Kingdom and New Zealand.
Straker (1991) noted that in the United Kingdom it was estimated that ‘the pool of qualified teachersunder the age of 60 which is currently inactive exceeds the number of teachers who are currently inteaching posts’. Straker noted that in 1989 almost 60 per cent of new appointments were ‘returners’to the profession and that this pool remained a valuable source of recruitment, provided that‘updating’ of skills and knowledge of curricula could be achieved.
Pool teachers, including those outside the teaching workforce, have also been important in the NewZealand teacher labour market. It is interesting to note, for example, that the primary school teachershortages in New Zealand in the 1990s were mostly resolved by supply from the pool.
There is no information in Australia about the extent of under-employment of contract and part-timeteachers. The ABS collects information in labour force surveys on part-time workers wanting towork more hours. This source could be used to provide an indication of the extent of under-employment among part-time teachers, but not for contract teachers who may not get continuouswork during the year.
Overseas migration
Data from Department of Immigration and Multicultural Affairs (DIMA) presented in Table 9 andTable 10 indicate that, at least in recent years, Australia has been a net gainer of teachers through themigration process.
Most of the inflow/outflow is associated with Australian residents leaving to go overseas or returning.This could be explained by a desire by teachers to combine work with travel. The figures suggest that
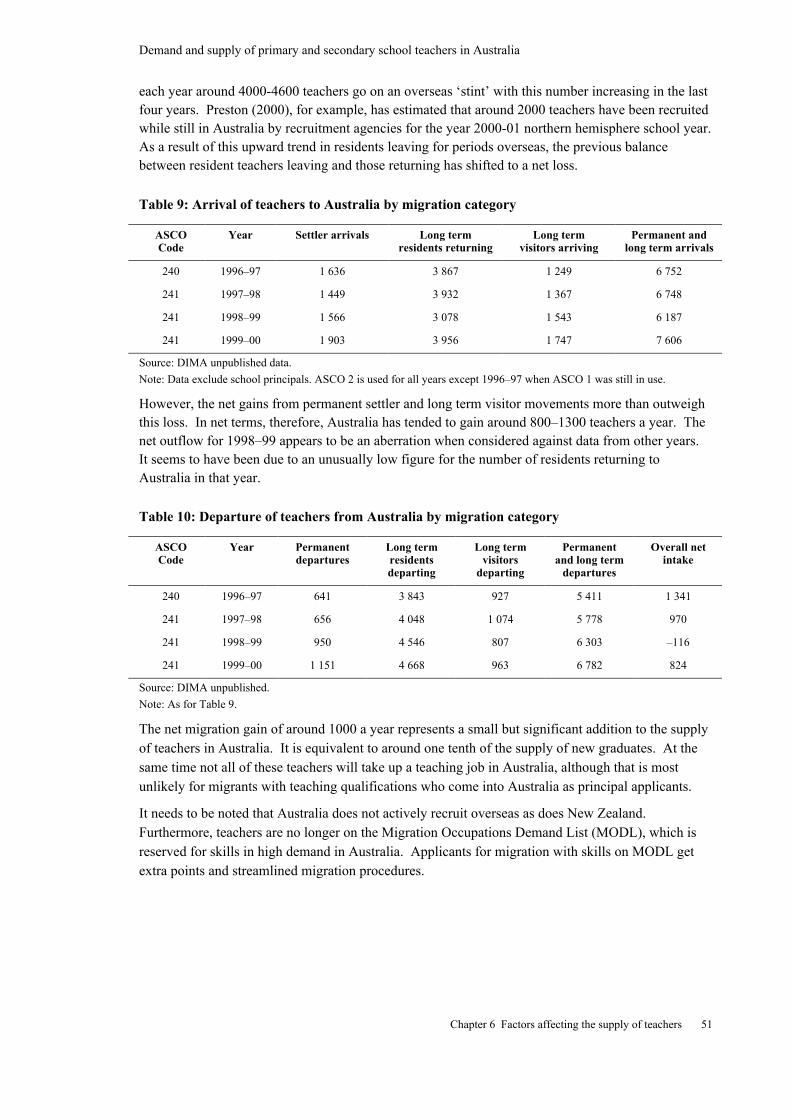
Demand and supply of primary and secondary school teachers in Australia
Chapter 6 Factors affecting the supply of teachers 51
each year around 4000-4600 teachers go on an overseas ‘stint’ with this number increasing in the lastfour years. Preston (2000), for example, has estimated that around 2000 teachers have been recruitedwhile still in Australia by recruitment agencies for the year 2000-01 northern hemisphere school year.As a result of this upward trend in residents leaving for periods overseas, the previous balancebetween resident teachers leaving and those returning has shifted to a net loss.
Table 9: Arrival of teachers to Australia by migration category
ASCOCode
Year Settler arrivals Long termresidents returning
Long termvisitors arriving
Permanent andlong term arrivals
240 1996–97 1 636 3 867 1 249 6 752
241 1997–98 1 449 3 932 1 367 6 748
241 1998–99 1 566 3 078 1 543 6 187
241 1999–00 1 903 3 956 1 747 7 606
Source: DIMA unpublished data.
Note: Data exclude school principals. ASCO 2 is used for all years except 1996–97 when ASCO 1 was still in use.
However, the net gains from permanent settler and long term visitor movements more than outweighthis loss. In net terms, therefore, Australia has tended to gain around 800–1300 teachers a year. Thenet outflow for 1998–99 appears to be an aberration when considered against data from other years.It seems to have been due to an unusually low figure for the number of residents returning toAustralia in that year.
Table 10: Departure of teachers from Australia by migration category
ASCOCode
Year Permanentdepartures
Long termresidentsdeparting
Long termvisitors
departing
Permanentand long term
departures
Overall netintake
240 1996–97 641 3 843 927 5 411 1 341
241 1997–98 656 4 048 1 074 5 778 970
241 1998–99 950 4 546 807 6 303 –116
241 1999–00 1 151 4 668 963 6 782 824
Source: DIMA unpublished.
Note: As for Table 9.
The net migration gain of around 1000 a year represents a small but significant addition to the supplyof teachers in Australia. It is equivalent to around one tenth of the supply of new graduates. At thesame time not all of these teachers will take up a teaching job in Australia, although that is mostunlikely for migrants with teaching qualifications who come into Australia as principal applicants.
It needs to be noted that Australia does not actively recruit overseas as does New Zealand.Furthermore, teachers are no longer on the Migration Occupations Demand List (MODL), which isreserved for skills in high demand in Australia. Applicants for migration with skills on MODL getextra points and streamlined migration procedures.
Demand and supply of primary and secondary school teachers in Australia
Chapter 6 Factors affecting the supply of teachers 52
Relative importance of the various sources of teacher supply
The major sources of supply of additional teachers discussed above include new graduates, teachersreturning from leave, former teachers returning to teaching, the pool of relief and casual teachers,unemployed teachers, teachers marginally attached to the labour force and qualified teachers fromoverseas migration. The teachers that are most easily quantified are new graduates, migrations andteachers returning from leave.
On average graduates contribute the equivalent of four to five per cent of the workforce a year to thestock of teachers, while migration flows have contributed about one half of a percent of the workforcein net terms in recent years (or around one tenth of graduate supply on average). Teachers returningfrom leave also represent about 6 per cent of the teaching workforce.
Other sources of supply are more difficult to quantify. Former teachers (not on leave) returning toteaching are recognised as being an important source, but the only evidence of this comes fromoverseas rather than Australia. On the other hand, there is more information on the pool of teacherson employment lists for jobs, and those who work as relief and casual teachers and who maytherefore be available for ongoing position. This evidence suggests that in three States alone (NewSouth Wales, Queensland and Western Australia) there are around 31 000 teachers on employmentlists for ongoing teaching jobs. The number of relief and casual teachers is around 30 000-40 000Australia wide. Taken together, this suggests that the pool of teachers available for ongoingvacancies is relatively large, although there is some overlap between the two categories.
How important have these sources of supply been in filling the teaching vacancies that have arisen?In the DETYA 2000 survey, data were provided on new teachers recruited during 1999 and whetherthey were graduates from the previous year or experienced teachers. New teachers excluded teachersreturning from leave but included those recruited to contract positions lasting at least one term as wellas to permanent positions. These data are presented in Table 12.
Table 11 shows that while there is considerable variation between States and Territories, at thenational level only around 45 per cent of new teachers in the government sector were graduates fromthe previous year. Over half of all recruited new teachers were experienced teachers. These wouldhave come from one of the other sources of supply discussed in this chapter. In addition, some wouldhave moved across from the non-government sector or from another State. These results suggest thatthese other sources of supply can be very significant.
In this context, it is important to note that by its very nature the flow back into the teaching workforcefrom new graduates and experienced teachers is dependent on a number of factors and can vary overtime. The most important factors are likely to be the level of demand for teachers and theopportunities available in other areas of the economy. Strong demand is likely to attract more poolteachers while strong competition from new graduates and good job prospects outside teaching arelikely to have the opposite effect. To some extent, the large pool of people with teachingqualifications outside teaching acts as an automatic stabiliser which helps to balance the demand forand supply of teachers.
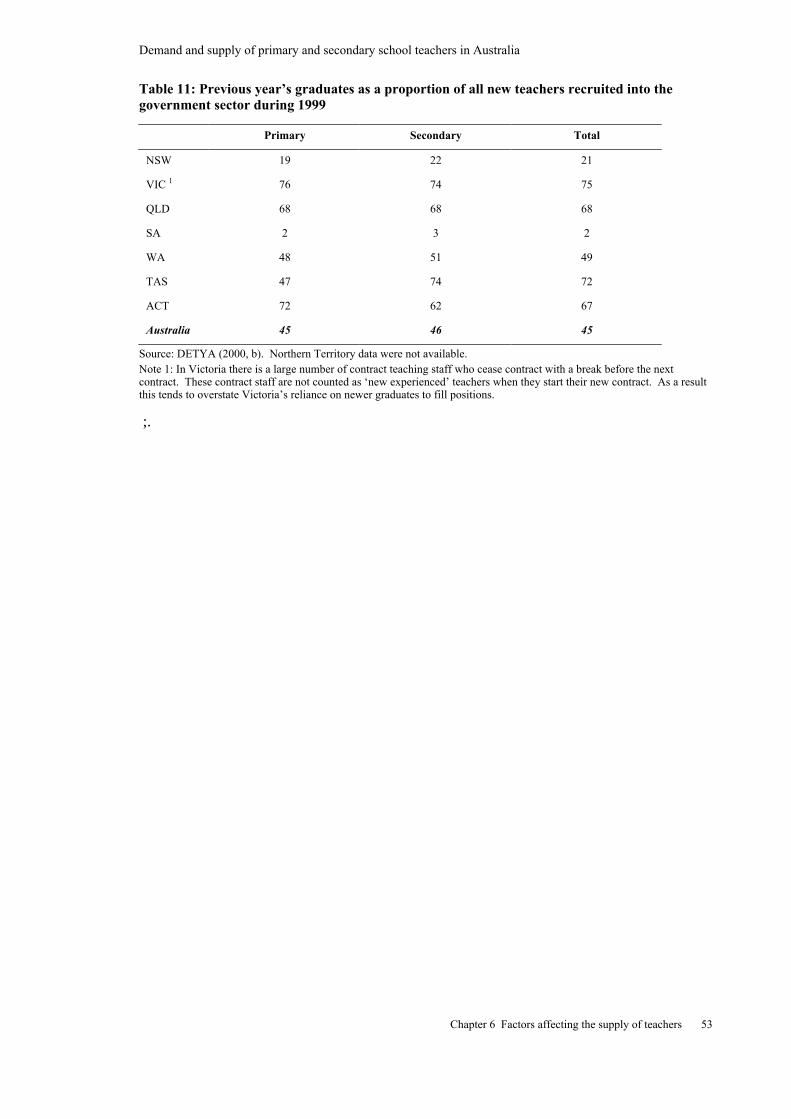
Demand and supply of primary and secondary school teachers in Australia
Chapter 6 Factors affecting the supply of teachers 53
Table 11: Previous year’s graduates as a proportion of all new teachers recruited into thegovernment sector during 1999
Primary Secondary Total
NSW 19 22 21
VIC 1 76 74 75
QLD 68 68 68
SA 2 3 2
WA 48 51 49
TAS 47 74 72
ACT 72 62 67
Australia 45 46 45
Source: DETYA (2000, b). Northern Territory data were not available.Note 1: In Victoria there is a large number of contract teaching staff who cease contract with a break before the nextcontract. These contract staff are not counted as ‘new experienced’ teachers when they start their new contract. As a resultthis tends to overstate Victoria’s reliance on newer graduates to fill positions.
;.
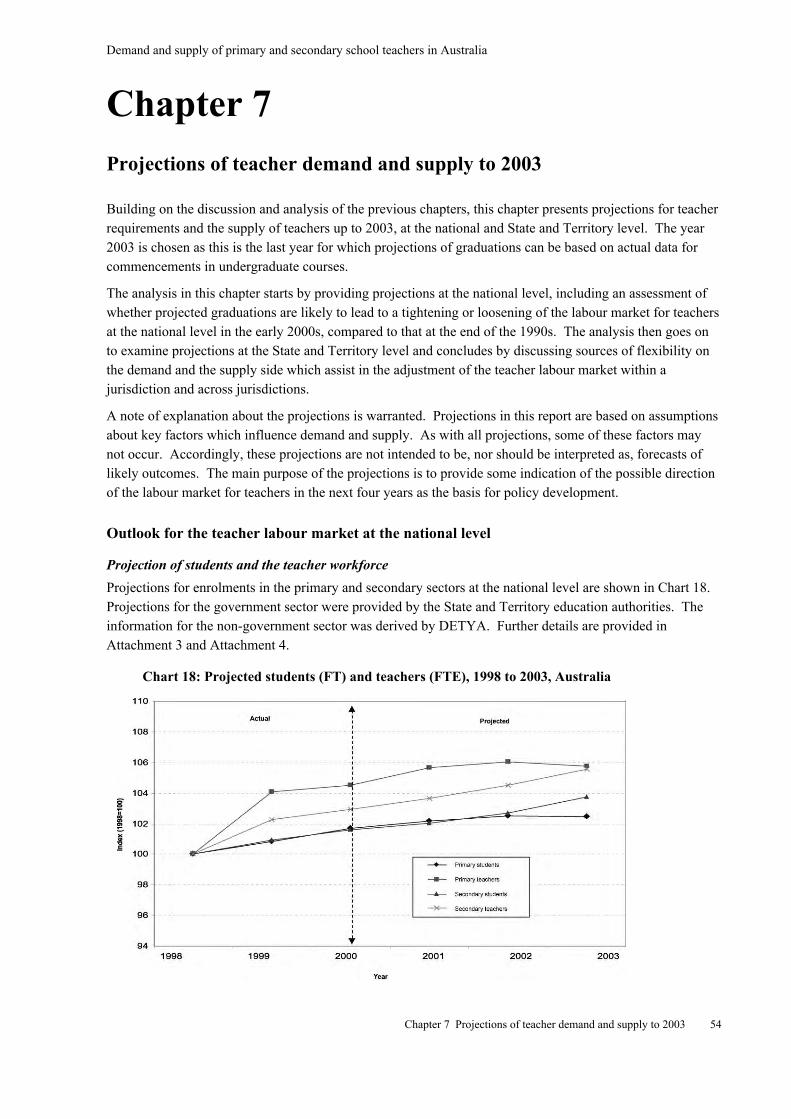
Demand and supply of primary and secondary school teachers in Australia
Chapter 7 Projections of teacher demand and supply to 2003 54
Chapter 7
Projections of teacher demand and supply to 2003
Building on the discussion and analysis of the previous chapters, this chapter presents projections for teacherrequirements and the supply of teachers up to 2003, at the national and State and Territory level. The year2003 is chosen as this is the last year for which projections of graduations can be based on actual data forcommencements in undergraduate courses.
The analysis in this chapter starts by providing projections at the national level, including an assessment ofwhether projected graduations are likely to lead to a tightening or loosening of the labour market for teachersat the national level in the early 2000s, compared to that at the end of the 1990s. The analysis then goes onto examine projections at the State and Territory level and concludes by discussing sources of flexibility onthe demand and the supply side which assist in the adjustment of the teacher labour market within ajurisdiction and across jurisdictions.
A note of explanation about the projections is warranted. Projections in this report are based on assumptionsabout key factors which influence demand and supply. As with all projections, some of these factors maynot occur. Accordingly, these projections are not intended to be, nor should be interpreted as, forecasts oflikely outcomes. The main purpose of the projections is to provide some indication of the possible directionof the labour market for teachers in the next four years as the basis for policy development.
Outlook for the teacher labour market at the national level
Projection of students and the teacher workforce
Projections for enrolments in the primary and secondary sectors at the national level are shown in Chart 18.Projections for the government sector were provided by the State and Territory education authorities. Theinformation for the non-government sector was derived by DETYA. Further details are provided inAttachment 3 and Attachment 4.
Chart 18: Projected students (FT) and teachers (FTE), 1998 to 2003, Australia
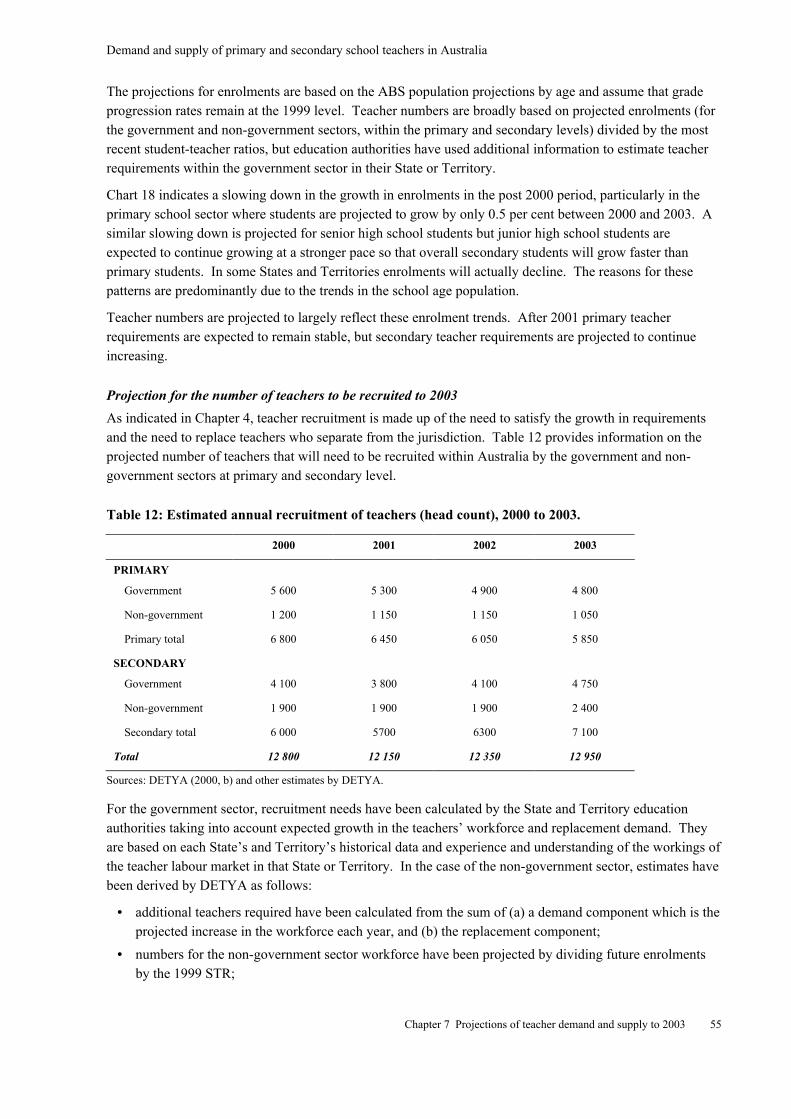
Demand and supply of primary and secondary school teachers in Australia
Chapter 7 Projections of teacher demand and supply to 2003 55
The projections for enrolments are based on the ABS population projections by age and assume that gradeprogression rates remain at the 1999 level. Teacher numbers are broadly based on projected enrolments (forthe government and non-government sectors, within the primary and secondary levels) divided by the mostrecent student-teacher ratios, but education authorities have used additional information to estimate teacherrequirements within the government sector in their State or Territory.
Chart 18 indicates a slowing down in the growth in enrolments in the post 2000 period, particularly in theprimary school sector where students are projected to grow by only 0.5 per cent between 2000 and 2003. Asimilar slowing down is projected for senior high school students but junior high school students areexpected to continue growing at a stronger pace so that overall secondary students will grow faster thanprimary students. In some States and Territories enrolments will actually decline. The reasons for thesepatterns are predominantly due to the trends in the school age population.
Teacher numbers are projected to largely reflect these enrolment trends. After 2001 primary teacherrequirements are expected to remain stable, but secondary teacher requirements are projected to continueincreasing.
Projection for the number of teachers to be recruited to 2003
As indicated in Chapter 4, teacher recruitment is made up of the need to satisfy the growth in requirementsand the need to replace teachers who separate from the jurisdiction. Table 12 provides information on theprojected number of teachers that will need to be recruited within Australia by the government and non-government sectors at primary and secondary level.
Table 12: Estimated annual recruitment of teachers (head count), 2000 to 2003.
2000 2001 2002 2003
PRIMARY
Government 5 600 5 300 4 900 4 800
Non-government 1 200 1 150 1 150 1 050
Primary total 6 800 6 450 6 050 5 850
SECONDARY
Government 4 100 3 800 4 100 4 750
Non-government 1 900 1 900 1 900 2 400
Secondary total 6 000 5700 6300 7 100
Total 12 800 12 150 12 350 12 950
Sources: DETYA (2000, b) and other estimates by DETYA.
For the government sector, recruitment needs have been calculated by the State and Territory educationauthorities taking into account expected growth in the teachers’ workforce and replacement demand. Theyare based on each State’s and Territory’s historical data and experience and understanding of the workings ofthe teacher labour market in that State or Territory. In the case of the non-government sector, estimates havebeen derived by DETYA as follows:
• additional teachers required have been calculated from the sum of (a) a demand component which is theprojected increase in the workforce each year, and (b) the replacement component;
• numbers for the non-government sector workforce have been projected by dividing future enrolmentsby the 1999 STR;
Demand and supply of primary and secondary school teachers in Australia
Chapter 7 Projections of teacher demand and supply to 2003 56
• for the non-government sector replacement is estimated as (i) the rate of retirement in the governmentsector times projected non-government workforce plus, (ii) a rate of resignations which is half thatevident in the government sector in each State times projected non-government workforce. Thisassumes a lower separation rate from the non-government sector. (For the Northern Territory historicseparation levels have been used for future replacement);
• the replacement (separations) and demand components have been summed to give totals for the rowsestimated in Table 12.
The results from the recruitment projections show different needs for the different levels of schooling :
• in the primary sector, recruitment is projected to fall from 6800 in 2000 to around 5900 in 2003;
• in the secondary sector, projected recruitment is estimated to increase from 6000 in 2000 to over 7000in 2003.
Projected completions from initial teacher training courses
Projections of completions from initial teacher training courses can be derived from information oncommencements in these courses (discussed in section 6 and shown in charts 15 and 16) and applying acompletion rate. To project completions in the period to 2003, the following assumptions have been madefor the different streams:
• undergraduate completions;
• for the period to 2003, completions equal commencements four years earlier multiplied by an averagecompletion rate of 60 per cent;
• post-graduate completions;
• for the period to 2000, completions equal commencements one year earlier multiplied by an averagecompletion rate of 85 per cent;
• for the period between 2001 and 2003, commencements in postgraduate teaching courses have beenassumed to run at a level equal to the average during the previous five years. During that timepostgraduate commencements were on a slightly upward trend.
The ‘completion rates’ have been calculated by comparing commencements and completions, suitablylagged, over the 1990s and averaging. While completion rates so derived can vary from one year to another,for a variety of reasons, it has been assumed that these historical average or trend completion rates will applyinto the next few years.
As shown in Chart 19, completions are projected to rise gradually in the period to 2003 to levels whichapproach those at the start of the 1990s. The main reason for this projected recovery is the increase incompletions from Initial Primary Teaching (and Initial General Teaching) courses, arising from recentincreases in commencements in these courses. The rise in completions from secondary teacher trainingcourses is projected to be more subdued, based on the assumptions described above. Further details are inAttachment 7.
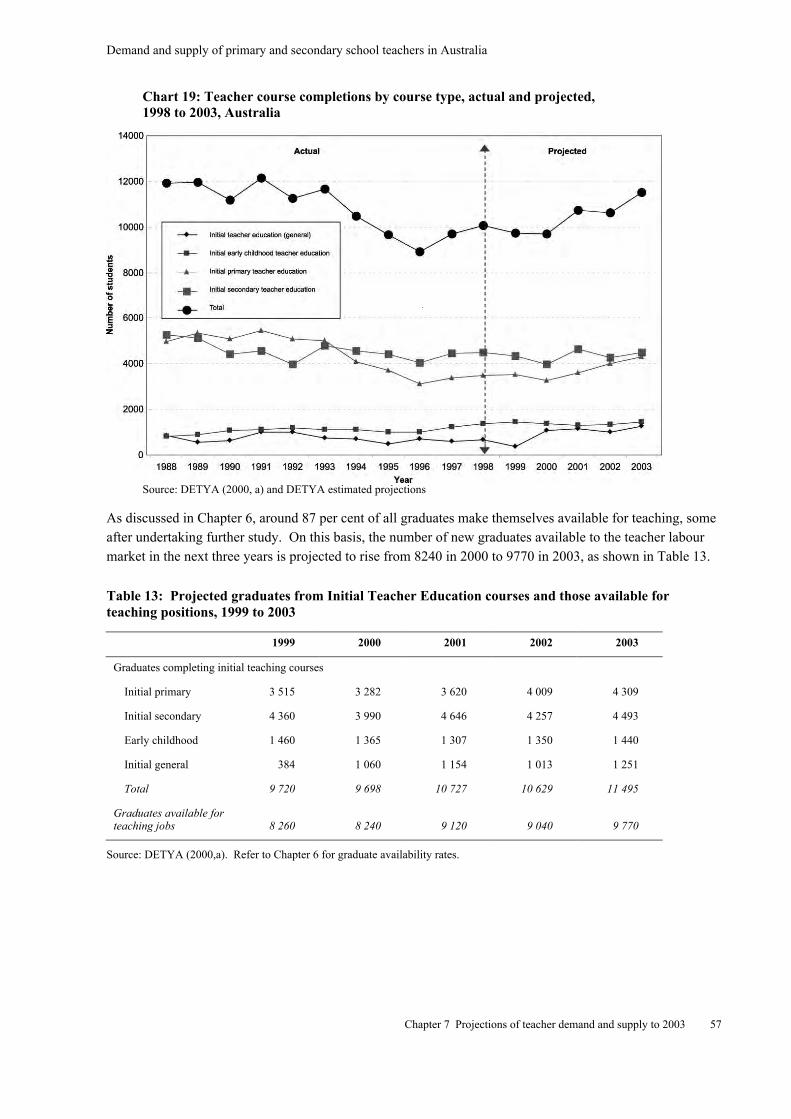
Demand and supply of primary and secondary school teachers in Australia
Chapter 7 Projections of teacher demand and supply to 2003 57
Chart 19: Teacher course completions by course type, actual and projected,1998 to 2003, Australia
Source: DETYA (2000, a) and DETYA estimated projections
As discussed in Chapter 6, around 87 per cent of all graduates make themselves available for teaching, someafter undertaking further study. On this basis, the number of new graduates available to the teacher labourmarket in the next three years is projected to rise from 8240 in 2000 to 9770 in 2003, as shown in Table 13.
Table 13: Projected graduates from Initial Teacher Education courses and those available forteaching positions, 1999 to 2003
1999 2000 2001 2002 2003
Graduates completing initial teaching courses
Initial primary 3 515 3 282 3 620 4 009 4 309
Initial secondary 4 360 3 990 4 646 4 257 4 493
Early childhood 1 460 1 365 1 307 1 350 1 440
Initial general 384 1 060 1 154 1 013 1 251
Total 9 720 9 698 10 727 10 629 11 495
Graduates available forteaching jobs 8 260 8 240 9 120 9 040 9 770
Source: DETYA (2000,a). Refer to Chapter 6 for graduate availability rates.
Demand and supply of primary and secondary school teachers in Australia
Chapter 7 Projections of teacher demand and supply to 2003 58
Adequacy of projected graduate numbers to meet teacher requirements
The recruitment needs of the government and non-government school system as calculated above is not ameasure of the level of new graduates required to satisfy the schools’ teacher requirements. There are twomain reasons for this. First, some recruitment needs arise because teachers move from one jurisdiction toanother and not out of teaching. That element of recruitment is not associated with a loss of teachers butsimply with a reshuffling of teachers across jurisdictions. Second, graduates are not the only source ofsupply to meet the recruitment needs. Many teachers return to the teaching workforce after a period outsideit and some come in through migration. For these reasons, recruitment needs as calculated above will exceedthe requirement for new graduates.
The more appropriate way to assess whether graduate numbers are adequate is to note that, in order to ensurethat teacher labour markets are in balance, the flow of teachers from graduations and immigration provide atleast as many teachers as are lost to the teaching profession in net terms plus those required because ofgrowth in the teaching workforce. A lesser number could be maintained for a period if there was an excesspool of available and/or under-utilised teachers, but this would eventually be depleted.As that begins to happen, it would start to put increasing pressure on the teacher labour market.
While growth in requirements can be estimated quite readily, the net loss to the teaching profession is noteasily derivable. The best estimate at this stage is provided by the work of Shah (1999) who reports that thenet replacement demand for the teaching profession in Australia as a whole is of the order of 2.9 per cent ayear across the full regular contract and casual teaching workforce. The way this estimate was calculated,based on ABS Labour Force Survey data, means that the estimate effectively represents the loss throughretirements, resignations and out migration to the profession, after netting out those who come back and/orenter the profession in Australia through immigration1.
Over the period 1999 to 2003, the loss rate calculated by using the results from Shah works out at an averageof 7000 new teachers a year (on a headcount basis) across the primary and secondary sectors. By contrast,the growth demand over the same time period is expected to be of the order of 1500 a year (on a headcountbasis), as noted earlier.
This suggests that balance in the teacher labour market in the next few years can be maintained with a flowof 8500 new graduates a year on average, across the primary and secondary sectors. This is broadlyconsistent with the graduate requirements implied in the results from the DETYA 2000 Survey reported inTable 12, after taking into account the fact that less than half of government teacher recruitments nationallywas met by hiring new graduates (see Table 11). If this proportion were applied to the projected recruitmentfor 2000 to 2003 in Table 12, around 6000 to 6500 graduates would be needed annually to satisfy theseprojected recruitment needs. The number of graduates at the national level that are projected to be availablefor teaching jobs in the next few years (starting at 8260 in 1999 and rising to 9770 in 2003) therefore appearsto be broadly in line with the requirements for a stable teacher labour market at the national level. In theperiod after 2003, however, with retirement pressures starting to emerge, overall replacement needs will riseand an increase in graduate numbers will become necessary (see Chapter 8 for a discussion of thisdevelopment).
1 It could be that the loss rate to the profession is higher for regular and contract teachers than for relief and casual
teachers, who are included in the Shah estimate. However, as the proportion of the relief and casuals in the teachingworkforce at any one time is relatively small (under 20 per cent), their inclusion in the Shah study should not haveinfluenced the loss rate of regular and contract teachers significantly.
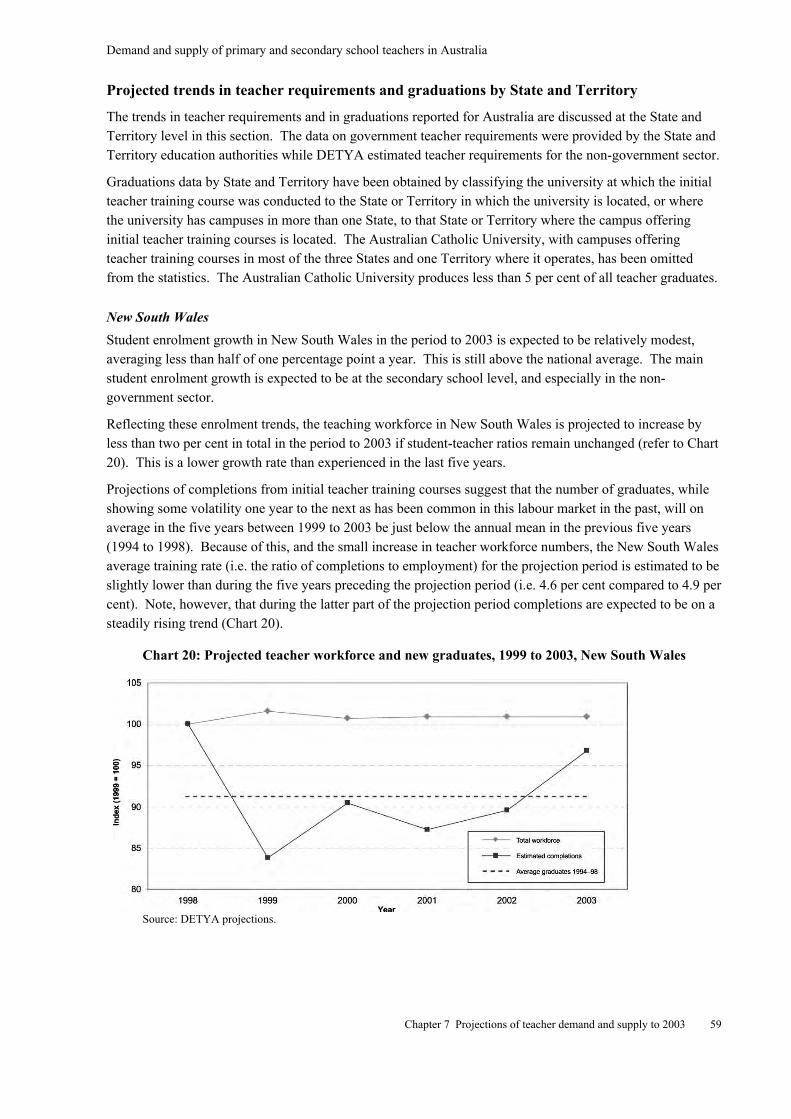
Demand and supply of primary and secondary school teachers in Australia
Chapter 7 Projections of teacher demand and supply to 2003 59
Projected trends in teacher requirements and graduations by State and Territory
The trends in teacher requirements and in graduations reported for Australia are discussed at the State andTerritory level in this section. The data on government teacher requirements were provided by the State andTerritory education authorities while DETYA estimated teacher requirements for the non-government sector.
Graduations data by State and Territory have been obtained by classifying the university at which the initialteacher training course was conducted to the State or Territory in which the university is located, or wherethe university has campuses in more than one State, to that State or Territory where the campus offeringinitial teacher training courses is located. The Australian Catholic University, with campuses offeringteacher training courses in most of the three States and one Territory where it operates, has been omittedfrom the statistics. The Australian Catholic University produces less than 5 per cent of all teacher graduates.
New South Wales
Student enrolment growth in New South Wales in the period to 2003 is expected to be relatively modest,averaging less than half of one percentage point a year. This is still above the national average. The mainstudent enrolment growth is expected to be at the secondary school level, and especially in the non-government sector.
Reflecting these enrolment trends, the teaching workforce in New South Wales is projected to increase byless than two per cent in total in the period to 2003 if student-teacher ratios remain unchanged (refer to Chart20). This is a lower growth rate than experienced in the last five years.
Projections of completions from initial teacher training courses suggest that the number of graduates, whileshowing some volatility one year to the next as has been common in this labour market in the past, will onaverage in the five years between 1999 to 2003 be just below the annual mean in the previous five years(1994 to 1998). Because of this, and the small increase in teacher workforce numbers, the New South Walesaverage training rate (i.e. the ratio of completions to employment) for the projection period is estimated to beslightly lower than during the five years preceding the projection period (i.e. 4.6 per cent compared to 4.9 percent). Note, however, that during the latter part of the projection period completions are expected to be on asteadily rising trend (Chart 20).
Chart 20: Projected teacher workforce and new graduates, 1999 to 2003, New South Wales
Source: DETYA projections.
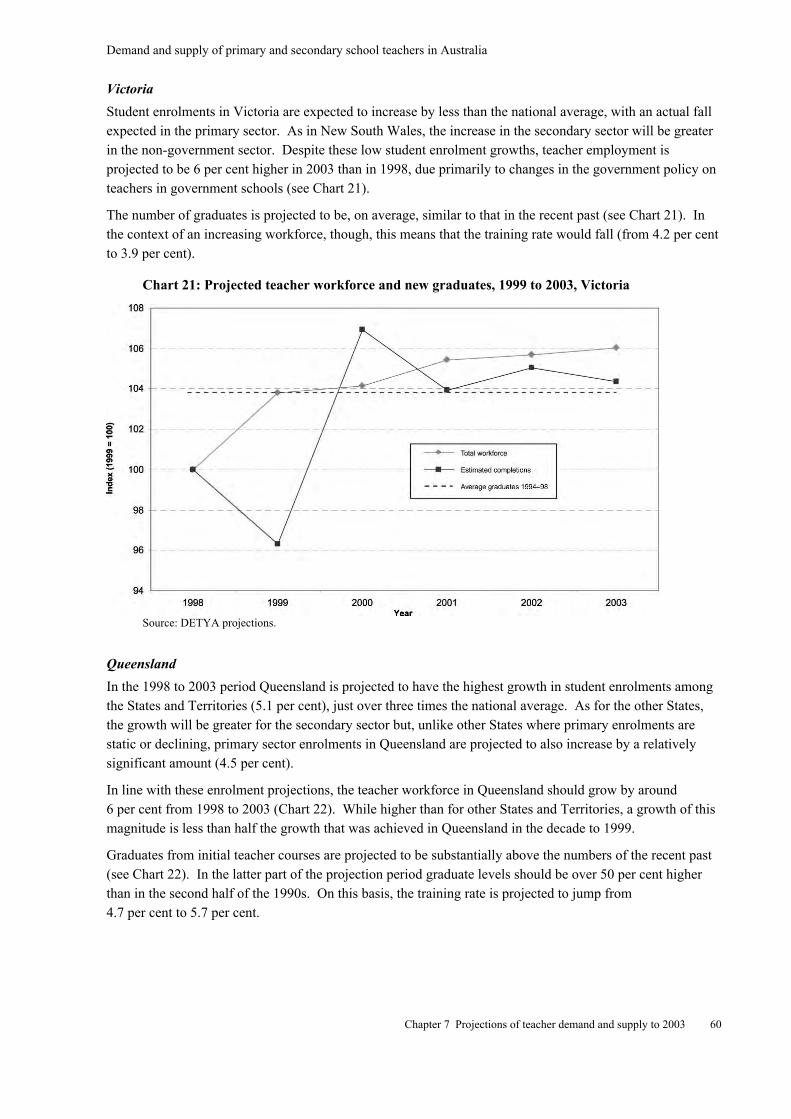
Demand and supply of primary and secondary school teachers in Australia
Chapter 7 Projections of teacher demand and supply to 2003 60
Victoria
Student enrolments in Victoria are expected to increase by less than the national average, with an actual fallexpected in the primary sector. As in New South Wales, the increase in the secondary sector will be greaterin the non-government sector. Despite these low student enrolment growths, teacher employment isprojected to be 6 per cent higher in 2003 than in 1998, due primarily to changes in the government policy onteachers in government schools (see Chart 21).
The number of graduates is projected to be, on average, similar to that in the recent past (see Chart 21). Inthe context of an increasing workforce, though, this means that the training rate would fall (from 4.2 per centto 3.9 per cent).
Chart 21: Projected teacher workforce and new graduates, 1999 to 2003, Victoria
Source: DETYA projections.
Queensland
In the 1998 to 2003 period Queensland is projected to have the highest growth in student enrolments amongthe States and Territories (5.1 per cent), just over three times the national average. As for the other States,the growth will be greater for the secondary sector but, unlike other States where primary enrolments arestatic or declining, primary sector enrolments in Queensland are projected to also increase by a relativelysignificant amount (4.5 per cent).
In line with these enrolment projections, the teacher workforce in Queensland should grow by around6 per cent from 1998 to 2003 (Chart 22). While higher than for other States and Territories, a growth of thismagnitude is less than half the growth that was achieved in Queensland in the decade to 1999.
Graduates from initial teacher courses are projected to be substantially above the numbers of the recent past(see Chart 22). In the latter part of the projection period graduate levels should be over 50 per cent higherthan in the second half of the 1990s. On this basis, the training rate is projected to jump from4.7 per cent to 5.7 per cent.
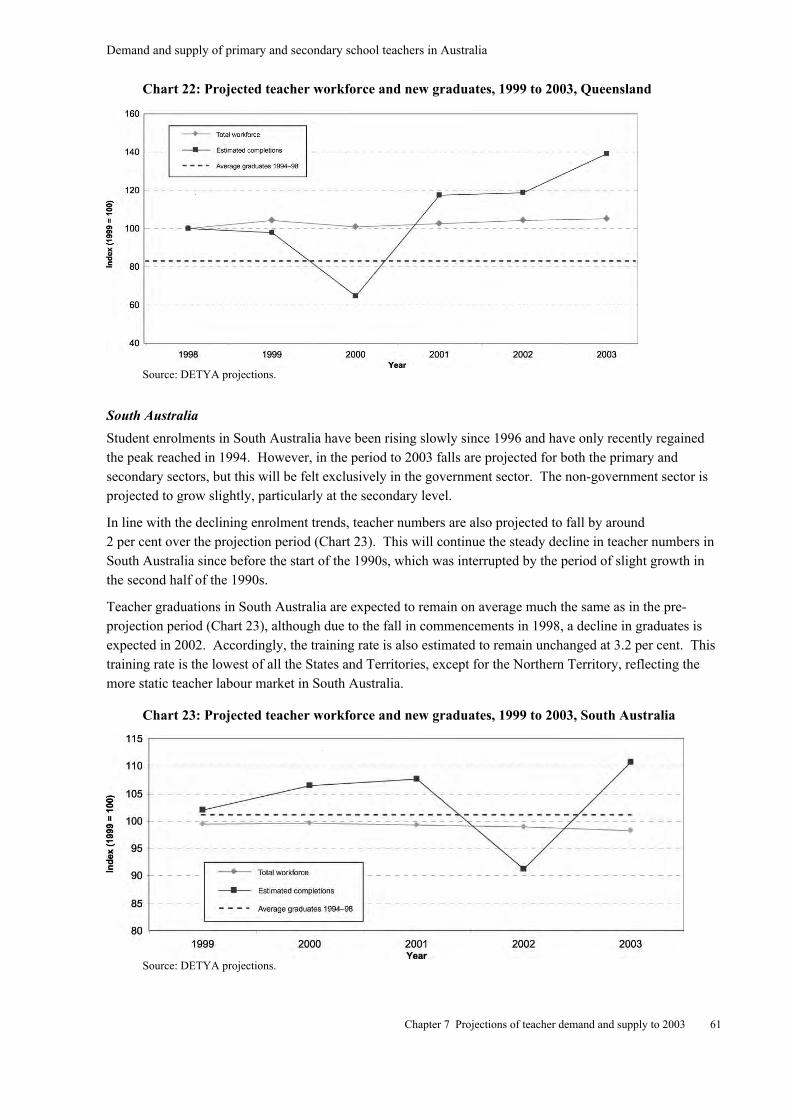
Demand and supply of primary and secondary school teachers in Australia
Chapter 7 Projections of teacher demand and supply to 2003 61
Chart 22: Projected teacher workforce and new graduates, 1999 to 2003, Queensland
Source: DETYA projections.
South Australia
Student enrolments in South Australia have been rising slowly since 1996 and have only recently regainedthe peak reached in 1994. However, in the period to 2003 falls are projected for both the primary andsecondary sectors, but this will be felt exclusively in the government sector. The non-government sector isprojected to grow slightly, particularly at the secondary level.
In line with the declining enrolment trends, teacher numbers are also projected to fall by around2 per cent over the projection period (Chart 23). This will continue the steady decline in teacher numbers inSouth Australia since before the start of the 1990s, which was interrupted by the period of slight growth inthe second half of the 1990s.
Teacher graduations in South Australia are expected to remain on average much the same as in the pre-projection period (Chart 23), although due to the fall in commencements in 1998, a decline in graduates isexpected in 2002. Accordingly, the training rate is also estimated to remain unchanged at 3.2 per cent. Thistraining rate is the lowest of all the States and Territories, except for the Northern Territory, reflecting themore static teacher labour market in South Australia.
Chart 23: Projected teacher workforce and new graduates, 1999 to 2003, South Australia
Source: DETYA projections.
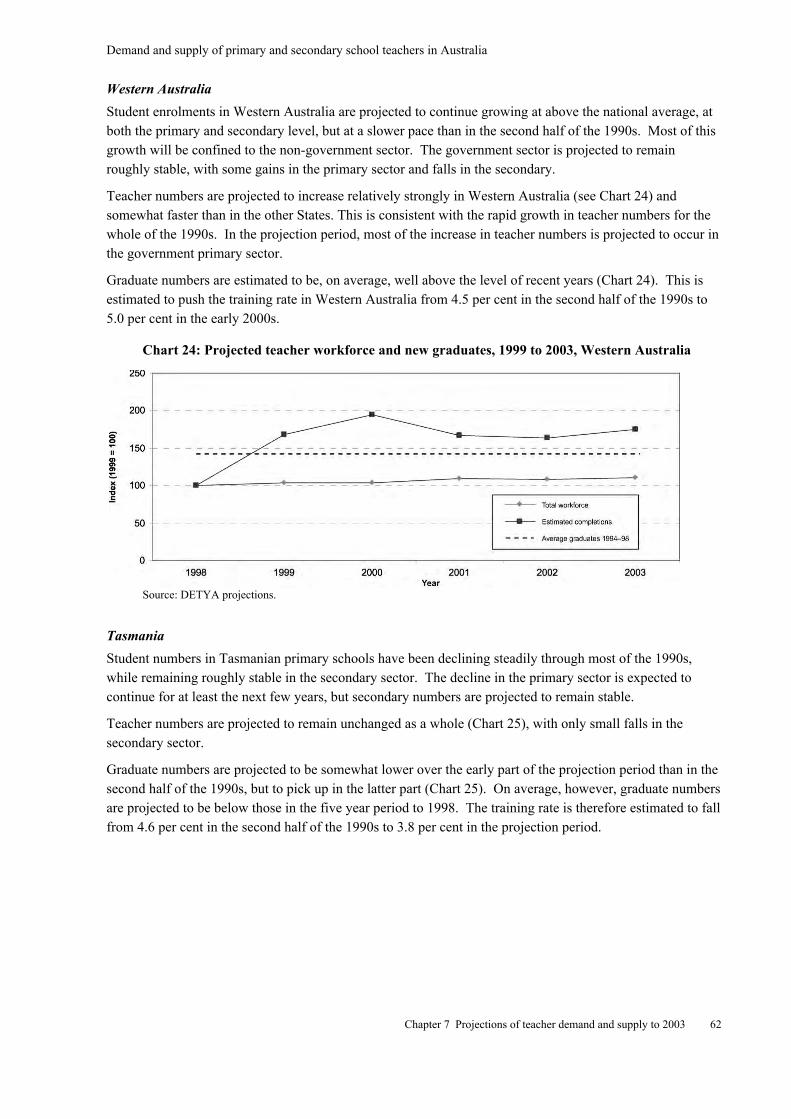
Demand and supply of primary and secondary school teachers in Australia
Chapter 7 Projections of teacher demand and supply to 2003 62
Western Australia
Student enrolments in Western Australia are projected to continue growing at above the national average, atboth the primary and secondary level, but at a slower pace than in the second half of the 1990s. Most of thisgrowth will be confined to the non-government sector. The government sector is projected to remainroughly stable, with some gains in the primary sector and falls in the secondary.
Teacher numbers are projected to increase relatively strongly in Western Australia (see Chart 24) andsomewhat faster than in the other States. This is consistent with the rapid growth in teacher numbers for thewhole of the 1990s. In the projection period, most of the increase in teacher numbers is projected to occur inthe government primary sector.
Graduate numbers are estimated to be, on average, well above the level of recent years (Chart 24). This isestimated to push the training rate in Western Australia from 4.5 per cent in the second half of the 1990s to5.0 per cent in the early 2000s.
Chart 24: Projected teacher workforce and new graduates, 1999 to 2003, Western Australia
Source: DETYA projections.
Tasmania
Student numbers in Tasmanian primary schools have been declining steadily through most of the 1990s,while remaining roughly stable in the secondary sector. The decline in the primary sector is expected tocontinue for at least the next few years, but secondary numbers are projected to remain stable.
Teacher numbers are projected to remain unchanged as a whole (Chart 25), with only small falls in thesecondary sector.
Graduate numbers are projected to be somewhat lower over the early part of the projection period than in thesecond half of the 1990s, but to pick up in the latter part (Chart 25). On average, however, graduate numbersare projected to be below those in the five year period to 1998. The training rate is therefore estimated to fallfrom 4.6 per cent in the second half of the 1990s to 3.8 per cent in the projection period.
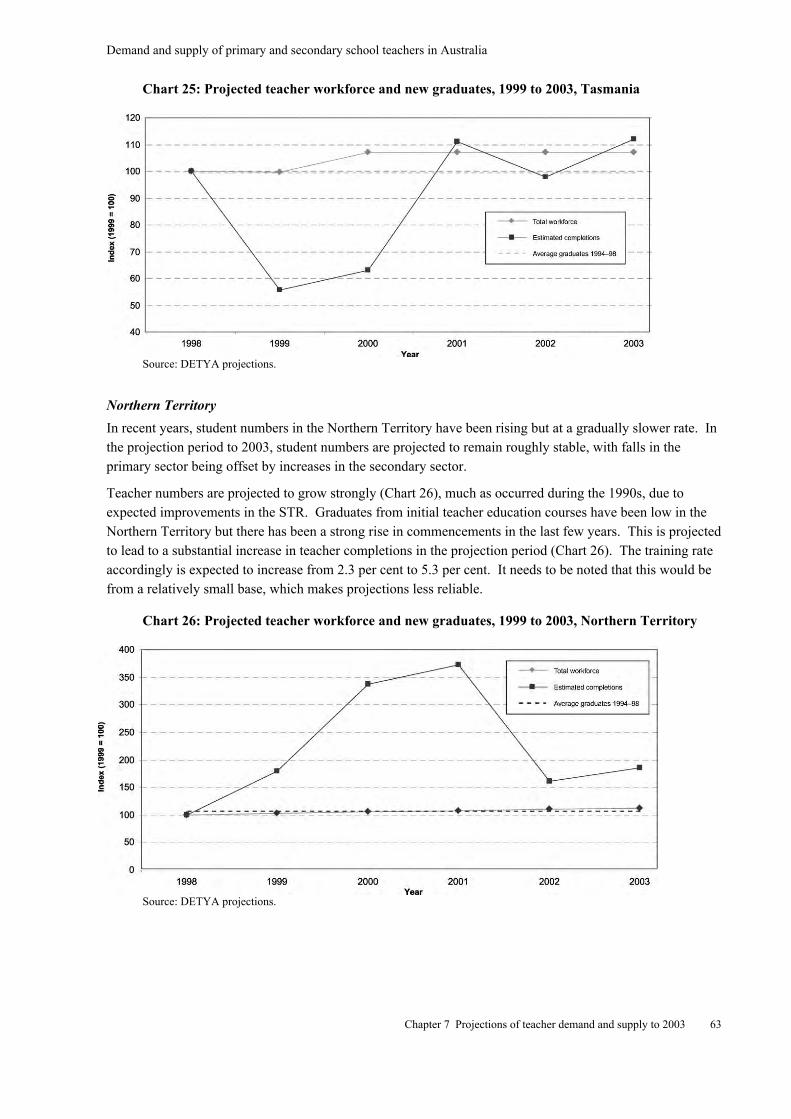
Demand and supply of primary and secondary school teachers in Australia
Chapter 7 Projections of teacher demand and supply to 2003 63
Chart 25: Projected teacher workforce and new graduates, 1999 to 2003, Tasmania
Source: DETYA projections.
Northern Territory
In recent years, student numbers in the Northern Territory have been rising but at a gradually slower rate. Inthe projection period to 2003, student numbers are projected to remain roughly stable, with falls in theprimary sector being offset by increases in the secondary sector.
Teacher numbers are projected to grow strongly (Chart 26), much as occurred during the 1990s, due toexpected improvements in the STR. Graduates from initial teacher education courses have been low in theNorthern Territory but there has been a strong rise in commencements in the last few years. This is projectedto lead to a substantial increase in teacher completions in the projection period (Chart 26). The training rateaccordingly is expected to increase from 2.3 per cent to 5.3 per cent. It needs to be noted that this would befrom a relatively small base, which makes projections less reliable.
Chart 26: Projected teacher workforce and new graduates, 1999 to 2003, Northern Territory
Source: DETYA projections.
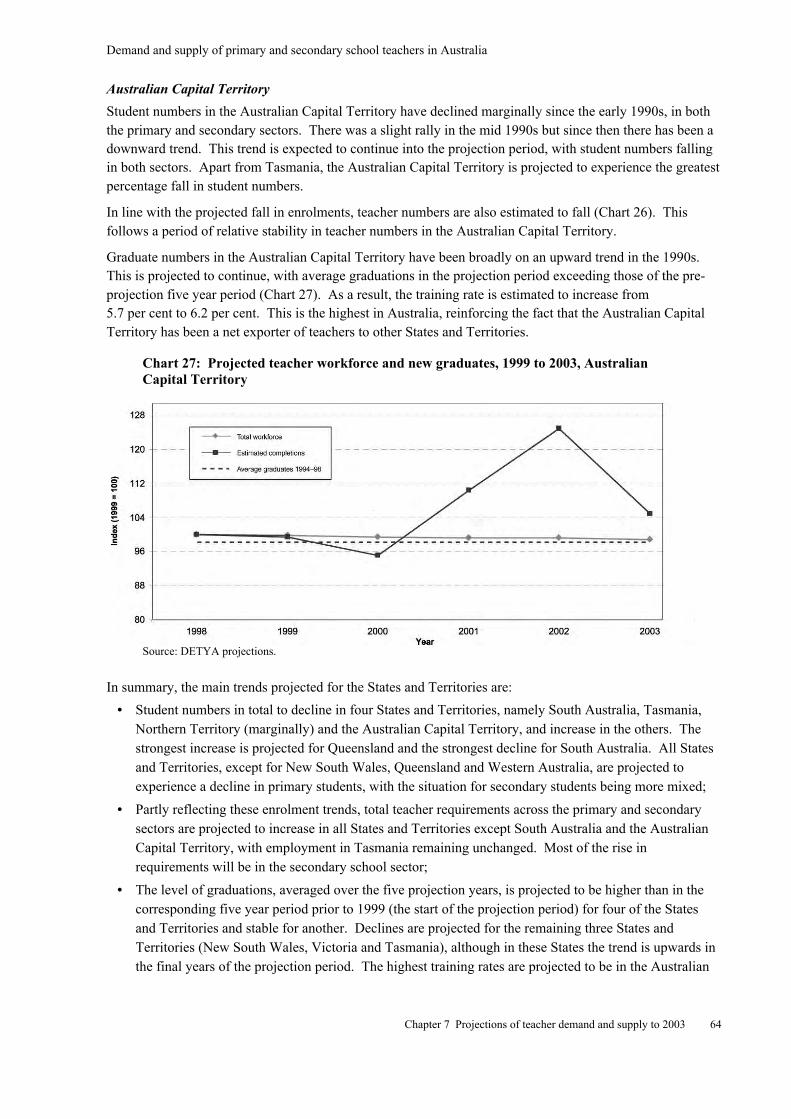
Demand and supply of primary and secondary school teachers in Australia
Chapter 7 Projections of teacher demand and supply to 2003 64
Australian Capital Territory
Student numbers in the Australian Capital Territory have declined marginally since the early 1990s, in boththe primary and secondary sectors. There was a slight rally in the mid 1990s but since then there has been adownward trend. This trend is expected to continue into the projection period, with student numbers fallingin both sectors. Apart from Tasmania, the Australian Capital Territory is projected to experience the greatestpercentage fall in student numbers.
In line with the projected fall in enrolments, teacher numbers are also estimated to fall (Chart 26). Thisfollows a period of relative stability in teacher numbers in the Australian Capital Territory.
Graduate numbers in the Australian Capital Territory have been broadly on an upward trend in the 1990s.This is projected to continue, with average graduations in the projection period exceeding those of the pre-projection five year period (Chart 27). As a result, the training rate is estimated to increase from5.7 per cent to 6.2 per cent. This is the highest in Australia, reinforcing the fact that the Australian CapitalTerritory has been a net exporter of teachers to other States and Territories.
Chart 27: Projected teacher workforce and new graduates, 1999 to 2003, AustralianCapital Territory
Source: DETYA projections.
In summary, the main trends projected for the States and Territories are:
• Student numbers in total to decline in four States and Territories, namely South Australia, Tasmania,Northern Territory (marginally) and the Australian Capital Territory, and increase in the others. Thestrongest increase is projected for Queensland and the strongest decline for South Australia. All Statesand Territories, except for New South Wales, Queensland and Western Australia, are projected toexperience a decline in primary students, with the situation for secondary students being more mixed;
• Partly reflecting these enrolment trends, total teacher requirements across the primary and secondarysectors are projected to increase in all States and Territories except South Australia and the AustralianCapital Territory, with employment in Tasmania remaining unchanged. Most of the rise inrequirements will be in the secondary school sector;
• The level of graduations, averaged over the five projection years, is projected to be higher than in thecorresponding five year period prior to 1999 (the start of the projection period) for four of the Statesand Territories and stable for another. Declines are projected for the remaining three States andTerritories (New South Wales, Victoria and Tasmania), although in these States the trend is upwards inthe final years of the projection period. The highest training rates are projected to be in the Australian
Demand and supply of primary and secondary school teachers in Australia
Chapter 7 Projections of teacher demand and supply to 2003 65
Capital Territory, Queensland, the Northern Territory (but from a low and variable base) andWestern Australia.
Flexibilities and scope for adjustment in the teacher labour market
While it has been possible using the available information to make an assessment of the extent to whichprojected graduations in the next few years may be adequate to meet the need for new teachers in theAustralian teacher labour market as a whole, appropriate data to make a similar assessment at the State andTerritory level are not available. In particular, there is no information at the State/Territory level on netreplacement rates, which are essential for making an informed assessment of the loss of teachers to theteaching profession within a State. These rates can be expected to vary significantly across the variousjurisdictions, reflecting differences in operation of the teacher labour markets across the States andTerritories and differences in opportunities available for people with teacher qualifications in the broaderlocal and State labour markets.
However, even if it were found that in one State or Territory the training rate is insufficient by itself toprovide enough new graduates to ensure that the State teacher labour market remains in balance, this doesnot mean that the State or Territory will automatically experience shortages of teachers. There are a numberof sources of flexibility in the system which enable the State and Territory teacher labour market to adjust tosome extent to potential imbalances between supply and demand. These sources are essentially of two kinds:
• options available to management within a single jurisdiction, such as the State education system. Thesecan be classed as essentially ‘internal flexibilities’.
• some adjustments are possible by way of movements across jurisdictions. For instance, teachers canmove from the government education system to the non-government system in the same State, and viceversa; or they can move from one State or Territory to another. These adjustments provide options for‘external flexibility’.
This section discusses briefly some of these sources of flexibility.
Adjustments within a jurisdiction (internal flexibilities)
If there is an unexpected surge in demand for teachers within the jurisdiction, or a shortfall develops, whichcannot be met through additional recruitment of staff because of a general shortage of teachers in the labourmarket, managers within the education authorities have a number of options at their disposal for dealing withthe problem. These could include:
• allowing the STRs to rise by a small amount. A rise in the STR by one half of a percentage point in thesecondary sector in any one jurisdiction is equivalent to reducing demand for teachers by about four percent, which is slightly less than the annual output of teaching graduates in that jurisdiction;
• delaying the granting of long service leave and other leave arrangements to retain existing teacherslonger;
• providing more hours of work to those currently working part-time (on a permanent or casual basis) andextending the term of appointment to fixed term contract teachers;
• making greater use of the pool of relief teachers and those registered for vacancies in teaching; and
• re-allocating teaching tasks to make the best use of available teachers, especially if the demand/shortageis for particular types of skills (e.g. mathematics or languages other than English).
A number of these measures have been used successfully in Australia in the past in the context ofovercoming recruitment difficulties. Some of these have already been reported by the States and Territoriesin Chapter 3.
Demand and supply of primary and secondary school teachers in Australia
Chapter 7 Projections of teacher demand and supply to 2003 66
Adjustments through teacher movements between jurisdictions (external flexibilities)
Education jurisdictions and State labour markets do not operate in isolation. There is a significant movementof teachers between jurisdictions within a State and, importantly, between States. This provides an importantsource of flexibility in the labour market. The extent of these movements is discussed below.
Movement of teachers between jurisdictions within the same State/Territory
Data on movement of teachers between jurisdictions is not available, although it is known to be an importantway by which teachers gain promotions and schools expand in areas of need. Some indication of the extentof this can be gleaned from the data on separations from the government school sector nationally andcomparing this to the net replacement rate. An important source for the difference between these twomeasures (of the order of 1-2 percentage points) is likely to be the net flow of teachers out of the governmentsector into the non-government sector, which has been growing faster than the government sector.
Interstate movements of teachers
Interstate movements can be an important source of flexibility in the teacher labour markets, with surplusteachers from one State or Territory helping to overcome shortages in other jurisdictions. Table 14 providesan indication of the flow of new teacher graduates across State borders to gain employment. The data isbased on the Graduate Destination survey undertaken by the Graduate Careers Council of Australia of 1998graduates. These data relate to new teaching graduates who obtained a job in teaching by the time of thesurvey (April 1999).
The first point to note is that around 8.4 per cent of graduates in Australia who found employment soon aftergraduation moved from the State where they obtained their qualification. The proportion varied from almosttwo thirds in the Australian Capital Territory to less than 3 per cent in Queensland. There was somemovement out of the State even in those States which were net gainers of graduates, like the NorthernTerritory and Tasmania. This is quite normal in the labour market for graduates as they seek out the bestopportunities in the labour market.
In the case of New South Wales, South Australia and the Australian Capital Territory, during 1999 a greaternumber of new teaching graduates left the State to take up a teaching position than came into the State forthe same reason. These States could be considered to have been net exporters of new teacher graduatesduring 1999.
Most of the New South Wales graduates who leave the State go to Queensland. South Australian graduatesto the Northern Territory and Victoria; and ACT graduates go to New South Wales.
The States which are net importers of new graduate teachers are the Northern Territory and Queensland and,to a lesser extent, Tasmania. The Northern Territory obtains new graduate teachers from New South Wales,Victoria and South Australia. The main contributor to the Queensland teacher market is New South Wales.
It must be emphasised that this relates only to the movement of new teaching graduates. Graduates ofprevious years and currently employed teachers are not included in the Graduate Destination Survey.(To illustrate this, in the case of New South Wales a number of interstate teachers and interstateteaching graduates of previous years apply for employment with the Department of Education and Trainingeach year.)
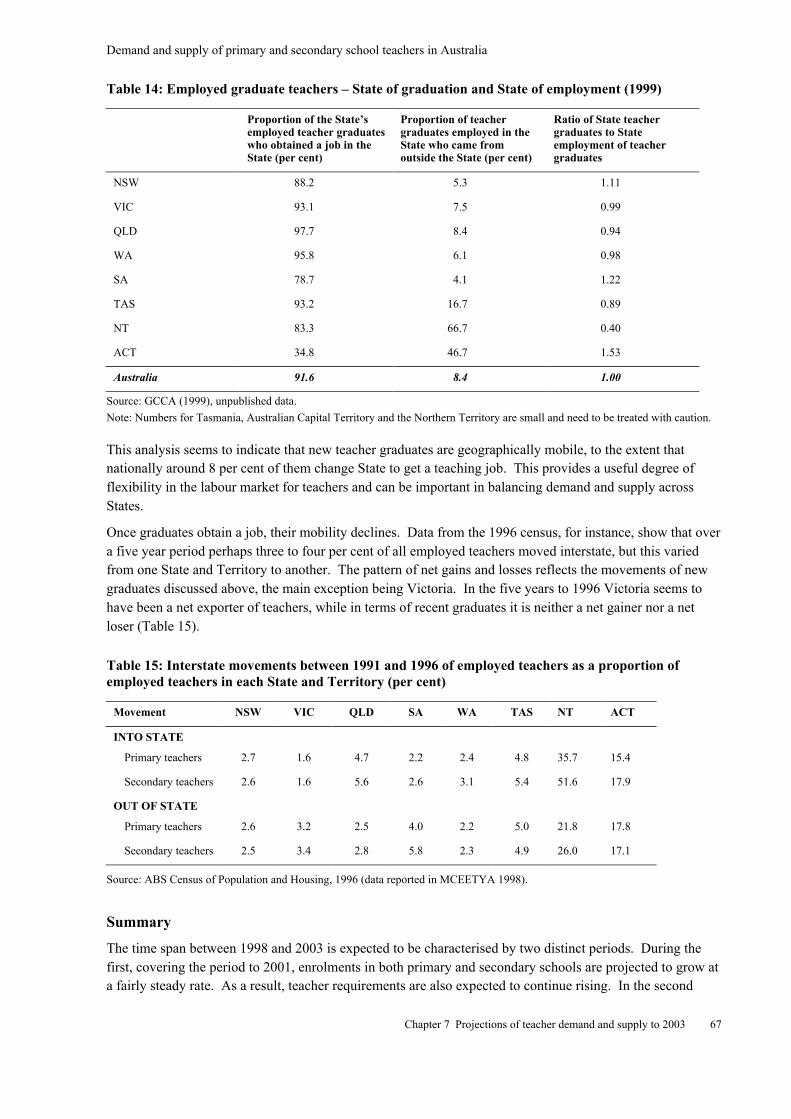
Demand and supply of primary and secondary school teachers in Australia
Chapter 7 Projections of teacher demand and supply to 2003 67
Table 14: Employed graduate teachers – State of graduation and State of employment (1999)
Proportion of the State’semployed teacher graduateswho obtained a job in theState (per cent)
Proportion of teachergraduates employed in theState who came fromoutside the State (per cent)
Ratio of State teachergraduates to Stateemployment of teachergraduates
NSW 88.2 5.3 1.11
VIC 93.1 7.5 0.99
QLD 97.7 8.4 0.94
WA 95.8 6.1 0.98
SA 78.7 4.1 1.22
TAS 93.2 16.7 0.89
NT 83.3 66.7 0.40
ACT 34.8 46.7 1.53
Australia 91.6 8.4 1.00
Source: GCCA (1999), unpublished data.
Note: Numbers for Tasmania, Australian Capital Territory and the Northern Territory are small and need to be treated with caution.
This analysis seems to indicate that new teacher graduates are geographically mobile, to the extent thatnationally around 8 per cent of them change State to get a teaching job. This provides a useful degree offlexibility in the labour market for teachers and can be important in balancing demand and supply acrossStates.
Once graduates obtain a job, their mobility declines. Data from the 1996 census, for instance, show that overa five year period perhaps three to four per cent of all employed teachers moved interstate, but this variedfrom one State and Territory to another. The pattern of net gains and losses reflects the movements of newgraduates discussed above, the main exception being Victoria. In the five years to 1996 Victoria seems tohave been a net exporter of teachers, while in terms of recent graduates it is neither a net gainer nor a netloser (Table 15).
Table 15: Interstate movements between 1991 and 1996 of employed teachers as a proportion ofemployed teachers in each State and Territory (per cent)
Movement NSW VIC QLD SA WA TAS NT ACT
INTO STATE
Primary teachers 2.7 1.6 4.7 2.2 2.4 4.8 35.7 15.4
Secondary teachers 2.6 1.6 5.6 2.6 3.1 5.4 51.6 17.9
OUT OF STATE
Primary teachers 2.6 3.2 2.5 4.0 2.2 5.0 21.8 17.8
Secondary teachers 2.5 3.4 2.8 5.8 2.3 4.9 26.0 17.1
Source: ABS Census of Population and Housing, 1996 (data reported in MCEETYA 1998).
Summary
The time span between 1998 and 2003 is expected to be characterised by two distinct periods. During thefirst, covering the period to 2001, enrolments in both primary and secondary schools are projected to grow ata fairly steady rate. As a result, teacher requirements are also expected to continue rising. In the second
Demand and supply of primary and secondary school teachers in Australia
Chapter 7 Projections of teacher demand and supply to 2003 68
period, between 2001 and 2003, enrolments in the primary sector are expected to flatten out while those inthe secondary sector are projected to continue growing but at a slower pace. Teacher requirements areexpected to follow suit.
The slow growth in teacher requirements in the four years to 2003 is therefore expected to generate the needfor under 1500 additional recruits a year. The biggest component of recruitment needs, summed over thegovernment and non-government sectors, will arise from the need to replace retiring teachers and teacherswho resign, some of them to go to another jurisdiction. On average, this is estimated to come to around 11000 teachers a year in this period. Other sources through which teachers leave the teaching workforce, suchas long term leave, roughly balance out with the number of teachers returning from long term leave.
This estimate of retirements and resignations overstates the loss of teachers from the teaching profession assome resignations involve leaving one teaching jurisdiction to go to another rather than exit from teaching.A better measure of the loss of teachers is the “net replacement rate” calculated by researchers at MonashUniversity, although this tends to understate the teacher loss somewhat. The net replacement rate has beenestimated at roughly 3 per cent of the teaching workforce or 7000 teachers a year in the period to 2003.
Ignoring any surplus teachers available to take up positions in teaching when these become available,balance in the labour market requires that new graduates equal the teacher loss rate plus growth inrequirements. On this basis, there is a need for at least 8500 new graduates a year (1500 growth plus 7000loss). This compares with a projected level of teaching graduates available for teaching of the order of 9000a year in the four years to 2003, suggesting that at the national level graduations should be broadly adequateto meet requirements over that time period. In addition, there is a buffer of teaching resources available inmost States in the pools of relief, casual and other teachers currently under-employed (or not employed atall) in teaching.
It has not been possible to undertake a similar analysis for each of the States and Territories because of datalimitations. However, even if an analysis of this kind were to indicate that graduations from a particularState or Territory came in under the level required to maintain balance in the labour market, some under-production of graduates can be maintained for a period if there is already a pool of surplus or under-employed teachers. This is the case at the moment in a number of States and Territories. Furthermore,interstate migration of new graduates provides a further source of flexibility to even out supply and demand.
Looking at projected trends in student numbers, teacher employment and graduation within the States andTerritories shows significant expected variations across Australia. Student numbers are projected to declinein four States and Territories and increase in the others. The strongest increase is projected for Queensland,followed by Western Australia, and the strongest decline for Tasmania. Teacher requirements across theprimary and secondary sectors are projected to increase in all of the States and Territories, with increasingstudent numbers as well as two of the States and Territories with declining student numbers (i.e. Tasmaniaand the Northern Territory). Most of the rise in teacher requirements is projected to occur in the secondaryschool sector.
While nationally graduations are on the rise in the period to 2003, some States and Territories areexpected to experience declines. The average training rate (i.e. the ratio of graduations to theteacher workforce) over the period 1998 to 2003 is projected to increase in Queensland, WesternAustralia, the Northern Territory and the Australian Capital Territory and remain unchanged inSouth Australia. In part this reflects differential rates of growth in enrolments between the Statesand Territories noting, for example, that Queensland and Western Australia are the two States withthe fastest growing student populations. However, other State-based factors are also at play in otherjurisdictions.
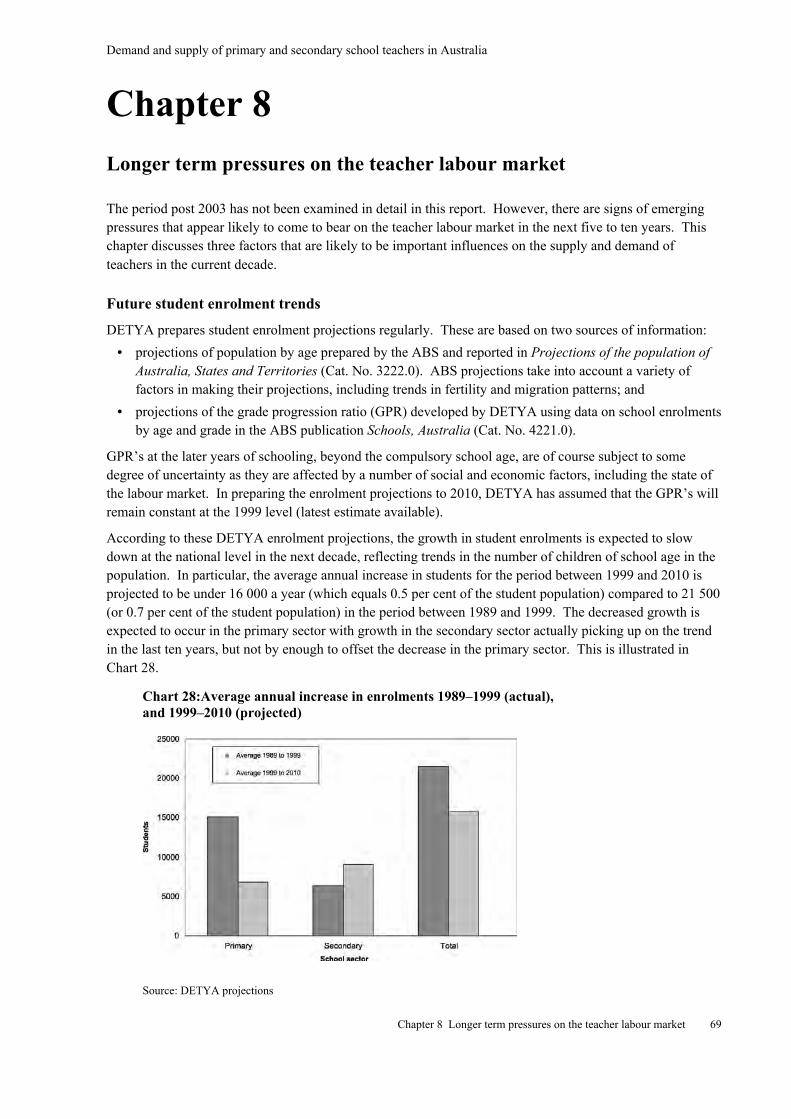
Demand and supply of primary and secondary school teachers in Australia
Chapter 8 Longer term pressures on the teacher labour market 69
Chapter 8
Longer term pressures on the teacher labour market
The period post 2003 has not been examined in detail in this report. However, there are signs of emergingpressures that appear likely to come to bear on the teacher labour market in the next five to ten years. Thischapter discusses three factors that are likely to be important influences on the supply and demand ofteachers in the current decade.
Future student enrolment trends
DETYA prepares student enrolment projections regularly. These are based on two sources of information:
• projections of population by age prepared by the ABS and reported in Projections of the population ofAustralia, States and Territories (Cat. No. 3222.0). ABS projections take into account a variety offactors in making their projections, including trends in fertility and migration patterns; and
• projections of the grade progression ratio (GPR) developed by DETYA using data on school enrolmentsby age and grade in the ABS publication Schools, Australia (Cat. No. 4221.0).
GPR’s at the later years of schooling, beyond the compulsory school age, are of course subject to somedegree of uncertainty as they are affected by a number of social and economic factors, including the state ofthe labour market. In preparing the enrolment projections to 2010, DETYA has assumed that the GPR’s willremain constant at the 1999 level (latest estimate available).
According to these DETYA enrolment projections, the growth in student enrolments is expected to slowdown at the national level in the next decade, reflecting trends in the number of children of school age in thepopulation. In particular, the average annual increase in students for the period between 1999 and 2010 isprojected to be under 16 000 a year (which equals 0.5 per cent of the student population) compared to 21 500(or 0.7 per cent of the student population) in the period between 1989 and 1999. The decreased growth isexpected to occur in the primary sector with growth in the secondary sector actually picking up on the trendin the last ten years, but not by enough to offset the decrease in the primary sector. This is illustrated inChart 28.
Chart 28:Average annual increase in enrolments 1989–1999 (actual),and 1999–2010 (projected)
Source: DETYA projections
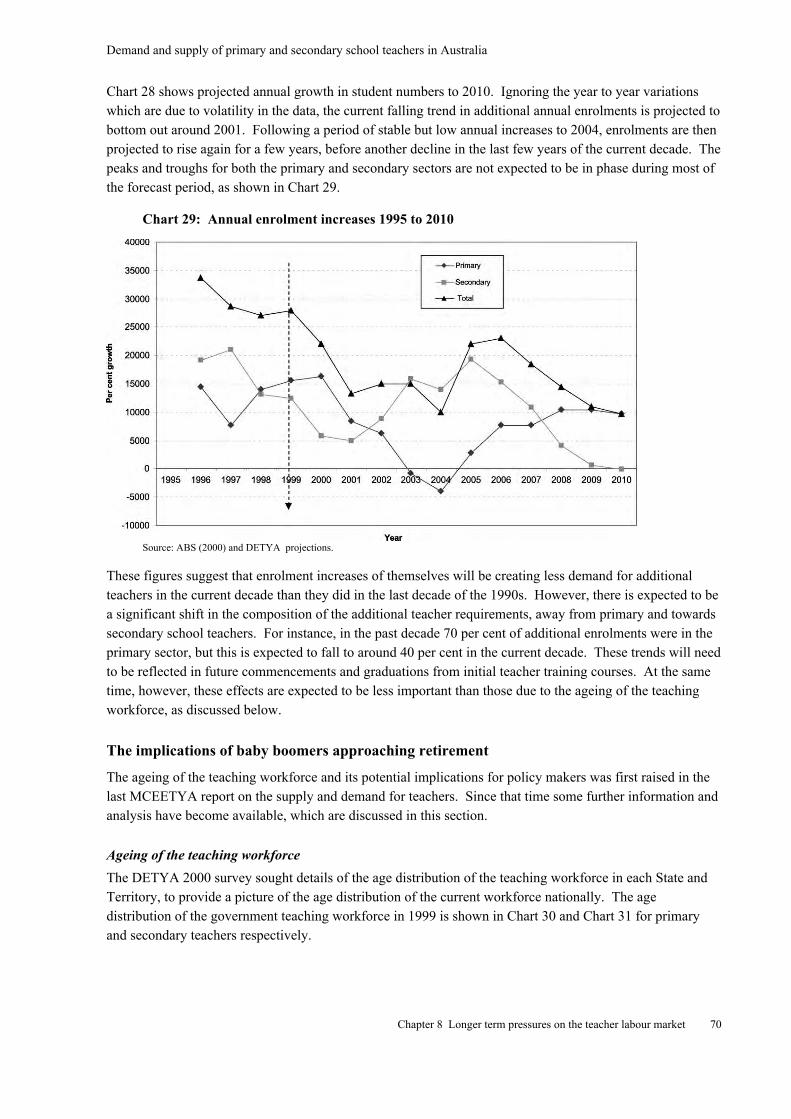
Demand and supply of primary and secondary school teachers in Australia
Chapter 8 Longer term pressures on the teacher labour market 70
Chart 28 shows projected annual growth in student numbers to 2010. Ignoring the year to year variationswhich are due to volatility in the data, the current falling trend in additional annual enrolments is projected tobottom out around 2001. Following a period of stable but low annual increases to 2004, enrolments are thenprojected to rise again for a few years, before another decline in the last few years of the current decade. Thepeaks and troughs for both the primary and secondary sectors are not expected to be in phase during most ofthe forecast period, as shown in Chart 29.
Chart 29: Annual enrolment increases 1995 to 2010
Source: ABS (2000) and DETYA projections.
These figures suggest that enrolment increases of themselves will be creating less demand for additionalteachers in the current decade than they did in the last decade of the 1990s. However, there is expected to bea significant shift in the composition of the additional teacher requirements, away from primary and towardssecondary school teachers. For instance, in the past decade 70 per cent of additional enrolments were in theprimary sector, but this is expected to fall to around 40 per cent in the current decade. These trends will needto be reflected in future commencements and graduations from initial teacher training courses. At the sametime, however, these effects are expected to be less important than those due to the ageing of the teachingworkforce, as discussed below.
The implications of baby boomers approaching retirement
The ageing of the teaching workforce and its potential implications for policy makers was first raised in thelast MCEETYA report on the supply and demand for teachers. Since that time some further information andanalysis have become available, which are discussed in this section.
Ageing of the teaching workforce
The DETYA 2000 survey sought details of the age distribution of the teaching workforce in each State andTerritory, to provide a picture of the age distribution of the current workforce nationally. The agedistribution of the government teaching workforce in 1999 is shown in Chart 30 and Chart 31 for primaryand secondary teachers respectively.
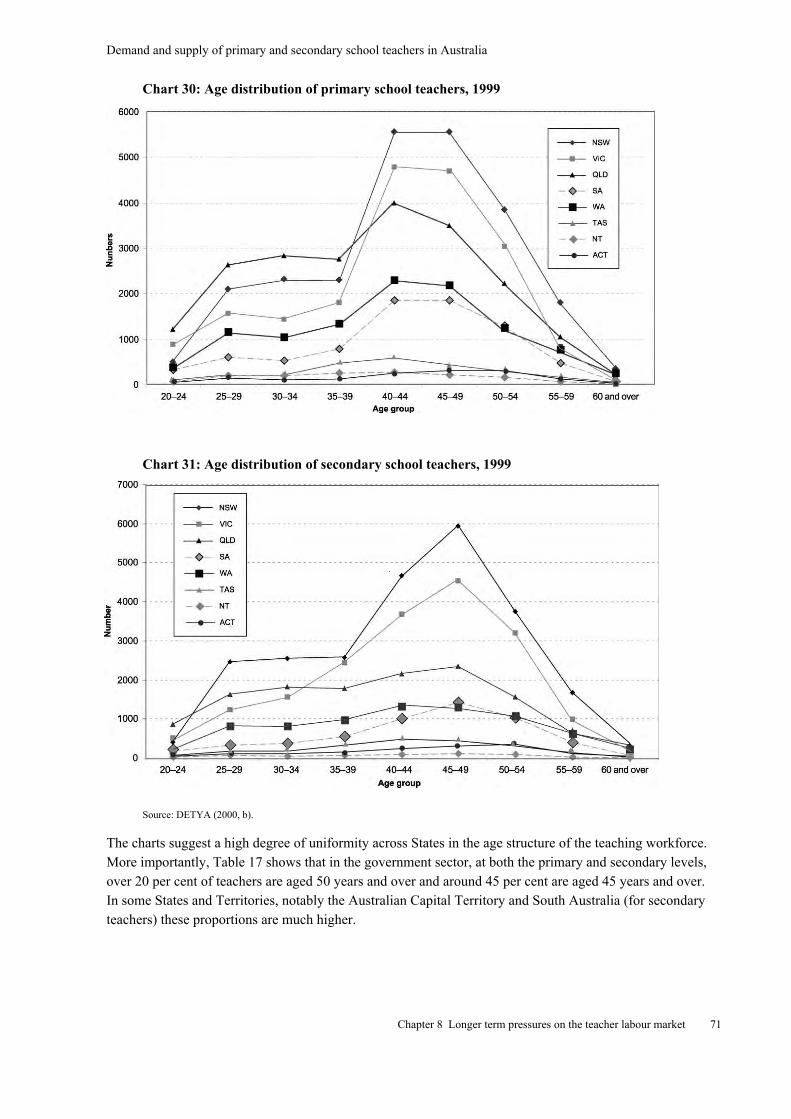
Demand and supply of primary and secondary school teachers in Australia
Chapter 8 Longer term pressures on the teacher labour market 71
Chart 30: Age distribution of primary school teachers, 1999
Chart 31: Age distribution of secondary school teachers, 1999
Source: DETYA (2000, b).
The charts suggest a high degree of uniformity across States in the age structure of the teaching workforce.More importantly, Table 17 shows that in the government sector, at both the primary and secondary levels,over 20 per cent of teachers are aged 50 years and over and around 45 per cent are aged 45 years and over.In some States and Territories, notably the Australian Capital Territory and South Australia (for secondaryteachers) these proportions are much higher.
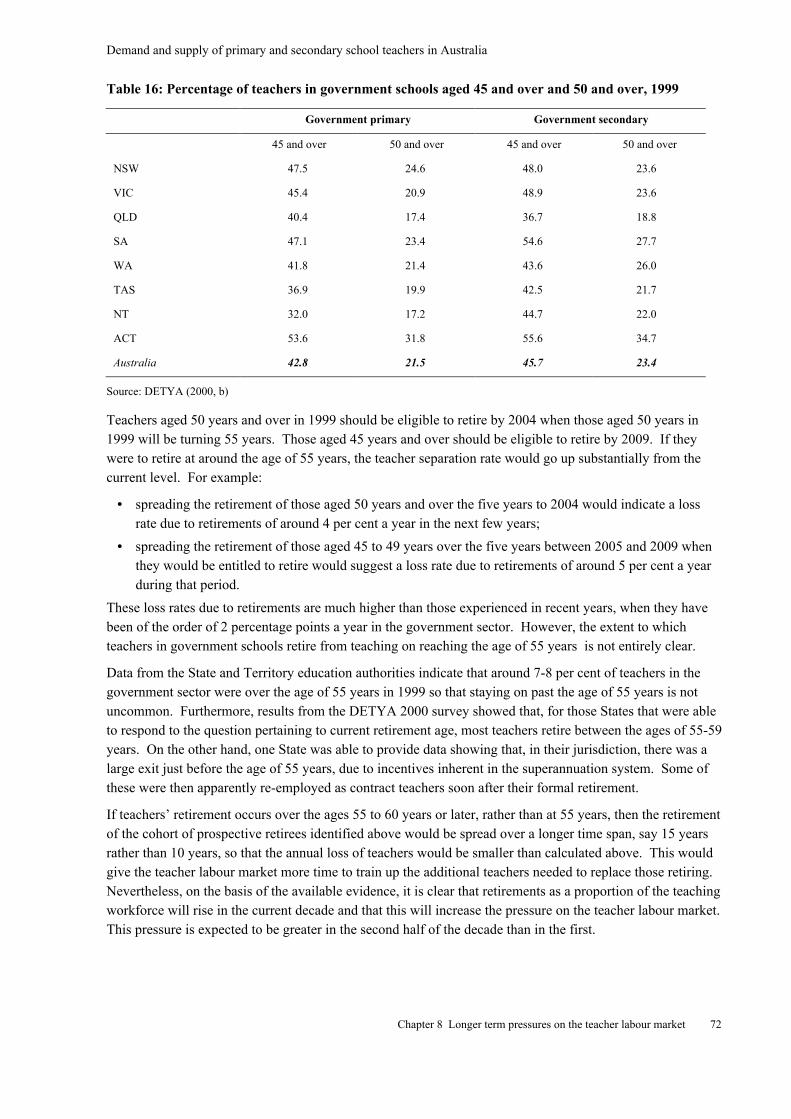
Demand and supply of primary and secondary school teachers in Australia
Chapter 8 Longer term pressures on the teacher labour market 72
Table 16: Percentage of teachers in government schools aged 45 and over and 50 and over, 1999
Government primary Government secondary
45 and over 50 and over 45 and over 50 and over
NSW 47.5 24.6 48.0 23.6
VIC 45.4 20.9 48.9 23.6
QLD 40.4 17.4 36.7 18.8
SA 47.1 23.4 54.6 27.7
WA 41.8 21.4 43.6 26.0
TAS 36.9 19.9 42.5 21.7
NT 32.0 17.2 44.7 22.0
ACT 53.6 31.8 55.6 34.7
Australia 42.8 21.5 45.7 23.4
Source: DETYA (2000, b)
Teachers aged 50 years and over in 1999 should be eligible to retire by 2004 when those aged 50 years in1999 will be turning 55 years. Those aged 45 years and over should be eligible to retire by 2009. If theywere to retire at around the age of 55 years, the teacher separation rate would go up substantially from thecurrent level. For example:
• spreading the retirement of those aged 50 years and over the five years to 2004 would indicate a lossrate due to retirements of around 4 per cent a year in the next few years;
• spreading the retirement of those aged 45 to 49 years over the five years between 2005 and 2009 whenthey would be entitled to retire would suggest a loss rate due to retirements of around 5 per cent a yearduring that period.
These loss rates due to retirements are much higher than those experienced in recent years, when they havebeen of the order of 2 percentage points a year in the government sector. However, the extent to whichteachers in government schools retire from teaching on reaching the age of 55 years is not entirely clear.
Data from the State and Territory education authorities indicate that around 7-8 per cent of teachers in thegovernment sector were over the age of 55 years in 1999 so that staying on past the age of 55 years is notuncommon. Furthermore, results from the DETYA 2000 survey showed that, for those States that were ableto respond to the question pertaining to current retirement age, most teachers retire between the ages of 55-59years. On the other hand, one State was able to provide data showing that, in their jurisdiction, there was alarge exit just before the age of 55 years, due to incentives inherent in the superannuation system. Some ofthese were then apparently re-employed as contract teachers soon after their formal retirement.
If teachers’ retirement occurs over the ages 55 to 60 years or later, rather than at 55 years, then the retirementof the cohort of prospective retirees identified above would be spread over a longer time span, say 15 yearsrather than 10 years, so that the annual loss of teachers would be smaller than calculated above. This wouldgive the teacher labour market more time to train up the additional teachers needed to replace those retiring.Nevertheless, on the basis of the available evidence, it is clear that retirements as a proportion of the teachingworkforce will rise in the current decade and that this will increase the pressure on the teacher labour market.This pressure is expected to be greater in the second half of the decade than in the first.
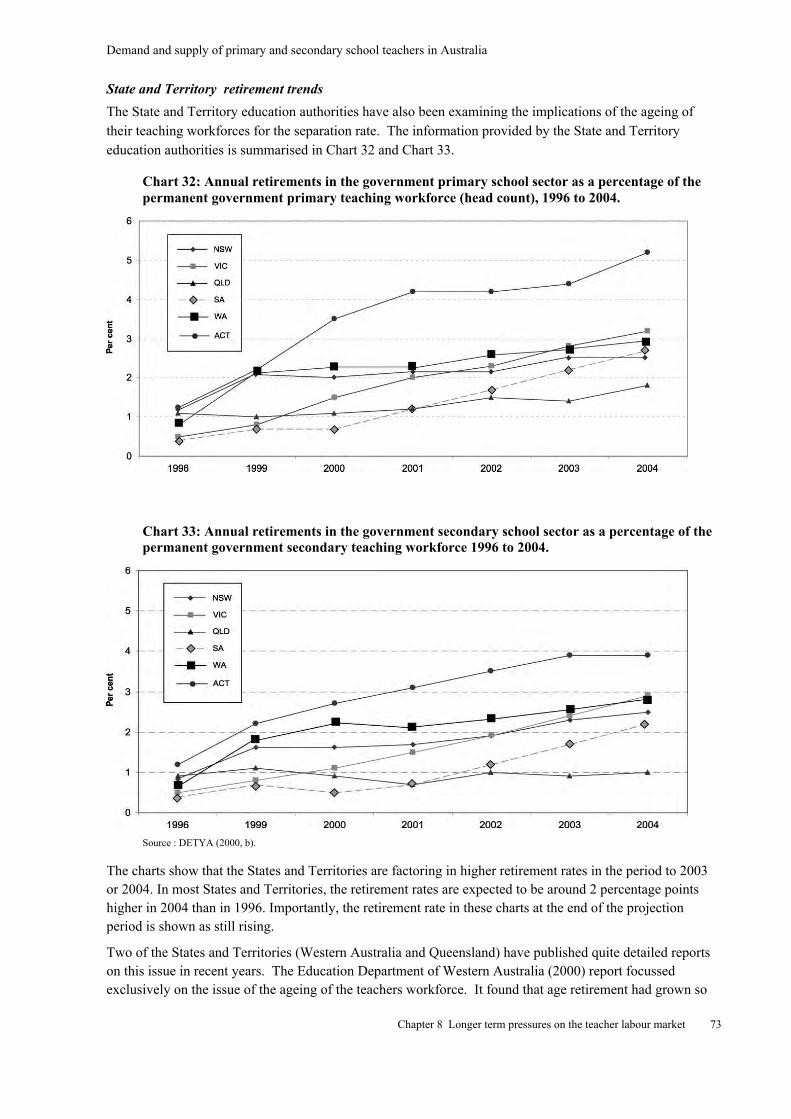
Demand and supply of primary and secondary school teachers in Australia
Chapter 8 Longer term pressures on the teacher labour market 73
State and Territory retirement trends
The State and Territory education authorities have also been examining the implications of the ageing oftheir teaching workforces for the separation rate. The information provided by the State and Territoryeducation authorities is summarised in Chart 32 and Chart 33.
Chart 32: Annual retirements in the government primary school sector as a percentage of thepermanent government primary teaching workforce (head count), 1996 to 2004.
Chart 33: Annual retirements in the government secondary school sector as a percentage of thepermanent government secondary teaching workforce 1996 to 2004.
Source : DETYA (2000, b).
The charts show that the States and Territories are factoring in higher retirement rates in the period to 2003or 2004. In most States and Territories, the retirement rates are expected to be around 2 percentage pointshigher in 2004 than in 1996. Importantly, the retirement rate in these charts at the end of the projectionperiod is shown as still rising.
Two of the States and Territories (Western Australia and Queensland) have published quite detailed reportson this issue in recent years. The Education Department of Western Australia (2000) report focussedexclusively on the issue of the ageing of the teachers workforce. It found that age retirement had grown so
Demand and supply of primary and secondary school teachers in Australia
Chapter 8 Longer term pressures on the teacher labour market 74
that in 2000 it represented about one third of overall separations and that this proportion appeared to be onthe increase. Projections of retirements indicate that the over 55 group could more than double over theperiod 2000 to 2010.
The Education Queensland (2000) report expected retirement levels to double between 1999 and 2009. Thiswould mean that retirements which were less than 1 per cent a year in the late 1990s could rise to more than2 per cent a year per annum by 2009.
Summary on the implications of the ageing of the teacher workforce
On the basis of the available evidence and research, it is clear that retirements as a proportion of the teachingworkforce will rise in the current decade and that this will increase the pressure on the teacher labour market.Some impact is likely to be felt in the early years of the current decade but the impact is projected to begreater in the second half of the decade than in the first. As there is some uncertainty about the precisepattern of future retirements, it will be important for the States and Territories to monitor developments,including retirement intentions of teachers. There may be also be some scope to provide incentives todefer retirements.
Shortage of mathematics and science teachers
Every State and Territory education authority has indicated that it is experiencing difficulties in recruitingscience and mathematics teachers, more so than for other disciplines. This section explores the likely futureoutlook for this group of teachers, based on currently available evidence.
Characteristics of mathematics and science teachers in secondary schools
Teachers whose principal teaching area was mathematics comprised around 16 per cent of all secondaryschool teachers in the Australian Council of Education 1989 survey (see Logan et al 1990). As a point ofcomparison, English teachers accounted for just under 16 per cent of the secondary teaching workforce. Bycontrast, using the same definition, teachers of physical and earth sciences accounted for just over7 per cent of all teachers.
There is a fair degree of overlap between mathematics and science teaching. The Third InternationalMathematics and Science Study (TIMSS) conducted in 1994 indicated that around a third of mathematicsteachers also taught science (Lokan et al 1996). However the degree of overlap was lower for teachers whotaught in the later years of high school compared to those who taught Years 7 and 8, suggesting that teacherstend to be more specialised at the senior secondary school levels. However, in general both mathematics andscience teachers cover a range of year levels in their teaching.
Information from TIMSS showed that mathematics and science teachers had, on average, 15 years ofteaching experience and most commonly around 20 years of experience. This largely reflects the agestructure of the teaching workforce. In the intervening years this structure has progressively moved furthertowards the older age groups, so that the most recent survey of teachers in Australia is likely to show that theaverage age of mathematics and science teachers has increased.
There is limited information on the precise qualifications held by mathematics and science teachers althoughthe 1999 ACE survey collected information on the qualifications of Year 12 teachers in a broad range ofdisciplines (Dempster et al 2000). Among mathematics teachers, around 70.3 per cent had a degree with amajor in mathematics (compared to 82.7 per cent for English, for example). A further25.7 per cent had some university mathematics but less than a full major. However, around 4.0 per cent hadonly Year 12 mathematics or no formal study in mathematics. For physical or earth science teachers, nearly80 per cent had a degree with a major in those areas of science in which they were principally engaged, andonly 1.4 per cent had only Year 12 science. Much as in the case of mathematics, around 18.7 per cent had
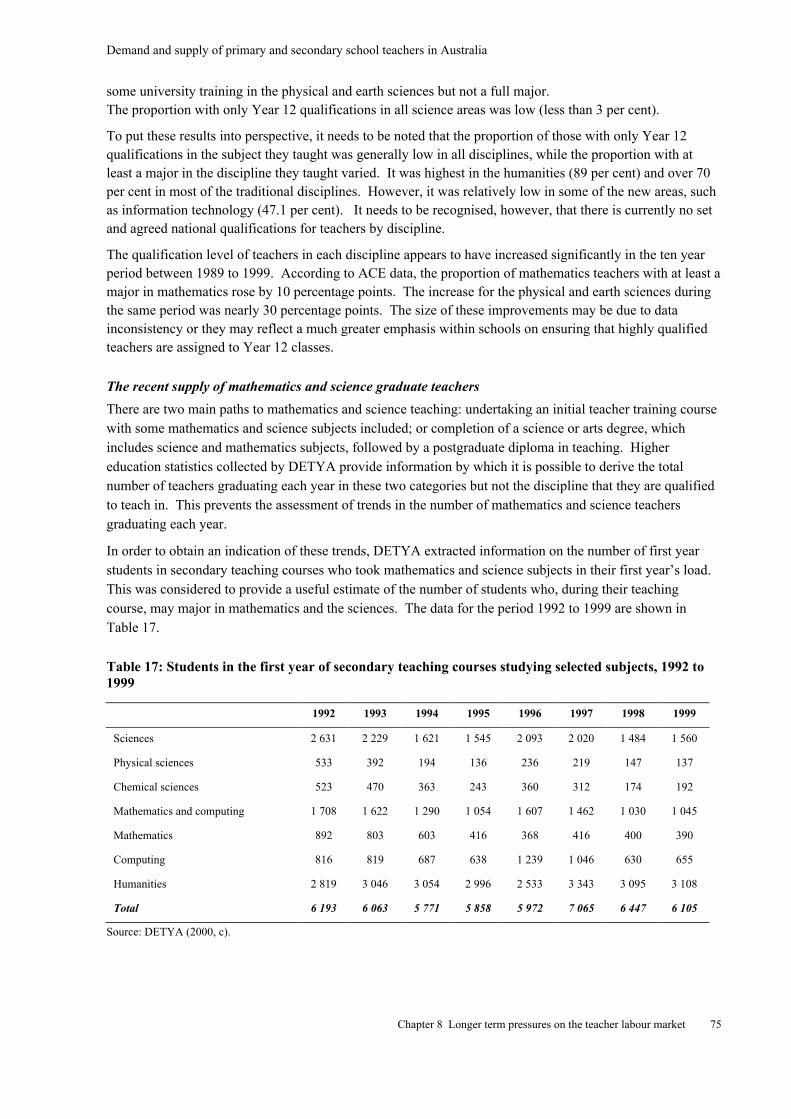
Demand and supply of primary and secondary school teachers in Australia
Chapter 8 Longer term pressures on the teacher labour market 75
some university training in the physical and earth sciences but not a full major.The proportion with only Year 12 qualifications in all science areas was low (less than 3 per cent).
To put these results into perspective, it needs to be noted that the proportion of those with only Year 12qualifications in the subject they taught was generally low in all disciplines, while the proportion with atleast a major in the discipline they taught varied. It was highest in the humanities (89 per cent) and over 70per cent in most of the traditional disciplines. However, it was relatively low in some of the new areas, suchas information technology (47.1 per cent). It needs to be recognised, however, that there is currently no setand agreed national qualifications for teachers by discipline.
The qualification level of teachers in each discipline appears to have increased significantly in the ten yearperiod between 1989 to 1999. According to ACE data, the proportion of mathematics teachers with at least amajor in mathematics rose by 10 percentage points. The increase for the physical and earth sciences duringthe same period was nearly 30 percentage points. The size of these improvements may be due to datainconsistency or they may reflect a much greater emphasis within schools on ensuring that highly qualifiedteachers are assigned to Year 12 classes.
The recent supply of mathematics and science graduate teachers
There are two main paths to mathematics and science teaching: undertaking an initial teacher training coursewith some mathematics and science subjects included; or completion of a science or arts degree, whichincludes science and mathematics subjects, followed by a postgraduate diploma in teaching. Highereducation statistics collected by DETYA provide information by which it is possible to derive the totalnumber of teachers graduating each year in these two categories but not the discipline that they are qualifiedto teach in. This prevents the assessment of trends in the number of mathematics and science teachersgraduating each year.
In order to obtain an indication of these trends, DETYA extracted information on the number of first yearstudents in secondary teaching courses who took mathematics and science subjects in their first year’s load.This was considered to provide a useful estimate of the number of students who, during their teachingcourse, may major in mathematics and the sciences. The data for the period 1992 to 1999 are shown inTable 17.
Table 17: Students in the first year of secondary teaching courses studying selected subjects, 1992 to1999
1992 1993 1994 1995 1996 1997 1998 1999
Sciences 2 631 2 229 1 621 1 545 2 093 2 020 1 484 1 560
Physical sciences 533 392 194 136 236 219 147 137
Chemical sciences 523 470 363 243 360 312 174 192
Mathematics and computing 1 708 1 622 1 290 1 054 1 607 1 462 1 030 1 045
Mathematics 892 803 603 416 368 416 400 390
Computing 816 819 687 638 1 239 1 046 630 655
Humanities 2 819 3 046 3 054 2 996 2 533 3 343 3 095 3 108
Total 6 193 6 063 5 771 5 858 5 972 7 065 6 447 6 105
Source: DETYA (2000, c).
Demand and supply of primary and secondary school teachers in Australia
Chapter 8 Longer term pressures on the teacher labour market 76
Table 17 shows that in the 7 year period between 1992 and 1999 the total number of students in secondaryteaching courses remained more or less the same. In some subjects, like the humanities, student numbersalso stayed at a fairly constant level. However, the situation was quite different for both mathematics andscience.
The number of teaching students who studied science fell both in absolute terms and as a proportion of allteaching students. The falls were particularly marked for the physical and chemical sciences, where thenumber of students more than halved during this time. A similar trend is evident for students in themathematical sciences and, to a lesser extent, in computing although trends in the latter are masked byunusually high figures for 1996 and 1997 which might reflect data recording problems rather than actualincreases in student numbers. Assuming that the number of graduates who followed the second path intoteaching exhibited the same trend, these data suggest that the number of new science and mathematicsteachers may have been declining significantly during the 1990s. Similar findings were reported in Dobsonand Calderon (1999).
Factors likely to affect the supply of mathematics and science teachers
A number of factors have been advanced in the literature for these results:
• a decline in interest among secondary and university students in mathematics and science;
• negative attitudes to teaching among mathematics and science teachers;
• greater opportunities in other fields among those with good mathematics and science abilities.
These factors are discussed briefly below.
Decline in interest among secondary and university students in mathematics and science
The report Subject choice by students in Year 12 in Australian Secondary Schools (Fullarton and Ainley2000) indicates that in 1998 around 87.5 per cent of all Year 12 students studied mathematics and around 60per cent studied some science. Expressed as a percentage of all subject enrolments, mathematics represented17.7 per cent of all full-time equivalent subject enrolments (slightly down from 17.9 per cent five yearsearlier); and science represented 15.2 per cent, down from 17.2 per cent five years earlier.
This suggests that there has been little change in participation in mathematics at senior secondary level in the1990s. However, Thomas (2000) indicates that this masks the fact that the majority of Year 12 students aretaking low and intermediate level mathematics, and the number and proportion studying high levelmathematics has been declining steadily since at least 1990. By 1999 the number taking high levelmathematics had fallen from the 1990 number by about one quarter. On the surface this may suggest adecline in interest in advanced mathematics, which is likely to be the level of mathematics expected of thosetaking courses in science and in teaching with a mathematical bent.
The number of students at university level taking mathematics and science also provides interesting insightsinto student preferences (Table 18). While the number of students commencing a science degree increasedsignificantly (over 50 per cent) in the ten years between 1989 and 1999, this was due almost entirely tostrong increases in computing science, the life sciences and general science. The physical sciences (mainlyphysics and chemistry) have risen marginally, while mathematics fell by around 15 per cent. Once thevolatility in the numbers is taken out, commencements in both the physical sciences and mathematics appearto have remained fairly stable. In proportional terms, as a ratio of all science commencements or totalcommencements, both physical sciences and mathematics have, however, declined.
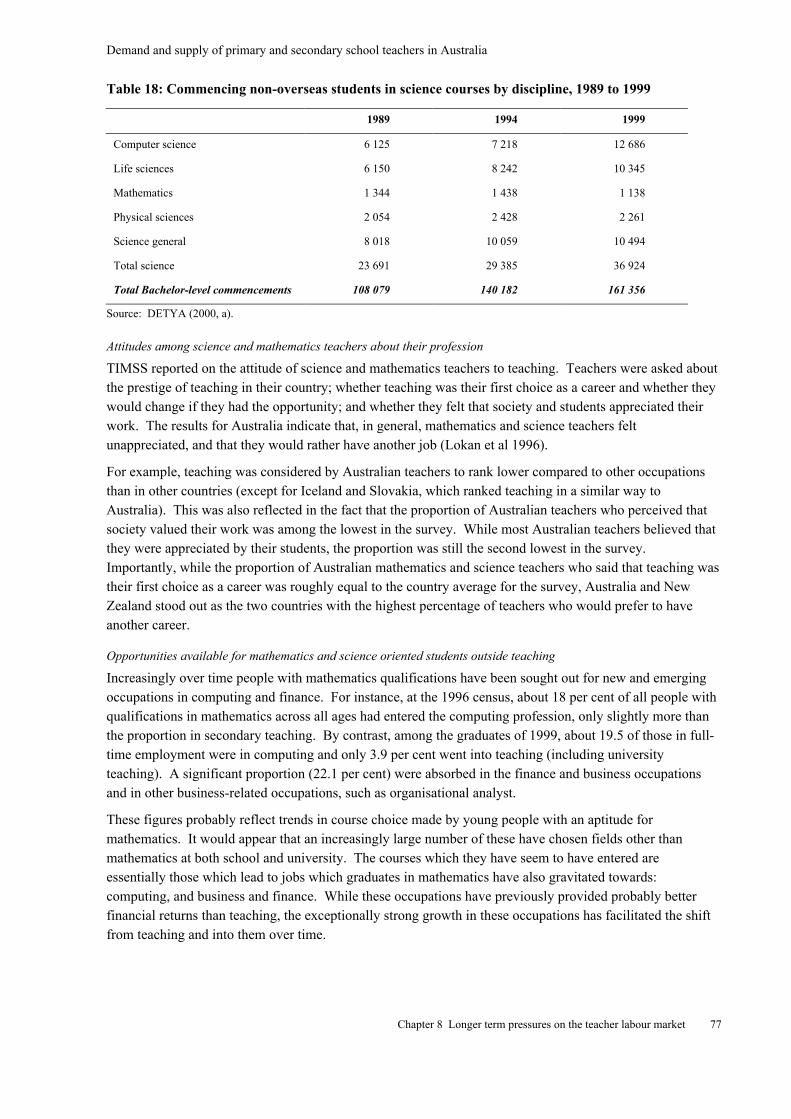
Demand and supply of primary and secondary school teachers in Australia
Chapter 8 Longer term pressures on the teacher labour market 77
Table 18: Commencing non-overseas students in science courses by discipline, 1989 to 1999
1989 1994 1999
Computer science 6 125 7 218 12 686
Life sciences 6 150 8 242 10 345
Mathematics 1 344 1 438 1 138
Physical sciences 2 054 2 428 2 261
Science general 8 018 10 059 10 494
Total science 23 691 29 385 36 924
Total Bachelor-level commencements 108 079 140 182 161 356
Source: DETYA (2000, a).
Attitudes among science and mathematics teachers about their profession
TIMSS reported on the attitude of science and mathematics teachers to teaching. Teachers were asked aboutthe prestige of teaching in their country; whether teaching was their first choice as a career and whether theywould change if they had the opportunity; and whether they felt that society and students appreciated theirwork. The results for Australia indicate that, in general, mathematics and science teachers feltunappreciated, and that they would rather have another job (Lokan et al 1996).
For example, teaching was considered by Australian teachers to rank lower compared to other occupationsthan in other countries (except for Iceland and Slovakia, which ranked teaching in a similar way toAustralia). This was also reflected in the fact that the proportion of Australian teachers who perceived thatsociety valued their work was among the lowest in the survey. While most Australian teachers believed thatthey were appreciated by their students, the proportion was still the second lowest in the survey.Importantly, while the proportion of Australian mathematics and science teachers who said that teaching wastheir first choice as a career was roughly equal to the country average for the survey, Australia and NewZealand stood out as the two countries with the highest percentage of teachers who would prefer to haveanother career.
Opportunities available for mathematics and science oriented students outside teaching
Increasingly over time people with mathematics qualifications have been sought out for new and emergingoccupations in computing and finance. For instance, at the 1996 census, about 18 per cent of all people withqualifications in mathematics across all ages had entered the computing profession, only slightly more thanthe proportion in secondary teaching. By contrast, among the graduates of 1999, about 19.5 of those in full-time employment were in computing and only 3.9 per cent went into teaching (including universityteaching). A significant proportion (22.1 per cent) were absorbed in the finance and business occupationsand in other business-related occupations, such as organisational analyst.
These figures probably reflect trends in course choice made by young people with an aptitude formathematics. It would appear that an increasingly large number of these have chosen fields other thanmathematics at both school and university. The courses which they have seem to have entered areessentially those which lead to jobs which graduates in mathematics have also gravitated towards:computing, and business and finance. While these occupations have previously provided probably betterfinancial returns than teaching, the exceptionally strong growth in these occupations has facilitated the shiftfrom teaching and into them over time.
Demand and supply of primary and secondary school teachers in Australia
Chapter 8 Longer term pressures on the teacher labour market 78
Implications for the mathematics and science teachers labour market in coming years
If these factors continue to influence the mathematics and science teachers labour market in the future inmuch the same way as they have up to now, then it could be expected that the number of new mathematicsand science teachers would continue to decline or at best remain the same. This would lead to furthertightening in a labour market that is already experiencing recruitment difficulties.
Two other factors are likely to exacerbate the situation further.
First, mathematics and science teachers probably have the same age profile as teachers in general so that theywill be impacted on by the expected high retirement rate of the next five to ten years as discussed earlier inthis chapter. Goodrum, Hackling and Rennie (2001 forthcoming) go further than this. They report that,according to the Australian Council of Deans of Education (ACDE) submission to the Teaching andLearning of Science Project, there is a general belief that the impact of retirements will be greater forsecondary science and mathematics teachers than for other professional groups, presumably also othersecondary teachers. This is an issue that could be tested in more detail when data from the 1999 AustralianCouncil of Education survey of teachers is released.
Second, there is evidence that other English speaking countries are also experiencing shortages in these areas(see Chapter 4) and that they are attempting to recruit in Australia. The ACDE is quoted in Goodrum,Hacking and Rennie (2001) as noting that several recruitment agencies have been seeking to fill severalhundred overseas positions at pay rates well above those applying in Australia. The ACDE estimated thatperhaps 10 to 20 per cent of the annual cohort of Australian teacher graduates may be recruited to overseasposition in the second half of 2000.
Taken together, these supply and demand considerations suggest that recruitment of science and mathematicsteachers could become considerably more difficult in the coming years. This has been recognised to someextent within the education sector, and a number of state education authorities have taken steps to addressthis, as discussed in chapter 3.

Demand and supply of primary and secondary school teachers in Australia
79
PART D CONCLUSIONS
Demand and supply of primary and secondary school teachers in Australia
Chapter 9 Summary and conclusions 80
PART D
CONCLUSIONS
Chapter 9
Summary and conclusions
The state of the teacher labour market in 2000
The early 1990s were a period of teacher surplus in Australia. As employment of teachers increased morerapidly in the second half of the 1990s, this led to a tightening of the teacher labour market. By the end ofthe decade and into 2000 the education authorities in the States and Territories were indicating that theteacher labour market was in balance across their jurisdiction. This applied in both the primary andsecondary sectors, with the secondary sector experiencing slightly greater tightness.
However, in 2000 some recruitment difficulties were being experienced but only in particular specialisationsof secondary teachers. These were mathematics, science and information technology (IT) and, to a lesserextent, modern foreign languages and industrial arts/technology. Vacancies for these types of teachers wereespecially difficult to fill in rural and remote regions, although such regions often experienced difficulty inrecruiting most types of teachers. Recruitment difficulties for some other specialisations were confined tosome States and Territories only.
At first glance, there did not seem to be a direct relationship between the growth of the teacher workforce byState and Territory and the range of specialisations experiencing recruitment difficulty. The hard-to-fillspecialisations were difficult to fill in all States and Territories not only those with strong growth in teacheremployment. However, there might be some difference in the severity of recruitment difficulties betweenStates and Territories, but these were not quantified in the study.
Projections of demand and supply of teachers to 2003
In the period to 2003 teacher recruitment needs are projected to total between 12 000 and 13 000 each year.Some of this incorporates movements between education systems within a State (including betweengovernment and non-government sectors) and across States and Territories. Recent research indicates thatthe net loss of teachers during the ten years to the late 1990s was of the order of 2.9 per cent of the teacherworkforce a year, or around 8500 teachers a year. This is substantially lower than the recruitmentrequirements. While this figure is subject to some qualifications, it provides the basis for estimating thenational requirement for teacher graduates.
Estimates of completions from initial teacher training courses undertaken for this report indicate that in thenext few years graduate numbers who will make themselves available for teaching will be of the order of8300 to 9800, which is in excess of the net loss of teachers. Another piece of evidence pointing to the sameconclusion is the finding that in the recent past government schools have relied on graduates for less thanhalf of their recruitment needs. Even if this proportion is increased in view of the rising demand for teachersto 2003, the requirement for new graduates would appear to be below the projected supply.
Unfortunately it has not been possible to make similar assessments at the State and Territory level or forspecialisations because of data limitations. Some States and Territories are likely to come under greaterpressure than others. This could be alleviated through interstate migration of graduates and measures thateducation authorities have in their power to adopt to balance teacher requirements with supply.
Demand and supply of primary and secondary school teachers in Australia
Chapter 9 Summary and conclusions 81
Some longer term sources of pressure on the teacher labour market
No detailed projections were made for the period post 2003 but analysis is provided in the report on threedevelopments which will have important implications for demand and supply of teachers in aggregate andfor key specialisations.
Growth in student enrolments during the decade to 2010 is expected to be slower than during the 1990s withmost of the increase concentrated in the secondary sector. Because of this slower overall growth and thecontinuing trend to non-government schools, it is also expected that the government sector in some of theslower growing States may experience a decline in student numbers.
The greatest pressure on the teacher labour market in the decade will come from the rapid ageing of theteaching workforce. States and Territories are already incorporating higher retirement rates into theirforward projections for the period to 2003 but, on the evidence of the age structure of the teachingworkforce, this should increase further in the period subsequent to 2003. These developments would beexpected to lead to an increased demand for new teaching graduates in the coming years, as well as measuresdesigned to improve the retention of teachers in teaching.
In the case of mathematics and science teachers, the ageing of the teaching workforce will be compoundedby other factors which appear to be having a downward influence on the graduation levels for teachers withmathematics and science qualifications. This includes strong demand for young people with mathematicalskills in the fast growing information technology industry. Recruitment difficulties in this area in particularcould, on the evidence to date, increase.
Improving data on teachers for supply and demand analyses
Detailed analysis of the labour market for teachers at the State and Territory level and for disciplines wasrestricted in part by lack of suitable data. While much of the necessary information is available from avariety of sources, published and unpublished, some elements are either not available at all or their coverageis patchy. There are five areas for which improved information would be useful.
Quantifying recruitment difficulties
State and Territory education authorities generally hold some information (often of a qualitative nature) onteaching skills which are difficult to recruit and the number of teaching vacancies within the governmentschool sector that have been hard to fill and/or remained unfilled, and in which location they occur. Theseare obtained in a variety of ways, but all rely on obtaining some information directly from schools. Whilethese data appear to be broadly adequate for assessing the extent of recruitment difficulty within thegovernment school sector, they provide only relatively basic information. There is no equivalent informationavailable for the non-government sector.
Countries like the United Kingdom, the United States of America and New Zealand, use a formal regularschool survey approach to collect hard-to-fill vacancy information. This has the added advantage ofproviding a vehicle for the collection of other policy useful information. In the United Kingdom, forinstance, the Department for Employment and Education (DfEE) annual survey of teacher vacancies is usedto provide a relative indication of shortages across a range of specialisations/subjects, as well as a measure of‘disguised skills shortages’. This occurs when schools adjust for the unavailability of certain teachingspecialisations by having classes taught by teachers outside their home field of specialisation. As a result,the UK has a relatively rich source of data on teacher shortages and teacher skill utilization.
Demand and supply of primary and secondary school teachers in Australia
Chapter 9 Summary and conclusions 82
The teaching workforce
There is a relatively large amount of information available from the State education authorities about thenumber of permanent and fixed term teachers in the government school system, but little information abouttheir specialisations. The most readily available source of information on teachers and their specialisations isthe ACE survey of teachers which was first conducted in 1963 and then every ten years since 1979, with thelatest survey being undertaken in 1999. Similarly, the data about student commencements and completionsfrom initial teacher training courses do not provide disaggregation by specialization. This largely reflects thedifficulty of collecting these kinds of information from the regular university statistics on students andcourses. DETYA commissioned research into this matter and the results are expected in 2001.
The non-government sector has increased its share of overall teacher employment over time and nowrepresents about a third of the school system. However, the only readily available source of publishedinformation on this sector is the publication ABS Schools, Australia, which provides information on thenumber of teachers and students, and the number of schools, by type of jurisdiction (e.g. Anglican, Catholic,etc) but no other information such as the break-up between permanent and contract teachers, and the age andspecialization structures. Similarly, while casual and relief teachers are an important component of theteaching workforce and a broad estimate of the size of this group is possible from a mixture of data sources,this is likely to be understated. Furthermore, there is no information on the characteristics of these teachers.
The teaching pool
The actual size of the pool of people available to teach on a permanent, contract or relief/casual basis butwho are not teaching or are under-utilised in their position is not known with any great accuracy across allStates and Territories. The analysis presented in this report suggests that this pool in those States andTerritories which are able to report on it can be quite significant, and can play an important part in balancingsupply and demand in the teachers labour market.
Information that would be required on this pool includes subject specialization, the characteristics of theteachers (e.g. age) and their availability, both in terms of their preferred hours of work and place of teaching.The best that can be provided at the moment by some States is the number of teachers who have applied forpermanent positions. Without additional information on these teachers, it is difficult to make a reliableassessment of their potential contribution to the supply of teachers.
Inflows and outflows of teachers to the teaching labour force
In order to assess the need for new teaching graduates to maintain balance in the labour market, it isnecessary to have good information on the inflow and outflow from the teaching labour force. Inflowscomprise people coming back from leave, new graduates and those returning to teaching after a periodoutside the teaching labour force. The first two categories are generally available but information onteachers returning to teaching are, by contrast, not. In the case of outflow, States and Territories havegenerally good information on retirements, resignations and people going on leave from the governmentschool system but there is no comparable data on the non-government system. Even if these data wereavailable for the non-government sector, outflows from a particular jurisdiction do not necessarily representoutflows from teaching as many teachers resign to move from one jurisdiction to another. It is these ‘net’outflows that are relevant for labour market analysis.
Obtaining net outflows out of teaching rather than gross outflows is by definition difficult and so isinformation on returning teachers. This largely accounts for the lack of information in these areas. Censusdata are one source of information but have their limitations. Recent work at Monash University onReplacement Demand for various occupations using Labour Force surveys has attempted to provideinformation on the ‘net replacement demand’, which is the difference between net outflows and net inflows
Demand and supply of primary and secondary school teachers in Australia
Chapter 9 Summary and conclusions 83
of already qualified teachers. This has been a fruitful and useful line of research but, of course, it does notprovide separately data on outflows and inflows. A possible source of such data would be a survey of thecareer path of teachers. From such data it should be possible to investigate and model the pattern of labourmarket behaviour followed by teachers from the time they complete their teaching course. This wouldcomplement analysis from the census and the labour force surveys. It may also be worth investigatingwhether teacher superannuation records could yield useful mobility information.
Recruitment practices of school systems and demand-supply adjustment mechanisms
While information is available on the recruitment practices of government schools, there is less informationon the methods used by schools to adjust to recruitment difficulties: for instance, how do schools handle thesituation where they are unable to fill a specialist position in the LOTE or mathematics area. To the extentthat such adjustments are feasible, information of this kind would be helpful in order to provide not only ameasure of imbalance between desired demand and supply but also a measure of the impact that such animbalance may have on the school system. The information could also be used to assess the training/re-training needs of existing teachers who may be called on to fill the gap.
Demand and supply of primary and secondary school teachers in Australia
Bibliography 84
BIBLIOGRAPHY
Australian Bureau of Statistics (ABS 2000) Schools, Australia, 1999 and other years (Cat No 4221.0)
Burke, G. (1994) Teachers: Employment in the 1980s and 1990s The Workplace in Education -Australian perspectives, First Yearbook of the Australian Council of Educational Administration, EdwardArnold publishers, 1994.
Dempster, N; Sim, C; Beere, D; Logan, L (2000) Teachers in Australian Schools – a report from the 1999National Survey Centre for Leadership and Management in Education, Faculty of Education, GriffithUniversity, September 2000 (not yet published). The study was funded by DETYA and the AustralianCollege of Education.
DETYA (2000, a) Higher Education Statistics (unpublished) Produced by the Higher Education StatisticsUnit, Higher Education Division, DETYA
DETYA (2000, b) DETYA survey of State and Territory education authorities Survey conducted byDETYA in the second half of 2000
DETYA (2000,c) Higher Education Statistics special run Produced by the Higher Education StatisticsUnit, Higher Education Division, DETYA
DETYA (2000,d) DETYA projections of student enrolments to 2010 Produced by the Schools Division ofDETYA, unpublished
Dobson, I R; Calderon, A J (1999) Trends in Science Education: Learning, Teaching and Outcomes 1989-1997 A study commissioned by the Australian Council of Deans of Science, September 1999
Education Queensland (2000) Teacher supply and demand in Queensland: 1981 to 2009 Main ReportPrepared by Pacific Analytics Inc for Education Queensland, Brisbane, February 2000
Education Department of Western Australia (1999) Issues paper: Teachers supply and demand study1999-2005 Paper prepared by the Human Resource Policy and Planning Division, Perth, March 1999
Education Department of Western Australia (2000) Issues Paper – Age profile Paper prepared by theHuman Resource Policy and Planning Division, Perth, March 2000
Fullarton, S; Ainley, J (2000) Subject choice by students in Year 12 in Australian Secondary SchoolsLSAY Research Report No 15, Australian Council for Educational Research, August 2000
Goodrum, D; Hackling, M; Rennie, L (2001) The Status and Quality of Teaching and Learning of Sciencein Australian Schools A Research Report prepared for DETYA
Graduate Careers Council of Australia (GCCA 1999) Graduate Destination Survey 1998 (and previousyears) GCCA, July 1999.
Logan, L; Dempster, N; Berkeley, G; Howell, M; Warry, M (1990) Teachers in Australian Schools – a1989 profile Prepared by the Department of Education, The University of Queensland, for the AustralianCollege of Education.
Lokan, J; Ford, P; Greenwood, L (1996) Maths & Science On the Line: Australian junior secondarystudents’ performance in the Third International Mathematics and Science study Australian Council forEducational Research, Melbourne, 1996
MCEETYA (1998) School Teacher Demand and Supply: Primary and Secondary Prepared by theCESCEO National Teacher Supply and Demand Working Party, July 1998
Demand and supply of primary and secondary school teachers in Australia
Bibliography 85
National Commission on Teaching and America’s Future (1996) What matters most: Teaching forAmerica’s future Prepared by the National Commission on Teaching and America’s Future, New York,September 1996
Preston, B (2000) Teacher supply and demand to 2005 Paper commissioned by the Australian Council ofDeans of Education, July 2000.
Shah, C. (1999) Teachers: older, wiser and needed EQ Australia, Autumn 1999, pp 10-12.
Straker, N (1991) Teacher supply in the 1990s : an analysis of current developments Evaluation andResearch in Education, Vol 5, Nos 1and 2, 1991.
Thomas, J (2000) Mathematical Sciences in Australia: Looking for a Future FASTS Occasional PaperSeries, Number 3, Federation of Australian Scientific and Technological Societies (FASTS) MathematicalScience Issues, Canberra, October 2000
Demand and supply of primary and secondary school teachers in Australia
Acronyms and Abbreviations 86
ACRONYMS AND ABBREVIATIONS
ABS, Australian Bureau of Statistics
ACE, Australian Council of Education
ASCO, Australian standard classification of occupations
CESCEO, Conference of Education System Chief Executive Officers
DETYA, Department of Education, Training and Youth Affairs
DEWRSB, Department of Employment, Work Place Relations and Small Business.
DfEE, Department for Employment and Education (UK)
DIMA, Department of Immigration and Multicultural Affairs
ESL, English as a Second Language
FTE, Full-Time Equivalent
GCCA, Graduate Careers Council of Australia
HECS, Higher Education Contribution Scheme
LEO, Labour Economics Office (part of the DEWRSB regional structure)
LOTE , Languages Other Than English
MCEETYA, Ministerial Council on Employment, Education, Training and Youth Affairs
NCES, National Office of Education Statistics (USA)
Demand and supply of primary and secondary school teachers in Australia
Glossary of Terms 87
GLOSSARY OF TERMS
Commencements (of teacher trainees), refers to the number of students commencing an initial teachertraining course as defined in the DETYA Higher Education statistics. Courses coming within scopeinclude undergraduate degree and Graduate Diploma (Diploma of Education) courses.
Completions (of teacher trainees), refers to the number of students completing an initial teacher trainingcourse.
(Employed) teachers, are full or part time teachers engaged on a permanent or fixed term basis i.e. regularteachers. It excludes relief and casual teachers who are engaged to fill in for permanent and contractteachers when these are not available. This group of ongoing teachers constitute the core workforce , ie. themajority of class room teachers. All statistics and references to teachers in this report relate to employedteachers, unless otherwise stated. Employed teachers can be expressed as head counts or in FTE terms.This definition of employed teachers is the same as that used in the ABS Schools, Australia publication.There it is used synonymously with teaching staff.
Full time equivalent or FTE, is a measure of all full and part time teachers expressed in terms of a fulltime work load. Thus two 0.5 teachers would count as 1 full time equivalent.
Growth Demand for teachers, is that portion of teacher demand related to the increase in total teacherrequirements. It stems from factors like increases in enrolments or additions to the curriculum whichrequire additional teachers to be hired. Growth demand in any one year is the difference between thatyear’s requirement for teachers and the previous year’s actual teacher employment level. It can beexpressed either as FTE or as headcounts. It is often convenient to express the Growth Demand for aparticular year (or period) as a percentage of the workforce in the previous year.
(New) Graduates is the same as completions.
Head count of teachers refers to the number of Teachers Employed, irrespective of whether they wereemployed full or part-time.
Net replacement demand refers to (gross) replacement demand less those teachers (other than newgraduates) who enter the teaching workforce during the year. These entrants could be returning teachers ormigrants. The net replacement rate is broadly a measure of the training rate required to satisfy the demandfor teachers.
Pool of teachers(or pool teachers), refer to qualified teachers who are not currently part of employedteachers (as defined above) but are available for permanent or contract positions or would be under certaincircumstances. These qualified teachers may currently be unemployed, be working in another occupation orin teaching as casual or relief teachers..
Recruitment difficulties, is used to refer to the situation where teaching vacancies are hard-to-fill andwould normally require more concerted recruitment action, such as head hunting, to fill.
Replacement demand, is demand for teachers which stems from the need to recruit new teachers to replacethose lost via separation (see definition for more details) from the teaching workforce. It affects bothpermanent and contract teachers.
Separation, also referred to as attrition or wastage, is a measure of the reduction in the teacher workforce asa result of teachers leaving the workforce (either permanently or for shorter periods). The measure has beendefined to include retirements, teacher resignations, teachers going on leave, contract expiration and othercategories such as deaths and dismissals.
Demand and supply of primary and secondary school teachers in Australia
Glossary of Terms 88
Separation rate is the number of teachers who separate as a percentage of the teaching workforce.Separation rate can be defined only for permanent teachers or for permanent and contract teacherscombined. In this report, separation rate refers to permanent teachers, unless otherwise indicated.
Shortages or shortfalls , refers to the inability to find sufficient numbers of suitably qualified teachers tosatisfy the desired or target level of teachers. This difference is commonly referred to as “teachershortages”. Unlike recruitment difficulties shortages may persist and not be resolved by normal recruitmentpractices such as advertising.
Student teaching staff ratio (STR), is the number of students enrolled divided by numbers of teachersemployed. In this report, both students and teachers are expressed as full-time equivalents to derive thisratio.
Training rate is the ratio of teacher completions (or graduates) to the teaching workforce.
Demand and supply of primary and secondary school teachers in Australia
Attachment 1: Detailed State and Territory reports 89
ATTACHMENT 1DETAILED STATE AND TERRITORY REPORTS
Note: In the following tables in this Attachment, teacher numbers for 1984, 1986 and 1988 do not includespecial education teachers. (For the years prior to 1990 special education teachers were identifiedseparately). From 1990 onwards these special education teachers have been included in overallprimary/secondary figures.
Demand and supply of primary and secondary school teachers in Australia
Attachment 1: Detailed State and Territory reports 90
New South Wales
Labour Market Background
In 1999 there were 34 762 FTE primary teachers and 37 079 FTE secondary teachers in government andnon-government schools in New South Wales (ABS Schools, Australia Cat. No. 4221.0). From 1984 to1999 teacher numbers increased substantially. In the primary sector the FTE of teachers grew by22 per cent over the period and in the secondary sector it grew by 16 per cent.
Primary teacher numbers showed a strong growth over the period in both government and non-governmentschools. Secondary teacher numbers fell slightly in the early 1990s and then began to increase.
Student to teacher ratios in primary schools has been declining from 20.9 in 1984 to 17.9 in 1999.A similar decline is evident in secondary schools where the STR declined progressively from 13.4 in 1984to 12.9 in 1999.
In general new graduates numbers have been sustained over 1988 to 1998. Primary teachers completions,which fell markedly during the latter part of the 1990s, revived in 1998. Numbers of teacher completionshave basically been sustained above the 3000 mark from 1988 to 1998 and were 3509 in 1998.
Recruitment experience in the government schools sector
Primary
The survey results indicate that there is currently an adequate overall supply of primary teachers to fill full-time permanent vacancies, except for a small number of positions in some geographic locations.
Some recruitment difficulties exist in special education and mainly in Western Sydney and non-coastalNew South Wales. There are occasional difficulties in filling vacancies for community language teachers.When positions cannot be filled by regular recruitment processes they are advertised in the press.
Secondary
Survey results from the secondary sector reveal that there is an adequate supply of secondary teachersexcept for teachers of Technological and Applied Studies (TAS), teachers of mathematics, science andspecial education in some geographic locations and some positions in particular geographic locations.
The shortage of TAS teachers has been evident for approximately four years. Mathematics and science(particularly physics) are areas in which shortages are projected to increase.
There is no general shortage of Languages other than English teachers. The only subject in which there isoccasionally a difficult to fill vacancy is Japanese in Western Sydney or isolated areas of New SouthWales. The number of such vacancies is less than ten a year.
Initiatives taken by the government education authorities to address areas of recruitmentdifficulty
The New South Wales Department of Education and Training (the Department) has developed andimplemented a comprehensive suite of targeted strategies to promote teaching as a career, ensure acontinuing overall supply of permanent quality teachers, and increase teacher supply in areas of shortfall.Key strategies to attract teachers to isolated areas of the State include:
• Permanent Employment Program which provides permanent employment opportunities to casualteachers. Vacancies filled through this program are advertised in the Department’s Personnel Bulletinand the Sydney Morning Herald;
Demand and supply of primary and secondary school teachers in Australia
Attachment 1: Detailed State and Territory reports 91
• The Graduate Recruitment Program. Graduates are only eligible to apply for appointment under thisprogram in the year they successfully complete their academic studies;
• The Department has developed a Website to promote teaching as a career. The site has beendeveloped to reach people with the skills and attributes to become outstanding teachers;
• The Teacher Employment Priority Scheme enables casual teachers to gain six, twelve, or eighteenmonths’ accelerated priority for permanent employment for every 50 days service in governmentschools;
• Casual Connect is a free employment service on the internet that allows casual teachers to registertheir interest in long-term and short-term casual work in government schools; and
• The Incentives Program, which provides a range of benefits to teachers recruited to designatedschools, including a priority for transfer after serving the required number of years in a rural orisolated school, a number of locality allowances, additional training and development, compassionatetransfer status for teaching partners, a twenty per cent rental subsidy in some locations and anadditional week's summer vacation in some locations.
Special education
Since 1994 it has been a requirement that people obtaining teacher qualifications will be employed in NewSouth Wales government schools only if their course of teacher education contains special education studywhich is equivalent to a thirteen week unit of special education. This special education study is designed toensure graduates have strategies and skills for teaching students with special education needs. In thisrespect, the Department provides expert advice and assistance to universities in the development of specialeducation training programs and ensures that university proposals are consistent with the Department’squalification requirements and workforce needs in special education.
In addition the Department also sponsors between 30 to 40 teachers (Kindergarten to Year 12) each year toundertake a one-year full-time postgraduate qualification in special education. The Department alsosponsors about 50 special education teachers (Kindergarten to Year 12) each year to upgrade their specialeducation qualifications through a two-year part-time program.
Subject areas in high demand
The strategies and initiatives undertaken by the Department to address staffing shortfalls in TAS include:
• Negotiations with universities to expand current and establish new TAS preservice teacher educationprograms;
• Negotiations with higher education institutions in providing articulated pathways into TAS teaching;
• Sponsorships of students with appropriate backgrounds to undertake a graduate diploma in TAS athigher education institutions;
• Retraining programs;
• Joint TAFE–university TAS programs in which people with appropriate TAFE qualifications undertakea Bachelor of Education (Technologies) course to qualify as teachers in the TAS area;
• Mentoring programs for new teachers;
• Vigorous promotion of teaching in the TAS KLA and publicity materials to schools; and
• Advertising specific vacancies.
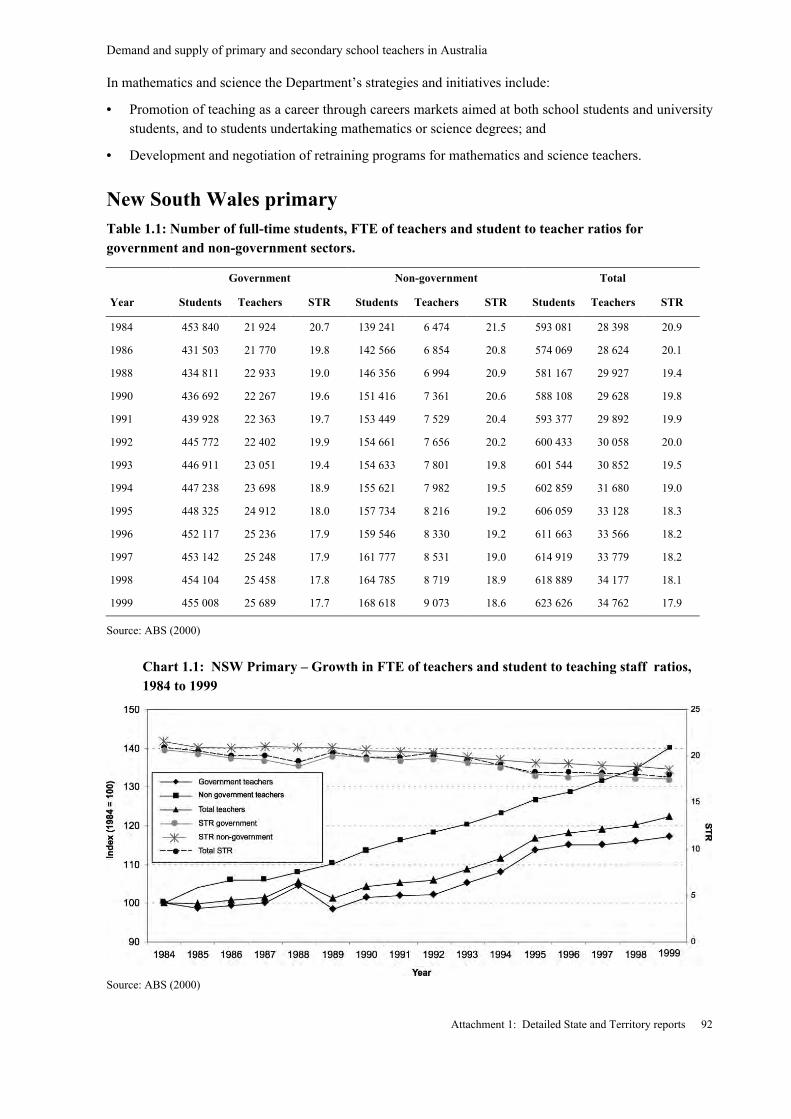
Demand and supply of primary and secondary school teachers in Australia
Attachment 1: Detailed State and Territory reports 92
In mathematics and science the Department’s strategies and initiatives include:
• Promotion of teaching as a career through careers markets aimed at both school students and universitystudents, and to students undertaking mathematics or science degrees; and
• Development and negotiation of retraining programs for mathematics and science teachers.
New South Wales primaryTable 1.1: Number of full-time students, FTE of teachers and student to teacher ratios forgovernment and non-government sectors.
Government Non-government Total
Year Students Teachers STR Students Teachers STR Students Teachers STR
1984 453 840 21 924 20.7 139 241 6 474 21.5 593 081 28 398 20.9
1986 431 503 21 770 19.8 142 566 6 854 20.8 574 069 28 624 20.1
1988 434 811 22 933 19.0 146 356 6 994 20.9 581 167 29 927 19.4
1990 436 692 22 267 19.6 151 416 7 361 20.6 588 108 29 628 19.8
1991 439 928 22 363 19.7 153 449 7 529 20.4 593 377 29 892 19.9
1992 445 772 22 402 19.9 154 661 7 656 20.2 600 433 30 058 20.0
1993 446 911 23 051 19.4 154 633 7 801 19.8 601 544 30 852 19.5
1994 447 238 23 698 18.9 155 621 7 982 19.5 602 859 31 680 19.0
1995 448 325 24 912 18.0 157 734 8 216 19.2 606 059 33 128 18.3
1996 452 117 25 236 17.9 159 546 8 330 19.2 611 663 33 566 18.2
1997 453 142 25 248 17.9 161 777 8 531 19.0 614 919 33 779 18.2
1998 454 104 25 458 17.8 164 785 8 719 18.9 618 889 34 177 18.1
1999 455 008 25 689 17.7 168 618 9 073 18.6 623 626 34 762 17.9
Source: ABS (2000)
Chart 1.1: NSW Primary – Growth in FTE of teachers and student to teaching staff ratios,1984 to 1999
Source: ABS (2000)
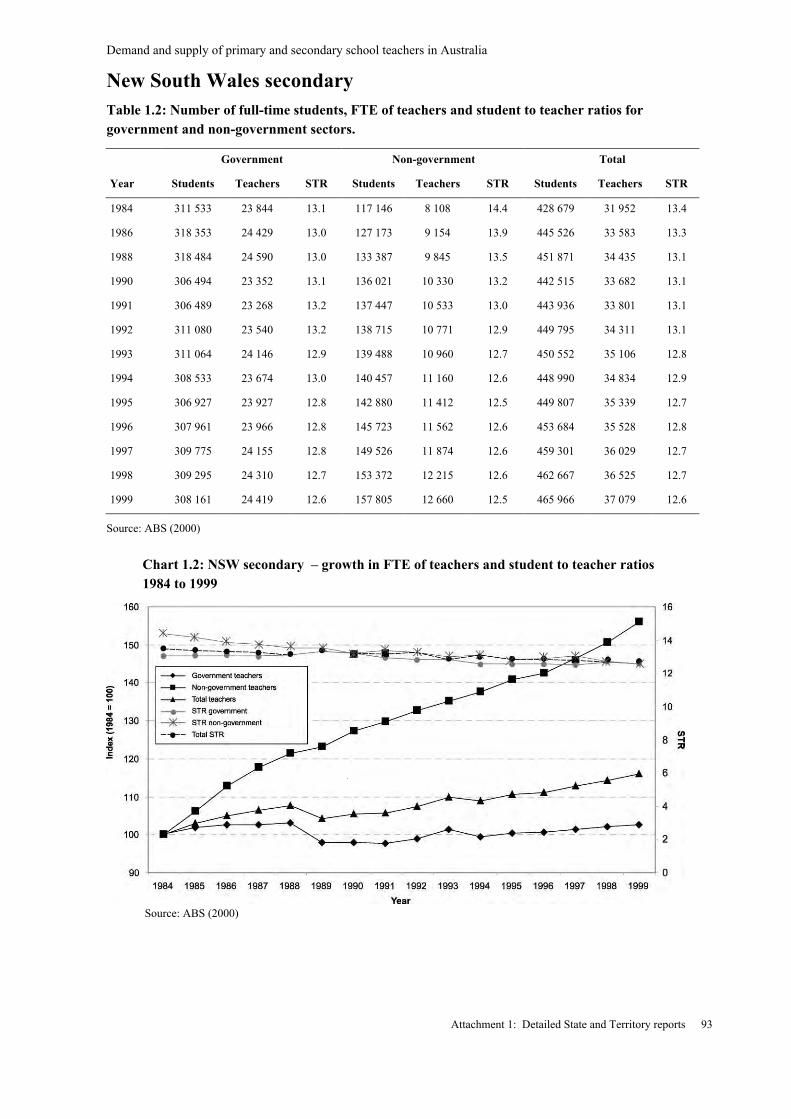
Demand and supply of primary and secondary school teachers in Australia
Attachment 1: Detailed State and Territory reports 93
New South Wales secondaryTable 1.2: Number of full-time students, FTE of teachers and student to teacher ratios forgovernment and non-government sectors.
Government Non-government Total
Year Students Teachers STR Students Teachers STR Students Teachers STR
1984 311 533 23 844 13.1 117 146 8 108 14.4 428 679 31 952 13.4
1986 318 353 24 429 13.0 127 173 9 154 13.9 445 526 33 583 13.3
1988 318 484 24 590 13.0 133 387 9 845 13.5 451 871 34 435 13.1
1990 306 494 23 352 13.1 136 021 10 330 13.2 442 515 33 682 13.1
1991 306 489 23 268 13.2 137 447 10 533 13.0 443 936 33 801 13.1
1992 311 080 23 540 13.2 138 715 10 771 12.9 449 795 34 311 13.1
1993 311 064 24 146 12.9 139 488 10 960 12.7 450 552 35 106 12.8
1994 308 533 23 674 13.0 140 457 11 160 12.6 448 990 34 834 12.9
1995 306 927 23 927 12.8 142 880 11 412 12.5 449 807 35 339 12.7
1996 307 961 23 966 12.8 145 723 11 562 12.6 453 684 35 528 12.8
1997 309 775 24 155 12.8 149 526 11 874 12.6 459 301 36 029 12.7
1998 309 295 24 310 12.7 153 372 12 215 12.6 462 667 36 525 12.7
1999 308 161 24 419 12.6 157 805 12 660 12.5 465 966 37 079 12.6
Source: ABS (2000)
Chart 1.2: NSW secondary – growth in FTE of teachers and student to teacher ratios1984 to 1999
Source: ABS (2000)
Demand and supply of primary and secondary school teachers in Australia
Attachment 1: Detailed State and Territory reports 94
Victoria
Labour Market Background
In 1999 there were 25 555 FTE primary teachers and 27 805 FTE secondary teachers in Victoria (ABSSchools, Australia Cat. No. 4221.0). Over the period 1984 to 1999, teacher numbers have fluctuated quitesubstantially. However, the overall trend for total teachers in the period has been downward due to fallingteacher numbers in secondary schools. Growth in teacher FTE in the primary sector was only 1.4 per centand the secondary sector showed a negative growth of 10.4 per cent.
Primary teacher numbers fell during the mid 1990s but rose in 1999 to be the highest in the period 1984 to1999. Both the DETYA survey and ABS data show a substantial lift in primary school employment.Secondary numbers were in steady decline over the period.
Recently, numbers of teachers in the government sector have revived significantly after a progressivereduction. Consistent with the national trend, non-government schools are the major area of long termgrowth.
Teacher completions numbers reduced over the period 1988 to 1998. Peak training levels of over 3500have now dropped to below the 2000 level and were 2056 in 1998. Primary teacher completions, whichfell markedly during the latter 1990s, were well below 1000 at the end of the period. Secondary teachershave followed a similar trend and in 1998 were only just over half the 1988 level.
Recruitment experience in the government school sector
Primary
At a census conducted in February 2000, the Department of Education asked every government school tocomplete a survey of recruitment difficulties. The survey results indicated that recruitment shortfalls were‘isolated and sporadic’ and limited mainly to particular geographical or curriculum areas. A number ofLanguages other than English areas were identified, together with special education and instrumentalmusic.
The results of the 2000 survey showed there were more difficult to fill vacancies reported in primaryschools than for secondary schools, which is consistent with employment trends noted above.
Secondary
Recruitment was less of a problem in the secondary sector and the main areas of difficulty were fortechnology teachers, Languages other than English teachers, mathematics and science. Some specificlocations in more remote rural areas and areas on the outer fringe of Melbourne experienced recruitmentdifficulties.
Initiatives taken by Schools and the Education Department to address areas of recruitmentdifficulties
Schools
In Victoria, many core functions and responsibilities have been devolved to schools, includingresponsibility for workforce planning and teacher recruitment. As such, schools now take an active role inensuring they have sufficient and high quality staff to suit their schools’ requirements.
Results from the Teacher Recruitment Difficulties Survey indicated that some schools in the primary andsecondary sectors used the following strategies in recruiting teaching staff:
• financial incentives;
Demand and supply of primary and secondary school teachers in Australia
Attachment 1: Detailed State and Territory reports 95
• advertising nationally;
• contacting Teacher Training Institutions and Subject Associations to target recommended applicants;
• having the last teacher training round in the year so they can offer early employment for the followingschool year;
Higher commencement salaries have also been achieved.
Department
One of the more high profile strategies being developed by the Department is the offering of up to220 teaching scholarships in each of three years to attract the brightest and best young graduates. Detailsof this scheme are at http://www.sofweb.vic.edu.au/hrm/recruit/scholarship.htm.
It is proposed that implementation of the scholarship program should not only increase the number of highquality graduates seeking employment as teachers for 2002 and beyond in Victorian government schools,but should target employment to geographic locations where there are recruitment difficulties or subjectareas where there is increased teacher demand.
Other potential recruitment strategies focus on early employment offers to teacher graduates,promotional/information campaigns, higher commencement salaries in special circumstances, and refreshercourses.
The survey response noted that development of a teacher employment register would assist in the targetingof qualified teachers available for relief work.
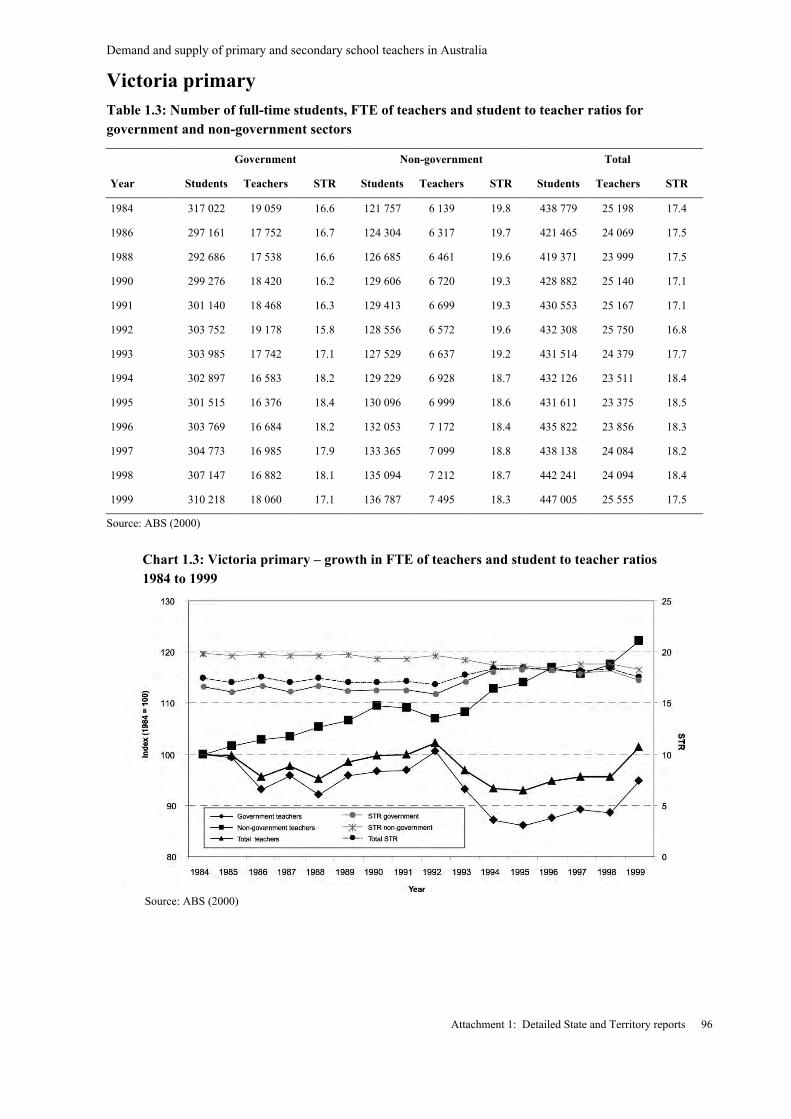
Demand and supply of primary and secondary school teachers in Australia
Attachment 1: Detailed State and Territory reports 96
Victoria primaryTable 1.3: Number of full-time students, FTE of teachers and student to teacher ratios forgovernment and non-government sectors
Government Non-government Total
Year Students Teachers STR Students Teachers STR Students Teachers STR
1984 317 022 19 059 16.6 121 757 6 139 19.8 438 779 25 198 17.4
1986 297 161 17 752 16.7 124 304 6 317 19.7 421 465 24 069 17.5
1988 292 686 17 538 16.6 126 685 6 461 19.6 419 371 23 999 17.5
1990 299 276 18 420 16.2 129 606 6 720 19.3 428 882 25 140 17.1
1991 301 140 18 468 16.3 129 413 6 699 19.3 430 553 25 167 17.1
1992 303 752 19 178 15.8 128 556 6 572 19.6 432 308 25 750 16.8
1993 303 985 17 742 17.1 127 529 6 637 19.2 431 514 24 379 17.7
1994 302 897 16 583 18.2 129 229 6 928 18.7 432 126 23 511 18.4
1995 301 515 16 376 18.4 130 096 6 999 18.6 431 611 23 375 18.5
1996 303 769 16 684 18.2 132 053 7 172 18.4 435 822 23 856 18.3
1997 304 773 16 985 17.9 133 365 7 099 18.8 438 138 24 084 18.2
1998 307 147 16 882 18.1 135 094 7 212 18.7 442 241 24 094 18.4
1999 310 218 18 060 17.1 136 787 7 495 18.3 447 005 25 555 17.5
Source: ABS (2000)
Chart 1.3: Victoria primary – growth in FTE of teachers and student to teacher ratios1984 to 1999
Source: ABS (2000)
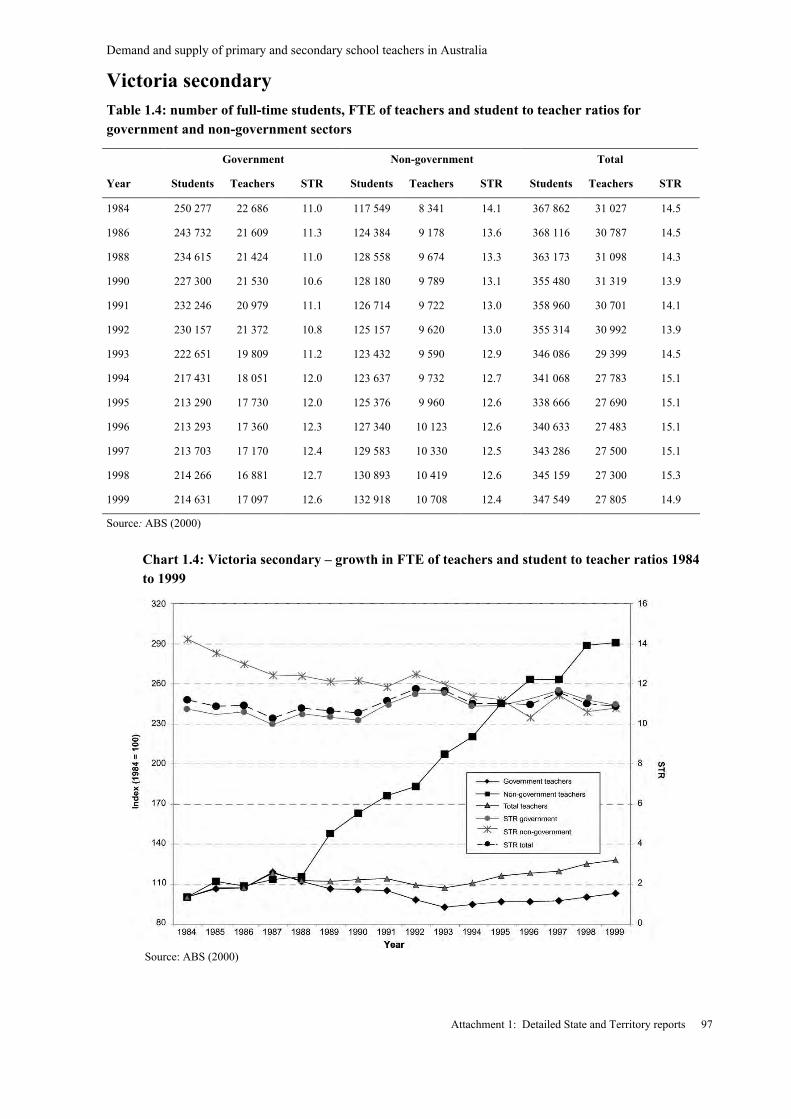
Demand and supply of primary and secondary school teachers in Australia
Attachment 1: Detailed State and Territory reports 97
Victoria secondaryTable 1.4: number of full-time students, FTE of teachers and student to teacher ratios forgovernment and non-government sectors
Government Non-government Total
Year Students Teachers STR Students Teachers STR Students Teachers STR
1984 250 277 22 686 11.0 117 549 8 341 14.1 367 862 31 027 14.5
1986 243 732 21 609 11.3 124 384 9 178 13.6 368 116 30 787 14.5
1988 234 615 21 424 11.0 128 558 9 674 13.3 363 173 31 098 14.3
1990 227 300 21 530 10.6 128 180 9 789 13.1 355 480 31 319 13.9
1991 232 246 20 979 11.1 126 714 9 722 13.0 358 960 30 701 14.1
1992 230 157 21 372 10.8 125 157 9 620 13.0 355 314 30 992 13.9
1993 222 651 19 809 11.2 123 432 9 590 12.9 346 086 29 399 14.5
1994 217 431 18 051 12.0 123 637 9 732 12.7 341 068 27 783 15.1
1995 213 290 17 730 12.0 125 376 9 960 12.6 338 666 27 690 15.1
1996 213 293 17 360 12.3 127 340 10 123 12.6 340 633 27 483 15.1
1997 213 703 17 170 12.4 129 583 10 330 12.5 343 286 27 500 15.1
1998 214 266 16 881 12.7 130 893 10 419 12.6 345 159 27 300 15.3
1999 214 631 17 097 12.6 132 918 10 708 12.4 347 549 27 805 14.9
Source: ABS (2000)
Chart 1.4: Victoria secondary – growth in FTE of teachers and student to teacher ratios 1984to 1999
Source: ABS (2000)
Demand and supply of primary and secondary school teachers in Australia
Attachment 1: Detailed State and Territory reports 98
Queensland
Labour Market background
In 1999 there were 21 874 FTE primary teachers and 18 399 FTE secondary teachers in Queensland (ABSSchools, Australia Cat. no. 4221.0). From 1984 to 1999 teacher numbers grew very rapidly in both theprimary and the secondary sectors. In the primary sector the FTE of teachers grew by 47 per cent over theperiod and in the secondary sector it grew by 45 per cent.
The overall trend in teacher numbers over the period 1984 to 1999 showed the most rapid growth in teachernumbers more than any other State. In 1984 the FTE of primary teachers was 14 879 and had risen to 21874 in 1999. For secondary schools the FTE of teachers was 12 683 in 1984 and had risen to 18 399 in1999.
Student teacher ratios in primary schools also fell during this period from 20.0 in 1984 to 16.4 in 1999.Secondary school’s STRs showed a decrease in STRs from the mid-1980s to the mid-1990s, and thenincreased, dropping back in 1999.
Teacher completion numbers in Queensland were consistently above 2000 in the late 1980s and early1990s, but fell to levels of about 75 per cent below the trend for most of the 1990s. Numbers in 1998revived to be 2058. The main contribution to the falling numbers was in primary teacher training.
Recruitment experience in the government school sector
Primary
The DETYA survey results show that recruitment difficulties are minimal in the primary sector. It isreported that country area vacancies for teacher positions are harder to fill as they occur during the year.
Secondary
The difficult to fill secondary vacancies occur in rural and remote areas of the State.
Positions for mathematics and science are most hard to fill, followed by manual arts and home economics.The growing number of VET courses in schools has led to increased demand for manual arts and homeeconomics teachers who can teach related specialisations in the senior secondary years.
Initiatives taken by the Education Department to address areas of recruitment difficulty
Education Queensland has developed an effective school staffing system that includes a monitoring ofvacancies and a State-wide approach to teacher transfers.
As indicated previously, there appears to be no shortage of teachers in the primary sector in Queensland.The regular flow of graduates from pre-service courses, along with the pool of existing unemployedteachers, ensures that the primary sector remains adequately staffed.
In the secondary sector, the demand for teachers has continued to grow due to the growth in secondarynumbers. Recruitment activities have ensured that teacher demand has been met. Education Queenslandhas commenced a campaign to increase student retention to Year 12, which will impact on future demandfor secondary teachers.
Education Queensland closely monitors teacher supply and demand. Vacancies in all State schools aretracked on a fortnightly basis to identify trends in teacher demand. Historical data on patterns on teacherbehaviour with respect to separating from and joining the Department are used to generate forecasts onfuture requirements for teachers.
Demand and supply of primary and secondary school teachers in Australia
Attachment 1: Detailed State and Territory reports 99
To meet the continuing demand for new teachers, students in preservice education courses are made awareof the benefits of employment with Education Queensland. Other strategies used to meet the demand forteachers are interstate marketing, national advertising of specific school vacancies, and early offers tograduating students.
Graduate teachers from rural and remote areas tend to view country service more favourably, and are morelikely to return to rural schools to begin their teaching careers. To address the issues of staffing schools inrural and remote areas, Education Queensland therefore provides scholarships to assist Year 12 studentsfrom rural and remote areas who have chosen primary teaching as a career. The scholarships take the formof financial assistance for the four years that the student is studying a Bachelor of Education (primary)course at a Queensland university. There are five scholarships, each valued at $20 000. Followingsatisfactory completion of their course and suitability assessment, successful applicants are guaranteedemployment with Education Queensland for a minimum of four years in any geographical location inQueensland.
Around 6 per cent of Education Queensland’s students identify as being of Aboriginal or Torres StraitIslander background, but only 0.83 per cent of its teachers have a similar identification. To address thisimbalance, Education Queensland offers scholarships to non-school leavers from Aboriginal or TorresStrait Islander backgrounds. The scholarships provide financial assistance for students to complete aBachelor of Education at a Queensland university. The scholarships are valued at a maximum of $20 000each. Following the satisfactory completion of their course and gaining a departmentally determinedsuitability rating, scholarship holders are guaranteed offers of employment with Education Queensland fora time equivalent to their scholarship period. Employment is conditional upon the scholarship holdermaintaining teacher registration and being willing to be employed in any geographical location inQueensland
Education Queensland also increases indigenous participation in teaching through the Remote AreaTeacher Education program (RATEP). RATEP is a partnership involving Education Queensland,indigenous communities, James Cook University, and the Far North Queensland TAFE in Cairns.On-site teacher education occurs at 20 sites across Queensland, including Boigu and Yorke Islands in theTorres Strait, Napranum and Aurukun on the Cape, and Mornington Island in the Gulf.
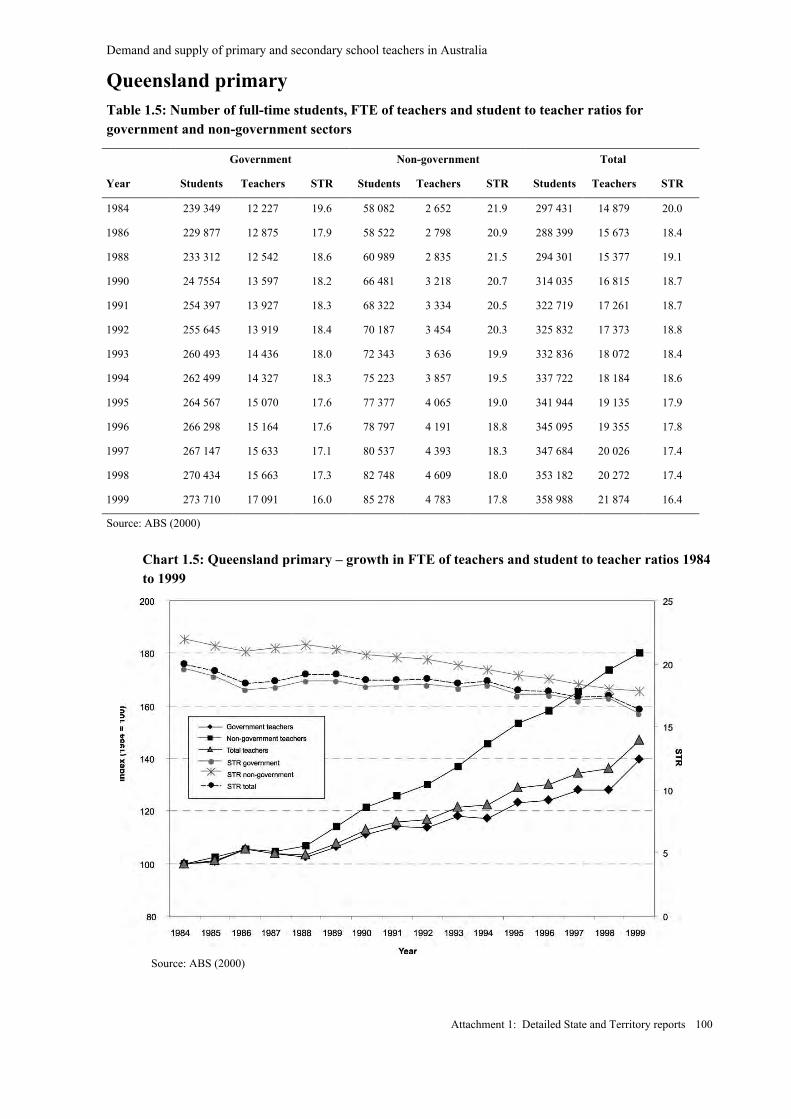
Demand and supply of primary and secondary school teachers in Australia
Attachment 1: Detailed State and Territory reports 100
Queensland primaryTable 1.5: Number of full-time students, FTE of teachers and student to teacher ratios forgovernment and non-government sectors
Government Non-government Total
Year Students Teachers STR Students Teachers STR Students Teachers STR
1984 239 349 12 227 19.6 58 082 2 652 21.9 297 431 14 879 20.0
1986 229 877 12 875 17.9 58 522 2 798 20.9 288 399 15 673 18.4
1988 233 312 12 542 18.6 60 989 2 835 21.5 294 301 15 377 19.1
1990 24 7554 13 597 18.2 66 481 3 218 20.7 314 035 16 815 18.7
1991 254 397 13 927 18.3 68 322 3 334 20.5 322 719 17 261 18.7
1992 255 645 13 919 18.4 70 187 3 454 20.3 325 832 17 373 18.8
1993 260 493 14 436 18.0 72 343 3 636 19.9 332 836 18 072 18.4
1994 262 499 14 327 18.3 75 223 3 857 19.5 337 722 18 184 18.6
1995 264 567 15 070 17.6 77 377 4 065 19.0 341 944 19 135 17.9
1996 266 298 15 164 17.6 78 797 4 191 18.8 345 095 19 355 17.8
1997 267 147 15 633 17.1 80 537 4 393 18.3 347 684 20 026 17.4
1998 270 434 15 663 17.3 82 748 4 609 18.0 353 182 20 272 17.4
1999 273 710 17 091 16.0 85 278 4 783 17.8 358 988 21 874 16.4
Source: ABS (2000)
Chart 1.5: Queensland primary – growth in FTE of teachers and student to teacher ratios 1984to 1999
Source: ABS (2000)
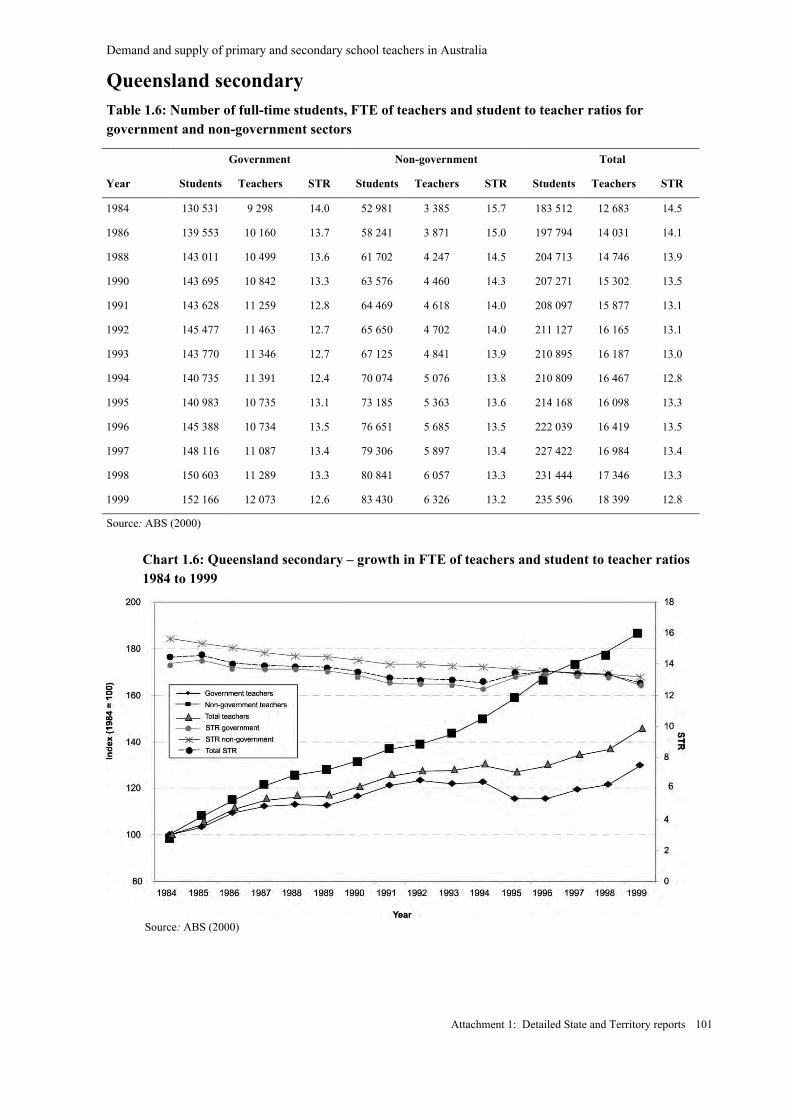
Demand and supply of primary and secondary school teachers in Australia
Attachment 1: Detailed State and Territory reports 101
Queensland secondaryTable 1.6: Number of full-time students, FTE of teachers and student to teacher ratios forgovernment and non-government sectors
Government Non-government Total
Year Students Teachers STR Students Teachers STR Students Teachers STR
1984 130 531 9 298 14.0 52 981 3 385 15.7 183 512 12 683 14.5
1986 139 553 10 160 13.7 58 241 3 871 15.0 197 794 14 031 14.1
1988 143 011 10 499 13.6 61 702 4 247 14.5 204 713 14 746 13.9
1990 143 695 10 842 13.3 63 576 4 460 14.3 207 271 15 302 13.5
1991 143 628 11 259 12.8 64 469 4 618 14.0 208 097 15 877 13.1
1992 145 477 11 463 12.7 65 650 4 702 14.0 211 127 16 165 13.1
1993 143 770 11 346 12.7 67 125 4 841 13.9 210 895 16 187 13.0
1994 140 735 11 391 12.4 70 074 5 076 13.8 210 809 16 467 12.8
1995 140 983 10 735 13.1 73 185 5 363 13.6 214 168 16 098 13.3
1996 145 388 10 734 13.5 76 651 5 685 13.5 222 039 16 419 13.5
1997 148 116 11 087 13.4 79 306 5 897 13.4 227 422 16 984 13.4
1998 150 603 11 289 13.3 80 841 6 057 13.3 231 444 17 346 13.3
1999 152 166 12 073 12.6 83 430 6 326 13.2 235 596 18 399 12.8
Source: ABS (2000)
Chart 1.6: Queensland secondary – growth in FTE of teachers and student to teacher ratios1984 to 1999
Source: ABS (2000)

Demand and supply of primary and secondary school teachers in Australia
Attachment 1: Detailed State and Territory reports 102
South Australia
Labour Market background
In 1999 there were 9302 FTE primary teachers and 7463 FTE secondary teachers in South Australia (ABSSchools, Australia Cat. no. 4221.0). Overall, from 1984 to 1999 teacher numbers in the primary sectorgrew despite fluctuations, whilst the secondary sector experienced falling teacher numbers to the mid 1990sbut have since increased. In the primary sector the FTE of teachers grew by 9 per cent over the period andin the secondary sector there was negative growth of 12 per cent.
Student to teacher ratios in the primary sector show a downward trend from 1984 to 1990 then increasedslightly to the mid 1990s before slightly declining again. Ratios in the secondary sector showed a declinefrom mid 1980s to the early 1990s with a slight increase recorded in STRs to 1999.
Overall numbers completing teaching courses have fallen from the levels of the early 1990s. The reductionis most marked in secondary schools (where enrolments have declined) and completions in primary weresustained prior to reductions in 1997 and 1998.
Recruitment experience in the government school sector
A survey of the labour market for primary and secondary teachers in government schools was conducted inFebruary 2000 by DETYA, and the information was provided by the State school authorities. The surveycovered information on the current teaching workforce, projected teaching workforce, recruitment ofteachers and difficulties encountered, and the size, nature and utilisation of the teaching workforce.
Primary
Generally, in South Australia there is not expected to be any difficulty in the short term in filling vacancies,particularly in primary schools. In the next five to ten years, there will be increasing vacancies as teachersin the older cohorts retire.
Some specific areas of high demand for teachers in the primary sector are Asian Languages and SpecialEducation.
Secondary
Specific areas in the secondary sector which indicate a high demand for teachers are: Mathematics, Seniorspecialist Science (i.e. Physics, Chemistry and Agriculture); Technical Studies (Manual Arts); HomeEconomics; Asian Languages; and Special Education (for students with physical and intellectualdisabilities).
Short term vacancies in country areas and in hard to staff metropolitan locations are becoming increasinglydifficult to fill.
Initiatives taken by the Department of Education, Training and Employment to addressareas of recruitment difficulty
The following strategies are being using in South Australia to address the shortages:
• Regular meetings (at least four times per year) between departmental and university teacher trainingrepresentatives;
• Retraining opportunities in areas of shortage;
• Specific units on ‘Country Teaching’ established within university courses;
Demand and supply of primary and secondary school teachers in Australia
Attachment 1: Detailed State and Territory reports 103
• Increased opportunities for employment in country schools through the introduction of ‘SchoolChoice’ vacancies, whereby schools declare and select for vacancies;
• Short term country vacancies filled by permanent teachers, who undertake to move on an annual basis;
• A significant level of country incentives to attract teachers to country locations, with additionaloptions being considered;
• The recent appointment of a Project Officer to support teachers recruited to country schools. TheProject Officer also identifies teaching demands in country areas and supports undergraduatesspecialising in areas of high demand to obtain employment;
• Within South Australia a Ministerial Committee for the Teaching and Learning of Mathematics hasbeen established to focus on teacher shortages in this area and to identify strategies to redress thissituation;
• The Department and the Science Teachers Association are co-delivering professional developmenttargeted at country and city teachers so as to support this area of shortage;
• The Languages other than English Plan 1998-2007 provides for increased funding to expand theLanguages Retraining Program to increase the numbers of appropriately qualified teachers oflanguages;
• The three year national Quality Teacher Program commenced in 2000 to update and improve teachers'skills and understanding in the teaching of literacy, numeracy, science, mathematics, informationtechnology and vocational education; and
• South Australia chairs the MCEETYA Teacher Preparation, Recruitment and Training Taskforce.
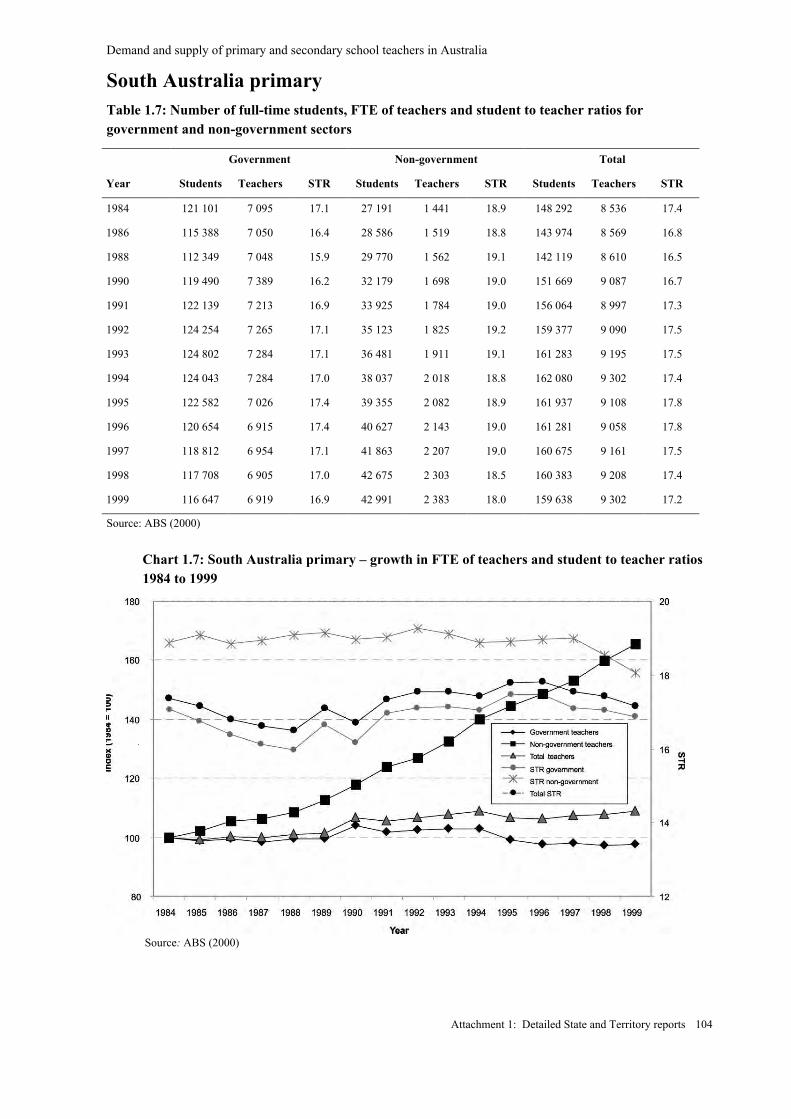
Demand and supply of primary and secondary school teachers in Australia
Attachment 1: Detailed State and Territory reports 104
South Australia primaryTable 1.7: Number of full-time students, FTE of teachers and student to teacher ratios forgovernment and non-government sectors
Government Non-government Total
Year Students Teachers STR Students Teachers STR Students Teachers STR
1984 121 101 7 095 17.1 27 191 1 441 18.9 148 292 8 536 17.4
1986 115 388 7 050 16.4 28 586 1 519 18.8 143 974 8 569 16.8
1988 112 349 7 048 15.9 29 770 1 562 19.1 142 119 8 610 16.5
1990 119 490 7 389 16.2 32 179 1 698 19.0 151 669 9 087 16.7
1991 122 139 7 213 16.9 33 925 1 784 19.0 156 064 8 997 17.3
1992 124 254 7 265 17.1 35 123 1 825 19.2 159 377 9 090 17.5
1993 124 802 7 284 17.1 36 481 1 911 19.1 161 283 9 195 17.5
1994 124 043 7 284 17.0 38 037 2 018 18.8 162 080 9 302 17.4
1995 122 582 7 026 17.4 39 355 2 082 18.9 161 937 9 108 17.8
1996 120 654 6 915 17.4 40 627 2 143 19.0 161 281 9 058 17.8
1997 118 812 6 954 17.1 41 863 2 207 19.0 160 675 9 161 17.5
1998 117 708 6 905 17.0 42 675 2 303 18.5 160 383 9 208 17.4
1999 116 647 6 919 16.9 42 991 2 383 18.0 159 638 9 302 17.2
Source: ABS (2000)
Chart 1.7: South Australia primary – growth in FTE of teachers and student to teacher ratios1984 to 1999
Source: ABS (2000)
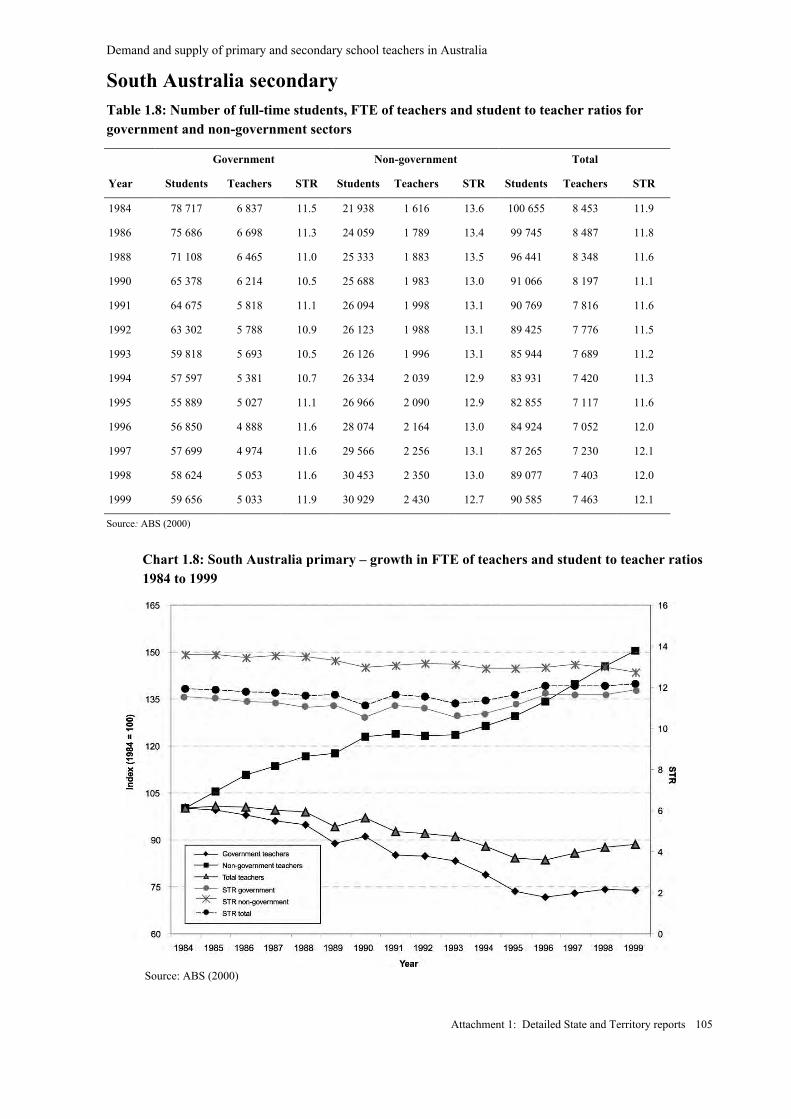
Demand and supply of primary and secondary school teachers in Australia
Attachment 1: Detailed State and Territory reports 105
South Australia secondaryTable 1.8: Number of full-time students, FTE of teachers and student to teacher ratios forgovernment and non-government sectors
Government Non-government Total
Year Students Teachers STR Students Teachers STR Students Teachers STR
1984 78 717 6 837 11.5 21 938 1 616 13.6 100 655 8 453 11.9
1986 75 686 6 698 11.3 24 059 1 789 13.4 99 745 8 487 11.8
1988 71 108 6 465 11.0 25 333 1 883 13.5 96 441 8 348 11.6
1990 65 378 6 214 10.5 25 688 1 983 13.0 91 066 8 197 11.1
1991 64 675 5 818 11.1 26 094 1 998 13.1 90 769 7 816 11.6
1992 63 302 5 788 10.9 26 123 1 988 13.1 89 425 7 776 11.5
1993 59 818 5 693 10.5 26 126 1 996 13.1 85 944 7 689 11.2
1994 57 597 5 381 10.7 26 334 2 039 12.9 83 931 7 420 11.3
1995 55 889 5 027 11.1 26 966 2 090 12.9 82 855 7 117 11.6
1996 56 850 4 888 11.6 28 074 2 164 13.0 84 924 7 052 12.0
1997 57 699 4 974 11.6 29 566 2 256 13.1 87 265 7 230 12.1
1998 58 624 5 053 11.6 30 453 2 350 13.0 89 077 7 403 12.0
1999 59 656 5 033 11.9 30 929 2 430 12.7 90 585 7 463 12.1
Source: ABS (2000)
Chart 1.8: South Australia primary – growth in FTE of teachers and student to teacher ratios1984 to 1999
Source: ABS (2000)

Demand and supply of primary and secondary school teachers in Australia
Attachment 1: Detailed State and Territory reports 106
Western Australia
Labour Market background
In 1999 there were 10 915 FTE primary teachers and 10 015 FTE secondary teachers in Western Australia(ABS Schools, Australia Cat. No. 4221.0). From 1984 to 1999 teacher numbers steadily increased. From1984 to 1999, in the primary sector the FTE of teachers grew by 38 per cent, whereas the secondary sectorshowed a higher growth rate of 45 per cent.
Student to teacher ratios in the primary sector fell from 1984 to 1999 (20.4 to 17.5), this fall in STRs wasalso evident in the secondary sector with a decrease in STR from 1984 to 1999 (13.5 to 12.5).
Overall teacher completions numbers in Western Australia have been sustained with the exception of 1998when there was a significant drop. Numbers completing primary were more sustained prior to 1998 butthere has been a progressive winding back of secondary completions.
Recruitment experience in the government school sector
A survey of the labour market for primary and secondary teachers in government schools was conducted inFebruary 2000 by DETYA, and the information was provided by the State school authorities. The surveycovered information on the current teaching workforce, projected teaching workforce, recruitment ofteachers and difficulties encountered, and the size, nature and utilisation of the teaching workforce.
Primary
There was no overall shortage of generalist primary teachers. However, a lack of teacher mobilitypresented a major problem because teachers were unwilling or unable to move from metropolitan areas totake up positions in rural schools. The worst affected areas were the Pilbara and Goldfields Districts, buteven schools within one or two hours drive of Perth were hard to staff. In Languages other than English,shortages were experienced in Italian and Japanese. Rural schools were most affected. There was also asmall shortfall of fully trained education support teachers for rural areas.
Secondary
As for primary schools, it was difficult to fill teacher vacancies in the Pilbara and Goldfields area due toperceptions about climate, poor infrastructure and social isolation. In 1999, positions in schools within oneor two hours drive from Perth became more difficult to fill due to the fall in the number of graduateteachers caused by the extension of the base training course for secondary teachers from three to four years.
Initiatives taken by the Education Department to address areas of recruitment difficulty
In the primary sector in Languages other than English some schools utilised telematics to deliver learningprograms. A small number of partially trained teachers, untrained teachers who were ‘native speakers’ orthose who were skilled in the language being taught were employed.
The following strategies were used to cope with teacher shortages in the secondary sector:
• the introduction of internships for students in their final year of training who have successfullycompleted their teaching practices and most of their academic requirements;
• the use of teachers who have minor units of study and interest and or experience in teaching thespecialist area;
• re-arranging timetables to allow for the optimum use of existing specialist teachers both within theschool and across schools in rural areas;

Demand and supply of primary and secondary school teachers in Australia
Attachment 1: Detailed State and Territory reports 107
• limited use of untrained teachers who have skills in the specialist area, particularly in Design andTechnology where local tradesmen worked with a trained teacher; and
• alternative methods of curriculum delivery such as telematics.
In the primary and secondary sector, the Department has introduced a number of initiatives to addressteacher demand and supply issues, these were:
• Graduate Diploma of Education Scholarships; Science Scholarships; Teacher PracticumScholarships; Cadetships;
• Teaching Internships; Site Based Teacher Training; Graduate Support Program; GraduateCertificate in Learning Technologies; Early Offers of Employment; Permanency and GraduatePlacement Trial; and
• Regional Professional Development Centre; Country Incentives Package; Remote TeachingService.
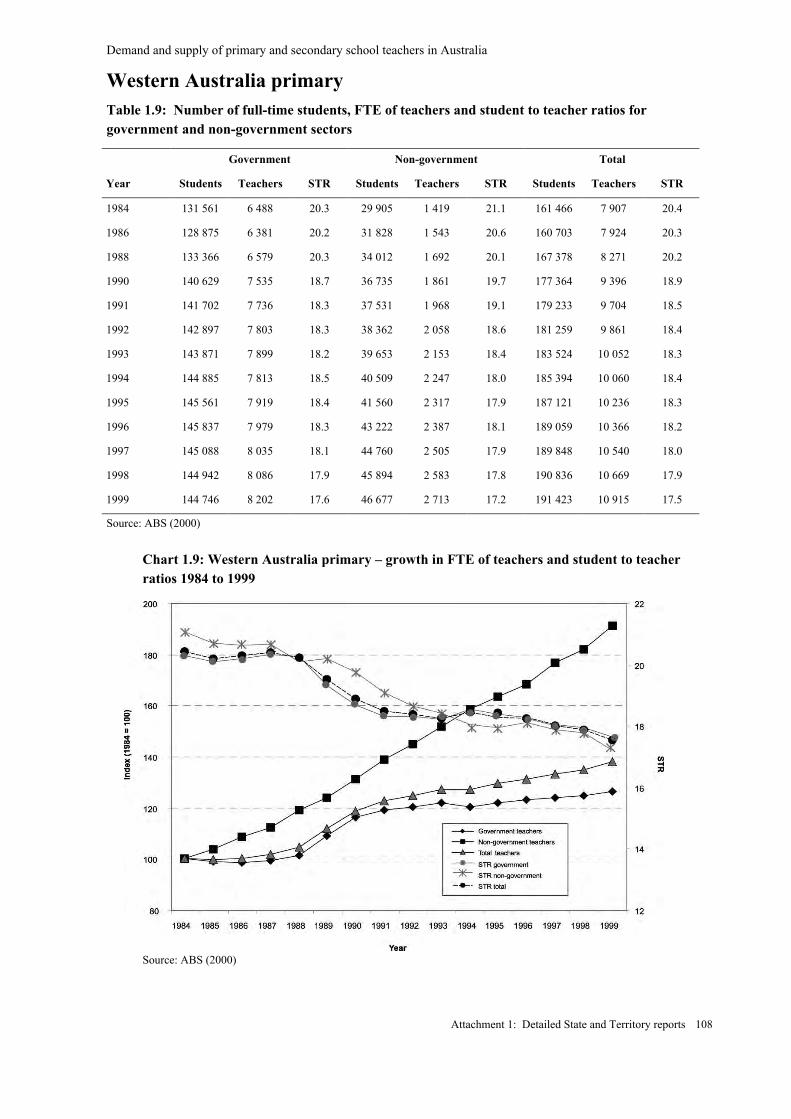
Demand and supply of primary and secondary school teachers in Australia
Attachment 1: Detailed State and Territory reports 108
Western Australia primaryTable 1.9: Number of full-time students, FTE of teachers and student to teacher ratios forgovernment and non-government sectors
Government Non-government Total
Year Students Teachers STR Students Teachers STR Students Teachers STR
1984 131 561 6 488 20.3 29 905 1 419 21.1 161 466 7 907 20.4
1986 128 875 6 381 20.2 31 828 1 543 20.6 160 703 7 924 20.3
1988 133 366 6 579 20.3 34 012 1 692 20.1 167 378 8 271 20.2
1990 140 629 7 535 18.7 36 735 1 861 19.7 177 364 9 396 18.9
1991 141 702 7 736 18.3 37 531 1 968 19.1 179 233 9 704 18.5
1992 142 897 7 803 18.3 38 362 2 058 18.6 181 259 9 861 18.4
1993 143 871 7 899 18.2 39 653 2 153 18.4 183 524 10 052 18.3
1994 144 885 7 813 18.5 40 509 2 247 18.0 185 394 10 060 18.4
1995 145 561 7 919 18.4 41 560 2 317 17.9 187 121 10 236 18.3
1996 145 837 7 979 18.3 43 222 2 387 18.1 189 059 10 366 18.2
1997 145 088 8 035 18.1 44 760 2 505 17.9 189 848 10 540 18.0
1998 144 942 8 086 17.9 45 894 2 583 17.8 190 836 10 669 17.9
1999 144 746 8 202 17.6 46 677 2 713 17.2 191 423 10 915 17.5
Source: ABS (2000)
Chart 1.9: Western Australia primary – growth in FTE of teachers and student to teacherratios 1984 to 1999
Source: ABS (2000)
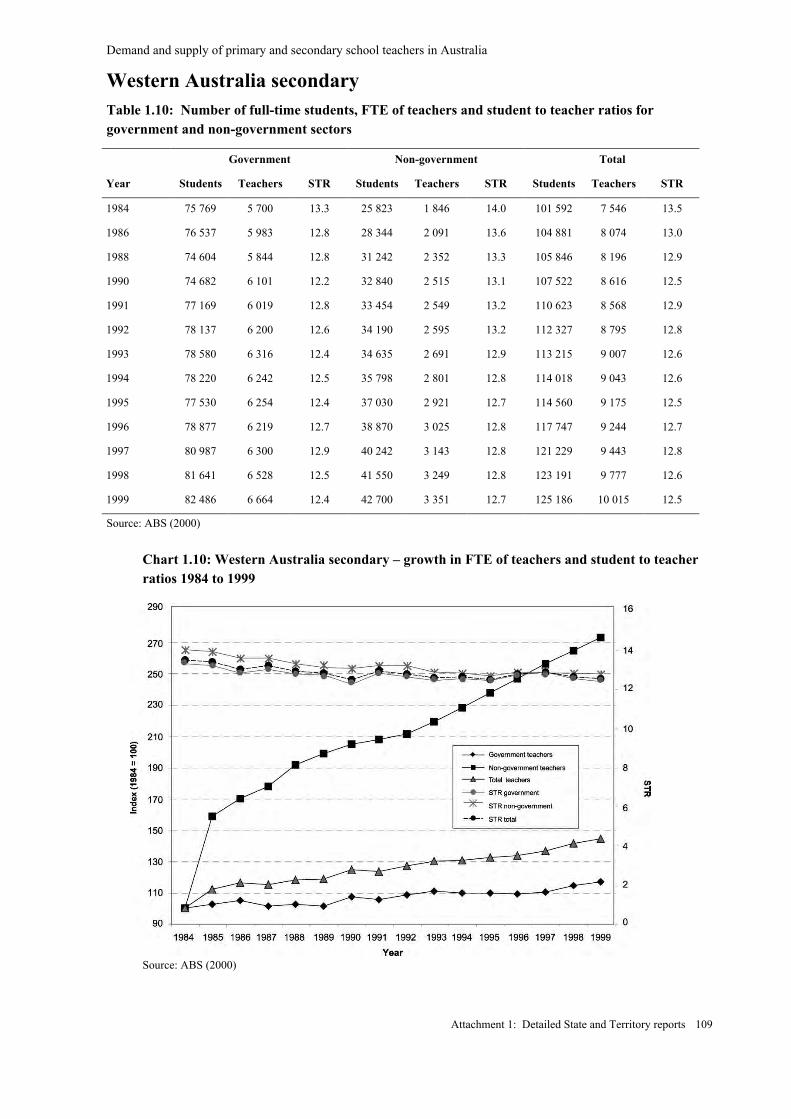
Demand and supply of primary and secondary school teachers in Australia
Attachment 1: Detailed State and Territory reports 109
Western Australia secondaryTable 1.10: Number of full-time students, FTE of teachers and student to teacher ratios forgovernment and non-government sectors
Government Non-government Total
Year Students Teachers STR Students Teachers STR Students Teachers STR
1984 75 769 5 700 13.3 25 823 1 846 14.0 101 592 7 546 13.5
1986 76 537 5 983 12.8 28 344 2 091 13.6 104 881 8 074 13.0
1988 74 604 5 844 12.8 31 242 2 352 13.3 105 846 8 196 12.9
1990 74 682 6 101 12.2 32 840 2 515 13.1 107 522 8 616 12.5
1991 77 169 6 019 12.8 33 454 2 549 13.2 110 623 8 568 12.9
1992 78 137 6 200 12.6 34 190 2 595 13.2 112 327 8 795 12.8
1993 78 580 6 316 12.4 34 635 2 691 12.9 113 215 9 007 12.6
1994 78 220 6 242 12.5 35 798 2 801 12.8 114 018 9 043 12.6
1995 77 530 6 254 12.4 37 030 2 921 12.7 114 560 9 175 12.5
1996 78 877 6 219 12.7 38 870 3 025 12.8 117 747 9 244 12.7
1997 80 987 6 300 12.9 40 242 3 143 12.8 121 229 9 443 12.8
1998 81 641 6 528 12.5 41 550 3 249 12.8 123 191 9 777 12.6
1999 82 486 6 664 12.4 42 700 3 351 12.7 125 186 10 015 12.5
Source: ABS (2000)
Chart 1.10: Western Australia secondary – growth in FTE of teachers and student to teacherratios 1984 to 1999
Source: ABS (2000)

Demand and supply of primary and secondary school teachers in Australia
Attachment 1: Detailed State and Territory reports 110
Tasmania
The current labour market for teachers
There were 2 894 FTE primary teachers and 2 853 FTE secondary teachers in Tasmania in 1999 (ABSSchools, Australia Cat. No. 4221.0). Over the period 1984 to 1998 teacher numbers have been declining inboth the primary and secondary sectors. This decline in teacher numbers was more prominent ingovernment schools. The growth in the number of primary teachers was negative at 2 per cent and in thesecondary sector growth rate was negative at 7 per cent.
Student to teacher ratios in the primary sector increased from the mid-1980s to the early 1990s and havesince been declining. STRs in the secondary sector have after rising in the 1980s have remained relativelyconstant since 1991.
Overall numbers of completions have been sustained in Tasmania
Recruitment experience in the government school sector
Primary
The DETYA survey indicated that there were some shortages of teachers in early childhood in one districtin Tasmania, caused by a clustering of separations.
Secondary
For all identified categories (other than special education) the difficulties were in finding suitablereplacement teachers for absent staff. The occurrences were of one or two instances only for each subjectarea. All positions were eventually filled. The difficulties were exacerbated in rural areas.The Department has not experienced difficulty in filling permanent positions, except as noted when seekingteachers for hearing impaired or vision impaired students.
Initiatives taken by the Education Department to address shortages
In the primary sector the previous shortage was solved by offering a number of staff conversions topermanent status and careful redeployment of the staff into vacancies as they arose. The TasmanianGovernment is looking to develop and possibly expand its student scholarship program for final year orbeginning Bachelor of Teaching students.
For secondary schools the Department has established on-line mentoring programs for teachers teachingoutside their specialisation(s). There are graduate certificate programs in various educational specialisationsavailable for teachers to upgrade their qualifications. The Department has worked with the University ofTasmania to more closely align its graduate output with the Department’s needs.
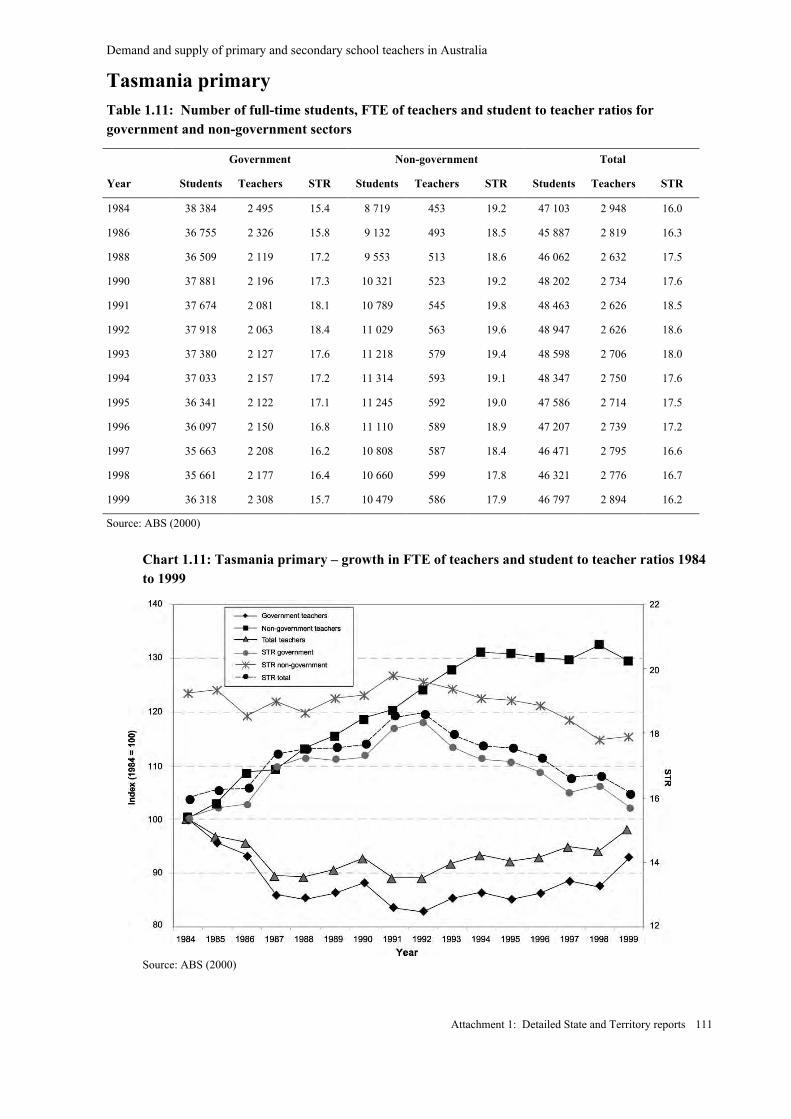
Demand and supply of primary and secondary school teachers in Australia
Attachment 1: Detailed State and Territory reports 111
Tasmania primaryTable 1.11: Number of full-time students, FTE of teachers and student to teacher ratios forgovernment and non-government sectors
Government Non-government Total
Year Students Teachers STR Students Teachers STR Students Teachers STR
1984 38 384 2 495 15.4 8 719 453 19.2 47 103 2 948 16.0
1986 36 755 2 326 15.8 9 132 493 18.5 45 887 2 819 16.3
1988 36 509 2 119 17.2 9 553 513 18.6 46 062 2 632 17.5
1990 37 881 2 196 17.3 10 321 523 19.2 48 202 2 734 17.6
1991 37 674 2 081 18.1 10 789 545 19.8 48 463 2 626 18.5
1992 37 918 2 063 18.4 11 029 563 19.6 48 947 2 626 18.6
1993 37 380 2 127 17.6 11 218 579 19.4 48 598 2 706 18.0
1994 37 033 2 157 17.2 11 314 593 19.1 48 347 2 750 17.6
1995 36 341 2 122 17.1 11 245 592 19.0 47 586 2 714 17.5
1996 36 097 2 150 16.8 11 110 589 18.9 47 207 2 739 17.2
1997 35 663 2 208 16.2 10 808 587 18.4 46 471 2 795 16.6
1998 35 661 2 177 16.4 10 660 599 17.8 46 321 2 776 16.7
1999 36 318 2 308 15.7 10 479 586 17.9 46 797 2 894 16.2
Source: ABS (2000)
Chart 1.11: Tasmania primary – growth in FTE of teachers and student to teacher ratios 1984to 1999
Source: ABS (2000)
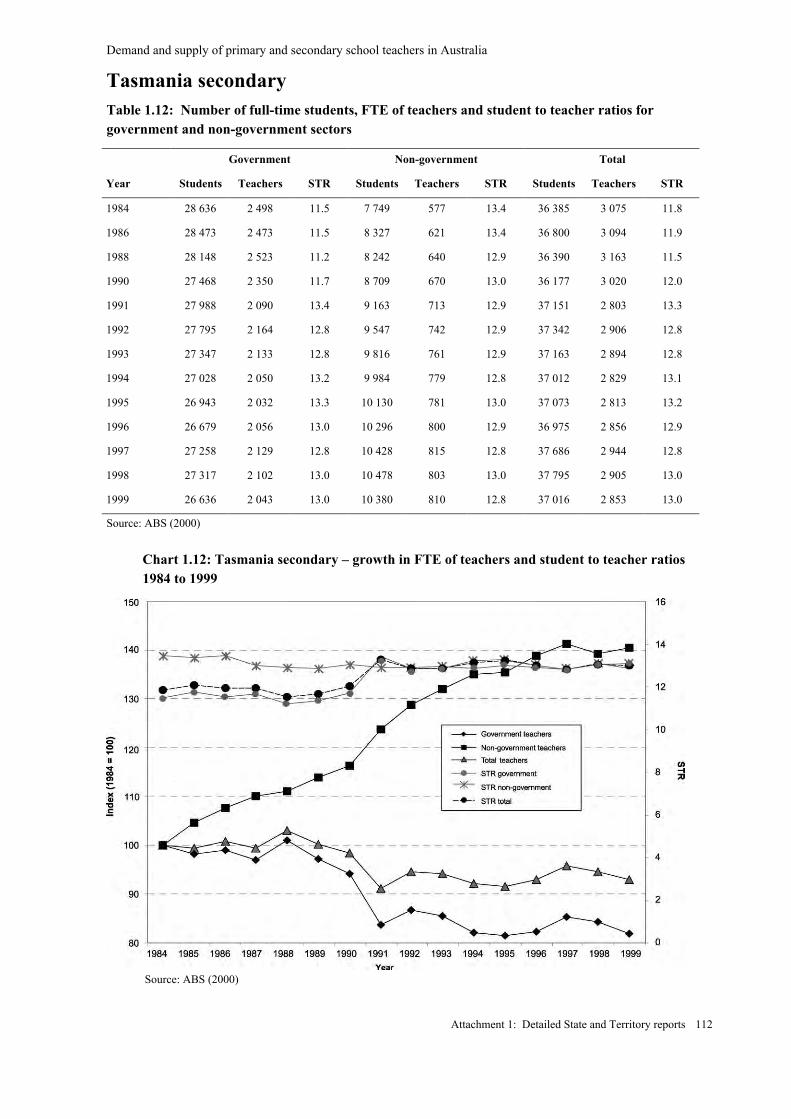
Demand and supply of primary and secondary school teachers in Australia
Attachment 1: Detailed State and Territory reports 112
Tasmania secondaryTable 1.12: Number of full-time students, FTE of teachers and student to teacher ratios forgovernment and non-government sectors
Government Non-government Total
Year Students Teachers STR Students Teachers STR Students Teachers STR
1984 28 636 2 498 11.5 7 749 577 13.4 36 385 3 075 11.8
1986 28 473 2 473 11.5 8 327 621 13.4 36 800 3 094 11.9
1988 28 148 2 523 11.2 8 242 640 12.9 36 390 3 163 11.5
1990 27 468 2 350 11.7 8 709 670 13.0 36 177 3 020 12.0
1991 27 988 2 090 13.4 9 163 713 12.9 37 151 2 803 13.3
1992 27 795 2 164 12.8 9 547 742 12.9 37 342 2 906 12.8
1993 27 347 2 133 12.8 9 816 761 12.9 37 163 2 894 12.8
1994 27 028 2 050 13.2 9 984 779 12.8 37 012 2 829 13.1
1995 26 943 2 032 13.3 10 130 781 13.0 37 073 2 813 13.2
1996 26 679 2 056 13.0 10 296 800 12.9 36 975 2 856 12.9
1997 27 258 2 129 12.8 10 428 815 12.8 37 686 2 944 12.8
1998 27 317 2 102 13.0 10 478 803 13.0 37 795 2 905 13.0
1999 26 636 2 043 13.0 10 380 810 12.8 37 016 2 853 13.0
Source: ABS (2000)
Chart 1.12: Tasmania secondary – growth in FTE of teachers and student to teacher ratios1984 to 1999
Source: ABS (2000)
Demand and supply of primary and secondary school teachers in Australia
Attachment 1: Detailed State and Territory reports 113
Northern Territory
Current labour market for teachers
In 1999 there were 1 770 FTE primary teachers and 1 026 FTE secondary teachers in the NorthernTerritory (ABS Schools Australia 4221.0). From 1984 to 1999 teacher numbers grew steadily, especially inthe primary sector. FTE of primary teachers grew by 41 per cent over the period whilst the growth insecondary teachers was comparatively slower at 27 per cent.
Student teacher ratios in primary schools also fell during this period from 16.7 in 1984 to 14.5 in 1999.Secondary school STRs rose in the early 1990s then dropped and have remained relatively constant sincethen.
Recruitment experience in the government schools sector
Primary
There is some difficulty in filling positions for general classroom teachers in remote areas, and LOTEteachers, mainly Indonesian, in urban centres. There is a shortfall in trained teachers in Special Education.
Secondary
The areas of recruitment difficulty are:
• Languages other than English – the shortfall occurs in urban centres, particularly in respect ofJapanese and Indonesian teachers;
• Mathematics – shortages are experienced in the Senior secondary area and in urban areas;
• Science – Senior physics and chemistry positions are hard to fill;
• Technical Studies – the shortfall in this area is as a result of teachers not training in this area and theageing teaching population;
• Information Technology – Urban Darwin Secondary School is experiencing difficulty in identifyingqualified teachers in this subject area;
• Home Economics – The demand for teachers in this area is not great, but these positions are difficultto fill due to the lack of trained and qualified teachers in this area; and
• English as a Second Language (ESL) – there is a shortfall both in the urban and remote areas.
Initiatives taken by the Education Department to address shortages
A number of strategies are being used in the Northern Territory to address shortages:
• Special Education teaching positions have been filled with experienced classroom teachers who havehad some experience in dealing with special education students. This is particularly the case in SpecialSchools;
• The Department advertises nationally when there is a difficult position to fill in a particular area. Inaddition, contact is made with the Northern Territory University to ascertain if there are anygraduating students in this subject area;
• It is also possible to share a teacher between two schools particularly in the Languages other thanEnglish area;
• Casual relief or short term contract teachers are employed to cover the vacancy in the first instance;
• Representatives of the Northern Territory Department of Education participate in ‘Recruitment Fairs’organised by interstate universities with the view of attracting new graduates;
Demand and supply of primary and secondary school teachers in Australia
Attachment 1: Detailed State and Territory reports 114
• The Department offers HECS reimbursement to all employees wishing to undertakefurther studies; and
• Consideration is being given to retraining teachers in the specialist areas of ESL and specialeducation.
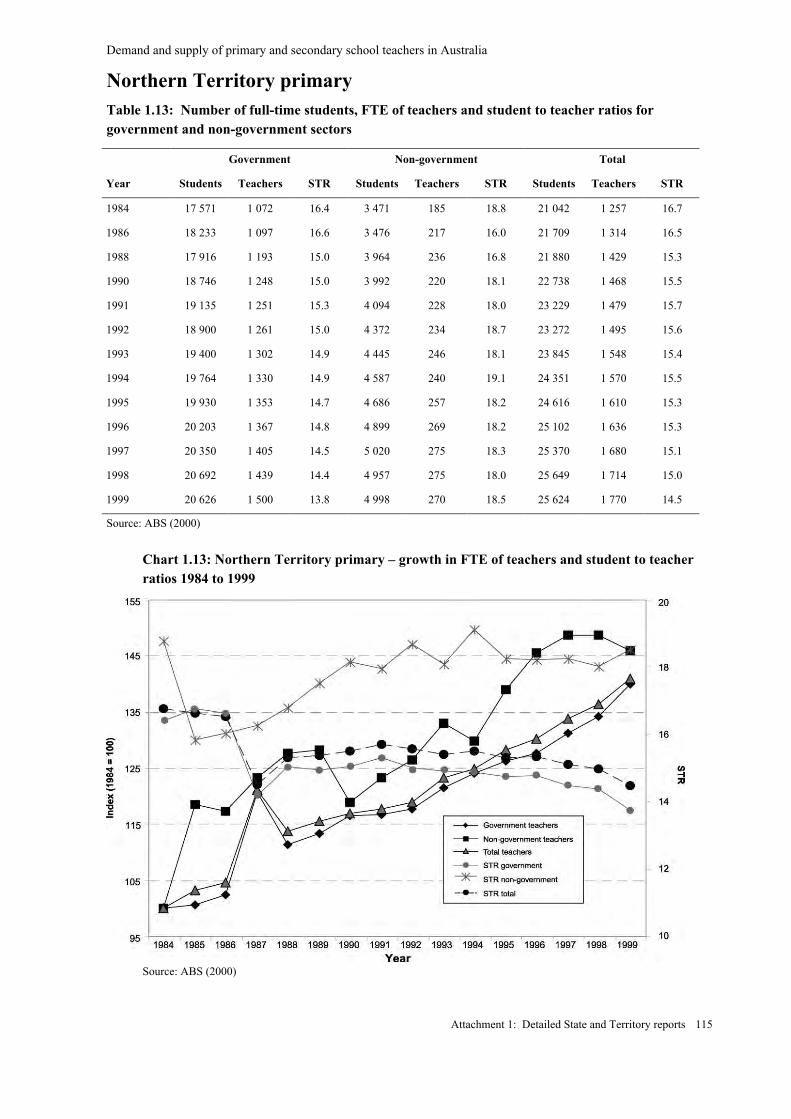
Demand and supply of primary and secondary school teachers in Australia
Attachment 1: Detailed State and Territory reports 115
Northern Territory primaryTable 1.13: Number of full-time students, FTE of teachers and student to teacher ratios forgovernment and non-government sectors
Government Non-government Total
Year Students Teachers STR Students Teachers STR Students Teachers STR
1984 17 571 1 072 16.4 3 471 185 18.8 21 042 1 257 16.7
1986 18 233 1 097 16.6 3 476 217 16.0 21 709 1 314 16.5
1988 17 916 1 193 15.0 3 964 236 16.8 21 880 1 429 15.3
1990 18 746 1 248 15.0 3 992 220 18.1 22 738 1 468 15.5
1991 19 135 1 251 15.3 4 094 228 18.0 23 229 1 479 15.7
1992 18 900 1 261 15.0 4 372 234 18.7 23 272 1 495 15.6
1993 19 400 1 302 14.9 4 445 246 18.1 23 845 1 548 15.4
1994 19 764 1 330 14.9 4 587 240 19.1 24 351 1 570 15.5
1995 19 930 1 353 14.7 4 686 257 18.2 24 616 1 610 15.3
1996 20 203 1 367 14.8 4 899 269 18.2 25 102 1 636 15.3
1997 20 350 1 405 14.5 5 020 275 18.3 25 370 1 680 15.1
1998 20 692 1 439 14.4 4 957 275 18.0 25 649 1 714 15.0
1999 20 626 1 500 13.8 4 998 270 18.5 25 624 1 770 14.5
Source: ABS (2000)
Chart 1.13: Northern Territory primary – growth in FTE of teachers and student to teacherratios 1984 to 1999
Source: ABS (2000)
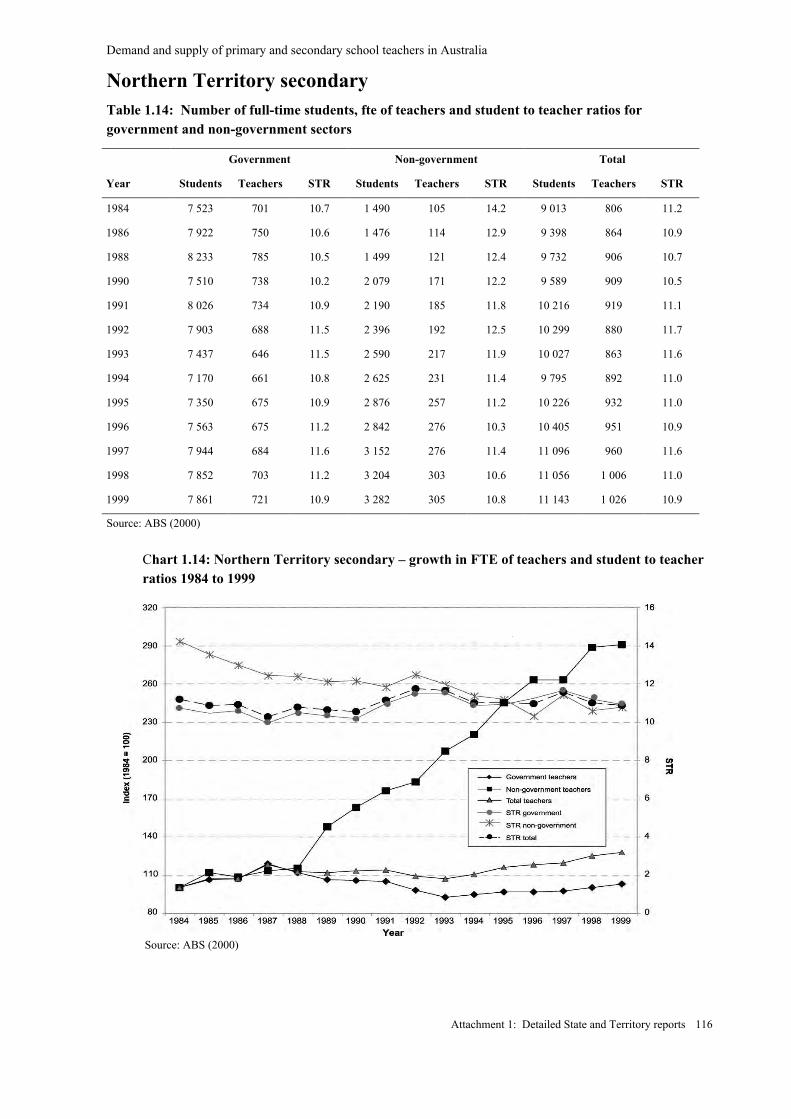
Demand and supply of primary and secondary school teachers in Australia
Attachment 1: Detailed State and Territory reports 116
Northern Territory secondaryTable 1.14: Number of full-time students, fte of teachers and student to teacher ratios forgovernment and non-government sectors
Government Non-government Total
Year Students Teachers STR Students Teachers STR Students Teachers STR
1984 7 523 701 10.7 1 490 105 14.2 9 013 806 11.2
1986 7 922 750 10.6 1 476 114 12.9 9 398 864 10.9
1988 8 233 785 10.5 1 499 121 12.4 9 732 906 10.7
1990 7 510 738 10.2 2 079 171 12.2 9 589 909 10.5
1991 8 026 734 10.9 2 190 185 11.8 10 216 919 11.1
1992 7 903 688 11.5 2 396 192 12.5 10 299 880 11.7
1993 7 437 646 11.5 2 590 217 11.9 10 027 863 11.6
1994 7 170 661 10.8 2 625 231 11.4 9 795 892 11.0
1995 7 350 675 10.9 2 876 257 11.2 10 226 932 11.0
1996 7 563 675 11.2 2 842 276 10.3 10 405 951 10.9
1997 7 944 684 11.6 3 152 276 11.4 11 096 960 11.6
1998 7 852 703 11.2 3 204 303 10.6 11 056 1 006 11.0
1999 7 861 721 10.9 3 282 305 10.8 11 143 1 026 10.9
Source: ABS (2000)
Chart 1.14: Northern Territory secondary – growth in FTE of teachers and student to teacherratios 1984 to 1999
Source: ABS (2000)
Demand and supply of primary and secondary school teachers in Australia
Attachment 1: Detailed State and Territory reports 117
Australian Capital Territory
Labour market background
There were 1793 FTE primary teachers and 2221 FTE secondary teachers in the ACT in 1999 (ABSSchools, Australia). Over the period 1984 to 1998 there has been a net increase in the number of teachersin both the primary and secondary sectors. This increase in teacher numbers was confined to the nongovernment sector with teacher numbers in the government sector falling since 1994. The growth in thenumber of primary teachers was 6 percent (3 percent in the government sector) and in the secondary sectorgrowth rate was 5 percent (negative 8 percent in the government sector).
Student to teacher ratios in the primary sector have declined over the period 1984 to 1999, however therehas been an increase in the STR for the secondary sector over this period.
Recruitment experience in the government school sector
Primary
Survey results show that there is an adequate supply of generalist primary school teachers. However, thereare recruitment difficulties filling some specialist vacancies - teacher librarian, special education and schoolcounselling. There is also difficulty attracting suitable teachers for casual vacancies.
Secondary
While survey results indicate an adequate supply of secondary teachers, there were difficulties fillingmathematics, science, information technology and special education vacancies. School counsellors andteachers with vocation certification are other demand areas. The lack of suitable casual teachers causesconcern particularly during the high demand winter months.
Initiatives taken by the Education Department to address shortages
The Student Internship Program initiative developed in partnership with the University of Canberra hasbeen success in assisting the Department to retain a higher percentage of recent primary educationgraduates in the ACT. The program provides opportunities for students in the program to obtain increasepracticum time as well as access to paid employment prior to graduation. The program is to be extended tosecondary education students during 2001.
The department advertises for teacher recruits in all major metropolitan and national newspapers. Inaddition, recruitment teams including recent recruits visit all teacher training institutions in all states andterritories except WA as well as participating in Recruitment Fairs at these institutions.
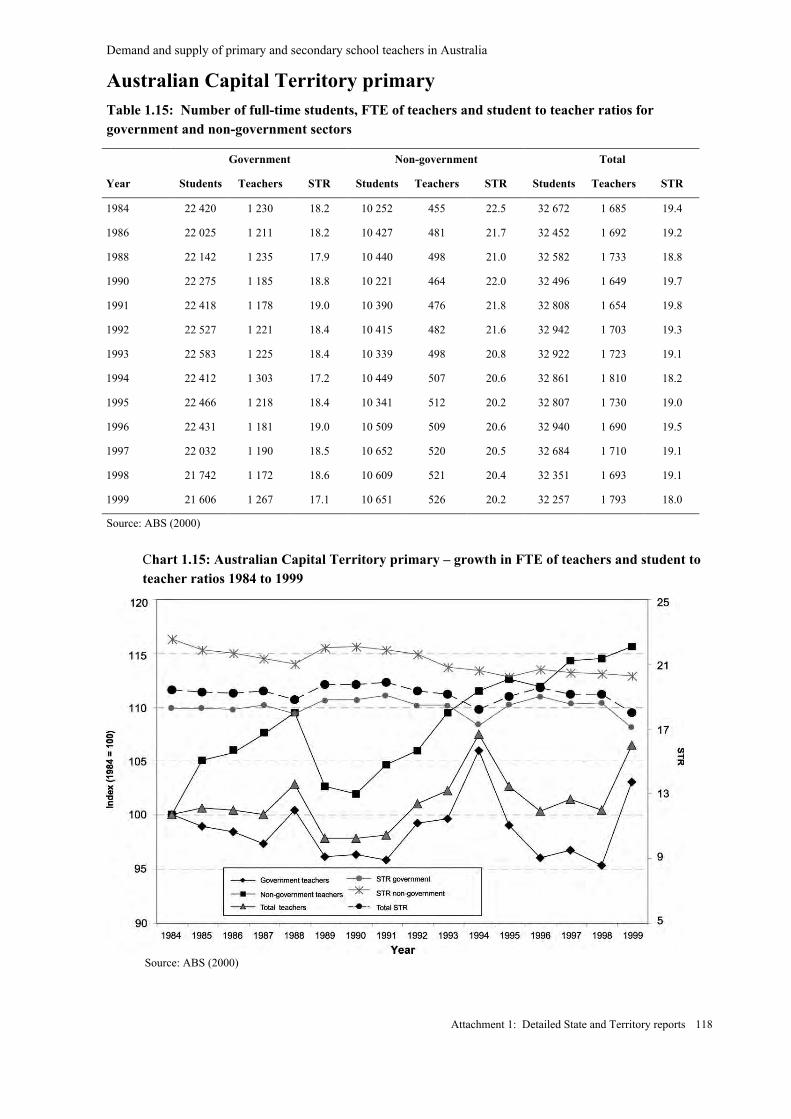
Demand and supply of primary and secondary school teachers in Australia
Attachment 1: Detailed State and Territory reports 118
Australian Capital Territory primaryTable 1.15: Number of full-time students, FTE of teachers and student to teacher ratios forgovernment and non-government sectors
Government Non-government Total
Year Students Teachers STR Students Teachers STR Students Teachers STR
1984 22 420 1 230 18.2 10 252 455 22.5 32 672 1 685 19.4
1986 22 025 1 211 18.2 10 427 481 21.7 32 452 1 692 19.2
1988 22 142 1 235 17.9 10 440 498 21.0 32 582 1 733 18.8
1990 22 275 1 185 18.8 10 221 464 22.0 32 496 1 649 19.7
1991 22 418 1 178 19.0 10 390 476 21.8 32 808 1 654 19.8
1992 22 527 1 221 18.4 10 415 482 21.6 32 942 1 703 19.3
1993 22 583 1 225 18.4 10 339 498 20.8 32 922 1 723 19.1
1994 22 412 1 303 17.2 10 449 507 20.6 32 861 1 810 18.2
1995 22 466 1 218 18.4 10 341 512 20.2 32 807 1 730 19.0
1996 22 431 1 181 19.0 10 509 509 20.6 32 940 1 690 19.5
1997 22 032 1 190 18.5 10 652 520 20.5 32 684 1 710 19.1
1998 21 742 1 172 18.6 10 609 521 20.4 32 351 1 693 19.1
1999 21 606 1 267 17.1 10 651 526 20.2 32 257 1 793 18.0
Source: ABS (2000)
Chart 1.15: Australian Capital Territory primary – growth in FTE of teachers and student toteacher ratios 1984 to 1999
Source: ABS (2000)
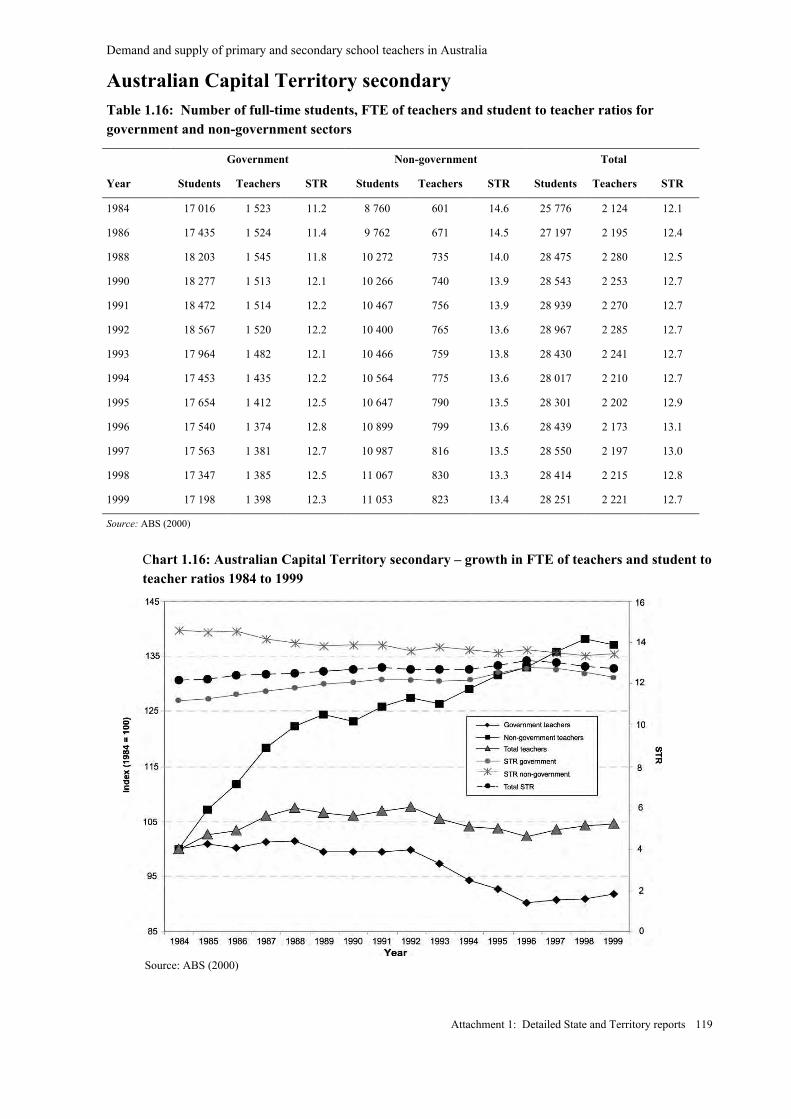
Demand and supply of primary and secondary school teachers in Australia
Attachment 1: Detailed State and Territory reports 119
Australian Capital Territory secondaryTable 1.16: Number of full-time students, FTE of teachers and student to teacher ratios forgovernment and non-government sectors
Government Non-government Total
Year Students Teachers STR Students Teachers STR Students Teachers STR
1984 17 016 1 523 11.2 8 760 601 14.6 25 776 2 124 12.1
1986 17 435 1 524 11.4 9 762 671 14.5 27 197 2 195 12.4
1988 18 203 1 545 11.8 10 272 735 14.0 28 475 2 280 12.5
1990 18 277 1 513 12.1 10 266 740 13.9 28 543 2 253 12.7
1991 18 472 1 514 12.2 10 467 756 13.9 28 939 2 270 12.7
1992 18 567 1 520 12.2 10 400 765 13.6 28 967 2 285 12.7
1993 17 964 1 482 12.1 10 466 759 13.8 28 430 2 241 12.7
1994 17 453 1 435 12.2 10 564 775 13.6 28 017 2 210 12.7
1995 17 654 1 412 12.5 10 647 790 13.5 28 301 2 202 12.9
1996 17 540 1 374 12.8 10 899 799 13.6 28 439 2 173 13.1
1997 17 563 1 381 12.7 10 987 816 13.5 28 550 2 197 13.0
1998 17 347 1 385 12.5 11 067 830 13.3 28 414 2 215 12.8
1999 17 198 1 398 12.3 11 053 823 13.4 28 251 2 221 12.7
Source: ABS (2000)
Chart 1.16: Australian Capital Territory secondary – growth in FTE of teachers and student toteacher ratios 1984 to 1999
Source: ABS (2000)
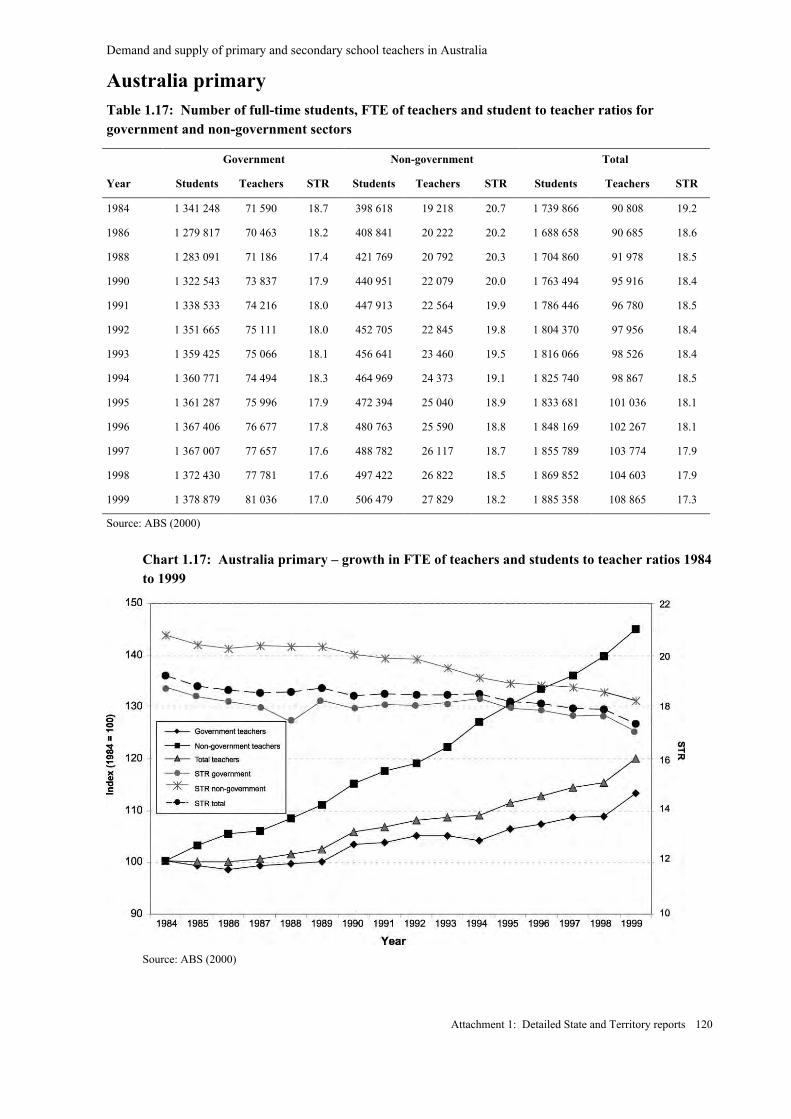
Demand and supply of primary and secondary school teachers in Australia
Attachment 1: Detailed State and Territory reports 120
Australia primaryTable 1.17: Number of full-time students, FTE of teachers and student to teacher ratios forgovernment and non-government sectors
Government Non-government Total
Year Students Teachers STR Students Teachers STR Students Teachers STR
1984 1 341 248 71 590 18.7 398 618 19 218 20.7 1 739 866 90 808 19.2
1986 1 279 817 70 463 18.2 408 841 20 222 20.2 1 688 658 90 685 18.6
1988 1 283 091 71 186 17.4 421 769 20 792 20.3 1 704 860 91 978 18.5
1990 1 322 543 73 837 17.9 440 951 22 079 20.0 1 763 494 95 916 18.4
1991 1 338 533 74 216 18.0 447 913 22 564 19.9 1 786 446 96 780 18.5
1992 1 351 665 75 111 18.0 452 705 22 845 19.8 1 804 370 97 956 18.4
1993 1 359 425 75 066 18.1 456 641 23 460 19.5 1 816 066 98 526 18.4
1994 1 360 771 74 494 18.3 464 969 24 373 19.1 1 825 740 98 867 18.5
1995 1 361 287 75 996 17.9 472 394 25 040 18.9 1 833 681 101 036 18.1
1996 1 367 406 76 677 17.8 480 763 25 590 18.8 1 848 169 102 267 18.1
1997 1 367 007 77 657 17.6 488 782 26 117 18.7 1 855 789 103 774 17.9
1998 1 372 430 77 781 17.6 497 422 26 822 18.5 1 869 852 104 603 17.9
1999 1 378 879 81 036 17.0 506 479 27 829 18.2 1 885 358 108 865 17.3
Source: ABS (2000)
Chart 1.17: Australia primary – growth in FTE of teachers and students to teacher ratios 1984to 1999
Source: ABS (2000)
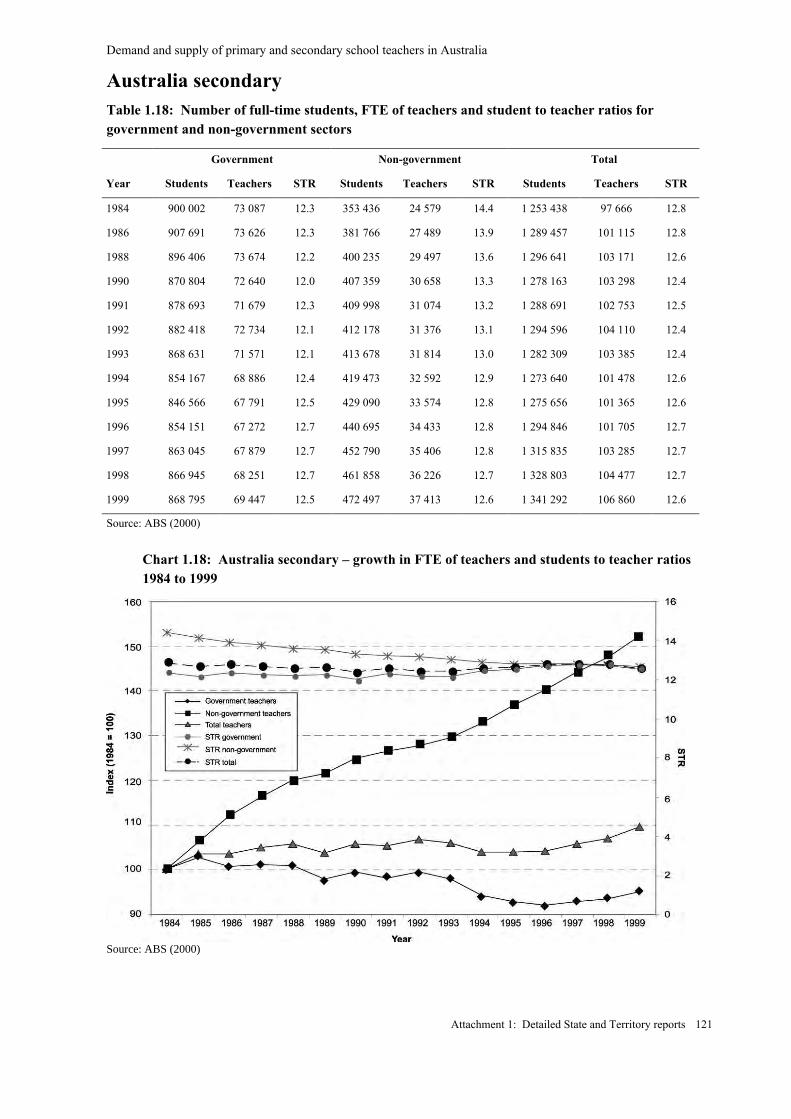
Demand and supply of primary and secondary school teachers in Australia
Attachment 1: Detailed State and Territory reports 121
Australia secondaryTable 1.18: Number of full-time students, FTE of teachers and student to teacher ratios forgovernment and non-government sectors
Government Non-government Total
Year Students Teachers STR Students Teachers STR Students Teachers STR
1984 900 002 73 087 12.3 353 436 24 579 14.4 1 253 438 97 666 12.8
1986 907 691 73 626 12.3 381 766 27 489 13.9 1 289 457 101 115 12.8
1988 896 406 73 674 12.2 400 235 29 497 13.6 1 296 641 103 171 12.6
1990 870 804 72 640 12.0 407 359 30 658 13.3 1 278 163 103 298 12.4
1991 878 693 71 679 12.3 409 998 31 074 13.2 1 288 691 102 753 12.5
1992 882 418 72 734 12.1 412 178 31 376 13.1 1 294 596 104 110 12.4
1993 868 631 71 571 12.1 413 678 31 814 13.0 1 282 309 103 385 12.4
1994 854 167 68 886 12.4 419 473 32 592 12.9 1 273 640 101 478 12.6
1995 846 566 67 791 12.5 429 090 33 574 12.8 1 275 656 101 365 12.6
1996 854 151 67 272 12.7 440 695 34 433 12.8 1 294 846 101 705 12.7
1997 863 045 67 879 12.7 452 790 35 406 12.8 1 315 835 103 285 12.7
1998 866 945 68 251 12.7 461 858 36 226 12.7 1 328 803 104 477 12.7
1999 868 795 69 447 12.5 472 497 37 413 12.6 1 341 292 106 860 12.6
Source: ABS (2000)
Chart 1.18: Australia secondary – growth in FTE of teachers and students to teacher ratios1984 to 1999
Source: ABS (2000)
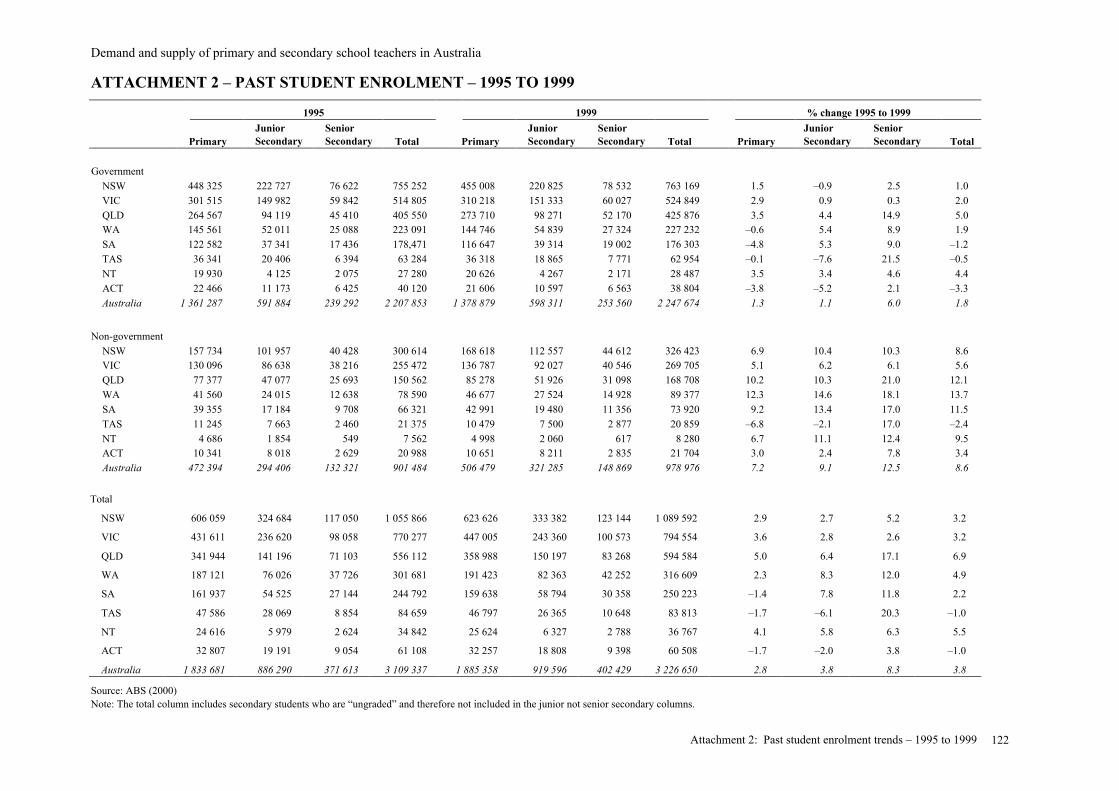
Demand and supply of primary and secondary school teachers in Australia
Attachment 2: Past student enrolment trends – 1995 to 1999 122
ATTACHMENT 2 – PAST STUDENT ENROLMENT – 1995 TO 1999
1995 1999 % change 1995 to 1999
PrimaryJuniorSecondary
SeniorSecondary Total Primary
JuniorSecondary
SeniorSecondary Total Primary
JuniorSecondary
SeniorSecondary Total
Government
NSW 448 325 222 727 76 622 755 252 455 008 220 825 78 532 763 169 1.5 –0.9 2.5 1.0
VIC 301 515 149 982 59 842 514 805 310 218 151 333 60 027 524 849 2.9 0.9 0.3 2.0
QLD 264 567 94 119 45 410 405 550 273 710 98 271 52 170 425 876 3.5 4.4 14.9 5.0WA 145 561 52 011 25 088 223 091 144 746 54 839 27 324 227 232 –0.6 5.4 8.9 1.9
SA 122 582 37 341 17 436 178,471 116 647 39 314 19 002 176 303 –4.8 5.3 9.0 –1.2
TAS 36 341 20 406 6 394 63 284 36 318 18 865 7 771 62 954 –0.1 –7.6 21.5 –0.5
NT 19 930 4 125 2 075 27 280 20 626 4 267 2 171 28 487 3.5 3.4 4.6 4.4
ACT 22 466 11 173 6 425 40 120 21 606 10 597 6 563 38 804 –3.8 –5.2 2.1 –3.3
Australia 1 361 287 591 884 239 292 2 207 853 1 378 879 598 311 253 560 2 247 674 1.3 1.1 6.0 1.8
Non-government
NSW 157 734 101 957 40 428 300 614 168 618 112 557 44 612 326 423 6.9 10.4 10.3 8.6VIC 130 096 86 638 38 216 255 472 136 787 92 027 40 546 269 705 5.1 6.2 6.1 5.6
QLD 77 377 47 077 25 693 150 562 85 278 51 926 31 098 168 708 10.2 10.3 21.0 12.1
WA 41 560 24 015 12 638 78 590 46 677 27 524 14 928 89 377 12.3 14.6 18.1 13.7
SA 39 355 17 184 9 708 66 321 42 991 19 480 11 356 73 920 9.2 13.4 17.0 11.5
TAS 11 245 7 663 2 460 21 375 10 479 7 500 2 877 20 859 –6.8 –2.1 17.0 –2.4
NT 4 686 1 854 549 7 562 4 998 2 060 617 8 280 6.7 11.1 12.4 9.5ACT 10 341 8 018 2 629 20 988 10 651 8 211 2 835 21 704 3.0 2.4 7.8 3.4
Australia 472 394 294 406 132 321 901 484 506 479 321 285 148 869 978 976 7.2 9.1 12.5 8.6
Total
NSW 606 059 324 684 117 050 1 055 866 623 626 333 382 123 144 1 089 592 2.9 2.7 5.2 3.2
VIC 431 611 236 620 98 058 770 277 447 005 243 360 100 573 794 554 3.6 2.8 2.6 3.2
QLD 341 944 141 196 71 103 556 112 358 988 150 197 83 268 594 584 5.0 6.4 17.1 6.9
WA 187 121 76 026 37 726 301 681 191 423 82 363 42 252 316 609 2.3 8.3 12.0 4.9
SA 161 937 54 525 27 144 244 792 159 638 58 794 30 358 250 223 –1.4 7.8 11.8 2.2
TAS 47 586 28 069 8 854 84 659 46 797 26 365 10 648 83 813 –1.7 –6.1 20.3 –1.0
NT 24 616 5 979 2 624 34 842 25 624 6 327 2 788 36 767 4.1 5.8 6.3 5.5
ACT 32 807 19 191 9 054 61 108 32 257 18 808 9 398 60 508 –1.7 –2.0 3.8 –1.0
Australia 1 833 681 886 290 371 613 3 109 337 1 885 358 919 596 402 429 3 226 650 2.8 3.8 8.3 3.8
Source: ABS (2000)Note: The total column includes secondary students who are “ungraded” and therefore not included in the junior not senior secondary columns.
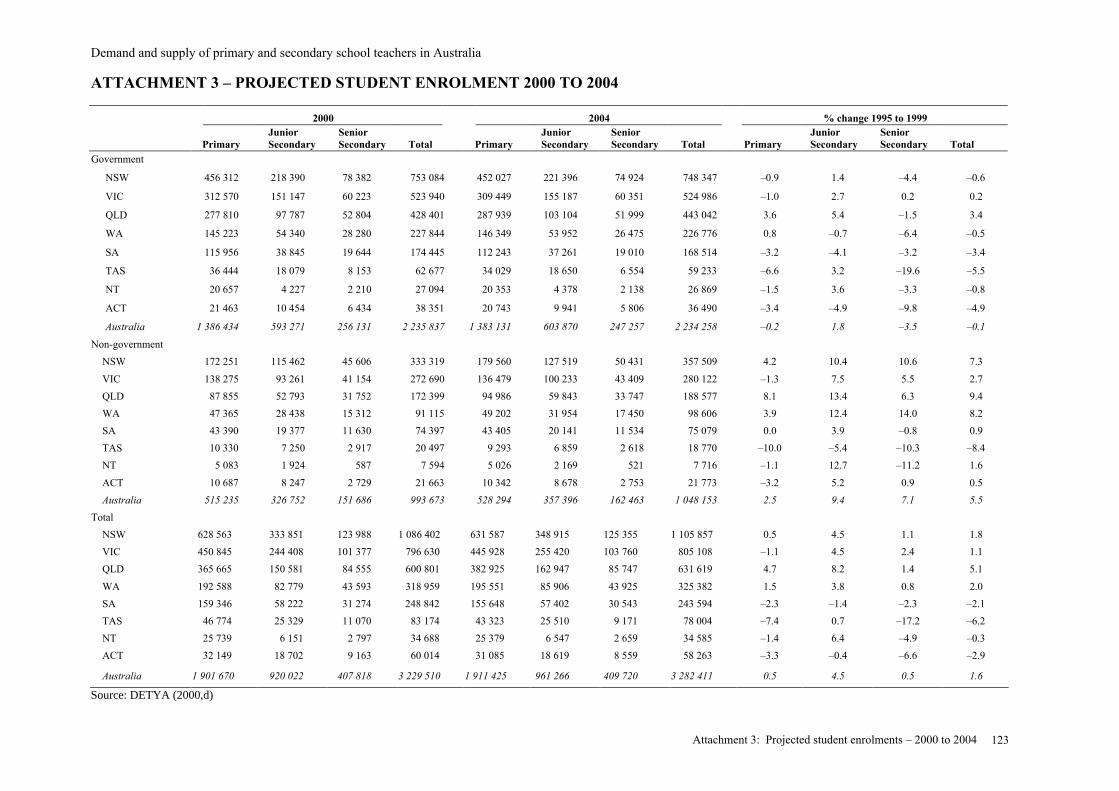
Demand and supply of primary and secondary school teachers in Australia
Attachment 3: Projected student enrolments – 2000 to 2004 123
ATTACHMENT 3 – PROJECTED STUDENT ENROLMENT 2000 TO 2004
2000 2004 % change 1995 to 1999
PrimaryJuniorSecondary
SeniorSecondary Total Primary
JuniorSecondary
SeniorSecondary Total Primary
JuniorSecondary
SeniorSecondary Total
Government
NSW 456 312 218 390 78 382 753 084 452 027 221 396 74 924 748 347 –0.9 1.4 –4.4 –0.6
VIC 312 570 151 147 60 223 523 940 309 449 155 187 60 351 524 986 –1.0 2.7 0.2 0.2
QLD 277 810 97 787 52 804 428 401 287 939 103 104 51 999 443 042 3.6 5.4 –1.5 3.4
WA 145 223 54 340 28 280 227 844 146 349 53 952 26 475 226 776 0.8 –0.7 –6.4 –0.5
SA 115 956 38 845 19 644 174 445 112 243 37 261 19 010 168 514 –3.2 –4.1 –3.2 –3.4
TAS 36 444 18 079 8 153 62 677 34 029 18 650 6 554 59 233 –6.6 3.2 –19.6 –5.5
NT 20 657 4 227 2 210 27 094 20 353 4 378 2 138 26 869 –1.5 3.6 –3.3 –0.8
ACT 21 463 10 454 6 434 38 351 20 743 9 941 5 806 36 490 –3.4 –4.9 –9.8 –4.9
Australia 1 386 434 593 271 256 131 2 235 837 1 383 131 603 870 247 257 2 234 258 –0.2 1.8 –3.5 –0.1
Non-government
NSW 172 251 115 462 45 606 333 319 179 560 127 519 50 431 357 509 4.2 10.4 10.6 7.3
VIC 138 275 93 261 41 154 272 690 136 479 100 233 43 409 280 122 –1.3 7.5 5.5 2.7
QLD 87 855 52 793 31 752 172 399 94 986 59 843 33 747 188 577 8.1 13.4 6.3 9.4
WA 47 365 28 438 15 312 91 115 49 202 31 954 17 450 98 606 3.9 12.4 14.0 8.2
SA 43 390 19 377 11 630 74 397 43 405 20 141 11 534 75 079 0.0 3.9 –0.8 0.9
TAS 10 330 7 250 2 917 20 497 9 293 6 859 2 618 18 770 –10.0 –5.4 –10.3 –8.4
NT 5 083 1 924 587 7 594 5 026 2 169 521 7 716 –1.1 12.7 –11.2 1.6
ACT 10 687 8 247 2 729 21 663 10 342 8 678 2 753 21 773 –3.2 5.2 0.9 0.5
Australia 515 235 326 752 151 686 993 673 528 294 357 396 162 463 1 048 153 2.5 9.4 7.1 5.5
Total
NSW 628 563 333 851 123 988 1 086 402 631 587 348 915 125 355 1 105 857 0.5 4.5 1.1 1.8
VIC 450 845 244 408 101 377 796 630 445 928 255 420 103 760 805 108 –1.1 4.5 2.4 1.1
QLD 365 665 150 581 84 555 600 801 382 925 162 947 85 747 631 619 4.7 8.2 1.4 5.1
WA 192 588 82 779 43 593 318 959 195 551 85 906 43 925 325 382 1.5 3.8 0.8 2.0
SA 159 346 58 222 31 274 248 842 155 648 57 402 30 543 243 594 –2.3 –1.4 –2.3 –2.1
TAS 46 774 25 329 11 070 83 174 43 323 25 510 9 171 78 004 –7.4 0.7 –17.2 –6.2
NT 25 739 6 151 2 797 34 688 25 379 6 547 2 659 34 585 –1.4 6.4 –4.9 –0.3
ACT 32 149 18 702 9 163 60 014 31 085 18 619 8 559 58 263 –3.3 –0.4 –6.6 –2.9
Australia 1 901 670 920 022 407 818 3 229 510 1 911 425 961 266 409 720 3 282 411 0.5 4.5 0.5 1.6
Source: DETYA (2000,d)
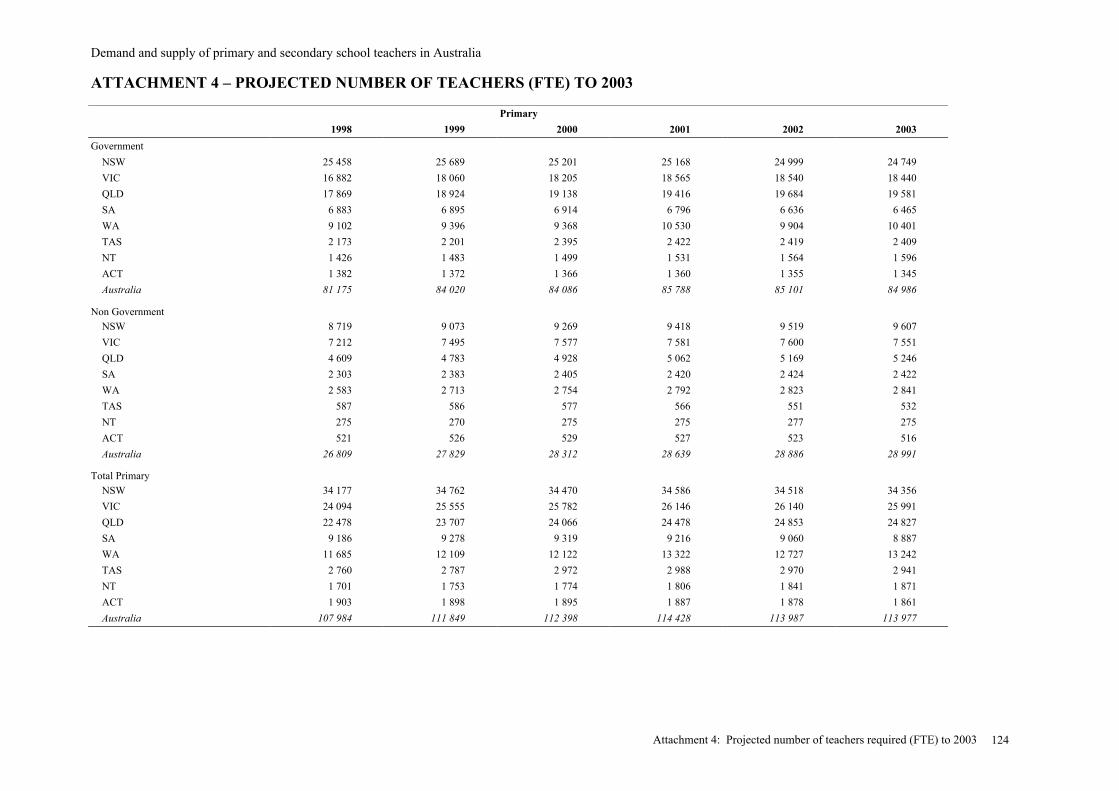
Demand and supply of primary and secondary school teachers in Australia
Attachment 4: Projected number of teachers required (FTE) to 2003 124
ATTACHMENT 4 – PROJECTED NUMBER OF TEACHERS (FTE) TO 2003
Primary
1998 1999 2000 2001 2002 2003
Government
NSW 25 458 25 689 25 201 25 168 24 999 24 749
VIC 16 882 18 060 18 205 18 565 18 540 18 440
QLD 17 869 18 924 19 138 19 416 19 684 19 581
SA 6 883 6 895 6 914 6 796 6 636 6 465
WA 9 102 9 396 9 368 10 530 9 904 10 401
TAS 2 173 2 201 2 395 2 422 2 419 2 409
NT 1 426 1 483 1 499 1 531 1 564 1 596
ACT 1 382 1 372 1 366 1 360 1 355 1 345
Australia 81 175 84 020 84 086 85 788 85 101 84 986
Non Government
NSW 8 719 9 073 9 269 9 418 9 519 9 607
VIC 7 212 7 495 7 577 7 581 7 600 7 551
QLD 4 609 4 783 4 928 5 062 5 169 5 246
SA 2 303 2 383 2 405 2 420 2 424 2 422
WA 2 583 2 713 2 754 2 792 2 823 2 841
TAS 587 586 577 566 551 532
NT 275 270 275 275 277 275
ACT 521 526 529 527 523 516
Australia 26 809 27 829 28 312 28 639 28 886 28 991
Total Primary
NSW 34 177 34 762 34 470 34 586 34 518 34 356
VIC 24 094 25 555 25 782 26 146 26 140 25 991
QLD 22 478 23 707 24 066 24 478 24 853 24 827
SA 9 186 9 278 9 319 9 216 9 060 8 887
WA 11 685 12 109 12 122 13 322 12 727 13 242
TAS 2 760 2 787 2 972 2 988 2 970 2 941
NT 1 701 1 753 1 774 1 806 1 841 1 871
ACT 1 903 1 898 1 895 1 887 1 878 1 861
Australia 107 984 111 849 112 398 114 428 113 987 113 977
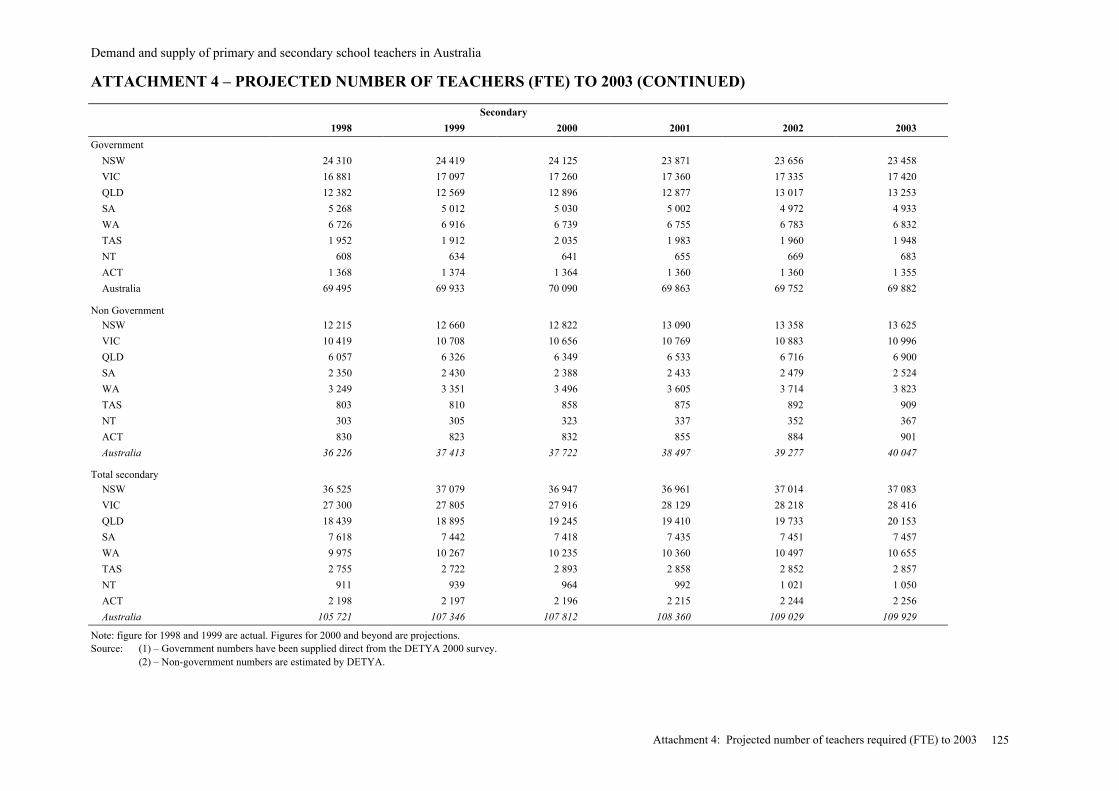
Demand and supply of primary and secondary school teachers in Australia
Attachment 4: Projected number of teachers required (FTE) to 2003 125
ATTACHMENT 4 – PROJECTED NUMBER OF TEACHERS (FTE) TO 2003 (CONTINUED)
Secondary
1998 1999 2000 2001 2002 2003
Government
NSW 24 310 24 419 24 125 23 871 23 656 23 458
VIC 16 881 17 097 17 260 17 360 17 335 17 420
QLD 12 382 12 569 12 896 12 877 13 017 13 253
SA 5 268 5 012 5 030 5 002 4 972 4 933
WA 6 726 6 916 6 739 6 755 6 783 6 832
TAS 1 952 1 912 2 035 1 983 1 960 1 948
NT 608 634 641 655 669 683
ACT 1 368 1 374 1 364 1 360 1 360 1 355
Australia 69 495 69 933 70 090 69 863 69 752 69 882
Non Government
NSW 12 215 12 660 12 822 13 090 13 358 13 625
VIC 10 419 10 708 10 656 10 769 10 883 10 996
QLD 6 057 6 326 6 349 6 533 6 716 6 900
SA 2 350 2 430 2 388 2 433 2 479 2 524
WA 3 249 3 351 3 496 3 605 3 714 3 823
TAS 803 810 858 875 892 909
NT 303 305 323 337 352 367
ACT 830 823 832 855 884 901
Australia 36 226 37 413 37 722 38 497 39 277 40 047
Total secondary
NSW 36 525 37 079 36 947 36 961 37 014 37 083
VIC 27 300 27 805 27 916 28 129 28 218 28 416
QLD 18 439 18 895 19 245 19 410 19 733 20 153
SA 7 618 7 442 7 418 7 435 7 451 7 457
WA 9 975 10 267 10 235 10 360 10 497 10 655
TAS 2 755 2 722 2 893 2 858 2 852 2 857
NT 911 939 964 992 1 021 1 050
ACT 2 198 2 197 2 196 2 215 2 244 2 256
Australia 105 721 107 346 107 812 108 360 109 029 109 929
Note: figure for 1998 and 1999 are actual. Figures for 2000 and beyond are projections.Source: (1) – Government numbers have been supplied direct from the DETYA 2000 survey.
(2) – Non-government numbers are estimated by DETYA.
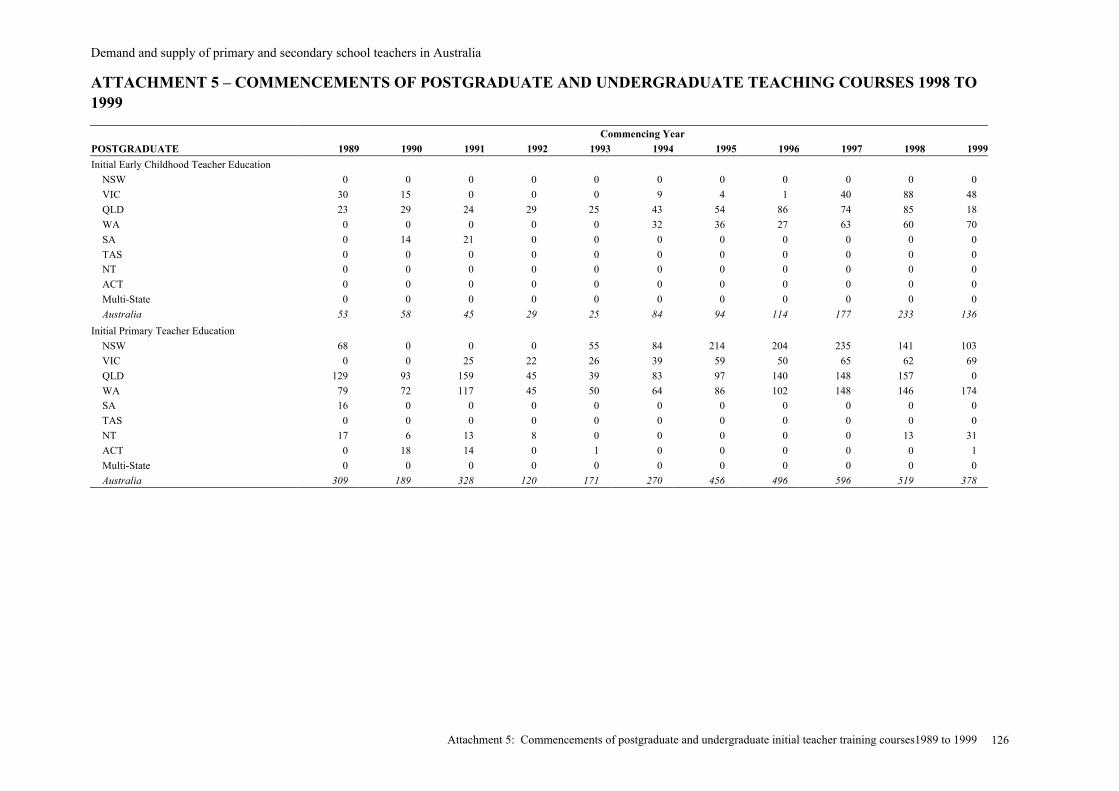
Demand and supply of primary and secondary school teachers in Australia
Attachment 5: Commencements of postgraduate and undergraduate initial teacher training courses1989 to 1999 126
ATTACHMENT 5 – COMMENCEMENTS OF POSTGRADUATE AND UNDERGRADUATE TEACHING COURSES 1998 TO1999
Commencing Year
POSTGRADUATE 1989 1990 1991 1992 1993 1994 1995 1996 1997 1998 1999
Initial Early Childhood Teacher Education
NSW 0 0 0 0 0 0 0 0 0 0 0
VIC 30 15 0 0 0 9 4 1 40 88 48
QLD 23 29 24 29 25 43 54 86 74 85 18
WA 0 0 0 0 0 32 36 27 63 60 70
SA 0 14 21 0 0 0 0 0 0 0 0
TAS 0 0 0 0 0 0 0 0 0 0 0
NT 0 0 0 0 0 0 0 0 0 0 0
ACT 0 0 0 0 0 0 0 0 0 0 0
Multi-State 0 0 0 0 0 0 0 0 0 0 0
Australia 53 58 45 29 25 84 94 114 177 233 136
Initial Primary Teacher Education
NSW 68 0 0 0 55 84 214 204 235 141 103
VIC 0 0 25 22 26 39 59 50 65 62 69
QLD 129 93 159 45 39 83 97 140 148 157 0
WA 79 72 117 45 50 64 86 102 148 146 174
SA 16 0 0 0 0 0 0 0 0 0 0
TAS 0 0 0 0 0 0 0 0 0 0 0
NT 17 6 13 8 0 0 0 0 0 13 31
ACT 0 18 14 0 1 0 0 0 0 0 1
Multi-State 0 0 0 0 0 0 0 0 0 0 0
Australia 309 189 328 120 171 270 456 496 596 519 378
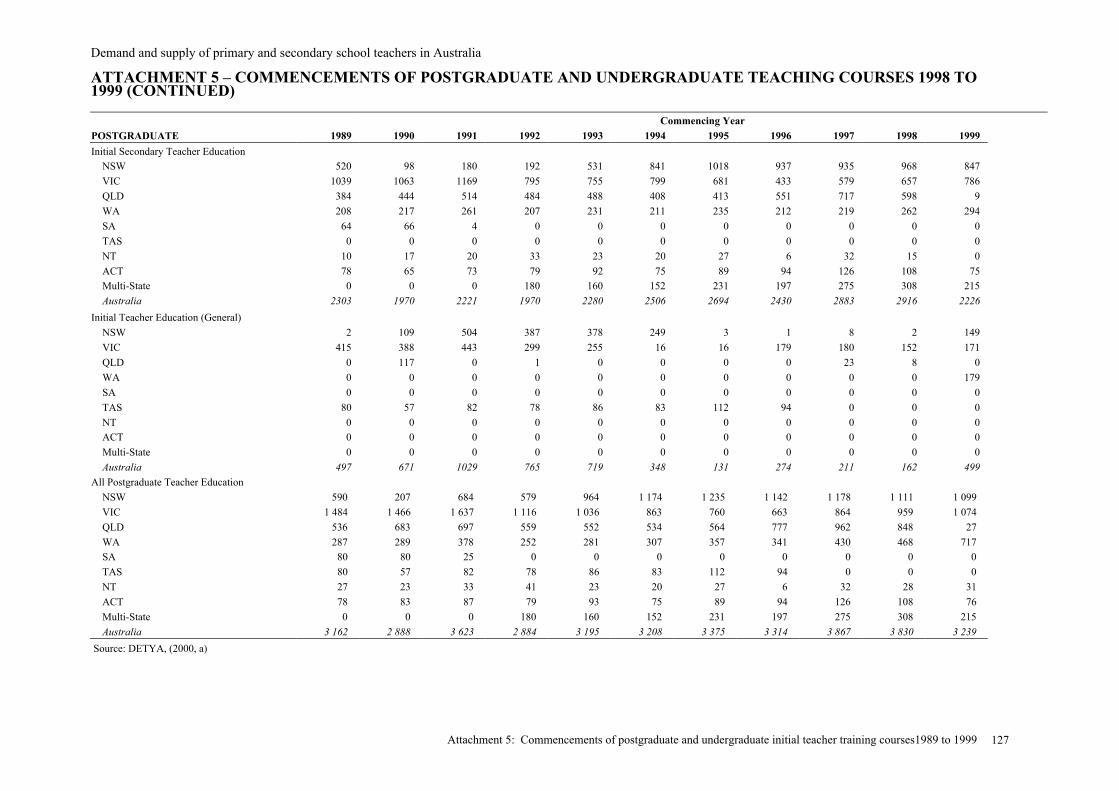
Demand and supply of primary and secondary school teachers in Australia
Attachment 5: Commencements of postgraduate and undergraduate initial teacher training courses1989 to 1999 127
ATTACHMENT 5 – COMMENCEMENTS OF POSTGRADUATE AND UNDERGRADUATE TEACHING COURSES 1998 TO1999 (CONTINUED)
Commencing Year
POSTGRADUATE 1989 1990 1991 1992 1993 1994 1995 1996 1997 1998 1999
Initial Secondary Teacher Education
NSW 520 98 180 192 531 841 1018 937 935 968 847
VIC 1039 1063 1169 795 755 799 681 433 579 657 786
QLD 384 444 514 484 488 408 413 551 717 598 9
WA 208 217 261 207 231 211 235 212 219 262 294
SA 64 66 4 0 0 0 0 0 0 0 0
TAS 0 0 0 0 0 0 0 0 0 0 0
NT 10 17 20 33 23 20 27 6 32 15 0
ACT 78 65 73 79 92 75 89 94 126 108 75
Multi-State 0 0 0 180 160 152 231 197 275 308 215
Australia 2303 1970 2221 1970 2280 2506 2694 2430 2883 2916 2226
Initial Teacher Education (General)
NSW 2 109 504 387 378 249 3 1 8 2 149
VIC 415 388 443 299 255 16 16 179 180 152 171
QLD 0 117 0 1 0 0 0 0 23 8 0
WA 0 0 0 0 0 0 0 0 0 0 179
SA 0 0 0 0 0 0 0 0 0 0 0
TAS 80 57 82 78 86 83 112 94 0 0 0
NT 0 0 0 0 0 0 0 0 0 0 0
ACT 0 0 0 0 0 0 0 0 0 0 0
Multi-State 0 0 0 0 0 0 0 0 0 0 0
Australia 497 671 1029 765 719 348 131 274 211 162 499
All Postgraduate Teacher Education
NSW 590 207 684 579 964 1 174 1 235 1 142 1 178 1 111 1 099
VIC 1 484 1 466 1 637 1 116 1 036 863 760 663 864 959 1 074
QLD 536 683 697 559 552 534 564 777 962 848 27
WA 287 289 378 252 281 307 357 341 430 468 717
SA 80 80 25 0 0 0 0 0 0 0 0
TAS 80 57 82 78 86 83 112 94 0 0 0
NT 27 23 33 41 23 20 27 6 32 28 31
ACT 78 83 87 79 93 75 89 94 126 108 76
Multi-State 0 0 0 180 160 152 231 197 275 308 215
Australia 3 162 2 888 3 623 2 884 3 195 3 208 3 375 3 314 3 867 3 830 3 239
Source: DETYA, (2000, a)

Demand and supply of primary and secondary school teachers in Australia
Attachment 5: Commencements of postgraduate and undergraduate initial teacher training courses1989 to 1999 128
ATTACHMENT 5 – COMMENCEMENTS OF POSTGRADUATE AND UNDERGRADUATE TEACHING COURSES 1998 TO1999 (CONTINUED)
Commencing Year
UNDERGRADUATE 1989 1990 1991 1992 1993 1994 1995 1996 1997 1998 1999
Initial Early Childhood Teacher Education
NSW 645 662 711 813 723 721 993 1018 770 840 810
VIC 362 339 392 347 353 291 229 286 245 276 251
QLD 219 283 243 184 183 334 382 350 432 414 584
WA 163 176 156 144 140 128 150 122 125 194 255
SA 136 125 103 118 130 125 157 168 192 205 225
TAS 0 0 0 0 0 0 0 0 0 0 0
NT 0 0 0 0 0 20 138 86 145 46 2
ACT 33 41 70 33 27 45 55 53 56 61 60
Multi-State 0 0 0 0 0 0 0 0 0 0 0
Australia 1 558 1 626 1 675 1 639 1 556 1 664 2 104 2 083 1 965 2 036 2 187
Initial Primary Teacher Education
NSW 2 006 1 898 2 127 1 345 1 264 1 283 1 431 1 341 1 102 1 454 1 601
VIC 1 980 2 156 2 142 1 299 1 326 1 081 1 008 1 101 1 114 1 076 1 128
QLD 1 604 1 849 1 493 781 816 733 1 104 1 308 1 625 1 623 1 827
WA 708 769 760 578 539 580 589 153 219 595 656
SA 653 659 753 500 499 520 574 575 680 548 542
TAS 157 161 0 0 0 0 0 0 0 0 0
NT 146 107 330 217 64 0 0 0 0 62 102
ACT 212 196 199 94 124 89 88 115 115 171 161
Multi-State 0 0 0 532 786 399 330 342 486 461 473
Australia 7 466 7 795 7 804 5 346 5 418 4 685 5 124 4 935 5 341 5 990 6 490

Demand and supply of primary and secondary school teachers in Australia
Attachment 5: Commencements of postgraduate and undergraduate initial teacher training courses1989 to 1999 129
ATTACHMENT 5 – COMMENCEMENTS OF POSTGRADUATE AND UNDERGRADUATE TEACHING COURSES 1998 TO1999 (CONTINUED)
Commencing Year
UNDERGRADUATE 1989 1990 1991 1992 1993 1994 1995 1996 1997 1998 1999
Initial Secondary Teacher Education
NSW 1 492 1 627 1 645 1 417 1 299 1 090 977 1 069 1 153 954 1 253
VIC 1 221 1 286 1 430 1 078 940 603 702 742 775 793 593
QLD 774 817 783 772 797 803 663 528 1 028 1 033 1 401
WA 534 507 553 464 418 322 371 763 765 283 265
SA 338 228 152 170 173 176 144 171 52 31 53
TAS 1 0 0 0 0 0 0 0 0 0 0
NT 0 1 0 1 0 0 0 0 0 0 0
ACT 50 82 81 77 73 75 80 84 107 101 36
Multi-State 0 0 0 236 193 175 200 139 138 174 162
Australia 4 410 4 548 4 644 4 215 3 893 3 244 3 137 3 496 4 018 3 369 3 763
Initial Teacher Education (General)
NSW 185 0 54 79 107 206 163 562 694 613 652
VIC 149 139 196 116 107 2 3 14 203 230 380
QLD 0 0 101 73 86 5 0 1 45 96 67
WA 70 46 122 162 193 143 0 0 0 0 17
SA 0 0 0 0 0 0 0 0 0 0 130
TAS 73 84 278 281 225 200 243 276 426 369 431
NT 0 0 0 0 51 79 1 207 193 18 47
ACT 0 0 0 0 0 0 0 0 0 0 0
Multi-State 0 0 0 0 0 0 0 0 0 0 0
Australia 477 269 751 711 769 635 410 1 060 1 561 1 326 1 724
All Undergraduate Teacher Education
NSW 4 328 4 187 4 537 3 654 3 393 3 300 3 564 3 990 3 719 3 861 4 316
VIC 3 712 3 920 4 160 2 840 2 726 1 977 1 942 2 143 2 337 2 375 2 352
QLD 2 597 2 949 2 620 1 810 1 882 1 875 2 149 2 187 3 130 3 166 3 879
WA 1 475 1 498 1 591 1 348 1 290 1 173 1 110 1 038 1 109 1 072 1 193
SA 1 127 1 012 1 008 788 802 821 875 914 924 784 950
TAS 231 245 278 281 225 200 243 276 426 369 431
NT 146 108 330 218 115 99 139 293 338 126 151
ACT 295 319 350 204 224 209 223 252 278 333 257
Australia 13 911 14 238 14 874 11 911 11 636 10 228 10 775 11 574 12 885 12 721 14 164
Source: DETYA, (2000, a).

Demand and supply of primary and secondary school teachers in Australia
Attachment 5: Commencements of postgraduate and undergraduate initial teacher training courses1989 to 1999 130
ATTACHMENT 5 – COMMENCEMENTS OF POSTGRADUATE AND UNDERGRADUATE TEACHING COURSES 1998 TO1999 (CONTINUED)
Commencing Year
ALL STUDENTS 1989 1990 1991 1992 1993 1994 1995 1996 1997 1998 1999
Initial Early Childhood Teacher Education
NSW 645 662 711 813 723 721 993 1018 770 840 810
VIC 392 354 392 347 353 300 233 287 285 364 299
QLD 242 312 267 213 208 377 436 436 506 499 602
WA 163 176 156 144 140 160 186 149 188 254 325
SA 136 139 124 118 130 125 157 168 192 205 225
TAS 0 0 0 0 0 0 0 0 0 0 0
NT 0 0 0 0 0 20 138 86 145 46 2
ACT 33 41 70 33 27 45 55 53 56 61 60
Multi-State 0 0 0 0 0 0 0 0 0 0 0
Australia 1 611 1 684 1 720 1 668 1 581 1 748 2 198 2 197 2 142 2 269 2 323
Initial Primary Teacher Education
NSW 2 074 1 898 2 127 1 345 1 319 1 367 1 645 1 545 1 337 1 595 1 704
VIC 1 980 2 156 2 167 1 321 1 352 1 120 1 067 1 151 1 179 1 138 1 197
QLD 1 733 1 942 1 652 826 855 816 1 201 1 448 1 773 1 780 1 827
WA 787 841 877 623 589 644 675 255 367 741 830
SA 669 659 753 500 499 520 574 575 680 548 542
TAS 157 161 0 0 0 0 0 0 0 0 0
NT 163 113 343 225 64 0 0 0 0 75 133
ACT 212 214 213 94 125 89 88 115 115 171 162
Multi-State 0 0 0 532 786 399 330 342 486 461 473
Australia 7 775 7 984 8 132 5 466 5 589 4 955 5 580 5 431 5 937 6 509 6 868
Demand and supply of primary and secondary school teachers in Australia
Attachment 5: Commencements of postgraduate and undergraduate initial teacher training courses1989 to 1999 131
ATTACHMENT 5 – COMMENCEMENTS OF POSTGRADUATE AND UNDERGRADUATE TEACHING COURSES 1998 TO1999 (CONTINUED)
Commencing Year
ALL STUDENTS 1989 1990 1991 1992 1993 1994 1995 1996 1997 1998 1999
Initial Secondary Teacher Education
NSW 2 012 1 725 1 825 1 609 1 830 1 931 1 995 2 006 2 088 1 922 2 100
VIC 2 260 2 349 2 599 1 873 1 695 1 402 1 383 1 175 1 354 1 450 1 379
QLD 1 158 1 261 1 297 1 256 1 285 1 211 1 076 1 079 1 745 1 631 1 410
WA 742 724 814 671 649 533 606 975 984 545 559
SA 402 294 156 170 173 176 144 171 52 31 53
TAS 1 0 0 0 0 0 0 0 0 0 0
NT 10 18 20 34 23 20 27 6 32 15 0
ACT 128 147 154 156 165 150 169 178 233 209 111
Multi-State 0 0 0 416 353 327 431 336 413 482 377
Australia 6 713 6 518 6 865 6 185 6 173 5 750 5 831 5 926 6 901 6 285 5 989
Initial Teacher Education (General)
NSW 187 109 558 466 485 455 166 563 702 615 801
VIC 564 527 639 415 362 18 19 193 383 382 551
QLD 0 117 101 74 86 5 0 1 68 104 67
WA 70 46 122 162 193 143 0 0 0 0 196
SA 0 0 0 0 0 0 0 0 0 0 130
TAS 153 141 360 359 311 283 355 370 426 369 431
NT 0 0 0 0 51 79 1 207 193 18 47
ACT 0 0 0 0 0 0 0 0 0 0 0
Multi-State 0 0 0 0 0 0 0 0 0 0 0
Australia 974 940 1 780 1 476 1 488 983 541 1 334 1 772 1 488 2 223
All commencements
NSW 4 918 4 394 5 221 4 233 4 357 4 474 4 799 5 132 4 897 4 972 5 415
VIC 5 196 5 386 5 797 3 956 3 762 2 840 2 702 2 806 3 201 3 334 3 426
QLD 3 133 3 632 3 317 2 369 2 434 2 409 2 713 2 964 4 092 4 014 3 906
WA 1 762 1 787 1 969 1 600 1571 1 480 1 467 1 379 1 539 1 540 1 910
SA 1 207 1 092 1 033 788 802 821 875 914 924 784 950
TAS 311 302 360 359 311 283 355 370 426 369 431
NT 173 131 363 259 138 119 166 299 370 154 182
ACT 373 402 437 283 317 284 312 346 404 441 333
Multi-State 0 0 0 948 1 139 726 761 678 899 943 850
Australia 17 073 17 126 18 497 14 795 14 831 13 436 14 150 14 888 16 752 16 551 17 403
Source: DETYA, (2000, a)
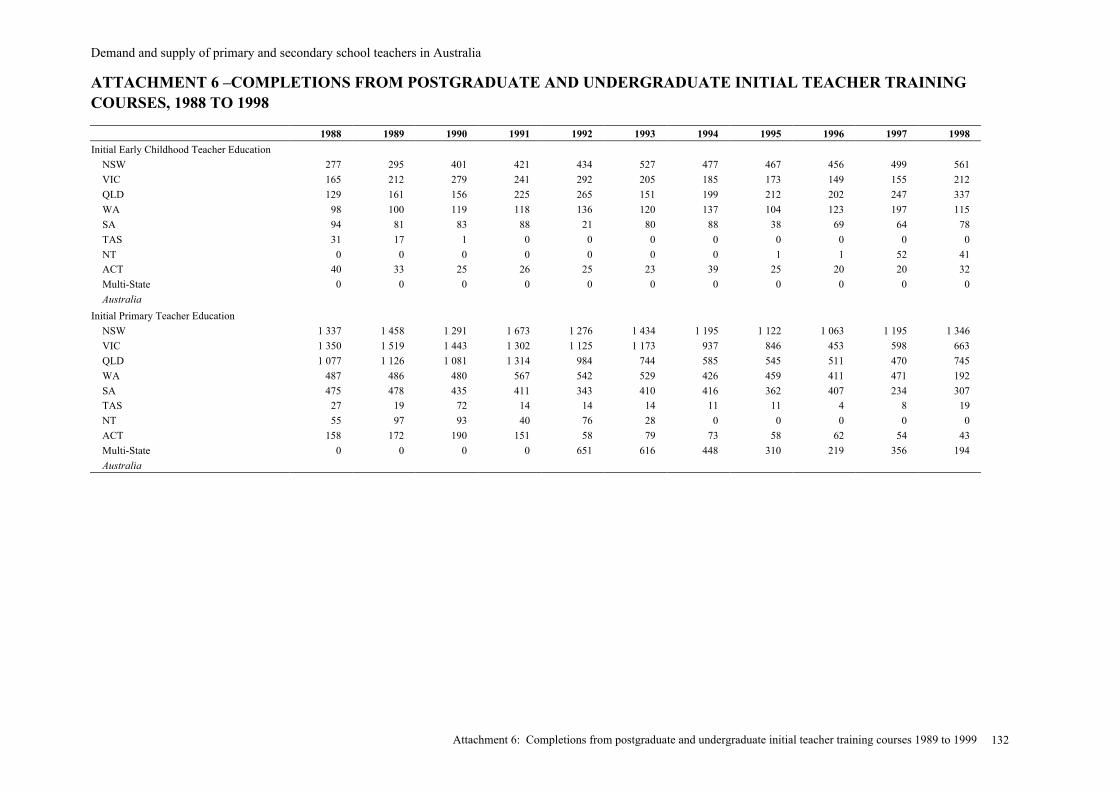
Demand and supply of primary and secondary school teachers in Australia
Attachment 6: Completions from postgraduate and undergraduate initial teacher training courses 1989 to 1999 132
ATTACHMENT 6 –COMPLETIONS FROM POSTGRADUATE AND UNDERGRADUATE INITIAL TEACHER TRAININGCOURSES, 1988 TO 1998
1988 1989 1990 1991 1992 1993 1994 1995 1996 1997 1998
Initial Early Childhood Teacher Education
NSW 277 295 401 421 434 527 477 467 456 499 561
VIC 165 212 279 241 292 205 185 173 149 155 212
QLD 129 161 156 225 265 151 199 212 202 247 337
WA 98 100 119 118 136 120 137 104 123 197 115
SA 94 81 83 88 21 80 88 38 69 64 78
TAS 31 17 1 0 0 0 0 0 0 0 0
NT 0 0 0 0 0 0 0 1 1 52 41
ACT 40 33 25 26 25 23 39 25 20 20 32
Multi-State 0 0 0 0 0 0 0 0 0 0 0
Australia
Initial Primary Teacher Education
NSW 1 337 1 458 1 291 1 673 1 276 1 434 1 195 1 122 1 063 1 195 1 346
VIC 1 350 1 519 1 443 1 302 1 125 1 173 937 846 453 598 663
QLD 1 077 1 126 1 081 1 314 984 744 585 545 511 470 745
WA 487 486 480 567 542 529 426 459 411 471 192
SA 475 478 435 411 343 410 416 362 407 234 307
TAS 27 19 72 14 14 14 11 11 4 8 19
NT 55 97 93 40 76 28 0 0 0 0 0
ACT 158 172 190 151 58 79 73 58 62 54 43
Multi-State 0 0 0 0 651 616 448 310 219 356 194
Australia
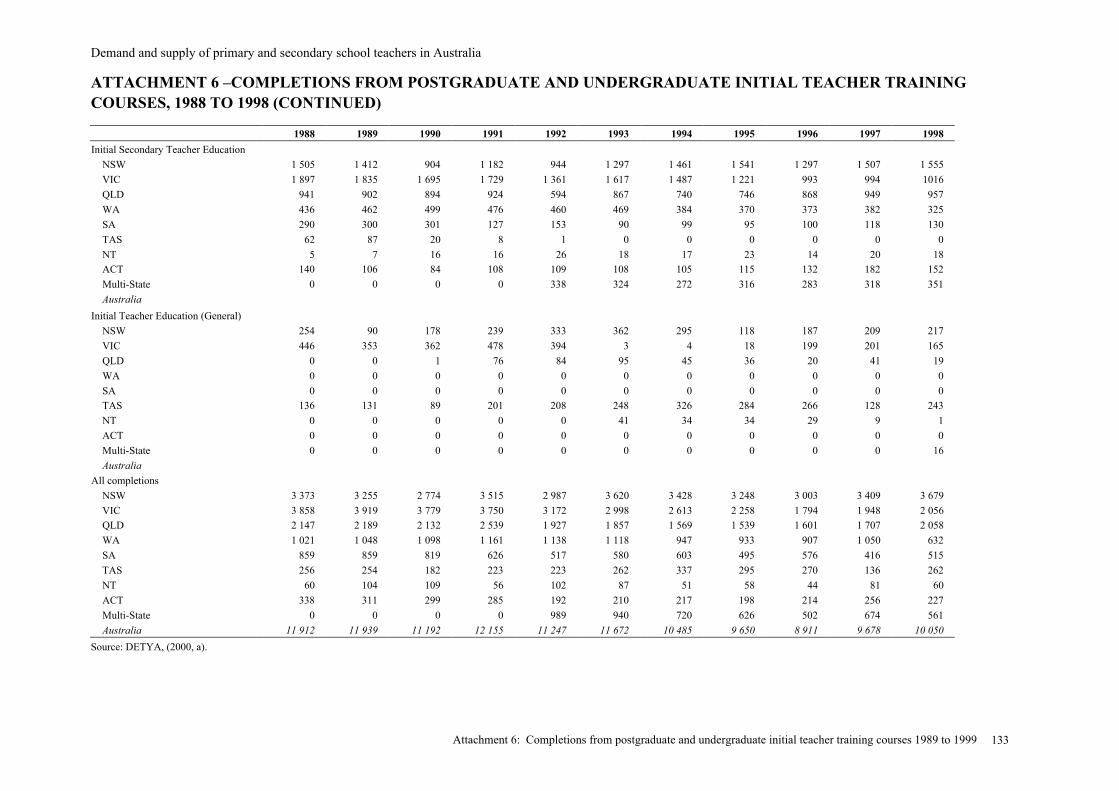
Demand and supply of primary and secondary school teachers in Australia
Attachment 6: Completions from postgraduate and undergraduate initial teacher training courses 1989 to 1999 133
ATTACHMENT 6 –COMPLETIONS FROM POSTGRADUATE AND UNDERGRADUATE INITIAL TEACHER TRAININGCOURSES, 1988 TO 1998 (CONTINUED)
1988 1989 1990 1991 1992 1993 1994 1995 1996 1997 1998
Initial Secondary Teacher Education
NSW 1 505 1 412 904 1 182 944 1 297 1 461 1 541 1 297 1 507 1 555
VIC 1 897 1 835 1 695 1 729 1 361 1 617 1 487 1 221 993 994 1016
QLD 941 902 894 924 594 867 740 746 868 949 957
WA 436 462 499 476 460 469 384 370 373 382 325
SA 290 300 301 127 153 90 99 95 100 118 130
TAS 62 87 20 8 1 0 0 0 0 0 0
NT 5 7 16 16 26 18 17 23 14 20 18
ACT 140 106 84 108 109 108 105 115 132 182 152
Multi-State 0 0 0 0 338 324 272 316 283 318 351
Australia
Initial Teacher Education (General)
NSW 254 90 178 239 333 362 295 118 187 209 217
VIC 446 353 362 478 394 3 4 18 199 201 165
QLD 0 0 1 76 84 95 45 36 20 41 19
WA 0 0 0 0 0 0 0 0 0 0 0
SA 0 0 0 0 0 0 0 0 0 0 0
TAS 136 131 89 201 208 248 326 284 266 128 243
NT 0 0 0 0 0 41 34 34 29 9 1
ACT 0 0 0 0 0 0 0 0 0 0 0
Multi-State 0 0 0 0 0 0 0 0 0 0 16
Australia
All completions
NSW 3 373 3 255 2 774 3 515 2 987 3 620 3 428 3 248 3 003 3 409 3 679
VIC 3 858 3 919 3 779 3 750 3 172 2 998 2 613 2 258 1 794 1 948 2 056
QLD 2 147 2 189 2 132 2 539 1 927 1 857 1 569 1 539 1 601 1 707 2 058
WA 1 021 1 048 1 098 1 161 1 138 1 118 947 933 907 1 050 632
SA 859 859 819 626 517 580 603 495 576 416 515
TAS 256 254 182 223 223 262 337 295 270 136 262
NT 60 104 109 56 102 87 51 58 44 81 60
ACT 338 311 299 285 192 210 217 198 214 256 227
Multi-State 0 0 0 0 989 940 720 626 502 674 561
Australia 11 912 11 939 11 192 12 155 11 247 11 672 10 485 9 650 8 911 9 678 10 050
Source: DETYA, (2000, a).
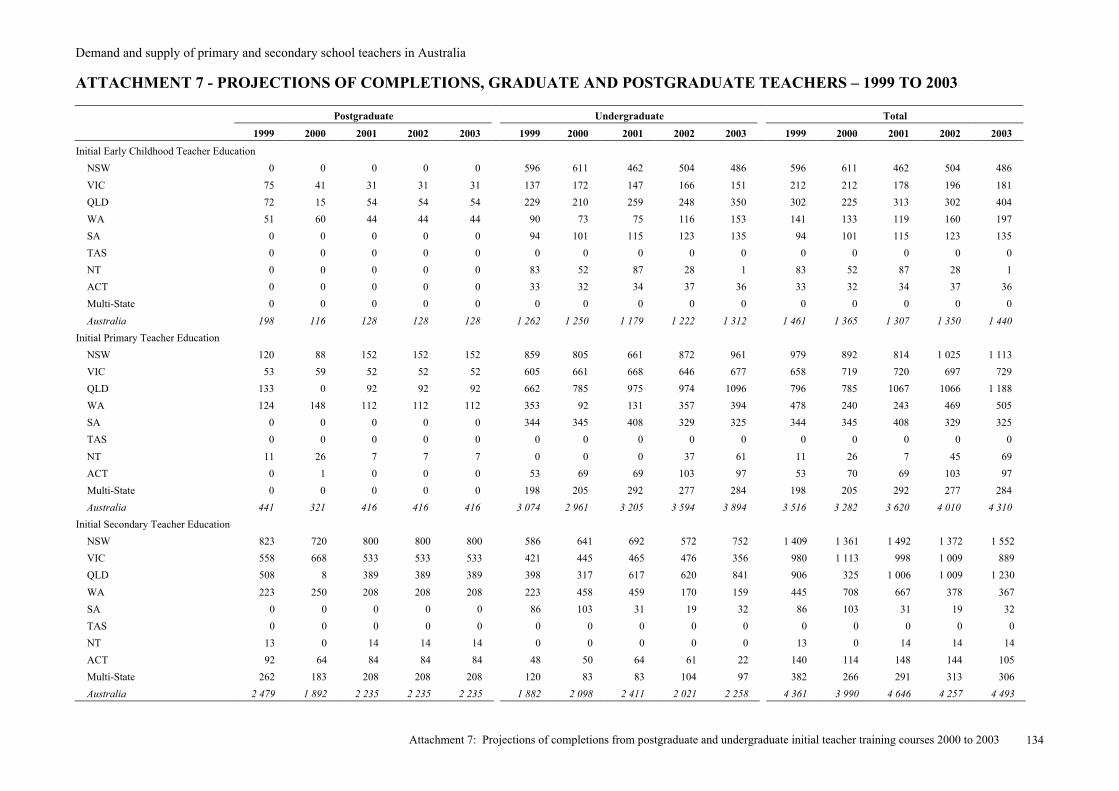
Demand and supply of primary and secondary school teachers in Australia
Attachment 7: Projections of completions from postgraduate and undergraduate initial teacher training courses 2000 to 2003 134
ATTACHMENT 7 - PROJECTIONS OF COMPLETIONS, GRADUATE AND POSTGRADUATE TEACHERS – 1999 TO 2003
Postgraduate Undergraduate Total
1999 2000 2001 2002 2003 1999 2000 2001 2002 2003 1999 2000 2001 2002 2003
Initial Early Childhood Teacher Education
NSW 0 0 0 0 0 596 611 462 504 486 596 611 462 504 486
VIC 75 41 31 31 31 137 172 147 166 151 212 212 178 196 181
QLD 72 15 54 54 54 229 210 259 248 350 302 225 313 302 404
WA 51 60 44 44 44 90 73 75 116 153 141 133 119 160 197
SA 0 0 0 0 0 94 101 115 123 135 94 101 115 123 135
TAS 0 0 0 0 0 0 0 0 0 0 0 0 0 0 0
NT 0 0 0 0 0 83 52 87 28 1 83 52 87 28 1
ACT 0 0 0 0 0 33 32 34 37 36 33 32 34 37 36
Multi-State 0 0 0 0 0 0 0 0 0 0 0 0 0 0 0
Australia 198 116 128 128 128 1 262 1 250 1 179 1 222 1 312 1 461 1 365 1 307 1 350 1 440
Initial Primary Teacher Education
NSW 120 88 152 152 152 859 805 661 872 961 979 892 814 1 025 1 113
VIC 53 59 52 52 52 605 661 668 646 677 658 719 720 697 729
QLD 133 0 92 92 92 662 785 975 974 1096 796 785 1067 1066 1 188
WA 124 148 112 112 112 353 92 131 357 394 478 240 243 469 505
SA 0 0 0 0 0 344 345 408 329 325 344 345 408 329 325
TAS 0 0 0 0 0 0 0 0 0 0 0 0 0 0 0
NT 11 26 7 7 7 0 0 0 37 61 11 26 7 45 69
ACT 0 1 0 0 0 53 69 69 103 97 53 70 69 103 97
Multi-State 0 0 0 0 0 198 205 292 277 284 198 205 292 277 284
Australia 441 321 416 416 416 3 074 2 961 3 205 3 594 3 894 3 516 3 282 3 620 4 010 4 310
Initial Secondary Teacher Education
NSW 823 720 800 800 800 586 641 692 572 752 1 409 1 361 1 492 1 372 1 552
VIC 558 668 533 533 533 421 445 465 476 356 980 1 113 998 1 009 889
QLD 508 8 389 389 389 398 317 617 620 841 906 325 1 006 1 009 1 230
WA 223 250 208 208 208 223 458 459 170 159 445 708 667 378 367
SA 0 0 0 0 0 86 103 31 19 32 86 103 31 19 32
TAS 0 0 0 0 0 0 0 0 0 0 0 0 0 0 0
NT 13 0 14 14 14 0 0 0 0 0 13 0 14 14 14
ACT 92 64 84 84 84 48 50 64 61 22 140 114 148 144 105
Multi-State 262 183 208 208 208 120 83 83 104 97 382 266 291 313 306
Australia 2 479 1 892 2 235 2 235 2 235 1 882 2 098 2 411 2 021 2 258 4 361 3 990 4 646 4 257 4 493
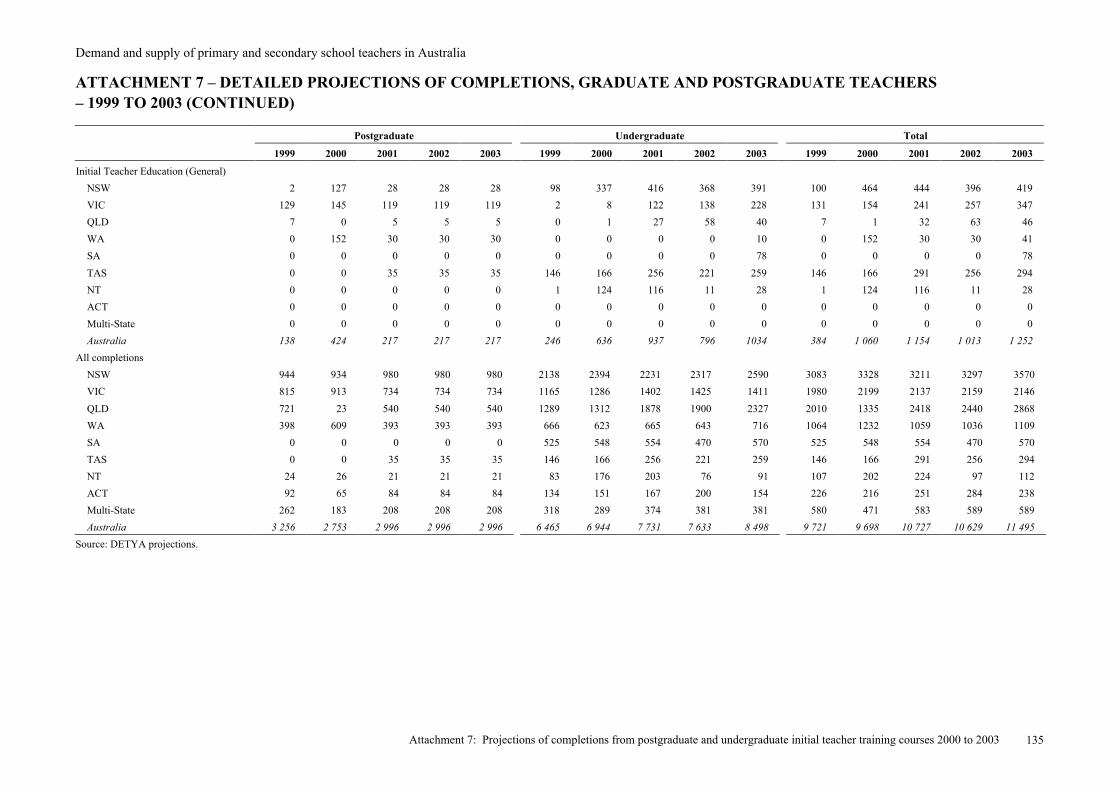
Demand and supply of primary and secondary school teachers in Australia
Attachment 7: Projections of completions from postgraduate and undergraduate initial teacher training courses 2000 to 2003 135
ATTACHMENT 7 – DETAILED PROJECTIONS OF COMPLETIONS, GRADUATE AND POSTGRADUATE TEACHERS– 1999 TO 2003 (CONTINUED)
Postgraduate Undergraduate Total
1999 2000 2001 2002 2003 1999 2000 2001 2002 2003 1999 2000 2001 2002 2003
Initial Teacher Education (General)
NSW 2 127 28 28 28 98 337 416 368 391 100 464 444 396 419
VIC 129 145 119 119 119 2 8 122 138 228 131 154 241 257 347
QLD 7 0 5 5 5 0 1 27 58 40 7 1 32 63 46
WA 0 152 30 30 30 0 0 0 0 10 0 152 30 30 41
SA 0 0 0 0 0 0 0 0 0 78 0 0 0 0 78
TAS 0 0 35 35 35 146 166 256 221 259 146 166 291 256 294
NT 0 0 0 0 0 1 124 116 11 28 1 124 116 11 28
ACT 0 0 0 0 0 0 0 0 0 0 0 0 0 0 0
Multi-State 0 0 0 0 0 0 0 0 0 0 0 0 0 0 0
Australia 138 424 217 217 217 246 636 937 796 1034 384 1 060 1 154 1 013 1 252
All completions
NSW 944 934 980 980 980 2138 2394 2231 2317 2590 3083 3328 3211 3297 3570
VIC 815 913 734 734 734 1165 1286 1402 1425 1411 1980 2199 2137 2159 2146
QLD 721 23 540 540 540 1289 1312 1878 1900 2327 2010 1335 2418 2440 2868
WA 398 609 393 393 393 666 623 665 643 716 1064 1232 1059 1036 1109
SA 0 0 0 0 0 525 548 554 470 570 525 548 554 470 570
TAS 0 0 35 35 35 146 166 256 221 259 146 166 291 256 294
NT 24 26 21 21 21 83 176 203 76 91 107 202 224 97 112
ACT 92 65 84 84 84 134 151 167 200 154 226 216 251 284 238
Multi-State 262 183 208 208 208 318 289 374 381 381 580 471 583 589 589
Australia 3 256 2 753 2 996 2 996 2 996 6 465 6 944 7 731 7 633 8 498 9 721 9 698 10 727 10 629 11 495
Source: DETYA projections.

Demand and supply of primary and secondary school teachers in Australia
List of Tables 1
List of Tables
Table 1: Employment of teachers (FTE) by State/Territory, sector and category of school, 1999
Table 2: Sex and age characteristics of the government and non-government teaching
workforce, 1999
Table 3: Long term trends in numbers of students, teachers and student/teaching staff ratios
Table 4: Balance between demand and supply in the teachers labour market by State
Table 5: Subject area recruitment difficulties/shortages in secondary schools
Table 6: Student to teacher ratios by sector and category of school, 1999
Table 7: Separations (other than through leave of absence) from the government permanent teaching workforce, as a
proportion of that workforce, 1996 and 1999.
Table 8: Destination of graduates from initial teacher education courses, 1998
Table 9: Arrival of teachers to Australia by migration category
Table 10: Departure of teachers from Australia by migration category
Table 11: Previous year’s graduates as a proportion of all new teachers recruited into the government sector during
1999
Table 12: Estimated annual recruitment of teachers (head count), 2000 to 2003.
Table 13: Projected graduates from Initial Teacher Education courses and those available for teaching positions, 1999
to 2003
Table 14: Employed graduate teachers – State of graduation and State of employment (1999)
Table 15: Interstate movements between 1991 and 1996 of employed teachers as a proportion of employed teachers in
each State and Territory (per cent)
Table 16: Percentage of teachers in government schools aged 45 and over and 50 and over, 1999
Table 17: Students in the first year of secondary teaching courses studying selected subjects, 1992 to 1999.
Table 18: Commencing non-overseas students in science courses by discipline, 1989 to 1999
List of Charts
Chart 1: Employed primary teachers (FTE), 1984 to 1999
Chart 2: Employed secondary teachers (FTE), 1984 to 1999
Chart 3: Teacher graduates working in full-time employment as a proportion of those available for full-time
employment
Chart 4: Employed teachers and new graduates, 1990 to 1999, New South Wales
Chart 5: Employed Teachers and new graduates, 1990 to 1999, Victoria
Chart 6: Employed Teachers and new graduates, 1990 to 1999, Queensland
Chart 7: Employed Teachers and new graduates, 1990 to 1999, South Australia
Chart 8: Employed Teachers and new graduates, 1990 to 1999, Western Australia
Chart 9: Employed Teachers and new graduates, 1990 to 1999, Tasmania
Chart 10: Employed teachers and new graduates, 1990 to 1999, Northern Territory
Demand and supply of primary and secondary school teachers in Australia
List of Tables 2
Chart 11: Employed Teachers and new graduates, 1990 to 1999, Australian Capital Territory
Chart 12: Student/to teacher ratio, 1984 to 1999, Australia
Chart 13: Total teacher commencements and completions, 1989 to 1998, Australia
Chart 14: Undergraduate teacher commencements, 1989 to 1999, Australia
Chart 15: Postgraduate teacher commencements, 1989 to 1999, Australia
Chart 16: Undergraduate course completions in teaching, 1988 to 1998, Australia
Chart 17: Postgraduate course completions in teaching, 1988 to 1998, Australia
Chart 18: Projected students (FT) and teachers (FTE), 1998 to 2003, Australia
Chart 19: Teacher course completions by course type, actual and projected, 1998 to 2003, Australia
Chart 20: Projected teacher workforce and new graduates, 1999 to 2003, New South Wales
Chart 21: Projected teacher workforce and new graduates, 1999 to 2003, Victoria
Chart 22: Projected teacher workforce and new graduates, 1999 to 2003, Queensland
Chart 23: Projected teacher workforce and new graduates, 1999 to 2003, South Australia
Chart 24: Projected teacher workforce and new graduates, 1999 to 2003, Western Australia
Chart 25: Projected teacher workforce and new graduates, 1999 to 2003, Tasmania
Chart 26: Projected teacher workforce and new graduates, 1999 to 2003, Northern Territory
Chart 27: Projected teacher workforce and new graduates, 1999 to 2003, Australian Capital Territory
Chart 28:Average annual increase in enrolments 1989–1999 (actual), and 1999–2010 (projected)
Chart 29: Annual enrolment increases 1995 to 2010
Chart 30: Age distribution of primary school teachers, 1999
Chart 31: Age distribution of secondary school teachers, 1999
Chart 32: Annual retirements in the government primary school sector as a percentage of the permanent government
primary teaching workforce (head count), 1996 to 2004.
Chart 33: Annual retirements in the government secondary school sector as a percentage of the permanent government
secondary teaching workforce 1996 to 2004.
List of Figures
Figure 1: Teacher labour markets – main stocks and flows
List of Boxes
Box 1: Two Queensland case studies of teacher separations