DEM simulation of particle descending velocity ... · PDF fileDEM simulation of particle...
16
Metall. Res. Technol. 113, 603 (2016) c EDP Sciences, 2016 DOI: 10.1051/metal/2016035 www.metallurgical-research.org Metallurgical Research & Technology DEM simulation of particle descending velocity distribution in the reduction shaft furnace Kuan Xu and Ming-hua Bai National Engineering Research Center for Equipment and Technology of Cold Strip Rolling, Yanshan University, No. 438 Hebei Avenue, Qinhuangdao 066004, Hebei, P.R. China e-mail: [email protected] Key words: Discrete element method; shaft furnace; screw feeder; descending velocity Received 18 April 2016 Accepted 1 June 2016 Abstract – Reduction shaft furnace is a promising alternative to blast furnace ironmaking. The particle descending velocity distribution has a great influence on the shaft furnace, which directly affects the production index and further the shaft furnace normal smelting. Therefore, a three-dimensional model (3D) is established based on the discrete element method (DEM) and computation fluid dynamic (CFD). The effect of the gas flow in the shaft furnace, the height, the diameter and the bosh angle of the shaft furnace on the particle descending velocity distribution during discharging process is investigated by the model and analyzed based on the granular dynamic theory and Janssen theory. The results show that the particle velocity reduces along the radius. The effect of the gas flow on the velocity distribution is insignificant. In order to obtain a uniform velocity distribution, it is better to increase the height, or the diameter, or to decrease the bosh angle. An improved model is proposed for the uniform velocity distribution at last. B ecause of its fast reduction rates, con- sistent product quality, minimal en- vironmental impacts, and great flexi- bility, reduction shaft furnace is a promising alternative to blast furnace ironmaking [1]. In the shaft furnace production, iron ore par- ticles are charging in the shaft furnace, and the reducing gas having high temperature is blown from tuyeres, then the particles are reduced during descending. If the particle descending velocity distribution is not rea- sonable, the iron ore particles will not be reduced better, causing the production in- dex decreases and further affecting the shaft furnace normal smelting. Consequently, it is necessary to focus on researching the par- ticle descending velocity distribution in the shaft furnace. Hence many researches had been investi- gated about the solid flow [2–6], these results are helpful for an overall understanding of the solid flow. To sum up, there have been two approaches adopted for the solid flow research, such as the physical simulation [2– 4] and the mathematical simulation [5, 6]. Compared with the mathematical simula- tion, the physical simulation is hard to an- alyze the solid flow quantificationally. Kou et al. [5] researched the effect of the bottom diameter of COREX shaft furnace, the cylin- der height and the screw flight diameter on the particle velocity distribution based on DEM. However, the model he developed is not taken into account the effect of the gas flow in the shaft furnace, the height, the di- ameter and the bosh angle of the shaft fur- nace on the particle descending velocity. Numerical simulation analysis for solid flow in shaft furnace is a useful tool to under- stand the behavior of solid flow. So far, DEM has become one of the most powerful sim- ulation methods for granular behaviors. In the ironmaking field, many researches [5–8] had been studied about the granular behav- ior based on DEM, and the simulation results coincided well with the experiments and in- dustrial operation. It can be found that DEM is well developed and useful to investigate the granular behavior after comparing the results with previous work. Janssen theory, originated from Janssen [9], has become one of the most powerful methods for calculating the stresses in granular layer. It is applied in civil engineering, such as hopper and Article published by EDP Sciences
Transcript of DEM simulation of particle descending velocity ... · PDF fileDEM simulation of particle...
Metall. Res. Technol. 113, 603 (2016)c© EDP Sciences, 2016DOI: 10.1051/metal/2016035www.metallurgical-research.org
Metallurgical Research&Technology
DEM simulation of particle descending velocitydistribution in the reduction shaft furnace
Kuan Xu and Ming-hua Bai
National Engineering Research Center for Equipment and Technology of Cold Strip Rolling, YanshanUniversity, No. 438 Hebei Avenue, Qinhuangdao 066004, Hebei, P.R. Chinae-mail: [email protected]
Key words:Discrete element method; shaftfurnace; screw feeder; descendingvelocity
Received 18 April 2016Accepted 1 June 2016
Abstract – Reduction shaft furnace is a promising alternative to blast furnace ironmaking.The particle descending velocity distribution has a great influence on the shaft furnace,which directly affects the production index and further the shaft furnace normal smelting.Therefore, a three-dimensional model (3D) is established based on the discrete elementmethod (DEM) and computation fluid dynamic (CFD). The effect of the gas flow in the shaftfurnace, the height, the diameter and the bosh angle of the shaft furnace on the particledescending velocity distribution during discharging process is investigated by the modeland analyzed based on the granular dynamic theory and Janssen theory. The results showthat the particle velocity reduces along the radius. The effect of the gas flow on the velocitydistribution is insignificant. In order to obtain a uniform velocity distribution, it is better toincrease the height, or the diameter, or to decrease the bosh angle. An improved model isproposed for the uniform velocity distribution at last.
B ecause of its fast reduction rates, con-sistent product quality, minimal en-vironmental impacts, and great flexi-
bility, reduction shaft furnace is a promisingalternative to blast furnace ironmaking [1].In the shaft furnace production, iron ore par-ticles are charging in the shaft furnace, andthe reducing gas having high temperatureis blown from tuyeres, then the particles arereduced during descending. If the particledescending velocity distribution is not rea-sonable, the iron ore particles will not bereduced better, causing the production in-dex decreases and further affecting the shaftfurnace normal smelting. Consequently, it isnecessary to focus on researching the par-ticle descending velocity distribution in theshaft furnace.
Hence many researches had been investi-gated about the solid flow [2–6], these resultsare helpful for an overall understanding ofthe solid flow. To sum up, there have beentwo approaches adopted for the solid flowresearch, such as the physical simulation [2–4] and the mathematical simulation [5, 6].Compared with the mathematical simula-tion, the physical simulation is hard to an-alyze the solid flow quantificationally. Kou
et al. [5] researched the effect of the bottomdiameter of COREX shaft furnace, the cylin-der height and the screw flight diameter onthe particle velocity distribution based onDEM. However, the model he developed isnot taken into account the effect of the gasflow in the shaft furnace, the height, the di-ameter and the bosh angle of the shaft fur-nace on the particle descending velocity.
Numerical simulation analysis for solidflow in shaft furnace is a useful tool to under-stand the behavior of solid flow. So far, DEMhas become one of the most powerful sim-ulation methods for granular behaviors. Inthe ironmaking field, many researches [5–8]had been studied about the granular behav-ior based on DEM, and the simulation resultscoincided well with the experiments and in-dustrial operation. It can be found that DEMis well developed and useful to investigatethe granular behavior after comparing theresults with previous work.
Janssen theory, originated fromJanssen [9], has become one of the mostpowerful methods for calculating thestresses in granular layer. It is appliedin civil engineering, such as hopper and
Article published by EDP Sciences

K. Xu and M.-H. Bai: Metall. Res. Technol. 113, 603 (2016)
Table 1. Forces and torques acting on particle i.
Force and torque Equation
Normal contact force, fcn,i j −(4/3)E∗√
Rδ3/2n n
Normal damping force, fdn,i j −cn[6mijE∗(R∗δn)1/2]1/2Vn,i j
Tangential contact force, fct,i j −μs
∣∣∣fcn,i j
∣∣∣ (1 − (1 − δt/δt,max)3/2) δ̂t
Tangential damping force, fdt,i j −ct
(6μsmij
∣∣∣fcn,i j
∣∣∣ √1 − δt/δt,max/δt,max
)1/2Vt,i j
Coulomb friction force, ft,i j −μs
∣∣∣fcn,i j
∣∣∣ δ̂t
Torque by tangential forces, Tt,i j Ri j ×(fct,i j + fdt,i j
)Rolling friction torque, Tr,i j μr,i j
∣∣∣fcn,i j
∣∣∣ ω̂nij
Particle-fluid drag force, fd f ,i 0.125Cd0,iρ fπd2piε
2i |ui − vi| (ui − vi)ε
−χi
Pressure gradient force, fp�,i −Vi∇pi
where 1/mij = 1/mi + 1/mj, 1/R∗ = 1/Ri + 1/Rj,E∗ = E/[2(1 − v2)] , ω̂n
ij = ωnij/∣∣∣∣ωn
ij
∣∣∣∣ , ω̂nij = ω
nij/∣∣∣∣ωn
ij
∣∣∣∣ , δt =
|δt| , δ̂t = δt/ |δt| ,Ri j = Ri
(r j − ri
)/(Ri + Rj
), δt,max = μsδn (2 − v) / (2 (1 − v)) ,vi j = v j −vi +ω j ×R j −ωi ×
Ri,vn,i j = (vi j·n)·n,vt,i j = (vi j×n)×n, εi = 1−∑ki=1 Vi/ΔV, χ = 3.7−0.65 exp
[−(1.5 − log10 Rei
)2/2],Cd0,i =(
0.63 + 4.8/Re0.5i
)2,Rei = ρ f dpiεi |ui − vi| /μ f .
Note that tangential force (fct,i j + fdt,i j) should be replaced by ft,i j when δt � δt,max
flat-bottomed bin designs, and furtherinvestigated by many researchers [10–12].
In this work, a 3D model of the shaft fur-nace is established by a combined CFD andDEM approach. The influence of the gas flowin the shaft furnace, the height, the diame-ter and the bosh angle of the shaft furnace onthe particle descending velocity is further in-vestigated by the established model and ana-lyzed based on the granular dynamic theoryand Janssen theory. An improved model isproposed in order to achieve a uniform ve-locity distribution in the shaft furnace in theend.
1 Model description
In this work, the gas-solid flow in the shaftfurnace is regarded as be composed of adiscrete solid phase and a continuum fluidphase (the fluid phase is air). The discretesolid phase is described based on DEM. Aparticle has two types of motion: transla-tional and rotational. During its movement,the particle may interact with the neighbor-ing particles and/or the walls at the con-tact points and interact with the surroundingfluid phase [13, 14]. At any time t, the gov-erning equations for particle i with radius R,mass mi and moment of inertia Ii (=2/5mR2)
can be expressed as follows:
midvi
dt= fp f ,i +
K∑j=1
(fcn,i j + fdn,i j + fct,i j + fdt,i j
)
+mig (1)
Iidωi
dt=
K∑j=1
(Tt,i j + Tr,i j) (2)
where ωi and vi are the angular velocityand translatory velocity of particle i. K is thenumber of the particles in contact with theparticle i. The forces involved are the grav-ity mig, the particle-fluid interaction forcefp f ,i which includes two parts: the drag andpressure gradient forces, fd f ,i and fp�,i, andthe inter-particle forces between particles:the tangential and normal contact forces, fct,i j
and fcn,i j, and the damping forces in tangen-tial and normal directions, fdt,i j and fdn,i j. Thetorque acting on particle i because of parti-cle j includes the tangential torque Tt,i j andthe rolling friction torque Tr,i j. The equationsused for the present simulation are the sameas those used in the previous work [14–20],as listed in Table 1.
The continuum fluid phase is describedin a way which is similar to the one widelyused in the usual two-fluid model. The fluidgoverning equation is obtained on the basisof the point equation of motion of the fluid
603-page 2

K. Xu and M.-H. Bai: Metall. Res. Technol. 113, 603 (2016)
Fig. 1. The shaft furnace model used in this simulation.
and the solid phase governing equation isderived on the basis of the equation of mo-tion for the center of mass of a single particle.The mass conservation and the momentumconservation in terms of the local averagedvariables over a computational cell can beexpressed as follows:
∂(ρ fε f )/∂t + ∇ · (ρ fε f u) = 0 (3)
∂(ρ fεu)/∂t + ∇ · (ρ fεuu) = −∇p − F f p
+ ∇ · τ + ρ fεg(4)
where F f p and τ are, respectively, the vol-umetric particle-fluid interaction force ina computational CFD cell of volume ΔVand the fluid viscous stress tensor whichare given as Fp f = (
∑ kci=1fp f )/ΔV, and τ =
μ f
[(∇u) + (∇u)−1
]. u and ε are the fluid ve-
locity and the porosity which is given asε = 1 −
(∑ kci=1Vp,i
)/ΔV.
The method for CFD-DEM simulationshas been well established [20–22]. Themethod used in this work is the same as be-fore, not described here for brevity.
2 Model simulation
Since our aim here is to establish a generalunderstanding of the influence of the gasflow in the shaft furnace, the height, the di-
Table 2. Particle conditions in the simulation.
Parameters Small Middle Large UnitDiameter 100 200 300 mmMass ratio 33.3 33.3 33.3 wt%
ameter and the bosh angle of the shaft fur-nace on the particle descending velocity dis-tribution, a simplified shaft furnace modelis used to reduce the computational require-ment while reasonable and general resultscan be acquired. For example the shaft fur-nace wall is designed vertical in the model.However, it doesn’t affect the laws and re-sults on the particle descending velocity dis-tribution. The 3D model of the shaft fur-nace is shown in Figure 1. As the numberof the particles in the shaft furnace is overhundreds of millions and the particles sizesrange widely, it will spend numerous timecarrying out the calculation according to theactual sizes of particles. Enlarging the parti-cle size is a common practice in process mod-eling by DEM or CDF-DEM approach [23].In addition, according to Kou [5], enlargingthe particle size and changing the particlesize distribution have insignificant influenceon particle descending velocity distribution.Therefore, the particle diameter is enlargedand the condition of the particle is listed inTable 2.
The geometries in the 3D model, in-clude the shaft furnace wall and the
603-page 3

K. Xu and M.-H. Bai: Metall. Res. Technol. 113, 603 (2016)
Table 3. Parameters used in the simulation.
Parameters Screw Particle Wall UnitDensity 7850 3425 7850 kg.m−3
Shear modulus 7.9E10 1E7 7.9E10 PaPoission’s ratio 0.3 0.25 0.3 –
Static friction cofficient 0.364 0.5 0.4 –Rolling friction cofficient 0.05 0.05 0.05 –
Restitution cofficient 0.5 0.6 0.5 –Time step 10−5 s
Fig. 2. The particle descending velocity distribution( the gas velocity is 0 m.s−1).
screws, are made of steel. According toFernandez [24] and Kou [5], because thescrew may be polished by the particle flow,the static friction coefficient between thescrew surface and particle is set as 0.364.The simulation parameters are collected inTable 3 [5, 8, 17, 25, 26].
In practical production, it spends 6–7 hextruding these particles out of the shaft fur-nace. Since 1 s movements of the particlescost almost 1 h calculation time in averageaccording to the simulation, it is almost im-possible to carry out the simulation. Accord-ing to Owen’s, Cundall’s and Thompson’sworks [27–30], the particle flow and the av-erage particle velocity are linear functionsof the screw rotating speed from 200 RPMto 1400 RPM for horizontal screw conveyor.Thus, in order to reduce the calculation time,the screw rotating speed is accelerated in thissimulation.
In this simulation, the shaft furnace isinitially filled with the well-mixed particlesmention above. Then, the gas is introducedat the shaft furnace bottom, and the particlesare settled under gravity, particle-fluid dragforce and pressure gradient force to reach amacroscopically static state. After that, thescrews start to rotate around their own axesat a given time for the simulation.
In practical production, there is a compli-cated thermo-chemical behavior in the shaftfurnace. However, this work only investi-gate the influence of the gas flow in theshaft furnace on the particle descending ve-locity distribution, the complicated thermo-chemical behavior will be investigate in thefuture. The particle descending velocity dis-tribution when the gas velocity is 0 m.s−1 isillustrated in Figure 2, where the red particlemeans large descending velocity, while theblue one means small velocity.
603-page 4
K. Xu and M.-H. Bai: Metall. Res. Technol. 113, 603 (2016)
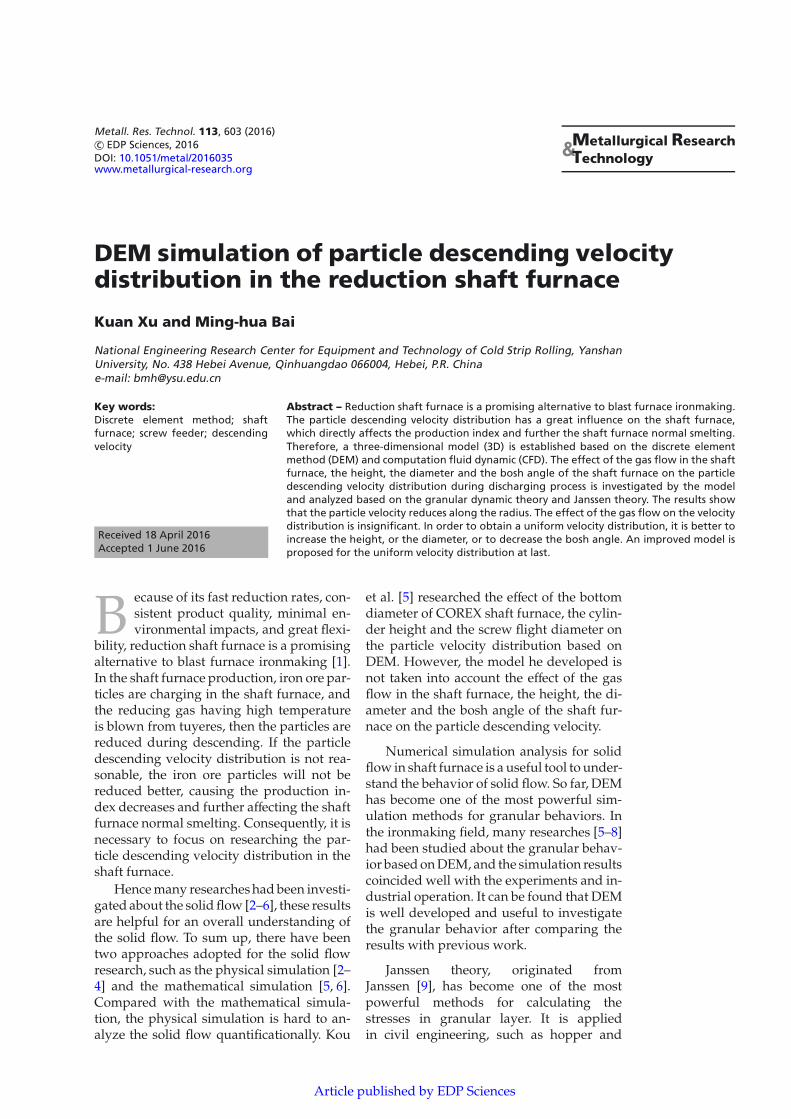
Fig. 3. Schematic diagram of the different levels.
It can been seen that the particle descend-ing velocity distribution is nonuniform inthis discharging process. The red area (thecentral area of the shaft furnace) means thatthe particles have the largest descending ve-locity in there, because the effect of the firstscrew blade is quite large and direct for theparticle movement, which is also found inKou’s and Yu’s works [5,31]. The particle ve-locity reduces with the increase of the heightfrom the shaft furnace bottom and from thecenter to the wall areas.
In order to obtain the particles descend-ing velocities along the radial direction,three levels are examined. The schematicdiagram of different levels is illustrated inFigure 3.
Because the X-direction velocity and theZ-direction velocity of the particle are tooslight to be considered, the Y-direction ve-locity of the particle is the research objectin this work. According to Kou [5], the par-ticle descending velocities around circum-ferential direction almost have no differenceat the same radius and depth. A series ofrings with 1 m height and same thicknessare extracted from the levels to measure theparticle descending velocities along the ra-dius. The average of velocities in the ringsare calculated and used to represent the par-ticle descending velocities along the radius,which are presented in Figure 4.
It can be obtained that the particle de-scending velocities in each level decreasealong radial direction. In addition, the par-
ticle descending velocity distribution is themost inhomogeneous in level 1 (the max-imum velocity difference is 0.742 m.s−1),while it is the most uniform in level 3 (themaximum velocity difference is 0.186 m.s−1).The standard deviations of the particle de-scending velocities in each level are calcu-lated in order to estimate the particle de-scending velocity fluctuations in each level.The standard deviation from level 1 to level3 are 0.312, 0.156 and 0.082, which impliesthat the particle descending velocity fluctu-ation is relatively even in higher level of theshaft furnace, while it becomes acutely inlower level of the shaft furnace. Thus, in or-der to obtain a uniform velocity distributionwhich is important to the discharging pro-cess, it is necessary to investigate the parti-cle descending velocities along the radius atdifferent conditions.
3 Results and discussion
The influences of some factors are investi-gated in this work, like gas flow in the shaftfurnace, height, diameter and bosh angle ofthe shaft furnace.
3.1 Gas flow
Here, the effect of gas flow is discussed atdifferent gas velocities in the shaft furnace. Itcan be noted that the similarity between dragand gravitational force is not satisfied in the
603-page 5

K. Xu and M.-H. Bai: Metall. Res. Technol. 113, 603 (2016)
Fig. 4. The particle descending velocities along the radius.
calculation using larger particle size than theactual particle size. However, the effect canbe negligible under the considered conditionbecause solid flow is dominant and gas flowplays a minor role.
Figure 5 shows the velocity distributionsat different gas velocities.
It can be seen that there are almost nodifference between Figures 5a–5c, which im-plies the effect of the gas velocity on the ve-locity distribution is insignificant under theconsidered conditions. Therefore, the veloc-ities along the radius at different gas veloc-ities in the three levels are extracted andshown in Figure 6 in order to analyze thephenomenon quantificationally.
In all levels, the particle descending ve-locity distributions are almost the same atdifferent gas velocities. In addition, the wallnormal stresses at different gas velocities inlevel 1 are measured and analyzed, the resultshows that the wall normal stresses underthe current conditions are almost no differ-ence (the maximum difference is less than5%). The reason is that the gas-solid interac-tion forces are too small to affect the particlemovement under the current conditions.
However, a phenomenon is found thatthe velocity distributions at different parti-
cle layer height in the same level exist ob-vious differences. Therefore, a hypothesis isproposed that different shaft furnace heightsmay affect the velocity distribution.
3.2 Shaft furnace height
The velocities along the radius at differentparticle layer heights (8 m, 10 m and 13 m)are measured and analyzed respectively inorder to investigate the influence of the shaftfurnace height on the velocity distribution.The results of the velocity distribution areshown in Figures 7 and 8.
In Figure 7, it can be seen that the highdescending velocity area is shrinking withthe increase of particle layer height. This canbe also found in all levels of Figure 8, theparticle velocities in the center area (0–0.5R)reduce with the particle layer height increas-ing, and the differences between the maxi-mum and minimum velocities in each levelturn to smaller. For example, in the case ofthe layer height is 13 m, the descending ve-locities at 0.1R from level 1 to level 3 decreaseby 13.5%, 31.4%, 27.1% respectively compar-ing with the layer height is 8 m. The standarddeviations of the velocities at different layerheights are listed in Table 4.
603-page 6

K. Xu and M.-H. Bai: Metall. Res. Technol. 113, 603 (2016)
(a) (b)
(c)
Fig. 5. Velocity distributions at different gas velocities (a) 0 m.s−1 (b) 2 m.s−1 (c) 4 m.s−1.
Table 4. Standard deviations of the velocities atdifferent layer heights.
Height Level 1 Level 2 Level 313 m 0.233 0.043 0.00910 m 0.264 0.091 0.0228 m 0.312 0.156 0.082
It can be found that the standard devia-tions of each level decrease with the layerheight increasing, which implies that therelative motion between the particles turnto smaller and the velocity distribution be-comes more uniform with the height increas-ing. It shows that the forces on the particles
in the furnace under different shaft furnaceheight conditions are different, because forceis the root cause of motion change. There-fore, the force on the particles in the furnaceshould be study.
According to granular dynamic the-ory [32], the reason of the relative motionbetween particles is that the shear force onthe granular layer is larger than the anti-shearing force. The anti-shearing force canbe written as follow.
Fs = Fr f + CA (5)
where Fr represents the normal force whichis perpendicular to the shear direction, f
603-page 7

K. Xu and M.-H. Bai: Metall. Res. Technol. 113, 603 (2016)
(a) (b)
(c)
Fig. 6. Velocities along the radius at different gas velocities (a) level 1 (b) level 2 (c) level 3.
represents the granular friction coefficient. Crepresents the unit cohesion which is definedas the cohesion on the unit shear plane and Arepresents the shear area. It can be seen thatf and C are constant in this work (the unit co-hesion is 0), which implies that the normalforce changes with the change of the layerheight. According to Janssen theory [9–12],the axial stress and the radial stress in thegranular layer are given by
Pa =ρ�D4kλ
(1 − e
−4kλzD
)(6)
Pr = kPa =ρ�D4λ
(1 − e−
4kλzD
)(7)
where z denotes the calculated height whichis the distance from the granular layer sur-face. λ and ρ denote the friction coefficientbetween the particle and the wall and thebulk density of the granular layer, respec-tively. k is a constant defining the ratio be-tween the radial and axial stresses.
According to Equations (5)–(7), the ra-dial and axial stresses increase with the in-crease of the shaft furnace height, and theanti-shearing force turns to larger, which re-duces the relative motion between the parti-cles. It is the reason that the velocity distribu-tion becomes more uniform with the heightincreasing. In addition, in the level 3, the
603-page 8

K. Xu and M.-H. Bai: Metall. Res. Technol. 113, 603 (2016)
(a) (b)
(c)
Fig. 7. Velocity distributions at different layer height (a) 8 m (b) 10 m (c) 13 m.
difference between the velocity distributionin the case of the layer height is 8 m and theother cases is obvious, because the distancefrom the granular layer surface to level 3 inthe case of the layer height is 8 m is so muchtinier that the stresses is quite smaller com-pare with the other cases. It can be foundfrom Figure 8 that the change trends of thevelocity at different heights in each level arealmost identical, and if the particle descend-
ing velocity distribution in the lower part ofthe shaft furnace is uniform, the one in thehigher part is more uniform. Hence, only thevelocities in level 1 are analyzed in the fol-lowing study.
According to Equations (5) and (6), theeffect of the increase of the height on theload on the particles in the furnace bottomgradually reduces with the height increas-ing. For the further investigate the effect of
603-page 9

K. Xu and M.-H. Bai: Metall. Res. Technol. 113, 603 (2016)
(a) (b)
(c)
Fig. 8. Velocity along the radius at different heights of the pellets layer (a) level 1 (b) level 2 (c) level 3.
the shaft furnace height on the velocity dis-tribution, a new shaft furnace model whichis increased the height is established, and thevelocity distributions in level 1 at differentlayer heights are illustrated in Figure 9.
It can be seen that the change of the veloc-ity distribution decreases with the height in-creasing, and the change is insignificant afterthe height reached 30 m, which implies thatthe height has little influence on the veloc-ity distribution after the hight reached 30 m(hereafter referred as “maximum height”)under the considered conditions.
3.3 Shaft furnace diameter
It can be found that the shaft furnace di-ameter has influence on the stresses on the
particles according to Equations (5) and (6).In this section, the effect of the shaft furnacediameter on the velocity distribution is in-vestigated. In order to eliminate the effect ofthe screws on the velocity distribution, theflight diameter and the pitch of the screwchange to be constant in this section. Fig-ure 10 shows the velocity distributions atdifferent the shaft furnace diameters whenthe layer heights are identical.
In Figure 10, the high velocity area atthe center of the shaft furnace bottom re-duces with the shaft furnace diameter in-creasing, while the low velocity area nearthe wall increases. The velocities in level 1along the radius are illustrated in Figure 11in order to quantificationally investigate thephenomenon.
603-page 10

K. Xu and M.-H. Bai: Metall. Res. Technol. 113, 603 (2016)
Fig. 9. Velocity along the radius in level 1 at different heights of the pellets layer.
It can be seen from Figure 11 that thecenter area velocities turn to smaller withthe increase of diameter, while the velocitiesin the middle area (the radius from 1.5 mto 3 m) increase slightly. Specifically, the de-crease of the center area velocity is obvious,the velocity in the case of 10 m shaft furnacediameter decreases by 17.0% compared withthat of 8 m. In addition, the unit distancechange of the velocity along the radial direc-tion decreases with the diameter increasing.It implies that the relative motion betweenthe particles turn to smaller which is causedby the increase of the stresses on the parti-cles. However, with the increase of the di-ameter, the low velocity area near the wallincreases. In order to reduce the low veloc-ity area near the wall, and obtain the uniformof drawdown patterns, the effect of the shaftfurnace bosh angle on the velocity distribu-tion should be studied.
3.4 Shaft furnace bosh angle
To investigate the effect of the shaft furnacebosh angle on the velocity distribution, the3D model is reestablished and the schematicdiagram of shaft furnace model is presentedin Figure 12, and the cross-sections of veloc-
ity distribution at different bosh angles (90◦,85◦ and 80◦) are illustrated in Figure 13.
It can be seen that with the decrease ofthe shaft furnace bosh angle, the low veloc-ity area near the wall turn to smaller andthe velocities at the center area reduce. Thevelocity distributions in level 1 at differentshaft furnace bosh angles are illustrated andanalyzed in Figure 14.
In Figure 14, it can be found that withthe decrease of the shaft furnace diameter,the velocities within 0.4R reduce, while thevelocities at other areas turn to larger. Thereason is that the shaft furnace cross sectionsare gradually reduced from the top to thebottom, which leads to the rearrangement ofthe particles in order to adapt the decreaseof the cross sections and the increase of theextrusion between the particles. In addition,the extrusion between the particles turns tolarger with the cross section contraction ratioincreasing.
3.5 The improved model
According to the above simulation results,the height and the diameter of the shaft fur-nace should be increased while the bosh an-gle of the shaft furnace should be reduced in
603-page 11

K. Xu and M.-H. Bai: Metall. Res. Technol. 113, 603 (2016)
(a) (b)
(c)
Fig. 10. Velocity distributions at different diameters of the shaft furnace (a) 10 m (b) 9 m (c) 8 m.
order to obtain an evener velocity distribu-tion. Thus, an improved model is establishedthrough combining the previous factors. Theheight of the improved model is 30 m forthe effect of the change of the height on thevelocity distribution will be insignificant ifthe height increases. The diameter of the im-proved model is 10 m and the bosh angle is80◦. The cross-section of the velocity distri-bution in the improved model is illustratedin Figure 15.
It can be seen that the velocity distribu-tion in the improved model is almost uni-form. The velocity distributions between the
contrast model (the height is 8 m, the diam-eter is 9 m and the bosh angle is 90◦) and theimproved model are compared in Figure 16.
The velocity distribution in the improvedmodel seem more uniform than the one inthe contrast model. The maximum velocitydecreases by 37.6% and the the minimumvelocity increases by 77.4% compare withthat in the contrast model. Specifically, thestandard deviation decreases from 0.312 to0.127. Therefore, the velocity distribution inthe improved model is more reasonable fordischarging materials evenly.
603-page 12

K. Xu and M.-H. Bai: Metall. Res. Technol. 113, 603 (2016)
Fig. 11. Velocity along the radius at different diameters of the shaft furnace in level 1.
Fig. 12. The schematic diagram of shaft furnacemodel.
4 Conclusions
In order to study the particle descending ve-locity distribution in the shaft furnace, DEM-CFD techniques have been employed andthe granular dynamic theory and the Janssentheory have been used to analyze the effect ofthe factors on the velocity distribution in thepresent study. The factors simulated in the
paper include the gas flow in the shaft fur-nace, the height, the diameter and the boshangle of the shaft furnace. Generally, the par-ticle descending velocity reduces from cen-ter to wall areas in the shaft furnace.
In terms of the ranges of factors investi-gated in the paper, the gas flow affects theparticle descending velocity most insignifi-cantly under the considered conditions be-cause of the small gas-solid interactionforces. The effect of the shaft furnace heighton the velocity distribution is obvious be-fore the height reaches the maximum height,the velocity distribution becomes more uni-form with the increase of the height, whilethe effect of the height on the velocity distri-bution turns to smaller. Enlarging the shaftfurnace diameter restrains the velocities inthe center area of the shaft but increases thelow velocity area near the wall, while reduc-ing the shaft furnace bosh angle help to nar-row the low velocity area beyond 0.4R anddecrease the velocities in the others. There-for, an improved model is established in or-der to obtain a uniform velocity distributionin the shaft furnace. The improved modelhas improved the evenness of the veloc-ity distribution obviously, which is providesa numerical basis and technical direction
603-page 13

K. Xu and M.-H. Bai: Metall. Res. Technol. 113, 603 (2016)
(a) (b)
(c)
Fig. 13. Velocity distributions at different bosh angles of the shaft furnace (a) 90◦; (b) 85◦; (c) 80◦.
for the design and improved of the shaftfurnace.
This work is an initial explore on theparticle descending velocity in the shaft fur-nace by using DEM-CFD, further simulationwill be carry out to investigate the effect ofthermo-chemical behavior in the shaft fur-nace. And the simulation will also take theeffect of particle swelling and shrinkage, ir-regular particle shape, and the sticking force
between particles into account inside the en-tire shaft furnace. Work on these aspects isundertaken and will be reported hopefullyin the future.
Acknowledgements
The author would like to appreciate much for theanonymous reviewers and editors for improve-ment of this work, and Mr. Guo-ming Xu and Mrs.Lan-xiang Zhang for suggestions on this work.
603-page 14

K. Xu and M.-H. Bai: Metall. Res. Technol. 113, 603 (2016)
Fig. 14. Velocity along the radius at different bosh angles of the shaft furnace in level 1.
Fig. 15. Velocity distribution in improved model.
603-page 15

K. Xu and M.-H. Bai: Metall. Res. Technol. 113, 603 (2016)
Fig. 16. Velocity along the radius between contrast model and improved model in level 1.
References
[1] J. Kopfle, R. Hunter, Iron. Steel. 35 (2008) 254-259
[2] Y.J. Lee, Powder Technol. 102 (1999) 194-201[3] H. Zhou, Z.S. Zou, Z.G. Luo, et al., Iron. Steel.
42 (2015) 209-216[4] H. Zhou, Z. Luo, Z. Zou, et al., Steel Res. Int.
86 (2015) 1073-1081[5] M. Kou, S. Wu, W. Shen, et al., ISIJ Int. 53
(2013) 2080-2089[6] H. Zhou, Z.G. Luo, T. Zhang, et al., Iron. Steel.
(2015)[7] M. Kou, S. Wu, K. Du, et al., ISIJ Int. 53 (2013)
1002-1009[8] H. Mio, S. Komatsuki, M. Akashi, et al.,
Trans. Iron Steel Instit. Jpn 49 (2009) 479-486[9] H.A. Janssen, Zeitschr. d. Vereines deutscher
Ingenieure 39 (1895) 1045-1049[10] M. Sperl, Granular Matter 8 (2005) 59-65[11] R. Balevièius, I. Sielamowicz, Z. Mróz, et al.,
Powder Technol. 214 (2011) 322-336[12] P. Xu, X. Duan, G. Qian, et al., Powder Technol.
284 (2015) 326-335[13] P.A. Cundall, O.D. L.A. Strack, Géotechnique
29 (1979) 47-65[14] Z.Y. Zhou, H.P. Zhu, B. Wright, et al., Powder
Technol. 208 (2011) 72-85[15] B.H. Xu, A.B. Yu, S.J. Chew, et al., Powder
Technol. 109 (2000) 13-26[16] Z. Zhou, H. Zhu, A. Yu, et al., ISIJ Int. 45
(2005) 1828-1837[17] Z.Y. Zhou, H.P. Zhu, A.B. Yu, et al., Comput.
Chem. Eng. 32 (2008) 1760-1772
[18] Z. Zhou, H. Zhu, A. Yu, et al., Trans. Iron SteelInstit. Jpn 50 (2010) 515-523
[19] Q.F. Hou, Z.Y. Zhou, A.B. Yu, Chem. Eng. Sci.84 (2012) 449-468
[20] Y.D. Z.iscrete, J. Fluid Mech. 661 (2010) 482-510
[21] B.H. Xu, A.B. Yu, Chem. Eng. Sci. 52 (1997)2785-2809
[22] Y.Q. Feng, B.H. Xu, S.J. Zhang, et al., Aiche J.50 (2004) 1713-1728
[23] H.P. Zhu, Z.Y. Zhou, R.Y. Yang, et al., Chem.Eng. Sci. 63 (2008) 5728-5770
[24] J.W. Fernandez, P.W. Cleary, W. Mcbrid,Chem. Eng. Sci. 66 (2011) 5585-5601
[25] Y. Yu, H. Saxen, ISIJ Int. 52 (2012) 788-796[26] H. Guoming, Analysis and simulation of
granular system by discrete element methodusing EDEM, 2010, pp. 7-10
[27] P.J. Owen, P.W. Cleary, Powder Technol. 193(2009) 274-288
[28] Y. Shimizu, P.A. Cundall, J. Eng. Mech. 127(2001) 864-872
[29] P.A. Moysey, M.R. Thompson, Polym. Eng.Sci. 44 (2004) 2203-2215
[30] P.A. Moysey, M.R. Thompson, PowderTechnol. 153 (2005) 95-107
[31] Y. Yu, P.C. Arnold, Powder Technol. 88 (1996)81-87
[32] Wu Aixiang, Sun Yezhi and Liu Xiangping,Granular dynamic theory and its applica-tion 1st edn, Metallurgical Industry Press ofChina, Beijing, 2002
603-page 16