DELTA AIR LINES INC /DE/ Form 10-K Annual Report...
341
Business Address HARTSFIELD ATLANTA INTL AIRPORT 1030 DELTA BLVD ATLANTA GA 30354-1989 4047152600 Mailing Address P.O. BOX 20706 DEPT 981 ATLANTA GA 30320-6001 SECURITIES AND EXCHANGE COMMISSION FORM 10-K Annual report pursuant to section 13 and 15(d) Filing Date: 2012-02-10 | Period of Report: 2011-12-31 SEC Accession No. 0001445305-12-000272 (HTML Version on secdatabase.com) FILER DELTA AIR LINES INC /DE/ CIK:27904| IRS No.: 580218548 | State of Incorp.:DE | Fiscal Year End: 1231 Type: 10-K | Act: 34 | File No.: 001-05424 | Film No.: 12594311 SIC: 4512 Air transportation, scheduled Copyright © 2014 www.secdatabase.com . All Rights Reserved. Please Consider the Environment Before Printing This Document
Transcript of DELTA AIR LINES INC /DE/ Form 10-K Annual Report...
Business AddressHARTSFIELD ATLANTA INTLAIRPORT1030 DELTA BLVDATLANTA GA 30354-19894047152600
Mailing AddressP.O. BOX 20706DEPT 981ATLANTA GA 30320-6001
SECURITIES AND EXCHANGE COMMISSION
FORM 10-KAnnual report pursuant to section 13 and 15(d)
Filing Date: 2012-02-10 | Period of Report: 2011-12-31SEC Accession No. 0001445305-12-000272
(HTML Version on secdatabase.com)
FILERDELTA AIR LINES INC /DE/CIK:27904| IRS No.: 580218548 | State of Incorp.:DE | Fiscal Year End: 1231Type: 10-K | Act: 34 | File No.: 001-05424 | Film No.: 12594311SIC: 4512 Air transportation, scheduled
Copyright © 2014 www.secdatabase.com. All Rights Reserved.Please Consider the Environment Before Printing This Document
UNITED STATESSECURITIES AND EXCHANGE COMMISSION
Washington, D.C. 20549
FORM 10-KR ANNUAL REPORT PURSUANT TO SECTION 13 OR 15(d) OF THE SECURITIES EXCHANGE ACT OF 1934
For the fiscal year ended December 31, 2011
Or
o TRANSITION REPORT PURSUANT TO SECTION 13 OR 15(d) OF THE SECURITIES EXCHANGE ACT OF 1934Commission File Number 001-5424
DELTA AIR LINES, INC.(Exact name of registrant as specified in its charter)
Delaware 58-0218548(State or other jurisdiction of incorporation or organization) (I.R.S. Employer Identification No.)
Post Office Box 20706Atlanta, Georgia 30320-6001
(Address of principal executive offices) (Zip Code)
Registrant's telephone number, including area code: (404) 715-2600Securities registered pursuant to Section 12(b) of the Act:
Title of each class Name of each exchange on which registered
Common Stock, par value $0.0001 per share New York Stock ExchangeSecurities registered pursuant to Section 12(g) of the Act: None
Indicate by check mark if the registrant is a well-known seasoned issuer, as defined in Rule 405 of the Securities Act. Yes R No o
Indicate by check mark if the registrant is not required to file reports pursuant to Section 13 or Section 15(d) of the Exchange Act. Yes o No RIndicate by check mark whether the registrant (1) has filed all reports required to be filed by Section 13 or 15(d) of the Securities Exchange Act of
1934 during the preceding 12 months (or for such shorter period that the registrant was required to file such reports), and (2) has been subject to suchfiling requirements for the past 90 days. Yes R No o
Indicate by check mark whether the registrant has submitted electronically and posted on its corporate Web site, if any, every Interactive Data Filerequired to be submitted and posted pursuant to Rule 405 of Regulation S-T (§ 232.405 of this chapter) during the preceding 12 months (or for suchshorter period that the registrant was required to submit and post such files). Yes R No o
Indicate by check mark if disclosure of delinquent filers pursuant to Item 405 of Regulation S-K is not contained herein, and will not be contained, tothe best of registrant's knowledge, in definitive proxy or information statements incorporated by reference in Part III of this Form 10-K or any amendmentto this Form 10-K. R
Indicate by check mark whether the registrant is a large accelerated filer, an accelerated filer, a non-accelerated filer, or a smaller reportingcompany. See the definitions of “large accelerated filer,” “accelerated filer” and “smaller reporting company” in Rule 12b-2 of the Exchange Act.(Check one):
Large accelerated filer R Accelerated filer o Non-accelerated filero Smaller reporting company o
(Do not check if a smaller reporting company)
Indicate by check mark whether the registrant is a shell company (as defined in Rule 12b-2 of the Exchange Act). Yes o No RThe aggregate market value of the voting and non-voting common equity held by non-affiliates of the registrant as of June 30, 2011 was
approximately $7.8 billion.Indicate by check mark whether the registrant has filed all documents and reports required to be filed by Section 12, 13 or 15(d) of the Securities
Exchange Act of 1934 subsequent to the distribution of securities under a plan confirmed by a court. Yes R No o
On January 31, 2012, there were outstanding 845,519,629 shares of the registrant's common stock.
Copyright © 2013 www.secdatabase.com. All Rights Reserved.Please Consider the Environment Before Printing This Document

This document is also available on our website at http://www.delta.com/about_delta/investor_relations.Documents Incorporated By Reference
Part III of this Form 10-K incorporates by reference certain information from the registrant's definitive Proxy Statement for its Annual Meeting ofStockholders to be filed with the Securities and Exchange Commission.
Copyright © 2013 www.secdatabase.com. All Rights Reserved.Please Consider the Environment Before Printing This Document
Table of ContentsPage
Forward-Looking Statements 1
PART I
ITEM 1. BUSINESS 2General 2Frequent Flyer Program 4Other Businesses 4Distribution and Expanded Product Offerings 5Fuel 5Competition 5Regulatory Matters 6Employee Matters 9Executive Officers of the Registrant 10Additional Information 10
ITEM 1A. RISK FACTORS 11Risk Factors Relating to Delta 11Risk Factors Relating to the Airline Industry 15
ITEM 1B. UNRESOLVED STAFF COMMENTS 17
ITEM 2. PROPERTIES 18Flight Equipment 18Ground Facilities 19
ITEM 3. LEGAL PROCEEDINGS 21
ITEM 4. MINE SAFTEY DISCLOSURES 21
PART II
ITEM 5. MARKET FOR REGISTRANT'S COMMON EQUITY, RELATED STOCKHOLDERMATTERS AND ISSUER PURCHASES OF EQUITY SECURITIES 22
ITEM 6. SELECTED FINANCIAL DATA 24
ITEM 7. MANAGEMENT'S DISCUSSION AND ANALYSIS OF FINANCIAL CONDITION ANDRESULTS OF OPERATION 26
Financial Highlights - 2011 Compared to 2010 26Results of Operations - 2011 Compared to 2010 28Results of Operations - 2010 Compared to 2009 31Non-Operating Results 33Income Taxes 33Financial Condition and Liquidity 34Contractual Obligations 36Critical Accounting Policies and Estimates 37Supplemental Information 41Glossary of Defined Terms 42
Copyright © 2013 www.secdatabase.com. All Rights Reserved.Please Consider the Environment Before Printing This Document
ITEM 7A. QUANTITATIVE AND QUALITATIVE DISCLOSURES ABOUT MARKET RISK 43
ITEM 8. FINANCIAL STATEMENTS AND SUPPLEMENTARY DATA 45
ITEM 9. CHANGES IN AND DISAGREEMENTS WITH ACCOUNTANTS ON ACCOUNTING ANDFINANCIAL DISCLOSURE 86
ITEM 9A. CONTROLS AND PROCEDURES 86
ITEM 9B. OTHER INFORMATION 88
Copyright © 2013 www.secdatabase.com. All Rights Reserved.Please Consider the Environment Before Printing This Document
PagePART III
ITEM 10. DIRECTORS, EXECUTIVE OFFICERS AND CORPORATE GOVERNANCE OF THEREGISTRANT 88
ITEM 11. EXECUTIVE COMPENSATION 88
ITEM 12. SECURITY OWNERSHIP OF CERTAIN BENEFICIAL OWNERS AND MANAGEMENT ANDRELATED STOCKHOLDER MATTERS 88
ITEM 13. CERTAIN RELATIONSHIPS AND RELATED TRANSACTIONS, AND DIRECTORINDEPENDENCE 88
ITEM 14. PRINCIPAL ACCOUNTANT FEES AND SERVICES 89
PART IV
ITEM 15. EXHIBITS AND FINANCIAL STATEMENT SCHEDULES 89
SIGNATURES 90EXHIBIT INDEX 91
Copyright © 2013 www.secdatabase.com. All Rights Reserved.Please Consider the Environment Before Printing This Document
Unless otherwise indicated, the terms “Delta,” “we,” “us,” and “our” refer to Delta Air Lines, Inc. and its subsidiaries.
FORWARD-LOOKING STATEMENTS
Statements in this Form 10-K (or otherwise made by us or on our behalf) that are not historical facts, including statements about ourestimates, expectations, beliefs, intentions, projections or strategies for the future, may be “forward-looking statements” as defined inthe Private Securities Litigation Reform Act of 1995. Forward-looking statements involve risks and uncertainties that could cause actualresults to differ materially from historical experience or our present expectations. Known material risk factors applicable to Delta aredescribed in “Risk Factors Relating to Delta” and “Risk Factors Relating to the Airline Industry” in “Item 1A. Risk Factors” of thisForm 10-K, other than risks that could apply to any issuer or offering. All forward-looking statements speak only as of the date made,and we undertake no obligation to publicly update or revise any forward-looking statements to reflect events or circumstances that mayarise after the date of this report.
1
Copyright © 2013 www.secdatabase.com. All Rights Reserved.Please Consider the Environment Before Printing This Document
Part I
ITEM 1. BUSINESS
General
We provide scheduled air transportation for passengers and cargo throughout the United States and around the world. Our globalroute network gives us a presence in every major domestic and international market. Our route network is centered around the hubsystem we operate at airports in Amsterdam, Atlanta, Cincinnati, Detroit, Memphis, Minneapolis-St. Paul, New York-JFK, Paris-Charles de Gaulle, Salt Lake City and Tokyo-Narita. Each of these hub operations includes flights that gather and distribute traffic frommarkets in the geographic region surrounding the hub to domestic and international cities and to other hubs. Our network is supportedby a fleet of aircraft that is varied in terms of size and capabilities, giving us flexibility to adjust aircraft to the network.
Other key characteristics of our route network include:
• our alliances with foreign airlines, including our membership in SkyTeam, a global airline alliance;
• our transatlantic joint venture with Air France-KLM and Alitalia;
• our domestic marketing alliance with Alaska Airlines, which expands our west coast service; and
• agreements with multiple domestic regional carriers, which operate as Delta Connection, including our wholly-ownedsubsidiary, Comair, Inc.
We are incorporated under the laws of the State of Delaware. Our principal executive offices are located at Hartsfield-JacksonAtlanta International Airport in Atlanta, Georgia. Our telephone number is (404) 715-2600 and our Internet address is www.delta.com.Information contained on this website is not part of, and is not incorporated by reference in, this Form 10-K.
International Alliances
We have bilateral and multilateral marketing alliances with foreign airlines to improve our access to international markets. Thesearrangements can include codesharing, reciprocal frequent flyer program benefits, shared or reciprocal access to passenger lounges,joint promotions, common use of airport gates and ticket counters, ticket office co-location and other marketing agreements. Thesealliances often present opportunities in other areas, such as airport ground handling arrangements and aircraft maintenance insourcing.
Our international codesharing agreements enable us to market and sell seats to an expanded number of international destinations.Under international codesharing arrangements, we and a foreign carrier each publish our respective airline designator codes on a singleflight operation, thereby allowing us and the foreign carrier to offer joint service with one aircraft, rather than operating separateservices with two aircraft. These arrangements typically allow us to sell seats on a foreign carrier's aircraft that are marketed under ourdesignator code and permit the foreign airline to sell seats on our aircraft that are marketed under the foreign carrier's designator code.
We have international codeshare arrangements with Aeroméxico, Air France, Air Nigeria, Alitalia, Aeroflot, China Airlines, ChinaEastern, China Southern, CSA Czech Airlines, KLM Royal Dutch Airlines, Korean Air, Olympic Air, Royal Air Maroc, VRG LinhasAéreas (operating as GOL), Vietnam Airlines, Virgin Australia and WestJet Airlines (and some affiliated carriers operating inconjunction with some of these airlines).
SkyTeam. In addition to our marketing alliance agreements with individual foreign airlines, we are a member of the SkyTeam globalairline alliance. The other members or prospective members of SkyTeam are Aeroflot, Aeroméxico, Air Europa, Air France, Alitalia,China Airlines, China Eastern, China Southern, CSA Czech Airlines, Kenya Airways, KLM, Korean Air, Tarom and Vietnam Airlines.Aerolineas Argentinas, Garuda Indonesia, Middle East Airlines, Saudi Arabian Airlines and Xiamen Airlines each have announced theirformal intent to join SkyTeam within the next two years. One goal of SkyTeam is to link the route networks of the member airlines,providing opportunities for increased connecting traffic while offering enhanced customer service through mutual codesharingarrangements, reciprocal frequent flyer and lounge programs and coordinated cargo operations.
Copyright © 2013 www.secdatabase.com. All Rights Reserved.Please Consider the Environment Before Printing This Document

2
Copyright © 2013 www.secdatabase.com. All Rights Reserved.Please Consider the Environment Before Printing This Document
Transatlantic joint venture. In addition to being members in SkyTeam with Air France and KLM, both of which are subsidiaries ofthe same holding company, and Alitalia, we have a transatlantic joint venture agreement with these carriers. This agreement provides forthe sharing of revenues and costs on transatlantic routes, as well as coordinated pricing, scheduling and product development onincluded routes. Pursuant to this joint venture, we, Air France-KLM and Alitalia operate an extensive transatlantic network, primarilyon routes between North America and Europe, and secondarily on routes between North America and Africa, the Middle East and India,and routes between Europe and Central America and several countries in northern South America.
Transpacific joint venture with Virgin Australia Airlines. In June 2011, we and Virgin Australia Airlines received approval ofantitrust immunity for our transpacific alliance. Antitrust immunity will allow us to implement a proposed joint venture that will expandthe reach of Delta and Virgin Australia between the United States and Australia and the South Pacific. The alliance will create a networkable to serve thousands of city-pairs in North America and the South Pacific. Alone, we serve only Sydney in Australia and VirginAustralia flies only to Los Angeles in the United States. The antitrust immunized alliance will allow the airlines to fully cooperate onnetwork planning and distribution to deliver a more attractive and competitive service for customers.
Enhanced commercial agreements with Latin American Carriers. In 2011, we entered into separate agreements with GrupoAeroméxico, S.A.B. de C.V., the parent company of Aeroméxico, and GOL Linhas Aéreas Inteligentes, S.A, the parent company ofGOL, for a strategic equity investment in each company and an exclusive commercial relationship with their carriers. We believe thiswill secure our long-term position in the important and expanding Latin markets of Mexico and Brazil, respectively. The agreementsprovide for expansion of codesharing, additional alignment of service attributes offered to frequent flyer members of our Sky Milesprogram and the other carriers' programs, and additional cooperation for selling activities. The expanded relationship with Aeroméxicoalso contemplates the establishment of a joint-venture maintenance, repair and overhaul facility in Guadalajara, Mexico.
Domestic Alliances
We have entered into a marketing alliance with Alaska Airlines, which includes mutual codesharing and reciprocal frequent flyer andairport lounge access arrangements. Our alliance agreement with Alaska Airlines provides for extensive cooperation with respect to ourwest coast presence.
We also have frequent flyer and reciprocal lounge agreements with Hawaiian Airlines, and codesharing agreements with AmericanEagle Airlines (“American Eagle”) and Hawaiian Airlines. These marketing relationships are designed to permit the carriers to retaintheir separate identities and route networks while increasing the number of domestic and international connecting passengers using thecarriers' route networks.
Regional Carriers
We have air service agreements with multiple domestic regional air carriers that feed traffic to our route system by servingpassengers primarily in small-and medium-sized cities. These arrangements enable us to increase the number of flights we haveavailable in certain locations and to better match capacity with demand. Approximately 21% of our passenger revenue in 2011 wasrelated to flying by regional air carriers.
Through our regional carrier program, we have contractual arrangements with ten regional carriers to operate regional jet and, incertain cases, turbo-prop aircraft using our “DL” designator code. In addition to our wholly-owned subsidiary, Comair, we havecontractual arrangements with: ExpressJet Airlines, Inc. (formerly, Atlantic Southeast Airlines, Inc.) and SkyWest Airlines, Inc., bothsubsidiaries of SkyWest, Inc.; Chautauqua Airlines, Inc. and Shuttle America Corporation, both subsidiaries of Republic AirwaysHoldings, Inc.; Pinnacle Airlines, Inc. and Mesaba Aviation, Inc. ("Mesaba"), both subsidiaries of Pinnacle Airlines Corp. ("Pinnacle");Compass Airlines, Inc. ("Compass") and GoJet Airlines, LLC, both subsidiaries of Trans States Holdings, Inc. ("Trans States"); andAmerican Eagle.
3
Copyright © 2013 www.secdatabase.com. All Rights Reserved.Please Consider the Environment Before Printing This Document
With the exception of American Eagle and a portion of the flights operated for us by SkyWest Airlines as described below, theseagreements are capacity purchase arrangements, under which we control the scheduling, pricing, reservations, ticketing and seatinventories for the regional carriers' flights operating under our “DL” designator code, and we are entitled to all ticket, cargo, mail andin-flight and ancillary revenues associated with these flights. We pay those airlines an amount, as defined in the applicable agreement,which is based on a determination of their cost of operating those flights and other factors intended to approximate market rates forthose services. These capacity purchase agreements are long-term agreements, usually with initial terms of at least 10 years, which grantus the option to extend the initial term. Certain of these agreements provide us the right to terminate the entire agreement, or in somecases remove some of the aircraft from the scope of the agreement, for convenience at certain future dates.
Our arrangement with American Eagle, limited to certain flights operated to and from the Los Angeles International Airport, as wellas a portion of the flights operated for us by SkyWest Airlines, are structured as revenue proration agreements. These prorationagreements establish a fixed dollar or percentage division of revenues for tickets sold to passengers traveling on connecting flightitineraries.
Frequent Flyer Program
Our SkyMiles® frequent flyer program is designed to retain and increase traveler loyalty by offering incentives to travel on Delta.The SkyMiles program allows program members to earn mileage for travel awards by flying on Delta, Delta's regional carriers and otherparticipating airlines. Mileage credit may also be earned by using certain services offered by program participants, such as credit cardcompanies, hotels and car rental agencies. In addition, individuals and companies may purchase mileage credits. Miles will not expire,but are subject to all program rules. We reserve the right to terminate the program with six months advance notice, and to change theprogram's terms and conditions at any time without notice.
SkyMiles program mileage credits can be redeemed for air travel on Delta and participating airlines, for membership in our DeltaSky Clubs® and for other program participant awards. Mileage credits are subject to certain transfer restrictions and travel awards aresubject to capacity-controlled seating. In 2011, program members redeemed more than 275 billion miles in the SkyMiles program for 12million award redemptions. During this period, 8.2% of revenue miles flown on Delta were from award travel.
Other Businesses
Cargo
Through the strength of our global network, our cargo operations are able to connect all of the world's major freight gateways. Wegenerate cargo revenues in domestic and international markets primarily through the use of cargo space on regularly scheduledpassenger aircraft. We are a member of SkyTeam Cargo, a global airline cargo alliance, whose other members are Aeromexico Cargo,Air France Cargo, Alitalia Cargo, CSA Czech Airlines Cargo, KLM Cargo and Korean Air Cargo. SkyTeam Cargo offers a globalnetwork spanning six continents, provides customers a consistent international product line and permits its members to improve theirefficiency and effectiveness in the marketplace.
Delta TechOps, Delta Global Services, MLT Vacations and Delta Private Jets
We have several other businesses arising from our airline operations, including aircraft maintenance, repair and overhaul (“MRO”),staffing services for third parties, vacation wholesale operations and our private jet operations. Our MRO operation, known as DeltaTechOps, is the largest airline MRO in North America. In addition to providing maintenance and engineering support for our fleet ofapproximately 775 aircraft, Delta TechOps serves more than 150 aviation and airline customers from around the world. Delta TechOpsemploys approximately 9,600 maintenance professionals and is one of the most experienced MRO providers in the world. Our staffingservices business, Delta Global Services, provides staffing services, professional security, training services and aviation solutions toapproximately 150 customers. Our vacation wholesale business, MLT Vacations, is one of the largest providers of vacation packages inthe United States. Our private jet operations, Delta Private Jets, provides aircraft charters, aircraft management and programs allowingmembers to purchase flight time by the hour. In 2011, the total revenue from these businesses was approximately $900 million.
4
Copyright © 2013 www.secdatabase.com. All Rights Reserved.Please Consider the Environment Before Printing This Document
Distribution and Expanded Product Offerings
Our tickets are sold through various distribution channels including telephone reservations, delta.com, global distribution systemsand online travel agencies. An increasing number of our tickets are sold through delta.com, which reduces our distribution costs andgives us closer contact with our customers. We expect to launch a new delta.com platform in 2012, which we expect will result inadditional purchases of tickets through that channel.
We are transforming distribution from a commodity approach to a differentiated and merchandised approach. We expect that themerchandising initiatives we are implementing, primarily through delta.com, will generate additional revenue opportunities for us andwill improve the experience of our customers. Our plan is to provide our customers with opportunities to purchase what they value, suchas first class upgrades, economy comfort seating, WiFi access and SkyClub passes. We also expect to benefit from increased traffic ondelta.com through a combination of advertising revenue and sales of third party merchandise and services such as car rentals, hotels, andtrip insurance.
Fuel
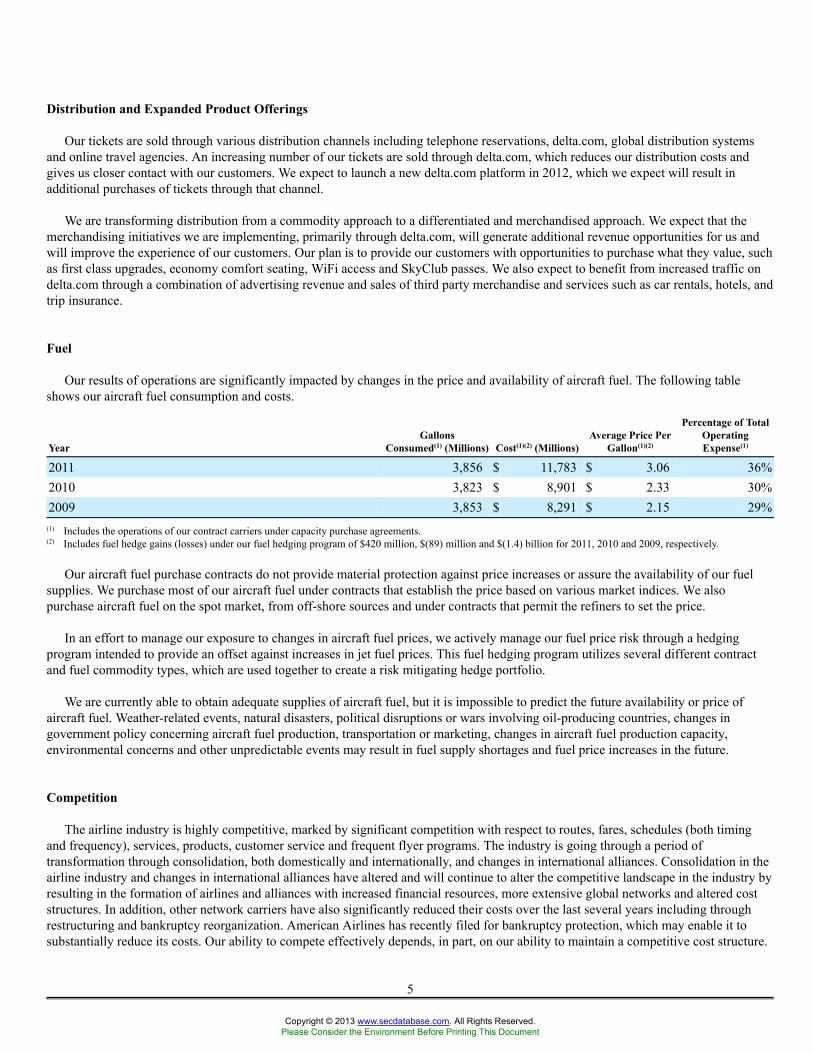
Our results of operations are significantly impacted by changes in the price and availability of aircraft fuel. The following tableshows our aircraft fuel consumption and costs.
YearGallons
Consumed(1) (Millions) Cost(1)(2) (Millions)Average Price Per
Gallon(1)(2)
Percentage of TotalOperatingExpense(1)
2011 3,856 $ 11,783 $ 3.06 36%2010 3,823 $ 8,901 $ 2.33 30%2009 3,853 $ 8,291 $ 2.15 29%
(1) Includes the operations of our contract carriers under capacity purchase agreements.(2) Includes fuel hedge gains (losses) under our fuel hedging program of $420 million, $(89) million and $(1.4) billion for 2011, 2010 and 2009, respectively.
Our aircraft fuel purchase contracts do not provide material protection against price increases or assure the availability of our fuelsupplies. We purchase most of our aircraft fuel under contracts that establish the price based on various market indices. We alsopurchase aircraft fuel on the spot market, from off-shore sources and under contracts that permit the refiners to set the price.
In an effort to manage our exposure to changes in aircraft fuel prices, we actively manage our fuel price risk through a hedgingprogram intended to provide an offset against increases in jet fuel prices. This fuel hedging program utilizes several different contractand fuel commodity types, which are used together to create a risk mitigating hedge portfolio.
We are currently able to obtain adequate supplies of aircraft fuel, but it is impossible to predict the future availability or price ofaircraft fuel. Weather-related events, natural disasters, political disruptions or wars involving oil-producing countries, changes ingovernment policy concerning aircraft fuel production, transportation or marketing, changes in aircraft fuel production capacity,environmental concerns and other unpredictable events may result in fuel supply shortages and fuel price increases in the future.
Competition
The airline industry is highly competitive, marked by significant competition with respect to routes, fares, schedules (both timingand frequency), services, products, customer service and frequent flyer programs. The industry is going through a period oftransformation through consolidation, both domestically and internationally, and changes in international alliances. Consolidation in theairline industry and changes in international alliances have altered and will continue to alter the competitive landscape in the industry byresulting in the formation of airlines and alliances with increased financial resources, more extensive global networks and altered coststructures. In addition, other network carriers have also significantly reduced their costs over the last several years including throughrestructuring and bankruptcy reorganization. American Airlines has recently filed for bankruptcy protection, which may enable it tosubstantially reduce its costs. Our ability to compete effectively depends, in part, on our ability to maintain a competitive cost structure.
5
Copyright © 2013 www.secdatabase.com. All Rights Reserved.Please Consider the Environment Before Printing This Document
Domestic
Our domestic operations are subject to competition from both traditional network and discount carriers, some of which may havelower costs than we do and provide service at low fares to destinations served by us. In particular, we face significant competition at ourdomestic hub airports in Atlanta, Cincinnati, Detroit, Memphis, Minneapolis-St. Paul, New York-JFK and Salt Lake City either directlyat those airports or at the hubs of other airlines that are located in close proximity to our hubs. We also face competition in smaller tomedium-sized markets from regional jet operators.
International
Our international operations are subject to competition from both domestic and foreign carriers. Through alliance and othermarketing and codesharing agreements with foreign carriers, U.S. carriers have increased their ability to sell international transportation,such as services to and beyond traditional European and Asian gateway cities. Similarly, foreign carriers have obtained increased accessto interior U.S. passenger traffic beyond traditional U.S. gateway cities through these relationships. In particular, alliances formed bydomestic and foreign carriers, including SkyTeam, the Star Alliance (among United Air Lines, Continental Airlines, Lufthansa GermanAirlines, Air Canada and others) and the oneworld alliance (among American Airlines, British Airways, Qantas and others) havesignificantly increased competition in international markets. The adoption of liberalized Open Skies Aviation Agreements with anincreasing number of countries around the world, including in particular the Open Skies Treaties that the U.S. has with the MemberStates of the European Union and Japan, could significantly increase competition among carriers serving those markets.
Several joint ventures among U.S. and foreign carriers, including our transatlantic joint venture with Air France-KLM and Alitalia,have received grants of antitrust immunity allowing the participating carriers to coordinate schedules, pricing, sales and inventory. Otherjoint ventures that have received anti-trust immunity include a transatlantic alliance among United, Continental, Air Canada andLufthansa, a transpacific joint venture among United, Continental and All Nippon Airways, a transatlantic joint venture amongAmerican, British Airways and Iberia, and a transpacific joint venture between American and Japan Air Lines.
Regulatory Matters
The Department of Transportation (“DOT”) and the Federal Aviation Administration (the “FAA”) exercise regulatory authority overair transportation in the U.S. The DOT has authority to issue certificates of public convenience and necessity required for airlines toprovide domestic air transportation. An air carrier that the DOT finds fit to operate is given authority to operate domestic andinternational air transportation (including the carriage of passengers and cargo). Except for constraints imposed by regulations regarding“Essential Air Services,” which are applicable to certain small communities, airlines may terminate service to a city without restriction.
The DOT has jurisdiction over certain economic and consumer protection matters, such as unfair or deceptive practices and methodsof competition, advertising, denied boarding compensation, baggage liability and disabled passenger transportation. The DOT also hasauthority to review certain joint venture agreements between major carriers and engages in regulation of economic matters such as slottransactions. The FAA has primary responsibility for matters relating to the safety of air carrier flight operations, including airlineoperating certificates, control of navigable air space, flight personnel, aircraft certification and maintenance and other matters affectingair safety.
Authority to operate international routes and international codesharing arrangements is regulated by the DOT and by thegovernments of the foreign countries involved. International certificate authorities are also subject to the approval of the U.S. Presidentfor conformance with national defense and foreign policy objectives.
The Transportation Security Administration and the U.S. Customs and Border Protection, each a division of the Department ofHomeland Security, are responsible for certain civil aviation security matters, including passenger and baggage screening at U.S.airports and international passenger prescreening prior to entry into or departure from the U.S.
Airlines are also subject to various other federal, state, local and foreign laws and regulations. For example, the U.S. Department ofJustice has jurisdiction over airline competition matters. The U.S. Postal Service has authority over certain aspects of the transportationof mail. Labor relations in the airline industry, as discussed below, are generally governed by the Railway Labor Act. Environmentalmatters are regulated by various federal, state, local and foreign governmental entities. Privacy of passenger and employee data isregulated by domestic and foreign laws and regulations.
Copyright © 2013 www.secdatabase.com. All Rights Reserved.Please Consider the Environment Before Printing This Document

6
Copyright © 2013 www.secdatabase.com. All Rights Reserved.Please Consider the Environment Before Printing This Document
Fares and Rates
Airlines set ticket prices in all domestic and most international city pairs with minimal governmental regulation, and the industry ischaracterized by significant price competition. Certain international fares and rates are subject to the jurisdiction of the DOT and thegovernments of the foreign countries involved. Many of our tickets are sold by travel agents, and fares are subject to commissions,overrides and discounts paid to travel agents, brokers and wholesalers.
Route Authority
Our flight operations are authorized by certificates of public convenience and necessity and also by exemptions and limited-entryfrequency awards issued by the DOT. The requisite approvals of other governments for international operations are controlled bybilateral agreements (and a multilateral agreement in the case of the U.S. and the European Union) with, or permits or approvals issuedby, foreign countries. Because international air transportation is governed by bilateral or other agreements between the U.S. and theforeign country or countries involved, changes in U.S. or foreign government aviation policies could result in the alteration ortermination of such agreements, diminish the value of our international route authorities or otherwise affect our international operations.Bilateral agreements between the U.S. and various foreign countries served by us are subject to renegotiation from time to time. TheU.S. government has negotiated “open skies” agreements with many countries, which allow unrestricted access between the U.S. andthe foreign markets. These agreements include separate agreements with the European Union and Japan.
Certain of our international route authorities are subject to periodic renewal requirements. We request extension of these authoritieswhen and as appropriate. While the DOT usually renews temporary authorities on routes where the authorized carrier is providing areasonable level of service, there is no assurance this practice will continue in general or with respect to a specific renewal. Dormantroute authorities may not be renewed in some cases, especially where another U.S. carrier indicates a willingness to provide service.
Airport Access
Operations at four major domestic airports and certain foreign airports served by us are regulated by governmental entities throughallocations of “slots” or similar regulatory mechanisms which limit the rights of carriers to conduct operations at those airports. Eachslot represents the authorization to land at or take off from the particular airport during a specified time period.
In the U.S., the FAA currently regulates the allocation of slots, slot exemptions, operating authorizations, or similar capacityallocation mechanisms at Reagan National in Washington, D.C. and LaGuardia, John F. Kennedy International Airport (“JFK”) andNewark in the New York City area. Our operations at these airports generally require the allocation of slots or analogous regulatoryauthorizations. Similarly, our operations at Tokyo's Narita and Haneda Airports, London's Gatwick and Heathrow airports and otherinternational airports are regulated by local slot coordinators pursuant to the International Air Transport Association's WorldwideScheduling Guidelines and applicable local law. We currently have sufficient slots or analogous authorizations to operate our existingflights, and we have generally been able to obtain the rights to expand our operations and to change our schedules. There is noassurance, however, that we will be able to do so in the future because, among other reasons, such allocations are subject to changes ingovernmental policies.
Environmental Matters
Emissions. The U.S. Environmental Protection Agency (the “EPA”) is authorized to regulate aircraft emissions and has historicallyimplemented emissions control standards previously adopted by the International Civil Aviation Organization (“ICAO”). Our aircraftcomply with existing EPA standards as applicable by engine design date. The ICAO has adopted two additional aircraft engineemissions standards, the first of which is applicable to engines certified after December 31, 2007, and the second of which is applicableto engines certified after December 31, 2013. On July 6, 2011, the EPA issued a Notice of Proposed Rulemaking that proposes to adoptthese two ICAO aircraft engine emissions standards, but the EPA has not yet issued the final regulation.
7
Copyright © 2013 www.secdatabase.com. All Rights Reserved.Please Consider the Environment Before Printing This Document
Concern about aviation environmental issues, including climate change and greenhouse gases, has led to taxes on our operations inthe United Kingdom and in Germany, both of which have levied taxes directly on our customers. We may face additional regulation ofaircraft emissions in the United States and abroad and become subject to further taxes, charges or additional requirements to obtainpermits or purchase allowances or emission credits for greenhouse gas emissions in various jurisdictions. This could result in taxation orpermitting requirements from multiple jurisdictions for the same operations. Ongoing bilateral discussions between the United Statesand other nations as well as discussions at the ICAO Assembly and Conference of the Parties, most recently in Durbin in December2011, may lead to international treaties or other actions focusing on reducing greenhouse gas emissions from aviation.
The European Union has required its member states to implement regulations including aviation in its Emissions Trading Scheme(“ETS”). Under these regulations, any airline with flights originating or landing in the European Union are subject to the ETS and,beginning in 2012, are required to purchase emissions allowances if the airline exceeds the number of free allowances allocated to itunder the ETS. We expect that this system will impose significant costs on our operations in the European Union. Numerous countries,including the U.S., and airline groups continue to oppose the European Union ETS.
Cap and trade restrictions have also been proposed in the United States. In addition, other legislative or regulatory action, includingby the EPA, to regulate greenhouse gas emissions is possible. In particular, the EPA has found that greenhouse gases threaten the publichealth and welfare, which could result in regulation of greenhouse gas emissions from aircraft. In the event that legislation or regulationis enacted in the U.S. or in the event similar legislation or regulation is enacted in jurisdictions other than the European Union where weoperate or where we may operate in the future, it could result in significant costs for us and the airline industry. In addition to directcosts, such regulation may have a greater effect on the airline industry through increases in fuel costs that could result from fuelsuppliers passing on increased costs that they incur under such a system. We are monitoring and evaluating the potential impact of suchlegislative and regulatory developments.
We seek to minimize the impact of carbon emissions from our operations through reductions in our fuel consumption and otherefforts. We have reduced the fuel needs of our aircraft fleet through the retirement and replacement of certain elements of our fleet andwith newer, more fuel efficient aircraft. In addition, we have implemented fuel saving procedures in our flight and ground supportoperations that further reduce carbon emissions. We are also supporting efforts to develop alternative fuels and efforts to modernize theair traffic control system in the U.S., as part of our efforts to reduce our emissions and minimize our impact on the environment.
Noise. The Airport Noise and Capacity Act of 1990 recognizes the rights of operators of airports with noise problems to implementlocal noise abatement programs so long as such programs do not interfere unreasonably with interstate or foreign commerce or thenational air transportation system. This statute generally provides that local noise restrictions on Stage 3 aircraft first effective afterOctober 1, 1990, require FAA approval. While we have had sufficient scheduling flexibility to accommodate local noise restrictions inthe past, our operations could be adversely impacted if locally-imposed regulations become more restrictive or widespread.
Other Environmental Matters. We have been identified by the EPA as a potentially responsible party (a “PRP”) with respect tocertain Superfund Sites, and entered into consent decrees or settlements regarding some of these sites. Our alleged disposal volume ateach of these sites was small or was considered de minimis when compared to the total contributions of all PRPs at each site. We areaware of soil and/or ground water contamination present on our current or former leaseholds at several domestic airports. To addressthis contamination, we have a program in place to investigate and, if appropriate, remediate these sites. Although the ultimate outcomeof these matters cannot be predicted with certainty, we believe that the resolution of these matters will not have a material adverse effecton our consolidated financial statements.
We are also subject to various other federal, state and local laws governing environmental matters, including the management anddisposal of chemicals, waste and hazardous materials, protection of surface and subsurface waters, and regulation of air emissions andaircraft drinking water.
Civil Reserve Air Fleet Program
We participate in the Civil Reserve Air Fleet program (the “CRAF Program”), which permits the U.S. military to use the aircraft andcrew resources of participating U.S. airlines during airlift emergencies, national emergencies or times of war. We have agreed to makeavailable under the CRAF Program a portion of our international long-range aircraft during the contract period ending September 30,2012. We have also committed aircraft to international short-range requirements. The CRAF Program has only been activated twicesince it was created in 1951.
8
Copyright © 2013 www.secdatabase.com. All Rights Reserved.Please Consider the Environment Before Printing This Document
Employee Matters
Railway Labor Act
Our relations with labor unions in the U.S. are governed by the Railway Labor Act. Under the Railway Labor Act, a labor unionseeking to represent an unrepresented craft or class of employees is required to file with the National Mediation Board (the “NMB”) anapplication alleging a representation dispute, along with authorization cards signed by at least 35% of the employees in that craft orclass. The NMB then investigates the dispute and, if it finds the labor union has obtained a sufficient number of authorization cards,conducts an election to determine whether to certify the labor union as the collective bargaining representative of that craft or class. Alabor union will be certified as the representative of the employees in a craft or class if more than 50% of votes cast are for that union. Acertified labor union would commence negotiations toward a collective bargaining agreement with the employer.
Under the Railway Labor Act, a collective bargaining agreement between an airline and a labor union does not expire, but insteadbecomes amendable as of a stated date. Either party may request that the NMB appoint a federal mediator to participate in thenegotiations for a new or amended agreement. If no agreement is reached in mediation, the NMB may determine, at any time, that animpasse exists and offer binding arbitration. If either party rejects binding arbitration, a 30-day “cooling off” period begins. At the endof this 30-day period, the parties may engage in “self help,” unless the U.S. President appoints a Presidential Emergency Board (“PEB”)to investigate and report on the dispute. The appointment of a PEB maintains the “status quo” for an additional 60 days. If the parties donot reach agreement during this period, the parties may then engage in “self help.” “Self help” includes, among other things, a strike bythe union or the imposition of proposed changes to the collective bargaining agreement by the airline. Congress and the President havethe authority to prevent “self help” by enacting legislation that, among other things, imposes a settlement on the parties.
Collective Bargaining
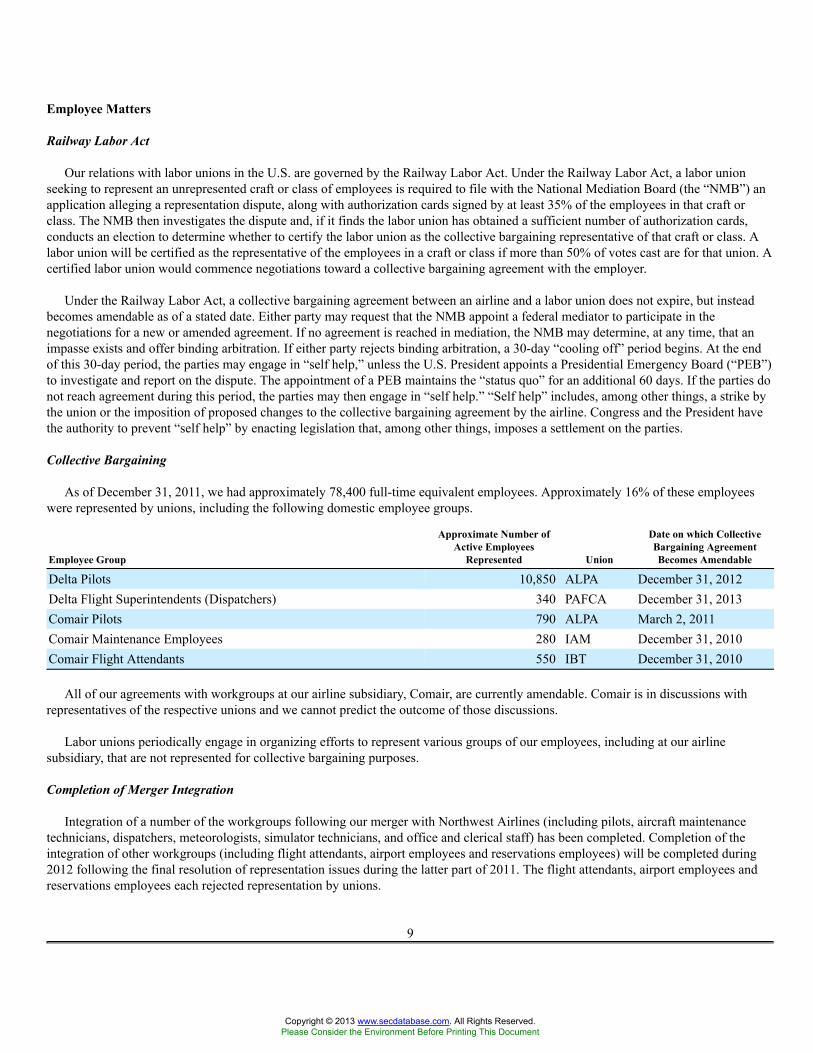
As of December 31, 2011, we had approximately 78,400 full-time equivalent employees. Approximately 16% of these employeeswere represented by unions, including the following domestic employee groups.
Employee Group
Approximate Number ofActive Employees
Represented Union
Date on which CollectiveBargaining AgreementBecomes Amendable
Delta Pilots 10,850 ALPA December 31, 2012Delta Flight Superintendents (Dispatchers) 340 PAFCA December 31, 2013Comair Pilots 790 ALPA March 2, 2011Comair Maintenance Employees 280 IAM December 31, 2010Comair Flight Attendants 550 IBT December 31, 2010
All of our agreements with workgroups at our airline subsidiary, Comair, are currently amendable. Comair is in discussions withrepresentatives of the respective unions and we cannot predict the outcome of those discussions.
Labor unions periodically engage in organizing efforts to represent various groups of our employees, including at our airlinesubsidiary, that are not represented for collective bargaining purposes.
Completion of Merger Integration
Integration of a number of the workgroups following our merger with Northwest Airlines (including pilots, aircraft maintenancetechnicians, dispatchers, meteorologists, simulator technicians, and office and clerical staff) has been completed. Completion of theintegration of other workgroups (including flight attendants, airport employees and reservations employees) will be completed during2012 following the final resolution of representation issues during the latter part of 2011. The flight attendants, airport employees andreservations employees each rejected representation by unions.
9
Copyright © 2013 www.secdatabase.com. All Rights Reserved.Please Consider the Environment Before Printing This Document
Executive Officers of the Registrant
Richard H. Anderson, Age 56: Chief Executive Officer of Delta since September 1, 2007; Executive Vice President of UnitedHealthGroup and President of its Commercial Services Group (December 2006-August 2007); Executive Vice President of UnitedHealthGroup (November 2004-December 2006); Chief Executive Officer of Northwest Airlines Corporation (“Northwest”) (2001-November2004).
Edward H. Bastian, Age 54: President of Delta since September 1, 2007; President of Delta and Chief Executive Officer NorthwestAirlines, Inc. (October 2008-December 2009); President and Chief Financial Officer of Delta (September 2007-October 2008);Executive Vice President and Chief Financial Officer of Delta (July 2005-September 2007); Chief Financial Officer, Acuity Brands(June 2005-July 2005); Senior Vice President-Finance and Controller of Delta (2000-April 2005); Vice President and Controller ofDelta (1998-2000).
Michael H. Campbell, Age 63: Executive Vice President-HR & Labor Relations of Delta since October 2008; Executive VicePresident-HR, Labor & Communications of Delta (December 2007-October 2008); Executive Vice President-Human Resources andLabor Relations of Delta (July 2006-December 2007); Of Counsel, Ford & Harrison (January 2005-July 2006); Senior Vice President-Human Resources and Labor Relations, Continental Airlines, Inc. (1997-2004); Partner, Ford & Harrison (1978-1996).
Stephen E. Gorman, Age 56: Executive Vice President and Chief Operating Officer of Delta since October 2008; Executive VicePresident-Operations of Delta (December 2007-October 2008); President and Chief Executive Officer of Greyhound Lines, Inc. (June2003-October 2007); President, North America and Executive Vice President Operations Support at Krispy Kreme Doughnuts, Inc.(August 2001-June 2003); Executive Vice President, Technical Operations and Flight Operations of Northwest (February 2001-August2001), Senior Vice President, Technical Operations of Northwest (January 1999-February 2001), and Vice President, EngineMaintenance Operations of Northwest (April 1996-January 1999).
Glen W. Hauenstein, Age 51: Executive Vice President-Network Planning and Revenue Management of Delta since April 2006;Executive Vice President and Chief of Network and Revenue Management of Delta (August 2005-April 2006); Vice General Director-Chief Commercial Officer and Chief Operating Officer of Alitalia (2003-2005); Senior Vice President-Network of Continental Airlines(2003); Senior Vice President-Scheduling of Continental Airlines (2001- 2003); Vice President Scheduling of Continental Airlines(1998-2001).
Hank Halter, Age 46: Senior Vice President and Chief Financial Officer of Delta since October 2008; Senior Vice President-Financeand Controller of Delta (May 2005-October 2008); Vice President-Controller of Delta (March 2005-May 2005); Vice President-Assistant Controller of Delta (January 2002-March 2005); and Vice President-Finance-Operations of Delta (February 2000-December2001); various finance leadership positions at Delta and American Airlines, Inc. (June 1993-February 2000).
Richard B. Hirst, Age 67: Senior Vice President and General Counsel of Delta since October 2008; Senior Vice President-CorporateAffairs and General Counsel of Northwest (March 2008- October 2008); Executive Vice President and Chief Legal Officer of KB Home(March 2004-November 2006); Executive Vice President and General Counsel of Burger King Corporation (March 2001-June 2003);General Counsel of the Minnesota Twins (1999-2000); Senior Vice President-Corporate Affairs of Northwest (1994-1999); Senior VicePresident-General Counsel of Northwest (1990-1994); Vice President-General Counsel and Secretary of Continental Airlines(1986-1990).
Additional Information
We make available free of charge on our website our Annual Report on Form 10-K, our Quarterly Reports on Form 10-Q, ourCurrent Reports on Form 8-K and amendments to those reports as soon as reasonably practicable after these reports are filed with orfurnished to the Securities and Exchange Commission. Information on our website is not incorporated into this Form 10-K or our othersecurities filings and is not a part of those filings.
10
Copyright © 2013 www.secdatabase.com. All Rights Reserved.Please Consider the Environment Before Printing This Document
ITEM 1A. RISK FACTORS
Risk Factors Relating to Delta
Our business and results of operations are dependent on the price and availability of aircraft fuel. High fuel costs or costincreases could have a materially adverse effect on our operating results. Likewise, significant disruptions in the supply ofaircraft fuel would materially adversely affect our operations and operating results.
Our operating results are significantly impacted by changes in the price and availability of aircraft fuel. Fuel prices have increasedsubstantially since the middle part of the last decade and have been extremely volatile during the last several years. In 2011, our averagefuel price per gallon was $3.06, a 31% increase from an average fuel price of $2.33 in 2010. In 2010, our average fuel price per gallonwas $2.33, an 8% increase from an average fuel price of $2.15 in 2009. In 2008, our average fuel price per gallon was $3.16, a 41%increase from an average price of $2.24 in 2007, which in turn was significantly higher than fuel prices just a few years earlier. Fuelcosts represented 36%, 30% and 29% of our operating expense in 2011, 2010 and 2009, respectively. Volatility in fuel costs has had asignificant negative effect on our results of operations and financial condition.
Our ability to pass along the increased costs of fuel to our customers may be affected by the competitive nature of the airlineindustry. We often have not been able to increase our fares to offset fully the effect of increased fuel costs in the past and we may not beable to do so in the future. In addition, our aircraft fuel purchase contracts do not provide material protection against price increases orassure the availability of our fuel supplies. We purchase most of our aircraft fuel under contracts that establish the price based onvarious market indices. We also purchase aircraft fuel on the spot market, from offshore sources and under contracts that permit therefiners to set the price.
We are currently able to obtain adequate supplies of aircraft fuel, but it is impossible to predict the future availability or price ofaircraft fuel. Weather-related events, natural disasters, political disruptions or wars involving oil-producing countries, changes ingovernmental policy concerning aircraft fuel production, transportation or marketing, changes in aircraft fuel production capacity,environmental concerns and other unpredictable events may result in additional fuel supply shortages and fuel price increases in thefuture. Additional increases in fuel costs or disruptions in fuel supplies could have additional negative effects on us.
Our fuel hedging activities are intended to provide an offset against increases in jet fuel prices. Our obligation to post collateralin connection with our hedge contracts may have a substantial impact on our short-term liquidity.
We actively manage our fuel price risk through a hedging program intended to provide an offset against increases in jet fuel prices.This fuel hedging program utilizes several different contract and commodity types, which are used together to create a risk mitigatinghedge portfolio. The economic effectiveness of this hedge portfolio is frequently tested against our financial targets. The hedge portfoliois rebalanced from time to time according to market conditions, which may result in locking in gains or losses on hedge contracts priorto their settlement dates and may have a negative impact on our financial results.
Our fuel hedge contracts contain margin funding requirements, which are driven by changes in price of the underlying commodityand the contracts used. The margin funding requirements may cause us to post margin to counterparties or may cause counterparties topost margin to us as market prices in the underlying hedged items change. If fuel prices decrease significantly from the levels existing atthe time we enter into fuel hedge contracts, we may be required to post a significant amount of margin, which could have a materialadverse impact on the level of our unrestricted cash and cash equivalents and short-term investments.
Our funding obligations with respect to defined benefit pension plans we sponsor is significant and can vary materially becauseof changes in investment asset returns and values.
As of December 31, 2011, our defined benefit pension plans had an estimated benefit obligation of approximately $19.3 billion andwere funded through assets with a value of approximately $7.8 billion. The benefit obligation is significantly affected by investmentasset returns and changes in interest rates, neither of which is in the control of Delta. We estimate that our funding requirement for ourdefined benefit pension plans, which are governed by ERISA and have been frozen for future accruals, is approximately $700 million in2012. Estimates of pension plan funding requirements can vary materially from actual funding requirements because the estimates arebased on various assumptions concerning factors outside our control, including, among other things, the market performance of assets;statutory requirements; and demographic data for participants, including the number of participants and the rate of participant attrition.Results that vary significantly from our assumptions could have a material impact on our future funding obligations.
Copyright © 2013 www.secdatabase.com. All Rights Reserved.Please Consider the Environment Before Printing This Document

11
Copyright © 2013 www.secdatabase.com. All Rights Reserved.Please Consider the Environment Before Printing This Document
Our substantial indebtedness may limit our financial and operating activities and may adversely affect our ability to incuradditional debt to fund future needs.
We have substantial indebtedness, which could:
• make us more vulnerable to economic downturns, adverse industry conditions or catastrophic external events;
• limit our ability to borrow additional money for working capital, restructurings, capital expenditures, research and development,investments, acquisitions or other purposes, if needed, and increasing the cost of any of these borrowings;
• limit our ability to withstand competitive pressures; and/or
• limit our flexibility in responding to changing business and economic conditions, including increased competition and demandfor new services, placing us at a disadvantage when compared to our competitors that have less debt, and making us morevulnerable than our competitors who have less debt to a downturn in our business, industry or the economy in general.
In addition, a substantial level of indebtedness, particularly because a significant portion of our assets are currently subject to liens,could limit our ability to obtain additional financing on acceptable terms or at all for working capital, capital expenditures and generalcorporate purposes. We have historically had substantial liquidity needs in the operation of our business. These liquidity needs couldvary significantly and may be affected by general economic conditions, industry trends, performance and many other factors not withinour control.
Agreements governing our debt, including credit agreements and indentures, include financial and other covenants that imposerestrictions on our financial and business operations.
Our credit facilities and indentures for secured notes have various financial and other covenants that require us to maintain,depending on the particular agreement, minimum fixed charge coverage ratios, minimum liquidity and/or minimum collateral coverageratios. The value of the collateral that has been pledged in each facility may change over time, which may be reflected in appraisals ofcollateral required by our credit agreements and indentures. These changes could result from factors that are not under our control. Adecline in the value of collateral could result in a situation where we may not be able to maintain the collateral coverage ratio. Inaddition, the credit facilities and indentures contain other negative covenants customary for such financings. If we fail to comply withthese covenants and are unable to obtain a waiver or amendment, an event of default would result. These covenants are subject toimportant exceptions and qualifications.
The credit facilities and indentures also contain other events of default customary for such financings. If an event of default were tooccur, the lenders or the trustee could, among other things, declare outstanding amounts due and payable, and our cash may becomerestricted. We cannot provide assurance that we would have sufficient liquidity to repay or refinance the borrowings or notes under anyof the credit facilities if such amounts were accelerated upon an event of default. In addition, an event of default or declaration ofacceleration under any of the credit facilities or the indentures could also result in an event of default under other of our financingagreements.
Employee strikes and other labor-related disruptions may adversely affect our operations.
Our business is labor intensive, utilizing large numbers of pilots, flight attendants, aircraft maintenance technicians, ground supportpersonnel and other personnel. As of December 31, 2011, approximately 16% of our workforce was unionized. Relations between aircarriers and labor unions in the United States are governed by the Railway Labor Act, which provides that a collective bargainingagreement between an airline and a labor union does not expire, but instead becomes amendable as of a stated date. The Railway LaborAct generally prohibits strikes or other types of self-help actions both before and after a collective bargaining agreement becomesamendable, unless and until the collective bargaining processes required by the Railway Labor Act have been exhausted. Our agreementwith our pilots becomes amendable in December 2012. All of our agreements with workgroups at our airline subsidiary, Comair, arecurrently amendable. Comair is in discussions with representatives of the respective unions and we cannot predict the outcome of thosediscussions.
12
Copyright © 2013 www.secdatabase.com. All Rights Reserved.Please Consider the Environment Before Printing This Document
If we or our affiliates are unable to reach agreement with any of our unionized work groups on future negotiations regarding theterms of their collective bargaining agreements or if additional segments of our workforce become unionized, we may be subject towork interruptions or stoppages, subject to the requirements of the Railway Labor Act. Strikes or labor disputes with our unionizedemployees may adversely affect our ability to conduct business. Likewise, if third party regional carriers with whom we have contractcarrier agreements are unable to reach agreement with their unionized work groups on current or future negotiations regarding the termsof their collective bargaining agreements, those carriers may be subject to work interruptions or stoppages, subject to the requirementsof the Railway Labor Act, which could have a negative impact on our operations.
Extended interruptions or disruptions in service at one of our hub airports could have a material adverse impact on ouroperations.
Our business is heavily dependent on our operations at the Atlanta airport and at our other hub airports in Amsterdam, Cincinnati,Detroit, Memphis, Minneapolis-St. Paul, New York-JFK, Paris-Charles de Gaulle, Salt Lake City and Tokyo-Narita. Each of these huboperations includes flights that gather and distribute traffic from markets in the geographic region surrounding the hub to other majorcities and to other Delta hubs. A significant interruption or disruption in service at one of our hubs could have a serious impact on ourbusiness, financial condition and results of operations.
We are increasingly dependent on technology in our operations, and if our technology fails or we are unable to continue to investin new technology, our business may be adversely affected.
We have become increasingly dependent on technology initiatives to reduce costs and to enhance customer service in order tocompete in the current business environment. For example, we have made and continue to make significant investments in delta.com,check-in kiosks and related initiatives. The performance and reliability of the technology are critical to our ability to attract and retaincustomers and our ability to compete effectively. Because of the rapid pace of new developments, these initiatives will continue torequire significant capital investments in our technology infrastructure. If we are unable to make these investments, our business andoperations could be negatively affected. If we are unable to manage these challenges effectively, our business and results of operationscould be negatively affected.
In addition, any internal technology error or failure impacting systems hosted internally at our data centers or externally at third partylocations or large scale external interruption in technology infrastructure we depend on, such as power, telecommunications or theinternet, may disrupt our technology network. Any individual, sustained or repeated failure of technology could impact our customerservice and result in increased costs. Our technology systems and related data may also be vulnerable to a variety of sources ofinterruption due to events beyond our control, including natural disasters, terrorist attacks, telecommunications failures, computerviruses, hackers and other security issues. While we have in place, and continue to invest in, technology security initiatives and disasterrecovery plans, these measures may not be adequate or implemented properly to prevent a business disruption and its adverse financialand reputational consequences to our business.
Our primary credit card processors have the ability to take significant holdbacks in certain circumstances. The initiation of suchholdbacks likely would have a material adverse effect on our liquidity.
Most of the tickets we sell are paid for by customers who use credit cards. Our primary credit card processing agreements providethat no holdback of receivables or reserve is required except in certain circumstances, including if we do not maintain a required level ofunrestricted cash. If circumstances were to occur that would allow American Express or our VISA/MasterCard processor to initiate aholdback, the negative impact on our liquidity likely would be material.
We are at risk of losses and adverse publicity stemming from any accident involving our aircraft.
An aircraft crash or other accident could expose us to significant tort liability. In the event that the insurance that we carry to coverdamages arising from future accidents is not adequate, we may be forced to bear substantial losses from an accident. In addition, anyaccident involving an aircraft that we operate or an aircraft that is operated by an airline that is one of our regional carriers or codesharepartners could create a public perception that our aircraft are not safe or reliable, which could harm our reputation, result in air travelersbeing reluctant to fly on our aircraft and harm our business.
13
Copyright © 2013 www.secdatabase.com. All Rights Reserved.Please Consider the Environment Before Printing This Document
Our business is subject to the effects of weather and natural disasters and seasonality, which can cause our results to fluctuate.
Our results of operations will reflect fluctuations from weather, natural disasters and seasonality. Severe weather conditions andnatural disasters can significantly disrupt service and create air traffic control problems. These events decrease revenue and can alsoincrease costs. In addition, increases in frequency, severity or duration of thunderstorms, hurricanes, typhoons or other severe weatherevents, including from changes in the global climate, could result in increases in fuel consumption to avoid such weather, turbulence-related injuries, delays and cancellations, any of which would increase the potential for greater loss of revenue and higher costs. Inaddition, demand for air travel is typically higher in the June and September quarters, particularly in international markets, becausethere is more vacation travel during these periods than during the remainder of the year. Because of fluctuations in our results fromweather, natural disasters and seasonality, operating results for a historical period are not necessarily indicative of operating results for afuture period and operating results for an interim period are not necessarily indicative of operating results for an entire year.
An extended disruption in services provided by our third party regional carriers could have a material adverse effect on ourresults of operations.
We utilize the services of third party providers in a number of areas in support of our operations that are integral to our business,including third party carriers in the Delta Connection program. While we have agreements with these providers that define expectedservice performance, we do not have direct control over the operations of these carriers. To the extent that a significant disruption in ourregional operations occurs because any of these providers are unable to perform their obligations over an extended period of time, ourrevenue may be reduced or our expenses may be increased resulting in a material adverse effect on our results of operations.
If we experience losses of senior management personnel and other key employees, our operating results could be adverselyaffected.
We are dependent on the experience and industry knowledge of our officers and other key employees to execute our business plans.If we experience a substantial turnover in our leadership and other key employees, our performance could be materially adverselyimpacted. Furthermore, we may be unable to attract and retain additional qualified executives as needed in the future.
Our ability to use net operating loss carryforwards to offset future taxable income for U.S. federal income tax purposes is subjectto limitation.
In general, under Section 382 of the Internal Revenue Code of 1986, as amended, a corporation that undergoes an “ownershipchange” is subject to limitations on its ability to utilize its pre-change net operating losses (“NOLs”), to offset future taxable income. Ingeneral, an ownership change occurs if the aggregate stock ownership of certain stockholders (generally 5% shareholders, applyingcertain look-through rules) increases by more than 50 percentage points over such stockholders' lowest percentage ownership during thetesting period (generally three years).
As of December 31, 2011, Delta reported a consolidated federal pretax NOL carryforward of approximately $16.8 billion. BothDelta and Northwest experienced an ownership change in 2007 as a result of their respective plans of reorganization under Chapter 11of the U.S. Bankruptcy Code. As a result of the merger, Northwest experienced a subsequent ownership change. Delta also experienceda subsequent ownership change on December 17, 2008 as a result of the merger, the issuance of equity to employees in connection withthe merger and other transactions involving the sale of our common stock within the testing period.
The Delta and Northwest ownership changes resulting from the merger could limit the ability to utilize pre-change NOLs that werenot subject to limitation, and could further limit the ability to utilize NOLs that were already subject to limitation. Limitations imposedon the ability to use NOLs to offset future taxable income could cause U.S. federal income taxes to be paid earlier than otherwise wouldbe paid if such limitations were not in effect and could cause such NOLs to expire unused, in each case reducing or eliminating thebenefit of such NOLs. Similar rules and limitations may apply for state income tax purposes. NOLs generated subsequent to December17, 2008 are not limited.
14
Copyright © 2013 www.secdatabase.com. All Rights Reserved.Please Consider the Environment Before Printing This Document
Risk Factors Relating to the Airline Industry
The airline industry is highly competitive and, if we cannot successfully compete in the marketplace, our business, financialcondition and operating results will be materially adversely affected.
The airline industry is highly competitive, marked by significant competition with respect to routes, fares, schedules (both timingand frequency), services, products, customer service and frequent flyer programs. Our domestic operations are subject to competitionfrom both traditional network and discount carriers, some of which may have lower costs than we do and provide service at low fares todestinations served by us. In particular, we face significant competition at our domestic hub airports in Atlanta, Cincinnati, Detroit,Memphis, Minneapolis-St. Paul, New York-JFK and Salt Lake City either directly at those airports or at the hubs of other airlines thatare located in close proximity to our hubs. We also face competition in smaller to medium-sized markets from regional jet operators.
Discount carriers, including Southwest, AirTran (now owned by Southwest) and JetBlue, have placed significant competitivepressure on us in the United States and on other network carriers in the domestic market. In addition, other network carriers have alsosignificantly reduced their costs over the last several years through restructuring and bankruptcy reorganization. American has recentlyfiled for bankruptcy protection, which may enable it to substantially reduce its costs. Our ability to compete effectively depends, in part,on our ability to maintain a competitive cost structure. If we cannot maintain our costs at a competitive level, then our business,financial condition and operating results could be materially adversely affected.
Our international operations are subject to competition from both domestic and foreign carriers. Through alliance and othermarketing and codesharing agreements with foreign carriers, U.S. carriers have increased their ability to sell international transportation,such as services to and beyond traditional European and Asian gateway cities. Similarly, foreign carriers have obtained increased accessto interior U.S. passenger traffic beyond traditional U.S. gateway cities through these relationships. In particular, alliances formed bydomestic and foreign carriers, including SkyTeam, the Star Alliance (among United Air Lines, Continental Airlines, Lufthansa GermanAirlines, Air Canada and others) and the oneworld alliance (among American Airlines, British Airways, Qantas and others) havesignificantly increased competition in international markets. The adoption of liberalized Open Skies Aviation Agreements with anincreasing number of countries around the world, including in particular the Open Skies Treaties that the U.S. has with the MemberStates of the European Union and Japan, could significantly increase competition among carriers serving those markets.
Several joint ventures among U.S. and foreign carriers, including our transatlantic joint venture with Air France-KLM and Alitalia,have received grants of antitrust immunity allowing the participating carriers to coordinate schedules, pricing, sales and inventory. Otherjoint ventures that have received anti-trust immunity include a transatlantic alliance among United, Continental, Air Canada andLufthansa, a transpacific joint venture among United, Continental and All Nippon Airways, a transatlantic joint venture amongAmerican, British Airways and Iberia, and a transpacific joint venture between American and Japan Air Lines.
Consolidation in the domestic airline industry and changes in international alliances have altered and will continue to alter thecompetitive landscape in the industry by resulting in the formation of airlines and alliances with increased financial resources, moreextensive global networks and altered cost structures.
The rapid spread of contagious illnesses can have a material adverse effect on our business and results of operations.
The rapid spread of a contagious illness can have a material adverse effect on the demand for worldwide air travel and therefore havea material adverse effect on our business and results of operations. Moreover, our operations could be negatively affected if employeesare quarantined as the result of exposure to a contagious illness. Similarly, travel restrictions or operational problems resulting from therapid spread of contagious illnesses in any part of the world in which we operate may have a materially adverse impact on our businessand results of operations.
15
Copyright © 2013 www.secdatabase.com. All Rights Reserved.Please Consider the Environment Before Printing This Document
Terrorist attacks or international hostilities may adversely affect our business, financial condition and operating results.
The terrorist attacks of September 11, 2001 caused fundamental and permanent changes in the airline industry, including substantialrevenue declines and cost increases, which resulted in industry-wide liquidity issues. Potential terrorist attacks or security breaches orfear of such events, even if not made directly on the airline industry, could negatively affect us and the airline industry. The potentialnegative effects include increased security (including as a result of our global operations), insurance and other costs and lost revenuefrom increased ticket refunds and decreased ticket sales. Our financial resources might not be sufficient to absorb the adverse effects ofany further terrorist attacks or other international hostilities involving the United States.
The airline industry is subject to extensive government regulation, and new regulations may increase our operating costs.
Airlines are subject to extensive regulatory and legal compliance requirements that result in significant costs. For instance, the FAAfrom time to time issues directives and other regulations relating to the maintenance and operation of aircraft that necessitate significantexpenditures. We expect to continue incurring expenses to comply with the FAA's regulations.
Other laws, regulations, taxes and airport rates and charges have also been imposed from time to time that significantly increase thecost of airline operations or reduce revenues. The industry is heavily taxed. For example, the Aviation and Transportation Security Actmandates the federalization of certain airport security procedures and imposes security requirements on airports and airlines, most ofwhich are funded by a per ticket tax on passengers and a tax on airlines. The federal government has on several occasions proposed asignificant increase in the per ticket tax and has recently proposed additional departure fees. A ticket tax increase or additional fees, ifimplemented, could negatively impact our results of operations.
Proposals to address congestion issues at certain airports or in certain airspace, particularly in the Northeast United States, haveincluded concepts such as “congestion-based” landing fees, “slot auctions” or other alternatives that could impose a significant cost onthe airlines operating in those airports or airspace and impact the ability of those airlines to respond to competitive actions by otherairlines. In contrast, the failure of the federal government to upgrade the U.S. air traffic control system has resulted in delays anddisruptions of air traffic during peak travel periods in certain congested markets. The failure to improve the air traffic control systemcould lead to increased delays and inefficiencies in flight operations as demand for U.S. air travel increases, having a material adverseeffect on our operations. Failure to update the air traffic control system in a timely manner, and the substantial funding requirements ofan updated system that may be imposed on air carriers, may have an adverse impact on our financial condition and results of operations.
Events related to extreme weather delays caused the DOT to promulgate regulations imposing potentially severe financial penaltiesupon airlines that have flights experiencing extended tarmac delays. These regulations could have a negative impact on our operationsin certain circumstances.
Future regulatory action concerning climate change and aircraft emissions could have a significant effect on the airline industry. Forexample, the European Commission has adopted an emissions trading scheme applicable to all flights operating in the European Union,including flights to and from the United States. We expect that this system will impose additional costs on our operations in theEuropean Union. Other laws or regulations such as this emissions trading scheme or other U.S. or foreign governmental actions mayadversely affect our operations and financial results, either through direct costs in our operations or through increases in costs for jet fuelthat could result from jet fuel suppliers passing on increased costs that they incur under such a system.
We and other U.S. carriers are subject to domestic and foreign laws regarding privacy of passenger and employee data that are notconsistent in all countries in which we operate. In addition to the heightened level of concern regarding privacy of passenger data in theUnited States, certain European government agencies are initiating inquiries into airline privacy practices. Compliance with theseregulatory regimes is expected to result in additional operating costs and could impact our operations and any future expansion. Inaddition, a security breach in which passenger or employee data is exposed could result in disruption to our operations, damage to ourreputation and significant costs.
16
Copyright © 2013 www.secdatabase.com. All Rights Reserved.Please Consider the Environment Before Printing This Document
Our insurance costs have increased substantially as a result of the September 11, 2001 terrorist attacks, and further increases ininsurance costs or reductions in coverage could have a material adverse impact on our business and operating results.
As a result of the terrorist attacks on September 11, 2001, aviation insurers significantly (1) reduced the maximum amount ofinsurance coverage available to commercial air carriers for liability to persons (other than employees or passengers) for claims resultingfrom acts of terrorism, war or similar events and (2) increased the premiums for such coverage and for aviation insurance in general.Since September 24, 2001, the U.S. government has been providing U.S. airlines with war-risk insurance to cover losses, includingthose resulting from terrorism, to passengers, third parties (ground damage) and the aircraft hull. The coverage currently extendsthrough September 30, 2012, and we expect the coverage to be further extended. The withdrawal of government support of airline war-risk insurance would require us to obtain war-risk insurance coverage commercially, if available. Such commercial insurance could havesubstantially less desirable coverage than that currently provided by the U.S. government, may not be adequate to protect our risk ofloss from future acts of terrorism, may result in a material increase to our operating expenses or may not be obtainable at all, resulting inan interruption to our operations.
ITEM 1B. UNRESOLVED STAFF COMMENTS
None.
17
Copyright © 2013 www.secdatabase.com. All Rights Reserved.Please Consider the Environment Before Printing This Document
ITEM 2. PROPERTIES
Flight Equipment
During 2011, we (1) entered into an agreement with Boeing to purchase 100 B-737-900ER aircraft; (2) purchased 12 previouslyowned MD-90 aircraft and one previously leased B-767-300 aircraft; and (3) leased six MD-90 aircraft and one B-757-200 aircraft.
Our active aircraft fleet, commitments, and options at December 31, 2011 are summarized in the following table:
Current Fleet(1)
Aircraft Type OwnedCapitalLease
OperatingLease Total
AverageAge Commitments(2) Options
B-737-700 10 — — 10 2.9 — —B-737-800 71 — — 71 10.9 — —B-737-900ER — — — — — 100 30B-747-400 4 8 3 15 18.5 — —B-757-200 84 37 33 154 18.7 — —B-757-300 16 — — 16 8.8 — —B-767-300 10 2 4 16 20.9 — —B-767-300ER 50 4 4 58 15.8 — 4B-767-400ER 21 — — 21 10.8 — 8B-777-200ER 8 — — 8 11.9 — —B-777-200LR 10 — — 10 2.7 — 14B-787-8 — — — — — 18 —A319-100 55 — 2 57 9.9 — —A320-200 41 — 28 69 16.8 — —A330-200 11 — — 11 6.8 — —A330-300 21 — — 21 6.4 — —MD-88 67 50 — 117 21.5 — —MD-90 28 1 — 29 15.1 9 7DC9-50 24 — — 24 33.8 — —CRJ-100 15 9 16 40 13.9 — —CRJ-700 15 — — 15 8.1 — —CRJ-900 13 — — 13 4.1 — —Embraer 175 — — — — — — 36Total 574 111 90 775 15.6 127 99
(1) Excludes certain aircraft we own or lease which are operated by third party contract carriers on our behalf shown in the table below.(2) Excludes our orders for five A319-100 aircraft and two A320-200 aircraft because we have the right to cancel these orders.
The following table summarizes the active aircraft fleet operated by third party contract carriers on our behalf at December 31, 2011:
Fleet Type
Carrier CRJ-200 CRJ-700 CRJ-900 ERJ-145 Embraer 170 Embraer 175 Total
ExpressJet Airlines, Inc.(1) 99 46 10 — — — 155Pinnacle 122 — 16 — — — 138SkyWest Airlines, Inc. 60 21 21 — — — 102Chautauqua Airlines, Inc. — — — 24 — — 24Compass — — — — 5 36 41
Copyright © 2013 www.secdatabase.com. All Rights Reserved.Please Consider the Environment Before Printing This Document
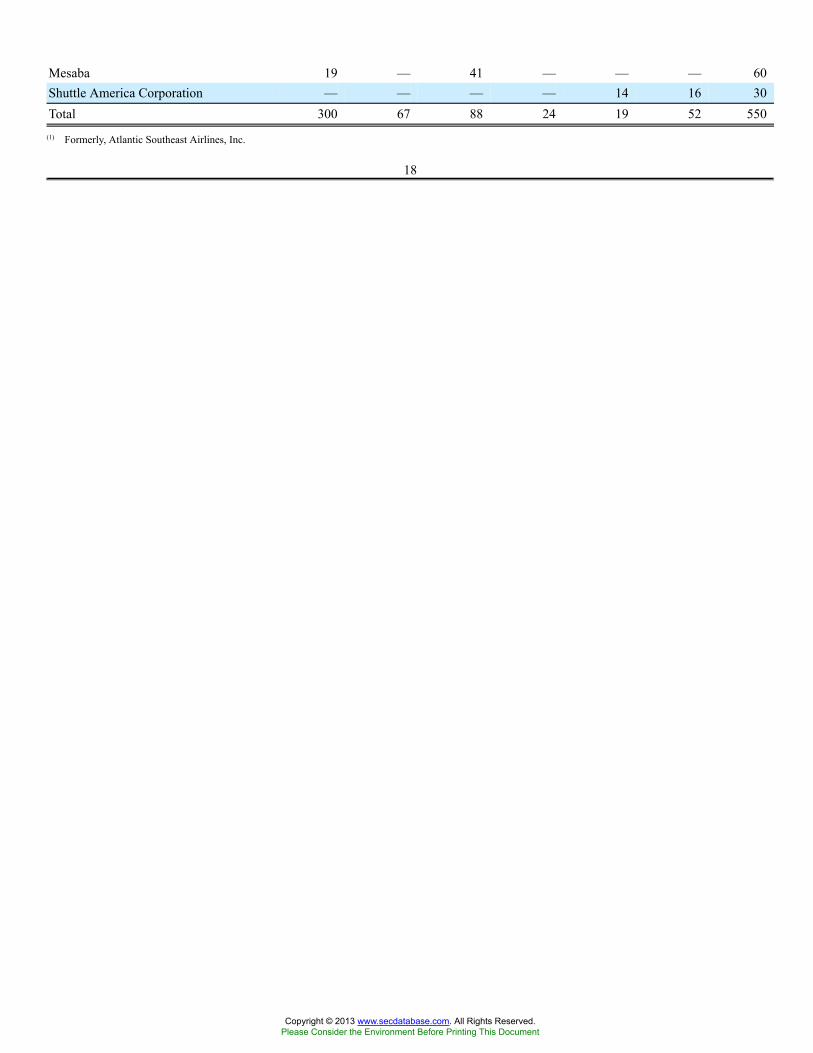
Mesaba 19 — 41 — — — 60Shuttle America Corporation — — — — 14 16 30Total 300 67 88 24 19 52 550
(1) Formerly, Atlantic Southeast Airlines, Inc.
18
Copyright © 2013 www.secdatabase.com. All Rights Reserved.Please Consider the Environment Before Printing This Document
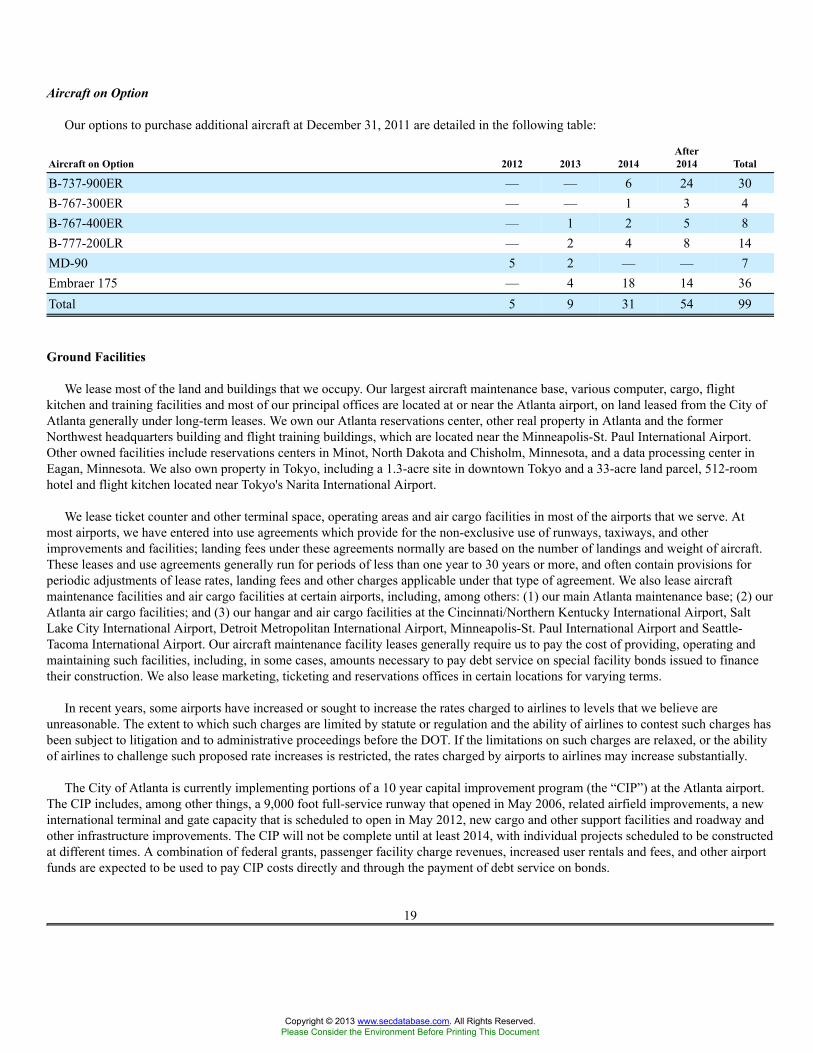
Aircraft on Option
Our options to purchase additional aircraft at December 31, 2011 are detailed in the following table:
Aircraft on Option 2012 2013 2014After2014 Total
B-737-900ER — — 6 24 30B-767-300ER — — 1 3 4B-767-400ER — 1 2 5 8B-777-200LR — 2 4 8 14MD-90 5 2 — — 7Embraer 175 — 4 18 14 36Total 5 9 31 54 99
Ground Facilities
We lease most of the land and buildings that we occupy. Our largest aircraft maintenance base, various computer, cargo, flightkitchen and training facilities and most of our principal offices are located at or near the Atlanta airport, on land leased from the City ofAtlanta generally under long-term leases. We own our Atlanta reservations center, other real property in Atlanta and the formerNorthwest headquarters building and flight training buildings, which are located near the Minneapolis-St. Paul International Airport.Other owned facilities include reservations centers in Minot, North Dakota and Chisholm, Minnesota, and a data processing center inEagan, Minnesota. We also own property in Tokyo, including a 1.3-acre site in downtown Tokyo and a 33-acre land parcel, 512-roomhotel and flight kitchen located near Tokyo's Narita International Airport.
We lease ticket counter and other terminal space, operating areas and air cargo facilities in most of the airports that we serve. Atmost airports, we have entered into use agreements which provide for the non-exclusive use of runways, taxiways, and otherimprovements and facilities; landing fees under these agreements normally are based on the number of landings and weight of aircraft.These leases and use agreements generally run for periods of less than one year to 30 years or more, and often contain provisions forperiodic adjustments of lease rates, landing fees and other charges applicable under that type of agreement. We also lease aircraftmaintenance facilities and air cargo facilities at certain airports, including, among others: (1) our main Atlanta maintenance base; (2) ourAtlanta air cargo facilities; and (3) our hangar and air cargo facilities at the Cincinnati/Northern Kentucky International Airport, SaltLake City International Airport, Detroit Metropolitan International Airport, Minneapolis-St. Paul International Airport and Seattle-Tacoma International Airport. Our aircraft maintenance facility leases generally require us to pay the cost of providing, operating andmaintaining such facilities, including, in some cases, amounts necessary to pay debt service on special facility bonds issued to financetheir construction. We also lease marketing, ticketing and reservations offices in certain locations for varying terms.
In recent years, some airports have increased or sought to increase the rates charged to airlines to levels that we believe areunreasonable. The extent to which such charges are limited by statute or regulation and the ability of airlines to contest such charges hasbeen subject to litigation and to administrative proceedings before the DOT. If the limitations on such charges are relaxed, or the abilityof airlines to challenge such proposed rate increases is restricted, the rates charged by airports to airlines may increase substantially.
The City of Atlanta is currently implementing portions of a 10 year capital improvement program (the “CIP”) at the Atlanta airport.The CIP includes, among other things, a 9,000 foot full-service runway that opened in May 2006, related airfield improvements, a newinternational terminal and gate capacity that is scheduled to open in May 2012, new cargo and other support facilities and roadway andother infrastructure improvements. The CIP will not be complete until at least 2014, with individual projects scheduled to be constructedat different times. A combination of federal grants, passenger facility charge revenues, increased user rentals and fees, and other airportfunds are expected to be used to pay CIP costs directly and through the payment of debt service on bonds.
19
Copyright © 2013 www.secdatabase.com. All Rights Reserved.Please Consider the Environment Before Printing This Document
During the December 2010 quarter, we began a redevelopment project at JFK, where we currently operate primarily at Terminal 2for domestic flights and Terminal 3 for international flights under leases with the Port Authority of New York and New Jersey (“PortAuthority”). We estimate this project will cost approximately $1.2 billion and will be completed in stages over five years. We alsoconduct some flights from Terminal 4, which is operated by JFK International Air Terminal, LLC, a private party, under a lease with thePort Authority. Our JFK redevelopment project currently includes the (1) enhancement and expansion of Terminal 4, including theconstruction of nine new gates; (2) construction of a passenger connector between Terminal 2 and Terminal 4; (3) demolition of theoutdated Terminal 3 facilities; and (4) development of the Terminal 3 site for aircraft parking positions. Upon completion of theTerminal 4 expansion, expected to occur in 2013, we will relocate our operations from Terminal 3 to Terminal 4, proceed withdemolition activities in Terminal 3 and thereafter conduct coordinated flight operations from Terminals 2 and 4. For information aboutspecial project bonds issued to fund a substantial majority of the project and our 30 year sublease of space in Terminal 4 from theoperator of Terminal 4, see Note 4 of the Notes to the Consolidated Financial Statements.
In December 2011, we executed agreements with US Airways and the Port Authority, allowing us to expand our flight operationsinto Terminal C at New York's LaGuardia Airport. This project allows us to accommodate additional flights into LaGuardia. As part ofthe expansion, we are also investing $100 million to create an expanded main terminal at LaGuardia in Terminals C and D and willbuild a bridge to link the two terminals.
20
Copyright © 2013 www.secdatabase.com. All Rights Reserved.Please Consider the Environment Before Printing This Document
ITEM 3. LEGAL PROCEEDINGS
First Bag Fee Antitrust Litigation
In May, June and July, 2009, a number of purported class action antitrust lawsuits were filed in the U.S. District Courts for theNorthern District of Georgia, the Middle District of Florida, and the District of Nevada, against Delta and AirTran Airways (“AirTran”).In these cases, the plaintiffs originally alleged that Delta and AirTran engaged in collusive behavior in violation of Section 1 of theSherman Act in November 2008 based upon certain public statements made in October 2008 by AirTran's CEO at an analyst conferenceconcerning fees for the first checked bag, Delta's imposition of a fee for the first checked bag on November 4, 2008 and AirTran'simposition of a similar fee on November 12, 2008. The plaintiffs sought to assert claims on behalf of an alleged class consisting ofpassengers who paid the first bag fee after December 5, 2008 and seek injunctive relief and unspecified treble damages. All of thesecases have been consolidated for pre-trial proceedings in the Northern District of Georgia by the Multi-District Litigation (“MDL”)Panel.
In February 2010, the plaintiffs in the MDL proceeding filed a consolidated amended class action complaint which substantiallyexpanded the scope of the original complaint. In the consolidated amended complaint, plaintiffs add new allegations concerning allegedsignaling by both Delta and AirTran based upon statements made to the investment community by both carriers relating to industrycapacity levels during 2008-2009. Plaintiffs also add a new cause of action against Delta alleging attempted monopolization in violationof Section 2 of the Sherman Act, paralleling a claim previously asserted against AirTran but not Delta.
In August 2010, the District Court issued an order granting Delta's motion to dismiss the Section 2 claim, but denying its motion todismiss the Section 1 claim. Plaintiffs have filed a motion to certify the Section 1 class, which remains pending. Delta believes theclaims in these cases are without merit and is vigorously defending these lawsuits.
EU Regulation 261 Class Action Litigation
In February 2011, a putative class action was filed in the U.S. District Court for the Northern District of Illinois seeking to representall US residents who were passengers on flights during the period from Feb 2009 to the present who are allegedly entitled tocompensation under EU Regulation 261 because their flight was cancelled or delayed by more than 3 hours. Plaintiffs allege that Deltahas incorporated a duty to pay this compensation into its contract of carriage, and assert a claim for breach of contract as the basis fortheir cause of action. The complaint seeks recovery of the EU Regulation 261 compensation of €600 for each US resident on a flightqualifying for such compensation. Delta disputes the allegations in the Complaint, has filed a motion to dismiss all claims, and intendsto vigorously defend the matter.
Canadian Passenger Surcharge Antitrust Litigation
On July 31, 2009, two parallel putative class actions were filed against a number of Canadian, Asian, European, and U.S. carriers(including Delta) in the Ontario Superior Court of Justice. Both allege that the defendants colluded to fix the price of passengersurcharges, in Canada-Asia and Canada-Europe markets respectively. There are no allegations in the complaints of any specific act byDelta in furtherance of either conspiracy. The complaints seek damages in excess of $100 million. We believe the allegations againstDelta are without merit and intend to vigorously defend these cases.
***
For a discussion of certain environmental matters, see “Business-Environmental Matters” in Item 1.
ITEM 4. MINE SAFETY DISCLOSURES
Not applicable.
21
Copyright © 2013 www.secdatabase.com. All Rights Reserved.Please Consider the Environment Before Printing This Document
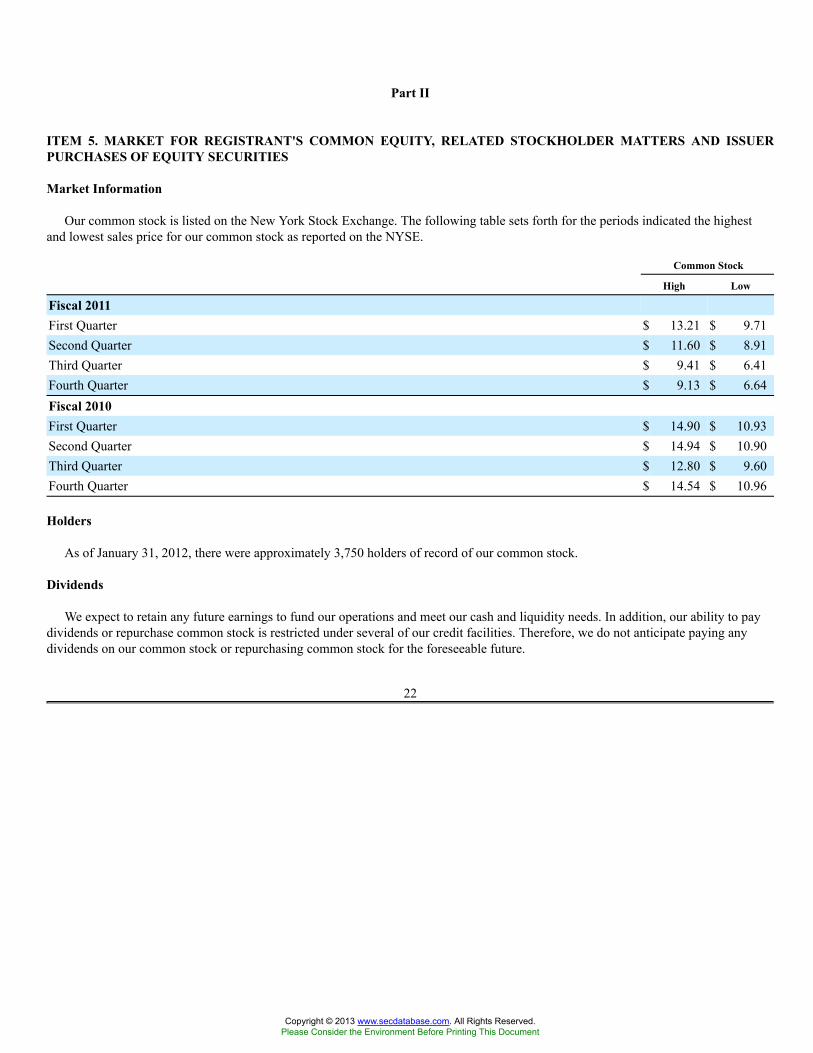
Part II
ITEM 5. MARKET FOR REGISTRANT'S COMMON EQUITY, RELATED STOCKHOLDER MATTERS AND ISSUERPURCHASES OF EQUITY SECURITIES
Market Information
Our common stock is listed on the New York Stock Exchange. The following table sets forth for the periods indicated the highestand lowest sales price for our common stock as reported on the NYSE.
Common Stock
High Low
Fiscal 2011First Quarter $ 13.21 $ 9.71Second Quarter $ 11.60 $ 8.91Third Quarter $ 9.41 $ 6.41Fourth Quarter $ 9.13 $ 6.64Fiscal 2010First Quarter $ 14.90 $ 10.93Second Quarter $ 14.94 $ 10.90Third Quarter $ 12.80 $ 9.60Fourth Quarter $ 14.54 $ 10.96
Holders
As of January 31, 2012, there were approximately 3,750 holders of record of our common stock.
Dividends
We expect to retain any future earnings to fund our operations and meet our cash and liquidity needs. In addition, our ability to paydividends or repurchase common stock is restricted under several of our credit facilities. Therefore, we do not anticipate paying anydividends on our common stock or repurchasing common stock for the foreseeable future.
22
Copyright © 2013 www.secdatabase.com. All Rights Reserved.Please Consider the Environment Before Printing This Document
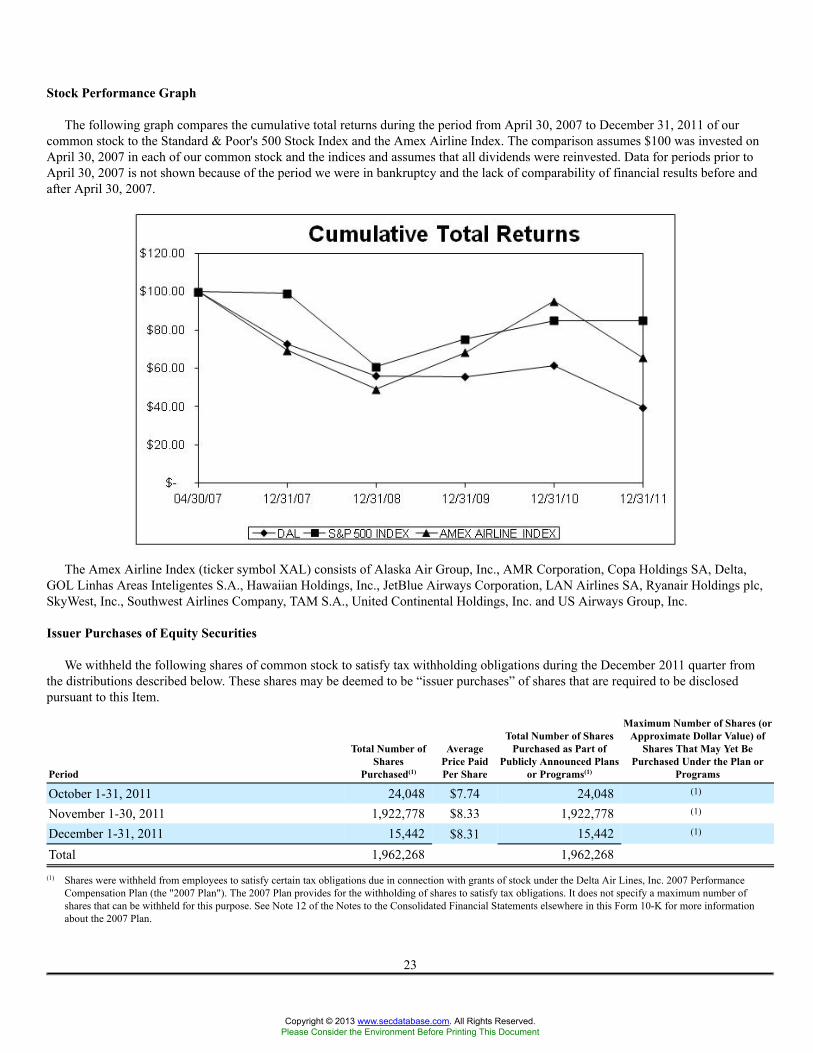
Stock Performance Graph
The following graph compares the cumulative total returns during the period from April 30, 2007 to December 31, 2011 of ourcommon stock to the Standard & Poor's 500 Stock Index and the Amex Airline Index. The comparison assumes $100 was invested onApril 30, 2007 in each of our common stock and the indices and assumes that all dividends were reinvested. Data for periods prior toApril 30, 2007 is not shown because of the period we were in bankruptcy and the lack of comparability of financial results before andafter April 30, 2007.
The Amex Airline Index (ticker symbol XAL) consists of Alaska Air Group, Inc., AMR Corporation, Copa Holdings SA, Delta,GOL Linhas Areas Inteligentes S.A., Hawaiian Holdings, Inc., JetBlue Airways Corporation, LAN Airlines SA, Ryanair Holdings plc,SkyWest, Inc., Southwest Airlines Company, TAM S.A., United Continental Holdings, Inc. and US Airways Group, Inc.
Issuer Purchases of Equity Securities
We withheld the following shares of common stock to satisfy tax withholding obligations during the December 2011 quarter fromthe distributions described below. These shares may be deemed to be “issuer purchases” of shares that are required to be disclosedpursuant to this Item.
Period
Total Number ofShares
Purchased(1)
AveragePrice PaidPer Share
Total Number of SharesPurchased as Part of
Publicly Announced Plansor Programs(1)
Maximum Number of Shares (orApproximate Dollar Value) of
Shares That May Yet BePurchased Under the Plan or
Programs
October 1-31, 2011 24,048 $7.74 24,048 (1)
November 1-30, 2011 1,922,778 $8.33 1,922,778 (1)
December 1-31, 2011 15,442 $8.31 15,442 (1)
Total 1,962,268 1,962,268(1) Shares were withheld from employees to satisfy certain tax obligations due in connection with grants of stock under the Delta Air Lines, Inc. 2007 Performance
Compensation Plan (the "2007 Plan"). The 2007 Plan provides for the withholding of shares to satisfy tax obligations. It does not specify a maximum number ofshares that can be withheld for this purpose. See Note 12 of the Notes to the Consolidated Financial Statements elsewhere in this Form 10-K for more informationabout the 2007 Plan.
23
Copyright © 2013 www.secdatabase.com. All Rights Reserved.Please Consider the Environment Before Printing This Document
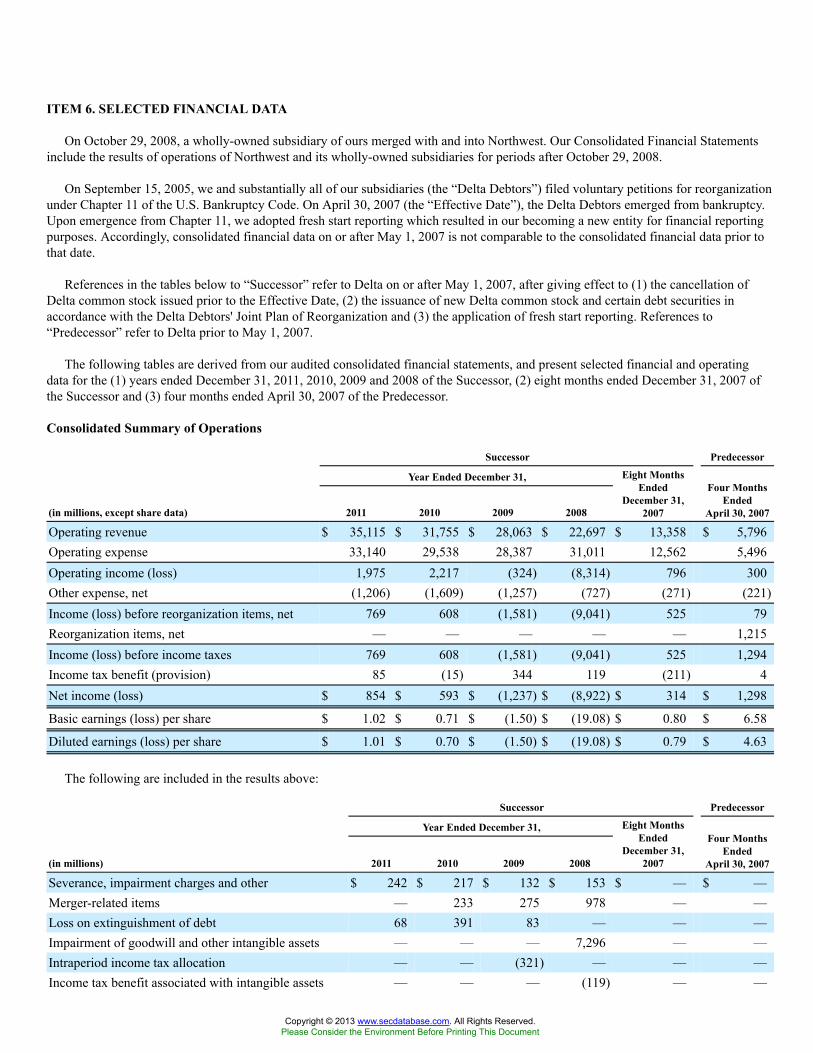
ITEM 6. SELECTED FINANCIAL DATA
On October 29, 2008, a wholly-owned subsidiary of ours merged with and into Northwest. Our Consolidated Financial Statementsinclude the results of operations of Northwest and its wholly-owned subsidiaries for periods after October 29, 2008.
On September 15, 2005, we and substantially all of our subsidiaries (the “Delta Debtors”) filed voluntary petitions for reorganizationunder Chapter 11 of the U.S. Bankruptcy Code. On April 30, 2007 (the “Effective Date”), the Delta Debtors emerged from bankruptcy.Upon emergence from Chapter 11, we adopted fresh start reporting which resulted in our becoming a new entity for financial reportingpurposes. Accordingly, consolidated financial data on or after May 1, 2007 is not comparable to the consolidated financial data prior tothat date.
References in the tables below to “Successor” refer to Delta on or after May 1, 2007, after giving effect to (1) the cancellation ofDelta common stock issued prior to the Effective Date, (2) the issuance of new Delta common stock and certain debt securities inaccordance with the Delta Debtors' Joint Plan of Reorganization and (3) the application of fresh start reporting. References to“Predecessor” refer to Delta prior to May 1, 2007.
The following tables are derived from our audited consolidated financial statements, and present selected financial and operatingdata for the (1) years ended December 31, 2011, 2010, 2009 and 2008 of the Successor, (2) eight months ended December 31, 2007 ofthe Successor and (3) four months ended April 30, 2007 of the Predecessor.
Consolidated Summary of Operations
Successor Predecessor
Year Ended December 31,
(in millions, except share data) 2011 2010 2009 2008
Eight MonthsEnded
December 31,2007
Four MonthsEnded
April 30, 2007
Operating revenue $ 35,115 $ 31,755 $ 28,063 $ 22,697 $ 13,358 $ 5,796Operating expense 33,140 29,538 28,387 31,011 12,562 5,496Operating income (loss) 1,975 2,217 (324) (8,314) 796 300Other expense, net (1,206) (1,609) (1,257) (727) (271) (221)Income (loss) before reorganization items, net 769 608 (1,581) (9,041) 525 79Reorganization items, net — — — — — 1,215Income (loss) before income taxes 769 608 (1,581) (9,041) 525 1,294Income tax benefit (provision) 85 (15) 344 119 (211) 4Net income (loss) $ 854 $ 593 $ (1,237) $ (8,922) $ 314 $ 1,298
Basic earnings (loss) per share $ 1.02 $ 0.71 $ (1.50) $ (19.08) $ 0.80 $ 6.58
Diluted earnings (loss) per share $ 1.01 $ 0.70 $ (1.50) $ (19.08) $ 0.79 $ 4.63
The following are included in the results above:
Successor Predecessor
Year Ended December 31,
(in millions) 2011 2010 2009 2008
Eight MonthsEnded
December 31,2007
Four MonthsEnded
April 30, 2007
Severance, impairment charges and other $ 242 $ 217 $ 132 $ 153 $ — $ —Merger-related items — 233 275 978 — —Loss on extinguishment of debt 68 391 83 — — —Impairment of goodwill and other intangible assets — — — 7,296 — —Intraperiod income tax allocation — — (321) — — —Income tax benefit associated with intangible assets — — — (119) — —
Copyright © 2013 www.secdatabase.com. All Rights Reserved.Please Consider the Environment Before Printing This Document
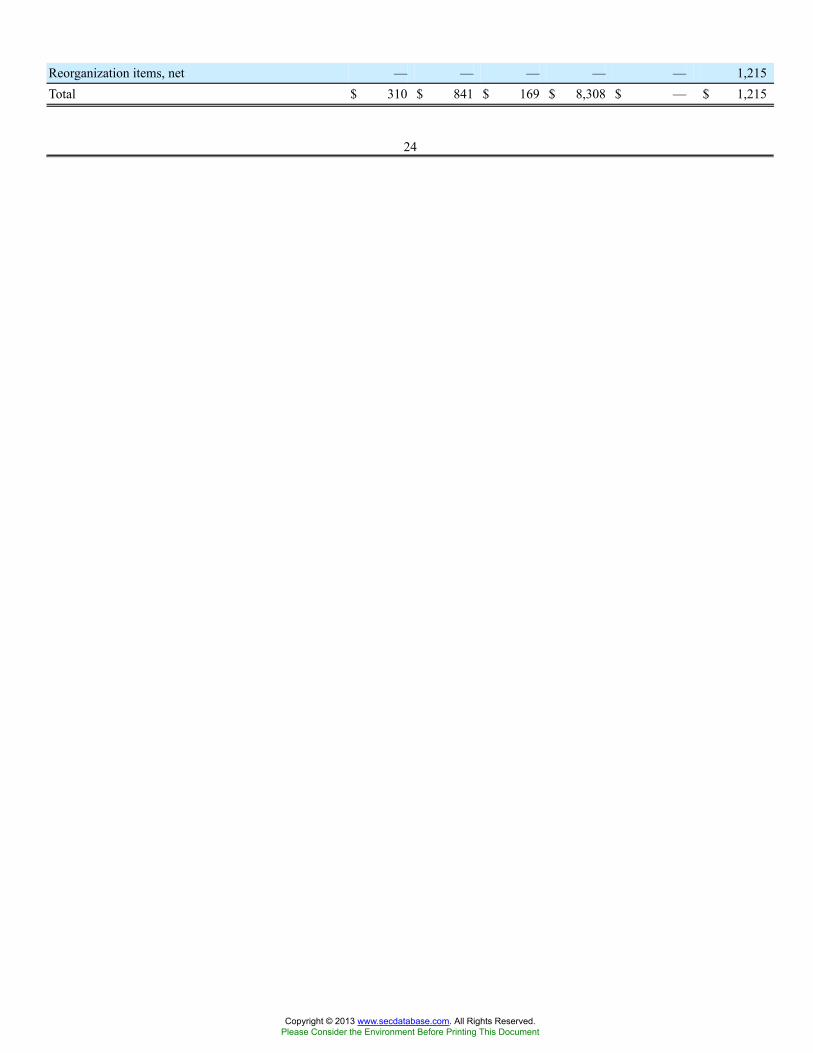
Reorganization items, net — — — — — 1,215Total $ 310 $ 841 $ 169 $ 8,308 $ — $ 1,215
24
Copyright © 2013 www.secdatabase.com. All Rights Reserved.Please Consider the Environment Before Printing This Document
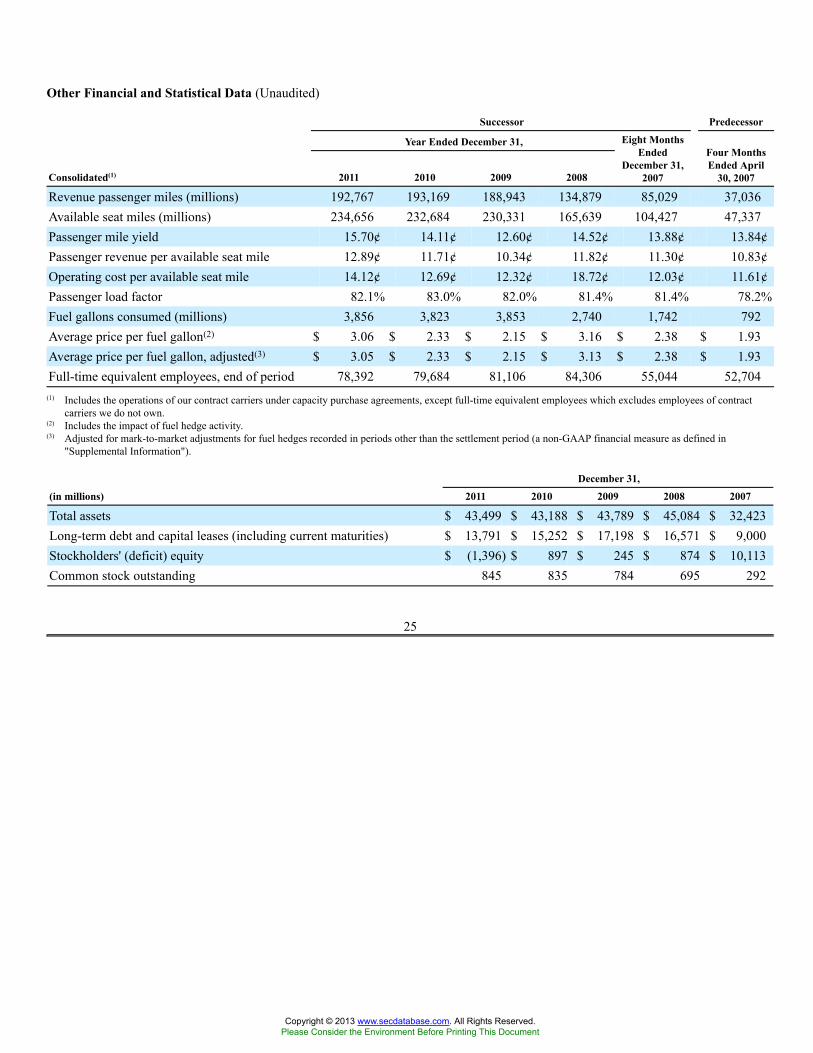
Other Financial and Statistical Data (Unaudited)
Successor Predecessor
Year Ended December 31,
Consolidated(1) 2011 2010 2009 2008
Eight MonthsEnded
December 31,2007
Four MonthsEnded April
30, 2007
Revenue passenger miles (millions) 192,767 193,169 188,943 134,879 85,029 37,036Available seat miles (millions) 234,656 232,684 230,331 165,639 104,427 47,337Passenger mile yield 15.70¢ 14.11¢ 12.60¢ 14.52¢ 13.88¢ 13.84¢Passenger revenue per available seat mile 12.89¢ 11.71¢ 10.34¢ 11.82¢ 11.30¢ 10.83¢Operating cost per available seat mile 14.12¢ 12.69¢ 12.32¢ 18.72¢ 12.03¢ 11.61¢Passenger load factor 82.1% 83.0% 82.0% 81.4% 81.4% 78.2%Fuel gallons consumed (millions) 3,856 3,823 3,853 2,740 1,742 792Average price per fuel gallon(2) $ 3.06 $ 2.33 $ 2.15 $ 3.16 $ 2.38 $ 1.93Average price per fuel gallon, adjusted(3) $ 3.05 $ 2.33 $ 2.15 $ 3.13 $ 2.38 $ 1.93Full-time equivalent employees, end of period 78,392 79,684 81,106 84,306 55,044 52,704
(1) Includes the operations of our contract carriers under capacity purchase agreements, except full-time equivalent employees which excludes employees of contractcarriers we do not own.
(2) Includes the impact of fuel hedge activity.(3) Adjusted for mark-to-market adjustments for fuel hedges recorded in periods other than the settlement period (a non-GAAP financial measure as defined in
"Supplemental Information").
December 31,
(in millions) 2011 2010 2009 2008 2007
Total assets $ 43,499 $ 43,188 $ 43,789 $ 45,084 $ 32,423Long-term debt and capital leases (including current maturities) $ 13,791 $ 15,252 $ 17,198 $ 16,571 $ 9,000Stockholders' (deficit) equity $ (1,396) $ 897 $ 245 $ 874 $ 10,113Common stock outstanding 845 835 784 695 292
25
Copyright © 2013 www.secdatabase.com. All Rights Reserved.Please Consider the Environment Before Printing This Document
ITEM 7. MANAGEMENT'S DISCUSSION AND ANALYSIS OF FINANCIAL CONDITION AND RESULTS OFOPERATIONS
Financial Highlights - 2011 Compared to 2010
Our net income for 2011 was $854 million, or $1.01 per diluted share. This is $261 million higher than 2010 despite significantlyhigher fuel costs. Total operating revenue increased $3.4 billion, on an 11% increase in passenger mile yield, primarily due to higherpassenger revenues as we were able to adjust ticket prices in response to higher fuel prices. Total operating expense was up $3.6 billion,or 12%, driven primarily by a $2.9 billion increase in fuel expense (including our contract carriers under capacity purchase agreements).
Fuel price volatility continues to represent a significant risk to our business and the airline industry as a whole. Our fuel cost pergallon increased 31% from 2010 to 2011. During 2011, fuel expense, including amounts under contract carrier agreements, increased by$2.9 billion and now represents 36% of total operating expense. During 2011, gains from our hedging program reduced fuel expense by$420 million. Including fuel hedge activity, our average price per fuel gallon in 2011 was $3.06 as compared to $2.33 in 2010.
Our consolidated operating cost per available seat mile ("CASM") for 2011 increased to 14.12 cents compared to 12.69 cents in2010, primarily reflecting higher fuel prices. For 2011, CASM-Ex (a non-GAAP financial measure as defined in "SupplementalInformation" below) was 8.53 cents, or 3% higher than 2010, primarily reflecting higher revenue-related expenses and salaries andrelated costs.
During 2011, we reduced our total debt and capital leases by $1.5 billion and ended the year with $5.4 billion in unrestrictedliquidity, consisting of cash and cash equivalents, short-term investments and availability under credit facilities.
Fleet Strategy
During 2011, we entered into an agreement with The Boeing Company ("Boeing") to purchase 100 B-737-900ER aircraft withdeliveries beginning in 2013 and continuing through 2018. We have obtained committed long-term financing for a substantial portion ofthe purchase price of these aircraft. The Boeing agreement and our plans to bring into service 30 to 40 previously owned MD-90 aircraftover the next two to three years will enable us to replace on a capacity-neutral basis older, less efficient aircraft scheduled to be retired.The majority of the MD-90 aircraft scheduled to come into service over the next two to three years were purchased or leased in 2010and 2011. These B-737-900ER and MD-90 aircraft will have lower unit costs than the aircraft they are replacing as a result of lowermaintenance costs and fuel efficiencies.
In addition to lowering unit costs, we are also investing in our fleet to enhance the customer experience. The state-of-the-artB-737-900ER will offer an industry leading customer experience, including expanded carry-on baggage space and a roomier cabin. Bythe end of 2013, our entire widebody international fleet will be updated with full flat-bed seats in BusinessElite. We completed theinstallation of full flat-bed seats in the BusinessElite cabin of our B-777 and B-767-400ER aircraft during 2011. Due to the success ofour Economy Comfort product, which we began offering during the 2011 summer on long-haul international flights, we are expandingEconomy Comfort throughout our mainline and regional fleet by the summer of 2012. We have also been investing in our domestic andregional fleet, with in-flight WiFi on all two-class domestic aircraft, interior upgrades and the installation of additional First Classseating.
New York Strategy
Strengthening our position in New York City is an important part of our network strategy. As discussed below, key components ofthis strategy are operating a domestic hub at New York's LaGuardia Airport ("LaGuardia") and creating a state-of-the-art facility at NewYork's John F. Kennedy International Airport ("JFK").
LaGuardia. During December 2011, we closed the transactions contemplated under an agreement with US Airways including theexchange of takeoff and landing rights (each a "slot pair") at LaGuardia and Reagan National airports, which will allow us to operate anew domestic hub at LaGuardia. Under the agreement, (1) Delta acquired 132 slot pairs at LaGuardia from US Airways and (2) USAirways acquired from Delta 42 slot pairs at Reagan National; the rights to operate additional daily service to São Paulo, Brazil in 2015;and $66.5 million in cash. Additionally, Delta divested 16 slot pairs at LaGuardia and eight slot pairs at Reagan National to airlines withlimited or no service at those airports.
Copyright © 2013 www.secdatabase.com. All Rights Reserved.Please Consider the Environment Before Printing This Document

26
Copyright © 2013 www.secdatabase.com. All Rights Reserved.Please Consider the Environment Before Printing This Document
Following the closing of the transaction, we announced the expansion of our service at LaGuardia in 2012 to include more than 100new flights and 29 new destinations. Our expanded schedule will add nonstop service to top U.S. business markets and additionalfrequencies to business markets currently served. As part of the expansion, we are also investing $100 million to create an expandedmain terminal at LaGuardia in Terminals C and D and will build a bridge to link the two terminals.
JFK. While our expanded LaGuardia schedule is focused on providing industry-leading domestic service, our schedule at JFK isbeing optimized in 2012 for international and trans-continental flights, as well as improved coordination with our SkyTeam alliancepartners. At JFK, we currently operate domestic flights primarily at Terminal 2 and international flights at Terminal 3 and, to a lesserextent, Terminal 4. Our redevelopment project at JFK, which began in 2010, currently includes the (1) enhancement and expansion ofTerminal 4, including the construction of nine new international gates; (2) construction of a passenger connector between Terminal 2and Terminal 4; (3) demolition of the outdated Terminal 3, which was constructed in 1960; and (4) development of the Terminal 3 sitefor aircraft parking positions. We estimate this project will cost approximately $1.2 billion and will be completed in stages over fiveyears. Construction at Terminal 4 has commenced and is scheduled to be completed in 2013. Upon completion of the Terminal 4expansion, we will relocate our operations from Terminal 3 to Terminal 4, proceed with the demolition of Terminal 3, and thereafterconduct coordinated flight operations from Terminals 2 and 4. Once our project is complete, we expect that passengers will benefit froman enhanced customer experience and improved operational performance, including reduced taxi times and better on-time performance.
27
Copyright © 2013 www.secdatabase.com. All Rights Reserved.Please Consider the Environment Before Printing This Document
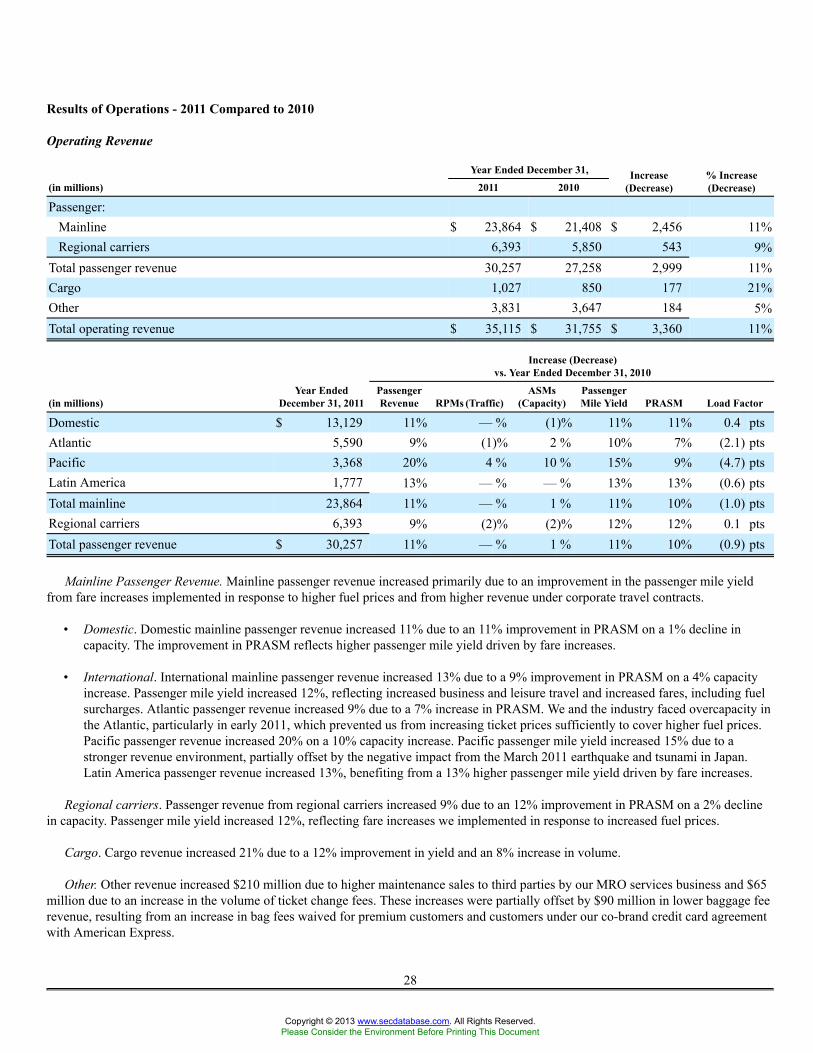
Results of Operations - 2011 Compared to 2010
Operating Revenue
Year Ended December 31,
(in millions) 2011 2010Increase
(Decrease)% Increase(Decrease)
Passenger:Mainline $ 23,864 $ 21,408 $ 2,456 11%Regional carriers 6,393 5,850 543 9%
Total passenger revenue 30,257 27,258 2,999 11%Cargo 1,027 850 177 21%Other 3,831 3,647 184 5%Total operating revenue $ 35,115 $ 31,755 $ 3,360 11%
Increase (Decrease)vs. Year Ended December 31, 2010
(in millions)Year Ended
December 31, 2011PassengerRevenue RPMs (Traffic)
ASMs(Capacity)
PassengerMile Yield PRASM Load Factor
Domestic $ 13,129 11% — % (1)% 11% 11% 0.4 ptsAtlantic 5,590 9% (1)% 2 % 10% 7% (2.1) ptsPacific 3,368 20% 4 % 10 % 15% 9% (4.7) ptsLatin America 1,777 13% — % — % 13% 13% (0.6) ptsTotal mainline 23,864 11% — % 1 % 11% 10% (1.0) ptsRegional carriers 6,393 9% (2)% (2)% 12% 12% 0.1 ptsTotal passenger revenue $ 30,257 11% — % 1 % 11% 10% (0.9) pts
Mainline Passenger Revenue. Mainline passenger revenue increased primarily due to an improvement in the passenger mile yieldfrom fare increases implemented in response to higher fuel prices and from higher revenue under corporate travel contracts.
• Domestic. Domestic mainline passenger revenue increased 11% due to an 11% improvement in PRASM on a 1% decline incapacity. The improvement in PRASM reflects higher passenger mile yield driven by fare increases.
• International. International mainline passenger revenue increased 13% due to a 9% improvement in PRASM on a 4% capacityincrease. Passenger mile yield increased 12%, reflecting increased business and leisure travel and increased fares, including fuelsurcharges. Atlantic passenger revenue increased 9% due to a 7% increase in PRASM. We and the industry faced overcapacity inthe Atlantic, particularly in early 2011, which prevented us from increasing ticket prices sufficiently to cover higher fuel prices.Pacific passenger revenue increased 20% on a 10% capacity increase. Pacific passenger mile yield increased 15% due to astronger revenue environment, partially offset by the negative impact from the March 2011 earthquake and tsunami in Japan.Latin America passenger revenue increased 13%, benefiting from a 13% higher passenger mile yield driven by fare increases.
Regional carriers. Passenger revenue from regional carriers increased 9% due to an 12% improvement in PRASM on a 2% declinein capacity. Passenger mile yield increased 12%, reflecting fare increases we implemented in response to increased fuel prices.
Cargo. Cargo revenue increased 21% due to a 12% improvement in yield and an 8% increase in volume.
Other. Other revenue increased $210 million due to higher maintenance sales to third parties by our MRO services business and $65million due to an increase in the volume of ticket change fees. These increases were partially offset by $90 million in lower baggage feerevenue, resulting from an increase in bag fees waived for premium customers and customers under our co-brand credit card agreementwith American Express.
28
Copyright © 2013 www.secdatabase.com. All Rights Reserved.Please Consider the Environment Before Printing This Document
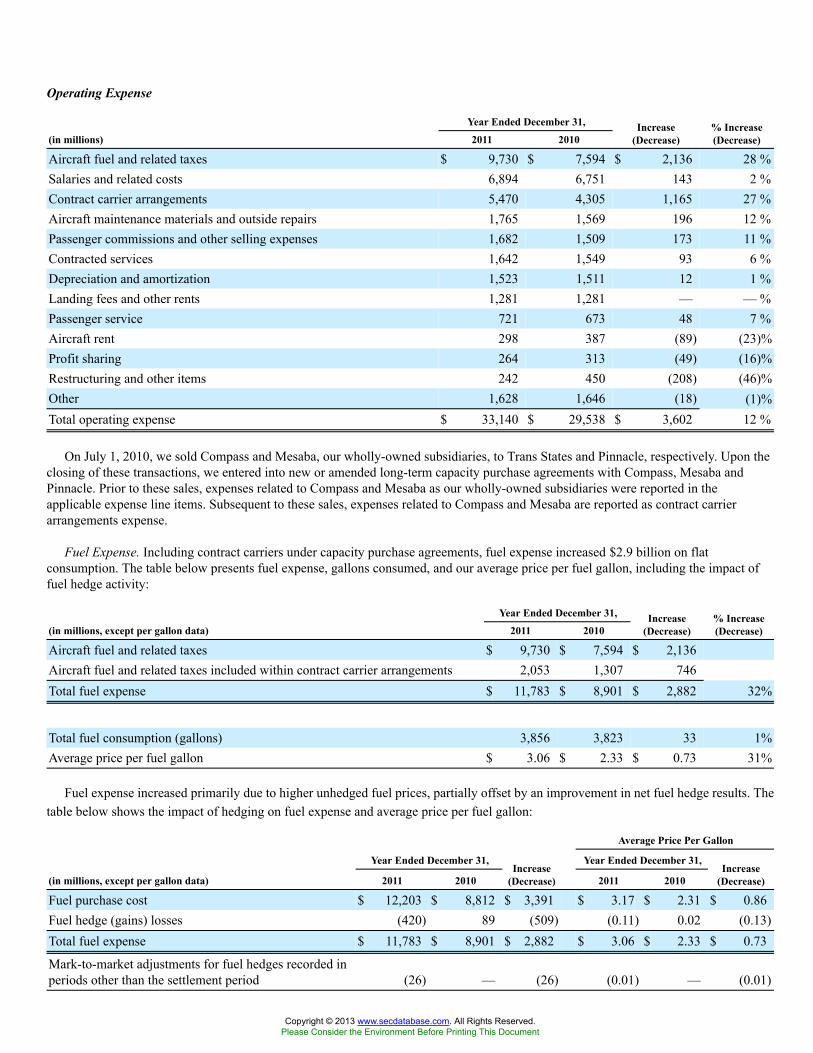
Operating Expense
Year Ended December 31,
(in millions) 2011 2010Increase
(Decrease)% Increase(Decrease)
Aircraft fuel and related taxes $ 9,730 $ 7,594 $ 2,136 28 %Salaries and related costs 6,894 6,751 143 2 %Contract carrier arrangements 5,470 4,305 1,165 27 %Aircraft maintenance materials and outside repairs 1,765 1,569 196 12 %Passenger commissions and other selling expenses 1,682 1,509 173 11 %Contracted services 1,642 1,549 93 6 %Depreciation and amortization 1,523 1,511 12 1 %Landing fees and other rents 1,281 1,281 — — %Passenger service 721 673 48 7 %Aircraft rent 298 387 (89) (23)%Profit sharing 264 313 (49) (16)%Restructuring and other items 242 450 (208) (46)%Other 1,628 1,646 (18) (1)%Total operating expense $ 33,140 $ 29,538 $ 3,602 12 %
On July 1, 2010, we sold Compass and Mesaba, our wholly-owned subsidiaries, to Trans States and Pinnacle, respectively. Upon theclosing of these transactions, we entered into new or amended long-term capacity purchase agreements with Compass, Mesaba andPinnacle. Prior to these sales, expenses related to Compass and Mesaba as our wholly-owned subsidiaries were reported in theapplicable expense line items. Subsequent to these sales, expenses related to Compass and Mesaba are reported as contract carrierarrangements expense.
Fuel Expense. Including contract carriers under capacity purchase agreements, fuel expense increased $2.9 billion on flatconsumption. The table below presents fuel expense, gallons consumed, and our average price per fuel gallon, including the impact offuel hedge activity:
Year Ended December 31,
(in millions, except per gallon data) 2011 2010Increase
(Decrease)% Increase(Decrease)
Aircraft fuel and related taxes $ 9,730 $ 7,594 $ 2,136Aircraft fuel and related taxes included within contract carrier arrangements 2,053 1,307 746Total fuel expense $ 11,783 $ 8,901 $ 2,882 32%
Total fuel consumption (gallons) 3,856 3,823 33 1%Average price per fuel gallon $ 3.06 $ 2.33 $ 0.73 31%
Fuel expense increased primarily due to higher unhedged fuel prices, partially offset by an improvement in net fuel hedge results. Thetable below shows the impact of hedging on fuel expense and average price per fuel gallon:
Average Price Per Gallon
Year Ended December 31, Year Ended December 31,
(in millions, except per gallon data) 2011 2010Increase
(Decrease) 2011 2010Increase
(Decrease)
Fuel purchase cost $ 12,203 $ 8,812 $ 3,391 $ 3.17 $ 2.31 $ 0.86Fuel hedge (gains) losses (420) 89 (509) (0.11) 0.02 (0.13)Total fuel expense $ 11,783 $ 8,901 $ 2,882 $ 3.06 $ 2.33 $ 0.73
Mark-to-market adjustments for fuel hedges recorded inperiods other than the settlement period (26) — (26) (0.01) — (0.01)
Copyright © 2013 www.secdatabase.com. All Rights Reserved.Please Consider the Environment Before Printing This Document

Total fuel expense, adjusted $ 11,757 $ 8,901 $ 2,856 $ 3.05 $ 2.33 $ 0.72
29
Copyright © 2013 www.secdatabase.com. All Rights Reserved.Please Consider the Environment Before Printing This Document
Our average price per fuel gallon, adjusted for mark-to-market adjustments for fuel hedges recorded in periods other than thesettlement period (a non-GAAP financial measure as defined in "Supplemental Information" below) was $3.05 for the year endedDecember 31, 2011. During 2011, our net fuel hedge gains of $420 million included $26 million in gains for mark-to-marketadjustments recorded in periods other than the settlement period. These mark-to-market adjustments are based on market prices as of theend of the reporting period. Such market prices are not necessarily indicative of the actual future cash value of the underlying hedge inthe contract settlement period. Therefore, Delta adjusts fuel expense for these items to arrive at a more meaningful measure of fuel cost.
Salaries and related costs. Salaries and related costs increased due to a 3% average increase in headcount and employee payincreases, partially offset by the change in reporting described above due to the transactions involving Compass and Mesaba.
Contract carrier arrangements. Contract carrier arrangements expense, excluding the impact of fuel expense (discussed above),increased primarily due to the change in reporting for the transactions involving Compass and Mesaba.
Aircraft maintenance materials and outside repairs. Aircraft maintenance materials and outside repairs expense increased primarilydue to costs associated with increased maintenance sales to third parties by our MRO services business, reflected in other revenueabove.
Passenger commissions and other selling expenses. Credit card and sales commissions increased in conjunction with the 11%increase in passenger revenue.
Aircraft rent. Aircraft rent decreased primarily due to the restructuring of certain existing leases and the change in reportingdescribed above due to the transactions involving Compass and Mesaba.
Restructuring and other items. Due to the nature of amounts recorded within restructuring and other items, a year over yearcomparison is not meaningful. For a discussion of charges recorded in restructuring and other items, see Note 15 to the Notes of theConsolidated Financial Statements.
30
Copyright © 2013 www.secdatabase.com. All Rights Reserved.Please Consider the Environment Before Printing This Document
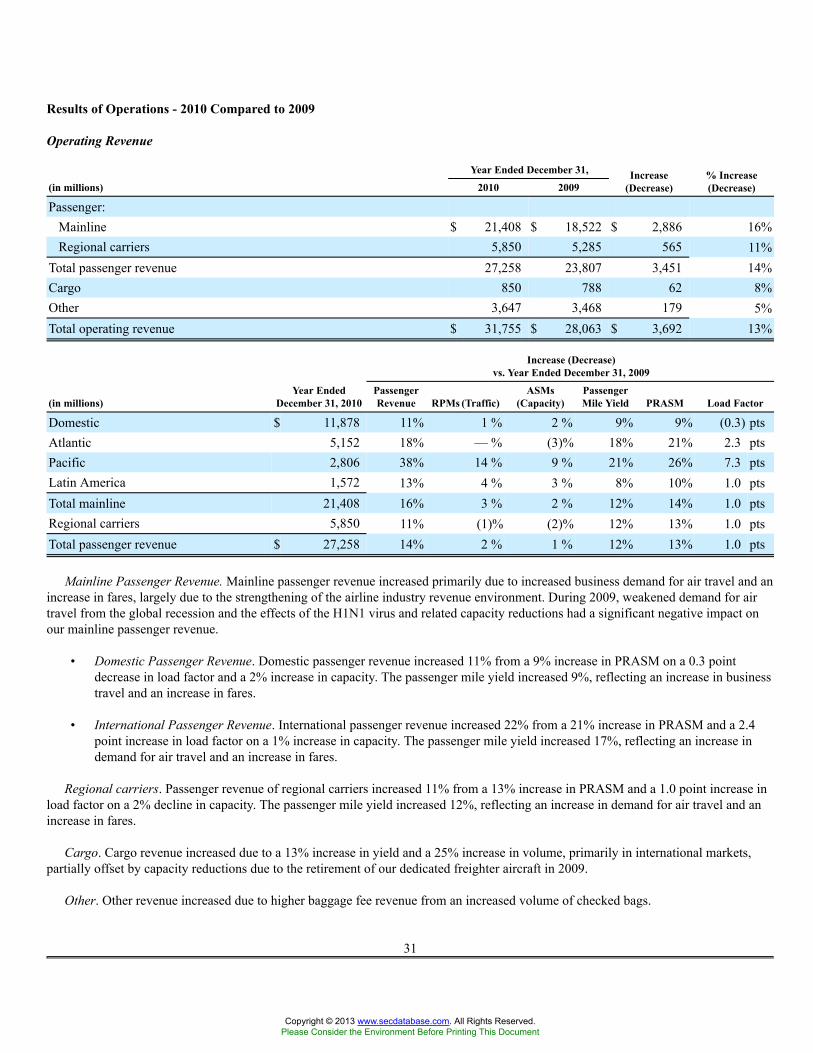
Results of Operations - 2010 Compared to 2009
Operating Revenue
Year Ended December 31,
(in millions) 2010 2009Increase
(Decrease)% Increase(Decrease)
Passenger:Mainline $ 21,408 $ 18,522 $ 2,886 16%Regional carriers 5,850 5,285 565 11%
Total passenger revenue 27,258 23,807 3,451 14%Cargo 850 788 62 8%Other 3,647 3,468 179 5%Total operating revenue $ 31,755 $ 28,063 $ 3,692 13%
Increase (Decrease)vs. Year Ended December 31, 2009
(in millions)Year Ended
December 31, 2010PassengerRevenue RPMs (Traffic)
ASMs(Capacity)
PassengerMile Yield PRASM Load Factor
Domestic $ 11,878 11% 1 % 2 % 9% 9% (0.3) ptsAtlantic 5,152 18% — % (3)% 18% 21% 2.3 ptsPacific 2,806 38% 14 % 9 % 21% 26% 7.3 ptsLatin America 1,572 13% 4 % 3 % 8% 10% 1.0 ptsTotal mainline 21,408 16% 3 % 2 % 12% 14% 1.0 ptsRegional carriers 5,850 11% (1)% (2)% 12% 13% 1.0 ptsTotal passenger revenue $ 27,258 14% 2 % 1 % 12% 13% 1.0 pts
Mainline Passenger Revenue. Mainline passenger revenue increased primarily due to increased business demand for air travel and anincrease in fares, largely due to the strengthening of the airline industry revenue environment. During 2009, weakened demand for airtravel from the global recession and the effects of the H1N1 virus and related capacity reductions had a significant negative impact onour mainline passenger revenue.
• Domestic Passenger Revenue. Domestic passenger revenue increased 11% from a 9% increase in PRASM on a 0.3 pointdecrease in load factor and a 2% increase in capacity. The passenger mile yield increased 9%, reflecting an increase in businesstravel and an increase in fares.
• International Passenger Revenue. International passenger revenue increased 22% from a 21% increase in PRASM and a 2.4point increase in load factor on a 1% increase in capacity. The passenger mile yield increased 17%, reflecting an increase indemand for air travel and an increase in fares.
Regional carriers. Passenger revenue of regional carriers increased 11% from a 13% increase in PRASM and a 1.0 point increase inload factor on a 2% decline in capacity. The passenger mile yield increased 12%, reflecting an increase in demand for air travel and anincrease in fares.
Cargo. Cargo revenue increased due to a 13% increase in yield and a 25% increase in volume, primarily in international markets,partially offset by capacity reductions due to the retirement of our dedicated freighter aircraft in 2009.
Other. Other revenue increased due to higher baggage fee revenue from an increased volume of checked bags.
31
Copyright © 2013 www.secdatabase.com. All Rights Reserved.Please Consider the Environment Before Printing This Document
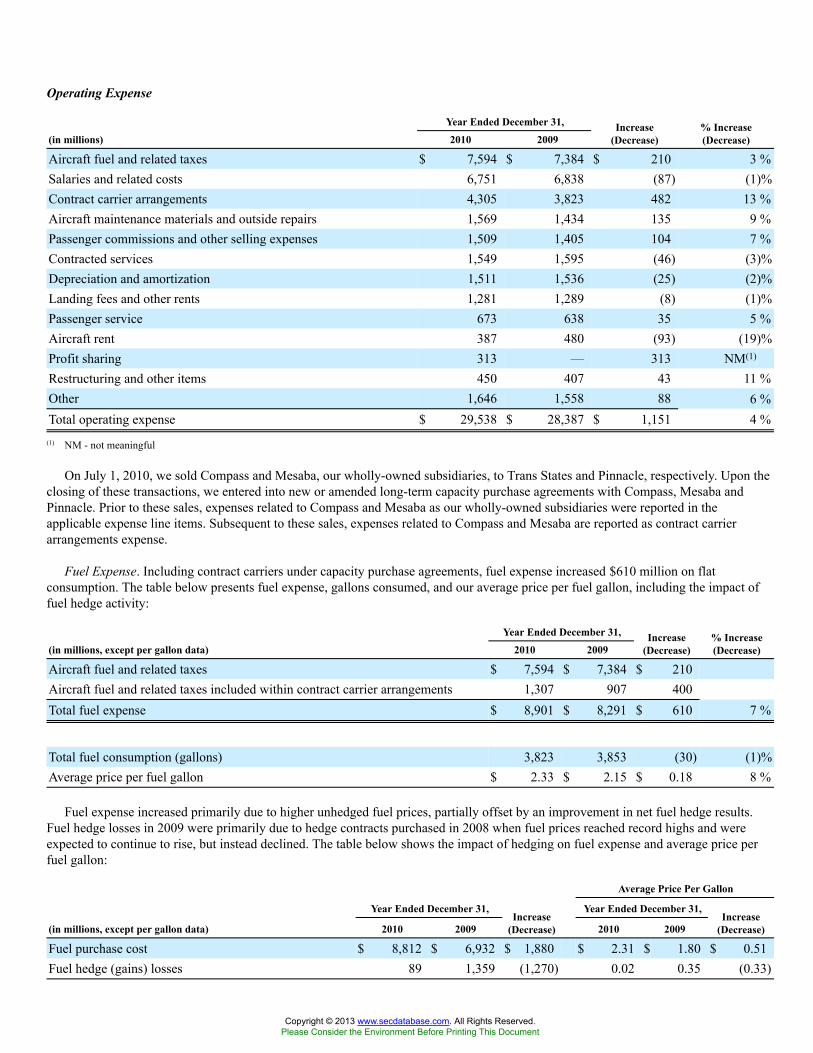
Operating Expense
Year Ended December 31,
(in millions) 2010 2009Increase
(Decrease)% Increase(Decrease)
Aircraft fuel and related taxes $ 7,594 $ 7,384 $ 210 3 %Salaries and related costs 6,751 6,838 (87) (1)%Contract carrier arrangements 4,305 3,823 482 13 %Aircraft maintenance materials and outside repairs 1,569 1,434 135 9 %Passenger commissions and other selling expenses 1,509 1,405 104 7 %Contracted services 1,549 1,595 (46) (3)%Depreciation and amortization 1,511 1,536 (25) (2)%Landing fees and other rents 1,281 1,289 (8) (1)%Passenger service 673 638 35 5 %Aircraft rent 387 480 (93) (19)%Profit sharing 313 — 313 NM(1)
Restructuring and other items 450 407 43 11 %Other 1,646 1,558 88 6 %Total operating expense $ 29,538 $ 28,387 $ 1,151 4 %
(1) NM - not meaningful
On July 1, 2010, we sold Compass and Mesaba, our wholly-owned subsidiaries, to Trans States and Pinnacle, respectively. Upon theclosing of these transactions, we entered into new or amended long-term capacity purchase agreements with Compass, Mesaba andPinnacle. Prior to these sales, expenses related to Compass and Mesaba as our wholly-owned subsidiaries were reported in theapplicable expense line items. Subsequent to these sales, expenses related to Compass and Mesaba are reported as contract carrierarrangements expense.
Fuel Expense. Including contract carriers under capacity purchase agreements, fuel expense increased $610 million on flatconsumption. The table below presents fuel expense, gallons consumed, and our average price per fuel gallon, including the impact offuel hedge activity:
Year Ended December 31,
(in millions, except per gallon data) 2010 2009Increase
(Decrease)% Increase(Decrease)
Aircraft fuel and related taxes $ 7,594 $ 7,384 $ 210Aircraft fuel and related taxes included within contract carrier arrangements 1,307 907 400Total fuel expense $ 8,901 $ 8,291 $ 610 7 %
Total fuel consumption (gallons) 3,823 3,853 (30) (1)%Average price per fuel gallon $ 2.33 $ 2.15 $ 0.18 8 %
Fuel expense increased primarily due to higher unhedged fuel prices, partially offset by an improvement in net fuel hedge results.Fuel hedge losses in 2009 were primarily due to hedge contracts purchased in 2008 when fuel prices reached record highs and wereexpected to continue to rise, but instead declined. The table below shows the impact of hedging on fuel expense and average price perfuel gallon:
Average Price Per Gallon
Year Ended December 31, Year Ended December 31,
(in millions, except per gallon data) 2010 2009Increase
(Decrease) 2010 2009Increase
(Decrease)
Fuel purchase cost $ 8,812 $ 6,932 $ 1,880 $ 2.31 $ 1.80 $ 0.51Fuel hedge (gains) losses 89 1,359 (1,270) 0.02 0.35 (0.33)
Copyright © 2013 www.secdatabase.com. All Rights Reserved.Please Consider the Environment Before Printing This Document
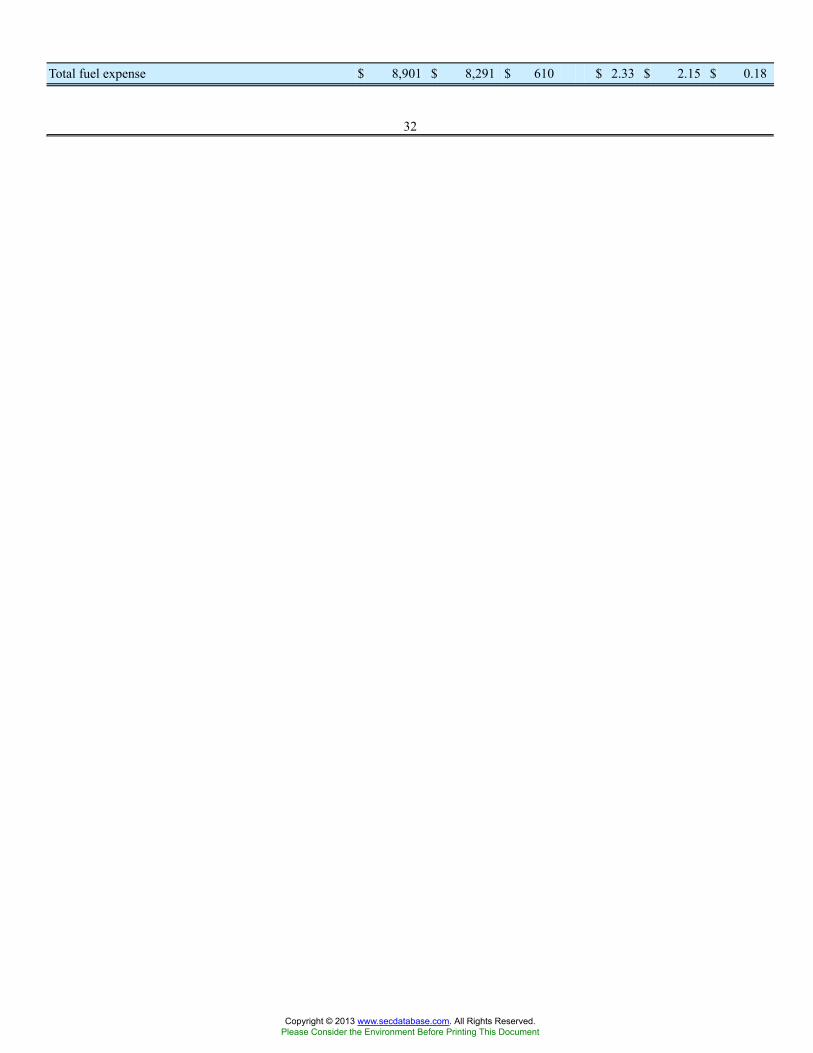
Total fuel expense $ 8,901 $ 8,291 $ 610 $ 2.33 $ 2.15 $ 0.18
32
Copyright © 2013 www.secdatabase.com. All Rights Reserved.Please Consider the Environment Before Printing This Document
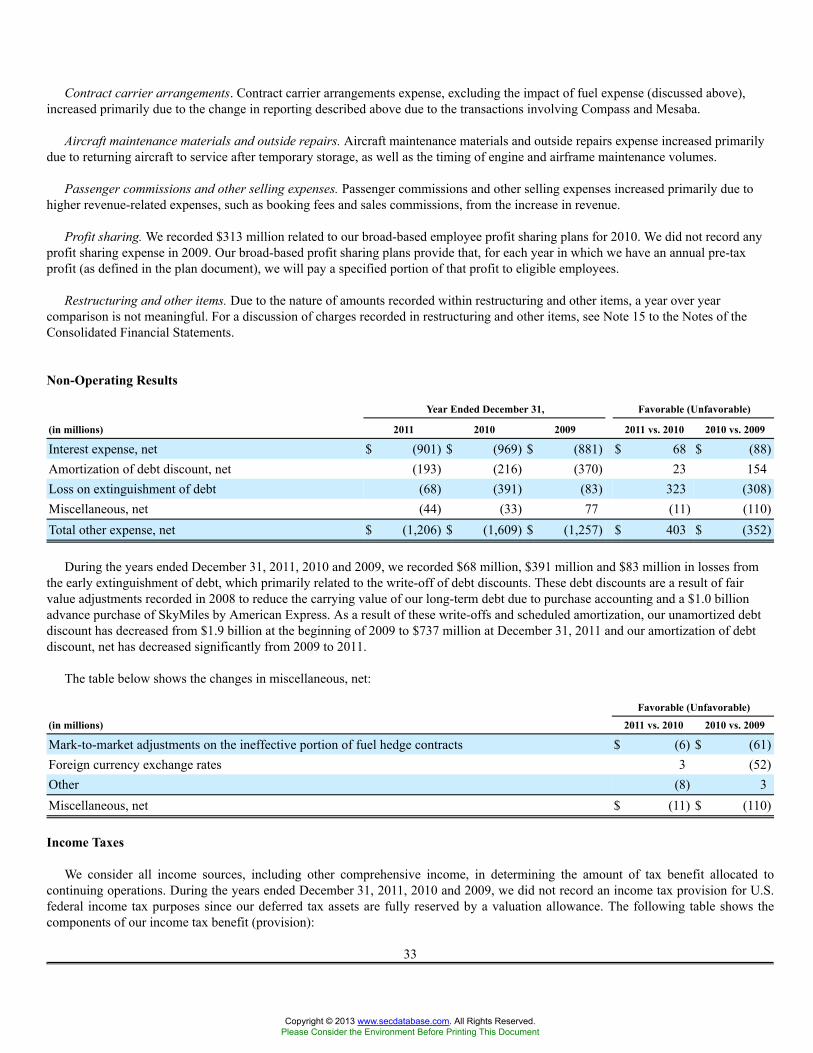
Contract carrier arrangements. Contract carrier arrangements expense, excluding the impact of fuel expense (discussed above),increased primarily due to the change in reporting described above due to the transactions involving Compass and Mesaba.
Aircraft maintenance materials and outside repairs. Aircraft maintenance materials and outside repairs expense increased primarilydue to returning aircraft to service after temporary storage, as well as the timing of engine and airframe maintenance volumes.
Passenger commissions and other selling expenses. Passenger commissions and other selling expenses increased primarily due tohigher revenue-related expenses, such as booking fees and sales commissions, from the increase in revenue.
Profit sharing. We recorded $313 million related to our broad-based employee profit sharing plans for 2010. We did not record anyprofit sharing expense in 2009. Our broad-based profit sharing plans provide that, for each year in which we have an annual pre-taxprofit (as defined in the plan document), we will pay a specified portion of that profit to eligible employees.
Restructuring and other items. Due to the nature of amounts recorded within restructuring and other items, a year over yearcomparison is not meaningful. For a discussion of charges recorded in restructuring and other items, see Note 15 to the Notes of theConsolidated Financial Statements.
Non-Operating Results
Year Ended December 31, Favorable (Unfavorable)
(in millions) 2011 2010 2009 2011 vs. 2010 2010 vs. 2009
Interest expense, net $ (901) $ (969) $ (881) $ 68 $ (88)Amortization of debt discount, net (193) (216) (370) 23 154Loss on extinguishment of debt (68) (391) (83) 323 (308)Miscellaneous, net (44) (33) 77 (11) (110)Total other expense, net $ (1,206) $ (1,609) $ (1,257) $ 403 $ (352)
During the years ended December 31, 2011, 2010 and 2009, we recorded $68 million, $391 million and $83 million in losses fromthe early extinguishment of debt, which primarily related to the write-off of debt discounts. These debt discounts are a result of fairvalue adjustments recorded in 2008 to reduce the carrying value of our long-term debt due to purchase accounting and a $1.0 billionadvance purchase of SkyMiles by American Express. As a result of these write-offs and scheduled amortization, our unamortized debtdiscount has decreased from $1.9 billion at the beginning of 2009 to $737 million at December 31, 2011 and our amortization of debtdiscount, net has decreased significantly from 2009 to 2011.
The table below shows the changes in miscellaneous, net:
Favorable (Unfavorable)
(in millions) 2011 vs. 2010 2010 vs. 2009
Mark-to-market adjustments on the ineffective portion of fuel hedge contracts $ (6) $ (61)Foreign currency exchange rates 3 (52)Other (8) 3Miscellaneous, net $ (11) $ (110)
Income Taxes
We consider all income sources, including other comprehensive income, in determining the amount of tax benefit allocated tocontinuing operations. During the years ended December 31, 2011, 2010 and 2009, we did not record an income tax provision for U.S.federal income tax purposes since our deferred tax assets are fully reserved by a valuation allowance. The following table shows thecomponents of our income tax benefit (provision):
33
Copyright © 2013 www.secdatabase.com. All Rights Reserved.Please Consider the Environment Before Printing This Document
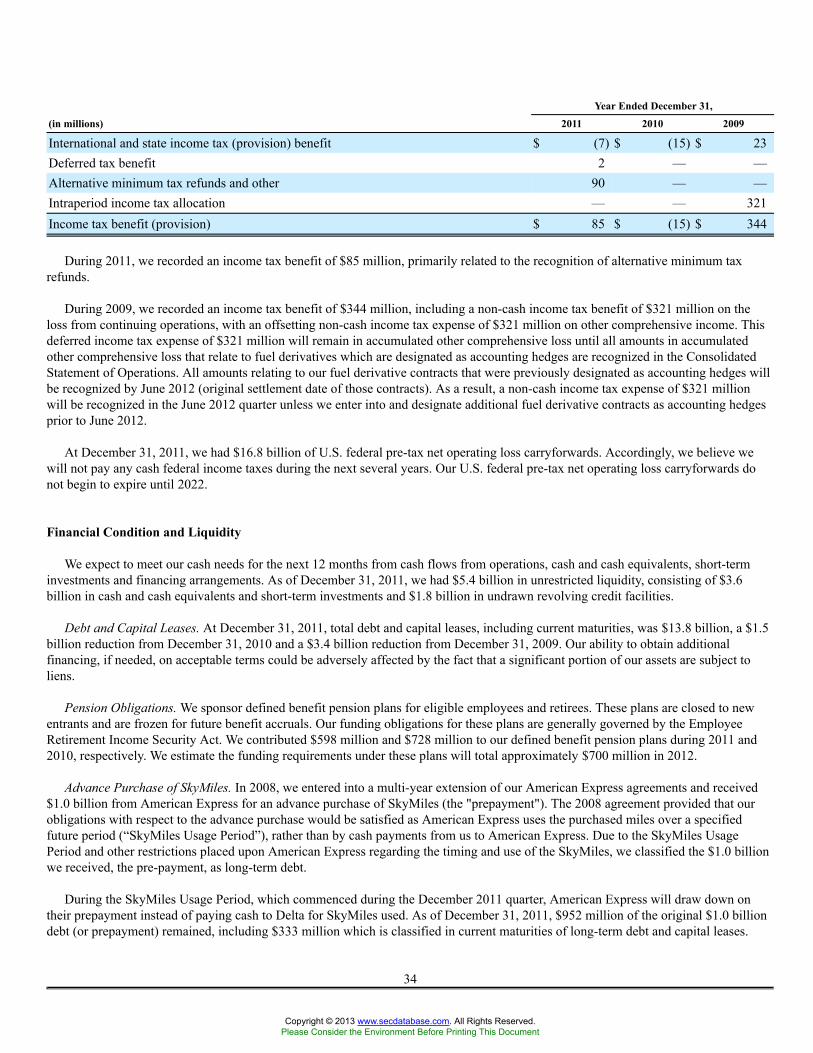
Year Ended December 31,
(in millions) 2011 2010 2009
International and state income tax (provision) benefit $ (7) $ (15) $ 23Deferred tax benefit 2 — —Alternative minimum tax refunds and other 90 — —Intraperiod income tax allocation — — 321Income tax benefit (provision) $ 85 $ (15) $ 344
During 2011, we recorded an income tax benefit of $85 million, primarily related to the recognition of alternative minimum taxrefunds.
During 2009, we recorded an income tax benefit of $344 million, including a non-cash income tax benefit of $321 million on theloss from continuing operations, with an offsetting non-cash income tax expense of $321 million on other comprehensive income. Thisdeferred income tax expense of $321 million will remain in accumulated other comprehensive loss until all amounts in accumulatedother comprehensive loss that relate to fuel derivatives which are designated as accounting hedges are recognized in the ConsolidatedStatement of Operations. All amounts relating to our fuel derivative contracts that were previously designated as accounting hedges willbe recognized by June 2012 (original settlement date of those contracts). As a result, a non-cash income tax expense of $321 millionwill be recognized in the June 2012 quarter unless we enter into and designate additional fuel derivative contracts as accounting hedgesprior to June 2012.
At December 31, 2011, we had $16.8 billion of U.S. federal pre-tax net operating loss carryforwards. Accordingly, we believe wewill not pay any cash federal income taxes during the next several years. Our U.S. federal pre-tax net operating loss carryforwards donot begin to expire until 2022.
Financial Condition and Liquidity
We expect to meet our cash needs for the next 12 months from cash flows from operations, cash and cash equivalents, short-terminvestments and financing arrangements. As of December 31, 2011, we had $5.4 billion in unrestricted liquidity, consisting of $3.6billion in cash and cash equivalents and short-term investments and $1.8 billion in undrawn revolving credit facilities.
Debt and Capital Leases. At December 31, 2011, total debt and capital leases, including current maturities, was $13.8 billion, a $1.5billion reduction from December 31, 2010 and a $3.4 billion reduction from December 31, 2009. Our ability to obtain additionalfinancing, if needed, on acceptable terms could be adversely affected by the fact that a significant portion of our assets are subject toliens.
Pension Obligations. We sponsor defined benefit pension plans for eligible employees and retirees. These plans are closed to newentrants and are frozen for future benefit accruals. Our funding obligations for these plans are generally governed by the EmployeeRetirement Income Security Act. We contributed $598 million and $728 million to our defined benefit pension plans during 2011 and2010, respectively. We estimate the funding requirements under these plans will total approximately $700 million in 2012.
Advance Purchase of SkyMiles. In 2008, we entered into a multi-year extension of our American Express agreements and received$1.0 billion from American Express for an advance purchase of SkyMiles (the "prepayment"). The 2008 agreement provided that ourobligations with respect to the advance purchase would be satisfied as American Express uses the purchased miles over a specifiedfuture period (“SkyMiles Usage Period”), rather than by cash payments from us to American Express. Due to the SkyMiles UsagePeriod and other restrictions placed upon American Express regarding the timing and use of the SkyMiles, we classified the $1.0 billionwe received, the pre-payment, as long-term debt.
During the SkyMiles Usage Period, which commenced during the December 2011 quarter, American Express will draw down ontheir prepayment instead of paying cash to Delta for SkyMiles used. As of December 31, 2011, $952 million of the original $1.0 billiondebt (or prepayment) remained, including $333 million which is classified in current maturities of long-term debt and capital leases.
34
Copyright © 2013 www.secdatabase.com. All Rights Reserved.Please Consider the Environment Before Printing This Document
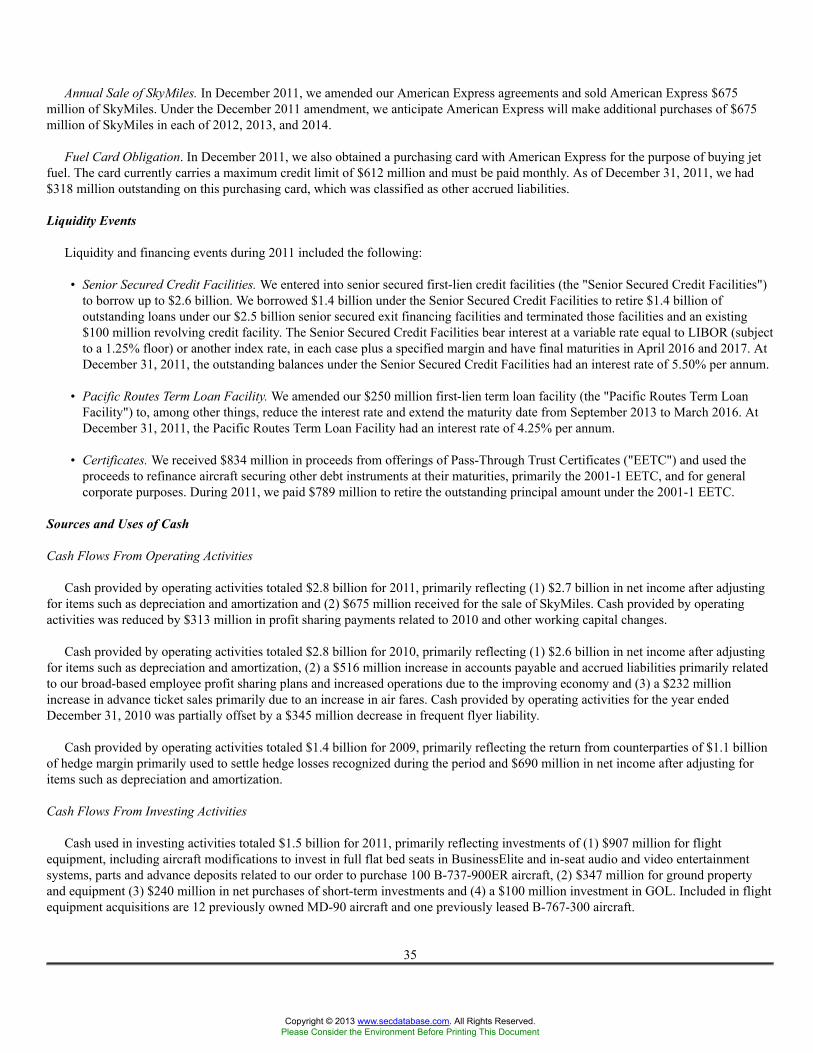
Annual Sale of SkyMiles. In December 2011, we amended our American Express agreements and sold American Express $675million of SkyMiles. Under the December 2011 amendment, we anticipate American Express will make additional purchases of $675million of SkyMiles in each of 2012, 2013, and 2014.
Fuel Card Obligation. In December 2011, we also obtained a purchasing card with American Express for the purpose of buying jetfuel. The card currently carries a maximum credit limit of $612 million and must be paid monthly. As of December 31, 2011, we had$318 million outstanding on this purchasing card, which was classified as other accrued liabilities.
Liquidity Events
Liquidity and financing events during 2011 included the following:
• Senior Secured Credit Facilities. We entered into senior secured first-lien credit facilities (the "Senior Secured Credit Facilities")to borrow up to $2.6 billion. We borrowed $1.4 billion under the Senior Secured Credit Facilities to retire $1.4 billion ofoutstanding loans under our $2.5 billion senior secured exit financing facilities and terminated those facilities and an existing$100 million revolving credit facility. The Senior Secured Credit Facilities bear interest at a variable rate equal to LIBOR (subjectto a 1.25% floor) or another index rate, in each case plus a specified margin and have final maturities in April 2016 and 2017. AtDecember 31, 2011, the outstanding balances under the Senior Secured Credit Facilities had an interest rate of 5.50% per annum.
• Pacific Routes Term Loan Facility. We amended our $250 million first-lien term loan facility (the "Pacific Routes Term LoanFacility") to, among other things, reduce the interest rate and extend the maturity date from September 2013 to March 2016. AtDecember 31, 2011, the Pacific Routes Term Loan Facility had an interest rate of 4.25% per annum.
• Certificates. We received $834 million in proceeds from offerings of Pass-Through Trust Certificates ("EETC") and used theproceeds to refinance aircraft securing other debt instruments at their maturities, primarily the 2001-1 EETC, and for generalcorporate purposes. During 2011, we paid $789 million to retire the outstanding principal amount under the 2001-1 EETC.
Sources and Uses of Cash
Cash Flows From Operating Activities
Cash provided by operating activities totaled $2.8 billion for 2011, primarily reflecting (1) $2.7 billion in net income after adjustingfor items such as depreciation and amortization and (2) $675 million received for the sale of SkyMiles. Cash provided by operatingactivities was reduced by $313 million in profit sharing payments related to 2010 and other working capital changes.
Cash provided by operating activities totaled $2.8 billion for 2010, primarily reflecting (1) $2.6 billion in net income after adjustingfor items such as depreciation and amortization, (2) a $516 million increase in accounts payable and accrued liabilities primarily relatedto our broad-based employee profit sharing plans and increased operations due to the improving economy and (3) a $232 millionincrease in advance ticket sales primarily due to an increase in air fares. Cash provided by operating activities for the year endedDecember 31, 2010 was partially offset by a $345 million decrease in frequent flyer liability.
Cash provided by operating activities totaled $1.4 billion for 2009, primarily reflecting the return from counterparties of $1.1 billionof hedge margin primarily used to settle hedge losses recognized during the period and $690 million in net income after adjusting foritems such as depreciation and amortization.
Cash Flows From Investing Activities
Cash used in investing activities totaled $1.5 billion for 2011, primarily reflecting investments of (1) $907 million for flightequipment, including aircraft modifications to invest in full flat bed seats in BusinessElite and in-seat audio and video entertainmentsystems, parts and advance deposits related to our order to purchase 100 B-737-900ER aircraft, (2) $347 million for ground propertyand equipment (3) $240 million in net purchases of short-term investments and (4) a $100 million investment in GOL. Included in flightequipment acquisitions are 12 previously owned MD-90 aircraft and one previously leased B-767-300 aircraft.
35
Copyright © 2013 www.secdatabase.com. All Rights Reserved.Please Consider the Environment Before Printing This Document
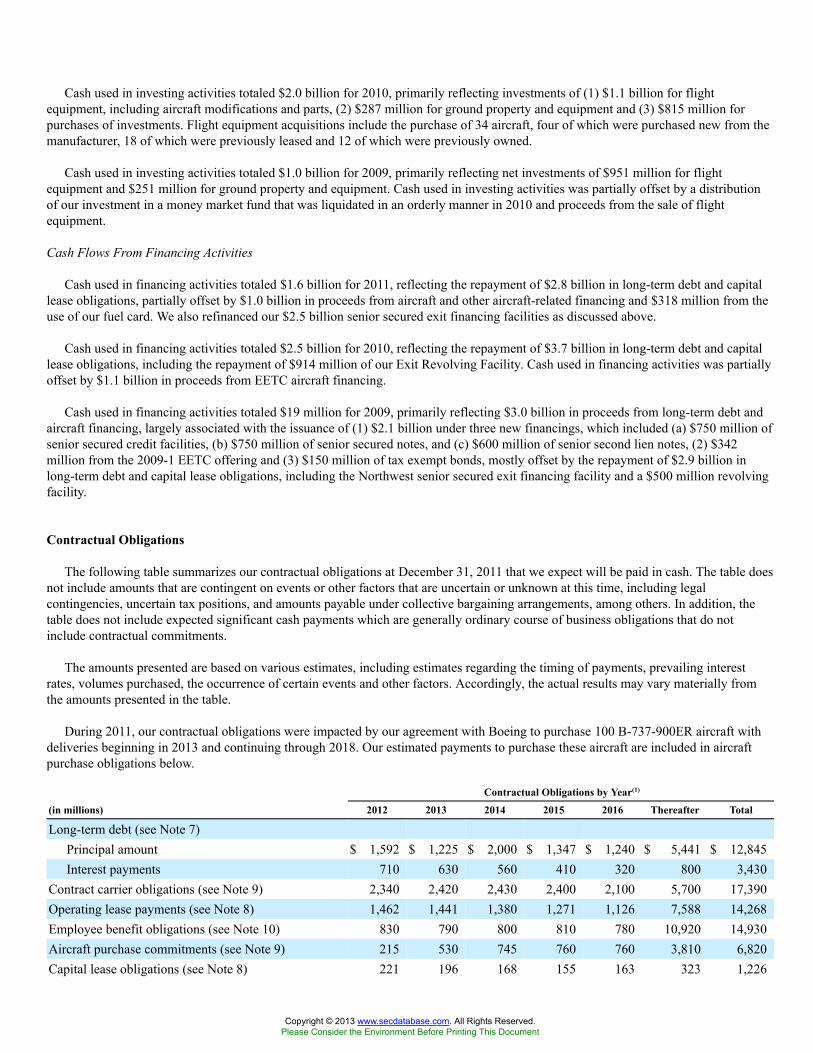
Cash used in investing activities totaled $2.0 billion for 2010, primarily reflecting investments of (1) $1.1 billion for flightequipment, including aircraft modifications and parts, (2) $287 million for ground property and equipment and (3) $815 million forpurchases of investments. Flight equipment acquisitions include the purchase of 34 aircraft, four of which were purchased new from themanufacturer, 18 of which were previously leased and 12 of which were previously owned.
Cash used in investing activities totaled $1.0 billion for 2009, primarily reflecting net investments of $951 million for flightequipment and $251 million for ground property and equipment. Cash used in investing activities was partially offset by a distributionof our investment in a money market fund that was liquidated in an orderly manner in 2010 and proceeds from the sale of flightequipment.
Cash Flows From Financing Activities
Cash used in financing activities totaled $1.6 billion for 2011, reflecting the repayment of $2.8 billion in long-term debt and capitallease obligations, partially offset by $1.0 billion in proceeds from aircraft and other aircraft-related financing and $318 million from theuse of our fuel card. We also refinanced our $2.5 billion senior secured exit financing facilities as discussed above.
Cash used in financing activities totaled $2.5 billion for 2010, reflecting the repayment of $3.7 billion in long-term debt and capitallease obligations, including the repayment of $914 million of our Exit Revolving Facility. Cash used in financing activities was partiallyoffset by $1.1 billion in proceeds from EETC aircraft financing.
Cash used in financing activities totaled $19 million for 2009, primarily reflecting $3.0 billion in proceeds from long-term debt andaircraft financing, largely associated with the issuance of (1) $2.1 billion under three new financings, which included (a) $750 million ofsenior secured credit facilities, (b) $750 million of senior secured notes, and (c) $600 million of senior second lien notes, (2) $342million from the 2009-1 EETC offering and (3) $150 million of tax exempt bonds, mostly offset by the repayment of $2.9 billion inlong-term debt and capital lease obligations, including the Northwest senior secured exit financing facility and a $500 million revolvingfacility.
Contractual Obligations
The following table summarizes our contractual obligations at December 31, 2011 that we expect will be paid in cash. The table doesnot include amounts that are contingent on events or other factors that are uncertain or unknown at this time, including legalcontingencies, uncertain tax positions, and amounts payable under collective bargaining arrangements, among others. In addition, thetable does not include expected significant cash payments which are generally ordinary course of business obligations that do notinclude contractual commitments.
The amounts presented are based on various estimates, including estimates regarding the timing of payments, prevailing interestrates, volumes purchased, the occurrence of certain events and other factors. Accordingly, the actual results may vary materially fromthe amounts presented in the table.
During 2011, our contractual obligations were impacted by our agreement with Boeing to purchase 100 B-737-900ER aircraft withdeliveries beginning in 2013 and continuing through 2018. Our estimated payments to purchase these aircraft are included in aircraftpurchase obligations below.
Contractual Obligations by Year(1)
(in millions) 2012 2013 2014 2015 2016 Thereafter Total
Long-term debt (see Note 7)Principal amount $ 1,592 $ 1,225 $ 2,000 $ 1,347 $ 1,240 $ 5,441 $ 12,845Interest payments 710 630 560 410 320 800 3,430
Contract carrier obligations (see Note 9) 2,340 2,420 2,430 2,400 2,100 5,700 17,390Operating lease payments (see Note 8) 1,462 1,441 1,380 1,271 1,126 7,588 14,268Employee benefit obligations (see Note 10) 830 790 800 810 780 10,920 14,930Aircraft purchase commitments (see Note 9) 215 530 745 760 760 3,810 6,820Capital lease obligations (see Note 8) 221 196 168 155 163 323 1,226
Copyright © 2013 www.secdatabase.com. All Rights Reserved.Please Consider the Environment Before Printing This Document
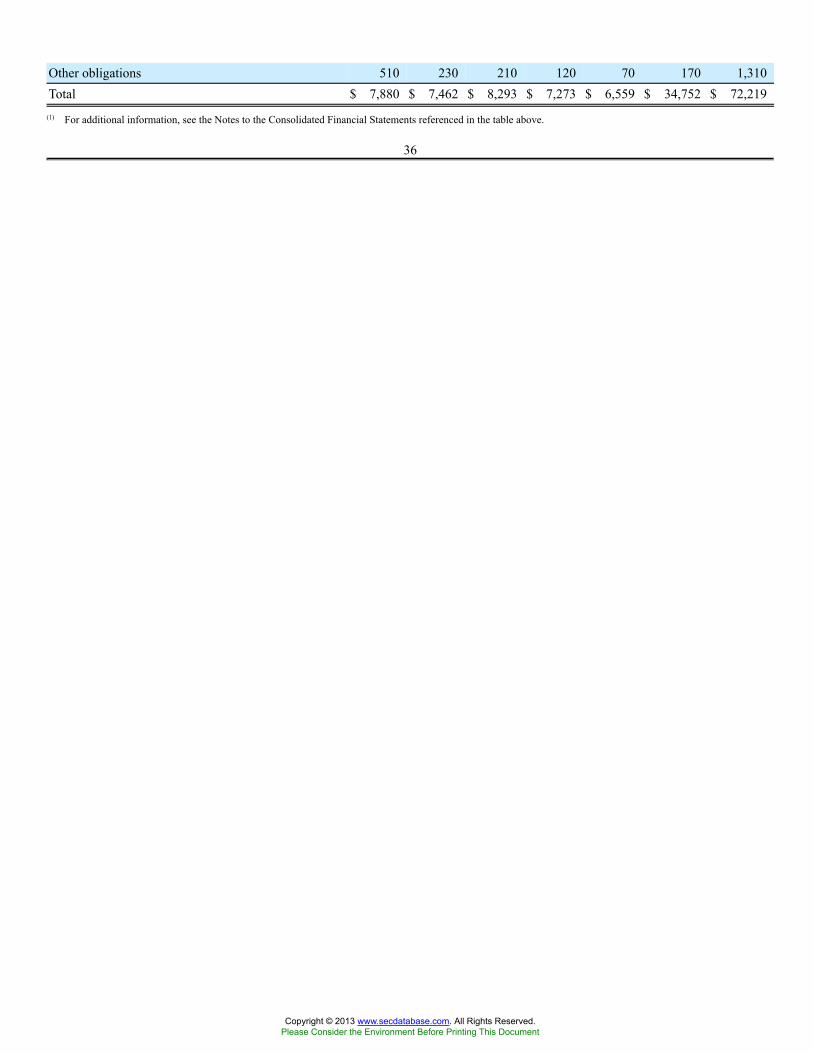
Other obligations 510 230 210 120 70 170 1,310Total $ 7,880 $ 7,462 $ 8,293 $ 7,273 $ 6,559 $ 34,752 $ 72,219
(1) For additional information, see the Notes to the Consolidated Financial Statements referenced in the table above.
36
Copyright © 2013 www.secdatabase.com. All Rights Reserved.Please Consider the Environment Before Printing This Document
Long-Term Debt, Principal Amount. Represents scheduled principal payments on long-term debt. The table excludes amountsreceived from American Express for its advance purchase of SkyMiles because this obligation will be satisfied by American Express'use of SkyMiles over a specified period rather than by cash payments from us. For additional information about our agreements withAmerican Express, see Note 6 of the Notes to the Consolidated Financial Statements.
Long-Term Debt, Interest Payments. Represents estimated interest payments under our long-term debt based on the interest ratesspecified in the applicable debt agreements. Interest payments on variable interest rate debt were calculated using LIBOR atDecember 31, 2011.
Contract Carrier Obligations. Represents our estimated minimum fixed obligations under capacity purchase agreements withregional carriers (excluding Comair). The reported amounts are based on (1) the required minimum levels of flying by our contractcarriers under the applicable agreements and (2) assumptions regarding the costs associated with such minimum levels of flying.
Employee Benefit Obligations. Represents primarily (1) our estimated minimum required funding for our qualified defined benefitpension plans based on actuarially determined estimates and (2) projected future benefit payments from our unfunded postretirementand postemployment plans. For additional information about our employee benefit obligations, see “Critical Accounting Policies andEstimates”.
Aircraft Purchase Commitments. Represents primarily our commitments to purchase 100 B-737-900ER aircraft, 18 B-787-8 aircraftand nine previously owned MD-90 aircraft.
Other Obligations. Represents primarily estimated purchase obligations under which we are required to make minimum paymentsfor goods and services, including but not limited to insurance, marketing, maintenance, technology, sponsorships and other third partyservices and products.
Critical Accounting Policies and Estimates
Our critical accounting policies and estimates are those that require significant judgments and estimates. Accordingly, the actualresults may differ materially from these estimates. For a discussion of these and other accounting policies, see Note 1 of the Notes to theConsolidated Financial Statements.
Frequent Flyer Program
Our frequent flyer program (the “SkyMiles Program”) offers incentives to travel on Delta. This program allows customers to earnmileage credits by flying on Delta, regional air carriers with which we have contract carrier agreements and airlines that participate inthe SkyMiles Program, as well as through participating companies such as credit card companies, hotels and car rental agencies. Wealso sell mileage credits to non-airline businesses, customers and other airlines.
The SkyMiles Program includes two types of transactions that are considered revenue arrangements with multiple deliverables. Asdiscussed below, these are (1) passenger ticket sales earning mileage credits and (2) the sale of mileage credits to participatingcompanies with which we have marketing agreements. Mileage credits are a separate unit of accounting as they can be redeemed bycustomers in future periods for air travel on Delta and participating airlines, membership in our Sky Club and other program awards.
Passenger Ticket Sales Earning Mileage Credits. Passenger ticket sales earning mileage credits under our SkyMiles Program providecustomers with two deliverables: (1) mileage credits earned and (2) air transportation. Effective January 1, 2011, we began applying theprovisions of Revenue Arrangements with Multiple Deliverables ("ASU 2009-13") to passenger tickets earning mileage credits. UnderASU 2009-13, we value each deliverable on a standalone basis. Our estimate of the standalone selling price of a mileage credit is basedon an analysis of our sales of mileage credits to other airlines and customers and is re-evaluated at least annually. We use establishedticket prices to determine the standalone selling price of air transportation. We allocate the total amount collected from passenger ticketsales between the deliverables based on their relative selling prices.
37
Copyright © 2013 www.secdatabase.com. All Rights Reserved.Please Consider the Environment Before Printing This Document
We defer revenue from the mileage credit component of passenger ticket sales and recognize it as passenger revenue when miles areredeemed and services are provided. We record the portion of the passenger ticket sales for air transportation in air traffic liability andrecognize these amounts in passenger revenue when we provide transportation or when the ticket expires unused. The adoption of ASU2009-13 did not have a material impact on the timing of revenue recognition or its classification with regard to passenger tickets earningmileage credits. A hypothetical 10% increase in our estimate of the standalone selling price of a mileage credit would decreasepassenger revenue by approximately $50 million, as a result of an increase in the amount of revenue deferred from the mileagecomponent of passenger ticket sales.
Prior to the adoption of ASU 2009-13, we used the residual method for revenue recognition. Under the residual method, wedetermined the fair value of the mileage credit component based on prices at which we sold mileage credits to other airlines and thenconsidered the remainder of the amount collected to be the air transportation deliverable.
Sale of Mileage Credits. Customers may earn mileage credits through participating companies such as credit card companies, hotelsand car rental agencies with which we have marketing agreements to sell mileage credits. Our contracts to sell mileage credits underthese marketing agreements have two deliverables: (1) the mileage credits redeemable for future travel and (2) the marketingcomponent.
ASU 2009-13 does not apply to contracts to sell mileage credits entered into prior to January 1, 2011 unless those contracts arematerially modified. As of December 31, 2011, we had not materially modified any of our significant agreements. Our most significantcontract to sell mileage credits relates to our co-brand credit card relationship with American Express. For additional information aboutthis relationship, see Note 6. For contracts entered into prior to January 1, 2011 that have not been materially modified since January 1,2011, we continue to use the residual method for revenue recognition and value only the mileage credits. Under the residual method, theportion of the revenue from the mileage component is deferred and recognized as passenger revenue when miles are redeemed andservices are provided. The portion of the revenue received in excess of the fair value of mileage credits sold, the marketing component,is recognized in income as other revenue when the related marketing services are provided. The fair value of a mileage credit isdetermined based on prices at which we sell mileage credits to other airlines and is re-evaluated at least annually.
If we enter into new contracts or materially modify existing contracts to sell mileage credits related to our SkyMiles Program, wewill value the standalone selling price of the marketing component and allocate the revenue from the contract based on the relativeselling price of the mileage credits and the marketing component. A material modification of an existing contract could impact ourdeferral rate or cause an adjustment to our deferred revenue balance, which could materially impact our future financial results.
Breakage. For mileage credits which we estimate are not likely to be redeemed (“Breakage”), we recognize the associated valueproportionally during the period in which the remaining mileage credits are expected to be redeemed. The estimate of Breakage is basedon historical redemption patterns. A change in assumptions as to the period over which mileage credits are expected to be redeemed, theactual redemption activity for mileage credits or the estimated fair value of mileage credits expected to be redeemed could have amaterial impact on our revenue in the year in which the change occurs and in future years. At December 31, 2011, the aggregatedeferred revenue balance associated with the SkyMiles Program was $4.5 billion. A hypothetical 1% change in the number ofoutstanding miles estimated to be redeemed would result in a $31 million impact on our deferred revenue liability at December 31,2011.
Goodwill and Other Intangible Assets
We apply a fair value-based impairment test to the net book value of goodwill and indefinite-lived intangible assets on an annual basis(as of October 1) and, if certain events or circumstances indicate that an impairment loss may have been incurred, on an interim basis. InSeptember 2011, the FASB issued "Testing Goodwill for Impairment." The standard revises the way in which entities test goodwill forimpairment. We adopted this standard and applied its provisions to our annual goodwill impairment test in the December 2011 quarter.
Key Assumptions. The key assumptions in our impairment tests include (1) our projected revenues, expenses and cash flows, (2) anestimated weighted average cost of capital, (3) assumed discount rates depending on the asset and (4) a tax rate. These assumptions areconsistent with those hypothetical market participants would use. Since we are required to make estimates and assumptions whenevaluating goodwill and indefinite-lived intangible assets for impairment, the actual amounts may differ materially from these estimates.
38
Copyright © 2013 www.secdatabase.com. All Rights Reserved.Please Consider the Environment Before Printing This Document
Changes in assumptions or circumstances could result in impairment. Factors which could cause impairment include, but are notlimited to, (1) negative trends in our market capitalization, (2) an increase in fuel prices, (3) declining passenger mile yields, (4) lowerpassenger demand as a result of the weakened U.S. and global economy, (5) interruption to our operations due to an employee strike,terrorist attack, or other reasons, (6) changes to the regulatory environment and (7) consolidation of competitors in the airline industry.
Goodwill. As of December 31, 2011 and 2010, our goodwill balance was $9.8 billion. In evaluating goodwill for impairment, weestimate the fair value of our reporting unit by considering market capitalization and other factors if it is more likely than not that thefair value of our reporting unit is less than its carrying value. If the reporting unit's fair value exceeds its carrying value, no furthertesting is required. If, however, the reporting unit's carrying value exceeds its fair value, we then determine the amount of theimpairment charge, if any. We recognize an impairment charge if the carrying value of the reporting unit's goodwill exceeds itsestimated fair value.
Identifiable Intangible Assets. Our identifiable intangible assets had a net carrying amount of $4.8 billion at December 31, 2011.Indefinite-lived assets are not amortized and consist primarily of routes, slots, the Delta tradename and assets related to SkyTeam.Definite-lived intangible assets consist primarily of marketing agreements and contracts and are amortized on a straight-line basis orunder the undiscounted cash flows method over the estimated economic life of the respective agreements and contracts.
We perform the impairment test for indefinite-lived intangible assets by comparing the asset's fair value to its carrying value. Fairvalue is estimated based on (1) recent market transactions, where available, (2) the lease savings method for certain airport slots (whichreflects potential lease savings from owning the slots rather than leasing them from another airline at market rates), (3) the royaltymethod for the Delta tradename (which assumes hypothetical royalties generated from using our tradename) or (4) projected discountedfuture cash flows. We recognize an impairment charge if the asset's carrying value exceeds its estimated fair value.
Long-Lived Assets
Our flight equipment and other long-lived assets have a recorded value of $20.2 billion at December 31, 2011. This value is based onvarious factors, including the assets' estimated useful lives and salvage values. We record impairment losses on flight equipment andother long-lived assets used in operations when events and circumstances indicate the assets may be impaired and the estimated futurecash flows generated by those assets are less than their carrying amounts. Factors which could cause impairment include, but are notlimited to, (1) a decision to permanently remove flight equipment or other long-lived assets from operations, (2) significant changes inthe estimated useful life, (3) significant changes in projected cash flows, (4) permanent and significant declines in fleet fair values and(5) changes to the regulatory environment. For long-lived assets held for sale, we discontinue depreciation and record impairment losseswhen the carrying amount of these assets is greater than the fair value less the cost to sell.
To determine whether impairments exist for aircraft used in operations, we group assets at the fleet-type level (the lowest level forwhich there are identifiable cash flows) and then estimate future cash flows based on projections of capacity, passenger mile yield, fuelcosts, labor costs and other relevant factors. If an impairment occurs, the impairment loss recognized is the amount by which theaircraft's carrying amount exceeds its estimated fair value. We estimate aircraft fair values using published sources, appraisals and bidsreceived from third parties, as available.
Income Tax Valuation Allowance
We periodically assess whether it is more likely than not that we will generate sufficient taxable income to realize our deferredincome tax assets and establish valuation allowances if it is not likely we will realize our deferred income tax assets. In making thisdetermination, we consider all available positive and negative evidence and make certain assumptions. We consider, among other things,our deferred tax liabilities, the overall business environment, our historical financial results, our industry's historically cyclical financialresults and potential current and future tax planning strategies. We cannot presently determine when we will be able to generatesufficient taxable income to realize our deferred tax assets. Accordingly, we have recorded a full valuation allowance totaling $10.7billion against our net deferred tax assets. If we determine that it is more likely than not that we will generate sufficient taxable incometo realize our deferred income tax assets, we will reverse our valuation allowance (in full or in part), resulting in a significant income taxbenefit in the period such a determination is made.
39
Copyright © 2013 www.secdatabase.com. All Rights Reserved.Please Consider the Environment Before Printing This Document
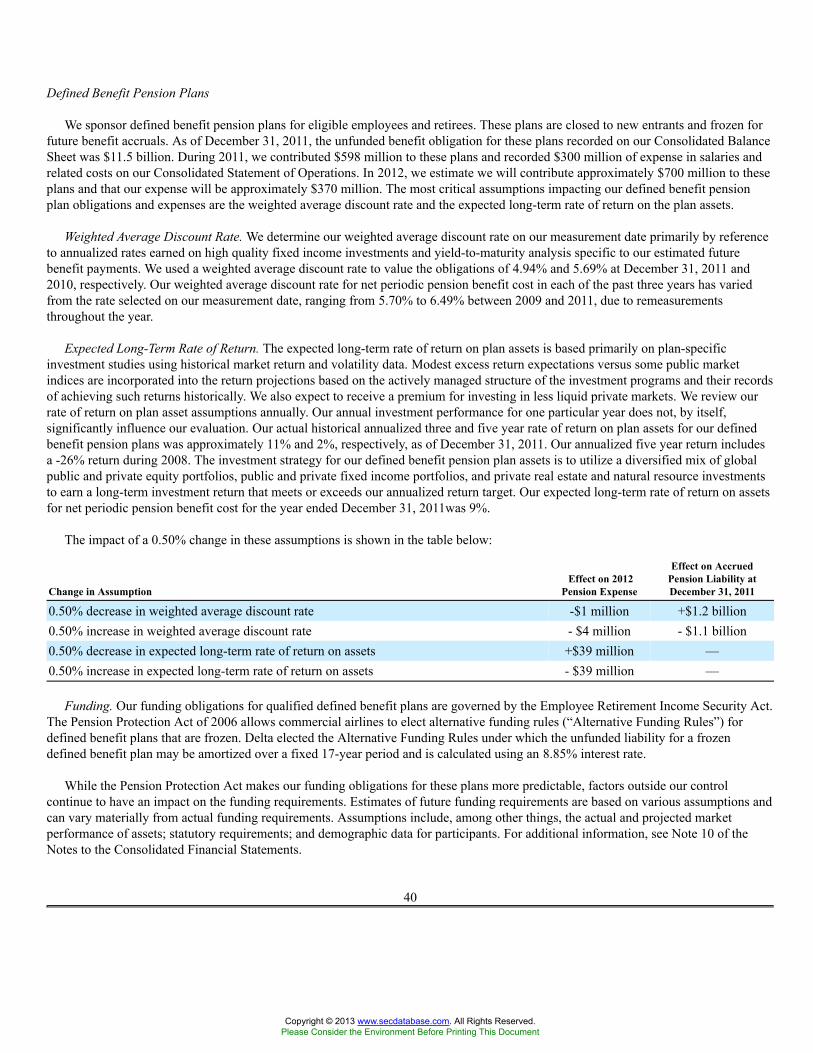
Defined Benefit Pension Plans
We sponsor defined benefit pension plans for eligible employees and retirees. These plans are closed to new entrants and frozen forfuture benefit accruals. As of December 31, 2011, the unfunded benefit obligation for these plans recorded on our Consolidated BalanceSheet was $11.5 billion. During 2011, we contributed $598 million to these plans and recorded $300 million of expense in salaries andrelated costs on our Consolidated Statement of Operations. In 2012, we estimate we will contribute approximately $700 million to theseplans and that our expense will be approximately $370 million. The most critical assumptions impacting our defined benefit pensionplan obligations and expenses are the weighted average discount rate and the expected long-term rate of return on the plan assets.
Weighted Average Discount Rate. We determine our weighted average discount rate on our measurement date primarily by referenceto annualized rates earned on high quality fixed income investments and yield-to-maturity analysis specific to our estimated futurebenefit payments. We used a weighted average discount rate to value the obligations of 4.94% and 5.69% at December 31, 2011 and2010, respectively. Our weighted average discount rate for net periodic pension benefit cost in each of the past three years has variedfrom the rate selected on our measurement date, ranging from 5.70% to 6.49% between 2009 and 2011, due to remeasurementsthroughout the year.
Expected Long-Term Rate of Return. The expected long-term rate of return on plan assets is based primarily on plan-specificinvestment studies using historical market return and volatility data. Modest excess return expectations versus some public marketindices are incorporated into the return projections based on the actively managed structure of the investment programs and their recordsof achieving such returns historically. We also expect to receive a premium for investing in less liquid private markets. We review ourrate of return on plan asset assumptions annually. Our annual investment performance for one particular year does not, by itself,significantly influence our evaluation. Our actual historical annualized three and five year rate of return on plan assets for our definedbenefit pension plans was approximately 11% and 2%, respectively, as of December 31, 2011. Our annualized five year return includesa -26% return during 2008. The investment strategy for our defined benefit pension plan assets is to utilize a diversified mix of globalpublic and private equity portfolios, public and private fixed income portfolios, and private real estate and natural resource investmentsto earn a long-term investment return that meets or exceeds our annualized return target. Our expected long-term rate of return on assetsfor net periodic pension benefit cost for the year ended December 31, 2011was 9%.
The impact of a 0.50% change in these assumptions is shown in the table below:
Change in AssumptionEffect on 2012
Pension Expense
Effect on AccruedPension Liability atDecember 31, 2011
0.50% decrease in weighted average discount rate -$1 million +$1.2 billion0.50% increase in weighted average discount rate - $4 million - $1.1 billion0.50% decrease in expected long-term rate of return on assets +$39 million —0.50% increase in expected long-term rate of return on assets - $39 million —
Funding. Our funding obligations for qualified defined benefit plans are governed by the Employee Retirement Income Security Act.The Pension Protection Act of 2006 allows commercial airlines to elect alternative funding rules (“Alternative Funding Rules”) fordefined benefit plans that are frozen. Delta elected the Alternative Funding Rules under which the unfunded liability for a frozendefined benefit plan may be amortized over a fixed 17-year period and is calculated using an 8.85% interest rate.
While the Pension Protection Act makes our funding obligations for these plans more predictable, factors outside our controlcontinue to have an impact on the funding requirements. Estimates of future funding requirements are based on various assumptions andcan vary materially from actual funding requirements. Assumptions include, among other things, the actual and projected marketperformance of assets; statutory requirements; and demographic data for participants. For additional information, see Note 10 of theNotes to the Consolidated Financial Statements.
40
Copyright © 2013 www.secdatabase.com. All Rights Reserved.Please Consider the Environment Before Printing This Document
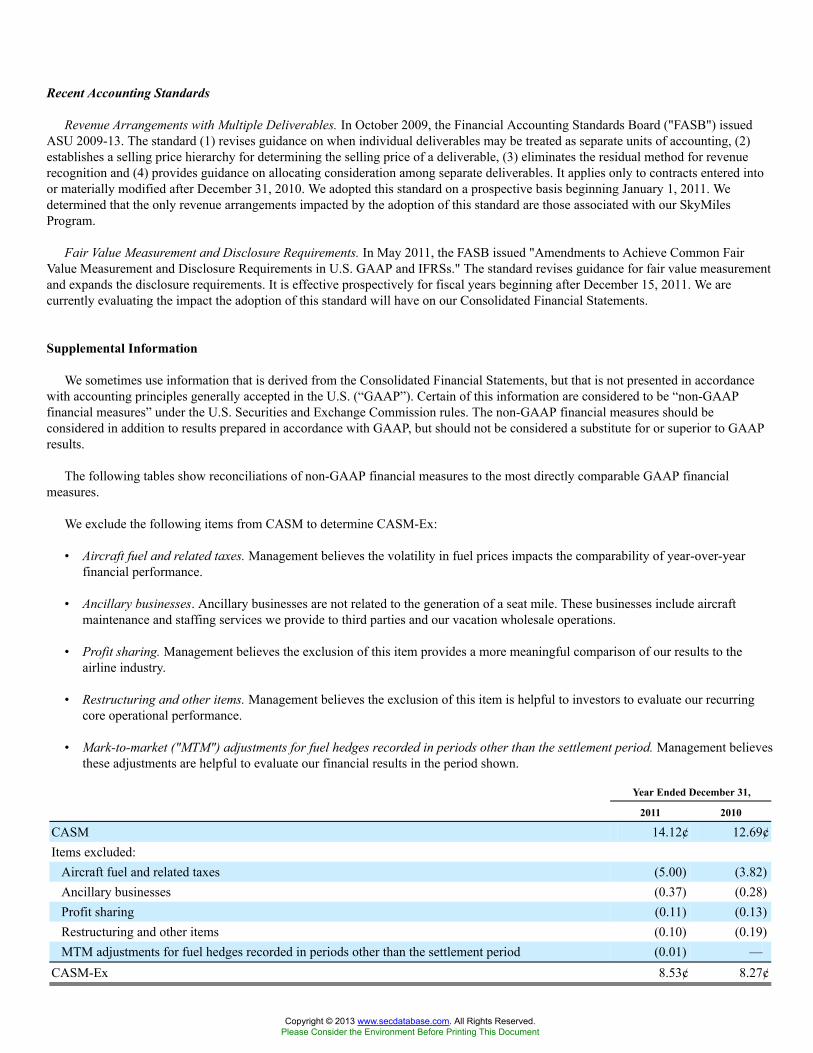
Recent Accounting Standards
Revenue Arrangements with Multiple Deliverables. In October 2009, the Financial Accounting Standards Board ("FASB") issuedASU 2009-13. The standard (1) revises guidance on when individual deliverables may be treated as separate units of accounting, (2)establishes a selling price hierarchy for determining the selling price of a deliverable, (3) eliminates the residual method for revenuerecognition and (4) provides guidance on allocating consideration among separate deliverables. It applies only to contracts entered intoor materially modified after December 31, 2010. We adopted this standard on a prospective basis beginning January 1, 2011. Wedetermined that the only revenue arrangements impacted by the adoption of this standard are those associated with our SkyMilesProgram.
Fair Value Measurement and Disclosure Requirements. In May 2011, the FASB issued "Amendments to Achieve Common FairValue Measurement and Disclosure Requirements in U.S. GAAP and IFRSs." The standard revises guidance for fair value measurementand expands the disclosure requirements. It is effective prospectively for fiscal years beginning after December 15, 2011. We arecurrently evaluating the impact the adoption of this standard will have on our Consolidated Financial Statements.
Supplemental Information
We sometimes use information that is derived from the Consolidated Financial Statements, but that is not presented in accordancewith accounting principles generally accepted in the U.S. (“GAAP”). Certain of this information are considered to be “non-GAAPfinancial measures” under the U.S. Securities and Exchange Commission rules. The non-GAAP financial measures should beconsidered in addition to results prepared in accordance with GAAP, but should not be considered a substitute for or superior to GAAPresults.
The following tables show reconciliations of non-GAAP financial measures to the most directly comparable GAAP financialmeasures.
We exclude the following items from CASM to determine CASM-Ex:
• Aircraft fuel and related taxes. Management believes the volatility in fuel prices impacts the comparability of year-over-yearfinancial performance.
• Ancillary businesses. Ancillary businesses are not related to the generation of a seat mile. These businesses include aircraftmaintenance and staffing services we provide to third parties and our vacation wholesale operations.
• Profit sharing. Management believes the exclusion of this item provides a more meaningful comparison of our results to theairline industry.
• Restructuring and other items. Management believes the exclusion of this item is helpful to investors to evaluate our recurringcore operational performance.
• Mark-to-market ("MTM") adjustments for fuel hedges recorded in periods other than the settlement period. Management believesthese adjustments are helpful to evaluate our financial results in the period shown.
Year Ended December 31,
2011 2010
CASM 14.12¢ 12.69¢Items excluded:
Aircraft fuel and related taxes (5.00) (3.82)Ancillary businesses (0.37) (0.28)Profit sharing (0.11) (0.13)Restructuring and other items (0.10) (0.19)MTM adjustments for fuel hedges recorded in periods other than the settlement period (0.01) —
CASM-Ex 8.53¢ 8.27¢
Copyright © 2013 www.secdatabase.com. All Rights Reserved.Please Consider the Environment Before Printing This Document

41
Copyright © 2013 www.secdatabase.com. All Rights Reserved.Please Consider the Environment Before Printing This Document
The following table reconciles average price per fuel gallon to average price per fuel gallon, adjusted for MTM adjustments for fuelhedges recorded in periods other than the settlement period. These mark-to-market adjustments are based on market prices as of the endof the reporting period. Such market prices are not necessarily indicative of the actual future cash value of the underlying hedge in thecontract settlement period. Therefore, Delta adjusts fuel expense for these items to arrive at a more meaningful measure of fuel cost.
Year Ended December 31,
2011 2008
Average price per fuel gallon(1) $ 3.06 $ 3.16MTM adjustments for fuel hedges recorded in periods other than the settlement period (0.01) (0.03)Average price per fuel gallon, adjusted $ 3.05 $ 3.13
(1) Includes fuel expense incurred under contract carriers arrangements and the impact of fuel hedge activity
Glossary of Defined Terms
ASM - Available Seat Mile. A measure of capacity. ASMs equal the total number of seats available for transporting passengersduring a reporting period multiplied by the total number of miles flown during that period.
CASM - (Operating) Cost per Available Seat Mile. The amount of operating cost incurred per ASM during a reporting period.
CASM-Ex - The amount of operating cost incurred per ASM during a reporting period, excluding aircraft fuel and related taxes,ancillary businesses, profit sharing, restructuring and other items and MTM adjustments for fuel hedges recorded in periods other thanthe settlement period.
Passenger Load Factor - A measure of utilized available seating capacity calculated by dividing RPMs by ASMs for a reportingperiod.
Passenger Mile Yield or Yield - The amount of passenger revenue earned per RPM during a reporting period.
PRASM - Passenger Revenue per ASM. The amount of passenger revenue earned per ASM during a reporting period. PRASM isalso referred to as “unit revenue.”
RPM - Revenue Passenger Mile. One revenue-paying passenger transported one mile. RPMs equal the number of revenue passengersduring a reporting period multiplied by the number of miles flown by those passengers during that period. RPMs are also referred to as“traffic.”
42
Copyright © 2013 www.secdatabase.com. All Rights Reserved.Please Consider the Environment Before Printing This Document
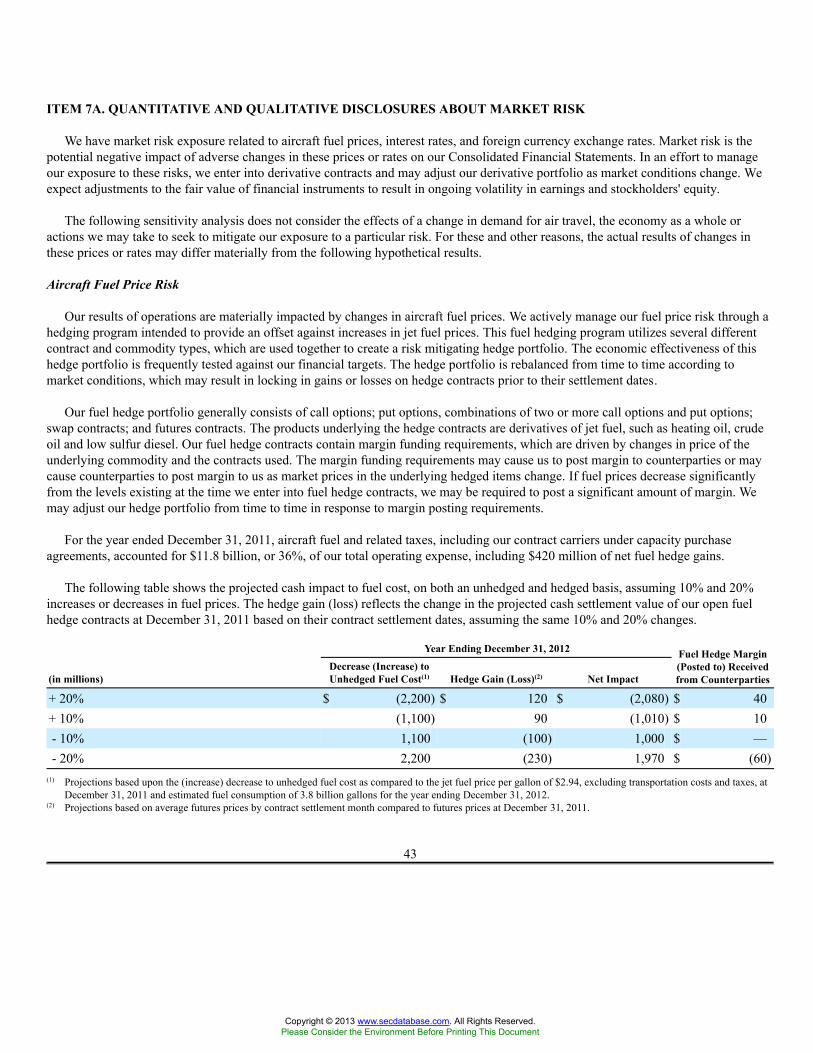
ITEM 7A. QUANTITATIVE AND QUALITATIVE DISCLOSURES ABOUT MARKET RISK
We have market risk exposure related to aircraft fuel prices, interest rates, and foreign currency exchange rates. Market risk is thepotential negative impact of adverse changes in these prices or rates on our Consolidated Financial Statements. In an effort to manageour exposure to these risks, we enter into derivative contracts and may adjust our derivative portfolio as market conditions change. Weexpect adjustments to the fair value of financial instruments to result in ongoing volatility in earnings and stockholders' equity.
The following sensitivity analysis does not consider the effects of a change in demand for air travel, the economy as a whole oractions we may take to seek to mitigate our exposure to a particular risk. For these and other reasons, the actual results of changes inthese prices or rates may differ materially from the following hypothetical results.
Aircraft Fuel Price Risk
Our results of operations are materially impacted by changes in aircraft fuel prices. We actively manage our fuel price risk through ahedging program intended to provide an offset against increases in jet fuel prices. This fuel hedging program utilizes several differentcontract and commodity types, which are used together to create a risk mitigating hedge portfolio. The economic effectiveness of thishedge portfolio is frequently tested against our financial targets. The hedge portfolio is rebalanced from time to time according tomarket conditions, which may result in locking in gains or losses on hedge contracts prior to their settlement dates.
Our fuel hedge portfolio generally consists of call options; put options, combinations of two or more call options and put options;swap contracts; and futures contracts. The products underlying the hedge contracts are derivatives of jet fuel, such as heating oil, crudeoil and low sulfur diesel. Our fuel hedge contracts contain margin funding requirements, which are driven by changes in price of theunderlying commodity and the contracts used. The margin funding requirements may cause us to post margin to counterparties or maycause counterparties to post margin to us as market prices in the underlying hedged items change. If fuel prices decrease significantlyfrom the levels existing at the time we enter into fuel hedge contracts, we may be required to post a significant amount of margin. Wemay adjust our hedge portfolio from time to time in response to margin posting requirements.
For the year ended December 31, 2011, aircraft fuel and related taxes, including our contract carriers under capacity purchaseagreements, accounted for $11.8 billion, or 36%, of our total operating expense, including $420 million of net fuel hedge gains.
The following table shows the projected cash impact to fuel cost, on both an unhedged and hedged basis, assuming 10% and 20%increases or decreases in fuel prices. The hedge gain (loss) reflects the change in the projected cash settlement value of our open fuelhedge contracts at December 31, 2011 based on their contract settlement dates, assuming the same 10% and 20% changes.
Year Ending December 31, 2012
(in millions)Decrease (Increase) toUnhedged Fuel Cost(1) Hedge Gain (Loss)(2) Net Impact
Fuel Hedge Margin(Posted to) Receivedfrom Counterparties
+ 20% $ (2,200) $ 120 $ (2,080) $ 40+ 10% (1,100) 90 (1,010) $ 10- 10% 1,100 (100) 1,000 $ —- 20% 2,200 (230) 1,970 $ (60)
(1) Projections based upon the (increase) decrease to unhedged fuel cost as compared to the jet fuel price per gallon of $2.94, excluding transportation costs and taxes, atDecember 31, 2011 and estimated fuel consumption of 3.8 billion gallons for the year ending December 31, 2012.
(2) Projections based on average futures prices by contract settlement month compared to futures prices at December 31, 2011.
43
Copyright © 2013 www.secdatabase.com. All Rights Reserved.Please Consider the Environment Before Printing This Document
Interest Rate Risk
Our exposure to market risk from adverse changes in interest rates is primarily associated with our long-term debt obligations.Market risk associated with our fixed and variable rate long-term debt relates to the potential reduction in fair value and negative impactto future earnings, respectively, from an increase in interest rates.
At December 31, 2011, we had $7.7 billion of fixed-rate long-term debt and $6.1 billion of variable-rate long-term debt. An increaseof 100 basis points in average annual interest rates would have decreased the estimated fair value of our fixed-rate long-term debt by$300 million at December 31, 2011 and would have increased the annual interest expense on our variable-rate long-term debt by $40million, inclusive of the impact of our interest rate hedge contracts.
Foreign Currency Exchange Risk
We are subject to foreign currency exchange rate risk because we have revenue and expense denominated in foreign currencies withour primary exposures being the Japanese yen and Canadian dollar. To manage exchange rate risk, we execute both our internationalrevenue and expense transactions in the same foreign currency to the extent practicable. From time to time, we may also enter intoforeign currency option and forward contracts. At December 31, 2011, we had open foreign currency forward contracts totaling an $89million liability position. We estimate that a 10% increase or decrease in the price of the Japanese yen and Canadian dollar in relation tothe U.S. dollar would change the projected cash settlement value of our open hedge contracts by a $90 million gain or $110 million loss,respectively, for the year ending December 31, 2012.
44
Copyright © 2013 www.secdatabase.com. All Rights Reserved.Please Consider the Environment Before Printing This Document
ITEM 8. FINANCIAL STATEMENTS AND SUPPLEMENTARY DATA
INDEX TO CONSOLIDATED FINANCIAL STATEMENTS
PageReport of Independent Registered Public Accounting Firm 46Consolidated Balance Sheets - December 31, 2011 and 2010 47Consolidated Statements of Operations for the years ended December 31, 2011, 2010 and 2009 48Consolidated Statements of Cash Flows for the years ended December 31, 2011, 2010 and 2009 49Consolidated Statements of Stockholders' (Deficit) Equity for the years ended December 31, 2011, 2010 and 2009 50Notes to the Consolidated Financial Statements 51
45
Copyright © 2013 www.secdatabase.com. All Rights Reserved.Please Consider the Environment Before Printing This Document
REPORT OF INDEPENDENT REGISTERED PUBLIC ACCOUNTING FIRM
To the Board of Directors and Stockholders of Delta Air Lines, Inc.
We have audited the accompanying consolidated balance sheets of Delta Air Lines, Inc. (the Company) as of December 31, 2011 and2010, and the related consolidated statements of operations, stockholders' (deficit) equity, and cash flows for each of the three years inthe period ended December 31, 2011. These financial statements are the responsibility of the Company's management. Our responsibilityis to express an opinion on these financial statements based on our audits.
We conducted our audits in accordance with the standards of the Public Company Accounting Oversight Board (United States). Thosestandards require that we plan and perform the audit to obtain reasonable assurance about whether the financial statements are free ofmaterial misstatement. An audit includes examining, on a test basis, evidence supporting the amounts and disclosures in the financialstatements. An audit also includes assessing the accounting principles used and significant estimates made by management, as well asevaluating the overall financial statement presentation. We believe that our audits provide a reasonable basis for our opinion.
In our opinion, the financial statements referred to above present fairly, in all material respects, the consolidated financial position ofDelta Air Lines, Inc. at December 31, 2011 and 2010, and the consolidated results of its operations and its cash flows for each of the threeyears in the period ended December 31, 2011, in conformity with U.S. generally accepted accounting principles.
We also have audited, in accordance with the standards of the Public Company Accounting Oversight Board (United States), Delta AirLines, Inc.'s internal control over financial reporting as of December 31, 2011, based on criteria established in Internal Control-IntegratedFramework issued by the Committee of Sponsoring Organizations of the Treadway Commission and our report dated February 10, 2012expressed an unqualified opinion thereon.
/s/ Ernst & Young LLPAtlanta, Georgia
February 10, 2012
46
Copyright © 2013 www.secdatabase.com. All Rights Reserved.Please Consider the Environment Before Printing This Document
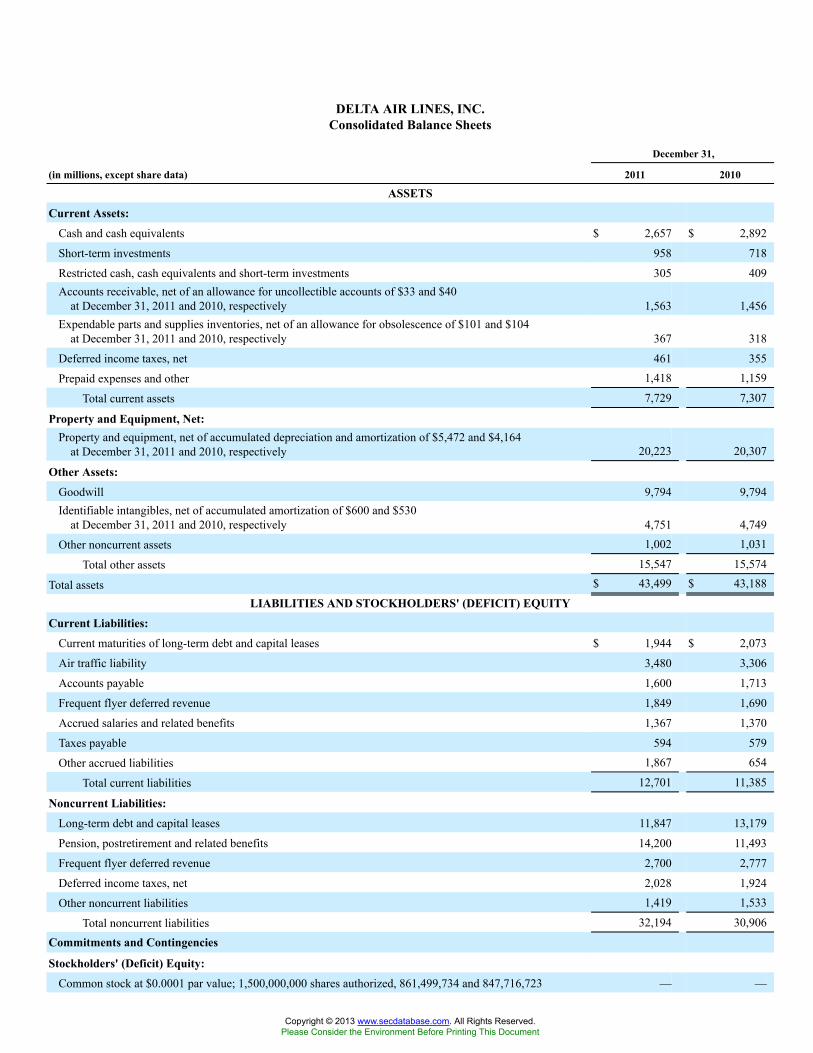
DELTA AIR LINES, INC.Consolidated Balance Sheets
December 31,
(in millions, except share data) 2011 2010
ASSETS
Current Assets:
Cash and cash equivalents $ 2,657 $ 2,892
Short-term investments 958 718
Restricted cash, cash equivalents and short-term investments 305 409Accounts receivable, net of an allowance for uncollectible accounts of $33 and $40
at December 31, 2011 and 2010, respectively 1,563 1,456Expendable parts and supplies inventories, net of an allowance for obsolescence of $101 and $104
at December 31, 2011 and 2010, respectively 367 318
Deferred income taxes, net 461 355
Prepaid expenses and other 1,418 1,159
Total current assets 7,729 7,307
Property and Equipment, Net:Property and equipment, net of accumulated depreciation and amortization of $5,472 and $4,164
at December 31, 2011 and 2010, respectively 20,223 20,307
Other Assets:
Goodwill 9,794 9,794Identifiable intangibles, net of accumulated amortization of $600 and $530
at December 31, 2011 and 2010, respectively 4,751 4,749
Other noncurrent assets 1,002 1,031
Total other assets 15,547 15,574
Total assets $ 43,499 $ 43,188
LIABILITIES AND STOCKHOLDERS' (DEFICIT) EQUITY
Current Liabilities:
Current maturities of long-term debt and capital leases $ 1,944 $ 2,073
Air traffic liability 3,480 3,306
Accounts payable 1,600 1,713
Frequent flyer deferred revenue 1,849 1,690
Accrued salaries and related benefits 1,367 1,370
Taxes payable 594 579
Other accrued liabilities 1,867 654
Total current liabilities 12,701 11,385
Noncurrent Liabilities:
Long-term debt and capital leases 11,847 13,179
Pension, postretirement and related benefits 14,200 11,493
Frequent flyer deferred revenue 2,700 2,777
Deferred income taxes, net 2,028 1,924
Other noncurrent liabilities 1,419 1,533
Total noncurrent liabilities 32,194 30,906
Commitments and Contingencies
Stockholders' (Deficit) Equity:
Common stock at $0.0001 par value; 1,500,000,000 shares authorized, 861,499,734 and 847,716,723 — —
Copyright © 2013 www.secdatabase.com. All Rights Reserved.Please Consider the Environment Before Printing This Document
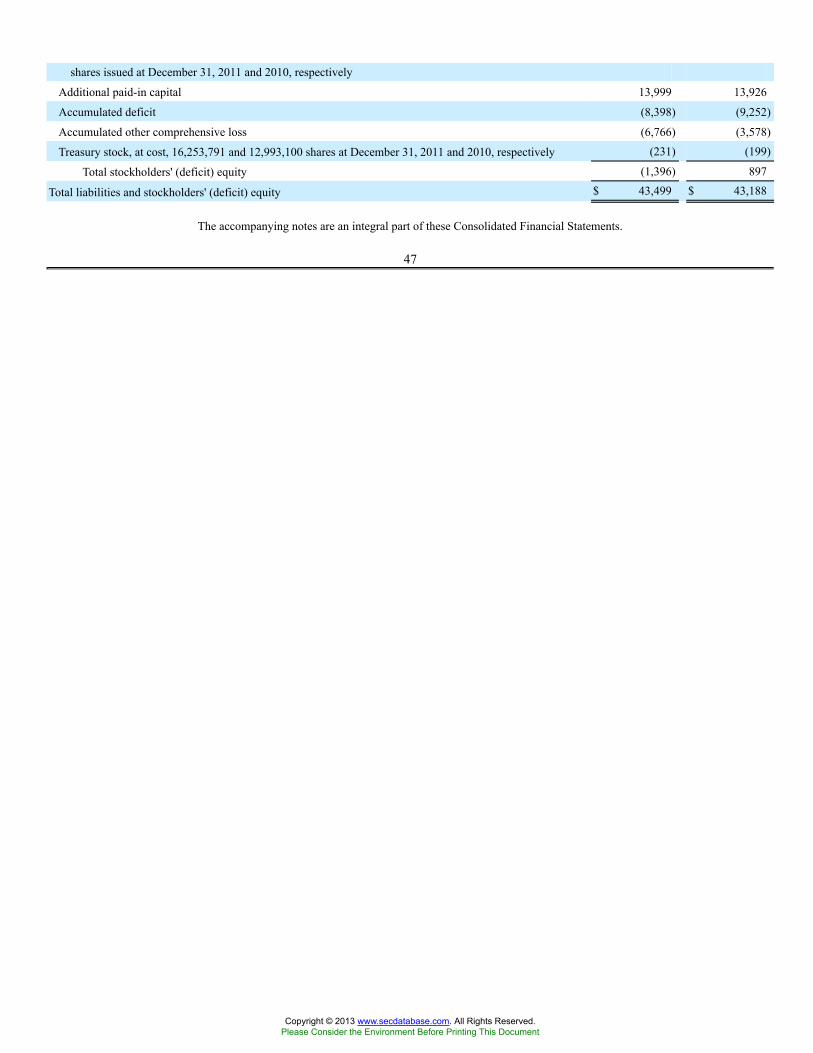
shares issued at December 31, 2011 and 2010, respectively
Additional paid-in capital 13,999 13,926
Accumulated deficit (8,398) (9,252)
Accumulated other comprehensive loss (6,766) (3,578)
Treasury stock, at cost, 16,253,791 and 12,993,100 shares at December 31, 2011 and 2010, respectively (231) (199)
Total stockholders' (deficit) equity (1,396) 897
Total liabilities and stockholders' (deficit) equity $ 43,499 $ 43,188
The accompanying notes are an integral part of these Consolidated Financial Statements.
47
Copyright © 2013 www.secdatabase.com. All Rights Reserved.Please Consider the Environment Before Printing This Document
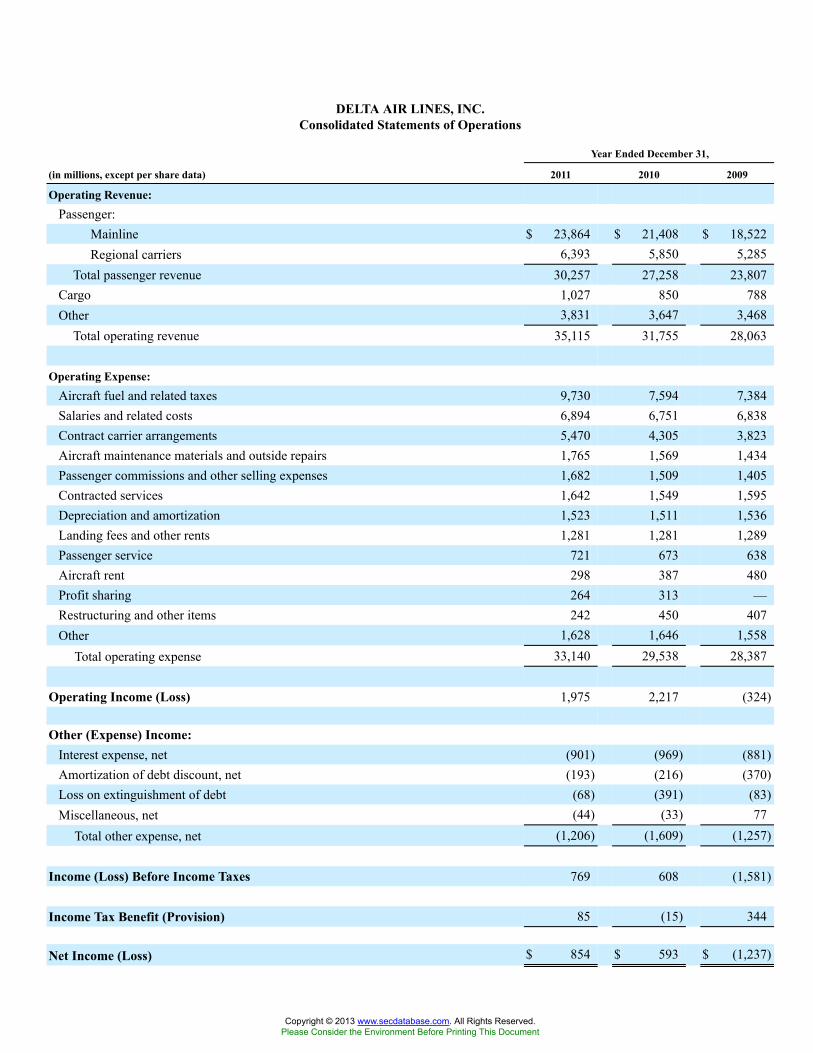
DELTA AIR LINES, INC.Consolidated Statements of Operations
Year Ended December 31,
(in millions, except per share data) 2011 2010 2009
Operating Revenue:Passenger:
Mainline $ 23,864 $ 21,408 $ 18,522Regional carriers 6,393 5,850 5,285
Total passenger revenue 30,257 27,258 23,807Cargo 1,027 850 788Other 3,831 3,647 3,468
Total operating revenue 35,115 31,755 28,063
Operating Expense:Aircraft fuel and related taxes 9,730 7,594 7,384Salaries and related costs 6,894 6,751 6,838Contract carrier arrangements 5,470 4,305 3,823Aircraft maintenance materials and outside repairs 1,765 1,569 1,434Passenger commissions and other selling expenses 1,682 1,509 1,405Contracted services 1,642 1,549 1,595Depreciation and amortization 1,523 1,511 1,536Landing fees and other rents 1,281 1,281 1,289Passenger service 721 673 638Aircraft rent 298 387 480Profit sharing 264 313 —Restructuring and other items 242 450 407Other 1,628 1,646 1,558
Total operating expense 33,140 29,538 28,387
Operating Income (Loss) 1,975 2,217 (324)
Other (Expense) Income:Interest expense, net (901) (969) (881)Amortization of debt discount, net (193) (216) (370)Loss on extinguishment of debt (68) (391) (83)Miscellaneous, net (44) (33) 77
Total other expense, net (1,206) (1,609) (1,257)
Income (Loss) Before Income Taxes 769 608 (1,581)
Income Tax Benefit (Provision) 85 (15) 344
Net Income (Loss) $ 854 $ 593 $ (1,237)
Copyright © 2013 www.secdatabase.com. All Rights Reserved.Please Consider the Environment Before Printing This Document
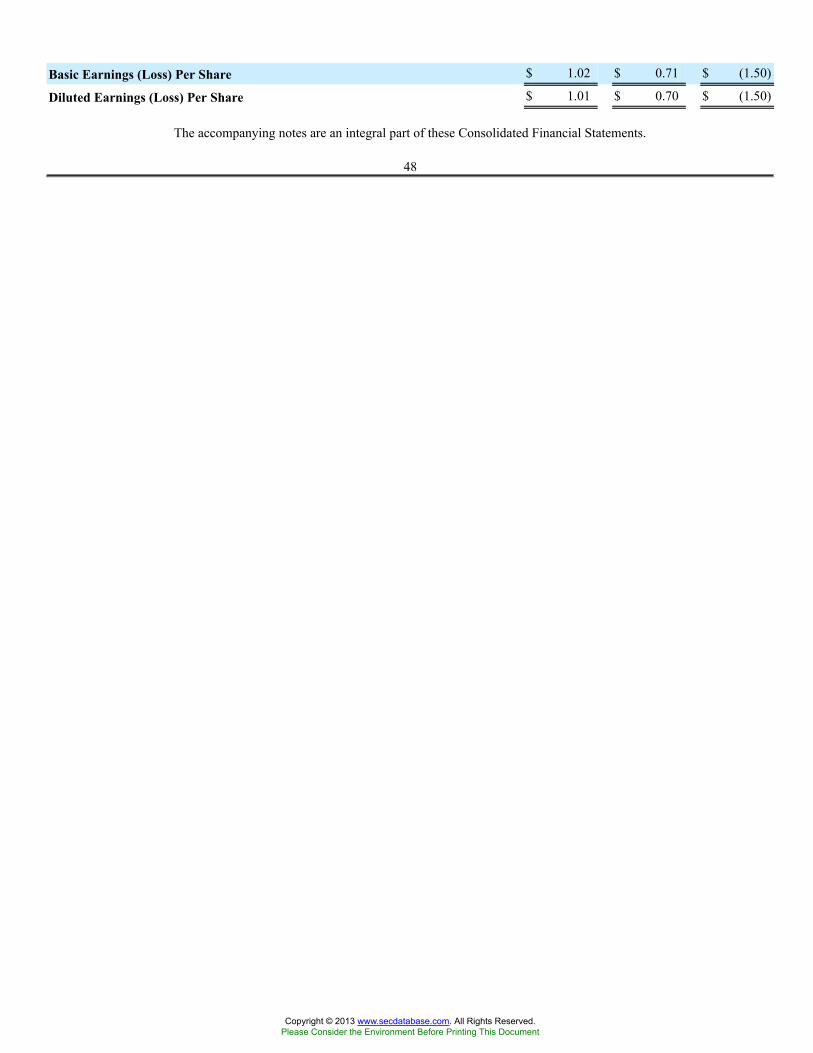
Basic Earnings (Loss) Per Share $ 1.02 $ 0.71 $ (1.50)
Diluted Earnings (Loss) Per Share $ 1.01 $ 0.70 $ (1.50)
The accompanying notes are an integral part of these Consolidated Financial Statements.
48
Copyright © 2013 www.secdatabase.com. All Rights Reserved.Please Consider the Environment Before Printing This Document
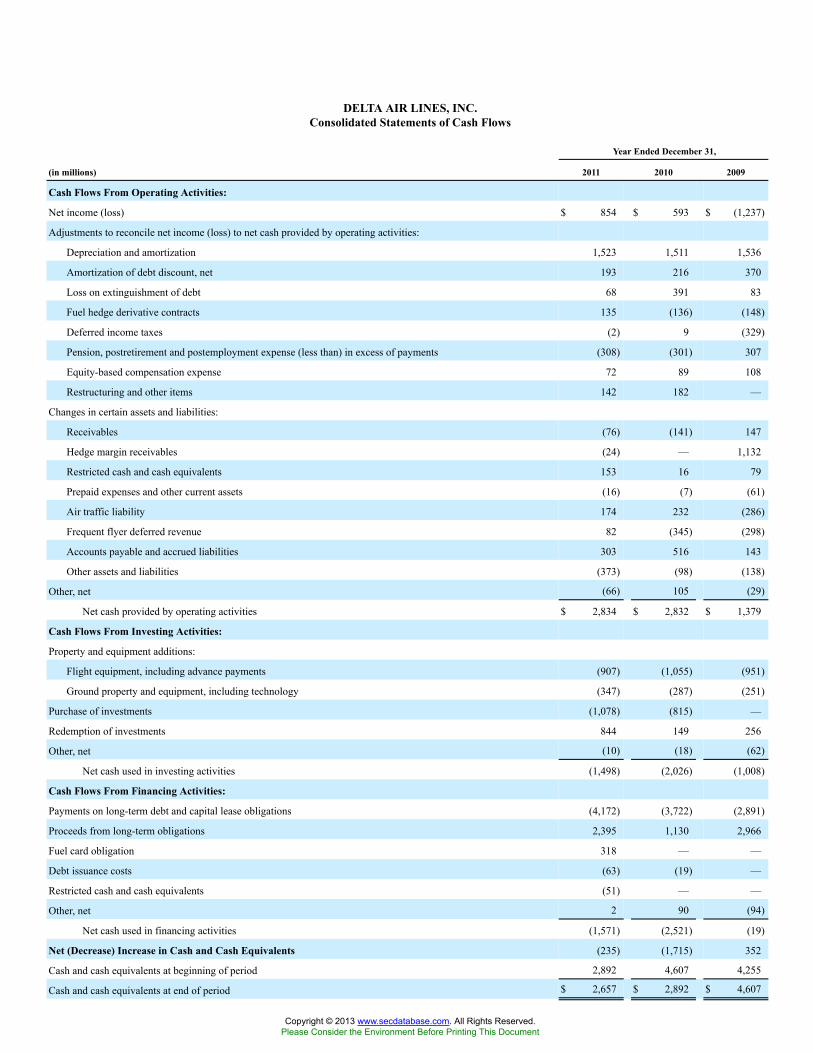
DELTA AIR LINES, INC.Consolidated Statements of Cash Flows
Year Ended December 31,
(in millions) 2011 2010 2009
Cash Flows From Operating Activities:
Net income (loss) $ 854 $ 593 $ (1,237)
Adjustments to reconcile net income (loss) to net cash provided by operating activities:
Depreciation and amortization 1,523 1,511 1,536
Amortization of debt discount, net 193 216 370
Loss on extinguishment of debt 68 391 83
Fuel hedge derivative contracts 135 (136) (148)
Deferred income taxes (2) 9 (329)
Pension, postretirement and postemployment expense (less than) in excess of payments (308) (301) 307
Equity-based compensation expense 72 89 108
Restructuring and other items 142 182 —
Changes in certain assets and liabilities:
Receivables (76) (141) 147
Hedge margin receivables (24) — 1,132
Restricted cash and cash equivalents 153 16 79
Prepaid expenses and other current assets (16) (7) (61)
Air traffic liability 174 232 (286)
Frequent flyer deferred revenue 82 (345) (298)
Accounts payable and accrued liabilities 303 516 143
Other assets and liabilities (373) (98) (138)
Other, net (66) 105 (29)
Net cash provided by operating activities $ 2,834 $ 2,832 $ 1,379
Cash Flows From Investing Activities:
Property and equipment additions:
Flight equipment, including advance payments (907) (1,055) (951)
Ground property and equipment, including technology (347) (287) (251)
Purchase of investments (1,078) (815) —
Redemption of investments 844 149 256
Other, net (10) (18) (62)
Net cash used in investing activities (1,498) (2,026) (1,008)
Cash Flows From Financing Activities:
Payments on long-term debt and capital lease obligations (4,172) (3,722) (2,891)
Proceeds from long-term obligations 2,395 1,130 2,966
Fuel card obligation 318 — —
Debt issuance costs (63) (19) —
Restricted cash and cash equivalents (51) — —
Other, net 2 90 (94)
Net cash used in financing activities (1,571) (2,521) (19)
Net (Decrease) Increase in Cash and Cash Equivalents (235) (1,715) 352
Cash and cash equivalents at beginning of period 2,892 4,607 4,255
Cash and cash equivalents at end of period $ 2,657 $ 2,892 $ 4,607
Copyright © 2013 www.secdatabase.com. All Rights Reserved.Please Consider the Environment Before Printing This Document
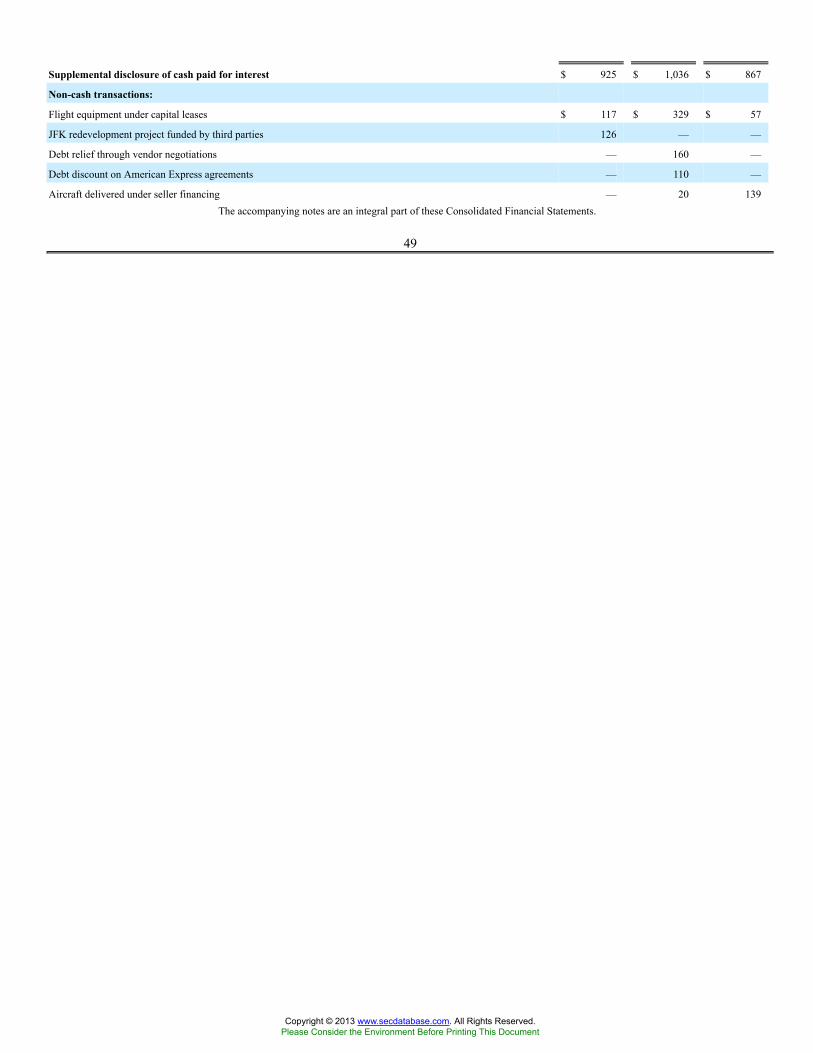
Supplemental disclosure of cash paid for interest $ 925 $ 1,036 $ 867
Non-cash transactions:
Flight equipment under capital leases $ 117 $ 329 $ 57
JFK redevelopment project funded by third parties 126 — —
Debt relief through vendor negotiations — 160 —
Debt discount on American Express agreements — 110 —
Aircraft delivered under seller financing — 20 139The accompanying notes are an integral part of these Consolidated Financial Statements.
49
Copyright © 2013 www.secdatabase.com. All Rights Reserved.Please Consider the Environment Before Printing This Document
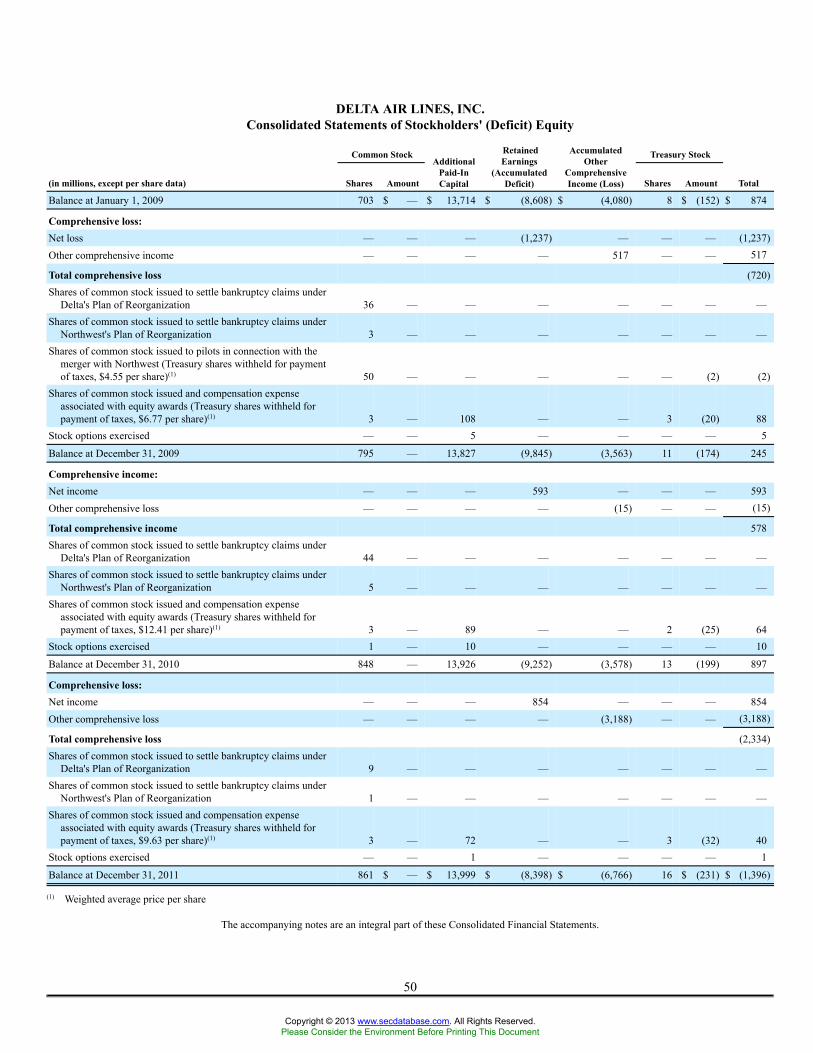
DELTA AIR LINES, INC.Consolidated Statements of Stockholders' (Deficit) Equity
Common Stock Treasury Stock
(in millions, except per share data) Shares Amount
AdditionalPaid-InCapital
RetainedEarnings
(AccumulatedDeficit)
AccumulatedOther
ComprehensiveIncome (Loss) Shares Amount Total
Balance at January 1, 2009 703 $ — $ 13,714 $ (8,608) $ (4,080) 8 $ (152) $ 874
Comprehensive loss:Net loss — — — (1,237) — — — (1,237)Other comprehensive income — — — — 517 — — 517
Total comprehensive loss (720)Shares of common stock issued to settle bankruptcy claims under
Delta's Plan of Reorganization 36 — — — — — — —Shares of common stock issued to settle bankruptcy claims under
Northwest's Plan of Reorganization 3 — — — — — — —Shares of common stock issued to pilots in connection with the
merger with Northwest (Treasury shares withheld for paymentof taxes, $4.55 per share)(1) 50 — — — — — (2) (2)
Shares of common stock issued and compensation expenseassociated with equity awards (Treasury shares withheld forpayment of taxes, $6.77 per share)(1) 3 — 108 — — 3 (20) 88
Stock options exercised — — 5 — — — — 5
Balance at December 31, 2009 795 — 13,827 (9,845) (3,563) 11 (174) 245
Comprehensive income:Net income — — — 593 — — — 593Other comprehensive loss — — — — (15) — — (15)
Total comprehensive income 578Shares of common stock issued to settle bankruptcy claims under
Delta's Plan of Reorganization 44 — — — — — — —Shares of common stock issued to settle bankruptcy claims under
Northwest's Plan of Reorganization 5 — — — — — — —Shares of common stock issued and compensation expense
associated with equity awards (Treasury shares withheld forpayment of taxes, $12.41 per share)(1) 3 — 89 — — 2 (25) 64
Stock options exercised 1 — 10 — — — — 10
Balance at December 31, 2010 848 — 13,926 (9,252) (3,578) 13 (199) 897
Comprehensive loss:Net income — — — 854 — — — 854Other comprehensive loss — — — — (3,188) — — (3,188)
Total comprehensive loss (2,334)Shares of common stock issued to settle bankruptcy claims under
Delta's Plan of Reorganization 9 — — — — — — —Shares of common stock issued to settle bankruptcy claims under
Northwest's Plan of Reorganization 1 — — — — — — —Shares of common stock issued and compensation expense
associated with equity awards (Treasury shares withheld forpayment of taxes, $9.63 per share)(1) 3 — 72 — — 3 (32) 40
Stock options exercised — — 1 — — — — 1
Balance at December 31, 2011 861 $ — $ 13,999 $ (8,398) $ (6,766) 16 $ (231) $ (1,396)
(1) Weighted average price per share
The accompanying notes are an integral part of these Consolidated Financial Statements.
50
Copyright © 2013 www.secdatabase.com. All Rights Reserved.Please Consider the Environment Before Printing This Document
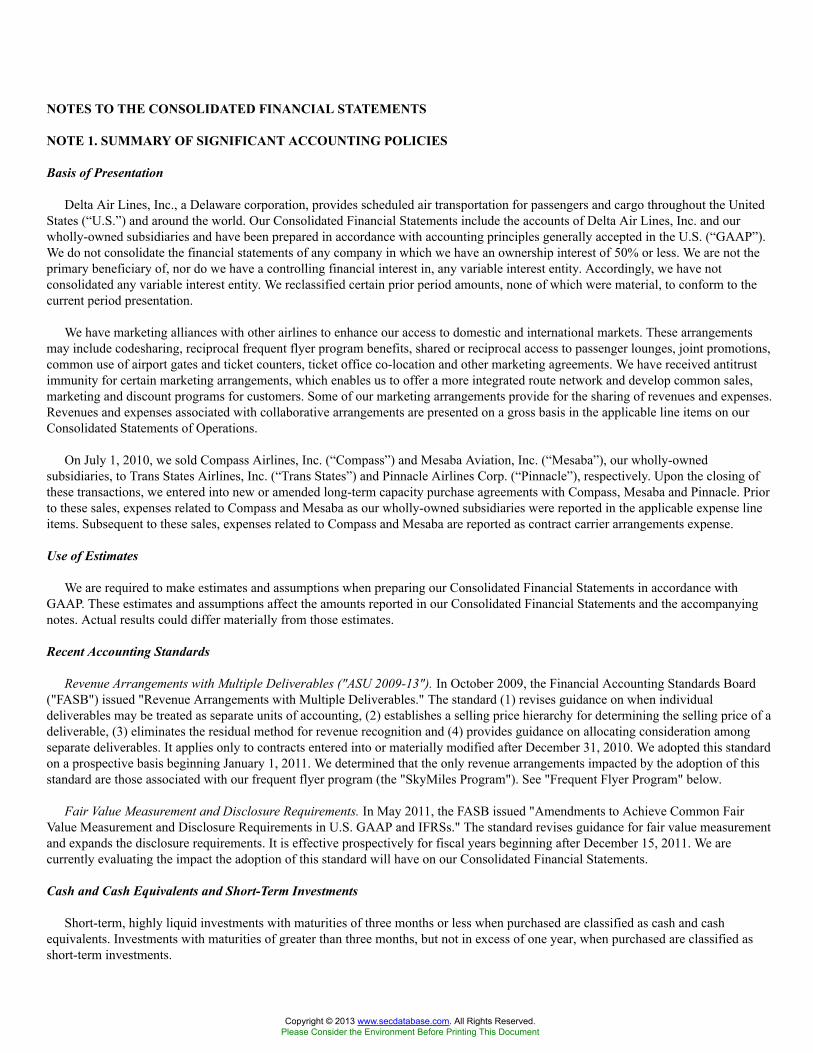
NOTES TO THE CONSOLIDATED FINANCIAL STATEMENTS
NOTE 1. SUMMARY OF SIGNIFICANT ACCOUNTING POLICIES
Basis of Presentation
Delta Air Lines, Inc., a Delaware corporation, provides scheduled air transportation for passengers and cargo throughout the UnitedStates (“U.S.”) and around the world. Our Consolidated Financial Statements include the accounts of Delta Air Lines, Inc. and ourwholly-owned subsidiaries and have been prepared in accordance with accounting principles generally accepted in the U.S. (“GAAP”).We do not consolidate the financial statements of any company in which we have an ownership interest of 50% or less. We are not theprimary beneficiary of, nor do we have a controlling financial interest in, any variable interest entity. Accordingly, we have notconsolidated any variable interest entity. We reclassified certain prior period amounts, none of which were material, to conform to thecurrent period presentation.
We have marketing alliances with other airlines to enhance our access to domestic and international markets. These arrangementsmay include codesharing, reciprocal frequent flyer program benefits, shared or reciprocal access to passenger lounges, joint promotions,common use of airport gates and ticket counters, ticket office co-location and other marketing agreements. We have received antitrustimmunity for certain marketing arrangements, which enables us to offer a more integrated route network and develop common sales,marketing and discount programs for customers. Some of our marketing arrangements provide for the sharing of revenues and expenses.Revenues and expenses associated with collaborative arrangements are presented on a gross basis in the applicable line items on ourConsolidated Statements of Operations.
On July 1, 2010, we sold Compass Airlines, Inc. (“Compass”) and Mesaba Aviation, Inc. (“Mesaba”), our wholly-ownedsubsidiaries, to Trans States Airlines, Inc. (“Trans States”) and Pinnacle Airlines Corp. (“Pinnacle”), respectively. Upon the closing ofthese transactions, we entered into new or amended long-term capacity purchase agreements with Compass, Mesaba and Pinnacle. Priorto these sales, expenses related to Compass and Mesaba as our wholly-owned subsidiaries were reported in the applicable expense lineitems. Subsequent to these sales, expenses related to Compass and Mesaba are reported as contract carrier arrangements expense.
Use of Estimates
We are required to make estimates and assumptions when preparing our Consolidated Financial Statements in accordance withGAAP. These estimates and assumptions affect the amounts reported in our Consolidated Financial Statements and the accompanyingnotes. Actual results could differ materially from those estimates.
Recent Accounting Standards
Revenue Arrangements with Multiple Deliverables ("ASU 2009-13"). In October 2009, the Financial Accounting Standards Board("FASB") issued "Revenue Arrangements with Multiple Deliverables." The standard (1) revises guidance on when individualdeliverables may be treated as separate units of accounting, (2) establishes a selling price hierarchy for determining the selling price of adeliverable, (3) eliminates the residual method for revenue recognition and (4) provides guidance on allocating consideration amongseparate deliverables. It applies only to contracts entered into or materially modified after December 31, 2010. We adopted this standardon a prospective basis beginning January 1, 2011. We determined that the only revenue arrangements impacted by the adoption of thisstandard are those associated with our frequent flyer program (the "SkyMiles Program"). See "Frequent Flyer Program" below.
Fair Value Measurement and Disclosure Requirements. In May 2011, the FASB issued "Amendments to Achieve Common FairValue Measurement and Disclosure Requirements in U.S. GAAP and IFRSs." The standard revises guidance for fair value measurementand expands the disclosure requirements. It is effective prospectively for fiscal years beginning after December 15, 2011. We arecurrently evaluating the impact the adoption of this standard will have on our Consolidated Financial Statements.
Cash and Cash Equivalents and Short-Term Investments
Short-term, highly liquid investments with maturities of three months or less when purchased are classified as cash and cashequivalents. Investments with maturities of greater than three months, but not in excess of one year, when purchased are classified asshort-term investments.
Copyright © 2013 www.secdatabase.com. All Rights Reserved.Please Consider the Environment Before Printing This Document

51
Copyright © 2013 www.secdatabase.com. All Rights Reserved.Please Consider the Environment Before Printing This Document
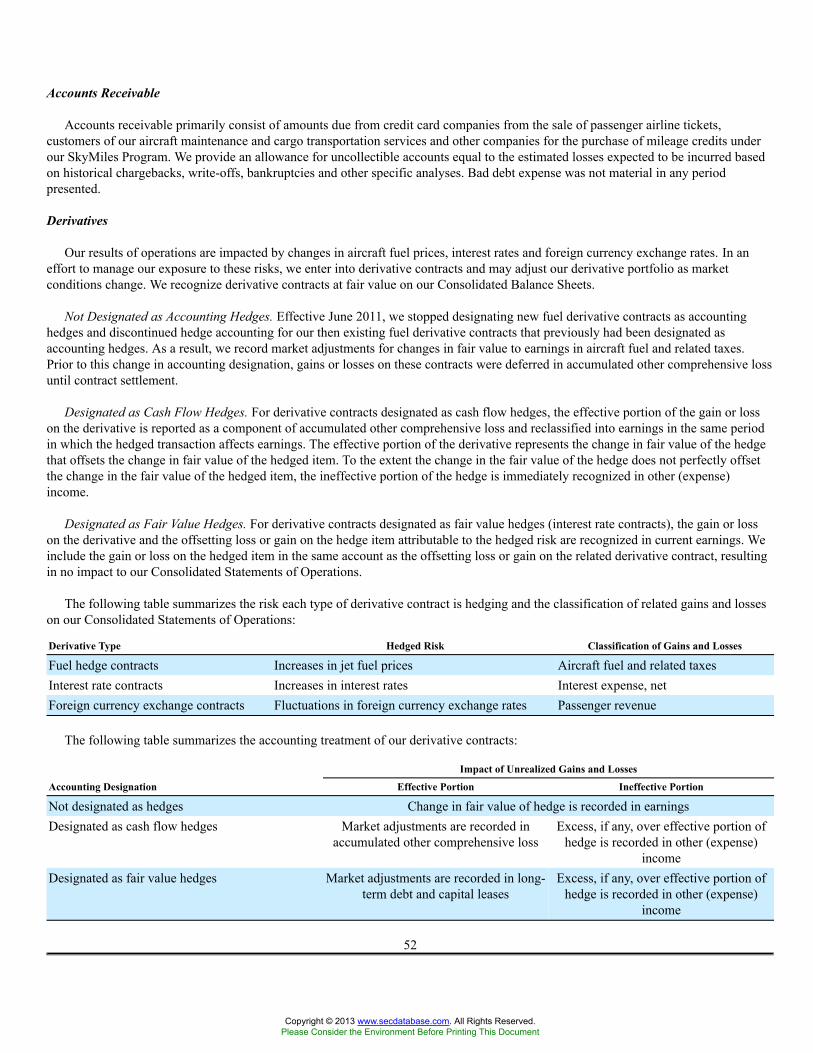
Accounts Receivable
Accounts receivable primarily consist of amounts due from credit card companies from the sale of passenger airline tickets,customers of our aircraft maintenance and cargo transportation services and other companies for the purchase of mileage credits underour SkyMiles Program. We provide an allowance for uncollectible accounts equal to the estimated losses expected to be incurred basedon historical chargebacks, write-offs, bankruptcies and other specific analyses. Bad debt expense was not material in any periodpresented.
Derivatives
Our results of operations are impacted by changes in aircraft fuel prices, interest rates and foreign currency exchange rates. In aneffort to manage our exposure to these risks, we enter into derivative contracts and may adjust our derivative portfolio as marketconditions change. We recognize derivative contracts at fair value on our Consolidated Balance Sheets.
Not Designated as Accounting Hedges. Effective June 2011, we stopped designating new fuel derivative contracts as accountinghedges and discontinued hedge accounting for our then existing fuel derivative contracts that previously had been designated asaccounting hedges. As a result, we record market adjustments for changes in fair value to earnings in aircraft fuel and related taxes.Prior to this change in accounting designation, gains or losses on these contracts were deferred in accumulated other comprehensive lossuntil contract settlement.
Designated as Cash Flow Hedges. For derivative contracts designated as cash flow hedges, the effective portion of the gain or losson the derivative is reported as a component of accumulated other comprehensive loss and reclassified into earnings in the same periodin which the hedged transaction affects earnings. The effective portion of the derivative represents the change in fair value of the hedgethat offsets the change in fair value of the hedged item. To the extent the change in the fair value of the hedge does not perfectly offsetthe change in the fair value of the hedged item, the ineffective portion of the hedge is immediately recognized in other (expense)income.
Designated as Fair Value Hedges. For derivative contracts designated as fair value hedges (interest rate contracts), the gain or losson the derivative and the offsetting loss or gain on the hedge item attributable to the hedged risk are recognized in current earnings. Weinclude the gain or loss on the hedged item in the same account as the offsetting loss or gain on the related derivative contract, resultingin no impact to our Consolidated Statements of Operations.
The following table summarizes the risk each type of derivative contract is hedging and the classification of related gains and losseson our Consolidated Statements of Operations:
Derivative Type Hedged Risk Classification of Gains and Losses
Fuel hedge contracts Increases in jet fuel prices Aircraft fuel and related taxesInterest rate contracts Increases in interest rates Interest expense, netForeign currency exchange contracts Fluctuations in foreign currency exchange rates Passenger revenue
The following table summarizes the accounting treatment of our derivative contracts:
Impact of Unrealized Gains and Losses
Accounting Designation Effective Portion Ineffective Portion
Not designated as hedges Change in fair value of hedge is recorded in earningsDesignated as cash flow hedges Market adjustments are recorded in
accumulated other comprehensive lossExcess, if any, over effective portion of
hedge is recorded in other (expense)income
Designated as fair value hedges Market adjustments are recorded in long-term debt and capital leases
Excess, if any, over effective portion ofhedge is recorded in other (expense)
income
52
Copyright © 2013 www.secdatabase.com. All Rights Reserved.Please Consider the Environment Before Printing This Document
We perform, at least quarterly, both a prospective and retrospective assessment of the effectiveness of our derivative contractsdesignated as hedges, including assessing the possibility of counterparty default. If we determine that a derivative is no longer expectedto be highly effective, we discontinue hedge accounting prospectively and recognize subsequent changes in the fair value of the hedgein earnings. We believe our derivative contracts that continue to be designated as hedges, consisting of interest rate and foreign currencyexchange contracts, will continue to be highly effective in offsetting changes in cash flow attributable to the hedged risk.
Hedge Margin. In accordance with our fuel, interest rate and foreign currency hedge contracts, we may require counterparties to fundthe margin associated with our gain position and/or counterparties may require us to fund the margin associated with our loss positionon these contracts. The amount of the margin, if any, is periodically adjusted based on the fair value of the hedge contracts. The marginrequirements are intended to mitigate a party's exposure to the risk of contracting party default. We do not offset margin funded tocounterparties or margin funded to us by counterparties against fair value amounts recorded for our hedge contracts.
The hedge margin we receive from counterparties is recorded in cash and cash equivalents or restricted cash, cash equivalents andshort-term investments, with the offsetting obligation in accounts payable. The hedge margin we provide to counterparties is recorded inaccounts receivable. All cash flows associated with purchasing and settling hedge contracts are classified as operating cash flows.
Passenger Tickets
We record sales of passenger tickets in air traffic liability. Passenger revenue is recognized when we provide transportation or whenthe ticket expires unused, reducing the related air traffic liability. We periodically evaluate the estimated air traffic liability and recordany adjustments in our Consolidated Statements of Operations. These adjustments relate primarily to refunds, exchanges, transactionswith other airlines and other items for which final settlement occurs in periods subsequent to the sale of the related tickets at amountsother than the original sales price.
Taxes and Fees
We are required to charge certain taxes and fees on our passenger tickets, including U.S. federal transportation taxes, federal securitycharges, airport passenger facility charges and foreign arrival and departure taxes. These taxes and fees are assessments on the customerfor which we act as a collection agent. Because we are not entitled to retain these taxes and fees, we do not include such amounts inpassenger revenue. We record a liability when the amounts are collected and reduce the liability when payments are made to theapplicable government agency or operating carrier.
Frequent Flyer Program
The SkyMiles Program offers incentives to travel on Delta. This program allows customers to earn mileage credits by flying onDelta, regional air carriers with which we have contract carrier agreements (“Contract Carriers”) and airlines that participate in theSkyMiles Program, as well as through participating companies such as credit card companies, hotels and car rental agencies. We alsosell mileage credits to non-airline businesses, customers and other airlines.
The SkyMiles Program includes two types of transactions that are considered revenue arrangements with multiple deliverables. Asdiscussed below, these are (1) passenger ticket sales earning mileage credits and (2) the sale of mileage credits to participatingcompanies with which we have marketing agreements. Mileage credits are a separate unit of accounting as they can be redeemed bycustomers in future periods for air travel on Delta and participating airlines, membership in our Sky Club and other program awards.
Passenger Ticket Sales Earning Mileage Credits. Passenger ticket sales earning mileage credits under our SkyMiles Program providecustomers with two deliverables: (1) mileage credits earned and (2) air transportation. Effective January 1, 2011, we began applying theprovisions of ASU 2009-13 to passenger tickets earning mileage credits. Under ASU 2009-13, we value each deliverable on astandalone basis. Our estimate of the standalone selling price of a mileage credit is based on an analysis of our sales of mileage creditsto other airlines and customers and is re-evaluated at least annually. We use established ticket prices to determine the standalone sellingprice of air transportation. We allocate the total amount collected from passenger ticket sales between the deliverables based on theirrelative selling prices.
53
Copyright © 2013 www.secdatabase.com. All Rights Reserved.Please Consider the Environment Before Printing This Document
We defer revenue from the mileage credit component of passenger ticket sales and recognize it as passenger revenue when miles areredeemed and services are provided. We record the portion of the passenger ticket sales for air transportation in air traffic liability andrecognize these amounts in passenger revenue when we provide transportation or when the ticket expires unused. The adoption of ASU2009-13 did not have a material impact on the timing of revenue recognition or its classification with regard to passenger tickets earningmileage credits.
Prior to the adoption of ASU 2009-13, we used the residual method for revenue recognition. Under the residual method, wedetermined the fair value of the mileage credit component based on prices at which we sold mileage credits to other airlines and thenconsidered the remainder of the amount collected to be the air transportation deliverable.
Sale of Mileage Credits. Customers may earn mileage credits through participating companies such as credit card companies, hotelsand car rental agencies with which we have marketing agreements to sell mileage credits. Our contracts to sell mileage credits underthese marketing agreements have two deliverables: (1) the mileage credits redeemable for future travel and (2) the marketingcomponent.
ASU 2009-13 does not apply to contracts to sell mileage credits entered into prior to January 1, 2011 unless those contracts arematerially modified. As of December 31, 2011, we had not materially modified any of our significant agreements. Our most significantcontract to sell mileage credits relates to our co-brand credit card relationship with American Express. For additional information aboutthis relationship, see Note 6. For contracts entered into prior to January 1, 2011 that have not been materially modified since January 1,2011, we continue to use the residual method for revenue recognition and value only the mileage credits. Under the residual method, theportion of the revenue from the mileage component is deferred and recognized as passenger revenue when miles are redeemed andservices are provided. The portion of the revenue received in excess of the fair value of mileage credits sold, the marketing component,is recognized in income as other revenue when the related marketing services are provided. The fair value of a mileage credit isdetermined based on prices at which we sell mileage credits to other airlines and is re-evaluated at least annually.
If we enter into new contracts or materially modify existing contracts to sell mileage credits related to our SkyMiles Program, wewill value the standalone selling price of the marketing component and allocate the revenue from the contract based on the relativeselling price of the mileage credits and the marketing component. A material modification of an existing contract could impact ourdeferral rate or cause an adjustment to our deferred revenue balance, which could materially impact our future financial results.
Breakage. For mileage credits which we estimate are not likely to be redeemed (“Breakage”), we recognize the associated valueproportionally during the period in which the remaining mileage credits are expected to be redeemed. The estimate of Breakage is basedon historical redemption patterns. A change in assumptions as to the period over which mileage credits are expected to be redeemed, theactual redemption activity for mileage credits or the estimated fair value of mileage credits expected to be redeemed could have amaterial impact on our revenue in the year in which the change occurs and in future years.
Regional Carriers Revenue
During the year ended December 31, 2011, we had contract carrier agreements with nine Contract Carriers, including our wholly-owned subsidiary, Comair, Inc. (“Comair”). Our Contract Carrier agreements are structured as either (1) capacity purchase agreementswhere we purchase all or a portion of the Contract Carrier's capacity and are responsible for selling the seat inventory we purchase or (2)revenue proration agreements, which are based on a fixed dollar or percentage division of revenues for tickets sold to passengerstraveling on connecting flight itineraries. We record revenue related to all of our Contract Carrier agreements as regional carrierspassenger revenue. We record expenses related to our Contract Carrier agreements, excluding Comair, as contract carrier arrangementsexpense.
Cargo Revenue
Cargo revenue is recognized when we provide the transportation.
54
Copyright © 2013 www.secdatabase.com. All Rights Reserved.Please Consider the Environment Before Printing This Document
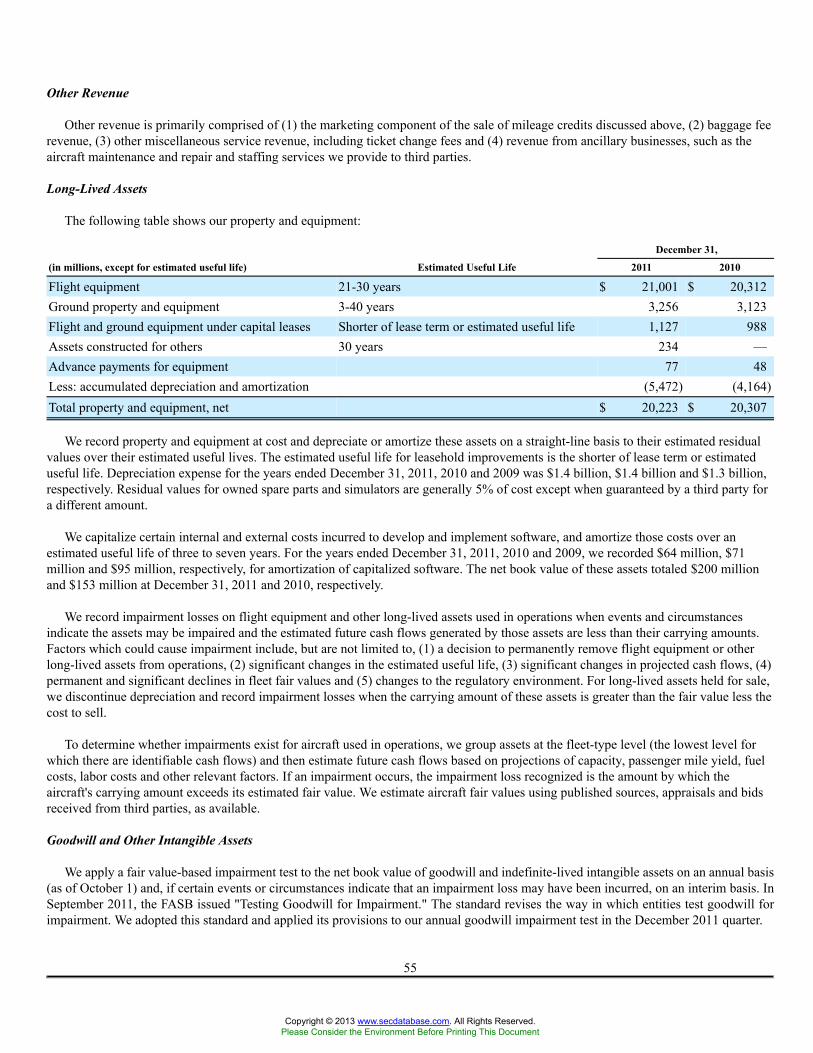
Other Revenue
Other revenue is primarily comprised of (1) the marketing component of the sale of mileage credits discussed above, (2) baggage feerevenue, (3) other miscellaneous service revenue, including ticket change fees and (4) revenue from ancillary businesses, such as theaircraft maintenance and repair and staffing services we provide to third parties.
Long-Lived Assets
The following table shows our property and equipment:
December 31,
(in millions, except for estimated useful life) Estimated Useful Life 2011 2010
Flight equipment 21-30 years $ 21,001 $ 20,312Ground property and equipment 3-40 years 3,256 3,123Flight and ground equipment under capital leases Shorter of lease term or estimated useful life 1,127 988Assets constructed for others 30 years 234 —Advance payments for equipment 77 48Less: accumulated depreciation and amortization (5,472) (4,164)Total property and equipment, net $ 20,223 $ 20,307
We record property and equipment at cost and depreciate or amortize these assets on a straight-line basis to their estimated residualvalues over their estimated useful lives. The estimated useful life for leasehold improvements is the shorter of lease term or estimateduseful life. Depreciation expense for the years ended December 31, 2011, 2010 and 2009 was $1.4 billion, $1.4 billion and $1.3 billion,respectively. Residual values for owned spare parts and simulators are generally 5% of cost except when guaranteed by a third party fora different amount.
We capitalize certain internal and external costs incurred to develop and implement software, and amortize those costs over anestimated useful life of three to seven years. For the years ended December 31, 2011, 2010 and 2009, we recorded $64 million, $71million and $95 million, respectively, for amortization of capitalized software. The net book value of these assets totaled $200 millionand $153 million at December 31, 2011 and 2010, respectively.
We record impairment losses on flight equipment and other long-lived assets used in operations when events and circumstancesindicate the assets may be impaired and the estimated future cash flows generated by those assets are less than their carrying amounts.Factors which could cause impairment include, but are not limited to, (1) a decision to permanently remove flight equipment or otherlong-lived assets from operations, (2) significant changes in the estimated useful life, (3) significant changes in projected cash flows, (4)permanent and significant declines in fleet fair values and (5) changes to the regulatory environment. For long-lived assets held for sale,we discontinue depreciation and record impairment losses when the carrying amount of these assets is greater than the fair value less thecost to sell.
To determine whether impairments exist for aircraft used in operations, we group assets at the fleet-type level (the lowest level forwhich there are identifiable cash flows) and then estimate future cash flows based on projections of capacity, passenger mile yield, fuelcosts, labor costs and other relevant factors. If an impairment occurs, the impairment loss recognized is the amount by which theaircraft's carrying amount exceeds its estimated fair value. We estimate aircraft fair values using published sources, appraisals and bidsreceived from third parties, as available.
Goodwill and Other Intangible Assets
We apply a fair value-based impairment test to the net book value of goodwill and indefinite-lived intangible assets on an annual basis(as of October 1) and, if certain events or circumstances indicate that an impairment loss may have been incurred, on an interim basis. InSeptember 2011, the FASB issued "Testing Goodwill for Impairment." The standard revises the way in which entities test goodwill forimpairment. We adopted this standard and applied its provisions to our annual goodwill impairment test in the December 2011 quarter.
55
Copyright © 2013 www.secdatabase.com. All Rights Reserved.Please Consider the Environment Before Printing This Document
We value goodwill and identified intangible assets primarily using market capitalization and income approach valuation techniques.These measurements include the following significant unobservable inputs: (1) our projected revenues, expenses and cash flows, (2) anestimated weighted average cost of capital, (3) assumed discount rates depending on the asset and (4) a tax rate. These assumptions areconsistent with those hypothetical market participants would use. Since we are required to make estimates and assumptions whenevaluating goodwill and indefinite-lived intangible assets for impairment, the actual amounts may differ materially from these estimates.
Changes in assumptions or circumstances could result in impairment. Factors which could cause impairment include, but are notlimited to, (1) negative trends in our market capitalization, (2) an increase in fuel prices, (3) declining passenger mile yields, (4) lowerpassenger demand as a result of the weakened U.S. and global economy, (5) interruption to our operations due to an employee strike,terrorist attack, or other reasons, (6) changes to the regulatory environment and (7) consolidation of competitors in the airline industry.
Goodwill. As of December 31, 2011 and 2010, our goodwill balance was $9.8 billion. In evaluating goodwill for impairment, weestimate the fair value of our reporting unit by considering market capitalization and other factors if it is more likely than not that thefair value of our reporting unit is less than its carrying value. If the reporting unit's fair value exceeds its carrying value, no furthertesting is required. If, however, the reporting unit's carrying value exceeds its fair value, we then determine the amount of theimpairment charge, if any. We recognize an impairment charge if the carrying value of the reporting unit's goodwill exceeds itsestimated fair value.
Identifiable Intangible Assets. Our identifiable intangible assets had a net carrying amount of $4.8 billion at December 31, 2011.Indefinite-lived assets are not amortized and consist primarily of routes, slots, the Delta tradename and assets related to SkyTeam.Definite-lived intangible assets consist primarily of marketing agreements and contracts and are amortized on a straight-line basis orunder the undiscounted cash flows method over the estimated economic life of the respective agreements and contracts. Costs incurredto renew or extend the term of an intangible asset are expensed as incurred.
We perform the impairment test for indefinite-lived intangible assets by comparing the asset's fair value to its carrying value. Fairvalue is estimated based on (1) recent market transactions, where available, (2) the lease savings method for certain airport slots (whichreflects potential lease savings from owning the slots rather than leasing them from another airline at market rates), (3) the royaltymethod for the Delta tradename (which assumes hypothetical royalties generated from using our tradename) or (4) projected discountedfuture cash flows. We recognize an impairment charge if the asset's carrying value exceeds its estimated fair value.
Income Taxes
We account for deferred income taxes under the liability method. We recognize deferred tax assets and liabilities based on the taxeffects of temporary differences between the financial statement and tax bases of assets and liabilities, as measured by current enactedtax rates. Deferred tax assets and liabilities are recorded net as current and noncurrent deferred income taxes. A valuation allowance isrecorded to reduce deferred tax assets when necessary. For additional information about our valuation allowance, see Note 11.
Manufacturers' Credits
We periodically receive credits in connection with the acquisition of aircraft and engines. These credits are deferred until the aircraftand engines are delivered, and then applied on a pro rata basis as a reduction to the cost of the related equipment.
Maintenance Costs
We record maintenance costs to aircraft maintenance materials and outside repairs. Maintenance costs are expensed as incurred,except for costs incurred under power-by-the-hour contracts, which are expensed based on actual hours flown. Power-by-the-hourcontracts transfer certain risk to third party service providers and fix the amount we pay per flight hour to the service provider inexchange for maintenance and repairs under a predefined maintenance program. Modifications that enhance the operating performanceor extend the useful lives of airframes or engines are capitalized and amortized over the remaining estimated useful life of the asset orthe remaining lease term, whichever is shorter.
56
Copyright © 2013 www.secdatabase.com. All Rights Reserved.Please Consider the Environment Before Printing This Document
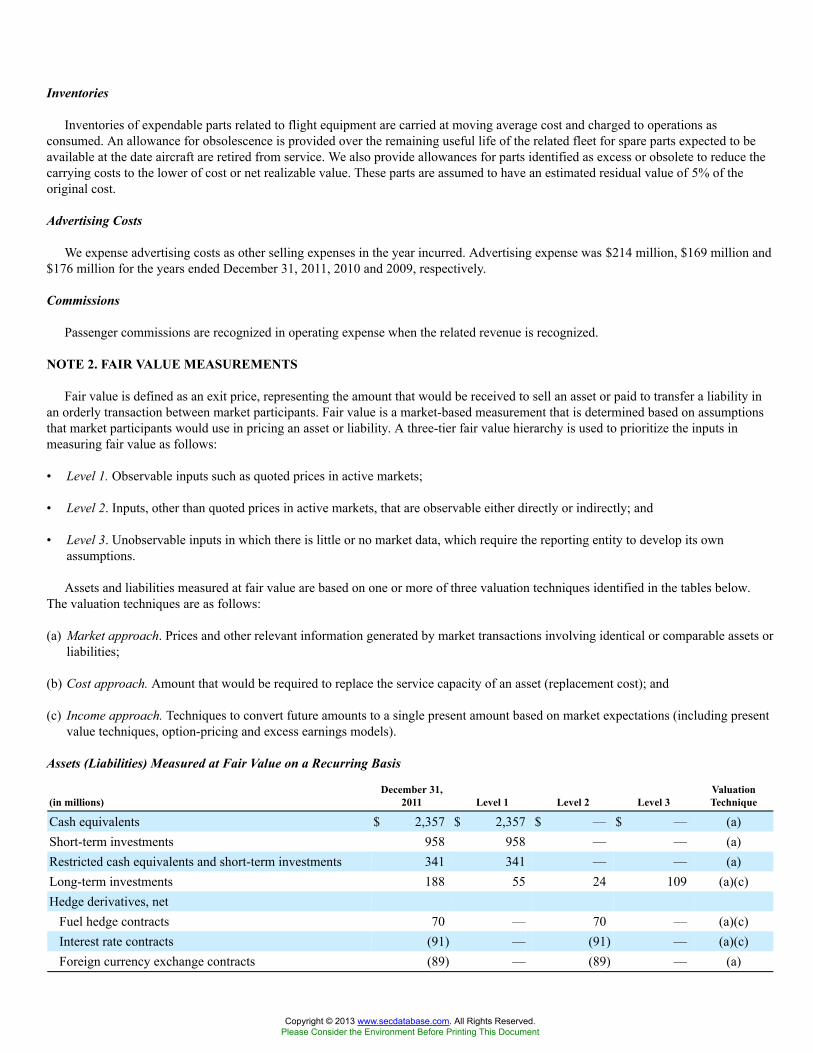
Inventories
Inventories of expendable parts related to flight equipment are carried at moving average cost and charged to operations asconsumed. An allowance for obsolescence is provided over the remaining useful life of the related fleet for spare parts expected to beavailable at the date aircraft are retired from service. We also provide allowances for parts identified as excess or obsolete to reduce thecarrying costs to the lower of cost or net realizable value. These parts are assumed to have an estimated residual value of 5% of theoriginal cost.
Advertising Costs
We expense advertising costs as other selling expenses in the year incurred. Advertising expense was $214 million, $169 million and$176 million for the years ended December 31, 2011, 2010 and 2009, respectively.
Commissions
Passenger commissions are recognized in operating expense when the related revenue is recognized.
NOTE 2. FAIR VALUE MEASUREMENTS
Fair value is defined as an exit price, representing the amount that would be received to sell an asset or paid to transfer a liability inan orderly transaction between market participants. Fair value is a market-based measurement that is determined based on assumptionsthat market participants would use in pricing an asset or liability. A three-tier fair value hierarchy is used to prioritize the inputs inmeasuring fair value as follows:
• Level 1. Observable inputs such as quoted prices in active markets;
• Level 2. Inputs, other than quoted prices in active markets, that are observable either directly or indirectly; and
• Level 3. Unobservable inputs in which there is little or no market data, which require the reporting entity to develop its ownassumptions.
Assets and liabilities measured at fair value are based on one or more of three valuation techniques identified in the tables below.The valuation techniques are as follows:
(a) Market approach. Prices and other relevant information generated by market transactions involving identical or comparable assets orliabilities;
(b) Cost approach. Amount that would be required to replace the service capacity of an asset (replacement cost); and
(c) Income approach. Techniques to convert future amounts to a single present amount based on market expectations (including presentvalue techniques, option-pricing and excess earnings models).
Assets (Liabilities) Measured at Fair Value on a Recurring Basis
(in millions)December 31,
2011 Level 1 Level 2 Level 3ValuationTechnique
Cash equivalents $ 2,357 $ 2,357 $ — $ — (a)Short-term investments 958 958 — — (a)Restricted cash equivalents and short-term investments 341 341 — — (a)Long-term investments 188 55 24 109 (a)(c)Hedge derivatives, net
Fuel hedge contracts 70 — 70 — (a)(c)Interest rate contracts (91) — (91) — (a)(c)Foreign currency exchange contracts (89) — (89) — (a)
Copyright © 2013 www.secdatabase.com. All Rights Reserved.Please Consider the Environment Before Printing This Document

57
Copyright © 2013 www.secdatabase.com. All Rights Reserved.Please Consider the Environment Before Printing This Document
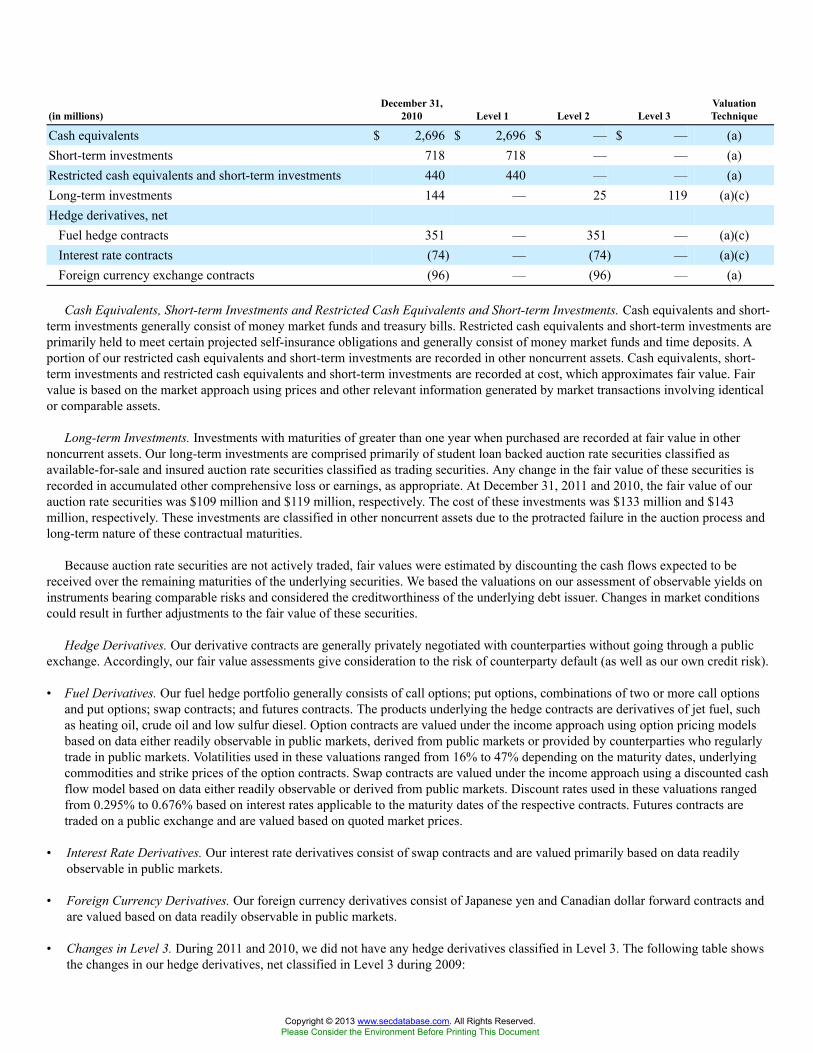
(in millions)December 31,
2010 Level 1 Level 2 Level 3ValuationTechnique
Cash equivalents $ 2,696 $ 2,696 $ — $ — (a)Short-term investments 718 718 — — (a)Restricted cash equivalents and short-term investments 440 440 — — (a)Long-term investments 144 — 25 119 (a)(c)Hedge derivatives, net
Fuel hedge contracts 351 — 351 — (a)(c)Interest rate contracts (74) — (74) — (a)(c)Foreign currency exchange contracts (96) — (96) — (a)
Cash Equivalents, Short-term Investments and Restricted Cash Equivalents and Short-term Investments. Cash equivalents and short-term investments generally consist of money market funds and treasury bills. Restricted cash equivalents and short-term investments areprimarily held to meet certain projected self-insurance obligations and generally consist of money market funds and time deposits. Aportion of our restricted cash equivalents and short-term investments are recorded in other noncurrent assets. Cash equivalents, short-term investments and restricted cash equivalents and short-term investments are recorded at cost, which approximates fair value. Fairvalue is based on the market approach using prices and other relevant information generated by market transactions involving identicalor comparable assets.
Long-term Investments. Investments with maturities of greater than one year when purchased are recorded at fair value in othernoncurrent assets. Our long-term investments are comprised primarily of student loan backed auction rate securities classified asavailable-for-sale and insured auction rate securities classified as trading securities. Any change in the fair value of these securities isrecorded in accumulated other comprehensive loss or earnings, as appropriate. At December 31, 2011 and 2010, the fair value of ourauction rate securities was $109 million and $119 million, respectively. The cost of these investments was $133 million and $143million, respectively. These investments are classified in other noncurrent assets due to the protracted failure in the auction process andlong-term nature of these contractual maturities.
Because auction rate securities are not actively traded, fair values were estimated by discounting the cash flows expected to bereceived over the remaining maturities of the underlying securities. We based the valuations on our assessment of observable yields oninstruments bearing comparable risks and considered the creditworthiness of the underlying debt issuer. Changes in market conditionscould result in further adjustments to the fair value of these securities.
Hedge Derivatives. Our derivative contracts are generally privately negotiated with counterparties without going through a publicexchange. Accordingly, our fair value assessments give consideration to the risk of counterparty default (as well as our own credit risk).
• Fuel Derivatives. Our fuel hedge portfolio generally consists of call options; put options, combinations of two or more call optionsand put options; swap contracts; and futures contracts. The products underlying the hedge contracts are derivatives of jet fuel, suchas heating oil, crude oil and low sulfur diesel. Option contracts are valued under the income approach using option pricing modelsbased on data either readily observable in public markets, derived from public markets or provided by counterparties who regularlytrade in public markets. Volatilities used in these valuations ranged from 16% to 47% depending on the maturity dates, underlyingcommodities and strike prices of the option contracts. Swap contracts are valued under the income approach using a discounted cashflow model based on data either readily observable or derived from public markets. Discount rates used in these valuations rangedfrom 0.295% to 0.676% based on interest rates applicable to the maturity dates of the respective contracts. Futures contracts aretraded on a public exchange and are valued based on quoted market prices.
• Interest Rate Derivatives. Our interest rate derivatives consist of swap contracts and are valued primarily based on data readilyobservable in public markets.
• Foreign Currency Derivatives. Our foreign currency derivatives consist of Japanese yen and Canadian dollar forward contracts andare valued based on data readily observable in public markets.
• Changes in Level 3. During 2011 and 2010, we did not have any hedge derivatives classified in Level 3. The following table showsthe changes in our hedge derivatives, net classified in Level 3 during 2009:
Copyright © 2013 www.secdatabase.com. All Rights Reserved.Please Consider the Environment Before Printing This Document

58
Copyright © 2013 www.secdatabase.com. All Rights Reserved.Please Consider the Environment Before Printing This Document
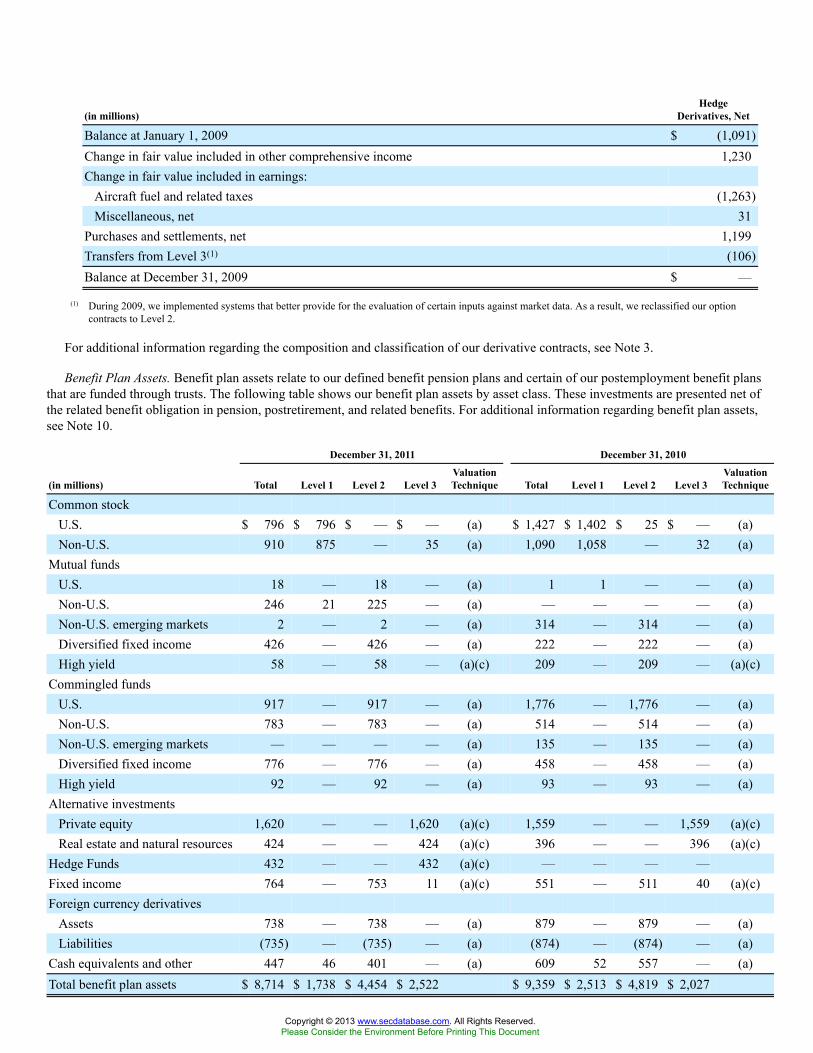
(in millions)Hedge
Derivatives, Net
Balance at January 1, 2009 $ (1,091)Change in fair value included in other comprehensive income 1,230Change in fair value included in earnings:
Aircraft fuel and related taxes (1,263)Miscellaneous, net 31
Purchases and settlements, net 1,199Transfers from Level 3(1) (106)Balance at December 31, 2009 $ —
(1) During 2009, we implemented systems that better provide for the evaluation of certain inputs against market data. As a result, we reclassified our optioncontracts to Level 2.
For additional information regarding the composition and classification of our derivative contracts, see Note 3.
Benefit Plan Assets. Benefit plan assets relate to our defined benefit pension plans and certain of our postemployment benefit plansthat are funded through trusts. The following table shows our benefit plan assets by asset class. These investments are presented net ofthe related benefit obligation in pension, postretirement, and related benefits. For additional information regarding benefit plan assets,see Note 10.
December 31, 2011 December 31, 2010
(in millions) Total Level 1 Level 2 Level 3ValuationTechnique Total Level 1 Level 2 Level 3
ValuationTechnique
Common stockU.S. $ 796 $ 796 $ — $ — (a) $ 1,427 $ 1,402 $ 25 $ — (a)Non-U.S. 910 875 — 35 (a) 1,090 1,058 — 32 (a)
Mutual fundsU.S. 18 — 18 — (a) 1 1 — — (a)Non-U.S. 246 21 225 — (a) — — — — (a)Non-U.S. emerging markets 2 — 2 — (a) 314 — 314 — (a)Diversified fixed income 426 — 426 — (a) 222 — 222 — (a)High yield 58 — 58 — (a)(c) 209 — 209 — (a)(c)
Commingled fundsU.S. 917 — 917 — (a) 1,776 — 1,776 — (a)Non-U.S. 783 — 783 — (a) 514 — 514 — (a)Non-U.S. emerging markets — — — — (a) 135 — 135 — (a)Diversified fixed income 776 — 776 — (a) 458 — 458 — (a)High yield 92 — 92 — (a) 93 — 93 — (a)
Alternative investmentsPrivate equity 1,620 — — 1,620 (a)(c) 1,559 — — 1,559 (a)(c)Real estate and natural resources 424 — — 424 (a)(c) 396 — — 396 (a)(c)
Hedge Funds 432 — — 432 (a)(c) — — — —Fixed income 764 — 753 11 (a)(c) 551 — 511 40 (a)(c)Foreign currency derivatives
Assets 738 — 738 — (a) 879 — 879 — (a)Liabilities (735) — (735) — (a) (874) — (874) — (a)
Cash equivalents and other 447 46 401 — (a) 609 52 557 — (a)Total benefit plan assets $ 8,714 $ 1,738 $ 4,454 $ 2,522 $ 9,359 $ 2,513 $ 4,819 $ 2,027
Copyright © 2013 www.secdatabase.com. All Rights Reserved.Please Consider the Environment Before Printing This Document

59
Copyright © 2013 www.secdatabase.com. All Rights Reserved.Please Consider the Environment Before Printing This Document
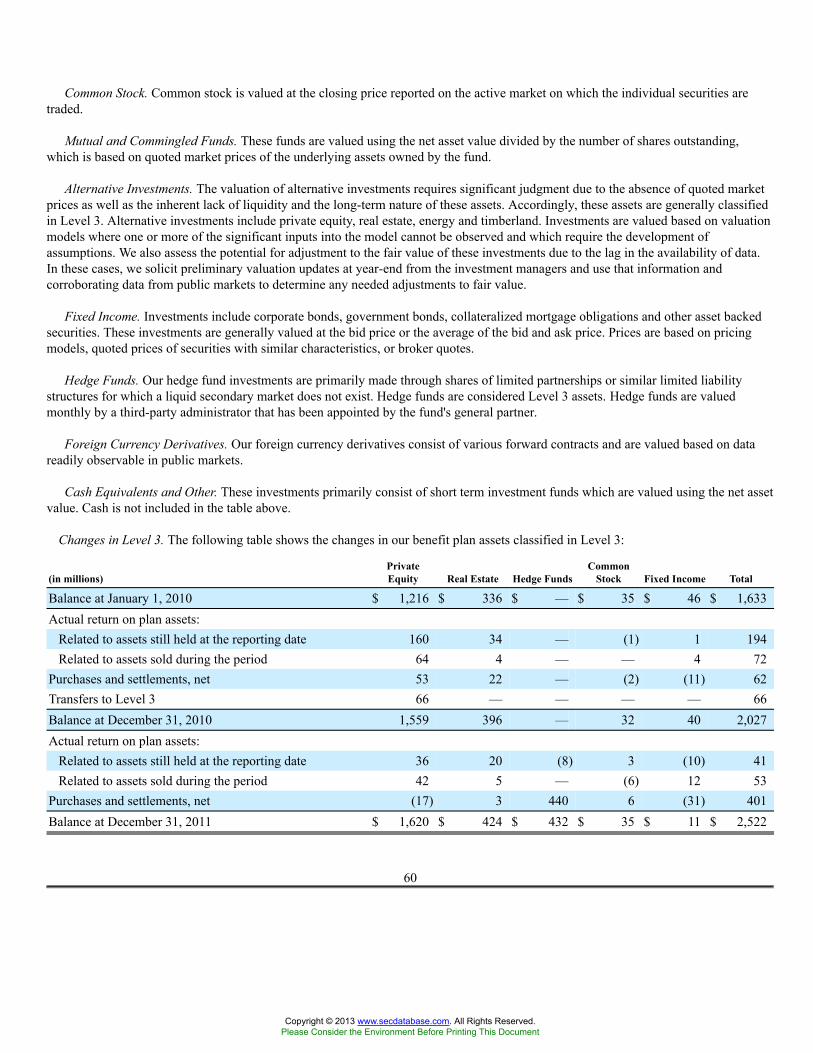
Common Stock. Common stock is valued at the closing price reported on the active market on which the individual securities aretraded.
Mutual and Commingled Funds. These funds are valued using the net asset value divided by the number of shares outstanding,which is based on quoted market prices of the underlying assets owned by the fund.
Alternative Investments. The valuation of alternative investments requires significant judgment due to the absence of quoted marketprices as well as the inherent lack of liquidity and the long-term nature of these assets. Accordingly, these assets are generally classifiedin Level 3. Alternative investments include private equity, real estate, energy and timberland. Investments are valued based on valuationmodels where one or more of the significant inputs into the model cannot be observed and which require the development ofassumptions. We also assess the potential for adjustment to the fair value of these investments due to the lag in the availability of data.In these cases, we solicit preliminary valuation updates at year-end from the investment managers and use that information andcorroborating data from public markets to determine any needed adjustments to fair value.
Fixed Income. Investments include corporate bonds, government bonds, collateralized mortgage obligations and other asset backedsecurities. These investments are generally valued at the bid price or the average of the bid and ask price. Prices are based on pricingmodels, quoted prices of securities with similar characteristics, or broker quotes.
Hedge Funds. Our hedge fund investments are primarily made through shares of limited partnerships or similar limited liabilitystructures for which a liquid secondary market does not exist. Hedge funds are considered Level 3 assets. Hedge funds are valuedmonthly by a third-party administrator that has been appointed by the fund's general partner.
Foreign Currency Derivatives. Our foreign currency derivatives consist of various forward contracts and are valued based on datareadily observable in public markets.
Cash Equivalents and Other. These investments primarily consist of short term investment funds which are valued using the net assetvalue. Cash is not included in the table above.
Changes in Level 3. The following table shows the changes in our benefit plan assets classified in Level 3:
(in millions)PrivateEquity Real Estate Hedge Funds
CommonStock Fixed Income Total
Balance at January 1, 2010 $ 1,216 $ 336 $ — $ 35 $ 46 $ 1,633Actual return on plan assets:
Related to assets still held at the reporting date 160 34 — (1) 1 194Related to assets sold during the period 64 4 — — 4 72
Purchases and settlements, net 53 22 — (2) (11) 62Transfers to Level 3 66 — — — — 66Balance at December 31, 2010 1,559 396 — 32 40 2,027Actual return on plan assets:
Related to assets still held at the reporting date 36 20 (8) 3 (10) 41Related to assets sold during the period 42 5 — (6) 12 53
Purchases and settlements, net (17) 3 440 6 (31) 401Balance at December 31, 2011 $ 1,620 $ 424 $ 432 $ 35 $ 11 $ 2,522
60
Copyright © 2013 www.secdatabase.com. All Rights Reserved.Please Consider the Environment Before Printing This Document
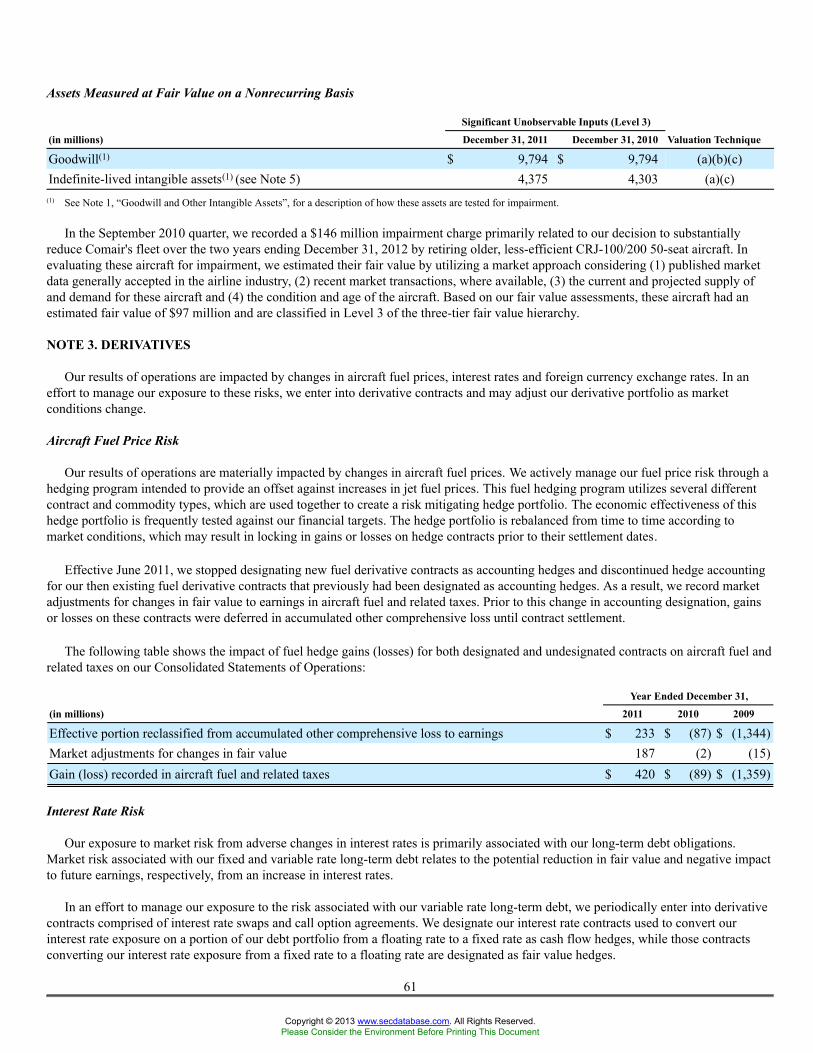
Assets Measured at Fair Value on a Nonrecurring Basis
Significant Unobservable Inputs (Level 3)
(in millions) December 31, 2011 December 31, 2010 Valuation Technique
Goodwill(1) $ 9,794 $ 9,794 (a)(b)(c)Indefinite-lived intangible assets(1) (see Note 5) 4,375 4,303 (a)(c)
(1) See Note 1, “Goodwill and Other Intangible Assets”, for a description of how these assets are tested for impairment.
In the September 2010 quarter, we recorded a $146 million impairment charge primarily related to our decision to substantiallyreduce Comair's fleet over the two years ending December 31, 2012 by retiring older, less-efficient CRJ-100/200 50-seat aircraft. Inevaluating these aircraft for impairment, we estimated their fair value by utilizing a market approach considering (1) published marketdata generally accepted in the airline industry, (2) recent market transactions, where available, (3) the current and projected supply ofand demand for these aircraft and (4) the condition and age of the aircraft. Based on our fair value assessments, these aircraft had anestimated fair value of $97 million and are classified in Level 3 of the three-tier fair value hierarchy.
NOTE 3. DERIVATIVES
Our results of operations are impacted by changes in aircraft fuel prices, interest rates and foreign currency exchange rates. In aneffort to manage our exposure to these risks, we enter into derivative contracts and may adjust our derivative portfolio as marketconditions change.
Aircraft Fuel Price Risk
Our results of operations are materially impacted by changes in aircraft fuel prices. We actively manage our fuel price risk through ahedging program intended to provide an offset against increases in jet fuel prices. This fuel hedging program utilizes several differentcontract and commodity types, which are used together to create a risk mitigating hedge portfolio. The economic effectiveness of thishedge portfolio is frequently tested against our financial targets. The hedge portfolio is rebalanced from time to time according tomarket conditions, which may result in locking in gains or losses on hedge contracts prior to their settlement dates.
Effective June 2011, we stopped designating new fuel derivative contracts as accounting hedges and discontinued hedge accountingfor our then existing fuel derivative contracts that previously had been designated as accounting hedges. As a result, we record marketadjustments for changes in fair value to earnings in aircraft fuel and related taxes. Prior to this change in accounting designation, gainsor losses on these contracts were deferred in accumulated other comprehensive loss until contract settlement.
The following table shows the impact of fuel hedge gains (losses) for both designated and undesignated contracts on aircraft fuel andrelated taxes on our Consolidated Statements of Operations:
Year Ended December 31,
(in millions) 2011 2010 2009
Effective portion reclassified from accumulated other comprehensive loss to earnings $ 233 $ (87) $ (1,344)Market adjustments for changes in fair value 187 (2) (15)Gain (loss) recorded in aircraft fuel and related taxes $ 420 $ (89) $ (1,359)
Interest Rate Risk
Our exposure to market risk from adverse changes in interest rates is primarily associated with our long-term debt obligations.Market risk associated with our fixed and variable rate long-term debt relates to the potential reduction in fair value and negative impactto future earnings, respectively, from an increase in interest rates.
In an effort to manage our exposure to the risk associated with our variable rate long-term debt, we periodically enter into derivativecontracts comprised of interest rate swaps and call option agreements. We designate our interest rate contracts used to convert ourinterest rate exposure on a portion of our debt portfolio from a floating rate to a fixed rate as cash flow hedges, while those contractsconverting our interest rate exposure from a fixed rate to a floating rate are designated as fair value hedges.
61
Copyright © 2013 www.secdatabase.com. All Rights Reserved.Please Consider the Environment Before Printing This Document
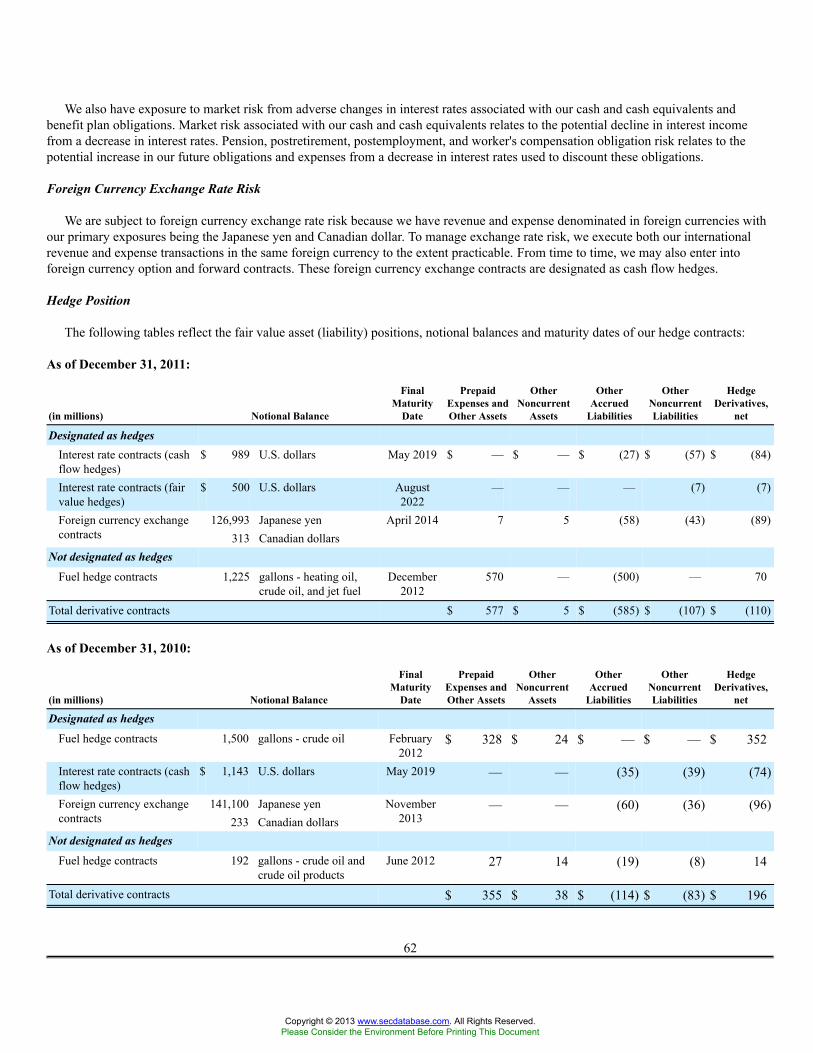
We also have exposure to market risk from adverse changes in interest rates associated with our cash and cash equivalents andbenefit plan obligations. Market risk associated with our cash and cash equivalents relates to the potential decline in interest incomefrom a decrease in interest rates. Pension, postretirement, postemployment, and worker's compensation obligation risk relates to thepotential increase in our future obligations and expenses from a decrease in interest rates used to discount these obligations.
Foreign Currency Exchange Rate Risk
We are subject to foreign currency exchange rate risk because we have revenue and expense denominated in foreign currencies withour primary exposures being the Japanese yen and Canadian dollar. To manage exchange rate risk, we execute both our internationalrevenue and expense transactions in the same foreign currency to the extent practicable. From time to time, we may also enter intoforeign currency option and forward contracts. These foreign currency exchange contracts are designated as cash flow hedges.
Hedge Position
The following tables reflect the fair value asset (liability) positions, notional balances and maturity dates of our hedge contracts:
As of December 31, 2011:
(in millions) Notional Balance
FinalMaturity
Date
PrepaidExpenses andOther Assets
OtherNoncurrent
Assets
OtherAccrued
Liabilities
OtherNoncurrentLiabilities
HedgeDerivatives,
net
Designated as hedgesInterest rate contracts (cashflow hedges)
$ 989 U.S. dollars May 2019 $ — $ — $ (27) $ (57) $ (84)
Interest rate contracts (fairvalue hedges)
$ 500 U.S. dollars August2022
— — — (7) (7)
126,993 Japanese yenForeign currency exchangecontracts 313 Canadian dollars
April 2014 7 5 (58) (43) (89)
Not designated as hedgesFuel hedge contracts 1,225 gallons - heating oil,
crude oil, and jet fuelDecember
2012570 — (500) — 70
Total derivative contracts $ 577 $ 5 $ (585) $ (107) $ (110)
As of December 31, 2010:
(in millions) Notional Balance
FinalMaturity
Date
PrepaidExpenses andOther Assets
OtherNoncurrent
Assets
OtherAccrued
Liabilities
OtherNoncurrentLiabilities
HedgeDerivatives,
net
Designated as hedgesFuel hedge contracts 1,500 gallons - crude oil February
2012$ 328 $ 24 $ — $ — $ 352
Interest rate contracts (cashflow hedges)
$ 1,143 U.S. dollars May 2019 — — (35) (39) (74)
141,100 Japanese yenForeign currency exchangecontracts 233 Canadian dollars
November2013
— — (60) (36) (96)
Not designated as hedgesFuel hedge contracts 192 gallons - crude oil and
crude oil productsJune 2012 27 14 (19) (8) 14
Total derivative contracts $ 355 $ 38 $ (114) $ (83) $ 196
62
Copyright © 2013 www.secdatabase.com. All Rights Reserved.Please Consider the Environment Before Printing This Document
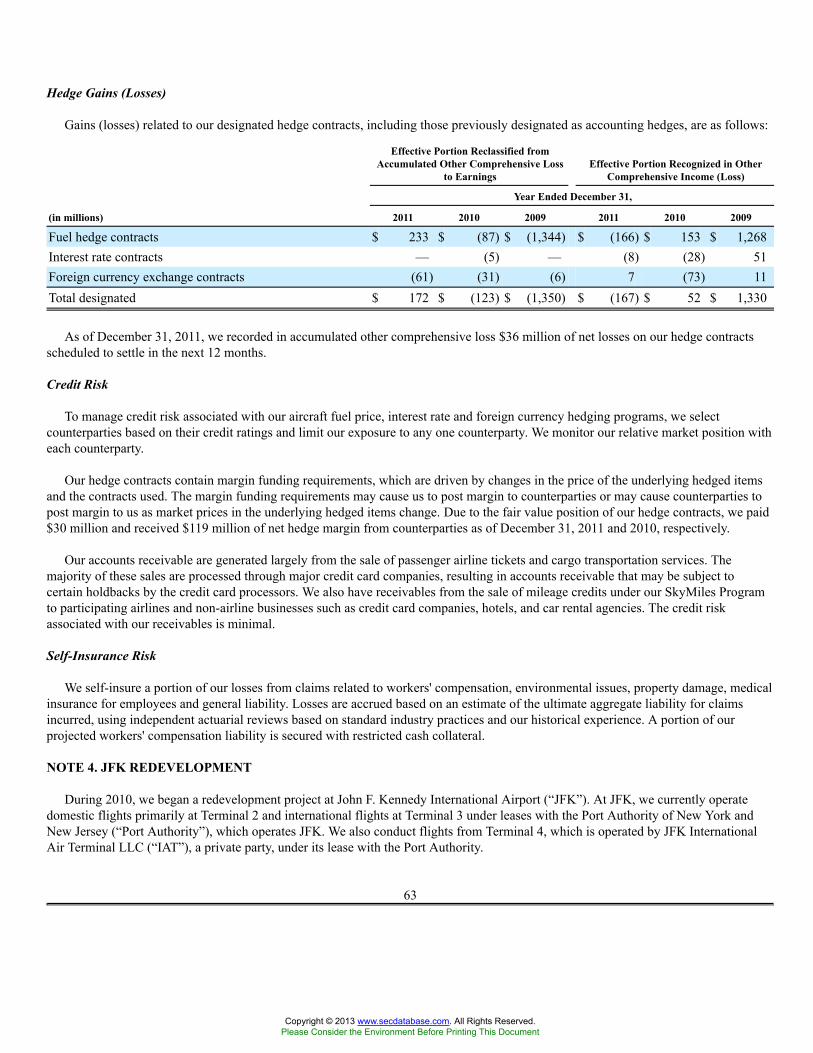
Hedge Gains (Losses)
Gains (losses) related to our designated hedge contracts, including those previously designated as accounting hedges, are as follows:
Effective Portion Reclassified fromAccumulated Other Comprehensive Loss
to EarningsEffective Portion Recognized in Other
Comprehensive Income (Loss)
Year Ended December 31,
(in millions) 2011 2010 2009 2011 2010 2009
Fuel hedge contracts $ 233 $ (87) $ (1,344) $ (166) $ 153 $ 1,268Interest rate contracts — (5) — (8) (28) 51Foreign currency exchange contracts (61) (31) (6) 7 (73) 11Total designated $ 172 $ (123) $ (1,350) $ (167) $ 52 $ 1,330
As of December 31, 2011, we recorded in accumulated other comprehensive loss $36 million of net losses on our hedge contractsscheduled to settle in the next 12 months.
Credit Risk
To manage credit risk associated with our aircraft fuel price, interest rate and foreign currency hedging programs, we selectcounterparties based on their credit ratings and limit our exposure to any one counterparty. We monitor our relative market position witheach counterparty.
Our hedge contracts contain margin funding requirements, which are driven by changes in the price of the underlying hedged itemsand the contracts used. The margin funding requirements may cause us to post margin to counterparties or may cause counterparties topost margin to us as market prices in the underlying hedged items change. Due to the fair value position of our hedge contracts, we paid$30 million and received $119 million of net hedge margin from counterparties as of December 31, 2011 and 2010, respectively.
Our accounts receivable are generated largely from the sale of passenger airline tickets and cargo transportation services. Themajority of these sales are processed through major credit card companies, resulting in accounts receivable that may be subject tocertain holdbacks by the credit card processors. We also have receivables from the sale of mileage credits under our SkyMiles Programto participating airlines and non-airline businesses such as credit card companies, hotels, and car rental agencies. The credit riskassociated with our receivables is minimal.
Self-Insurance Risk
We self-insure a portion of our losses from claims related to workers' compensation, environmental issues, property damage, medicalinsurance for employees and general liability. Losses are accrued based on an estimate of the ultimate aggregate liability for claimsincurred, using independent actuarial reviews based on standard industry practices and our historical experience. A portion of ourprojected workers' compensation liability is secured with restricted cash collateral.
NOTE 4. JFK REDEVELOPMENT
During 2010, we began a redevelopment project at John F. Kennedy International Airport (“JFK”). At JFK, we currently operatedomestic flights primarily at Terminal 2 and international flights at Terminal 3 under leases with the Port Authority of New York andNew Jersey (“Port Authority”), which operates JFK. We also conduct flights from Terminal 4, which is operated by JFK InternationalAir Terminal LLC (“IAT”), a private party, under its lease with the Port Authority.
63
Copyright © 2013 www.secdatabase.com. All Rights Reserved.Please Consider the Environment Before Printing This Document
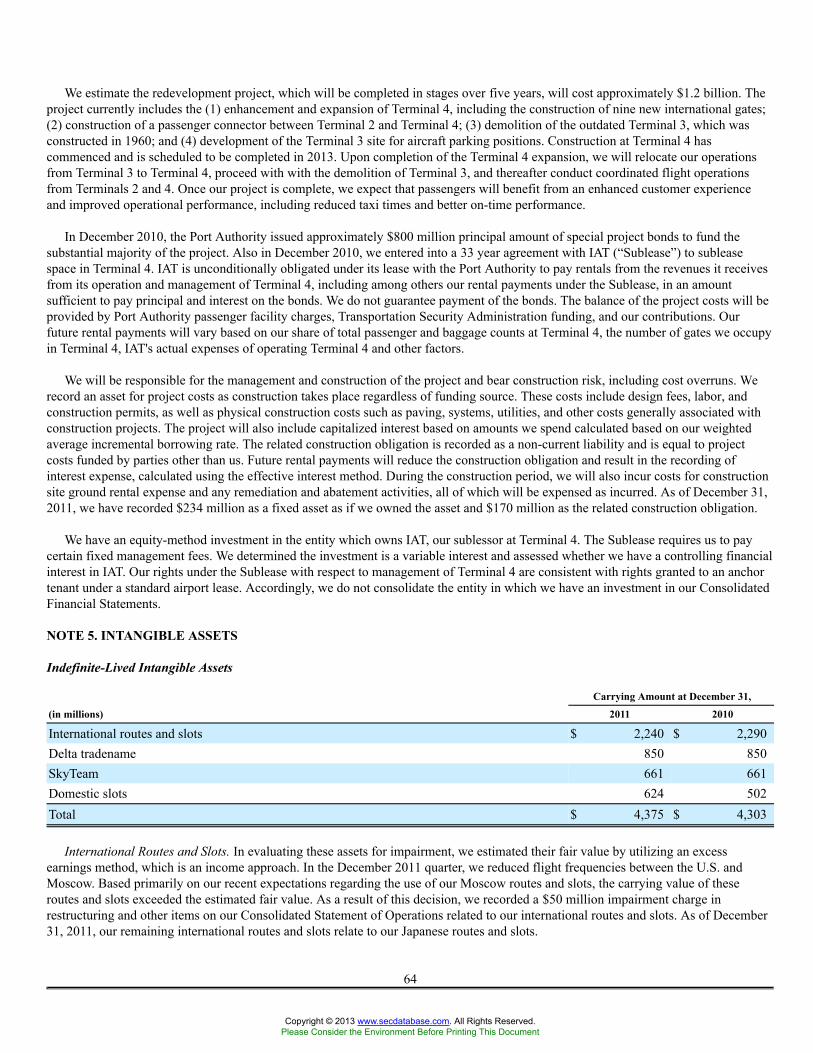
We estimate the redevelopment project, which will be completed in stages over five years, will cost approximately $1.2 billion. Theproject currently includes the (1) enhancement and expansion of Terminal 4, including the construction of nine new international gates;(2) construction of a passenger connector between Terminal 2 and Terminal 4; (3) demolition of the outdated Terminal 3, which wasconstructed in 1960; and (4) development of the Terminal 3 site for aircraft parking positions. Construction at Terminal 4 hascommenced and is scheduled to be completed in 2013. Upon completion of the Terminal 4 expansion, we will relocate our operationsfrom Terminal 3 to Terminal 4, proceed with with the demolition of Terminal 3, and thereafter conduct coordinated flight operationsfrom Terminals 2 and 4. Once our project is complete, we expect that passengers will benefit from an enhanced customer experienceand improved operational performance, including reduced taxi times and better on-time performance.
In December 2010, the Port Authority issued approximately $800 million principal amount of special project bonds to fund thesubstantial majority of the project. Also in December 2010, we entered into a 33 year agreement with IAT (“Sublease”) to subleasespace in Terminal 4. IAT is unconditionally obligated under its lease with the Port Authority to pay rentals from the revenues it receivesfrom its operation and management of Terminal 4, including among others our rental payments under the Sublease, in an amountsufficient to pay principal and interest on the bonds. We do not guarantee payment of the bonds. The balance of the project costs will beprovided by Port Authority passenger facility charges, Transportation Security Administration funding, and our contributions. Ourfuture rental payments will vary based on our share of total passenger and baggage counts at Terminal 4, the number of gates we occupyin Terminal 4, IAT's actual expenses of operating Terminal 4 and other factors.
We will be responsible for the management and construction of the project and bear construction risk, including cost overruns. Werecord an asset for project costs as construction takes place regardless of funding source. These costs include design fees, labor, andconstruction permits, as well as physical construction costs such as paving, systems, utilities, and other costs generally associated withconstruction projects. The project will also include capitalized interest based on amounts we spend calculated based on our weightedaverage incremental borrowing rate. The related construction obligation is recorded as a non-current liability and is equal to projectcosts funded by parties other than us. Future rental payments will reduce the construction obligation and result in the recording ofinterest expense, calculated using the effective interest method. During the construction period, we will also incur costs for constructionsite ground rental expense and any remediation and abatement activities, all of which will be expensed as incurred. As of December 31,2011, we have recorded $234 million as a fixed asset as if we owned the asset and $170 million as the related construction obligation.
We have an equity-method investment in the entity which owns IAT, our sublessor at Terminal 4. The Sublease requires us to paycertain fixed management fees. We determined the investment is a variable interest and assessed whether we have a controlling financialinterest in IAT. Our rights under the Sublease with respect to management of Terminal 4 are consistent with rights granted to an anchortenant under a standard airport lease. Accordingly, we do not consolidate the entity in which we have an investment in our ConsolidatedFinancial Statements.
NOTE 5. INTANGIBLE ASSETS
Indefinite-Lived Intangible Assets
Carrying Amount at December 31,
(in millions) 2011 2010
International routes and slots $ 2,240 $ 2,290Delta tradename 850 850SkyTeam 661 661Domestic slots 624 502Total $ 4,375 $ 4,303
International Routes and Slots. In evaluating these assets for impairment, we estimated their fair value by utilizing an excessearnings method, which is an income approach. In the December 2011 quarter, we reduced flight frequencies between the U.S. andMoscow. Based primarily on our recent expectations regarding the use of our Moscow routes and slots, the carrying value of theseroutes and slots exceeded the estimated fair value. As a result of this decision, we recorded a $50 million impairment charge inrestructuring and other items on our Consolidated Statement of Operations related to our international routes and slots. As of December31, 2011, our remaining international routes and slots relate to our Japanese routes and slots.
64
Copyright © 2013 www.secdatabase.com. All Rights Reserved.Please Consider the Environment Before Printing This Document
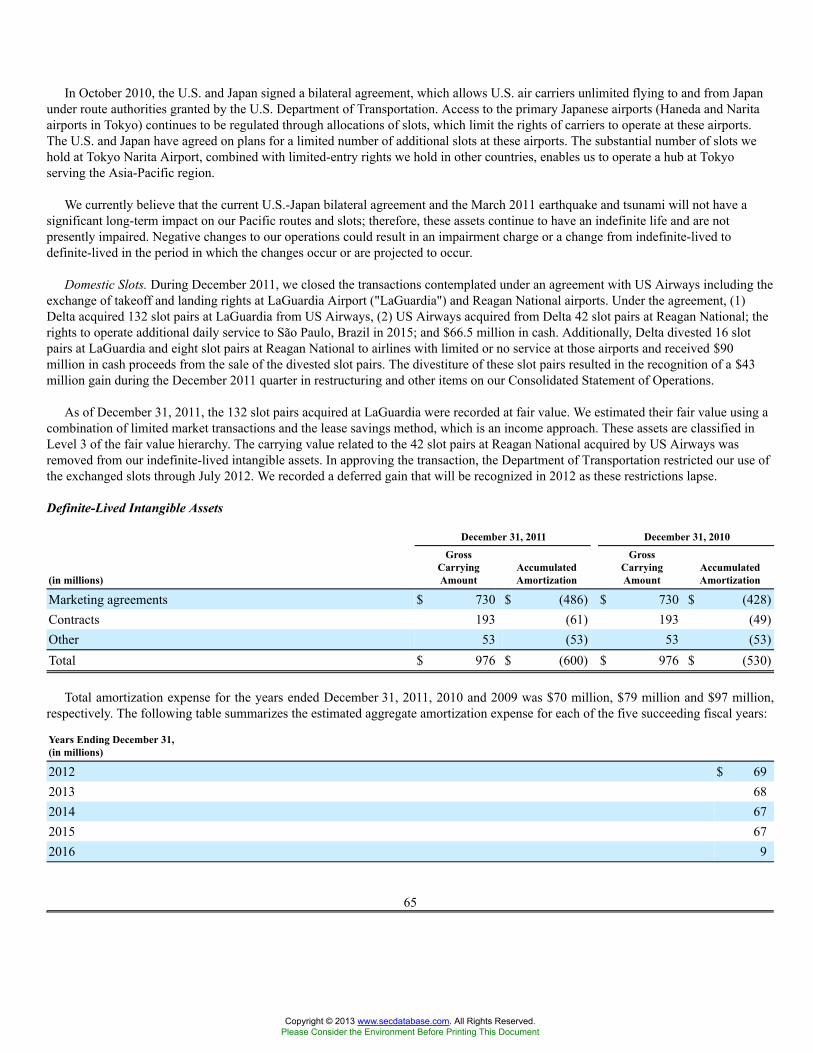
In October 2010, the U.S. and Japan signed a bilateral agreement, which allows U.S. air carriers unlimited flying to and from Japanunder route authorities granted by the U.S. Department of Transportation. Access to the primary Japanese airports (Haneda and Naritaairports in Tokyo) continues to be regulated through allocations of slots, which limit the rights of carriers to operate at these airports.The U.S. and Japan have agreed on plans for a limited number of additional slots at these airports. The substantial number of slots wehold at Tokyo Narita Airport, combined with limited-entry rights we hold in other countries, enables us to operate a hub at Tokyoserving the Asia-Pacific region.
We currently believe that the current U.S.-Japan bilateral agreement and the March 2011 earthquake and tsunami will not have asignificant long-term impact on our Pacific routes and slots; therefore, these assets continue to have an indefinite life and are notpresently impaired. Negative changes to our operations could result in an impairment charge or a change from indefinite-lived todefinite-lived in the period in which the changes occur or are projected to occur.
Domestic Slots. During December 2011, we closed the transactions contemplated under an agreement with US Airways including theexchange of takeoff and landing rights at LaGuardia Airport ("LaGuardia") and Reagan National airports. Under the agreement, (1)Delta acquired 132 slot pairs at LaGuardia from US Airways, (2) US Airways acquired from Delta 42 slot pairs at Reagan National; therights to operate additional daily service to São Paulo, Brazil in 2015; and $66.5 million in cash. Additionally, Delta divested 16 slotpairs at LaGuardia and eight slot pairs at Reagan National to airlines with limited or no service at those airports and received $90million in cash proceeds from the sale of the divested slot pairs. The divestiture of these slot pairs resulted in the recognition of a $43million gain during the December 2011 quarter in restructuring and other items on our Consolidated Statement of Operations.
As of December 31, 2011, the 132 slot pairs acquired at LaGuardia were recorded at fair value. We estimated their fair value using acombination of limited market transactions and the lease savings method, which is an income approach. These assets are classified inLevel 3 of the fair value hierarchy. The carrying value related to the 42 slot pairs at Reagan National acquired by US Airways wasremoved from our indefinite-lived intangible assets. In approving the transaction, the Department of Transportation restricted our use ofthe exchanged slots through July 2012. We recorded a deferred gain that will be recognized in 2012 as these restrictions lapse.
Definite-Lived Intangible Assets
December 31, 2011 December 31, 2010
(in millions)
GrossCarryingAmount
AccumulatedAmortization
GrossCarryingAmount
AccumulatedAmortization
Marketing agreements $ 730 $ (486) $ 730 $ (428)Contracts 193 (61) 193 (49)Other 53 (53) 53 (53)Total $ 976 $ (600) $ 976 $ (530)
Total amortization expense for the years ended December 31, 2011, 2010 and 2009 was $70 million, $79 million and $97 million,respectively. The following table summarizes the estimated aggregate amortization expense for each of the five succeeding fiscal years:
Years Ending December 31,(in millions)
2012 $ 692013 682014 672015 672016 9
65
Copyright © 2013 www.secdatabase.com. All Rights Reserved.Please Consider the Environment Before Printing This Document
NOTE 6. AMERICAN EXPRESS RELATIONSHIP
General. Our agreements with American Express provide for joint marketing, grant certain benefits to Delta-American Express co-branded credit card holders ("Cardholders") and American Express Membership Rewards Program participants, and allow AmericanExpress to market to our customer database. Cardholders earn mileage credits for making purchases on their co-branded cards, maycheck their first bag for free on every Delta flight and enjoy other benefits while traveling with Delta. Additionally, participants in theAmerican Express Membership Rewards program may exchange their points for mileage credits under the SkyMiles Program. As aresult, we sell mileage credits at agreed upon rates to American Express for provision to their customers under the co-brand credit cardprogram and the Membership Rewards program.
Advance Purchase of SkyMiles. In 2008, we entered into a multi-year extension of our American Express agreements and received$1.0 billion from American Express for an advance purchase of SkyMiles (the "prepayment"). The 2008 agreement provided that ourobligations with respect to the advance purchase would be satisfied as American Express uses the purchased miles over a specifiedfuture period (“SkyMiles Usage Period”), rather than by cash payments from us to American Express. Due to the SkyMiles UsagePeriod and other restrictions placed upon American Express regarding the timing and use of the SkyMiles, we classified the $1.0 billionwe received, the prepayment, as long-term debt.
In 2010, we amended our 2008 American Express agreement. The amendments, among other things, (1) provide that Cardholdersmay check their first bag for free on every Delta flight through June 2013 ("Baggage Fee Waiver Period"), (2) changed the SkyMilesUsage Period to a three-year period beginning in the December 2011 quarter from a two-year period beginning in December 2010quarter, and (3) gave American Express the option to extend our agreements with them for one year.
During the SkyMiles Usage Period, which commenced during the December 2011 quarter, American Express will draw down on theprepayment instead of paying cash to Delta for SkyMiles used. As of December 31, 2011, $952 million of the original $1.0 billion debt(or prepayment) remained, including $333 million which is classified in current maturities of long-term debt and capital leases. AsSkyMiles are used by American Express, we recognize the two separate revenue components of these SkyMiles consistent with ouraccounting policy discussed in Note 1. We defer revenue related to the portion of the mileage credits redeemable for future travel andrecognize it as passenger revenue when miles are redeemed and services are provided. The value of the marketing component isdetermined under the residual method and recognized as other revenue as related marketing services are provided.
Annual Sale of SkyMiles. In December 2011, we further amended our American Express agreements and sold American Express$675 million of SkyMiles. Under the December 2011 amendment, we anticipate American Express will make additional purchases of$675 million of SkyMiles in each of 2012, 2013, and 2014. The December 2011 amendment also extends the Baggage Fee WaiverPeriod. The SkyMiles purchased pursuant to the December 2011 amendment may be used immediately by American Express. The usageof these SkyMiles is not restricted in any way. These annual purchases of SkyMiles will be recorded as deferred revenue within currentliabilities. The portion of each purchase of SkyMiles related to mileage credits redeemable for future travel will be classified withinfrequent flyer deferred revenue and the portion related to the marketing component will be classified within other accrued liabilities.
The December 2011 amendment does not change the number of miles that we expect American Express to purchase from us over thenext four years. It only impacts the timing of those purchases. The December 2011 amendment did not make any significant changes tothe deliverables (the mileage credits sold and the marketing component). Therefore, it is not a material modification of the AmericanExpress agreements under the accounting guidance. A future material modification of the American Express agreements could impactour deferral rate or cause an adjustment to our deferred revenue balance, which could materially impact our future financial results. Foradditional information, see "Frequent Flyer Program" in Note 1.
Fuel Card Obligation. In December 2011, we also obtained a purchasing card with American Express for the purpose of buying jetfuel. The card currently carries a maximum credit limit of $612 million and must be paid monthly. As of December 31, 2011, we had$318 million outstanding on this purchasing card, which was classified as other accrued liabilities.
66
Copyright © 2013 www.secdatabase.com. All Rights Reserved.Please Consider the Environment Before Printing This Document
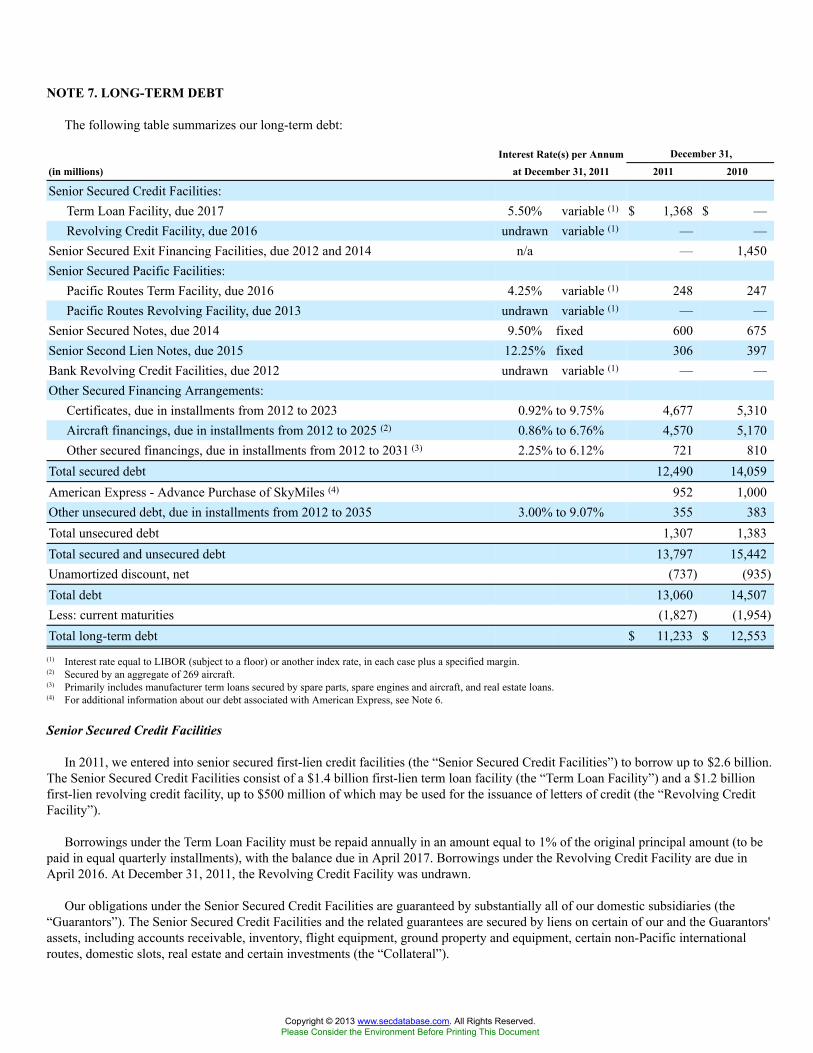
NOTE 7. LONG-TERM DEBT
The following table summarizes our long-term debt:
Interest Rate(s) per Annum December 31,
(in millions) at December 31, 2011 2011 2010
Senior Secured Credit Facilities:Term Loan Facility, due 2017 5.50% variable (1) $ 1,368 $ —Revolving Credit Facility, due 2016 undrawn variable (1) — —
Senior Secured Exit Financing Facilities, due 2012 and 2014 n/a — 1,450Senior Secured Pacific Facilities:
Pacific Routes Term Facility, due 2016 4.25% variable (1) 248 247Pacific Routes Revolving Facility, due 2013 undrawn variable (1) — —
Senior Secured Notes, due 2014 9.50% fixed 600 675Senior Second Lien Notes, due 2015 12.25% fixed 306 397Bank Revolving Credit Facilities, due 2012 undrawn variable (1) — —Other Secured Financing Arrangements:
Certificates, due in installments from 2012 to 2023 0.92% to 9.75% 4,677 5,310Aircraft financings, due in installments from 2012 to 2025 (2) 0.86% to 6.76% 4,570 5,170Other secured financings, due in installments from 2012 to 2031 (3) 2.25% to 6.12% 721 810
Total secured debt 12,490 14,059American Express - Advance Purchase of SkyMiles (4) 952 1,000Other unsecured debt, due in installments from 2012 to 2035 3.00% to 9.07% 355 383Total unsecured debt 1,307 1,383Total secured and unsecured debt 13,797 15,442Unamortized discount, net (737) (935)Total debt 13,060 14,507Less: current maturities (1,827) (1,954)Total long-term debt $ 11,233 $ 12,553
(1) Interest rate equal to LIBOR (subject to a floor) or another index rate, in each case plus a specified margin.(2) Secured by an aggregate of 269 aircraft.(3) Primarily includes manufacturer term loans secured by spare parts, spare engines and aircraft, and real estate loans.(4) For additional information about our debt associated with American Express, see Note 6.
Senior Secured Credit Facilities
In 2011, we entered into senior secured first-lien credit facilities (the “Senior Secured Credit Facilities”) to borrow up to $2.6 billion.The Senior Secured Credit Facilities consist of a $1.4 billion first-lien term loan facility (the “Term Loan Facility”) and a $1.2 billionfirst-lien revolving credit facility, up to $500 million of which may be used for the issuance of letters of credit (the “Revolving CreditFacility”).
Borrowings under the Term Loan Facility must be repaid annually in an amount equal to 1% of the original principal amount (to bepaid in equal quarterly installments), with the balance due in April 2017. Borrowings under the Revolving Credit Facility are due inApril 2016. At December 31, 2011, the Revolving Credit Facility was undrawn.
Our obligations under the Senior Secured Credit Facilities are guaranteed by substantially all of our domestic subsidiaries (the“Guarantors”). The Senior Secured Credit Facilities and the related guarantees are secured by liens on certain of our and the Guarantors'assets, including accounts receivable, inventory, flight equipment, ground property and equipment, certain non-Pacific internationalroutes, domestic slots, real estate and certain investments (the “Collateral”).
Copyright © 2013 www.secdatabase.com. All Rights Reserved.Please Consider the Environment Before Printing This Document

67
Copyright © 2013 www.secdatabase.com. All Rights Reserved.Please Consider the Environment Before Printing This Document
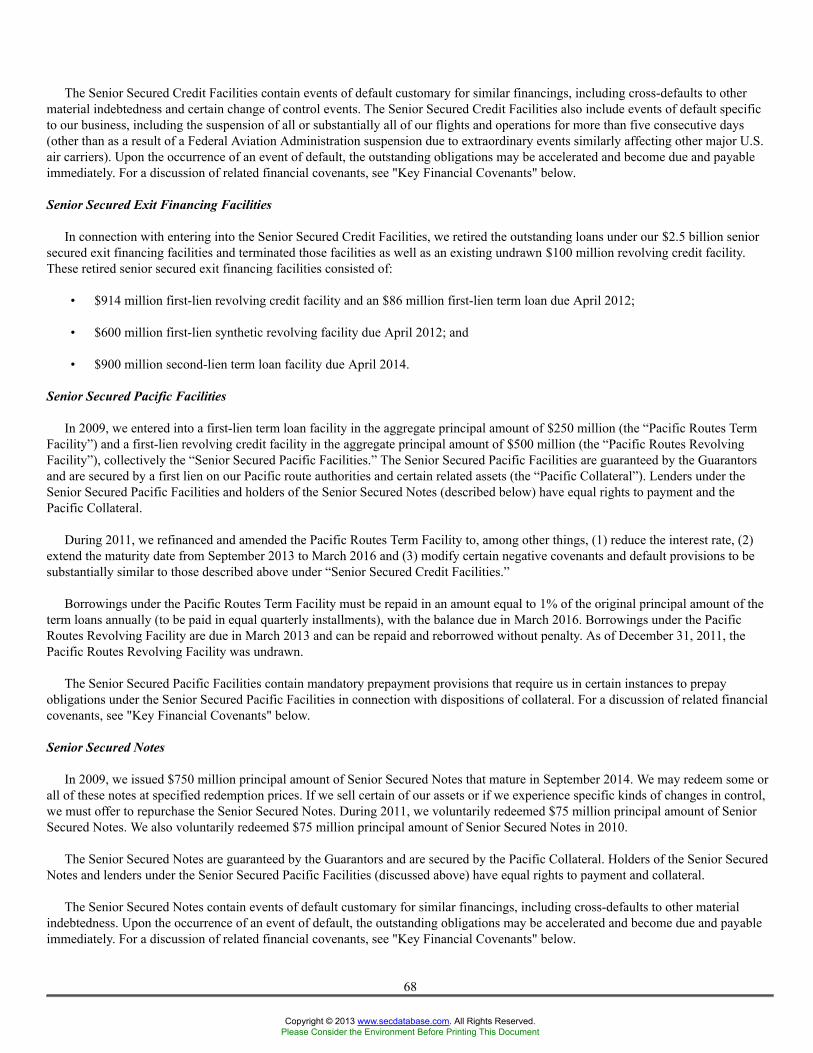
The Senior Secured Credit Facilities contain events of default customary for similar financings, including cross-defaults to othermaterial indebtedness and certain change of control events. The Senior Secured Credit Facilities also include events of default specificto our business, including the suspension of all or substantially all of our flights and operations for more than five consecutive days(other than as a result of a Federal Aviation Administration suspension due to extraordinary events similarly affecting other major U.S.air carriers). Upon the occurrence of an event of default, the outstanding obligations may be accelerated and become due and payableimmediately. For a discussion of related financial covenants, see "Key Financial Covenants" below.
Senior Secured Exit Financing Facilities
In connection with entering into the Senior Secured Credit Facilities, we retired the outstanding loans under our $2.5 billion seniorsecured exit financing facilities and terminated those facilities as well as an existing undrawn $100 million revolving credit facility.These retired senior secured exit financing facilities consisted of:
• $914 million first-lien revolving credit facility and an $86 million first-lien term loan due April 2012;
• $600 million first-lien synthetic revolving facility due April 2012; and
• $900 million second-lien term loan facility due April 2014.
Senior Secured Pacific Facilities
In 2009, we entered into a first-lien term loan facility in the aggregate principal amount of $250 million (the “Pacific Routes TermFacility”) and a first-lien revolving credit facility in the aggregate principal amount of $500 million (the “Pacific Routes RevolvingFacility”), collectively the “Senior Secured Pacific Facilities.” The Senior Secured Pacific Facilities are guaranteed by the Guarantorsand are secured by a first lien on our Pacific route authorities and certain related assets (the “Pacific Collateral”). Lenders under theSenior Secured Pacific Facilities and holders of the Senior Secured Notes (described below) have equal rights to payment and thePacific Collateral.
During 2011, we refinanced and amended the Pacific Routes Term Facility to, among other things, (1) reduce the interest rate, (2)extend the maturity date from September 2013 to March 2016 and (3) modify certain negative covenants and default provisions to besubstantially similar to those described above under “Senior Secured Credit Facilities.”
Borrowings under the Pacific Routes Term Facility must be repaid in an amount equal to 1% of the original principal amount of theterm loans annually (to be paid in equal quarterly installments), with the balance due in March 2016. Borrowings under the PacificRoutes Revolving Facility are due in March 2013 and can be repaid and reborrowed without penalty. As of December 31, 2011, thePacific Routes Revolving Facility was undrawn.
The Senior Secured Pacific Facilities contain mandatory prepayment provisions that require us in certain instances to prepayobligations under the Senior Secured Pacific Facilities in connection with dispositions of collateral. For a discussion of related financialcovenants, see "Key Financial Covenants" below.
Senior Secured Notes
In 2009, we issued $750 million principal amount of Senior Secured Notes that mature in September 2014. We may redeem some orall of these notes at specified redemption prices. If we sell certain of our assets or if we experience specific kinds of changes in control,we must offer to repurchase the Senior Secured Notes. During 2011, we voluntarily redeemed $75 million principal amount of SeniorSecured Notes. We also voluntarily redeemed $75 million principal amount of Senior Secured Notes in 2010.
The Senior Secured Notes are guaranteed by the Guarantors and are secured by the Pacific Collateral. Holders of the Senior SecuredNotes and lenders under the Senior Secured Pacific Facilities (discussed above) have equal rights to payment and collateral.
The Senior Secured Notes contain events of default customary for similar financings, including cross-defaults to other materialindebtedness. Upon the occurrence of an event of default, the outstanding obligations may be accelerated and become due and payableimmediately. For a discussion of related financial covenants, see "Key Financial Covenants" below.
68
Copyright © 2013 www.secdatabase.com. All Rights Reserved.Please Consider the Environment Before Printing This Document
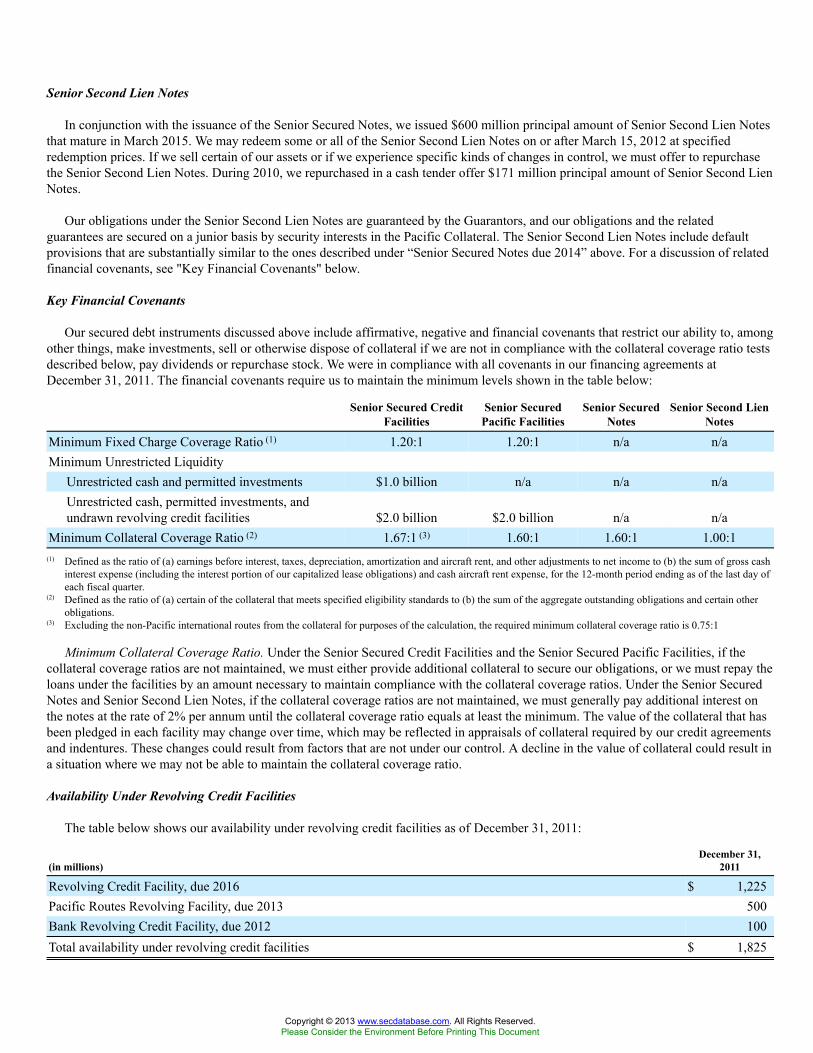
Senior Second Lien Notes
In conjunction with the issuance of the Senior Secured Notes, we issued $600 million principal amount of Senior Second Lien Notesthat mature in March 2015. We may redeem some or all of the Senior Second Lien Notes on or after March 15, 2012 at specifiedredemption prices. If we sell certain of our assets or if we experience specific kinds of changes in control, we must offer to repurchasethe Senior Second Lien Notes. During 2010, we repurchased in a cash tender offer $171 million principal amount of Senior Second LienNotes.
Our obligations under the Senior Second Lien Notes are guaranteed by the Guarantors, and our obligations and the relatedguarantees are secured on a junior basis by security interests in the Pacific Collateral. The Senior Second Lien Notes include defaultprovisions that are substantially similar to the ones described under “Senior Secured Notes due 2014” above. For a discussion of relatedfinancial covenants, see "Key Financial Covenants" below.
Key Financial Covenants
Our secured debt instruments discussed above include affirmative, negative and financial covenants that restrict our ability to, amongother things, make investments, sell or otherwise dispose of collateral if we are not in compliance with the collateral coverage ratio testsdescribed below, pay dividends or repurchase stock. We were in compliance with all covenants in our financing agreements atDecember 31, 2011. The financial covenants require us to maintain the minimum levels shown in the table below:
Senior Secured CreditFacilities
Senior SecuredPacific Facilities
Senior SecuredNotes
Senior Second LienNotes
Minimum Fixed Charge Coverage Ratio (1) 1.20:1 1.20:1 n/a n/aMinimum Unrestricted Liquidity
Unrestricted cash and permitted investments $1.0 billion n/a n/a n/aUnrestricted cash, permitted investments, andundrawn revolving credit facilities $2.0 billion $2.0 billion n/a n/a
Minimum Collateral Coverage Ratio (2) 1.67:1 (3) 1.60:1 1.60:1 1.00:1(1) Defined as the ratio of (a) earnings before interest, taxes, depreciation, amortization and aircraft rent, and other adjustments to net income to (b) the sum of gross cash
interest expense (including the interest portion of our capitalized lease obligations) and cash aircraft rent expense, for the 12-month period ending as of the last day ofeach fiscal quarter.
(2) Defined as the ratio of (a) certain of the collateral that meets specified eligibility standards to (b) the sum of the aggregate outstanding obligations and certain otherobligations.
(3) Excluding the non-Pacific international routes from the collateral for purposes of the calculation, the required minimum collateral coverage ratio is 0.75:1
Minimum Collateral Coverage Ratio. Under the Senior Secured Credit Facilities and the Senior Secured Pacific Facilities, if thecollateral coverage ratios are not maintained, we must either provide additional collateral to secure our obligations, or we must repay theloans under the facilities by an amount necessary to maintain compliance with the collateral coverage ratios. Under the Senior SecuredNotes and Senior Second Lien Notes, if the collateral coverage ratios are not maintained, we must generally pay additional interest onthe notes at the rate of 2% per annum until the collateral coverage ratio equals at least the minimum. The value of the collateral that hasbeen pledged in each facility may change over time, which may be reflected in appraisals of collateral required by our credit agreementsand indentures. These changes could result from factors that are not under our control. A decline in the value of collateral could result ina situation where we may not be able to maintain the collateral coverage ratio.
Availability Under Revolving Credit Facilities
The table below shows our availability under revolving credit facilities as of December 31, 2011:
(in millions)December 31,
2011
Revolving Credit Facility, due 2016 $ 1,225Pacific Routes Revolving Facility, due 2013 500Bank Revolving Credit Facility, due 2012 100Total availability under revolving credit facilities $ 1,825
Copyright © 2013 www.secdatabase.com. All Rights Reserved.Please Consider the Environment Before Printing This Document

69
Copyright © 2013 www.secdatabase.com. All Rights Reserved.Please Consider the Environment Before Printing This Document
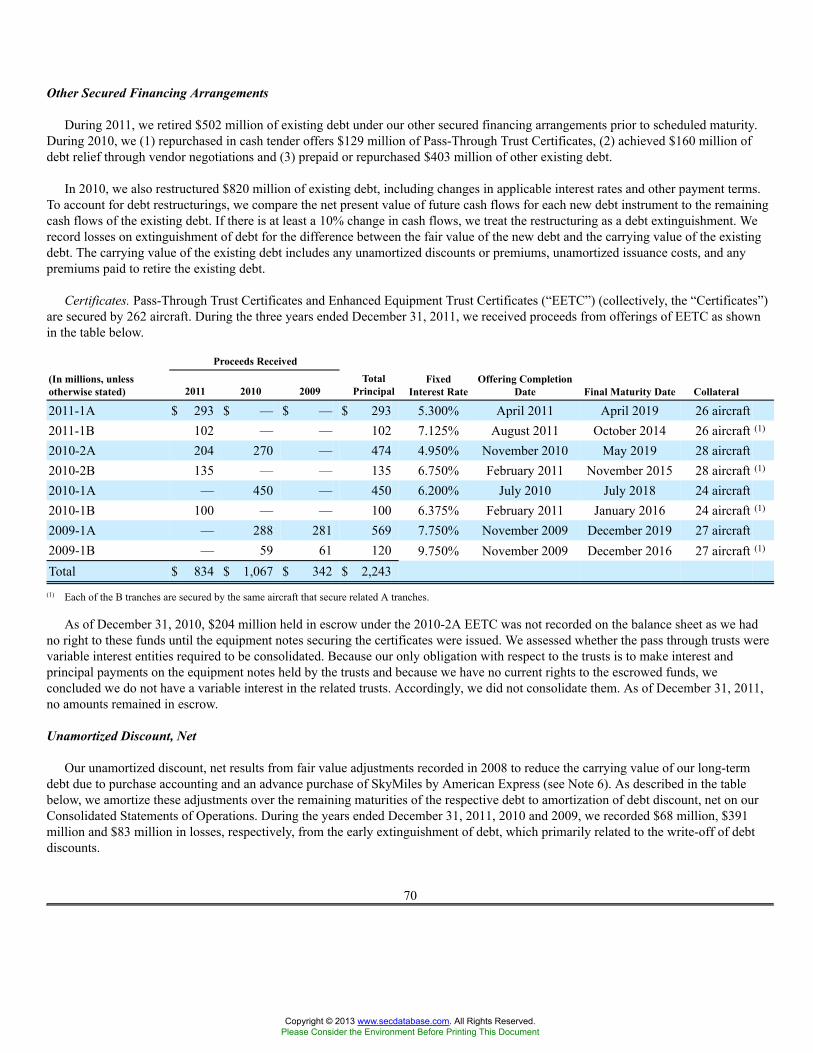
Other Secured Financing Arrangements
During 2011, we retired $502 million of existing debt under our other secured financing arrangements prior to scheduled maturity.During 2010, we (1) repurchased in cash tender offers $129 million of Pass-Through Trust Certificates, (2) achieved $160 million ofdebt relief through vendor negotiations and (3) prepaid or repurchased $403 million of other existing debt.
In 2010, we also restructured $820 million of existing debt, including changes in applicable interest rates and other payment terms.To account for debt restructurings, we compare the net present value of future cash flows for each new debt instrument to the remainingcash flows of the existing debt. If there is at least a 10% change in cash flows, we treat the restructuring as a debt extinguishment. Werecord losses on extinguishment of debt for the difference between the fair value of the new debt and the carrying value of the existingdebt. The carrying value of the existing debt includes any unamortized discounts or premiums, unamortized issuance costs, and anypremiums paid to retire the existing debt.
Certificates. Pass-Through Trust Certificates and Enhanced Equipment Trust Certificates (“EETC”) (collectively, the “Certificates”)are secured by 262 aircraft. During the three years ended December 31, 2011, we received proceeds from offerings of EETC as shownin the table below.
Proceeds Received
(In millions, unlessotherwise stated) 2011 2010 2009
TotalPrincipal
FixedInterest Rate
Offering CompletionDate Final Maturity Date Collateral
2011-1A $ 293 $ — $ — $ 293 5.300% April 2011 April 2019 26 aircraft2011-1B 102 — — 102 7.125% August 2011 October 2014 26 aircraft (1)
2010-2A 204 270 — 474 4.950% November 2010 May 2019 28 aircraft2010-2B 135 — — 135 6.750% February 2011 November 2015 28 aircraft (1)
2010-1A — 450 — 450 6.200% July 2010 July 2018 24 aircraft2010-1B 100 — — 100 6.375% February 2011 January 2016 24 aircraft (1)
2009-1A — 288 281 569 7.750% November 2009 December 2019 27 aircraft2009-1B — 59 61 120 9.750% November 2009 December 2016 27 aircraft (1)
Total $ 834 $ 1,067 $ 342 $ 2,243(1) Each of the B tranches are secured by the same aircraft that secure related A tranches.
As of December 31, 2010, $204 million held in escrow under the 2010-2A EETC was not recorded on the balance sheet as we hadno right to these funds until the equipment notes securing the certificates were issued. We assessed whether the pass through trusts werevariable interest entities required to be consolidated. Because our only obligation with respect to the trusts is to make interest andprincipal payments on the equipment notes held by the trusts and because we have no current rights to the escrowed funds, weconcluded we do not have a variable interest in the related trusts. Accordingly, we did not consolidate them. As of December 31, 2011,no amounts remained in escrow.
Unamortized Discount, Net
Our unamortized discount, net results from fair value adjustments recorded in 2008 to reduce the carrying value of our long-termdebt due to purchase accounting and an advance purchase of SkyMiles by American Express (see Note 6). As described in the tablebelow, we amortize these adjustments over the remaining maturities of the respective debt to amortization of debt discount, net on ourConsolidated Statements of Operations. During the years ended December 31, 2011, 2010 and 2009, we recorded $68 million, $391million and $83 million in losses, respectively, from the early extinguishment of debt, which primarily related to the write-off of debtdiscounts.
70
Copyright © 2013 www.secdatabase.com. All Rights Reserved.Please Consider the Environment Before Printing This Document
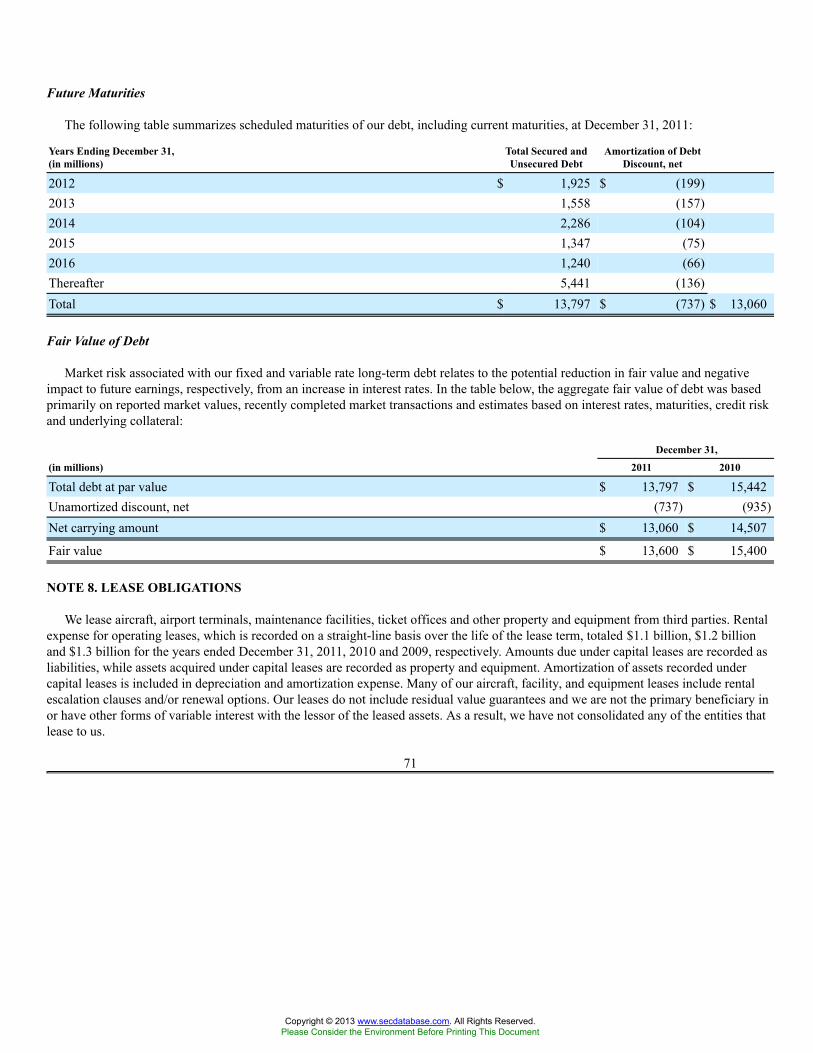
Future Maturities
The following table summarizes scheduled maturities of our debt, including current maturities, at December 31, 2011:
Years Ending December 31,(in millions)
Total Secured andUnsecured Debt
Amortization of DebtDiscount, net
2012 $ 1,925 $ (199)2013 1,558 (157)2014 2,286 (104)2015 1,347 (75)2016 1,240 (66)Thereafter 5,441 (136)Total $ 13,797 $ (737) $ 13,060
Fair Value of Debt
Market risk associated with our fixed and variable rate long-term debt relates to the potential reduction in fair value and negativeimpact to future earnings, respectively, from an increase in interest rates. In the table below, the aggregate fair value of debt was basedprimarily on reported market values, recently completed market transactions and estimates based on interest rates, maturities, credit riskand underlying collateral:
December 31,
(in millions) 2011 2010
Total debt at par value $ 13,797 $ 15,442Unamortized discount, net (737) (935)Net carrying amount $ 13,060 $ 14,507
Fair value $ 13,600 $ 15,400
NOTE 8. LEASE OBLIGATIONS
We lease aircraft, airport terminals, maintenance facilities, ticket offices and other property and equipment from third parties. Rentalexpense for operating leases, which is recorded on a straight-line basis over the life of the lease term, totaled $1.1 billion, $1.2 billionand $1.3 billion for the years ended December 31, 2011, 2010 and 2009, respectively. Amounts due under capital leases are recorded asliabilities, while assets acquired under capital leases are recorded as property and equipment. Amortization of assets recorded undercapital leases is included in depreciation and amortization expense. Many of our aircraft, facility, and equipment leases include rentalescalation clauses and/or renewal options. Our leases do not include residual value guarantees and we are not the primary beneficiary inor have other forms of variable interest with the lessor of the leased assets. As a result, we have not consolidated any of the entities thatlease to us.
71
Copyright © 2013 www.secdatabase.com. All Rights Reserved.Please Consider the Environment Before Printing This Document
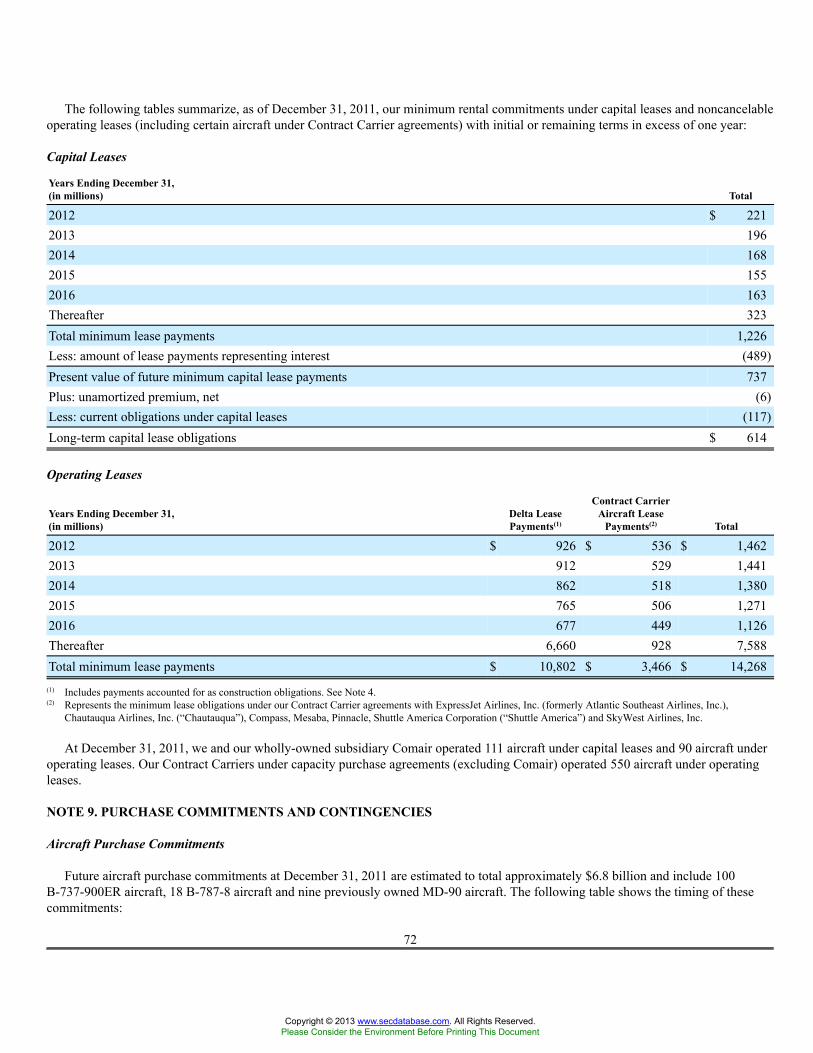
The following tables summarize, as of December 31, 2011, our minimum rental commitments under capital leases and noncancelableoperating leases (including certain aircraft under Contract Carrier agreements) with initial or remaining terms in excess of one year:
Capital Leases
Years Ending December 31,(in millions) Total
2012 $ 2212013 1962014 1682015 1552016 163Thereafter 323Total minimum lease payments 1,226Less: amount of lease payments representing interest (489)Present value of future minimum capital lease payments 737Plus: unamortized premium, net (6)Less: current obligations under capital leases (117)Long-term capital lease obligations $ 614
Operating Leases
Years Ending December 31,(in millions)
Delta LeasePayments(1)
Contract CarrierAircraft Lease
Payments(2) Total
2012 $ 926 $ 536 $ 1,4622013 912 529 1,4412014 862 518 1,3802015 765 506 1,2712016 677 449 1,126Thereafter 6,660 928 7,588Total minimum lease payments $ 10,802 $ 3,466 $ 14,268
(1) Includes payments accounted for as construction obligations. See Note 4.(2) Represents the minimum lease obligations under our Contract Carrier agreements with ExpressJet Airlines, Inc. (formerly Atlantic Southeast Airlines, Inc.),
Chautauqua Airlines, Inc. (“Chautauqua”), Compass, Mesaba, Pinnacle, Shuttle America Corporation (“Shuttle America”) and SkyWest Airlines, Inc.
At December 31, 2011, we and our wholly-owned subsidiary Comair operated 111 aircraft under capital leases and 90 aircraft underoperating leases. Our Contract Carriers under capacity purchase agreements (excluding Comair) operated 550 aircraft under operatingleases.
NOTE 9. PURCHASE COMMITMENTS AND CONTINGENCIES
Aircraft Purchase Commitments
Future aircraft purchase commitments at December 31, 2011 are estimated to total approximately $6.8 billion and include 100B-737-900ER aircraft, 18 B-787-8 aircraft and nine previously owned MD-90 aircraft. The following table shows the timing of thesecommitments:
72
Copyright © 2013 www.secdatabase.com. All Rights Reserved.Please Consider the Environment Before Printing This Document
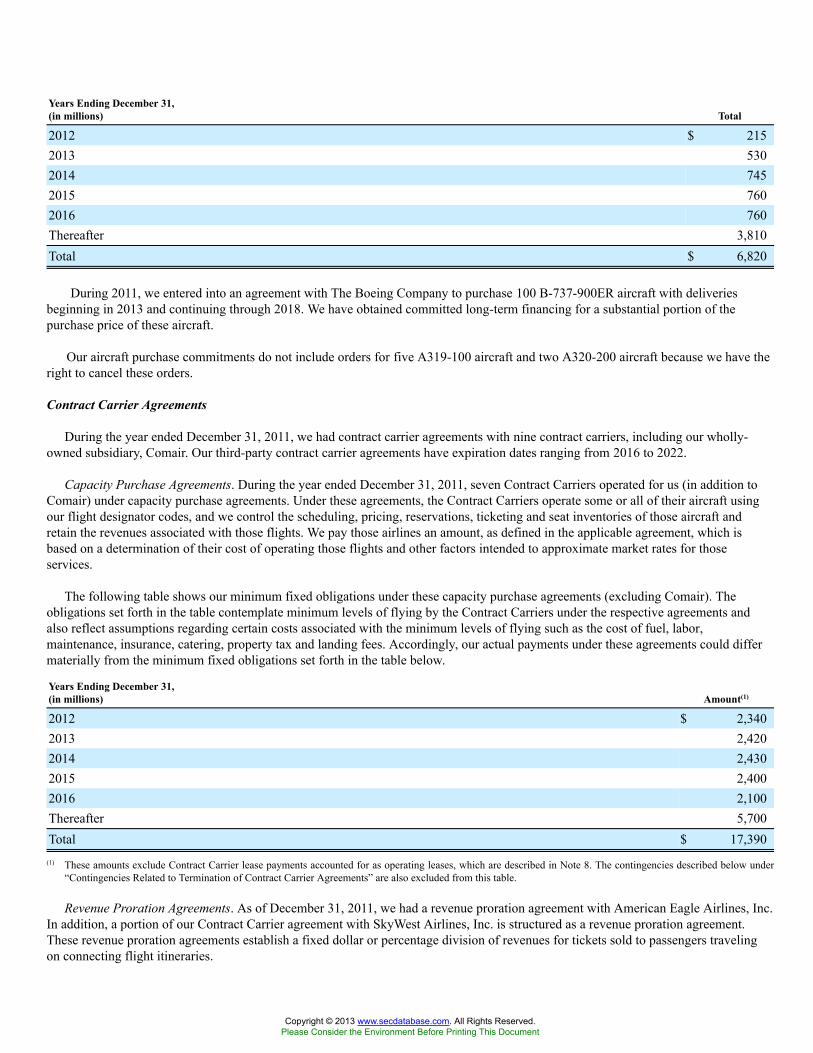
Years Ending December 31,(in millions) Total
2012 $ 2152013 5302014 7452015 7602016 760Thereafter 3,810Total $ 6,820
During 2011, we entered into an agreement with The Boeing Company to purchase 100 B-737-900ER aircraft with deliveriesbeginning in 2013 and continuing through 2018. We have obtained committed long-term financing for a substantial portion of thepurchase price of these aircraft.
Our aircraft purchase commitments do not include orders for five A319-100 aircraft and two A320-200 aircraft because we have theright to cancel these orders.
Contract Carrier Agreements
During the year ended December 31, 2011, we had contract carrier agreements with nine contract carriers, including our wholly-owned subsidiary, Comair. Our third-party contract carrier agreements have expiration dates ranging from 2016 to 2022.
Capacity Purchase Agreements. During the year ended December 31, 2011, seven Contract Carriers operated for us (in addition toComair) under capacity purchase agreements. Under these agreements, the Contract Carriers operate some or all of their aircraft usingour flight designator codes, and we control the scheduling, pricing, reservations, ticketing and seat inventories of those aircraft andretain the revenues associated with those flights. We pay those airlines an amount, as defined in the applicable agreement, which isbased on a determination of their cost of operating those flights and other factors intended to approximate market rates for thoseservices.
The following table shows our minimum fixed obligations under these capacity purchase agreements (excluding Comair). Theobligations set forth in the table contemplate minimum levels of flying by the Contract Carriers under the respective agreements andalso reflect assumptions regarding certain costs associated with the minimum levels of flying such as the cost of fuel, labor,maintenance, insurance, catering, property tax and landing fees. Accordingly, our actual payments under these agreements could differmaterially from the minimum fixed obligations set forth in the table below.
Years Ending December 31,(in millions) Amount(1)
2012 $ 2,3402013 2,4202014 2,4302015 2,4002016 2,100Thereafter 5,700Total $ 17,390
(1) These amounts exclude Contract Carrier lease payments accounted for as operating leases, which are described in Note 8. The contingencies described below under“Contingencies Related to Termination of Contract Carrier Agreements” are also excluded from this table.
Revenue Proration Agreements. As of December 31, 2011, we had a revenue proration agreement with American Eagle Airlines, Inc.In addition, a portion of our Contract Carrier agreement with SkyWest Airlines, Inc. is structured as a revenue proration agreement.These revenue proration agreements establish a fixed dollar or percentage division of revenues for tickets sold to passengers travelingon connecting flight itineraries.
Copyright © 2013 www.secdatabase.com. All Rights Reserved.Please Consider the Environment Before Printing This Document

73
Copyright © 2013 www.secdatabase.com. All Rights Reserved.Please Consider the Environment Before Printing This Document
Contingencies Related to Termination of Contract Carrier Agreements
We may terminate without cause the Chautauqua agreement at any time and the Shuttle America agreement at any time after January2016 by providing certain advance notice. If we terminate either the Chautauqua or Shuttle America agreements without cause,Chautauqua or Shuttle America, respectively, has the right to (1) assign to us leased aircraft that the airline operates for us, provided weare able to continue the leases on the same terms the airline had prior to the assignment and (2) require us to purchase or lease anyaircraft the airline owns and operates for us at the time of the termination. If we are required to purchase aircraft owned by Chautauquaor Shuttle America, the purchase price would be equal to the amount necessary to (1) reimburse Chautauqua or Shuttle America for theequity it provided to purchase the aircraft and (2) repay in full any debt outstanding at such time that is not being assumed in connectionwith such purchase. If we are required to lease aircraft owned by Chautauqua or Shuttle America, the lease would have (1) a rate equalto the debt payments of Chautauqua or Shuttle America for the debt financing of the aircraft calculated as if 90% of the aircraft was debtfinanced by Chautauqua or Shuttle America and (2) other specified terms and conditions. Because these contingencies depend on ourtermination of the agreements without cause prior to their expiration dates, no obligation exists unless such termination occurs.
We estimate that the total fair values, determined as of December 31, 2011, of the aircraft Chautauqua or Shuttle America couldassign to us or require that we purchase if we terminate without cause our contract carrier agreements with those airlines (the "PutRight") are approximately $134 million and $536 million, respectively. The actual amount we may be required to pay in thesecircumstances may be materially different from these estimates. If the Put Right is exercised, we must also pay the exercising carrier10% interest (compounded monthly) on the equity the carrier provided when it purchased the put aircraft. These equity amounts forChautauqua and Shuttle America total $25 million and $52 million, respectively.
Legal Contingencies
We are involved in various legal proceedings related to employment practices, environmental issues, antitrust matters and othermatters concerning our business. We record liabilities for losses from legal proceedings when we determine that it is probable that theoutcome in a legal proceeding will be unfavorable and the amount of loss can be reasonably estimated. We cannot reasonably estimatethe potential loss for certain legal proceedings because, for example, the litigation is in its early stages or the plaintiff does not specifythe damages being sought. Although the outcome of the legal proceedings in which we are involved cannot be predicted with certainty,management believes that the resolution of these matters will not have a material adverse effect on our Consolidated FinancialStatements.
Credit Card Processing Agreements
Our VISA/MasterCard and American Express credit card processing agreements provide that no cash reserve ("Reserve") isrequired, and no withholding of payment related to receivables collected will occur, except in certain circumstances, including when wedo not maintain a required level of unrestricted cash. In circumstances in which the credit card processor can establish a Reserve orwithhold payments, the amount of the Reserve or payments that may be withheld would be equal to the potential liability of the creditcard processor for tickets purchased with VISA/MasterCard or American Express credit cards, as applicable, that had not yet been usedfor travel. There was no Reserve or amounts withheld as of December 31, 2011 and 2010.
Other Contingencies
General Indemnifications
We are the lessee under many commercial real estate leases. It is common in these transactions for us, as the lessee, to agree toindemnify the lessor and the lessor's related parties for tort, environmental and other liabilities that arise out of or relate to our use oroccupancy of the leased premises. This type of indemnity would typically make us responsible to indemnified parties for liabilitiesarising out of the conduct of, among others, contractors, licensees and invitees at, or in connection with, the use or occupancy of theleased premises. This indemnity often extends to related liabilities arising from the negligence of the indemnified parties, but usuallyexcludes any liabilities caused by either their sole or gross negligence or their willful misconduct.
Our aircraft and other equipment lease and financing agreements typically contain provisions requiring us, as the lessee or obligor, toindemnify the other parties to those agreements, including certain of those parties' related persons, against virtually any liabilities thatmight arise from the use or operation of the aircraft or such other equipment.
74
Copyright © 2013 www.secdatabase.com. All Rights Reserved.Please Consider the Environment Before Printing This Document
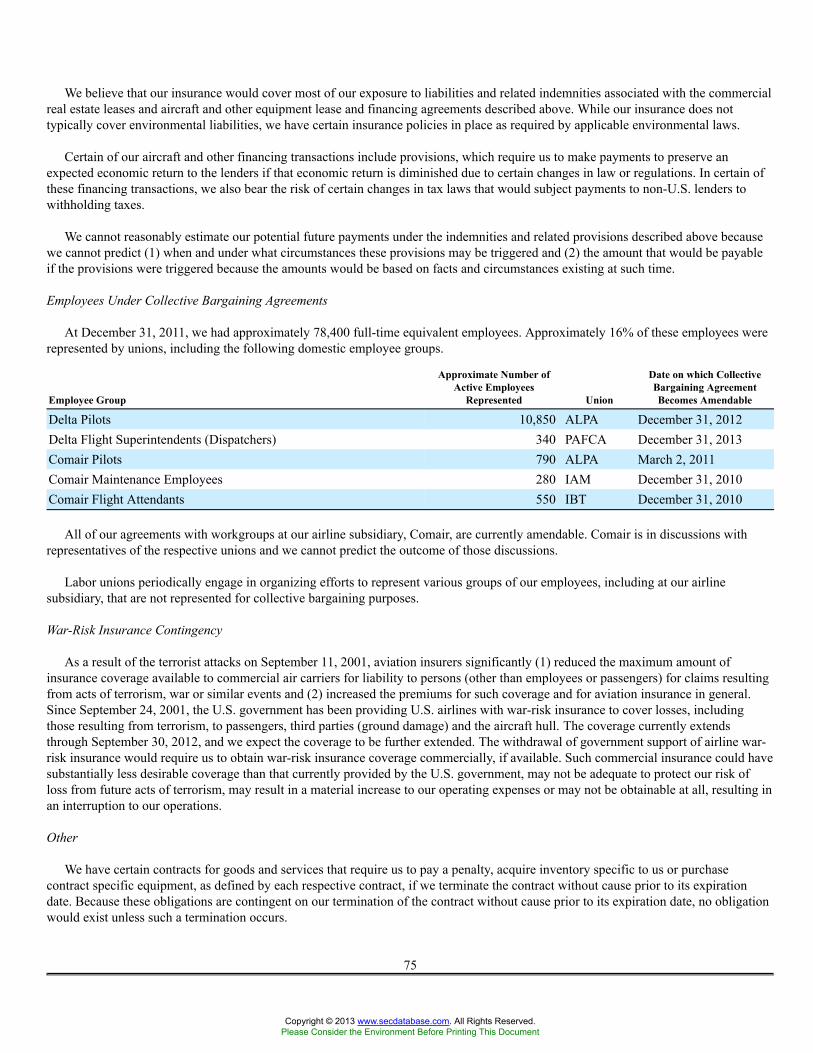
We believe that our insurance would cover most of our exposure to liabilities and related indemnities associated with the commercialreal estate leases and aircraft and other equipment lease and financing agreements described above. While our insurance does nottypically cover environmental liabilities, we have certain insurance policies in place as required by applicable environmental laws.
Certain of our aircraft and other financing transactions include provisions, which require us to make payments to preserve anexpected economic return to the lenders if that economic return is diminished due to certain changes in law or regulations. In certain ofthese financing transactions, we also bear the risk of certain changes in tax laws that would subject payments to non-U.S. lenders towithholding taxes.
We cannot reasonably estimate our potential future payments under the indemnities and related provisions described above becausewe cannot predict (1) when and under what circumstances these provisions may be triggered and (2) the amount that would be payableif the provisions were triggered because the amounts would be based on facts and circumstances existing at such time.
Employees Under Collective Bargaining Agreements
At December 31, 2011, we had approximately 78,400 full-time equivalent employees. Approximately 16% of these employees wererepresented by unions, including the following domestic employee groups.
Employee Group
Approximate Number ofActive Employees
Represented Union
Date on which CollectiveBargaining AgreementBecomes Amendable
Delta Pilots 10,850 ALPA December 31, 2012Delta Flight Superintendents (Dispatchers) 340 PAFCA December 31, 2013Comair Pilots 790 ALPA March 2, 2011Comair Maintenance Employees 280 IAM December 31, 2010Comair Flight Attendants 550 IBT December 31, 2010
All of our agreements with workgroups at our airline subsidiary, Comair, are currently amendable. Comair is in discussions withrepresentatives of the respective unions and we cannot predict the outcome of those discussions.
Labor unions periodically engage in organizing efforts to represent various groups of our employees, including at our airlinesubsidiary, that are not represented for collective bargaining purposes.
War-Risk Insurance Contingency
As a result of the terrorist attacks on September 11, 2001, aviation insurers significantly (1) reduced the maximum amount ofinsurance coverage available to commercial air carriers for liability to persons (other than employees or passengers) for claims resultingfrom acts of terrorism, war or similar events and (2) increased the premiums for such coverage and for aviation insurance in general.Since September 24, 2001, the U.S. government has been providing U.S. airlines with war-risk insurance to cover losses, includingthose resulting from terrorism, to passengers, third parties (ground damage) and the aircraft hull. The coverage currently extendsthrough September 30, 2012, and we expect the coverage to be further extended. The withdrawal of government support of airline war-risk insurance would require us to obtain war-risk insurance coverage commercially, if available. Such commercial insurance could havesubstantially less desirable coverage than that currently provided by the U.S. government, may not be adequate to protect our risk ofloss from future acts of terrorism, may result in a material increase to our operating expenses or may not be obtainable at all, resulting inan interruption to our operations.
Other
We have certain contracts for goods and services that require us to pay a penalty, acquire inventory specific to us or purchasecontract specific equipment, as defined by each respective contract, if we terminate the contract without cause prior to its expirationdate. Because these obligations are contingent on our termination of the contract without cause prior to its expiration date, no obligationwould exist unless such a termination occurs.
75
Copyright © 2013 www.secdatabase.com. All Rights Reserved.Please Consider the Environment Before Printing This Document
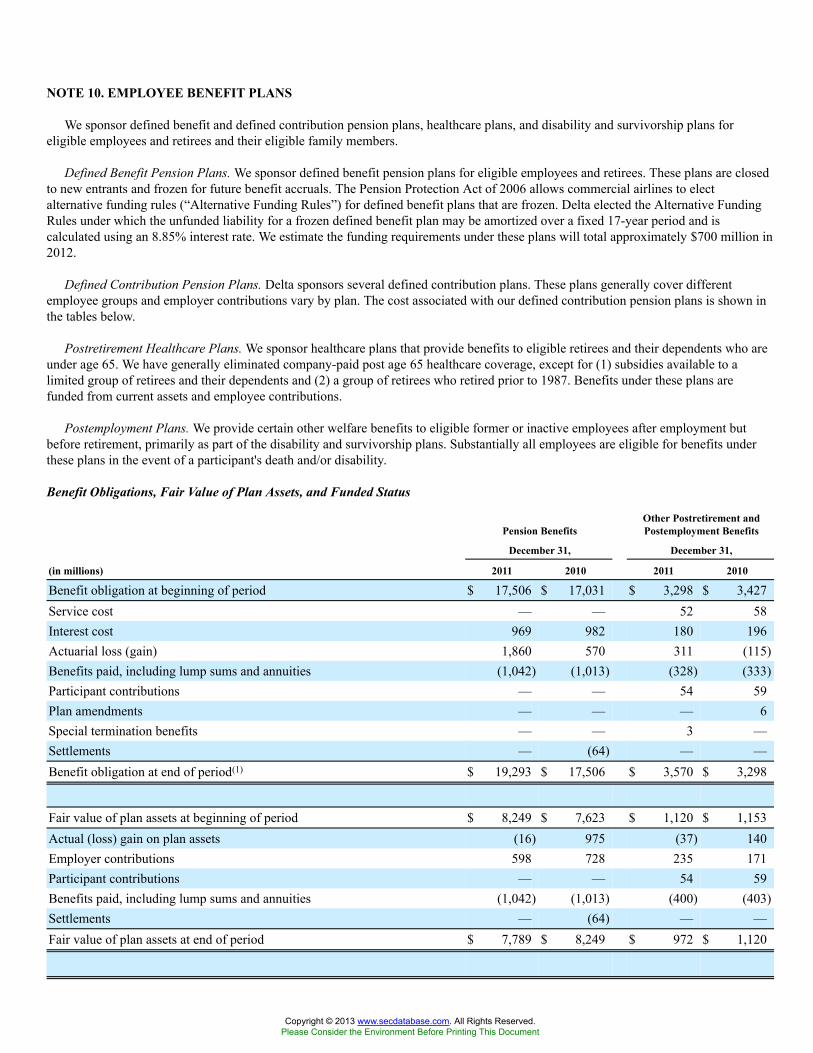
NOTE 10. EMPLOYEE BENEFIT PLANS
We sponsor defined benefit and defined contribution pension plans, healthcare plans, and disability and survivorship plans foreligible employees and retirees and their eligible family members.
Defined Benefit Pension Plans. We sponsor defined benefit pension plans for eligible employees and retirees. These plans are closedto new entrants and frozen for future benefit accruals. The Pension Protection Act of 2006 allows commercial airlines to electalternative funding rules (“Alternative Funding Rules”) for defined benefit plans that are frozen. Delta elected the Alternative FundingRules under which the unfunded liability for a frozen defined benefit plan may be amortized over a fixed 17-year period and iscalculated using an 8.85% interest rate. We estimate the funding requirements under these plans will total approximately $700 million in2012.
Defined Contribution Pension Plans. Delta sponsors several defined contribution plans. These plans generally cover differentemployee groups and employer contributions vary by plan. The cost associated with our defined contribution pension plans is shown inthe tables below.
Postretirement Healthcare Plans. We sponsor healthcare plans that provide benefits to eligible retirees and their dependents who areunder age 65. We have generally eliminated company-paid post age 65 healthcare coverage, except for (1) subsidies available to alimited group of retirees and their dependents and (2) a group of retirees who retired prior to 1987. Benefits under these plans arefunded from current assets and employee contributions.
Postemployment Plans. We provide certain other welfare benefits to eligible former or inactive employees after employment butbefore retirement, primarily as part of the disability and survivorship plans. Substantially all employees are eligible for benefits underthese plans in the event of a participant's death and/or disability.
Benefit Obligations, Fair Value of Plan Assets, and Funded Status
Pension BenefitsOther Postretirement andPostemployment Benefits
December 31, December 31,
(in millions) 2011 2010 2011 2010
Benefit obligation at beginning of period $ 17,506 $ 17,031 $ 3,298 $ 3,427Service cost — — 52 58Interest cost 969 982 180 196Actuarial loss (gain) 1,860 570 311 (115)Benefits paid, including lump sums and annuities (1,042) (1,013) (328) (333)Participant contributions — — 54 59Plan amendments — — — 6Special termination benefits — — 3 —Settlements — (64) — —Benefit obligation at end of period(1) $ 19,293 $ 17,506 $ 3,570 $ 3,298
Fair value of plan assets at beginning of period $ 8,249 $ 7,623 $ 1,120 $ 1,153Actual (loss) gain on plan assets (16) 975 (37) 140Employer contributions 598 728 235 171Participant contributions — — 54 59Benefits paid, including lump sums and annuities (1,042) (1,013) (400) (403)Settlements — (64) — —Fair value of plan assets at end of period $ 7,789 $ 8,249 $ 972 $ 1,120
Copyright © 2013 www.secdatabase.com. All Rights Reserved.Please Consider the Environment Before Printing This Document

Funded status at end of period $ (11,504) $ (9,257) $ (2,598) $ (2,178)(1) At each period-end presented, our accumulated benefit obligations for our pension plans are equal to the benefit obligations shown above.
76
Copyright © 2013 www.secdatabase.com. All Rights Reserved.Please Consider the Environment Before Printing This Document
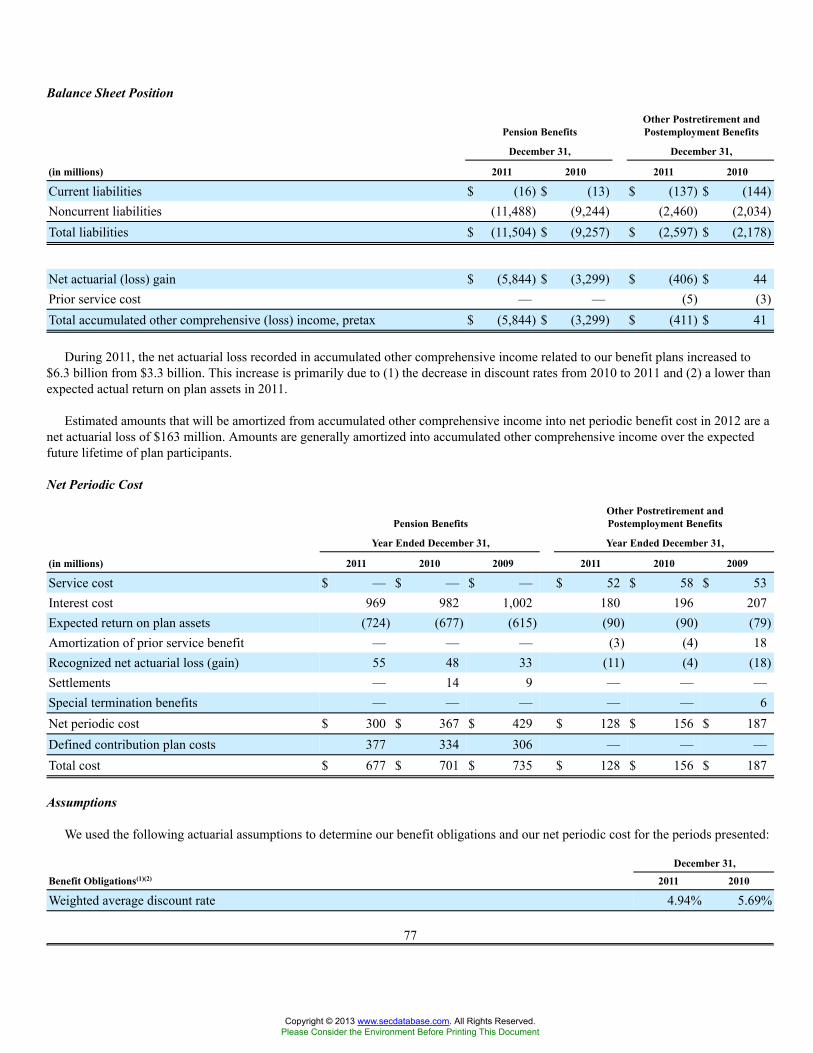
Balance Sheet Position
Pension BenefitsOther Postretirement andPostemployment Benefits
December 31, December 31,
(in millions) 2011 2010 2011 2010
Current liabilities $ (16) $ (13) $ (137) $ (144)Noncurrent liabilities (11,488) (9,244) (2,460) (2,034)Total liabilities $ (11,504) $ (9,257) $ (2,597) $ (2,178)
Net actuarial (loss) gain $ (5,844) $ (3,299) $ (406) $ 44Prior service cost — — (5) (3)Total accumulated other comprehensive (loss) income, pretax $ (5,844) $ (3,299) $ (411) $ 41
During 2011, the net actuarial loss recorded in accumulated other comprehensive income related to our benefit plans increased to$6.3 billion from $3.3 billion. This increase is primarily due to (1) the decrease in discount rates from 2010 to 2011 and (2) a lower thanexpected actual return on plan assets in 2011.
Estimated amounts that will be amortized from accumulated other comprehensive income into net periodic benefit cost in 2012 are anet actuarial loss of $163 million. Amounts are generally amortized into accumulated other comprehensive income over the expectedfuture lifetime of plan participants.
Net Periodic Cost
Pension BenefitsOther Postretirement andPostemployment Benefits
Year Ended December 31, Year Ended December 31,
(in millions) 2011 2010 2009 2011 2010 2009
Service cost $ — $ — $ — $ 52 $ 58 $ 53Interest cost 969 982 1,002 180 196 207Expected return on plan assets (724) (677) (615) (90) (90) (79)Amortization of prior service benefit — — — (3) (4) 18Recognized net actuarial loss (gain) 55 48 33 (11) (4) (18)Settlements — 14 9 — — —Special termination benefits — — — — — 6Net periodic cost $ 300 $ 367 $ 429 $ 128 $ 156 $ 187Defined contribution plan costs 377 334 306 — — —Total cost $ 677 $ 701 $ 735 $ 128 $ 156 $ 187
Assumptions
We used the following actuarial assumptions to determine our benefit obligations and our net periodic cost for the periods presented:
December 31,
Benefit Obligations(1)(2) 2011 2010
Weighted average discount rate 4.94% 5.69%
77
Copyright © 2013 www.secdatabase.com. All Rights Reserved.Please Consider the Environment Before Printing This Document
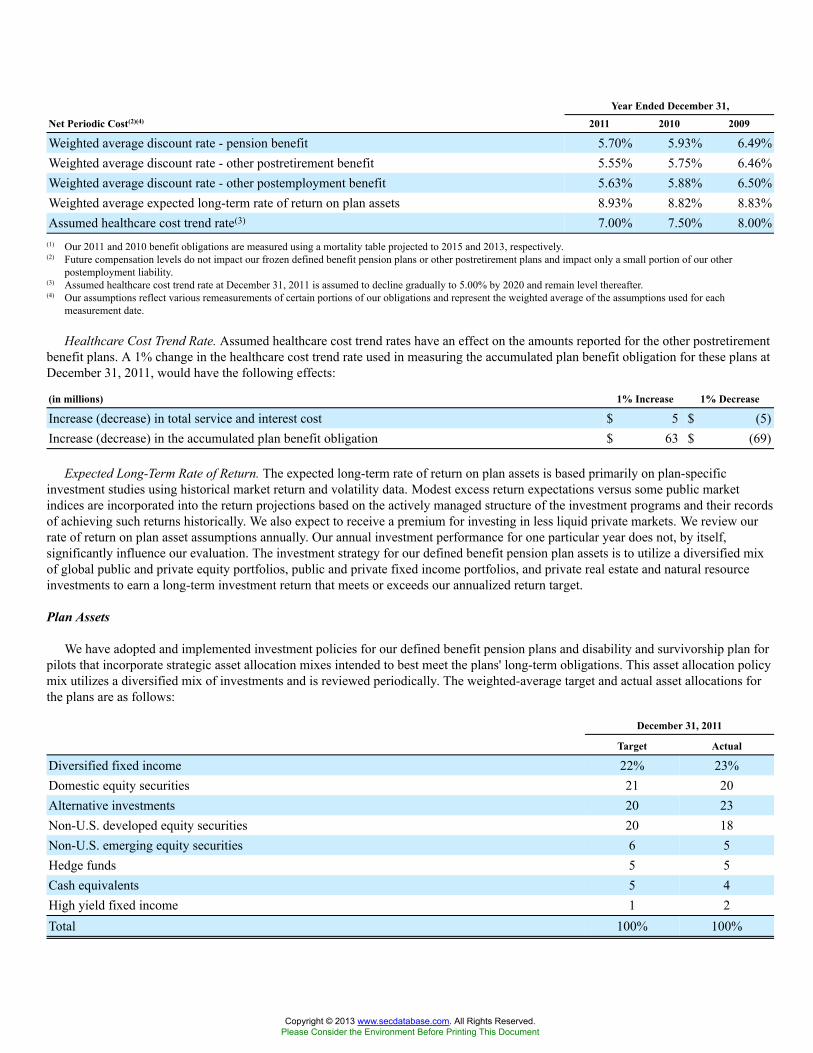
Year Ended December 31,
Net Periodic Cost(2)(4) 2011 2010 2009
Weighted average discount rate - pension benefit 5.70% 5.93% 6.49%Weighted average discount rate - other postretirement benefit 5.55% 5.75% 6.46%Weighted average discount rate - other postemployment benefit 5.63% 5.88% 6.50%Weighted average expected long-term rate of return on plan assets 8.93% 8.82% 8.83%Assumed healthcare cost trend rate(3) 7.00% 7.50% 8.00%
(1) Our 2011 and 2010 benefit obligations are measured using a mortality table projected to 2015 and 2013, respectively.(2) Future compensation levels do not impact our frozen defined benefit pension plans or other postretirement plans and impact only a small portion of our other
postemployment liability.(3) Assumed healthcare cost trend rate at December 31, 2011 is assumed to decline gradually to 5.00% by 2020 and remain level thereafter.(4) Our assumptions reflect various remeasurements of certain portions of our obligations and represent the weighted average of the assumptions used for each
measurement date.
Healthcare Cost Trend Rate. Assumed healthcare cost trend rates have an effect on the amounts reported for the other postretirementbenefit plans. A 1% change in the healthcare cost trend rate used in measuring the accumulated plan benefit obligation for these plans atDecember 31, 2011, would have the following effects:
(in millions) 1% Increase 1% Decrease
Increase (decrease) in total service and interest cost $ 5 $ (5)Increase (decrease) in the accumulated plan benefit obligation $ 63 $ (69)
Expected Long-Term Rate of Return. The expected long-term rate of return on plan assets is based primarily on plan-specificinvestment studies using historical market return and volatility data. Modest excess return expectations versus some public marketindices are incorporated into the return projections based on the actively managed structure of the investment programs and their recordsof achieving such returns historically. We also expect to receive a premium for investing in less liquid private markets. We review ourrate of return on plan asset assumptions annually. Our annual investment performance for one particular year does not, by itself,significantly influence our evaluation. The investment strategy for our defined benefit pension plan assets is to utilize a diversified mixof global public and private equity portfolios, public and private fixed income portfolios, and private real estate and natural resourceinvestments to earn a long-term investment return that meets or exceeds our annualized return target.
Plan Assets
We have adopted and implemented investment policies for our defined benefit pension plans and disability and survivorship plan forpilots that incorporate strategic asset allocation mixes intended to best meet the plans' long-term obligations. This asset allocation policymix utilizes a diversified mix of investments and is reviewed periodically. The weighted-average target and actual asset allocations forthe plans are as follows:
December 31, 2011
Target Actual
Diversified fixed income 22% 23%Domestic equity securities 21 20Alternative investments 20 23Non-U.S. developed equity securities 20 18Non-U.S. emerging equity securities 6 5Hedge funds 5 5Cash equivalents 5 4High yield fixed income 1 2Total 100% 100%
Copyright © 2013 www.secdatabase.com. All Rights Reserved.Please Consider the Environment Before Printing This Document

The overall asset mix of the portfolios is more heavily weighted in equity-like investments. Active management strategies areutilized where feasible in an effort to realize investment returns in excess of market indices. For additional information regarding thefair value of pension assets, see Note 2.
78
Copyright © 2013 www.secdatabase.com. All Rights Reserved.Please Consider the Environment Before Printing This Document
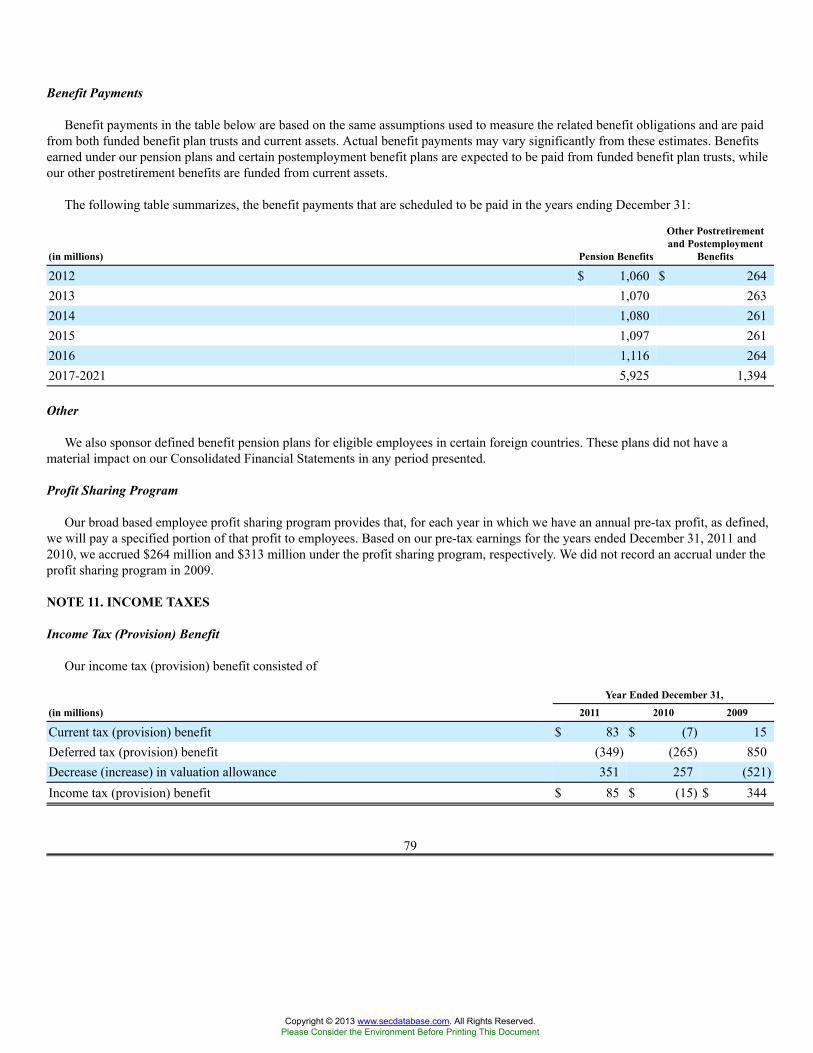
Benefit Payments
Benefit payments in the table below are based on the same assumptions used to measure the related benefit obligations and are paidfrom both funded benefit plan trusts and current assets. Actual benefit payments may vary significantly from these estimates. Benefitsearned under our pension plans and certain postemployment benefit plans are expected to be paid from funded benefit plan trusts, whileour other postretirement benefits are funded from current assets.
The following table summarizes, the benefit payments that are scheduled to be paid in the years ending December 31:
(in millions) Pension Benefits
Other Postretirementand Postemployment
Benefits
2012 $ 1,060 $ 2642013 1,070 2632014 1,080 2612015 1,097 2612016 1,116 2642017-2021 5,925 1,394
Other
We also sponsor defined benefit pension plans for eligible employees in certain foreign countries. These plans did not have amaterial impact on our Consolidated Financial Statements in any period presented.
Profit Sharing Program
Our broad based employee profit sharing program provides that, for each year in which we have an annual pre-tax profit, as defined,we will pay a specified portion of that profit to employees. Based on our pre-tax earnings for the years ended December 31, 2011 and2010, we accrued $264 million and $313 million under the profit sharing program, respectively. We did not record an accrual under theprofit sharing program in 2009.
NOTE 11. INCOME TAXES
Income Tax (Provision) Benefit
Our income tax (provision) benefit consisted of
Year Ended December 31,
(in millions) 2011 2010 2009
Current tax (provision) benefit $ 83 $ (7) 15Deferred tax (provision) benefit (349) (265) 850Decrease (increase) in valuation allowance 351 257 (521)Income tax (provision) benefit $ 85 $ (15) $ 344
79
Copyright © 2013 www.secdatabase.com. All Rights Reserved.Please Consider the Environment Before Printing This Document
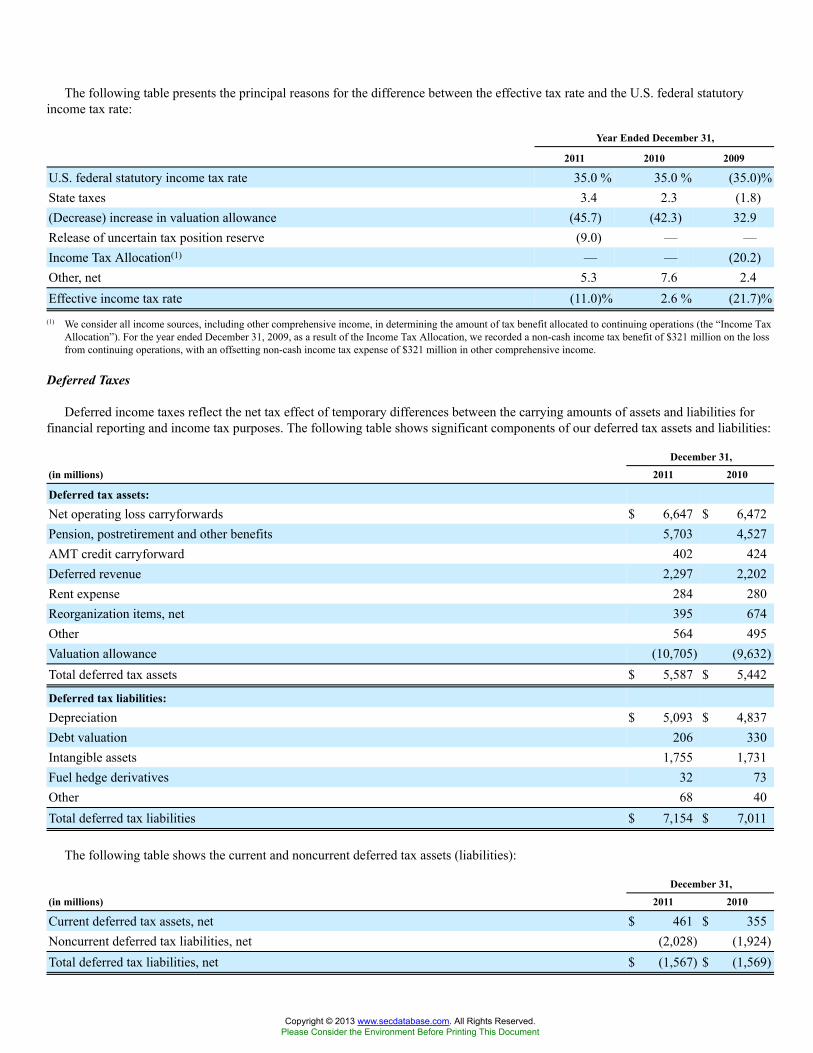
The following table presents the principal reasons for the difference between the effective tax rate and the U.S. federal statutoryincome tax rate:
Year Ended December 31,
2011 2010 2009
U.S. federal statutory income tax rate 35.0 % 35.0 % (35.0)%State taxes 3.4 2.3 (1.8)(Decrease) increase in valuation allowance (45.7) (42.3) 32.9Release of uncertain tax position reserve (9.0) — —Income Tax Allocation(1) — — (20.2)Other, net 5.3 7.6 2.4Effective income tax rate (11.0)% 2.6 % (21.7)%
(1) We consider all income sources, including other comprehensive income, in determining the amount of tax benefit allocated to continuing operations (the “Income TaxAllocation”). For the year ended December 31, 2009, as a result of the Income Tax Allocation, we recorded a non-cash income tax benefit of $321 million on the lossfrom continuing operations, with an offsetting non-cash income tax expense of $321 million in other comprehensive income.
Deferred Taxes
Deferred income taxes reflect the net tax effect of temporary differences between the carrying amounts of assets and liabilities forfinancial reporting and income tax purposes. The following table shows significant components of our deferred tax assets and liabilities:
December 31,
(in millions) 2011 2010
Deferred tax assets:Net operating loss carryforwards $ 6,647 $ 6,472Pension, postretirement and other benefits 5,703 4,527AMT credit carryforward 402 424Deferred revenue 2,297 2,202Rent expense 284 280Reorganization items, net 395 674Other 564 495Valuation allowance (10,705) (9,632)Total deferred tax assets $ 5,587 $ 5,442
Deferred tax liabilities:Depreciation $ 5,093 $ 4,837Debt valuation 206 330Intangible assets 1,755 1,731Fuel hedge derivatives 32 73Other 68 40Total deferred tax liabilities $ 7,154 $ 7,011
The following table shows the current and noncurrent deferred tax assets (liabilities):
December 31,
(in millions) 2011 2010
Current deferred tax assets, net $ 461 $ 355Noncurrent deferred tax liabilities, net (2,028) (1,924)Total deferred tax liabilities, net $ (1,567) $ (1,569)
Copyright © 2013 www.secdatabase.com. All Rights Reserved.Please Consider the Environment Before Printing This Document

80
Copyright © 2013 www.secdatabase.com. All Rights Reserved.Please Consider the Environment Before Printing This Document
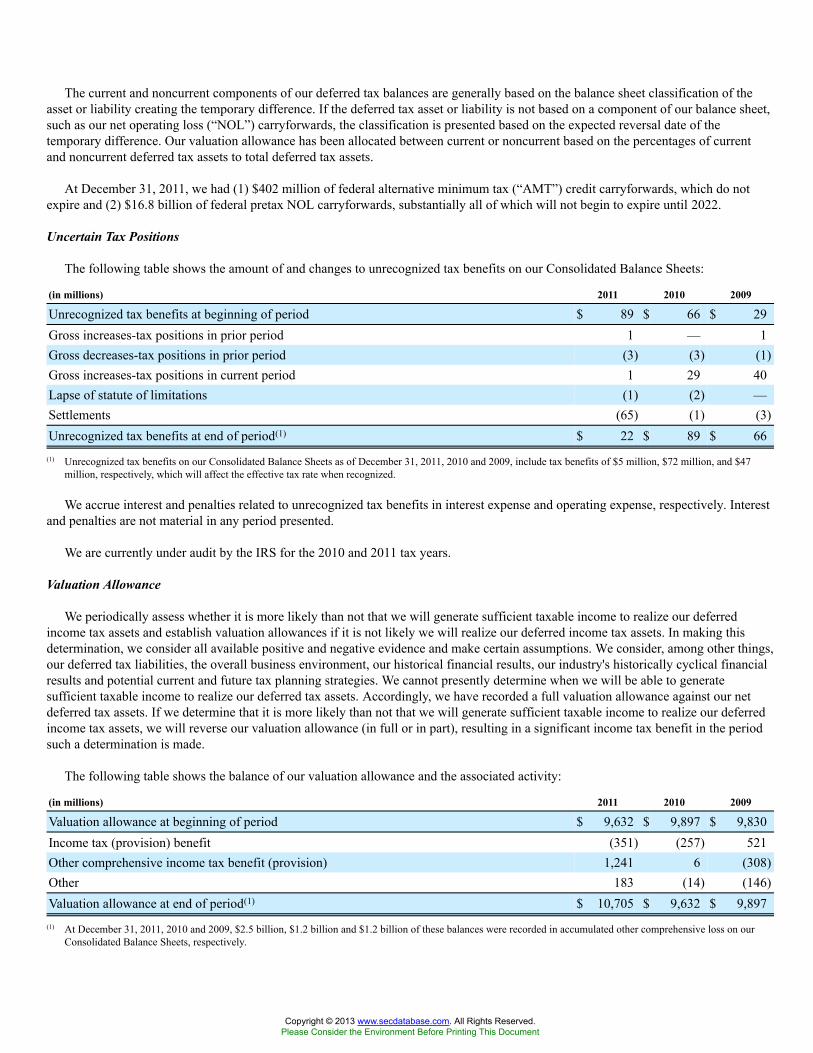
The current and noncurrent components of our deferred tax balances are generally based on the balance sheet classification of theasset or liability creating the temporary difference. If the deferred tax asset or liability is not based on a component of our balance sheet,such as our net operating loss (“NOL”) carryforwards, the classification is presented based on the expected reversal date of thetemporary difference. Our valuation allowance has been allocated between current or noncurrent based on the percentages of currentand noncurrent deferred tax assets to total deferred tax assets.
At December 31, 2011, we had (1) $402 million of federal alternative minimum tax (“AMT”) credit carryforwards, which do notexpire and (2) $16.8 billion of federal pretax NOL carryforwards, substantially all of which will not begin to expire until 2022.
Uncertain Tax Positions
The following table shows the amount of and changes to unrecognized tax benefits on our Consolidated Balance Sheets:
(in millions) 2011 2010 2009
Unrecognized tax benefits at beginning of period $ 89 $ 66 $ 29Gross increases-tax positions in prior period 1 — 1Gross decreases-tax positions in prior period (3) (3) (1)Gross increases-tax positions in current period 1 29 40Lapse of statute of limitations (1) (2) —Settlements (65) (1) (3)Unrecognized tax benefits at end of period(1) $ 22 $ 89 $ 66
(1) Unrecognized tax benefits on our Consolidated Balance Sheets as of December 31, 2011, 2010 and 2009, include tax benefits of $5 million, $72 million, and $47million, respectively, which will affect the effective tax rate when recognized.
We accrue interest and penalties related to unrecognized tax benefits in interest expense and operating expense, respectively. Interestand penalties are not material in any period presented.
We are currently under audit by the IRS for the 2010 and 2011 tax years.
Valuation Allowance
We periodically assess whether it is more likely than not that we will generate sufficient taxable income to realize our deferredincome tax assets and establish valuation allowances if it is not likely we will realize our deferred income tax assets. In making thisdetermination, we consider all available positive and negative evidence and make certain assumptions. We consider, among other things,our deferred tax liabilities, the overall business environment, our historical financial results, our industry's historically cyclical financialresults and potential current and future tax planning strategies. We cannot presently determine when we will be able to generatesufficient taxable income to realize our deferred tax assets. Accordingly, we have recorded a full valuation allowance against our netdeferred tax assets. If we determine that it is more likely than not that we will generate sufficient taxable income to realize our deferredincome tax assets, we will reverse our valuation allowance (in full or in part), resulting in a significant income tax benefit in the periodsuch a determination is made.
The following table shows the balance of our valuation allowance and the associated activity:
(in millions) 2011 2010 2009
Valuation allowance at beginning of period $ 9,632 $ 9,897 $ 9,830Income tax (provision) benefit (351) (257) 521Other comprehensive income tax benefit (provision) 1,241 6 (308)Other 183 (14) (146)Valuation allowance at end of period(1) $ 10,705 $ 9,632 $ 9,897
(1) At December 31, 2011, 2010 and 2009, $2.5 billion, $1.2 billion and $1.2 billion of these balances were recorded in accumulated other comprehensive loss on ourConsolidated Balance Sheets, respectively.
Copyright © 2013 www.secdatabase.com. All Rights Reserved.Please Consider the Environment Before Printing This Document

81
Copyright © 2013 www.secdatabase.com. All Rights Reserved.Please Consider the Environment Before Printing This Document
NOTE 12. EQUITY AND EQUITY COMPENSATION
Equity
We are authorized to issue 2.0 billion shares of capital stock, of which up to 1.5 billion may be shares of common stock, par value$0.0001 per share, and up to 500 million may be shares of preferred stock.
Preferred Stock. We may issue preferred stock in one or more series. The Board of Directors is authorized (1) to fix the descriptions,powers (including voting powers), preferences, rights, qualifications, limitations and restrictions with respect to any series of preferredstock and (2) to specify the number of shares of any series of preferred stock. We have not issued any preferred stock.
Treasury Stock. We generally withhold shares of Delta common stock to cover employees' portion of required tax withholdings whenemployee equity awards are issued or vest. These shares are valued at cost, which equals the market price of the common stock on thedate of issuance or vesting. The weighted average cost of shares held in treasury was $14.19 and $15.33 as of December 31, 2011 and2010, respectively.
Equity-Based Compensation
Our broad based equity and cash compensation plan provides for grants of restricted stock, stock options, performance awards,including cash incentive awards, and other equity-based awards (the "2007 Plan"). Shares of common stock issued under the 2007 Planmay be made available from authorized but unissued common stock or common stock we acquire. If any shares of our common stockare covered by an award that is canceled, forfeited or otherwise terminates without delivery of shares (including shares surrendered orwithheld for payment of the exercise price of an award or taxes related to an award), such shares will again be available for issuanceunder the 2007 Plan. The 2007 Plan authorizes the issuance of up to 157 million shares of common stock. As of December 31, 2011,there were 34 million shares available for future grants.
We make long term incentive awards annually to eligible employees under the 2007 Plan. Generally, awards vest over time, subjectto the employee's continued employment. Equity compensation expense for these awards is recognized in salaries and related costs overthe employee's requisite service period (generally, the vesting period of the award) and totaled $72 million, $89 million and $108million for the years ended December 31, 2011, 2010, and 2009, respectively. We record expense on a straight-line basis for awards withinstallment vesting. As of December 31, 2011, unrecognized costs related to unvested shares and stock options totaled $36 million. Weexpect substantially all unvested awards to vest.
Restricted Stock. Restricted stock is common stock that may not be sold or otherwise transferred for a period of time and is subject toforfeiture in certain circumstances. The fair value of restricted stock awards is based on the closing price of the common stock on thegrant date. As of December 31, 2011, there were four million unvested restricted stock awards.
Stock Options. Stock options are granted with an exercise price equal to the closing price of Delta common stock on the grant dateand generally have a 10-year term. We determine the fair value of stock options at the grant date using an option pricing model. As ofDecember 31, 2011, there were 18 million outstanding stock option awards with a weighted average exercise price of $12.15, and 17million were exercisable.
Performance Shares. Performance shares are long-term incentive opportunities which are payable in common stock or cash and aregenerally contingent upon our achieving certain financial goals.
Other. There was no tax benefit recognized in 2011, 2010 or 2009 related to equity-based compensation, as we record a full valuationallowance against our deferred tax assets due to the uncertainty regarding the ultimate realization of those assets.
82
Copyright © 2013 www.secdatabase.com. All Rights Reserved.Please Consider the Environment Before Printing This Document
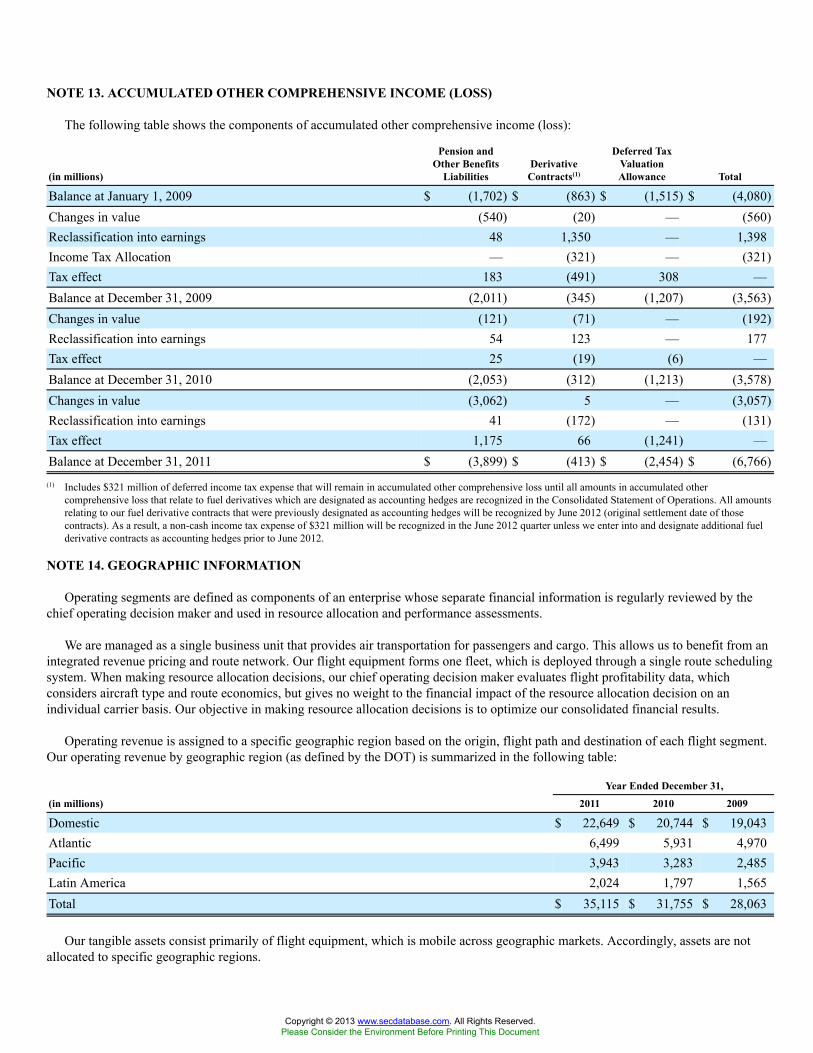
NOTE 13. ACCUMULATED OTHER COMPREHENSIVE INCOME (LOSS)
The following table shows the components of accumulated other comprehensive income (loss):
(in millions)
Pension andOther Benefits
LiabilitiesDerivative
Contracts(1)
Deferred TaxValuationAllowance Total
Balance at January 1, 2009 $ (1,702) $ (863) $ (1,515) $ (4,080)Changes in value (540) (20) — (560)Reclassification into earnings 48 1,350 — 1,398Income Tax Allocation — (321) — (321)Tax effect 183 (491) 308 —Balance at December 31, 2009 (2,011) (345) (1,207) (3,563)Changes in value (121) (71) — (192)Reclassification into earnings 54 123 — 177Tax effect 25 (19) (6) —Balance at December 31, 2010 (2,053) (312) (1,213) (3,578)Changes in value (3,062) 5 — (3,057)Reclassification into earnings 41 (172) — (131)Tax effect 1,175 66 (1,241) —Balance at December 31, 2011 $ (3,899) $ (413) $ (2,454) $ (6,766)
(1) Includes $321 million of deferred income tax expense that will remain in accumulated other comprehensive loss until all amounts in accumulated othercomprehensive loss that relate to fuel derivatives which are designated as accounting hedges are recognized in the Consolidated Statement of Operations. All amountsrelating to our fuel derivative contracts that were previously designated as accounting hedges will be recognized by June 2012 (original settlement date of thosecontracts). As a result, a non-cash income tax expense of $321 million will be recognized in the June 2012 quarter unless we enter into and designate additional fuelderivative contracts as accounting hedges prior to June 2012.
NOTE 14. GEOGRAPHIC INFORMATION
Operating segments are defined as components of an enterprise whose separate financial information is regularly reviewed by thechief operating decision maker and used in resource allocation and performance assessments.
We are managed as a single business unit that provides air transportation for passengers and cargo. This allows us to benefit from anintegrated revenue pricing and route network. Our flight equipment forms one fleet, which is deployed through a single route schedulingsystem. When making resource allocation decisions, our chief operating decision maker evaluates flight profitability data, whichconsiders aircraft type and route economics, but gives no weight to the financial impact of the resource allocation decision on anindividual carrier basis. Our objective in making resource allocation decisions is to optimize our consolidated financial results.
Operating revenue is assigned to a specific geographic region based on the origin, flight path and destination of each flight segment.Our operating revenue by geographic region (as defined by the DOT) is summarized in the following table:
Year Ended December 31,
(in millions) 2011 2010 2009
Domestic $ 22,649 $ 20,744 $ 19,043Atlantic 6,499 5,931 4,970Pacific 3,943 3,283 2,485Latin America 2,024 1,797 1,565Total $ 35,115 $ 31,755 $ 28,063
Our tangible assets consist primarily of flight equipment, which is mobile across geographic markets. Accordingly, assets are notallocated to specific geographic regions.
Copyright © 2013 www.secdatabase.com. All Rights Reserved.Please Consider the Environment Before Printing This Document

83
Copyright © 2013 www.secdatabase.com. All Rights Reserved.Please Consider the Environment Before Printing This Document
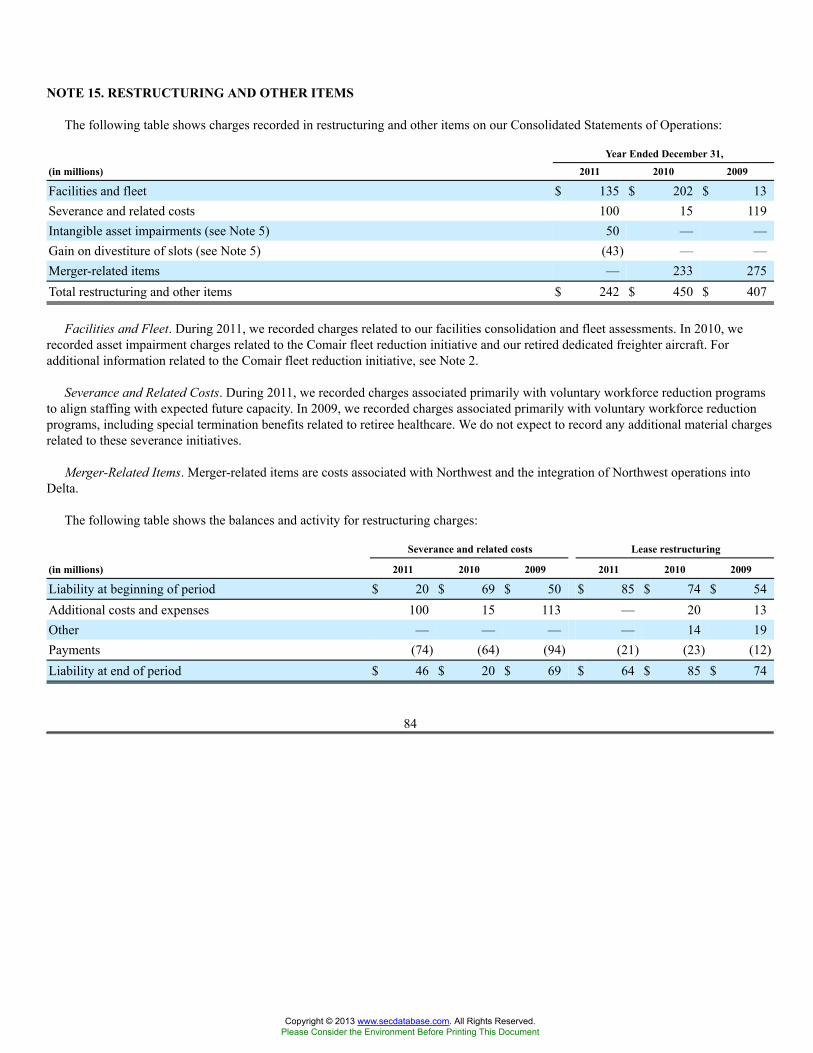
NOTE 15. RESTRUCTURING AND OTHER ITEMS
The following table shows charges recorded in restructuring and other items on our Consolidated Statements of Operations:
Year Ended December 31,
(in millions) 2011 2010 2009
Facilities and fleet $ 135 $ 202 $ 13Severance and related costs 100 15 119Intangible asset impairments (see Note 5) 50 — —Gain on divestiture of slots (see Note 5) (43) — —Merger-related items — 233 275Total restructuring and other items $ 242 $ 450 $ 407
Facilities and Fleet. During 2011, we recorded charges related to our facilities consolidation and fleet assessments. In 2010, werecorded asset impairment charges related to the Comair fleet reduction initiative and our retired dedicated freighter aircraft. Foradditional information related to the Comair fleet reduction initiative, see Note 2.
Severance and Related Costs. During 2011, we recorded charges associated primarily with voluntary workforce reduction programsto align staffing with expected future capacity. In 2009, we recorded charges associated primarily with voluntary workforce reductionprograms, including special termination benefits related to retiree healthcare. We do not expect to record any additional material chargesrelated to these severance initiatives.
Merger-Related Items. Merger-related items are costs associated with Northwest and the integration of Northwest operations intoDelta.
The following table shows the balances and activity for restructuring charges:
Severance and related costs Lease restructuring
(in millions) 2011 2010 2009 2011 2010 2009
Liability at beginning of period $ 20 $ 69 $ 50 $ 85 $ 74 $ 54Additional costs and expenses 100 15 113 — 20 13Other — — — — 14 19Payments (74) (64) (94) (21) (23) (12)Liability at end of period $ 46 $ 20 $ 69 $ 64 $ 85 $ 74
84
Copyright © 2013 www.secdatabase.com. All Rights Reserved.Please Consider the Environment Before Printing This Document
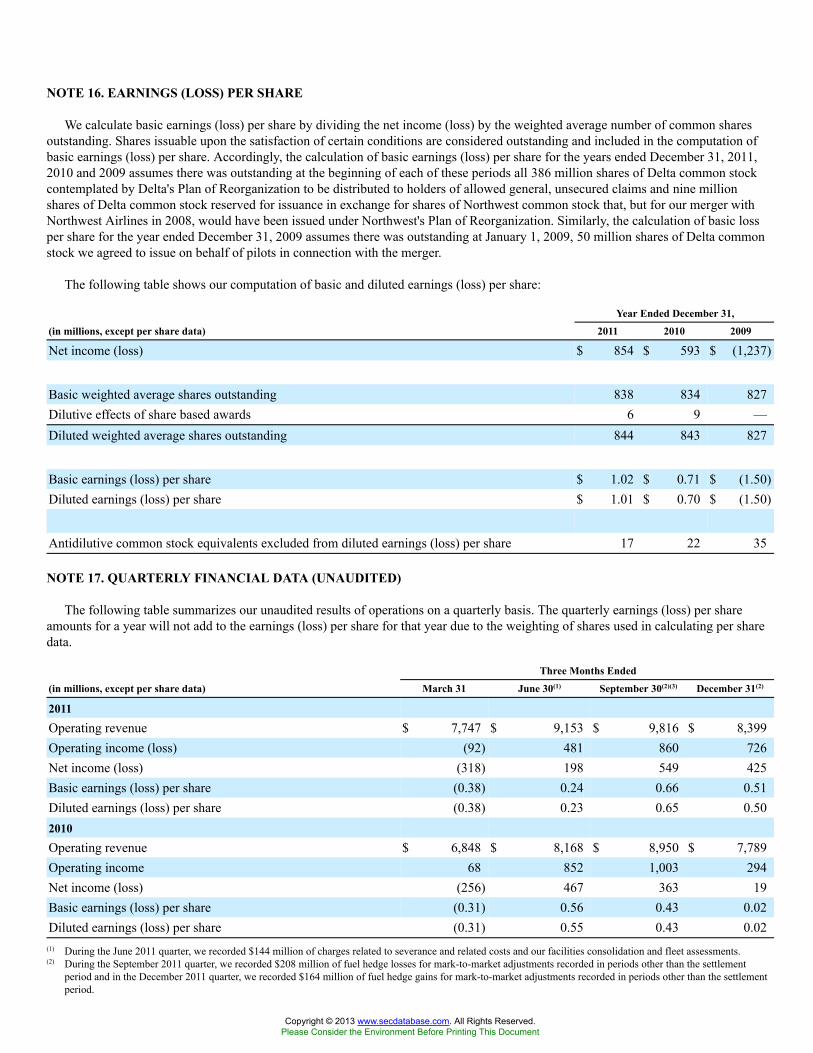
NOTE 16. EARNINGS (LOSS) PER SHARE
We calculate basic earnings (loss) per share by dividing the net income (loss) by the weighted average number of common sharesoutstanding. Shares issuable upon the satisfaction of certain conditions are considered outstanding and included in the computation ofbasic earnings (loss) per share. Accordingly, the calculation of basic earnings (loss) per share for the years ended December 31, 2011,2010 and 2009 assumes there was outstanding at the beginning of each of these periods all 386 million shares of Delta common stockcontemplated by Delta's Plan of Reorganization to be distributed to holders of allowed general, unsecured claims and nine millionshares of Delta common stock reserved for issuance in exchange for shares of Northwest common stock that, but for our merger withNorthwest Airlines in 2008, would have been issued under Northwest's Plan of Reorganization. Similarly, the calculation of basic lossper share for the year ended December 31, 2009 assumes there was outstanding at January 1, 2009, 50 million shares of Delta commonstock we agreed to issue on behalf of pilots in connection with the merger.
The following table shows our computation of basic and diluted earnings (loss) per share:
Year Ended December 31,
(in millions, except per share data) 2011 2010 2009
Net income (loss) $ 854 $ 593 $ (1,237)
Basic weighted average shares outstanding 838 834 827Dilutive effects of share based awards 6 9 —Diluted weighted average shares outstanding 844 843 827
Basic earnings (loss) per share $ 1.02 $ 0.71 $ (1.50)Diluted earnings (loss) per share $ 1.01 $ 0.70 $ (1.50)
Antidilutive common stock equivalents excluded from diluted earnings (loss) per share 17 22 35
NOTE 17. QUARTERLY FINANCIAL DATA (UNAUDITED)
The following table summarizes our unaudited results of operations on a quarterly basis. The quarterly earnings (loss) per shareamounts for a year will not add to the earnings (loss) per share for that year due to the weighting of shares used in calculating per sharedata.
Three Months Ended
(in millions, except per share data) March 31 June 30(1) September 30(2)(3) December 31(2)
2011Operating revenue $ 7,747 $ 9,153 $ 9,816 $ 8,399Operating income (loss) (92) 481 860 726Net income (loss) (318) 198 549 425Basic earnings (loss) per share (0.38) 0.24 0.66 0.51Diluted earnings (loss) per share (0.38) 0.23 0.65 0.502010Operating revenue $ 6,848 $ 8,168 $ 8,950 $ 7,789Operating income 68 852 1,003 294Net income (loss) (256) 467 363 19Basic earnings (loss) per share (0.31) 0.56 0.43 0.02Diluted earnings (loss) per share (0.31) 0.55 0.43 0.02
(1) During the June 2011 quarter, we recorded $144 million of charges related to severance and related costs and our facilities consolidation and fleet assessments.(2) During the September 2011 quarter, we recorded $208 million of fuel hedge losses for mark-to-market adjustments recorded in periods other than the settlement
period and in the December 2011 quarter, we recorded $164 million of fuel hedge gains for mark-to-market adjustments recorded in periods other than the settlementperiod.
Copyright © 2013 www.secdatabase.com. All Rights Reserved.Please Consider the Environment Before Printing This Document

(3) During the September 2010 quarter, we recorded (1) a $360 million loss associated with the primarily non-cash loss on extinguishment of debt, including the write-offof unamortized debt discount and (2) a $146 million charge related to the Comair fleet reduction initiative.
85
Copyright © 2013 www.secdatabase.com. All Rights Reserved.Please Consider the Environment Before Printing This Document
ITEM 9. CHANGES IN AND DISAGREEMENTS WITH ACCOUNTANTS ON ACCOUNTING AND FINANCIALDISCLOSURE
None.
ITEM 9A. CONTROLS AND PROCEDURES
Disclosure Controls and Procedures
Our management, including our Chief Executive Officer and Chief Financial Officer, performed an evaluation of our disclosurecontrols and procedures, which have been designed to permit us to effectively identify and timely disclose important information.Our management, including our Chief Executive Officer and Chief Financial Officer, concluded that the controls and procedures wereeffective as of December 31, 2011 to ensure that material information was accumulated and communicated to our management, includingour Chief Executive Officer and Chief Financial Officer, as appropriate to allow timely decisions regarding required disclosure.
Changes in Internal Control
During the three months ended December 31, 2011, we did not make any changes in our internal control over financial reporting thathave materially affected, or are reasonably likely to materially affect, our internal control over financial reporting.
Management's Annual Report on Internal Control Over Financial Reporting
Management is responsible for establishing and maintaining adequate internal control over financial reporting, as such term is definedin Rules 13a-15(f) and 15d-15(f) under the Securities Exchange Act of 1934. Our internal control over financial reporting is designedto provide reasonable assurance regarding the reliability of financial reporting and the preparation of financial statements for externalpurposes in accordance with accounting principles generally accepted in the United States of America.
Because of its inherent limitations, internal control over financial reporting may not prevent or detect misstatements. Projectionsof any evaluation of effectiveness to future periods are subject to the risk that controls may become inadequate because of changes inconditions, or that the degree of compliance with the policies may deteriorate.
Management conducted an evaluation of the effectiveness of our internal control over financial reporting as of December 31, 2011using the criteria issued by the Committee of Sponsoring Organizations of the Treadway Commission (COSO) in Internal Control-Integrated Framework. Based on that evaluation, management believes that our internal control over financial reporting was effective asof December 31, 2011.
The effectiveness of our internal control over financial reporting as of December 31, 2011 has been audited by Ernst & Young LLP,an independent registered public accounting firm, which also audited our Consolidated Financial Statements for the year endedDecember 31, 2011. Ernst & Young LLP's report on our internal control over financial reporting is set forth below.
86
Copyright © 2013 www.secdatabase.com. All Rights Reserved.Please Consider the Environment Before Printing This Document
REPORT OF INDEPENDENT REGISTERED PUBLIC ACCOUNTING FIRM ON INTERNAL CONTROL OVERFINANCIAL REPORTING
The Board of Directors and Stockholders ofDelta Air Lines, Inc.
We have audited Delta Air Lines, Inc.'s internal control over financial reporting as of December 31, 2011, based on criteria establishedin Internal Control-Integrated Framework issued by the Committee of Sponsoring Organizations of the Treadway Commission (theCOSO criteria). Delta Air Lines, Inc.'s management is responsible for maintaining effective internal control over financial reporting, andfor its assessment of the effectiveness of internal control over financial reporting included in the accompanying Management's AnnualReport on Internal Control Over Financial Reporting. Our responsibility is to express an opinion on the Company's internal control overfinancial reporting based on our audit.
We conducted our audit in accordance with the standards of the Public Company Accounting Oversight Board (United States). Thosestandards require that we plan and perform the audit to obtain reasonable assurance about whether effective internal control over financialreporting was maintained in all material respects. Our audit included obtaining an understanding of internal control over financialreporting, assessing the risk that a material weakness exists, testing and evaluating the design and operating effectiveness of internalcontrol based on the assessed risk, and performing such other procedures as we considered necessary in the circumstances. We believethat our audit provides a reasonable basis for our opinion.
A company's internal control over financial reporting is a process designed to provide reasonable assurance regarding the reliabilityof financial reporting and the preparation of financial statements for external purposes in accordance with generally accepted accountingprinciples. A company's internal control over financial reporting includes those policies and procedures that (1) pertain to the maintenanceof records that, in reasonable detail, accurately and fairly reflect the transactions and dispositions of the assets of the company; (2)provide reasonable assurance that transactions are recorded as necessary to permit preparation of financial statements in accordancewith generally accepted accounting principles, and that receipts and expenditures of the company are being made only in accordancewith authorizations of management and directors of the company; and (3) provide reasonable assurance regarding prevention or timelydetection of unauthorized acquisition, use, or disposition of the company's assets that could have a material effect on the financialstatements.
Because of its inherent limitations, internal control over financial reporting may not prevent or detect misstatements. Also, projectionsof any evaluation of effectiveness to future periods are subject to the risk that controls may become inadequate because of changes inconditions, or that the degree of compliance with the policies or procedures may deteriorate.
In our opinion, Delta Air Lines, Inc. maintained, in all material respects, effective internal control over financial reporting as ofDecember 31, 2011, based on the COSO criteria.
We also have audited, in accordance with the standards of the Public Company Accounting Oversight Board (United States), theconsolidated balance sheets of Delta Air Lines, Inc. as of December 31, 2011 and 2010, and the related consolidated statements ofoperations, stockholders' (deficit) equity, and cash flows for each of the three years in the period ended December 31, 2011 of Delta AirLines, Inc. and our report dated February 10, 2012 expressed an unqualified opinion thereon.
/s/ Ernst & Young LLPAtlanta, Georgia
February 10, 2012
87
Copyright © 2013 www.secdatabase.com. All Rights Reserved.Please Consider the Environment Before Printing This Document
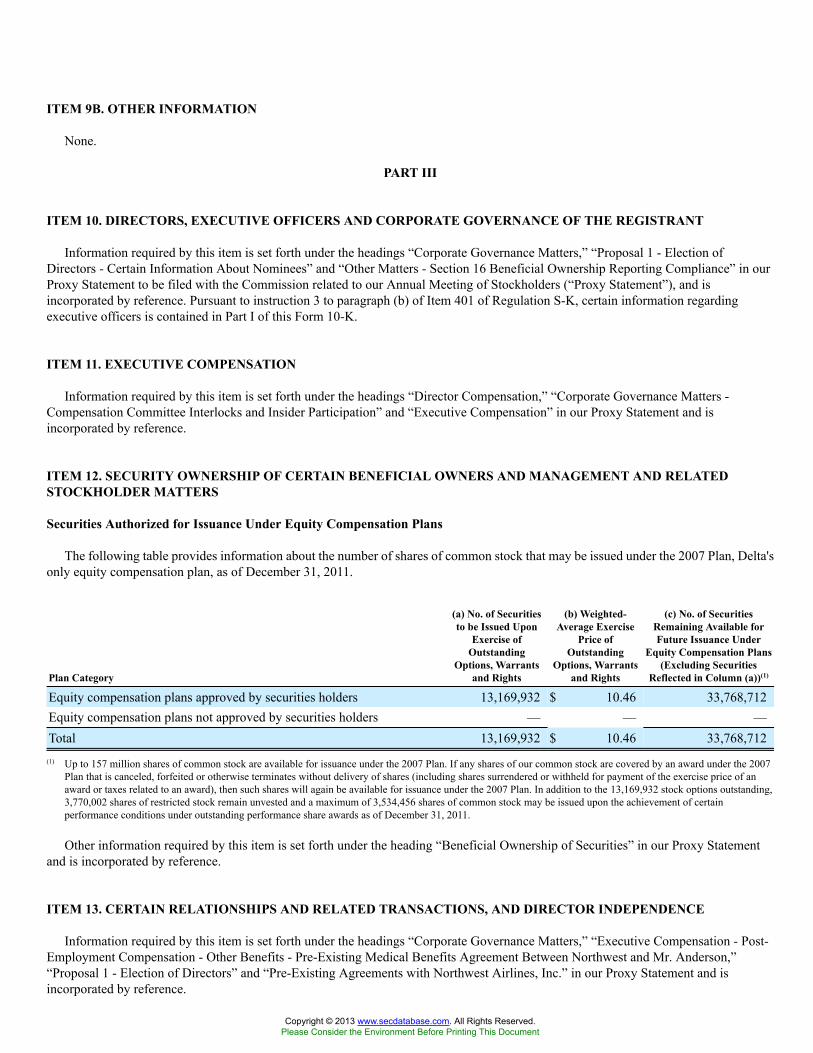
ITEM 9B. OTHER INFORMATION
None.
PART III
ITEM 10. DIRECTORS, EXECUTIVE OFFICERS AND CORPORATE GOVERNANCE OF THE REGISTRANT
Information required by this item is set forth under the headings “Corporate Governance Matters,” “Proposal 1 - Election ofDirectors - Certain Information About Nominees” and “Other Matters - Section 16 Beneficial Ownership Reporting Compliance” in ourProxy Statement to be filed with the Commission related to our Annual Meeting of Stockholders (“Proxy Statement”), and isincorporated by reference. Pursuant to instruction 3 to paragraph (b) of Item 401 of Regulation S-K, certain information regardingexecutive officers is contained in Part I of this Form 10-K.
ITEM 11. EXECUTIVE COMPENSATION
Information required by this item is set forth under the headings “Director Compensation,” “Corporate Governance Matters -Compensation Committee Interlocks and Insider Participation” and “Executive Compensation” in our Proxy Statement and isincorporated by reference.
ITEM 12. SECURITY OWNERSHIP OF CERTAIN BENEFICIAL OWNERS AND MANAGEMENT AND RELATEDSTOCKHOLDER MATTERS
Securities Authorized for Issuance Under Equity Compensation Plans
The following table provides information about the number of shares of common stock that may be issued under the 2007 Plan, Delta'sonly equity compensation plan, as of December 31, 2011.
Plan Category
(a) No. of Securitiesto be Issued Upon
Exercise ofOutstanding
Options, Warrantsand Rights
(b) Weighted-Average Exercise
Price ofOutstanding
Options, Warrantsand Rights
(c) No. of SecuritiesRemaining Available forFuture Issuance Under
Equity Compensation Plans(Excluding Securities
Reflected in Column (a))(1)
Equity compensation plans approved by securities holders 13,169,932 $ 10.46 33,768,712Equity compensation plans not approved by securities holders — — —Total 13,169,932 $ 10.46 33,768,712
(1) Up to 157 million shares of common stock are available for issuance under the 2007 Plan. If any shares of our common stock are covered by an award under the 2007Plan that is canceled, forfeited or otherwise terminates without delivery of shares (including shares surrendered or withheld for payment of the exercise price of anaward or taxes related to an award), then such shares will again be available for issuance under the 2007 Plan. In addition to the 13,169,932 stock options outstanding,3,770,002 shares of restricted stock remain unvested and a maximum of 3,534,456 shares of common stock may be issued upon the achievement of certainperformance conditions under outstanding performance share awards as of December 31, 2011.
Other information required by this item is set forth under the heading “Beneficial Ownership of Securities” in our Proxy Statementand is incorporated by reference.
ITEM 13. CERTAIN RELATIONSHIPS AND RELATED TRANSACTIONS, AND DIRECTOR INDEPENDENCE
Information required by this item is set forth under the headings “Corporate Governance Matters,” “Executive Compensation - Post-Employment Compensation - Other Benefits - Pre-Existing Medical Benefits Agreement Between Northwest and Mr. Anderson,”“Proposal 1 - Election of Directors” and “Pre-Existing Agreements with Northwest Airlines, Inc.” in our Proxy Statement and isincorporated by reference.
Copyright © 2013 www.secdatabase.com. All Rights Reserved.Please Consider the Environment Before Printing This Document

88
Copyright © 2013 www.secdatabase.com. All Rights Reserved.Please Consider the Environment Before Printing This Document
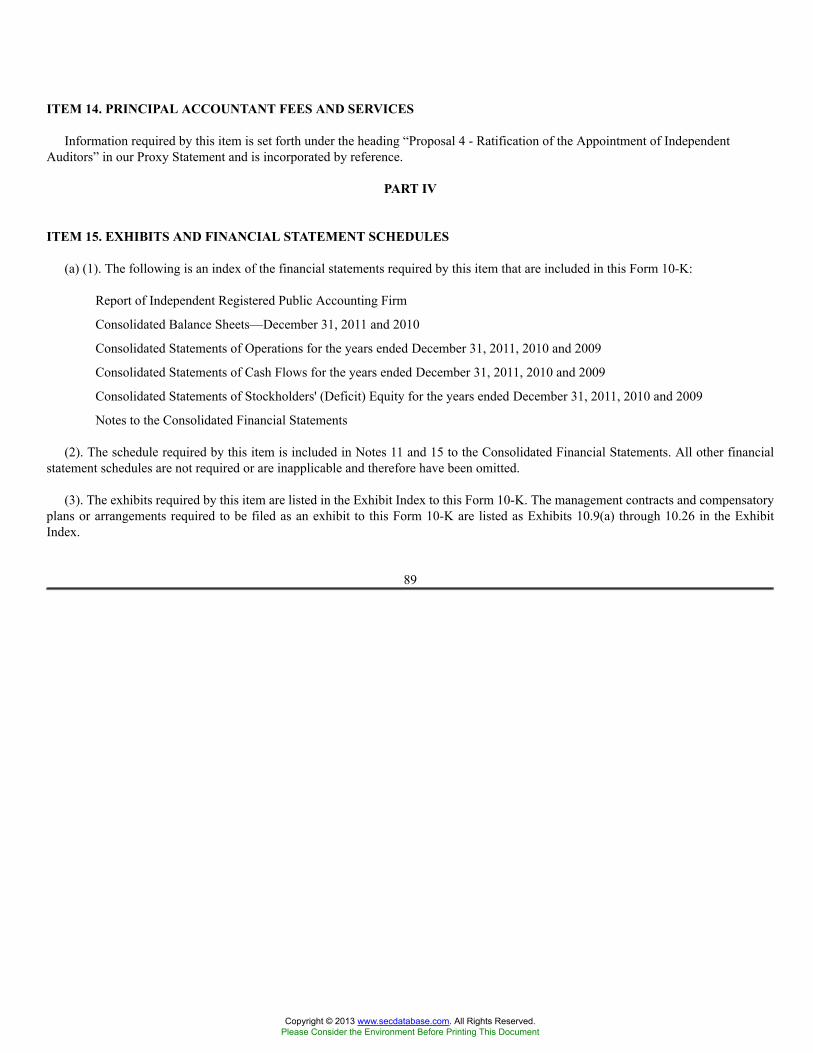
ITEM 14. PRINCIPAL ACCOUNTANT FEES AND SERVICES
Information required by this item is set forth under the heading “Proposal 4 - Ratification of the Appointment of IndependentAuditors” in our Proxy Statement and is incorporated by reference.
PART IV
ITEM 15. EXHIBITS AND FINANCIAL STATEMENT SCHEDULES
(a) (1). The following is an index of the financial statements required by this item that are included in this Form 10-K:
Report of Independent Registered Public Accounting Firm
Consolidated Balance Sheets—December 31, 2011 and 2010
Consolidated Statements of Operations for the years ended December 31, 2011, 2010 and 2009
Consolidated Statements of Cash Flows for the years ended December 31, 2011, 2010 and 2009
Consolidated Statements of Stockholders' (Deficit) Equity for the years ended December 31, 2011, 2010 and 2009
Notes to the Consolidated Financial Statements
(2). The schedule required by this item is included in Notes 11 and 15 to the Consolidated Financial Statements. All other financialstatement schedules are not required or are inapplicable and therefore have been omitted.
(3). The exhibits required by this item are listed in the Exhibit Index to this Form 10-K. The management contracts and compensatoryplans or arrangements required to be filed as an exhibit to this Form 10-K are listed as Exhibits 10.9(a) through 10.26 in the ExhibitIndex.
89
Copyright © 2013 www.secdatabase.com. All Rights Reserved.Please Consider the Environment Before Printing This Document
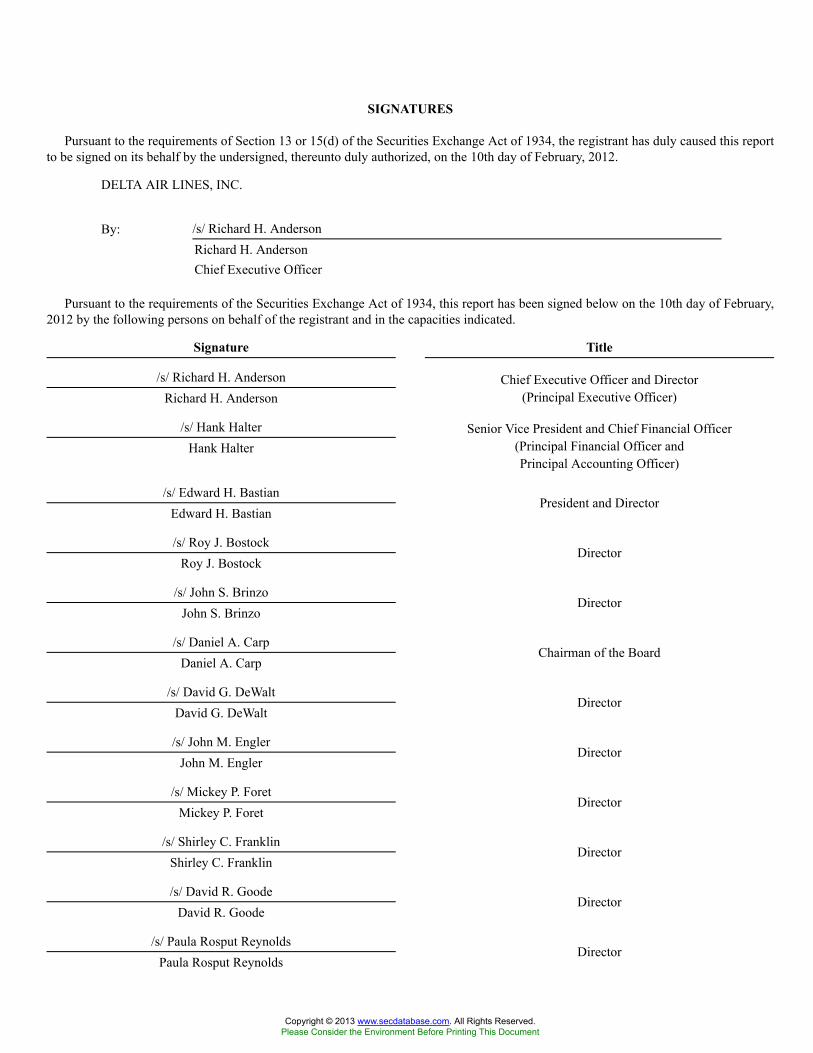
SIGNATURES
Pursuant to the requirements of Section 13 or 15(d) of the Securities Exchange Act of 1934, the registrant has duly caused this reportto be signed on its behalf by the undersigned, thereunto duly authorized, on the 10th day of February, 2012.
DELTA AIR LINES, INC.
By: /s/ Richard H. AndersonRichard H. AndersonChief Executive Officer
Pursuant to the requirements of the Securities Exchange Act of 1934, this report has been signed below on the 10th day of February,2012 by the following persons on behalf of the registrant and in the capacities indicated.
Signature Title
/s/ Richard H. AndersonRichard H. Anderson
Chief Executive Officer and Director(Principal Executive Officer)
/s/ Hank HalterHank Halter
Senior Vice President and Chief Financial Officer(Principal Financial Officer andPrincipal Accounting Officer)
/s/ Edward H. BastianEdward H. Bastian
President and Director
/s/ Roy J. BostockRoy J. Bostock
Director
/s/ John S. BrinzoJohn S. Brinzo
Director
/s/ Daniel A. CarpDaniel A. Carp
Chairman of the Board
/s/ David G. DeWaltDavid G. DeWalt
Director
/s/ John M. EnglerJohn M. Engler
Director
/s/ Mickey P. ForetMickey P. Foret
Director
/s/ Shirley C. FranklinShirley C. Franklin
Director
/s/ David R. GoodeDavid R. Goode
Director
/s/ Paula Rosput ReynoldsPaula Rosput Reynolds
Director
Copyright © 2013 www.secdatabase.com. All Rights Reserved.Please Consider the Environment Before Printing This Document

/s/ Kenneth C. RogersKenneth C. Rogers
Director
/s/ Kenneth B. WoodrowKenneth B. Woodrow
Director
90
Copyright © 2013 www.secdatabase.com. All Rights Reserved.Please Consider the Environment Before Printing This Document
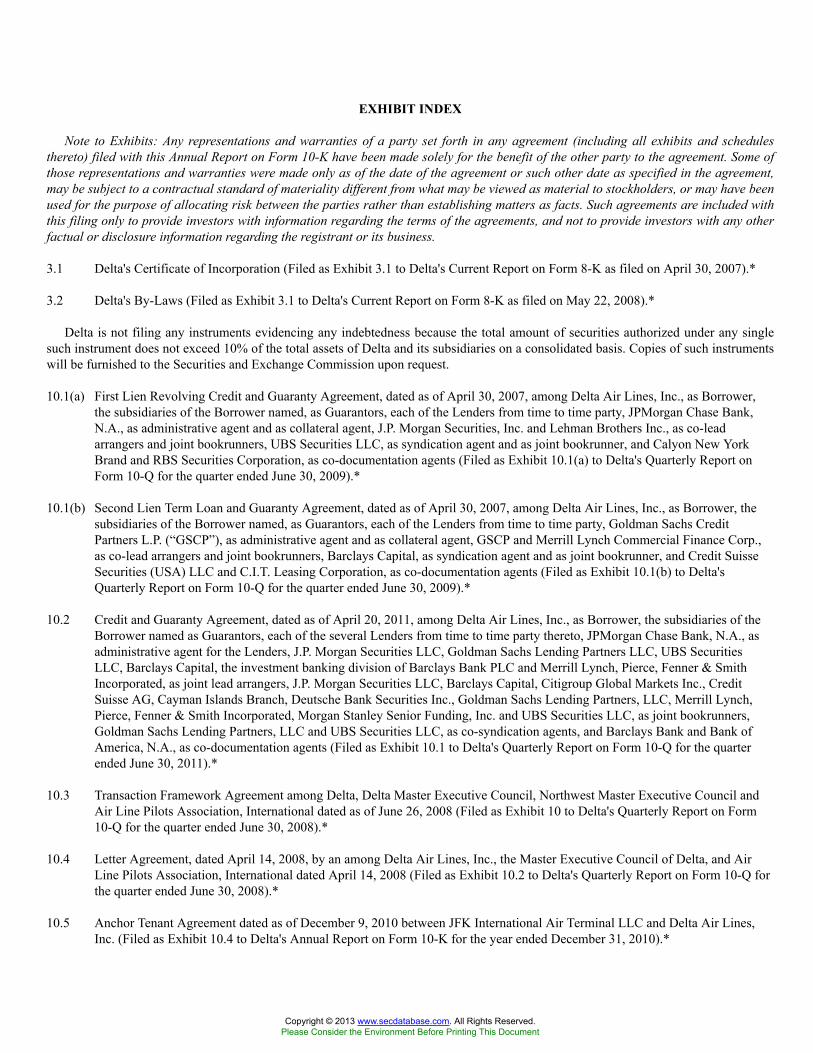
EXHIBIT INDEX
Note to Exhibits: Any representations and warranties of a party set forth in any agreement (including all exhibits and schedulesthereto) filed with this Annual Report on Form 10-K have been made solely for the benefit of the other party to the agreement. Some ofthose representations and warranties were made only as of the date of the agreement or such other date as specified in the agreement,may be subject to a contractual standard of materiality different from what may be viewed as material to stockholders, or may have beenused for the purpose of allocating risk between the parties rather than establishing matters as facts. Such agreements are included withthis filing only to provide investors with information regarding the terms of the agreements, and not to provide investors with any otherfactual or disclosure information regarding the registrant or its business.
3.1 Delta's Certificate of Incorporation (Filed as Exhibit 3.1 to Delta's Current Report on Form 8-K as filed on April 30, 2007).*
3.2 Delta's By-Laws (Filed as Exhibit 3.1 to Delta's Current Report on Form 8-K as filed on May 22, 2008).*
Delta is not filing any instruments evidencing any indebtedness because the total amount of securities authorized under any singlesuch instrument does not exceed 10% of the total assets of Delta and its subsidiaries on a consolidated basis. Copies of such instrumentswill be furnished to the Securities and Exchange Commission upon request.
10.1(a) First Lien Revolving Credit and Guaranty Agreement, dated as of April 30, 2007, among Delta Air Lines, Inc., as Borrower,the subsidiaries of the Borrower named, as Guarantors, each of the Lenders from time to time party, JPMorgan Chase Bank,N.A., as administrative agent and as collateral agent, J.P. Morgan Securities, Inc. and Lehman Brothers Inc., as co-leadarrangers and joint bookrunners, UBS Securities LLC, as syndication agent and as joint bookrunner, and Calyon New YorkBrand and RBS Securities Corporation, as co-documentation agents (Filed as Exhibit 10.1(a) to Delta's Quarterly Report onForm 10-Q for the quarter ended June 30, 2009).*
10.1(b) Second Lien Term Loan and Guaranty Agreement, dated as of April 30, 2007, among Delta Air Lines, Inc., as Borrower, thesubsidiaries of the Borrower named, as Guarantors, each of the Lenders from time to time party, Goldman Sachs CreditPartners L.P. (“GSCP”), as administrative agent and as collateral agent, GSCP and Merrill Lynch Commercial Finance Corp.,as co-lead arrangers and joint bookrunners, Barclays Capital, as syndication agent and as joint bookrunner, and Credit SuisseSecurities (USA) LLC and C.I.T. Leasing Corporation, as co-documentation agents (Filed as Exhibit 10.1(b) to Delta'sQuarterly Report on Form 10-Q for the quarter ended June 30, 2009).*
10.2 Credit and Guaranty Agreement, dated as of April 20, 2011, among Delta Air Lines, Inc., as Borrower, the subsidiaries of theBorrower named as Guarantors, each of the several Lenders from time to time party thereto, JPMorgan Chase Bank, N.A., asadministrative agent for the Lenders, J.P. Morgan Securities LLC, Goldman Sachs Lending Partners LLC, UBS SecuritiesLLC, Barclays Capital, the investment banking division of Barclays Bank PLC and Merrill Lynch, Pierce, Fenner & SmithIncorporated, as joint lead arrangers, J.P. Morgan Securities LLC, Barclays Capital, Citigroup Global Markets Inc., CreditSuisse AG, Cayman Islands Branch, Deutsche Bank Securities Inc., Goldman Sachs Lending Partners, LLC, Merrill Lynch,Pierce, Fenner & Smith Incorporated, Morgan Stanley Senior Funding, Inc. and UBS Securities LLC, as joint bookrunners,Goldman Sachs Lending Partners, LLC and UBS Securities LLC, as co-syndication agents, and Barclays Bank and Bank ofAmerica, N.A., as co-documentation agents (Filed as Exhibit 10.1 to Delta's Quarterly Report on Form 10-Q for the quarterended June 30, 2011).*
10.3 Transaction Framework Agreement among Delta, Delta Master Executive Council, Northwest Master Executive Council andAir Line Pilots Association, International dated as of June 26, 2008 (Filed as Exhibit 10 to Delta's Quarterly Report on Form10-Q for the quarter ended June 30, 2008).*
10.4 Letter Agreement, dated April 14, 2008, by an among Delta Air Lines, Inc., the Master Executive Council of Delta, and AirLine Pilots Association, International dated April 14, 2008 (Filed as Exhibit 10.2 to Delta's Quarterly Report on Form 10-Q forthe quarter ended June 30, 2008).*
10.5 Anchor Tenant Agreement dated as of December 9, 2010 between JFK International Air Terminal LLC and Delta Air Lines,Inc. (Filed as Exhibit 10.4 to Delta's Annual Report on Form 10-K for the year ended December 31, 2010).*
Copyright © 2013 www.secdatabase.com. All Rights Reserved.Please Consider the Environment Before Printing This Document

10.6 Supplemental Agreement No. 13 to Purchase Agreement Number 2022, dated August 24, 2011, between The Boeing Companyand Delta relating to Boeing Model 737NG Aircraft (the “B-737NG Purchase Agreement”) (Filed as Exhibit 10.1 to Delta'sQuarterly Report on Form 10-Q for the quarter ended September 30, 2011).*/**
91
Copyright © 2013 www.secdatabase.com. All Rights Reserved.Please Consider the Environment Before Printing This Document
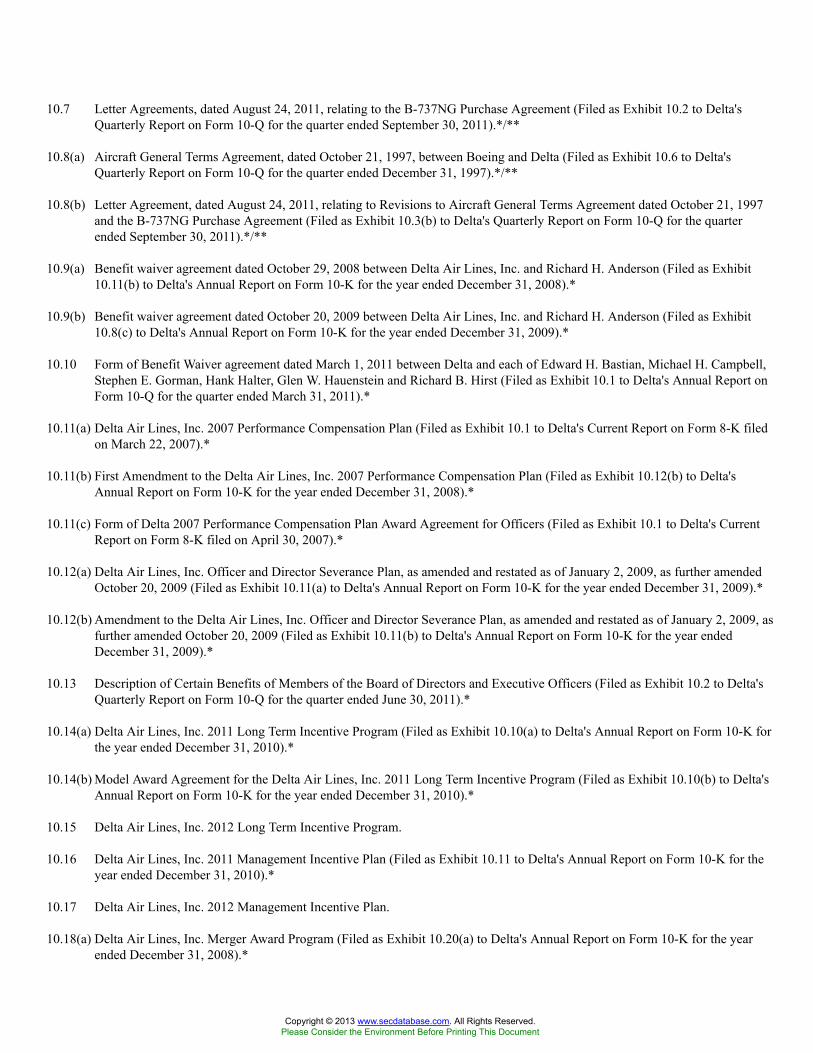
10.7 Letter Agreements, dated August 24, 2011, relating to the B-737NG Purchase Agreement (Filed as Exhibit 10.2 to Delta'sQuarterly Report on Form 10-Q for the quarter ended September 30, 2011).*/**
10.8(a) Aircraft General Terms Agreement, dated October 21, 1997, between Boeing and Delta (Filed as Exhibit 10.6 to Delta'sQuarterly Report on Form 10-Q for the quarter ended December 31, 1997).*/**
10.8(b) Letter Agreement, dated August 24, 2011, relating to Revisions to Aircraft General Terms Agreement dated October 21, 1997and the B-737NG Purchase Agreement (Filed as Exhibit 10.3(b) to Delta's Quarterly Report on Form 10-Q for the quarterended September 30, 2011).*/**
10.9(a) Benefit waiver agreement dated October 29, 2008 between Delta Air Lines, Inc. and Richard H. Anderson (Filed as Exhibit10.11(b) to Delta's Annual Report on Form 10-K for the year ended December 31, 2008).*
10.9(b) Benefit waiver agreement dated October 20, 2009 between Delta Air Lines, Inc. and Richard H. Anderson (Filed as Exhibit10.8(c) to Delta's Annual Report on Form 10-K for the year ended December 31, 2009).*
10.10 Form of Benefit Waiver agreement dated March 1, 2011 between Delta and each of Edward H. Bastian, Michael H. Campbell,Stephen E. Gorman, Hank Halter, Glen W. Hauenstein and Richard B. Hirst (Filed as Exhibit 10.1 to Delta's Annual Report onForm 10-Q for the quarter ended March 31, 2011).*
10.11(a) Delta Air Lines, Inc. 2007 Performance Compensation Plan (Filed as Exhibit 10.1 to Delta's Current Report on Form 8-K filedon March 22, 2007).*
10.11(b) First Amendment to the Delta Air Lines, Inc. 2007 Performance Compensation Plan (Filed as Exhibit 10.12(b) to Delta'sAnnual Report on Form 10-K for the year ended December 31, 2008).*
10.11(c) Form of Delta 2007 Performance Compensation Plan Award Agreement for Officers (Filed as Exhibit 10.1 to Delta's CurrentReport on Form 8-K filed on April 30, 2007).*
10.12(a) Delta Air Lines, Inc. Officer and Director Severance Plan, as amended and restated as of January 2, 2009, as further amendedOctober 20, 2009 (Filed as Exhibit 10.11(a) to Delta's Annual Report on Form 10-K for the year ended December 31, 2009).*
10.12(b) Amendment to the Delta Air Lines, Inc. Officer and Director Severance Plan, as amended and restated as of January 2, 2009, asfurther amended October 20, 2009 (Filed as Exhibit 10.11(b) to Delta's Annual Report on Form 10-K for the year endedDecember 31, 2009).*
10.13 Description of Certain Benefits of Members of the Board of Directors and Executive Officers (Filed as Exhibit 10.2 to Delta'sQuarterly Report on Form 10-Q for the quarter ended June 30, 2011).*
10.14(a) Delta Air Lines, Inc. 2011 Long Term Incentive Program (Filed as Exhibit 10.10(a) to Delta's Annual Report on Form 10-K forthe year ended December 31, 2010).*
10.14(b) Model Award Agreement for the Delta Air Lines, Inc. 2011 Long Term Incentive Program (Filed as Exhibit 10.10(b) to Delta'sAnnual Report on Form 10-K for the year ended December 31, 2010).*
10.15 Delta Air Lines, Inc. 2012 Long Term Incentive Program.
10.16 Delta Air Lines, Inc. 2011 Management Incentive Plan (Filed as Exhibit 10.11 to Delta's Annual Report on Form 10-K for theyear ended December 31, 2010).*
10.17 Delta Air Lines, Inc. 2012 Management Incentive Plan.
10.18(a) Delta Air Lines, Inc. Merger Award Program (Filed as Exhibit 10.20(a) to Delta's Annual Report on Form 10-K for the yearended December 31, 2008).*
Copyright © 2013 www.secdatabase.com. All Rights Reserved.Please Consider the Environment Before Printing This Document

10.18(b) Model Award Agreement for Delta Air Lines, Inc. Merger Award Program (Filed as Exhibit 10.20(b) to Delta's Annual Reporton Form 10-K for the year ended December 31, 2008).*
92
Copyright © 2013 www.secdatabase.com. All Rights Reserved.Please Consider the Environment Before Printing This Document
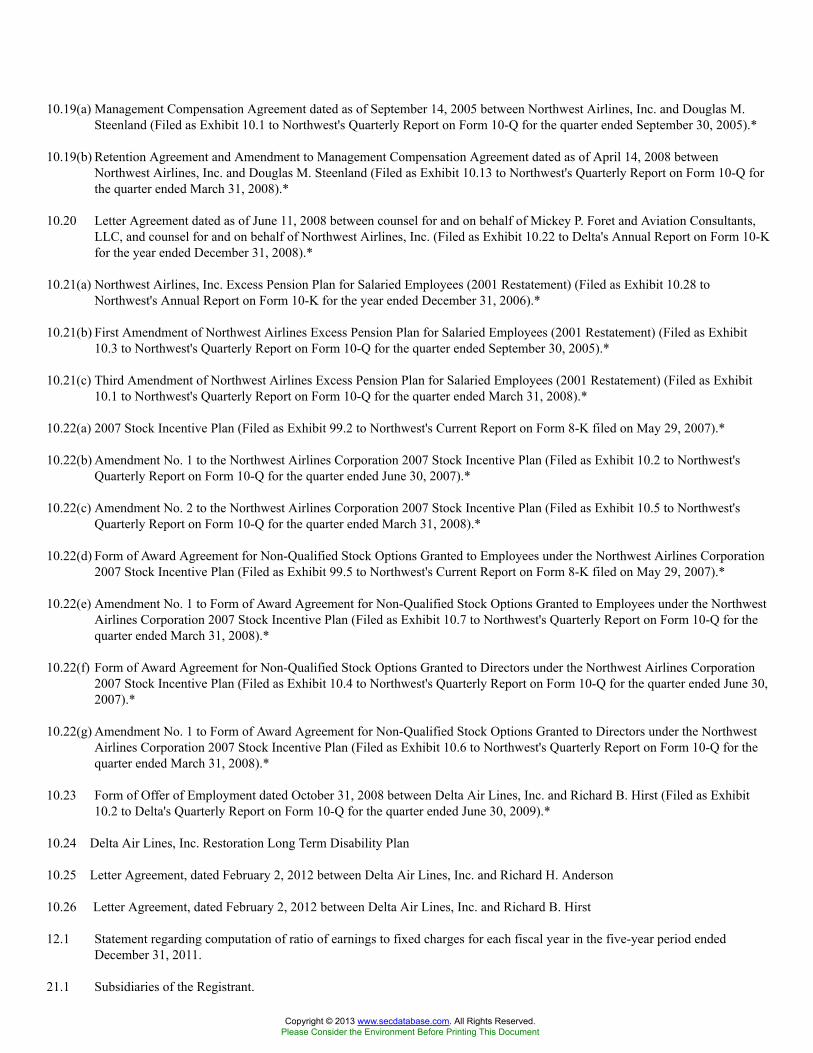
10.19(a) Management Compensation Agreement dated as of September 14, 2005 between Northwest Airlines, Inc. and Douglas M.Steenland (Filed as Exhibit 10.1 to Northwest's Quarterly Report on Form 10-Q for the quarter ended September 30, 2005).*
10.19(b) Retention Agreement and Amendment to Management Compensation Agreement dated as of April 14, 2008 betweenNorthwest Airlines, Inc. and Douglas M. Steenland (Filed as Exhibit 10.13 to Northwest's Quarterly Report on Form 10-Q forthe quarter ended March 31, 2008).*
10.20 Letter Agreement dated as of June 11, 2008 between counsel for and on behalf of Mickey P. Foret and Aviation Consultants,LLC, and counsel for and on behalf of Northwest Airlines, Inc. (Filed as Exhibit 10.22 to Delta's Annual Report on Form 10-Kfor the year ended December 31, 2008).*
10.21(a) Northwest Airlines, Inc. Excess Pension Plan for Salaried Employees (2001 Restatement) (Filed as Exhibit 10.28 toNorthwest's Annual Report on Form 10-K for the year ended December 31, 2006).*
10.21(b) First Amendment of Northwest Airlines Excess Pension Plan for Salaried Employees (2001 Restatement) (Filed as Exhibit10.3 to Northwest's Quarterly Report on Form 10-Q for the quarter ended September 30, 2005).*
10.21(c) Third Amendment of Northwest Airlines Excess Pension Plan for Salaried Employees (2001 Restatement) (Filed as Exhibit10.1 to Northwest's Quarterly Report on Form 10-Q for the quarter ended March 31, 2008).*
10.22(a) 2007 Stock Incentive Plan (Filed as Exhibit 99.2 to Northwest's Current Report on Form 8-K filed on May 29, 2007).*
10.22(b) Amendment No. 1 to the Northwest Airlines Corporation 2007 Stock Incentive Plan (Filed as Exhibit 10.2 to Northwest'sQuarterly Report on Form 10-Q for the quarter ended June 30, 2007).*
10.22(c) Amendment No. 2 to the Northwest Airlines Corporation 2007 Stock Incentive Plan (Filed as Exhibit 10.5 to Northwest'sQuarterly Report on Form 10-Q for the quarter ended March 31, 2008).*
10.22(d) Form of Award Agreement for Non-Qualified Stock Options Granted to Employees under the Northwest Airlines Corporation2007 Stock Incentive Plan (Filed as Exhibit 99.5 to Northwest's Current Report on Form 8-K filed on May 29, 2007).*
10.22(e) Amendment No. 1 to Form of Award Agreement for Non-Qualified Stock Options Granted to Employees under the NorthwestAirlines Corporation 2007 Stock Incentive Plan (Filed as Exhibit 10.7 to Northwest's Quarterly Report on Form 10-Q for thequarter ended March 31, 2008).*
10.22(f) Form of Award Agreement for Non-Qualified Stock Options Granted to Directors under the Northwest Airlines Corporation2007 Stock Incentive Plan (Filed as Exhibit 10.4 to Northwest's Quarterly Report on Form 10-Q for the quarter ended June 30,2007).*
10.22(g) Amendment No. 1 to Form of Award Agreement for Non-Qualified Stock Options Granted to Directors under the NorthwestAirlines Corporation 2007 Stock Incentive Plan (Filed as Exhibit 10.6 to Northwest's Quarterly Report on Form 10-Q for thequarter ended March 31, 2008).*
10.23 Form of Offer of Employment dated October 31, 2008 between Delta Air Lines, Inc. and Richard B. Hirst (Filed as Exhibit10.2 to Delta's Quarterly Report on Form 10-Q for the quarter ended June 30, 2009).*
10.24 Delta Air Lines, Inc. Restoration Long Term Disability Plan
10.25 Letter Agreement, dated February 2, 2012 between Delta Air Lines, Inc. and Richard H. Anderson
10.26 Letter Agreement, dated February 2, 2012 between Delta Air Lines, Inc. and Richard B. Hirst
12.1 Statement regarding computation of ratio of earnings to fixed charges for each fiscal year in the five-year period endedDecember 31, 2011.
21.1 Subsidiaries of the Registrant.
Copyright © 2013 www.secdatabase.com. All Rights Reserved.Please Consider the Environment Before Printing This Document

93
Copyright © 2013 www.secdatabase.com. All Rights Reserved.Please Consider the Environment Before Printing This Document
23.1 Consent of Ernst & Young LLP.
31.1 Rule 13a-14(a)/15d-14(a) Certification of Chief Executive Officer.
31.2 Rule 13a-14(a)/15d-14(a) Certification of Chief Financial Officer.
32 Certification pursuant to 18 U.S.C. Section 1350, as adopted pursuant to Section 906 of the Sarbanes-Oxley Act 2002.
____________* Incorporated by reference.** Portions of this exhibit have been omitted and filed separately with the Securities and Exchange Commission pursuant to requests
for confidential treatment.
94
Copyright © 2013 www.secdatabase.com. All Rights Reserved.Please Consider the Environment Before Printing This Document
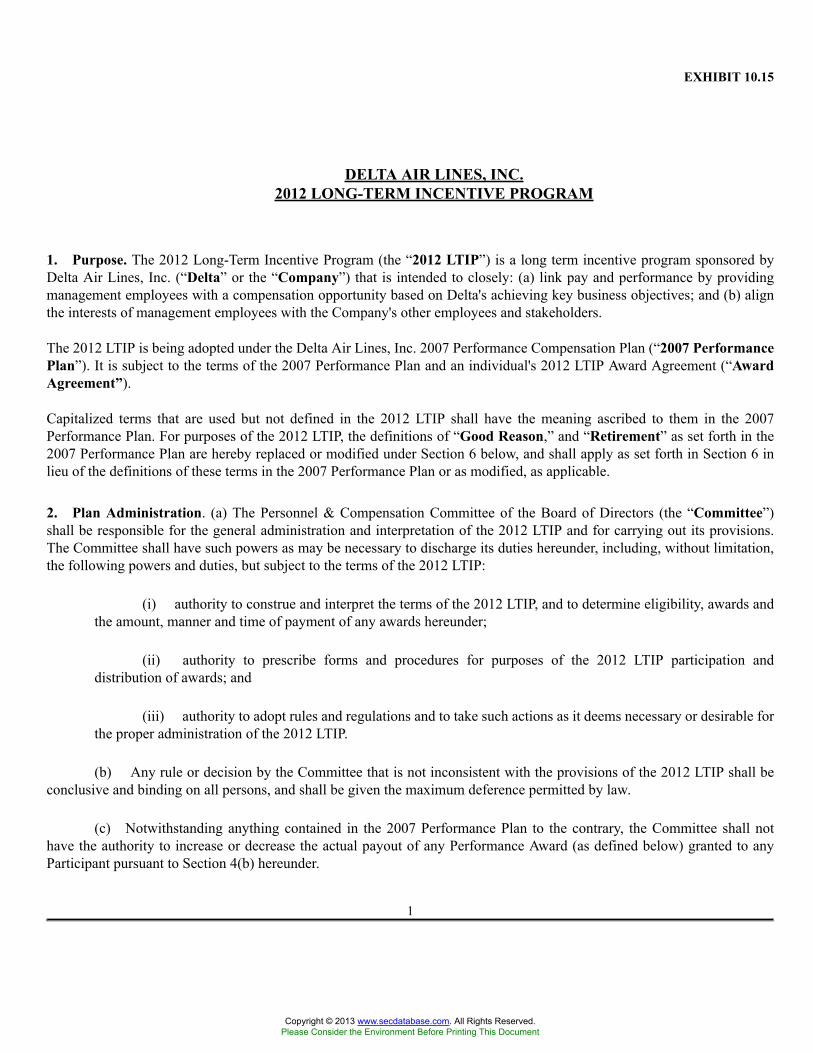
EXHIBIT 10.15
DELTA AIR LINES, INC.2012 LONG-TERM INCENTIVE PROGRAM
1. Purpose. The 2012 Long-Term Incentive Program (the “2012 LTIP”) is a long term incentive program sponsored byDelta Air Lines, Inc. (“Delta” or the “Company”) that is intended to closely: (a) link pay and performance by providingmanagement employees with a compensation opportunity based on Delta's achieving key business objectives; and (b) alignthe interests of management employees with the Company's other employees and stakeholders.
The 2012 LTIP is being adopted under the Delta Air Lines, Inc. 2007 Performance Compensation Plan (“2007 PerformancePlan”). It is subject to the terms of the 2007 Performance Plan and an individual's 2012 LTIP Award Agreement (“AwardAgreement”).
Capitalized terms that are used but not defined in the 2012 LTIP shall have the meaning ascribed to them in the 2007Performance Plan. For purposes of the 2012 LTIP, the definitions of “Good Reason,” and “Retirement” as set forth in the2007 Performance Plan are hereby replaced or modified under Section 6 below, and shall apply as set forth in Section 6 inlieu of the definitions of these terms in the 2007 Performance Plan or as modified, as applicable.
2. Plan Administration. (a) The Personnel & Compensation Committee of the Board of Directors (the “Committee”)shall be responsible for the general administration and interpretation of the 2012 LTIP and for carrying out its provisions.The Committee shall have such powers as may be necessary to discharge its duties hereunder, including, without limitation,the following powers and duties, but subject to the terms of the 2012 LTIP:
(i) authority to construe and interpret the terms of the 2012 LTIP, and to determine eligibility, awards andthe amount, manner and time of payment of any awards hereunder;
(ii) authority to prescribe forms and procedures for purposes of the 2012 LTIP participation anddistribution of awards; and
(iii) authority to adopt rules and regulations and to take such actions as it deems necessary or desirable forthe proper administration of the 2012 LTIP.
(b) Any rule or decision by the Committee that is not inconsistent with the provisions of the 2012 LTIP shall beconclusive and binding on all persons, and shall be given the maximum deference permitted by law.
(c) Notwithstanding anything contained in the 2007 Performance Plan to the contrary, the Committee shall nothave the authority to increase or decrease the actual payout of any Performance Award (as defined below) granted to anyParticipant pursuant to Section 4(b) hereunder.
1
Copyright © 2013 www.secdatabase.com. All Rights Reserved.Please Consider the Environment Before Printing This Document
3. Individual Award Agreements. Any person offered an Award under the 2012 LTIP will be required to sign anindividual Award Agreement. Execution by such person of his or her Award Agreement will be a prerequisite to theeffectiveness of the Award under the 2012 LTIP and to the person's becoming a Participant in the 2012 LTIP.
4. Awards.
(a) Restricted Stock.
(i) Award Grant. A Participant may receive Restricted Stock as specified in the Participant's AwardAgreement (the “Restricted Stock”).
(ii) Grant Date. The Grant Date of the Restricted Stock will be determined by the Committee inaccordance with the Company's Equity Award Grant Policy, as in effect from time to time, and set forth in aParticipant's Award Agreement.
(iii) Restrictions. Until the restrictions imposed by this Section 4(a) (the “Restrictions”) have lapsedpursuant to Section 4(a)(iv), (v) or (vi) below, a Participant will not be permitted to sell, exchange, assign, transfer,pledge or otherwise dispose of the Restricted Stock and the Restricted Stock will be subject to forfeiture as set forthbelow.
(iv) Lapse of Restrictions-Continued Employment. Subject to the terms of the 2007 Performance Plan andthe 2012 LTIP, the Restrictions shall lapse and be of no further force or effect with respect to one-half of the Sharesof Restricted Stock on February 1, 2013 (“First Installment Date”) and the remaining one-half on February 1, 2014(“Second Installment Date”).1
(v) Lapse of Restrictions/Forfeiture upon Termination of Employment. The Restricted Stock and theRestrictions set forth in this Section 4(a) are subject to the following terms and conditions:
(A) Without Cause or For Good Reason. Upon a Participant's Termination of Employment by theCompany without Cause or by the Participant for Good Reason (including the Termination of Employmentof the Participant if he is employed by an Affiliate at the time the Company sells or otherwise divests itself ofsuch Affiliate), with respect to any portion of the Restricted Stock subject to the Restrictions, the Restrictionsshall immediately lapse on the Pro Rata RS Portion as of the date of such Termination of Employment. Upona Participant's Termination of Employment by the Company without Cause or by the Participant for GoodReason, any Restricted Stock that remains subject to the Restrictions, other than the Pro Rata RS Portion,shall be immediately forfeited.
“Pro Rata RS Portion” means, with respect to any portion of Restricted Stock that is subject to theRestrictions at the time of a Participant's Termination of Employment, the number of Shares with respect towhich the Restrictions would have lapsed on each future Installment Date multiplied by a fraction (i) thenumerator of which is the number
_________________________________1 If this formula results in any fractional Share allocation to any Installment Date, the number of Shares with respect to which the Restrictions lapse onthe First Installment Date will be rounded up, and the number of shares with respect to which the Restrictions lapse on the Second Installment Date willbe rounded down, to the nearest whole Share so that only full Shares are covered by each Installment Date.
2
Copyright © 2013 www.secdatabase.com. All Rights Reserved.Please Consider the Environment Before Printing This Document
of calendar months2 from the Grant Date to the date of such Termination of Employment, rounded up forany partial month and (ii) the denominator of which is twelve (12) for the First Installment Date andtwenty-four (24) for the Second Installment Date.3
(B) Voluntary Resignation. Upon a Participant's Termination of Employment by reason of avoluntary resignation (other than for Good Reason or Retirement), any portion of the Restricted Stocksubject to the Restrictions shall be immediately forfeited.
(C) Retirement. Subject to Section 4(a)(v)(F) below, upon a Participant's Termination ofEmployment by reason of Retirement, with respect to any portion of the Restricted Stock subject to theRestrictions, the Restrictions shall immediately lapse on the Pro Rata RS Portion as of the date of suchTermination of Employment. Pro Rata RS Portion has the meaning set forth in Section 4(a)(v)(A) above.Upon a Participant's Termination of Employment by reason of Retirement, any Restricted Stock that remainssubject to the Restrictions, other than the Pro Rata RS Portion, shall be immediately forfeited.
(D) Death or Disability. Upon a Participant's Termination of Employment due to death orDisability, the Restrictions shall immediately lapse and be of no further force or effect as of the date of suchTermination of Employment.
(E) For Cause. Upon a Participant's Termination of Employment by the Company for Cause, anyportion of the Restricted Stock subject to the Restrictions shall be immediately forfeited.
(F) Retirement-Eligible Participants Who Incur a Termination of Employment for Other Reasons.If a Participant who is eligible for Retirement is, or would be, terminated by the Company without Cause,such Participant shall be considered to have been terminated by the Company without Cause for purposes ofthe 2012 LTIP rather than having retired, but only if the Participant acknowledges that, absent Retirement,the Participant would have been terminated by the Company without Cause. If, however, the employmentof a Participant who is eligible for Retirement is terminated by the Company for Cause, then regardless ofwhether the Participant is considered as a retiree for purposes of any other program, plan or policy of theCompany, for purposes of the 2012 LTIP, the Participant's employment shall be considered to have beenterminated by the Company for Cause.
(vi) Change in Control. Notwithstanding the forgoing and subject to Section 5 below, upon a Participant'sTermination of Employment by the Company without Cause or by the Participant for Good Reason (including theTermination of Employment of the Participant if he is employed by an Affiliate at the time the Company sells orotherwise divests itself of such Affiliate) on or after a Change in Control but prior to the second anniversary of suchChange in Control, any Restrictions in effect shall immediately lapse on the date of such Termination of Employmentand be of no further force or effect as of such date.
(vii) Dividends. In the event a cash dividend shall be paid with respect to Shares at a time the Restrictionson the Restricted Stock have not lapsed, the Participant shall be eligible to receive the dividend upon the lapse of theRestrictions. The Restrictions shall apply to any such dividend.
_________________________________2 For purposes of the 2012 LTIP, one calendar month is calculated from the date of measurement to the same or closest numerical date occurringduring the following month. For example, one calendar month from January 31, 2012 will elapse as of February 29, 2012, two months will elapse onMarch 31, 2012, and so on.
3 If this formula results in any fractional Share, the Pro Rata RS Portion will be rounded up to the nearest whole Share.
3
Copyright © 2013 www.secdatabase.com. All Rights Reserved.Please Consider the Environment Before Printing This Document
(b) Performance Awards.
(i) Award Grant. A Participant may receive a Performance Award for a specified target cash amount asset forth in the Participant's Award Agreement (a “Performance Award”).
(ii) Grant Date. The Grant Date of the Performance Award will be determined by the Committee and setforth in the Participant's Award Agreement.
(iii) Payout Criteria and Form of Payment. Except as otherwise expressly set forth in this Section 4(b),payment, if any, of a Performance Award will be based on the following factors as described and defined below:(A) the Average Annual Operating Income Margin during the Performance Period of the Company relative to theComposite Performance of the members of the Industry Composite Group; (B) Customer Service Performanceduring the Performance Period of the Company; and (C) Return on Invested Capital during the Performance Periodof the Company.
The payout, if any, of a Performance Award will be made (A) in Shares, calculated based on the ConversionFormula (as defined below), to each Participant who is employed by the Company as an executive vice president ormore senior officer or holds the position of general counsel or chief financial officer of the Company (“ExecutiveOfficer Participant”) at the time of such payout; and (B) in cash in all other circumstances.
(iv) Definitions.
(A) In General.
(1) “Composite Performance” means, for purposes of determining the total Average AnnualOperating Income Margin of the Industry Composite Group, the result obtained by treatingthe members of the Industry Composite Group as if they were one combined entity.
(2) The “Conversion Formula” will apply to convert from cash to Shares the payout, if any,of a Performance Award to a person who is an Executive Officer Participant at the time ofsuch payout. First, the cash amount of the payout is calculated in the same manner as if thepayout is being made in cash. Next, the cash amount is converted into a number of Sharesbased on the following formula: A ÷ B, where:
A = the amount of the payout for the Performance Award if it is paid in cash; and
B = the closing price of a Share on the New York Stock Exchange on the later of(1) date that the Committee approves the payouts, if any, of the Performance Awards to theExecutive Officer Participants following the Committee's determination of the achievementof the payout criteria described in Section 4(b)(iii) and (2) the third business day followingthe date on which the Company publicly announces its annual financial results if this date isscheduled in the same month that the Committee approves such payouts, if any.
(3) “GAAP” means accounting principles generally accepted in the United States of America.
(4) “Industry Composite Group” means Alaska Air Group, Inc., AMR
4
Copyright © 2013 www.secdatabase.com. All Rights Reserved.Please Consider the Environment Before Printing This Document
Corporation, JetBlue Airways Corporation, Southwest Airlines Co., United ContinentalHoldings, Inc., and US Airways Group, Inc.
(5) “Performance Period” means the period beginning on January 1, 2012 and ending on andincluding December 31, 2013.
(B) Average Annual Operating Income Margin.
(1) The “Average Annual Operating Income Margin” for Delta and each member of theIndustry Composite Group shall be calculated by using the subject company's OperatingIncome and Total Operating Revenue for the applicable periods and the following formula:(A ÷ B ), where:
A = Operating Income for 2012 and 2013; and
B = Total Operating Revenue for 2012 and 2013.
(2) “Operating Income” means, subject to Section 4(b)(v)(B) below, the subject company'sconsolidated operating income for the applicable periods based on its regularly preparedand publicly available statements of operations prepared in accordance with GAAP, butexcluding: (i) any material asset write downs; (ii) gains or losses with respect to unusualor non-recurring events, including, without limitation, changes in accounting principles,bankruptcy-related reorganization items, restructuring charges, merger-related costs,extinguishment of debt and other out of period adjustments; and (iii) expenses accrued withrespect to any annual broad-based employee profit sharing plan, program or arrangement.
(3) “Total Operating Revenue” means, subject to Section 4(b)(v)(B) below, the subjectcompany's total operating revenue for the applicable periods based on its regularly preparedand publicly available statements of operations prepared in accordance with GAAP.
(C) Customer Service Performance.
(1) The “Customer Service Performance” for Delta shall be measured based on thepercentage point improvement in Delta's average monthly Net Promoter Score (“NPS”)from the 2011 calendar year to the average monthly NPS over the Performance Period,with (A) Delta's NPS performance attributable to domestic travel accounting for 60% ofthe measure and (ii) Delta's NPS performance attributable to international travel accountingfor 40% of the measure. The criteria and methodology used to determine Delta's NPS isdescribed in a document titled, “'Net Promoter': Measuring Customer Satisfaction at Delta,”which was previously reviewed by the Committee. Company management will periodicallyreport to the Company's Board of Directors regarding Delta's NPS.
(D) Return on Invested Capital.
(1) The “Return on Invested Capital” for Delta shall be calculated by using Delta's AverageOperating Income and Average Invested Capital for the applicable periods and the followingformula, (A÷B), where:
5
Copyright © 2013 www.secdatabase.com. All Rights Reserved.Please Consider the Environment Before Printing This Document
A = Average Operating Income for 2012 and 2013; and
B = Average Invested Capital for 2012 and 2013.
(2) “Average Operating Income” means, subject to Section 4(b)(v)(B) below, Delta's averageannual Total Operating Income over the Performance Period.
(3) “Total Operating Income” means, subject to Section 4(b)(v)(B) below, Delta'sconsolidated operating income for the applicable periods based on its regularly preparedand publicly available statements of operations prepared in accordance with GAAP, butexcluding: (i) any material asset write downs; and (ii) gains or losses with respect to unusualor non-recurring events, including, without limitation, changes in accounting principles,bankruptcy-related reorganization items, restructuring charges, merger-related costs,extinguishment of debt and other out of period adjustments.
(4) “Average Invested Capital” means, subject to Section 4(b)(v)(B) below, Delta's totalinvested capital averaged monthly over the Performance Period, and shall be calculatedusing the following formula, (A+B), where:
A = Market Value of Equity; and
B = Adjusted Net Debt.
(5) “Market Value of Equity” means the total number of Shares of Common Stock outstandingon December 30, 2011 multiplied by $8.09 (the closing price of a Share of CommonStock on the New York Stock Exchange on that date), which value shall remain constantduring the Performance Period; provided, however, in the event that the Company issuesor repurchases additional Common Stock for cash during the Performance Period (butexcluding the exercise of any employee stock option for cash), the Market Value of Equityshall be adjusted to include the gross cash proceeds of the equity issuance or exclude thegross cash payments for the equity repurchase, before adjustment for any applicable fees orcharges associated therewith.
(6) “Adjusted Net Debt” for Delta shall be calculated monthly based on its regularly preparedinternal financial statements using the following formula (A+B-C), subject to Section4(b)(v)(B), where:
A = Total gross long term debt and capital leases (including current maturities) thatreflects Delta's actual obligations to lenders or lessors, including any adjustments from thebook value to reflect premiums or discounts that may be amortizing;
B = Annual aircraft rent expense multiplied by seven (7); and
C = Unrestricted cash, cash equivalents and short-term investments.
(v) Vesting.
(A) General. Subject to the terms of the 2007 Performance Plan and all other conditions includedin any applicable Award Agreement, the Performance Award shall vest, as described in this Section 4(b)(v),as of the end of the Performance Period to the extent
6
Copyright © 2013 www.secdatabase.com. All Rights Reserved.Please Consider the Environment Before Printing This Document
that the Company's actual performance results meet or exceed Threshold level with respect to AverageAnnual Operating Income Margin Customer Service Performance and/or Return on Invested Capital, asapplicable and as described below. For purposes of Average Annual Operating Income Margin, theCompany's performance is compared against the Composite Performance of the Industry Composite Group.
(B) Committee's Authority. In determining the Average Annual Operating Income Margin forDelta and each member of the Industry Composite Group and the Return on Invested Capital for Delta, theCommittee shall make such adjustments with respect to any subject company as is necessary to ensure theresults are comparable, including, without limitation, differences in accounting policies (for example, fuelhedging, purchase accounting adjustments associated with mergers, acquisitions or divestures, fresh startaccounting as a result of emergence from bankruptcy). Without limiting the generality of the forgoing, theCommittee shall (i) make such determinations based on financial data filed by the subject company with theU.S. Department of Transportation or otherwise, and (ii) exclude from any calculation any item of gain, lossor expense to be extraordinary or unusual in nature or infrequent in occurrence.
(C) Impact of Certain Events. A company shall be automatically removed from the IndustryComposite Group in the event that any of the following occur during or with respect to the PerformancePeriod: (i) such company ceases to maintain or does not timely prepare publicly available statements ofoperations prepared in accordance with GAAP; (ii) such company is not the surviving entity in any merger,consolidation, or other non-bankruptcy reorganization (or survives only as a subsidiary of an entity otherthan a previously wholly owned subsidiary of such company); (iii) such company sells, leases, or exchangesall or substantially all of its assets to any other person or entity (other than a previously wholly ownedsubsidiary of such company); (iv) such company is dissolved and liquidated; or (v) more than 20% ofsuch company's revenues (determined on a consolidated basis based on the regularly prepared and publiclyavailable statements of operations of such company prepared in accordance with GAAP) for any fiscal yearof such company are attributable to the operation of businesses other than such company's airline businessand such company does not provide publicly available statements of operations with respect to its airlinebusiness that are separate from the statements of operations provided with respect to its other businesses.
(D) Transactions Between Airlines. To the extent reasonably practicable, in the event of a merger,consolidation or similar transaction during the Performance Period between Delta and any other airline,including a member of the Industry Composite Group, or between any member of the Industry CompositeGroup and any other airline, including another member of the Industry Composite Group (an “AirlineMerger”), Average Annual Operating Income Margin for such company will be calculated on a combinedbasis as if the Airline Merger had occurred on January 1, 2012.
(E) Vesting/Performance Measures. The payment, if any, a Participant will receive in connectionwith the vesting of the Performance Award will be based on the following:
7
Copyright © 2013 www.secdatabase.com. All Rights Reserved.Please Consider the Environment Before Printing This Document
Average Annual OperatingIncome Margin +
Customer ServicePerformance--Domestic +
Customer ServicePerformance--International + Return on Invested Capital
PerformanceMeasure
% ofTargetEarned
xWeight
PerformanceMeasure
% ofTargetEarned
xWeight
PerformanceMeasure
% ofTargetEarned
xWeight
PerformanceMeasure
% ofTargetEarned
xWeight
Maximum
33.0% aboveComposite
Performance200%x50% Maximum
+3% pointsor higher
200%x15% Maximum
+3% pointsor higher
200%x10% Maximum
10.0% orhigher
200%x25%
TargetComposite
Performance100%x50% Target
+1.50%points
100%x15% Target
+1.50%points
100%x10% Target 0.08
100%x25%
Threshold
33.0% belowComposite
Performance50%
x 50% Threshold +0% points50%
x 15% Threshold +0% points50%x 10% Threshold 0.06
50%x 25%
Any portion of a Performance Award that does not vest at the end of the Performance Period will immediately lapse andbecome void. Payouts based on the above performance measures will be straight-line interpolated when actual performanceresults fall above Threshold and below Target or above Target and below Maximum.
(vi) Timing of Payment. The payout, if any, of any Performance Awards that vest under Section 4(b)(v)will be made as soon after the end of the Performance Period as the payment amount can be finally determined, but inno event later than March 15, 2014, unless it is administratively impracticable to do so, and such impracticability wasnot foreseeable at the end of 2013, in which case such payment shall be made as soon as administratively practicableafter March 15, 2014.
(vii) Accelerated Vesting/Forfeiture upon Termination of Employment. The Performance Awards aresubject to the following terms and conditions.
(A) Without Cause or For Good Reason. Upon a Participant's Termination of Employment by theCompany without Cause or by the Participant for Good Reason (including the Termination of Employmentof the Participant if he is employed by an Affiliate at the time the Company sells or otherwise divests itselfof such Affiliate), the Participant's target Performance Award will be recalculated and will be the result ofthe following formula (the “Adjusted Performance Award”): S × (T ÷ 24) where,
S = the Participant's target Performance Award as of the Grant Date; and
T = the number of calendar months from January 1, 2012 to the date of such Termination of Employment(rounded up for any partial month).
Thereafter, the Participant will be eligible to receive a payment, if any, in cash based on the AdjustedPerformance Award which will vest and become payable under Section 4(b)(v) in the same manner and tothe same extent as if the Participant's employment had continued.
(B) Voluntary Resignation. Upon a Participant's Termination of Employment by reason of avoluntary resignation (other than for Good Reason or Retirement) prior to the end of the workday onDecember 31, 2013, the Participant will immediately forfeit any unpaid portion of the Performance Awardas of the date of such Termination of Employment. In the event that a Participant incurs a Terminationof Employment by reason of a voluntary resignation (other than for Good Reason or Retirement) on orafter January 1, 2014, the Participant will remain eligible for any unpaid Performance Award, which awardwill vest and become payable under Section 4(b)(v) in the same manner and to the same extent as if theParticipant's employment had continued.
(C) Retirement. Subject to Section 4(b)(vii)(F) below, upon a Participant's
Copyright © 2013 www.secdatabase.com. All Rights Reserved.Please Consider the Environment Before Printing This Document

8
Copyright © 2013 www.secdatabase.com. All Rights Reserved.Please Consider the Environment Before Printing This Document
Termination of Employment due to Retirement, the Participant's target Performance Award will berecalculated in accordance with the formula set forth in Section 4(b)(vii)(A) above. Thereafter, theParticipant will be eligible to receive a payment, if any, in cash based on the Adjusted Performance Awardwhich will vest and become payable under Section 4(b)(v) in the same manner and to the same extent as ifthe Participant's employment had continued.
(D) Death or Disability. Upon a Participant's Termination of Employment due to death orDisability, the Participant's Performance Award will immediately become vested at the target level and suchamount will be paid in cash as soon as practicable thereafter to the Participant or the Participant's estate, asapplicable.
(E) For Cause. Upon a Participant's Termination of Employment by the Company for Cause, theParticipant will immediately forfeit any unpaid portion of the Performance Award as of the date of suchTermination of Employment.
(F) Retirement-Eligible Participants Who Incur a Termination of Employment for Other Reasons.If a Participant who is eligible for Retirement is, or would be, terminated by the Company without Cause,such Participant shall be considered to have been terminated by the Company without Cause for purposes ofthe 2012 LTIP rather than having retired, but only if the Participant acknowledges that, absent Retirement,the Participant would have been terminated by the Company without Cause. If, however, the employmentof a Participant who is eligible for Retirement is terminated by the Company for Cause, then regardless ofwhether the Participant is considered as a retiree for purposes of any other program, plan or policy of theCompany, for purposes of the 2012 LTIP, the Participant's employment shall be considered to have beenterminated by the Company for Cause.
(viii) Change in Control. Notwithstanding the forgoing and subject to Section 5 below, upon a Participant'sTermination of Employment by the Company without Cause or by the Participant for Good Reason (including theTermination of Employment of the Participant if he is employed by an Affiliate at the time the Company sells orotherwise divests itself of such Affiliate) on or after a Change in Control but prior to the second anniversary of suchChange in Control, the Participant's outstanding Performance Award shall immediately become vested at the targetlevel and such amount will be paid in cash to the Participant as soon as practicable. With respect to any Participantwho incurs a Termination of Employment by the Company without Cause or who resigns for Good Reason priorto a Change in Control, if a Change in Control occurs thereafter during the Performance Period, such Participant'sAdjusted Performance Award will immediately become vested and be paid in cash to the Participant as soon aspracticable.
(c) Restricted Stock Units
(i) Award Grant. A Participant may receive Restricted Stock Units as specified in the Participant's AwardAgreement (the “RSU”).
(ii) Grant Date. The Grant Date of the RSUs will be determined in accordance with the Company's EquityAward Grant Policy, as in effect from time to time, and set forth in the Participant's Award Agreement.
(iii) Risk of Forfeiture. Until an RSU becomes vested, a Participant will not be permitted to sell, exchange,assign, transfer, pledge or otherwise dispose of the RSU and the RSU will be subject to forfeiture as set forth below.
(iv) Vesting. Subject to the terms of 2007 Performance Plan and the 2012 LTIP, the
9
Copyright © 2013 www.secdatabase.com. All Rights Reserved.Please Consider the Environment Before Printing This Document
RSUs will vest with respect to one-half of the RSUs on February 1, 2013 (“First RSU Installment”) and theremaining one-half on February 1, 2014 (“Second RSU Installment”).4 As soon as practicable after any RSUsbecome vested, the Company shall pay to Participant in cash a lump sum amount equal to the number of RSUsvesting multiplied by the closing price of a Share of Common Stock on the NYSE on the vesting date or, if theCommon Stock was not traded on the NYSE on the vesting date, the last date prior to the vesting date that theCommon Stock was traded on the NYSE.
(v) Accelerated Vesting; Forfeiture. The RSUs and the vesting provisions set forth in this Section 4(c) aresubject to the following terms and conditions:
(A) Without Cause or For Good Reason. Upon a Participant's Termination of Employment by theCompany without Cause or by the Participant for Good Reason (including the Termination of Employmentof the Participant if he is employed by an Affiliate at the time the Company sells or otherwise divests itselfof such Affiliate), a number of RSUs equal to the Pro Rata RSU Portion will become immediately vested asof the date of such termination. Upon a Participant's Termination of Employment by the Company withoutCause or by the Participant for Good Reason, any unvested RSUs, other than the Pro Rata RSU Portion,shall be immediately forfeited.
“Pro Rata RSU Portion” means, with respect to any RSU Installment that is not vested at thetime of a Participant's Termination of Employment, the number of RSUs covered by such RSU Installmentmultiplied by a fraction (i) the numerator of which is the number of calendar months5 from the Grant Dateto the date of such Termination of Employment, rounded up for any partial month and (ii) the denominatorof which is twelve (12) for the First RSU Installment and twenty-four (24) for the Second RSU Installment.6
(B) Voluntary Resignation. Upon a Participant's Termination of Employment by reason of avoluntary resignation (other than for Good Reason or Retirement), any unvested portion of the RSUs shallbe immediately forfeited.
(C) Retirement. Subject to Section (4)(c)(v)(F) below, upon a Participant's Termination ofEmployment by reason of Retirement, with respect to any RSU Installment that is not then vested, anumber of RSUs equal to the Pro Rata RSU Portion will become immediately vested as of the date of suchTermination of Employment. Pro Rata RSU Portion has the meaning set forth in Section 4(c)(v)(A) above.Upon a Participant's Termination of Employment by reason of Retirement, any unvested RSUs, other thanthe Pro Rata RSU Portion, shall be immediately forfeited.
(D) Death or Disability. Upon a Participant's Termination of Employment due to death orDisability, all unvested RSUs will immediately vest as of the date of such Termination of Employment.
________________________________4 If this formula results in any fractional RSU allocation to any RSU Installment, the number of RSUs in the First RSU Installment will be roundedup, and the number of RSUs in the Second RSU Installment will be rounded down, to the nearest whole RSU, so that only full RSUs are covered byeach Installment.
5 For purposes of this Agreement, one calendar month is calculated from the date of measurement to the same or closest numerical date occurringduring the following month. For example, one calendar month from January 31, 2012 will elapse as of February 29, 2012, two months will elapse onMarch 31, 2012, as so on.
6 If this formula results in any fractional RSUs, the Pro Rata RSU Portion will be rounded up to the nearest whole RSU.
10
Copyright © 2013 www.secdatabase.com. All Rights Reserved.Please Consider the Environment Before Printing This Document
(E) For Cause. Upon a Participant's Termination of Employment by the Company for Cause, anyunvested portion of the RSUs shall be immediately forfeited.
(F) Retirement-Eligible Participants Who Incur a Termination of Employment for Other Reasons.If a Participant who is eligible for Retirement, is, or would be, terminated by the Company without Cause,such participant shall be considered to have been terminated by the Company without Cause for purposes ofthis Agreement rather than having retired, but only if the Participant acknowledges, that absent Retirement,the Participant would have been terminated by the Company without Cause. If, however, the employmentof a Participant who is eligible for Retirement is terminated by the Company for Cause, then regardlessof whether the Participant is considered a retiree for purposes of any other program, plan or policy of theCompany, for purposes of this Agreement, the Participant's employment shall be considered to have beenterminated by the Company for Cause.
(vi) Change in Control. Notwithstanding the foregoing and subject to Section 5 below, upon a Participant'sTermination of Employment by the Company without Cause or by the Participant for Good Reason (including theTermination of Employment of the Participant if he is employed by an Affiliate at the time the Company sells orotherwise divests itself of such Affiliate) on or after a Change in Control, but prior to the second anniversary of suchChange in Control, any unvested portion of the RSUs will immediately vest as of the date of such Termination ofEmployment.
(d) Stock Option
(i) Award Grant. A Participant may receive a Non-Qualified Stock Option covering the number of Sharesas specified in the Participant's Award Agreement (the “Option”).
(ii) Grant Date. The Grant Date of the Option will be determined by the Committee in accordance withthe Company's Equity Award Grant Policy, as in effect from time to time, and set forth in a Participant's AwardAgreement.
(iii) Exercise Price. The exercise price of the Option is the closing price of a Share on the New YorkStock Exchange on the Grant Date.
(iv) Exercise Period. The exercise period of the Option shall be specified in the Participant's AwardAgreement.
(v) Change in Exercisability and Exercise Period upon Termination of Employment. The exercisability ofthe Option and the exercise period set forth in Section 3(d)(iv) is subject to the terms and conditions specified in theParticipant's Award Agreement.
5. Potential Reduction in Payments Due to Excise Tax. In the event that a Participant becomes entitled to benefits underthe 2012 LTIP, then such benefits, together with any payment or consideration in the nature of value or compensation to or forthe Participant's benefit under any other agreement with or plan of Delta, shall be subject to reduction as set forth in Section4(e) of the 2009 Delta Air Lines, Inc. Officer and Director Severance Plan, which relates to the excise tax under Section 4999of the Code.
6. Definitions. For purposes of the 2012 LTIP, the following definitions are hereby modified as set forth below and willapply in lieu of the definitions set forth in the 2007 Performance Plan or as modified, as applicable.
(a) For purposes of the 2012 LTIP, “Good Reason” shall have the meaning set forth in the 2007 PerformancePlan except the following will be ignored for purposes of determining whether a Participant has suffered a reduction thatconstitutes Good Reason under the 2012 LTIP: (i) any long-term award made
11
Copyright © 2013 www.secdatabase.com. All Rights Reserved.Please Consider the Environment Before Printing This Document
to a Participant under the 2007 Performance Plan, (ii) any other equity-based awards or other incentive compensation awardsmade to a Participant by Delta (or any Affiliate or former Affiliate), (iii) any retention payment or special travel benefitsprovided to a Participant as a result of his or her initial employment with Delta or any Affiliate and (iv) the elimination ofpost-retirement coverage under the Company's executive life insurance program.
(b) For purposes of the 2012 LTIP, “Retirement” means a Termination of Employment (other than forCause or death) either: (i) on or after a Participant's 62nd birthday provided that such Participant has completed at least 5years service since his or her most recent hire date with the Company (or an Affiliate or former Affiliate); or (ii) on or aftera Participant's 52nd birthday provided that such Participant has completed at least 10 years service since his or her mostrecent hire date with the Company (or an Affiliate or former Affiliate).
7. Clawback. Notwithstanding anything to the contrary in the 2012 LTIP and subject to further amendment of this Section7 to the extent required to be in compliance with any applicable law or regulations or Delta's internal clawback policy, as itmay be amended from time to time, if the Committee determines that a vice president or more senior officer level Participanthas engaged in fraud or misconduct that caused, in whole or in part, the need for a required restatement of Delta's financialstatements filed with the Securities and Exchange Commission, the Committee will review all incentive compensationawarded to or earned by the Participant, including, without limitation, any Award under the 2012 LTIP, with respect tofiscal periods materially affected by the restatement and may recover from the Participant all such incentive compensationto the extent that the Committee deems appropriate after taking into account the relevant facts and circumstances. Anyrecoupment hereunder may be in addition to any other remedies that may be available to Delta under applicable law,including, disciplinary action up to and including termination of employment.
12
Copyright © 2013 www.secdatabase.com. All Rights Reserved.Please Consider the Environment Before Printing This Document
EXHIBIT 10.17
DELTA AIR LINES, INC.2012 MANAGEMENT INCENTIVE PLAN
1. Purpose. The 2012 Management Incentive Plan (the “MIP”) is an annual incentive program sponsored by Delta AirLines, Inc. (“Delta” or the “Company”) that is intended to closely: (a) link pay and performance by providing managementemployees with a compensation opportunity based on Delta's achieving key business plan goals in 2012; and (b) align theinterests of management employees with the Company's other employees and stakeholders. The MIP is being adopted under,and is subject to the terms of, the Delta Air Lines, Inc. 2007 Performance Compensation Plan (the “2007 Plan”). Capitalizedterms that are used but not defined in the MIP shall have the meaning ascribed to them in the 2007 Plan.
2. Plan Administration. (a) The Personnel & Compensation Committee of the Board of Directors (the “Committee”) shallbe responsible for the general administration and interpretation of the MIP and for carrying out its provisions. The Committeeshall have such powers as may be necessary to discharge its duties hereunder, including, without limitation, the followingpowers and duties, but subject to the terms of the MIP:
(i) authority to construe and interpret the terms of the MIP, and to determine eligibility, awards and theamount, manner and time of payment of any awards hereunder;
(ii) authority to prescribe forms and procedures for purposes of MIP participation and distribution ofawards;
(iii) authority to adopt rules and regulations and to take such actions as it deems necessary or desirable forthe proper administration of the MIP; and
(iv) authority at any time prior to a Change in Control to eliminate or reduce the actual payout to anyParticipant in the MIP.
(b) Any rule or decision by the Committee that is not inconsistent with the provisions of the MIP shall beconclusive and binding on all persons, and shall be given the maximum deference permitted by law.
(c) Notwithstanding anything contained in the 2007 Plan to the contrary, the Committee shall not have the authorityto increase the actual payout to any Participant in the MIP.
3. Eligibility. All Delta employees worldwide who are officers, managing directors (grade 13), directors (grade 12), generalmanagers (grade 11), grade 10 or grade 8 (other than employees who participate in a sales incentive plan) are eligible toparticipate in the MIP (“Participants”).
4. MIP Awards.
(a) General. The MIP award (the “MIP Award”) each Participant receives, if any, will be based on: (i) theParticipant's Target MIP Award, as defined below; (ii) the level of achievement within each applicable performance measure;and (iii) the occurrence of a payout for 2012 under the Company's broad-based employee profit sharing program (the “ProfitSharing Program”), as described below. Certain additional requirements will apply to any Participant who is employed bythe Company as an executive vice president or more senior officer or holds the position of general counsel or chief financialofficer of the Company (“Executive Officer Participant”), as discussed in Section 7(b) below.
Copyright © 2013 www.secdatabase.com. All Rights Reserved.Please Consider the Environment Before Printing This Document
(b) Performance Measures. The performance measures used will be one or more of financial (“FinancialPerformance”), operational (“Operational Performance”), revenue (“Revenue Performance”), leadership effectiveness(“Leadership Effectiveness Performance”) and individual
1
Copyright © 2013 www.secdatabase.com. All Rights Reserved.Please Consider the Environment Before Printing This Document
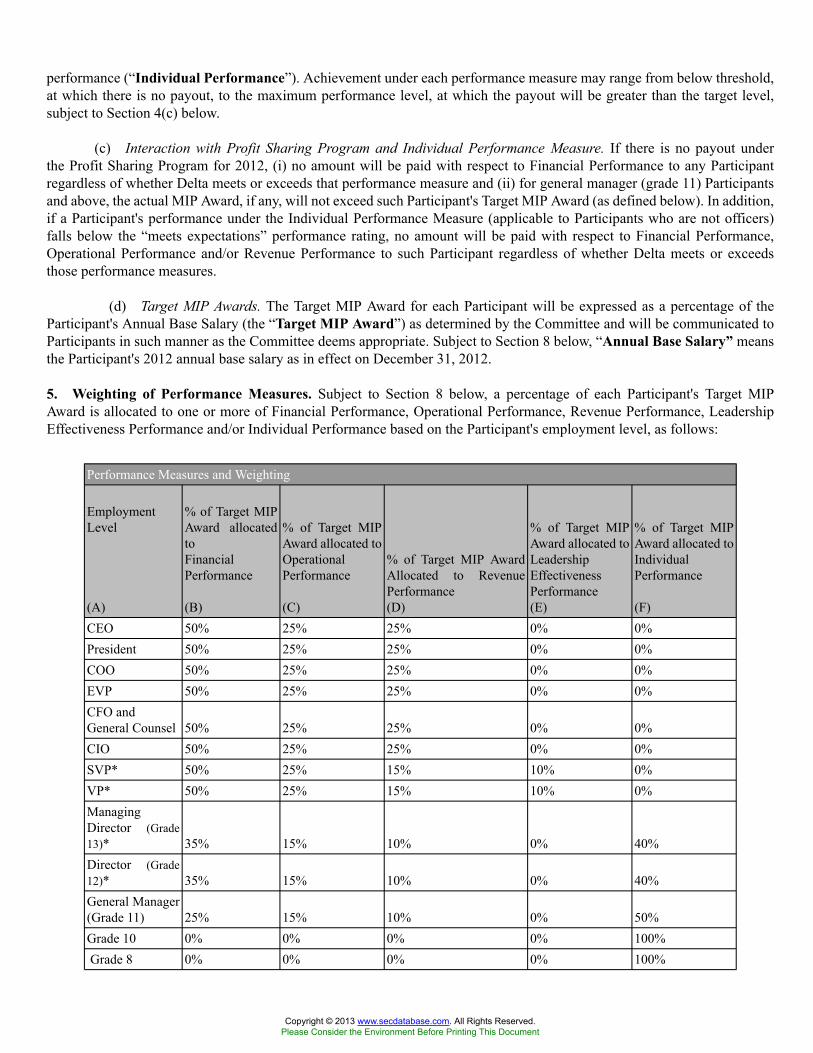
performance (“Individual Performance”). Achievement under each performance measure may range from below threshold,at which there is no payout, to the maximum performance level, at which the payout will be greater than the target level,subject to Section 4(c) below.
(c) Interaction with Profit Sharing Program and Individual Performance Measure. If there is no payout underthe Profit Sharing Program for 2012, (i) no amount will be paid with respect to Financial Performance to any Participantregardless of whether Delta meets or exceeds that performance measure and (ii) for general manager (grade 11) Participantsand above, the actual MIP Award, if any, will not exceed such Participant's Target MIP Award (as defined below). In addition,if a Participant's performance under the Individual Performance Measure (applicable to Participants who are not officers)falls below the “meets expectations” performance rating, no amount will be paid with respect to Financial Performance,Operational Performance and/or Revenue Performance to such Participant regardless of whether Delta meets or exceedsthose performance measures.
(d) Target MIP Awards. The Target MIP Award for each Participant will be expressed as a percentage of theParticipant's Annual Base Salary (the “Target MIP Award”) as determined by the Committee and will be communicated toParticipants in such manner as the Committee deems appropriate. Subject to Section 8 below, “Annual Base Salary” meansthe Participant's 2012 annual base salary as in effect on December 31, 2012.
5. Weighting of Performance Measures. Subject to Section 8 below, a percentage of each Participant's Target MIPAward is allocated to one or more of Financial Performance, Operational Performance, Revenue Performance, LeadershipEffectiveness Performance and/or Individual Performance based on the Participant's employment level, as follows:
Performance Measures and Weighting
EmploymentLevel
(A)
% of Target MIPAward allocatedtoFinancialPerformance
(B)
% of Target MIPAward allocated toOperationalPerformance
(C)
% of Target MIP AwardAllocated to RevenuePerformance(D)
% of Target MIPAward allocated toLeadershipEffectivenessPerformance(E)
% of Target MIPAward allocated toIndividualPerformance
(F)CEO 50% 25% 25% 0% 0%President 50% 25% 25% 0% 0%COO 50% 25% 25% 0% 0%EVP 50% 25% 25% 0% 0%CFO andGeneral Counsel 50% 25% 25% 0% 0%CIO 50% 25% 25% 0% 0%SVP* 50% 25% 15% 10% 0%VP* 50% 25% 15% 10% 0%ManagingDirector (Grade13)* 35% 15% 10% 0% 40%Director (Grade12)* 35% 15% 10% 0% 40%General Manager(Grade 11) 25% 15% 10% 0% 50%Grade 10 0% 0% 0% 0% 100%Grade 8 0% 0% 0% 0% 100%
Copyright © 2013 www.secdatabase.com. All Rights Reserved.Please Consider the Environment Before Printing This Document

2
Copyright © 2013 www.secdatabase.com. All Rights Reserved.Please Consider the Environment Before Printing This Document
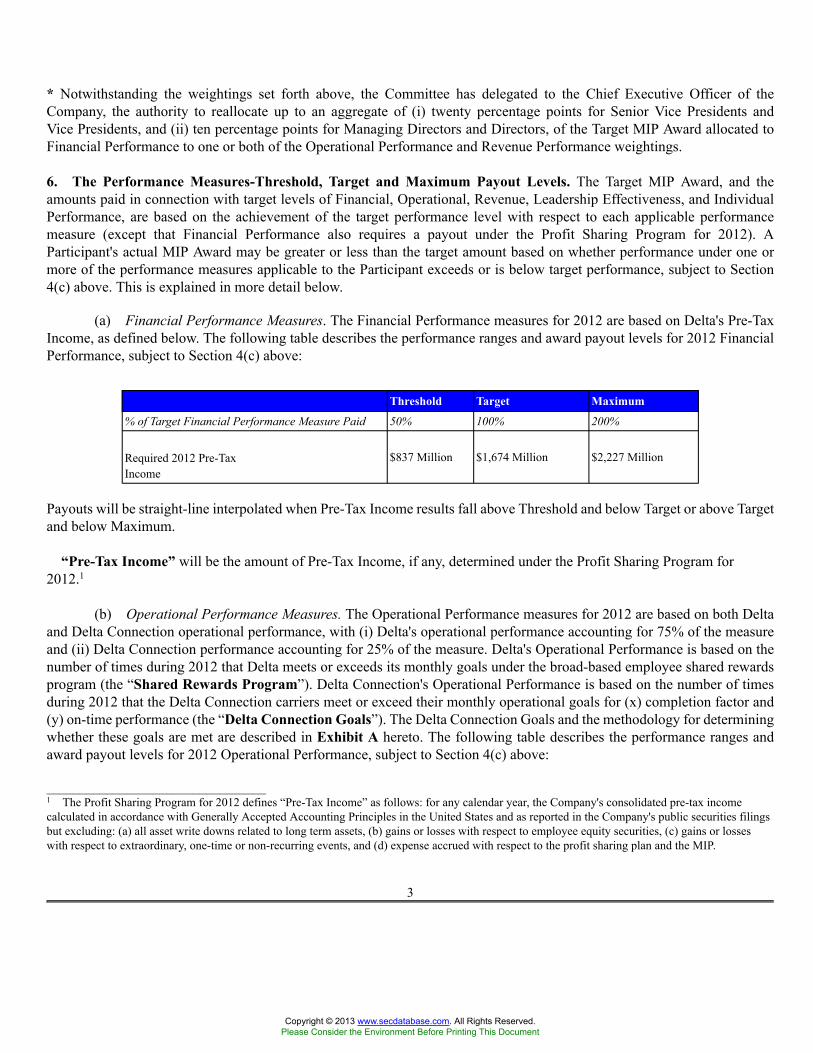
* Notwithstanding the weightings set forth above, the Committee has delegated to the Chief Executive Officer of theCompany, the authority to reallocate up to an aggregate of (i) twenty percentage points for Senior Vice Presidents andVice Presidents, and (ii) ten percentage points for Managing Directors and Directors, of the Target MIP Award allocated toFinancial Performance to one or both of the Operational Performance and Revenue Performance weightings.
6. The Performance Measures-Threshold, Target and Maximum Payout Levels. The Target MIP Award, and theamounts paid in connection with target levels of Financial, Operational, Revenue, Leadership Effectiveness, and IndividualPerformance, are based on the achievement of the target performance level with respect to each applicable performancemeasure (except that Financial Performance also requires a payout under the Profit Sharing Program for 2012). AParticipant's actual MIP Award may be greater or less than the target amount based on whether performance under one ormore of the performance measures applicable to the Participant exceeds or is below target performance, subject to Section4(c) above. This is explained in more detail below.
(a) Financial Performance Measures. The Financial Performance measures for 2012 are based on Delta's Pre-TaxIncome, as defined below. The following table describes the performance ranges and award payout levels for 2012 FinancialPerformance, subject to Section 4(c) above:
Threshold Target Maximum
% of Target Financial Performance Measure Paid 50% 100% 200%
Required 2012 Pre-TaxIncome
$837 Million $1,674 Million $2,227 Million
Payouts will be straight-line interpolated when Pre-Tax Income results fall above Threshold and below Target or above Targetand below Maximum.
“Pre-Tax Income” will be the amount of Pre-Tax Income, if any, determined under the Profit Sharing Program for2012.1
(b) Operational Performance Measures. The Operational Performance measures for 2012 are based on both Deltaand Delta Connection operational performance, with (i) Delta's operational performance accounting for 75% of the measureand (ii) Delta Connection performance accounting for 25% of the measure. Delta's Operational Performance is based on thenumber of times during 2012 that Delta meets or exceeds its monthly goals under the broad-based employee shared rewardsprogram (the “Shared Rewards Program”). Delta Connection's Operational Performance is based on the number of timesduring 2012 that the Delta Connection carriers meet or exceed their monthly operational goals for (x) completion factor and(y) on-time performance (the “Delta Connection Goals”). The Delta Connection Goals and the methodology for determiningwhether these goals are met are described in Exhibit A hereto. The following table describes the performance ranges andaward payout levels for 2012 Operational Performance, subject to Section 4(c) above:
_________________________________1 The Profit Sharing Program for 2012 defines “Pre-Tax Income” as follows: for any calendar year, the Company's consolidated pre-tax incomecalculated in accordance with Generally Accepted Accounting Principles in the United States and as reported in the Company's public securities filingsbut excluding: (a) all asset write downs related to long term assets, (b) gains or losses with respect to employee equity securities, (c) gains or losseswith respect to extraordinary, one-time or non-recurring events, and (d) expense accrued with respect to the profit sharing plan and the MIP.
3
Copyright © 2013 www.secdatabase.com. All Rights Reserved.Please Consider the Environment Before Printing This Document
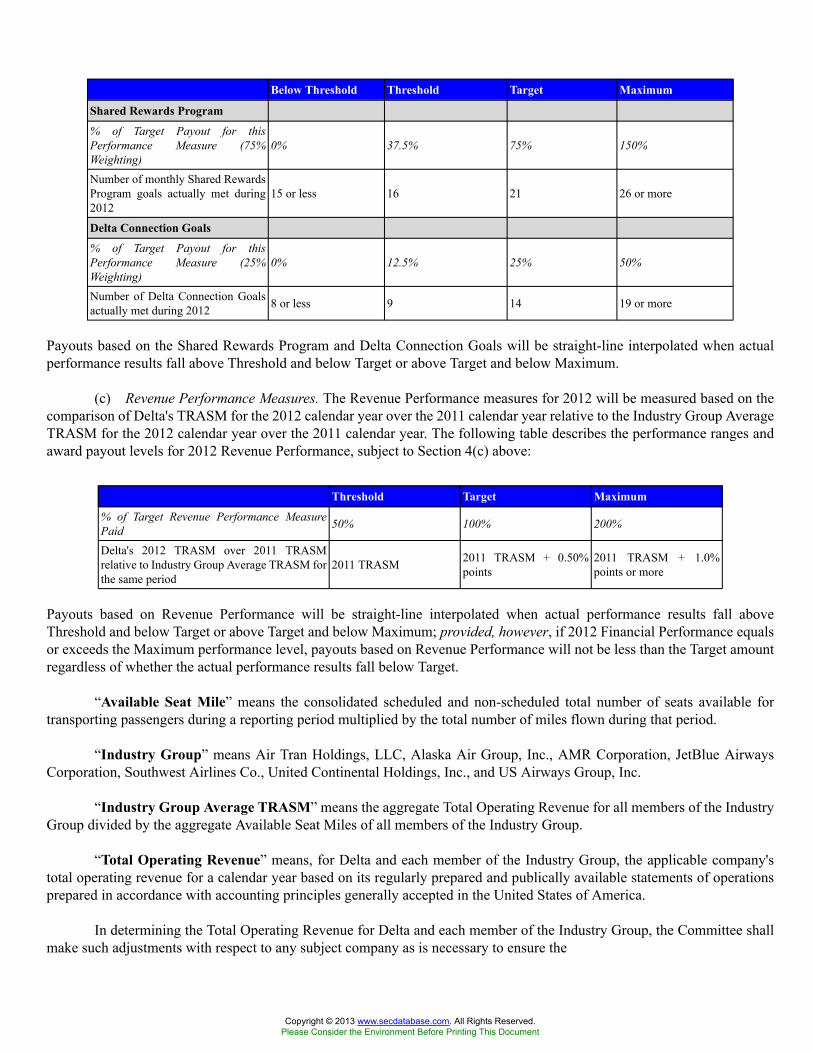
Below Threshold Threshold Target Maximum
Shared Rewards Program
% of Target Payout for thisPerformance Measure (75%Weighting)
0% 37.5% 75% 150%
Number of monthly Shared RewardsProgram goals actually met during2012
15 or less 16 21 26 or more
Delta Connection Goals
% of Target Payout for thisPerformance Measure (25%Weighting)
0% 12.5% 25% 50%
Number of Delta Connection Goalsactually met during 2012 8 or less 9 14 19 or more
Payouts based on the Shared Rewards Program and Delta Connection Goals will be straight-line interpolated when actualperformance results fall above Threshold and below Target or above Target and below Maximum.
(c) Revenue Performance Measures. The Revenue Performance measures for 2012 will be measured based on thecomparison of Delta's TRASM for the 2012 calendar year over the 2011 calendar year relative to the Industry Group AverageTRASM for the 2012 calendar year over the 2011 calendar year. The following table describes the performance ranges andaward payout levels for 2012 Revenue Performance, subject to Section 4(c) above:
Threshold Target Maximum
% of Target Revenue Performance MeasurePaid 50% 100% 200%
Delta's 2012 TRASM over 2011 TRASMrelative to Industry Group Average TRASM forthe same period
2011 TRASM 2011 TRASM + 0.50%points
2011 TRASM + 1.0%points or more
Payouts based on Revenue Performance will be straight-line interpolated when actual performance results fall aboveThreshold and below Target or above Target and below Maximum; provided, however, if 2012 Financial Performance equalsor exceeds the Maximum performance level, payouts based on Revenue Performance will not be less than the Target amountregardless of whether the actual performance results fall below Target.
“Available Seat Mile” means the consolidated scheduled and non-scheduled total number of seats available fortransporting passengers during a reporting period multiplied by the total number of miles flown during that period.
“Industry Group” means Air Tran Holdings, LLC, Alaska Air Group, Inc., AMR Corporation, JetBlue AirwaysCorporation, Southwest Airlines Co., United Continental Holdings, Inc., and US Airways Group, Inc.
“Industry Group Average TRASM” means the aggregate Total Operating Revenue for all members of the IndustryGroup divided by the aggregate Available Seat Miles of all members of the Industry Group.
“Total Operating Revenue” means, for Delta and each member of the Industry Group, the applicable company'stotal operating revenue for a calendar year based on its regularly prepared and publically available statements of operationsprepared in accordance with accounting principles generally accepted in the United States of America.
In determining the Total Operating Revenue for Delta and each member of the Industry Group, the Committee shallmake such adjustments with respect to any subject company as is necessary to ensure the
Copyright © 2013 www.secdatabase.com. All Rights Reserved.Please Consider the Environment Before Printing This Document

4
Copyright © 2013 www.secdatabase.com. All Rights Reserved.Please Consider the Environment Before Printing This Document
results are comparable, including, without limitation, differences in accounting policies (for example, non-recurringadjustments to deferred revenue resulting from (i) initial application of accounting policies; (ii) the application of accountingpolicies to materially modified contracts or (iii) significant accounting estimate changes associated with mergers,acquisitions, divestitures or fresh start accounting as a result of emergence from bankruptcy). Without limiting the generalityof the forgoing, the Committee shall (i) make such determinations based on publicly audited financial statements filed by thesubject company with the U.S. Securities and Exchange Commission, and (ii) exclude from any calculation any item of gain,loss or expense to be extraordinary or unusual in nature or infrequent in occurrence.
“TRASM” means Total Operating Revenue divided by Available Seat Miles.
(d) Leadership Effectiveness Performance Measure. The Leadership Effectiveness Performance measure(applicable to Participants who are Vice Presidents or Senior Vice Presidents (other than any Executive Officer Participants)for 2012 will be based on an evaluation of whether a Participant has demonstrated leadership attributes and results during2012 including, among other things, supporting diversity, providing talent management, meeting financial budget, andbeing a role model for the Rules of the Road. The performance ranges and award payout levels will be determined by theCommittee, subject to Section 4(c) above.
(e) Individual Performance Measure. The Individual Performance measure (applicable to Participants who are notofficers) is generally determined by each Participant's Leader Performance Management evaluation (“LPM”) at the end of2012. The performance ranges and award payout levels will be determined by the Committee, subject to Section 4(c) above.
7. Timing of Award Payments.
(a) In General. Subject to Sections 7(b) and 8(a) below, any payouts to a Participant under the MIP for 2012 will bemade in cash, as soon as practicable after (i) the Committee certifies the achievement of the required Financial Performance,Operational Performance and Revenue Performance results and (ii) where applicable, Leadership Effectiveness Performanceresults have been determined and an LPM evaluation has been completed, but in no event later than March 15, 2013, unlessit is administratively impracticable to do so, and such impracticability was unforeseeable at the end of 2012, in which casesuch payment shall be made as soon as administratively practicable after March 15, 2013. Further, unless a payout for 2012under the Profit Sharing Program occurs after March 15, 2013, any payout under the 2012 MIP will not be made priorto a payout for 2012 under the Profit Sharing Program; provided, however, if it is determined there will be no payout for2012 under the Profit Sharing Program, any MIP Awards that are payable based on Operational Performance, RevenuePerformance, Leadership Effectiveness Performance or Individual Performance will be paid as soon as practicable thereafter,but in no event later than March 15, 2013, unless it is administratively impracticable to do so, and such impracticability wasunforeseeable at the end of 2012, in which case such payment shall be made as soon as administratively practicable afterMarch 15, 2013.
(b) Executive Officer Participants. Payouts under the MIP to Participants who, as of December 31, 2012, areExecutive Officer Participants (as such term is defined in Section 4(a) above) will be subject to the following terms andconditions:
(i) Payment in Restricted Stock. If there is no payout under the Profit Sharing Program for 2012, any payout under theMIP to an Executive Officer Participant will be made in shares of Restricted Stock rather than in cash, with the number ofshares of Restricted Stock being equal to the result of the following formula (“MIP Restricted Stock”): A ÷ B, where:2
A = the amount of the payout to the Executive Officer Participant under the MIP had the payout been madein cash; and
______________________2 If this formula results in any fractional share, the MIP Restricted Stock will be rounded up to the nearest whole share.
5
Copyright © 2013 www.secdatabase.com. All Rights Reserved.Please Consider the Environment Before Printing This Document
B = the closing price of a Share on the New York Stock Exchange on the later of (1) the date thatthe Committee approves the payouts, if any, to the Executive Officer Participants under the MIP followingthe Committee's certification of the achievement of the required performance measures as described inSection 7(a) and (2) the third business day following the date on which the Company publicly announcesits annual financial results if this date is scheduled in the same month that the Committee approves suchpayouts, if any.
(ii) Lapsing of Restrictions; Forfeiture. Until the restrictions imposed by this Section 7(b)(ii) (the“Restrictions”) have lapsed pursuant to the terms below, an Executive Officer Participant will not be permitted tosell, exchange, assign, transfer, pledge or otherwise dispose of the MIP Restricted Stock and the MIP RestrictedStock will be subject to forfeiture as set forth below.
(A) The Restrictions shall lapse and be of no further force or effect on the earlier of the date(1) there is a payout under the Profit Sharing Program unless, prior to such payout, the Executive OfficerParticipant incurs a Disqualifying Termination of Employment or (2) an Executive Officer Participant incursa Qualifying Termination of Employment. The MIP Restricted Stock will be immediately forfeited if, priorto the lapsing of the Restrictions, the Executive Officer Participant incurs a Disqualifying Termination ofEmployment.
(B) “Disqualifying Termination of Employment” means an Executive Officer Participant'sTermination of Employment by the Company for Cause.
(A) “Qualifying Termination of Employment” means an Executive Officer Participant'sTermination of Employment (1) by the Company without Cause; or (2) due to death or Disability.
(D) For purposes of this Section 7(b)(ii), if an Executive Officer Participant incurs a Terminationof Employment by reason of (1) a voluntary resignation (including the Termination of Employment by theParticipant if he is employed by an Affiliate at the time the Company sells or otherwise divests itself ofsuch Affiliate); or (2) Retirement, the Restrictions shall lapse and be of no further force or effect on the datethere is a payout under the Profit Sharing Program as if such Executive Officer Participant's employmenthad continued through such date.
(E) For purposes of the MIP, “Retirement” means a Termination of Employment (other thanfor Cause or death) either: (1) on or after a Participant's 62nd birthday provided that such Participant hascompleted at least 5 years service since his or her most recent hire date with the Company (or an Affiliate orformer Affiliate); or (2) on or after a Participant's 52nd birthday provided that such Participant has completedat least 10 years service since his or her most recent hire date with the Company (or an Affiliate or formerAffiliate).
(iii) Dividends. In the event a cash dividend shall be paid in respect of Shares at a time the Restrictions onthe MIP Restricted Stock have not lapsed, the Participant shall be eligible to receive the dividend upon the lapse ofthe Restrictions. The Restrictions shall apply to any such dividend.
(iv) 2007 Plan; Written Notice. The MIP Restricted Stock will otherwise be subject to the terms of the2007 Plan. In the event any Executive Officer Participant's MIP Award is converted to MIP Restricted Stock, suchParticipant will receive a written notice of such conversion with the details thereof as soon as practicable after theMIP Payment Date.
6
Copyright © 2013 www.secdatabase.com. All Rights Reserved.Please Consider the Environment Before Printing This Document
8. Change in Employment Status.
(a) Termination of Employment.
(i) A Termination Event in 2012--General. Except as expressly set forth in this Section 8, in the event aParticipant's employment with Delta terminates for any reason prior to the end of the workday on December 31,2012, such Participant will be ineligible for any award under the MIP. In other words, if a Participant is employedaccording to Company records through the end of the workday on December 31, 2012, the Participant will be eligiblefor any award earned under the MIP for 2012, including, if applicable, MIP Restricted Stock.
(ii) Termination on or after January 1, 2013. Subject to Section 7(b) above, a Participant who incurs aTermination of Employment for any reason other than for Cause on or after January 1, 2013 will remain eligible forany unpaid MIP Award, which award will be paid according to the terms of Section 7(a) above. A Participant who isterminated by the Company for Cause on or after January 1, 2013 will forfeit any unpaid MIP Award.
(iii) Pro Rata MIP Payment.
(A) Disability or Retirement. This Section 8(a)(iii)(A) applies to any Participant who incurs aTermination of Employment prior to January 1, 2013 due to the Participant's Disability or Retirement(as such term is defined in Section 7(b)(ii)(D)). Subject to the Participant's execution of a waiver andrelease of claims in a form and manner satisfactory to the Company, such Participant will be eligibleto receive a MIP Award based on an adjusted annual base salary amount, but otherwise in the samemanner, to the same extent and at the same time as the Participant would have received such MIP Awardif such Participant's employment had continued through December 31, 2012 (i.e., based on achievementof applicable performance measures). The most recent LPM prior to the Termination of Employment willgenerally apply to the Individual Performance measure, if any, applicable to the Participant. The Participant'sAnnual Base Salary will be the result of the following formula: X × Y/12, where:
X = the Participant's annual base salary as in effect as of the date of Termination of Employment;and
Y = the number of calendar months the Participant was actively employed by Delta during 2012 ina MIP-eligible position, rounded up for any partial month.3
(B) Termination of Employment Without Cause or Resulting in Benefits under the SeverancePlan. This Section 8(a)(iii)(B) applies to any Participant who incurs a Termination of Employment priorto January 1, 2013 due to either (1) a Termination of Employment by the Company without Cause, or(2) for any other reason that entitles such Participant to benefits under the Delta Air Lines, Inc. 2009Officer and Director Severance Plan (the “Severance Plan”). Subject to the Participant's execution of awaiver and release of claims in a form and manner satisfactory to the Company, such Participant will beeligible to receive a MIP Award based on an adjusted annual base salary amount, but otherwise in the samemanner, to the same extent and at the same time as the Participant would have received such MIP Awardif such Participant's employment had continued through December 31, 2012 (i.e., based on achievement ofapplicable performance measures). The Participant's
_____________________________3 For purposes of the MIP, one calendar month is calculated from the date of measurement to the same or closest numerical date occurring during thefollowing month. For example, one calendar month from January 31, 2012 will elapse as of February 29, 2012, two months will elapse on March 31,2012, and so on.
7
Copyright © 2013 www.secdatabase.com. All Rights Reserved.Please Consider the Environment Before Printing This Document
Annual Base Salary will be determined in accordance with the formula set forth in Section 8(a)(iii)(A) above.
(C) Death. This Section 8(a)(iii)(C) applies to any Participant who incurs a Termination ofEmployment prior to January 1, 2013 due to the Participant's death. The Participant's estate will be eligibleto receive a Pro Rata MIP Payment made in cash as soon as practicable after a Participant's Termination ofEmployment, but in no event later than 2½ months following the end of the year in which the Terminationof Employment occurs. “Pro Rata MIP Payment” means the result of the following formula: W × Z/12,where:
W = the Participant's Target MIP Award; and
Z = the number of calendar months the Participant was actively employed by Delta during2012 in a MIP-eligible position, rounded up for any partial month.
(b) Other Changes in Employment Status. The terms of this Section 8(b) shall apply to circumstances involvingnew hires, promotions, demotions, transfers or leaves of absence during 2012. After a Participant's Target MIP Award isdetermined under this Section 8(b), the appropriate weighting of performance measures will apply to each portion of suchTarget MIP Award as set forth in Section 5 above. For partial calendar months, the change in employment status will beconsidered effective as of the 1st day of the month in which there is a change in status; provided, however, in the event that aParticipant was (i) on a Disability leave of absence for a period of less than one calendar month during 2012 and (ii) activelyat work for at least one full day during such calendar month, the Participant will be deemed to have been employed in aMIP-eligible position for the entire calendar month. The end of year LPM will apply to any Individual Performance measureapplicable to the Participant unless the Participant is no longer subject to the LPM process after the change in employmentstatus, in which case the most recent LPM will apply. Any MIP Awards payable under this Section 8(b) will be paid at thesame time and in the same manner as such awards are paid to active Participants, subject to Section 7(b) above.
(i) New Hires. With respect to any individual who becomes employed by Delta as a grade 8 or any moresenior MIP-eligible position during 2012 but after January 1, 2012, such individual will be a Participant in the MIPand will be eligible to receive an award under the MIP for 2012; provided, that such Participant's Annual Base Salarywill be the result of the following formula: X × Y/12, where:
X = the Participant's annual base salary as of December 31, 2012; and
Y = the number of calendar months the Participant was actively employed by Delta in a MIP-eligibleposition during 2012, rounded up for any partial month.
(ii) Promotions. Participants who are either promoted into a MIP-eligible job level or promoted into ahigher level of MIP participation during 2012 will have their Target MIP Award calculated based on their annualbase salary at each MIP-eligible job level (measured as of the date immediately prior to the date the promotionis considered effective for purposes of the MIP, if applicable, as described in the first paragraph of Section 8(b)above, and as of December 31, 2012) and the number of calendar months they were employed in each such capacity,multiplied by the relevant total target award percentage applicable to their position or positions during the relevantperiod.
(iii) Demotions. Participants who are either demoted to a position that is not eligible to participate in theMIP or demoted to a lower level of MIP participation during 2012 will have their
8
Copyright © 2013 www.secdatabase.com. All Rights Reserved.Please Consider the Environment Before Printing This Document
Target MIP Award calculated based on their annual base salary at each MIP-eligible job level (measured as of thedate immediately prior to the date the demotion is considered effective for purposes of the MIP, as described inthe first paragraph of Section 8(b) above, and, if applicable, as of December 31, 2012) and the number of calendarmonths they were employed in each such capacity, multiplied by the relevant total target award percentage applicableto their position or positions during the relevant period.
(iv) Transfers and Leaves of Absence. In the event that during 2012 a Participant transfers employmentfrom Delta to a Delta subsidiary or affiliate that does not participate in the MIP, other than a transfer to the DeltaCommunity Credit Union (the “DCCU”), the Participant will forfeit any eligibility for an award under the MIP.Except as provided under Section 8(b)(v) below, any Participant who goes on any type of leave or who transfersto the DCCU at any time during 2012 will have his Target MIP Award calculated based on his annual base salary(measured as of the date immediately prior to the date the transfer or leave is considered effective for purposes of theMIP) and the number of calendar months he was employed in a MIP-eligible position during 2012, multiplied by therelevant total target award percentage applicable to his MIP-eligible position.
(v) Military Leave. In the event that at any time during 2012 a Participant is on a Military Leave ofAbsence, his or her Annual Base Salary shall be equal to the aggregate annual base salary the Participant receivedfrom Delta during 2012 plus any amount of base salary such Participant would have received had he or she beenactively employed by Delta in any corresponding MIP-eligible position during such leave. “Military Leave ofAbsence” means a Participant's absence from his or her position of employment at any time during 2012 because ofservice in the uniformed services, as defined under the Uniformed Services Employment and Reemployment RightsAct of 1994, as amended (“USERRA”); provided, that a Participant must provide the Company appropriate evidencethat his or her absence was due to service in the uniformed services and the period of such service in order to beconsidered to be on a Military Leave of Absence for purposes of the MIP. For purposes of the MIP, any Participantwho is absent due to military service (according to Delta's records) as of December 31, 2012 and has been on suchleave for a cumulative period (during the period he or she has been employed by Delta) of five years or less, willbe presumed to be on a Military Leave of Absence. Any Participant who is similarly absent due to military service(based on Delta's records) and who has been on such leave for a period of more than five years will not be consideredto be on a Military Leave of Absence until he or she provides appropriate evidence that he or she is entitled to anexception to the five-year limit on uniformed service as set forth in USERRA.
9. Treatment of Payments Under Benefit Plans or Programs. MIP payments, which for an Executive Officer Participantwho receives MIP Restricted Stock means the amount of the payout to the Executive Officer Participant under the MIP hadthe payout been made in cash, will be considered as earnings under any benefit plan or program sponsored by Delta only tothe extent such payments are included as earnings under the terms of the specific plan or program; provided, however, thatany MIP payment made to an Executive Officer Participant in MIP Restricted Stock will be considered as earnings only forpurposes of the Company's restoration payment program, as in effect from time to time. If such payments are included, unlessotherwise provided in such plan or program, participants will be eligible to contribute amounts paid under the MIP into suchplans in the same manner and to the same extent as their ordinary compensation and any amounts so contributed will besubject to any applicable Company contributions and/or matches. Notwithstanding anything to the contrary in this Section9, any MIP payment received in connection with a Termination of Employment shall not be considered earnings under anybenefit plan or program sponsored by Delta.10. Effective Date. The MIP will become effective as of January 1, 2012; provided however, if on or before the date theCommittee adopts the MIP any employee who would otherwise have participated in the MIP is informed that his or heremployment will be terminated by the Company without Cause, any severance such employee is entitled to receive will becalculated based on the 2011 Management Incentive Plan as in effect as of December 31, 2011.
9
Copyright © 2013 www.secdatabase.com. All Rights Reserved.Please Consider the Environment Before Printing This Document
11. Amendment. Except as otherwise expressly set forth in this Section and Section 14, the terms of Section 14 of the2007 Plan shall apply to any amendment or termination of the MIP. In addition, the terms applicable to any Participantwill be subject in their entirety to the terms of any offer letter or other document to which the Participant has agreed. Theterms of such offer letter or other document, if contrary to the terms of the MIP, shall govern the rights of the correspondingParticipant.
12. Fractions. Any calculation under the MIP that results in a fractional amount will be rounded up to two decimal points.
13. Section 409A of the Code. Notwithstanding anything to the contrary in the MIP, to the extent that any amount paidhereunder in connection with a Termination of Employment constitutes deferred compensation under Section 409A of theInternal Revenue Code of 1986, as amended, and the regulations promulgated thereunder (together, “Section 409A”) and ispaid to a “specified employee” as defined in Section 409A, the payment of such amount will be delayed for six months.
14. Clawback. Notwithstanding anything to the contrary in the MIP and subject to further amendment of this Section 14to the extent required to be in compliance with any applicable law or regulation or Delta's internal clawback policy, as itmay be amended from time to time, if the Committee determines that a vice president or more senior officer level Participanthas engaged in fraud or misconduct that caused, in whole or in part, the need for a required restatement of Delta's financialstatements filed with the Securities and Exchange Commission, the Committee will review all incentive compensationawarded to or earned by such Participant, including, without limitation, any MIP Award, with respect to fiscal periodsmaterially affected by the restatement and may recover from the Participant all such incentive compensation to the extent thatthe Committee deems appropriate after taking into account the relevant facts and circumstances. Any recoupment hereundermay be in addition to any other remedies that may be available to Delta under applicable law, including, disciplinary actionup to and including termination of employment.
10
Copyright © 2013 www.secdatabase.com. All Rights Reserved.Please Consider the Environment Before Printing This Document
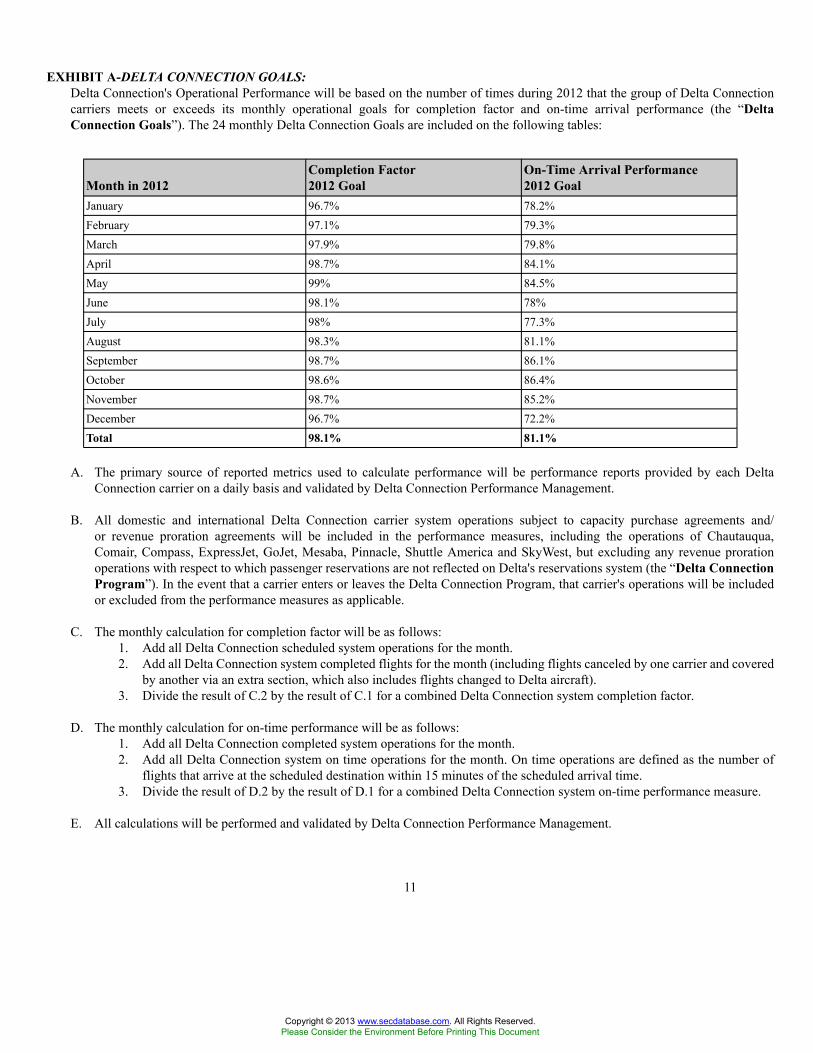
EXHIBIT A-DELTA CONNECTION GOALS:Delta Connection's Operational Performance will be based on the number of times during 2012 that the group of Delta Connectioncarriers meets or exceeds its monthly operational goals for completion factor and on-time arrival performance (the “DeltaConnection Goals”). The 24 monthly Delta Connection Goals are included on the following tables:
Month in 2012Completion Factor2012 Goal
On-Time Arrival Performance2012 Goal
January 96.7% 78.2%February 97.1% 79.3%March 97.9% 79.8%April 98.7% 84.1%May 99% 84.5%June 98.1% 78%July 98% 77.3%August 98.3% 81.1%September 98.7% 86.1%October 98.6% 86.4%November 98.7% 85.2%December 96.7% 72.2%Total 98.1% 81.1%
A. The primary source of reported metrics used to calculate performance will be performance reports provided by each DeltaConnection carrier on a daily basis and validated by Delta Connection Performance Management.
B. All domestic and international Delta Connection carrier system operations subject to capacity purchase agreements and/or revenue proration agreements will be included in the performance measures, including the operations of Chautauqua,Comair, Compass, ExpressJet, GoJet, Mesaba, Pinnacle, Shuttle America and SkyWest, but excluding any revenue prorationoperations with respect to which passenger reservations are not reflected on Delta's reservations system (the “Delta ConnectionProgram”). In the event that a carrier enters or leaves the Delta Connection Program, that carrier's operations will be includedor excluded from the performance measures as applicable.
C. The monthly calculation for completion factor will be as follows:1. Add all Delta Connection scheduled system operations for the month.2. Add all Delta Connection system completed flights for the month (including flights canceled by one carrier and covered
by another via an extra section, which also includes flights changed to Delta aircraft).3. Divide the result of C.2 by the result of C.1 for a combined Delta Connection system completion factor.
D. The monthly calculation for on-time performance will be as follows:1. Add all Delta Connection completed system operations for the month.2. Add all Delta Connection system on time operations for the month. On time operations are defined as the number of
flights that arrive at the scheduled destination within 15 minutes of the scheduled arrival time.3. Divide the result of D.2 by the result of D.1 for a combined Delta Connection system on-time performance measure.
E. All calculations will be performed and validated by Delta Connection Performance Management.
11
Copyright © 2013 www.secdatabase.com. All Rights Reserved.Please Consider the Environment Before Printing This Document
EXHIBIT 10.24
Delta Air Lines, IncRestoration Long Term
Disability Plan
Article 1General
Section 1.1 Introduction. Delta Air Lines, Inc. (the “Company”) has established and maintained the Delta Family-Care Disability and Survivorship Plan ( the “D&S Plan”) as a tax exempt welfare benefit plan for purposes ofproviding welfare benefits, including but not limited to, long term disability benefits, to non pilot employees ofthe Company. The D&S Plan and its accompanying trust are subject to the compensation limit of Section 505(b)of the Internal Revenue Code of 1986 (the “Code”) (such compensation limit referred to as the “Restriction”),which Restriction may prevent participants in the D&S Plan from receiving the amount of long term disabilitybenefits to which they would otherwise be entitled under the D&S Plan. The Company has established this DeltaAir Lines, Inc. Restoration Long Term Disability Plan (the “Restoration Plan”) to provide certain supplementallong term disability benefits as described herein.
Section 1.2 Eligibility. Any non pilot employee whose Earnings as defined in the D&S Plan exceeds the thenapplicable compensation limit under Section 505(b) of the Code (a “Plan Participant”) is eligible to participate inthis Restoration Plan.
Section 1.3 Purpose. The purpose of the Restoration Plan is to provide for the payment of any reduction in a PlanParticipant's long term disability benefit under the D&S Plan which results solely from the Restriction and not inwhole or in part from any other term or provision of the D&S Plan.
Section 1.4 Nature of Restoration Plan. The Restoration Plan is a non-qualified unfunded plan maintained by theCompany for the purpose of providing benefits for a select group of management or highly compensatedemployees. Accordingly, the Restoration Plan is intended to be exempt from coverage under certain sections ofthe Employee Retirement Income Security Act of 1974 (ERISA”) pursuant to ERISA Sections 4(b)(5), 301(2),301(a)(1) 4021 and applicable regulations. The Restoration Plan is also intended to be a disability pay plan underSection 409A of the Code and Section 1.401A-1(a)(5) of the applicable regulations, and shall be administeredconsistent with such intention.
Article 2Benefits
Section 2.1. Incorporation of D&S Plan. To the extent consistent with the terms of this Restoration Plan, theterms of the D&S Plan and any past and future amendments thereto are incorporated by reference into thisRestoration Plan.
Section 2.2. Restoration Long Term Disability Benefits. The Company agrees to pay to a Plan Participant at thetime and in the manner set forth herein a supplemental monthly disability benefit equal to (a) minus (b) where (a)equals the monthly long term disability benefit which the Plan Participant would receive under the D&S Planbased on Earnings as if the Restriction was not in effect, but taking into account all other terms of the D&S Plan;
Copyright © 2013 www.secdatabase.com. All Rights Reserved.Please Consider the Environment Before Printing This Document

and (b) equals the monthly long term disability which the Plan Participant actually receives from the D&S Planconsidering the Restriction and taking into account all other terms of
1
Copyright © 2013 www.secdatabase.com. All Rights Reserved.Please Consider the Environment Before Printing This Document
the D&S Plan. Provided however, the amount of Restoration Long Term Disability Benefits payable under thisRestoration Plan shall be based only upon the amount of Company paid benefits (i.e. long term disability benefitsdetermined at the 50% level) and shall not include any employee paid long term disability “buy up” to the 60%level. A Plan Participant's Restoration Long Term Disability Benefits shall be paid monthly and begin on the datelong term disability benefits begin under the D&S Plan and cease when the Plan Participant is no longer eligiblefor long term disability benefits from the D&S Plan, or if the Restriction no longer applies such that the entirelong term disability benefit can be paid from the D&S Plan. Any decision of the D&S Plan administratorsregarding continued eligibility for long term disability benefits under the D&S Plan shall be binding on thisRestoration Plan.
Section 2.3. Source of Payment. The benefits provided under this Restoration Plan shall be paid, to the extentthey become due, from the Company's general assets or by such other means as the Company deems advisable.To the extent a Plan Participant acquires the right to receive payments under this Restoration Plan, such rightshall be no greater than that of a general creditor of the Company.
Article 3Administration
Section 3.1. Plan Administration. The Company, acting through its Vice President - Global HR Services andLabor Relations (or, if from time to time no such position exists, then acting through its highest ranking officerwho is primarily responsible for the Company's employee benefit programs) shall have the full power andauthority to administer this Restoration Plan. The Company, its agents and employees shall not be liable to anyperson for any action taken or omitted in connection with the administration of this Restoration Plan. Anyapplication for long term disability benefits under the D&S Plan by a Plan Participant shall also be deemed to bean application for Restoration Long Term Disability Benefits, and no separate application shall be required. Anyemployee who believes he is a Plan Participant who does not receive Restoration Long Term Disability Benefitsmay file a claim for such benefits with the Company; however such claim must be filed within 60 days after longterm disability benefits are first paid under the D&S Plan. Any adverse determination to such a claim for benefitsunder this Restoration Plan shall be made, and the Plan Participant notified of such adverse determination, with45 days of submission of his claim for benefits hereunder, subject to extensions allowed under applicable claimregulations.
Section 3.2. Appeals. To be eligible for benefits under this Restoration Plan, a Plan Participant must be receivinglong term disability benefits under the D&S Plan, and any appeal regarding the Plan Participant's initial orcontinued eligibility for, or receipt of, such benefits shall be determined solely under the appeal procedurescontained in the D&S Plan. The results of any such appeal shall be determinative of the same issues with respectto this Restoration Plan. Any appeal regarding Restoration Long Term Disability Benefits under this RestorationPlan, including, but not limited to, eligibility to participate in the Restoration Plan or the amount of RestorationLong Term Disability Benefits, shall be commenced separate and apart from any appeal under the D&S Plan.Any Plan Participant who is denied benefits under this Restoration Plan or believes the amount of such benefits isincorrect and wishes to appeal such denial or determination must request in writing a review of the denial ordetermination by the Administrative Committee of Delta Air Lines, Inc. within 180 days of receiving writtennotice of the denial. If no request for review is received by the Administrative Committee within 180 days of thereceipt of the written denial, the denial shall be final and binding upon the Company and the Plan Participant. Allappeals for benefits under this Restoration Plan, including the time limits for such appeal, required notices andother appeal procedures shall be consistent with any applicable claims review regulations promulgated underSection 503 of ERISA.
Copyright © 2013 www.secdatabase.com. All Rights Reserved.Please Consider the Environment Before Printing This Document

2
Copyright © 2013 www.secdatabase.com. All Rights Reserved.Please Consider the Environment Before Printing This Document
Article 4General
Section 4.1. Governing Law. This Restoration Plan shall be governed by and construed in accordance with thelaws of the State of Georgia without regard to its conflict of laws rules.
Section 4.2 No Right to Continued Employment. Nothing in this Restoration Plan shall be deemed to give anyPlan Participant the right to be retained in the service of the Company for any time or period, including any timethe Plan Participant may be receiving benefits hereunder.
Section 4.3. Nonassignability of Benefits. No benefit payable under this Restoration Plan may be assigned,encumbered or subject to any legal process for the payment of any claim against any Plan Participant.
Section 4.4. Amendment and Termination. This Restoration Plan is not intended to create any contractual rightsor benefits and may be terminated or amended by the Company at any time and for any reason, includingamendment or termination of benefits in pay status for any Plan Participant at any time.
3
Copyright © 2013 www.secdatabase.com. All Rights Reserved.Please Consider the Environment Before Printing This Document
Exhibit 10.25
February 2, 2012
Mr. Richard H. AndersonChief Executive OfficerDelta Air Lines, Inc.World HeadquartersAtlanta, Georgia 30320
Dear Richard:
As a result of the merger between Delta Air Lines, Inc. (“Delta”) and Northwest Airlines, Inc. (“Northwest”), Delta will honor theobligations under the Management Compensation Agreement dated June 28, 2001 between you and Delta, successor to Northwest (the“MCA”). Pursuant to the MCA, you, your spouse and your eligible dependents shall be provided certain medical and dental benefitsfollowing your termination of employment at Delta.
Section 3.2 of the MCA provided that you, your spouse and covered dependents (but only as long as they remain dependents) would beentitled to medical and dental coverage at the levels provided to you at the time of execution of the MCA under the then existingNorthwest health plans without cost to you for the life of you and your spouse. This coverage is secondary to any coverage provided bya subsequent employer. You have voluntarily and permanently waived the provisions of Section 3.2 of the MCA during youremployment with Delta. You also permanently and voluntarily waived any claim for eligibility under the Northwest Medical ExpenseReimbursement Program (“MERP”) that you may have had under the MCA. Your participation in the MERP program is herebyterminated in its entirety.
This letter will further confirm and memorialize your agreement with Delta as to how the medical and dental benefits under the MCAwill be provided following the termination of your employment with Delta. From the time of your termination of employment withDelta until you reach age 65, you, your spouse and your eligible dependents will continue to participate in Delta's group health plans atno cost to you. Your spouse and any eligible dependents will remain eligible under the terms of the Delta plan in place year to year untilyour spouse is eligible for Medicare, or any other dependents reach the maximum age of coverage for dependents.
In order to provide the general level of post retirement medical benefits contemplated under the MCA, we have agreed that, upon yourretirement, resignation or termination from Delta and so long as any subsequent employer or spouse's employer does not provide youwith medical benefit coverage, Delta, at its cost, will provide you and, once she is eligible for Medicare, your spouse (regardless ofwhether you pre-decease your spouse), with either a (i) Medicare Supplemental Policy with Part D coverage, or (ii) a MedicareAdvantage Plan with Part D coverage, (either of which, the “Policy”). The Company will select the Policy and Policy provider; howeveryou may direct the Company to use a different insurer and specific policy if you wish. In addition to providing the Policy, the Companywill reimburse you for any cost that would otherwise be covered by the medical plan in
Copyright © 2013 www.secdatabase.com. All Rights Reserved.Please Consider the Environment Before Printing This Document
Richard H. AndersonPage 2 of 2February 2, 2012
effect for you as of the date of this letter, i.e. the current plan for active employees, (the “Medical Plan”) a summary of which is attachedas Exhibit A, that is not covered by the Policy, at the amount of such benefit as it would have been provided under the Medical Plan.This reimbursement would include, for example, the cost of receiving services from a non Medicare provider, provided such costswould otherwise be covered under the Medical Plan. The Company will also reimburse you for the cost of any applicable Medicare PartB or D premiums. Post retirement dental coverage will be reasonably provided through an individual policy on terms consistent with thecurrent Delta dental benefit provided to employees as of the date of this agreement, a summary of which benefits is attached as ExhibitB.
Any reimbursement hereunder will (i) not affect the expenses eligible for reimbursement in any other tax year; (ii) be made on or beforethe last day of your tax year following the tax year in which the expense was incurred; and (iii) not be subject to liquidation or exchangefor another benefit. Consistent with the terms of the MCA, the post retirement medical and dental coverage will continue to the death ofyou and your spouse. You (and following your death, your spouse) shall be responsible for all applicable state, local and federal taxes onthis medical and dental coverage.
If any change in either the law regarding health benefits or the form or way in which Delta provides such benefits impacts the futurebenefits contemplated by this letter, Delta will reasonably provide medical and dental benefits equivalent to those described above.Please indicate your agreement with the provisions of this letter by signing in the space indicated below and returning a signed copy tome.
Sincerely,
/s/ David R. GoodeDavid R. GoodeChairman, Personnel & Compensation CommitteeBoard of Directors of Delta Air Lines, Inc.
/s/ Richard H. AndersonRichard H. Anderson
February 2, 2012Date
Copyright © 2013 www.secdatabase.com. All Rights Reserved.Please Consider the Environment Before Printing This Document
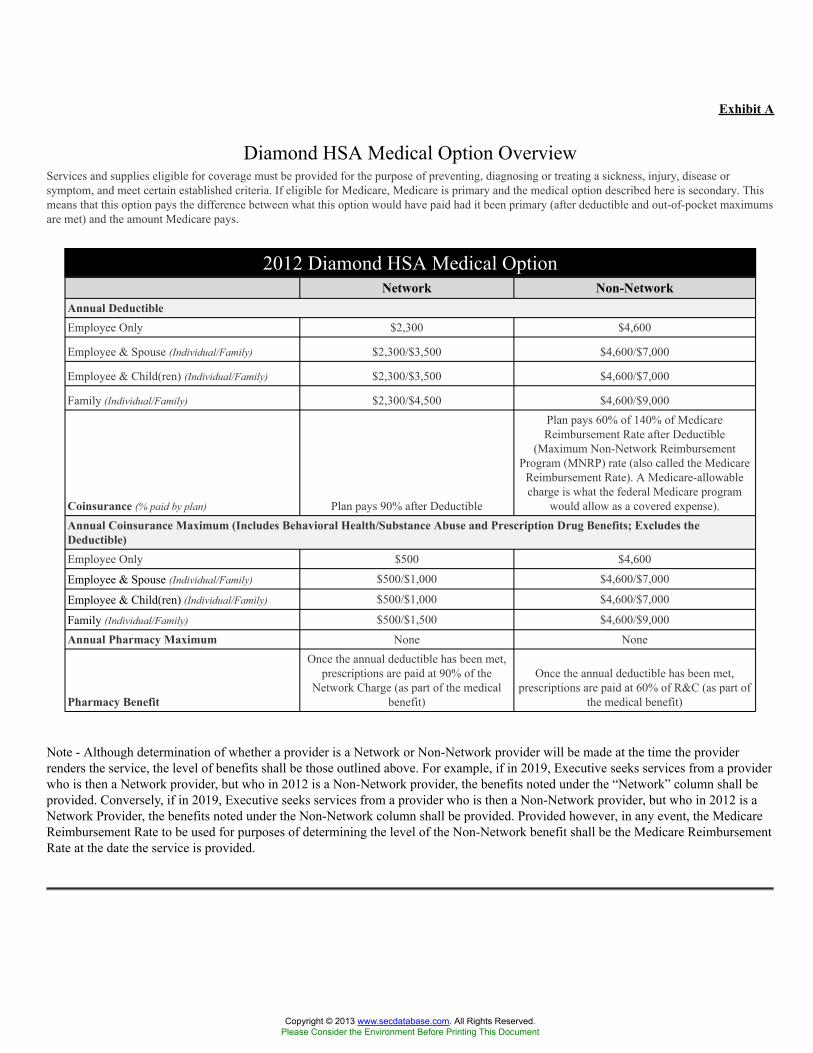
Exhibit A
Diamond HSA Medical Option OverviewServices and supplies eligible for coverage must be provided for the purpose of preventing, diagnosing or treating a sickness, injury, disease orsymptom, and meet certain established criteria. If eligible for Medicare, Medicare is primary and the medical option described here is secondary. Thismeans that this option pays the difference between what this option would have paid had it been primary (after deductible and out-of-pocket maximumsare met) and the amount Medicare pays.
2012 Diamond HSA Medical OptionNetwork Non-Network
Annual DeductibleEmployee Only $2,300 $4,600
Employee & Spouse (Individual/Family) $2,300/$3,500 $4,600/$7,000
Employee & Child(ren) (Individual/Family) $2,300/$3,500 $4,600/$7,000
Family (Individual/Family) $2,300/$4,500 $4,600/$9,000
Coinsurance (% paid by plan) Plan pays 90% after Deductible
Plan pays 60% of 140% of MedicareReimbursement Rate after Deductible
(Maximum Non-Network ReimbursementProgram (MNRP) rate (also called the Medicare
Reimbursement Rate). A Medicare-allowablecharge is what the federal Medicare program
would allow as a covered expense).Annual Coinsurance Maximum (Includes Behavioral Health/Substance Abuse and Prescription Drug Benefits; Excludes theDeductible)Employee Only $500 $4,600
Employee & Spouse (Individual/Family) $500/$1,000 $4,600/$7,000
Employee & Child(ren) (Individual/Family) $500/$1,000 $4,600/$7,000
Family (Individual/Family) $500/$1,500 $4,600/$9,000
Annual Pharmacy Maximum None None
Pharmacy Benefit
Once the annual deductible has been met,prescriptions are paid at 90% of the
Network Charge (as part of the medicalbenefit)
Once the annual deductible has been met,prescriptions are paid at 60% of R&C (as part of
the medical benefit)
Note - Although determination of whether a provider is a Network or Non-Network provider will be made at the time the providerrenders the service, the level of benefits shall be those outlined above. For example, if in 2019, Executive seeks services from a providerwho is then a Network provider, but who in 2012 is a Non-Network provider, the benefits noted under the “Network” column shall beprovided. Conversely, if in 2019, Executive seeks services from a provider who is then a Non-Network provider, but who in 2012 is aNetwork Provider, the benefits noted under the Non-Network column shall be provided. Provided however, in any event, the MedicareReimbursement Rate to be used for purposes of determining the level of the Non-Network benefit shall be the Medicare ReimbursementRate at the date the service is provided.
Copyright © 2013 www.secdatabase.com. All Rights Reserved.Please Consider the Environment Before Printing This Document
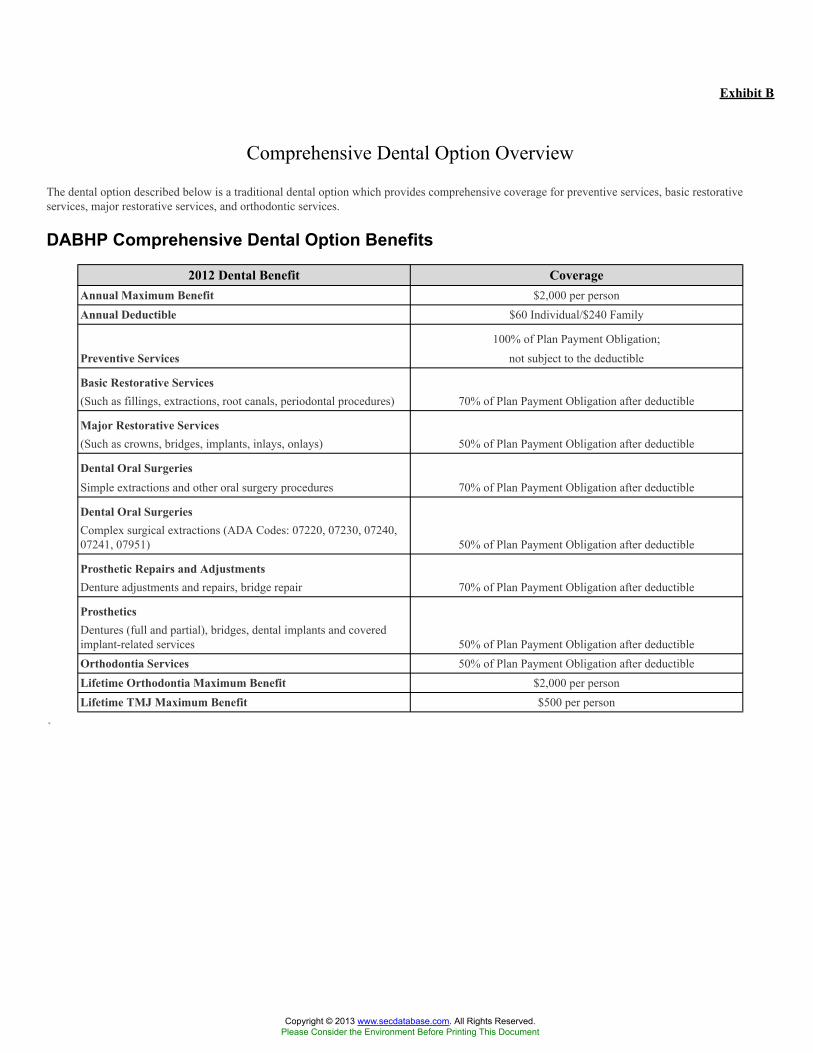
Exhibit B
Comprehensive Dental Option Overview
The dental option described below is a traditional dental option which provides comprehensive coverage for preventive services, basic restorativeservices, major restorative services, and orthodontic services.
DABHP Comprehensive Dental Option Benefits
2012 Dental Benefit CoverageAnnual Maximum Benefit $2,000 per personAnnual Deductible $60 Individual/$240 Family
Preventive Services100% of Plan Payment Obligation;
not subject to the deductible
Basic Restorative Services(Such as fillings, extractions, root canals, periodontal procedures) 70% of Plan Payment Obligation after deductible
Major Restorative Services(Such as crowns, bridges, implants, inlays, onlays) 50% of Plan Payment Obligation after deductible
Dental Oral SurgeriesSimple extractions and other oral surgery procedures 70% of Plan Payment Obligation after deductible
Dental Oral SurgeriesComplex surgical extractions (ADA Codes: 07220, 07230, 07240,07241, 07951) 50% of Plan Payment Obligation after deductible
Prosthetic Repairs and AdjustmentsDenture adjustments and repairs, bridge repair 70% of Plan Payment Obligation after deductible
ProstheticsDentures (full and partial), bridges, dental implants and coveredimplant-related services 50% of Plan Payment Obligation after deductibleOrthodontia Services 50% of Plan Payment Obligation after deductibleLifetime Orthodontia Maximum Benefit $2,000 per personLifetime TMJ Maximum Benefit $500 per person
*
Copyright © 2013 www.secdatabase.com. All Rights Reserved.Please Consider the Environment Before Printing This Document
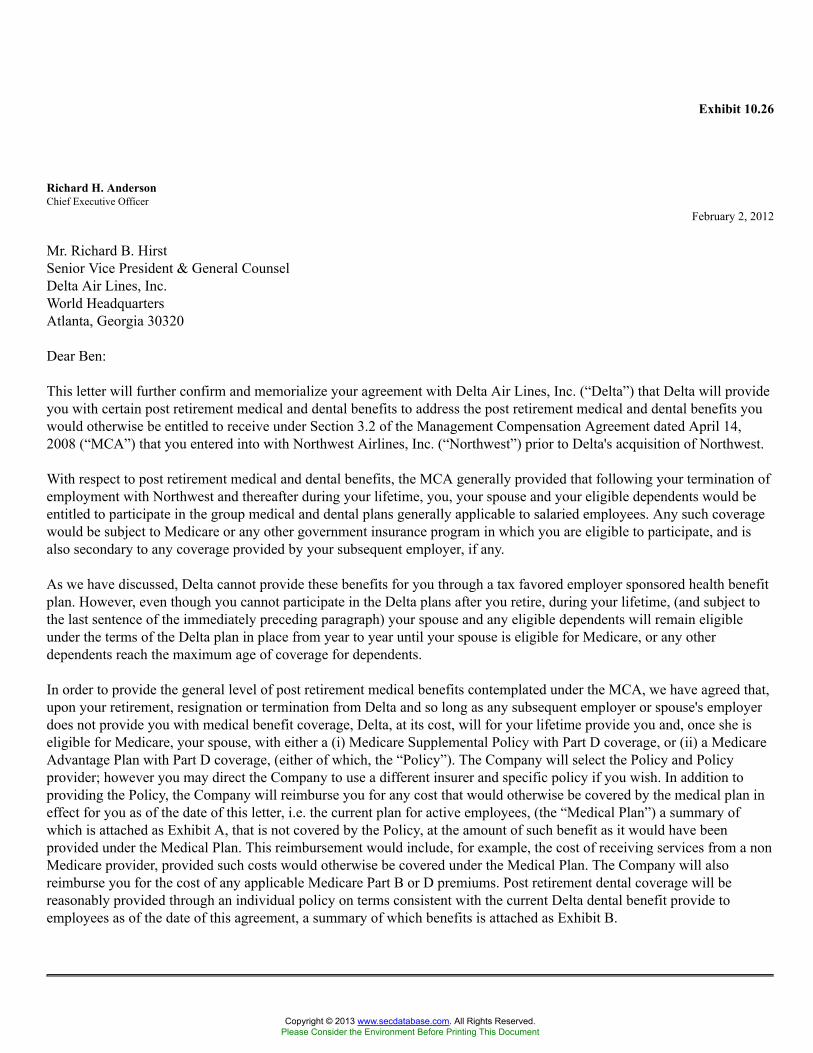
Exhibit 10.26
Richard H. AndersonChief Executive Officer
February 2, 2012
Mr. Richard B. HirstSenior Vice President & General CounselDelta Air Lines, Inc.World HeadquartersAtlanta, Georgia 30320
Dear Ben:
This letter will further confirm and memorialize your agreement with Delta Air Lines, Inc. (“Delta”) that Delta will provideyou with certain post retirement medical and dental benefits to address the post retirement medical and dental benefits youwould otherwise be entitled to receive under Section 3.2 of the Management Compensation Agreement dated April 14,2008 (“MCA”) that you entered into with Northwest Airlines, Inc. (“Northwest”) prior to Delta's acquisition of Northwest.
With respect to post retirement medical and dental benefits, the MCA generally provided that following your termination ofemployment with Northwest and thereafter during your lifetime, you, your spouse and your eligible dependents would beentitled to participate in the group medical and dental plans generally applicable to salaried employees. Any such coveragewould be subject to Medicare or any other government insurance program in which you are eligible to participate, and isalso secondary to any coverage provided by your subsequent employer, if any.
As we have discussed, Delta cannot provide these benefits for you through a tax favored employer sponsored health benefitplan. However, even though you cannot participate in the Delta plans after you retire, during your lifetime, (and subject tothe last sentence of the immediately preceding paragraph) your spouse and any eligible dependents will remain eligibleunder the terms of the Delta plan in place from year to year until your spouse is eligible for Medicare, or any otherdependents reach the maximum age of coverage for dependents.
In order to provide the general level of post retirement medical benefits contemplated under the MCA, we have agreed that,upon your retirement, resignation or termination from Delta and so long as any subsequent employer or spouse's employerdoes not provide you with medical benefit coverage, Delta, at its cost, will for your lifetime provide you and, once she iseligible for Medicare, your spouse, with either a (i) Medicare Supplemental Policy with Part D coverage, or (ii) a MedicareAdvantage Plan with Part D coverage, (either of which, the “Policy”). The Company will select the Policy and Policyprovider; however you may direct the Company to use a different insurer and specific policy if you wish. In addition toproviding the Policy, the Company will reimburse you for any cost that would otherwise be covered by the medical plan ineffect for you as of the date of this letter, i.e. the current plan for active employees, (the “Medical Plan”) a summary ofwhich is attached as Exhibit A, that is not covered by the Policy, at the amount of such benefit as it would have beenprovided under the Medical Plan. This reimbursement would include, for example, the cost of receiving services from a nonMedicare provider, provided such costs would otherwise be covered under the Medical Plan. The Company will alsoreimburse you for the cost of any applicable Medicare Part B or D premiums. Post retirement dental coverage will bereasonably provided through an individual policy on terms consistent with the current Delta dental benefit provide toemployees as of the date of this agreement, a summary of which benefits is attached as Exhibit B.
Copyright © 2013 www.secdatabase.com. All Rights Reserved.Please Consider the Environment Before Printing This Document
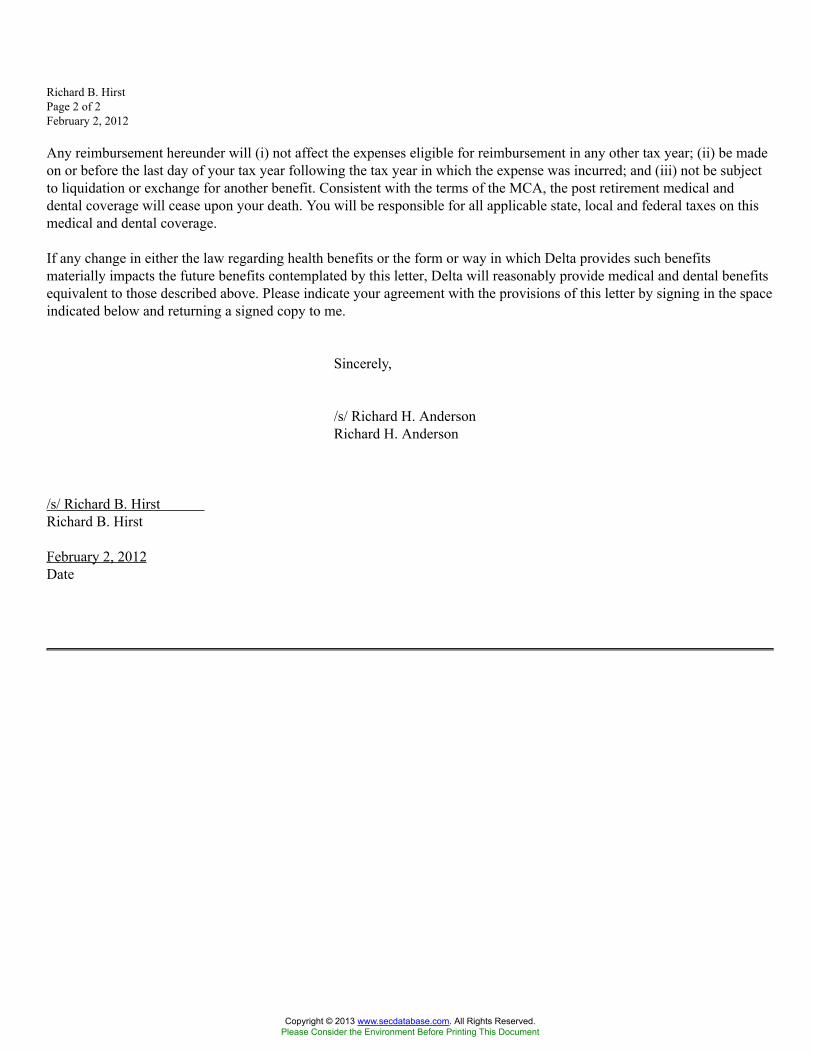
Richard B. HirstPage 2 of 2February 2, 2012
Any reimbursement hereunder will (i) not affect the expenses eligible for reimbursement in any other tax year; (ii) be madeon or before the last day of your tax year following the tax year in which the expense was incurred; and (iii) not be subjectto liquidation or exchange for another benefit. Consistent with the terms of the MCA, the post retirement medical anddental coverage will cease upon your death. You will be responsible for all applicable state, local and federal taxes on thismedical and dental coverage.
If any change in either the law regarding health benefits or the form or way in which Delta provides such benefitsmaterially impacts the future benefits contemplated by this letter, Delta will reasonably provide medical and dental benefitsequivalent to those described above. Please indicate your agreement with the provisions of this letter by signing in the spaceindicated below and returning a signed copy to me.
Sincerely,
/s/ Richard H. AndersonRichard H. Anderson
/s/ Richard B. HirstRichard B. Hirst
February 2, 2012Date
Copyright © 2013 www.secdatabase.com. All Rights Reserved.Please Consider the Environment Before Printing This Document
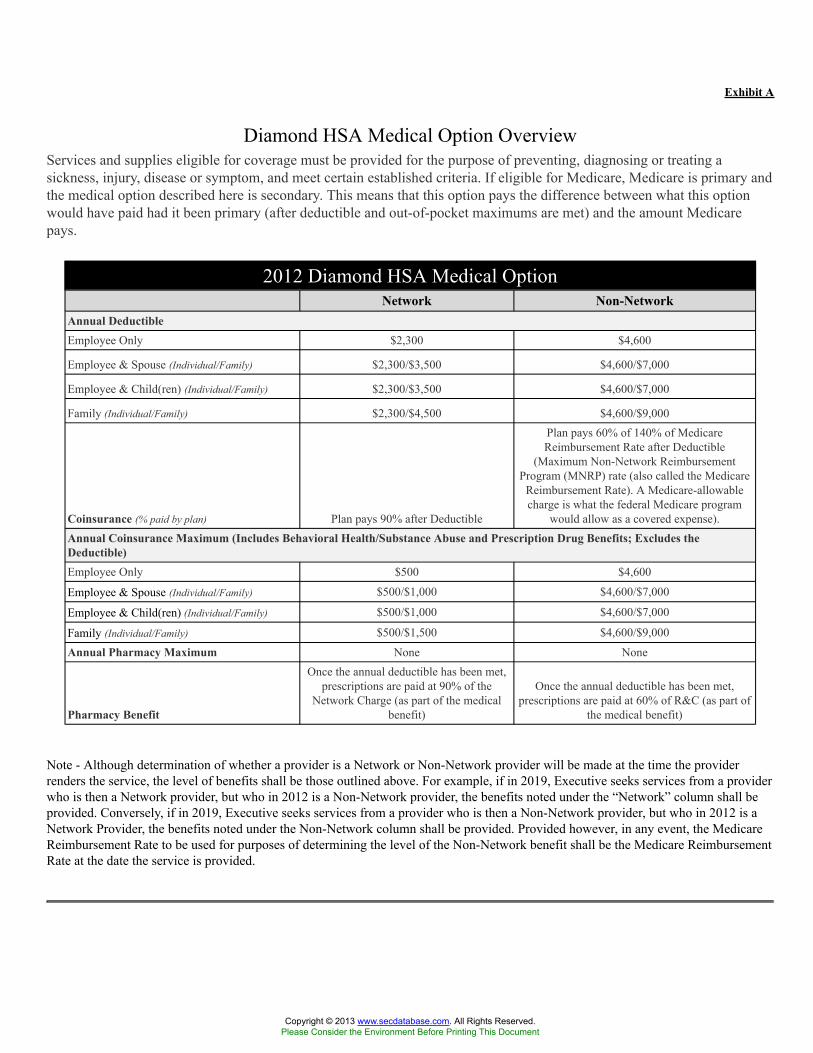
Exhibit A
Diamond HSA Medical Option OverviewServices and supplies eligible for coverage must be provided for the purpose of preventing, diagnosing or treating asickness, injury, disease or symptom, and meet certain established criteria. If eligible for Medicare, Medicare is primary andthe medical option described here is secondary. This means that this option pays the difference between what this optionwould have paid had it been primary (after deductible and out-of-pocket maximums are met) and the amount Medicarepays.
2012 Diamond HSA Medical OptionNetwork Non-Network
Annual DeductibleEmployee Only $2,300 $4,600
Employee & Spouse (Individual/Family) $2,300/$3,500 $4,600/$7,000
Employee & Child(ren) (Individual/Family) $2,300/$3,500 $4,600/$7,000
Family (Individual/Family) $2,300/$4,500 $4,600/$9,000
Coinsurance (% paid by plan) Plan pays 90% after Deductible
Plan pays 60% of 140% of MedicareReimbursement Rate after Deductible
(Maximum Non-Network ReimbursementProgram (MNRP) rate (also called the Medicare
Reimbursement Rate). A Medicare-allowablecharge is what the federal Medicare program
would allow as a covered expense).Annual Coinsurance Maximum (Includes Behavioral Health/Substance Abuse and Prescription Drug Benefits; Excludes theDeductible)Employee Only $500 $4,600
Employee & Spouse (Individual/Family) $500/$1,000 $4,600/$7,000
Employee & Child(ren) (Individual/Family) $500/$1,000 $4,600/$7,000
Family (Individual/Family) $500/$1,500 $4,600/$9,000
Annual Pharmacy Maximum None None
Pharmacy Benefit
Once the annual deductible has been met,prescriptions are paid at 90% of the
Network Charge (as part of the medicalbenefit)
Once the annual deductible has been met,prescriptions are paid at 60% of R&C (as part of
the medical benefit)
Note - Although determination of whether a provider is a Network or Non-Network provider will be made at the time the providerrenders the service, the level of benefits shall be those outlined above. For example, if in 2019, Executive seeks services from a providerwho is then a Network provider, but who in 2012 is a Non-Network provider, the benefits noted under the “Network” column shall beprovided. Conversely, if in 2019, Executive seeks services from a provider who is then a Non-Network provider, but who in 2012 is aNetwork Provider, the benefits noted under the Non-Network column shall be provided. Provided however, in any event, the MedicareReimbursement Rate to be used for purposes of determining the level of the Non-Network benefit shall be the Medicare ReimbursementRate at the date the service is provided.
Copyright © 2013 www.secdatabase.com. All Rights Reserved.Please Consider the Environment Before Printing This Document
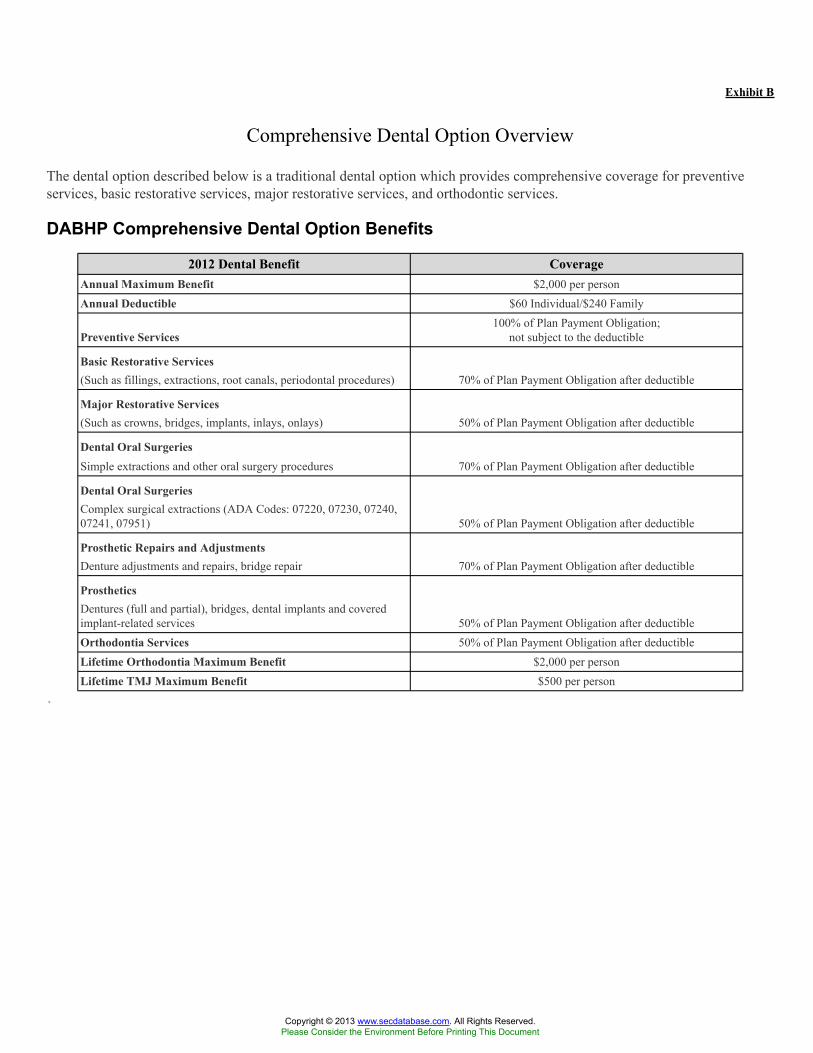
Exhibit B
Comprehensive Dental Option Overview
The dental option described below is a traditional dental option which provides comprehensive coverage for preventiveservices, basic restorative services, major restorative services, and orthodontic services.
DABHP Comprehensive Dental Option Benefits
2012 Dental Benefit CoverageAnnual Maximum Benefit $2,000 per personAnnual Deductible $60 Individual/$240 Family
Preventive Services100% of Plan Payment Obligation;
not subject to the deductible
Basic Restorative Services(Such as fillings, extractions, root canals, periodontal procedures) 70% of Plan Payment Obligation after deductible
Major Restorative Services(Such as crowns, bridges, implants, inlays, onlays) 50% of Plan Payment Obligation after deductible
Dental Oral SurgeriesSimple extractions and other oral surgery procedures 70% of Plan Payment Obligation after deductible
Dental Oral SurgeriesComplex surgical extractions (ADA Codes: 07220, 07230, 07240,07241, 07951) 50% of Plan Payment Obligation after deductible
Prosthetic Repairs and AdjustmentsDenture adjustments and repairs, bridge repair 70% of Plan Payment Obligation after deductible
ProstheticsDentures (full and partial), bridges, dental implants and coveredimplant-related services 50% of Plan Payment Obligation after deductibleOrthodontia Services 50% of Plan Payment Obligation after deductibleLifetime Orthodontia Maximum Benefit $2,000 per personLifetime TMJ Maximum Benefit $500 per person
*
Copyright © 2013 www.secdatabase.com. All Rights Reserved.Please Consider the Environment Before Printing This Document
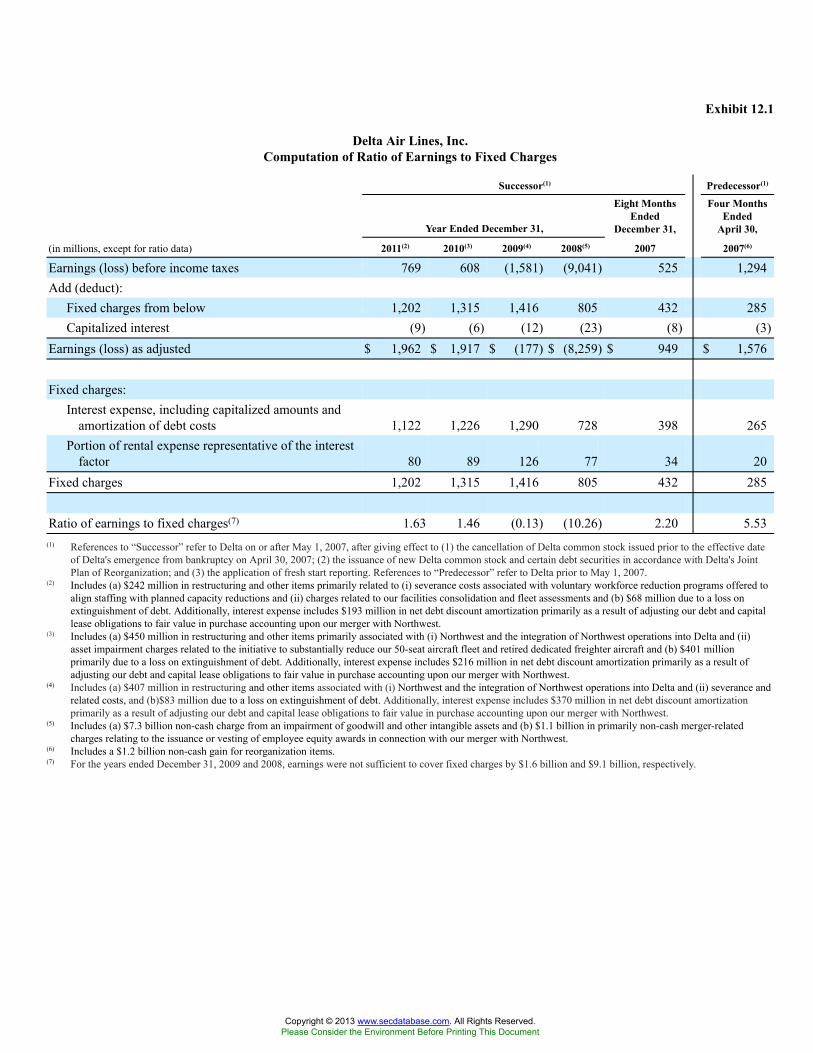
Exhibit 12.1
Delta Air Lines, Inc.Computation of Ratio of Earnings to Fixed Charges
Successor(1) Predecessor(1)
Year Ended December 31,
Eight MonthsEnded
December 31,
Four MonthsEnded
April 30,
(in millions, except for ratio data) 2011(2) 2010(3) 2009(4) 2008(5) 2007 2007(6)
Earnings (loss) before income taxes 769 608 (1,581) (9,041) 525 1,294Add (deduct):
Fixed charges from below 1,202 1,315 1,416 805 432 285Capitalized interest (9) (6) (12) (23) (8) (3)
Earnings (loss) as adjusted $ 1,962 $ 1,917 $ (177) $ (8,259) $ 949 $ 1,576
Fixed charges:Interest expense, including capitalized amounts and
amortization of debt costs 1,122 1,226 1,290 728 398 265Portion of rental expense representative of the interest
factor 80 89 126 77 34 20Fixed charges 1,202 1,315 1,416 805 432 285
Ratio of earnings to fixed charges(7) 1.63 1.46 (0.13) (10.26) 2.20 5.53(1) References to “Successor” refer to Delta on or after May 1, 2007, after giving effect to (1) the cancellation of Delta common stock issued prior to the effective date
of Delta's emergence from bankruptcy on April 30, 2007; (2) the issuance of new Delta common stock and certain debt securities in accordance with Delta's JointPlan of Reorganization; and (3) the application of fresh start reporting. References to “Predecessor” refer to Delta prior to May 1, 2007.
(2) Includes (a) $242 million in restructuring and other items primarily related to (i) severance costs associated with voluntary workforce reduction programs offered toalign staffing with planned capacity reductions and (ii) charges related to our facilities consolidation and fleet assessments and (b) $68 million due to a loss onextinguishment of debt. Additionally, interest expense includes $193 million in net debt discount amortization primarily as a result of adjusting our debt and capitallease obligations to fair value in purchase accounting upon our merger with Northwest.
(3) Includes (a) $450 million in restructuring and other items primarily associated with (i) Northwest and the integration of Northwest operations into Delta and (ii)asset impairment charges related to the initiative to substantially reduce our 50-seat aircraft fleet and retired dedicated freighter aircraft and (b) $401 millionprimarily due to a loss on extinguishment of debt. Additionally, interest expense includes $216 million in net debt discount amortization primarily as a result ofadjusting our debt and capital lease obligations to fair value in purchase accounting upon our merger with Northwest.
(4) Includes (a) $407 million in restructuring and other items associated with (i) Northwest and the integration of Northwest operations into Delta and (ii) severance andrelated costs, and (b)$83 million due to a loss on extinguishment of debt. Additionally, interest expense includes $370 million in net debt discount amortizationprimarily as a result of adjusting our debt and capital lease obligations to fair value in purchase accounting upon our merger with Northwest.
(5) Includes (a) $7.3 billion non-cash charge from an impairment of goodwill and other intangible assets and (b) $1.1 billion in primarily non-cash merger-relatedcharges relating to the issuance or vesting of employee equity awards in connection with our merger with Northwest.
(6) Includes a $1.2 billion non-cash gain for reorganization items.(7) For the years ended December 31, 2009 and 2008, earnings were not sufficient to cover fixed charges by $1.6 billion and $9.1 billion, respectively.
Copyright © 2013 www.secdatabase.com. All Rights Reserved.Please Consider the Environment Before Printing This Document
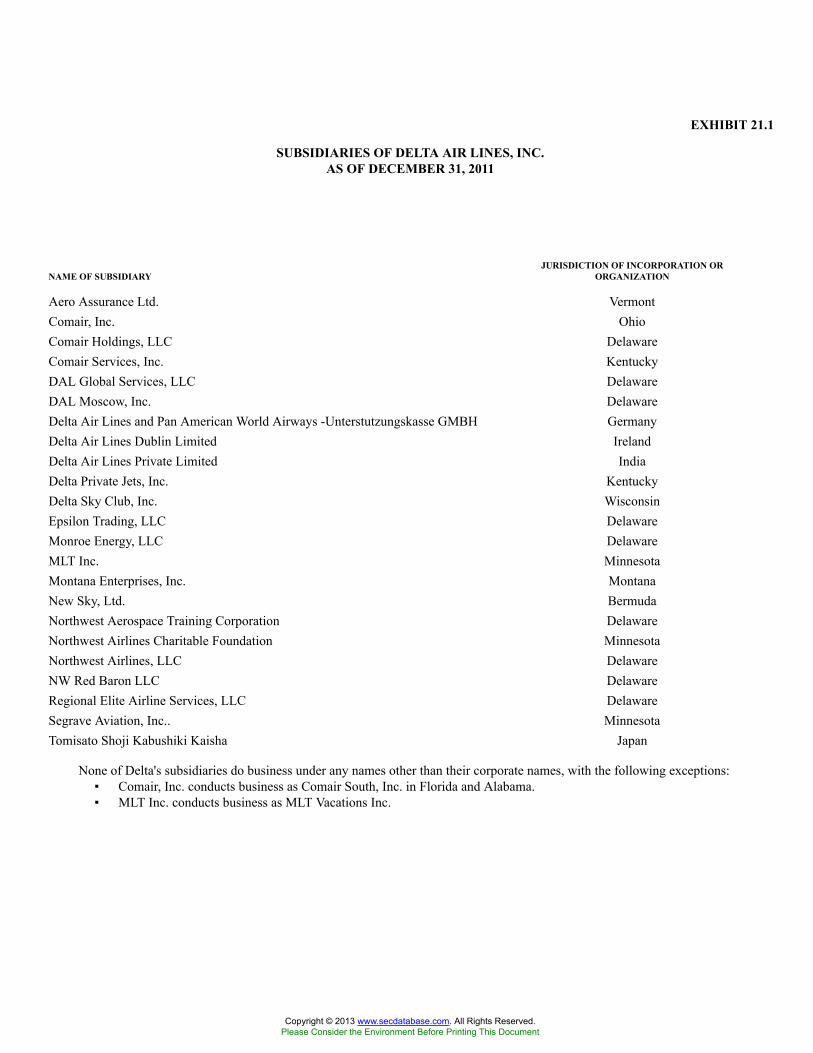
EXHIBIT 21.1
SUBSIDIARIES OF DELTA AIR LINES, INC.AS OF DECEMBER 31, 2011
NAME OF SUBSIDIARYJURISDICTION OF INCORPORATION OR
ORGANIZATION
Aero Assurance Ltd. VermontComair, Inc. OhioComair Holdings, LLC DelawareComair Services, Inc. KentuckyDAL Global Services, LLC DelawareDAL Moscow, Inc. DelawareDelta Air Lines and Pan American World Airways -Unterstutzungskasse GMBH GermanyDelta Air Lines Dublin Limited IrelandDelta Air Lines Private Limited IndiaDelta Private Jets, Inc. KentuckyDelta Sky Club, Inc. WisconsinEpsilon Trading, LLC DelawareMonroe Energy, LLC DelawareMLT Inc. MinnesotaMontana Enterprises, Inc. MontanaNew Sky, Ltd. BermudaNorthwest Aerospace Training Corporation DelawareNorthwest Airlines Charitable Foundation MinnesotaNorthwest Airlines, LLC DelawareNW Red Baron LLC DelawareRegional Elite Airline Services, LLC DelawareSegrave Aviation, Inc.. MinnesotaTomisato Shoji Kabushiki Kaisha Japan
None of Delta's subsidiaries do business under any names other than their corporate names, with the following exceptions:▪ Comair, Inc. conducts business as Comair South, Inc. in Florida and Alabama.▪ MLT Inc. conducts business as MLT Vacations Inc.
Copyright © 2013 www.secdatabase.com. All Rights Reserved.Please Consider the Environment Before Printing This Document
Exhibit 23.1
Consent of Independent Registered Public Accounting Firm
We consent to the incorporation by reference in the following Registration Statements:
(1) Registration Statement No. 333-142424 on Form S-8 pertaining to Delta Air Lines, Inc. 2007 PerformanceCompensation Plan,
(2) Registration Statement No. 333-149308 on Form S-8 pertaining to Delta Air Lines, Inc. 2007 PerformanceCompensation Plan,
(3) Registration Statement No. 333-154818 on Form S-8 pertaining to Delta Air Lines, Inc. 2007 PerformanceCompensation Plan,
(4) Registration Statement No. 333-151060 on Form S-8 pertaining to Northwest Airlines Corporation 2007Stock Incentive Plan, and
(5) Registration Statement No. 333-167811 on Form S-3 pertaining to Pass Through Certificates;
of our reports dated February 10, 2012, with respect to the consolidated financial statements of Delta Air Lines,Inc., and the effectiveness of internal control over financial reporting of Delta Air Lines, Inc. included in thisAnnual Report (Form 10-K) of Delta Air Lines, Inc. for the year ended December 31, 2011.
/s/ Ernst & Young LLPAtlanta, Georgia
February 10, 2012
Copyright © 2013 www.secdatabase.com. All Rights Reserved.Please Consider the Environment Before Printing This Document
Exhibit 31.1
I, Richard H. Anderson, certify that:
1. I have reviewed this annual report on Form 10‑K of Delta Air Lines, Inc. (“Delta”) for the fiscal year ended December 31,2011;
2. Based on my knowledge, this report does not contain any untrue statement of a material fact or omit to state a material factnecessary to make the statements made, in light of the circumstances under which such statements were made, not misleading withrespect to the period covered by this report;
3. Based on my knowledge, the financial statements, and other financial information included in this report, fairly present inall material respects the financial condition, results of operations and cash flows of Delta as of, and for, the periods presented in thisreport;
4. Delta's other certifying officer and I are responsible for establishing and maintaining disclosure controls and procedures (asdefined in Exchange Act Rules 13a-15(e) and 15d-15(e)) and internal control over financial reporting (as defined in Exchange Act Rules13a-15(f) and 15d-15(f)) for Delta and have:
(a) Designed such disclosure controls and procedures, or caused such disclosure controls and procedures to bedesigned under our supervision, to ensure that material information relating to Delta, including its consolidated subsidiaries, is madeknown to us by others within those entities, particularly during the period in which this report is being prepared;
(b) Designed such internal control over financial reporting, or caused such internal control over financial reporting tobe designed under our supervision, to provide reasonable assurance regarding the reliability of financial reporting and the preparation offinancial statements for external purposes in accordance with generally accepted accounting principles;
(c) Evaluated the effectiveness of Delta's disclosure controls and procedures and presented in this report ourconclusions about the effectiveness of the disclosure controls and procedures, as of the end of the period covered by this report based onsuch evaluation; and
(d) Disclosed in this report any change in Delta's internal control over financial reporting that occurred during Delta'smost recent fiscal quarter that has materially affected, or is reasonably likely to materially affect, Delta's internal control over financialreporting; and
5. Delta's other certifying officer and I have disclosed, based on our most recent evaluation of internal control over financialreporting, to Delta's auditors and the Audit Committee of Delta's Board of Directors (or persons performing the equivalent functions):
(a) All significant deficiencies and material weaknesses in the design or operation of internal control over financialreporting which are reasonably likely to adversely affect Delta's ability to record, process, summarize and report financial information;and
(b) Any fraud, whether or not material, that involves management or other employees who have a significant role inDelta's internal control over financial reporting.
February 10, 2012 /s/ Richard H. AndersonRichard H. AndersonChief Executive Officer
Copyright © 2013 www.secdatabase.com. All Rights Reserved.Please Consider the Environment Before Printing This Document
Exhibit 31.2
I, Hank Halter, certify that:
1. I have reviewed this annual report on Form 10‑K of Delta Air Lines, Inc. (“Delta”) for the fiscal year ended December 31,2011;
2. Based on my knowledge, this report does not contain any untrue statement of a material fact or omit to state a material factnecessary to make the statements made, in light of the circumstances under which such statements were made, not misleading withrespect to the period covered by this report;
3. Based on my knowledge, the financial statements, and other financial information included in this report, fairly present inall material respects the financial condition, results of operations and cash flows of Delta as of, and for, the periods presented in thisreport;
4. Delta's other certifying officer and I are responsible for establishing and maintaining disclosure controls and procedures (asdefined in Exchange Act Rules 13a-15(e) and 15d-15(e)) and internal control over financial reporting (as defined in Exchange Act Rules13a-15(f) and 15d-15(f)) for Delta and have:
(a) Designed such disclosure controls and procedures, or caused such disclosure controls and procedures to bedesigned under our supervision, to ensure that material information relating to Delta, including its consolidated subsidiaries, is madeknown to us by others within those entities, particularly during the period in which this report is being prepared;
(b) Designed such internal control over financial reporting, or caused such internal control over financial reporting tobe designed under our supervision, to provide reasonable assurance regarding the reliability of financial reporting and the preparation offinancial statements for external purposes in accordance with generally accepted accounting principles;
(c) Evaluated the effectiveness of Delta's disclosure controls and procedures and presented in this report ourconclusions about the effectiveness of the disclosure controls and procedures, as of the end of the period covered by this report based onsuch evaluation; and
(d) Disclosed in this report any change in Delta's internal control over financial reporting that occurred during Delta'smost recent fiscal quarter that has materially affected, or is reasonably likely to materially affect, Delta's internal control over financialreporting; and
5. Delta's other certifying officer and I have disclosed, based on our most recent evaluation of internal control over financialreporting, to Delta's auditors and the Audit Committee of Delta's Board of Directors (or persons performing the equivalent functions):
(a) All significant deficiencies and material weaknesses in the design or operation of internal control over financialreporting which are reasonably likely to adversely affect Delta's ability to record, process, summarize and report financial information;and
(b) Any fraud, whether or not material, that involves management or other employees who have a significant role inDelta's internal control over financial reporting.
February 10, 2012 /s/ Hank HalterHank HalterSenior Vice President andChief Financial Officer
Copyright © 2013 www.secdatabase.com. All Rights Reserved.Please Consider the Environment Before Printing This Document
Exhibit 32
February 10, 2012
Securities and Exchange Commission450 Fifth Street, N.W.Washington, D.C. 20549
Ladies and Gentlemen:
The certifications set forth below are hereby submitted to the Securities and Exchange Commission pursuant to,and solely for the purpose of complying with, Section 1350 of Chapter 63 of Title 18 of the United States Code inconnection with the filing on the date hereof with the Securities and Exchange Commission of the Annual Report on Form10‑K of Delta Air Lines, Inc. (“Delta”) for the fiscal year ended December 31, 2011 (the “Report”).
Each of the undersigned, the Chief Executive Officer and the Senior Vice President and Chief Financial Officer,respectively, of Delta, hereby certifies that, as of the end of the period covered by the Report:
1. such Report fully complies with the requirements of Section 13(a) of the Securities Exchange Act of 1934; and
2. the information contained in the Report fairly presents, in all material respects, the financial condition andresults of operations of Delta.
/s/ Richard H. AndersonRichard H. AndersonChief Executive Officer
/s/ Hank HalterHank HalterSenior Vice President andChief Financial Officer
Copyright © 2013 www.secdatabase.com. All Rights Reserved.Please Consider the Environment Before Printing This Document
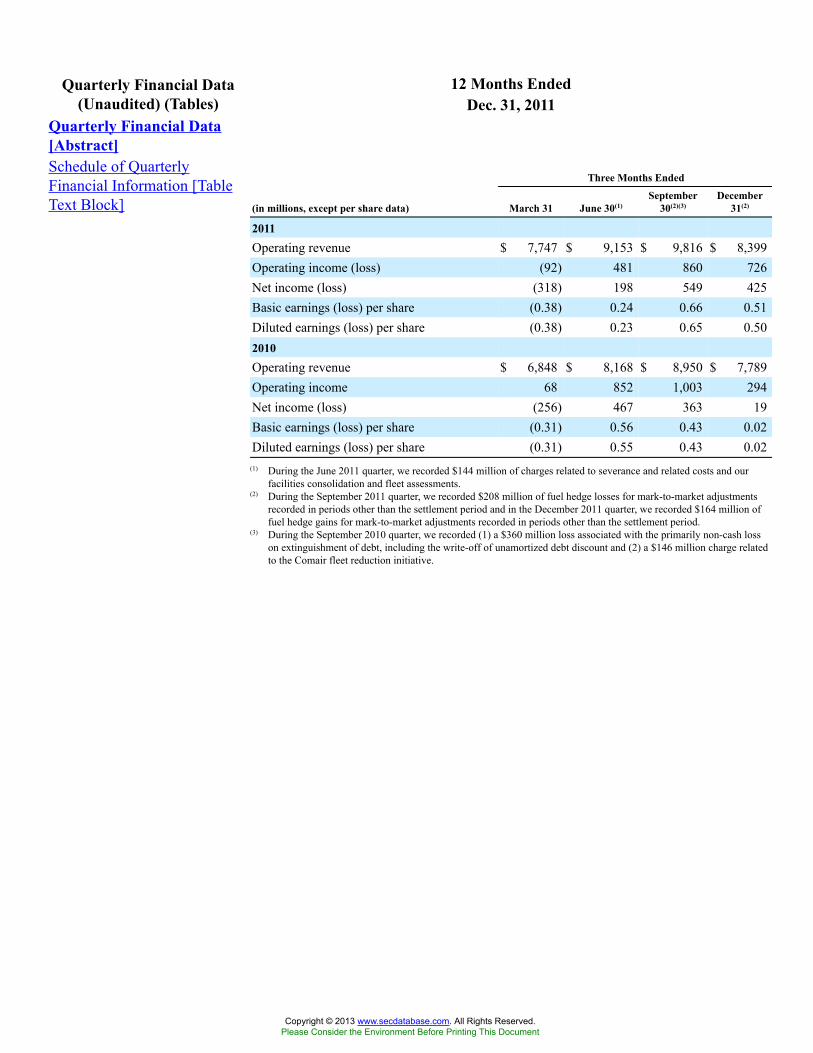
12 Months EndedQuarterly Financial Data(Unaudited) (Tables) Dec. 31, 2011
Quarterly Financial Data[Abstract]Schedule of QuarterlyFinancial Information [TableText Block]
Three Months Ended
(in millions, except per share data) March 31 June 30(1)September
30(2)(3)December
31(2)
2011Operating revenue $ 7,747 $ 9,153 $ 9,816 $ 8,399Operating income (loss) (92) 481 860 726Net income (loss) (318) 198 549 425Basic earnings (loss) per share (0.38) 0.24 0.66 0.51Diluted earnings (loss) per share (0.38) 0.23 0.65 0.502010Operating revenue $ 6,848 $ 8,168 $ 8,950 $ 7,789Operating income 68 852 1,003 294Net income (loss) (256) 467 363 19Basic earnings (loss) per share (0.31) 0.56 0.43 0.02Diluted earnings (loss) per share (0.31) 0.55 0.43 0.02
(1) During the June 2011 quarter, we recorded $144 million of charges related to severance and related costs and ourfacilities consolidation and fleet assessments.
(2) During the September 2011 quarter, we recorded $208 million of fuel hedge losses for mark-to-market adjustmentsrecorded in periods other than the settlement period and in the December 2011 quarter, we recorded $164 million offuel hedge gains for mark-to-market adjustments recorded in periods other than the settlement period.
(3) During the September 2010 quarter, we recorded (1) a $360 million loss associated with the primarily non-cash losson extinguishment of debt, including the write-off of unamortized debt discount and (2) a $146 million charge relatedto the Comair fleet reduction initiative.
Copyright © 2013 www.secdatabase.com. All Rights Reserved.Please Consider the Environment Before Printing This Document
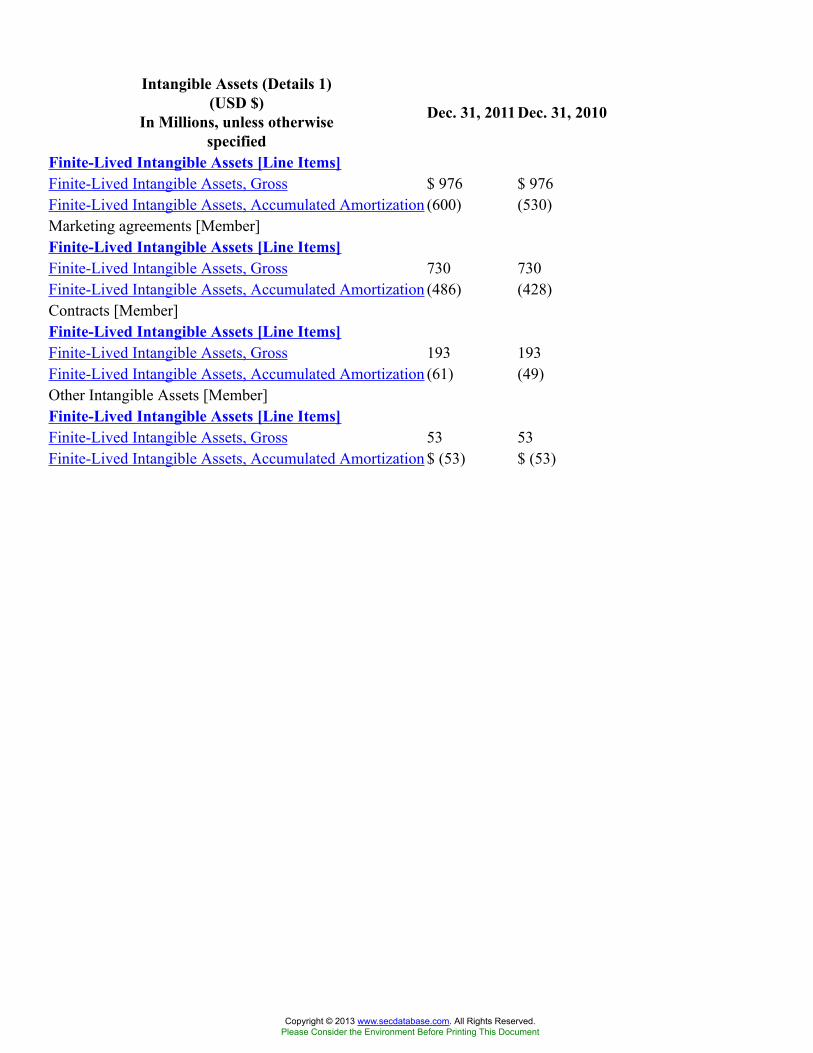
Intangible Assets (Details 1)(USD $)
In Millions, unless otherwisespecified
Dec. 31, 2011Dec. 31, 2010
Finite-Lived Intangible Assets [Line Items]Finite-Lived Intangible Assets, Gross $ 976 $ 976Finite-Lived Intangible Assets, Accumulated Amortization (600) (530)Marketing agreements [Member]Finite-Lived Intangible Assets [Line Items]Finite-Lived Intangible Assets, Gross 730 730Finite-Lived Intangible Assets, Accumulated Amortization (486) (428)Contracts [Member]Finite-Lived Intangible Assets [Line Items]Finite-Lived Intangible Assets, Gross 193 193Finite-Lived Intangible Assets, Accumulated Amortization (61) (49)Other Intangible Assets [Member]Finite-Lived Intangible Assets [Line Items]Finite-Lived Intangible Assets, Gross 53 53Finite-Lived Intangible Assets, Accumulated Amortization $ (53) $ (53)
Copyright © 2013 www.secdatabase.com. All Rights Reserved.Please Consider the Environment Before Printing This Document
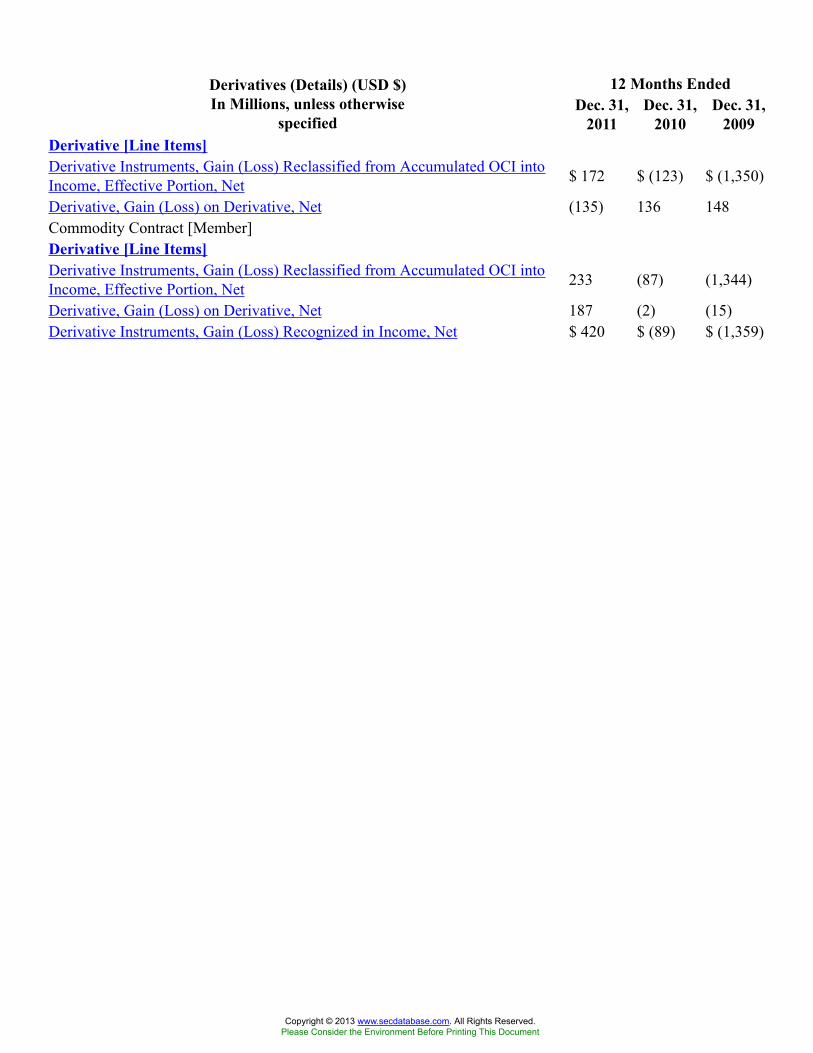
12 Months EndedDerivatives (Details) (USD $)In Millions, unless otherwise
specifiedDec. 31,
2011Dec. 31,
2010Dec. 31,
2009Derivative [Line Items]Derivative Instruments, Gain (Loss) Reclassified from Accumulated OCI intoIncome, Effective Portion, Net $ 172 $ (123) $ (1,350)
Derivative, Gain (Loss) on Derivative, Net (135) 136 148Commodity Contract [Member]Derivative [Line Items]Derivative Instruments, Gain (Loss) Reclassified from Accumulated OCI intoIncome, Effective Portion, Net 233 (87) (1,344)
Derivative, Gain (Loss) on Derivative, Net 187 (2) (15)Derivative Instruments, Gain (Loss) Recognized in Income, Net $ 420 $ (89) $ (1,359)
Copyright © 2013 www.secdatabase.com. All Rights Reserved.Please Consider the Environment Before Printing This Document
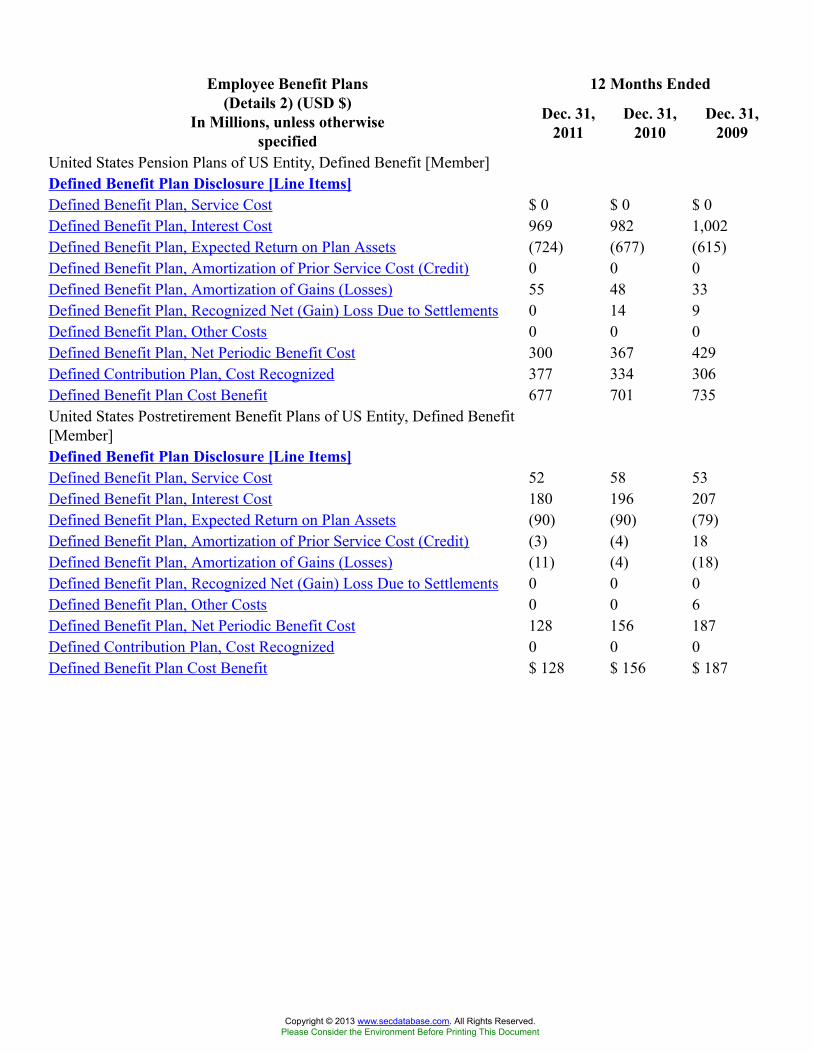
12 Months EndedEmployee Benefit Plans(Details 2) (USD $)
In Millions, unless otherwisespecified
Dec. 31,2011
Dec. 31,2010
Dec. 31,2009
United States Pension Plans of US Entity, Defined Benefit [Member]Defined Benefit Plan Disclosure [Line Items]Defined Benefit Plan, Service Cost $ 0 $ 0 $ 0Defined Benefit Plan, Interest Cost 969 982 1,002Defined Benefit Plan, Expected Return on Plan Assets (724) (677) (615)Defined Benefit Plan, Amortization of Prior Service Cost (Credit) 0 0 0Defined Benefit Plan, Amortization of Gains (Losses) 55 48 33Defined Benefit Plan, Recognized Net (Gain) Loss Due to Settlements 0 14 9Defined Benefit Plan, Other Costs 0 0 0Defined Benefit Plan, Net Periodic Benefit Cost 300 367 429Defined Contribution Plan, Cost Recognized 377 334 306Defined Benefit Plan Cost Benefit 677 701 735United States Postretirement Benefit Plans of US Entity, Defined Benefit[Member]Defined Benefit Plan Disclosure [Line Items]Defined Benefit Plan, Service Cost 52 58 53Defined Benefit Plan, Interest Cost 180 196 207Defined Benefit Plan, Expected Return on Plan Assets (90) (90) (79)Defined Benefit Plan, Amortization of Prior Service Cost (Credit) (3) (4) 18Defined Benefit Plan, Amortization of Gains (Losses) (11) (4) (18)Defined Benefit Plan, Recognized Net (Gain) Loss Due to Settlements 0 0 0Defined Benefit Plan, Other Costs 0 0 6Defined Benefit Plan, Net Periodic Benefit Cost 128 156 187Defined Contribution Plan, Cost Recognized 0 0 0Defined Benefit Plan Cost Benefit $ 128 $ 156 $ 187
Copyright © 2013 www.secdatabase.com. All Rights Reserved.Please Consider the Environment Before Printing This Document
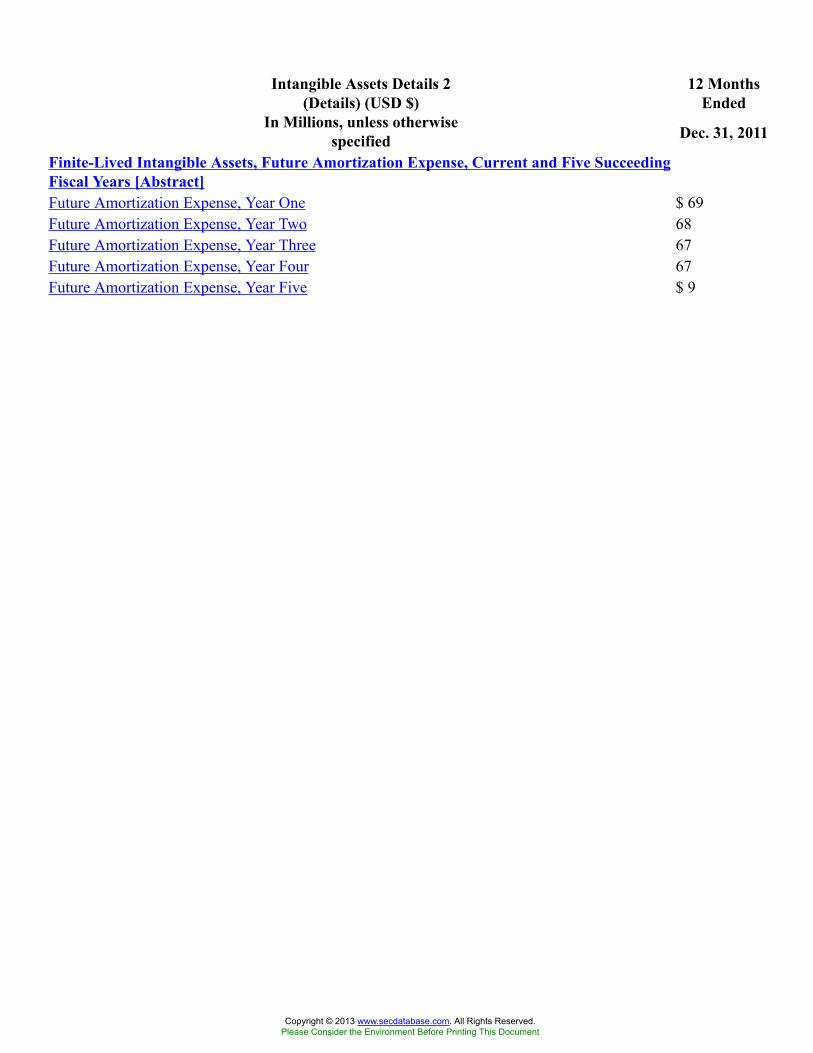
12 MonthsEnded
Intangible Assets Details 2(Details) (USD $)
In Millions, unless otherwisespecified Dec. 31, 2011
Finite-Lived Intangible Assets, Future Amortization Expense, Current and Five SucceedingFiscal Years [Abstract]Future Amortization Expense, Year One $ 69Future Amortization Expense, Year Two 68Future Amortization Expense, Year Three 67Future Amortization Expense, Year Four 67Future Amortization Expense, Year Five $ 9
Copyright © 2013 www.secdatabase.com. All Rights Reserved.Please Consider the Environment Before Printing This Document
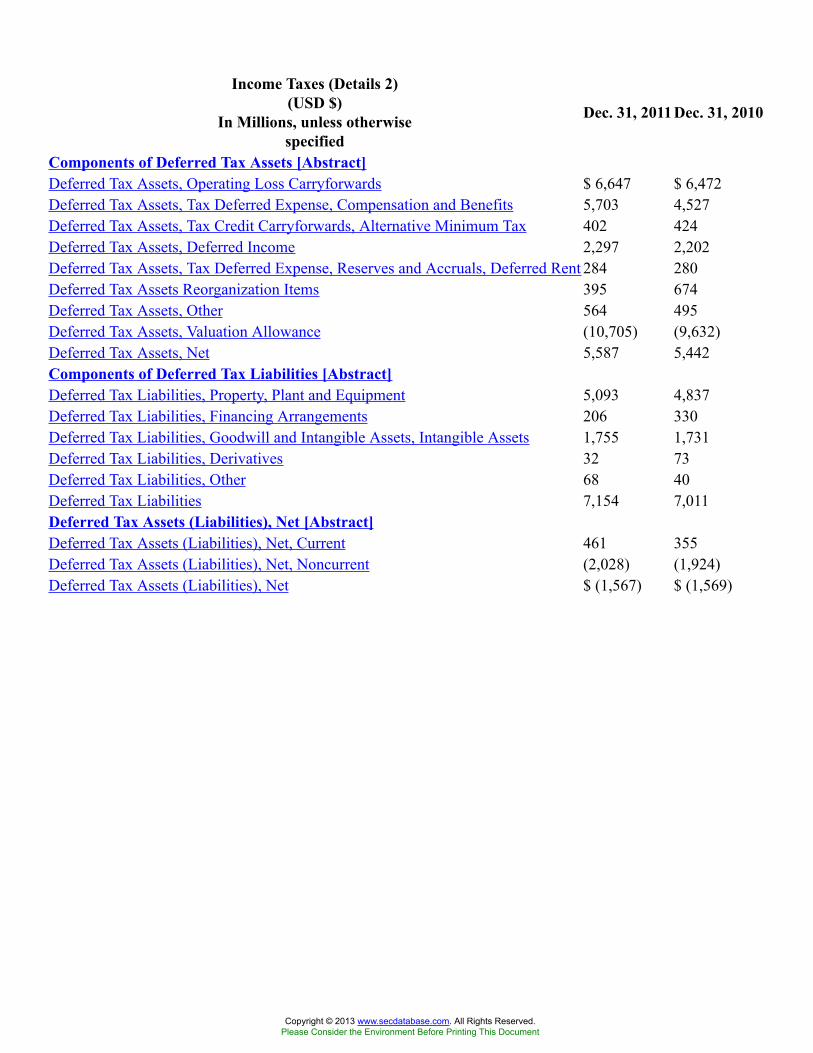
Income Taxes (Details 2)(USD $)
In Millions, unless otherwisespecified
Dec. 31, 2011Dec. 31, 2010
Components of Deferred Tax Assets [Abstract]Deferred Tax Assets, Operating Loss Carryforwards $ 6,647 $ 6,472Deferred Tax Assets, Tax Deferred Expense, Compensation and Benefits 5,703 4,527Deferred Tax Assets, Tax Credit Carryforwards, Alternative Minimum Tax 402 424Deferred Tax Assets, Deferred Income 2,297 2,202Deferred Tax Assets, Tax Deferred Expense, Reserves and Accruals, Deferred Rent 284 280Deferred Tax Assets Reorganization Items 395 674Deferred Tax Assets, Other 564 495Deferred Tax Assets, Valuation Allowance (10,705) (9,632)Deferred Tax Assets, Net 5,587 5,442Components of Deferred Tax Liabilities [Abstract]Deferred Tax Liabilities, Property, Plant and Equipment 5,093 4,837Deferred Tax Liabilities, Financing Arrangements 206 330Deferred Tax Liabilities, Goodwill and Intangible Assets, Intangible Assets 1,755 1,731Deferred Tax Liabilities, Derivatives 32 73Deferred Tax Liabilities, Other 68 40Deferred Tax Liabilities 7,154 7,011Deferred Tax Assets (Liabilities), Net [Abstract]Deferred Tax Assets (Liabilities), Net, Current 461 355Deferred Tax Assets (Liabilities), Net, Noncurrent (2,028) (1,924)Deferred Tax Assets (Liabilities), Net $ (1,567) $ (1,569)
Copyright © 2013 www.secdatabase.com. All Rights Reserved.Please Consider the Environment Before Printing This Document
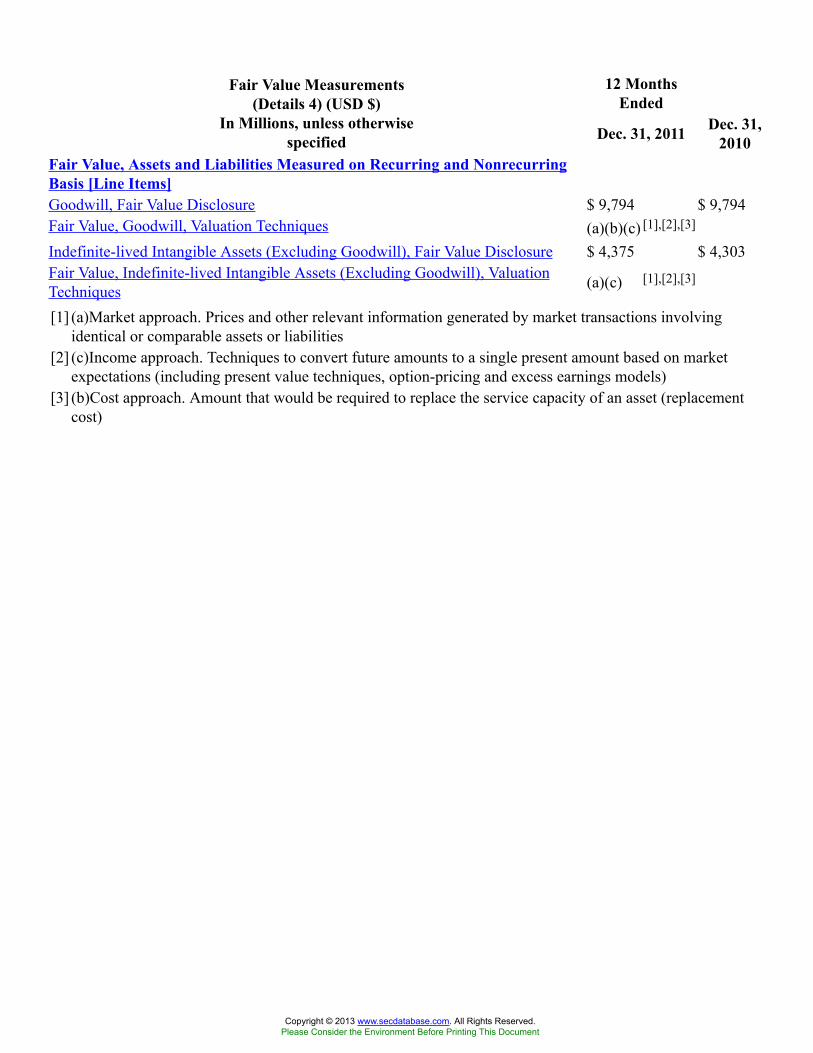
12 MonthsEnded
Fair Value Measurements(Details 4) (USD $)
In Millions, unless otherwisespecified Dec. 31, 2011 Dec. 31,
2010Fair Value, Assets and Liabilities Measured on Recurring and NonrecurringBasis [Line Items]Goodwill, Fair Value Disclosure $ 9,794 $ 9,794Fair Value, Goodwill, Valuation Techniques (a)(b)(c) [1],[2],[3]
Indefinite-lived Intangible Assets (Excluding Goodwill), Fair Value Disclosure $ 4,375 $ 4,303Fair Value, Indefinite-lived Intangible Assets (Excluding Goodwill), ValuationTechniques (a)(c) [1],[2],[3]
[1] (a)Market approach. Prices and other relevant information generated by market transactions involvingidentical or comparable assets or liabilities
[2] (c)Income approach. Techniques to convert future amounts to a single present amount based on marketexpectations (including present value techniques, option-pricing and excess earnings models)
[3] (b)Cost approach. Amount that would be required to replace the service capacity of an asset (replacementcost)
Copyright © 2013 www.secdatabase.com. All Rights Reserved.Please Consider the Environment Before Printing This Document
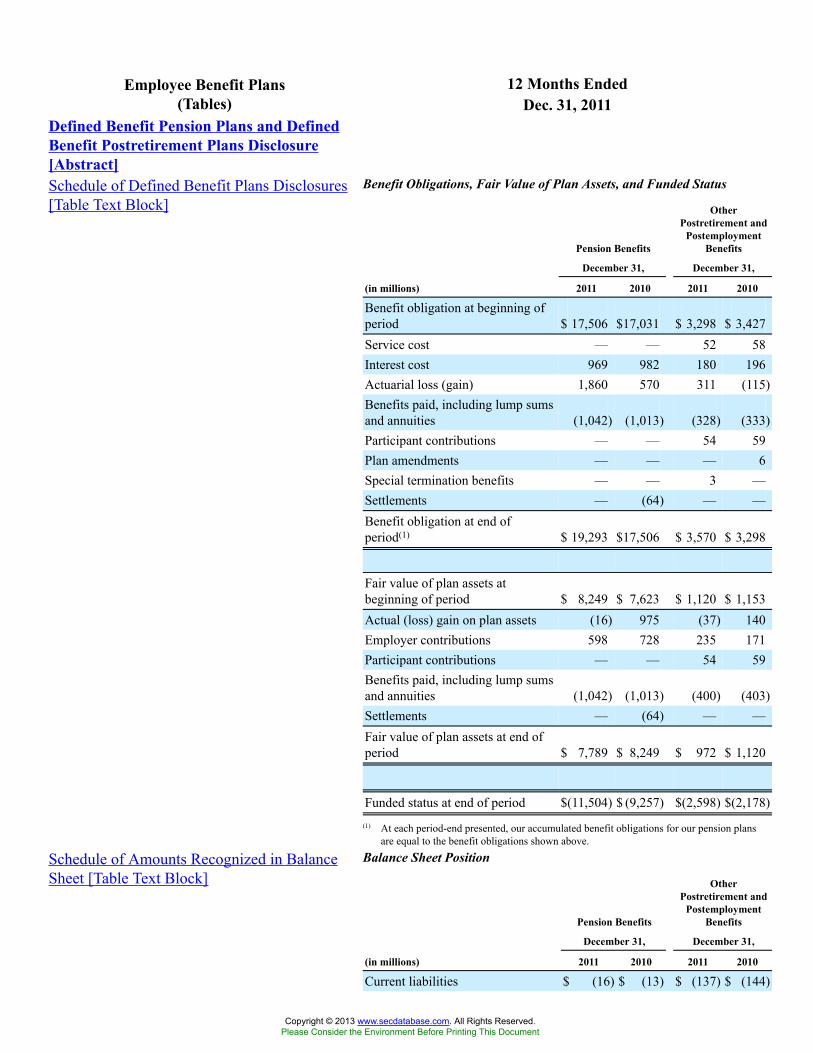
12 Months EndedEmployee Benefit Plans(Tables) Dec. 31, 2011
Defined Benefit Pension Plans and DefinedBenefit Postretirement Plans Disclosure[Abstract]Schedule of Defined Benefit Plans Disclosures[Table Text Block]
Benefit Obligations, Fair Value of Plan Assets, and Funded Status
Pension Benefits
OtherPostretirement and
PostemploymentBenefits
December 31, December 31,
(in millions) 2011 2010 2011 2010
Benefit obligation at beginning ofperiod $ 17,506 $17,031 $ 3,298 $ 3,427Service cost — — 52 58Interest cost 969 982 180 196Actuarial loss (gain) 1,860 570 311 (115)Benefits paid, including lump sumsand annuities (1,042) (1,013) (328) (333)Participant contributions — — 54 59Plan amendments — — — 6Special termination benefits — — 3 —Settlements — (64) — —Benefit obligation at end ofperiod(1) $ 19,293 $17,506 $ 3,570 $ 3,298
Fair value of plan assets atbeginning of period $ 8,249 $ 7,623 $ 1,120 $ 1,153Actual (loss) gain on plan assets (16) 975 (37) 140Employer contributions 598 728 235 171Participant contributions — — 54 59Benefits paid, including lump sumsand annuities (1,042) (1,013) (400) (403)Settlements — (64) — —Fair value of plan assets at end ofperiod $ 7,789 $ 8,249 $ 972 $ 1,120
Funded status at end of period $(11,504) $ (9,257) $(2,598) $(2,178)(1) At each period-end presented, our accumulated benefit obligations for our pension plans
are equal to the benefit obligations shown above.
Schedule of Amounts Recognized in BalanceSheet [Table Text Block]
Balance Sheet Position
Pension Benefits
OtherPostretirement and
PostemploymentBenefits
December 31, December 31,
(in millions) 2011 2010 2011 2010
Current liabilities $ (16) $ (13) $ (137) $ (144)
Copyright © 2013 www.secdatabase.com. All Rights Reserved.Please Consider the Environment Before Printing This Document
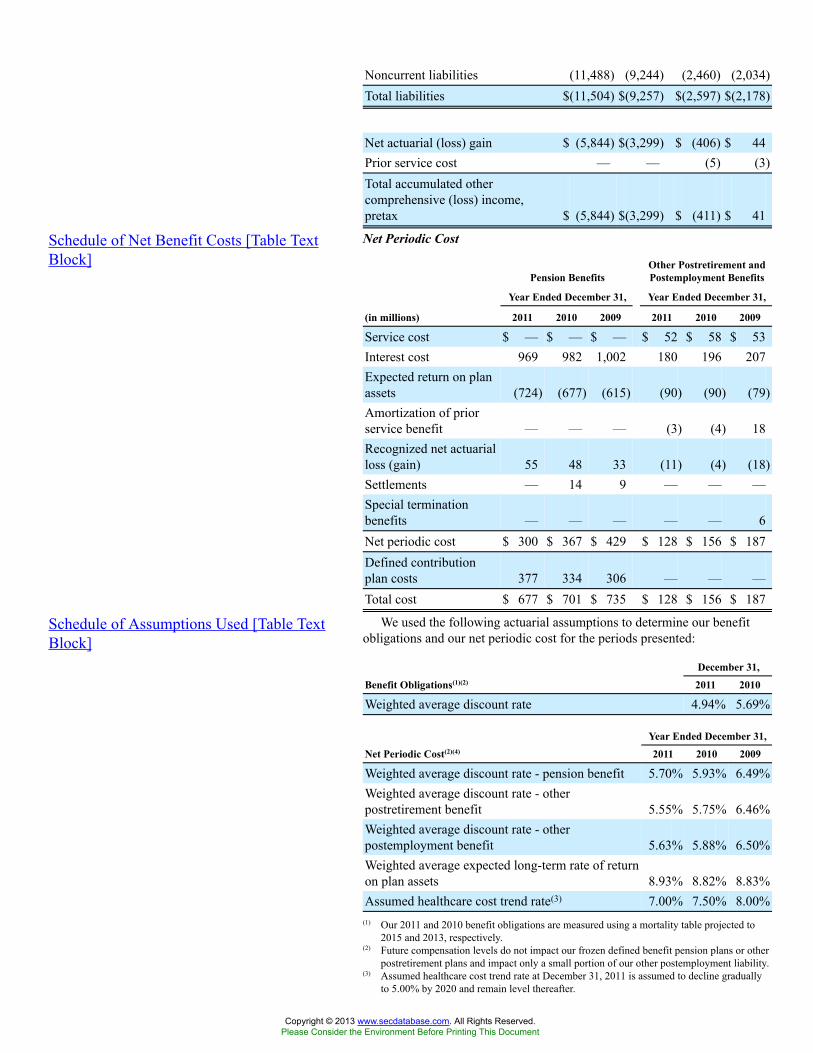
Noncurrent liabilities (11,488) (9,244) (2,460) (2,034)Total liabilities $(11,504) $(9,257) $(2,597) $(2,178)
Net actuarial (loss) gain $ (5,844) $(3,299) $ (406) $ 44Prior service cost — — (5) (3)Total accumulated othercomprehensive (loss) income,pretax $ (5,844) $(3,299) $ (411) $ 41
Schedule of Net Benefit Costs [Table TextBlock]
Net Periodic Cost
Pension BenefitsOther Postretirement andPostemployment Benefits
Year Ended December 31, Year Ended December 31,
(in millions) 2011 2010 2009 2011 2010 2009
Service cost $ — $ — $ — $ 52 $ 58 $ 53Interest cost 969 982 1,002 180 196 207Expected return on planassets (724) (677) (615) (90) (90) (79)Amortization of priorservice benefit — — — (3) (4) 18Recognized net actuarialloss (gain) 55 48 33 (11) (4) (18)Settlements — 14 9 — — —Special terminationbenefits — — — — — 6Net periodic cost $ 300 $ 367 $ 429 $ 128 $ 156 $ 187Defined contributionplan costs 377 334 306 — — —Total cost $ 677 $ 701 $ 735 $ 128 $ 156 $ 187
Schedule of Assumptions Used [Table TextBlock]
We used the following actuarial assumptions to determine our benefitobligations and our net periodic cost for the periods presented:
December 31,
Benefit Obligations(1)(2) 2011 2010
Weighted average discount rate 4.94% 5.69%
Year Ended December 31,
Net Periodic Cost(2)(4) 2011 2010 2009
Weighted average discount rate - pension benefit 5.70% 5.93% 6.49%Weighted average discount rate - otherpostretirement benefit 5.55% 5.75% 6.46%Weighted average discount rate - otherpostemployment benefit 5.63% 5.88% 6.50%Weighted average expected long-term rate of returnon plan assets 8.93% 8.82% 8.83%Assumed healthcare cost trend rate(3) 7.00% 7.50% 8.00%
(1) Our 2011 and 2010 benefit obligations are measured using a mortality table projected to2015 and 2013, respectively.
(2) Future compensation levels do not impact our frozen defined benefit pension plans or otherpostretirement plans and impact only a small portion of our other postemployment liability.
(3) Assumed healthcare cost trend rate at December 31, 2011 is assumed to decline graduallyto 5.00% by 2020 and remain level thereafter.
Copyright © 2013 www.secdatabase.com. All Rights Reserved.Please Consider the Environment Before Printing This Document
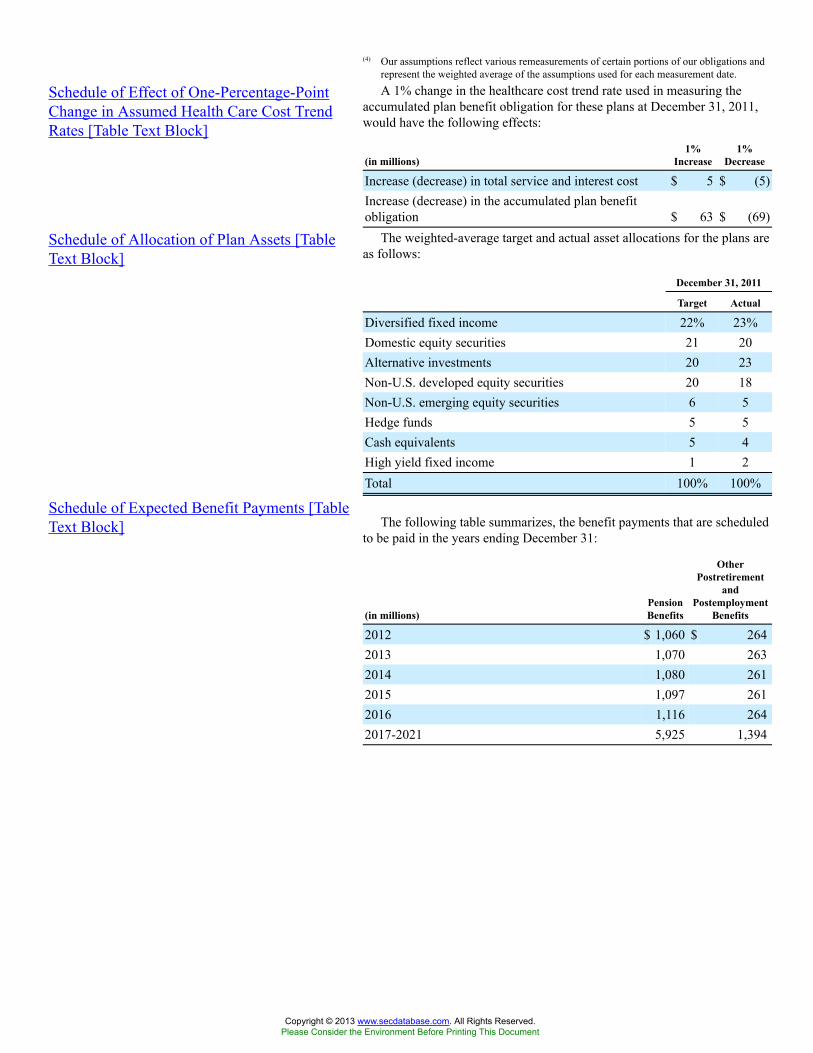
(4) Our assumptions reflect various remeasurements of certain portions of our obligations andrepresent the weighted average of the assumptions used for each measurement date.
Schedule of Effect of One-Percentage-PointChange in Assumed Health Care Cost TrendRates [Table Text Block]
A 1% change in the healthcare cost trend rate used in measuring theaccumulated plan benefit obligation for these plans at December 31, 2011,would have the following effects:
(in millions)1%
Increase1%
Decrease
Increase (decrease) in total service and interest cost $ 5 $ (5)Increase (decrease) in the accumulated plan benefitobligation $ 63 $ (69)
Schedule of Allocation of Plan Assets [TableText Block]
The weighted-average target and actual asset allocations for the plans areas follows:
December 31, 2011
Target Actual
Diversified fixed income 22% 23%Domestic equity securities 21 20Alternative investments 20 23Non-U.S. developed equity securities 20 18Non-U.S. emerging equity securities 6 5Hedge funds 5 5Cash equivalents 5 4High yield fixed income 1 2Total 100% 100%
Schedule of Expected Benefit Payments [TableText Block] The following table summarizes, the benefit payments that are scheduled
to be paid in the years ending December 31:
(in millions)PensionBenefits
OtherPostretirement
andPostemployment
Benefits
2012 $ 1,060 $ 2642013 1,070 2632014 1,080 2612015 1,097 2612016 1,116 2642017-2021 5,925 1,394
Copyright © 2013 www.secdatabase.com. All Rights Reserved.Please Consider the Environment Before Printing This Document
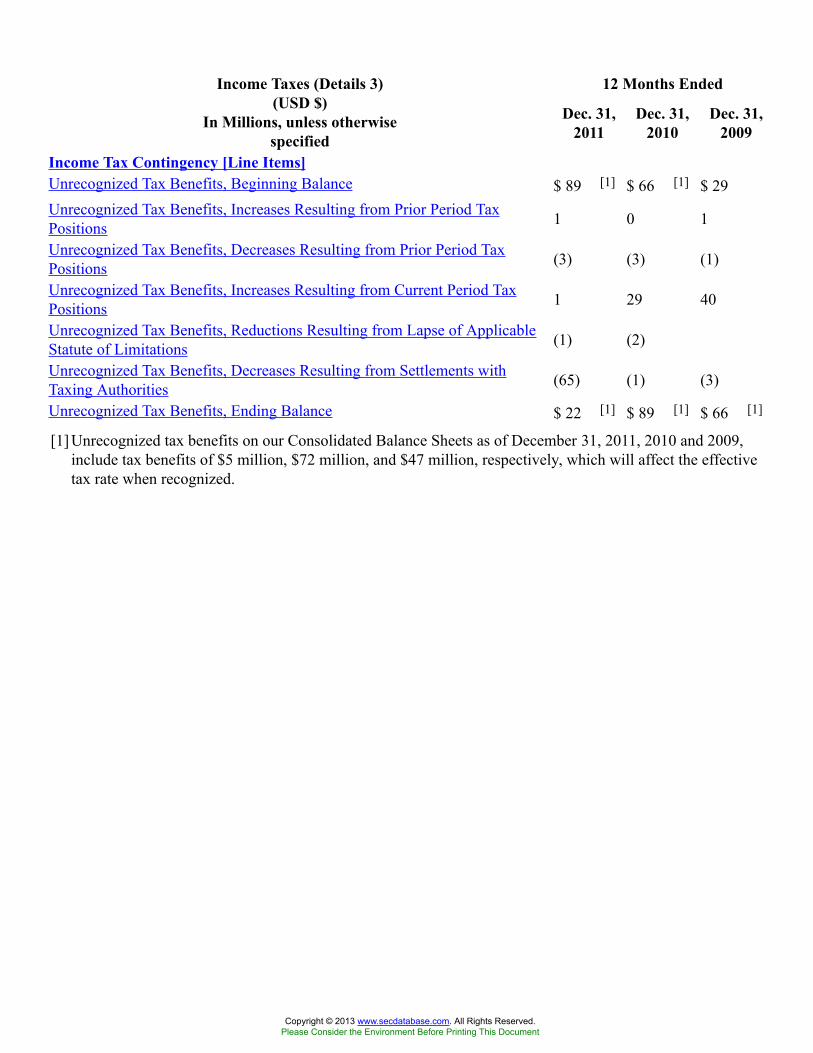
12 Months EndedIncome Taxes (Details 3)(USD $)
In Millions, unless otherwisespecified
Dec. 31,2011
Dec. 31,2010
Dec. 31,2009
Income Tax Contingency [Line Items]Unrecognized Tax Benefits, Beginning Balance $ 89 [1] $ 66 [1] $ 29Unrecognized Tax Benefits, Increases Resulting from Prior Period TaxPositions 1 0 1
Unrecognized Tax Benefits, Decreases Resulting from Prior Period TaxPositions (3) (3) (1)
Unrecognized Tax Benefits, Increases Resulting from Current Period TaxPositions 1 29 40
Unrecognized Tax Benefits, Reductions Resulting from Lapse of ApplicableStatute of Limitations (1) (2)
Unrecognized Tax Benefits, Decreases Resulting from Settlements withTaxing Authorities (65) (1) (3)
Unrecognized Tax Benefits, Ending Balance $ 22 [1] $ 89 [1] $ 66 [1]
[1] Unrecognized tax benefits on our Consolidated Balance Sheets as of December 31, 2011, 2010 and 2009,include tax benefits of $5 million, $72 million, and $47 million, respectively, which will affect the effectivetax rate when recognized.
Copyright © 2013 www.secdatabase.com. All Rights Reserved.Please Consider the Environment Before Printing This Document
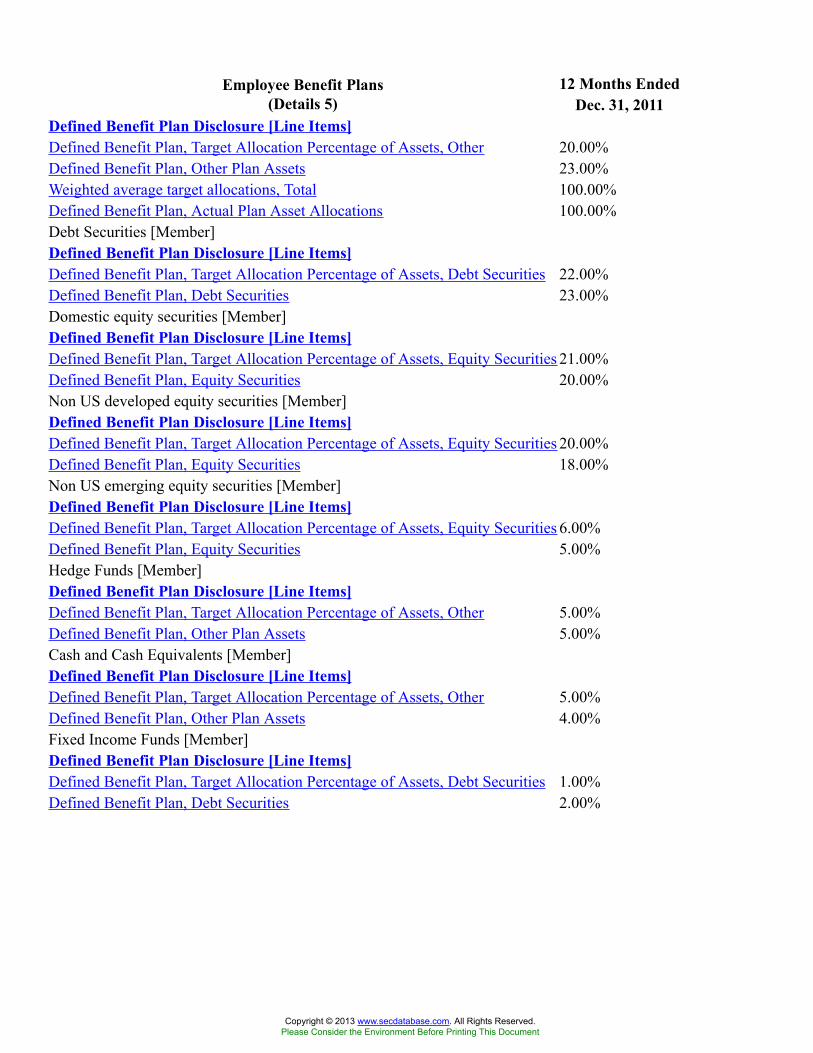
12 Months EndedEmployee Benefit Plans(Details 5) Dec. 31, 2011
Defined Benefit Plan Disclosure [Line Items]Defined Benefit Plan, Target Allocation Percentage of Assets, Other 20.00%Defined Benefit Plan, Other Plan Assets 23.00%Weighted average target allocations, Total 100.00%Defined Benefit Plan, Actual Plan Asset Allocations 100.00%Debt Securities [Member]Defined Benefit Plan Disclosure [Line Items]Defined Benefit Plan, Target Allocation Percentage of Assets, Debt Securities 22.00%Defined Benefit Plan, Debt Securities 23.00%Domestic equity securities [Member]Defined Benefit Plan Disclosure [Line Items]Defined Benefit Plan, Target Allocation Percentage of Assets, Equity Securities 21.00%Defined Benefit Plan, Equity Securities 20.00%Non US developed equity securities [Member]Defined Benefit Plan Disclosure [Line Items]Defined Benefit Plan, Target Allocation Percentage of Assets, Equity Securities 20.00%Defined Benefit Plan, Equity Securities 18.00%Non US emerging equity securities [Member]Defined Benefit Plan Disclosure [Line Items]Defined Benefit Plan, Target Allocation Percentage of Assets, Equity Securities 6.00%Defined Benefit Plan, Equity Securities 5.00%Hedge Funds [Member]Defined Benefit Plan Disclosure [Line Items]Defined Benefit Plan, Target Allocation Percentage of Assets, Other 5.00%Defined Benefit Plan, Other Plan Assets 5.00%Cash and Cash Equivalents [Member]Defined Benefit Plan Disclosure [Line Items]Defined Benefit Plan, Target Allocation Percentage of Assets, Other 5.00%Defined Benefit Plan, Other Plan Assets 4.00%Fixed Income Funds [Member]Defined Benefit Plan Disclosure [Line Items]Defined Benefit Plan, Target Allocation Percentage of Assets, Debt Securities 1.00%Defined Benefit Plan, Debt Securities 2.00%
Copyright © 2013 www.secdatabase.com. All Rights Reserved.Please Consider the Environment Before Printing This Document
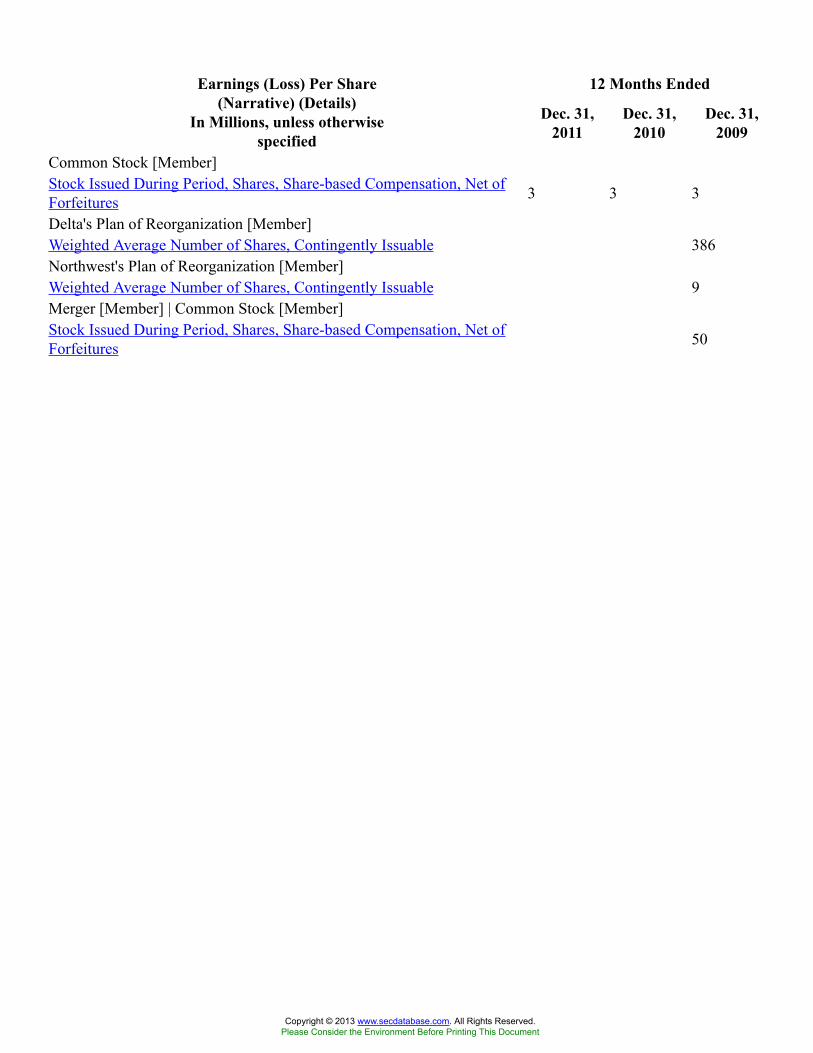
12 Months EndedEarnings (Loss) Per Share(Narrative) (Details)
In Millions, unless otherwisespecified
Dec. 31,2011
Dec. 31,2010
Dec. 31,2009
Common Stock [Member]Stock Issued During Period, Shares, Share-based Compensation, Net ofForfeitures 3 3 3
Delta's Plan of Reorganization [Member]Weighted Average Number of Shares, Contingently Issuable 386Northwest's Plan of Reorganization [Member]Weighted Average Number of Shares, Contingently Issuable 9Merger [Member] | Common Stock [Member]Stock Issued During Period, Shares, Share-based Compensation, Net ofForfeitures 50
Copyright © 2013 www.secdatabase.com. All Rights Reserved.Please Consider the Environment Before Printing This Document
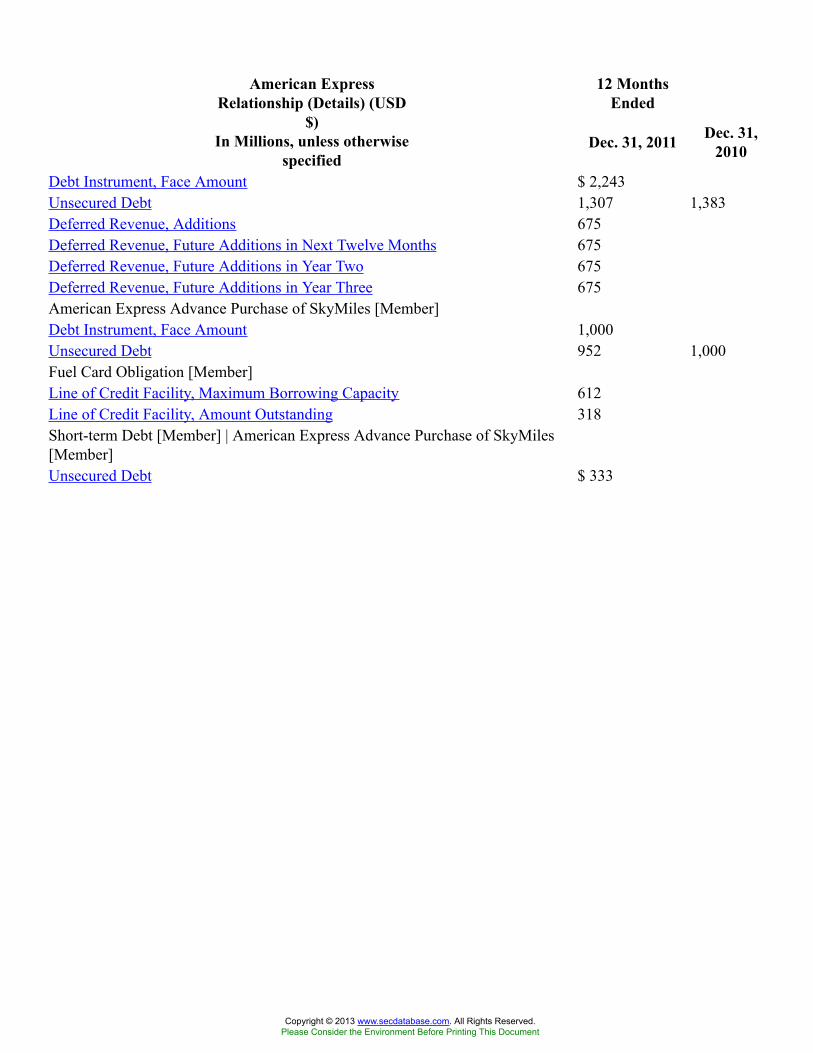
12 MonthsEnded
American ExpressRelationship (Details) (USD
$)In Millions, unless otherwise
specifiedDec. 31, 2011 Dec. 31,
2010
Debt Instrument, Face Amount $ 2,243Unsecured Debt 1,307 1,383Deferred Revenue, Additions 675Deferred Revenue, Future Additions in Next Twelve Months 675Deferred Revenue, Future Additions in Year Two 675Deferred Revenue, Future Additions in Year Three 675American Express Advance Purchase of SkyMiles [Member]Debt Instrument, Face Amount 1,000Unsecured Debt 952 1,000Fuel Card Obligation [Member]Line of Credit Facility, Maximum Borrowing Capacity 612Line of Credit Facility, Amount Outstanding 318Short-term Debt [Member] | American Express Advance Purchase of SkyMiles[Member]Unsecured Debt $ 333
Copyright © 2013 www.secdatabase.com. All Rights Reserved.Please Consider the Environment Before Printing This Document
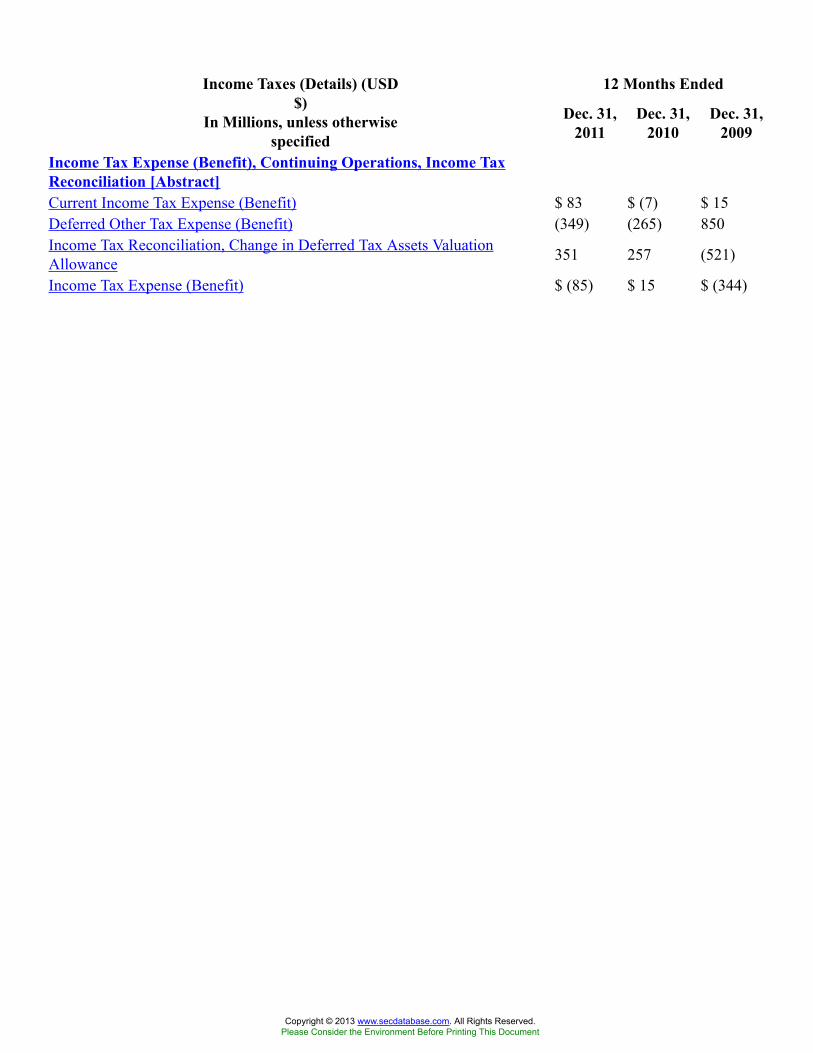
12 Months EndedIncome Taxes (Details) (USD$)
In Millions, unless otherwisespecified
Dec. 31,2011
Dec. 31,2010
Dec. 31,2009
Income Tax Expense (Benefit), Continuing Operations, Income TaxReconciliation [Abstract]Current Income Tax Expense (Benefit) $ 83 $ (7) $ 15Deferred Other Tax Expense (Benefit) (349) (265) 850Income Tax Reconciliation, Change in Deferred Tax Assets ValuationAllowance 351 257 (521)
Income Tax Expense (Benefit) $ (85) $ 15 $ (344)
Copyright © 2013 www.secdatabase.com. All Rights Reserved.Please Consider the Environment Before Printing This Document
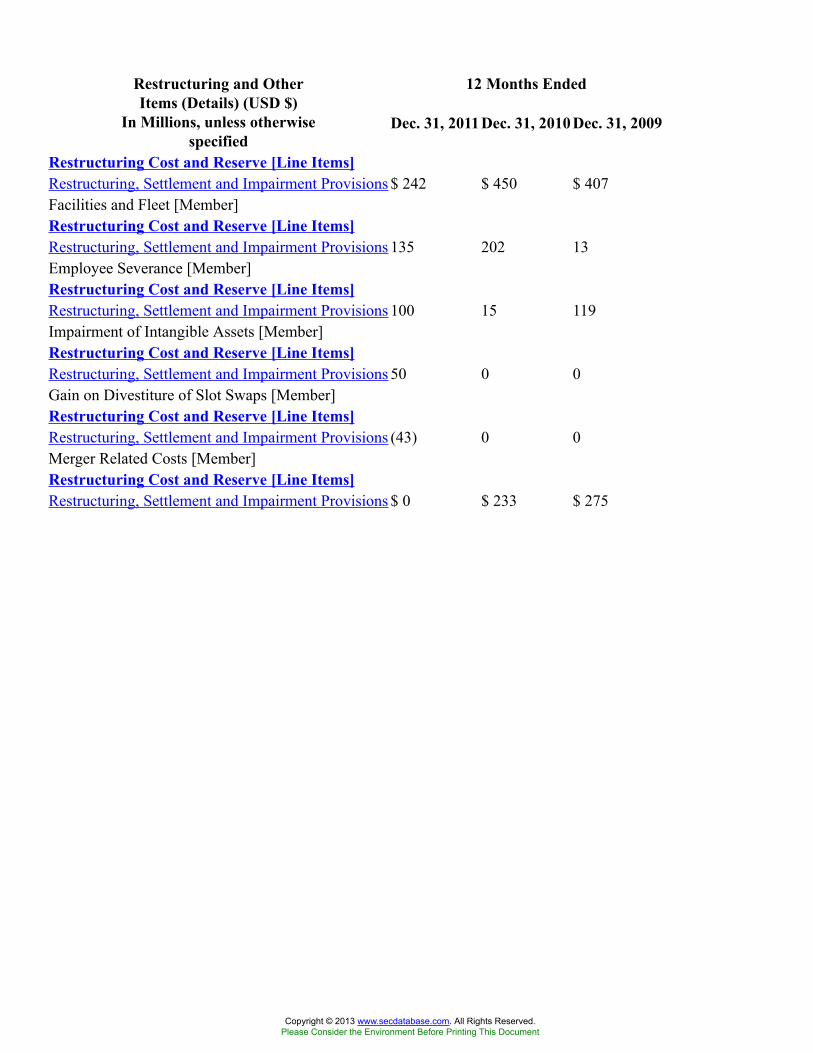
12 Months EndedRestructuring and OtherItems (Details) (USD $)
In Millions, unless otherwisespecified
Dec. 31, 2011Dec. 31, 2010 Dec. 31, 2009
Restructuring Cost and Reserve [Line Items]Restructuring, Settlement and Impairment Provisions $ 242 $ 450 $ 407Facilities and Fleet [Member]Restructuring Cost and Reserve [Line Items]Restructuring, Settlement and Impairment Provisions 135 202 13Employee Severance [Member]Restructuring Cost and Reserve [Line Items]Restructuring, Settlement and Impairment Provisions 100 15 119Impairment of Intangible Assets [Member]Restructuring Cost and Reserve [Line Items]Restructuring, Settlement and Impairment Provisions 50 0 0Gain on Divestiture of Slot Swaps [Member]Restructuring Cost and Reserve [Line Items]Restructuring, Settlement and Impairment Provisions (43) 0 0Merger Related Costs [Member]Restructuring Cost and Reserve [Line Items]Restructuring, Settlement and Impairment Provisions $ 0 $ 233 $ 275
Copyright © 2013 www.secdatabase.com. All Rights Reserved.Please Consider the Environment Before Printing This Document
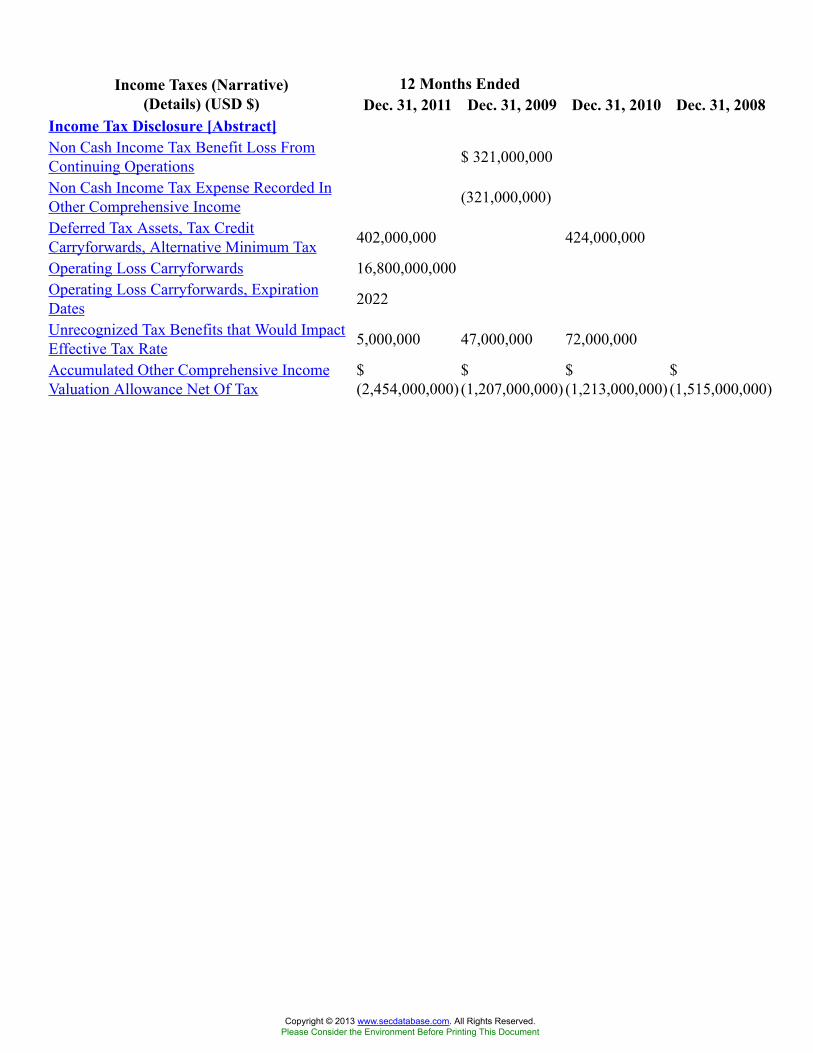
12 Months EndedIncome Taxes (Narrative)(Details) (USD $) Dec. 31, 2011 Dec. 31, 2009 Dec. 31, 2010 Dec. 31, 2008
Income Tax Disclosure [Abstract]Non Cash Income Tax Benefit Loss FromContinuing Operations $ 321,000,000
Non Cash Income Tax Expense Recorded InOther Comprehensive Income (321,000,000)
Deferred Tax Assets, Tax CreditCarryforwards, Alternative Minimum Tax 402,000,000 424,000,000
Operating Loss Carryforwards 16,800,000,000Operating Loss Carryforwards, ExpirationDates 2022
Unrecognized Tax Benefits that Would ImpactEffective Tax Rate 5,000,000 47,000,000 72,000,000
Accumulated Other Comprehensive IncomeValuation Allowance Net Of Tax
$(2,454,000,000)
$(1,207,000,000)
$(1,213,000,000)
$(1,515,000,000)
Copyright © 2013 www.secdatabase.com. All Rights Reserved.Please Consider the Environment Before Printing This Document
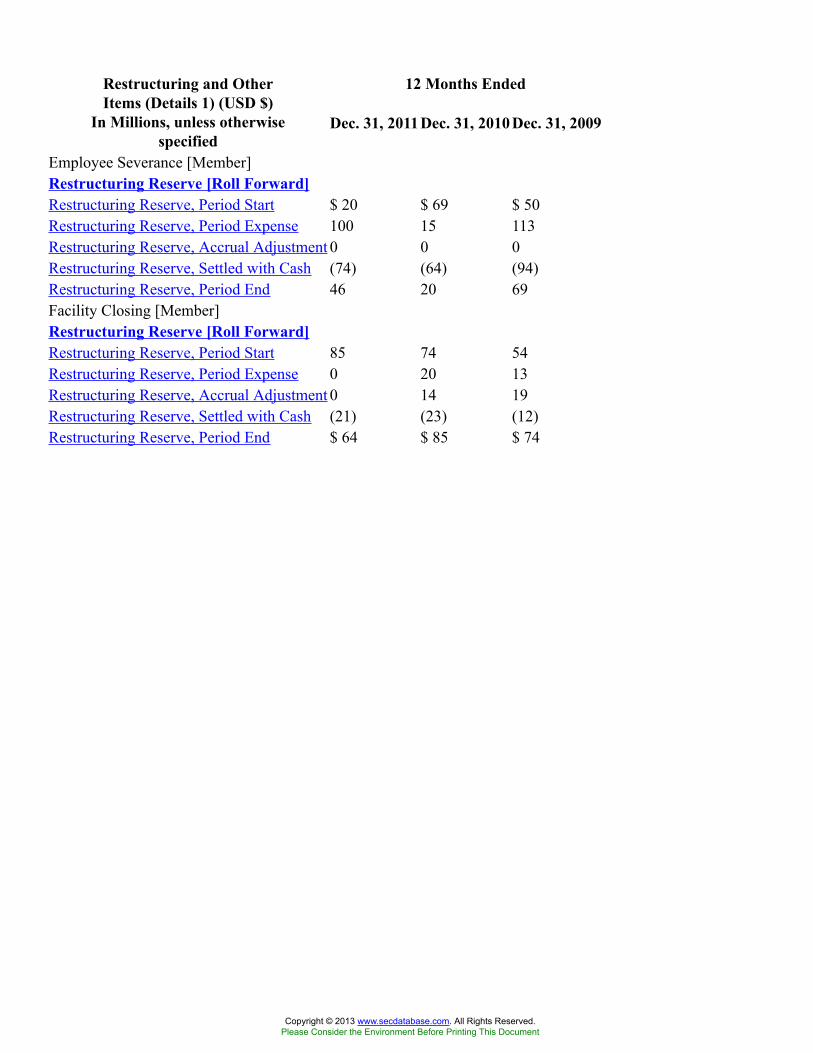
12 Months EndedRestructuring and OtherItems (Details 1) (USD $)
In Millions, unless otherwisespecified
Dec. 31, 2011Dec. 31, 2010 Dec. 31, 2009
Employee Severance [Member]Restructuring Reserve [Roll Forward]Restructuring Reserve, Period Start $ 20 $ 69 $ 50Restructuring Reserve, Period Expense 100 15 113Restructuring Reserve, Accrual Adjustment 0 0 0Restructuring Reserve, Settled with Cash (74) (64) (94)Restructuring Reserve, Period End 46 20 69Facility Closing [Member]Restructuring Reserve [Roll Forward]Restructuring Reserve, Period Start 85 74 54Restructuring Reserve, Period Expense 0 20 13Restructuring Reserve, Accrual Adjustment 0 14 19Restructuring Reserve, Settled with Cash (21) (23) (12)Restructuring Reserve, Period End $ 64 $ 85 $ 74
Copyright © 2013 www.secdatabase.com. All Rights Reserved.Please Consider the Environment Before Printing This Document
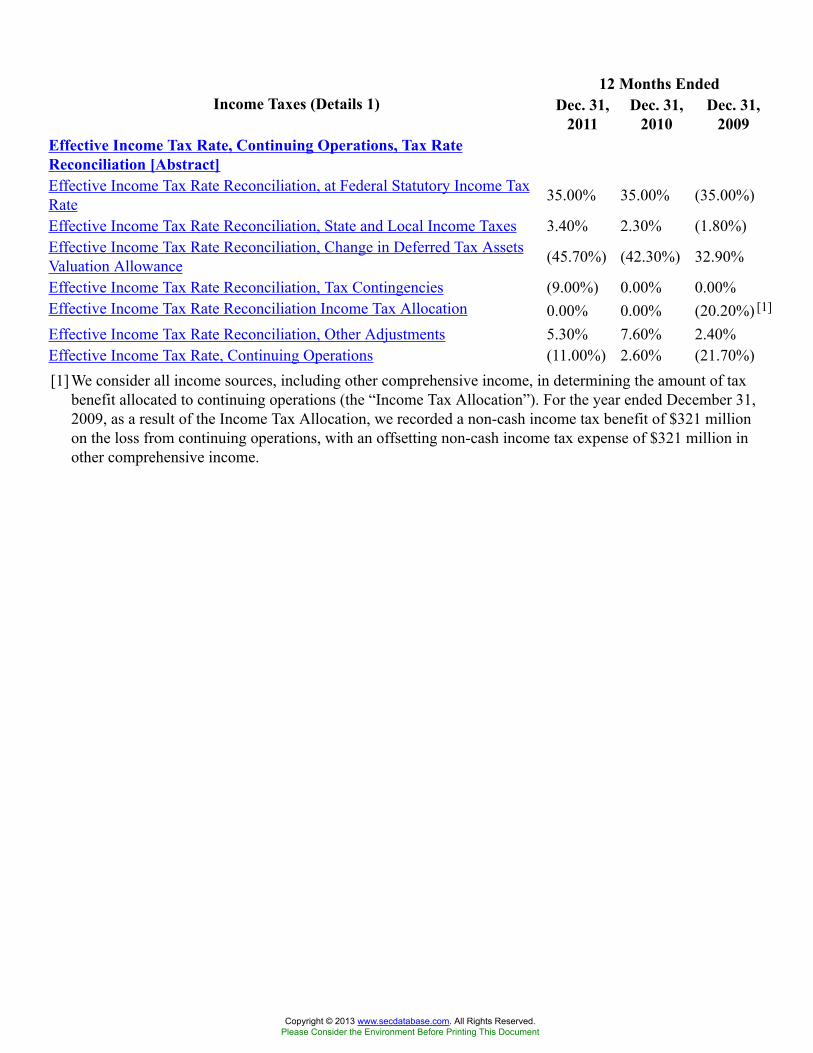
12 Months EndedIncome Taxes (Details 1) Dec. 31,
2011Dec. 31,
2010Dec. 31,
2009Effective Income Tax Rate, Continuing Operations, Tax RateReconciliation [Abstract]Effective Income Tax Rate Reconciliation, at Federal Statutory Income TaxRate 35.00% 35.00% (35.00%)
Effective Income Tax Rate Reconciliation, State and Local Income Taxes 3.40% 2.30% (1.80%)Effective Income Tax Rate Reconciliation, Change in Deferred Tax AssetsValuation Allowance (45.70%) (42.30%) 32.90%
Effective Income Tax Rate Reconciliation, Tax Contingencies (9.00%) 0.00% 0.00%Effective Income Tax Rate Reconciliation Income Tax Allocation 0.00% 0.00% (20.20%) [1]
Effective Income Tax Rate Reconciliation, Other Adjustments 5.30% 7.60% 2.40%Effective Income Tax Rate, Continuing Operations (11.00%) 2.60% (21.70%)[1] We consider all income sources, including other comprehensive income, in determining the amount of tax
benefit allocated to continuing operations (the “Income Tax Allocation”). For the year ended December 31,2009, as a result of the Income Tax Allocation, we recorded a non-cash income tax benefit of $321 millionon the loss from continuing operations, with an offsetting non-cash income tax expense of $321 million inother comprehensive income.
Copyright © 2013 www.secdatabase.com. All Rights Reserved.Please Consider the Environment Before Printing This Document
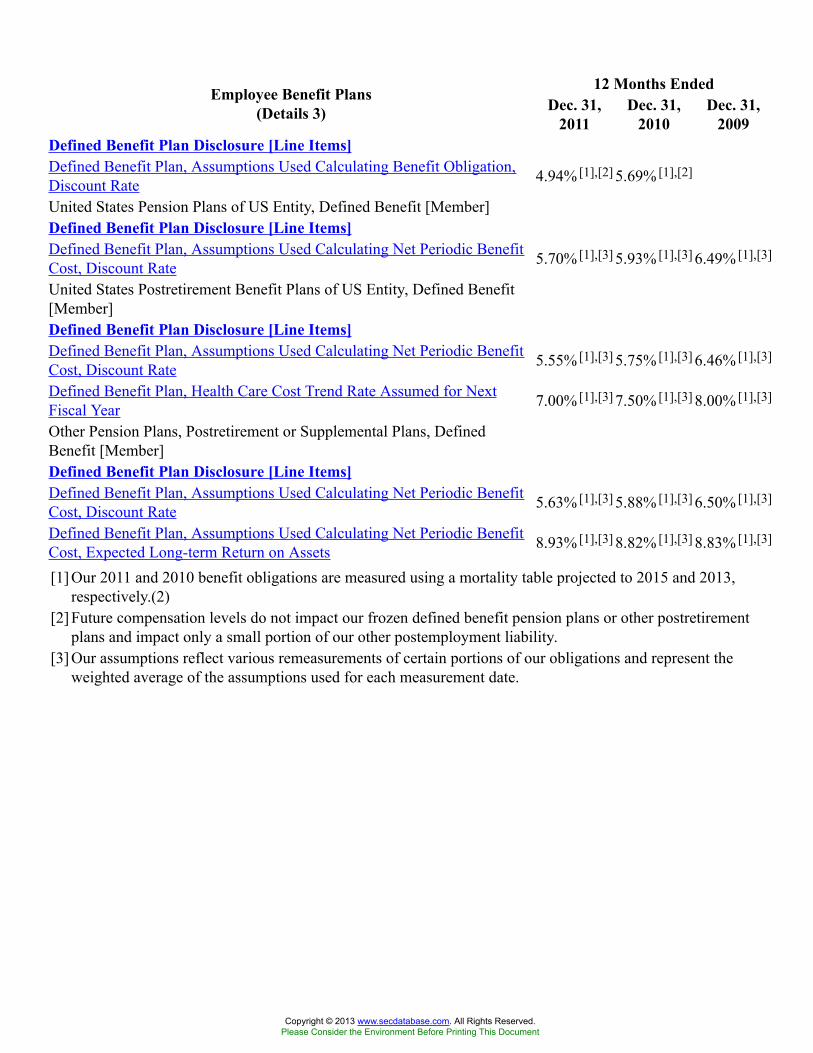
12 Months EndedEmployee Benefit Plans(Details 3) Dec. 31,
2011Dec. 31,
2010Dec. 31,
2009Defined Benefit Plan Disclosure [Line Items]Defined Benefit Plan, Assumptions Used Calculating Benefit Obligation,Discount Rate 4.94% [1],[2] 5.69% [1],[2]
United States Pension Plans of US Entity, Defined Benefit [Member]Defined Benefit Plan Disclosure [Line Items]Defined Benefit Plan, Assumptions Used Calculating Net Periodic BenefitCost, Discount Rate 5.70% [1],[3] 5.93% [1],[3] 6.49% [1],[3]
United States Postretirement Benefit Plans of US Entity, Defined Benefit[Member]Defined Benefit Plan Disclosure [Line Items]Defined Benefit Plan, Assumptions Used Calculating Net Periodic BenefitCost, Discount Rate 5.55% [1],[3] 5.75% [1],[3] 6.46% [1],[3]
Defined Benefit Plan, Health Care Cost Trend Rate Assumed for NextFiscal Year 7.00% [1],[3] 7.50% [1],[3] 8.00% [1],[3]
Other Pension Plans, Postretirement or Supplemental Plans, DefinedBenefit [Member]Defined Benefit Plan Disclosure [Line Items]Defined Benefit Plan, Assumptions Used Calculating Net Periodic BenefitCost, Discount Rate 5.63% [1],[3] 5.88% [1],[3] 6.50% [1],[3]
Defined Benefit Plan, Assumptions Used Calculating Net Periodic BenefitCost, Expected Long-term Return on Assets 8.93% [1],[3] 8.82% [1],[3] 8.83% [1],[3]
[1] Our 2011 and 2010 benefit obligations are measured using a mortality table projected to 2015 and 2013,respectively.(2)
[2] Future compensation levels do not impact our frozen defined benefit pension plans or other postretirementplans and impact only a small portion of our other postemployment liability.
[3] Our assumptions reflect various remeasurements of certain portions of our obligations and represent theweighted average of the assumptions used for each measurement date.
Copyright © 2013 www.secdatabase.com. All Rights Reserved.Please Consider the Environment Before Printing This Document
12 Months EndedSummary of SignificantAccounting Policies (Policies) Dec. 31, 2011Organization, Consolidationand Presentation ofFinancial Statements[Abstract]Consolidation, Subsidiaries orOther Investments,Consolidated Entities, Policy[Policy Text Block]
We do not consolidate the financial statements of any company in which we have anownership interest of 50% or less.
Basis of Accounting [PolicyText Block]
Our Consolidated Financial Statements include the accounts of Delta Air Lines, Inc. and ourwholly-owned subsidiaries and have been prepared in accordance with accounting principlesgenerally accepted in the U.S. (“GAAP”). We do not consolidate the financial statements of anycompany in which we have an ownership interest of 50% or less. We are not the primarybeneficiary of, nor do we have a controlling financial interest in, any variable interest entity.Accordingly, we have not consolidated any variable interest entity. We reclassified certain priorperiod amounts, none of which were material, to conform to the current period presentation.
We have marketing alliances with other airlines to enhance our access to domestic andinternational markets. These arrangements may include codesharing, reciprocal frequent flyerprogram benefits, shared or reciprocal access to passenger lounges, joint promotions, commonuse of airport gates and ticket counters, ticket office co-location and other marketing agreements.We have received antitrust immunity for certain marketing arrangements, which enables us tooffer a more integrated route network and develop common sales, marketing and discountprograms for customers. Some of our marketing arrangements provide for the sharing of revenuesand expenses. Revenues and expenses associated with collaborative arrangements are presentedon a gross basis in the applicable line items on our Consolidated Statements of Operations.
Comparability of Prior YearFinancial Data, Policy [PolicyText Block]
On July 1, 2010, we sold Compass Airlines, Inc. (“Compass”) and Mesaba Aviation, Inc.(“Mesaba”), our wholly-owned subsidiaries, to Trans States Airlines, Inc. (“Trans States”) andPinnacle Airlines Corp. (“Pinnacle”), respectively. Upon the closing of these transactions, weentered into new or amended long-term capacity purchase agreements with Compass, Mesaba andPinnacle. Prior to these sales, expenses related to Compass and Mesaba as our wholly-ownedsubsidiaries were reported in the applicable expense line items. Subsequent to these sales,expenses related to Compass and Mesaba are reported as contract carrier arrangements expense.
Use of Estimates, Policy[Policy Text Block]
Use of Estimates
We are required to make estimates and assumptions when preparing our ConsolidatedFinancial Statements in accordance with GAAP. These estimates and assumptions affect theamounts reported in our Consolidated Financial Statements and the accompanying notes. Actualresults could differ materially from those estimates.
Revenue Recognition,Multiple-deliverableArrangements, Description[Policy Text Block]
Revenue Arrangements with Multiple Deliverables ("ASU 2009-13"). In October 2009, theFinancial Accounting Standards Board ("FASB") issued "Revenue Arrangements with MultipleDeliverables." The standard (1) revises guidance on when individual deliverables may be treatedas separate units of accounting, (2) establishes a selling price hierarchy for determining theselling price of a deliverable, (3) eliminates the residual method for revenue recognition and (4)provides guidance on allocating consideration among separate deliverables. It applies only tocontracts entered into or materially modified after December 31, 2010. We adopted this standardon a prospective basis beginning January 1, 2011. We determined that the only revenuearrangements impacted by the adoption of this standard are those associated with our frequentflyer program (the "SkyMiles Program"). See "Frequent Flyer Program" below.
New AccountingPronouncements, Policy[Policy Text Block]
Recent Accounting Standards
Copyright © 2013 www.secdatabase.com. All Rights Reserved.Please Consider the Environment Before Printing This Document
Revenue Arrangements with Multiple Deliverables ("ASU 2009-13"). In October 2009, theFinancial Accounting Standards Board ("FASB") issued "Revenue Arrangements with MultipleDeliverables." The standard (1) revises guidance on when individual deliverables may be treatedas separate units of accounting, (2) establishes a selling price hierarchy for determining theselling price of a deliverable, (3) eliminates the residual method for revenue recognition and (4)provides guidance on allocating consideration among separate deliverables. It applies only tocontracts entered into or materially modified after December 31, 2010. We adopted this standardon a prospective basis beginning January 1, 2011. We determined that the only revenuearrangements impacted by the adoption of this standard are those associated with our frequentflyer program (the "SkyMiles Program"). See "Frequent Flyer Program" below.
Fair Value Measurement and Disclosure Requirements. In May 2011, the FASB issued"Amendments to Achieve Common Fair Value Measurement and Disclosure Requirements inU.S. GAAP and IFRSs." The standard revises guidance for fair value measurement and expandsthe disclosure requirements. It is effective prospectively for fiscal years beginning afterDecember 15, 2011. We are currently evaluating the impact the adoption of this standard willhave on our Consolidated Financial Statements.
Cash and Cash Equivalents,Policy [Policy Text Block]
Short-term, highly liquid investments with maturities of three months or less when purchasedare classified as cash and cash equivalents.
Investment, Policy [PolicyText Block]
Investments with maturities of greater than three months, but not in excess of one year, whenpurchased are classified as short-term investments.
Receivables, Policy [PolicyText Block]
Accounts Receivable
Accounts receivable primarily consist of amounts due from credit card companies from thesale of passenger airline tickets, customers of our aircraft maintenance and cargo transportationservices and other companies for the purchase of mileage credits under our SkyMiles Program.We provide an allowance for uncollectible accounts equal to the estimated losses expected to beincurred based on historical chargebacks, write-offs, bankruptcies and other specific analyses.Bad debt expense was not material in any period presented.
Derivatives, Policy [PolicyText Block]
Derivatives
Our results of operations are impacted by changes in aircraft fuel prices, interest rates andforeign currency exchange rates. In an effort to manage our exposure to these risks, we enter intoderivative contracts and may adjust our derivative portfolio as market conditions change. Werecognize derivative contracts at fair value on our Consolidated Balance Sheets.
Not Designated as Accounting Hedges. Effective June 2011, we stopped designating new fuelderivative contracts as accounting hedges and discontinued hedge accounting for our thenexisting fuel derivative contracts that previously had been designated as accounting hedges. As aresult, we record market adjustments for changes in fair value to earnings in aircraft fuel andrelated taxes. Prior to this change in accounting designation, gains or losses on these contractswere deferred in accumulated other comprehensive loss until contract settlement.
Designated as Cash Flow Hedges. For derivative contracts designated as cash flow hedges,the effective portion of the gain or loss on the derivative is reported as a component ofaccumulated other comprehensive loss and reclassified into earnings in the same period in whichthe hedged transaction affects earnings. The effective portion of the derivative represents thechange in fair value of the hedge that offsets the change in fair value of the hedged item. To theextent the change in the fair value of the hedge does not perfectly offset the change in the fairvalue of the hedged item, the ineffective portion of the hedge is immediately recognized in other(expense) income.
Designated as Fair Value Hedges. For derivative contracts designated as fair value hedges(interest rate contracts), the gain or loss on the derivative and the offsetting loss or gain on thehedge item attributable to the hedged risk are recognized in current earnings. We include the gain
Copyright © 2013 www.secdatabase.com. All Rights Reserved.Please Consider the Environment Before Printing This Document
or loss on the hedged item in the same account as the offsetting loss or gain on the relatedderivative contract, resulting in no impact to our Consolidated Statements of Operations.
The following table summarizes the risk each type of derivative contract is hedging and theclassification of related gains and losses on our Consolidated Statements of Operations:
Derivative Type Hedged RiskClassification of Gains and
Losses
Fuel hedge contracts Increases in jet fuel prices Aircraft fuel and relatedtaxes
Interest rate contracts Increases in interest rates Interest expense, netForeign currency exchangecontracts
Fluctuations in foreign currencyexchange rates
Passenger revenue
The following table summarizes the accounting treatment of our derivative contracts:
Impact of Unrealized Gains and Losses
Accounting Designation Effective Portion Ineffective Portion
Not designated as hedges Change in fair value of hedge is recorded in earningsDesignated as cash flow hedges Market adjustments are
recorded in accumulatedother comprehensive loss
Excess, if any, over effectiveportion of hedge is recordedin other (expense) income
Designated as fair value hedges Market adjustments arerecorded in long-term debt
and capital leases
Excess, if any, over effectiveportion of hedge is recordedin other (expense) income
We perform, at least quarterly, both a prospective and retrospective assessment of theeffectiveness of our derivative contracts designated as hedges, including assessing the possibilityof counterparty default. If we determine that a derivative is no longer expected to be highlyeffective, we discontinue hedge accounting prospectively and recognize subsequent changes inthe fair value of the hedge in earnings. We believe our derivative contracts that continue to bedesignated as hedges, consisting of interest rate and foreign currency exchange contracts, willcontinue to be highly effective in offsetting changes in cash flow attributable to the hedged risk.
Hedge Margin. In accordance with our fuel, interest rate and foreign currency hedge contracts,we may require counterparties to fund the margin associated with our gain position and/orcounterparties may require us to fund the margin associated with our loss position on thesecontracts. The amount of the margin, if any, is periodically adjusted based on the fair value of thehedge contracts. The margin requirements are intended to mitigate a party's exposure to the riskof contracting party default. We do not offset margin funded to counterparties or margin funded tous by counterparties against fair value amounts recorded for our hedge contracts.
The hedge margin we receive from counterparties is recorded in cash and cash equivalents orrestricted cash, cash equivalents and short-term investments, with the offsetting obligation inaccounts payable. The hedge margin we provide to counterparties is recorded in accountsreceivable. All cash flows associated with purchasing and settling hedge contracts are classifiedas operating cash flows.
Revenue Recognition, Policy[Policy Text Block]
Passenger Tickets
We record sales of passenger tickets in air traffic liability. Passenger revenue is recognizedwhen we provide transportation or when the ticket expires unused, reducing the related air trafficliability. We periodically evaluate the estimated air traffic liability and record any adjustments inour Consolidated Statements of Operations. These adjustments relate primarily to refunds,exchanges, transactions with other airlines and other items for which final settlement occurs inperiods subsequent to the sale of the related tickets at amounts other than the original sales price.
Taxes and Fees
Copyright © 2013 www.secdatabase.com. All Rights Reserved.Please Consider the Environment Before Printing This Document
We are required to charge certain taxes and fees on our passenger tickets, including U.S.federal transportation taxes, federal security charges, airport passenger facility charges andforeign arrival and departure taxes. These taxes and fees are assessments on the customer forwhich we act as a collection agent. Because we are not entitled to retain these taxes and fees, wedo not include such amounts in passenger revenue. We record a liability when the amounts arecollected and reduce the liability when payments are made to the applicable government agencyor operating carrier.
Frequent Flyer Program
The SkyMiles Program offers incentives to travel on Delta. This program allows customers toearn mileage credits by flying on Delta, regional air carriers with which we have contract carrieragreements (“Contract Carriers”) and airlines that participate in the SkyMiles Program, as well asthrough participating companies such as credit card companies, hotels and car rental agencies. Wealso sell mileage credits to non-airline businesses, customers and other airlines.
The SkyMiles Program includes two types of transactions that are considered revenuearrangements with multiple deliverables. As discussed below, these are (1) passenger ticket salesearning mileage credits and (2) the sale of mileage credits to participating companies with whichwe have marketing agreements. Mileage credits are a separate unit of accounting as they can beredeemed by customers in future periods for air travel on Delta and participating airlines,membership in our Sky Club and other program awards.
Passenger Ticket Sales Earning Mileage Credits. Passenger ticket sales earning mileagecredits under our SkyMiles Program provide customers with two deliverables: (1) mileage creditsearned and (2) air transportation. Effective January 1, 2011, we began applying the provisions ofASU 2009-13 to passenger tickets earning mileage credits. Under ASU 2009-13, we value eachdeliverable on a standalone basis. Our estimate of the standalone selling price of a mileage creditis based on an analysis of our sales of mileage credits to other airlines and customers and is re-evaluated at least annually. We use established ticket prices to determine the standalone sellingprice of air transportation. We allocate the total amount collected from passenger ticket salesbetween the deliverables based on their relative selling prices.
We defer revenue from the mileage credit component of passenger ticket sales and recognizeit as passenger revenue when miles are redeemed and services are provided. We record theportion of the passenger ticket sales for air transportation in air traffic liability and recognizethese amounts in passenger revenue when we provide transportation or when the ticket expiresunused. The adoption of ASU 2009-13 did not have a material impact on the timing of revenuerecognition or its classification with regard to passenger tickets earning mileage credits.
Prior to the adoption of ASU 2009-13, we used the residual method for revenue recognition.Under the residual method, we determined the fair value of the mileage credit component basedon prices at which we sold mileage credits to other airlines and then considered the remainder ofthe amount collected to be the air transportation deliverable.
Sale of Mileage Credits. Customers may earn mileage credits through participating companiessuch as credit card companies, hotels and car rental agencies with which we have marketingagreements to sell mileage credits. Our contracts to sell mileage credits under these marketingagreements have two deliverables: (1) the mileage credits redeemable for future travel and (2) themarketing component.
ASU 2009-13 does not apply to contracts to sell mileage credits entered into prior to January1, 2011 unless those contracts are materially modified. As of December 31, 2011, we had notmaterially modified any of our significant agreements. Our most significant contract to sellmileage credits relates to our co-brand credit card relationship with American Express. Foradditional information about this relationship, see Note 6. For contracts entered into prior toJanuary 1, 2011 that have not been materially modified since January 1, 2011, we continue to usethe residual method for revenue recognition and value only the mileage credits. Under theresidual method, the portion of the revenue from the mileage component is deferred and
Copyright © 2013 www.secdatabase.com. All Rights Reserved.Please Consider the Environment Before Printing This Document
recognized as passenger revenue when miles are redeemed and services are provided. The portionof the revenue received in excess of the fair value of mileage credits sold, the marketingcomponent, is recognized in income as other revenue when the related marketing services areprovided. The fair value of a mileage credit is determined based on prices at which we sellmileage credits to other airlines and is re-evaluated at least annually.
If we enter into new contracts or materially modify existing contracts to sell mileage creditsrelated to our SkyMiles Program, we will value the standalone selling price of the marketingcomponent and allocate the revenue from the contract based on the relative selling price of themileage credits and the marketing component. A material modification of an existing contractcould impact our deferral rate or cause an adjustment to our deferred revenue balance, whichcould materially impact our future financial results.
Breakage. For mileage credits which we estimate are not likely to be redeemed (“Breakage”),we recognize the associated value proportionally during the period in which the remainingmileage credits are expected to be redeemed. The estimate of Breakage is based on historicalredemption patterns. A change in assumptions as to the period over which mileage credits areexpected to be redeemed, the actual redemption activity for mileage credits or the estimated fairvalue of mileage credits expected to be redeemed could have a material impact on our revenue inthe year in which the change occurs and in future years.
Regional Carriers Revenue
During the year ended December 31, 2011, we had contract carrier agreements with nineContract Carriers, including our wholly-owned subsidiary, Comair, Inc. (“Comair”). Our ContractCarrier agreements are structured as either (1) capacity purchase agreements where we purchaseall or a portion of the Contract Carrier's capacity and are responsible for selling the seat inventorywe purchase or (2) revenue proration agreements, which are based on a fixed dollar or percentagedivision of revenues for tickets sold to passengers traveling on connecting flight itineraries. Werecord revenue related to all of our Contract Carrier agreements as regional carriers passengerrevenue. We record expenses related to our Contract Carrier agreements, excluding Comair, ascontract carrier arrangements expense.
Cargo Revenue
Cargo revenue is recognized when we provide the transportation.
Other Revenue
Other revenue is primarily comprised of (1) the marketing component of the sale of mileagecredits discussed above, (2) baggage fee revenue, (3) other miscellaneous service revenue,including ticket change fees and (4) revenue from ancillary businesses, such as the aircraftmaintenance and repair and staffing services we provide to third parties.
Revenue Recognition, LoyaltyPrograms [Policy Text Block]
Frequent Flyer Program
The SkyMiles Program offers incentives to travel on Delta. This program allows customers toearn mileage credits by flying on Delta, regional air carriers with which we have contract carrieragreements (“Contract Carriers”) and airlines that participate in the SkyMiles Program, as well asthrough participating companies such as credit card companies, hotels and car rental agencies. Wealso sell mileage credits to non-airline businesses, customers and other airlines.
The SkyMiles Program includes two types of transactions that are considered revenuearrangements with multiple deliverables. As discussed below, these are (1) passenger ticket salesearning mileage credits and (2) the sale of mileage credits to participating companies with whichwe have marketing agreements. Mileage credits are a separate unit of accounting as they can beredeemed by customers in future periods for air travel on Delta and participating airlines,membership in our Sky Club and other program awards.
Copyright © 2013 www.secdatabase.com. All Rights Reserved.Please Consider the Environment Before Printing This Document
Passenger Ticket Sales Earning Mileage Credits. Passenger ticket sales earning mileagecredits under our SkyMiles Program provide customers with two deliverables: (1) mileage creditsearned and (2) air transportation. Effective January 1, 2011, we began applying the provisions ofASU 2009-13 to passenger tickets earning mileage credits. Under ASU 2009-13, we value eachdeliverable on a standalone basis. Our estimate of the standalone selling price of a mileage creditis based on an analysis of our sales of mileage credits to other airlines and customers and is re-evaluated at least annually. We use established ticket prices to determine the standalone sellingprice of air transportation. We allocate the total amount collected from passenger ticket salesbetween the deliverables based on their relative selling prices.
We defer revenue from the mileage credit component of passenger ticket sales and recognizeit as passenger revenue when miles are redeemed and services are provided. We record theportion of the passenger ticket sales for air transportation in air traffic liability and recognizethese amounts in passenger revenue when we provide transportation or when the ticket expiresunused. The adoption of ASU 2009-13 did not have a material impact on the timing of revenuerecognition or its classification with regard to passenger tickets earning mileage credits.
Prior to the adoption of ASU 2009-13, we used the residual method for revenue recognition.Under the residual method, we determined the fair value of the mileage credit component basedon prices at which we sold mileage credits to other airlines and then considered the remainder ofthe amount collected to be the air transportation deliverable.
Sale of Mileage Credits. Customers may earn mileage credits through participating companiessuch as credit card companies, hotels and car rental agencies with which we have marketingagreements to sell mileage credits. Our contracts to sell mileage credits under these marketingagreements have two deliverables: (1) the mileage credits redeemable for future travel and (2) themarketing component.
ASU 2009-13 does not apply to contracts to sell mileage credits entered into prior to January1, 2011 unless those contracts are materially modified. As of December 31, 2011, we had notmaterially modified any of our significant agreements. Our most significant contract to sellmileage credits relates to our co-brand credit card relationship with American Express. Foradditional information about this relationship, see Note 6. For contracts entered into prior toJanuary 1, 2011 that have not been materially modified since January 1, 2011, we continue to usethe residual method for revenue recognition and value only the mileage credits. Under theresidual method, the portion of the revenue from the mileage component is deferred andrecognized as passenger revenue when miles are redeemed and services are provided. The portionof the revenue received in excess of the fair value of mileage credits sold, the marketingcomponent, is recognized in income as other revenue when the related marketing services areprovided. The fair value of a mileage credit is determined based on prices at which we sellmileage credits to other airlines and is re-evaluated at least annually.
If we enter into new contracts or materially modify existing contracts to sell mileage creditsrelated to our SkyMiles Program, we will value the standalone selling price of the marketingcomponent and allocate the revenue from the contract based on the relative selling price of themileage credits and the marketing component. A material modification of an existing contractcould impact our deferral rate or cause an adjustment to our deferred revenue balance, whichcould materially impact our future financial results.
Breakage. For mileage credits which we estimate are not likely to be redeemed (“Breakage”),we recognize the associated value proportionally during the period in which the remainingmileage credits are expected to be redeemed. The estimate of Breakage is based on historicalredemption patterns. A change in assumptions as to the period over which mileage credits areexpected to be redeemed, the actual redemption activity for mileage credits or the estimated fairvalue of mileage credits expected to be redeemed could have a material impact on our revenue inthe year in which the change occurs and in future years.
Copyright © 2013 www.secdatabase.com. All Rights Reserved.Please Consider the Environment Before Printing This Document
Revenue Recognition,Deferred Revenue [Policy TextBlock]
Passenger Ticket Sales Earning Mileage Credits. Passenger ticket sales earning mileagecredits under our SkyMiles Program provide customers with two deliverables: (1) mileage creditsearned and (2) air transportation. Effective January 1, 2011, we began applying the provisions ofASU 2009-13 to passenger tickets earning mileage credits. Under ASU 2009-13, we value eachdeliverable on a standalone basis. Our estimate of the standalone selling price of a mileage creditis based on an analysis of our sales of mileage credits to other airlines and customers and is re-evaluated at least annually. We use established ticket prices to determine the standalone sellingprice of air transportation. We allocate the total amount collected from passenger ticket salesbetween the deliverables based on their relative selling prices.
We defer revenue from the mileage credit component of passenger ticket sales and recognizeit as passenger revenue when miles are redeemed and services are provided. We record theportion of the passenger ticket sales for air transportation in air traffic liability and recognizethese amounts in passenger revenue when we provide transportation or when the ticket expiresunused. The adoption of ASU 2009-13 did not have a material impact on the timing of revenuerecognition or its classification with regard to passenger tickets earning mileage credits.
Prior to the adoption of ASU 2009-13, we used the residual method for revenue recognition.Under the residual method, we determined the fair value of the mileage credit component basedon prices at which we sold mileage credits to other airlines and then considered the remainder ofthe amount collected to be the air transportation deliverable.
Sale of Mileage Credits. Customers may earn mileage credits through participating companiessuch as credit card companies, hotels and car rental agencies with which we have marketingagreements to sell mileage credits. Our contracts to sell mileage credits under these marketingagreements have two deliverables: (1) the mileage credits redeemable for future travel and (2) themarketing component.
ASU 2009-13 does not apply to contracts to sell mileage credits entered into prior to January1, 2011 unless those contracts are materially modified. As of December 31, 2011, we had notmaterially modified any of our significant agreements. Our most significant contract to sellmileage credits relates to our co-brand credit card relationship with American Express. Foradditional information about this relationship, see Note 6. For contracts entered into prior toJanuary 1, 2011 that have not been materially modified since January 1, 2011, we continue to usethe residual method for revenue recognition and value only the mileage credits. Under theresidual method, the portion of the revenue from the mileage component is deferred andrecognized as passenger revenue when miles are redeemed and services are provided. The portionof the revenue received in excess of the fair value of mileage credits sold, the marketingcomponent, is recognized in income as other revenue when the related marketing services areprovided. The fair value of a mileage credit is determined based on prices at which we sellmileage credits to other airlines and is re-evaluated at least annually.
If we enter into new contracts or materially modify existing contracts to sell mileage creditsrelated to our SkyMiles Program, we will value the standalone selling price of the marketingcomponent and allocate the revenue from the contract based on the relative selling price of themileage credits and the marketing component. A material modification of an existing contractcould impact our deferral rate or cause an adjustment to our deferred revenue balance, whichcould materially impact our future financial results.
Breakage. For mileage credits which we estimate are not likely to be redeemed (“Breakage”),we recognize the associated value proportionally during the period in which the remainingmileage credits are expected to be redeemed. The estimate of Breakage is based on historicalredemption patterns. A change in assumptions as to the period over which mileage credits areexpected to be redeemed, the actual redemption activity for mileage credits or the estimated fairvalue of mileage credits expected to be redeemed could have a material impact on our revenue inthe year in which the change occurs and in future years.
Revenue Recognition, Sales ofServices [Policy Text Block]
Passenger Tickets
Copyright © 2013 www.secdatabase.com. All Rights Reserved.Please Consider the Environment Before Printing This Document
We record sales of passenger tickets in air traffic liability. Passenger revenue is recognizedwhen we provide transportation or when the ticket expires unused, reducing the related air trafficliability. We periodically evaluate the estimated air traffic liability and record any adjustments inour Consolidated Statements of Operations. These adjustments relate primarily to refunds,exchanges, transactions with other airlines and other items for which final settlement occurs inperiods subsequent to the sale of the related tickets at amounts other than the original sales price.Regional Carriers Revenue
During the year ended December 31, 2011, we had contract carrier agreements with nineContract Carriers, including our wholly-owned subsidiary, Comair, Inc. (“Comair”). Our ContractCarrier agreements are structured as either (1) capacity purchase agreements where we purchaseall or a portion of the Contract Carrier's capacity and are responsible for selling the seat inventorywe purchase or (2) revenue proration agreements, which are based on a fixed dollar or percentagedivision of revenues for tickets sold to passengers traveling on connecting flight itineraries. Werecord revenue related to all of our Contract Carrier agreements as regional carriers passengerrevenue. We record expenses related to our Contract Carrier agreements, excluding Comair, ascontract carrier arrangements expense.
Revenue Recognition, Cargoand Freight, Policy [PolicyText Block]
Cargo Revenue
Cargo revenue is recognized when we provide the transportation.
Property, Plant andEquipment, Policy [PolicyText Block]
Long-Lived Assets
The following table shows our property and equipment:
December 31,
(in millions, except for estimated useful life) Estimated Useful Life 2011 2010
Flight equipment 21-30 years $ 21,001 $ 20,312Ground property and equipment 3-40 years 3,256 3,123Flight and ground equipment undercapital leases
Shorter of lease term or estimateduseful life 1,127 988
Assets constructed for others 30 years 234 —Advance payments for equipment 77 48Less: accumulated depreciation andamortization (5,472) (4,164)Total property and equipment, net $ 20,223 $ 20,307
We record property and equipment at cost and depreciate or amortize these assets on astraight-line basis to their estimated residual values over their estimated useful lives. Theestimated useful life for leasehold improvements is the shorter of lease term or estimated usefullife. Depreciation expense for the years ended December 31, 2011, 2010 and 2009 was $1.4billion, $1.4 billion and $1.3 billion, respectively. Residual values for owned spare parts andsimulators are generally 5% of cost except when guaranteed by a third party for a differentamount.
We capitalize certain internal and external costs incurred to develop and implement software,and amortize those costs over an estimated useful life of three to seven years. For the years endedDecember 31, 2011, 2010 and 2009, we recorded $64 million, $71 million and $95 million,respectively, for amortization of capitalized software. The net book value of these assets totaled$200 million and $153 million at December 31, 2011 and 2010, respectively.
We record impairment losses on flight equipment and other long-lived assets used inoperations when events and circumstances indicate the assets may be impaired and the estimatedfuture cash flows generated by those assets are less than their carrying amounts. Factors whichcould cause impairment include, but are not limited to, (1) a decision to permanently removeflight equipment or other long-lived assets from operations, (2) significant changes in the
Copyright © 2013 www.secdatabase.com. All Rights Reserved.Please Consider the Environment Before Printing This Document
estimated useful life, (3) significant changes in projected cash flows, (4) permanent andsignificant declines in fleet fair values and (5) changes to the regulatory environment. For long-lived assets held for sale, we discontinue depreciation and record impairment losses when thecarrying amount of these assets is greater than the fair value less the cost to sell.
To determine whether impairments exist for aircraft used in operations, we group assets at thefleet-type level (the lowest level for which there are identifiable cash flows) and then estimatefuture cash flows based on projections of capacity, passenger mile yield, fuel costs, labor costsand other relevant factors. If an impairment occurs, the impairment loss recognized is the amountby which the aircraft's carrying amount exceeds its estimated fair value. We estimate aircraft fairvalues using published sources, appraisals and bids received from third parties, as available.
Property, Plant andEquipment, Impairment[Policy Text Block]
We record impairment losses on flight equipment and other long-lived assets used inoperations when events and circumstances indicate the assets may be impaired and the estimatedfuture cash flows generated by those assets are less than their carrying amounts. Factors whichcould cause impairment include, but are not limited to, (1) a decision to permanently removeflight equipment or other long-lived assets from operations, (2) significant changes in theestimated useful life, (3) significant changes in projected cash flows, (4) permanent andsignificant declines in fleet fair values and (5) changes to the regulatory environment. For long-lived assets held for sale, we discontinue depreciation and record impairment losses when thecarrying amount of these assets is greater than the fair value less the cost to sell.
To determine whether impairments exist for aircraft used in operations, we group assets at thefleet-type level (the lowest level for which there are identifiable cash flows) and then estimatefuture cash flows based on projections of capacity, passenger mile yield, fuel costs, labor costsand other relevant factors. If an impairment occurs, the impairment loss recognized is the amountby which the aircraft's carrying amount exceeds its estimated fair value. We estimate aircraft fairvalues using published sources, appraisals and bids received from third parties, as available.
Goodwill and IntangibleAssets, Policy [Policy TextBlock]
Goodwill and Other Intangible Assets
We apply a fair value-based impairment test to the net book value of goodwill and indefinite-lived intangible assets on an annual basis (as of October 1) and, if certain events or circumstancesindicate that an impairment loss may have been incurred, on an interim basis. In September 2011,the FASB issued "Testing Goodwill for Impairment." The standard revises the way in whichentities test goodwill for impairment. We adopted this standard and applied its provisions to ourannual goodwill impairment test in the December 2011 quarter.
We value goodwill and identified intangible assets primarily using market capitalization andincome approach valuation techniques. These measurements include the following significantunobservable inputs: (1) our projected revenues, expenses and cash flows, (2) an estimatedweighted average cost of capital, (3) assumed discount rates depending on the asset and (4) a taxrate. These assumptions are consistent with those hypothetical market participants would use.Since we are required to make estimates and assumptions when evaluating goodwill andindefinite-lived intangible assets for impairment, the actual amounts may differ materially fromthese estimates.
Changes in assumptions or circumstances could result in impairment. Factors which couldcause impairment include, but are not limited to, (1) negative trends in our market capitalization,(2) an increase in fuel prices, (3) declining passenger mile yields, (4) lower passenger demand asa result of the weakened U.S. and global economy, (5) interruption to our operations due to anemployee strike, terrorist attack, or other reasons, (6) changes to the regulatory environment and(7) consolidation of competitors in the airline industry.
Goodwill. As of December 31, 2011 and 2010, our goodwill balance was $9.8 billion. Inevaluating goodwill for impairment, we estimate the fair value of our reporting unit byconsidering market capitalization and other factors if it is more likely than not that the fair valueof our reporting unit is less than its carrying value. If the reporting unit's fair value exceeds itscarrying value, no further testing is required. If, however, the reporting unit's carrying value
Copyright © 2013 www.secdatabase.com. All Rights Reserved.Please Consider the Environment Before Printing This Document
exceeds its fair value, we then determine the amount of the impairment charge, if any. Werecognize an impairment charge if the carrying value of the reporting unit's goodwill exceeds itsestimated fair value.
Identifiable Intangible Assets. Our identifiable intangible assets had a net carrying amount of$4.8 billion at December 31, 2011. Indefinite-lived assets are not amortized and consist primarilyof routes, slots, the Delta tradename and assets related to SkyTeam. Definite-lived intangibleassets consist primarily of marketing agreements and contracts and are amortized on a straight-line basis or under the undiscounted cash flows method over the estimated economic life of therespective agreements and contracts. Costs incurred to renew or extend the term of an intangibleasset are expensed as incurred.
We perform the impairment test for indefinite-lived intangible assets by comparing the asset'sfair value to its carrying value. Fair value is estimated based on (1) recent market transactions,where available, (2) the lease savings method for certain airport slots (which reflects potentiallease savings from owning the slots rather than leasing them from another airline at market rates),(3) the royalty method for the Delta tradename (which assumes hypothetical royalties generatedfrom using our tradename) or (4) projected discounted future cash flows. We recognize animpairment charge if the asset's carrying value exceeds its estimated fair value.
Goodwill and IntangibleAssets, Goodwill, Policy[Policy Text Block]
Goodwill. As of December 31, 2011 and 2010, our goodwill balance was $9.8 billion. Inevaluating goodwill for impairment, we estimate the fair value of our reporting unit byconsidering market capitalization and other factors if it is more likely than not that the fair valueof our reporting unit is less than its carrying value. If the reporting unit's fair value exceeds itscarrying value, no further testing is required. If, however, the reporting unit's carrying valueexceeds its fair value, we then determine the amount of the impairment charge, if any. Werecognize an impairment charge if the carrying value of the reporting unit's goodwill exceeds itsestimated fair value.
Goodwill and IntangibleAssets, Intangible Assets,Policy [Policy Text Block]
Identifiable Intangible Assets. Our identifiable intangible assets had a net carrying amount of$4.8 billion at December 31, 2011. Indefinite-lived assets are not amortized and consist primarilyof routes, slots, the Delta tradename and assets related to SkyTeam. Definite-lived intangibleassets consist primarily of marketing agreements and contracts and are amortized on a straight-line basis or under the undiscounted cash flows method over the estimated economic life of therespective agreements and contracts. Costs incurred to renew or extend the term of an intangibleasset are expensed as incurred.
We perform the impairment test for indefinite-lived intangible assets by comparing the asset'sfair value to its carrying value. Fair value is estimated based on (1) recent market transactions,where available, (2) the lease savings method for certain airport slots (which reflects potentiallease savings from owning the slots rather than leasing them from another airline at market rates),(3) the royalty method for the Delta tradename (which assumes hypothetical royalties generatedfrom using our tradename) or (4) projected discounted future cash flows. We recognize animpairment charge if the asset's carrying value exceeds its estimated fair value.
Income Tax, Policy [PolicyText Block]
Income Taxes
We account for deferred income taxes under the liability method. We recognize deferred taxassets and liabilities based on the tax effects of temporary differences between the financialstatement and tax bases of assets and liabilities, as measured by current enacted tax rates.Deferred tax assets and liabilities are recorded net as current and noncurrent deferred incometaxes. A valuation allowance is recorded to reduce deferred tax assets when necessary. Foradditional information about our valuation allowance, see Note 11
Manufacturers Credits [PolicyText Block]
Manufacturers' Credits
We periodically receive credits in connection with the acquisition of aircraft and engines.These credits are deferred until the aircraft and engines are delivered, and then applied on a prorata basis as a reduction to the cost of the related equipment.
Maintenance Cost, Policy[Policy Text Block]
Maintenance Costs
Copyright © 2013 www.secdatabase.com. All Rights Reserved.Please Consider the Environment Before Printing This Document
We record maintenance costs to aircraft maintenance materials and outside repairs.Maintenance costs are expensed as incurred, except for costs incurred under power-by-the-hourcontracts, which are expensed based on actual hours flown. Power-by-the-hour contracts transfercertain risk to third party service providers and fix the amount we pay per flight hour to theservice provider in exchange for maintenance and repairs under a predefined maintenanceprogram. Modifications that enhance the operating performance or extend the useful lives ofairframes or engines are capitalized and amortized over the remaining estimated useful life of theasset or the remaining lease term, whichever is shorter.
Inventory, Policy [Policy TextBlock]
Inventories
Inventories of expendable parts related to flight equipment are carried at moving average costand charged to operations as consumed. An allowance for obsolescence is provided over theremaining useful life of the related fleet for spare parts expected to be available at the date aircraftare retired from service. We also provide allowances for parts identified as excess or obsolete toreduce the carrying costs to the lower of cost or net realizable value. These parts are assumed tohave an estimated residual value of 5% of the original cost.
Advertising Cost, Policy,Expensed Advertising Cost[Policy Text Block]
Advertising Costs
We expense advertising costs as other selling expenses in the year incurred. Advertisingexpense was $214 million, $169 million and $176 million for the years ended December 31,2011, 2010 and 2009, respectively.
Commissions, Policy [PolicyText Block]
Commissions
Passenger commissions are recognized in operating expense when the related revenue isrecognized.
Copyright © 2013 www.secdatabase.com. All Rights Reserved.Please Consider the Environment Before Printing This Document
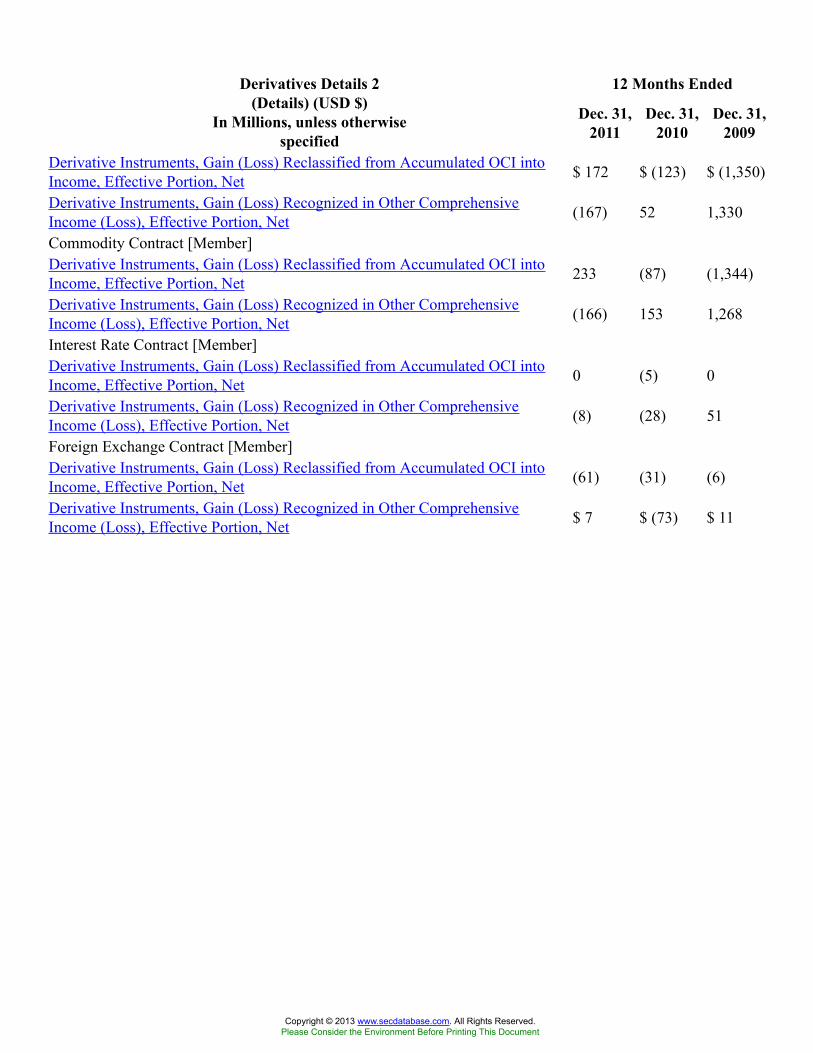
12 Months EndedDerivatives Details 2(Details) (USD $)
In Millions, unless otherwisespecified
Dec. 31,2011
Dec. 31,2010
Dec. 31,2009
Derivative Instruments, Gain (Loss) Reclassified from Accumulated OCI intoIncome, Effective Portion, Net $ 172 $ (123) $ (1,350)
Derivative Instruments, Gain (Loss) Recognized in Other ComprehensiveIncome (Loss), Effective Portion, Net (167) 52 1,330
Commodity Contract [Member]Derivative Instruments, Gain (Loss) Reclassified from Accumulated OCI intoIncome, Effective Portion, Net 233 (87) (1,344)
Derivative Instruments, Gain (Loss) Recognized in Other ComprehensiveIncome (Loss), Effective Portion, Net (166) 153 1,268
Interest Rate Contract [Member]Derivative Instruments, Gain (Loss) Reclassified from Accumulated OCI intoIncome, Effective Portion, Net 0 (5) 0
Derivative Instruments, Gain (Loss) Recognized in Other ComprehensiveIncome (Loss), Effective Portion, Net (8) (28) 51
Foreign Exchange Contract [Member]Derivative Instruments, Gain (Loss) Reclassified from Accumulated OCI intoIncome, Effective Portion, Net (61) (31) (6)
Derivative Instruments, Gain (Loss) Recognized in Other ComprehensiveIncome (Loss), Effective Portion, Net $ 7 $ (73) $ 11
Copyright © 2013 www.secdatabase.com. All Rights Reserved.Please Consider the Environment Before Printing This Document
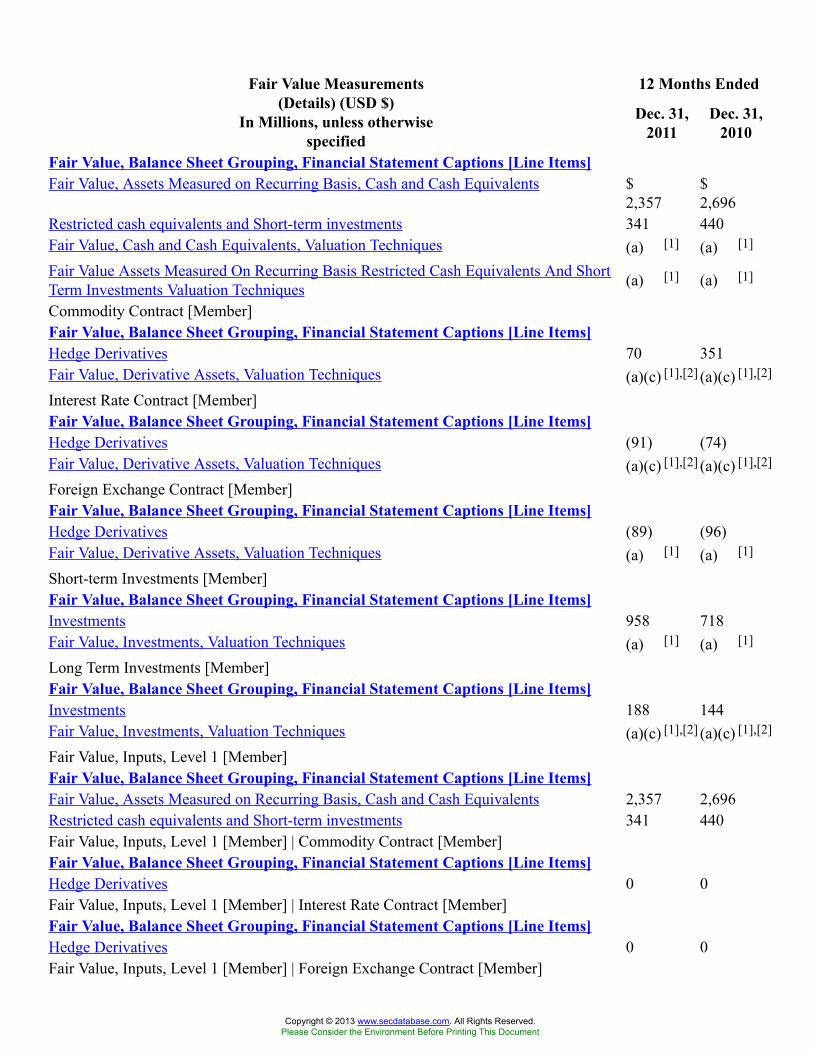
12 Months EndedFair Value Measurements(Details) (USD $)
In Millions, unless otherwisespecified
Dec. 31,2011
Dec. 31,2010
Fair Value, Balance Sheet Grouping, Financial Statement Captions [Line Items]Fair Value, Assets Measured on Recurring Basis, Cash and Cash Equivalents $
2,357$2,696
Restricted cash equivalents and Short-term investments 341 440Fair Value, Cash and Cash Equivalents, Valuation Techniques (a) [1] (a) [1]
Fair Value Assets Measured On Recurring Basis Restricted Cash Equivalents And ShortTerm Investments Valuation Techniques (a) [1] (a) [1]
Commodity Contract [Member]Fair Value, Balance Sheet Grouping, Financial Statement Captions [Line Items]Hedge Derivatives 70 351Fair Value, Derivative Assets, Valuation Techniques (a)(c) [1],[2] (a)(c) [1],[2]
Interest Rate Contract [Member]Fair Value, Balance Sheet Grouping, Financial Statement Captions [Line Items]Hedge Derivatives (91) (74)Fair Value, Derivative Assets, Valuation Techniques (a)(c) [1],[2] (a)(c) [1],[2]
Foreign Exchange Contract [Member]Fair Value, Balance Sheet Grouping, Financial Statement Captions [Line Items]Hedge Derivatives (89) (96)Fair Value, Derivative Assets, Valuation Techniques (a) [1] (a) [1]
Short-term Investments [Member]Fair Value, Balance Sheet Grouping, Financial Statement Captions [Line Items]Investments 958 718Fair Value, Investments, Valuation Techniques (a) [1] (a) [1]
Long Term Investments [Member]Fair Value, Balance Sheet Grouping, Financial Statement Captions [Line Items]Investments 188 144Fair Value, Investments, Valuation Techniques (a)(c) [1],[2] (a)(c) [1],[2]
Fair Value, Inputs, Level 1 [Member]Fair Value, Balance Sheet Grouping, Financial Statement Captions [Line Items]Fair Value, Assets Measured on Recurring Basis, Cash and Cash Equivalents 2,357 2,696Restricted cash equivalents and Short-term investments 341 440Fair Value, Inputs, Level 1 [Member] | Commodity Contract [Member]Fair Value, Balance Sheet Grouping, Financial Statement Captions [Line Items]Hedge Derivatives 0 0Fair Value, Inputs, Level 1 [Member] | Interest Rate Contract [Member]Fair Value, Balance Sheet Grouping, Financial Statement Captions [Line Items]Hedge Derivatives 0 0Fair Value, Inputs, Level 1 [Member] | Foreign Exchange Contract [Member]
Copyright © 2013 www.secdatabase.com. All Rights Reserved.Please Consider the Environment Before Printing This Document
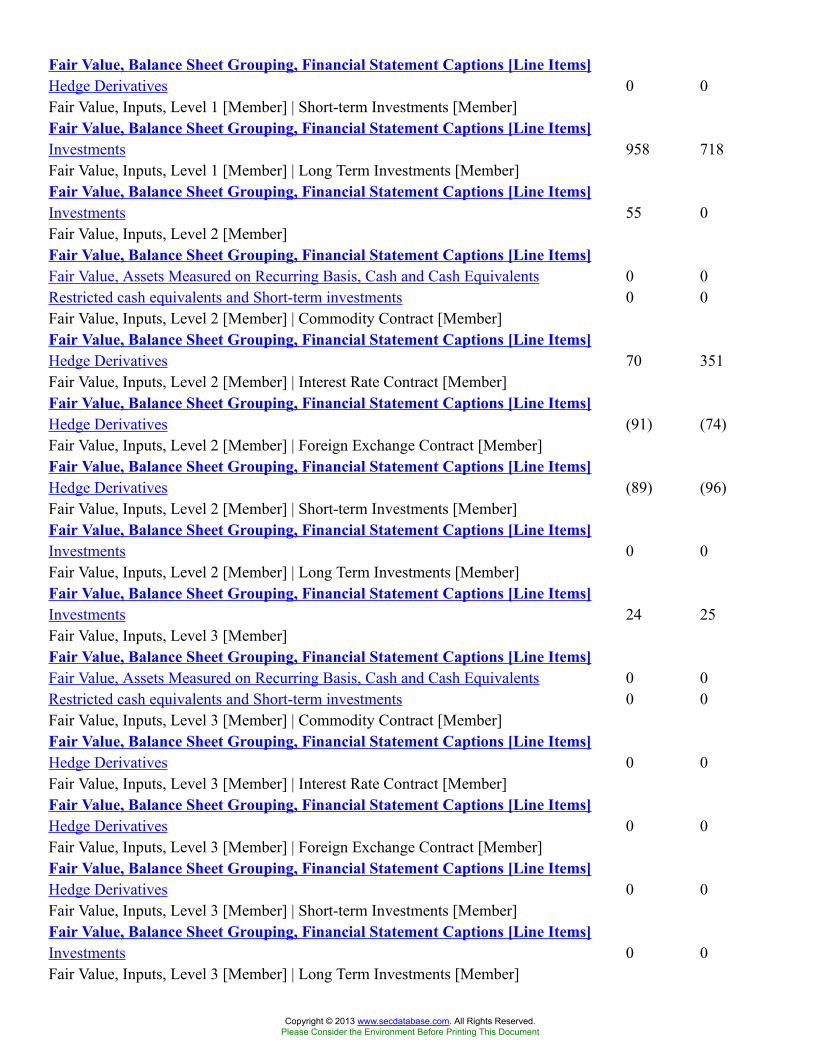
Fair Value, Balance Sheet Grouping, Financial Statement Captions [Line Items]Hedge Derivatives 0 0Fair Value, Inputs, Level 1 [Member] | Short-term Investments [Member]Fair Value, Balance Sheet Grouping, Financial Statement Captions [Line Items]Investments 958 718Fair Value, Inputs, Level 1 [Member] | Long Term Investments [Member]Fair Value, Balance Sheet Grouping, Financial Statement Captions [Line Items]Investments 55 0Fair Value, Inputs, Level 2 [Member]Fair Value, Balance Sheet Grouping, Financial Statement Captions [Line Items]Fair Value, Assets Measured on Recurring Basis, Cash and Cash Equivalents 0 0Restricted cash equivalents and Short-term investments 0 0Fair Value, Inputs, Level 2 [Member] | Commodity Contract [Member]Fair Value, Balance Sheet Grouping, Financial Statement Captions [Line Items]Hedge Derivatives 70 351Fair Value, Inputs, Level 2 [Member] | Interest Rate Contract [Member]Fair Value, Balance Sheet Grouping, Financial Statement Captions [Line Items]Hedge Derivatives (91) (74)Fair Value, Inputs, Level 2 [Member] | Foreign Exchange Contract [Member]Fair Value, Balance Sheet Grouping, Financial Statement Captions [Line Items]Hedge Derivatives (89) (96)Fair Value, Inputs, Level 2 [Member] | Short-term Investments [Member]Fair Value, Balance Sheet Grouping, Financial Statement Captions [Line Items]Investments 0 0Fair Value, Inputs, Level 2 [Member] | Long Term Investments [Member]Fair Value, Balance Sheet Grouping, Financial Statement Captions [Line Items]Investments 24 25Fair Value, Inputs, Level 3 [Member]Fair Value, Balance Sheet Grouping, Financial Statement Captions [Line Items]Fair Value, Assets Measured on Recurring Basis, Cash and Cash Equivalents 0 0Restricted cash equivalents and Short-term investments 0 0Fair Value, Inputs, Level 3 [Member] | Commodity Contract [Member]Fair Value, Balance Sheet Grouping, Financial Statement Captions [Line Items]Hedge Derivatives 0 0Fair Value, Inputs, Level 3 [Member] | Interest Rate Contract [Member]Fair Value, Balance Sheet Grouping, Financial Statement Captions [Line Items]Hedge Derivatives 0 0Fair Value, Inputs, Level 3 [Member] | Foreign Exchange Contract [Member]Fair Value, Balance Sheet Grouping, Financial Statement Captions [Line Items]Hedge Derivatives 0 0Fair Value, Inputs, Level 3 [Member] | Short-term Investments [Member]Fair Value, Balance Sheet Grouping, Financial Statement Captions [Line Items]Investments 0 0Fair Value, Inputs, Level 3 [Member] | Long Term Investments [Member]
Copyright © 2013 www.secdatabase.com. All Rights Reserved.Please Consider the Environment Before Printing This Document
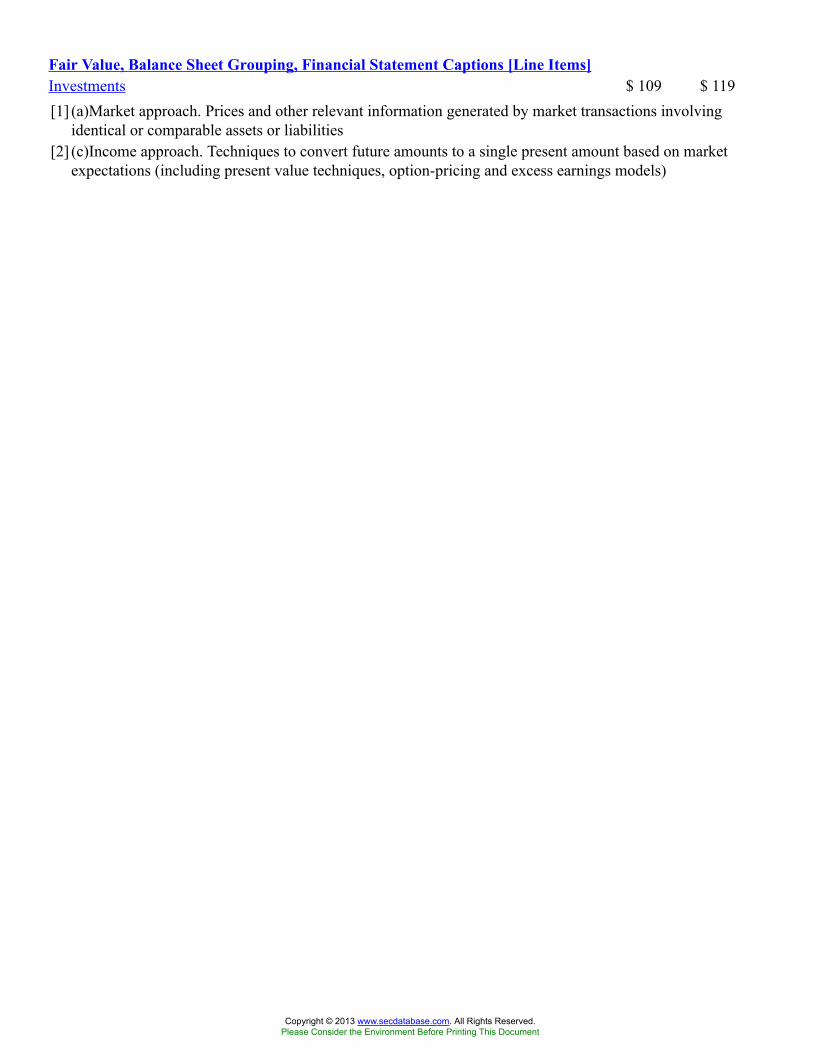
Fair Value, Balance Sheet Grouping, Financial Statement Captions [Line Items]Investments $ 109 $ 119[1] (a)Market approach. Prices and other relevant information generated by market transactions involving
identical or comparable assets or liabilities[2] (c)Income approach. Techniques to convert future amounts to a single present amount based on market
expectations (including present value techniques, option-pricing and excess earnings models)
Copyright © 2013 www.secdatabase.com. All Rights Reserved.Please Consider the Environment Before Printing This Document
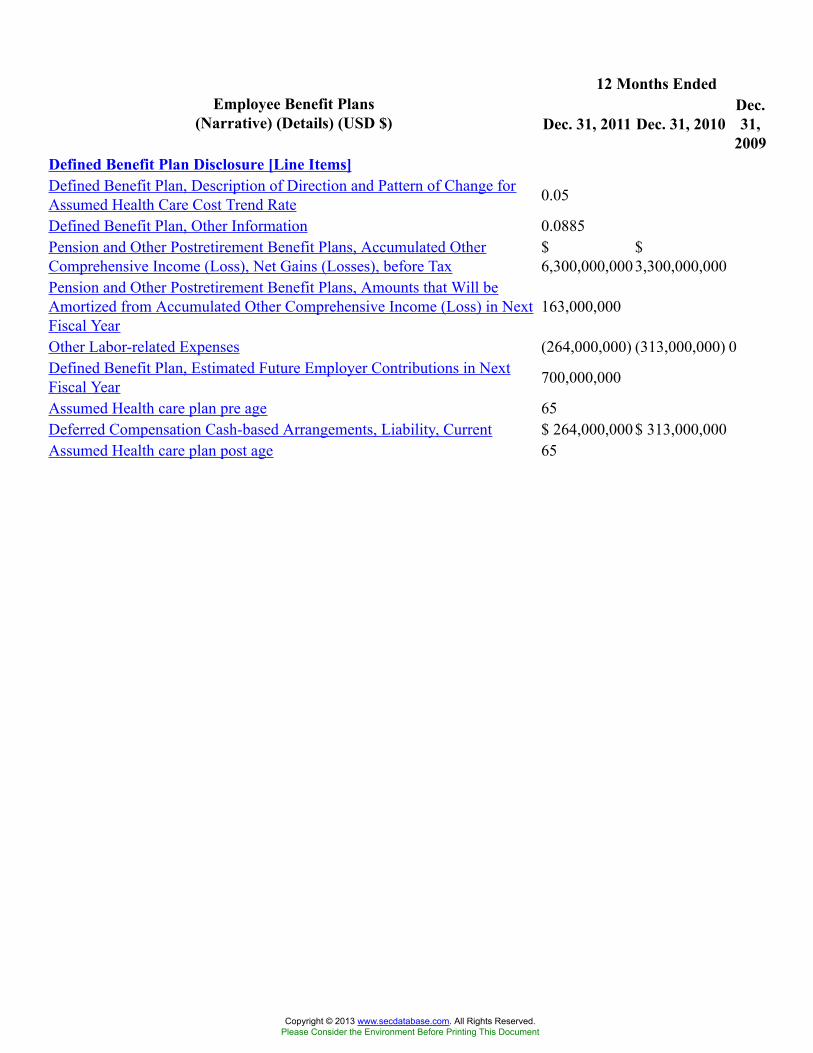
12 Months EndedEmployee Benefit Plans
(Narrative) (Details) (USD $) Dec. 31, 2011 Dec. 31, 2010Dec.31,
2009Defined Benefit Plan Disclosure [Line Items]Defined Benefit Plan, Description of Direction and Pattern of Change forAssumed Health Care Cost Trend Rate 0.05
Defined Benefit Plan, Other Information 0.0885Pension and Other Postretirement Benefit Plans, Accumulated OtherComprehensive Income (Loss), Net Gains (Losses), before Tax
$6,300,000,000
$3,300,000,000
Pension and Other Postretirement Benefit Plans, Amounts that Will beAmortized from Accumulated Other Comprehensive Income (Loss) in NextFiscal Year
163,000,000
Other Labor-related Expenses (264,000,000) (313,000,000) 0Defined Benefit Plan, Estimated Future Employer Contributions in NextFiscal Year 700,000,000
Assumed Health care plan pre age 65Deferred Compensation Cash-based Arrangements, Liability, Current $ 264,000,000$ 313,000,000Assumed Health care plan post age 65
Copyright © 2013 www.secdatabase.com. All Rights Reserved.Please Consider the Environment Before Printing This Document
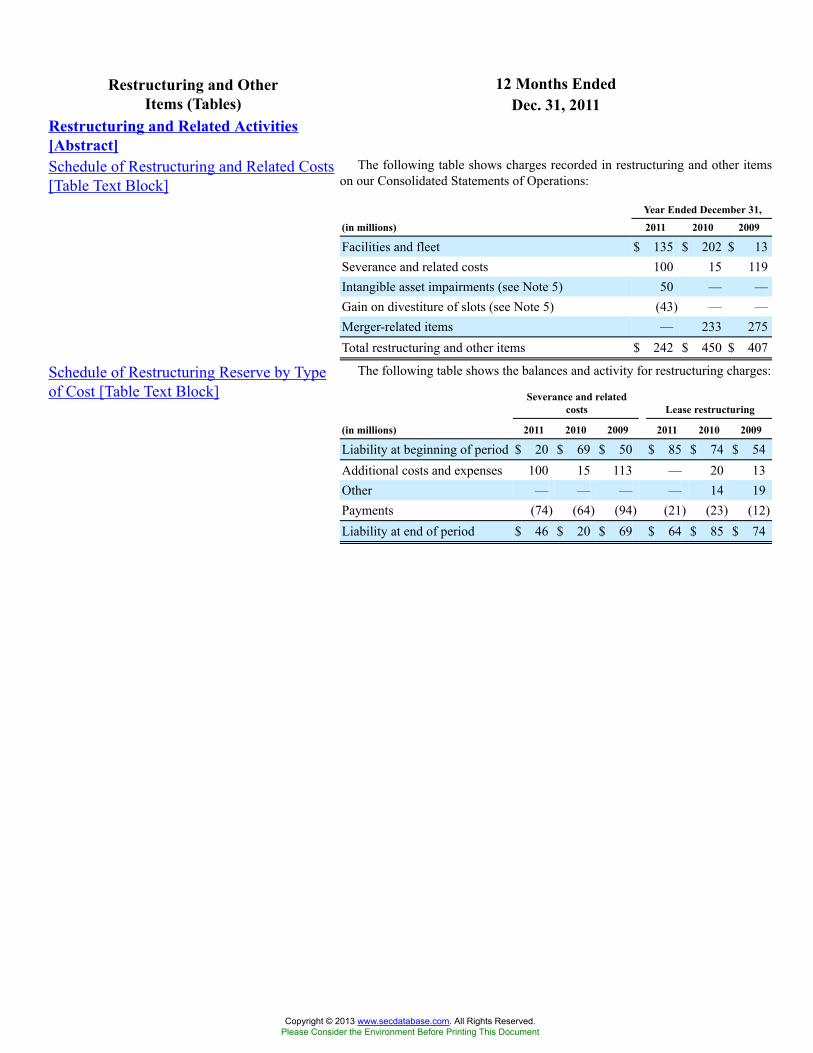
12 Months EndedRestructuring and OtherItems (Tables) Dec. 31, 2011
Restructuring and Related Activities[Abstract]Schedule of Restructuring and Related Costs[Table Text Block]
The following table shows charges recorded in restructuring and other itemson our Consolidated Statements of Operations:
Year Ended December 31,
(in millions) 2011 2010 2009
Facilities and fleet $ 135 $ 202 $ 13Severance and related costs 100 15 119Intangible asset impairments (see Note 5) 50 — —Gain on divestiture of slots (see Note 5) (43) — —Merger-related items — 233 275Total restructuring and other items $ 242 $ 450 $ 407
Schedule of Restructuring Reserve by Typeof Cost [Table Text Block]
The following table shows the balances and activity for restructuring charges:
Severance and relatedcosts Lease restructuring
(in millions) 2011 2010 2009 2011 2010 2009
Liability at beginning of period $ 20 $ 69 $ 50 $ 85 $ 74 $ 54Additional costs and expenses 100 15 113 — 20 13Other — — — — 14 19Payments (74) (64) (94) (21) (23) (12)Liability at end of period $ 46 $ 20 $ 69 $ 64 $ 85 $ 74
Copyright © 2013 www.secdatabase.com. All Rights Reserved.Please Consider the Environment Before Printing This Document
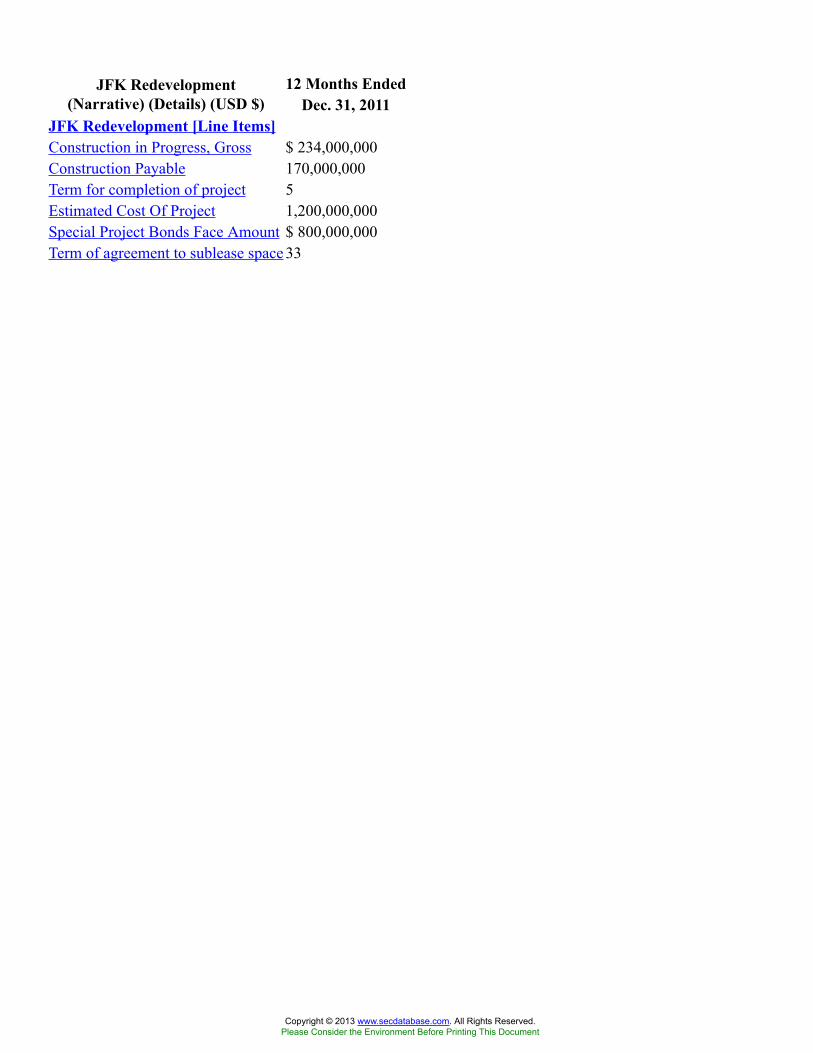
12 Months EndedJFK Redevelopment(Narrative) (Details) (USD $) Dec. 31, 2011
JFK Redevelopment [Line Items]Construction in Progress, Gross $ 234,000,000Construction Payable 170,000,000Term for completion of project 5Estimated Cost Of Project 1,200,000,000Special Project Bonds Face Amount $ 800,000,000Term of agreement to sublease space 33
Copyright © 2013 www.secdatabase.com. All Rights Reserved.Please Consider the Environment Before Printing This Document
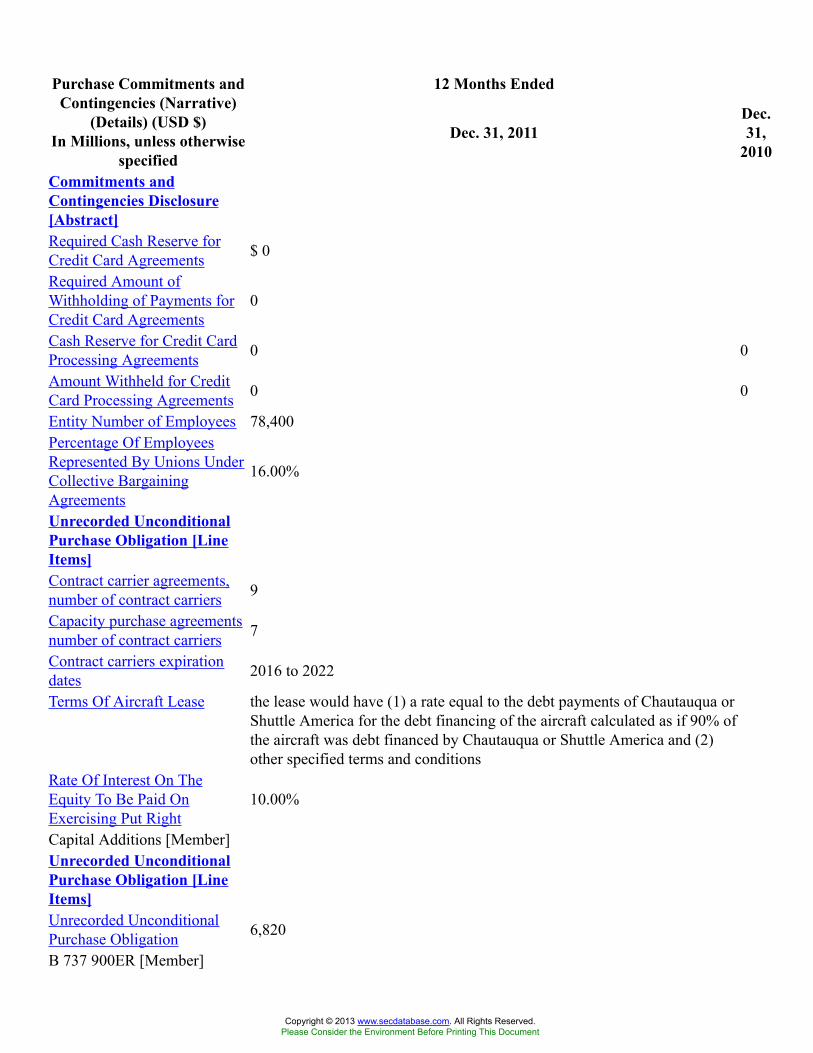
12 Months EndedPurchase Commitments andContingencies (Narrative)
(Details) (USD $)In Millions, unless otherwise
specified
Dec. 31, 2011Dec.31,
2010
Commitments andContingencies Disclosure[Abstract]Required Cash Reserve forCredit Card Agreements $ 0
Required Amount ofWithholding of Payments forCredit Card Agreements
0
Cash Reserve for Credit CardProcessing Agreements 0 0
Amount Withheld for CreditCard Processing Agreements 0 0
Entity Number of Employees 78,400Percentage Of EmployeesRepresented By Unions UnderCollective BargainingAgreements
16.00%
Unrecorded UnconditionalPurchase Obligation [LineItems]Contract carrier agreements,number of contract carriers 9
Capacity purchase agreementsnumber of contract carriers 7
Contract carriers expirationdates 2016 to 2022
Terms Of Aircraft Lease the lease would have (1) a rate equal to the debt payments of Chautauqua orShuttle America for the debt financing of the aircraft calculated as if 90% ofthe aircraft was debt financed by Chautauqua or Shuttle America and (2)other specified terms and conditions
Rate Of Interest On TheEquity To Be Paid OnExercising Put Right
10.00%
Capital Additions [Member]Unrecorded UnconditionalPurchase Obligation [LineItems]Unrecorded UnconditionalPurchase Obligation 6,820
B 737 900ER [Member]
Copyright © 2013 www.secdatabase.com. All Rights Reserved.Please Consider the Environment Before Printing This Document
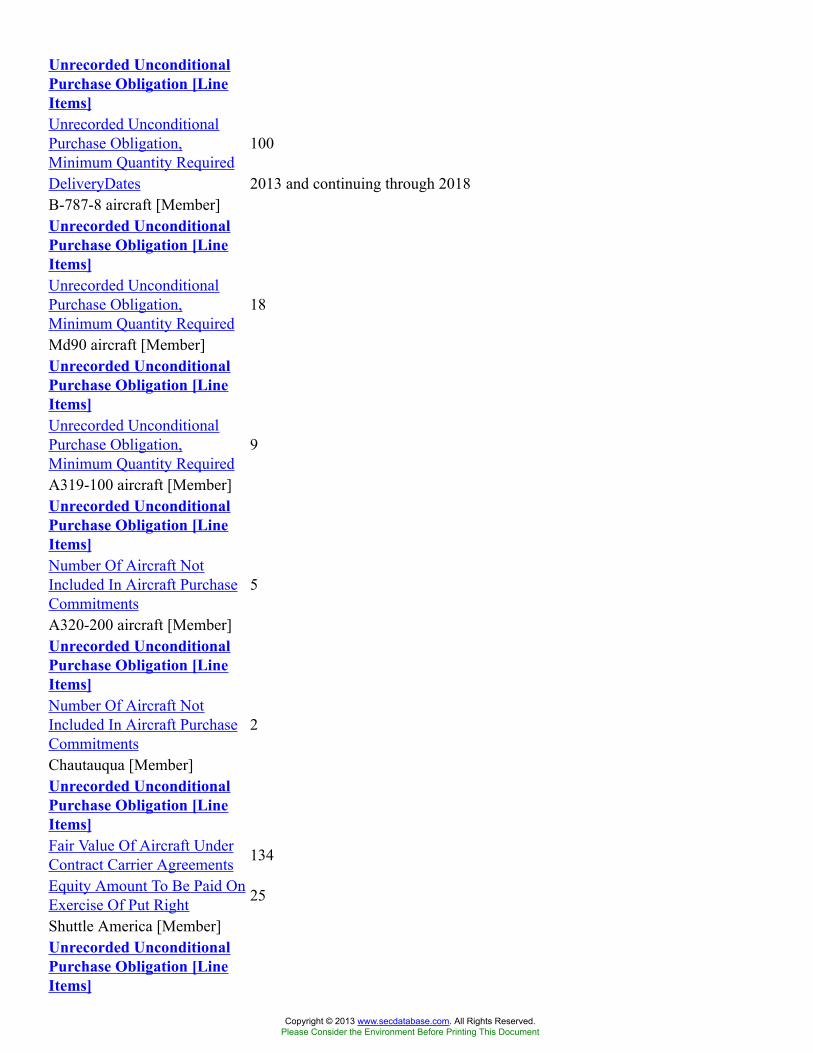
Unrecorded UnconditionalPurchase Obligation [LineItems]Unrecorded UnconditionalPurchase Obligation,Minimum Quantity Required
100
DeliveryDates 2013 and continuing through 2018B-787-8 aircraft [Member]Unrecorded UnconditionalPurchase Obligation [LineItems]Unrecorded UnconditionalPurchase Obligation,Minimum Quantity Required
18
Md90 aircraft [Member]Unrecorded UnconditionalPurchase Obligation [LineItems]Unrecorded UnconditionalPurchase Obligation,Minimum Quantity Required
9
A319-100 aircraft [Member]Unrecorded UnconditionalPurchase Obligation [LineItems]Number Of Aircraft NotIncluded In Aircraft PurchaseCommitments
5
A320-200 aircraft [Member]Unrecorded UnconditionalPurchase Obligation [LineItems]Number Of Aircraft NotIncluded In Aircraft PurchaseCommitments
2
Chautauqua [Member]Unrecorded UnconditionalPurchase Obligation [LineItems]Fair Value Of Aircraft UnderContract Carrier Agreements 134
Equity Amount To Be Paid OnExercise Of Put Right 25
Shuttle America [Member]Unrecorded UnconditionalPurchase Obligation [LineItems]
Copyright © 2013 www.secdatabase.com. All Rights Reserved.Please Consider the Environment Before Printing This Document

Contract carriers expirationdates January 2016
Fair Value Of Aircraft UnderContract Carrier Agreements 536
Equity Amount To Be Paid OnExercise Of Put Right $ 52
Copyright © 2013 www.secdatabase.com. All Rights Reserved.Please Consider the Environment Before Printing This Document
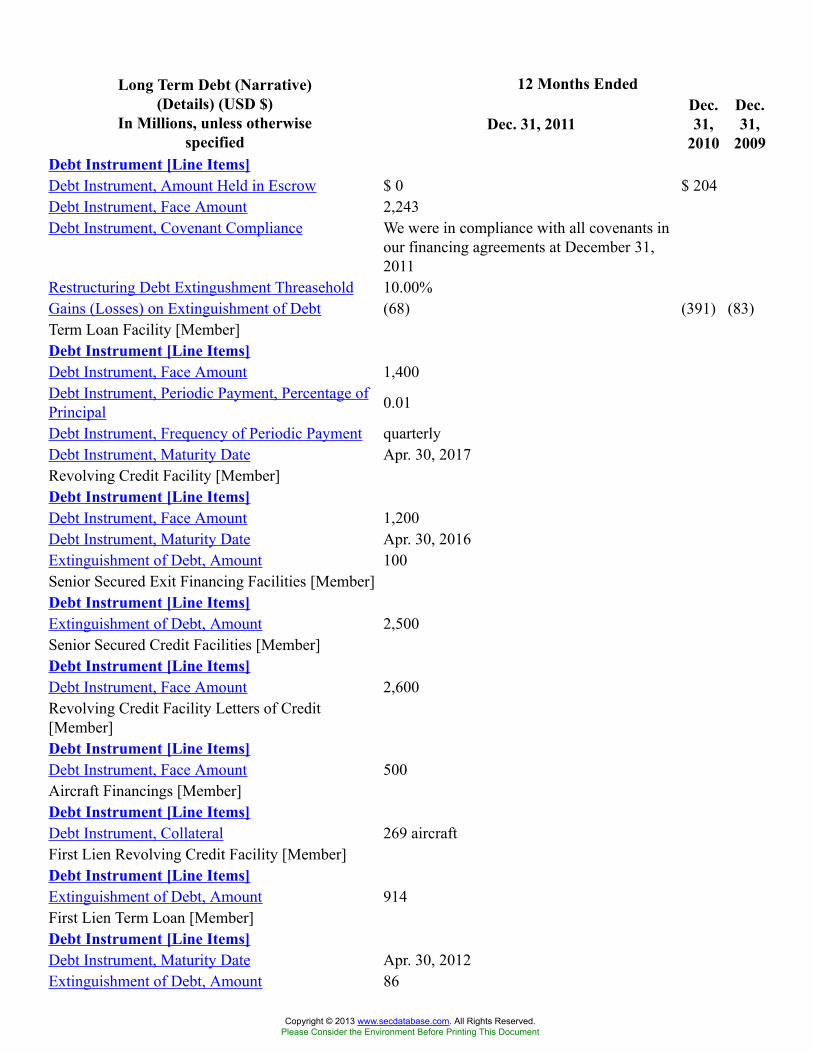
12 Months EndedLong Term Debt (Narrative)(Details) (USD $)
In Millions, unless otherwisespecified
Dec. 31, 2011Dec.31,
2010
Dec.31,
2009Debt Instrument [Line Items]Debt Instrument, Amount Held in Escrow $ 0 $ 204Debt Instrument, Face Amount 2,243Debt Instrument, Covenant Compliance We were in compliance with all covenants in
our financing agreements at December 31,2011
Restructuring Debt Extingushment Threasehold 10.00%Gains (Losses) on Extinguishment of Debt (68) (391) (83)Term Loan Facility [Member]Debt Instrument [Line Items]Debt Instrument, Face Amount 1,400Debt Instrument, Periodic Payment, Percentage ofPrincipal 0.01
Debt Instrument, Frequency of Periodic Payment quarterlyDebt Instrument, Maturity Date Apr. 30, 2017Revolving Credit Facility [Member]Debt Instrument [Line Items]Debt Instrument, Face Amount 1,200Debt Instrument, Maturity Date Apr. 30, 2016Extinguishment of Debt, Amount 100Senior Secured Exit Financing Facilities [Member]Debt Instrument [Line Items]Extinguishment of Debt, Amount 2,500Senior Secured Credit Facilities [Member]Debt Instrument [Line Items]Debt Instrument, Face Amount 2,600Revolving Credit Facility Letters of Credit[Member]Debt Instrument [Line Items]Debt Instrument, Face Amount 500Aircraft Financings [Member]Debt Instrument [Line Items]Debt Instrument, Collateral 269 aircraftFirst Lien Revolving Credit Facility [Member]Debt Instrument [Line Items]Extinguishment of Debt, Amount 914First Lien Term Loan [Member]Debt Instrument [Line Items]Debt Instrument, Maturity Date Apr. 30, 2012Extinguishment of Debt, Amount 86
Copyright © 2013 www.secdatabase.com. All Rights Reserved.Please Consider the Environment Before Printing This Document
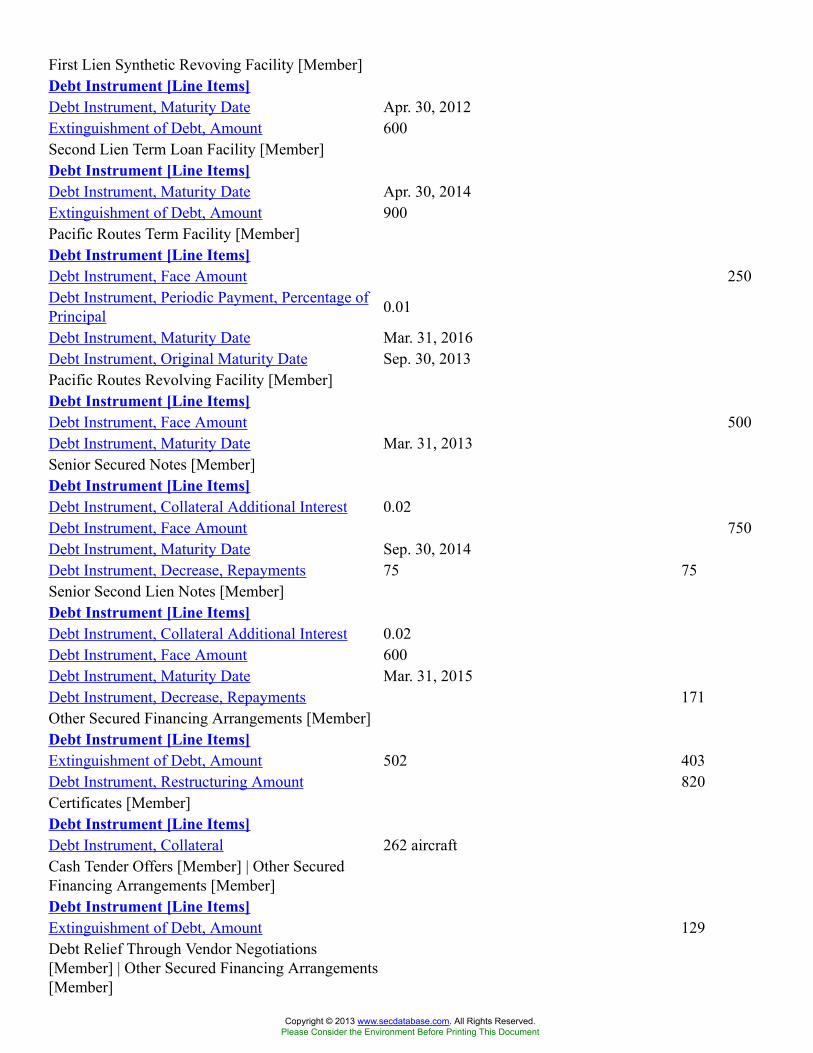
First Lien Synthetic Revoving Facility [Member]Debt Instrument [Line Items]Debt Instrument, Maturity Date Apr. 30, 2012Extinguishment of Debt, Amount 600Second Lien Term Loan Facility [Member]Debt Instrument [Line Items]Debt Instrument, Maturity Date Apr. 30, 2014Extinguishment of Debt, Amount 900Pacific Routes Term Facility [Member]Debt Instrument [Line Items]Debt Instrument, Face Amount 250Debt Instrument, Periodic Payment, Percentage ofPrincipal 0.01
Debt Instrument, Maturity Date Mar. 31, 2016Debt Instrument, Original Maturity Date Sep. 30, 2013Pacific Routes Revolving Facility [Member]Debt Instrument [Line Items]Debt Instrument, Face Amount 500Debt Instrument, Maturity Date Mar. 31, 2013Senior Secured Notes [Member]Debt Instrument [Line Items]Debt Instrument, Collateral Additional Interest 0.02Debt Instrument, Face Amount 750Debt Instrument, Maturity Date Sep. 30, 2014Debt Instrument, Decrease, Repayments 75 75Senior Second Lien Notes [Member]Debt Instrument [Line Items]Debt Instrument, Collateral Additional Interest 0.02Debt Instrument, Face Amount 600Debt Instrument, Maturity Date Mar. 31, 2015Debt Instrument, Decrease, Repayments 171Other Secured Financing Arrangements [Member]Debt Instrument [Line Items]Extinguishment of Debt, Amount 502 403Debt Instrument, Restructuring Amount 820Certificates [Member]Debt Instrument [Line Items]Debt Instrument, Collateral 262 aircraftCash Tender Offers [Member] | Other SecuredFinancing Arrangements [Member]Debt Instrument [Line Items]Extinguishment of Debt, Amount 129Debt Relief Through Vendor Negotiations[Member] | Other Secured Financing Arrangements[Member]
Copyright © 2013 www.secdatabase.com. All Rights Reserved.Please Consider the Environment Before Printing This Document

Debt Instrument [Line Items]Extinguishment of Debt, Amount $ 160
Copyright © 2013 www.secdatabase.com. All Rights Reserved.Please Consider the Environment Before Printing This Document
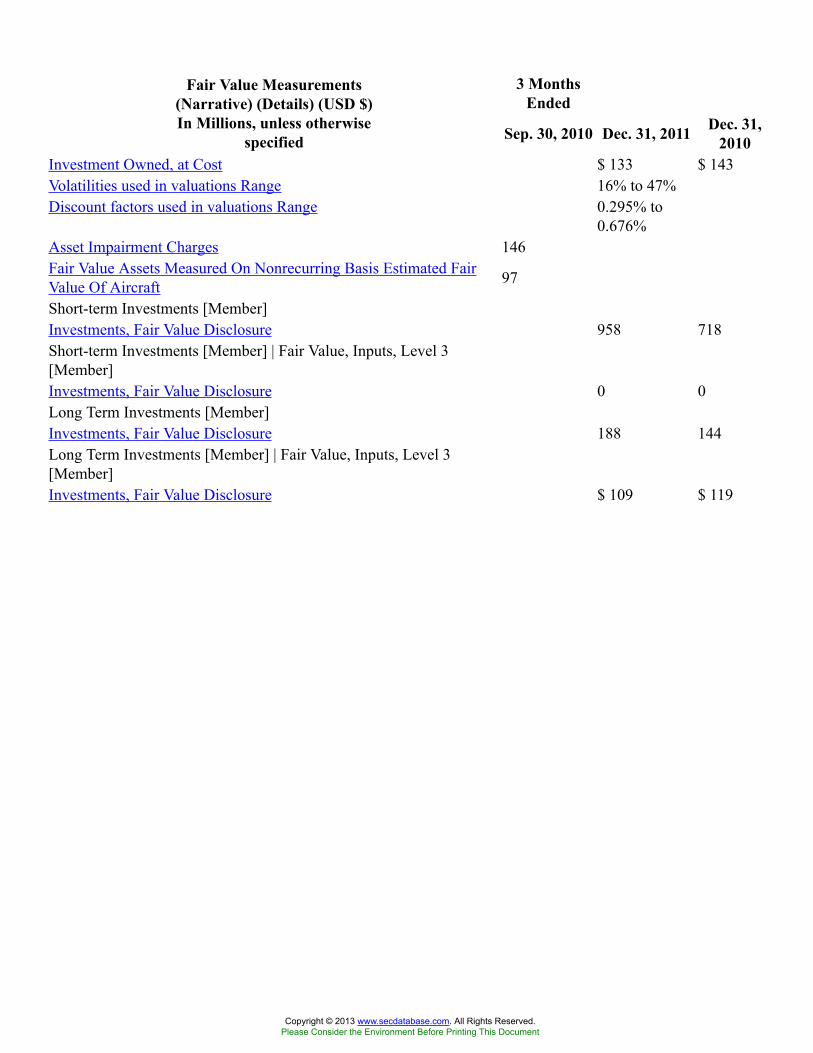
3 MonthsEnded
Fair Value Measurements(Narrative) (Details) (USD $)In Millions, unless otherwise
specified Sep. 30, 2010 Dec. 31, 2011 Dec. 31,2010
Investment Owned, at Cost $ 133 $ 143Volatilities used in valuations Range 16% to 47%Discount factors used in valuations Range 0.295% to
0.676%Asset Impairment Charges 146Fair Value Assets Measured On Nonrecurring Basis Estimated FairValue Of Aircraft 97
Short-term Investments [Member]Investments, Fair Value Disclosure 958 718Short-term Investments [Member] | Fair Value, Inputs, Level 3[Member]Investments, Fair Value Disclosure 0 0Long Term Investments [Member]Investments, Fair Value Disclosure 188 144Long Term Investments [Member] | Fair Value, Inputs, Level 3[Member]Investments, Fair Value Disclosure $ 109 $ 119
Copyright © 2013 www.secdatabase.com. All Rights Reserved.Please Consider the Environment Before Printing This Document
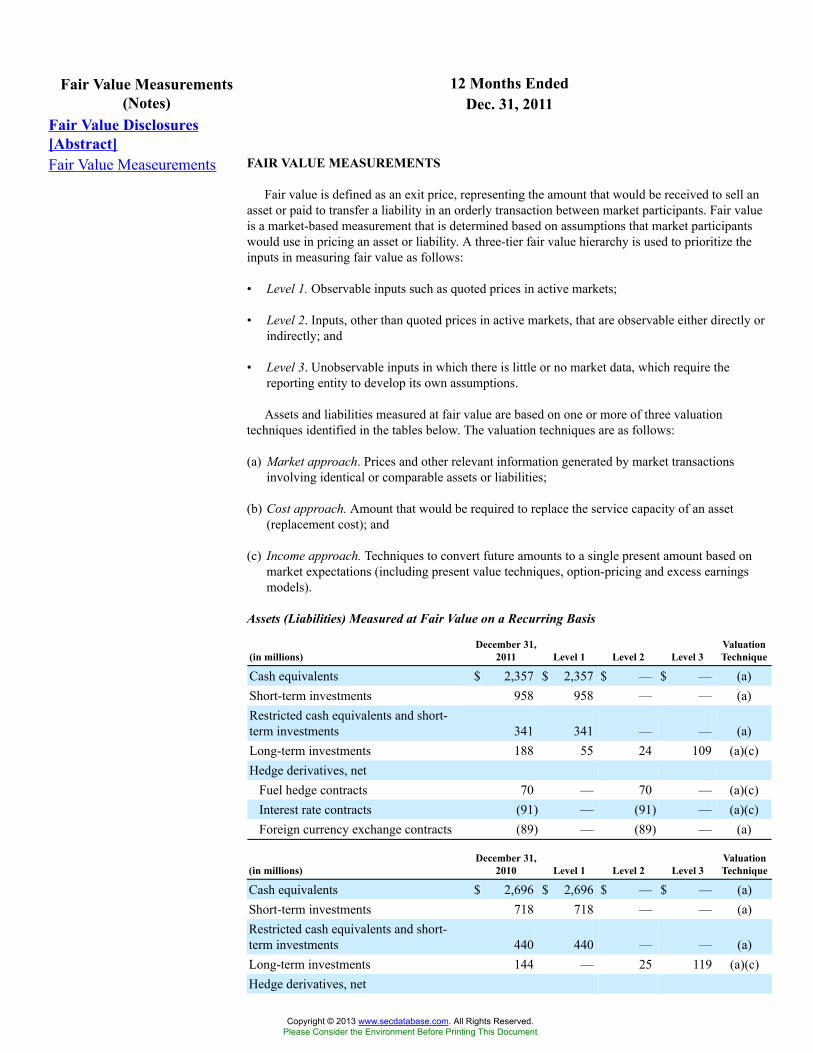
12 Months EndedFair Value Measurements(Notes) Dec. 31, 2011
Fair Value Disclosures[Abstract]Fair Value Measeurements FAIR VALUE MEASUREMENTS
Fair value is defined as an exit price, representing the amount that would be received to sell anasset or paid to transfer a liability in an orderly transaction between market participants. Fair valueis a market-based measurement that is determined based on assumptions that market participantswould use in pricing an asset or liability. A three-tier fair value hierarchy is used to prioritize theinputs in measuring fair value as follows:
• Level 1. Observable inputs such as quoted prices in active markets;
• Level 2. Inputs, other than quoted prices in active markets, that are observable either directly orindirectly; and
• Level 3. Unobservable inputs in which there is little or no market data, which require thereporting entity to develop its own assumptions.
Assets and liabilities measured at fair value are based on one or more of three valuationtechniques identified in the tables below. The valuation techniques are as follows:
(a) Market approach. Prices and other relevant information generated by market transactionsinvolving identical or comparable assets or liabilities;
(b) Cost approach. Amount that would be required to replace the service capacity of an asset(replacement cost); and
(c) Income approach. Techniques to convert future amounts to a single present amount based onmarket expectations (including present value techniques, option-pricing and excess earningsmodels).
Assets (Liabilities) Measured at Fair Value on a Recurring Basis
(in millions)December 31,
2011 Level 1 Level 2 Level 3ValuationTechnique
Cash equivalents $ 2,357 $ 2,357 $ — $ — (a)Short-term investments 958 958 — — (a)Restricted cash equivalents and short-term investments 341 341 — — (a)Long-term investments 188 55 24 109 (a)(c)Hedge derivatives, net
Fuel hedge contracts 70 — 70 — (a)(c)Interest rate contracts (91) — (91) — (a)(c)Foreign currency exchange contracts (89) — (89) — (a)
(in millions)December 31,
2010 Level 1 Level 2 Level 3ValuationTechnique
Cash equivalents $ 2,696 $ 2,696 $ — $ — (a)Short-term investments 718 718 — — (a)Restricted cash equivalents and short-term investments 440 440 — — (a)Long-term investments 144 — 25 119 (a)(c)Hedge derivatives, net
Copyright © 2013 www.secdatabase.com. All Rights Reserved.Please Consider the Environment Before Printing This Document
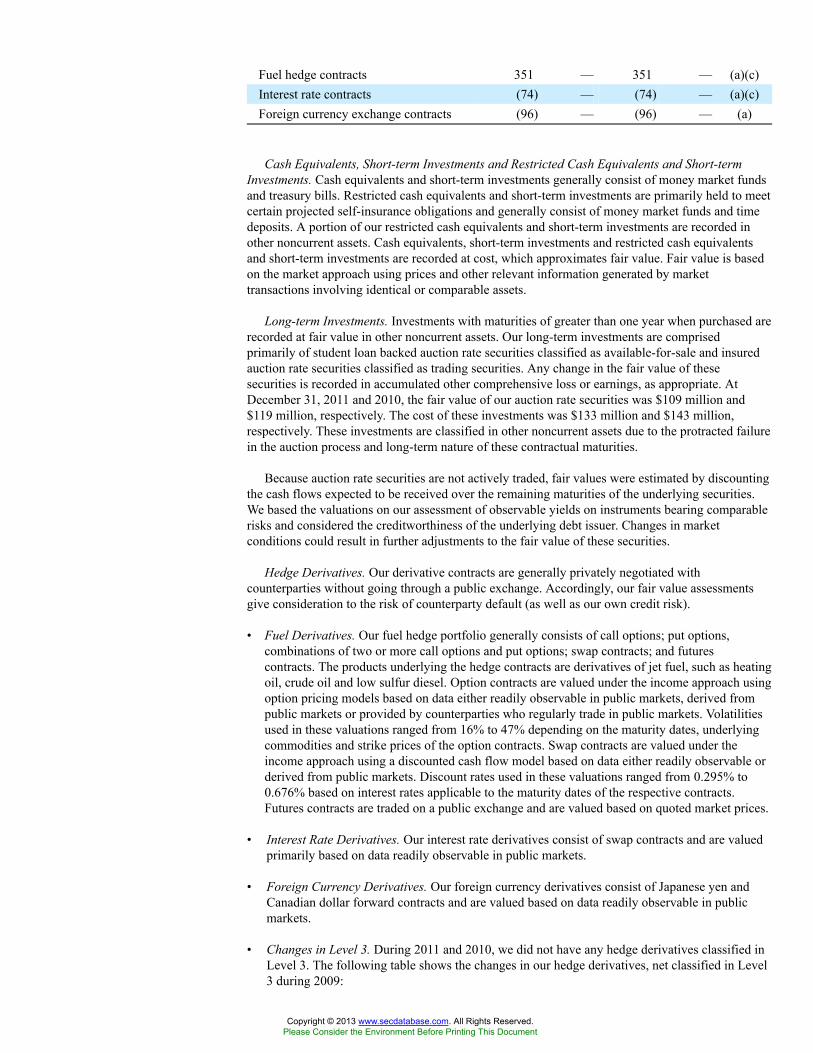
Fuel hedge contracts 351 — 351 — (a)(c)Interest rate contracts (74) — (74) — (a)(c)Foreign currency exchange contracts (96) — (96) — (a)
Cash Equivalents, Short-term Investments and Restricted Cash Equivalents and Short-termInvestments. Cash equivalents and short-term investments generally consist of money market fundsand treasury bills. Restricted cash equivalents and short-term investments are primarily held to meetcertain projected self-insurance obligations and generally consist of money market funds and timedeposits. A portion of our restricted cash equivalents and short-term investments are recorded inother noncurrent assets. Cash equivalents, short-term investments and restricted cash equivalentsand short-term investments are recorded at cost, which approximates fair value. Fair value is basedon the market approach using prices and other relevant information generated by markettransactions involving identical or comparable assets.
Long-term Investments. Investments with maturities of greater than one year when purchased arerecorded at fair value in other noncurrent assets. Our long-term investments are comprisedprimarily of student loan backed auction rate securities classified as available-for-sale and insuredauction rate securities classified as trading securities. Any change in the fair value of thesesecurities is recorded in accumulated other comprehensive loss or earnings, as appropriate. AtDecember 31, 2011 and 2010, the fair value of our auction rate securities was $109 million and$119 million, respectively. The cost of these investments was $133 million and $143 million,respectively. These investments are classified in other noncurrent assets due to the protracted failurein the auction process and long-term nature of these contractual maturities.
Because auction rate securities are not actively traded, fair values were estimated by discountingthe cash flows expected to be received over the remaining maturities of the underlying securities.We based the valuations on our assessment of observable yields on instruments bearing comparablerisks and considered the creditworthiness of the underlying debt issuer. Changes in marketconditions could result in further adjustments to the fair value of these securities.
Hedge Derivatives. Our derivative contracts are generally privately negotiated withcounterparties without going through a public exchange. Accordingly, our fair value assessmentsgive consideration to the risk of counterparty default (as well as our own credit risk).
• Fuel Derivatives. Our fuel hedge portfolio generally consists of call options; put options,combinations of two or more call options and put options; swap contracts; and futurescontracts. The products underlying the hedge contracts are derivatives of jet fuel, such as heatingoil, crude oil and low sulfur diesel. Option contracts are valued under the income approach usingoption pricing models based on data either readily observable in public markets, derived frompublic markets or provided by counterparties who regularly trade in public markets. Volatilitiesused in these valuations ranged from 16% to 47% depending on the maturity dates, underlyingcommodities and strike prices of the option contracts. Swap contracts are valued under theincome approach using a discounted cash flow model based on data either readily observable orderived from public markets. Discount rates used in these valuations ranged from 0.295% to0.676% based on interest rates applicable to the maturity dates of the respective contracts.Futures contracts are traded on a public exchange and are valued based on quoted market prices.
• Interest Rate Derivatives. Our interest rate derivatives consist of swap contracts and are valuedprimarily based on data readily observable in public markets.
• Foreign Currency Derivatives. Our foreign currency derivatives consist of Japanese yen andCanadian dollar forward contracts and are valued based on data readily observable in publicmarkets.
• Changes in Level 3. During 2011 and 2010, we did not have any hedge derivatives classified inLevel 3. The following table shows the changes in our hedge derivatives, net classified in Level3 during 2009:
Copyright © 2013 www.secdatabase.com. All Rights Reserved.Please Consider the Environment Before Printing This Document
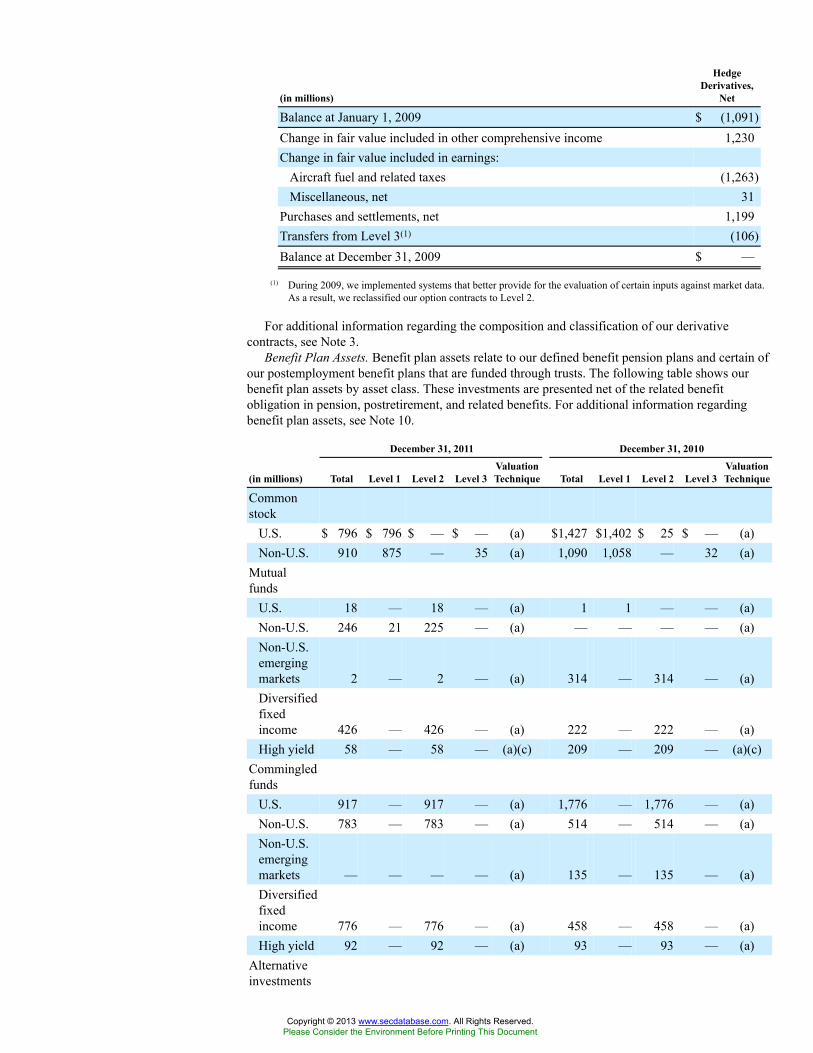
(in millions)
HedgeDerivatives,
Net
Balance at January 1, 2009 $ (1,091)Change in fair value included in other comprehensive income 1,230Change in fair value included in earnings:
Aircraft fuel and related taxes (1,263)Miscellaneous, net 31
Purchases and settlements, net 1,199Transfers from Level 3(1) (106)Balance at December 31, 2009 $ —
(1) During 2009, we implemented systems that better provide for the evaluation of certain inputs against market data.As a result, we reclassified our option contracts to Level 2.
For additional information regarding the composition and classification of our derivativecontracts, see Note 3.
Benefit Plan Assets. Benefit plan assets relate to our defined benefit pension plans and certain ofour postemployment benefit plans that are funded through trusts. The following table shows ourbenefit plan assets by asset class. These investments are presented net of the related benefitobligation in pension, postretirement, and related benefits. For additional information regardingbenefit plan assets, see Note 10.
December 31, 2011 December 31, 2010
(in millions) Total Level 1 Level 2 Level 3ValuationTechnique Total Level 1 Level 2 Level 3
ValuationTechnique
Commonstock
U.S. $ 796 $ 796 $ — $ — (a) $1,427 $1,402 $ 25 $ — (a)Non-U.S. 910 875 — 35 (a) 1,090 1,058 — 32 (a)
Mutualfunds
U.S. 18 — 18 — (a) 1 1 — — (a)Non-U.S. 246 21 225 — (a) — — — — (a)Non-U.S.emergingmarkets 2 — 2 — (a) 314 — 314 — (a)Diversifiedfixedincome 426 — 426 — (a) 222 — 222 — (a)High yield 58 — 58 — (a)(c) 209 — 209 — (a)(c)
Commingledfunds
U.S. 917 — 917 — (a) 1,776 — 1,776 — (a)Non-U.S. 783 — 783 — (a) 514 — 514 — (a)Non-U.S.emergingmarkets — — — — (a) 135 — 135 — (a)Diversifiedfixedincome 776 — 776 — (a) 458 — 458 — (a)High yield 92 — 92 — (a) 93 — 93 — (a)
Alternativeinvestments
Copyright © 2013 www.secdatabase.com. All Rights Reserved.Please Consider the Environment Before Printing This Document
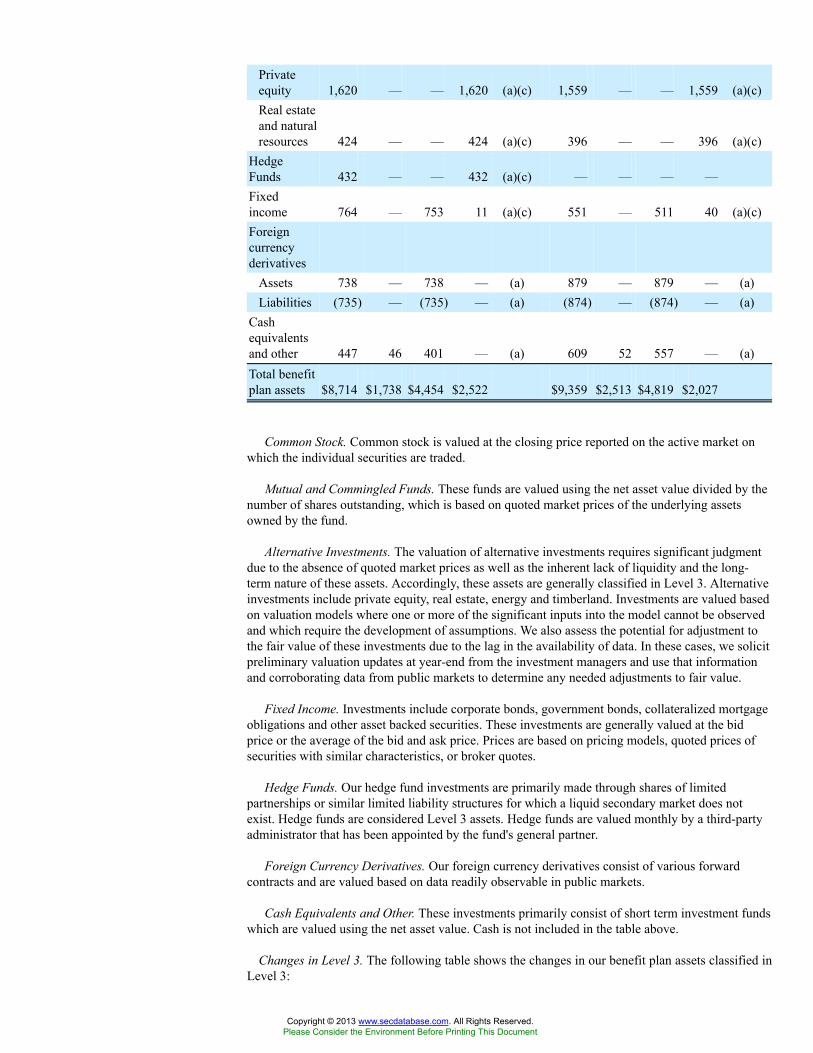
Privateequity 1,620 — — 1,620 (a)(c) 1,559 — — 1,559 (a)(c)Real estateand naturalresources 424 — — 424 (a)(c) 396 — — 396 (a)(c)
HedgeFunds 432 — — 432 (a)(c) — — — —Fixedincome 764 — 753 11 (a)(c) 551 — 511 40 (a)(c)Foreigncurrencyderivatives
Assets 738 — 738 — (a) 879 — 879 — (a)Liabilities (735) — (735) — (a) (874) — (874) — (a)
Cashequivalentsand other 447 46 401 — (a) 609 52 557 — (a)Total benefitplan assets $8,714 $1,738 $4,454 $2,522 $9,359 $2,513 $4,819 $2,027
Common Stock. Common stock is valued at the closing price reported on the active market onwhich the individual securities are traded.
Mutual and Commingled Funds. These funds are valued using the net asset value divided by thenumber of shares outstanding, which is based on quoted market prices of the underlying assetsowned by the fund.
Alternative Investments. The valuation of alternative investments requires significant judgmentdue to the absence of quoted market prices as well as the inherent lack of liquidity and the long-term nature of these assets. Accordingly, these assets are generally classified in Level 3. Alternativeinvestments include private equity, real estate, energy and timberland. Investments are valued basedon valuation models where one or more of the significant inputs into the model cannot be observedand which require the development of assumptions. We also assess the potential for adjustment tothe fair value of these investments due to the lag in the availability of data. In these cases, we solicitpreliminary valuation updates at year-end from the investment managers and use that informationand corroborating data from public markets to determine any needed adjustments to fair value.
Fixed Income. Investments include corporate bonds, government bonds, collateralized mortgageobligations and other asset backed securities. These investments are generally valued at the bidprice or the average of the bid and ask price. Prices are based on pricing models, quoted prices ofsecurities with similar characteristics, or broker quotes.
Hedge Funds. Our hedge fund investments are primarily made through shares of limitedpartnerships or similar limited liability structures for which a liquid secondary market does notexist. Hedge funds are considered Level 3 assets. Hedge funds are valued monthly by a third-partyadministrator that has been appointed by the fund's general partner.
Foreign Currency Derivatives. Our foreign currency derivatives consist of various forwardcontracts and are valued based on data readily observable in public markets.
Cash Equivalents and Other. These investments primarily consist of short term investment fundswhich are valued using the net asset value. Cash is not included in the table above.
Changes in Level 3. The following table shows the changes in our benefit plan assets classified inLevel 3:
Copyright © 2013 www.secdatabase.com. All Rights Reserved.Please Consider the Environment Before Printing This Document
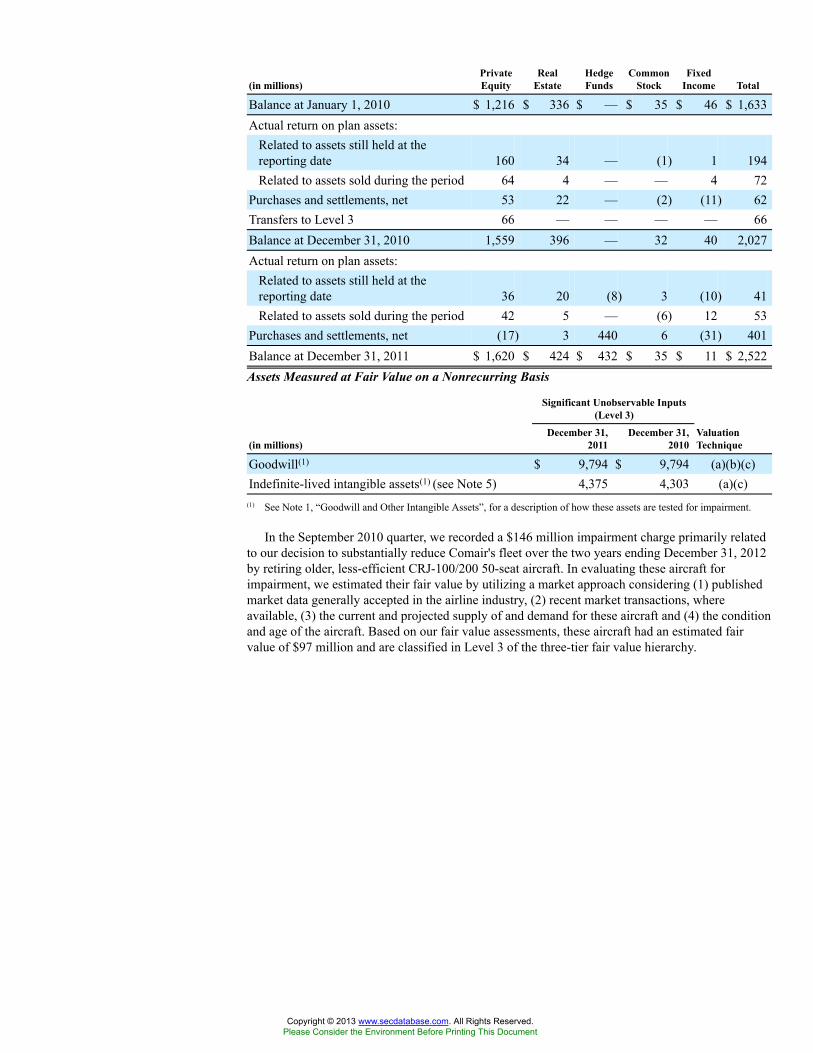
(in millions)PrivateEquity
RealEstate
HedgeFunds
CommonStock
FixedIncome Total
Balance at January 1, 2010 $ 1,216 $ 336 $ — $ 35 $ 46 $ 1,633Actual return on plan assets:
Related to assets still held at thereporting date 160 34 — (1) 1 194Related to assets sold during the period 64 4 — — 4 72
Purchases and settlements, net 53 22 — (2) (11) 62Transfers to Level 3 66 — — — — 66Balance at December 31, 2010 1,559 396 — 32 40 2,027Actual return on plan assets:
Related to assets still held at thereporting date 36 20 (8) 3 (10) 41Related to assets sold during the period 42 5 — (6) 12 53
Purchases and settlements, net (17) 3 440 6 (31) 401Balance at December 31, 2011 $ 1,620 $ 424 $ 432 $ 35 $ 11 $ 2,522Assets Measured at Fair Value on a Nonrecurring Basis
Significant Unobservable Inputs(Level 3)
(in millions)December 31,
2011December 31,
2010ValuationTechnique
Goodwill(1) $ 9,794 $ 9,794 (a)(b)(c)Indefinite-lived intangible assets(1) (see Note 5) 4,375 4,303 (a)(c)
(1) See Note 1, “Goodwill and Other Intangible Assets”, for a description of how these assets are tested for impairment.
In the September 2010 quarter, we recorded a $146 million impairment charge primarily relatedto our decision to substantially reduce Comair's fleet over the two years ending December 31, 2012by retiring older, less-efficient CRJ-100/200 50-seat aircraft. In evaluating these aircraft forimpairment, we estimated their fair value by utilizing a market approach considering (1) publishedmarket data generally accepted in the airline industry, (2) recent market transactions, whereavailable, (3) the current and projected supply of and demand for these aircraft and (4) the conditionand age of the aircraft. Based on our fair value assessments, these aircraft had an estimated fairvalue of $97 million and are classified in Level 3 of the three-tier fair value hierarchy.
Copyright © 2013 www.secdatabase.com. All Rights Reserved.Please Consider the Environment Before Printing This Document
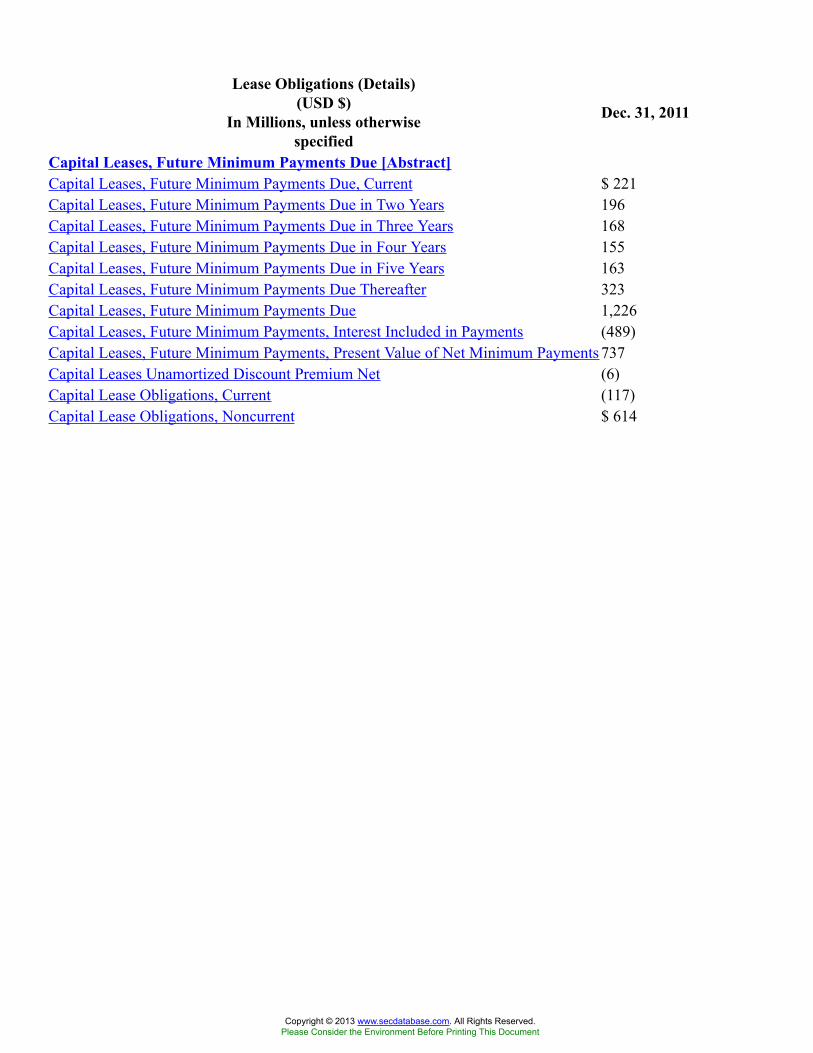
Lease Obligations (Details)(USD $)
In Millions, unless otherwisespecified
Dec. 31, 2011
Capital Leases, Future Minimum Payments Due [Abstract]Capital Leases, Future Minimum Payments Due, Current $ 221Capital Leases, Future Minimum Payments Due in Two Years 196Capital Leases, Future Minimum Payments Due in Three Years 168Capital Leases, Future Minimum Payments Due in Four Years 155Capital Leases, Future Minimum Payments Due in Five Years 163Capital Leases, Future Minimum Payments Due Thereafter 323Capital Leases, Future Minimum Payments Due 1,226Capital Leases, Future Minimum Payments, Interest Included in Payments (489)Capital Leases, Future Minimum Payments, Present Value of Net Minimum Payments 737Capital Leases Unamortized Discount Premium Net (6)Capital Lease Obligations, Current (117)Capital Lease Obligations, Noncurrent $ 614
Copyright © 2013 www.secdatabase.com. All Rights Reserved.Please Consider the Environment Before Printing This Document
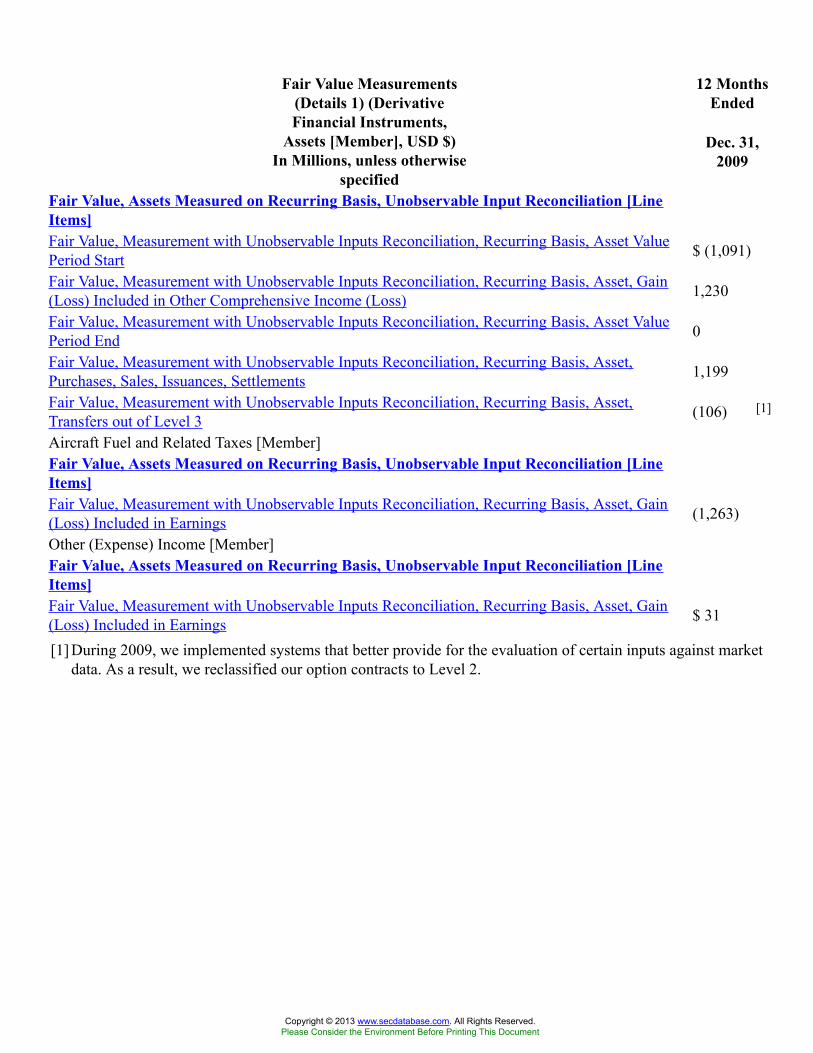
12 MonthsEnded
Fair Value Measurements(Details 1) (DerivativeFinancial Instruments,
Assets [Member], USD $)In Millions, unless otherwise
specified
Dec. 31,2009
Fair Value, Assets Measured on Recurring Basis, Unobservable Input Reconciliation [LineItems]Fair Value, Measurement with Unobservable Inputs Reconciliation, Recurring Basis, Asset ValuePeriod Start $ (1,091)
Fair Value, Measurement with Unobservable Inputs Reconciliation, Recurring Basis, Asset, Gain(Loss) Included in Other Comprehensive Income (Loss) 1,230
Fair Value, Measurement with Unobservable Inputs Reconciliation, Recurring Basis, Asset ValuePeriod End 0
Fair Value, Measurement with Unobservable Inputs Reconciliation, Recurring Basis, Asset,Purchases, Sales, Issuances, Settlements 1,199
Fair Value, Measurement with Unobservable Inputs Reconciliation, Recurring Basis, Asset,Transfers out of Level 3 (106) [1]
Aircraft Fuel and Related Taxes [Member]Fair Value, Assets Measured on Recurring Basis, Unobservable Input Reconciliation [LineItems]Fair Value, Measurement with Unobservable Inputs Reconciliation, Recurring Basis, Asset, Gain(Loss) Included in Earnings (1,263)
Other (Expense) Income [Member]Fair Value, Assets Measured on Recurring Basis, Unobservable Input Reconciliation [LineItems]Fair Value, Measurement with Unobservable Inputs Reconciliation, Recurring Basis, Asset, Gain(Loss) Included in Earnings $ 31
[1] During 2009, we implemented systems that better provide for the evaluation of certain inputs against marketdata. As a result, we reclassified our option contracts to Level 2.
Copyright © 2013 www.secdatabase.com. All Rights Reserved.Please Consider the Environment Before Printing This Document
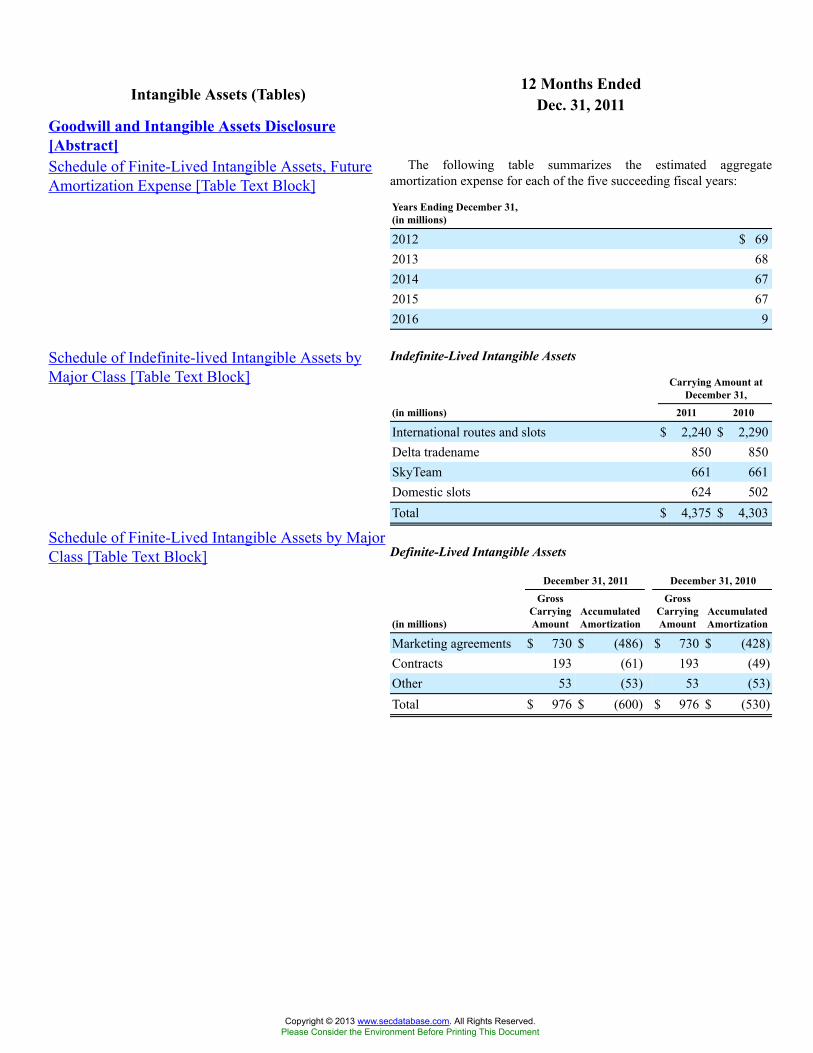
12 Months EndedIntangible Assets (Tables) Dec. 31, 2011Goodwill and Intangible Assets Disclosure[Abstract]Schedule of Finite-Lived Intangible Assets, FutureAmortization Expense [Table Text Block]
The following table summarizes the estimated aggregateamortization expense for each of the five succeeding fiscal years:
Years Ending December 31,(in millions)
2012 $ 692013 682014 672015 672016 9
Schedule of Indefinite-lived Intangible Assets byMajor Class [Table Text Block]
Indefinite-Lived Intangible Assets
Carrying Amount atDecember 31,
(in millions) 2011 2010
International routes and slots $ 2,240 $ 2,290Delta tradename 850 850SkyTeam 661 661Domestic slots 624 502Total $ 4,375 $ 4,303
Schedule of Finite-Lived Intangible Assets by MajorClass [Table Text Block] Definite-Lived Intangible Assets
December 31, 2011 December 31, 2010
(in millions)
GrossCarryingAmount
AccumulatedAmortization
GrossCarryingAmount
AccumulatedAmortization
Marketing agreements $ 730 $ (486) $ 730 $ (428)Contracts 193 (61) 193 (49)Other 53 (53) 53 (53)Total $ 976 $ (600) $ 976 $ (530)
Copyright © 2013 www.secdatabase.com. All Rights Reserved.Please Consider the Environment Before Printing This Document
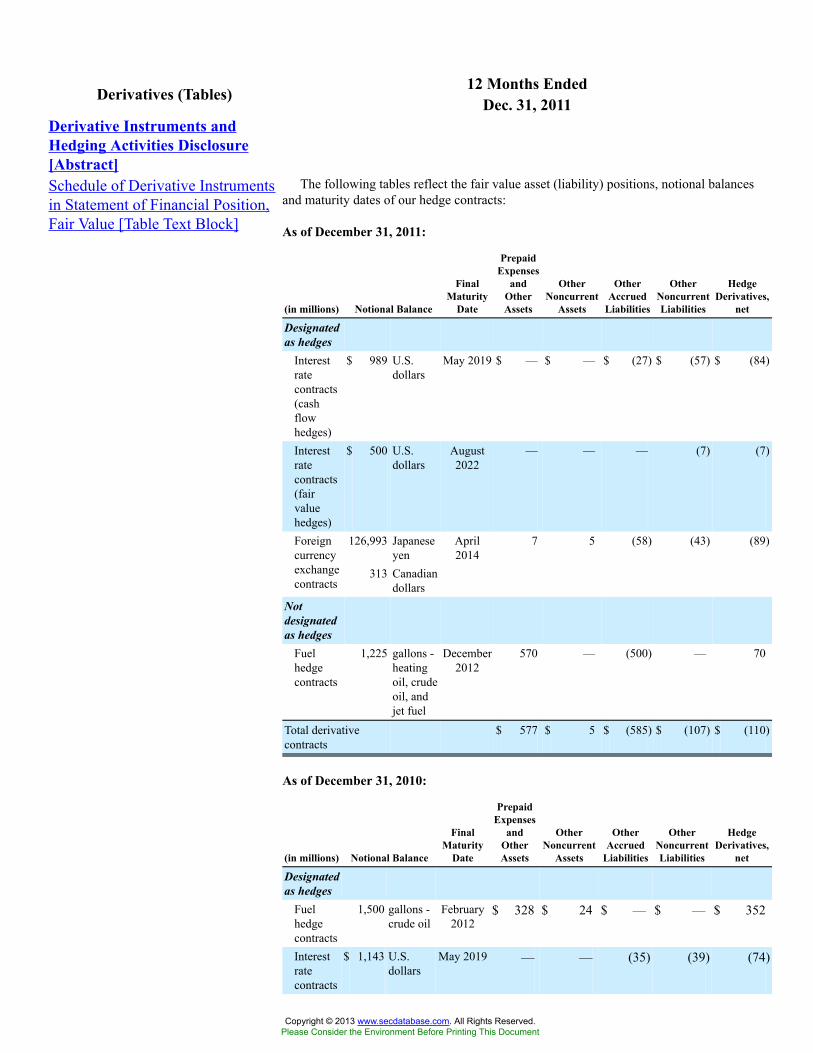
12 Months EndedDerivatives (Tables) Dec. 31, 2011Derivative Instruments andHedging Activities Disclosure[Abstract]Schedule of Derivative Instrumentsin Statement of Financial Position,Fair Value [Table Text Block]
The following tables reflect the fair value asset (liability) positions, notional balancesand maturity dates of our hedge contracts:
As of December 31, 2011:
(in millions) Notional Balance
FinalMaturity
Date
PrepaidExpenses
andOtherAssets
OtherNoncurrent
Assets
OtherAccrued
Liabilities
OtherNoncurrentLiabilities
HedgeDerivatives,
net
Designatedas hedges
Interestratecontracts(cashflowhedges)
$ 989 U.S.dollars
May 2019 $ — $ — $ (27) $ (57) $ (84)
Interestratecontracts(fairvaluehedges)
$ 500 U.S.dollars
August2022
— — — (7) (7)
126,993 Japaneseyen
Foreigncurrencyexchangecontracts
313 Canadiandollars
April2014
7 5 (58) (43) (89)
Notdesignatedas hedges
Fuelhedgecontracts
1,225 gallons -heatingoil, crudeoil, andjet fuel
December2012
570 — (500) — 70
Total derivativecontracts
$ 577 $ 5 $ (585) $ (107) $ (110)
As of December 31, 2010:
(in millions) Notional Balance
FinalMaturity
Date
PrepaidExpenses
andOtherAssets
OtherNoncurrent
Assets
OtherAccrued
Liabilities
OtherNoncurrentLiabilities
HedgeDerivatives,
net
Designatedas hedges
Fuelhedgecontracts
1,500 gallons -crude oil
February2012
$ 328 $ 24 $ — $ — $ 352
Interestratecontracts
$ 1,143 U.S.dollars
May 2019 — — (35) (39) (74)
Copyright © 2013 www.secdatabase.com. All Rights Reserved.Please Consider the Environment Before Printing This Document
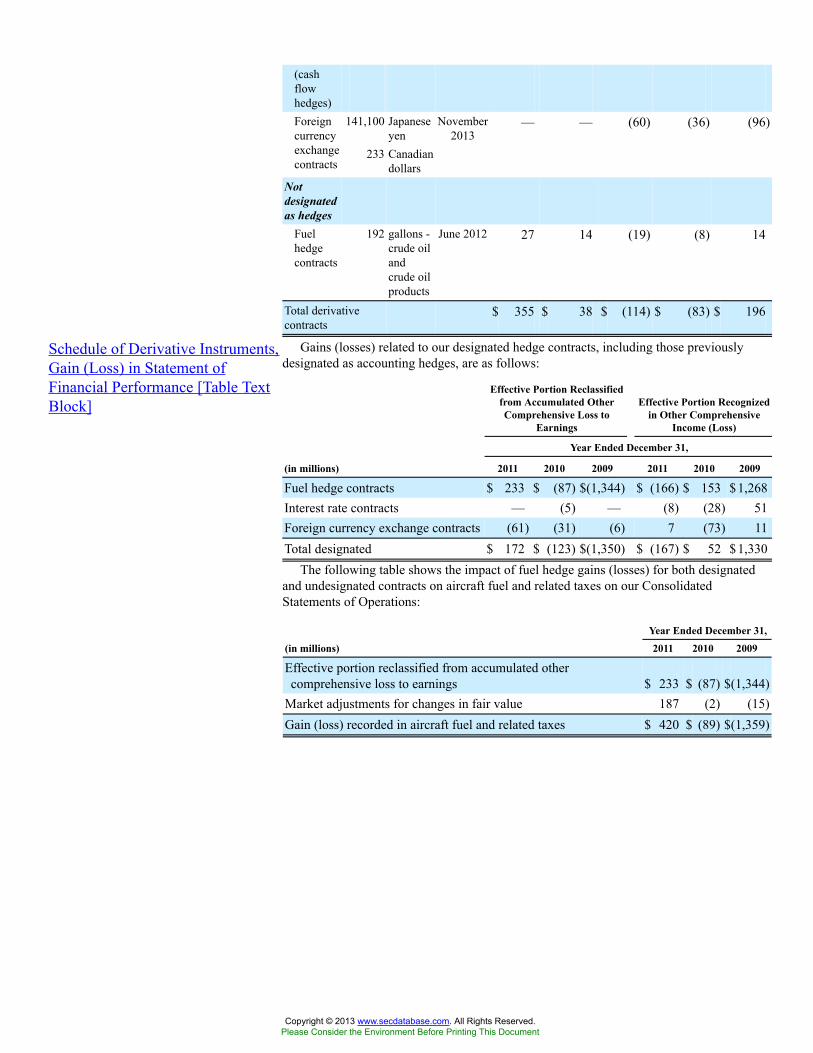
(cashflowhedges)
141,100 Japaneseyen
Foreigncurrencyexchangecontracts
233 Canadiandollars
November2013
— — (60) (36) (96)
Notdesignatedas hedges
Fuelhedgecontracts
192 gallons -crude oilandcrude oilproducts
June 2012 27 14 (19) (8) 14
Total derivativecontracts
$ 355 $ 38 $ (114) $ (83) $ 196
Schedule of Derivative Instruments,Gain (Loss) in Statement ofFinancial Performance [Table TextBlock]
Gains (losses) related to our designated hedge contracts, including those previouslydesignated as accounting hedges, are as follows:
Effective Portion Reclassifiedfrom Accumulated OtherComprehensive Loss to
Earnings
Effective Portion Recognizedin Other Comprehensive
Income (Loss)
Year Ended December 31,
(in millions) 2011 2010 2009 2011 2010 2009
Fuel hedge contracts $ 233 $ (87) $(1,344) $ (166) $ 153 $1,268Interest rate contracts — (5) — (8) (28) 51Foreign currency exchange contracts (61) (31) (6) 7 (73) 11Total designated $ 172 $ (123) $(1,350) $ (167) $ 52 $1,330
The following table shows the impact of fuel hedge gains (losses) for both designatedand undesignated contracts on aircraft fuel and related taxes on our ConsolidatedStatements of Operations:
Year Ended December 31,
(in millions) 2011 2010 2009
Effective portion reclassified from accumulated othercomprehensive loss to earnings $ 233 $ (87) $(1,344)
Market adjustments for changes in fair value 187 (2) (15)Gain (loss) recorded in aircraft fuel and related taxes $ 420 $ (89) $(1,359)
Copyright © 2013 www.secdatabase.com. All Rights Reserved.Please Consider the Environment Before Printing This Document
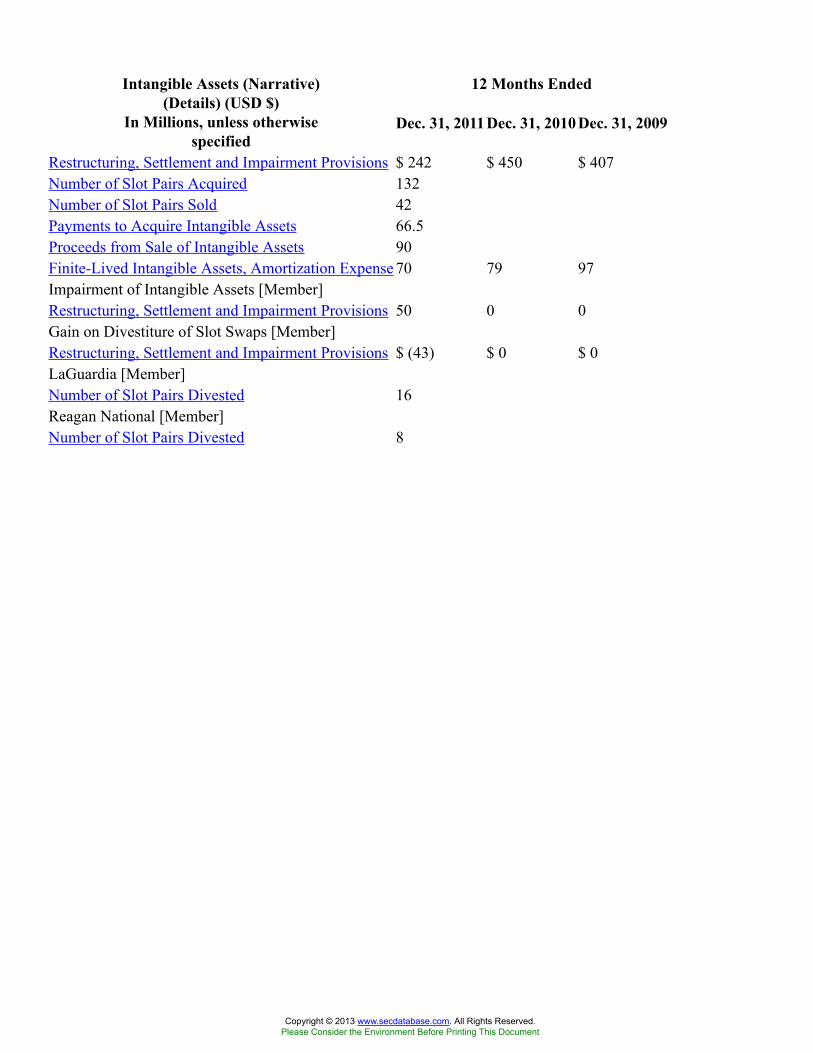
12 Months EndedIntangible Assets (Narrative)(Details) (USD $)
In Millions, unless otherwisespecified
Dec. 31, 2011Dec. 31, 2010 Dec. 31, 2009
Restructuring, Settlement and Impairment Provisions $ 242 $ 450 $ 407Number of Slot Pairs Acquired 132Number of Slot Pairs Sold 42Payments to Acquire Intangible Assets 66.5Proceeds from Sale of Intangible Assets 90Finite-Lived Intangible Assets, Amortization Expense 70 79 97Impairment of Intangible Assets [Member]Restructuring, Settlement and Impairment Provisions 50 0 0Gain on Divestiture of Slot Swaps [Member]Restructuring, Settlement and Impairment Provisions $ (43) $ 0 $ 0LaGuardia [Member]Number of Slot Pairs Divested 16Reagan National [Member]Number of Slot Pairs Divested 8
Copyright © 2013 www.secdatabase.com. All Rights Reserved.Please Consider the Environment Before Printing This Document
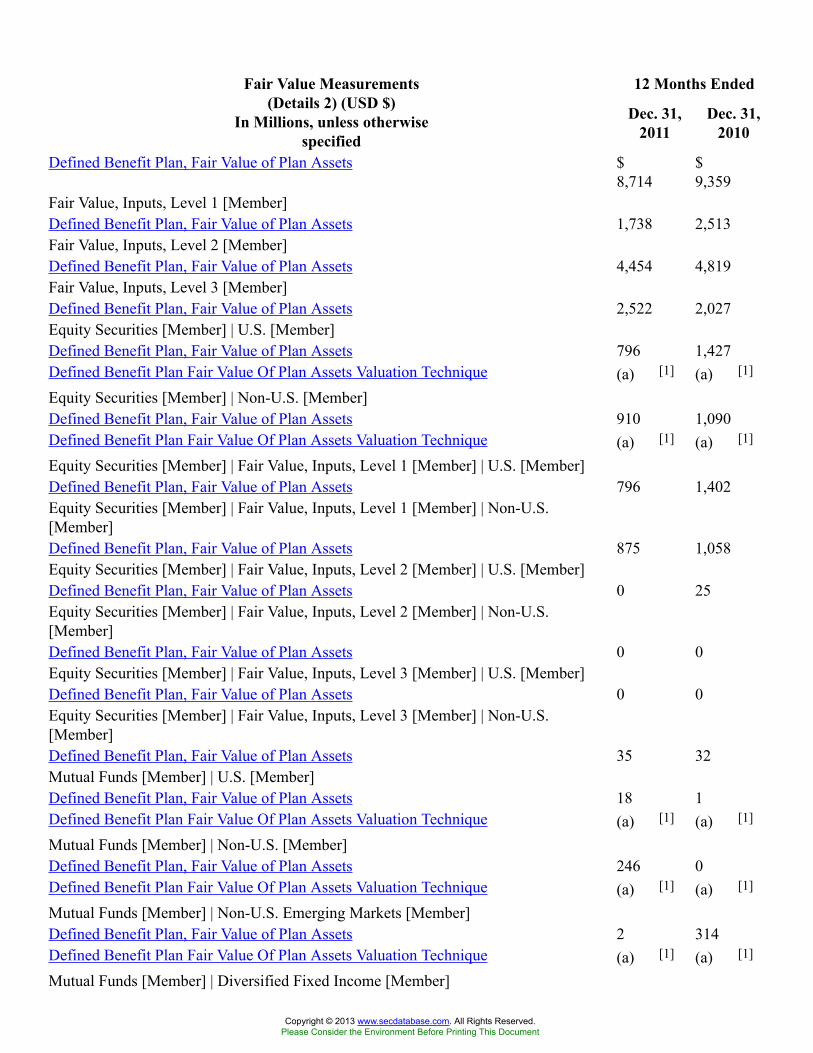
12 Months EndedFair Value Measurements(Details 2) (USD $)
In Millions, unless otherwisespecified
Dec. 31,2011
Dec. 31,2010
Defined Benefit Plan, Fair Value of Plan Assets $8,714
$9,359
Fair Value, Inputs, Level 1 [Member]Defined Benefit Plan, Fair Value of Plan Assets 1,738 2,513Fair Value, Inputs, Level 2 [Member]Defined Benefit Plan, Fair Value of Plan Assets 4,454 4,819Fair Value, Inputs, Level 3 [Member]Defined Benefit Plan, Fair Value of Plan Assets 2,522 2,027Equity Securities [Member] | U.S. [Member]Defined Benefit Plan, Fair Value of Plan Assets 796 1,427Defined Benefit Plan Fair Value Of Plan Assets Valuation Technique (a) [1] (a) [1]
Equity Securities [Member] | Non-U.S. [Member]Defined Benefit Plan, Fair Value of Plan Assets 910 1,090Defined Benefit Plan Fair Value Of Plan Assets Valuation Technique (a) [1] (a) [1]
Equity Securities [Member] | Fair Value, Inputs, Level 1 [Member] | U.S. [Member]Defined Benefit Plan, Fair Value of Plan Assets 796 1,402Equity Securities [Member] | Fair Value, Inputs, Level 1 [Member] | Non-U.S.[Member]Defined Benefit Plan, Fair Value of Plan Assets 875 1,058Equity Securities [Member] | Fair Value, Inputs, Level 2 [Member] | U.S. [Member]Defined Benefit Plan, Fair Value of Plan Assets 0 25Equity Securities [Member] | Fair Value, Inputs, Level 2 [Member] | Non-U.S.[Member]Defined Benefit Plan, Fair Value of Plan Assets 0 0Equity Securities [Member] | Fair Value, Inputs, Level 3 [Member] | U.S. [Member]Defined Benefit Plan, Fair Value of Plan Assets 0 0Equity Securities [Member] | Fair Value, Inputs, Level 3 [Member] | Non-U.S.[Member]Defined Benefit Plan, Fair Value of Plan Assets 35 32Mutual Funds [Member] | U.S. [Member]Defined Benefit Plan, Fair Value of Plan Assets 18 1Defined Benefit Plan Fair Value Of Plan Assets Valuation Technique (a) [1] (a) [1]
Mutual Funds [Member] | Non-U.S. [Member]Defined Benefit Plan, Fair Value of Plan Assets 246 0Defined Benefit Plan Fair Value Of Plan Assets Valuation Technique (a) [1] (a) [1]
Mutual Funds [Member] | Non-U.S. Emerging Markets [Member]Defined Benefit Plan, Fair Value of Plan Assets 2 314Defined Benefit Plan Fair Value Of Plan Assets Valuation Technique (a) [1] (a) [1]
Mutual Funds [Member] | Diversified Fixed Income [Member]
Copyright © 2013 www.secdatabase.com. All Rights Reserved.Please Consider the Environment Before Printing This Document
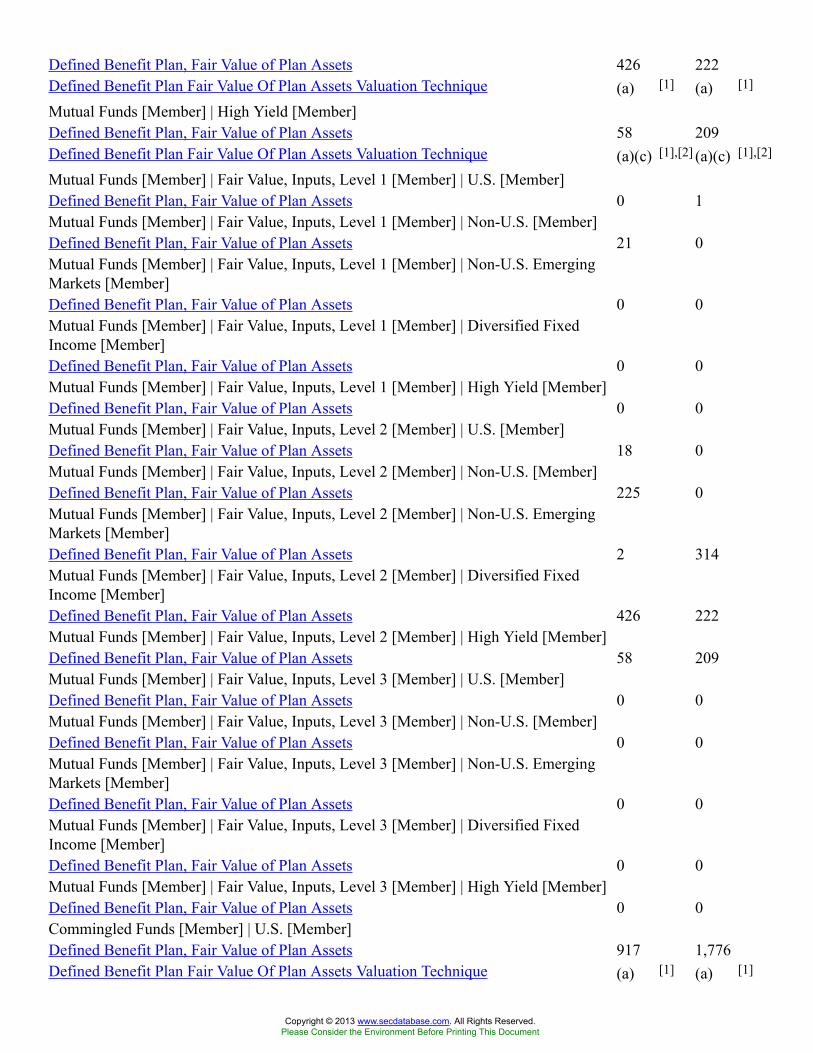
Defined Benefit Plan, Fair Value of Plan Assets 426 222Defined Benefit Plan Fair Value Of Plan Assets Valuation Technique (a) [1] (a) [1]
Mutual Funds [Member] | High Yield [Member]Defined Benefit Plan, Fair Value of Plan Assets 58 209Defined Benefit Plan Fair Value Of Plan Assets Valuation Technique (a)(c) [1],[2] (a)(c) [1],[2]
Mutual Funds [Member] | Fair Value, Inputs, Level 1 [Member] | U.S. [Member]Defined Benefit Plan, Fair Value of Plan Assets 0 1Mutual Funds [Member] | Fair Value, Inputs, Level 1 [Member] | Non-U.S. [Member]Defined Benefit Plan, Fair Value of Plan Assets 21 0Mutual Funds [Member] | Fair Value, Inputs, Level 1 [Member] | Non-U.S. EmergingMarkets [Member]Defined Benefit Plan, Fair Value of Plan Assets 0 0Mutual Funds [Member] | Fair Value, Inputs, Level 1 [Member] | Diversified FixedIncome [Member]Defined Benefit Plan, Fair Value of Plan Assets 0 0Mutual Funds [Member] | Fair Value, Inputs, Level 1 [Member] | High Yield [Member]Defined Benefit Plan, Fair Value of Plan Assets 0 0Mutual Funds [Member] | Fair Value, Inputs, Level 2 [Member] | U.S. [Member]Defined Benefit Plan, Fair Value of Plan Assets 18 0Mutual Funds [Member] | Fair Value, Inputs, Level 2 [Member] | Non-U.S. [Member]Defined Benefit Plan, Fair Value of Plan Assets 225 0Mutual Funds [Member] | Fair Value, Inputs, Level 2 [Member] | Non-U.S. EmergingMarkets [Member]Defined Benefit Plan, Fair Value of Plan Assets 2 314Mutual Funds [Member] | Fair Value, Inputs, Level 2 [Member] | Diversified FixedIncome [Member]Defined Benefit Plan, Fair Value of Plan Assets 426 222Mutual Funds [Member] | Fair Value, Inputs, Level 2 [Member] | High Yield [Member]Defined Benefit Plan, Fair Value of Plan Assets 58 209Mutual Funds [Member] | Fair Value, Inputs, Level 3 [Member] | U.S. [Member]Defined Benefit Plan, Fair Value of Plan Assets 0 0Mutual Funds [Member] | Fair Value, Inputs, Level 3 [Member] | Non-U.S. [Member]Defined Benefit Plan, Fair Value of Plan Assets 0 0Mutual Funds [Member] | Fair Value, Inputs, Level 3 [Member] | Non-U.S. EmergingMarkets [Member]Defined Benefit Plan, Fair Value of Plan Assets 0 0Mutual Funds [Member] | Fair Value, Inputs, Level 3 [Member] | Diversified FixedIncome [Member]Defined Benefit Plan, Fair Value of Plan Assets 0 0Mutual Funds [Member] | Fair Value, Inputs, Level 3 [Member] | High Yield [Member]Defined Benefit Plan, Fair Value of Plan Assets 0 0Commingled Funds [Member] | U.S. [Member]Defined Benefit Plan, Fair Value of Plan Assets 917 1,776Defined Benefit Plan Fair Value Of Plan Assets Valuation Technique (a) [1] (a) [1]
Copyright © 2013 www.secdatabase.com. All Rights Reserved.Please Consider the Environment Before Printing This Document
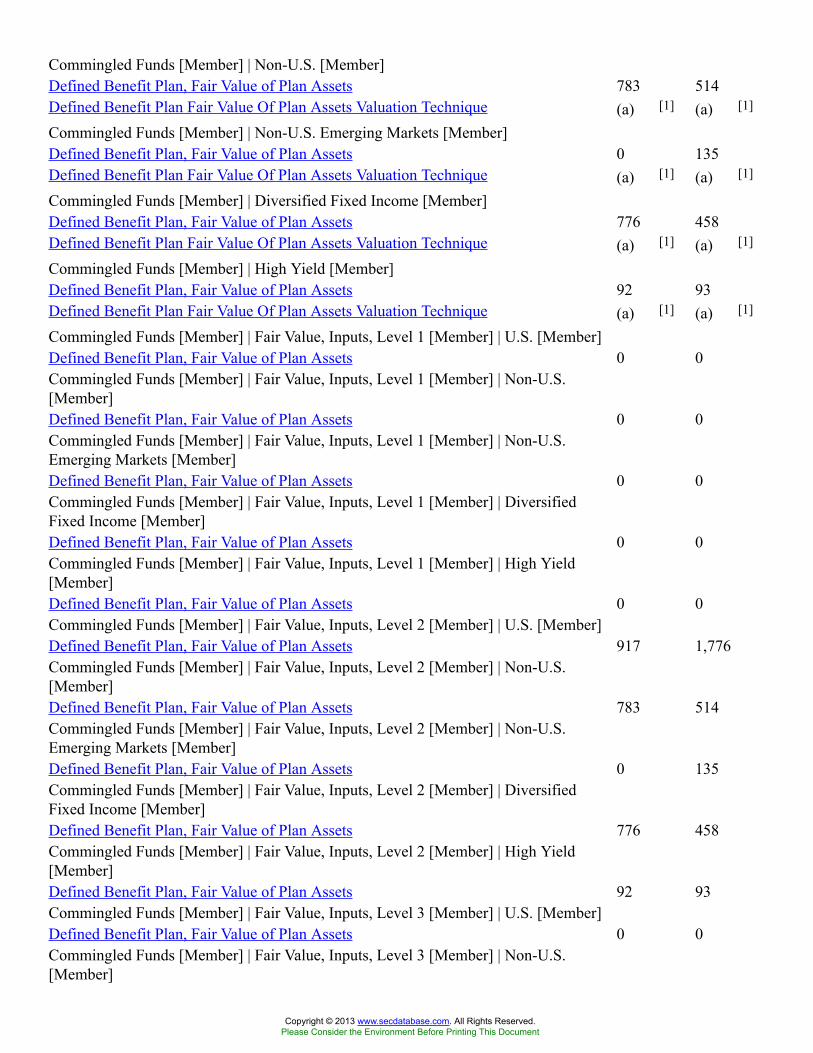
Commingled Funds [Member] | Non-U.S. [Member]Defined Benefit Plan, Fair Value of Plan Assets 783 514Defined Benefit Plan Fair Value Of Plan Assets Valuation Technique (a) [1] (a) [1]
Commingled Funds [Member] | Non-U.S. Emerging Markets [Member]Defined Benefit Plan, Fair Value of Plan Assets 0 135Defined Benefit Plan Fair Value Of Plan Assets Valuation Technique (a) [1] (a) [1]
Commingled Funds [Member] | Diversified Fixed Income [Member]Defined Benefit Plan, Fair Value of Plan Assets 776 458Defined Benefit Plan Fair Value Of Plan Assets Valuation Technique (a) [1] (a) [1]
Commingled Funds [Member] | High Yield [Member]Defined Benefit Plan, Fair Value of Plan Assets 92 93Defined Benefit Plan Fair Value Of Plan Assets Valuation Technique (a) [1] (a) [1]
Commingled Funds [Member] | Fair Value, Inputs, Level 1 [Member] | U.S. [Member]Defined Benefit Plan, Fair Value of Plan Assets 0 0Commingled Funds [Member] | Fair Value, Inputs, Level 1 [Member] | Non-U.S.[Member]Defined Benefit Plan, Fair Value of Plan Assets 0 0Commingled Funds [Member] | Fair Value, Inputs, Level 1 [Member] | Non-U.S.Emerging Markets [Member]Defined Benefit Plan, Fair Value of Plan Assets 0 0Commingled Funds [Member] | Fair Value, Inputs, Level 1 [Member] | DiversifiedFixed Income [Member]Defined Benefit Plan, Fair Value of Plan Assets 0 0Commingled Funds [Member] | Fair Value, Inputs, Level 1 [Member] | High Yield[Member]Defined Benefit Plan, Fair Value of Plan Assets 0 0Commingled Funds [Member] | Fair Value, Inputs, Level 2 [Member] | U.S. [Member]Defined Benefit Plan, Fair Value of Plan Assets 917 1,776Commingled Funds [Member] | Fair Value, Inputs, Level 2 [Member] | Non-U.S.[Member]Defined Benefit Plan, Fair Value of Plan Assets 783 514Commingled Funds [Member] | Fair Value, Inputs, Level 2 [Member] | Non-U.S.Emerging Markets [Member]Defined Benefit Plan, Fair Value of Plan Assets 0 135Commingled Funds [Member] | Fair Value, Inputs, Level 2 [Member] | DiversifiedFixed Income [Member]Defined Benefit Plan, Fair Value of Plan Assets 776 458Commingled Funds [Member] | Fair Value, Inputs, Level 2 [Member] | High Yield[Member]Defined Benefit Plan, Fair Value of Plan Assets 92 93Commingled Funds [Member] | Fair Value, Inputs, Level 3 [Member] | U.S. [Member]Defined Benefit Plan, Fair Value of Plan Assets 0 0Commingled Funds [Member] | Fair Value, Inputs, Level 3 [Member] | Non-U.S.[Member]
Copyright © 2013 www.secdatabase.com. All Rights Reserved.Please Consider the Environment Before Printing This Document
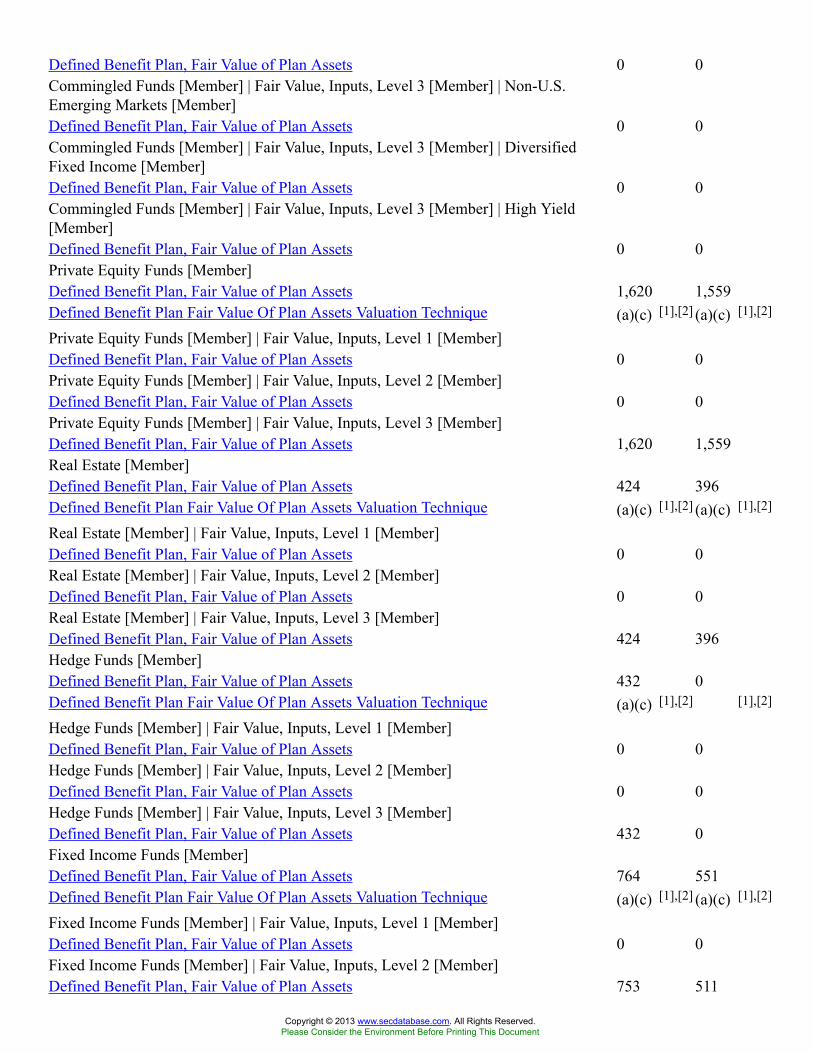
Defined Benefit Plan, Fair Value of Plan Assets 0 0Commingled Funds [Member] | Fair Value, Inputs, Level 3 [Member] | Non-U.S.Emerging Markets [Member]Defined Benefit Plan, Fair Value of Plan Assets 0 0Commingled Funds [Member] | Fair Value, Inputs, Level 3 [Member] | DiversifiedFixed Income [Member]Defined Benefit Plan, Fair Value of Plan Assets 0 0Commingled Funds [Member] | Fair Value, Inputs, Level 3 [Member] | High Yield[Member]Defined Benefit Plan, Fair Value of Plan Assets 0 0Private Equity Funds [Member]Defined Benefit Plan, Fair Value of Plan Assets 1,620 1,559Defined Benefit Plan Fair Value Of Plan Assets Valuation Technique (a)(c) [1],[2] (a)(c) [1],[2]
Private Equity Funds [Member] | Fair Value, Inputs, Level 1 [Member]Defined Benefit Plan, Fair Value of Plan Assets 0 0Private Equity Funds [Member] | Fair Value, Inputs, Level 2 [Member]Defined Benefit Plan, Fair Value of Plan Assets 0 0Private Equity Funds [Member] | Fair Value, Inputs, Level 3 [Member]Defined Benefit Plan, Fair Value of Plan Assets 1,620 1,559Real Estate [Member]Defined Benefit Plan, Fair Value of Plan Assets 424 396Defined Benefit Plan Fair Value Of Plan Assets Valuation Technique (a)(c) [1],[2] (a)(c) [1],[2]
Real Estate [Member] | Fair Value, Inputs, Level 1 [Member]Defined Benefit Plan, Fair Value of Plan Assets 0 0Real Estate [Member] | Fair Value, Inputs, Level 2 [Member]Defined Benefit Plan, Fair Value of Plan Assets 0 0Real Estate [Member] | Fair Value, Inputs, Level 3 [Member]Defined Benefit Plan, Fair Value of Plan Assets 424 396Hedge Funds [Member]Defined Benefit Plan, Fair Value of Plan Assets 432 0Defined Benefit Plan Fair Value Of Plan Assets Valuation Technique (a)(c) [1],[2] [1],[2]
Hedge Funds [Member] | Fair Value, Inputs, Level 1 [Member]Defined Benefit Plan, Fair Value of Plan Assets 0 0Hedge Funds [Member] | Fair Value, Inputs, Level 2 [Member]Defined Benefit Plan, Fair Value of Plan Assets 0 0Hedge Funds [Member] | Fair Value, Inputs, Level 3 [Member]Defined Benefit Plan, Fair Value of Plan Assets 432 0Fixed Income Funds [Member]Defined Benefit Plan, Fair Value of Plan Assets 764 551Defined Benefit Plan Fair Value Of Plan Assets Valuation Technique (a)(c) [1],[2] (a)(c) [1],[2]
Fixed Income Funds [Member] | Fair Value, Inputs, Level 1 [Member]Defined Benefit Plan, Fair Value of Plan Assets 0 0Fixed Income Funds [Member] | Fair Value, Inputs, Level 2 [Member]Defined Benefit Plan, Fair Value of Plan Assets 753 511
Copyright © 2013 www.secdatabase.com. All Rights Reserved.Please Consider the Environment Before Printing This Document
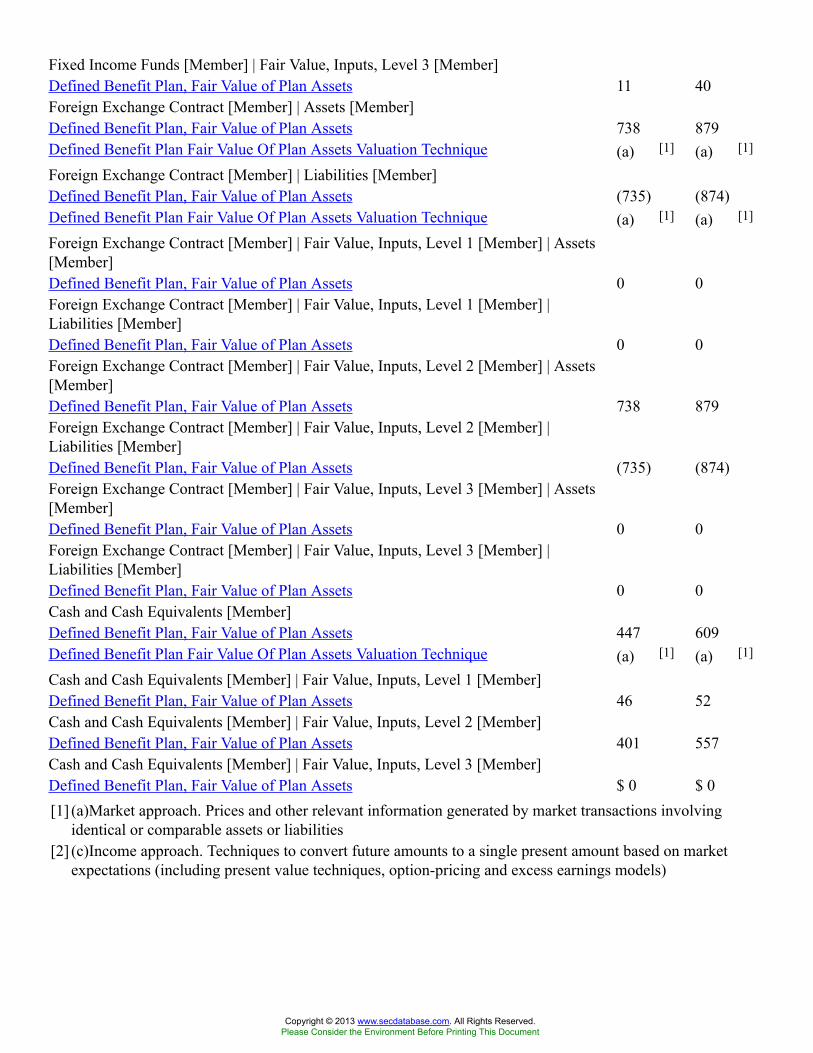
Fixed Income Funds [Member] | Fair Value, Inputs, Level 3 [Member]Defined Benefit Plan, Fair Value of Plan Assets 11 40Foreign Exchange Contract [Member] | Assets [Member]Defined Benefit Plan, Fair Value of Plan Assets 738 879Defined Benefit Plan Fair Value Of Plan Assets Valuation Technique (a) [1] (a) [1]
Foreign Exchange Contract [Member] | Liabilities [Member]Defined Benefit Plan, Fair Value of Plan Assets (735) (874)Defined Benefit Plan Fair Value Of Plan Assets Valuation Technique (a) [1] (a) [1]
Foreign Exchange Contract [Member] | Fair Value, Inputs, Level 1 [Member] | Assets[Member]Defined Benefit Plan, Fair Value of Plan Assets 0 0Foreign Exchange Contract [Member] | Fair Value, Inputs, Level 1 [Member] |Liabilities [Member]Defined Benefit Plan, Fair Value of Plan Assets 0 0Foreign Exchange Contract [Member] | Fair Value, Inputs, Level 2 [Member] | Assets[Member]Defined Benefit Plan, Fair Value of Plan Assets 738 879Foreign Exchange Contract [Member] | Fair Value, Inputs, Level 2 [Member] |Liabilities [Member]Defined Benefit Plan, Fair Value of Plan Assets (735) (874)Foreign Exchange Contract [Member] | Fair Value, Inputs, Level 3 [Member] | Assets[Member]Defined Benefit Plan, Fair Value of Plan Assets 0 0Foreign Exchange Contract [Member] | Fair Value, Inputs, Level 3 [Member] |Liabilities [Member]Defined Benefit Plan, Fair Value of Plan Assets 0 0Cash and Cash Equivalents [Member]Defined Benefit Plan, Fair Value of Plan Assets 447 609Defined Benefit Plan Fair Value Of Plan Assets Valuation Technique (a) [1] (a) [1]
Cash and Cash Equivalents [Member] | Fair Value, Inputs, Level 1 [Member]Defined Benefit Plan, Fair Value of Plan Assets 46 52Cash and Cash Equivalents [Member] | Fair Value, Inputs, Level 2 [Member]Defined Benefit Plan, Fair Value of Plan Assets 401 557Cash and Cash Equivalents [Member] | Fair Value, Inputs, Level 3 [Member]Defined Benefit Plan, Fair Value of Plan Assets $ 0 $ 0[1] (a)Market approach. Prices and other relevant information generated by market transactions involving
identical or comparable assets or liabilities[2] (c)Income approach. Techniques to convert future amounts to a single present amount based on market
expectations (including present value techniques, option-pricing and excess earnings models)
Copyright © 2013 www.secdatabase.com. All Rights Reserved.Please Consider the Environment Before Printing This Document
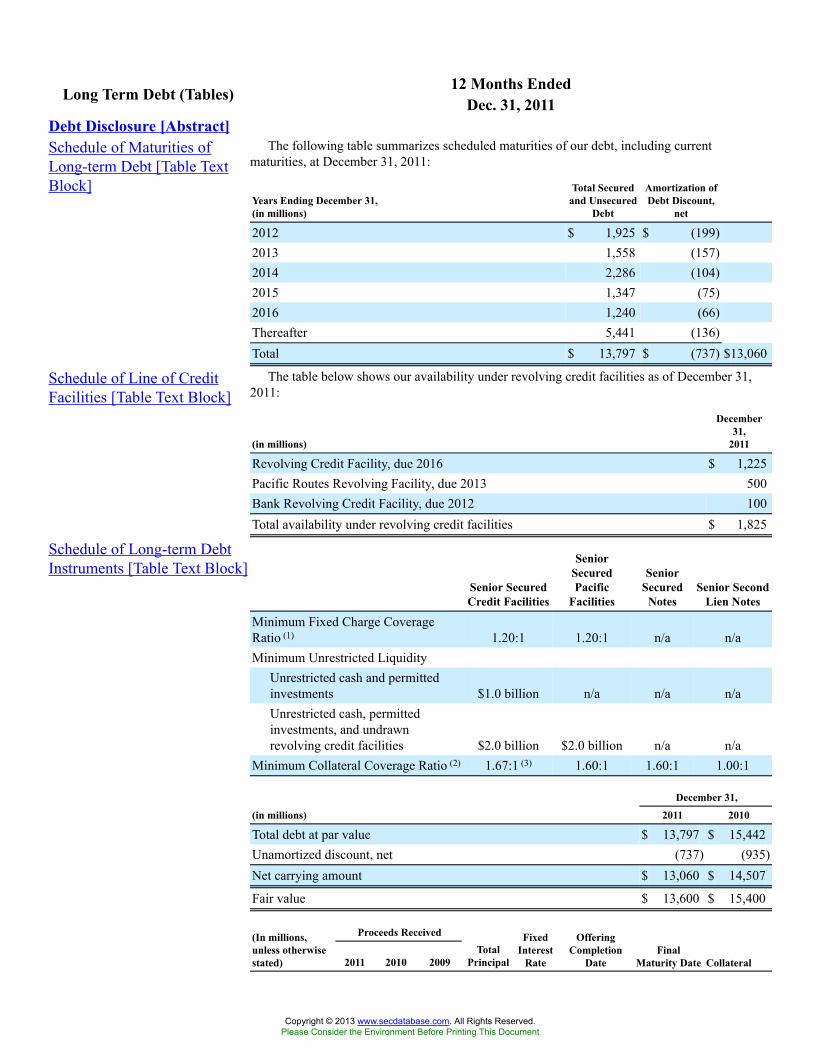
12 Months EndedLong Term Debt (Tables) Dec. 31, 2011Debt Disclosure [Abstract]Schedule of Maturities ofLong-term Debt [Table TextBlock]
The following table summarizes scheduled maturities of our debt, including currentmaturities, at December 31, 2011:
Years Ending December 31,(in millions)
Total Securedand Unsecured
Debt
Amortization ofDebt Discount,
net
2012 $ 1,925 $ (199)2013 1,558 (157)2014 2,286 (104)2015 1,347 (75)2016 1,240 (66)Thereafter 5,441 (136)Total $ 13,797 $ (737) $13,060
Schedule of Line of CreditFacilities [Table Text Block]
The table below shows our availability under revolving credit facilities as of December 31,2011:
(in millions)
December31,
2011
Revolving Credit Facility, due 2016 $ 1,225Pacific Routes Revolving Facility, due 2013 500Bank Revolving Credit Facility, due 2012 100Total availability under revolving credit facilities $ 1,825
Schedule of Long-term DebtInstruments [Table Text Block]
Senior SecuredCredit Facilities
SeniorSecuredPacific
Facilities
SeniorSecured
NotesSenior Second
Lien Notes
Minimum Fixed Charge CoverageRatio (1) 1.20:1 1.20:1 n/a n/aMinimum Unrestricted Liquidity
Unrestricted cash and permittedinvestments $1.0 billion n/a n/a n/aUnrestricted cash, permittedinvestments, and undrawnrevolving credit facilities $2.0 billion $2.0 billion n/a n/a
Minimum Collateral Coverage Ratio (2) 1.67:1 (3) 1.60:1 1.60:1 1.00:1
December 31,
(in millions) 2011 2010
Total debt at par value $ 13,797 $ 15,442Unamortized discount, net (737) (935)Net carrying amount $ 13,060 $ 14,507
Fair value $ 13,600 $ 15,400
Proceeds Received(In millions,unless otherwisestated) 2011 2010 2009
TotalPrincipal
FixedInterest
Rate
OfferingCompletion
DateFinal
Maturity Date Collateral
Copyright © 2013 www.secdatabase.com. All Rights Reserved.Please Consider the Environment Before Printing This Document
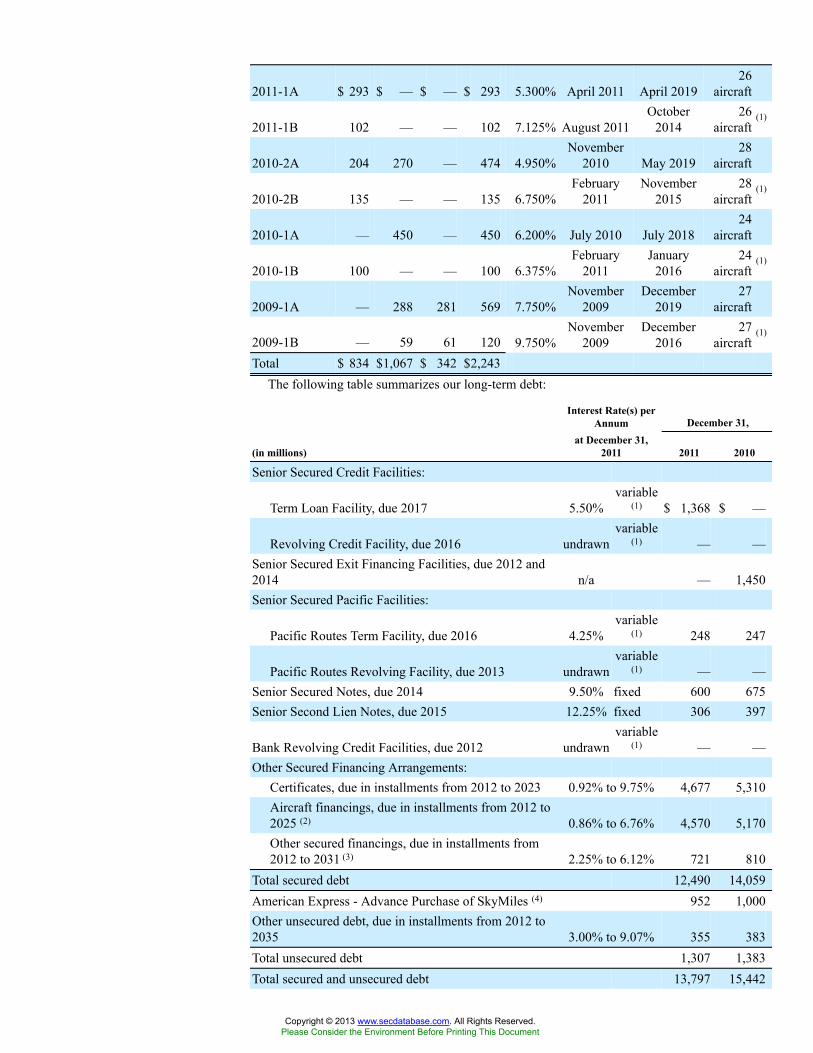
2011-1A $ 293 $ — $ — $ 293 5.300% April 2011 April 201926
aircraft
2011-1B 102 — — 102 7.125% August 2011October
201426
aircraft(1)
2010-2A 204 270 — 474 4.950%November
2010 May 201928
aircraft
2010-2B 135 — — 135 6.750%February
2011November
201528
aircraft(1)
2010-1A — 450 — 450 6.200% July 2010 July 201824
aircraft
2010-1B 100 — — 100 6.375%February
2011January
201624
aircraft(1)
2009-1A — 288 281 569 7.750%November
2009December
201927
aircraft
2009-1B — 59 61 120 9.750%November
2009December
201627
aircraft(1)
Total $ 834 $1,067 $ 342 $2,243The following table summarizes our long-term debt:
Interest Rate(s) perAnnum December 31,
(in millions)at December 31,
2011 2011 2010
Senior Secured Credit Facilities:
Term Loan Facility, due 2017 5.50%variable
(1) $ 1,368 $ —
Revolving Credit Facility, due 2016 undrawnvariable
(1) — —Senior Secured Exit Financing Facilities, due 2012 and2014 n/a — 1,450Senior Secured Pacific Facilities:
Pacific Routes Term Facility, due 2016 4.25%variable
(1) 248 247
Pacific Routes Revolving Facility, due 2013 undrawnvariable
(1) — —Senior Secured Notes, due 2014 9.50% fixed 600 675Senior Second Lien Notes, due 2015 12.25% fixed 306 397
Bank Revolving Credit Facilities, due 2012 undrawnvariable
(1) — —Other Secured Financing Arrangements:
Certificates, due in installments from 2012 to 2023 0.92% to 9.75% 4,677 5,310Aircraft financings, due in installments from 2012 to2025 (2) 0.86% to 6.76% 4,570 5,170Other secured financings, due in installments from2012 to 2031 (3) 2.25% to 6.12% 721 810
Total secured debt 12,490 14,059American Express - Advance Purchase of SkyMiles (4) 952 1,000Other unsecured debt, due in installments from 2012 to2035 3.00% to 9.07% 355 383Total unsecured debt 1,307 1,383Total secured and unsecured debt 13,797 15,442
Copyright © 2013 www.secdatabase.com. All Rights Reserved.Please Consider the Environment Before Printing This Document
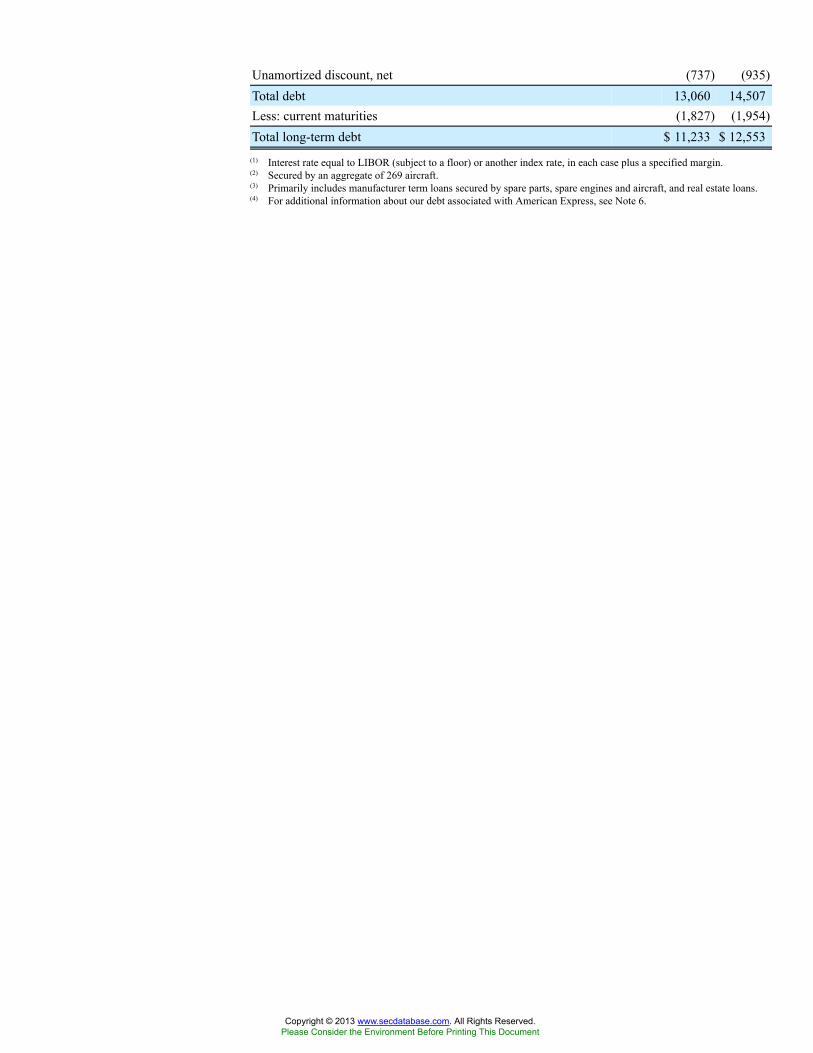
Unamortized discount, net (737) (935)Total debt 13,060 14,507Less: current maturities (1,827) (1,954)Total long-term debt $ 11,233 $ 12,553
(1) Interest rate equal to LIBOR (subject to a floor) or another index rate, in each case plus a specified margin.(2) Secured by an aggregate of 269 aircraft.(3) Primarily includes manufacturer term loans secured by spare parts, spare engines and aircraft, and real estate loans.(4) For additional information about our debt associated with American Express, see Note 6.
Copyright © 2013 www.secdatabase.com. All Rights Reserved.Please Consider the Environment Before Printing This Document
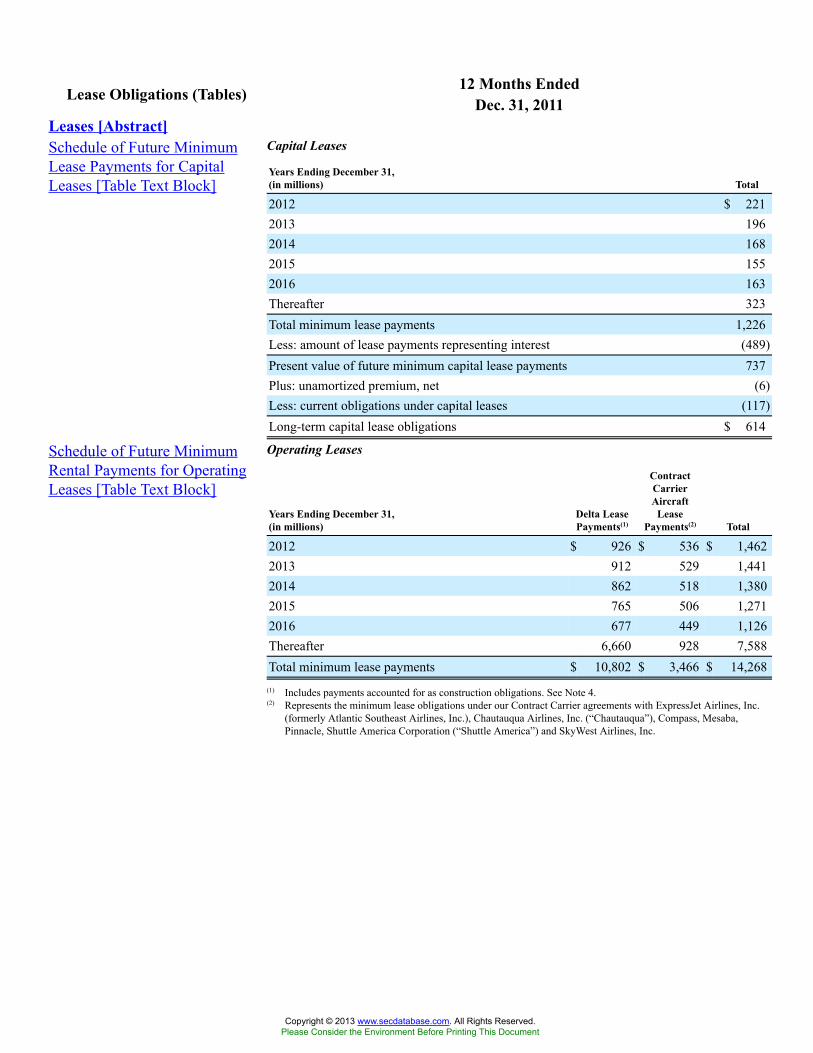
12 Months EndedLease Obligations (Tables) Dec. 31, 2011Leases [Abstract]Schedule of Future MinimumLease Payments for CapitalLeases [Table Text Block]
Capital Leases
Years Ending December 31,(in millions) Total
2012 $ 2212013 1962014 1682015 1552016 163Thereafter 323Total minimum lease payments 1,226Less: amount of lease payments representing interest (489)Present value of future minimum capital lease payments 737Plus: unamortized premium, net (6)Less: current obligations under capital leases (117)Long-term capital lease obligations $ 614
Schedule of Future MinimumRental Payments for OperatingLeases [Table Text Block]
Operating Leases
Years Ending December 31,(in millions)
Delta LeasePayments(1)
ContractCarrierAircraft
LeasePayments(2) Total
2012 $ 926 $ 536 $ 1,4622013 912 529 1,4412014 862 518 1,3802015 765 506 1,2712016 677 449 1,126Thereafter 6,660 928 7,588Total minimum lease payments $ 10,802 $ 3,466 $ 14,268
(1) Includes payments accounted for as construction obligations. See Note 4.(2) Represents the minimum lease obligations under our Contract Carrier agreements with ExpressJet Airlines, Inc.
(formerly Atlantic Southeast Airlines, Inc.), Chautauqua Airlines, Inc. (“Chautauqua”), Compass, Mesaba,Pinnacle, Shuttle America Corporation (“Shuttle America”) and SkyWest Airlines, Inc.
Copyright © 2013 www.secdatabase.com. All Rights Reserved.Please Consider the Environment Before Printing This Document
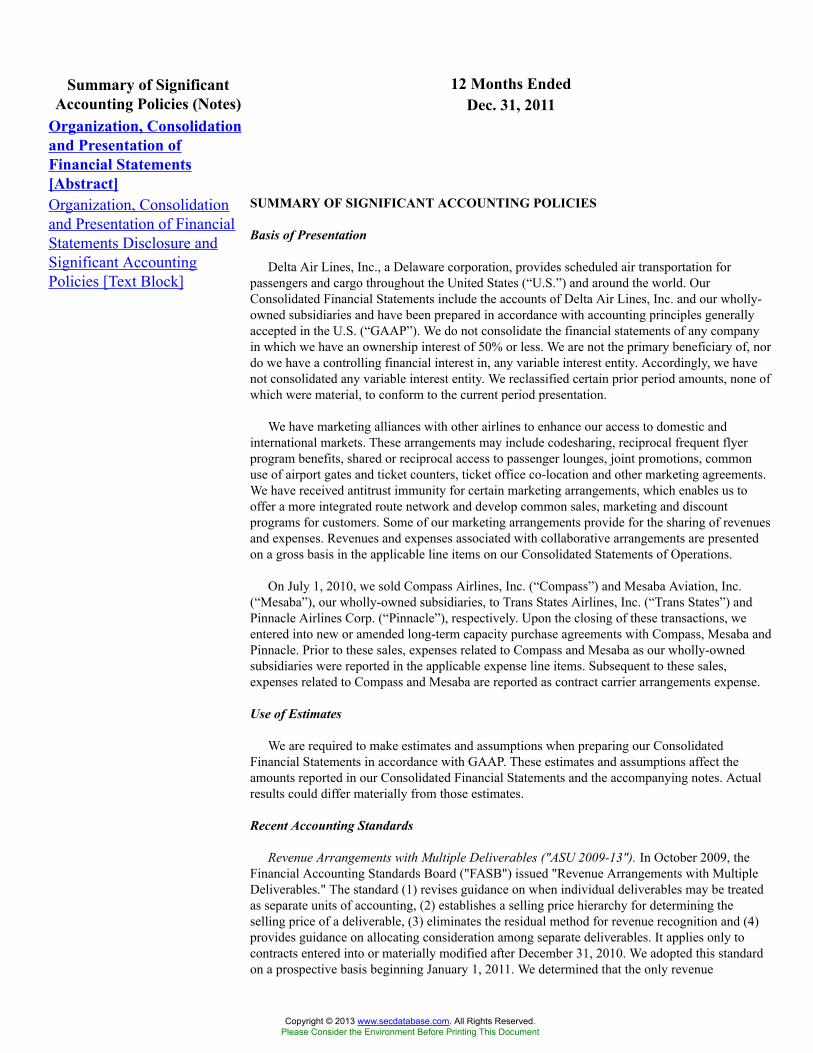
12 Months EndedSummary of SignificantAccounting Policies (Notes) Dec. 31, 2011
Organization, Consolidationand Presentation ofFinancial Statements[Abstract]Organization, Consolidationand Presentation of FinancialStatements Disclosure andSignificant AccountingPolicies [Text Block]
SUMMARY OF SIGNIFICANT ACCOUNTING POLICIES
Basis of Presentation
Delta Air Lines, Inc., a Delaware corporation, provides scheduled air transportation forpassengers and cargo throughout the United States (“U.S.”) and around the world. OurConsolidated Financial Statements include the accounts of Delta Air Lines, Inc. and our wholly-owned subsidiaries and have been prepared in accordance with accounting principles generallyaccepted in the U.S. (“GAAP”). We do not consolidate the financial statements of any companyin which we have an ownership interest of 50% or less. We are not the primary beneficiary of, nordo we have a controlling financial interest in, any variable interest entity. Accordingly, we havenot consolidated any variable interest entity. We reclassified certain prior period amounts, none ofwhich were material, to conform to the current period presentation.
We have marketing alliances with other airlines to enhance our access to domestic andinternational markets. These arrangements may include codesharing, reciprocal frequent flyerprogram benefits, shared or reciprocal access to passenger lounges, joint promotions, commonuse of airport gates and ticket counters, ticket office co-location and other marketing agreements.We have received antitrust immunity for certain marketing arrangements, which enables us tooffer a more integrated route network and develop common sales, marketing and discountprograms for customers. Some of our marketing arrangements provide for the sharing of revenuesand expenses. Revenues and expenses associated with collaborative arrangements are presentedon a gross basis in the applicable line items on our Consolidated Statements of Operations.
On July 1, 2010, we sold Compass Airlines, Inc. (“Compass”) and Mesaba Aviation, Inc.(“Mesaba”), our wholly-owned subsidiaries, to Trans States Airlines, Inc. (“Trans States”) andPinnacle Airlines Corp. (“Pinnacle”), respectively. Upon the closing of these transactions, weentered into new or amended long-term capacity purchase agreements with Compass, Mesaba andPinnacle. Prior to these sales, expenses related to Compass and Mesaba as our wholly-ownedsubsidiaries were reported in the applicable expense line items. Subsequent to these sales,expenses related to Compass and Mesaba are reported as contract carrier arrangements expense.
Use of Estimates
We are required to make estimates and assumptions when preparing our ConsolidatedFinancial Statements in accordance with GAAP. These estimates and assumptions affect theamounts reported in our Consolidated Financial Statements and the accompanying notes. Actualresults could differ materially from those estimates.
Recent Accounting Standards
Revenue Arrangements with Multiple Deliverables ("ASU 2009-13"). In October 2009, theFinancial Accounting Standards Board ("FASB") issued "Revenue Arrangements with MultipleDeliverables." The standard (1) revises guidance on when individual deliverables may be treatedas separate units of accounting, (2) establishes a selling price hierarchy for determining theselling price of a deliverable, (3) eliminates the residual method for revenue recognition and (4)provides guidance on allocating consideration among separate deliverables. It applies only tocontracts entered into or materially modified after December 31, 2010. We adopted this standardon a prospective basis beginning January 1, 2011. We determined that the only revenue
Copyright © 2013 www.secdatabase.com. All Rights Reserved.Please Consider the Environment Before Printing This Document
arrangements impacted by the adoption of this standard are those associated with our frequentflyer program (the "SkyMiles Program"). See "Frequent Flyer Program" below.
Fair Value Measurement and Disclosure Requirements. In May 2011, the FASB issued"Amendments to Achieve Common Fair Value Measurement and Disclosure Requirements inU.S. GAAP and IFRSs." The standard revises guidance for fair value measurement and expandsthe disclosure requirements. It is effective prospectively for fiscal years beginning afterDecember 15, 2011. We are currently evaluating the impact the adoption of this standard willhave on our Consolidated Financial Statements.
Cash and Cash Equivalents and Short-Term Investments
Short-term, highly liquid investments with maturities of three months or less when purchasedare classified as cash and cash equivalents. Investments with maturities of greater than threemonths, but not in excess of one year, when purchased are classified as short-term investments.
Accounts Receivable
Accounts receivable primarily consist of amounts due from credit card companies from thesale of passenger airline tickets, customers of our aircraft maintenance and cargo transportationservices and other companies for the purchase of mileage credits under our SkyMiles Program.We provide an allowance for uncollectible accounts equal to the estimated losses expected to beincurred based on historical chargebacks, write-offs, bankruptcies and other specific analyses.Bad debt expense was not material in any period presented.
Derivatives
Our results of operations are impacted by changes in aircraft fuel prices, interest rates andforeign currency exchange rates. In an effort to manage our exposure to these risks, we enter intoderivative contracts and may adjust our derivative portfolio as market conditions change. Werecognize derivative contracts at fair value on our Consolidated Balance Sheets.
Not Designated as Accounting Hedges. Effective June 2011, we stopped designating new fuelderivative contracts as accounting hedges and discontinued hedge accounting for our thenexisting fuel derivative contracts that previously had been designated as accounting hedges. As aresult, we record market adjustments for changes in fair value to earnings in aircraft fuel andrelated taxes. Prior to this change in accounting designation, gains or losses on these contractswere deferred in accumulated other comprehensive loss until contract settlement.
Designated as Cash Flow Hedges. For derivative contracts designated as cash flow hedges,the effective portion of the gain or loss on the derivative is reported as a component ofaccumulated other comprehensive loss and reclassified into earnings in the same period in whichthe hedged transaction affects earnings. The effective portion of the derivative represents thechange in fair value of the hedge that offsets the change in fair value of the hedged item. To theextent the change in the fair value of the hedge does not perfectly offset the change in the fairvalue of the hedged item, the ineffective portion of the hedge is immediately recognized in other(expense) income.
Designated as Fair Value Hedges. For derivative contracts designated as fair value hedges(interest rate contracts), the gain or loss on the derivative and the offsetting loss or gain on thehedge item attributable to the hedged risk are recognized in current earnings. We include the gainor loss on the hedged item in the same account as the offsetting loss or gain on the relatedderivative contract, resulting in no impact to our Consolidated Statements of Operations.
The following table summarizes the risk each type of derivative contract is hedging and theclassification of related gains and losses on our Consolidated Statements of Operations:
Derivative Type Hedged RiskClassification of Gains and
Losses
Copyright © 2013 www.secdatabase.com. All Rights Reserved.Please Consider the Environment Before Printing This Document
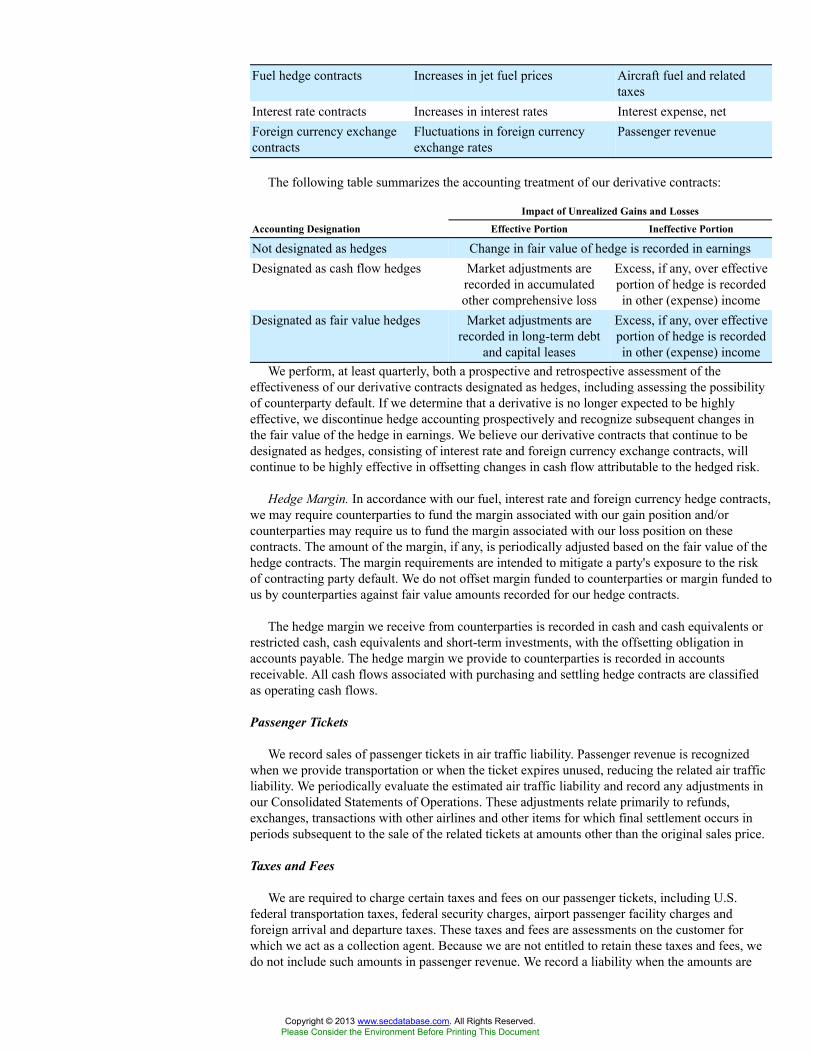
Fuel hedge contracts Increases in jet fuel prices Aircraft fuel and relatedtaxes
Interest rate contracts Increases in interest rates Interest expense, netForeign currency exchangecontracts
Fluctuations in foreign currencyexchange rates
Passenger revenue
The following table summarizes the accounting treatment of our derivative contracts:
Impact of Unrealized Gains and Losses
Accounting Designation Effective Portion Ineffective Portion
Not designated as hedges Change in fair value of hedge is recorded in earningsDesignated as cash flow hedges Market adjustments are
recorded in accumulatedother comprehensive loss
Excess, if any, over effectiveportion of hedge is recordedin other (expense) income
Designated as fair value hedges Market adjustments arerecorded in long-term debt
and capital leases
Excess, if any, over effectiveportion of hedge is recordedin other (expense) income
We perform, at least quarterly, both a prospective and retrospective assessment of theeffectiveness of our derivative contracts designated as hedges, including assessing the possibilityof counterparty default. If we determine that a derivative is no longer expected to be highlyeffective, we discontinue hedge accounting prospectively and recognize subsequent changes inthe fair value of the hedge in earnings. We believe our derivative contracts that continue to bedesignated as hedges, consisting of interest rate and foreign currency exchange contracts, willcontinue to be highly effective in offsetting changes in cash flow attributable to the hedged risk.
Hedge Margin. In accordance with our fuel, interest rate and foreign currency hedge contracts,we may require counterparties to fund the margin associated with our gain position and/orcounterparties may require us to fund the margin associated with our loss position on thesecontracts. The amount of the margin, if any, is periodically adjusted based on the fair value of thehedge contracts. The margin requirements are intended to mitigate a party's exposure to the riskof contracting party default. We do not offset margin funded to counterparties or margin funded tous by counterparties against fair value amounts recorded for our hedge contracts.
The hedge margin we receive from counterparties is recorded in cash and cash equivalents orrestricted cash, cash equivalents and short-term investments, with the offsetting obligation inaccounts payable. The hedge margin we provide to counterparties is recorded in accountsreceivable. All cash flows associated with purchasing and settling hedge contracts are classifiedas operating cash flows.
Passenger Tickets
We record sales of passenger tickets in air traffic liability. Passenger revenue is recognizedwhen we provide transportation or when the ticket expires unused, reducing the related air trafficliability. We periodically evaluate the estimated air traffic liability and record any adjustments inour Consolidated Statements of Operations. These adjustments relate primarily to refunds,exchanges, transactions with other airlines and other items for which final settlement occurs inperiods subsequent to the sale of the related tickets at amounts other than the original sales price.
Taxes and Fees
We are required to charge certain taxes and fees on our passenger tickets, including U.S.federal transportation taxes, federal security charges, airport passenger facility charges andforeign arrival and departure taxes. These taxes and fees are assessments on the customer forwhich we act as a collection agent. Because we are not entitled to retain these taxes and fees, wedo not include such amounts in passenger revenue. We record a liability when the amounts are
Copyright © 2013 www.secdatabase.com. All Rights Reserved.Please Consider the Environment Before Printing This Document
collected and reduce the liability when payments are made to the applicable government agencyor operating carrier.
Frequent Flyer Program
The SkyMiles Program offers incentives to travel on Delta. This program allows customers toearn mileage credits by flying on Delta, regional air carriers with which we have contract carrieragreements (“Contract Carriers”) and airlines that participate in the SkyMiles Program, as well asthrough participating companies such as credit card companies, hotels and car rental agencies. Wealso sell mileage credits to non-airline businesses, customers and other airlines.
The SkyMiles Program includes two types of transactions that are considered revenuearrangements with multiple deliverables. As discussed below, these are (1) passenger ticket salesearning mileage credits and (2) the sale of mileage credits to participating companies with whichwe have marketing agreements. Mileage credits are a separate unit of accounting as they can beredeemed by customers in future periods for air travel on Delta and participating airlines,membership in our Sky Club and other program awards.
Passenger Ticket Sales Earning Mileage Credits. Passenger ticket sales earning mileagecredits under our SkyMiles Program provide customers with two deliverables: (1) mileage creditsearned and (2) air transportation. Effective January 1, 2011, we began applying the provisions ofASU 2009-13 to passenger tickets earning mileage credits. Under ASU 2009-13, we value eachdeliverable on a standalone basis. Our estimate of the standalone selling price of a mileage creditis based on an analysis of our sales of mileage credits to other airlines and customers and is re-evaluated at least annually. We use established ticket prices to determine the standalone sellingprice of air transportation. We allocate the total amount collected from passenger ticket salesbetween the deliverables based on their relative selling prices.
We defer revenue from the mileage credit component of passenger ticket sales and recognizeit as passenger revenue when miles are redeemed and services are provided. We record theportion of the passenger ticket sales for air transportation in air traffic liability and recognizethese amounts in passenger revenue when we provide transportation or when the ticket expiresunused. The adoption of ASU 2009-13 did not have a material impact on the timing of revenuerecognition or its classification with regard to passenger tickets earning mileage credits.
Prior to the adoption of ASU 2009-13, we used the residual method for revenue recognition.Under the residual method, we determined the fair value of the mileage credit component basedon prices at which we sold mileage credits to other airlines and then considered the remainder ofthe amount collected to be the air transportation deliverable.
Sale of Mileage Credits. Customers may earn mileage credits through participating companiessuch as credit card companies, hotels and car rental agencies with which we have marketingagreements to sell mileage credits. Our contracts to sell mileage credits under these marketingagreements have two deliverables: (1) the mileage credits redeemable for future travel and (2) themarketing component.
ASU 2009-13 does not apply to contracts to sell mileage credits entered into prior to January1, 2011 unless those contracts are materially modified. As of December 31, 2011, we had notmaterially modified any of our significant agreements. Our most significant contract to sellmileage credits relates to our co-brand credit card relationship with American Express. Foradditional information about this relationship, see Note 6. For contracts entered into prior toJanuary 1, 2011 that have not been materially modified since January 1, 2011, we continue to usethe residual method for revenue recognition and value only the mileage credits. Under theresidual method, the portion of the revenue from the mileage component is deferred andrecognized as passenger revenue when miles are redeemed and services are provided. The portionof the revenue received in excess of the fair value of mileage credits sold, the marketingcomponent, is recognized in income as other revenue when the related marketing services areprovided. The fair value of a mileage credit is determined based on prices at which we sellmileage credits to other airlines and is re-evaluated at least annually.
Copyright © 2013 www.secdatabase.com. All Rights Reserved.Please Consider the Environment Before Printing This Document
If we enter into new contracts or materially modify existing contracts to sell mileage creditsrelated to our SkyMiles Program, we will value the standalone selling price of the marketingcomponent and allocate the revenue from the contract based on the relative selling price of themileage credits and the marketing component. A material modification of an existing contractcould impact our deferral rate or cause an adjustment to our deferred revenue balance, whichcould materially impact our future financial results.
Breakage. For mileage credits which we estimate are not likely to be redeemed (“Breakage”),we recognize the associated value proportionally during the period in which the remainingmileage credits are expected to be redeemed. The estimate of Breakage is based on historicalredemption patterns. A change in assumptions as to the period over which mileage credits areexpected to be redeemed, the actual redemption activity for mileage credits or the estimated fairvalue of mileage credits expected to be redeemed could have a material impact on our revenue inthe year in which the change occurs and in future years.
Regional Carriers Revenue
During the year ended December 31, 2011, we had contract carrier agreements with nineContract Carriers, including our wholly-owned subsidiary, Comair, Inc. (“Comair”). Our ContractCarrier agreements are structured as either (1) capacity purchase agreements where we purchaseall or a portion of the Contract Carrier's capacity and are responsible for selling the seat inventorywe purchase or (2) revenue proration agreements, which are based on a fixed dollar or percentagedivision of revenues for tickets sold to passengers traveling on connecting flight itineraries. Werecord revenue related to all of our Contract Carrier agreements as regional carriers passengerrevenue. We record expenses related to our Contract Carrier agreements, excluding Comair, ascontract carrier arrangements expense.
Cargo Revenue
Cargo revenue is recognized when we provide the transportation.
Other Revenue
Other revenue is primarily comprised of (1) the marketing component of the sale of mileagecredits discussed above, (2) baggage fee revenue, (3) other miscellaneous service revenue,including ticket change fees and (4) revenue from ancillary businesses, such as the aircraftmaintenance and repair and staffing services we provide to third parties.
Long-Lived Assets
The following table shows our property and equipment:
December 31,
(in millions, except for estimated useful life) Estimated Useful Life 2011 2010
Flight equipment 21-30 years $ 21,001 $ 20,312Ground property and equipment 3-40 years 3,256 3,123Flight and ground equipment undercapital leases
Shorter of lease term or estimateduseful life 1,127 988
Assets constructed for others 30 years 234 —Advance payments for equipment 77 48Less: accumulated depreciation andamortization (5,472) (4,164)Total property and equipment, net $ 20,223 $ 20,307
Copyright © 2013 www.secdatabase.com. All Rights Reserved.Please Consider the Environment Before Printing This Document
We record property and equipment at cost and depreciate or amortize these assets on astraight-line basis to their estimated residual values over their estimated useful lives. Theestimated useful life for leasehold improvements is the shorter of lease term or estimated usefullife. Depreciation expense for the years ended December 31, 2011, 2010 and 2009 was $1.4billion, $1.4 billion and $1.3 billion, respectively. Residual values for owned spare parts andsimulators are generally 5% of cost except when guaranteed by a third party for a differentamount.
We capitalize certain internal and external costs incurred to develop and implement software,and amortize those costs over an estimated useful life of three to seven years. For the years endedDecember 31, 2011, 2010 and 2009, we recorded $64 million, $71 million and $95 million,respectively, for amortization of capitalized software. The net book value of these assets totaled$200 million and $153 million at December 31, 2011 and 2010, respectively.
We record impairment losses on flight equipment and other long-lived assets used inoperations when events and circumstances indicate the assets may be impaired and the estimatedfuture cash flows generated by those assets are less than their carrying amounts. Factors whichcould cause impairment include, but are not limited to, (1) a decision to permanently removeflight equipment or other long-lived assets from operations, (2) significant changes in theestimated useful life, (3) significant changes in projected cash flows, (4) permanent andsignificant declines in fleet fair values and (5) changes to the regulatory environment. For long-lived assets held for sale, we discontinue depreciation and record impairment losses when thecarrying amount of these assets is greater than the fair value less the cost to sell.
To determine whether impairments exist for aircraft used in operations, we group assets at thefleet-type level (the lowest level for which there are identifiable cash flows) and then estimatefuture cash flows based on projections of capacity, passenger mile yield, fuel costs, labor costsand other relevant factors. If an impairment occurs, the impairment loss recognized is the amountby which the aircraft's carrying amount exceeds its estimated fair value. We estimate aircraft fairvalues using published sources, appraisals and bids received from third parties, as available.
Goodwill and Other Intangible Assets
We apply a fair value-based impairment test to the net book value of goodwill and indefinite-lived intangible assets on an annual basis (as of October 1) and, if certain events or circumstancesindicate that an impairment loss may have been incurred, on an interim basis. In September 2011,the FASB issued "Testing Goodwill for Impairment." The standard revises the way in whichentities test goodwill for impairment. We adopted this standard and applied its provisions to ourannual goodwill impairment test in the December 2011 quarter.
We value goodwill and identified intangible assets primarily using market capitalization andincome approach valuation techniques. These measurements include the following significantunobservable inputs: (1) our projected revenues, expenses and cash flows, (2) an estimatedweighted average cost of capital, (3) assumed discount rates depending on the asset and (4) a taxrate. These assumptions are consistent with those hypothetical market participants would use.Since we are required to make estimates and assumptions when evaluating goodwill andindefinite-lived intangible assets for impairment, the actual amounts may differ materially fromthese estimates.
Changes in assumptions or circumstances could result in impairment. Factors which couldcause impairment include, but are not limited to, (1) negative trends in our market capitalization,(2) an increase in fuel prices, (3) declining passenger mile yields, (4) lower passenger demand asa result of the weakened U.S. and global economy, (5) interruption to our operations due to anemployee strike, terrorist attack, or other reasons, (6) changes to the regulatory environment and(7) consolidation of competitors in the airline industry.
Goodwill. As of December 31, 2011 and 2010, our goodwill balance was $9.8 billion. Inevaluating goodwill for impairment, we estimate the fair value of our reporting unit byconsidering market capitalization and other factors if it is more likely than not that the fair value
Copyright © 2013 www.secdatabase.com. All Rights Reserved.Please Consider the Environment Before Printing This Document
of our reporting unit is less than its carrying value. If the reporting unit's fair value exceeds itscarrying value, no further testing is required. If, however, the reporting unit's carrying valueexceeds its fair value, we then determine the amount of the impairment charge, if any. Werecognize an impairment charge if the carrying value of the reporting unit's goodwill exceeds itsestimated fair value.
Identifiable Intangible Assets. Our identifiable intangible assets had a net carrying amount of$4.8 billion at December 31, 2011. Indefinite-lived assets are not amortized and consist primarilyof routes, slots, the Delta tradename and assets related to SkyTeam. Definite-lived intangibleassets consist primarily of marketing agreements and contracts and are amortized on a straight-line basis or under the undiscounted cash flows method over the estimated economic life of therespective agreements and contracts. Costs incurred to renew or extend the term of an intangibleasset are expensed as incurred.
We perform the impairment test for indefinite-lived intangible assets by comparing the asset'sfair value to its carrying value. Fair value is estimated based on (1) recent market transactions,where available, (2) the lease savings method for certain airport slots (which reflects potentiallease savings from owning the slots rather than leasing them from another airline at market rates),(3) the royalty method for the Delta tradename (which assumes hypothetical royalties generatedfrom using our tradename) or (4) projected discounted future cash flows. We recognize animpairment charge if the asset's carrying value exceeds its estimated fair value.
Income Taxes
We account for deferred income taxes under the liability method. We recognize deferred taxassets and liabilities based on the tax effects of temporary differences between the financialstatement and tax bases of assets and liabilities, as measured by current enacted tax rates.Deferred tax assets and liabilities are recorded net as current and noncurrent deferred incometaxes. A valuation allowance is recorded to reduce deferred tax assets when necessary. Foradditional information about our valuation allowance, see Note 11.
Manufacturers' Credits
We periodically receive credits in connection with the acquisition of aircraft and engines.These credits are deferred until the aircraft and engines are delivered, and then applied on a prorata basis as a reduction to the cost of the related equipment.
Maintenance Costs
We record maintenance costs to aircraft maintenance materials and outside repairs.Maintenance costs are expensed as incurred, except for costs incurred under power-by-the-hourcontracts, which are expensed based on actual hours flown. Power-by-the-hour contracts transfercertain risk to third party service providers and fix the amount we pay per flight hour to theservice provider in exchange for maintenance and repairs under a predefined maintenanceprogram. Modifications that enhance the operating performance or extend the useful lives ofairframes or engines are capitalized and amortized over the remaining estimated useful life of theasset or the remaining lease term, whichever is shorter.
Inventories
Inventories of expendable parts related to flight equipment are carried at moving average costand charged to operations as consumed. An allowance for obsolescence is provided over theremaining useful life of the related fleet for spare parts expected to be available at the date aircraftare retired from service. We also provide allowances for parts identified as excess or obsolete toreduce the carrying costs to the lower of cost or net realizable value. These parts are assumed tohave an estimated residual value of 5% of the original cost.
Advertising Costs
Copyright © 2013 www.secdatabase.com. All Rights Reserved.Please Consider the Environment Before Printing This Document
We expense advertising costs as other selling expenses in the year incurred. Advertisingexpense was $214 million, $169 million and $176 million for the years ended December 31,2011, 2010 and 2009, respectively.
Commissions
Passenger commissions are recognized in operating expense when the related revenue isrecognized.
Copyright © 2013 www.secdatabase.com. All Rights Reserved.Please Consider the Environment Before Printing This Document
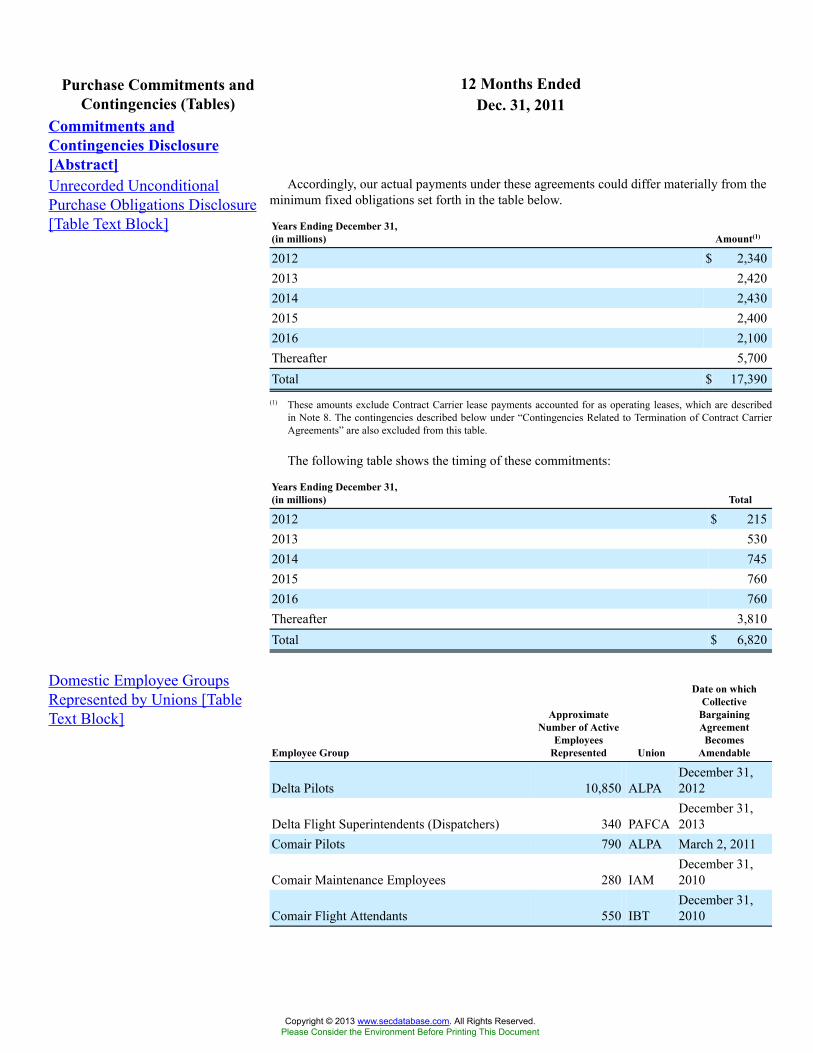
12 Months EndedPurchase Commitments andContingencies (Tables) Dec. 31, 2011
Commitments andContingencies Disclosure[Abstract]Unrecorded UnconditionalPurchase Obligations Disclosure[Table Text Block]
Accordingly, our actual payments under these agreements could differ materially from theminimum fixed obligations set forth in the table below.
Years Ending December 31,(in millions) Amount(1)
2012 $ 2,3402013 2,4202014 2,4302015 2,4002016 2,100Thereafter 5,700Total $ 17,390
(1) These amounts exclude Contract Carrier lease payments accounted for as operating leases, which are describedin Note 8. The contingencies described below under “Contingencies Related to Termination of Contract CarrierAgreements” are also excluded from this table.
The following table shows the timing of these commitments:
Years Ending December 31,(in millions) Total
2012 $ 2152013 5302014 7452015 7602016 760Thereafter 3,810Total $ 6,820
Domestic Employee GroupsRepresented by Unions [TableText Block]
Employee Group
ApproximateNumber of Active
EmployeesRepresented Union
Date on whichCollective
BargainingAgreementBecomes
Amendable
Delta Pilots 10,850 ALPADecember 31,2012
Delta Flight Superintendents (Dispatchers) 340 PAFCADecember 31,2013
Comair Pilots 790 ALPA March 2, 2011
Comair Maintenance Employees 280 IAMDecember 31,2010
Comair Flight Attendants 550 IBTDecember 31,2010
Copyright © 2013 www.secdatabase.com. All Rights Reserved.Please Consider the Environment Before Printing This Document
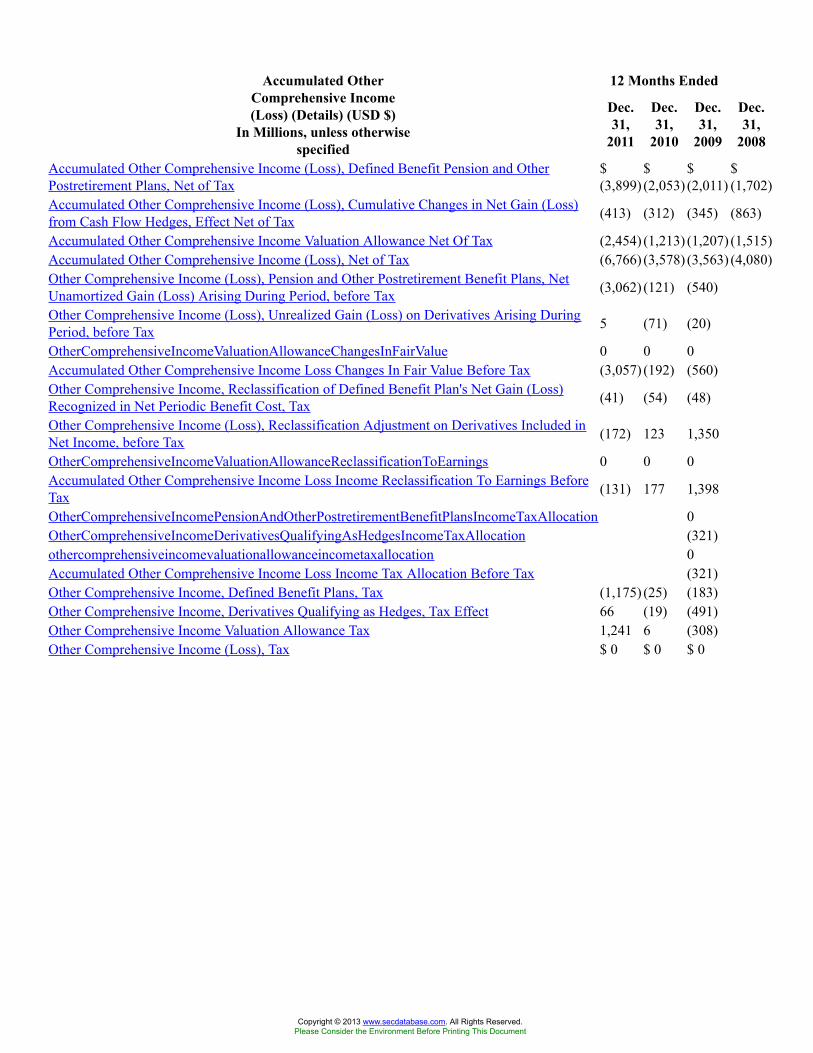
12 Months EndedAccumulated OtherComprehensive Income(Loss) (Details) (USD $)
In Millions, unless otherwisespecified
Dec.31,
2011
Dec.31,
2010
Dec.31,
2009
Dec.31,
2008
Accumulated Other Comprehensive Income (Loss), Defined Benefit Pension and OtherPostretirement Plans, Net of Tax
$(3,899)
$(2,053)
$(2,011)
$(1,702)
Accumulated Other Comprehensive Income (Loss), Cumulative Changes in Net Gain (Loss)from Cash Flow Hedges, Effect Net of Tax (413) (312) (345) (863)
Accumulated Other Comprehensive Income Valuation Allowance Net Of Tax (2,454) (1,213) (1,207) (1,515)Accumulated Other Comprehensive Income (Loss), Net of Tax (6,766) (3,578) (3,563) (4,080)Other Comprehensive Income (Loss), Pension and Other Postretirement Benefit Plans, NetUnamortized Gain (Loss) Arising During Period, before Tax (3,062) (121) (540)
Other Comprehensive Income (Loss), Unrealized Gain (Loss) on Derivatives Arising DuringPeriod, before Tax 5 (71) (20)
OtherComprehensiveIncomeValuationAllowanceChangesInFairValue 0 0 0Accumulated Other Comprehensive Income Loss Changes In Fair Value Before Tax (3,057) (192) (560)Other Comprehensive Income, Reclassification of Defined Benefit Plan's Net Gain (Loss)Recognized in Net Periodic Benefit Cost, Tax (41) (54) (48)
Other Comprehensive Income (Loss), Reclassification Adjustment on Derivatives Included inNet Income, before Tax (172) 123 1,350
OtherComprehensiveIncomeValuationAllowanceReclassificationToEarnings 0 0 0Accumulated Other Comprehensive Income Loss Income Reclassification To Earnings BeforeTax (131) 177 1,398
OtherComprehensiveIncomePensionAndOtherPostretirementBenefitPlansIncomeTaxAllocation 0OtherComprehensiveIncomeDerivativesQualifyingAsHedgesIncomeTaxAllocation (321)othercomprehensiveincomevaluationallowanceincometaxallocation 0Accumulated Other Comprehensive Income Loss Income Tax Allocation Before Tax (321)Other Comprehensive Income, Defined Benefit Plans, Tax (1,175) (25) (183)Other Comprehensive Income, Derivatives Qualifying as Hedges, Tax Effect 66 (19) (491)Other Comprehensive Income Valuation Allowance Tax 1,241 6 (308)Other Comprehensive Income (Loss), Tax $ 0 $ 0 $ 0
Copyright © 2013 www.secdatabase.com. All Rights Reserved.Please Consider the Environment Before Printing This Document
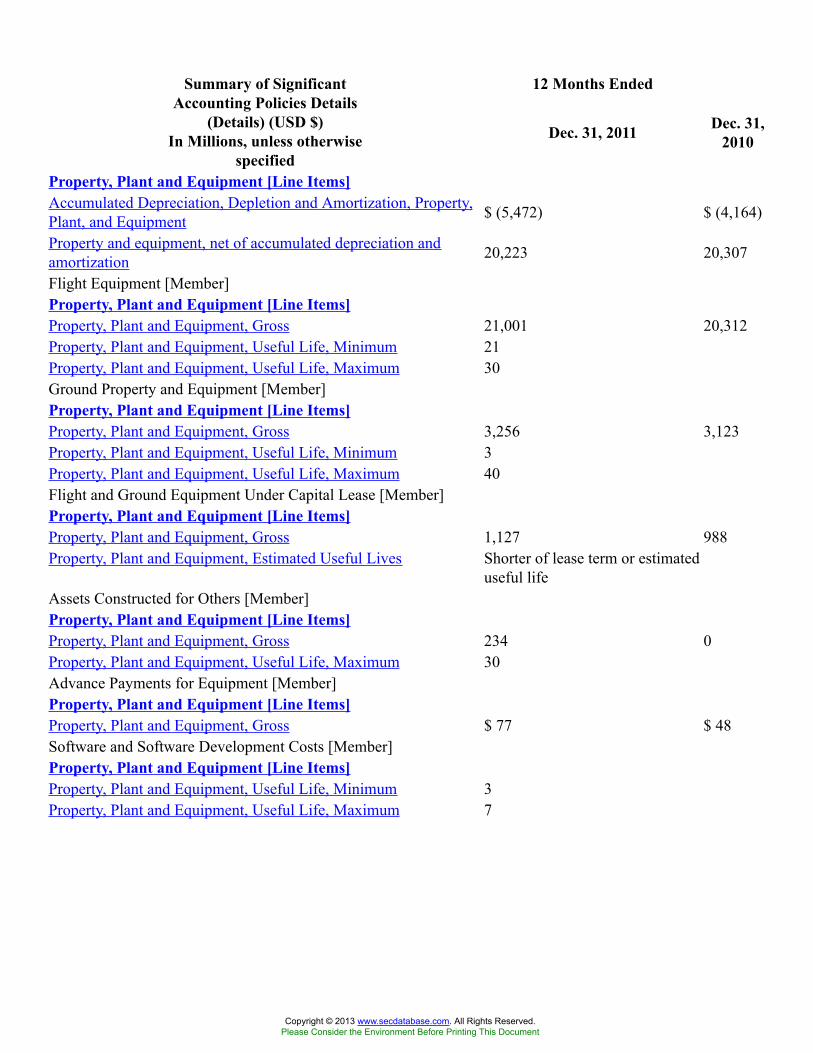
12 Months EndedSummary of SignificantAccounting Policies Details
(Details) (USD $)In Millions, unless otherwise
specified
Dec. 31, 2011 Dec. 31,2010
Property, Plant and Equipment [Line Items]Accumulated Depreciation, Depletion and Amortization, Property,Plant, and Equipment $ (5,472) $ (4,164)
Property and equipment, net of accumulated depreciation andamortization 20,223 20,307
Flight Equipment [Member]Property, Plant and Equipment [Line Items]Property, Plant and Equipment, Gross 21,001 20,312Property, Plant and Equipment, Useful Life, Minimum 21Property, Plant and Equipment, Useful Life, Maximum 30Ground Property and Equipment [Member]Property, Plant and Equipment [Line Items]Property, Plant and Equipment, Gross 3,256 3,123Property, Plant and Equipment, Useful Life, Minimum 3Property, Plant and Equipment, Useful Life, Maximum 40Flight and Ground Equipment Under Capital Lease [Member]Property, Plant and Equipment [Line Items]Property, Plant and Equipment, Gross 1,127 988Property, Plant and Equipment, Estimated Useful Lives Shorter of lease term or estimated
useful lifeAssets Constructed for Others [Member]Property, Plant and Equipment [Line Items]Property, Plant and Equipment, Gross 234 0Property, Plant and Equipment, Useful Life, Maximum 30Advance Payments for Equipment [Member]Property, Plant and Equipment [Line Items]Property, Plant and Equipment, Gross $ 77 $ 48Software and Software Development Costs [Member]Property, Plant and Equipment [Line Items]Property, Plant and Equipment, Useful Life, Minimum 3Property, Plant and Equipment, Useful Life, Maximum 7
Copyright © 2013 www.secdatabase.com. All Rights Reserved.Please Consider the Environment Before Printing This Document
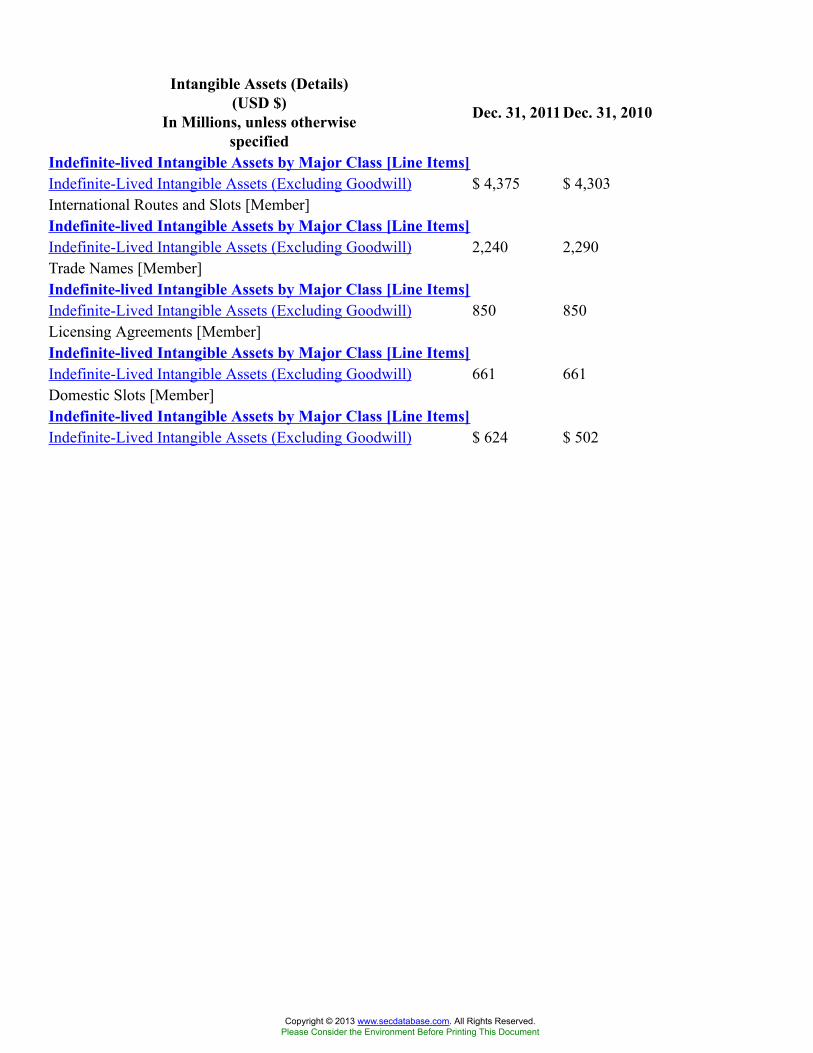
Intangible Assets (Details)(USD $)
In Millions, unless otherwisespecified
Dec. 31, 2011Dec. 31, 2010
Indefinite-lived Intangible Assets by Major Class [Line Items]Indefinite-Lived Intangible Assets (Excluding Goodwill) $ 4,375 $ 4,303International Routes and Slots [Member]Indefinite-lived Intangible Assets by Major Class [Line Items]Indefinite-Lived Intangible Assets (Excluding Goodwill) 2,240 2,290Trade Names [Member]Indefinite-lived Intangible Assets by Major Class [Line Items]Indefinite-Lived Intangible Assets (Excluding Goodwill) 850 850Licensing Agreements [Member]Indefinite-lived Intangible Assets by Major Class [Line Items]Indefinite-Lived Intangible Assets (Excluding Goodwill) 661 661Domestic Slots [Member]Indefinite-lived Intangible Assets by Major Class [Line Items]Indefinite-Lived Intangible Assets (Excluding Goodwill) $ 624 $ 502
Copyright © 2013 www.secdatabase.com. All Rights Reserved.Please Consider the Environment Before Printing This Document
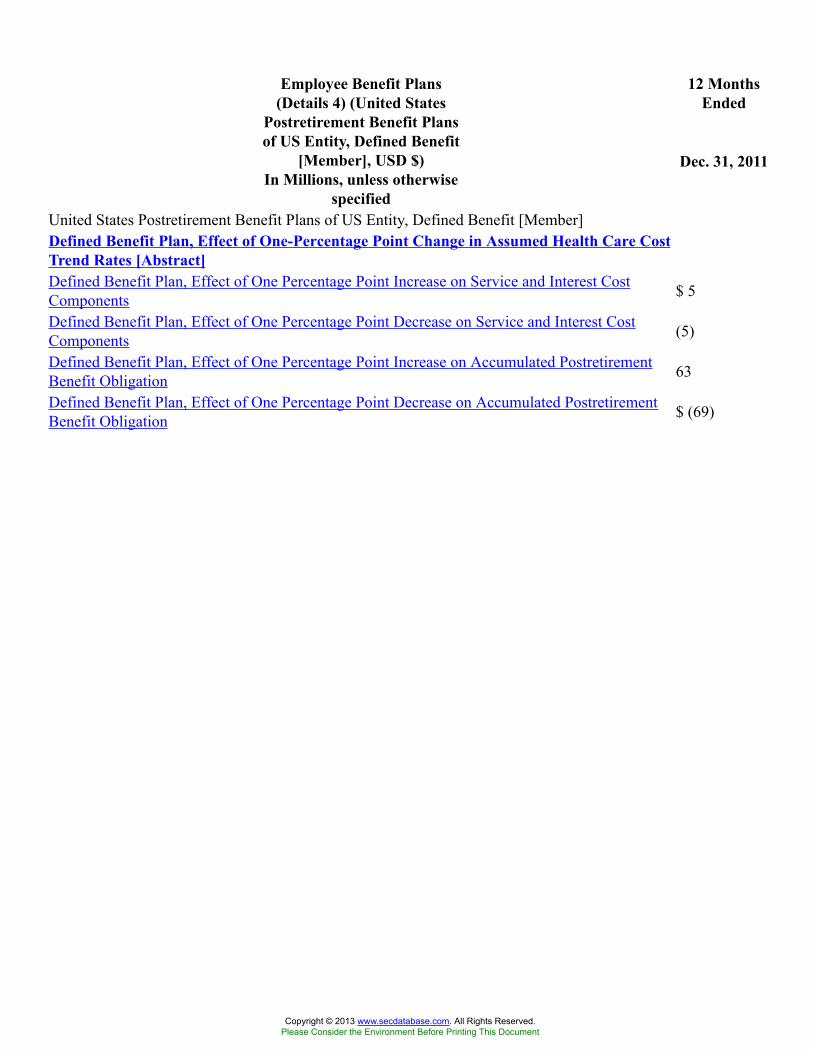
12 MonthsEnded
Employee Benefit Plans(Details 4) (United States
Postretirement Benefit Plansof US Entity, Defined Benefit
[Member], USD $)In Millions, unless otherwise
specified
Dec. 31, 2011
United States Postretirement Benefit Plans of US Entity, Defined Benefit [Member]Defined Benefit Plan, Effect of One-Percentage Point Change in Assumed Health Care CostTrend Rates [Abstract]Defined Benefit Plan, Effect of One Percentage Point Increase on Service and Interest CostComponents $ 5
Defined Benefit Plan, Effect of One Percentage Point Decrease on Service and Interest CostComponents (5)
Defined Benefit Plan, Effect of One Percentage Point Increase on Accumulated PostretirementBenefit Obligation 63
Defined Benefit Plan, Effect of One Percentage Point Decrease on Accumulated PostretirementBenefit Obligation $ (69)
Copyright © 2013 www.secdatabase.com. All Rights Reserved.Please Consider the Environment Before Printing This Document
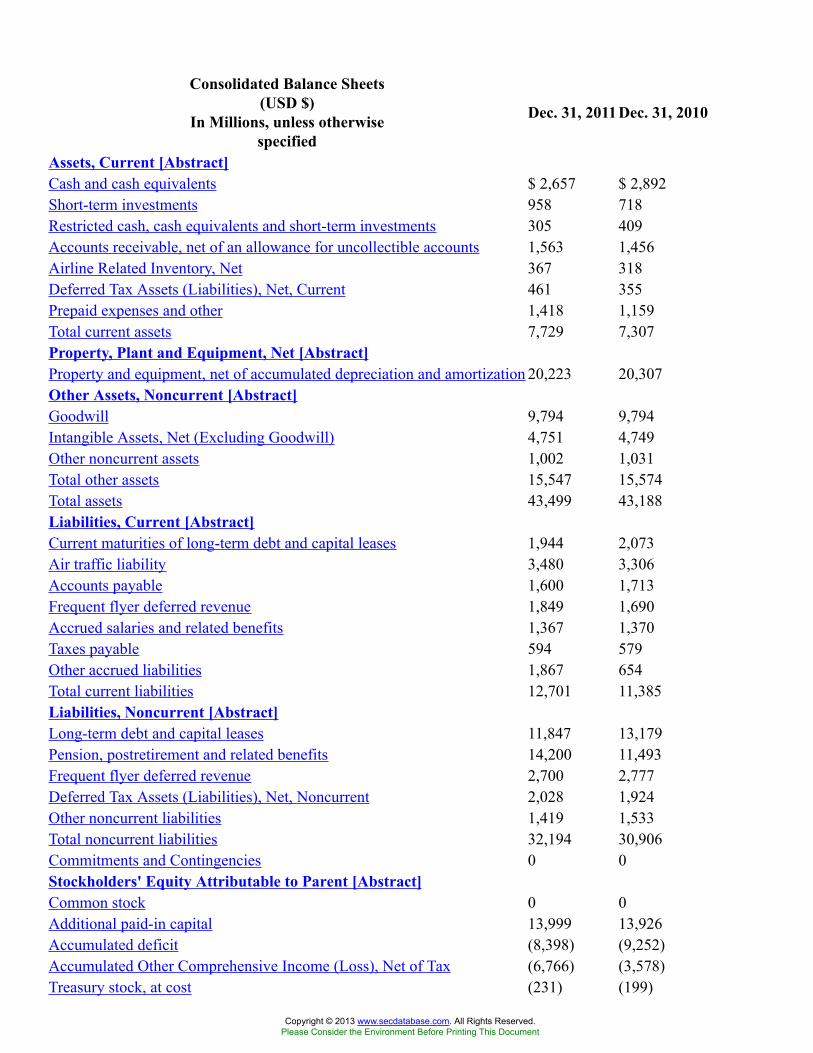
Consolidated Balance Sheets(USD $)
In Millions, unless otherwisespecified
Dec. 31, 2011Dec. 31, 2010
Assets, Current [Abstract]Cash and cash equivalents $ 2,657 $ 2,892Short-term investments 958 718Restricted cash, cash equivalents and short-term investments 305 409Accounts receivable, net of an allowance for uncollectible accounts 1,563 1,456Airline Related Inventory, Net 367 318Deferred Tax Assets (Liabilities), Net, Current 461 355Prepaid expenses and other 1,418 1,159Total current assets 7,729 7,307Property, Plant and Equipment, Net [Abstract]Property and equipment, net of accumulated depreciation and amortization 20,223 20,307Other Assets, Noncurrent [Abstract]Goodwill 9,794 9,794Intangible Assets, Net (Excluding Goodwill) 4,751 4,749Other noncurrent assets 1,002 1,031Total other assets 15,547 15,574Total assets 43,499 43,188Liabilities, Current [Abstract]Current maturities of long-term debt and capital leases 1,944 2,073Air traffic liability 3,480 3,306Accounts payable 1,600 1,713Frequent flyer deferred revenue 1,849 1,690Accrued salaries and related benefits 1,367 1,370Taxes payable 594 579Other accrued liabilities 1,867 654Total current liabilities 12,701 11,385Liabilities, Noncurrent [Abstract]Long-term debt and capital leases 11,847 13,179Pension, postretirement and related benefits 14,200 11,493Frequent flyer deferred revenue 2,700 2,777Deferred Tax Assets (Liabilities), Net, Noncurrent 2,028 1,924Other noncurrent liabilities 1,419 1,533Total noncurrent liabilities 32,194 30,906Commitments and Contingencies 0 0Stockholders' Equity Attributable to Parent [Abstract]Common stock 0 0Additional paid-in capital 13,999 13,926Accumulated deficit (8,398) (9,252)Accumulated Other Comprehensive Income (Loss), Net of Tax (6,766) (3,578)Treasury stock, at cost (231) (199)
Copyright © 2013 www.secdatabase.com. All Rights Reserved.Please Consider the Environment Before Printing This Document

Total stockholders' equity (1,396) 897Total liabilities and stockholders' equity $ 43,499 $ 43,188
Copyright © 2013 www.secdatabase.com. All Rights Reserved.Please Consider the Environment Before Printing This Document
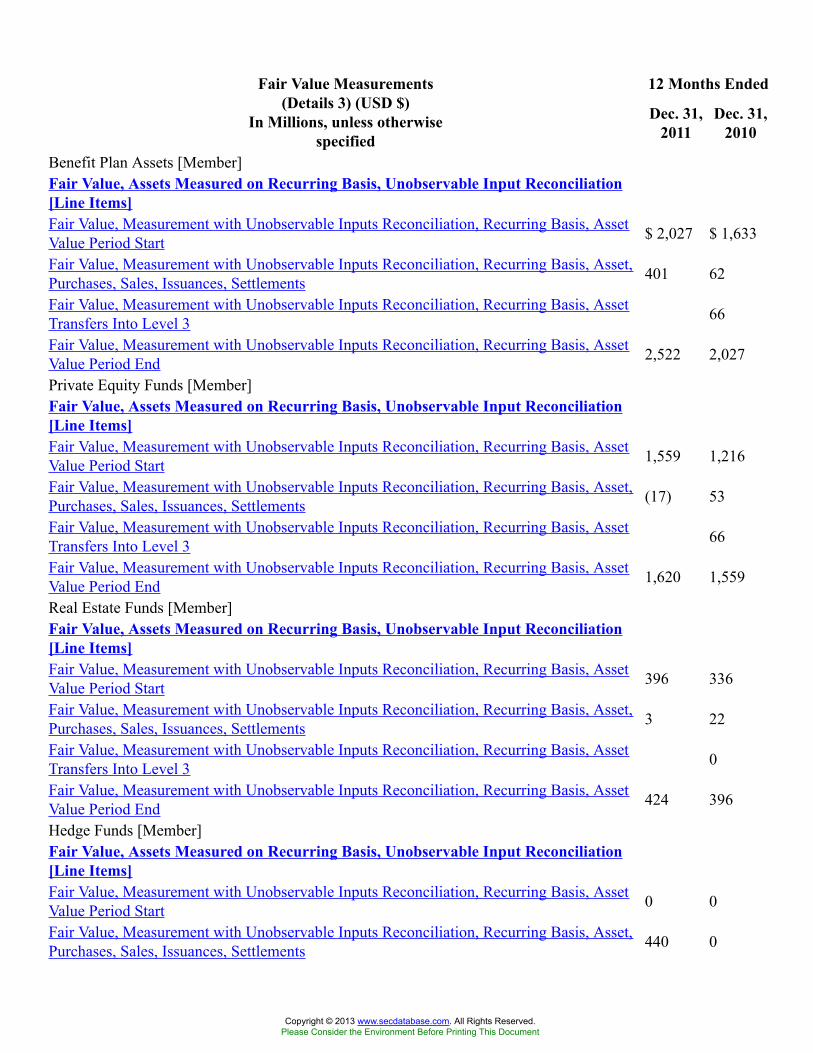
12 Months EndedFair Value Measurements(Details 3) (USD $)
In Millions, unless otherwisespecified
Dec. 31,2011
Dec. 31,2010
Benefit Plan Assets [Member]Fair Value, Assets Measured on Recurring Basis, Unobservable Input Reconciliation[Line Items]Fair Value, Measurement with Unobservable Inputs Reconciliation, Recurring Basis, AssetValue Period Start $ 2,027 $ 1,633
Fair Value, Measurement with Unobservable Inputs Reconciliation, Recurring Basis, Asset,Purchases, Sales, Issuances, Settlements 401 62
Fair Value, Measurement with Unobservable Inputs Reconciliation, Recurring Basis, AssetTransfers Into Level 3 66
Fair Value, Measurement with Unobservable Inputs Reconciliation, Recurring Basis, AssetValue Period End 2,522 2,027
Private Equity Funds [Member]Fair Value, Assets Measured on Recurring Basis, Unobservable Input Reconciliation[Line Items]Fair Value, Measurement with Unobservable Inputs Reconciliation, Recurring Basis, AssetValue Period Start 1,559 1,216
Fair Value, Measurement with Unobservable Inputs Reconciliation, Recurring Basis, Asset,Purchases, Sales, Issuances, Settlements (17) 53
Fair Value, Measurement with Unobservable Inputs Reconciliation, Recurring Basis, AssetTransfers Into Level 3 66
Fair Value, Measurement with Unobservable Inputs Reconciliation, Recurring Basis, AssetValue Period End 1,620 1,559
Real Estate Funds [Member]Fair Value, Assets Measured on Recurring Basis, Unobservable Input Reconciliation[Line Items]Fair Value, Measurement with Unobservable Inputs Reconciliation, Recurring Basis, AssetValue Period Start 396 336
Fair Value, Measurement with Unobservable Inputs Reconciliation, Recurring Basis, Asset,Purchases, Sales, Issuances, Settlements 3 22
Fair Value, Measurement with Unobservable Inputs Reconciliation, Recurring Basis, AssetTransfers Into Level 3 0
Fair Value, Measurement with Unobservable Inputs Reconciliation, Recurring Basis, AssetValue Period End 424 396
Hedge Funds [Member]Fair Value, Assets Measured on Recurring Basis, Unobservable Input Reconciliation[Line Items]Fair Value, Measurement with Unobservable Inputs Reconciliation, Recurring Basis, AssetValue Period Start 0 0
Fair Value, Measurement with Unobservable Inputs Reconciliation, Recurring Basis, Asset,Purchases, Sales, Issuances, Settlements 440 0
Copyright © 2013 www.secdatabase.com. All Rights Reserved.Please Consider the Environment Before Printing This Document

Fair Value, Measurement with Unobservable Inputs Reconciliation, Recurring Basis, AssetTransfers Into Level 3 0
Fair Value, Measurement with Unobservable Inputs Reconciliation, Recurring Basis, AssetValue Period End 432 0
Common Stock [Member]Fair Value, Assets Measured on Recurring Basis, Unobservable Input Reconciliation[Line Items]Fair Value, Measurement with Unobservable Inputs Reconciliation, Recurring Basis, AssetValue Period Start 32 35
Fair Value, Measurement with Unobservable Inputs Reconciliation, Recurring Basis, Asset,Purchases, Sales, Issuances, Settlements 6 (2)
Fair Value, Measurement with Unobservable Inputs Reconciliation, Recurring Basis, AssetTransfers Into Level 3 0
Fair Value, Measurement with Unobservable Inputs Reconciliation, Recurring Basis, AssetValue Period End 35 32
Fixed Income Funds [Member]Fair Value, Assets Measured on Recurring Basis, Unobservable Input Reconciliation[Line Items]Fair Value, Measurement with Unobservable Inputs Reconciliation, Recurring Basis, AssetValue Period Start 40 46
Fair Value, Measurement with Unobservable Inputs Reconciliation, Recurring Basis, Asset,Purchases, Sales, Issuances, Settlements (31) (11)
Fair Value, Measurement with Unobservable Inputs Reconciliation, Recurring Basis, AssetTransfers Into Level 3 0
Fair Value, Measurement with Unobservable Inputs Reconciliation, Recurring Basis, AssetValue Period End 11 40
Assets Still Held At The Reporting Date [Member] | Benefit Plan Assets [Member]Fair Value, Assets Measured on Recurring Basis, Unobservable Input Reconciliation[Line Items]Fair Value, Measurement with Unobservable Inputs Reconciliation, Recurring Basis, Asset,Period Increase (Decrease) 41 194
Assets Still Held At The Reporting Date [Member] | Private Equity Funds [Member]Fair Value, Assets Measured on Recurring Basis, Unobservable Input Reconciliation[Line Items]Fair Value, Measurement with Unobservable Inputs Reconciliation, Recurring Basis, Asset,Period Increase (Decrease) 36 160
Assets Still Held At The Reporting Date [Member] | Real Estate Funds [Member]Fair Value, Assets Measured on Recurring Basis, Unobservable Input Reconciliation[Line Items]Fair Value, Measurement with Unobservable Inputs Reconciliation, Recurring Basis, Asset,Period Increase (Decrease) 20 34
Assets Still Held At The Reporting Date [Member] | Hedge Funds [Member]Fair Value, Assets Measured on Recurring Basis, Unobservable Input Reconciliation[Line Items]Fair Value, Measurement with Unobservable Inputs Reconciliation, Recurring Basis, Asset,Period Increase (Decrease) (8) 0
Copyright © 2013 www.secdatabase.com. All Rights Reserved.Please Consider the Environment Before Printing This Document
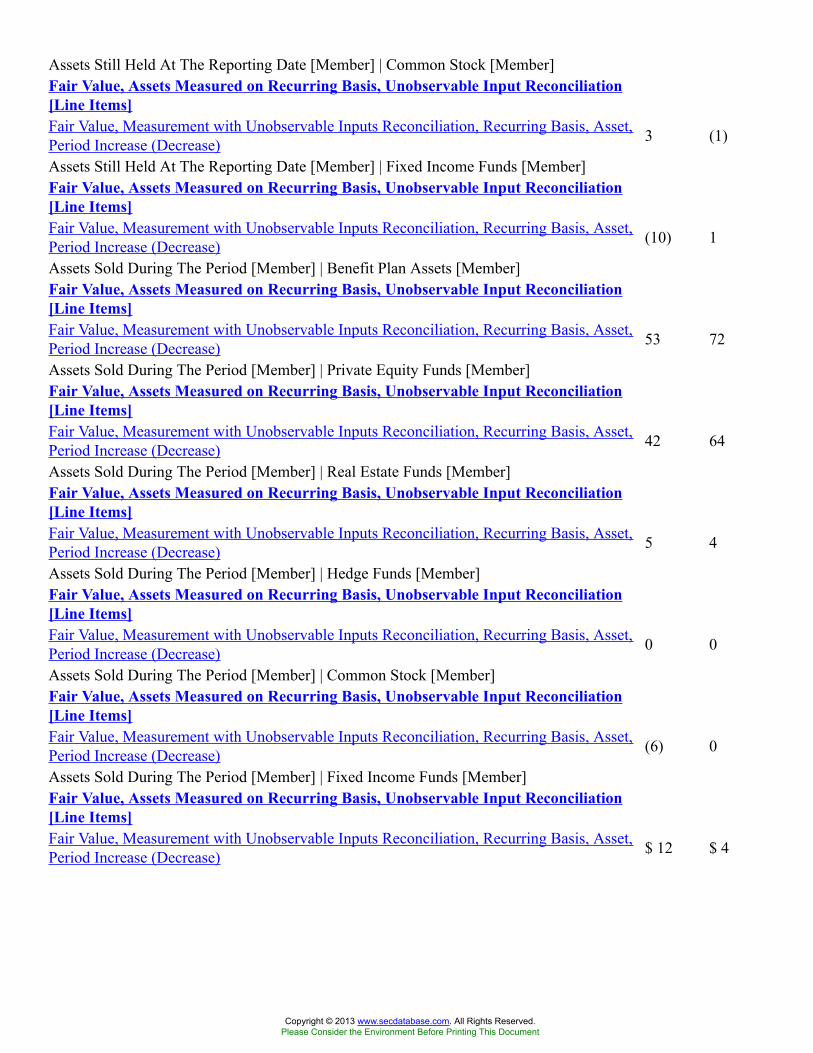
Assets Still Held At The Reporting Date [Member] | Common Stock [Member]Fair Value, Assets Measured on Recurring Basis, Unobservable Input Reconciliation[Line Items]Fair Value, Measurement with Unobservable Inputs Reconciliation, Recurring Basis, Asset,Period Increase (Decrease) 3 (1)
Assets Still Held At The Reporting Date [Member] | Fixed Income Funds [Member]Fair Value, Assets Measured on Recurring Basis, Unobservable Input Reconciliation[Line Items]Fair Value, Measurement with Unobservable Inputs Reconciliation, Recurring Basis, Asset,Period Increase (Decrease) (10) 1
Assets Sold During The Period [Member] | Benefit Plan Assets [Member]Fair Value, Assets Measured on Recurring Basis, Unobservable Input Reconciliation[Line Items]Fair Value, Measurement with Unobservable Inputs Reconciliation, Recurring Basis, Asset,Period Increase (Decrease) 53 72
Assets Sold During The Period [Member] | Private Equity Funds [Member]Fair Value, Assets Measured on Recurring Basis, Unobservable Input Reconciliation[Line Items]Fair Value, Measurement with Unobservable Inputs Reconciliation, Recurring Basis, Asset,Period Increase (Decrease) 42 64
Assets Sold During The Period [Member] | Real Estate Funds [Member]Fair Value, Assets Measured on Recurring Basis, Unobservable Input Reconciliation[Line Items]Fair Value, Measurement with Unobservable Inputs Reconciliation, Recurring Basis, Asset,Period Increase (Decrease) 5 4
Assets Sold During The Period [Member] | Hedge Funds [Member]Fair Value, Assets Measured on Recurring Basis, Unobservable Input Reconciliation[Line Items]Fair Value, Measurement with Unobservable Inputs Reconciliation, Recurring Basis, Asset,Period Increase (Decrease) 0 0
Assets Sold During The Period [Member] | Common Stock [Member]Fair Value, Assets Measured on Recurring Basis, Unobservable Input Reconciliation[Line Items]Fair Value, Measurement with Unobservable Inputs Reconciliation, Recurring Basis, Asset,Period Increase (Decrease) (6) 0
Assets Sold During The Period [Member] | Fixed Income Funds [Member]Fair Value, Assets Measured on Recurring Basis, Unobservable Input Reconciliation[Line Items]Fair Value, Measurement with Unobservable Inputs Reconciliation, Recurring Basis, Asset,Period Increase (Decrease) $ 12 $ 4
Copyright © 2013 www.secdatabase.com. All Rights Reserved.Please Consider the Environment Before Printing This Document
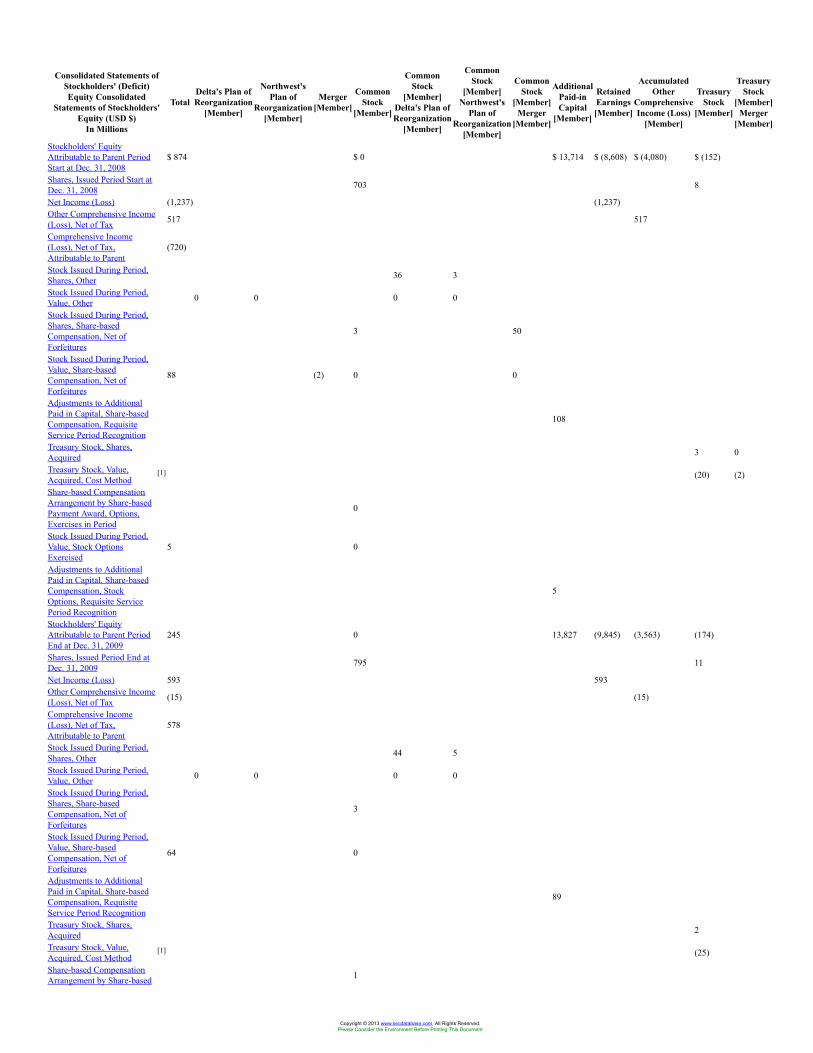
Consolidated Statements ofStockholders' (Deficit)Equity Consolidated
Statements of Stockholders'Equity (USD $)
In Millions
TotalDelta's Plan ofReorganization
[Member]
Northwest'sPlan of
Reorganization[Member]
Merger[Member]
CommonStock
[Member]
CommonStock
[Member]Delta's Plan ofReorganization
[Member]
CommonStock
[Member]Northwest's
Plan ofReorganization
[Member]
CommonStock
[Member]Merger
[Member]
AdditionalPaid-inCapital
[Member]
RetainedEarnings[Member]
AccumulatedOther
ComprehensiveIncome (Loss)
[Member]
TreasuryStock
[Member]
TreasuryStock
[Member]Merger
[Member]
Stockholders' EquityAttributable to Parent PeriodStart at Dec. 31, 2008
$ 874 $ 0 $ 13,714 $ (8,608) $ (4,080) $ (152)
Shares, Issued Period Start atDec. 31, 2008 703 8
Net Income (Loss) (1,237) (1,237)Other Comprehensive Income(Loss), Net of Tax 517 517
Comprehensive Income(Loss), Net of Tax,Attributable to Parent
(720)
Stock Issued During Period,Shares, Other 36 3
Stock Issued During Period,Value, Other 0 0 0 0
Stock Issued During Period,Shares, Share-basedCompensation, Net ofForfeitures
3 50
Stock Issued During Period,Value, Share-basedCompensation, Net ofForfeitures
88 (2) 0 0
Adjustments to AdditionalPaid in Capital, Share-basedCompensation, RequisiteService Period Recognition
108
Treasury Stock, Shares,Acquired 3 0
Treasury Stock, Value,Acquired, Cost Method
[1] (20) (2)
Share-based CompensationArrangement by Share-basedPayment Award, Options,Exercises in Period
0
Stock Issued During Period,Value, Stock OptionsExercised
5 0
Adjustments to AdditionalPaid in Capital, Share-basedCompensation, StockOptions, Requisite ServicePeriod Recognition
5
Stockholders' EquityAttributable to Parent PeriodEnd at Dec. 31, 2009
245 0 13,827 (9,845) (3,563) (174)
Shares, Issued Period End atDec. 31, 2009 795 11
Net Income (Loss) 593 593Other Comprehensive Income(Loss), Net of Tax (15) (15)
Comprehensive Income(Loss), Net of Tax,Attributable to Parent
578
Stock Issued During Period,Shares, Other 44 5
Stock Issued During Period,Value, Other 0 0 0 0
Stock Issued During Period,Shares, Share-basedCompensation, Net ofForfeitures
3
Stock Issued During Period,Value, Share-basedCompensation, Net ofForfeitures
64 0
Adjustments to AdditionalPaid in Capital, Share-basedCompensation, RequisiteService Period Recognition
89
Treasury Stock, Shares,Acquired 2
Treasury Stock, Value,Acquired, Cost Method
[1] (25)
Share-based CompensationArrangement by Share-based 1
Copyright © 2013 www.secdatabase.com. All Rights Reserved.Please Consider the Environment Before Printing This Document
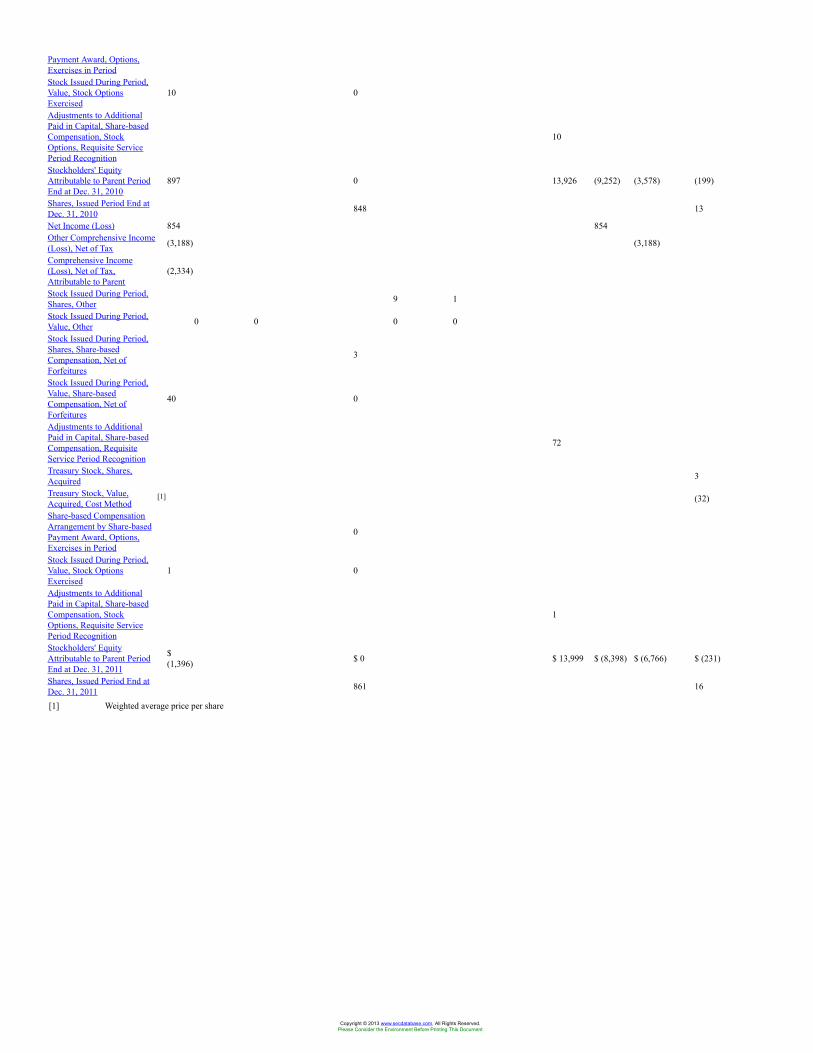
Payment Award, Options,Exercises in PeriodStock Issued During Period,Value, Stock OptionsExercised
10 0
Adjustments to AdditionalPaid in Capital, Share-basedCompensation, StockOptions, Requisite ServicePeriod Recognition
10
Stockholders' EquityAttributable to Parent PeriodEnd at Dec. 31, 2010
897 0 13,926 (9,252) (3,578) (199)
Shares, Issued Period End atDec. 31, 2010 848 13
Net Income (Loss) 854 854Other Comprehensive Income(Loss), Net of Tax (3,188) (3,188)
Comprehensive Income(Loss), Net of Tax,Attributable to Parent
(2,334)
Stock Issued During Period,Shares, Other 9 1
Stock Issued During Period,Value, Other 0 0 0 0
Stock Issued During Period,Shares, Share-basedCompensation, Net ofForfeitures
3
Stock Issued During Period,Value, Share-basedCompensation, Net ofForfeitures
40 0
Adjustments to AdditionalPaid in Capital, Share-basedCompensation, RequisiteService Period Recognition
72
Treasury Stock, Shares,Acquired 3
Treasury Stock, Value,Acquired, Cost Method
[1] (32)
Share-based CompensationArrangement by Share-basedPayment Award, Options,Exercises in Period
0
Stock Issued During Period,Value, Stock OptionsExercised
1 0
Adjustments to AdditionalPaid in Capital, Share-basedCompensation, StockOptions, Requisite ServicePeriod Recognition
1
Stockholders' EquityAttributable to Parent PeriodEnd at Dec. 31, 2011
$(1,396) $ 0 $ 13,999 $ (8,398) $ (6,766) $ (231)
Shares, Issued Period End atDec. 31, 2011 861 16
[1] Weighted average price per share
Copyright © 2013 www.secdatabase.com. All Rights Reserved.Please Consider the Environment Before Printing This Document
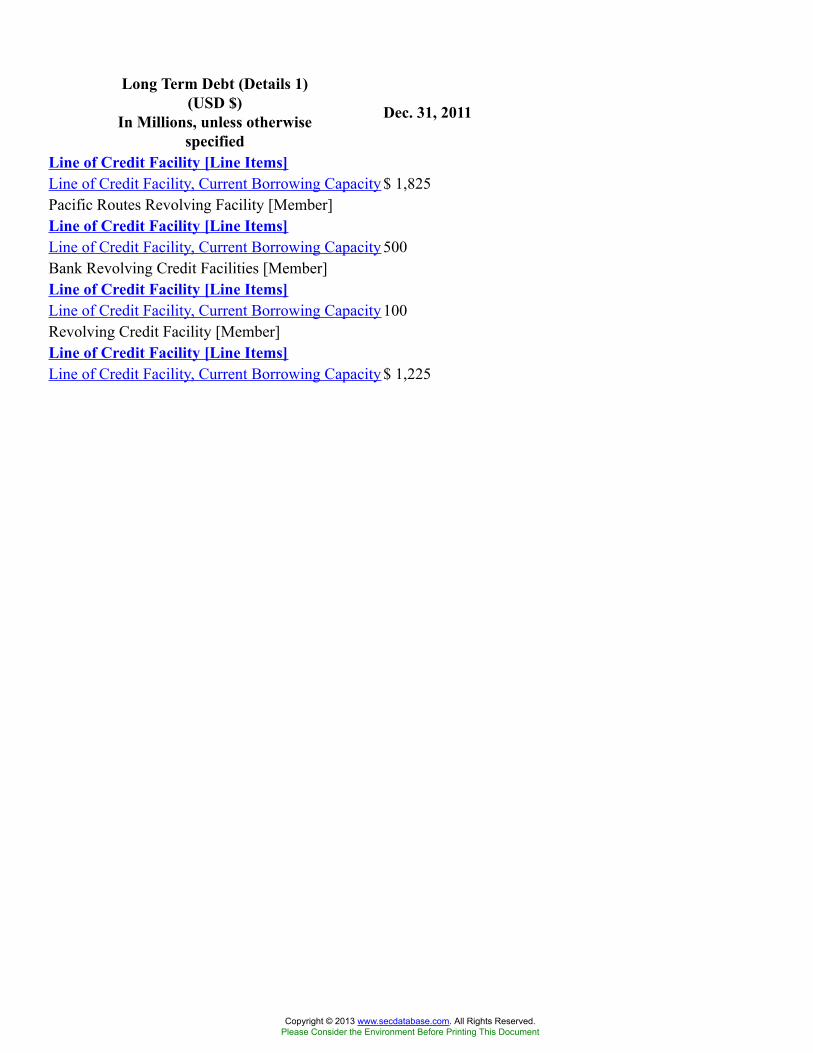
Long Term Debt (Details 1)(USD $)
In Millions, unless otherwisespecified
Dec. 31, 2011
Line of Credit Facility [Line Items]Line of Credit Facility, Current Borrowing Capacity $ 1,825Pacific Routes Revolving Facility [Member]Line of Credit Facility [Line Items]Line of Credit Facility, Current Borrowing Capacity 500Bank Revolving Credit Facilities [Member]Line of Credit Facility [Line Items]Line of Credit Facility, Current Borrowing Capacity 100Revolving Credit Facility [Member]Line of Credit Facility [Line Items]Line of Credit Facility, Current Borrowing Capacity $ 1,225
Copyright © 2013 www.secdatabase.com. All Rights Reserved.Please Consider the Environment Before Printing This Document
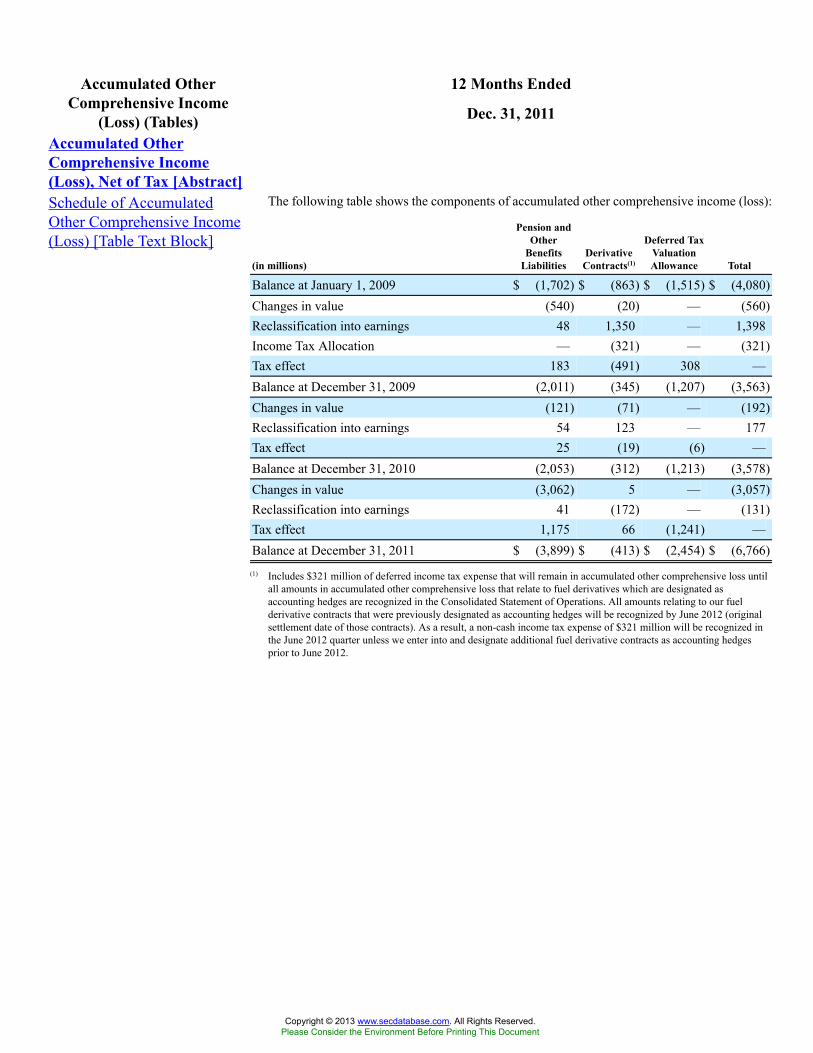
12 Months EndedAccumulated OtherComprehensive Income
(Loss) (Tables) Dec. 31, 2011
Accumulated OtherComprehensive Income(Loss), Net of Tax [Abstract]Schedule of AccumulatedOther Comprehensive Income(Loss) [Table Text Block]
The following table shows the components of accumulated other comprehensive income (loss):
(in millions)
Pension andOther
BenefitsLiabilities
DerivativeContracts(1)
Deferred TaxValuationAllowance Total
Balance at January 1, 2009 $ (1,702) $ (863) $ (1,515) $ (4,080)Changes in value (540) (20) — (560)Reclassification into earnings 48 1,350 — 1,398Income Tax Allocation — (321) — (321)Tax effect 183 (491) 308 —Balance at December 31, 2009 (2,011) (345) (1,207) (3,563)Changes in value (121) (71) — (192)Reclassification into earnings 54 123 — 177Tax effect 25 (19) (6) —Balance at December 31, 2010 (2,053) (312) (1,213) (3,578)Changes in value (3,062) 5 — (3,057)Reclassification into earnings 41 (172) — (131)Tax effect 1,175 66 (1,241) —Balance at December 31, 2011 $ (3,899) $ (413) $ (2,454) $ (6,766)
(1) Includes $321 million of deferred income tax expense that will remain in accumulated other comprehensive loss untilall amounts in accumulated other comprehensive loss that relate to fuel derivatives which are designated asaccounting hedges are recognized in the Consolidated Statement of Operations. All amounts relating to our fuelderivative contracts that were previously designated as accounting hedges will be recognized by June 2012 (originalsettlement date of those contracts). As a result, a non-cash income tax expense of $321 million will be recognized inthe June 2012 quarter unless we enter into and designate additional fuel derivative contracts as accounting hedgesprior to June 2012.
Copyright © 2013 www.secdatabase.com. All Rights Reserved.Please Consider the Environment Before Printing This Document
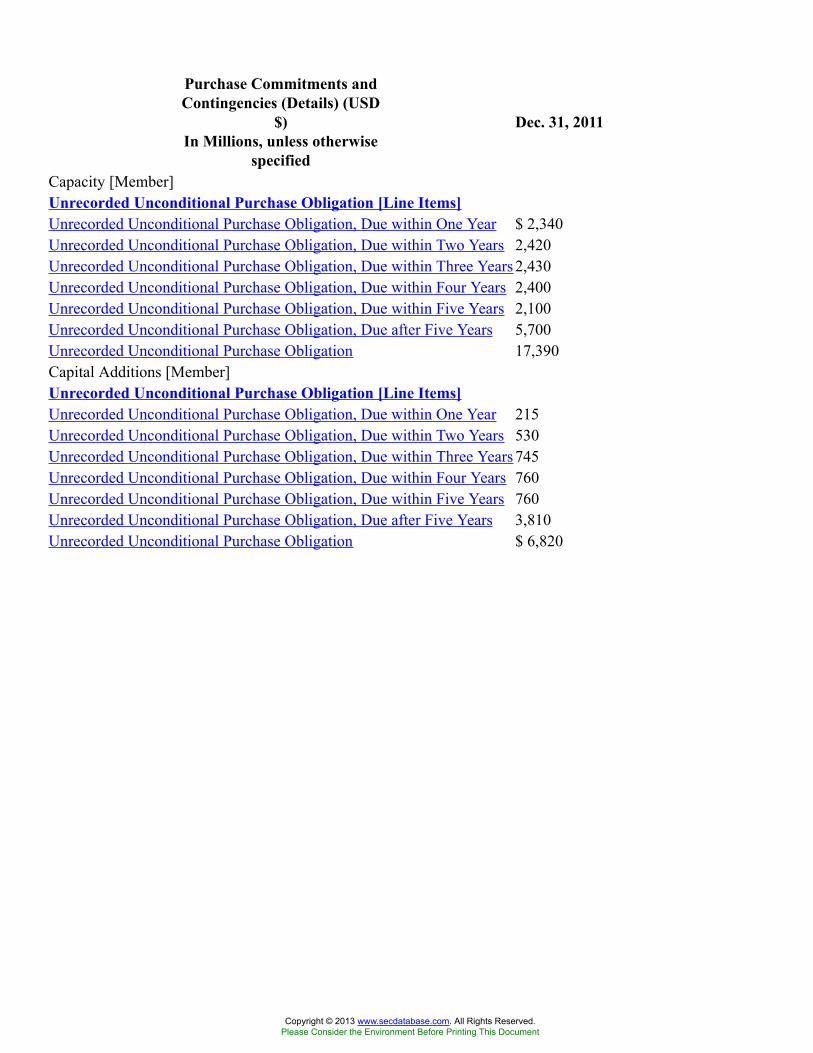
Purchase Commitments andContingencies (Details) (USD
$)In Millions, unless otherwise
specified
Dec. 31, 2011
Capacity [Member]Unrecorded Unconditional Purchase Obligation [Line Items]Unrecorded Unconditional Purchase Obligation, Due within One Year $ 2,340Unrecorded Unconditional Purchase Obligation, Due within Two Years 2,420Unrecorded Unconditional Purchase Obligation, Due within Three Years 2,430Unrecorded Unconditional Purchase Obligation, Due within Four Years 2,400Unrecorded Unconditional Purchase Obligation, Due within Five Years 2,100Unrecorded Unconditional Purchase Obligation, Due after Five Years 5,700Unrecorded Unconditional Purchase Obligation 17,390Capital Additions [Member]Unrecorded Unconditional Purchase Obligation [Line Items]Unrecorded Unconditional Purchase Obligation, Due within One Year 215Unrecorded Unconditional Purchase Obligation, Due within Two Years 530Unrecorded Unconditional Purchase Obligation, Due within Three Years 745Unrecorded Unconditional Purchase Obligation, Due within Four Years 760Unrecorded Unconditional Purchase Obligation, Due within Five Years 760Unrecorded Unconditional Purchase Obligation, Due after Five Years 3,810Unrecorded Unconditional Purchase Obligation $ 6,820
Copyright © 2013 www.secdatabase.com. All Rights Reserved.Please Consider the Environment Before Printing This Document
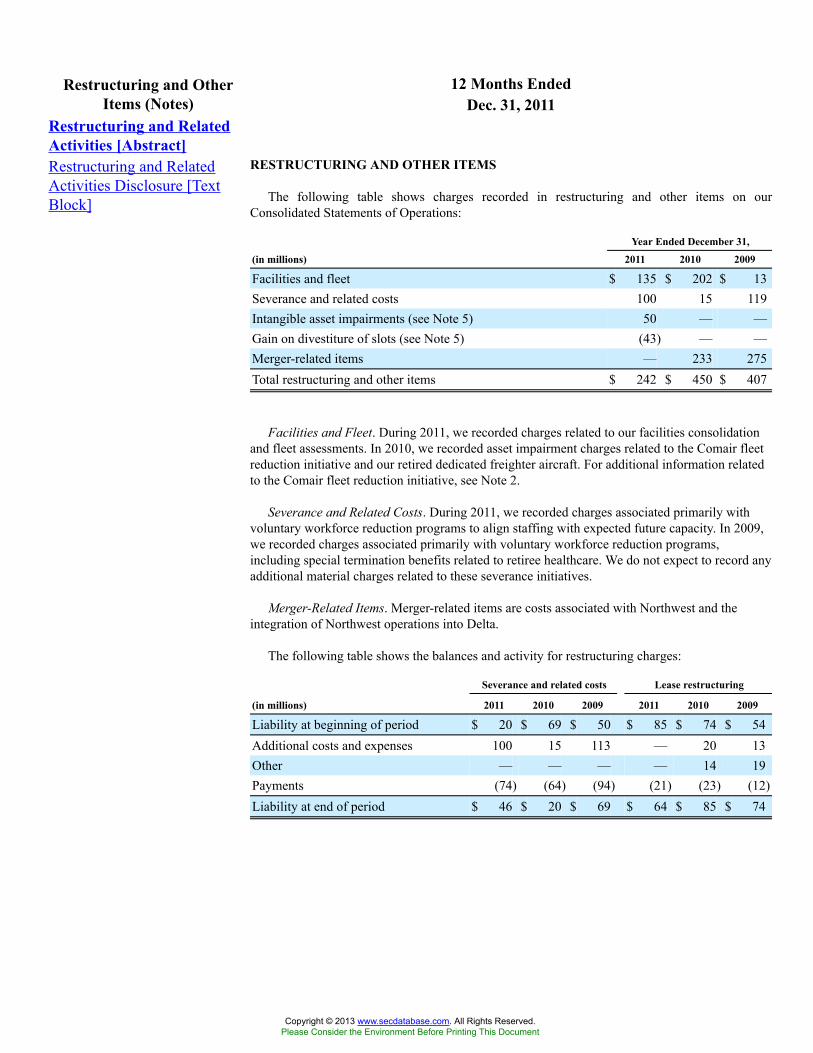
12 Months EndedRestructuring and OtherItems (Notes) Dec. 31, 2011
Restructuring and RelatedActivities [Abstract]Restructuring and RelatedActivities Disclosure [TextBlock]
RESTRUCTURING AND OTHER ITEMS
The following table shows charges recorded in restructuring and other items on ourConsolidated Statements of Operations:
Year Ended December 31,
(in millions) 2011 2010 2009
Facilities and fleet $ 135 $ 202 $ 13Severance and related costs 100 15 119Intangible asset impairments (see Note 5) 50 — —Gain on divestiture of slots (see Note 5) (43) — —Merger-related items — 233 275Total restructuring and other items $ 242 $ 450 $ 407
Facilities and Fleet. During 2011, we recorded charges related to our facilities consolidationand fleet assessments. In 2010, we recorded asset impairment charges related to the Comair fleetreduction initiative and our retired dedicated freighter aircraft. For additional information relatedto the Comair fleet reduction initiative, see Note 2.
Severance and Related Costs. During 2011, we recorded charges associated primarily withvoluntary workforce reduction programs to align staffing with expected future capacity. In 2009,we recorded charges associated primarily with voluntary workforce reduction programs,including special termination benefits related to retiree healthcare. We do not expect to record anyadditional material charges related to these severance initiatives.
Merger-Related Items. Merger-related items are costs associated with Northwest and theintegration of Northwest operations into Delta.
The following table shows the balances and activity for restructuring charges:
Severance and related costs Lease restructuring
(in millions) 2011 2010 2009 2011 2010 2009
Liability at beginning of period $ 20 $ 69 $ 50 $ 85 $ 74 $ 54Additional costs and expenses 100 15 113 — 20 13Other — — — — 14 19Payments (74) (64) (94) (21) (23) (12)Liability at end of period $ 46 $ 20 $ 69 $ 64 $ 85 $ 74
Copyright © 2013 www.secdatabase.com. All Rights Reserved.Please Consider the Environment Before Printing This Document
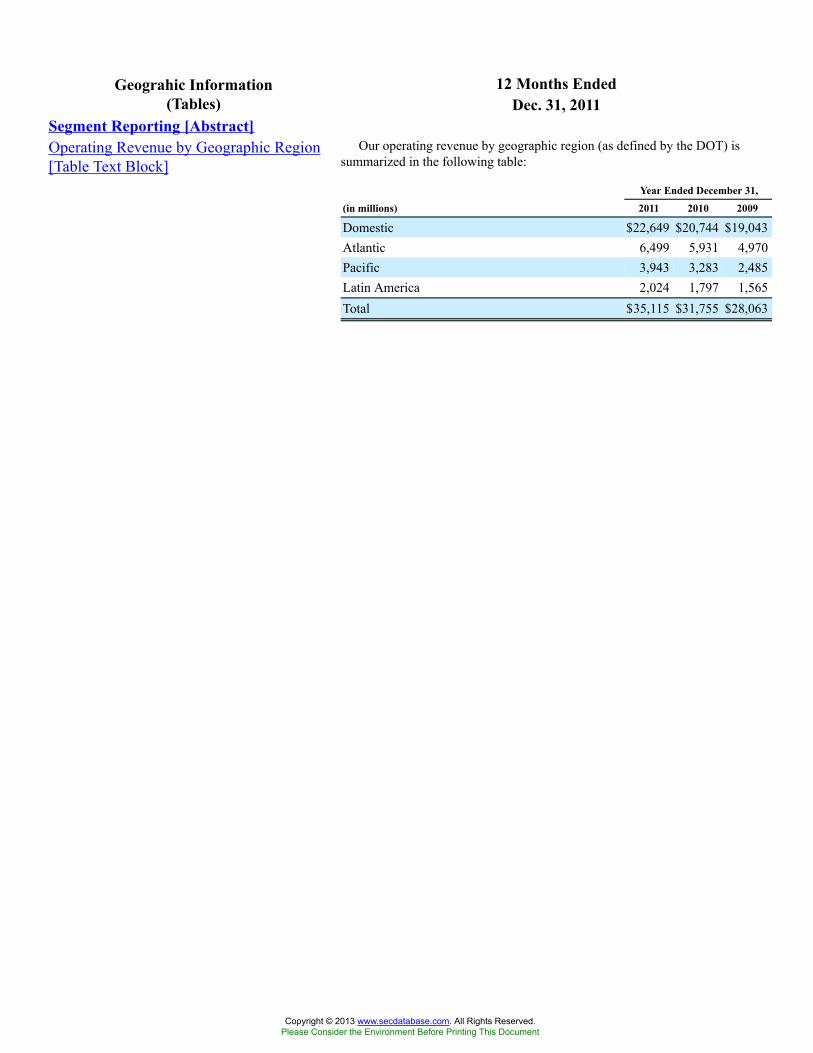
12 Months EndedGeograhic Information(Tables) Dec. 31, 2011
Segment Reporting [Abstract]Operating Revenue by Geographic Region[Table Text Block]
Our operating revenue by geographic region (as defined by the DOT) issummarized in the following table:
Year Ended December 31,
(in millions) 2011 2010 2009
Domestic $22,649 $20,744 $19,043Atlantic 6,499 5,931 4,970Pacific 3,943 3,283 2,485Latin America 2,024 1,797 1,565Total $35,115 $31,755 $28,063
Copyright © 2013 www.secdatabase.com. All Rights Reserved.Please Consider the Environment Before Printing This Document
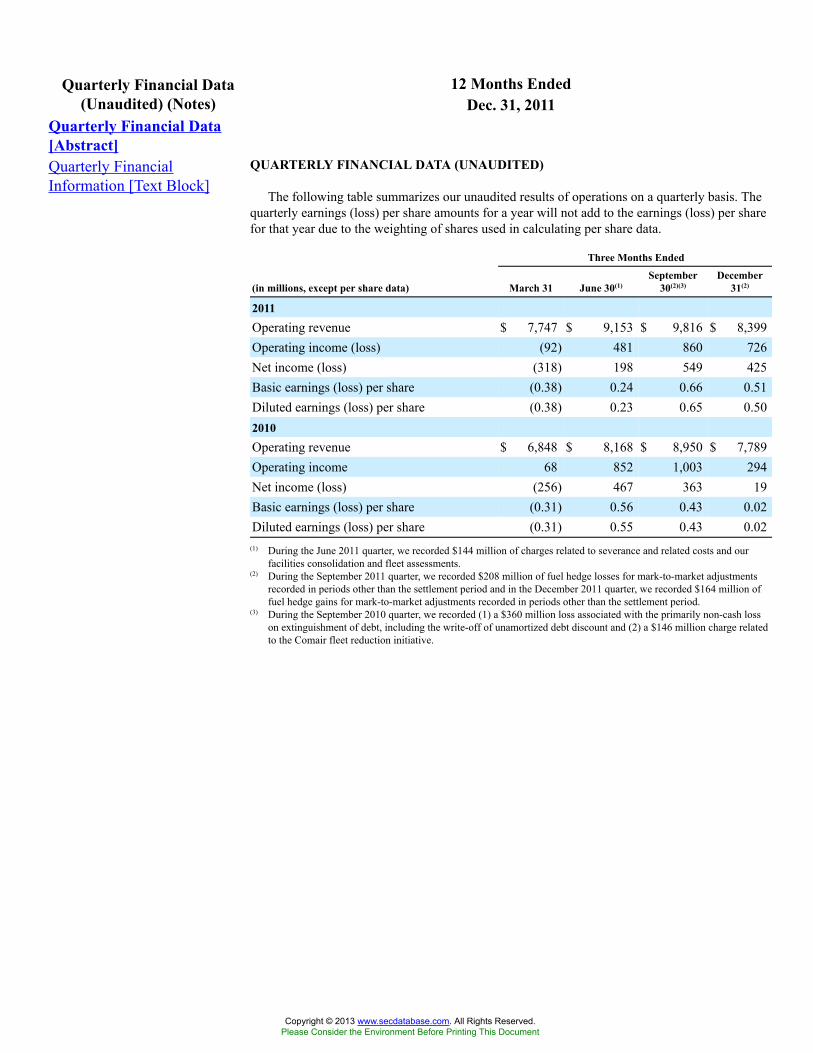
12 Months EndedQuarterly Financial Data(Unaudited) (Notes) Dec. 31, 2011
Quarterly Financial Data[Abstract]Quarterly FinancialInformation [Text Block]
QUARTERLY FINANCIAL DATA (UNAUDITED)
The following table summarizes our unaudited results of operations on a quarterly basis. Thequarterly earnings (loss) per share amounts for a year will not add to the earnings (loss) per sharefor that year due to the weighting of shares used in calculating per share data.
Three Months Ended
(in millions, except per share data) March 31 June 30(1)September
30(2)(3)December
31(2)
2011Operating revenue $ 7,747 $ 9,153 $ 9,816 $ 8,399Operating income (loss) (92) 481 860 726Net income (loss) (318) 198 549 425Basic earnings (loss) per share (0.38) 0.24 0.66 0.51Diluted earnings (loss) per share (0.38) 0.23 0.65 0.502010Operating revenue $ 6,848 $ 8,168 $ 8,950 $ 7,789Operating income 68 852 1,003 294Net income (loss) (256) 467 363 19Basic earnings (loss) per share (0.31) 0.56 0.43 0.02Diluted earnings (loss) per share (0.31) 0.55 0.43 0.02
(1) During the June 2011 quarter, we recorded $144 million of charges related to severance and related costs and ourfacilities consolidation and fleet assessments.
(2) During the September 2011 quarter, we recorded $208 million of fuel hedge losses for mark-to-market adjustmentsrecorded in periods other than the settlement period and in the December 2011 quarter, we recorded $164 million offuel hedge gains for mark-to-market adjustments recorded in periods other than the settlement period.
(3) During the September 2010 quarter, we recorded (1) a $360 million loss associated with the primarily non-cash losson extinguishment of debt, including the write-off of unamortized debt discount and (2) a $146 million charge relatedto the Comair fleet reduction initiative.
Copyright © 2013 www.secdatabase.com. All Rights Reserved.Please Consider the Environment Before Printing This Document
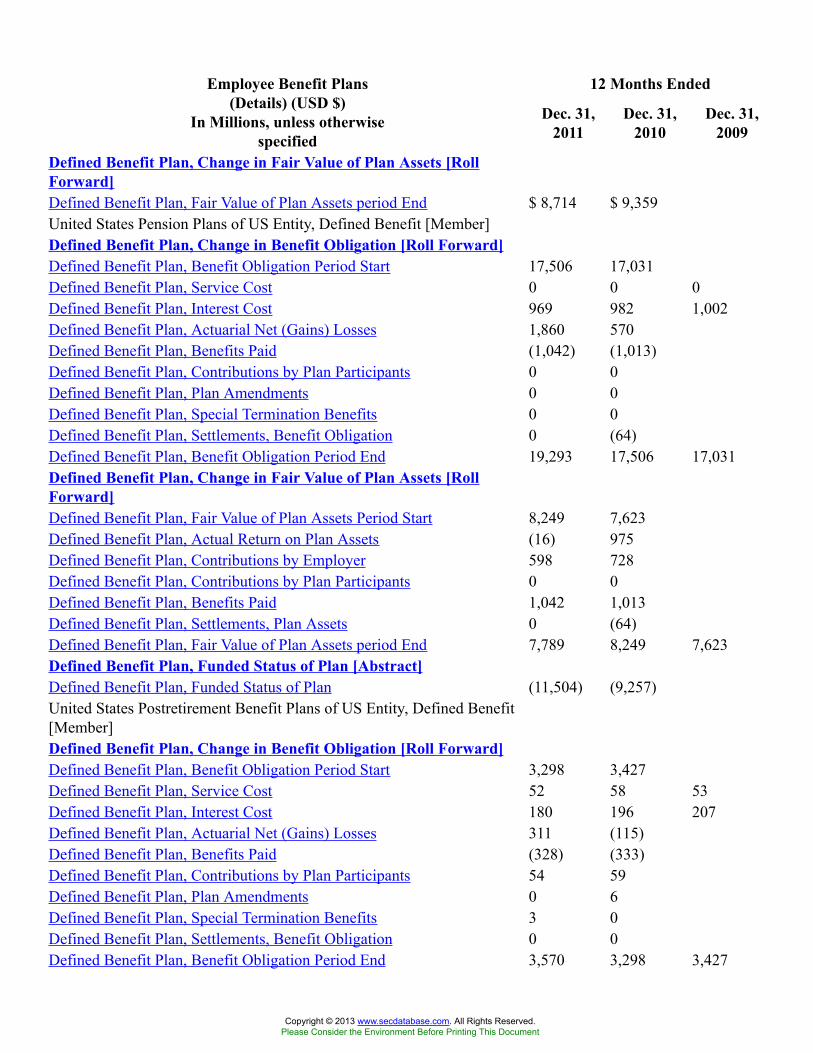
12 Months EndedEmployee Benefit Plans(Details) (USD $)
In Millions, unless otherwisespecified
Dec. 31,2011
Dec. 31,2010
Dec. 31,2009
Defined Benefit Plan, Change in Fair Value of Plan Assets [RollForward]Defined Benefit Plan, Fair Value of Plan Assets period End $ 8,714 $ 9,359United States Pension Plans of US Entity, Defined Benefit [Member]Defined Benefit Plan, Change in Benefit Obligation [Roll Forward]Defined Benefit Plan, Benefit Obligation Period Start 17,506 17,031Defined Benefit Plan, Service Cost 0 0 0Defined Benefit Plan, Interest Cost 969 982 1,002Defined Benefit Plan, Actuarial Net (Gains) Losses 1,860 570Defined Benefit Plan, Benefits Paid (1,042) (1,013)Defined Benefit Plan, Contributions by Plan Participants 0 0Defined Benefit Plan, Plan Amendments 0 0Defined Benefit Plan, Special Termination Benefits 0 0Defined Benefit Plan, Settlements, Benefit Obligation 0 (64)Defined Benefit Plan, Benefit Obligation Period End 19,293 17,506 17,031Defined Benefit Plan, Change in Fair Value of Plan Assets [RollForward]Defined Benefit Plan, Fair Value of Plan Assets Period Start 8,249 7,623Defined Benefit Plan, Actual Return on Plan Assets (16) 975Defined Benefit Plan, Contributions by Employer 598 728Defined Benefit Plan, Contributions by Plan Participants 0 0Defined Benefit Plan, Benefits Paid 1,042 1,013Defined Benefit Plan, Settlements, Plan Assets 0 (64)Defined Benefit Plan, Fair Value of Plan Assets period End 7,789 8,249 7,623Defined Benefit Plan, Funded Status of Plan [Abstract]Defined Benefit Plan, Funded Status of Plan (11,504) (9,257)United States Postretirement Benefit Plans of US Entity, Defined Benefit[Member]Defined Benefit Plan, Change in Benefit Obligation [Roll Forward]Defined Benefit Plan, Benefit Obligation Period Start 3,298 3,427Defined Benefit Plan, Service Cost 52 58 53Defined Benefit Plan, Interest Cost 180 196 207Defined Benefit Plan, Actuarial Net (Gains) Losses 311 (115)Defined Benefit Plan, Benefits Paid (328) (333)Defined Benefit Plan, Contributions by Plan Participants 54 59Defined Benefit Plan, Plan Amendments 0 6Defined Benefit Plan, Special Termination Benefits 3 0Defined Benefit Plan, Settlements, Benefit Obligation 0 0Defined Benefit Plan, Benefit Obligation Period End 3,570 3,298 3,427
Copyright © 2013 www.secdatabase.com. All Rights Reserved.Please Consider the Environment Before Printing This Document
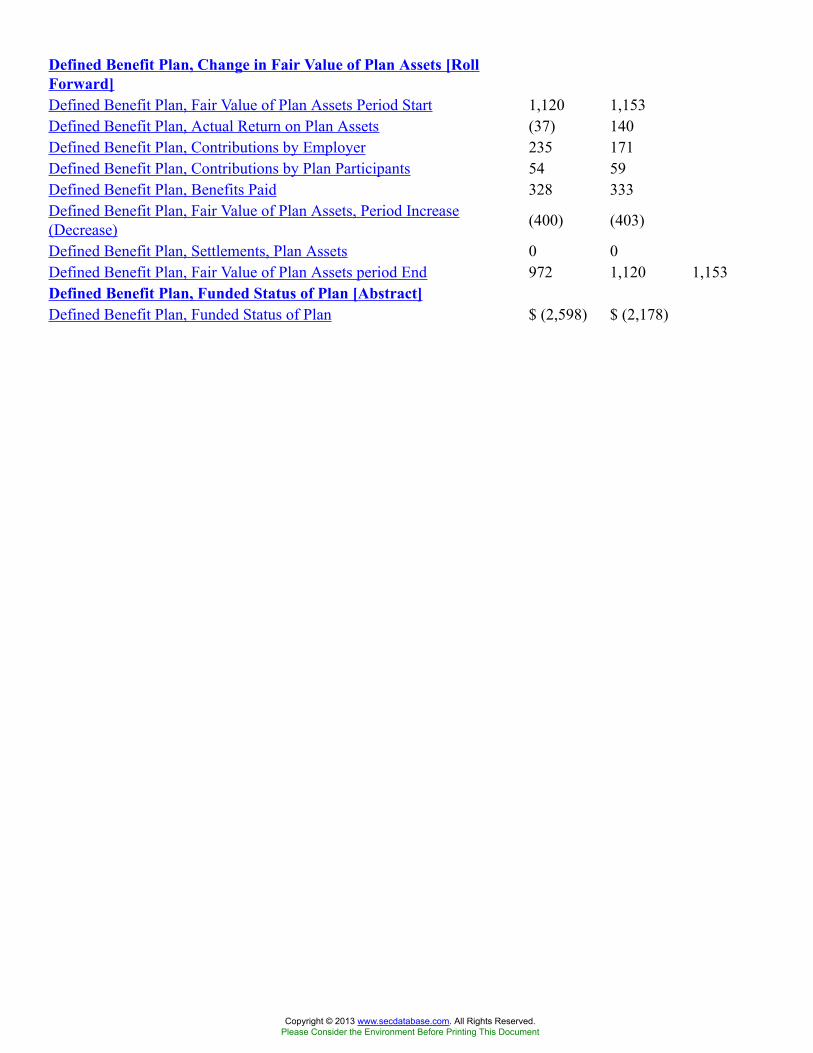
Defined Benefit Plan, Change in Fair Value of Plan Assets [RollForward]Defined Benefit Plan, Fair Value of Plan Assets Period Start 1,120 1,153Defined Benefit Plan, Actual Return on Plan Assets (37) 140Defined Benefit Plan, Contributions by Employer 235 171Defined Benefit Plan, Contributions by Plan Participants 54 59Defined Benefit Plan, Benefits Paid 328 333Defined Benefit Plan, Fair Value of Plan Assets, Period Increase(Decrease) (400) (403)
Defined Benefit Plan, Settlements, Plan Assets 0 0Defined Benefit Plan, Fair Value of Plan Assets period End 972 1,120 1,153Defined Benefit Plan, Funded Status of Plan [Abstract]Defined Benefit Plan, Funded Status of Plan $ (2,598) $ (2,178)
Copyright © 2013 www.secdatabase.com. All Rights Reserved.Please Consider the Environment Before Printing This Document
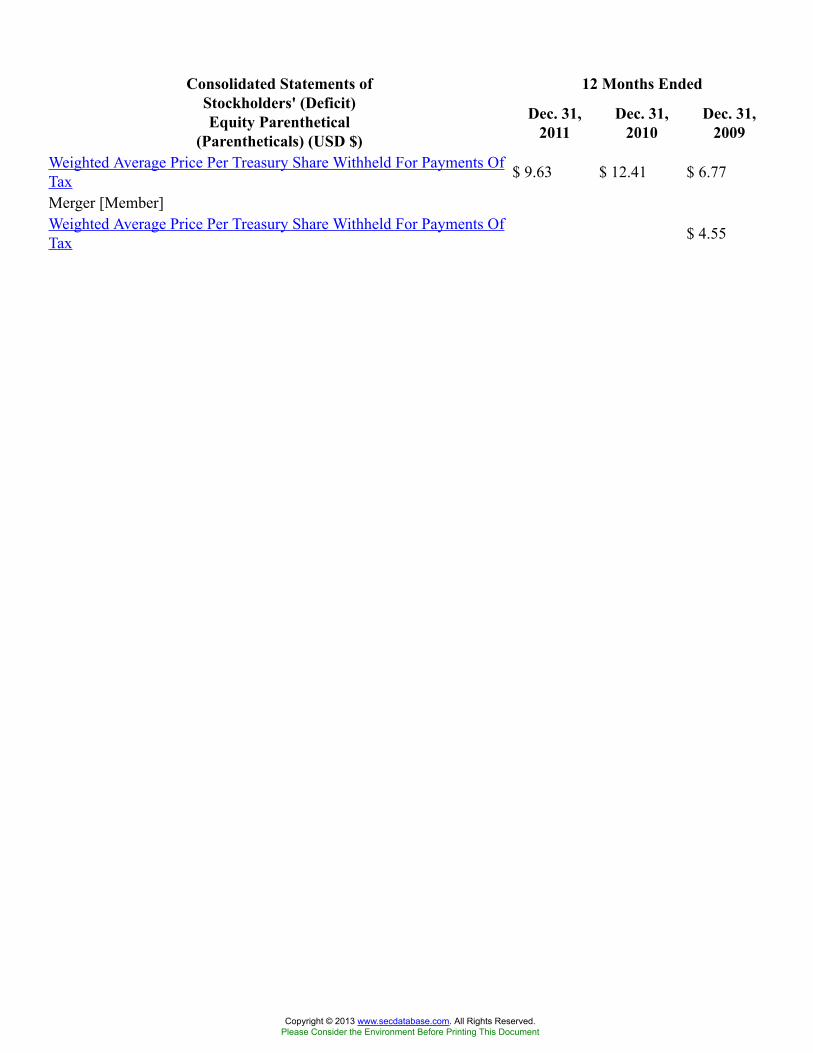
12 Months EndedConsolidated Statements ofStockholders' (Deficit)Equity Parenthetical
(Parentheticals) (USD $)
Dec. 31,2011
Dec. 31,2010
Dec. 31,2009
Weighted Average Price Per Treasury Share Withheld For Payments OfTax $ 9.63 $ 12.41 $ 6.77
Merger [Member]Weighted Average Price Per Treasury Share Withheld For Payments OfTax $ 4.55
Copyright © 2013 www.secdatabase.com. All Rights Reserved.Please Consider the Environment Before Printing This Document
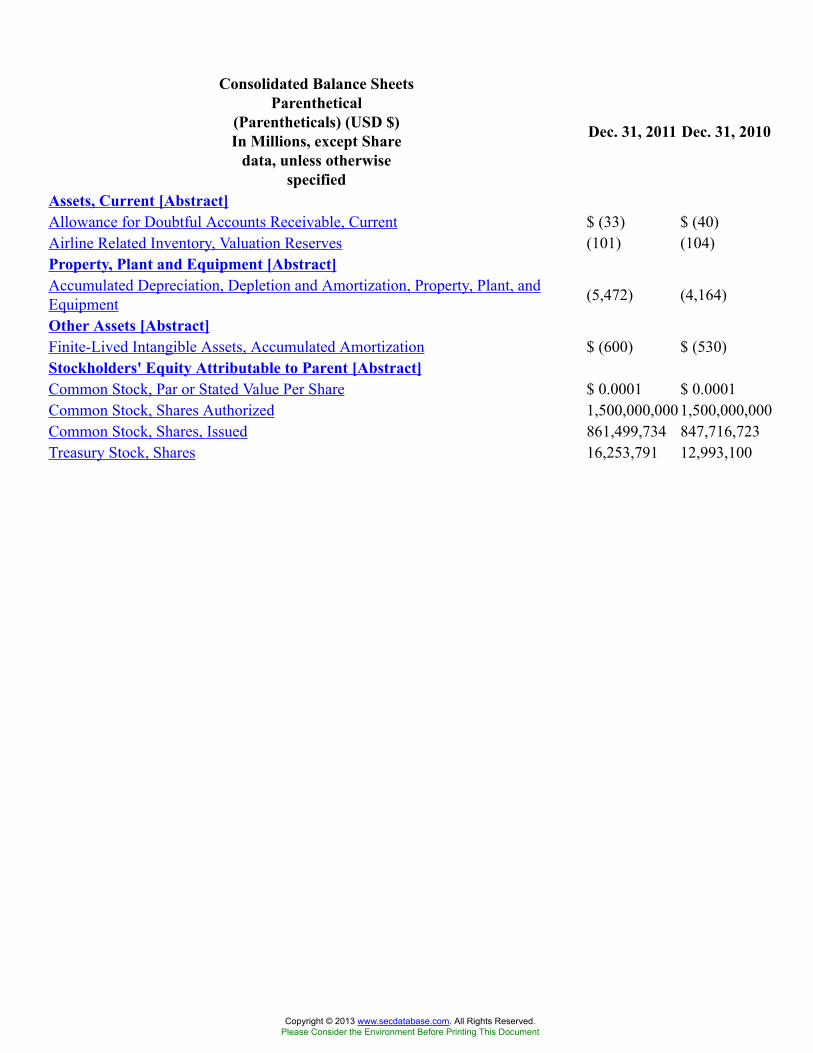
Consolidated Balance SheetsParenthetical
(Parentheticals) (USD $)In Millions, except Share
data, unless otherwisespecified
Dec. 31, 2011 Dec. 31, 2010
Assets, Current [Abstract]Allowance for Doubtful Accounts Receivable, Current $ (33) $ (40)Airline Related Inventory, Valuation Reserves (101) (104)Property, Plant and Equipment [Abstract]Accumulated Depreciation, Depletion and Amortization, Property, Plant, andEquipment (5,472) (4,164)
Other Assets [Abstract]Finite-Lived Intangible Assets, Accumulated Amortization $ (600) $ (530)Stockholders' Equity Attributable to Parent [Abstract]Common Stock, Par or Stated Value Per Share $ 0.0001 $ 0.0001Common Stock, Shares Authorized 1,500,000,0001,500,000,000Common Stock, Shares, Issued 861,499,734 847,716,723Treasury Stock, Shares 16,253,791 12,993,100
Copyright © 2013 www.secdatabase.com. All Rights Reserved.Please Consider the Environment Before Printing This Document
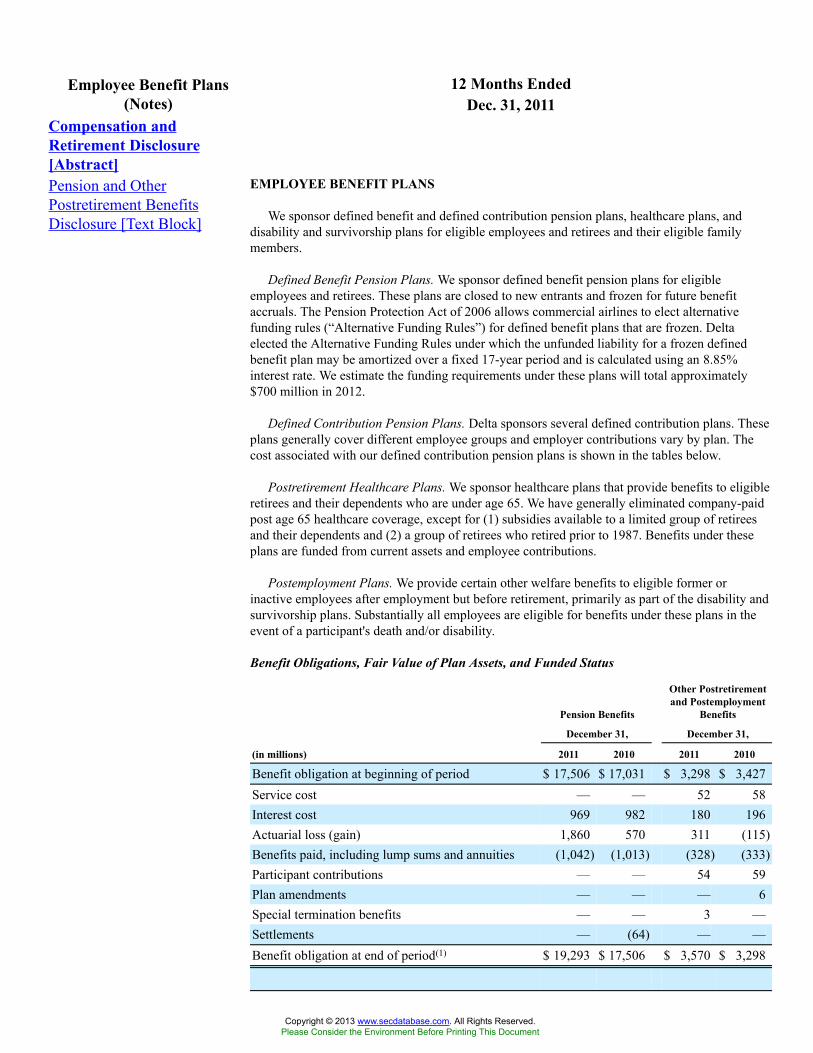
12 Months EndedEmployee Benefit Plans(Notes) Dec. 31, 2011
Compensation andRetirement Disclosure[Abstract]Pension and OtherPostretirement BenefitsDisclosure [Text Block]
EMPLOYEE BENEFIT PLANS
We sponsor defined benefit and defined contribution pension plans, healthcare plans, anddisability and survivorship plans for eligible employees and retirees and their eligible familymembers.
Defined Benefit Pension Plans. We sponsor defined benefit pension plans for eligibleemployees and retirees. These plans are closed to new entrants and frozen for future benefitaccruals. The Pension Protection Act of 2006 allows commercial airlines to elect alternativefunding rules (“Alternative Funding Rules”) for defined benefit plans that are frozen. Deltaelected the Alternative Funding Rules under which the unfunded liability for a frozen definedbenefit plan may be amortized over a fixed 17-year period and is calculated using an 8.85%interest rate. We estimate the funding requirements under these plans will total approximately$700 million in 2012.
Defined Contribution Pension Plans. Delta sponsors several defined contribution plans. Theseplans generally cover different employee groups and employer contributions vary by plan. Thecost associated with our defined contribution pension plans is shown in the tables below.
Postretirement Healthcare Plans. We sponsor healthcare plans that provide benefits to eligibleretirees and their dependents who are under age 65. We have generally eliminated company-paidpost age 65 healthcare coverage, except for (1) subsidies available to a limited group of retireesand their dependents and (2) a group of retirees who retired prior to 1987. Benefits under theseplans are funded from current assets and employee contributions.
Postemployment Plans. We provide certain other welfare benefits to eligible former orinactive employees after employment but before retirement, primarily as part of the disability andsurvivorship plans. Substantially all employees are eligible for benefits under these plans in theevent of a participant's death and/or disability.
Benefit Obligations, Fair Value of Plan Assets, and Funded Status
Pension Benefits
Other Postretirementand Postemployment
Benefits
December 31, December 31,
(in millions) 2011 2010 2011 2010
Benefit obligation at beginning of period $ 17,506 $ 17,031 $ 3,298 $ 3,427Service cost — — 52 58Interest cost 969 982 180 196Actuarial loss (gain) 1,860 570 311 (115)Benefits paid, including lump sums and annuities (1,042) (1,013) (328) (333)Participant contributions — — 54 59Plan amendments — — — 6Special termination benefits — — 3 —Settlements — (64) — —Benefit obligation at end of period(1) $ 19,293 $ 17,506 $ 3,570 $ 3,298
Copyright © 2013 www.secdatabase.com. All Rights Reserved.Please Consider the Environment Before Printing This Document
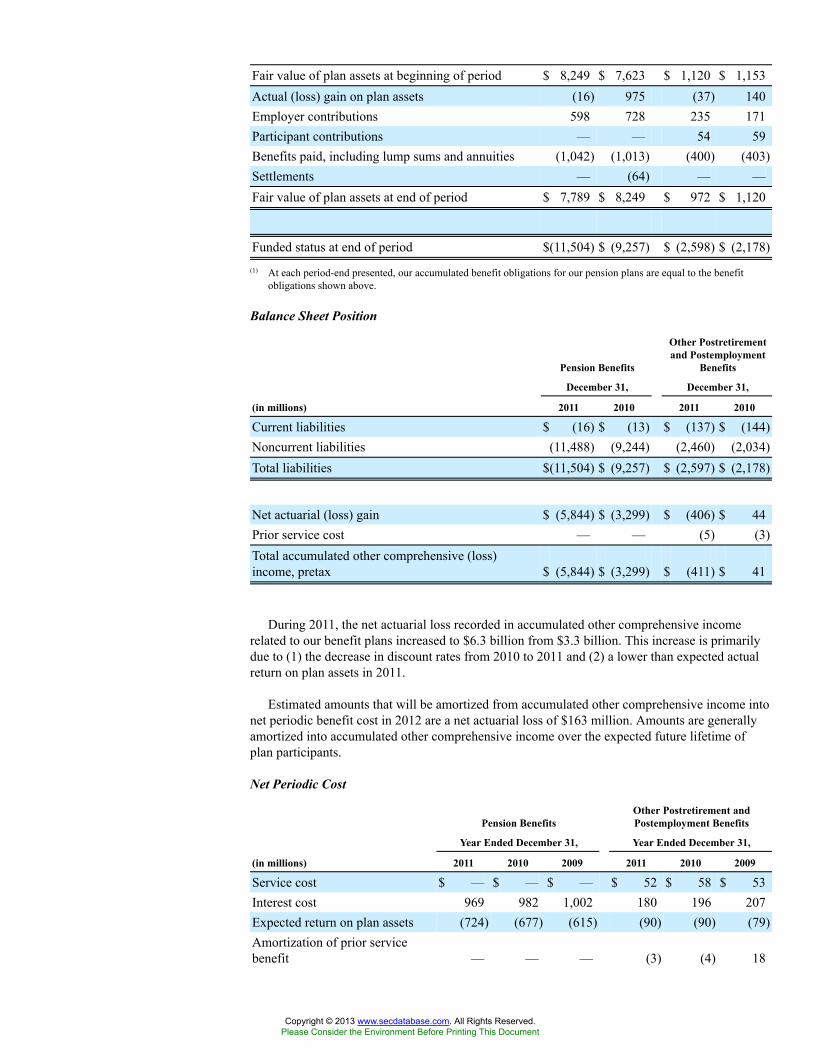
Fair value of plan assets at beginning of period $ 8,249 $ 7,623 $ 1,120 $ 1,153Actual (loss) gain on plan assets (16) 975 (37) 140Employer contributions 598 728 235 171Participant contributions — — 54 59Benefits paid, including lump sums and annuities (1,042) (1,013) (400) (403)Settlements — (64) — —Fair value of plan assets at end of period $ 7,789 $ 8,249 $ 972 $ 1,120
Funded status at end of period $(11,504) $ (9,257) $ (2,598) $ (2,178)(1) At each period-end presented, our accumulated benefit obligations for our pension plans are equal to the benefit
obligations shown above.
Balance Sheet Position
Pension Benefits
Other Postretirementand Postemployment
Benefits
December 31, December 31,
(in millions) 2011 2010 2011 2010
Current liabilities $ (16) $ (13) $ (137) $ (144)Noncurrent liabilities (11,488) (9,244) (2,460) (2,034)Total liabilities $(11,504) $ (9,257) $ (2,597) $ (2,178)
Net actuarial (loss) gain $ (5,844) $ (3,299) $ (406) $ 44Prior service cost — — (5) (3)Total accumulated other comprehensive (loss)income, pretax $ (5,844) $ (3,299) $ (411) $ 41
During 2011, the net actuarial loss recorded in accumulated other comprehensive incomerelated to our benefit plans increased to $6.3 billion from $3.3 billion. This increase is primarilydue to (1) the decrease in discount rates from 2010 to 2011 and (2) a lower than expected actualreturn on plan assets in 2011.
Estimated amounts that will be amortized from accumulated other comprehensive income intonet periodic benefit cost in 2012 are a net actuarial loss of $163 million. Amounts are generallyamortized into accumulated other comprehensive income over the expected future lifetime ofplan participants.
Net Periodic Cost
Pension BenefitsOther Postretirement andPostemployment Benefits
Year Ended December 31, Year Ended December 31,
(in millions) 2011 2010 2009 2011 2010 2009
Service cost $ — $ — $ — $ 52 $ 58 $ 53Interest cost 969 982 1,002 180 196 207Expected return on plan assets (724) (677) (615) (90) (90) (79)Amortization of prior servicebenefit — — — (3) (4) 18
Copyright © 2013 www.secdatabase.com. All Rights Reserved.Please Consider the Environment Before Printing This Document
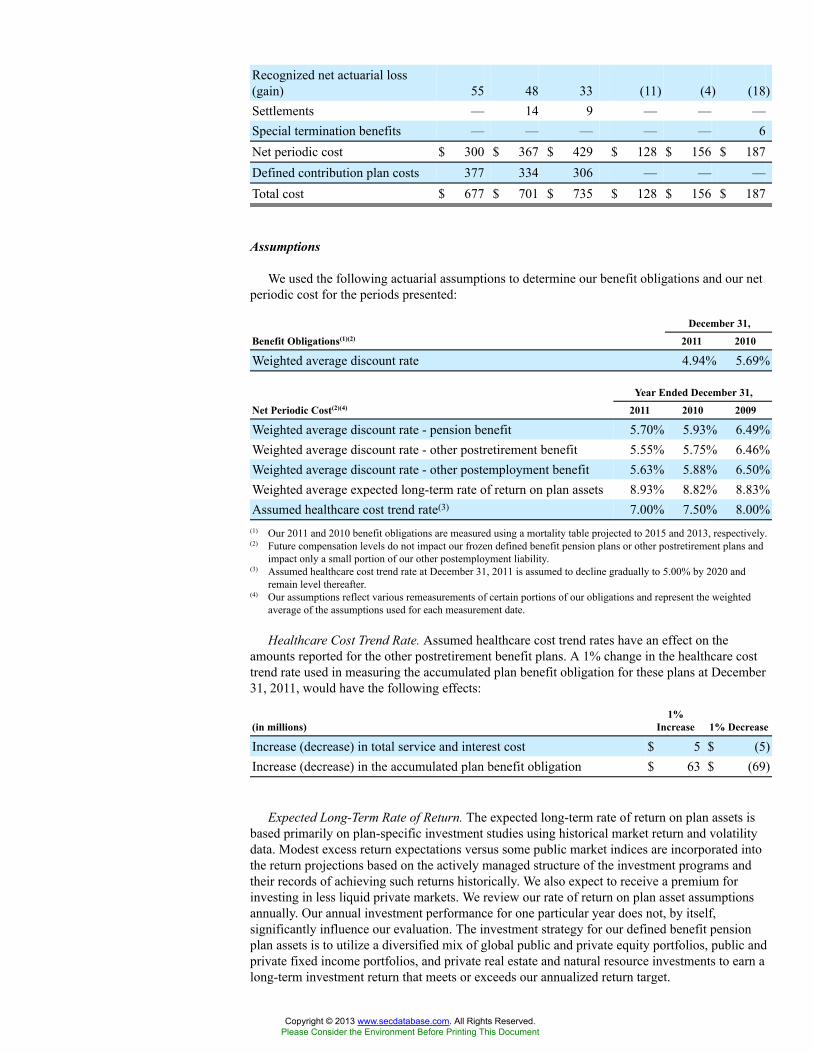
Recognized net actuarial loss(gain) 55 48 33 (11) (4) (18)Settlements — 14 9 — — —Special termination benefits — — — — — 6Net periodic cost $ 300 $ 367 $ 429 $ 128 $ 156 $ 187Defined contribution plan costs 377 334 306 — — —Total cost $ 677 $ 701 $ 735 $ 128 $ 156 $ 187
Assumptions
We used the following actuarial assumptions to determine our benefit obligations and our netperiodic cost for the periods presented:
December 31,
Benefit Obligations(1)(2) 2011 2010
Weighted average discount rate 4.94% 5.69%
Year Ended December 31,
Net Periodic Cost(2)(4) 2011 2010 2009
Weighted average discount rate - pension benefit 5.70% 5.93% 6.49%Weighted average discount rate - other postretirement benefit 5.55% 5.75% 6.46%Weighted average discount rate - other postemployment benefit 5.63% 5.88% 6.50%Weighted average expected long-term rate of return on plan assets 8.93% 8.82% 8.83%Assumed healthcare cost trend rate(3) 7.00% 7.50% 8.00%
(1) Our 2011 and 2010 benefit obligations are measured using a mortality table projected to 2015 and 2013, respectively.(2) Future compensation levels do not impact our frozen defined benefit pension plans or other postretirement plans and
impact only a small portion of our other postemployment liability.(3) Assumed healthcare cost trend rate at December 31, 2011 is assumed to decline gradually to 5.00% by 2020 and
remain level thereafter.(4) Our assumptions reflect various remeasurements of certain portions of our obligations and represent the weighted
average of the assumptions used for each measurement date.
Healthcare Cost Trend Rate. Assumed healthcare cost trend rates have an effect on theamounts reported for the other postretirement benefit plans. A 1% change in the healthcare costtrend rate used in measuring the accumulated plan benefit obligation for these plans at December31, 2011, would have the following effects:
(in millions)1%
Increase 1% Decrease
Increase (decrease) in total service and interest cost $ 5 $ (5)Increase (decrease) in the accumulated plan benefit obligation $ 63 $ (69)
Expected Long-Term Rate of Return. The expected long-term rate of return on plan assets isbased primarily on plan-specific investment studies using historical market return and volatilitydata. Modest excess return expectations versus some public market indices are incorporated intothe return projections based on the actively managed structure of the investment programs andtheir records of achieving such returns historically. We also expect to receive a premium forinvesting in less liquid private markets. We review our rate of return on plan asset assumptionsannually. Our annual investment performance for one particular year does not, by itself,significantly influence our evaluation. The investment strategy for our defined benefit pensionplan assets is to utilize a diversified mix of global public and private equity portfolios, public andprivate fixed income portfolios, and private real estate and natural resource investments to earn along-term investment return that meets or exceeds our annualized return target.
Copyright © 2013 www.secdatabase.com. All Rights Reserved.Please Consider the Environment Before Printing This Document
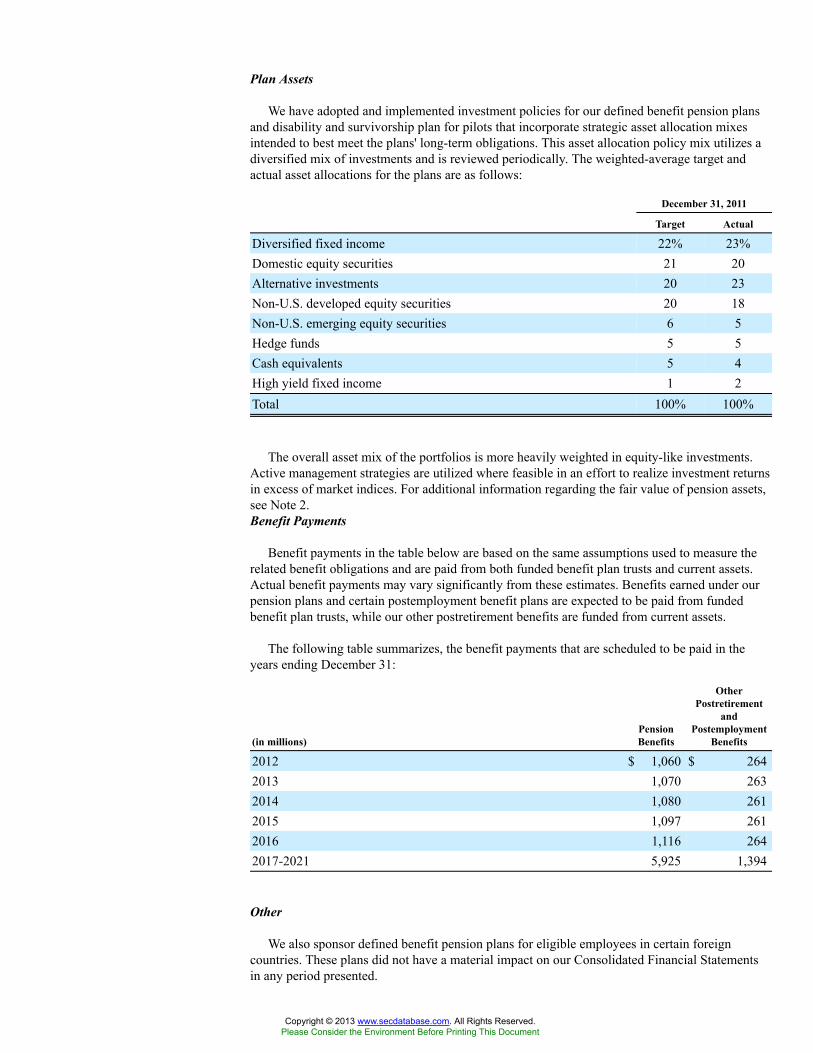
Plan Assets
We have adopted and implemented investment policies for our defined benefit pension plansand disability and survivorship plan for pilots that incorporate strategic asset allocation mixesintended to best meet the plans' long-term obligations. This asset allocation policy mix utilizes adiversified mix of investments and is reviewed periodically. The weighted-average target andactual asset allocations for the plans are as follows:
December 31, 2011
Target Actual
Diversified fixed income 22% 23%Domestic equity securities 21 20Alternative investments 20 23Non-U.S. developed equity securities 20 18Non-U.S. emerging equity securities 6 5Hedge funds 5 5Cash equivalents 5 4High yield fixed income 1 2Total 100% 100%
The overall asset mix of the portfolios is more heavily weighted in equity-like investments.Active management strategies are utilized where feasible in an effort to realize investment returnsin excess of market indices. For additional information regarding the fair value of pension assets,see Note 2.Benefit Payments
Benefit payments in the table below are based on the same assumptions used to measure therelated benefit obligations and are paid from both funded benefit plan trusts and current assets.Actual benefit payments may vary significantly from these estimates. Benefits earned under ourpension plans and certain postemployment benefit plans are expected to be paid from fundedbenefit plan trusts, while our other postretirement benefits are funded from current assets.
The following table summarizes, the benefit payments that are scheduled to be paid in theyears ending December 31:
(in millions)PensionBenefits
OtherPostretirement
andPostemployment
Benefits
2012 $ 1,060 $ 2642013 1,070 2632014 1,080 2612015 1,097 2612016 1,116 2642017-2021 5,925 1,394
Other
We also sponsor defined benefit pension plans for eligible employees in certain foreigncountries. These plans did not have a material impact on our Consolidated Financial Statementsin any period presented.
Copyright © 2013 www.secdatabase.com. All Rights Reserved.Please Consider the Environment Before Printing This Document

Profit Sharing Program
Our broad based employee profit sharing program provides that, for each year in which wehave an annual pre-tax profit, as defined, we will pay a specified portion of that profit toemployees. Based on our pre-tax earnings for the years ended December 31, 2011 and 2010, weaccrued $264 million and $313 million under the profit sharing program, respectively. We did notrecord an accrual under the profit sharing program in 2009.
Copyright © 2013 www.secdatabase.com. All Rights Reserved.Please Consider the Environment Before Printing This Document
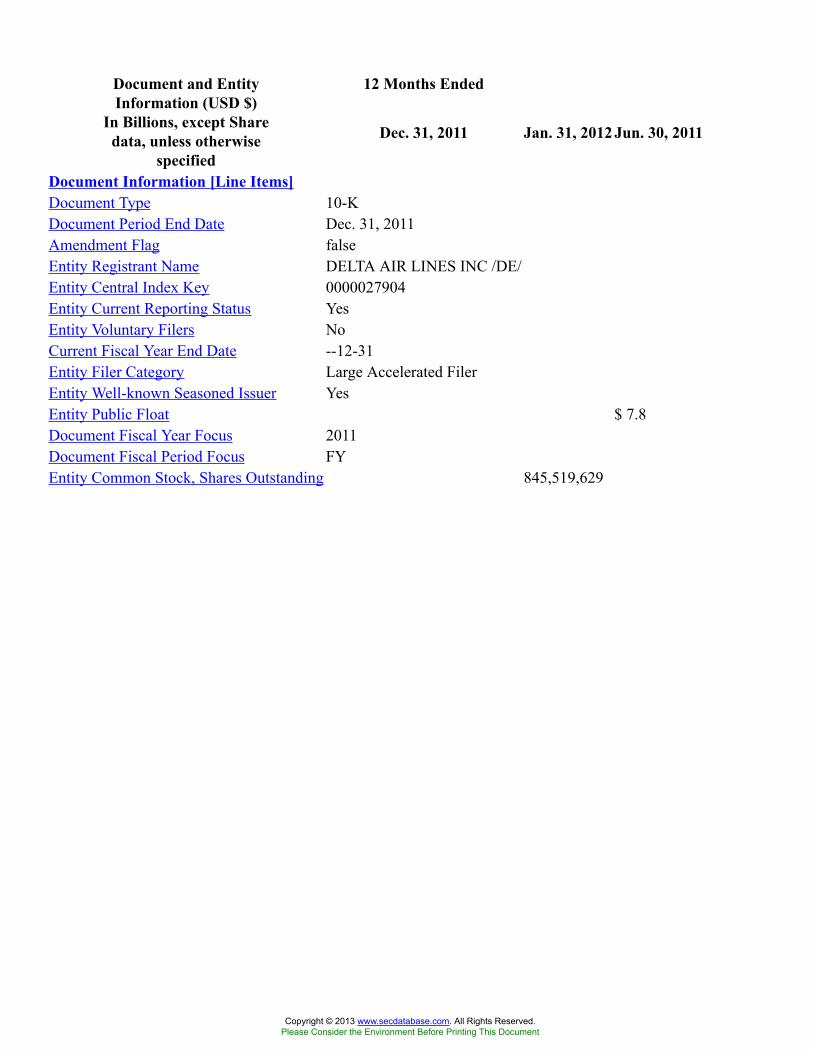
12 Months EndedDocument and EntityInformation (USD $)
In Billions, except Sharedata, unless otherwise
specified
Dec. 31, 2011 Jan. 31, 2012 Jun. 30, 2011
Document Information [Line Items]Document Type 10-KDocument Period End Date Dec. 31, 2011Amendment Flag falseEntity Registrant Name DELTA AIR LINES INC /DE/Entity Central Index Key 0000027904Entity Current Reporting Status YesEntity Voluntary Filers NoCurrent Fiscal Year End Date --12-31Entity Filer Category Large Accelerated FilerEntity Well-known Seasoned Issuer YesEntity Public Float $ 7.8Document Fiscal Year Focus 2011Document Fiscal Period Focus FYEntity Common Stock, Shares Outstanding 845,519,629
Copyright © 2013 www.secdatabase.com. All Rights Reserved.Please Consider the Environment Before Printing This Document
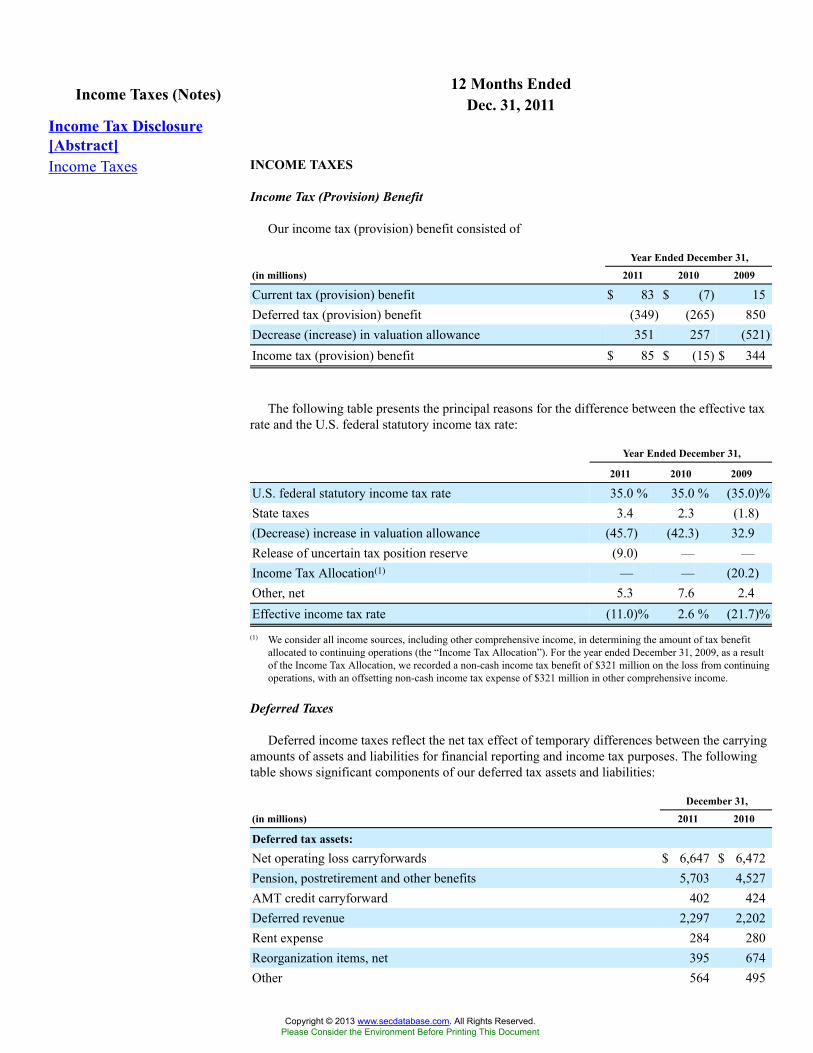
12 Months EndedIncome Taxes (Notes) Dec. 31, 2011Income Tax Disclosure[Abstract]Income Taxes INCOME TAXES
Income Tax (Provision) Benefit
Our income tax (provision) benefit consisted of
Year Ended December 31,
(in millions) 2011 2010 2009
Current tax (provision) benefit $ 83 $ (7) 15Deferred tax (provision) benefit (349) (265) 850Decrease (increase) in valuation allowance 351 257 (521)Income tax (provision) benefit $ 85 $ (15) $ 344
The following table presents the principal reasons for the difference between the effective taxrate and the U.S. federal statutory income tax rate:
Year Ended December 31,
2011 2010 2009
U.S. federal statutory income tax rate 35.0 % 35.0 % (35.0)%State taxes 3.4 2.3 (1.8)(Decrease) increase in valuation allowance (45.7) (42.3) 32.9Release of uncertain tax position reserve (9.0) — —Income Tax Allocation(1) — — (20.2)Other, net 5.3 7.6 2.4Effective income tax rate (11.0)% 2.6 % (21.7)%
(1) We consider all income sources, including other comprehensive income, in determining the amount of tax benefitallocated to continuing operations (the “Income Tax Allocation”). For the year ended December 31, 2009, as a resultof the Income Tax Allocation, we recorded a non-cash income tax benefit of $321 million on the loss from continuingoperations, with an offsetting non-cash income tax expense of $321 million in other comprehensive income.
Deferred Taxes
Deferred income taxes reflect the net tax effect of temporary differences between the carryingamounts of assets and liabilities for financial reporting and income tax purposes. The followingtable shows significant components of our deferred tax assets and liabilities:
December 31,
(in millions) 2011 2010
Deferred tax assets:Net operating loss carryforwards $ 6,647 $ 6,472Pension, postretirement and other benefits 5,703 4,527AMT credit carryforward 402 424Deferred revenue 2,297 2,202Rent expense 284 280Reorganization items, net 395 674Other 564 495
Copyright © 2013 www.secdatabase.com. All Rights Reserved.Please Consider the Environment Before Printing This Document
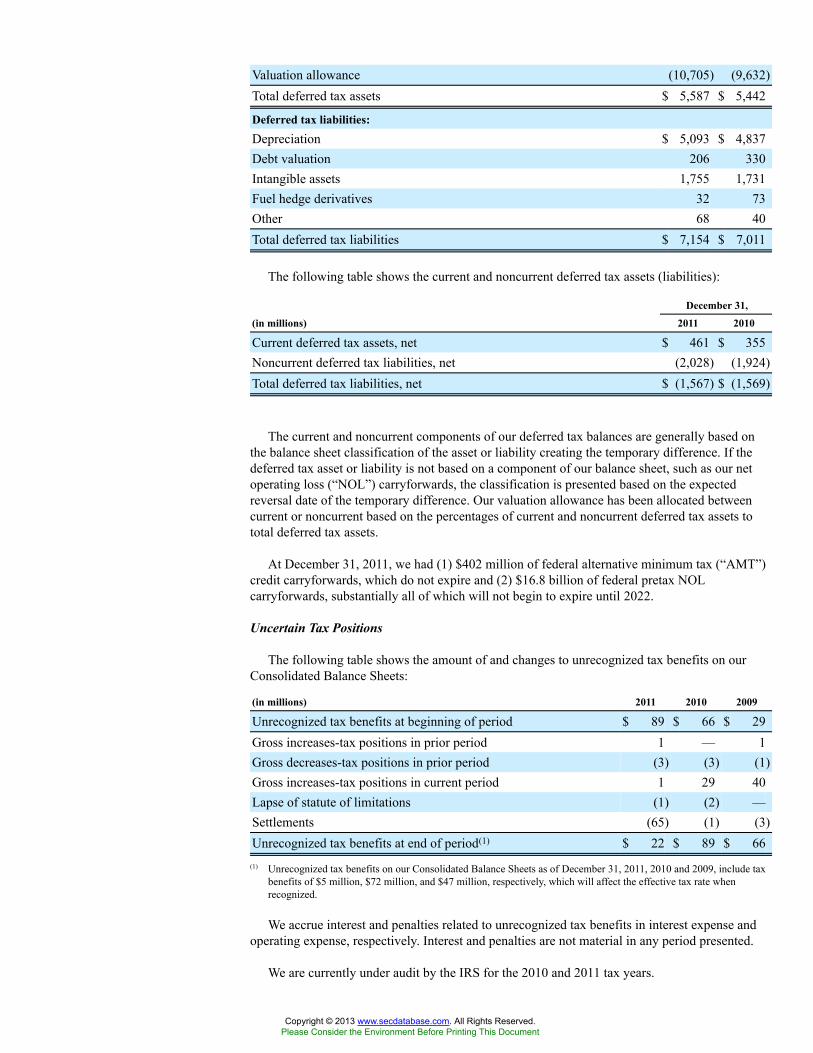
Valuation allowance (10,705) (9,632)Total deferred tax assets $ 5,587 $ 5,442
Deferred tax liabilities:Depreciation $ 5,093 $ 4,837Debt valuation 206 330Intangible assets 1,755 1,731Fuel hedge derivatives 32 73Other 68 40Total deferred tax liabilities $ 7,154 $ 7,011
The following table shows the current and noncurrent deferred tax assets (liabilities):
December 31,
(in millions) 2011 2010
Current deferred tax assets, net $ 461 $ 355Noncurrent deferred tax liabilities, net (2,028) (1,924)Total deferred tax liabilities, net $ (1,567) $ (1,569)
The current and noncurrent components of our deferred tax balances are generally based onthe balance sheet classification of the asset or liability creating the temporary difference. If thedeferred tax asset or liability is not based on a component of our balance sheet, such as our netoperating loss (“NOL”) carryforwards, the classification is presented based on the expectedreversal date of the temporary difference. Our valuation allowance has been allocated betweencurrent or noncurrent based on the percentages of current and noncurrent deferred tax assets tototal deferred tax assets.
At December 31, 2011, we had (1) $402 million of federal alternative minimum tax (“AMT”)credit carryforwards, which do not expire and (2) $16.8 billion of federal pretax NOLcarryforwards, substantially all of which will not begin to expire until 2022.
Uncertain Tax Positions
The following table shows the amount of and changes to unrecognized tax benefits on ourConsolidated Balance Sheets:
(in millions) 2011 2010 2009
Unrecognized tax benefits at beginning of period $ 89 $ 66 $ 29Gross increases-tax positions in prior period 1 — 1Gross decreases-tax positions in prior period (3) (3) (1)Gross increases-tax positions in current period 1 29 40Lapse of statute of limitations (1) (2) —Settlements (65) (1) (3)Unrecognized tax benefits at end of period(1) $ 22 $ 89 $ 66
(1) Unrecognized tax benefits on our Consolidated Balance Sheets as of December 31, 2011, 2010 and 2009, include taxbenefits of $5 million, $72 million, and $47 million, respectively, which will affect the effective tax rate whenrecognized.
We accrue interest and penalties related to unrecognized tax benefits in interest expense andoperating expense, respectively. Interest and penalties are not material in any period presented.
We are currently under audit by the IRS for the 2010 and 2011 tax years.
Copyright © 2013 www.secdatabase.com. All Rights Reserved.Please Consider the Environment Before Printing This Document
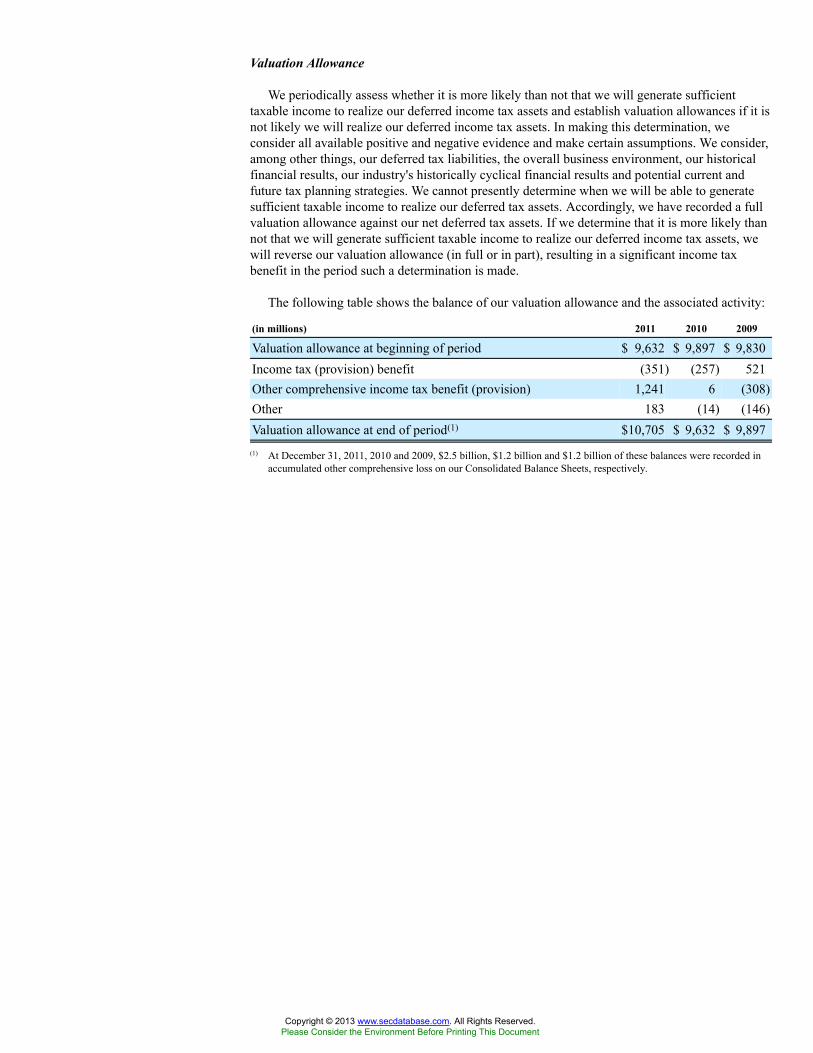
Valuation Allowance
We periodically assess whether it is more likely than not that we will generate sufficienttaxable income to realize our deferred income tax assets and establish valuation allowances if it isnot likely we will realize our deferred income tax assets. In making this determination, weconsider all available positive and negative evidence and make certain assumptions. We consider,among other things, our deferred tax liabilities, the overall business environment, our historicalfinancial results, our industry's historically cyclical financial results and potential current andfuture tax planning strategies. We cannot presently determine when we will be able to generatesufficient taxable income to realize our deferred tax assets. Accordingly, we have recorded a fullvaluation allowance against our net deferred tax assets. If we determine that it is more likely thannot that we will generate sufficient taxable income to realize our deferred income tax assets, wewill reverse our valuation allowance (in full or in part), resulting in a significant income taxbenefit in the period such a determination is made.
The following table shows the balance of our valuation allowance and the associated activity:
(in millions) 2011 2010 2009
Valuation allowance at beginning of period $ 9,632 $ 9,897 $ 9,830Income tax (provision) benefit (351) (257) 521Other comprehensive income tax benefit (provision) 1,241 6 (308)Other 183 (14) (146)Valuation allowance at end of period(1) $10,705 $ 9,632 $ 9,897
(1) At December 31, 2011, 2010 and 2009, $2.5 billion, $1.2 billion and $1.2 billion of these balances were recorded inaccumulated other comprehensive loss on our Consolidated Balance Sheets, respectively.
Copyright © 2013 www.secdatabase.com. All Rights Reserved.Please Consider the Environment Before Printing This Document
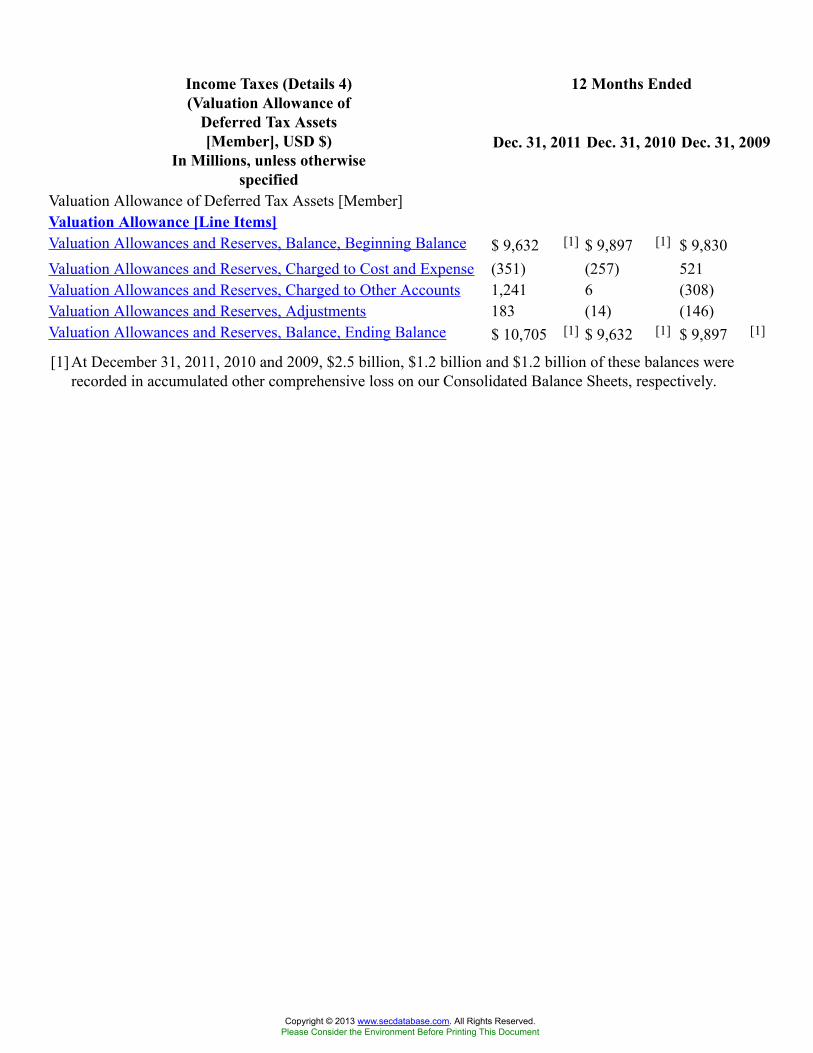
12 Months EndedIncome Taxes (Details 4)(Valuation Allowance of
Deferred Tax Assets[Member], USD $)
In Millions, unless otherwisespecified
Dec. 31, 2011 Dec. 31, 2010 Dec. 31, 2009
Valuation Allowance of Deferred Tax Assets [Member]Valuation Allowance [Line Items]Valuation Allowances and Reserves, Balance, Beginning Balance $ 9,632 [1] $ 9,897 [1] $ 9,830Valuation Allowances and Reserves, Charged to Cost and Expense (351) (257) 521Valuation Allowances and Reserves, Charged to Other Accounts 1,241 6 (308)Valuation Allowances and Reserves, Adjustments 183 (14) (146)Valuation Allowances and Reserves, Balance, Ending Balance $ 10,705 [1] $ 9,632 [1] $ 9,897 [1]
[1] At December 31, 2011, 2010 and 2009, $2.5 billion, $1.2 billion and $1.2 billion of these balances wererecorded in accumulated other comprehensive loss on our Consolidated Balance Sheets, respectively.
Copyright © 2013 www.secdatabase.com. All Rights Reserved.Please Consider the Environment Before Printing This Document
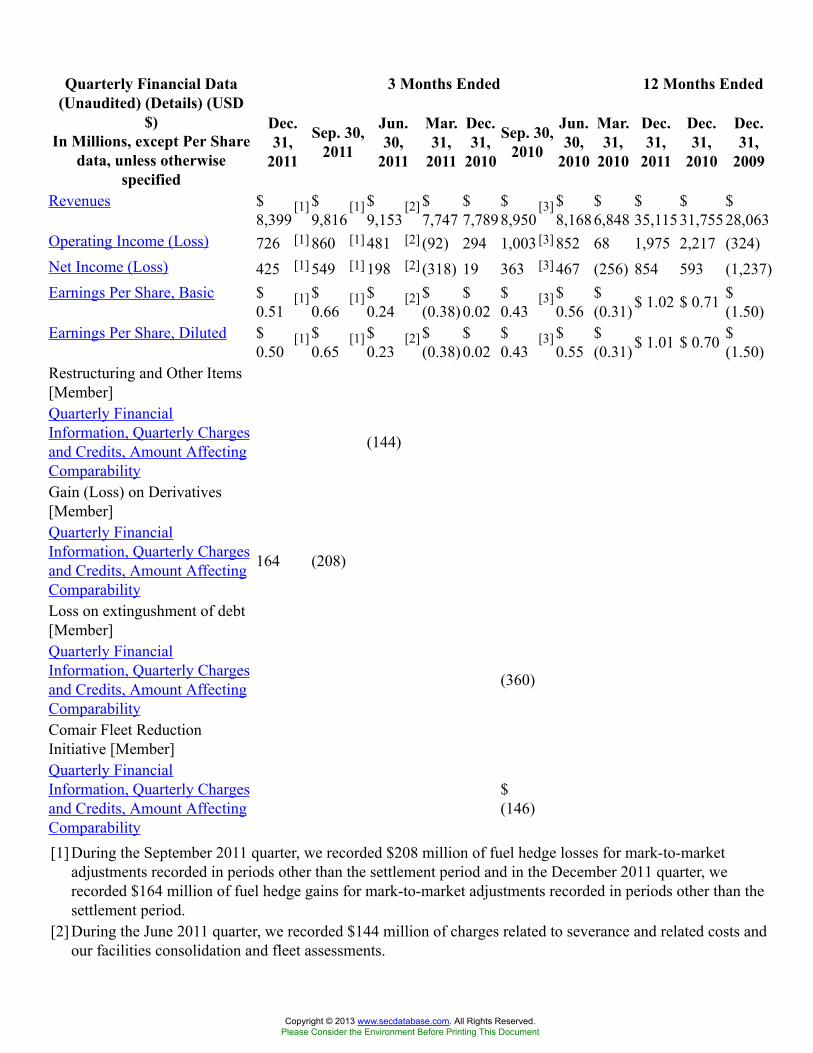
3 Months Ended 12 Months EndedQuarterly Financial Data(Unaudited) (Details) (USD
$)In Millions, except Per Share
data, unless otherwisespecified
Dec.31,
2011
Sep. 30,2011
Jun.30,
2011
Mar.31,
2011
Dec.31,
2010
Sep. 30,2010
Jun.30,
2010
Mar.31,
2010
Dec.31,
2011
Dec.31,
2010
Dec.31,
2009
Revenues $8,399
[1] $9,816
[1] $9,153
[2] $7,747
$7,789
$8,950
[3] $8,168
$6,848
$35,115
$31,755
$28,063
Operating Income (Loss) 726 [1] 860 [1] 481 [2] (92) 294 1,003 [3] 852 68 1,975 2,217 (324)Net Income (Loss) 425 [1] 549 [1] 198 [2] (318) 19 363 [3] 467 (256) 854 593 (1,237)Earnings Per Share, Basic $
0.51[1] $
0.66[1] $
0.24[2] $
(0.38)$0.02
$0.43
[3] $0.56
$(0.31) $ 1.02 $ 0.71 $
(1.50)Earnings Per Share, Diluted $
0.50[1] $
0.65[1] $
0.23[2] $
(0.38)$0.02
$0.43
[3] $0.55
$(0.31) $ 1.01 $ 0.70 $
(1.50)Restructuring and Other Items[Member]Quarterly FinancialInformation, Quarterly Chargesand Credits, Amount AffectingComparability
(144)
Gain (Loss) on Derivatives[Member]Quarterly FinancialInformation, Quarterly Chargesand Credits, Amount AffectingComparability
164 (208)
Loss on extingushment of debt[Member]Quarterly FinancialInformation, Quarterly Chargesand Credits, Amount AffectingComparability
(360)
Comair Fleet ReductionInitiative [Member]Quarterly FinancialInformation, Quarterly Chargesand Credits, Amount AffectingComparability
$(146)
[1] During the September 2011 quarter, we recorded $208 million of fuel hedge losses for mark-to-marketadjustments recorded in periods other than the settlement period and in the December 2011 quarter, werecorded $164 million of fuel hedge gains for mark-to-market adjustments recorded in periods other than thesettlement period.
[2] During the June 2011 quarter, we recorded $144 million of charges related to severance and related costs andour facilities consolidation and fleet assessments.
Copyright © 2013 www.secdatabase.com. All Rights Reserved.Please Consider the Environment Before Printing This Document

[3] During the September 2010 quarter, we recorded (1) a $360 million loss associated with the primarily non-cash loss on extinguishment of debt, including the write-off of unamortized debt discount and (2) a $146million charge related to the Comair fleet reduction initiative.
Copyright © 2013 www.secdatabase.com. All Rights Reserved.Please Consider the Environment Before Printing This Document
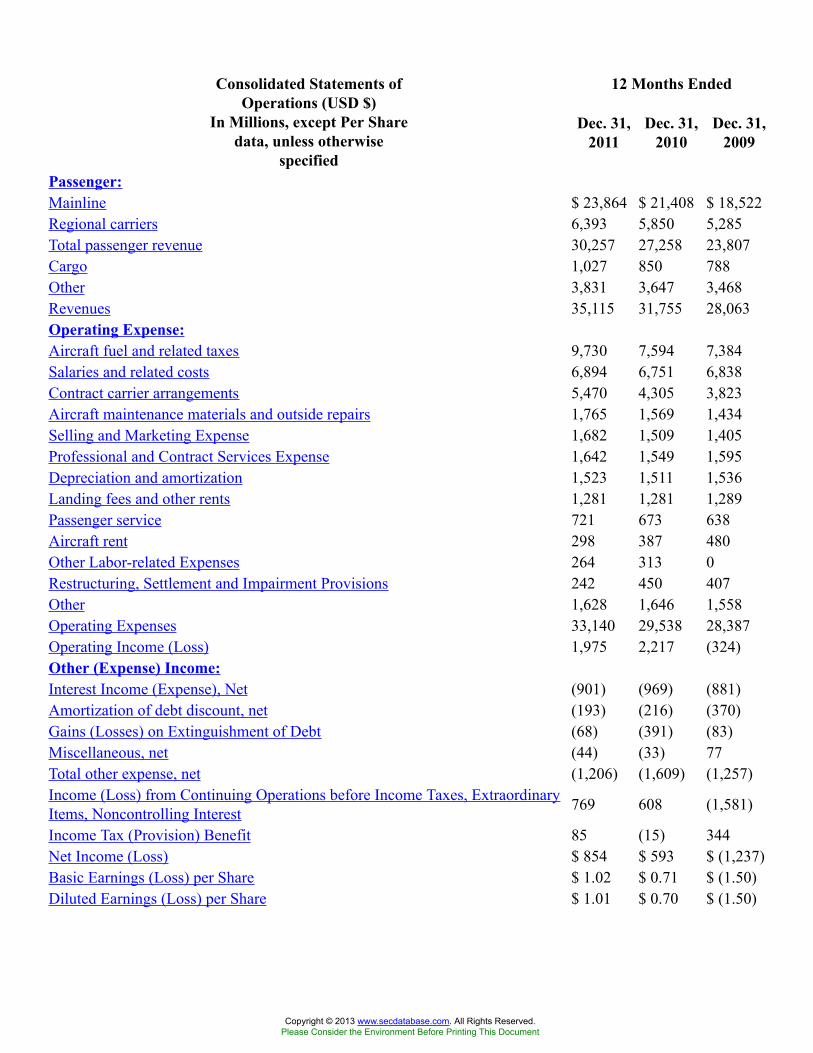
12 Months EndedConsolidated Statements ofOperations (USD $)
In Millions, except Per Sharedata, unless otherwise
specified
Dec. 31,2011
Dec. 31,2010
Dec. 31,2009
Passenger:Mainline $ 23,864 $ 21,408 $ 18,522Regional carriers 6,393 5,850 5,285Total passenger revenue 30,257 27,258 23,807Cargo 1,027 850 788Other 3,831 3,647 3,468Revenues 35,115 31,755 28,063Operating Expense:Aircraft fuel and related taxes 9,730 7,594 7,384Salaries and related costs 6,894 6,751 6,838Contract carrier arrangements 5,470 4,305 3,823Aircraft maintenance materials and outside repairs 1,765 1,569 1,434Selling and Marketing Expense 1,682 1,509 1,405Professional and Contract Services Expense 1,642 1,549 1,595Depreciation and amortization 1,523 1,511 1,536Landing fees and other rents 1,281 1,281 1,289Passenger service 721 673 638Aircraft rent 298 387 480Other Labor-related Expenses 264 313 0Restructuring, Settlement and Impairment Provisions 242 450 407Other 1,628 1,646 1,558Operating Expenses 33,140 29,538 28,387Operating Income (Loss) 1,975 2,217 (324)Other (Expense) Income:Interest Income (Expense), Net (901) (969) (881)Amortization of debt discount, net (193) (216) (370)Gains (Losses) on Extinguishment of Debt (68) (391) (83)Miscellaneous, net (44) (33) 77Total other expense, net (1,206) (1,609) (1,257)Income (Loss) from Continuing Operations before Income Taxes, ExtraordinaryItems, Noncontrolling Interest 769 608 (1,581)
Income Tax (Provision) Benefit 85 (15) 344Net Income (Loss) $ 854 $ 593 $ (1,237)Basic Earnings (Loss) per Share $ 1.02 $ 0.71 $ (1.50)Diluted Earnings (Loss) per Share $ 1.01 $ 0.70 $ (1.50)
Copyright © 2013 www.secdatabase.com. All Rights Reserved.Please Consider the Environment Before Printing This Document
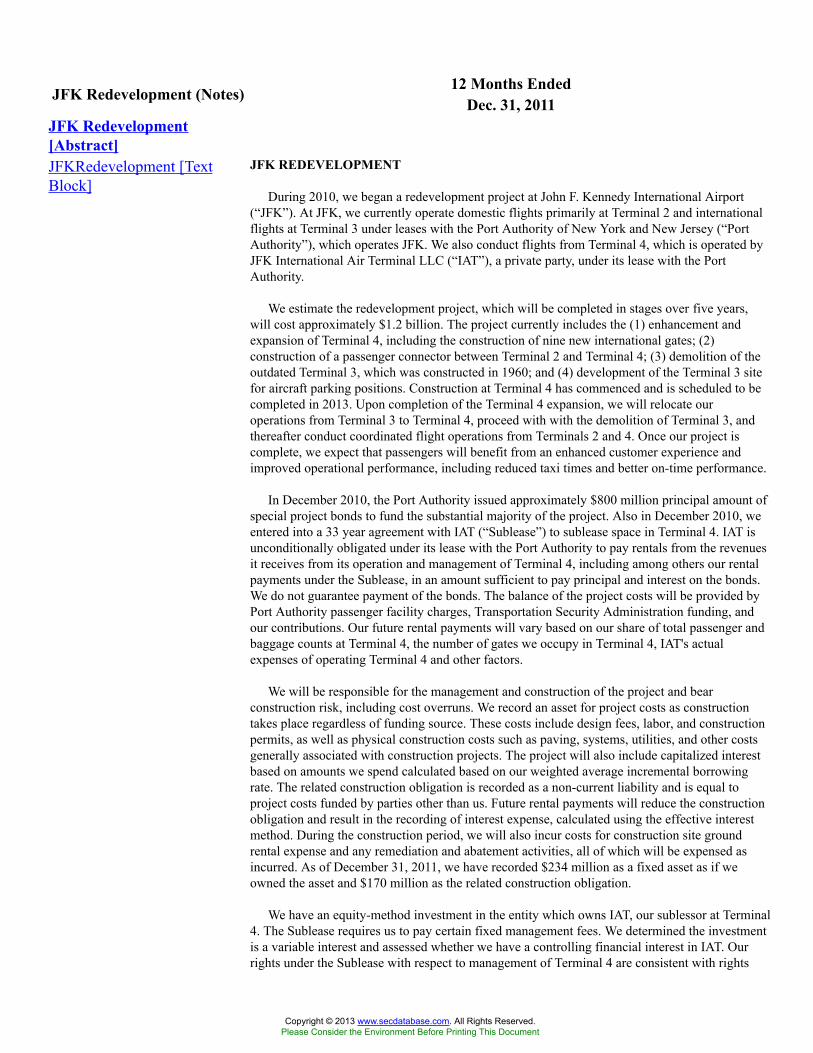
12 Months EndedJFK Redevelopment (Notes) Dec. 31, 2011JFK Redevelopment[Abstract]JFKRedevelopment [TextBlock]
JFK REDEVELOPMENT
During 2010, we began a redevelopment project at John F. Kennedy International Airport(“JFK”). At JFK, we currently operate domestic flights primarily at Terminal 2 and internationalflights at Terminal 3 under leases with the Port Authority of New York and New Jersey (“PortAuthority”), which operates JFK. We also conduct flights from Terminal 4, which is operated byJFK International Air Terminal LLC (“IAT”), a private party, under its lease with the PortAuthority.
We estimate the redevelopment project, which will be completed in stages over five years,will cost approximately $1.2 billion. The project currently includes the (1) enhancement andexpansion of Terminal 4, including the construction of nine new international gates; (2)construction of a passenger connector between Terminal 2 and Terminal 4; (3) demolition of theoutdated Terminal 3, which was constructed in 1960; and (4) development of the Terminal 3 sitefor aircraft parking positions. Construction at Terminal 4 has commenced and is scheduled to becompleted in 2013. Upon completion of the Terminal 4 expansion, we will relocate ouroperations from Terminal 3 to Terminal 4, proceed with with the demolition of Terminal 3, andthereafter conduct coordinated flight operations from Terminals 2 and 4. Once our project iscomplete, we expect that passengers will benefit from an enhanced customer experience andimproved operational performance, including reduced taxi times and better on-time performance.
In December 2010, the Port Authority issued approximately $800 million principal amount ofspecial project bonds to fund the substantial majority of the project. Also in December 2010, weentered into a 33 year agreement with IAT (“Sublease”) to sublease space in Terminal 4. IAT isunconditionally obligated under its lease with the Port Authority to pay rentals from the revenuesit receives from its operation and management of Terminal 4, including among others our rentalpayments under the Sublease, in an amount sufficient to pay principal and interest on the bonds.We do not guarantee payment of the bonds. The balance of the project costs will be provided byPort Authority passenger facility charges, Transportation Security Administration funding, andour contributions. Our future rental payments will vary based on our share of total passenger andbaggage counts at Terminal 4, the number of gates we occupy in Terminal 4, IAT's actualexpenses of operating Terminal 4 and other factors.
We will be responsible for the management and construction of the project and bearconstruction risk, including cost overruns. We record an asset for project costs as constructiontakes place regardless of funding source. These costs include design fees, labor, and constructionpermits, as well as physical construction costs such as paving, systems, utilities, and other costsgenerally associated with construction projects. The project will also include capitalized interestbased on amounts we spend calculated based on our weighted average incremental borrowingrate. The related construction obligation is recorded as a non-current liability and is equal toproject costs funded by parties other than us. Future rental payments will reduce the constructionobligation and result in the recording of interest expense, calculated using the effective interestmethod. During the construction period, we will also incur costs for construction site groundrental expense and any remediation and abatement activities, all of which will be expensed asincurred. As of December 31, 2011, we have recorded $234 million as a fixed asset as if weowned the asset and $170 million as the related construction obligation.
We have an equity-method investment in the entity which owns IAT, our sublessor at Terminal4. The Sublease requires us to pay certain fixed management fees. We determined the investmentis a variable interest and assessed whether we have a controlling financial interest in IAT. Ourrights under the Sublease with respect to management of Terminal 4 are consistent with rights
Copyright © 2013 www.secdatabase.com. All Rights Reserved.Please Consider the Environment Before Printing This Document

granted to an anchor tenant under a standard airport lease. Accordingly, we do not consolidate theentity in which we have an investment in our Consolidated Financial Statements.
Copyright © 2013 www.secdatabase.com. All Rights Reserved.Please Consider the Environment Before Printing This Document
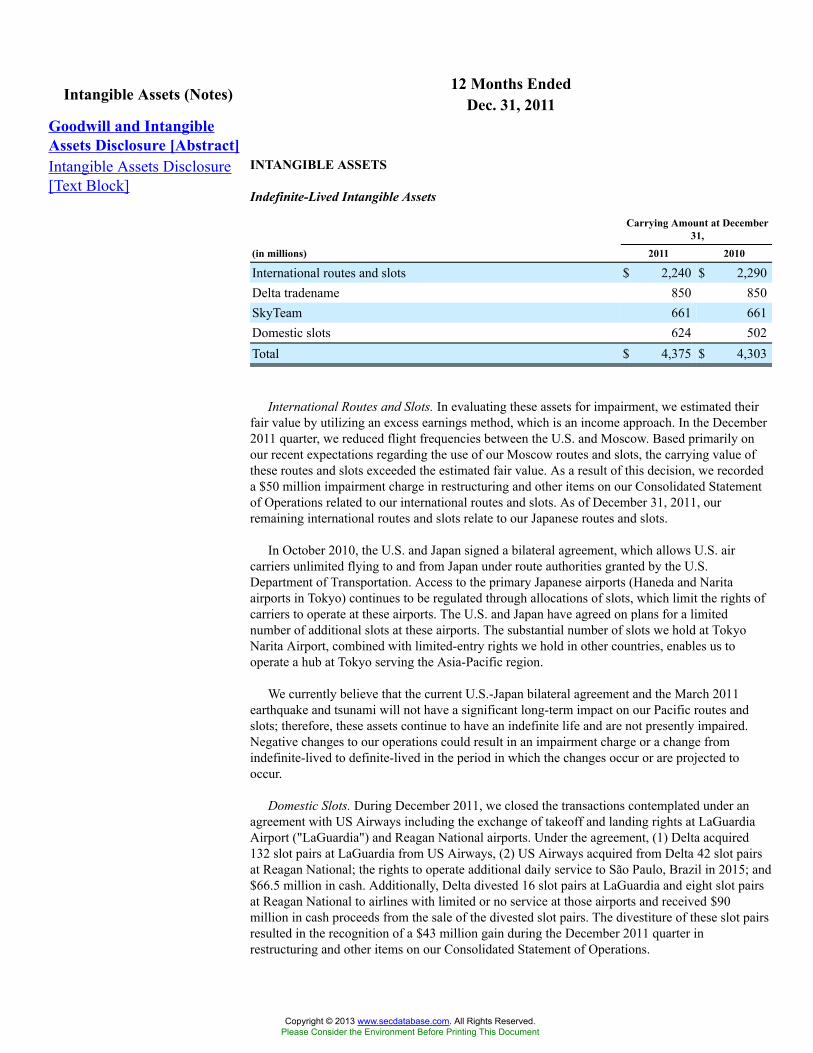
12 Months EndedIntangible Assets (Notes) Dec. 31, 2011Goodwill and IntangibleAssets Disclosure [Abstract]Intangible Assets Disclosure[Text Block]
INTANGIBLE ASSETS
Indefinite-Lived Intangible Assets
Carrying Amount at December31,
(in millions) 2011 2010
International routes and slots $ 2,240 $ 2,290Delta tradename 850 850SkyTeam 661 661Domestic slots 624 502Total $ 4,375 $ 4,303
International Routes and Slots. In evaluating these assets for impairment, we estimated theirfair value by utilizing an excess earnings method, which is an income approach. In the December2011 quarter, we reduced flight frequencies between the U.S. and Moscow. Based primarily onour recent expectations regarding the use of our Moscow routes and slots, the carrying value ofthese routes and slots exceeded the estimated fair value. As a result of this decision, we recordeda $50 million impairment charge in restructuring and other items on our Consolidated Statementof Operations related to our international routes and slots. As of December 31, 2011, ourremaining international routes and slots relate to our Japanese routes and slots.
In October 2010, the U.S. and Japan signed a bilateral agreement, which allows U.S. aircarriers unlimited flying to and from Japan under route authorities granted by the U.S.Department of Transportation. Access to the primary Japanese airports (Haneda and Naritaairports in Tokyo) continues to be regulated through allocations of slots, which limit the rights ofcarriers to operate at these airports. The U.S. and Japan have agreed on plans for a limitednumber of additional slots at these airports. The substantial number of slots we hold at TokyoNarita Airport, combined with limited-entry rights we hold in other countries, enables us tooperate a hub at Tokyo serving the Asia-Pacific region.
We currently believe that the current U.S.-Japan bilateral agreement and the March 2011earthquake and tsunami will not have a significant long-term impact on our Pacific routes andslots; therefore, these assets continue to have an indefinite life and are not presently impaired.Negative changes to our operations could result in an impairment charge or a change fromindefinite-lived to definite-lived in the period in which the changes occur or are projected tooccur.
Domestic Slots. During December 2011, we closed the transactions contemplated under anagreement with US Airways including the exchange of takeoff and landing rights at LaGuardiaAirport ("LaGuardia") and Reagan National airports. Under the agreement, (1) Delta acquired132 slot pairs at LaGuardia from US Airways, (2) US Airways acquired from Delta 42 slot pairsat Reagan National; the rights to operate additional daily service to São Paulo, Brazil in 2015; and$66.5 million in cash. Additionally, Delta divested 16 slot pairs at LaGuardia and eight slot pairsat Reagan National to airlines with limited or no service at those airports and received $90million in cash proceeds from the sale of the divested slot pairs. The divestiture of these slot pairsresulted in the recognition of a $43 million gain during the December 2011 quarter inrestructuring and other items on our Consolidated Statement of Operations.
Copyright © 2013 www.secdatabase.com. All Rights Reserved.Please Consider the Environment Before Printing This Document
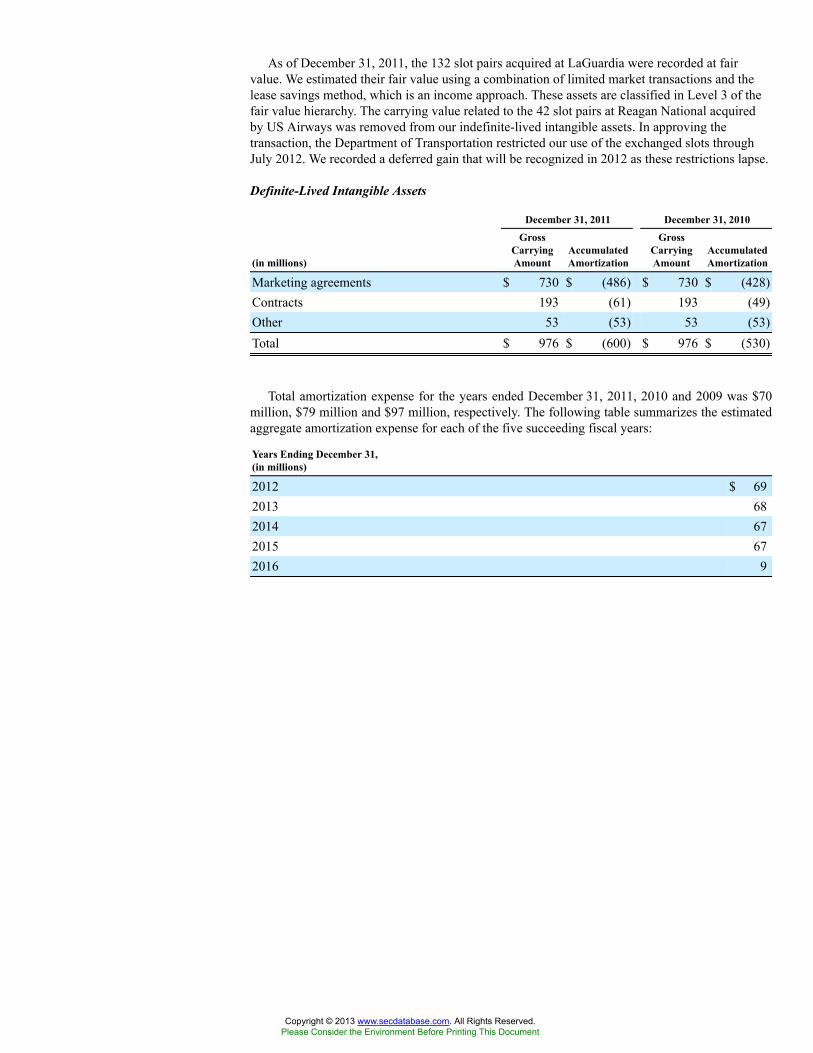
As of December 31, 2011, the 132 slot pairs acquired at LaGuardia were recorded at fairvalue. We estimated their fair value using a combination of limited market transactions and thelease savings method, which is an income approach. These assets are classified in Level 3 of thefair value hierarchy. The carrying value related to the 42 slot pairs at Reagan National acquiredby US Airways was removed from our indefinite-lived intangible assets. In approving thetransaction, the Department of Transportation restricted our use of the exchanged slots throughJuly 2012. We recorded a deferred gain that will be recognized in 2012 as these restrictions lapse.
Definite-Lived Intangible Assets
December 31, 2011 December 31, 2010
(in millions)
GrossCarryingAmount
AccumulatedAmortization
GrossCarryingAmount
AccumulatedAmortization
Marketing agreements $ 730 $ (486) $ 730 $ (428)Contracts 193 (61) 193 (49)Other 53 (53) 53 (53)Total $ 976 $ (600) $ 976 $ (530)
Total amortization expense for the years ended December 31, 2011, 2010 and 2009 was $70million, $79 million and $97 million, respectively. The following table summarizes the estimatedaggregate amortization expense for each of the five succeeding fiscal years:
Years Ending December 31,(in millions)
2012 $ 692013 682014 672015 672016 9
Copyright © 2013 www.secdatabase.com. All Rights Reserved.Please Consider the Environment Before Printing This Document
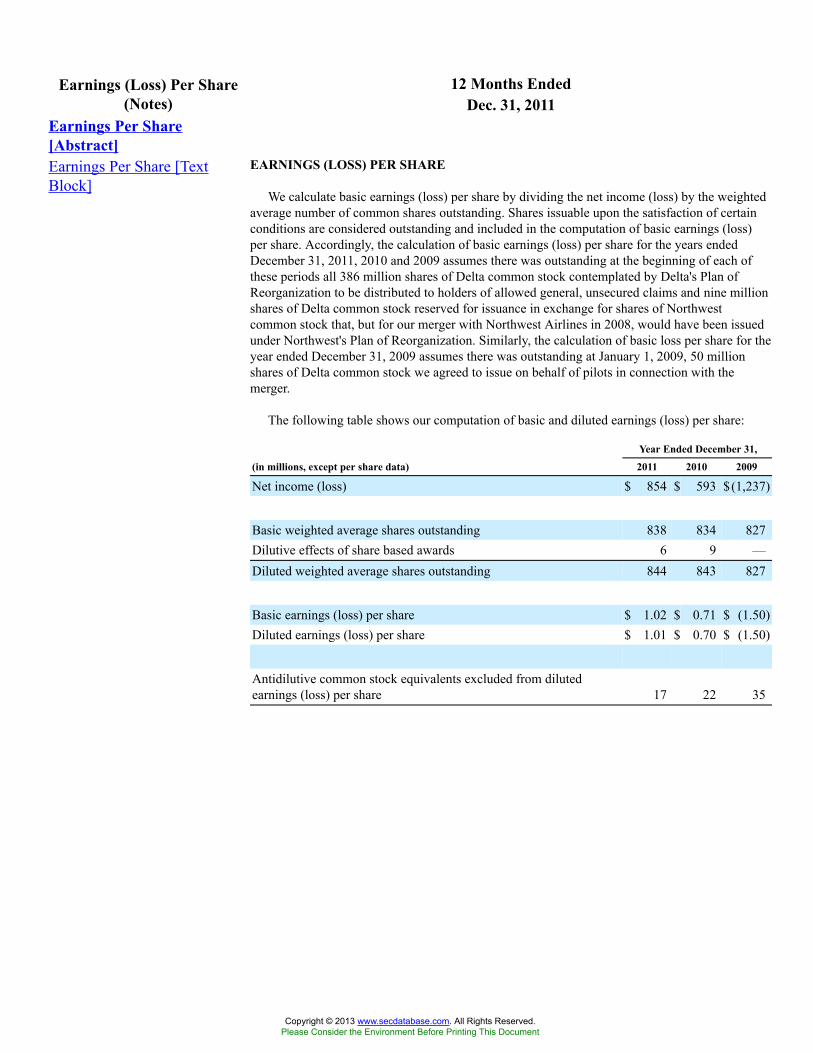
12 Months EndedEarnings (Loss) Per Share(Notes) Dec. 31, 2011
Earnings Per Share[Abstract]Earnings Per Share [TextBlock]
EARNINGS (LOSS) PER SHARE
We calculate basic earnings (loss) per share by dividing the net income (loss) by the weightedaverage number of common shares outstanding. Shares issuable upon the satisfaction of certainconditions are considered outstanding and included in the computation of basic earnings (loss)per share. Accordingly, the calculation of basic earnings (loss) per share for the years endedDecember 31, 2011, 2010 and 2009 assumes there was outstanding at the beginning of each ofthese periods all 386 million shares of Delta common stock contemplated by Delta's Plan ofReorganization to be distributed to holders of allowed general, unsecured claims and nine millionshares of Delta common stock reserved for issuance in exchange for shares of Northwestcommon stock that, but for our merger with Northwest Airlines in 2008, would have been issuedunder Northwest's Plan of Reorganization. Similarly, the calculation of basic loss per share for theyear ended December 31, 2009 assumes there was outstanding at January 1, 2009, 50 millionshares of Delta common stock we agreed to issue on behalf of pilots in connection with themerger.
The following table shows our computation of basic and diluted earnings (loss) per share:
Year Ended December 31,
(in millions, except per share data) 2011 2010 2009
Net income (loss) $ 854 $ 593 $(1,237)
Basic weighted average shares outstanding 838 834 827Dilutive effects of share based awards 6 9 —Diluted weighted average shares outstanding 844 843 827
Basic earnings (loss) per share $ 1.02 $ 0.71 $ (1.50)Diluted earnings (loss) per share $ 1.01 $ 0.70 $ (1.50)
Antidilutive common stock equivalents excluded from dilutedearnings (loss) per share 17 22 35
Copyright © 2013 www.secdatabase.com. All Rights Reserved.Please Consider the Environment Before Printing This Document
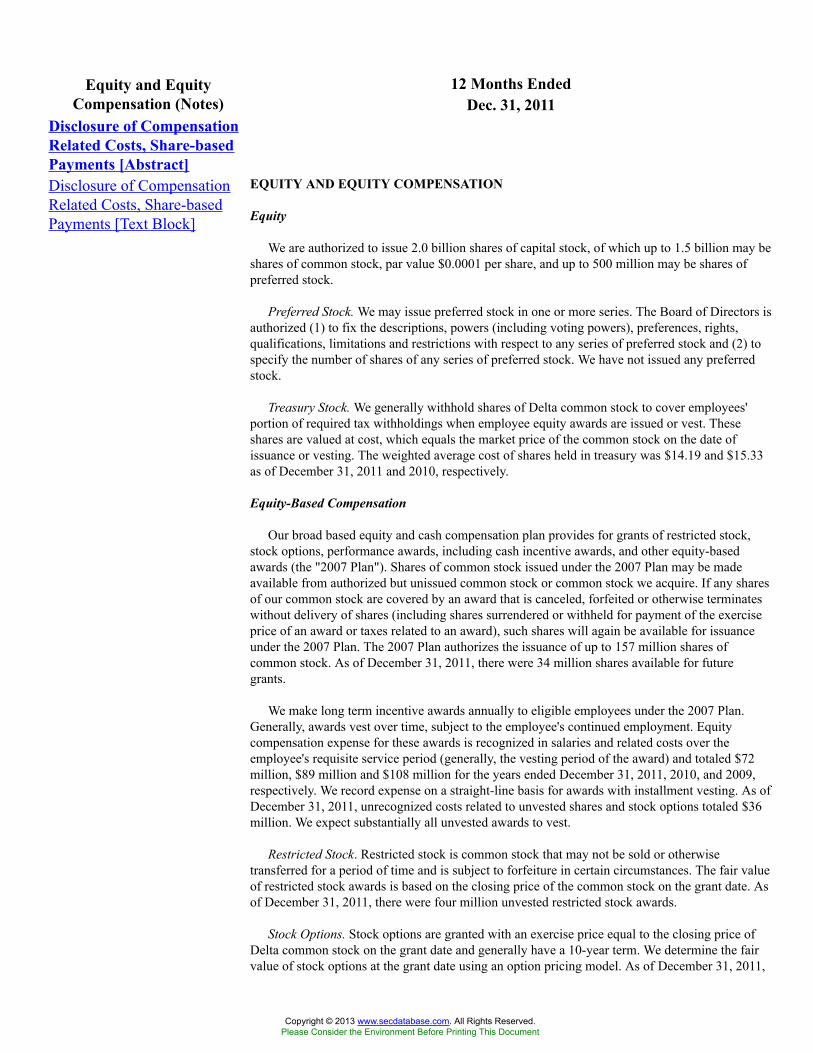
12 Months EndedEquity and EquityCompensation (Notes) Dec. 31, 2011
Disclosure of CompensationRelated Costs, Share-basedPayments [Abstract]Disclosure of CompensationRelated Costs, Share-basedPayments [Text Block]
EQUITY AND EQUITY COMPENSATION
Equity
We are authorized to issue 2.0 billion shares of capital stock, of which up to 1.5 billion may beshares of common stock, par value $0.0001 per share, and up to 500 million may be shares ofpreferred stock.
Preferred Stock. We may issue preferred stock in one or more series. The Board of Directors isauthorized (1) to fix the descriptions, powers (including voting powers), preferences, rights,qualifications, limitations and restrictions with respect to any series of preferred stock and (2) tospecify the number of shares of any series of preferred stock. We have not issued any preferredstock.
Treasury Stock. We generally withhold shares of Delta common stock to cover employees'portion of required tax withholdings when employee equity awards are issued or vest. Theseshares are valued at cost, which equals the market price of the common stock on the date ofissuance or vesting. The weighted average cost of shares held in treasury was $14.19 and $15.33as of December 31, 2011 and 2010, respectively.
Equity-Based Compensation
Our broad based equity and cash compensation plan provides for grants of restricted stock,stock options, performance awards, including cash incentive awards, and other equity-basedawards (the "2007 Plan"). Shares of common stock issued under the 2007 Plan may be madeavailable from authorized but unissued common stock or common stock we acquire. If any sharesof our common stock are covered by an award that is canceled, forfeited or otherwise terminateswithout delivery of shares (including shares surrendered or withheld for payment of the exerciseprice of an award or taxes related to an award), such shares will again be available for issuanceunder the 2007 Plan. The 2007 Plan authorizes the issuance of up to 157 million shares ofcommon stock. As of December 31, 2011, there were 34 million shares available for futuregrants.
We make long term incentive awards annually to eligible employees under the 2007 Plan.Generally, awards vest over time, subject to the employee's continued employment. Equitycompensation expense for these awards is recognized in salaries and related costs over theemployee's requisite service period (generally, the vesting period of the award) and totaled $72million, $89 million and $108 million for the years ended December 31, 2011, 2010, and 2009,respectively. We record expense on a straight-line basis for awards with installment vesting. As ofDecember 31, 2011, unrecognized costs related to unvested shares and stock options totaled $36million. We expect substantially all unvested awards to vest.
Restricted Stock. Restricted stock is common stock that may not be sold or otherwisetransferred for a period of time and is subject to forfeiture in certain circumstances. The fair valueof restricted stock awards is based on the closing price of the common stock on the grant date. Asof December 31, 2011, there were four million unvested restricted stock awards.
Stock Options. Stock options are granted with an exercise price equal to the closing price ofDelta common stock on the grant date and generally have a 10-year term. We determine the fairvalue of stock options at the grant date using an option pricing model. As of December 31, 2011,
Copyright © 2013 www.secdatabase.com. All Rights Reserved.Please Consider the Environment Before Printing This Document

there were 18 million outstanding stock option awards with a weighted average exercise price of$12.15, and 17 million were exercisable.
Performance Shares. Performance shares are long-term incentive opportunities which arepayable in common stock or cash and are generally contingent upon our achieving certainfinancial goals.
Other. There was no tax benefit recognized in 2011, 2010 or 2009 related to equity-basedcompensation, as we record a full valuation allowance against our deferred tax assets due to theuncertainty regarding the ultimate realization of those assets.
Copyright © 2013 www.secdatabase.com. All Rights Reserved.Please Consider the Environment Before Printing This Document
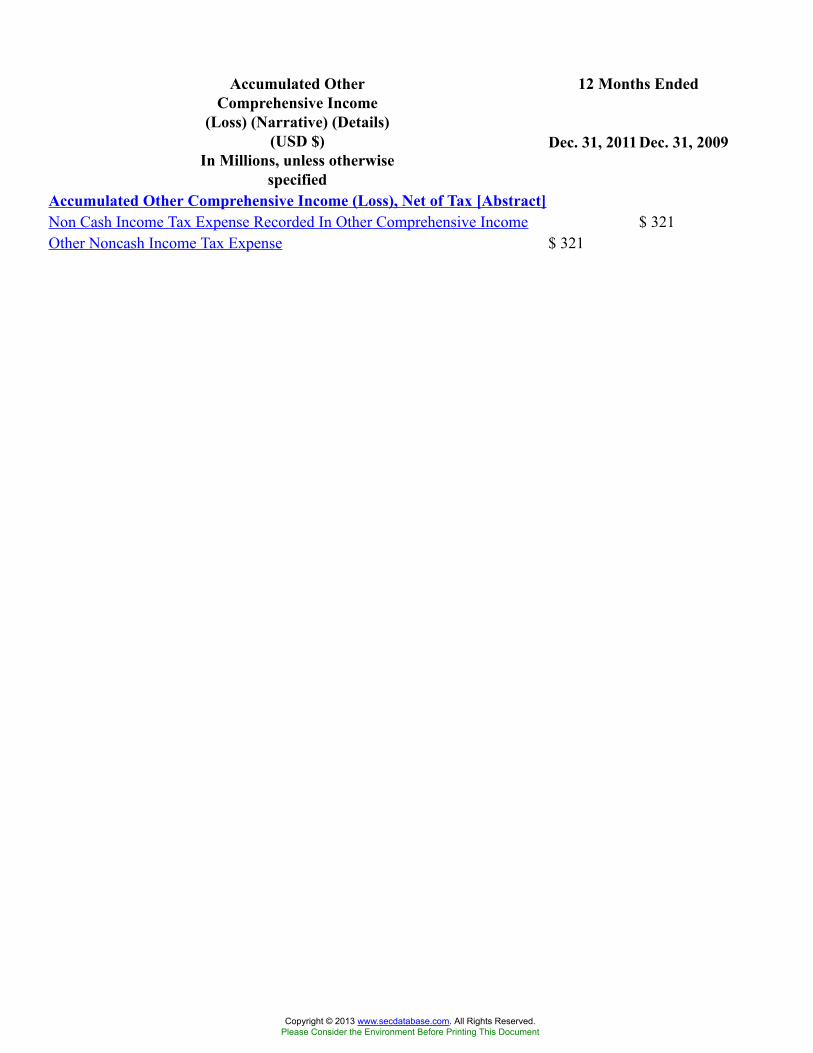
12 Months EndedAccumulated OtherComprehensive Income
(Loss) (Narrative) (Details)(USD $)
In Millions, unless otherwisespecified
Dec. 31, 2011Dec. 31, 2009
Accumulated Other Comprehensive Income (Loss), Net of Tax [Abstract]Non Cash Income Tax Expense Recorded In Other Comprehensive Income $ 321Other Noncash Income Tax Expense $ 321
Copyright © 2013 www.secdatabase.com. All Rights Reserved.Please Consider the Environment Before Printing This Document
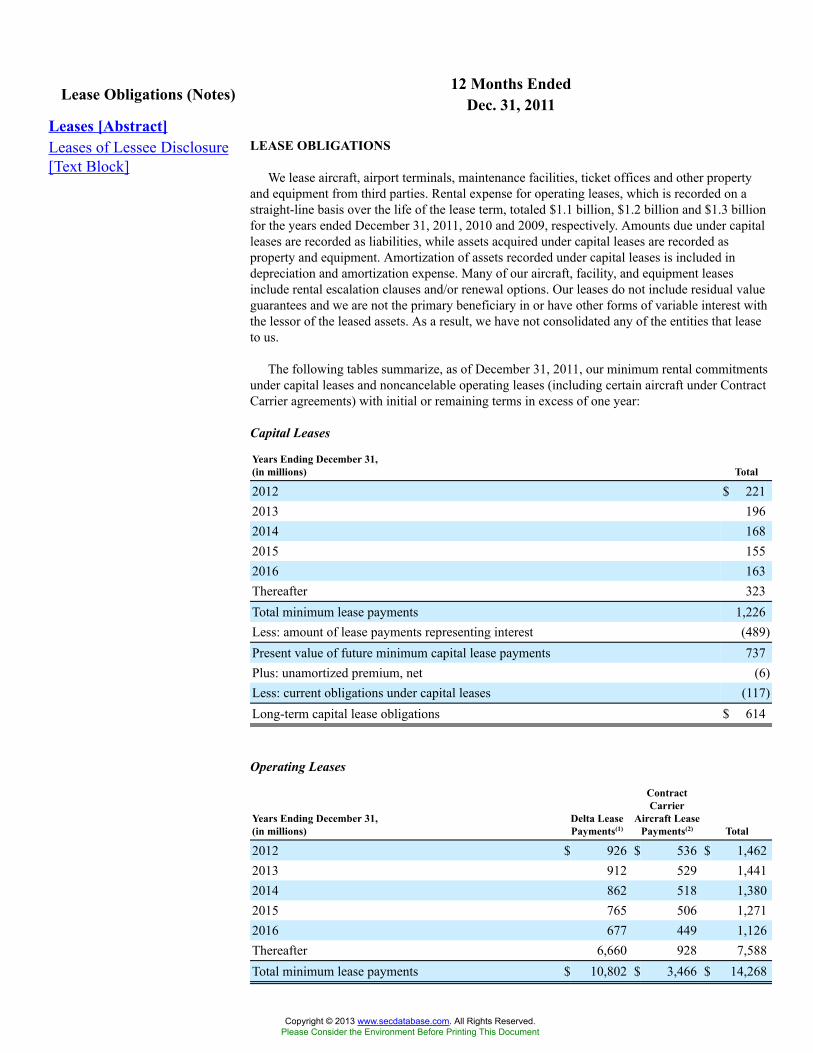
12 Months EndedLease Obligations (Notes) Dec. 31, 2011Leases [Abstract]Leases of Lessee Disclosure[Text Block]
LEASE OBLIGATIONS
We lease aircraft, airport terminals, maintenance facilities, ticket offices and other propertyand equipment from third parties. Rental expense for operating leases, which is recorded on astraight-line basis over the life of the lease term, totaled $1.1 billion, $1.2 billion and $1.3 billionfor the years ended December 31, 2011, 2010 and 2009, respectively. Amounts due under capitalleases are recorded as liabilities, while assets acquired under capital leases are recorded asproperty and equipment. Amortization of assets recorded under capital leases is included indepreciation and amortization expense. Many of our aircraft, facility, and equipment leasesinclude rental escalation clauses and/or renewal options. Our leases do not include residual valueguarantees and we are not the primary beneficiary in or have other forms of variable interest withthe lessor of the leased assets. As a result, we have not consolidated any of the entities that leaseto us.
The following tables summarize, as of December 31, 2011, our minimum rental commitmentsunder capital leases and noncancelable operating leases (including certain aircraft under ContractCarrier agreements) with initial or remaining terms in excess of one year:
Capital Leases
Years Ending December 31,(in millions) Total
2012 $ 2212013 1962014 1682015 1552016 163Thereafter 323Total minimum lease payments 1,226Less: amount of lease payments representing interest (489)Present value of future minimum capital lease payments 737Plus: unamortized premium, net (6)Less: current obligations under capital leases (117)Long-term capital lease obligations $ 614
Operating Leases
Years Ending December 31,(in millions)
Delta LeasePayments(1)
ContractCarrier
Aircraft LeasePayments(2) Total
2012 $ 926 $ 536 $ 1,4622013 912 529 1,4412014 862 518 1,3802015 765 506 1,2712016 677 449 1,126Thereafter 6,660 928 7,588Total minimum lease payments $ 10,802 $ 3,466 $ 14,268
Copyright © 2013 www.secdatabase.com. All Rights Reserved.Please Consider the Environment Before Printing This Document

(1) Includes payments accounted for as construction obligations. See Note 4.(2) Represents the minimum lease obligations under our Contract Carrier agreements with ExpressJet Airlines, Inc.
(formerly Atlantic Southeast Airlines, Inc.), Chautauqua Airlines, Inc. (“Chautauqua”), Compass, Mesaba, Pinnacle,Shuttle America Corporation (“Shuttle America”) and SkyWest Airlines, Inc.
At December 31, 2011, we and our wholly-owned subsidiary Comair operated 111 aircraftunder capital leases and 90 aircraft under operating leases. Our Contract Carriers under capacitypurchase agreements (excluding Comair) operated 550 aircraft under operating leases.
Copyright © 2013 www.secdatabase.com. All Rights Reserved.Please Consider the Environment Before Printing This Document
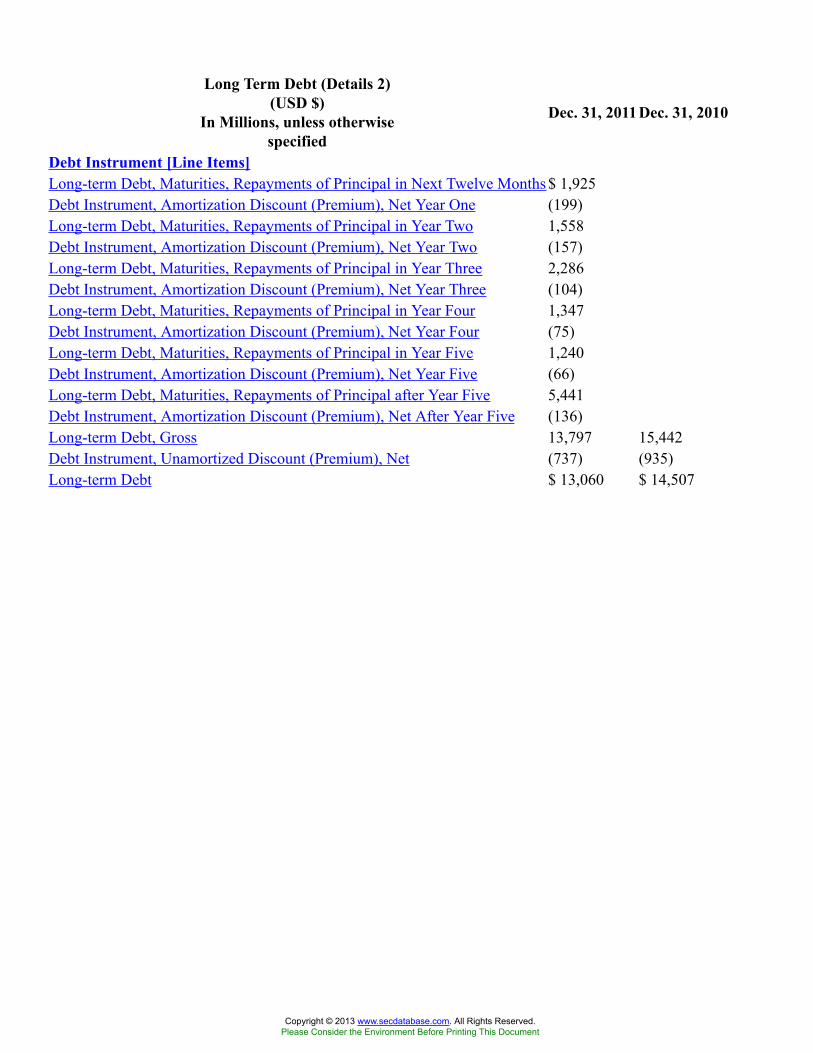
Long Term Debt (Details 2)(USD $)
In Millions, unless otherwisespecified
Dec. 31, 2011Dec. 31, 2010
Debt Instrument [Line Items]Long-term Debt, Maturities, Repayments of Principal in Next Twelve Months $ 1,925Debt Instrument, Amortization Discount (Premium), Net Year One (199)Long-term Debt, Maturities, Repayments of Principal in Year Two 1,558Debt Instrument, Amortization Discount (Premium), Net Year Two (157)Long-term Debt, Maturities, Repayments of Principal in Year Three 2,286Debt Instrument, Amortization Discount (Premium), Net Year Three (104)Long-term Debt, Maturities, Repayments of Principal in Year Four 1,347Debt Instrument, Amortization Discount (Premium), Net Year Four (75)Long-term Debt, Maturities, Repayments of Principal in Year Five 1,240Debt Instrument, Amortization Discount (Premium), Net Year Five (66)Long-term Debt, Maturities, Repayments of Principal after Year Five 5,441Debt Instrument, Amortization Discount (Premium), Net After Year Five (136)Long-term Debt, Gross 13,797 15,442Debt Instrument, Unamortized Discount (Premium), Net (737) (935)Long-term Debt $ 13,060 $ 14,507
Copyright © 2013 www.secdatabase.com. All Rights Reserved.Please Consider the Environment Before Printing This Document
12 Months EndedAmerican ExpressRelationship Dec. 31, 2011
American ExpressRelationship [Abstract]American ExpressRelationship [Text Block]
AMERICAN EXPRESS RELATIONSHIP
General. Our agreements with American Express provide for joint marketing, grant certainbenefits to Delta-American Express co-branded credit card holders ("Cardholders") and AmericanExpress Membership Rewards Program participants, and allow American Express to market toour customer database. Cardholders earn mileage credits for making purchases on their co-branded cards, may check their first bag for free on every Delta flight and enjoy other benefitswhile traveling with Delta. Additionally, participants in the American Express MembershipRewards program may exchange their points for mileage credits under the SkyMiles Program. Asa result, we sell mileage credits at agreed upon rates to American Express for provision to theircustomers under the co-brand credit card program and the Membership Rewards program.
Advance Purchase of SkyMiles. In 2008, we entered into a multi-year extension of ourAmerican Express agreements and received $1.0 billion from American Express for an advancepurchase of SkyMiles (the "prepayment"). The 2008 agreement provided that our obligations withrespect to the advance purchase would be satisfied as American Express uses the purchased milesover a specified future period (“SkyMiles Usage Period”), rather than by cash payments from usto American Express. Due to the SkyMiles Usage Period and other restrictions placed uponAmerican Express regarding the timing and use of the SkyMiles, we classified the $1.0 billion wereceived, the prepayment, as long-term debt.
In 2010, we amended our 2008 American Express agreement. The amendments, among otherthings, (1) provide that Cardholders may check their first bag for free on every Delta flightthrough June 2013 ("Baggage Fee Waiver Period"), (2) changed the SkyMiles Usage Period to athree-year period beginning in the December 2011 quarter from a two-year period beginning inDecember 2010 quarter, and (3) gave American Express the option to extend our agreements withthem for one year.
During the SkyMiles Usage Period, which commenced during the December 2011 quarter,American Express will draw down on the prepayment instead of paying cash to Delta forSkyMiles used. As of December 31, 2011, $952 million of the original $1.0 billion debt (orprepayment) remained, including $333 million which is classified in current maturities of long-term debt and capital leases. As SkyMiles are used by American Express, we recognize the twoseparate revenue components of these SkyMiles consistent with our accounting policy discussedin Note 1. We defer revenue related to the portion of the mileage credits redeemable for futuretravel and recognize it as passenger revenue when miles are redeemed and services are provided.The value of the marketing component is determined under the residual method and recognizedas other revenue as related marketing services are provided.
Annual Sale of SkyMiles. In December 2011, we further amended our American Expressagreements and sold American Express $675 million of SkyMiles. Under the December 2011amendment, we anticipate American Express will make additional purchases of $675 million ofSkyMiles in each of 2012, 2013, and 2014. The December 2011 amendment also extends theBaggage Fee Waiver Period. The SkyMiles purchased pursuant to the December 2011amendment may be used immediately by American Express. The usage of these SkyMiles is notrestricted in any way. These annual purchases of SkyMiles will be recorded as deferred revenuewithin current liabilities. The portion of each purchase of SkyMiles related to mileage creditsredeemable for future travel will be classified within frequent flyer deferred revenue and theportion related to the marketing component will be classified within other accrued liabilities.
The December 2011 amendment does not change the number of miles that we expectAmerican Express to purchase from us over the next four years. It only impacts the timing of
Copyright © 2013 www.secdatabase.com. All Rights Reserved.Please Consider the Environment Before Printing This Document

those purchases. The December 2011 amendment did not make any significant changes to thedeliverables (the mileage credits sold and the marketing component). Therefore, it is not amaterial modification of the American Express agreements under the accounting guidance. Afuture material modification of the American Express agreements could impact our deferral rateor cause an adjustment to our deferred revenue balance, which could materially impact our futurefinancial results. For additional information, see "Frequent Flyer Program" in Note 1.
Fuel Card Obligation. In December 2011, we also obtained a purchasing card with AmericanExpress for the purpose of buying jet fuel. The card currently carries a maximum credit limit of$612 million and must be paid monthly. As of December 31, 2011, we had $318 millionoutstanding on this purchasing card, which was classified as other accrued liabilities.
Copyright © 2013 www.secdatabase.com. All Rights Reserved.Please Consider the Environment Before Printing This Document
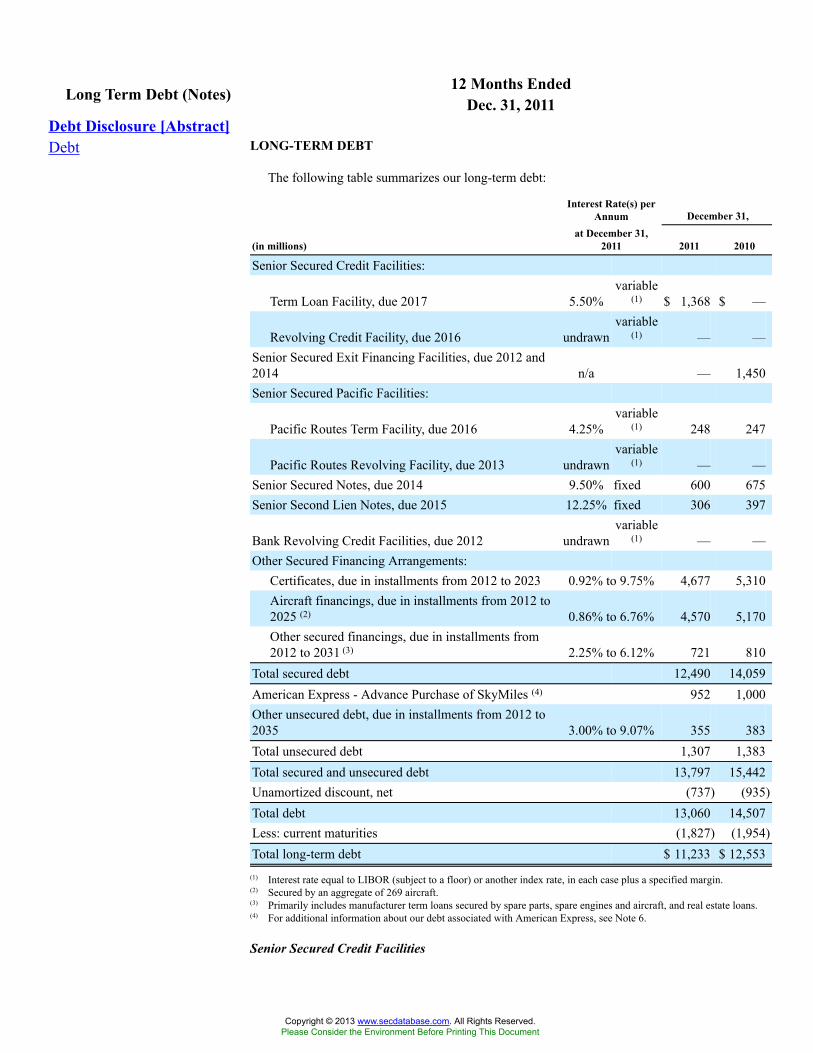
12 Months EndedLong Term Debt (Notes) Dec. 31, 2011Debt Disclosure [Abstract]Debt LONG-TERM DEBT
The following table summarizes our long-term debt:
Interest Rate(s) perAnnum December 31,
(in millions)at December 31,
2011 2011 2010
Senior Secured Credit Facilities:
Term Loan Facility, due 2017 5.50%variable
(1) $ 1,368 $ —
Revolving Credit Facility, due 2016 undrawnvariable
(1) — —Senior Secured Exit Financing Facilities, due 2012 and2014 n/a — 1,450Senior Secured Pacific Facilities:
Pacific Routes Term Facility, due 2016 4.25%variable
(1) 248 247
Pacific Routes Revolving Facility, due 2013 undrawnvariable
(1) — —Senior Secured Notes, due 2014 9.50% fixed 600 675Senior Second Lien Notes, due 2015 12.25% fixed 306 397
Bank Revolving Credit Facilities, due 2012 undrawnvariable
(1) — —Other Secured Financing Arrangements:
Certificates, due in installments from 2012 to 2023 0.92% to 9.75% 4,677 5,310Aircraft financings, due in installments from 2012 to2025 (2) 0.86% to 6.76% 4,570 5,170Other secured financings, due in installments from2012 to 2031 (3) 2.25% to 6.12% 721 810
Total secured debt 12,490 14,059American Express - Advance Purchase of SkyMiles (4) 952 1,000Other unsecured debt, due in installments from 2012 to2035 3.00% to 9.07% 355 383Total unsecured debt 1,307 1,383Total secured and unsecured debt 13,797 15,442Unamortized discount, net (737) (935)Total debt 13,060 14,507Less: current maturities (1,827) (1,954)Total long-term debt $ 11,233 $ 12,553
(1) Interest rate equal to LIBOR (subject to a floor) or another index rate, in each case plus a specified margin.(2) Secured by an aggregate of 269 aircraft.(3) Primarily includes manufacturer term loans secured by spare parts, spare engines and aircraft, and real estate loans.(4) For additional information about our debt associated with American Express, see Note 6.
Senior Secured Credit Facilities
Copyright © 2013 www.secdatabase.com. All Rights Reserved.Please Consider the Environment Before Printing This Document
In 2011, we entered into senior secured first-lien credit facilities (the “Senior Secured CreditFacilities”) to borrow up to $2.6 billion. The Senior Secured Credit Facilities consist of a $1.4billion first-lien term loan facility (the “Term Loan Facility”) and a $1.2 billion first-lienrevolving credit facility, up to $500 million of which may be used for the issuance of letters ofcredit (the “Revolving Credit Facility”).
Borrowings under the Term Loan Facility must be repaid annually in an amount equal to 1%of the original principal amount (to be paid in equal quarterly installments), with the balance duein April 2017. Borrowings under the Revolving Credit Facility are due in April 2016. AtDecember 31, 2011, the Revolving Credit Facility was undrawn.
Our obligations under the Senior Secured Credit Facilities are guaranteed by substantially allof our domestic subsidiaries (the “Guarantors”). The Senior Secured Credit Facilities and therelated guarantees are secured by liens on certain of our and the Guarantors' assets, includingaccounts receivable, inventory, flight equipment, ground property and equipment, certain non-Pacific international routes, domestic slots, real estate and certain investments (the “Collateral”).
The Senior Secured Credit Facilities contain events of default customary for similarfinancings, including cross-defaults to other material indebtedness and certain change of controlevents. The Senior Secured Credit Facilities also include events of default specific to ourbusiness, including the suspension of all or substantially all of our flights and operations for morethan five consecutive days (other than as a result of a Federal Aviation Administration suspensiondue to extraordinary events similarly affecting other major U.S. air carriers). Upon the occurrenceof an event of default, the outstanding obligations may be accelerated and become due andpayable immediately. For a discussion of related financial covenants, see "Key FinancialCovenants" below.
Senior Secured Exit Financing Facilities
In connection with entering into the Senior Secured Credit Facilities, we retired theoutstanding loans under our $2.5 billion senior secured exit financing facilities and terminatedthose facilities as well as an existing undrawn $100 million revolving credit facility. These retiredsenior secured exit financing facilities consisted of:
• $914 million first-lien revolving credit facility and an $86 million first-lien term loandue April 2012;
• $600 million first-lien synthetic revolving facility due April 2012; and
• $900 million second-lien term loan facility due April 2014.
Senior Secured Pacific Facilities
In 2009, we entered into a first-lien term loan facility in the aggregate principal amount of$250 million (the “Pacific Routes Term Facility”) and a first-lien revolving credit facility in theaggregate principal amount of $500 million (the “Pacific Routes Revolving Facility”),collectively the “Senior Secured Pacific Facilities.” The Senior Secured Pacific Facilities areguaranteed by the Guarantors and are secured by a first lien on our Pacific route authorities andcertain related assets (the “Pacific Collateral”). Lenders under the Senior Secured PacificFacilities and holders of the Senior Secured Notes (described below) have equal rights topayment and the Pacific Collateral.
During 2011, we refinanced and amended the Pacific Routes Term Facility to, among otherthings, (1) reduce the interest rate, (2) extend the maturity date from September 2013 to March2016 and (3) modify certain negative covenants and default provisions to be substantially similarto those described above under “Senior Secured Credit Facilities.”
Borrowings under the Pacific Routes Term Facility must be repaid in an amount equal to 1%of the original principal amount of the term loans annually (to be paid in equal quarterly
Copyright © 2013 www.secdatabase.com. All Rights Reserved.Please Consider the Environment Before Printing This Document
installments), with the balance due in March 2016. Borrowings under the Pacific RoutesRevolving Facility are due in March 2013 and can be repaid and reborrowed without penalty. Asof December 31, 2011, the Pacific Routes Revolving Facility was undrawn.
The Senior Secured Pacific Facilities contain mandatory prepayment provisions that requireus in certain instances to prepay obligations under the Senior Secured Pacific Facilities inconnection with dispositions of collateral. For a discussion of related financial covenants, see"Key Financial Covenants" below.
Senior Secured Notes
In 2009, we issued $750 million principal amount of Senior Secured Notes that mature inSeptember 2014. We may redeem some or all of these notes at specified redemption prices. If wesell certain of our assets or if we experience specific kinds of changes in control, we must offer torepurchase the Senior Secured Notes. During 2011, we voluntarily redeemed $75 millionprincipal amount of Senior Secured Notes. We also voluntarily redeemed $75 million principalamount of Senior Secured Notes in 2010.
The Senior Secured Notes are guaranteed by the Guarantors and are secured by the PacificCollateral. Holders of the Senior Secured Notes and lenders under the Senior Secured PacificFacilities (discussed above) have equal rights to payment and collateral.
The Senior Secured Notes contain events of default customary for similar financings,including cross-defaults to other material indebtedness. Upon the occurrence of an event ofdefault, the outstanding obligations may be accelerated and become due and payableimmediately. For a discussion of related financial covenants, see "Key Financial Covenants"below.
Senior Second Lien Notes
In conjunction with the issuance of the Senior Secured Notes, we issued $600 millionprincipal amount of Senior Second Lien Notes that mature in March 2015. We may redeem someor all of the Senior Second Lien Notes on or after March 15, 2012 at specified redemption prices.If we sell certain of our assets or if we experience specific kinds of changes in control, we mustoffer to repurchase the Senior Second Lien Notes. During 2010, we repurchased in a cash tenderoffer $171 million principal amount of Senior Second Lien Notes.
Our obligations under the Senior Second Lien Notes are guaranteed by the Guarantors, andour obligations and the related guarantees are secured on a junior basis by security interests in thePacific Collateral. The Senior Second Lien Notes include default provisions that are substantiallysimilar to the ones described under “Senior Secured Notes due 2014” above. For a discussion ofrelated financial covenants, see "Key Financial Covenants" below.
Key Financial Covenants
Our secured debt instruments discussed above include affirmative, negative and financialcovenants that restrict our ability to, among other things, make investments, sell or otherwisedispose of collateral if we are not in compliance with the collateral coverage ratio tests describedbelow, pay dividends or repurchase stock. We were in compliance with all covenants in ourfinancing agreements at December 31, 2011. The financial covenants require us to maintain theminimum levels shown in the table below:
Senior SecuredCredit Facilities
SeniorSecuredPacific
Facilities
SeniorSecured
NotesSenior Second
Lien Notes
Minimum Fixed Charge CoverageRatio (1) 1.20:1 1.20:1 n/a n/aMinimum Unrestricted Liquidity
Copyright © 2013 www.secdatabase.com. All Rights Reserved.Please Consider the Environment Before Printing This Document
Unrestricted cash and permittedinvestments $1.0 billion n/a n/a n/aUnrestricted cash, permittedinvestments, and undrawnrevolving credit facilities $2.0 billion $2.0 billion n/a n/a
Minimum Collateral Coverage Ratio (2) 1.67:1 (3) 1.60:1 1.60:1 1.00:1
(1) Defined as the ratio of (a) earnings before interest, taxes, depreciation, amortization and aircraft rent, and otheradjustments to net income to (b) the sum of gross cash interest expense (including the interest portion of ourcapitalized lease obligations) and cash aircraft rent expense, for the 12-month period ending as of the last day of eachfiscal quarter.
(2) Defined as the ratio of (a) certain of the collateral that meets specified eligibility standards to (b) the sum of theaggregate outstanding obligations and certain other obligations.
(3) Excluding the non-Pacific international routes from the collateral for purposes of the calculation, the requiredminimum collateral coverage ratio is 0.75:1
Minimum Collateral Coverage Ratio. Under the Senior Secured Credit Facilities and theSenior Secured Pacific Facilities, if the collateral coverage ratios are not maintained, we musteither provide additional collateral to secure our obligations, or we must repay the loans under thefacilities by an amount necessary to maintain compliance with the collateral coverage ratios.Under the Senior Secured Notes and Senior Second Lien Notes, if the collateral coverage ratiosare not maintained, we must generally pay additional interest on the notes at the rate of 2% perannum until the collateral coverage ratio equals at least the minimum. The value of the collateralthat has been pledged in each facility may change over time, which may be reflected in appraisalsof collateral required by our credit agreements and indentures. These changes could result fromfactors that are not under our control. A decline in the value of collateral could result in asituation where we may not be able to maintain the collateral coverage ratio.
Availability Under Revolving Credit Facilities
The table below shows our availability under revolving credit facilities as of December 31,2011:
(in millions)
December31,
2011
Revolving Credit Facility, due 2016 $ 1,225Pacific Routes Revolving Facility, due 2013 500Bank Revolving Credit Facility, due 2012 100Total availability under revolving credit facilities $ 1,825
Other Secured Financing Arrangements
During 2011, we retired $502 million of existing debt under our other secured financingarrangements prior to scheduled maturity. During 2010, we (1) repurchased in cash tender offers$129 million of Pass-Through Trust Certificates, (2) achieved $160 million of debt relief throughvendor negotiations and (3) prepaid or repurchased $403 million of other existing debt.
In 2010, we also restructured $820 million of existing debt, including changes in applicableinterest rates and other payment terms. To account for debt restructurings, we compare the netpresent value of future cash flows for each new debt instrument to the remaining cash flows ofthe existing debt. If there is at least a 10% change in cash flows, we treat the restructuring as adebt extinguishment. We record losses on extinguishment of debt for the difference between thefair value of the new debt and the carrying value of the existing debt. The carrying value of theexisting debt includes any unamortized discounts or premiums, unamortized issuance costs, andany premiums paid to retire the existing debt.
Copyright © 2013 www.secdatabase.com. All Rights Reserved.Please Consider the Environment Before Printing This Document
Certificates. Pass-Through Trust Certificates and Enhanced Equipment Trust Certificates(“EETC”) (collectively, the “Certificates”) are secured by 262 aircraft. During the three yearsended December 31, 2011, we received proceeds from offerings of EETC as shown in the tablebelow.
Proceeds Received(In millions,unless otherwisestated) 2011 2010 2009
TotalPrincipal
FixedInterest
Rate
OfferingCompletion
DateFinal
Maturity Date Collateral
2011-1A $ 293 $ — $ — $ 293 5.300% April 2011 April 201926
aircraft
2011-1B 102 — — 102 7.125% August 2011October
201426
aircraft(1)
2010-2A 204 270 — 474 4.950%November
2010 May 201928
aircraft
2010-2B 135 — — 135 6.750%February
2011November
201528
aircraft(1)
2010-1A — 450 — 450 6.200% July 2010 July 201824
aircraft
2010-1B 100 — — 100 6.375%February
2011January
201624
aircraft(1)
2009-1A — 288 281 569 7.750%November
2009December
201927
aircraft
2009-1B — 59 61 120 9.750%November
2009December
201627
aircraft(1)
Total $ 834 $1,067 $ 342 $2,243
(1) Each of the B tranches are secured by the same aircraft that secure related A tranches.
As of December 31, 2010, $204 million held in escrow under the 2010-2A EETC was notrecorded on the balance sheet as we had no right to these funds until the equipment notes securingthe certificates were issued. We assessed whether the pass through trusts were variable interestentities required to be consolidated. Because our only obligation with respect to the trusts is tomake interest and principal payments on the equipment notes held by the trusts and because wehave no current rights to the escrowed funds, we concluded we do not have a variable interest inthe related trusts. Accordingly, we did not consolidate them. As of December 31, 2011, noamounts remained in escrow.
Unamortized Discount, Net
Our unamortized discount, net results from fair value adjustments recorded in 2008 to reducethe carrying value of our long-term debt due to purchase accounting and an advance purchase ofSkyMiles by American Express (see Note 6). As described in the table below, we amortize theseadjustments over the remaining maturities of the respective debt to amortization of debt discount,net on our Consolidated Statements of Operations. During the years ended December 31, 2011,2010 and 2009, we recorded $68 million, $391 million and $83 million in losses, respectively,from the early extinguishment of debt, which primarily related to the write-off of debt discounts.
Future Maturities
The following table summarizes scheduled maturities of our debt, including currentmaturities, at December 31, 2011:
Years Ending December 31,(in millions)
Total Securedand Unsecured
Debt
Amortization ofDebt Discount,
net
2012 $ 1,925 $ (199)
Copyright © 2013 www.secdatabase.com. All Rights Reserved.Please Consider the Environment Before Printing This Document
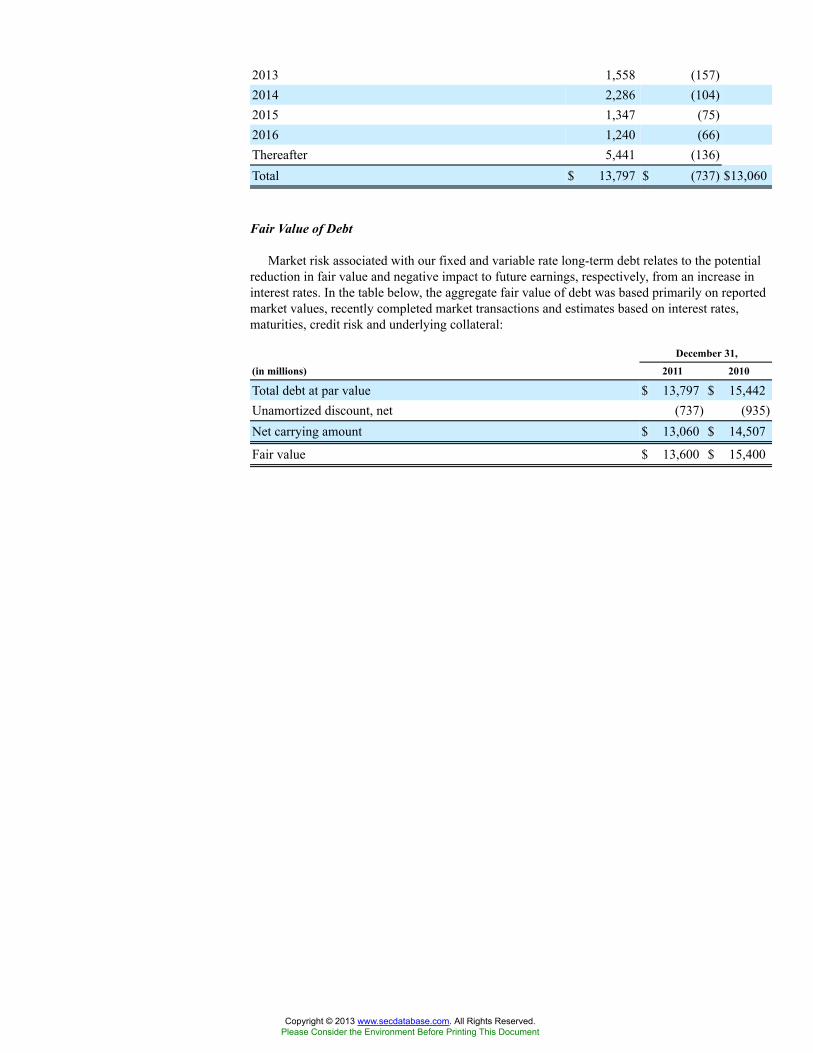
2013 1,558 (157)2014 2,286 (104)2015 1,347 (75)2016 1,240 (66)Thereafter 5,441 (136)Total $ 13,797 $ (737) $13,060
Fair Value of Debt
Market risk associated with our fixed and variable rate long-term debt relates to the potentialreduction in fair value and negative impact to future earnings, respectively, from an increase ininterest rates. In the table below, the aggregate fair value of debt was based primarily on reportedmarket values, recently completed market transactions and estimates based on interest rates,maturities, credit risk and underlying collateral:
December 31,
(in millions) 2011 2010
Total debt at par value $ 13,797 $ 15,442Unamortized discount, net (737) (935)Net carrying amount $ 13,060 $ 14,507
Fair value $ 13,600 $ 15,400
Copyright © 2013 www.secdatabase.com. All Rights Reserved.Please Consider the Environment Before Printing This Document
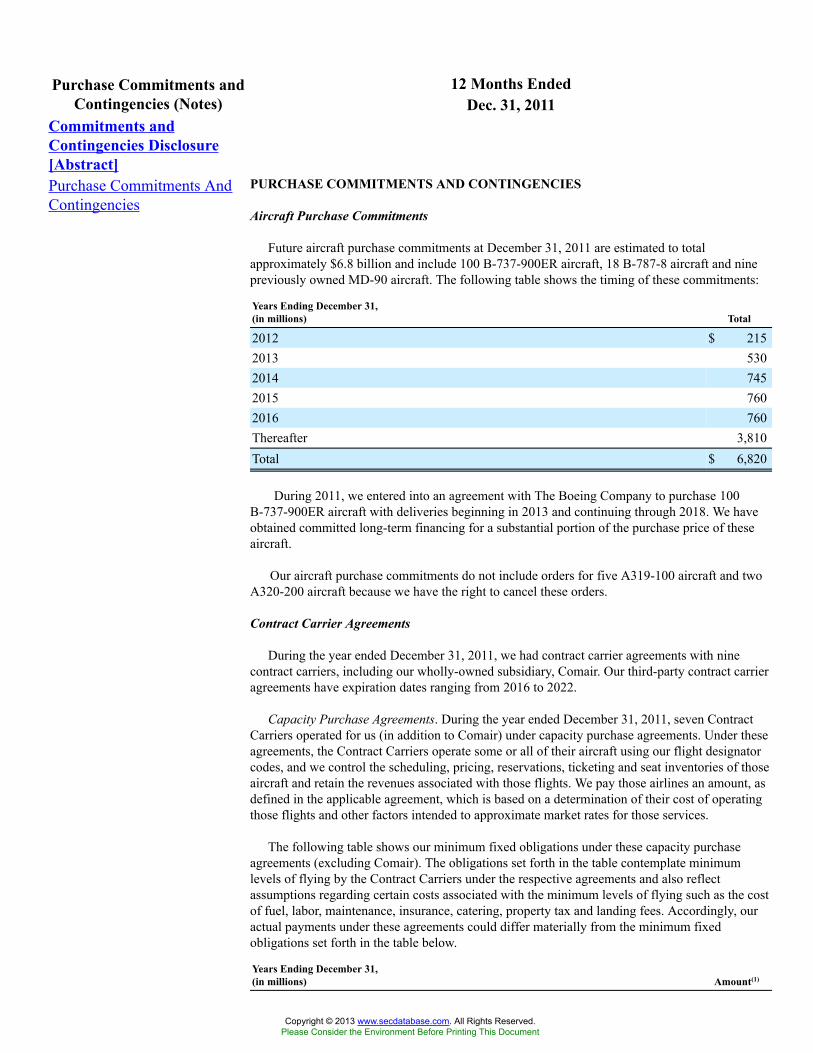
12 Months EndedPurchase Commitments andContingencies (Notes) Dec. 31, 2011
Commitments andContingencies Disclosure[Abstract]Purchase Commitments AndContingencies
PURCHASE COMMITMENTS AND CONTINGENCIES
Aircraft Purchase Commitments
Future aircraft purchase commitments at December 31, 2011 are estimated to totalapproximately $6.8 billion and include 100 B-737-900ER aircraft, 18 B-787-8 aircraft and ninepreviously owned MD-90 aircraft. The following table shows the timing of these commitments:
Years Ending December 31,(in millions) Total
2012 $ 2152013 5302014 7452015 7602016 760Thereafter 3,810Total $ 6,820
During 2011, we entered into an agreement with The Boeing Company to purchase 100B-737-900ER aircraft with deliveries beginning in 2013 and continuing through 2018. We haveobtained committed long-term financing for a substantial portion of the purchase price of theseaircraft.
Our aircraft purchase commitments do not include orders for five A319-100 aircraft and twoA320-200 aircraft because we have the right to cancel these orders.
Contract Carrier Agreements
During the year ended December 31, 2011, we had contract carrier agreements with ninecontract carriers, including our wholly-owned subsidiary, Comair. Our third-party contract carrieragreements have expiration dates ranging from 2016 to 2022.
Capacity Purchase Agreements. During the year ended December 31, 2011, seven ContractCarriers operated for us (in addition to Comair) under capacity purchase agreements. Under theseagreements, the Contract Carriers operate some or all of their aircraft using our flight designatorcodes, and we control the scheduling, pricing, reservations, ticketing and seat inventories of thoseaircraft and retain the revenues associated with those flights. We pay those airlines an amount, asdefined in the applicable agreement, which is based on a determination of their cost of operatingthose flights and other factors intended to approximate market rates for those services.
The following table shows our minimum fixed obligations under these capacity purchaseagreements (excluding Comair). The obligations set forth in the table contemplate minimumlevels of flying by the Contract Carriers under the respective agreements and also reflectassumptions regarding certain costs associated with the minimum levels of flying such as the costof fuel, labor, maintenance, insurance, catering, property tax and landing fees. Accordingly, ouractual payments under these agreements could differ materially from the minimum fixedobligations set forth in the table below.
Years Ending December 31,(in millions) Amount(1)
Copyright © 2013 www.secdatabase.com. All Rights Reserved.Please Consider the Environment Before Printing This Document
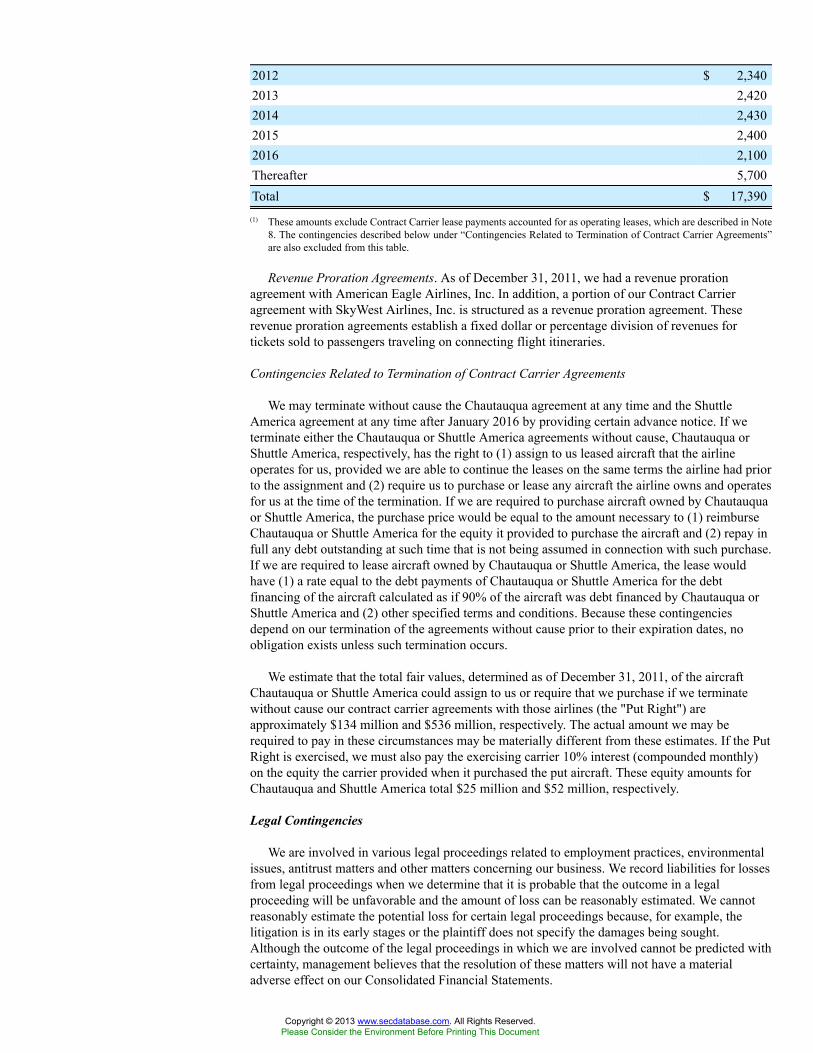
2012 $ 2,3402013 2,4202014 2,4302015 2,4002016 2,100Thereafter 5,700Total $ 17,390
(1) These amounts exclude Contract Carrier lease payments accounted for as operating leases, which are described in Note8. The contingencies described below under “Contingencies Related to Termination of Contract Carrier Agreements”are also excluded from this table.
Revenue Proration Agreements. As of December 31, 2011, we had a revenue prorationagreement with American Eagle Airlines, Inc. In addition, a portion of our Contract Carrieragreement with SkyWest Airlines, Inc. is structured as a revenue proration agreement. Theserevenue proration agreements establish a fixed dollar or percentage division of revenues fortickets sold to passengers traveling on connecting flight itineraries.
Contingencies Related to Termination of Contract Carrier Agreements
We may terminate without cause the Chautauqua agreement at any time and the ShuttleAmerica agreement at any time after January 2016 by providing certain advance notice. If weterminate either the Chautauqua or Shuttle America agreements without cause, Chautauqua orShuttle America, respectively, has the right to (1) assign to us leased aircraft that the airlineoperates for us, provided we are able to continue the leases on the same terms the airline had priorto the assignment and (2) require us to purchase or lease any aircraft the airline owns and operatesfor us at the time of the termination. If we are required to purchase aircraft owned by Chautauquaor Shuttle America, the purchase price would be equal to the amount necessary to (1) reimburseChautauqua or Shuttle America for the equity it provided to purchase the aircraft and (2) repay infull any debt outstanding at such time that is not being assumed in connection with such purchase.If we are required to lease aircraft owned by Chautauqua or Shuttle America, the lease wouldhave (1) a rate equal to the debt payments of Chautauqua or Shuttle America for the debtfinancing of the aircraft calculated as if 90% of the aircraft was debt financed by Chautauqua orShuttle America and (2) other specified terms and conditions. Because these contingenciesdepend on our termination of the agreements without cause prior to their expiration dates, noobligation exists unless such termination occurs.
We estimate that the total fair values, determined as of December 31, 2011, of the aircraftChautauqua or Shuttle America could assign to us or require that we purchase if we terminatewithout cause our contract carrier agreements with those airlines (the "Put Right") areapproximately $134 million and $536 million, respectively. The actual amount we may berequired to pay in these circumstances may be materially different from these estimates. If the PutRight is exercised, we must also pay the exercising carrier 10% interest (compounded monthly)on the equity the carrier provided when it purchased the put aircraft. These equity amounts forChautauqua and Shuttle America total $25 million and $52 million, respectively.
Legal Contingencies
We are involved in various legal proceedings related to employment practices, environmentalissues, antitrust matters and other matters concerning our business. We record liabilities for lossesfrom legal proceedings when we determine that it is probable that the outcome in a legalproceeding will be unfavorable and the amount of loss can be reasonably estimated. We cannotreasonably estimate the potential loss for certain legal proceedings because, for example, thelitigation is in its early stages or the plaintiff does not specify the damages being sought.Although the outcome of the legal proceedings in which we are involved cannot be predicted withcertainty, management believes that the resolution of these matters will not have a materialadverse effect on our Consolidated Financial Statements.
Copyright © 2013 www.secdatabase.com. All Rights Reserved.Please Consider the Environment Before Printing This Document
Credit Card Processing Agreements
Our VISA/MasterCard and American Express credit card processing agreements provide thatno cash reserve ("Reserve") is required, and no withholding of payment related to receivablescollected will occur, except in certain circumstances, including when we do not maintain arequired level of unrestricted cash. In circumstances in which the credit card processor canestablish a Reserve or withhold payments, the amount of the Reserve or payments that may bewithheld would be equal to the potential liability of the credit card processor for tickets purchasedwith VISA/MasterCard or American Express credit cards, as applicable, that had not yet beenused for travel. There was no Reserve or amounts withheld as of December 31, 2011 and 2010.
Other Contingencies
General Indemnifications
We are the lessee under many commercial real estate leases. It is common in thesetransactions for us, as the lessee, to agree to indemnify the lessor and the lessor's related partiesfor tort, environmental and other liabilities that arise out of or relate to our use or occupancy ofthe leased premises. This type of indemnity would typically make us responsible to indemnifiedparties for liabilities arising out of the conduct of, among others, contractors, licensees andinvitees at, or in connection with, the use or occupancy of the leased premises. This indemnityoften extends to related liabilities arising from the negligence of the indemnified parties, butusually excludes any liabilities caused by either their sole or gross negligence or their willfulmisconduct.
Our aircraft and other equipment lease and financing agreements typically contain provisionsrequiring us, as the lessee or obligor, to indemnify the other parties to those agreements, includingcertain of those parties' related persons, against virtually any liabilities that might arise from theuse or operation of the aircraft or such other equipment.
We believe that our insurance would cover most of our exposure to liabilities and relatedindemnities associated with the commercial real estate leases and aircraft and other equipmentlease and financing agreements described above. While our insurance does not typically coverenvironmental liabilities, we have certain insurance policies in place as required by applicableenvironmental laws.
Certain of our aircraft and other financing transactions include provisions, which require us tomake payments to preserve an expected economic return to the lenders if that economic return isdiminished due to certain changes in law or regulations. In certain of these financing transactions,we also bear the risk of certain changes in tax laws that would subject payments to non-U.S.lenders to withholding taxes.
We cannot reasonably estimate our potential future payments under the indemnities andrelated provisions described above because we cannot predict (1) when and under whatcircumstances these provisions may be triggered and (2) the amount that would be payable if theprovisions were triggered because the amounts would be based on facts and circumstancesexisting at such time.
Employees Under Collective Bargaining Agreements
At December 31, 2011, we had approximately 78,400 full-time equivalent employees.Approximately 16% of these employees were represented by unions, including the followingdomestic employee groups.
Employee Group
ApproximateNumber of Active
EmployeesRepresented Union
Date on whichCollective
BargainingAgreement Becomes
Amendable
Copyright © 2013 www.secdatabase.com. All Rights Reserved.Please Consider the Environment Before Printing This Document
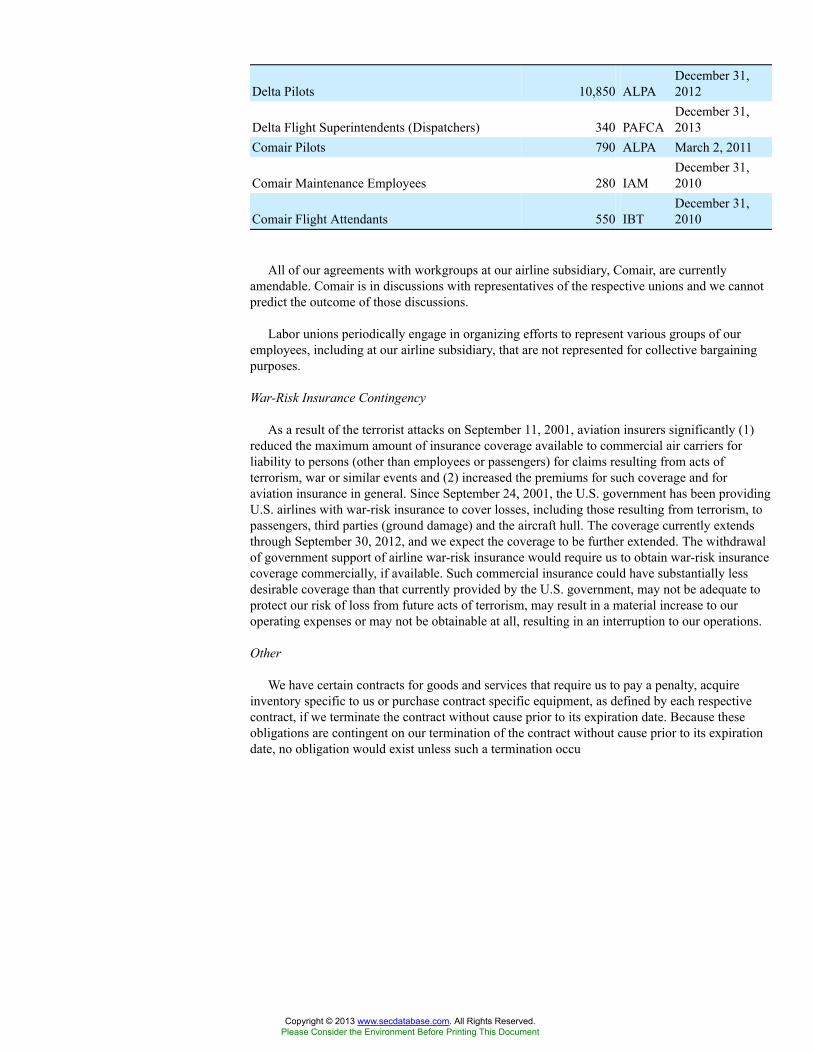
Delta Pilots 10,850 ALPADecember 31,2012
Delta Flight Superintendents (Dispatchers) 340 PAFCADecember 31,2013
Comair Pilots 790 ALPA March 2, 2011
Comair Maintenance Employees 280 IAMDecember 31,2010
Comair Flight Attendants 550 IBTDecember 31,2010
All of our agreements with workgroups at our airline subsidiary, Comair, are currentlyamendable. Comair is in discussions with representatives of the respective unions and we cannotpredict the outcome of those discussions.
Labor unions periodically engage in organizing efforts to represent various groups of ouremployees, including at our airline subsidiary, that are not represented for collective bargainingpurposes.
War-Risk Insurance Contingency
As a result of the terrorist attacks on September 11, 2001, aviation insurers significantly (1)reduced the maximum amount of insurance coverage available to commercial air carriers forliability to persons (other than employees or passengers) for claims resulting from acts ofterrorism, war or similar events and (2) increased the premiums for such coverage and foraviation insurance in general. Since September 24, 2001, the U.S. government has been providingU.S. airlines with war-risk insurance to cover losses, including those resulting from terrorism, topassengers, third parties (ground damage) and the aircraft hull. The coverage currently extendsthrough September 30, 2012, and we expect the coverage to be further extended. The withdrawalof government support of airline war-risk insurance would require us to obtain war-risk insurancecoverage commercially, if available. Such commercial insurance could have substantially lessdesirable coverage than that currently provided by the U.S. government, may not be adequate toprotect our risk of loss from future acts of terrorism, may result in a material increase to ouroperating expenses or may not be obtainable at all, resulting in an interruption to our operations.
Other
We have certain contracts for goods and services that require us to pay a penalty, acquireinventory specific to us or purchase contract specific equipment, as defined by each respectivecontract, if we terminate the contract without cause prior to its expiration date. Because theseobligations are contingent on our termination of the contract without cause prior to its expirationdate, no obligation would exist unless such a termination occu
Copyright © 2013 www.secdatabase.com. All Rights Reserved.Please Consider the Environment Before Printing This Document
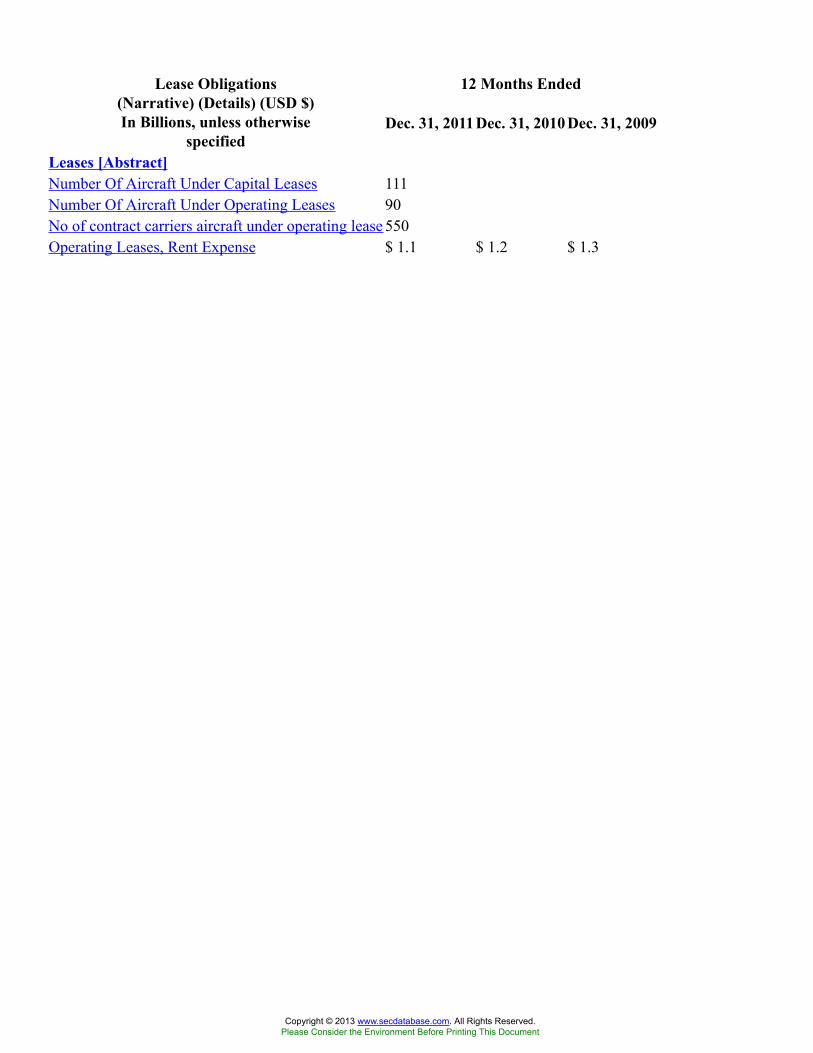
12 Months EndedLease Obligations(Narrative) (Details) (USD $)In Billions, unless otherwise
specifiedDec. 31, 2011Dec. 31, 2010 Dec. 31, 2009
Leases [Abstract]Number Of Aircraft Under Capital Leases 111Number Of Aircraft Under Operating Leases 90No of contract carriers aircraft under operating lease 550Operating Leases, Rent Expense $ 1.1 $ 1.2 $ 1.3
Copyright © 2013 www.secdatabase.com. All Rights Reserved.Please Consider the Environment Before Printing This Document
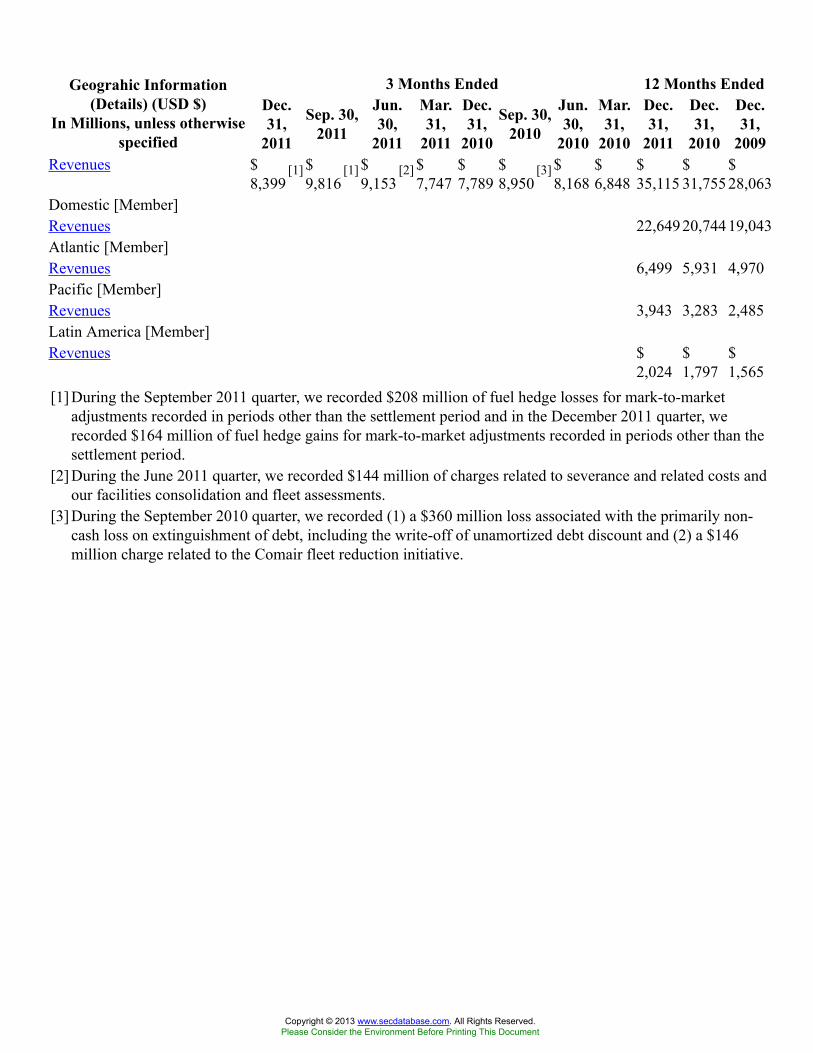
3 Months Ended 12 Months EndedGeograhic Information(Details) (USD $)
In Millions, unless otherwisespecified
Dec.31,
2011
Sep. 30,2011
Jun.30,
2011
Mar.31,
2011
Dec.31,
2010
Sep. 30,2010
Jun.30,
2010
Mar.31,
2010
Dec.31,
2011
Dec.31,
2010
Dec.31,
2009Revenues $
8,399[1] $
9,816[1] $
9,153[2] $
7,747$7,789
$8,950
[3] $8,168
$6,848
$35,115
$31,755
$28,063
Domestic [Member]Revenues 22,64920,74419,043Atlantic [Member]Revenues 6,499 5,931 4,970Pacific [Member]Revenues 3,943 3,283 2,485Latin America [Member]Revenues $
2,024$1,797
$1,565
[1] During the September 2011 quarter, we recorded $208 million of fuel hedge losses for mark-to-marketadjustments recorded in periods other than the settlement period and in the December 2011 quarter, werecorded $164 million of fuel hedge gains for mark-to-market adjustments recorded in periods other than thesettlement period.
[2] During the June 2011 quarter, we recorded $144 million of charges related to severance and related costs andour facilities consolidation and fleet assessments.
[3] During the September 2010 quarter, we recorded (1) a $360 million loss associated with the primarily non-cash loss on extinguishment of debt, including the write-off of unamortized debt discount and (2) a $146million charge related to the Comair fleet reduction initiative.
Copyright © 2013 www.secdatabase.com. All Rights Reserved.Please Consider the Environment Before Printing This Document
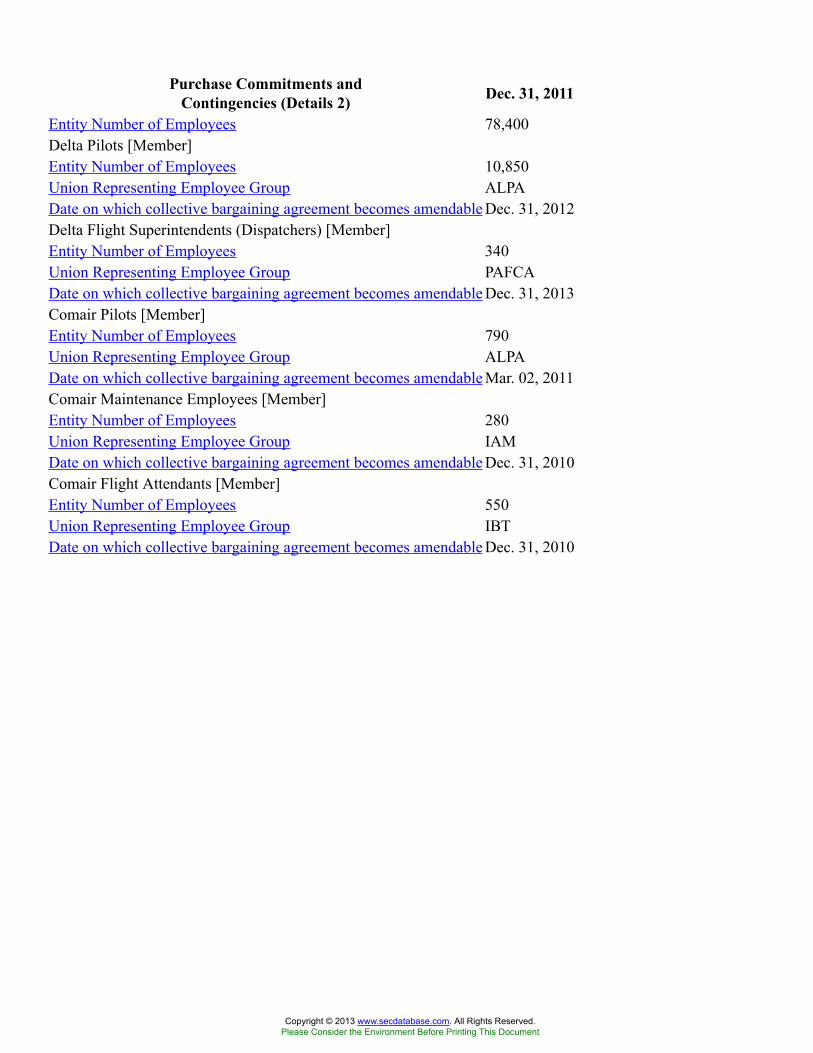
Purchase Commitments andContingencies (Details 2) Dec. 31, 2011
Entity Number of Employees 78,400Delta Pilots [Member]Entity Number of Employees 10,850Union Representing Employee Group ALPADate on which collective bargaining agreement becomes amendable Dec. 31, 2012Delta Flight Superintendents (Dispatchers) [Member]Entity Number of Employees 340Union Representing Employee Group PAFCADate on which collective bargaining agreement becomes amendable Dec. 31, 2013Comair Pilots [Member]Entity Number of Employees 790Union Representing Employee Group ALPADate on which collective bargaining agreement becomes amendable Mar. 02, 2011Comair Maintenance Employees [Member]Entity Number of Employees 280Union Representing Employee Group IAMDate on which collective bargaining agreement becomes amendable Dec. 31, 2010Comair Flight Attendants [Member]Entity Number of Employees 550Union Representing Employee Group IBTDate on which collective bargaining agreement becomes amendable Dec. 31, 2010
Copyright © 2013 www.secdatabase.com. All Rights Reserved.Please Consider the Environment Before Printing This Document
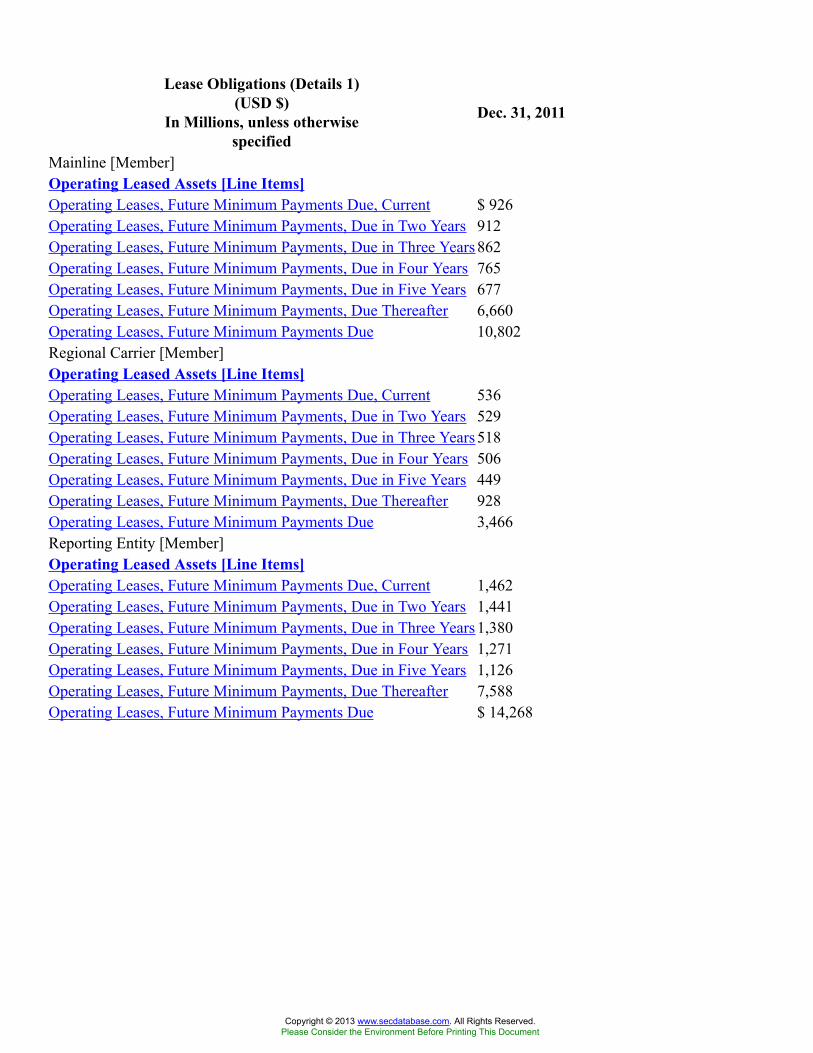
Lease Obligations (Details 1)(USD $)
In Millions, unless otherwisespecified
Dec. 31, 2011
Mainline [Member]Operating Leased Assets [Line Items]Operating Leases, Future Minimum Payments Due, Current $ 926Operating Leases, Future Minimum Payments, Due in Two Years 912Operating Leases, Future Minimum Payments, Due in Three Years 862Operating Leases, Future Minimum Payments, Due in Four Years 765Operating Leases, Future Minimum Payments, Due in Five Years 677Operating Leases, Future Minimum Payments, Due Thereafter 6,660Operating Leases, Future Minimum Payments Due 10,802Regional Carrier [Member]Operating Leased Assets [Line Items]Operating Leases, Future Minimum Payments Due, Current 536Operating Leases, Future Minimum Payments, Due in Two Years 529Operating Leases, Future Minimum Payments, Due in Three Years 518Operating Leases, Future Minimum Payments, Due in Four Years 506Operating Leases, Future Minimum Payments, Due in Five Years 449Operating Leases, Future Minimum Payments, Due Thereafter 928Operating Leases, Future Minimum Payments Due 3,466Reporting Entity [Member]Operating Leased Assets [Line Items]Operating Leases, Future Minimum Payments Due, Current 1,462Operating Leases, Future Minimum Payments, Due in Two Years 1,441Operating Leases, Future Minimum Payments, Due in Three Years 1,380Operating Leases, Future Minimum Payments, Due in Four Years 1,271Operating Leases, Future Minimum Payments, Due in Five Years 1,126Operating Leases, Future Minimum Payments, Due Thereafter 7,588Operating Leases, Future Minimum Payments Due $ 14,268
Copyright © 2013 www.secdatabase.com. All Rights Reserved.Please Consider the Environment Before Printing This Document
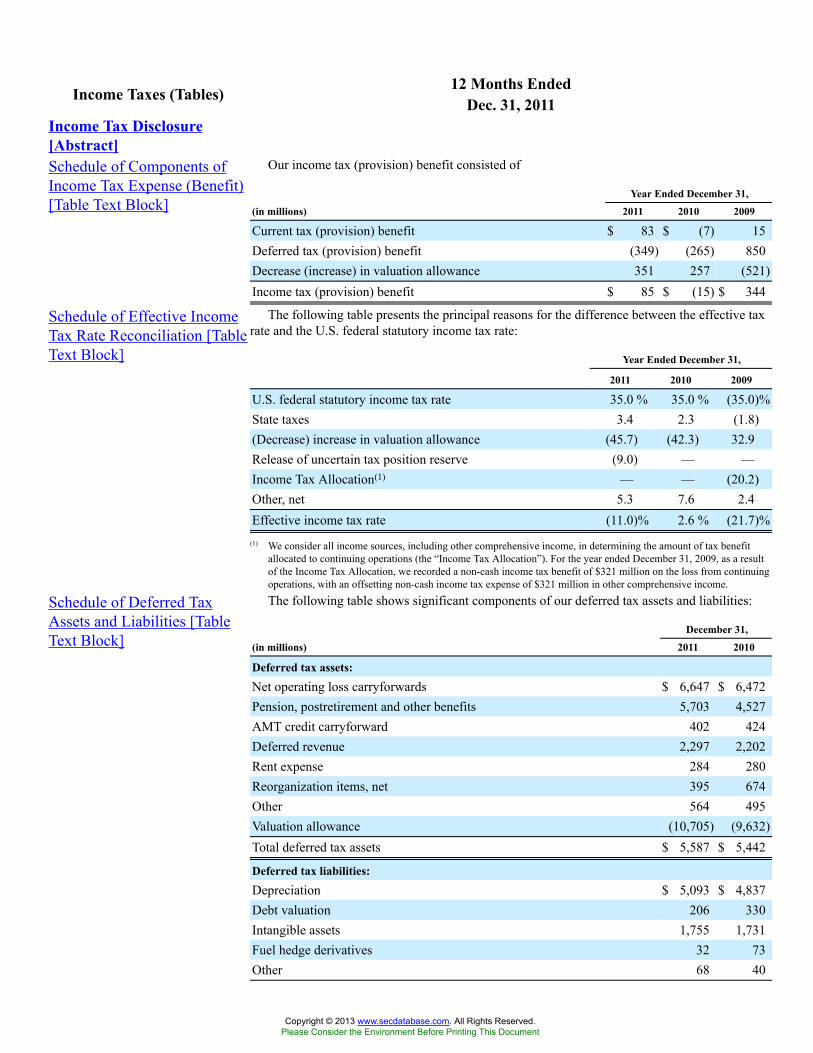
12 Months EndedIncome Taxes (Tables) Dec. 31, 2011Income Tax Disclosure[Abstract]Schedule of Components ofIncome Tax Expense (Benefit)[Table Text Block]
Our income tax (provision) benefit consisted of
Year Ended December 31,
(in millions) 2011 2010 2009
Current tax (provision) benefit $ 83 $ (7) 15Deferred tax (provision) benefit (349) (265) 850Decrease (increase) in valuation allowance 351 257 (521)Income tax (provision) benefit $ 85 $ (15) $ 344
Schedule of Effective IncomeTax Rate Reconciliation [TableText Block]
The following table presents the principal reasons for the difference between the effective taxrate and the U.S. federal statutory income tax rate:
Year Ended December 31,
2011 2010 2009
U.S. federal statutory income tax rate 35.0 % 35.0 % (35.0)%State taxes 3.4 2.3 (1.8)(Decrease) increase in valuation allowance (45.7) (42.3) 32.9Release of uncertain tax position reserve (9.0) — —Income Tax Allocation(1) — — (20.2)Other, net 5.3 7.6 2.4Effective income tax rate (11.0)% 2.6 % (21.7)%
(1) We consider all income sources, including other comprehensive income, in determining the amount of tax benefitallocated to continuing operations (the “Income Tax Allocation”). For the year ended December 31, 2009, as a resultof the Income Tax Allocation, we recorded a non-cash income tax benefit of $321 million on the loss from continuingoperations, with an offsetting non-cash income tax expense of $321 million in other comprehensive income.
Schedule of Deferred TaxAssets and Liabilities [TableText Block]
The following table shows significant components of our deferred tax assets and liabilities:
December 31,
(in millions) 2011 2010
Deferred tax assets:Net operating loss carryforwards $ 6,647 $ 6,472Pension, postretirement and other benefits 5,703 4,527AMT credit carryforward 402 424Deferred revenue 2,297 2,202Rent expense 284 280Reorganization items, net 395 674Other 564 495Valuation allowance (10,705) (9,632)Total deferred tax assets $ 5,587 $ 5,442
Deferred tax liabilities:Depreciation $ 5,093 $ 4,837Debt valuation 206 330Intangible assets 1,755 1,731Fuel hedge derivatives 32 73Other 68 40
Copyright © 2013 www.secdatabase.com. All Rights Reserved.Please Consider the Environment Before Printing This Document
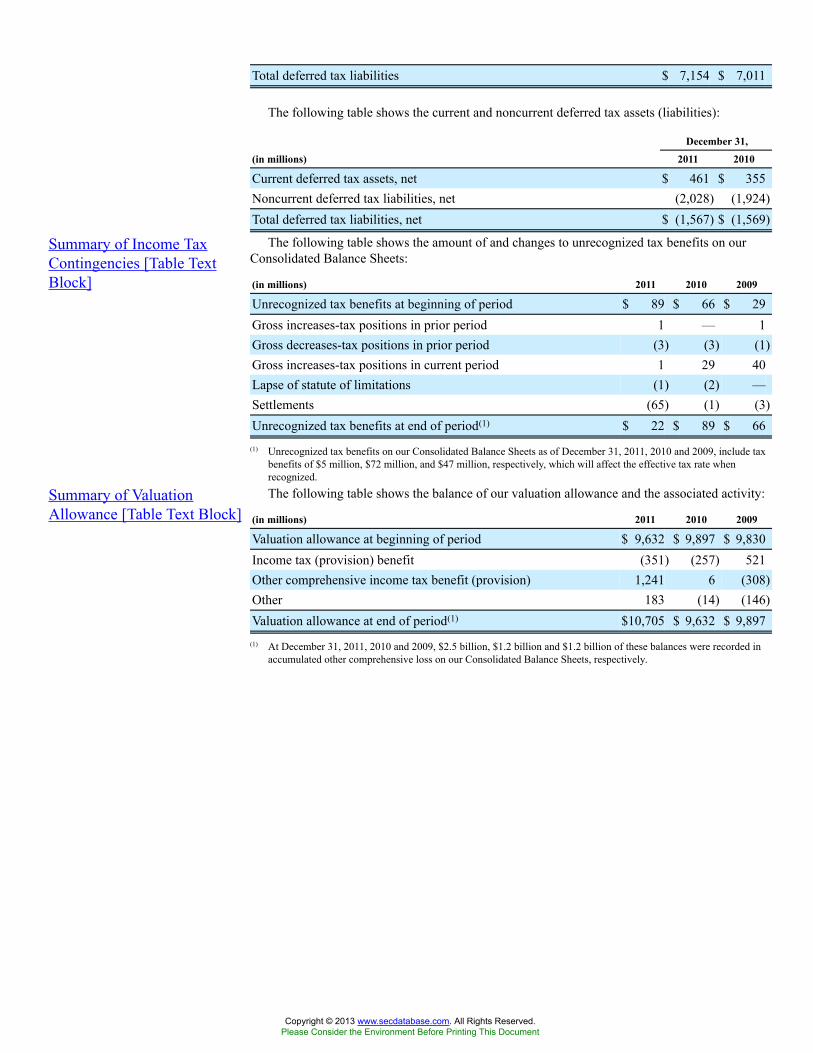
Total deferred tax liabilities $ 7,154 $ 7,011
The following table shows the current and noncurrent deferred tax assets (liabilities):
December 31,
(in millions) 2011 2010
Current deferred tax assets, net $ 461 $ 355Noncurrent deferred tax liabilities, net (2,028) (1,924)Total deferred tax liabilities, net $ (1,567) $ (1,569)
Summary of Income TaxContingencies [Table TextBlock]
The following table shows the amount of and changes to unrecognized tax benefits on ourConsolidated Balance Sheets:
(in millions) 2011 2010 2009
Unrecognized tax benefits at beginning of period $ 89 $ 66 $ 29Gross increases-tax positions in prior period 1 — 1Gross decreases-tax positions in prior period (3) (3) (1)Gross increases-tax positions in current period 1 29 40Lapse of statute of limitations (1) (2) —Settlements (65) (1) (3)Unrecognized tax benefits at end of period(1) $ 22 $ 89 $ 66
(1) Unrecognized tax benefits on our Consolidated Balance Sheets as of December 31, 2011, 2010 and 2009, include taxbenefits of $5 million, $72 million, and $47 million, respectively, which will affect the effective tax rate whenrecognized.
Summary of ValuationAllowance [Table Text Block]
The following table shows the balance of our valuation allowance and the associated activity:
(in millions) 2011 2010 2009
Valuation allowance at beginning of period $ 9,632 $ 9,897 $ 9,830Income tax (provision) benefit (351) (257) 521Other comprehensive income tax benefit (provision) 1,241 6 (308)Other 183 (14) (146)Valuation allowance at end of period(1) $10,705 $ 9,632 $ 9,897
(1) At December 31, 2011, 2010 and 2009, $2.5 billion, $1.2 billion and $1.2 billion of these balances were recorded inaccumulated other comprehensive loss on our Consolidated Balance Sheets, respectively.
Copyright © 2013 www.secdatabase.com. All Rights Reserved.Please Consider the Environment Before Printing This Document
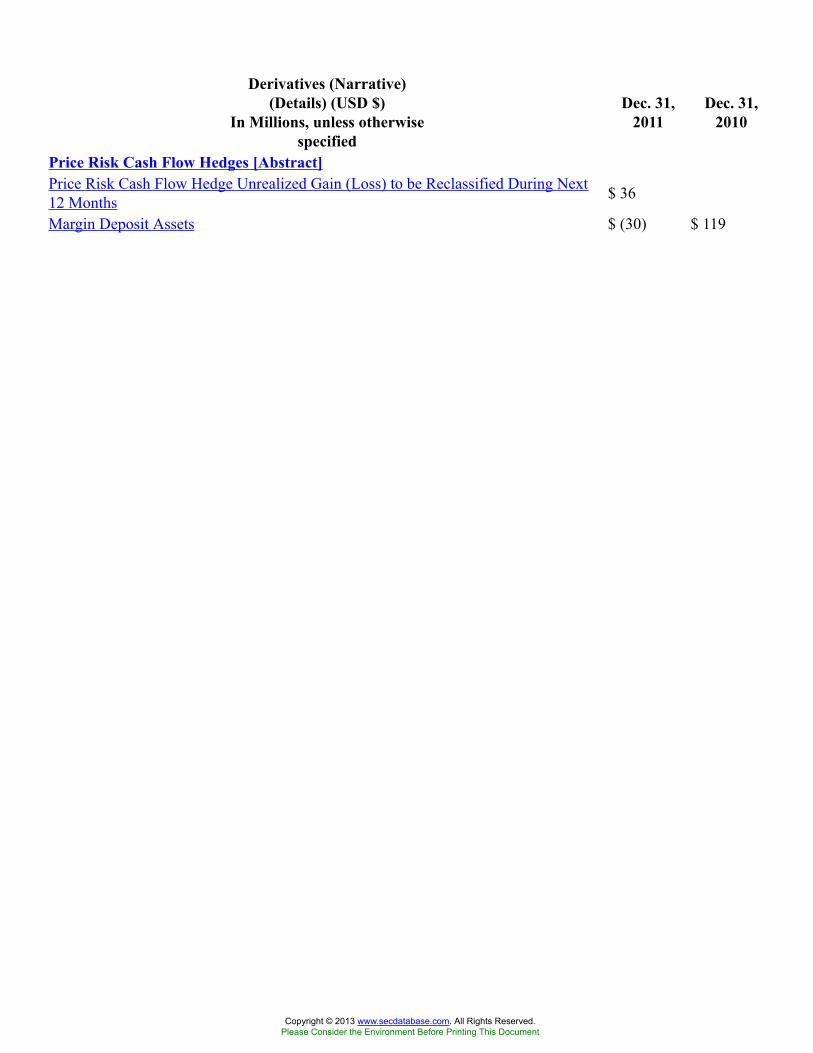
Derivatives (Narrative)(Details) (USD $)
In Millions, unless otherwisespecified
Dec. 31,2011
Dec. 31,2010
Price Risk Cash Flow Hedges [Abstract]Price Risk Cash Flow Hedge Unrealized Gain (Loss) to be Reclassified During Next12 Months $ 36
Margin Deposit Assets $ (30) $ 119
Copyright © 2013 www.secdatabase.com. All Rights Reserved.Please Consider the Environment Before Printing This Document
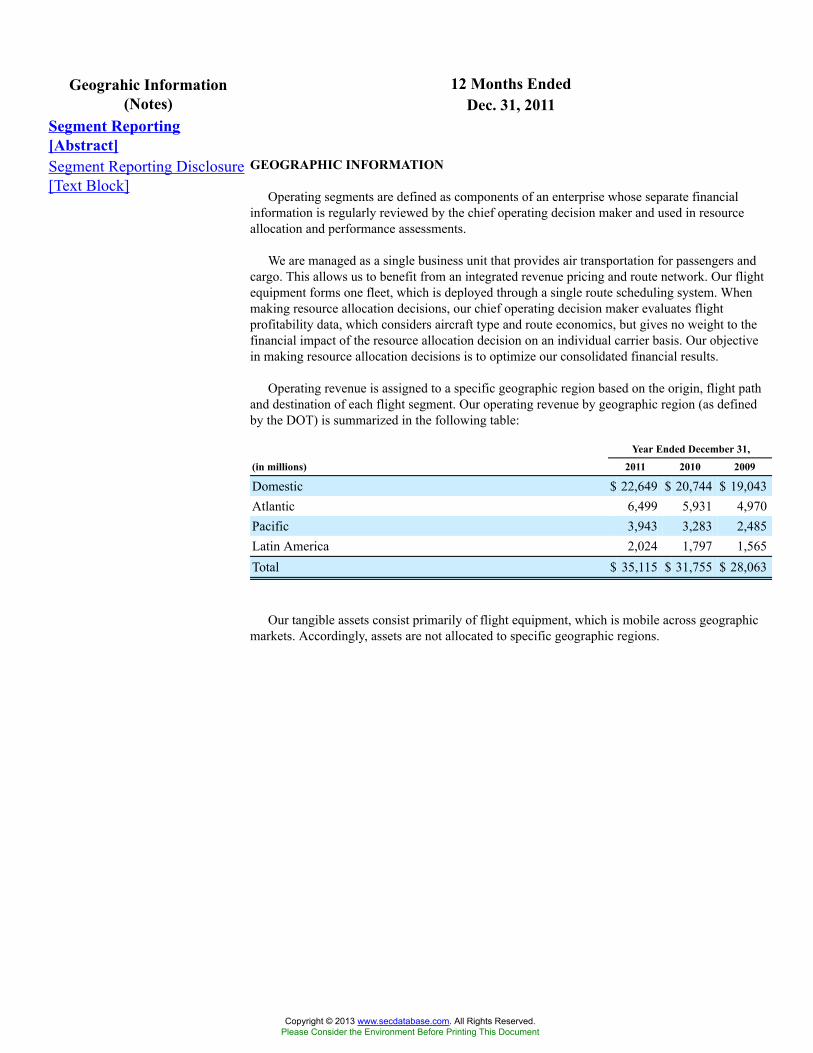
12 Months EndedGeograhic Information(Notes) Dec. 31, 2011
Segment Reporting[Abstract]Segment Reporting Disclosure[Text Block]
GEOGRAPHIC INFORMATION
Operating segments are defined as components of an enterprise whose separate financialinformation is regularly reviewed by the chief operating decision maker and used in resourceallocation and performance assessments.
We are managed as a single business unit that provides air transportation for passengers andcargo. This allows us to benefit from an integrated revenue pricing and route network. Our flightequipment forms one fleet, which is deployed through a single route scheduling system. Whenmaking resource allocation decisions, our chief operating decision maker evaluates flightprofitability data, which considers aircraft type and route economics, but gives no weight to thefinancial impact of the resource allocation decision on an individual carrier basis. Our objectivein making resource allocation decisions is to optimize our consolidated financial results.
Operating revenue is assigned to a specific geographic region based on the origin, flight pathand destination of each flight segment. Our operating revenue by geographic region (as definedby the DOT) is summarized in the following table:
Year Ended December 31,
(in millions) 2011 2010 2009
Domestic $ 22,649 $ 20,744 $ 19,043Atlantic 6,499 5,931 4,970Pacific 3,943 3,283 2,485Latin America 2,024 1,797 1,565Total $ 35,115 $ 31,755 $ 28,063
Our tangible assets consist primarily of flight equipment, which is mobile across geographicmarkets. Accordingly, assets are not allocated to specific geographic regions.
Copyright © 2013 www.secdatabase.com. All Rights Reserved.Please Consider the Environment Before Printing This Document
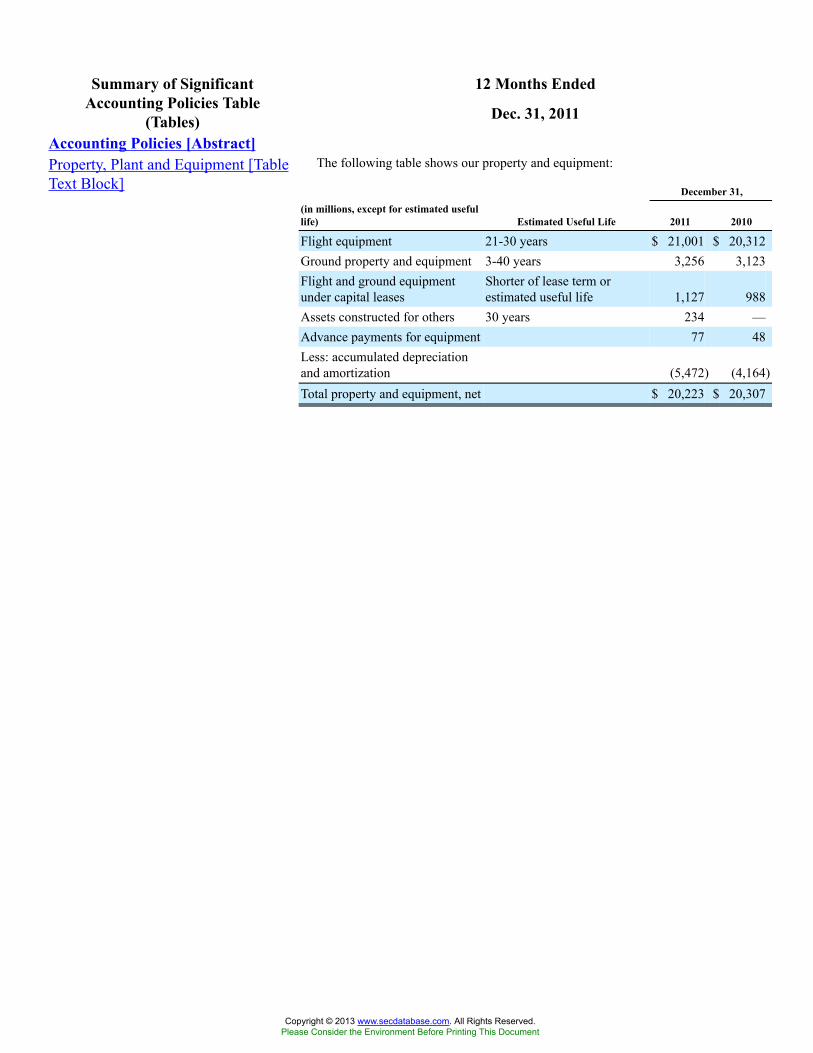
12 Months EndedSummary of SignificantAccounting Policies Table
(Tables) Dec. 31, 2011
Accounting Policies [Abstract]Property, Plant and Equipment [TableText Block]
The following table shows our property and equipment:
December 31,(in millions, except for estimated usefullife) Estimated Useful Life 2011 2010
Flight equipment 21-30 years $ 21,001 $ 20,312Ground property and equipment 3-40 years 3,256 3,123Flight and ground equipmentunder capital leases
Shorter of lease term orestimated useful life 1,127 988
Assets constructed for others 30 years 234 —Advance payments for equipment 77 48Less: accumulated depreciationand amortization (5,472) (4,164)Total property and equipment, net $ 20,223 $ 20,307
Copyright © 2013 www.secdatabase.com. All Rights Reserved.Please Consider the Environment Before Printing This Document

Derivatives (Details 1)In Millions, unless otherwise
specified
Dec.31,
2011USD($)
Dec.31,
2010USD($)
Dec. 31,2011
Prepaidexpensesand other
assets[Member]USD ($)
Dec. 31,2010
Prepaidexpensesand other
assets[Member]USD ($)
Dec. 31,2011
OtherAssets
[Member]USD ($)
Dec. 31,2010
OtherAssets
[Member]USD ($)
Dec. 31,2011
OtherLiabilities[Member]USD ($)
Dec. 31,2010
OtherLiabilities[Member]USD ($)
Dec. 31,2011
OtherNoncurrentLiabilities[Member]USD ($)
Dec. 31,2010
OtherNoncurrentLiabilities[Member]USD ($)
Dec. 31, 2011Not
Designatedas HedgingInstrument[Member]USD ($)Gallons
Dec. 31,2010Not
Designatedas HedgingInstrument[Member]USD ($)Gallons
Dec. 31,2011Not
Designatedas HedgingInstrument[Member]
CommodityContract[Member]
Dec. 31,2010Not
Designatedas HedgingInstrument[Member]
CommodityContract[Member]
Dec. 31,2011Not
Designatedas HedgingInstrument[Member]Prepaidexpensesand other
assets[Member]USD ($)
Dec. 31,2010Not
Designatedas HedgingInstrument[Member]Prepaidexpensesand other
assets[Member]USD ($)
Dec. 31,2011Not
Designatedas HedgingInstrument[Member]
OtherAssets
[Member]USD ($)
Dec. 31,2010Not
Designatedas HedgingInstrument[Member]
OtherAssets
[Member]USD ($)
Dec. 31,2011Not
Designatedas HedgingInstrument[Member]
OtherLiabilities[Member]USD ($)
Dec. 31,2010Not
Designatedas HedgingInstrument[Member]
OtherLiabilities[Member]USD ($)
Dec. 31,2011Not
Designatedas HedgingInstrument[Member]
OtherNoncurrentLiabilities[Member]USD ($)
Dec. 31,2010Not
Designatedas HedgingInstrument[Member]
OtherNoncurrentLiabilities[Member]USD ($)
Dec. 31,2011
Designatedas HedgingInstrument[Member]USD ($)
Dec. 31,2011
Designatedas HedgingInstrument[Member]
CAD
Dec. 31,2011
Designatedas HedgingInstrument[Member]
JPY (¥)
Dec. 31, 2010Designatedas HedgingInstrument[Member]USD ($)Gallons
Dec. 31, 2010Designatedas HedgingInstrument[Member]
CAD
Dec. 31, 2010Designatedas HedgingInstrument[Member]
JPY (¥)
Dec. 31, 2011Designated as Hedging Instrument
[Member]InterestRateCashFlowHedgesContract
[Member]
Dec. 31, 2010Designated as Hedging Instrument
[Member]InterestRateCashFlowHedgesContract
[Member]
Dec. 31, 2011Designated as Hedging Instrument
[Member]InterestRateFairValueHedgesContract
[Member]
Dec. 31,2010
Designatedas HedgingInstrument[Member]
CommodityContract[Member]
Dec. 31,2011
Designatedas HedgingInstrument[Member]
ForeignExchangeContract[Member]
Dec. 31,2010
Designatedas HedgingInstrument[Member]
ForeignExchangeContract[Member]
Dec. 31,2011
Designatedas HedgingInstrument[Member]Prepaidexpensesand other
assets[Member]USD ($)
Dec. 31,2010
Designatedas HedgingInstrument[Member]Prepaidexpensesand other
assets[Member]USD ($)
Dec. 31,2011
Designatedas HedgingInstrument[Member]
OtherAssets
[Member]USD ($)
Dec. 31,2010
Designatedas HedgingInstrument[Member]
OtherAssets
[Member]USD ($)
Dec. 31,2011
Designatedas HedgingInstrument[Member]
OtherLiabilities[Member]USD ($)
Dec. 31,2010
Designatedas HedgingInstrument[Member]
OtherLiabilities[Member]USD ($)
Dec. 31,2011
Designatedas HedgingInstrument[Member]
OtherNoncurrentLiabilities[Member]USD ($)
Dec. 31,2010
Designatedas HedgingInstrument[Member]
OtherNoncurrentLiabilities[Member]USD ($)
Derivatives, Fair Value [LineItems]Notional Amount of InterestRate Cash Flow HedgeDerivatives
$ 989 $ 1,143
Notional Amount of InterestRate Fair Value HedgeDerivatives
500
Notional Amount of ForeignCurrency Derivatives 313 126,993 233 141,100
Nonmonetary NotionalAmount of Price RiskDerivatives
1,225,000,000192,000,000 1,500,000,0001,500,000,000 1,500,000,000
Derivative, Higher RemainingMaturity Range
December2012 June 2012 May 2019 May 2019 August 2022 February
2012 April 2014 November2013
Interest Rate Cash Flow HedgeAsset at Fair Value 0 0 0 0
Interest Rate Cash Flow HedgeLiability at Fair Value 27 35 57 39
Interest Rate Cash Flow HedgeDerivative at Fair Value, Net (84) (74)
Interest Rate Fair Value HedgeAsset at Fair Value 0 0
Interest Rate Fair Value HedgeLiability at Fair Value 0 7
Interest Rate Fair Value HedgeDerivative at Fair Value, Net (7)
Foreign Currency Fair ValueHedge Asset at Fair Value 7 0 5 0
Foreign Currency Fair ValueHedge Liability at Fair Value 58 60 43 36
Foreign Currency Fair ValueHedge Derivative at FairValue, Net
(89) (96)
Price Risk Derivative Assets,at Fair Value 570 27 0 14 328 24
Price Risk DerivativeLiabilities, at Fair Value 500 19 0 8 0 0
Price Risk Derivatives, at FairValue, Net 70 14 352
Derivative Asset, Fair Value,Gross Asset 577 355 5 38
Derivative Liability, FairValue, Gross Liability (585) (114) (107) (83)
Derivative, Fair Value, Net $110
$(196)
Copyright © 2013 www.secdatabase.com. All Rights Reserved.Please Consider the Environment Before Printing This Document
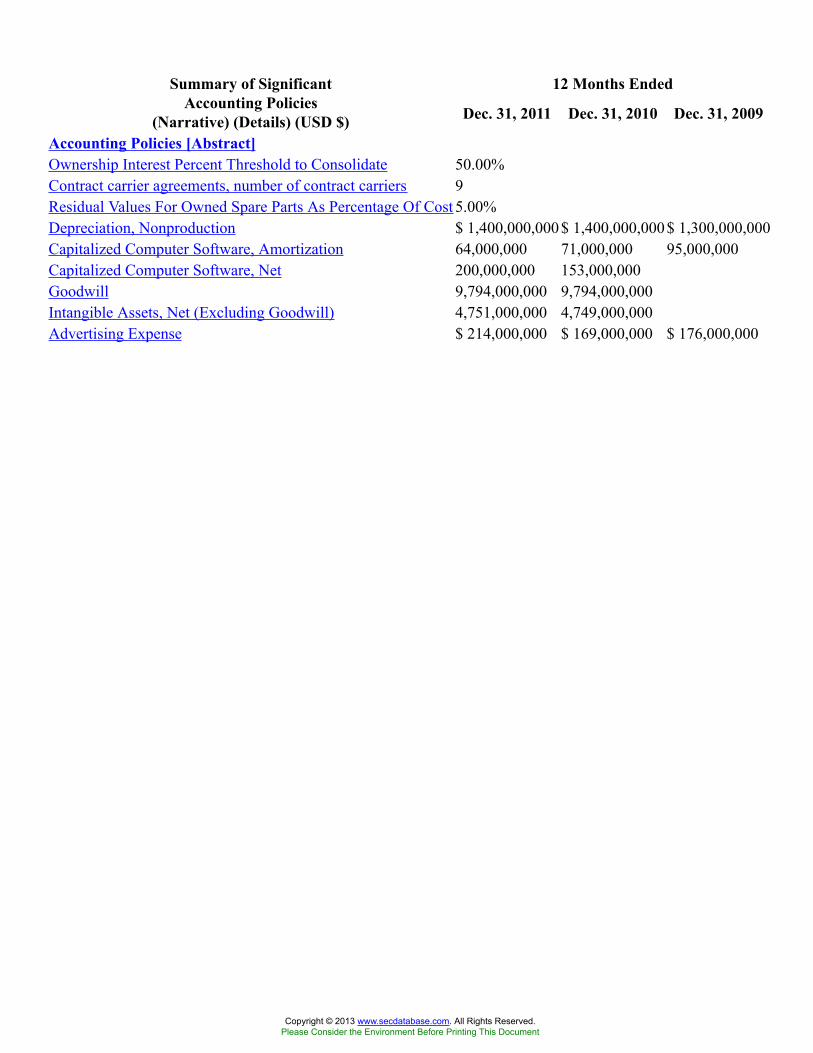
12 Months EndedSummary of SignificantAccounting Policies
(Narrative) (Details) (USD $) Dec. 31, 2011 Dec. 31, 2010 Dec. 31, 2009
Accounting Policies [Abstract]Ownership Interest Percent Threshold to Consolidate 50.00%Contract carrier agreements, number of contract carriers 9Residual Values For Owned Spare Parts As Percentage Of Cost 5.00%Depreciation, Nonproduction $ 1,400,000,000$ 1,400,000,000$ 1,300,000,000Capitalized Computer Software, Amortization 64,000,000 71,000,000 95,000,000Capitalized Computer Software, Net 200,000,000 153,000,000Goodwill 9,794,000,000 9,794,000,000Intangible Assets, Net (Excluding Goodwill) 4,751,000,000 4,749,000,000Advertising Expense $ 214,000,000 $ 169,000,000 $ 176,000,000
Copyright © 2013 www.secdatabase.com. All Rights Reserved.Please Consider the Environment Before Printing This Document
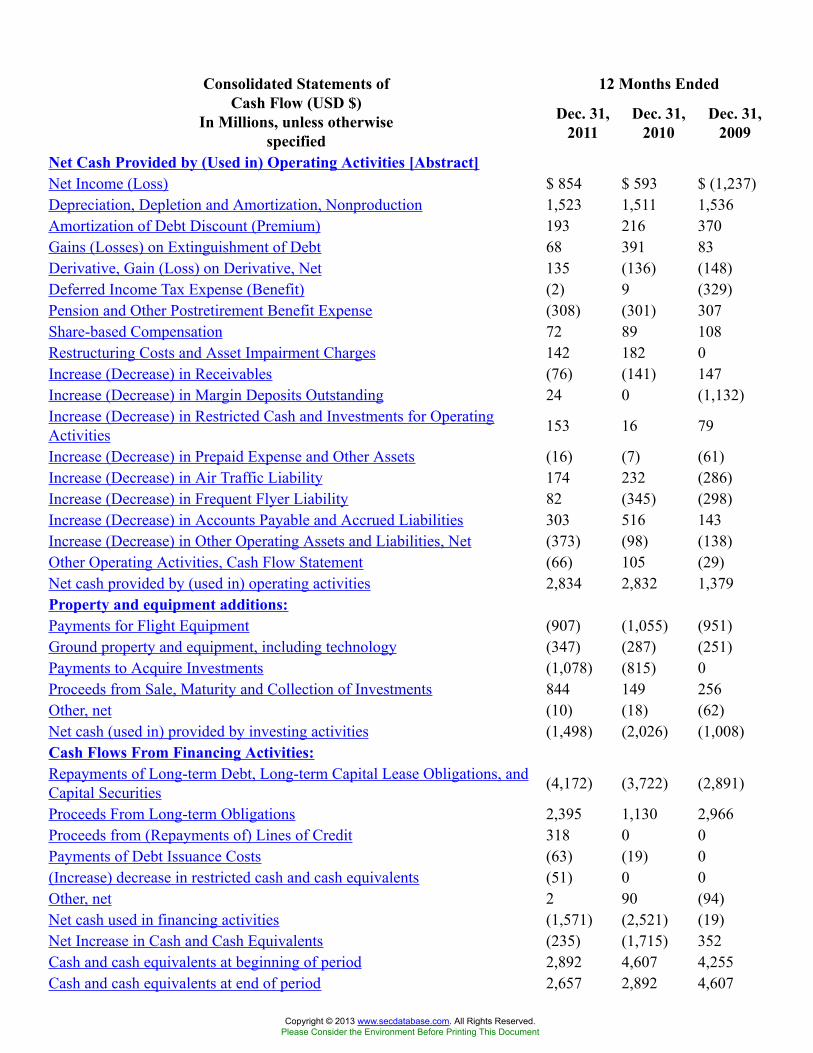
12 Months EndedConsolidated Statements ofCash Flow (USD $)
In Millions, unless otherwisespecified
Dec. 31,2011
Dec. 31,2010
Dec. 31,2009
Net Cash Provided by (Used in) Operating Activities [Abstract]Net Income (Loss) $ 854 $ 593 $ (1,237)Depreciation, Depletion and Amortization, Nonproduction 1,523 1,511 1,536Amortization of Debt Discount (Premium) 193 216 370Gains (Losses) on Extinguishment of Debt 68 391 83Derivative, Gain (Loss) on Derivative, Net 135 (136) (148)Deferred Income Tax Expense (Benefit) (2) 9 (329)Pension and Other Postretirement Benefit Expense (308) (301) 307Share-based Compensation 72 89 108Restructuring Costs and Asset Impairment Charges 142 182 0Increase (Decrease) in Receivables (76) (141) 147Increase (Decrease) in Margin Deposits Outstanding 24 0 (1,132)Increase (Decrease) in Restricted Cash and Investments for OperatingActivities 153 16 79
Increase (Decrease) in Prepaid Expense and Other Assets (16) (7) (61)Increase (Decrease) in Air Traffic Liability 174 232 (286)Increase (Decrease) in Frequent Flyer Liability 82 (345) (298)Increase (Decrease) in Accounts Payable and Accrued Liabilities 303 516 143Increase (Decrease) in Other Operating Assets and Liabilities, Net (373) (98) (138)Other Operating Activities, Cash Flow Statement (66) 105 (29)Net cash provided by (used in) operating activities 2,834 2,832 1,379Property and equipment additions:Payments for Flight Equipment (907) (1,055) (951)Ground property and equipment, including technology (347) (287) (251)Payments to Acquire Investments (1,078) (815) 0Proceeds from Sale, Maturity and Collection of Investments 844 149 256Other, net (10) (18) (62)Net cash (used in) provided by investing activities (1,498) (2,026) (1,008)Cash Flows From Financing Activities:Repayments of Long-term Debt, Long-term Capital Lease Obligations, andCapital Securities (4,172) (3,722) (2,891)
Proceeds From Long-term Obligations 2,395 1,130 2,966Proceeds from (Repayments of) Lines of Credit 318 0 0Payments of Debt Issuance Costs (63) (19) 0(Increase) decrease in restricted cash and cash equivalents (51) 0 0Other, net 2 90 (94)Net cash used in financing activities (1,571) (2,521) (19)Net Increase in Cash and Cash Equivalents (235) (1,715) 352Cash and cash equivalents at beginning of period 2,892 4,607 4,255Cash and cash equivalents at end of period 2,657 2,892 4,607
Copyright © 2013 www.secdatabase.com. All Rights Reserved.Please Consider the Environment Before Printing This Document
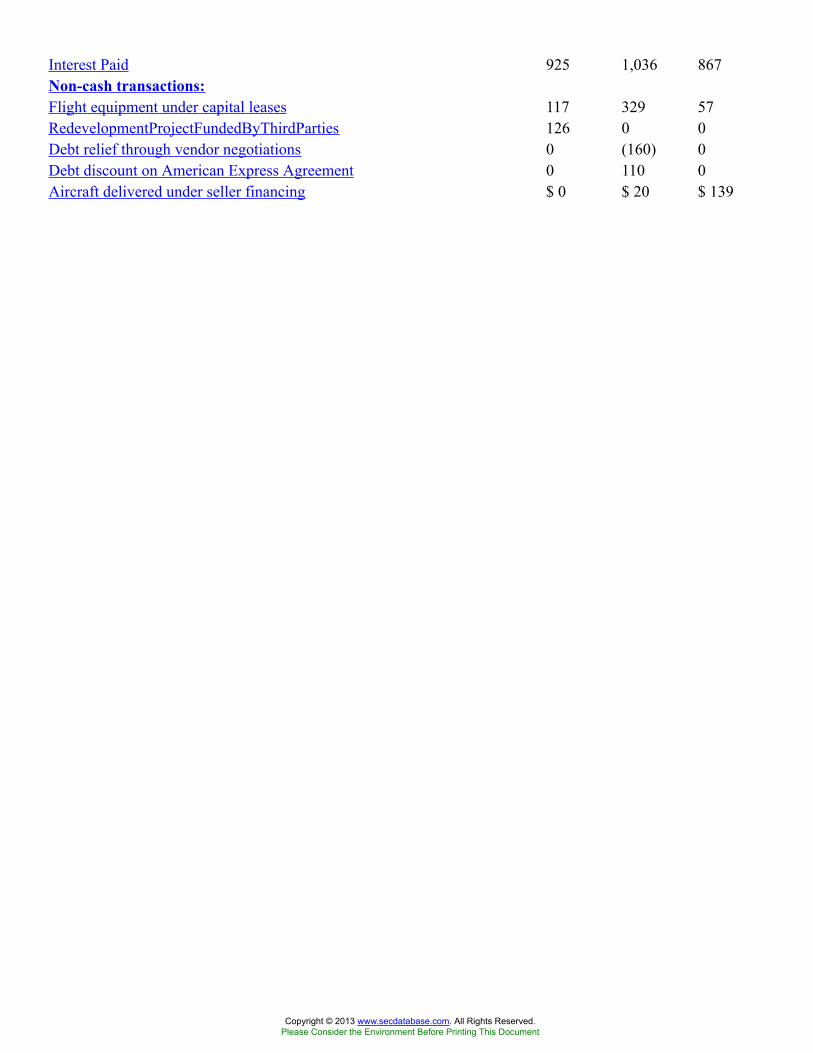
Interest Paid 925 1,036 867Non-cash transactions:Flight equipment under capital leases 117 329 57RedevelopmentProjectFundedByThirdParties 126 0 0Debt relief through vendor negotiations 0 (160) 0Debt discount on American Express Agreement 0 110 0Aircraft delivered under seller financing $ 0 $ 20 $ 139
Copyright © 2013 www.secdatabase.com. All Rights Reserved.Please Consider the Environment Before Printing This Document
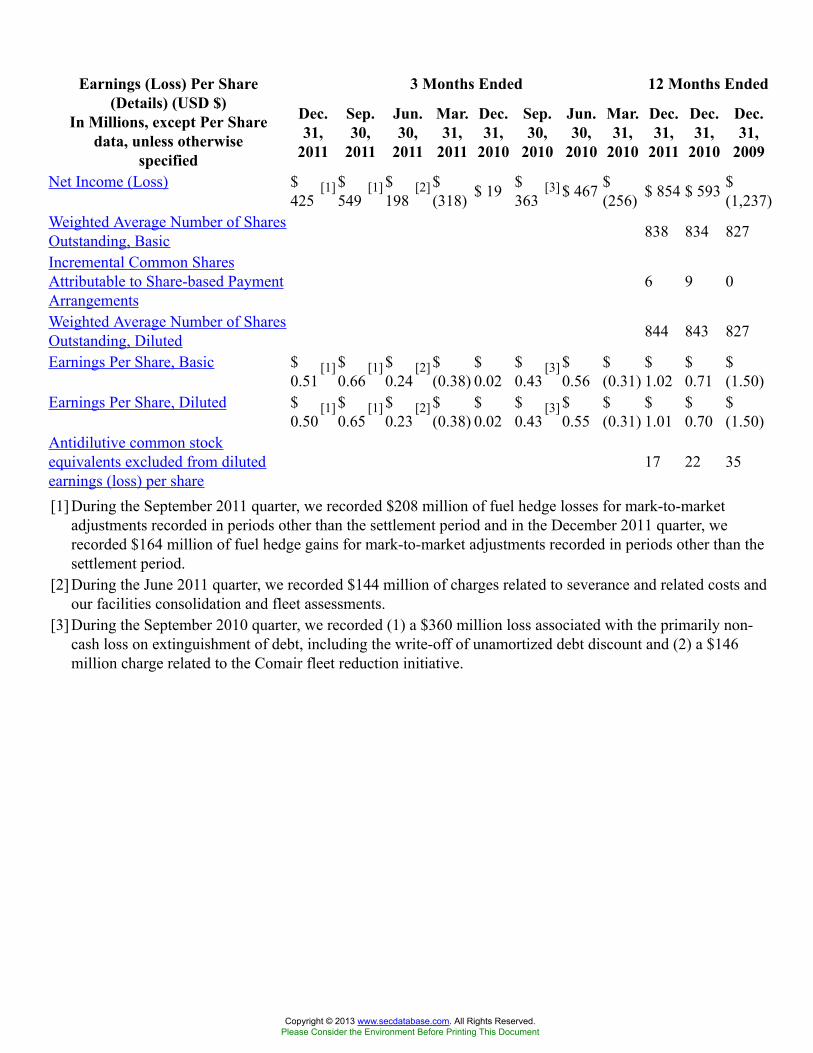
3 Months Ended 12 Months EndedEarnings (Loss) Per Share(Details) (USD $)
In Millions, except Per Sharedata, unless otherwise
specified
Dec.31,
2011
Sep.30,
2011
Jun.30,
2011
Mar.31,
2011
Dec.31,
2010
Sep.30,
2010
Jun.30,
2010
Mar.31,
2010
Dec.31,
2011
Dec.31,
2010
Dec.31,
2009
Net Income (Loss) $425
[1] $549
[1] $198
[2] $(318) $ 19 $
363[3] $ 467 $
(256) $ 854 $ 593 $(1,237)
Weighted Average Number of SharesOutstanding, Basic 838 834 827
Incremental Common SharesAttributable to Share-based PaymentArrangements
6 9 0
Weighted Average Number of SharesOutstanding, Diluted 844 843 827
Earnings Per Share, Basic $0.51
[1] $0.66
[1] $0.24
[2] $(0.38)
$0.02
$0.43
[3] $0.56
$(0.31)
$1.02
$0.71
$(1.50)
Earnings Per Share, Diluted $0.50
[1] $0.65
[1] $0.23
[2] $(0.38)
$0.02
$0.43
[3] $0.55
$(0.31)
$1.01
$0.70
$(1.50)
Antidilutive common stockequivalents excluded from dilutedearnings (loss) per share
17 22 35
[1] During the September 2011 quarter, we recorded $208 million of fuel hedge losses for mark-to-marketadjustments recorded in periods other than the settlement period and in the December 2011 quarter, werecorded $164 million of fuel hedge gains for mark-to-market adjustments recorded in periods other than thesettlement period.
[2] During the June 2011 quarter, we recorded $144 million of charges related to severance and related costs andour facilities consolidation and fleet assessments.
[3] During the September 2010 quarter, we recorded (1) a $360 million loss associated with the primarily non-cash loss on extinguishment of debt, including the write-off of unamortized debt discount and (2) a $146million charge related to the Comair fleet reduction initiative.
Copyright © 2013 www.secdatabase.com. All Rights Reserved.Please Consider the Environment Before Printing This Document
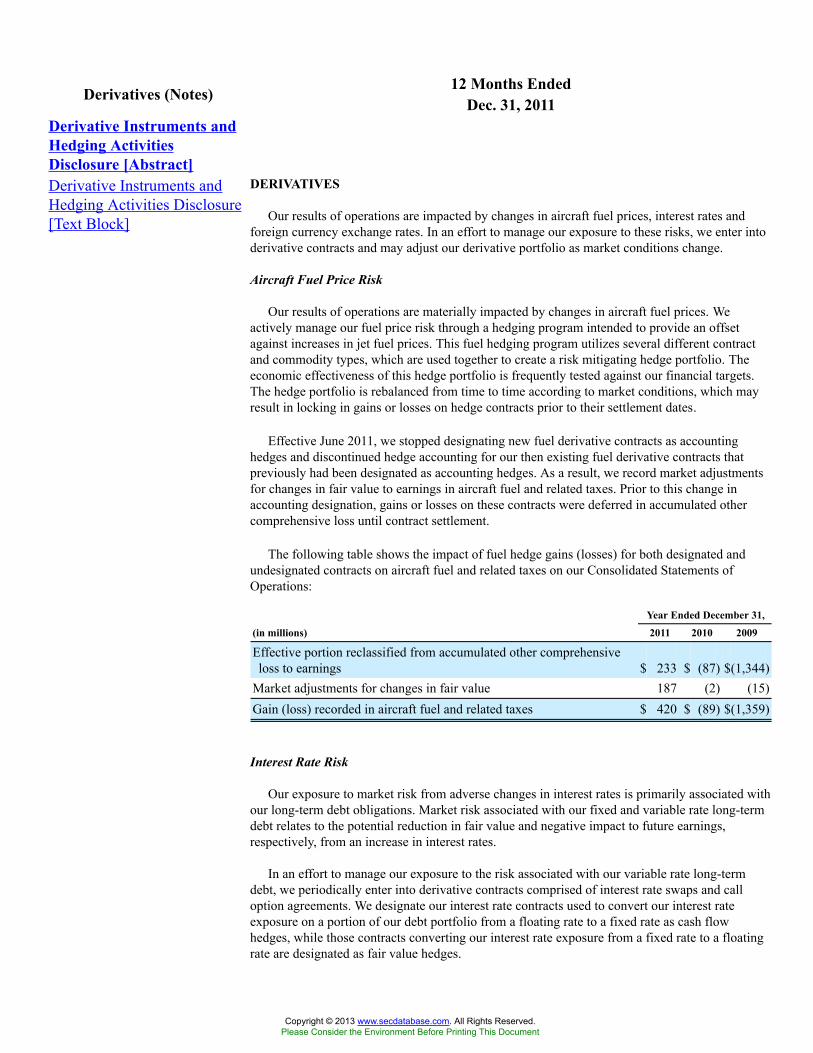
12 Months EndedDerivatives (Notes) Dec. 31, 2011Derivative Instruments andHedging ActivitiesDisclosure [Abstract]Derivative Instruments andHedging Activities Disclosure[Text Block]
DERIVATIVES
Our results of operations are impacted by changes in aircraft fuel prices, interest rates andforeign currency exchange rates. In an effort to manage our exposure to these risks, we enter intoderivative contracts and may adjust our derivative portfolio as market conditions change.
Aircraft Fuel Price Risk
Our results of operations are materially impacted by changes in aircraft fuel prices. Weactively manage our fuel price risk through a hedging program intended to provide an offsetagainst increases in jet fuel prices. This fuel hedging program utilizes several different contractand commodity types, which are used together to create a risk mitigating hedge portfolio. Theeconomic effectiveness of this hedge portfolio is frequently tested against our financial targets.The hedge portfolio is rebalanced from time to time according to market conditions, which mayresult in locking in gains or losses on hedge contracts prior to their settlement dates.
Effective June 2011, we stopped designating new fuel derivative contracts as accountinghedges and discontinued hedge accounting for our then existing fuel derivative contracts thatpreviously had been designated as accounting hedges. As a result, we record market adjustmentsfor changes in fair value to earnings in aircraft fuel and related taxes. Prior to this change inaccounting designation, gains or losses on these contracts were deferred in accumulated othercomprehensive loss until contract settlement.
The following table shows the impact of fuel hedge gains (losses) for both designated andundesignated contracts on aircraft fuel and related taxes on our Consolidated Statements ofOperations:
Year Ended December 31,
(in millions) 2011 2010 2009
Effective portion reclassified from accumulated other comprehensiveloss to earnings $ 233 $ (87) $(1,344)
Market adjustments for changes in fair value 187 (2) (15)Gain (loss) recorded in aircraft fuel and related taxes $ 420 $ (89) $(1,359)
Interest Rate Risk
Our exposure to market risk from adverse changes in interest rates is primarily associated withour long-term debt obligations. Market risk associated with our fixed and variable rate long-termdebt relates to the potential reduction in fair value and negative impact to future earnings,respectively, from an increase in interest rates.
In an effort to manage our exposure to the risk associated with our variable rate long-termdebt, we periodically enter into derivative contracts comprised of interest rate swaps and calloption agreements. We designate our interest rate contracts used to convert our interest rateexposure on a portion of our debt portfolio from a floating rate to a fixed rate as cash flowhedges, while those contracts converting our interest rate exposure from a fixed rate to a floatingrate are designated as fair value hedges.
Copyright © 2013 www.secdatabase.com. All Rights Reserved.Please Consider the Environment Before Printing This Document
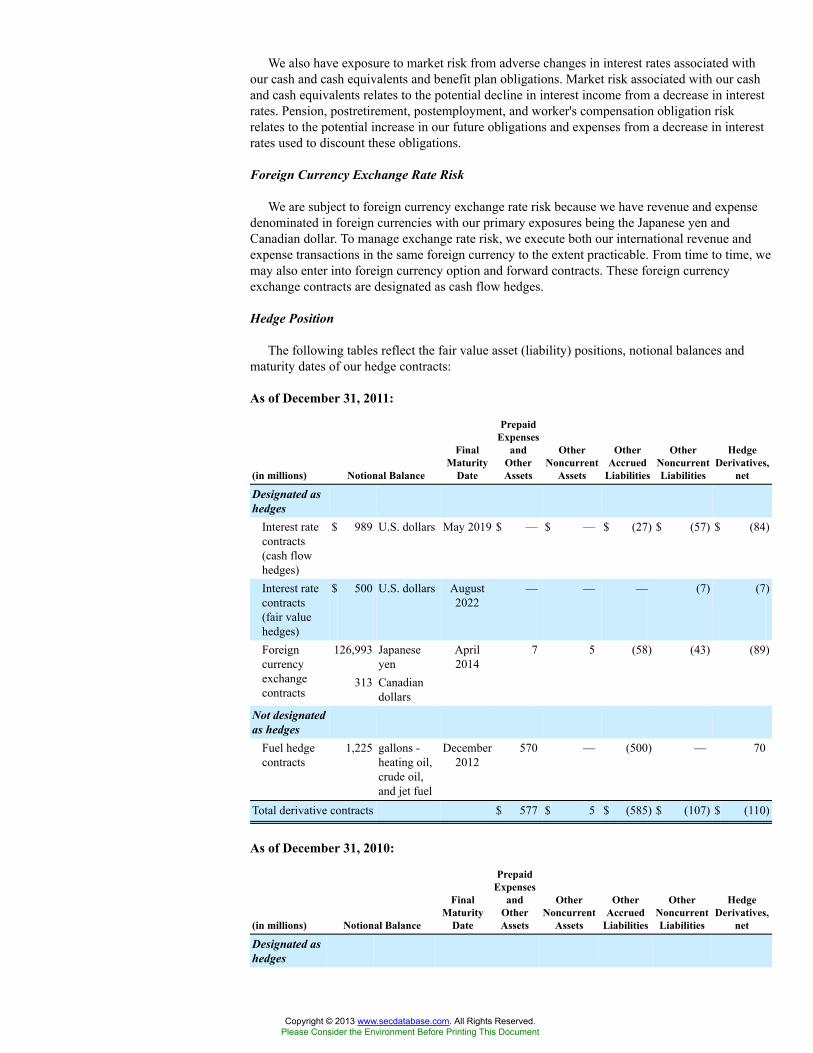
We also have exposure to market risk from adverse changes in interest rates associated withour cash and cash equivalents and benefit plan obligations. Market risk associated with our cashand cash equivalents relates to the potential decline in interest income from a decrease in interestrates. Pension, postretirement, postemployment, and worker's compensation obligation riskrelates to the potential increase in our future obligations and expenses from a decrease in interestrates used to discount these obligations.
Foreign Currency Exchange Rate Risk
We are subject to foreign currency exchange rate risk because we have revenue and expensedenominated in foreign currencies with our primary exposures being the Japanese yen andCanadian dollar. To manage exchange rate risk, we execute both our international revenue andexpense transactions in the same foreign currency to the extent practicable. From time to time, wemay also enter into foreign currency option and forward contracts. These foreign currencyexchange contracts are designated as cash flow hedges.
Hedge Position
The following tables reflect the fair value asset (liability) positions, notional balances andmaturity dates of our hedge contracts:
As of December 31, 2011:
(in millions) Notional Balance
FinalMaturity
Date
PrepaidExpenses
andOtherAssets
OtherNoncurrent
Assets
OtherAccrued
Liabilities
OtherNoncurrentLiabilities
HedgeDerivatives,
net
Designated ashedges
Interest ratecontracts(cash flowhedges)
$ 989 U.S. dollars May 2019 $ — $ — $ (27) $ (57) $ (84)
Interest ratecontracts(fair valuehedges)
$ 500 U.S. dollars August2022
— — — (7) (7)
126,993 Japaneseyen
Foreigncurrencyexchangecontracts
313 Canadiandollars
April2014
7 5 (58) (43) (89)
Not designatedas hedges
Fuel hedgecontracts
1,225 gallons -heating oil,crude oil,and jet fuel
December2012
570 — (500) — 70
Total derivative contracts $ 577 $ 5 $ (585) $ (107) $ (110)
As of December 31, 2010:
(in millions) Notional Balance
FinalMaturity
Date
PrepaidExpenses
andOtherAssets
OtherNoncurrent
Assets
OtherAccrued
Liabilities
OtherNoncurrentLiabilities
HedgeDerivatives,
net
Designated ashedges
Copyright © 2013 www.secdatabase.com. All Rights Reserved.Please Consider the Environment Before Printing This Document
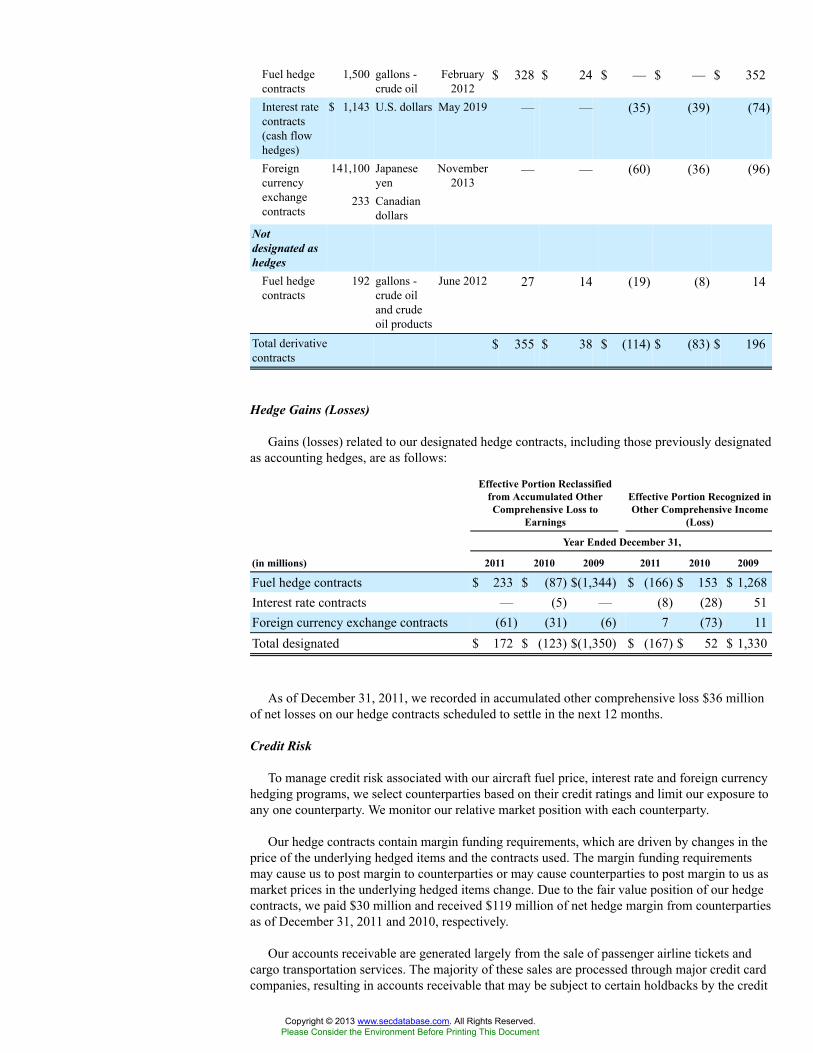
Fuel hedgecontracts
1,500 gallons -crude oil
February2012
$ 328 $ 24 $ — $ — $ 352
Interest ratecontracts(cash flowhedges)
$ 1,143 U.S. dollars May 2019 — — (35) (39) (74)
141,100 Japaneseyen
Foreigncurrencyexchangecontracts
233 Canadiandollars
November2013
— — (60) (36) (96)
Notdesignated ashedges
Fuel hedgecontracts
192 gallons -crude oiland crudeoil products
June 2012 27 14 (19) (8) 14
Total derivativecontracts
$ 355 $ 38 $ (114) $ (83) $ 196
Hedge Gains (Losses)
Gains (losses) related to our designated hedge contracts, including those previously designatedas accounting hedges, are as follows:
Effective Portion Reclassifiedfrom Accumulated OtherComprehensive Loss to
Earnings
Effective Portion Recognized inOther Comprehensive Income
(Loss)
Year Ended December 31,
(in millions) 2011 2010 2009 2011 2010 2009
Fuel hedge contracts $ 233 $ (87) $(1,344) $ (166) $ 153 $ 1,268Interest rate contracts — (5) — (8) (28) 51Foreign currency exchange contracts (61) (31) (6) 7 (73) 11Total designated $ 172 $ (123) $(1,350) $ (167) $ 52 $ 1,330
As of December 31, 2011, we recorded in accumulated other comprehensive loss $36 millionof net losses on our hedge contracts scheduled to settle in the next 12 months.
Credit Risk
To manage credit risk associated with our aircraft fuel price, interest rate and foreign currencyhedging programs, we select counterparties based on their credit ratings and limit our exposure toany one counterparty. We monitor our relative market position with each counterparty.
Our hedge contracts contain margin funding requirements, which are driven by changes in theprice of the underlying hedged items and the contracts used. The margin funding requirementsmay cause us to post margin to counterparties or may cause counterparties to post margin to us asmarket prices in the underlying hedged items change. Due to the fair value position of our hedgecontracts, we paid $30 million and received $119 million of net hedge margin from counterpartiesas of December 31, 2011 and 2010, respectively.
Our accounts receivable are generated largely from the sale of passenger airline tickets andcargo transportation services. The majority of these sales are processed through major credit cardcompanies, resulting in accounts receivable that may be subject to certain holdbacks by the credit
Copyright © 2013 www.secdatabase.com. All Rights Reserved.Please Consider the Environment Before Printing This Document
card processors. We also have receivables from the sale of mileage credits under our SkyMilesProgram to participating airlines and non-airline businesses such as credit card companies, hotels,and car rental agencies. The credit risk associated with our receivables is minimal.
Self-Insurance Risk
We self-insure a portion of our losses from claims related to workers' compensation,environmental issues, property damage, medical insurance for employees and general liability.Losses are accrued based on an estimate of the ultimate aggregate liability for claims incurred,using independent actuarial reviews based on standard industry practices and our historicalexperience. A portion of our projected workers' compensation liability is secured with restrictedcash collateral.
Copyright © 2013 www.secdatabase.com. All Rights Reserved.Please Consider the Environment Before Printing This Document
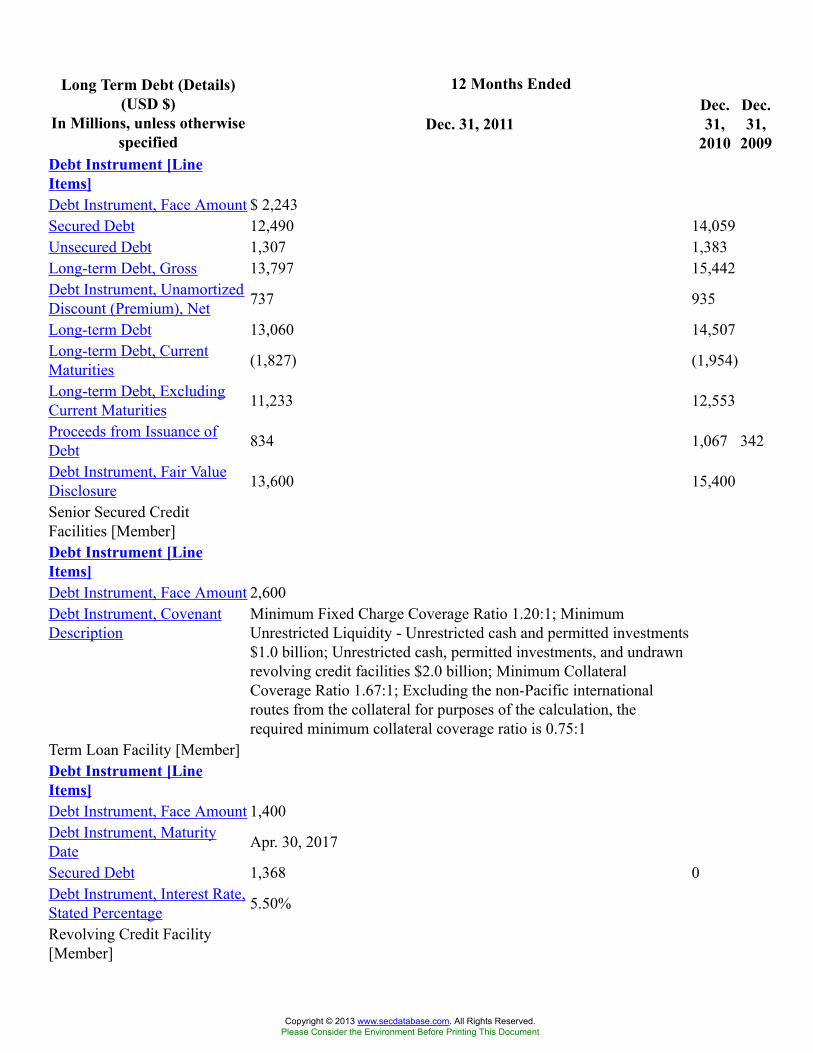
12 Months EndedLong Term Debt (Details)(USD $)
In Millions, unless otherwisespecified
Dec. 31, 2011Dec.31,
2010
Dec.31,
2009Debt Instrument [LineItems]Debt Instrument, Face Amount $ 2,243Secured Debt 12,490 14,059Unsecured Debt 1,307 1,383Long-term Debt, Gross 13,797 15,442Debt Instrument, UnamortizedDiscount (Premium), Net 737 935
Long-term Debt 13,060 14,507Long-term Debt, CurrentMaturities (1,827) (1,954)
Long-term Debt, ExcludingCurrent Maturities 11,233 12,553
Proceeds from Issuance ofDebt 834 1,067 342
Debt Instrument, Fair ValueDisclosure 13,600 15,400
Senior Secured CreditFacilities [Member]Debt Instrument [LineItems]Debt Instrument, Face Amount 2,600Debt Instrument, CovenantDescription
Minimum Fixed Charge Coverage Ratio 1.20:1; MinimumUnrestricted Liquidity - Unrestricted cash and permitted investments$1.0 billion; Unrestricted cash, permitted investments, and undrawnrevolving credit facilities $2.0 billion; Minimum CollateralCoverage Ratio 1.67:1; Excluding the non-Pacific internationalroutes from the collateral for purposes of the calculation, therequired minimum collateral coverage ratio is 0.75:1
Term Loan Facility [Member]Debt Instrument [LineItems]Debt Instrument, Face Amount 1,400Debt Instrument, MaturityDate Apr. 30, 2017
Secured Debt 1,368 0Debt Instrument, Interest Rate,Stated Percentage 5.50%
Revolving Credit Facility[Member]
Copyright © 2013 www.secdatabase.com. All Rights Reserved.Please Consider the Environment Before Printing This Document
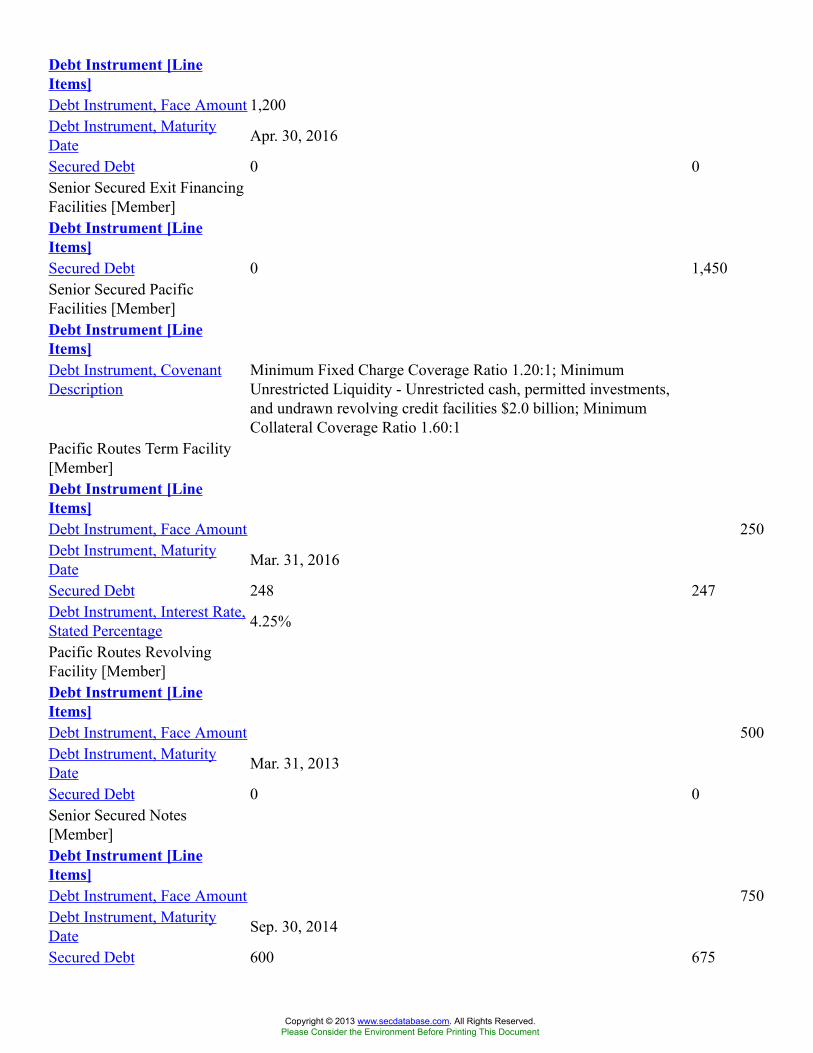
Debt Instrument [LineItems]Debt Instrument, Face Amount 1,200Debt Instrument, MaturityDate Apr. 30, 2016
Secured Debt 0 0Senior Secured Exit FinancingFacilities [Member]Debt Instrument [LineItems]Secured Debt 0 1,450Senior Secured PacificFacilities [Member]Debt Instrument [LineItems]Debt Instrument, CovenantDescription
Minimum Fixed Charge Coverage Ratio 1.20:1; MinimumUnrestricted Liquidity - Unrestricted cash, permitted investments,and undrawn revolving credit facilities $2.0 billion; MinimumCollateral Coverage Ratio 1.60:1
Pacific Routes Term Facility[Member]Debt Instrument [LineItems]Debt Instrument, Face Amount 250Debt Instrument, MaturityDate Mar. 31, 2016
Secured Debt 248 247Debt Instrument, Interest Rate,Stated Percentage 4.25%
Pacific Routes RevolvingFacility [Member]Debt Instrument [LineItems]Debt Instrument, Face Amount 500Debt Instrument, MaturityDate Mar. 31, 2013
Secured Debt 0 0Senior Secured Notes[Member]Debt Instrument [LineItems]Debt Instrument, Face Amount 750Debt Instrument, MaturityDate Sep. 30, 2014
Secured Debt 600 675
Copyright © 2013 www.secdatabase.com. All Rights Reserved.Please Consider the Environment Before Printing This Document
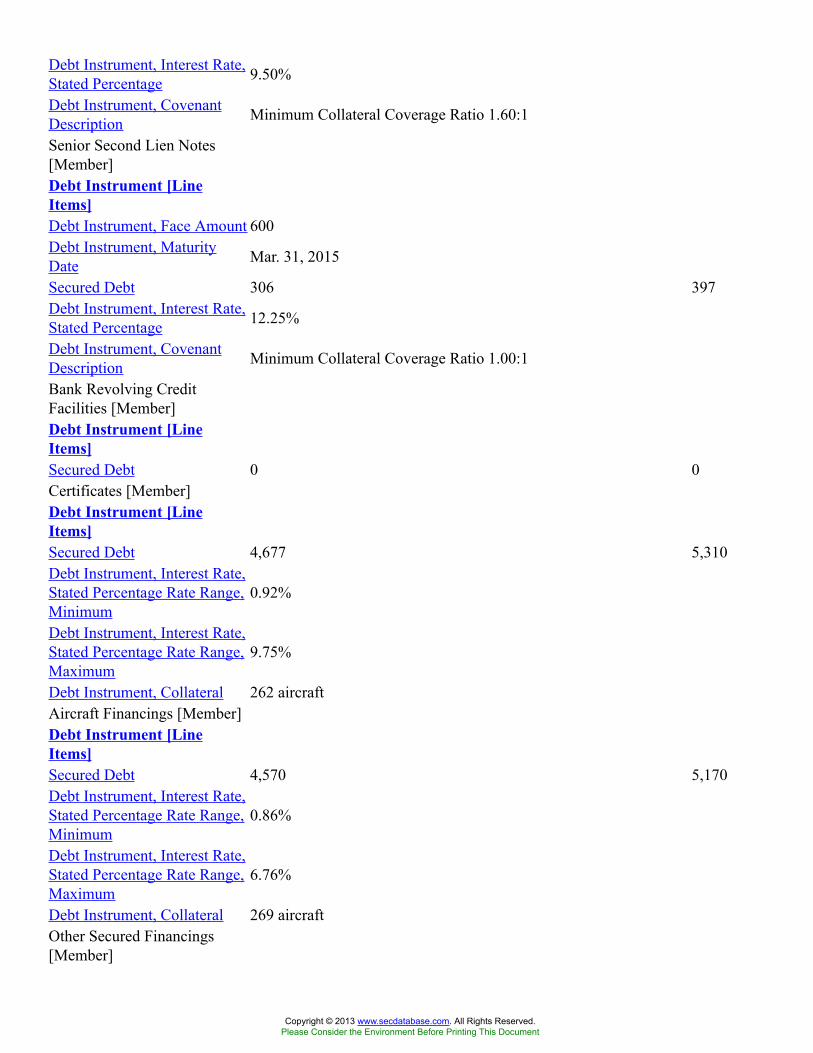
Debt Instrument, Interest Rate,Stated Percentage 9.50%
Debt Instrument, CovenantDescription Minimum Collateral Coverage Ratio 1.60:1
Senior Second Lien Notes[Member]Debt Instrument [LineItems]Debt Instrument, Face Amount 600Debt Instrument, MaturityDate Mar. 31, 2015
Secured Debt 306 397Debt Instrument, Interest Rate,Stated Percentage 12.25%
Debt Instrument, CovenantDescription Minimum Collateral Coverage Ratio 1.00:1
Bank Revolving CreditFacilities [Member]Debt Instrument [LineItems]Secured Debt 0 0Certificates [Member]Debt Instrument [LineItems]Secured Debt 4,677 5,310Debt Instrument, Interest Rate,Stated Percentage Rate Range,Minimum
0.92%
Debt Instrument, Interest Rate,Stated Percentage Rate Range,Maximum
9.75%
Debt Instrument, Collateral 262 aircraftAircraft Financings [Member]Debt Instrument [LineItems]Secured Debt 4,570 5,170Debt Instrument, Interest Rate,Stated Percentage Rate Range,Minimum
0.86%
Debt Instrument, Interest Rate,Stated Percentage Rate Range,Maximum
6.76%
Debt Instrument, Collateral 269 aircraftOther Secured Financings[Member]
Copyright © 2013 www.secdatabase.com. All Rights Reserved.Please Consider the Environment Before Printing This Document
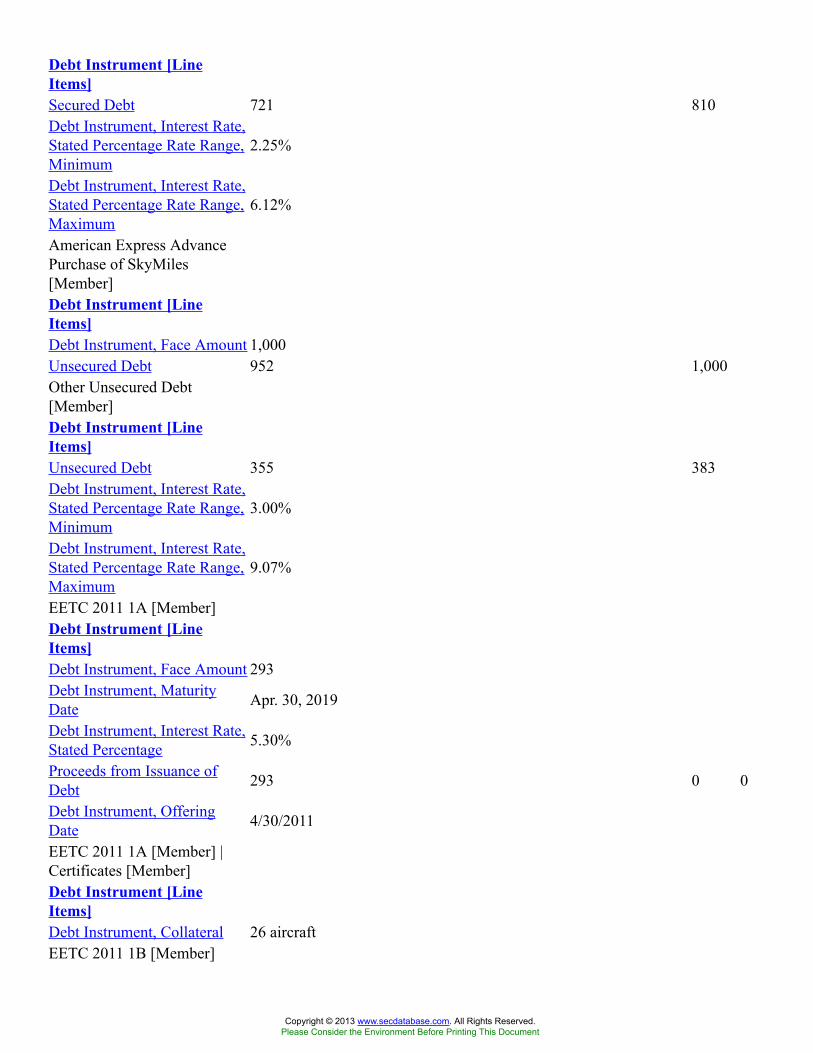
Debt Instrument [LineItems]Secured Debt 721 810Debt Instrument, Interest Rate,Stated Percentage Rate Range,Minimum
2.25%
Debt Instrument, Interest Rate,Stated Percentage Rate Range,Maximum
6.12%
American Express AdvancePurchase of SkyMiles[Member]Debt Instrument [LineItems]Debt Instrument, Face Amount 1,000Unsecured Debt 952 1,000Other Unsecured Debt[Member]Debt Instrument [LineItems]Unsecured Debt 355 383Debt Instrument, Interest Rate,Stated Percentage Rate Range,Minimum
3.00%
Debt Instrument, Interest Rate,Stated Percentage Rate Range,Maximum
9.07%
EETC 2011 1A [Member]Debt Instrument [LineItems]Debt Instrument, Face Amount 293Debt Instrument, MaturityDate Apr. 30, 2019
Debt Instrument, Interest Rate,Stated Percentage 5.30%
Proceeds from Issuance ofDebt 293 0 0
Debt Instrument, OfferingDate 4/30/2011
EETC 2011 1A [Member] |Certificates [Member]Debt Instrument [LineItems]Debt Instrument, Collateral 26 aircraftEETC 2011 1B [Member]
Copyright © 2013 www.secdatabase.com. All Rights Reserved.Please Consider the Environment Before Printing This Document
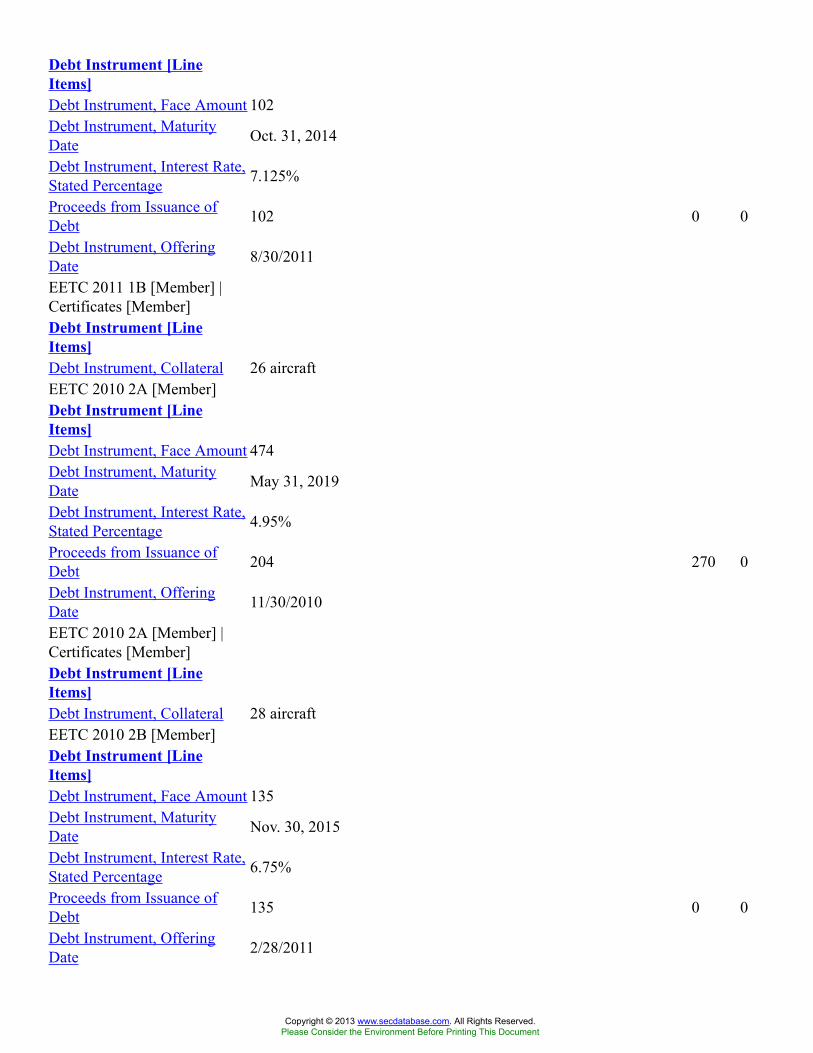
Debt Instrument [LineItems]Debt Instrument, Face Amount 102Debt Instrument, MaturityDate Oct. 31, 2014
Debt Instrument, Interest Rate,Stated Percentage 7.125%
Proceeds from Issuance ofDebt 102 0 0
Debt Instrument, OfferingDate 8/30/2011
EETC 2011 1B [Member] |Certificates [Member]Debt Instrument [LineItems]Debt Instrument, Collateral 26 aircraftEETC 2010 2A [Member]Debt Instrument [LineItems]Debt Instrument, Face Amount 474Debt Instrument, MaturityDate May 31, 2019
Debt Instrument, Interest Rate,Stated Percentage 4.95%
Proceeds from Issuance ofDebt 204 270 0
Debt Instrument, OfferingDate 11/30/2010
EETC 2010 2A [Member] |Certificates [Member]Debt Instrument [LineItems]Debt Instrument, Collateral 28 aircraftEETC 2010 2B [Member]Debt Instrument [LineItems]Debt Instrument, Face Amount 135Debt Instrument, MaturityDate Nov. 30, 2015
Debt Instrument, Interest Rate,Stated Percentage 6.75%
Proceeds from Issuance ofDebt 135 0 0
Debt Instrument, OfferingDate 2/28/2011
Copyright © 2013 www.secdatabase.com. All Rights Reserved.Please Consider the Environment Before Printing This Document
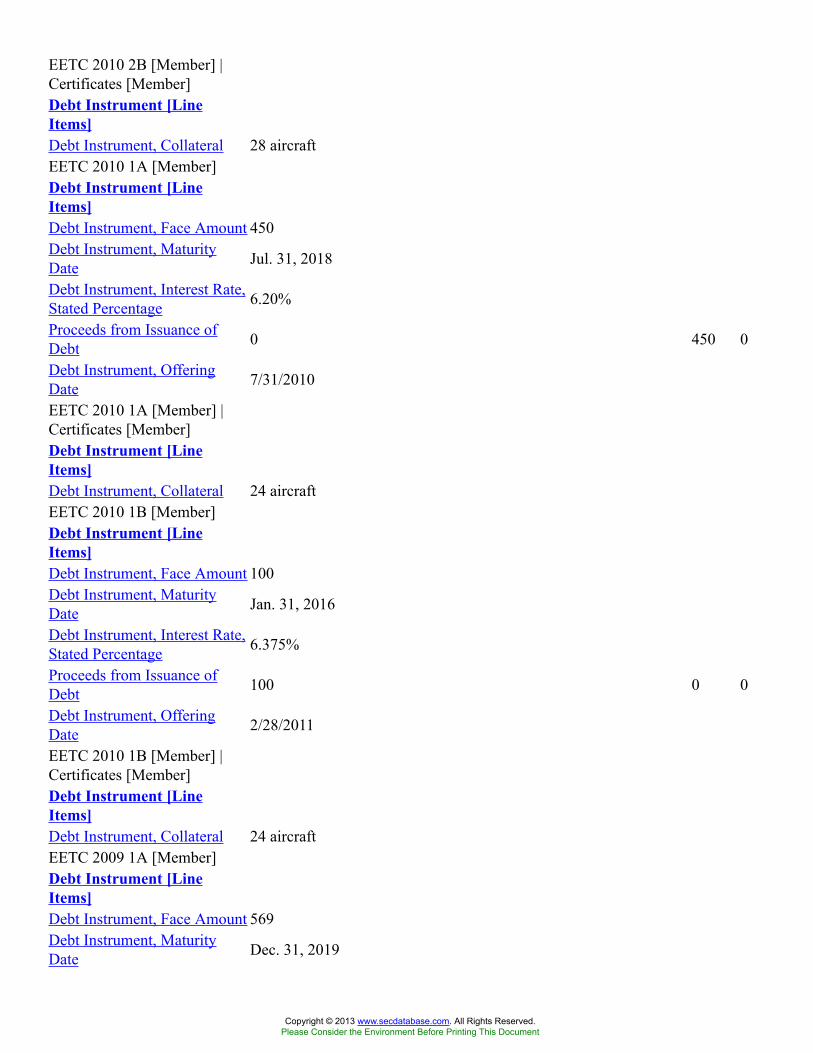
EETC 2010 2B [Member] |Certificates [Member]Debt Instrument [LineItems]Debt Instrument, Collateral 28 aircraftEETC 2010 1A [Member]Debt Instrument [LineItems]Debt Instrument, Face Amount 450Debt Instrument, MaturityDate Jul. 31, 2018
Debt Instrument, Interest Rate,Stated Percentage 6.20%
Proceeds from Issuance ofDebt 0 450 0
Debt Instrument, OfferingDate 7/31/2010
EETC 2010 1A [Member] |Certificates [Member]Debt Instrument [LineItems]Debt Instrument, Collateral 24 aircraftEETC 2010 1B [Member]Debt Instrument [LineItems]Debt Instrument, Face Amount 100Debt Instrument, MaturityDate Jan. 31, 2016
Debt Instrument, Interest Rate,Stated Percentage 6.375%
Proceeds from Issuance ofDebt 100 0 0
Debt Instrument, OfferingDate 2/28/2011
EETC 2010 1B [Member] |Certificates [Member]Debt Instrument [LineItems]Debt Instrument, Collateral 24 aircraftEETC 2009 1A [Member]Debt Instrument [LineItems]Debt Instrument, Face Amount 569Debt Instrument, MaturityDate Dec. 31, 2019
Copyright © 2013 www.secdatabase.com. All Rights Reserved.Please Consider the Environment Before Printing This Document
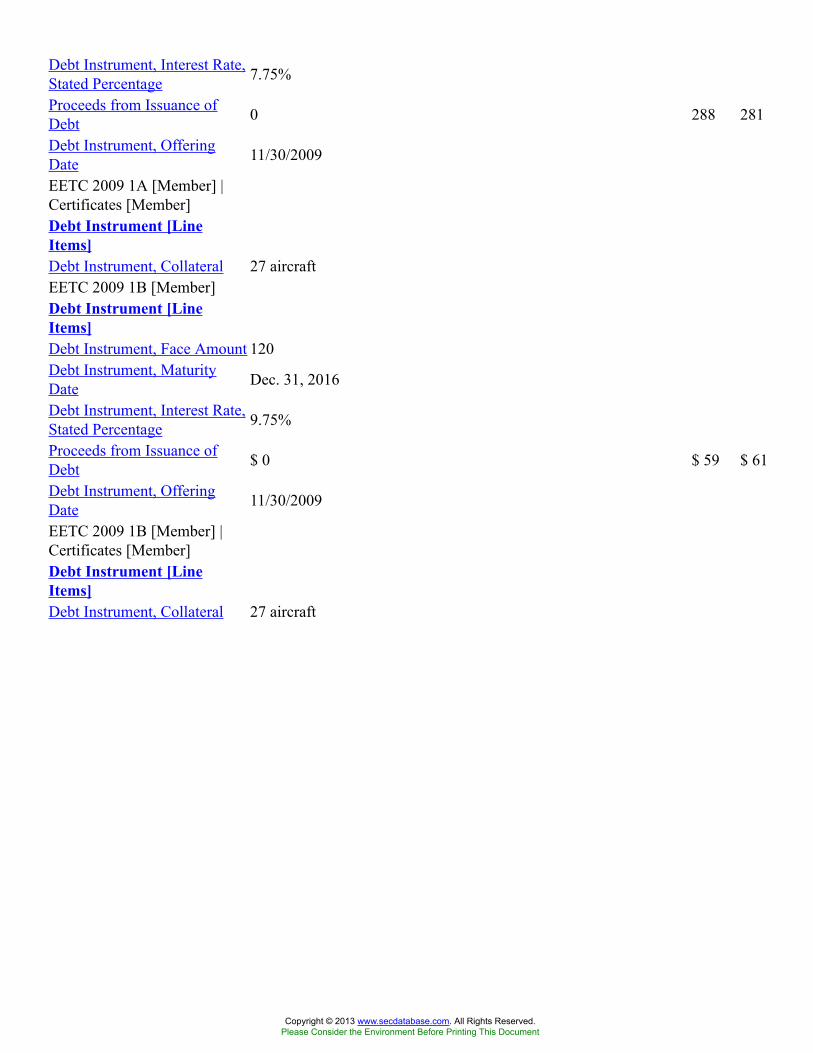
Debt Instrument, Interest Rate,Stated Percentage 7.75%
Proceeds from Issuance ofDebt 0 288 281
Debt Instrument, OfferingDate 11/30/2009
EETC 2009 1A [Member] |Certificates [Member]Debt Instrument [LineItems]Debt Instrument, Collateral 27 aircraftEETC 2009 1B [Member]Debt Instrument [LineItems]Debt Instrument, Face Amount 120Debt Instrument, MaturityDate Dec. 31, 2016
Debt Instrument, Interest Rate,Stated Percentage 9.75%
Proceeds from Issuance ofDebt $ 0 $ 59 $ 61
Debt Instrument, OfferingDate 11/30/2009
EETC 2009 1B [Member] |Certificates [Member]Debt Instrument [LineItems]Debt Instrument, Collateral 27 aircraft
Copyright © 2013 www.secdatabase.com. All Rights Reserved.Please Consider the Environment Before Printing This Document
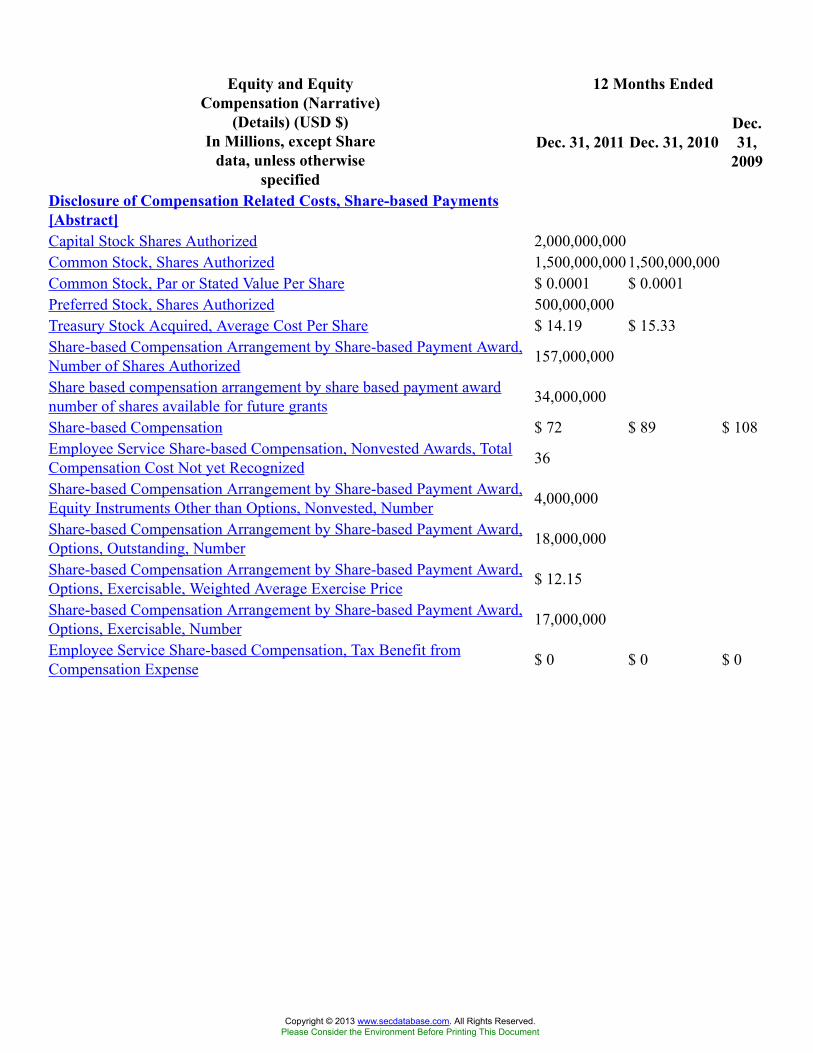
12 Months EndedEquity and EquityCompensation (Narrative)
(Details) (USD $)In Millions, except Share
data, unless otherwisespecified
Dec. 31, 2011 Dec. 31, 2010Dec.31,
2009
Disclosure of Compensation Related Costs, Share-based Payments[Abstract]Capital Stock Shares Authorized 2,000,000,000Common Stock, Shares Authorized 1,500,000,0001,500,000,000Common Stock, Par or Stated Value Per Share $ 0.0001 $ 0.0001Preferred Stock, Shares Authorized 500,000,000Treasury Stock Acquired, Average Cost Per Share $ 14.19 $ 15.33Share-based Compensation Arrangement by Share-based Payment Award,Number of Shares Authorized 157,000,000
Share based compensation arrangement by share based payment awardnumber of shares available for future grants 34,000,000
Share-based Compensation $ 72 $ 89 $ 108Employee Service Share-based Compensation, Nonvested Awards, TotalCompensation Cost Not yet Recognized 36
Share-based Compensation Arrangement by Share-based Payment Award,Equity Instruments Other than Options, Nonvested, Number 4,000,000
Share-based Compensation Arrangement by Share-based Payment Award,Options, Outstanding, Number 18,000,000
Share-based Compensation Arrangement by Share-based Payment Award,Options, Exercisable, Weighted Average Exercise Price $ 12.15
Share-based Compensation Arrangement by Share-based Payment Award,Options, Exercisable, Number 17,000,000
Employee Service Share-based Compensation, Tax Benefit fromCompensation Expense $ 0 $ 0 $ 0
Copyright © 2013 www.secdatabase.com. All Rights Reserved.Please Consider the Environment Before Printing This Document
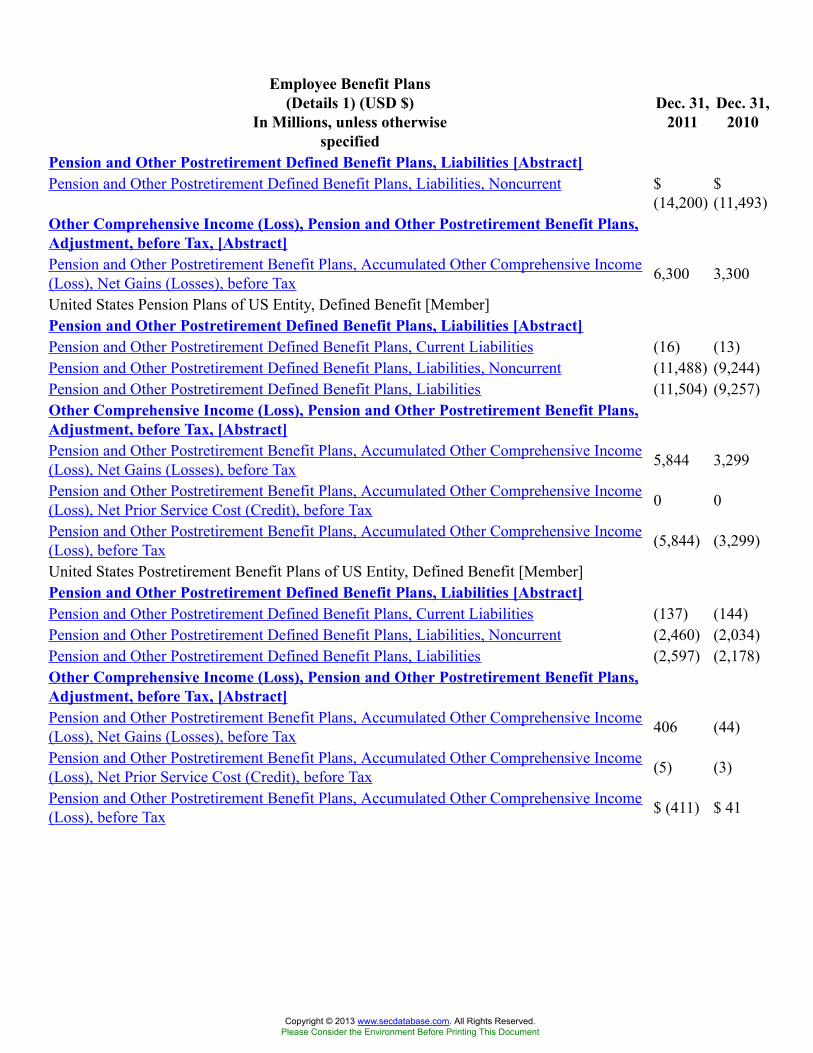
Employee Benefit Plans(Details 1) (USD $)
In Millions, unless otherwisespecified
Dec. 31,2011
Dec. 31,2010
Pension and Other Postretirement Defined Benefit Plans, Liabilities [Abstract]Pension and Other Postretirement Defined Benefit Plans, Liabilities, Noncurrent $
(14,200)$(11,493)
Other Comprehensive Income (Loss), Pension and Other Postretirement Benefit Plans,Adjustment, before Tax, [Abstract]Pension and Other Postretirement Benefit Plans, Accumulated Other Comprehensive Income(Loss), Net Gains (Losses), before Tax 6,300 3,300
United States Pension Plans of US Entity, Defined Benefit [Member]Pension and Other Postretirement Defined Benefit Plans, Liabilities [Abstract]Pension and Other Postretirement Defined Benefit Plans, Current Liabilities (16) (13)Pension and Other Postretirement Defined Benefit Plans, Liabilities, Noncurrent (11,488) (9,244)Pension and Other Postretirement Defined Benefit Plans, Liabilities (11,504) (9,257)Other Comprehensive Income (Loss), Pension and Other Postretirement Benefit Plans,Adjustment, before Tax, [Abstract]Pension and Other Postretirement Benefit Plans, Accumulated Other Comprehensive Income(Loss), Net Gains (Losses), before Tax 5,844 3,299
Pension and Other Postretirement Benefit Plans, Accumulated Other Comprehensive Income(Loss), Net Prior Service Cost (Credit), before Tax 0 0
Pension and Other Postretirement Benefit Plans, Accumulated Other Comprehensive Income(Loss), before Tax (5,844) (3,299)
United States Postretirement Benefit Plans of US Entity, Defined Benefit [Member]Pension and Other Postretirement Defined Benefit Plans, Liabilities [Abstract]Pension and Other Postretirement Defined Benefit Plans, Current Liabilities (137) (144)Pension and Other Postretirement Defined Benefit Plans, Liabilities, Noncurrent (2,460) (2,034)Pension and Other Postretirement Defined Benefit Plans, Liabilities (2,597) (2,178)Other Comprehensive Income (Loss), Pension and Other Postretirement Benefit Plans,Adjustment, before Tax, [Abstract]Pension and Other Postretirement Benefit Plans, Accumulated Other Comprehensive Income(Loss), Net Gains (Losses), before Tax 406 (44)
Pension and Other Postretirement Benefit Plans, Accumulated Other Comprehensive Income(Loss), Net Prior Service Cost (Credit), before Tax (5) (3)
Pension and Other Postretirement Benefit Plans, Accumulated Other Comprehensive Income(Loss), before Tax $ (411) $ 41
Copyright © 2013 www.secdatabase.com. All Rights Reserved.Please Consider the Environment Before Printing This Document
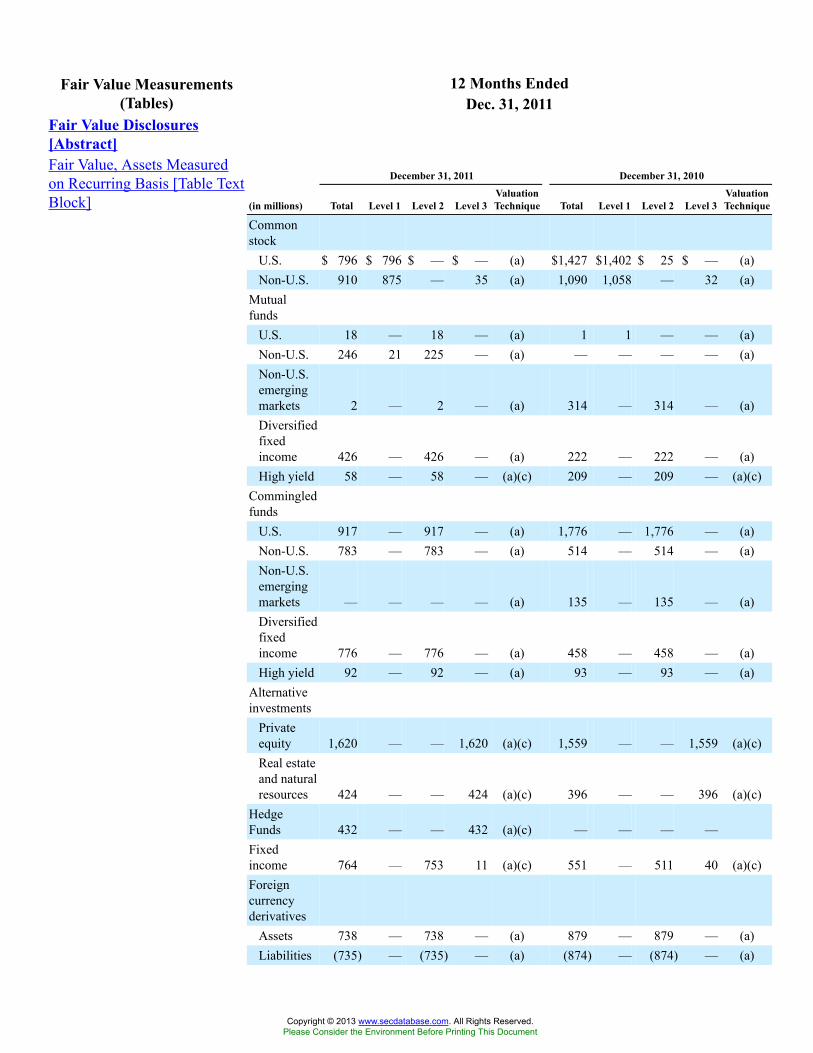
12 Months EndedFair Value Measurements(Tables) Dec. 31, 2011
Fair Value Disclosures[Abstract]Fair Value, Assets Measuredon Recurring Basis [Table TextBlock]
December 31, 2011 December 31, 2010
(in millions) Total Level 1 Level 2 Level 3ValuationTechnique Total Level 1 Level 2 Level 3
ValuationTechnique
Commonstock
U.S. $ 796 $ 796 $ — $ — (a) $1,427 $1,402 $ 25 $ — (a)Non-U.S. 910 875 — 35 (a) 1,090 1,058 — 32 (a)
Mutualfunds
U.S. 18 — 18 — (a) 1 1 — — (a)Non-U.S. 246 21 225 — (a) — — — — (a)Non-U.S.emergingmarkets 2 — 2 — (a) 314 — 314 — (a)Diversifiedfixedincome 426 — 426 — (a) 222 — 222 — (a)High yield 58 — 58 — (a)(c) 209 — 209 — (a)(c)
Commingledfunds
U.S. 917 — 917 — (a) 1,776 — 1,776 — (a)Non-U.S. 783 — 783 — (a) 514 — 514 — (a)Non-U.S.emergingmarkets — — — — (a) 135 — 135 — (a)Diversifiedfixedincome 776 — 776 — (a) 458 — 458 — (a)High yield 92 — 92 — (a) 93 — 93 — (a)
Alternativeinvestments
Privateequity 1,620 — — 1,620 (a)(c) 1,559 — — 1,559 (a)(c)Real estateand naturalresources 424 — — 424 (a)(c) 396 — — 396 (a)(c)
HedgeFunds 432 — — 432 (a)(c) — — — —Fixedincome 764 — 753 11 (a)(c) 551 — 511 40 (a)(c)Foreigncurrencyderivatives
Assets 738 — 738 — (a) 879 — 879 — (a)Liabilities (735) — (735) — (a) (874) — (874) — (a)
Copyright © 2013 www.secdatabase.com. All Rights Reserved.Please Consider the Environment Before Printing This Document
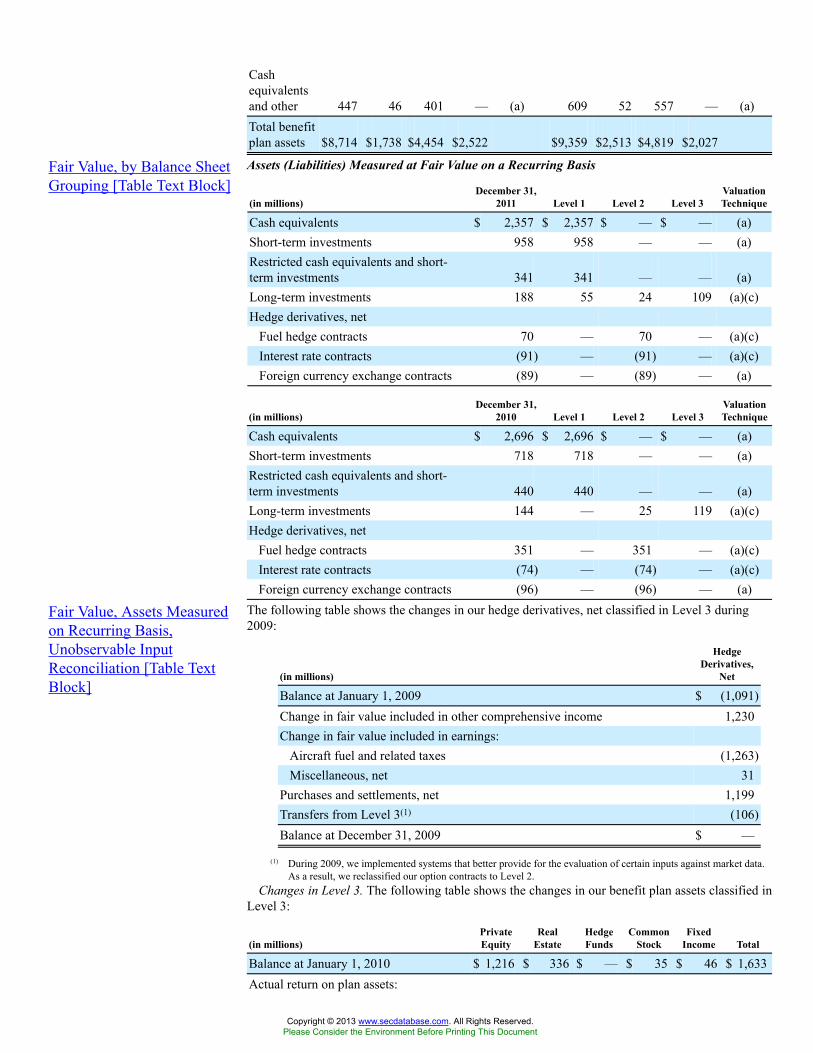
Cashequivalentsand other 447 46 401 — (a) 609 52 557 — (a)Total benefitplan assets $8,714 $1,738 $4,454 $2,522 $9,359 $2,513 $4,819 $2,027
Fair Value, by Balance SheetGrouping [Table Text Block]
Assets (Liabilities) Measured at Fair Value on a Recurring Basis
(in millions)December 31,
2011 Level 1 Level 2 Level 3ValuationTechnique
Cash equivalents $ 2,357 $ 2,357 $ — $ — (a)Short-term investments 958 958 — — (a)Restricted cash equivalents and short-term investments 341 341 — — (a)Long-term investments 188 55 24 109 (a)(c)Hedge derivatives, net
Fuel hedge contracts 70 — 70 — (a)(c)Interest rate contracts (91) — (91) — (a)(c)Foreign currency exchange contracts (89) — (89) — (a)
(in millions)December 31,
2010 Level 1 Level 2 Level 3ValuationTechnique
Cash equivalents $ 2,696 $ 2,696 $ — $ — (a)Short-term investments 718 718 — — (a)Restricted cash equivalents and short-term investments 440 440 — — (a)Long-term investments 144 — 25 119 (a)(c)Hedge derivatives, net
Fuel hedge contracts 351 — 351 — (a)(c)Interest rate contracts (74) — (74) — (a)(c)Foreign currency exchange contracts (96) — (96) — (a)
Fair Value, Assets Measuredon Recurring Basis,Unobservable InputReconciliation [Table TextBlock]
The following table shows the changes in our hedge derivatives, net classified in Level 3 during2009:
(in millions)
HedgeDerivatives,
Net
Balance at January 1, 2009 $ (1,091)Change in fair value included in other comprehensive income 1,230Change in fair value included in earnings:
Aircraft fuel and related taxes (1,263)Miscellaneous, net 31
Purchases and settlements, net 1,199Transfers from Level 3(1) (106)Balance at December 31, 2009 $ —
(1) During 2009, we implemented systems that better provide for the evaluation of certain inputs against market data.As a result, we reclassified our option contracts to Level 2.
Changes in Level 3. The following table shows the changes in our benefit plan assets classified inLevel 3:
(in millions)PrivateEquity
RealEstate
HedgeFunds
CommonStock
FixedIncome Total
Balance at January 1, 2010 $ 1,216 $ 336 $ — $ 35 $ 46 $ 1,633Actual return on plan assets:
Copyright © 2013 www.secdatabase.com. All Rights Reserved.Please Consider the Environment Before Printing This Document
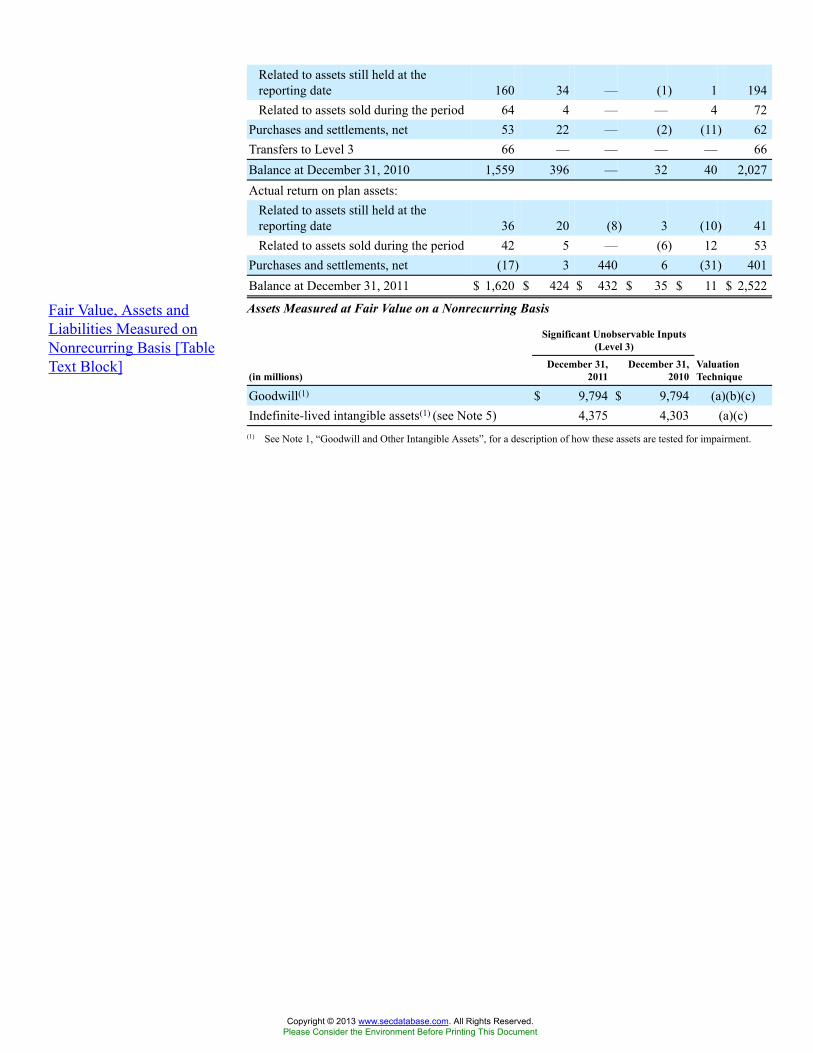
Related to assets still held at thereporting date 160 34 — (1) 1 194Related to assets sold during the period 64 4 — — 4 72
Purchases and settlements, net 53 22 — (2) (11) 62Transfers to Level 3 66 — — — — 66Balance at December 31, 2010 1,559 396 — 32 40 2,027Actual return on plan assets:
Related to assets still held at thereporting date 36 20 (8) 3 (10) 41Related to assets sold during the period 42 5 — (6) 12 53
Purchases and settlements, net (17) 3 440 6 (31) 401Balance at December 31, 2011 $ 1,620 $ 424 $ 432 $ 35 $ 11 $ 2,522
Fair Value, Assets andLiabilities Measured onNonrecurring Basis [TableText Block]
Assets Measured at Fair Value on a Nonrecurring Basis
Significant Unobservable Inputs(Level 3)
(in millions)December 31,
2011December 31,
2010ValuationTechnique
Goodwill(1) $ 9,794 $ 9,794 (a)(b)(c)Indefinite-lived intangible assets(1) (see Note 5) 4,375 4,303 (a)(c)
(1) See Note 1, “Goodwill and Other Intangible Assets”, for a description of how these assets are tested for impairment.
Copyright © 2013 www.secdatabase.com. All Rights Reserved.Please Consider the Environment Before Printing This Document
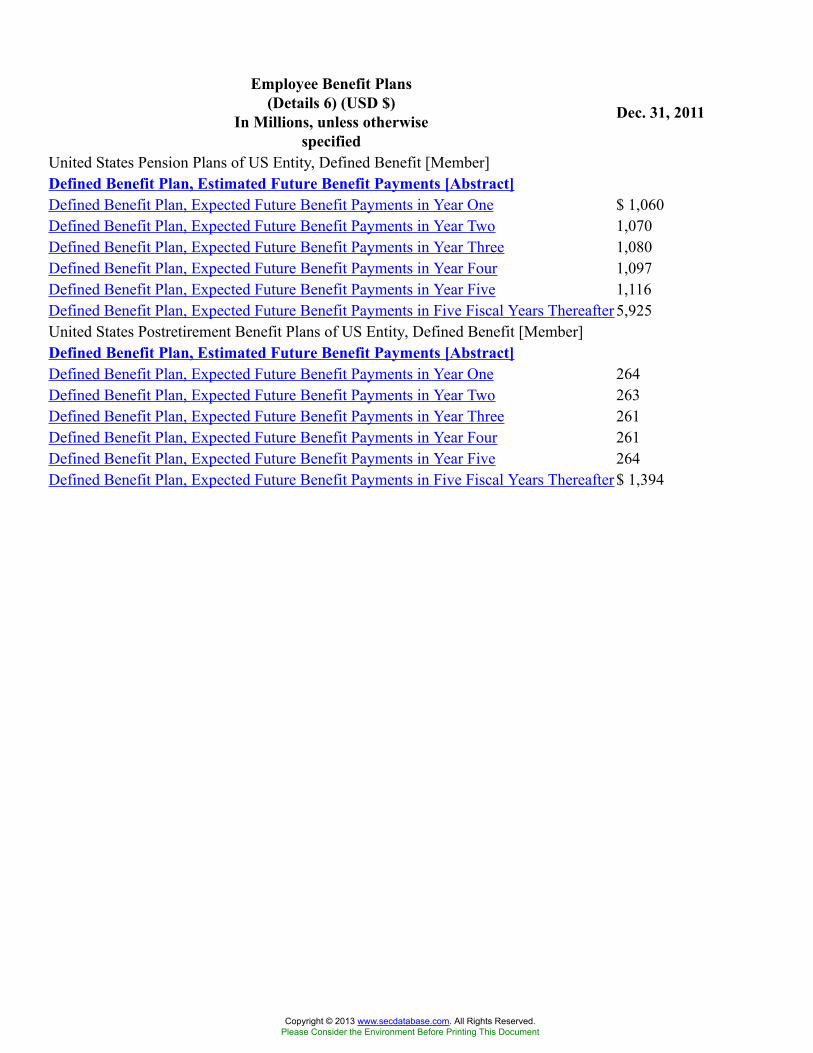
Employee Benefit Plans(Details 6) (USD $)
In Millions, unless otherwisespecified
Dec. 31, 2011
United States Pension Plans of US Entity, Defined Benefit [Member]Defined Benefit Plan, Estimated Future Benefit Payments [Abstract]Defined Benefit Plan, Expected Future Benefit Payments in Year One $ 1,060Defined Benefit Plan, Expected Future Benefit Payments in Year Two 1,070Defined Benefit Plan, Expected Future Benefit Payments in Year Three 1,080Defined Benefit Plan, Expected Future Benefit Payments in Year Four 1,097Defined Benefit Plan, Expected Future Benefit Payments in Year Five 1,116Defined Benefit Plan, Expected Future Benefit Payments in Five Fiscal Years Thereafter 5,925United States Postretirement Benefit Plans of US Entity, Defined Benefit [Member]Defined Benefit Plan, Estimated Future Benefit Payments [Abstract]Defined Benefit Plan, Expected Future Benefit Payments in Year One 264Defined Benefit Plan, Expected Future Benefit Payments in Year Two 263Defined Benefit Plan, Expected Future Benefit Payments in Year Three 261Defined Benefit Plan, Expected Future Benefit Payments in Year Four 261Defined Benefit Plan, Expected Future Benefit Payments in Year Five 264Defined Benefit Plan, Expected Future Benefit Payments in Five Fiscal Years Thereafter $ 1,394
Copyright © 2013 www.secdatabase.com. All Rights Reserved.Please Consider the Environment Before Printing This Document
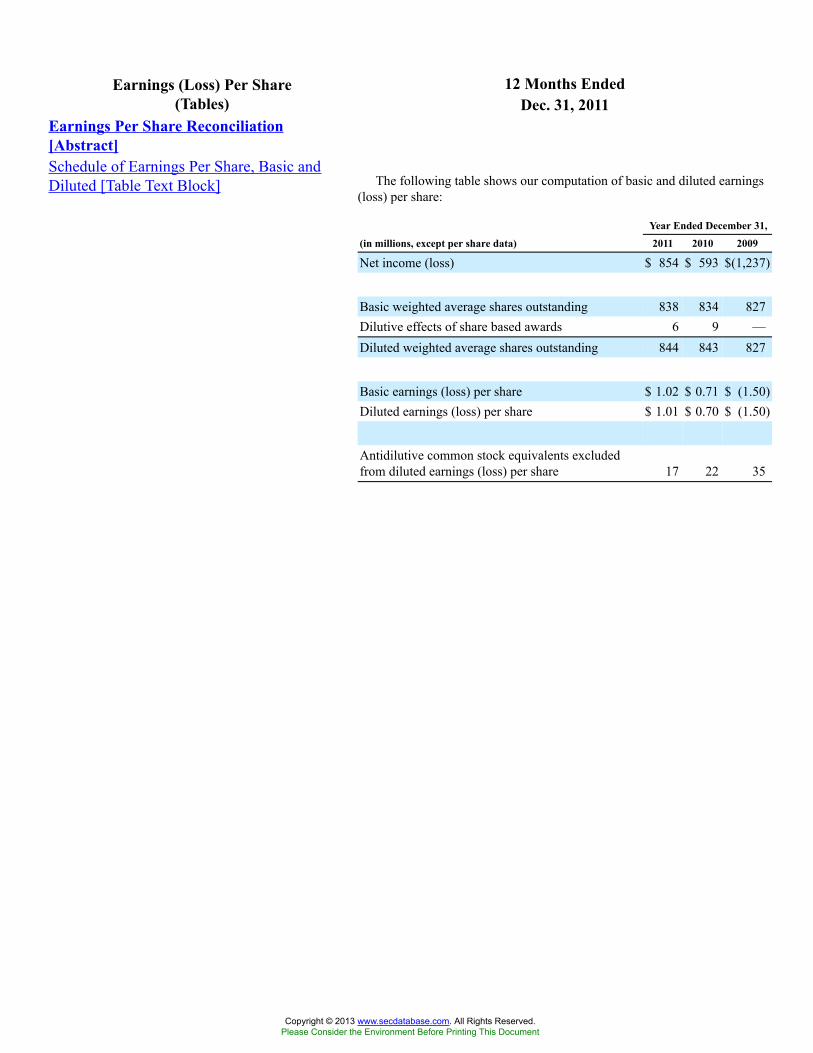
12 Months EndedEarnings (Loss) Per Share(Tables) Dec. 31, 2011
Earnings Per Share Reconciliation[Abstract]Schedule of Earnings Per Share, Basic andDiluted [Table Text Block] The following table shows our computation of basic and diluted earnings
(loss) per share:
Year Ended December 31,
(in millions, except per share data) 2011 2010 2009
Net income (loss) $ 854 $ 593 $(1,237)
Basic weighted average shares outstanding 838 834 827Dilutive effects of share based awards 6 9 —Diluted weighted average shares outstanding 844 843 827
Basic earnings (loss) per share $ 1.02 $ 0.71 $ (1.50)Diluted earnings (loss) per share $ 1.01 $ 0.70 $ (1.50)
Antidilutive common stock equivalents excludedfrom diluted earnings (loss) per share 17 22 35
Copyright © 2013 www.secdatabase.com. All Rights Reserved.Please Consider the Environment Before Printing This Document
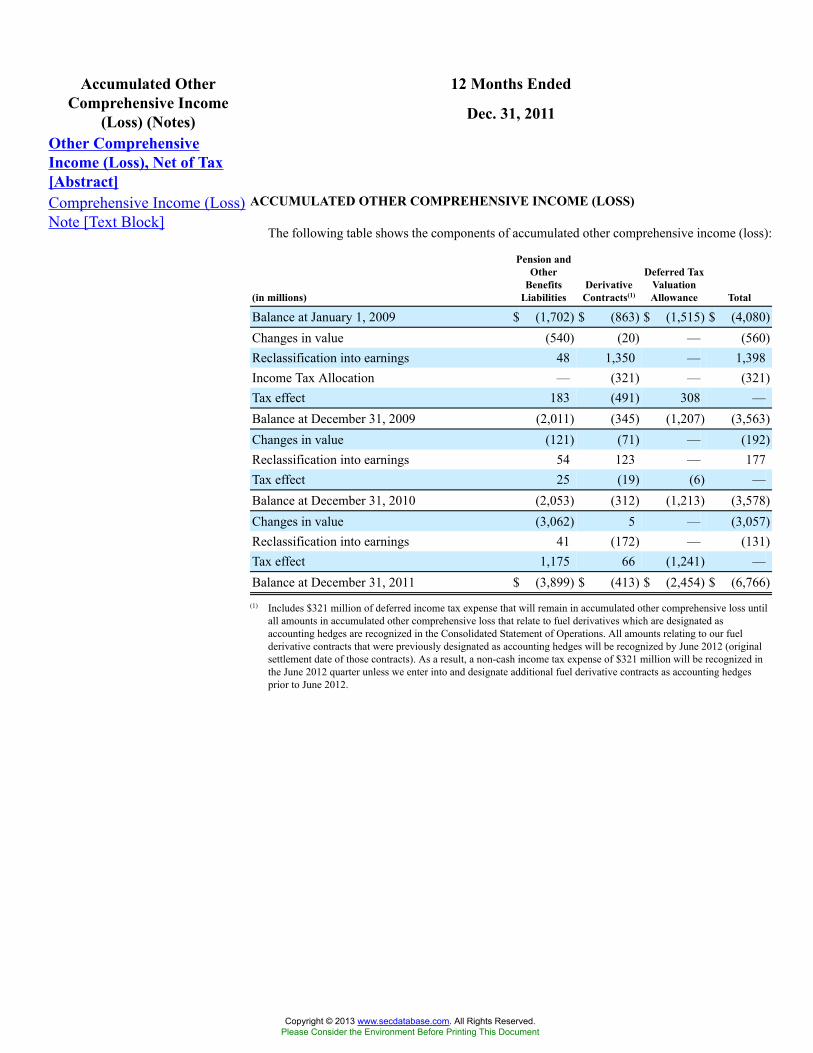
12 Months EndedAccumulated OtherComprehensive Income
(Loss) (Notes) Dec. 31, 2011
Other ComprehensiveIncome (Loss), Net of Tax[Abstract]Comprehensive Income (Loss)Note [Text Block]
ACCUMULATED OTHER COMPREHENSIVE INCOME (LOSS)
The following table shows the components of accumulated other comprehensive income (loss):
(in millions)
Pension andOther
BenefitsLiabilities
DerivativeContracts(1)
Deferred TaxValuationAllowance Total
Balance at January 1, 2009 $ (1,702) $ (863) $ (1,515) $ (4,080)Changes in value (540) (20) — (560)Reclassification into earnings 48 1,350 — 1,398Income Tax Allocation — (321) — (321)Tax effect 183 (491) 308 —Balance at December 31, 2009 (2,011) (345) (1,207) (3,563)Changes in value (121) (71) — (192)Reclassification into earnings 54 123 — 177Tax effect 25 (19) (6) —Balance at December 31, 2010 (2,053) (312) (1,213) (3,578)Changes in value (3,062) 5 — (3,057)Reclassification into earnings 41 (172) — (131)Tax effect 1,175 66 (1,241) —Balance at December 31, 2011 $ (3,899) $ (413) $ (2,454) $ (6,766)
(1) Includes $321 million of deferred income tax expense that will remain in accumulated other comprehensive loss untilall amounts in accumulated other comprehensive loss that relate to fuel derivatives which are designated asaccounting hedges are recognized in the Consolidated Statement of Operations. All amounts relating to our fuelderivative contracts that were previously designated as accounting hedges will be recognized by June 2012 (originalsettlement date of those contracts). As a result, a non-cash income tax expense of $321 million will be recognized inthe June 2012 quarter unless we enter into and designate additional fuel derivative contracts as accounting hedgesprior to June 2012.
Copyright © 2013 www.secdatabase.com. All Rights Reserved.Please Consider the Environment Before Printing This Document