Dell Technologies Earnings Financial Tables Q2 FY21
13
1 DELL TECHNOLOGIES INC. Condensed Consolidated Statements of Income (Loss) and Related Financial Highlights (in millions, except percentages; unaudited) Three Months Ended Six Months Ended July 31, 2020 August 2, 2019 Change July 31, 2020 August 2, 2019 Change Net revenue (a): Products $ 16,737 $ 17,915 (7)% $ 32,775 $ 34,490 (5)% Services 5,996 5,455 10% 11,855 10,788 10% Total net revenue 22,733 23,370 (3)% 44,630 45,278 (1)% Cost of net revenue: Products 13,330 13,889 (4)% 26,134 26,968 (3)% Services 2,247 2,155 4% 4,487 4,187 7% Total cost of net revenue 15,577 16,044 (3)% 30,621 31,155 (2)% Gross margin 7,156 7,326 (2)% 14,009 14,123 (1)% Operating expenses: Selling, general, and administrative 4,761 5,578 (15)% 9,647 10,649 (9)% Research and development 1,259 1,229 2% 2,524 2,405 5% Total operating expenses 6,020 6,807 (12)% 12,171 13,054 (7)% Operating income 1,136 519 119% 1,838 1,069 72% Interest and other, net (636) (630) (1)% (1,202) (1,323) 9% Income (loss) before income taxes 500 (111) 550% 636 (254) 350% Income tax benefit (599) (4,343) 86% (645) (4,815) 87% Net income 1,099 4,232 (74)% 1,281 4,561 (72)% Less: Net income attributable to non-controlling interests 51 816 (94)% 90 852 (89)% Net income attributable to Dell Technologies Inc. $ 1,048 $ 3,416 (69)% $ 1,191 $ 3,709 (68)% Percentage of Total Net Revenue: Gross margin 31 % 31 % 31 % 31 % Selling, general, and administrative 21 % 24 % 22 % 24 % Research and development 6 % 5 % 6 % 5 % Operating expenses 26 % 29 % 27 % 29 % Operating income 5 % 2 % 4 % 2 % Income (loss) before income taxes 2 % — % 1 % (1)% Net income 5 % 18 % 3 % 10 % Income tax rate -119.8 % 3912.6 % -101.4 % 1895.7 % ____________________ (a) During Fiscal 2020, the Company reclassified revenue associated with certain service and software-as-a-service offerings from product revenue to services revenue. There was no change to total revenue as a result of the reclassifications. Prior period results have been recast to conform with current period presentation.
Transcript of Dell Technologies Earnings Financial Tables Q2 FY21
1
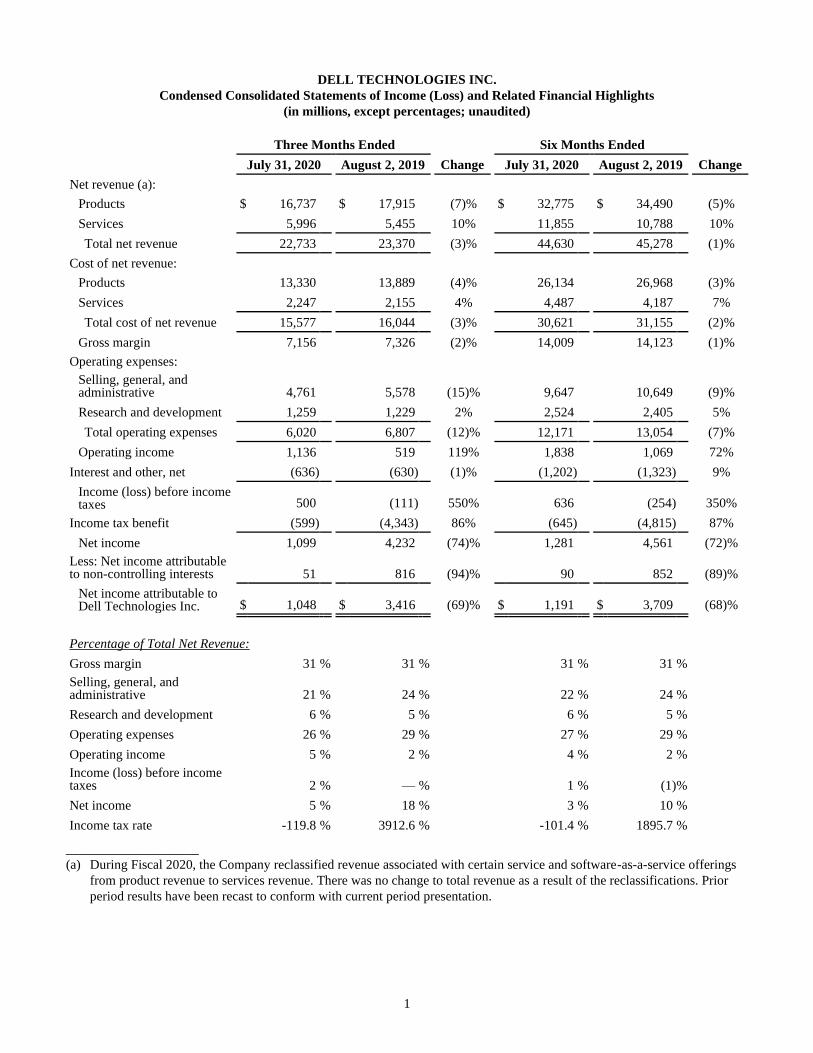
DELL TECHNOLOGIES INC.
Condensed Consolidated Statements of Income (Loss) and Related Financial Highlights
(in millions, except percentages; unaudited)
Three Months Ended Six Months Ended
July 31, 2020 August 2, 2019 Change July 31, 2020 August 2, 2019 Change
Net revenue (a):
Products $ 16,737 $ 17,915 (7)% $ 32,775 $ 34,490 (5)%
Services 5,996 5,455 10% 11,855 10,788 10%
Total net revenue 22,733 23,370 (3)% 44,630 45,278 (1)%
Cost of net revenue:
Products 13,330 13,889 (4)% 26,134 26,968 (3)%
Services 2,247 2,155 4% 4,487 4,187 7%
Total cost of net revenue 15,577 16,044 (3)% 30,621 31,155 (2)%
Gross margin 7,156 7,326 (2)% 14,009 14,123 (1)%
Operating expenses: Selling, general, and administrative 4,761 5,578 (15)% 9,647 10,649 (9)%
Research and development 1,259 1,229 2% 2,524 2,405 5%
Total operating expenses 6,020 6,807 (12)% 12,171 13,054 (7)%
Operating income 1,136 519 119% 1,838 1,069 72%
Interest and other, net (636) (630) (1)% (1,202) (1,323) 9%
Income (loss) before income taxes 500 (111) 550% 636 (254) 350%
Income tax benefit (599) (4,343) 86% (645) (4,815) 87%
Net income 1,099 4,232 (74)% 1,281 4,561 (72)%
Less: Net income attributable to non-controlling interests 51 816 (94)% 90 852 (89)%
Net income attributable to Dell Technologies Inc. $ 1,048 $ 3,416 (69)% $ 1,191 $ 3,709 (68)%
Percentage of Total Net Revenue:
Gross margin 31 % 31 % 31 % 31 % Selling, general, and administrative 21 % 24 % 22 % 24 %
Research and development 6 % 5 % 6 % 5 %
Operating expenses 26 % 29 % 27 % 29 %
Operating income 5 % 2 % 4 % 2 % Income (loss) before income taxes 2 % — % 1 % (1) %
Net income 5 % 18 % 3 % 10 %
Income tax rate -119.8 % 3912.6 % -101.4 % 1895.7 %
____________________
(a) During Fiscal 2020, the Company reclassified revenue associated with certain service and software-as-a-service offerings
from product revenue to services revenue. There was no change to total revenue as a result of the reclassifications. Prior
period results have been recast to conform with current period presentation.

2
DELL TECHNOLOGIES INC.
Consolidated Statements of Financial Position
(in millions; unaudited)
July 31, 2020 January 31, 2020
ASSETS
Current assets:
Cash and cash equivalents $ 11,221 $ 9,302
Accounts receivable, net 11,643 12,484
Short-term financing receivables, net 4,855 4,895
Inventories, net 3,602 3,281
Other current assets 7,711 6,906
Current assets held for sale 2,058 —
Total current assets 41,090 36,868
Property, plant, and equipment, net 6,380 6,055
Long-term investments 1,073 864
Long-term financing receivables, net 5,378 4,848
Goodwill 40,644 41,691
Intangible assets, net 16,064 18,107
Other non-current assets 10,647 10,428
Total assets $ 121,276 $ 118,861
LIABILITIES, REDEEMABLE SHARES, AND STOCKHOLDERS’ EQUITY (DEFICIT)
Current liabilities:
Short-term debt $ 10,345 $ 7,737
Accounts payable 19,500 20,065
Accrued and other 8,758 9,773
Short-term deferred revenue 15,341 14,881
Current liabilities held for sale 344 —
Total current liabilities 54,288 52,456
Long-term debt 43,608 44,319
Long-term deferred revenue 13,450 12,919
Other non-current liabilities 4,762 5,383
Total liabilities 116,108 115,077
Redeemable shares 610 629
Stockholders’ equity (deficit):
Total Dell Technologies Inc. stockholders’ deficit (419) (1,574)
Non-controlling interests 4,977 4,729
Total stockholders’ equity (deficit) 4,558 3,155
Total liabilities, redeemable shares, and stockholders’ equity (deficit) $ 121,276 $ 118,861
3
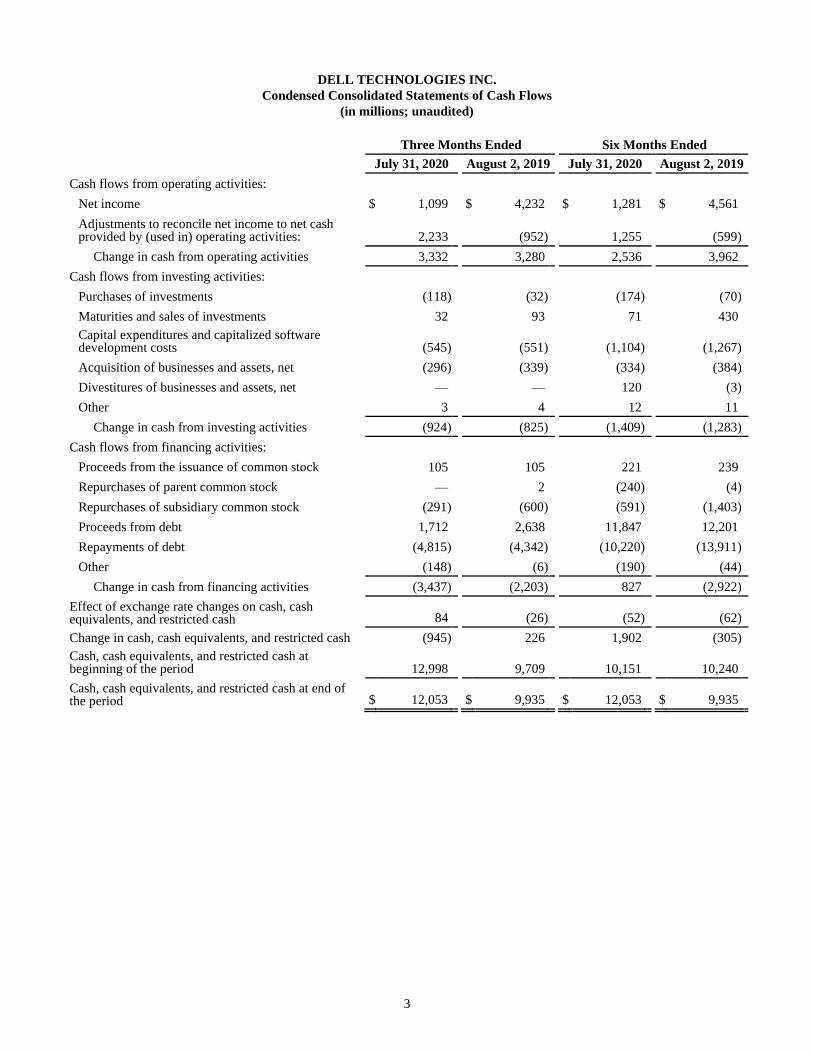
DELL TECHNOLOGIES INC.
Condensed Consolidated Statements of Cash Flows
(in millions; unaudited)
Three Months Ended Six Months Ended
July 31, 2020 August 2, 2019 July 31, 2020 August 2, 2019
Cash flows from operating activities:
Net income $ 1,099 $ 4,232 $ 1,281 $ 4,561
Adjustments to reconcile net income to net cash provided by (used in) operating activities: 2,233 (952) 1,255 (599)
Change in cash from operating activities 3,332 3,280 2,536 3,962
Cash flows from investing activities:
Purchases of investments (118) (32) (174) (70)
Maturities and sales of investments 32 93 71 430 Capital expenditures and capitalized software development costs (545) (551) (1,104) (1,267)
Acquisition of businesses and assets, net (296) (339) (334) (384)
Divestitures of businesses and assets, net — — 120 (3)
Other 3 4 12 11
Change in cash from investing activities (924) (825) (1,409) (1,283)
Cash flows from financing activities:
Proceeds from the issuance of common stock 105 105 221 239
Repurchases of parent common stock — 2 (240) (4)
Repurchases of subsidiary common stock (291) (600) (591) (1,403)
Proceeds from debt 1,712 2,638 11,847 12,201
Repayments of debt (4,815) (4,342) (10,220) (13,911)
Other (148) (6) (190) (44)
Change in cash from financing activities (3,437) (2,203) 827 (2,922)
Effect of exchange rate changes on cash, cash equivalents, and restricted cash 84 (26) (52) (62)
Change in cash, cash equivalents, and restricted cash (945) 226 1,902 (305) Cash, cash equivalents, and restricted cash at beginning of the period 12,998 9,709 10,151 10,240
Cash, cash equivalents, and restricted cash at end of the period $ 12,053 $ 9,935 $ 12,053 $ 9,935
4
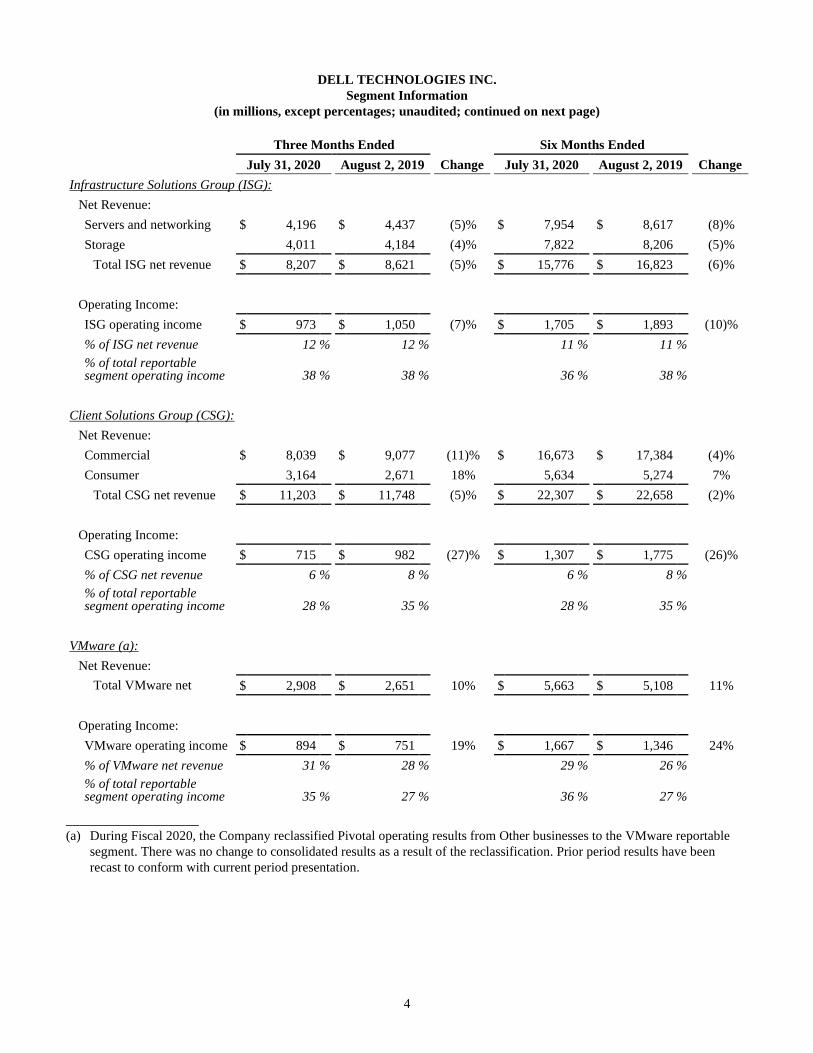
DELL TECHNOLOGIES INC.
Segment Information
(in millions, except percentages; unaudited; continued on next page)
Three Months Ended Six Months Ended
July 31, 2020 August 2, 2019 Change July 31, 2020 August 2, 2019 Change
Infrastructure Solutions Group (ISG):
Net Revenue:
Servers and networking $ 4,196 $ 4,437 (5)% $ 7,954 $ 8,617 (8)%
Storage 4,011 4,184 (4)% 7,822 8,206 (5)%
Total ISG net revenue $ 8,207 $ 8,621 (5)% $ 15,776 $ 16,823 (6)%
Operating Income:
ISG operating income $ 973 $ 1,050 (7)% $ 1,705 $ 1,893 (10)%
% of ISG net revenue 12 % 12 % 11 % 11 % % of total reportable segment operating income 38 % 38 % 36 % 38 %
Client Solutions Group (CSG):
Net Revenue:
Commercial $ 8,039 $ 9,077 (11)% $ 16,673 $ 17,384 (4)%
Consumer 3,164 2,671 18% 5,634 5,274 7%
Total CSG net revenue $ 11,203 $ 11,748 (5)% $ 22,307 $ 22,658 (2)%
Operating Income:
CSG operating income $ 715 $ 982 (27)% $ 1,307 $ 1,775 (26)%
% of CSG net revenue 6 % 8 % 6 % 8 % % of total reportable segment operating income 28 % 35 % 28 % 35 %
VMware (a):
Net Revenue:
Total VMware net revenue
$ 2,908 $ 2,651 10% $ 5,663 $ 5,108 11%
Operating Income:
VMware operating income $ 894 $ 751 19% $ 1,667 $ 1,346 24%
% of VMware net revenue 31 % 28 % 29 % 26 % % of total reportable segment operating income 35 % 27 % 36 % 27 %
____________________
(a) During Fiscal 2020, the Company reclassified Pivotal operating results from Other businesses to the VMware reportable
segment. There was no change to consolidated results as a result of the reclassification. Prior period results have been
recast to conform with current period presentation.
5
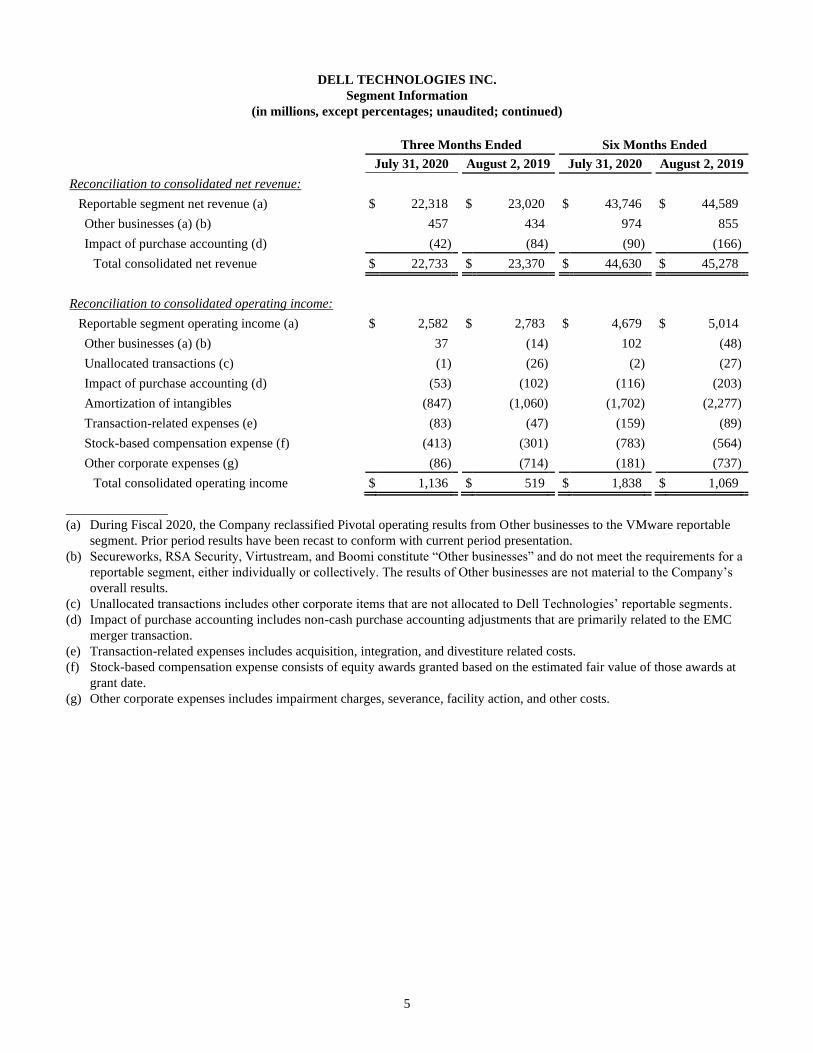
DELL TECHNOLOGIES INC.
Segment Information
(in millions, except percentages; unaudited; continued)
Three Months Ended Six Months Ended
July 31, 2020 August 2, 2019 July 31, 2020 August 2, 2019
Reconciliation to consolidated net revenue:
Reportable segment net revenue (a) $ 22,318 $ 23,020 $ 43,746 $ 44,589
Other businesses (a) (b) 457 434 974 855
Impact of purchase accounting (d) (42) (84) (90) (166)
Total consolidated net revenue $ 22,733 $ 23,370 $ 44,630 $ 45,278
Reconciliation to consolidated operating income:
Reportable segment operating income (a) $ 2,582 $ 2,783 $ 4,679 $ 5,014
Other businesses (a) (b) 37 (14) 102 (48)
Unallocated transactions (c) (1) (26) (2) (27)
Impact of purchase accounting (d) (53) (102) (116) (203)
Amortization of intangibles (847) (1,060) (1,702) (2,277)
Transaction-related expenses (e) (83) (47) (159) (89)
Stock-based compensation expense (f) (413) (301) (783) (564)
Other corporate expenses (g) (86) (714) (181) (737)
Total consolidated operating income $ 1,136 $ 519 $ 1,838 $ 1,069
_________________
(a) During Fiscal 2020, the Company reclassified Pivotal operating results from Other businesses to the VMware reportable
segment. Prior period results have been recast to conform with current period presentation.
(b) Secureworks, RSA Security, Virtustream, and Boomi constitute “Other businesses” and do not meet the requirements for a
reportable segment, either individually or collectively. The results of Other businesses are not material to the Company’s
overall results.
(c) Unallocated transactions includes other corporate items that are not allocated to Dell Technologies’ reportable segments.
(d) Impact of purchase accounting includes non-cash purchase accounting adjustments that are primarily related to the EMC
merger transaction.
(e) Transaction-related expenses includes acquisition, integration, and divestiture related costs.
(f) Stock-based compensation expense consists of equity awards granted based on the estimated fair value of those awards at
grant date.
(g) Other corporate expenses includes impairment charges, severance, facility action, and other costs.
6
SUPPLEMENTAL SELECTED NON-GAAP FINANCIAL MEASURES
These tables present information about the Company’s non-GAAP net revenue, non-GAAP gross margin, non-GAAP operating
expenses, non-GAAP operating income, non-GAAP net income, non-GAAP net income attributable to non-controlling
interests, non-GAAP net income attributable to Dell Technologies Inc. - basic, non-GAAP net income attributable to Dell
Technologies Inc. - diluted, non-GAAP earnings per share attributable to Dell Technologies Inc. - basic, non-GAAP earnings
per share attributable to Dell Technologies Inc. - diluted, EBITDA, and adjusted EBITDA, which are non-GAAP financial
measures provided as a supplement to the results provided in accordance with generally accepted accounting principles in the
United States of America (“GAAP”). A detailed discussion of Dell Technologies’ reasons for including these non-
GAAP financial measures, the limitations associated with these measures, the items excluded from these measures, and our
reason for excluding those items are presented in “Management’s Discussion and Analysis of Financial Condition and Results
of Operations — Non-GAAP Financial Measures” in our periodic reports filed with the SEC. Dell Technologies encourages
investors to review the non-GAAP discussion in these reports in conjunction with the presentation of non-GAAP financial
measures.
7
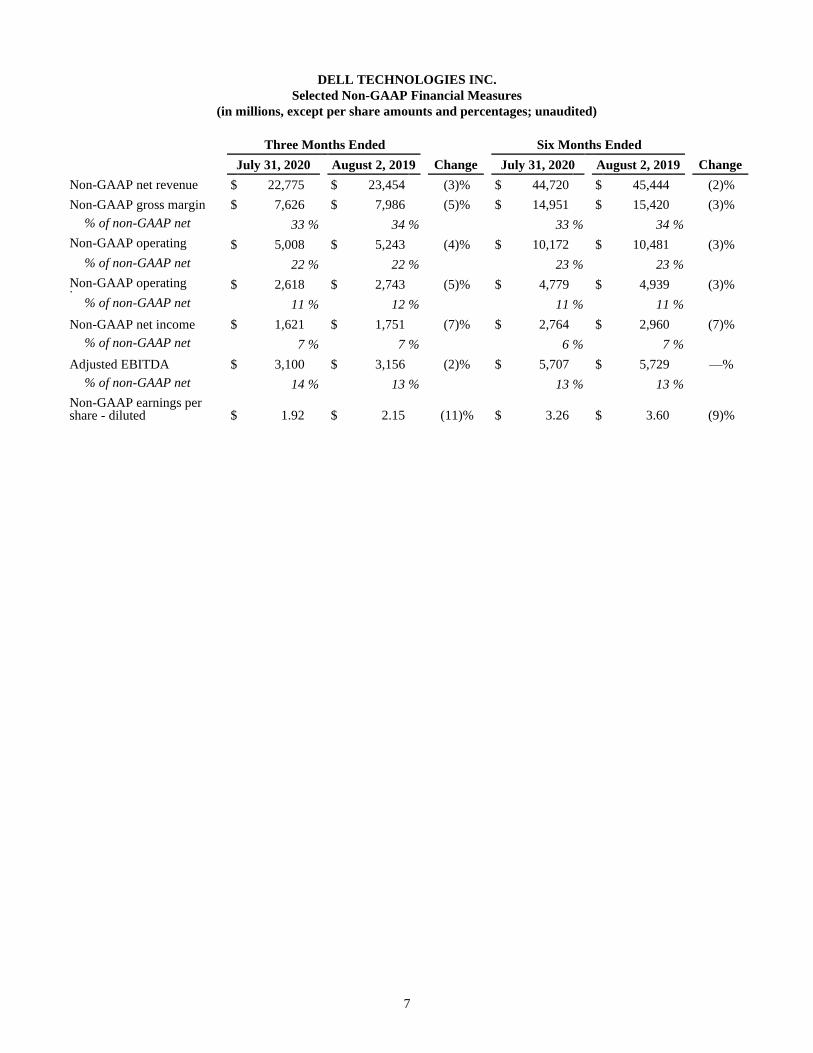
DELL TECHNOLOGIES INC.
Selected Non-GAAP Financial Measures
(in millions, except per share amounts and percentages; unaudited)
Three Months Ended Six Months Ended
July 31, 2020 August 2, 2019 Change July 31, 2020 August 2, 2019 Change
Non-GAAP net revenue $ 22,775 $ 23,454 (3)% $ 44,720 $ 45,444 (2)%
Non-GAAP gross margin $ 7,626 $ 7,986 (5)% $ 14,951 $ 15,420 (3)%
% of non-GAAP net revenue
33 % 34 % 33 % 34 % Non-GAAP operating expenses
$ 5,008 $ 5,243 (4)% $ 10,172 $ 10,481 (3)%
% of non-GAAP net revenue
22 % 22 % 23 % 23 % Non-GAAP operating income
$ 2,618 $ 2,743 (5)% $ 4,779 $ 4,939 (3)%
% of non-GAAP net revenue
11 % 12 % 11 % 11 %
Non-GAAP net income $ 1,621 $ 1,751 (7)% $ 2,764 $ 2,960 (7)%
% of non-GAAP net revenue
7 % 7 % 6 % 7 %
Adjusted EBITDA $ 3,100 $ 3,156 (2)% $ 5,707 $ 5,729 —%
% of non-GAAP net revenue
14 % 13 % 13 % 13 % Non-GAAP earnings per share - diluted $ 1.92 $ 2.15 (11)% $ 3.26 $ 3.60 (9)%

8
DELL TECHNOLOGIES INC.
Reconciliation of Selected Non-GAAP Financial Measures
(in millions, except percentages; unaudited; continued on next page)
Three Months Ended Six Months Ended
July 31, 2020 August 2, 2019 Change July 31, 2020 August 2, 2019 Change
Net revenue $ 22,733 $ 23,370 (3)% $ 44,630 $ 45,278 (1)%
Non-GAAP adjustments: Impact of purchase accounting 42 84 90 166
Non-GAAP net revenue $ 22,775 $ 23,454 (3)% $ 44,720 $ 45,444 (2)%
Gross margin $ 7,156 $ 7,326 (2)% $ 14,009 $ 14,123 (1)%
Non-GAAP adjustments:
Amortization of intangibles 375 519 747 1,038 Impact of purchase accounting 43 85 94 169
Transaction-related expenses — — — (5) Stock-based compensation expense 50 32 90 58
Other corporate expenses 2 24 11 37
Non-GAAP gross margin $ 7,626 $ 7,986 (5)% $ 14,951 $ 15,420 (3)%
Operating expenses $ 6,020 $ 6,807 (12)% $ 12,171 $ 13,054 (7)%
Non-GAAP adjustments:
Amortization of intangibles (472) (541) (955) (1,239) Impact of purchase accounting (10) (17) (22) (34)
Transaction-related expenses (83) (47) (159) (94) Stock-based compensation expense (363) (269) (693) (506)
Other corporate expenses (84) (690) (170) (700)
Non-GAAP operating expenses $ 5,008 $ 5,243 (4)% $ 10,172 $ 10,481 (3)%
Operating income $ 1,136 $ 519 119% $ 1,838 $ 1,069 72%
Non-GAAP adjustments:
Amortization of intangibles 847 1,060 1,702 2,277 Impact of purchase accounting 53 102 116 203
Transaction-related expenses 83 47 159 89 Stock-based compensation expense 413 301 783 564
Other corporate expenses 86 714 181 737
Non-GAAP operating income $ 2,618 $ 2,743 (5)% $ 4,779 $ 4,939 (3)%
9
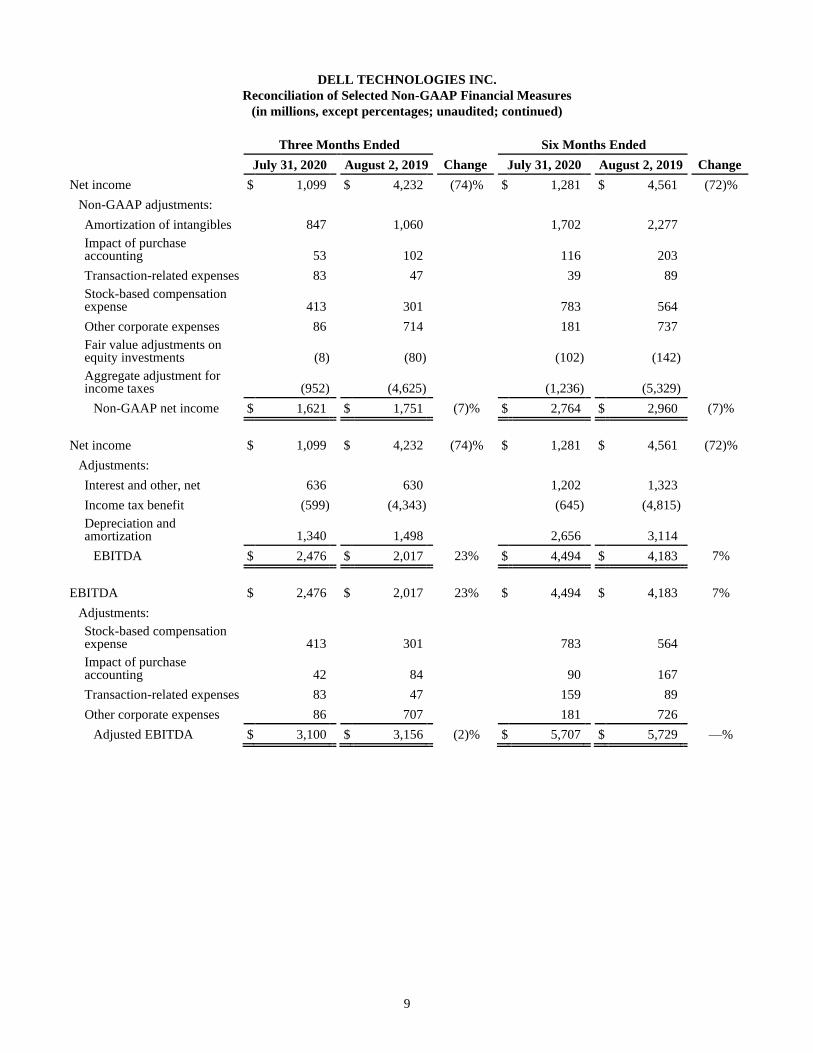
DELL TECHNOLOGIES INC.
Reconciliation of Selected Non-GAAP Financial Measures
(in millions, except percentages; unaudited; continued)
Three Months Ended Six Months Ended
July 31, 2020 August 2, 2019 Change July 31, 2020 August 2, 2019 Change
Net income $ 1,099 $ 4,232 (74)% $ 1,281 $ 4,561 (72)%
Non-GAAP adjustments:
Amortization of intangibles 847 1,060 1,702 2,277 Impact of purchase accounting 53 102 116 203
Transaction-related expenses 83 47 39 89 Stock-based compensation expense 413 301 783 564
Other corporate expenses 86 714 181 737 Fair value adjustments on equity investments (8) (80) (102) (142) Aggregate adjustment for income taxes (952) (4,625) (1,236) (5,329)
Non-GAAP net income $ 1,621 $ 1,751 (7)% $ 2,764 $ 2,960 (7)%
Net income $ 1,099 $ 4,232 (74)% $ 1,281 $ 4,561 (72)%
Adjustments:
Interest and other, net 636 630 1,202 1,323
Income tax benefit (599) (4,343) (645) (4,815) Depreciation and amortization 1,340 1,498 2,656 3,114
EBITDA $ 2,476 $ 2,017 23% $ 4,494 $ 4,183 7%
EBITDA $ 2,476 $ 2,017 23% $ 4,494 $ 4,183 7%
Adjustments: Stock-based compensation expense 413 301 783 564 Impact of purchase accounting 42 84 90 167
Transaction-related expenses 83 47 159 89
Other corporate expenses 86 707 181 726
Adjusted EBITDA $ 3,100 $ 3,156 (2)% $ 5,707 $ 5,729 —%
10
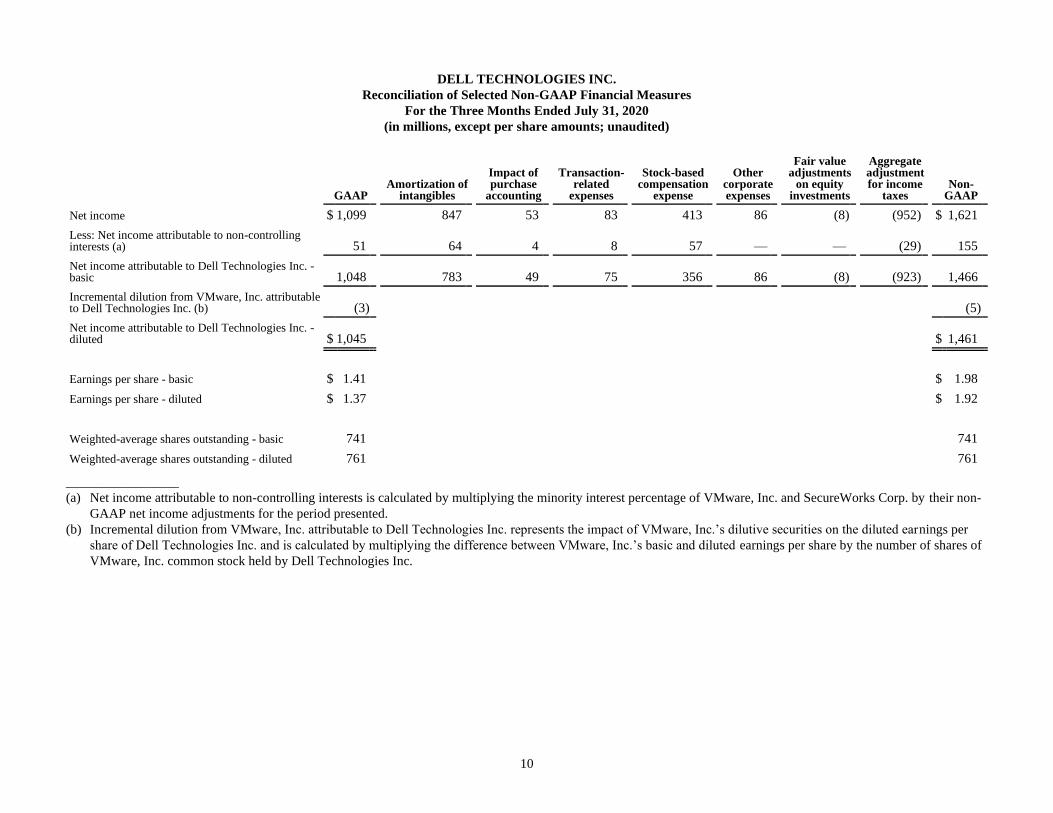
DELL TECHNOLOGIES INC.
Reconciliation of Selected Non-GAAP Financial Measures
For the Three Months Ended July 31, 2020
(in millions, except per share amounts; unaudited)
GAAP Amortization of
intangibles
Impact of purchase
accounting
Transaction-related
expenses
Stock-based compensation
expense
Other corporate expenses
Fair value adjustments
on equity investments
Aggregate adjustment for income
taxes Non-
GAAP
Net income $ 1,099 847 53 83 413 86 (8) (952) $ 1,621
Less: Net income attributable to non-controlling interests (a) 51 64 4 8 57 — — (29) 155
Net income attributable to Dell Technologies Inc. - basic 1,048 783 49 75 356 86 (8) (923) 1,466
Incremental dilution from VMware, Inc. attributable to Dell Technologies Inc. (b) (3) (5)
Net income attributable to Dell Technologies Inc. - diluted $ 1,045 $ 1,461
Earnings per share - basic $ 1.41 $ 1.98
Earnings per share - diluted $ 1.37 $ 1.92
Weighted-average shares outstanding - basic 741 741
Weighted-average shares outstanding - diluted 761 761
_________________
(a) Net income attributable to non-controlling interests is calculated by multiplying the minority interest percentage of VMware, Inc. and SecureWorks Corp. by their non-
GAAP net income adjustments for the period presented.
(b) Incremental dilution from VMware, Inc. attributable to Dell Technologies Inc. represents the impact of VMware, Inc.’s dilutive securities on the diluted earnings per
share of Dell Technologies Inc. and is calculated by multiplying the difference between VMware, Inc.’s basic and diluted earnings per share by the number of shares of
VMware, Inc. common stock held by Dell Technologies Inc.

11
DELL TECHNOLOGIES INC.
Reconciliation of Selected Non-GAAP Financial Measures
For the Six Months Ended July 31, 2020
(in millions, except per share amounts; unaudited)
GAAP Amortization of
intangibles
Impact of purchase
accounting
Transaction-related
expenses
Stock-based compensation
expense
Other corporate expenses
Fair value adjustments
on equity investments
Aggregate adjustment for income
taxes Non-
GAAP
Net income $ 1,281 1,702 116 39 783 181 (102) (1,236) $ 2,764
Less: Net income attributable to non-controlling interests (a) 90 124 7 15 111 — (1) (64) 282
Net income attributable to Dell Technologies Inc. - basic 1,191 $ 1,578 $ 109 $ 24 $ 672 $ 181 $ (101) $ (1,172) 2,482
Incremental dilution from VMware, Inc. attributable to Dell Technologies Inc. (b) (5) (9)
Net income attributable to Dell Technologies Inc. - diluted $ 1,186 $ 2,473
Earnings per share - basic $ 1.61 $ 3.35
Earnings per share - diluted $ 1.56 $ 3.26
Weighted-average shares outstanding - basic 740 740
Weighted-average shares outstanding - diluted 758 758
_________________
(a) Net income attributable to non-controlling interests is calculated by multiplying the minority interest percentage of VMware, Inc. and SecureWorks Corp. by their non-
GAAP net income adjustments for the period presented.
(b) Incremental dilution from VMware, Inc. attributable to Dell Technologies Inc. represents the impact of VMware, Inc.’s dilutive securities on the diluted earnings per
share of Dell Technologies Inc. and is calculated by multiplying the difference between VMware, Inc.’s basic and diluted earnings per share by the number of shares of
VMware, Inc. common stock held by Dell Technologies Inc.
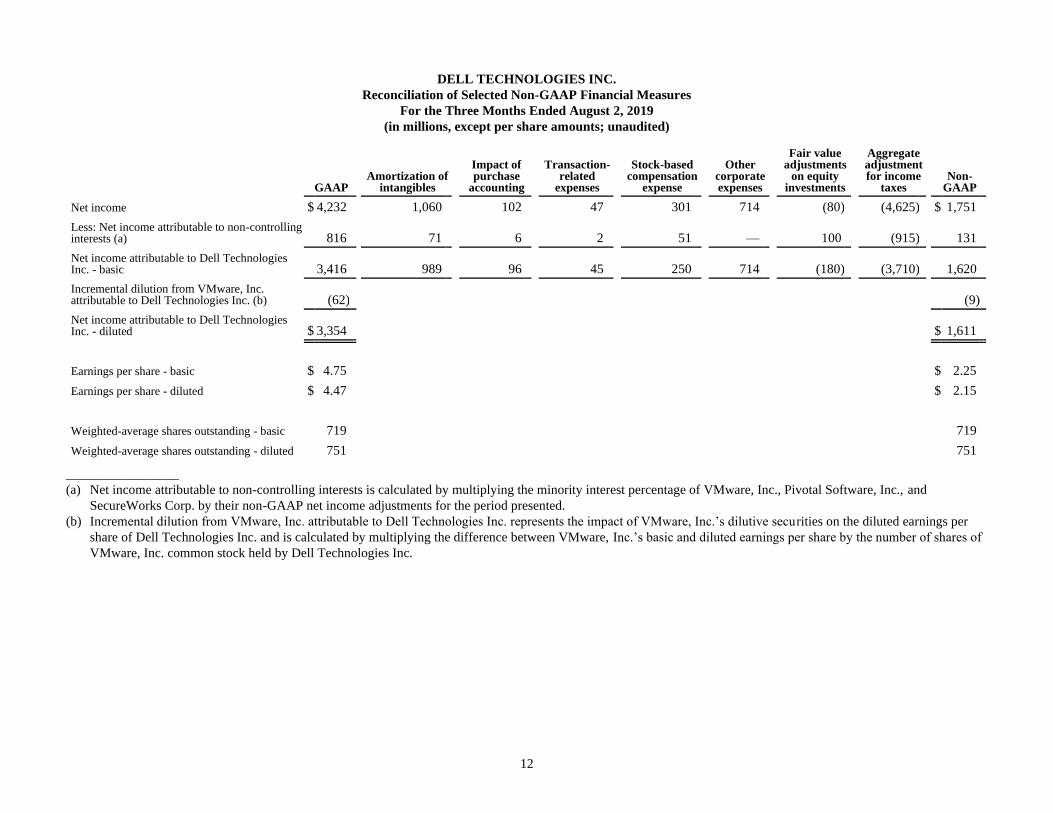
12
DELL TECHNOLOGIES INC.
Reconciliation of Selected Non-GAAP Financial Measures
For the Three Months Ended August 2, 2019
(in millions, except per share amounts; unaudited)
GAAP Amortization of
intangibles
Impact of purchase
accounting
Transaction-related
expenses
Stock-based compensation
expense
Other corporate expenses
Fair value adjustments
on equity investments
Aggregate adjustment for income
taxes Non-
GAAP
Net income $ 4,232 1,060 102 47 301 714 (80) (4,625) $ 1,751
Less: Net income attributable to non-controlling interests (a) 816 71 6 2 51 — 100 (915) 131
Net income attributable to Dell Technologies Inc. - basic 3,416 989 96 45 250 714 (180) (3,710) 1,620
Incremental dilution from VMware, Inc. attributable to Dell Technologies Inc. (b) (62) (9)
Net income attributable to Dell Technologies Inc. - diluted $ 3,354 $ 1,611
Earnings per share - basic $ 4.75 $ 2.25
Earnings per share - diluted $ 4.47 $ 2.15
Weighted-average shares outstanding - basic 719 719
Weighted-average shares outstanding - diluted 751 751
_________________
(a) Net income attributable to non-controlling interests is calculated by multiplying the minority interest percentage of VMware, Inc., Pivotal Software, Inc., and
SecureWorks Corp. by their non-GAAP net income adjustments for the period presented.
(b) Incremental dilution from VMware, Inc. attributable to Dell Technologies Inc. represents the impact of VMware, Inc.’s dilutive securities on the diluted earnings per
share of Dell Technologies Inc. and is calculated by multiplying the difference between VMware, Inc.’s basic and diluted earnings per share by the number of shares of
VMware, Inc. common stock held by Dell Technologies Inc.

13
DELL TECHNOLOGIES INC.
Reconciliation of Selected Non-GAAP Financial Measures
For the Six Months Ended August 2, 2019
(in millions, except per share amounts; unaudited)
GAAP Amortization of
intangibles
Impact of purchase
accounting
Transaction-related
expenses
Stock-based compensation
expense
Other corporate expenses
Fair value adjustments
on equity investments
Aggregate adjustment for income
taxes Non-
GAAP
Net income $ 4,561 2,277 203 89 564 737 (142) (5,329) $ 2,960
Less: Net income attributable to non-controlling interests (a) 852 144 12 5 97 — 74 (944) 240
Net income attributable to Dell Technologies Inc. - basic 3,709 2,133 191 84 467 737 (216) (4,385) 2,720
Incremental dilution from VMware, Inc. attributable to Dell Technologies Inc. (b) (78) (17)
Net income attributable to Dell Technologies Inc. - diluted $ 3,631 $ 2,703
Earnings per share - basic $ 5.17 $ 3.79
Earnings per share - diluted $ 4.84 $ 3.60
Weighted-average shares outstanding - basic 718 718
Weighted-average shares outstanding - diluted 750 750
_________________
(a) Net income attributable to non-controlling interests is calculated by multiplying the minority interest percentage of VMware, Inc., Pivotal Software, Inc., and
SecureWorks Corp. by their non-GAAP net income adjustments for the period presented.
(b) Incremental dilution from VMware, Inc. attributable to Dell Technologies Inc. represents the impact of VMware, Inc.’s dilutive securities on the diluted earnings per
share of Dell Technologies Inc. and is calculated by multiplying the difference between VMware, Inc.’s basic and diluted earnings per share by the number of shares of
VMware, Inc. common stock held by Dell Technologies Inc.