Dell EMC Server Management Pack Suite Version 7.2 for ...
66
Dell EMC Server Management Pack Suite Version 7.2 for Microsoft System Center Operations Manager User's Guide January 2021 Rev. A04
Transcript of Dell EMC Server Management Pack Suite Version 7.2 for ...

Dell EMC Server Management Pack SuiteVersion 7.2 for Microsoft System CenterOperations ManagerUser's Guide
January 2021Rev. A04

Notes, cautions, and warnings
NOTE: A NOTE indicates important information that helps you make better use of your product.
CAUTION: A CAUTION indicates either potential damage to hardware or loss of data and tells you how to avoid
the problem.
WARNING: A WARNING indicates a potential for property damage, personal injury, or death.
© 2009 - 2021 Dell Inc. or its subsidiaries. All rights reserved. Dell, EMC, and other trademarks are trademarks of Dell Inc. or its subsidiaries.Other trademarks may be trademarks of their respective owners.

Chapter 1: About Dell EMC Server Management Pack Suite (DSMPS) for SCOM........................... 6
Chapter 2: Support Matrix for DSMPS.......................................................................................... 7User roles necessary for using DSMPS..........................................................................................................................8
Chapter 3: Installing DSMPS......................................................................................................... 9Install Dell EMC Server Management Pack Suite (DSMPS) for SCOM.................................................................9Install DSMPS on multiple management servers................................................................................................9Management features imported into SCOM console after installing DSMPS.................................................... 10Repair installation issues of DSMPS..............................................................................................................................10
Chapter 4: Discover and manage PowerEdge servers on the SCOM console by using themonitoring feature of DSMPS................................................................................................... 11Scalable and detailed editions of DSMPS monitoring for PowerEdge servers and rack workstations..........11Discovery and classification of PowerEdge servers and rack workstations ....................................................... 11Discover PowerEdge servers by using SCOM Agent Management...................................................................... 12Monitoring Dell EMC PowerEdge Servers in the SCOM console.......................................................................... 12
View options for Dell EMC Server and Rack Workstation monitoring feature of DSMPS.........................12
Chapter 5: Discover and manage PowerEdge servers on the SCOM console by using iSM-WMI.... 16................................................................................................................................................................................................16Scalable and Detailed editions of DSMPS monitoring for PowerEdge servers and rack workstations
using iSM-WMI............................................................................................................................................................... 16Discovery and classification of PowerEdge servers and rack workstations using iSM-WMI.......................... 17Prerequisites for discovering PowerEdge servers by using iSM-WMI..................................................................17Discover PowerEdge servers by using iSM-WMI....................................................................................................... 17
Object discoveries using iSM-WMI.......................................................................................................................... 18Monitoring features for PowerEdge servers and rack workstations in DSMPS using iSM-WMI...................18
View options for Dell EMC Server and Rack Workstation Monitoring feature of DSMPS usingiSM-WMI.................................................................................................................................................................... 18
Chapter 6: Discover and manage DRACs on the SCOM console by using DSMPS.......................... 21Introduction to the monitoring features in DSMPS for DRACs..............................................................................21Discovery and classification of DRACs......................................................................................................................... 21Discover and enable DRAC devices using DSMPS................................................................................................... 22Monitoring DRACs using DSMPS..................................................................................................................................22
View options for DRAC monitoring feature of DSMPS......................................................................................22
Chapter 7: Supported tasks on the SCOM console for DSMPS monitoring features..................... 25Run DSMPS monitoring feature-based tasks on SCOM......................................................................................... 25Tasks run on Dell EMC devices by using the DSMPS monitoring features........................................................ 25
Check connection to the nodes...............................................................................................................................26View warranty information of PowerEdge servers............................................................................................. 26Start OMSA on monolithic servers using the SCOM console.......................................................................... 26
Contents
Contents 3

Start iDRAC using the SCOM console................................................................................................................... 26Start Remote Desktop on monolithic servers using the SCOM console....................................................... 26Perform a remote iDRAC hard reset operation.................................................................................................... 27Clear Embedded Server Management (ESM) logs............................................................................................. 27Power management-related tasks...........................................................................................................................27
Chapter 8: Generating DSMPS reports........................................................................................ 29View reports about PowerEdge servers on the SCOM console............................................................................29
Generate DSMPS reports on the SCOM console............................................................................................... 29
Chapter 9: Upgrading DSMPS...................................................................................................... 31Upgrade DSMPS to latest version of OMIMSSC....................................................................................................... 31Upgrade from previous versions of DSMPS................................................................................................................31
Chapter 10: Uninstalling DSMPS..................................................................................................32Uninstall DSMPS by using the Windows Control Panel........................................................................................... 32Uninstall DSMPS by using DSMPS installer EXE file................................................................................................ 32
Chapter 11: Reference topics....................................................................................................... 33Monitoring features supported by DSMPS.................................................................................................................33
Dell EMC Server and Rack Workstation Monitoring feature in DSMPS using OMSA................................33Dell EMC Server and Rack Workstation Monitoring feature using iSM-WMI.............................................. 35DRAC Monitoring feature of DSMPS..................................................................................................................... 37Configuring the monitoring features of DSMPS by using the Feature Management Dashboard............39
Severity levels of discovered devices.......................................................................................................................... 42Discovery features supported in the DSMPS monitoring of PowerEdge servers and rack
workstations using OMSA...........................................................................................................................................42Discovery features supported by DSMPS for monitoring DRACs.........................................................................43Hardware components monitored by different monitoring features of DSMPS............................................... 43View options provided by the monitoring features of DSMPS.............................................................................. 46
Alert views displayed by different monitoring features of DSMPS.................................................................46Diagram views displayed by different monitoring features of DSMPS...........................................................47State views displayed by different monitoring features of DSMPS............................................................... 50
Key features of monitoring PowerEdge servers in DSMPS using iSM-WMI.......................................................51System configuration lockdown mode in iDRAC9 PowerEdge servers.......................................................... 51iDRAC Group Manager in iDRAC9 PowerEdge servers...................................................................................... 51Capacity planning of PowerEdge servers discovered through iDRAC and iSM...........................................52Port connection information of PowerEdge servers discovered through iDRAC and iSM....................... 52
DSMPS Unit Monitors......................................................................................................................................................52Scalable Edition Unit monitors in the monitoring feature of DSMPS for PowerEdge servers and
workstations using OMSA.....................................................................................................................................52Detailed Edition Unit monitors in the monitoring feature of DSMPS for PowerEdge servers and
workstations using OMSA.....................................................................................................................................53Unit monitors in the monitoring feature of DSMPS for DRACs...................................................................... 55
Event rules used by different monitoring features of DSMPS.............................................................................. 55
Chapter 12: Troubleshooting........................................................................................................57Data is not displayed on the Feature Management Dashboard............................................................................. 57A task run on the Feature Management Dashboard fails........................................................................................ 57
4 Contents

Feature Management alerts........................................................................................................................................... 58The Management Server (MS) is not functioning, and therefore, tasks associated with it cannot be
completed (Health Service of the Feature Management Host Server is nonfunctional)............................58
Chapter 13: Additional resources................................................................................................. 59
Chapter 14: Accessing support content from the Dell EMC support site...................................... 60
Chapter 15: Contacting Dell Technologies.................................................................................... 61
Appendix A: Glossary...................................................................................................................62
Appendix B: Additional topics...................................................................................................... 63Identify device and device power status by using identification LEDs................................................................ 63Migrate from Dell Server Management Pack Suite Version 6.0 for Microsoft SCOM.................................... 64Configure SCOM to monitor traps and trap-based unit monitors........................................................................ 64Create Run-As-Account for SNMP monitoring......................................................................................................... 65Associate multiple Run-As accounts............................................................................................................................ 65Install Web Services Management (WS-Man) and SMASH device template.................................................... 66Associate Run-As Account task—Dell EMC Server and Rack Workstation Monitoring feature.................. 66
Contents 5

About Dell EMC Server Management PackSuite (DSMPS) for SCOM
The Dell EMC Server Management Pack Suite (DSMPS) is a management pack suite for SCOM that enables agent-baseddiscovery and monitoring of PowerEdge servers, rack workstations, and iDRACs through OMSA or by using iSM-WMI. Themanagement packs provide the Dell EMC-specific views that you can use to observe and analyze the device status in a network.
DSMPS for SCOM is a self-extracting executable file—Dell_EMC_Server_Management_Pack_Suite_<Version>_xx.exe—where, xx is the server management pack suite version release number. You can download the executable file and the latestdocuments from the Dell Technologies support site.
CAUTION: You must perform the tasks that are described in this user's guide only if you have firsthand working
experience with the supported SCOM console versions and in using Microsoft Windows operating system. Else,
it can result in lost or corrupted data.
Monitoring features supported by DSMPS for SCOMDSMPS for SCOM enables you to discover and classify the following Dell EMC devices:
● Dell EMC PowerEdge servers—Using the Dell EMC Servers and Rack Workstations Monitoring feature (OMSA agent-basedand iSM using WMI).
NOTE: Dell EMC Server and Rack Workstation Monitoring feature supports monitoring of PowerEdge servers having
Windows Server operating systems.
NOTE: Discovery using iSM-WMI feature would remain same as SCOM native discovery using management packs.
● Dell Remote Access Controllers● Supported Dell Precision Racks
Comparing the monitoring features offered by DSMPS andOMIMSSC appliance for SCOM● Discovery and monitoring features offered by DSMPS
○ Discovery and monitoring of PowerEdge Servers and Rack Workstations using software-based agent (OMSA) or throughiSM (for iSM-based discovery, the iDRAC license are imported to the iDRAC console which is per node).
● Discovery and monitoring features offered by OMIMSSC for SCOM○ Discovery and monitoring of PowerEdge Servers and Rack Workstations using iDRAC agent-free discovery, Chassis, and
Network Switches.For more information about deploying and using the OMIMSSC appliance for SCOM, see the Dell EMCOpenManage Integration with Microsoft System Center for System Center Operations Manager User's Guide on thesupport site.
1
6 About Dell EMC Server Management Pack Suite (DSMPS) for SCOM

Support Matrix for DSMPSBefore installing and configuring Dell EMC Server Management Pack Suite (DSMPS), ensure that the following software andhardware requirements are met.
Table 1. Support Matrix for DSMPS
Supported software and hardware Requirements and versions
Microsoft System Center—Operations Manager(SCOM)
One of the following SCOM build numbers must be already installed onthe management server:● SCOM 1807● SCOM 1801● SCOM 2012 R2● SCOM 2016● SCOM 2019
NOTE: On systems running the Nano server version of WindowsServer 2016 operating system, apply the Update Rollup 1 for MicrosoftSystem Center 2016 - Operations Manager agent package that isprovided in the Microsoft knowledge base article KB3190029. Formore information, see https://support.microsoft.com/en-us/help/3190029/update-rollup-1. You can upgrade to the latest versionsof SCOM from previous versions as per Microsoft guidelines. Forinformation about the supported upgrade scenarios, see the MicrosoftSystem Center documentation.
Windows requirements for installing DSMPS onthe Management Server with the SCOM console
● Enable the following Windows firewall rules:○ SCOM SNMP Response○ SCOM SNMP Trap Listener○ SCOM Ping Response
● Windows PowerShell 3.0 or later, if your system is running WindowsServer 2012 R2 operating system.
DSMPS features
Management Server (MS) requirements -
Operating systems ● For SCOM 2019, see https://www.docs.microsoft.com/en-us/system-center/scom/?view=sc-om-2019.
● For SCOM 2016, see https://www.docs.microsoft.com/en-us/system-center/scom/?view=sc-om-2016.
● For SCOM 2012 R2, see https://docs.microsoft.com/en-us/previous-versions/system-center/system-center-2012-R2/hh546785(v=sc.12).
Managed System requirements -
Dell EMC Server and Rack Workstation Monitoring Dell EMC OpenManageServer Administrator(OMSA)
Versions 9.4 and 9.3
iDRAC Service Module (iSM) Monitoring Feature iSM for iDRAC9-basedand 13th generation ofPowerEdge servers
3.5.1 and 3.4.0
iDRAC Monitoring Feature iDRAC8 with LifecycleController Modular andMonolithic
Firmware version 2.xx.xx.xx
2
Support Matrix for DSMPS 7
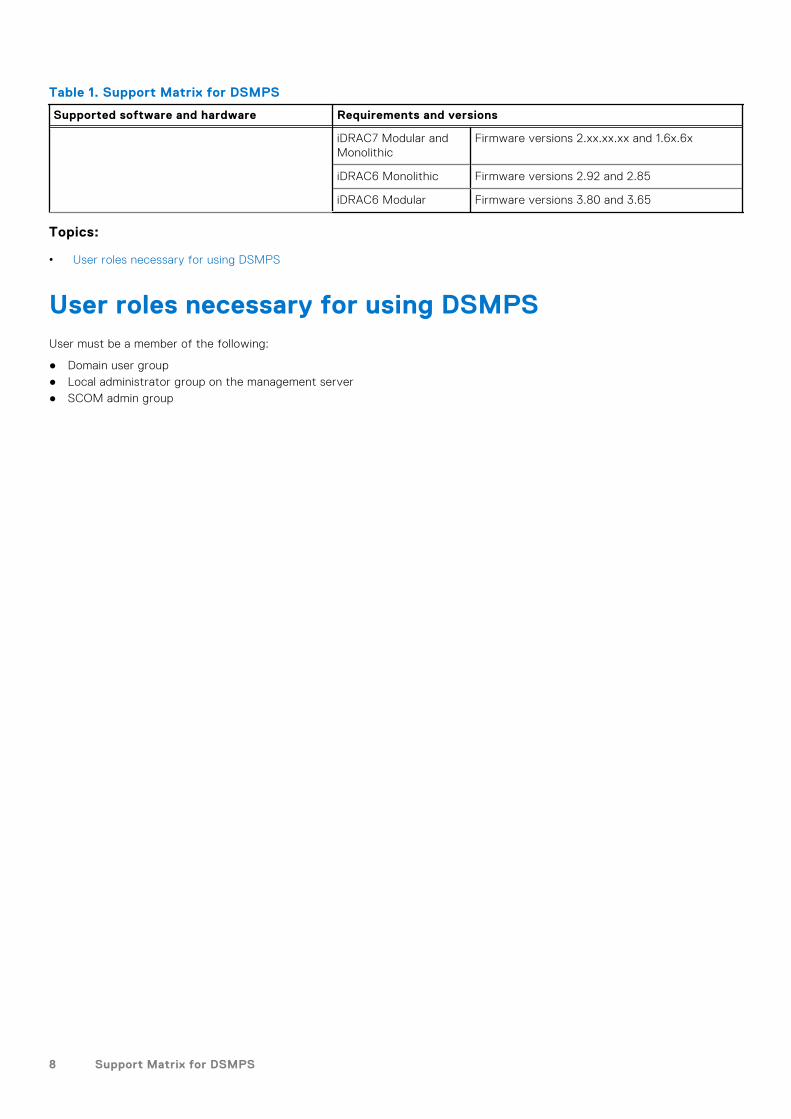
Table 1. Support Matrix for DSMPS
Supported software and hardware Requirements and versions
iDRAC7 Modular andMonolithic
Firmware versions 2.xx.xx.xx and 1.6x.6x
iDRAC6 Monolithic Firmware versions 2.92 and 2.85
iDRAC6 Modular Firmware versions 3.80 and 3.65
Topics:
• User roles necessary for using DSMPS
User roles necessary for using DSMPSUser must be a member of the following:
● Domain user group● Local administrator group on the management server● SCOM admin group
8 Support Matrix for DSMPS

Installing DSMPSPrerequisites: Before you begin with the installation of Dell EMC Server Management Pack Suite (DSMPS) for SCOM, ensurethat all the software and hardware requirements and user privileges are configured and available. See Support Matrix forDSMPS.
Topics:
• Install Dell EMC Server Management Pack Suite (DSMPS) for SCOM• Install DSMPS on multiple management servers• Management features imported into SCOM console after installing DSMPS• Repair installation issues of DSMPS
Install Dell EMC Server Management Pack Suite(DSMPS) for SCOM
Steps
1. From the Dell Technologies support site, download Dell_EMC_Server_Management_Pack_<version>_Axx.exe—where xx isthe Dell EMC Server Management Pack release number.
2. To extract contents of the self-extractable file, run the EXE file.
3. Launch the Dell_EMC_Server_Management_Pack.exe file from the extracted location.The Dell EMC Server Management Pack Suite welcome screen is displayed.
4. Click Next.The license agreement is displayed.
5. To continue the installation, read through the license terms and accept.
6. Click Next.
7. If you want to change the default location of the installation folder, click Change > Next.
8. Click Install.
9. On the Install Shield Wizard Completed screen, click Finish.By default, the management packs are installed in the location: C:\Program Files\Dell ManagementPacks\Server Mgmt Suite\7.2.
Results
NOTE: A log file containing the installation information is generated after the installation of DSMPS. The log file is available
in the folder where the EXE file of DSMPS is extracted.
Install DSMPS on multiple management servers
Steps
1. Import the management packs by using the Dell EMC Feature Management Dashboard or the SCOM ImportManagement Pack wizard on any of the management servers. SCOM automatically distributes the management packsto all the management servers.
2. To receive traps, add the management server that is used for discovering the Dell EMC devices to the Dell EMC device’strap destination list.
NOTE: Trap destination is automatically configured for the Dell EMC devices that are discovered and monitored through
Dell EMC Server and Rack Workstation Monitoring (Licensed) feature. To be able to receive SNMP alerts from devices
3
Installing DSMPS 9

discovered through the iDRAC access via the Host OS feature, you must install SNMP services on the Managed Node
and set the Management Server IP address as the trap destination in the SNMP Services.
Management features imported into SCOM consoleafter installing DSMPSThe following monitoring features are automatically imported into the SCOM console after you install DSMPS:
● Dell EMC Server and Rack Workstation Monitoring feature:○ Using OMSA agent-based.○ Using iSM-WMI only if all the prerequisites are fulfilled.
● Dell EMC Feature Management Pack—The Feature Management Dashboard is displayed under Monitoring > Dell EMC ofthe SCOM console.
NOTE: The Dell EMC Server and Rack Workstation Monitoring feature of DSMPS requires the installer to run on all the
management servers that are used to monitor the PowerEdge servers.
Repair installation issues of DSMPS
About this task
After installing DSMPS, if you face any installation issues and you are unable to run the DSMPS application, then use the Repairfeature available in the DSMPS installation file to resolve any issues that may have occurred during the installation process.
Steps
1. Run the Dell_EMC_Server_Management_Pack.exe file from the extracted location.The Welcome screen for Dell EMC Server Management Pack is displayed.
2. Click Next.The Program Maintenance screen is displayed.
3. Select Repair, and then click Next.The Ready to Repair the Program screen is displayed.
4. Click Install.The status bar indicates the installation status. After the installation is completed, the Installation CompletedSuccessfully screen is displayed.
5. Click Finish.
Example
NOTE: The Repair option is not available under Add/Remove Programs in the Control Panel.
10 Installing DSMPS

Discover and manage PowerEdge servers onthe SCOM console by using the monitoring
feature of DSMPS
Topics:
• Scalable and detailed editions of DSMPS monitoring for PowerEdge servers and rack workstations• Discovery and classification of PowerEdge servers and rack workstations• Discover PowerEdge servers by using SCOM Agent Management• Monitoring Dell EMC PowerEdge Servers in the SCOM console
Scalable and detailed editions of DSMPS monitoringfor PowerEdge servers and rack workstationsThe following table describes the environment in which you can use the Scalable and Detailed Edition features.
Table 2. Scalable and detailed editions of DSMPS monitoring feature
Feature Scalable Edition Detailed Edition
Dell EMC Server and RackWorkstation Monitoring feature
● Inventory and monitoring ofcomponent groups. Also, displays theavailability of iDRAC.
● Reports—Only OpenManage Windowsevent log report is available.
● Detailed inventory and healthmonitoring of individual components.
● View metrics of memory, processors,network interfaces, sensors, storagecontrollers, disks, and virtual disks.Also, displays BIOS information.
● Reports—Availability of BIOSconfiguration, firmware and driverversion, and RAID configurationreports.
Discovery and classification of PowerEdge serversand rack workstationsUsing DSMPS, you can discover and classify Dell EMC PowerEdge Servers (Monolithic, Modular, and sleds) and supported DellPrecision Racks. The following table lists the hardware discovery and grouping that is supported by the DSMPS monitoringfeature.
Table 3. Dell EMC hardware discovery and grouping using DSMPS
Group Diagram View Hardware Type
Dell EMC PowerEdge Servers ● Dell EMC Monolithic Servers● Dell EMC Modular Servers● Dell EMC Sled Servers
● PowerEdge servers● PowerVault servers
Dell EMC Rack Workstations Dell EMC Rack Workstation Diagram Dell EMC Precision Racks
4
Discover and manage PowerEdge servers on the SCOM console by using the monitoring feature of DSMPS 11

Discover PowerEdge servers by using SCOM AgentManagement
About this task
NOTE: Discover a PowerEdge server in the Agent Managed view under the Administration section of the SCOM
console.
Steps
1. In the left pane of the SCOM console, select Administration.
2. In the left pane, click Discovery Wizard.
3. In the working pane, select Windows computers, and then complete the tasks that are prompted by the Computer andDevice Management Wizard.
For more information, see the Microsoft SCOM documentation.NOTE: In a distributed environment, the discovery of devices may be not be successful. Ensure all the conditions
displayed in the error message are verified, and then discover the devices.
Results
NOTE: The installer automatically imports the Dell EMC Server and Rack Workstation Monitoring management packs into
the SCOM console. If the installer fails to install the management packs, then import the management packs using the
Import Management Packs wizard or the Dell EMC Feature Management Dashboard on the SCOM console.
NOTE: Dell EMC PowerEdge Servers that do not have Dell OpenManage Server Administrator (OMSA) installed or are
running an unsupported OMSA version are grouped as Dell Unmanaged Devices.
Monitoring Dell EMC PowerEdge Servers in the SCOMconsoleThe Monitoring pane of the SCOM console is used to select views that provide complete health information about thediscovered Dell EMC PowerEdge Servers. The Severity Level Indicators helps you to indicate the health of the Dell EMCPowerEdge Servers on the network.
It includes monitoring the health of monolithic and modular servers, and supported Dell Precision Racks and their components,both at regular intervals and on occurrence of events.
View options for Dell EMC Server and Rack Workstation monitoringfeature of DSMPS
DSMPS provides the following types of views for monitoring servers and rack workstations by selecting Monitoring > DellEMC on the SCOM console:
● Alert view in the monitoring feature of DSMPS for PowerEdge servers and rack workstations on page 13● Diagram views in the monitoring feature of DSMPS for PowerEdge servers and rack workstations on page 13● Performance and power monitoring views in the monitoring feature of DSMPS for PowerEdge servers and rack workstations
on page 13● State views in the monitoring feature of DSMPS for PowerEdge servers and rack workstations on page 15
12 Discover and manage PowerEdge servers on the SCOM console by using the monitoring feature of DSMPS

Alert view in the monitoring feature of DSMPS for PowerEdge servers andrack workstations
The Alert View is available for managing hardware and storage events from the Dell EMC servers and rack workstations, whichare received from OpenManage Server Administrator (OMSA). Link-up and Link-down alerts for events that are received fromthe Broadcom and Intel Network Interface Cards (NICs) are displayed.
To view the alert views that are displayed by the monitoring feature of DSMPS for PowerEdge servers and workstations:
1. On the SCOM console, select Monitoring.2. Expand Dell EMC > Dell EMC Alerts Views. The alert views displayed by the monitoring feature of DSMPS for PowerEdge
servers and rack workstations are:● Dell EMC Network Interface Alerts Views—Link-up and Link-down alerts from the discovered NICs.● Dell EMC Server and Rack Workstation Alerts Views—OMSA alerts from the Dell Server and Rack Workstations.● Dell EMC Rack Workstation Alert Views
○ Dell EMC Network Interface Alerts—Link-up and Link-down alerts from the discovered NICs.○ Dell EMC Rack Workstation Alerts—OMSA alerts from Rack Workstations.
See Alert views displayed by different monitoring features of DSMPS on page 46.3. Select the required Alert View. In the right pane, alerts that meet the criteria—such as alert severity, resolution state, or
alerts that are assigned to you—are displayed.4. Select an alert to view the details in the Alert Details section.
NOTE: By default, informational alerts are disabled. To enable informational alerts, run the Set Informational Alerts On
task for the Server and Rack Monitoring feature on the Dell EMC Feature Management Dashboard.
Diagram views in the monitoring feature of DSMPS for PowerEdge serversand rack workstations
About this task
The Dell EMC Diagram Views offer a hierarchical and graphical representation of all Dell EMC PowerEdge servers and supportedrack workstations on the network.
Steps
1. In the left pane of the SCOM console, select Monitoring.
2. Expand Dell EMC > Dell EMC Diagram Views.
3. Go to the Dell EMC Diagram Views folder to view the available diagram views. See Diagram views displayed by differentmonitoring features of DSMPS on page 47.
4. Select a required Dell EMC Diagram View to view the hierarchical and graphical representation of the selected Dell EMCserver or rack workstation in the right pane.
5. Select a component in the diagram to view its details in the Detail View section.
Performance and power monitoring views in the monitoring feature ofDSMPS for PowerEdge servers and rack workstations
About this task
To view the Dell EMC performance and power monitoring views on the SCOM console:
Steps
1. In the left pane of the SCOM, select Monitoring.
2. In the Monitoring pane, expand Dell EMC > Dell EMC Performance and Power Monitoring Views.
The following Performance and Power Monitoring views are available:● Ambient Temperature (Centigrade)● Amperage (Amps)● Dell EMC Performance View● Dell EMC Performance View (iSM)
Discover and manage PowerEdge servers on the SCOM console by using the monitoring feature of DSMPS 13

● Dell EMC Server Performance View● Disk Performance - iSM (%)● Energy Consumption (kWh)● Peak Amperage (Amps)● Peak Power (Watts)● Power Consumption (BTU/hr)● Power Consumption (Watts)
NOTE: Power monitoring is applicable only for Dell EMC PowerEdge Servers with power monitoring capability for a
particular attribute. It is enabled only when the detailed edition of Dell EMC Server and Rack Workstation Monitoring
feature is present.
NOTE: Disk Performance View - iSM (%) is disabled by default and appears only when the detailed edition of the Dell
EMC Server and Rack Workstation Monitoring feature is installed and imported.
3. Select the counters from the individual performance views and select the time range for which the values are required.
The data that is collected is represented in a graphical format for each system.
Next steps
A unit monitor monitors the performance counter over two successive cycles to check if it exceeds a threshold value. Whenthe threshold value is exceeded, the Dell EMC PowerEdge Server changes state and generates an alert. This unit monitor isdisabled by default. You can override (enable) the threshold values in the Authoring pane of the SCOM console. Unit monitorsare available under Dell Windows Server objects for the Dell EMC Server and Rack Workstation Monitoring feature. To enablethe threshold values of unit monitors, see Enable performance and power monitoring unit monitors on page 14.
To enable the PowerEdge server performance collection rules and for more information about the performance informationcollection, see Enable PowerEdge server performance collection rules set on the SCOM console on page 14.
Enable performance and power monitoring unit monitors
Steps
1. In the left pane of the SCOM console, select Authoring.
2. Expand Management Pack Objects > Monitors.
3. In the Look for field, search for Performance.
4. Right-click the unit monitor that you want to enable.
5. Select Overrides > Override the Monitor, and then select an option based on your requirement.
For example, to override the unit monitors for all objects of class: Dell Windows Server, select For all objects of class: DellWindows Server.
The Override Properties screen is displayed.
6. Select Enabled and set the Override Value to True.
7. In the Management Pack section, select a management pack from the drop-down list.
To create a management pack, click New and complete the tasks prompted. For more information about creatingmanagement packs, see the Microsoft SCOM documentation.
8. Click Apply.
Enable PowerEdge server performance collection rules set on the SCOM console
About this task
By default, the server performance collection rules are disabled. To enable, perform the following actions:
Steps
1. In the left pane of the SCOM console, select Authoring.
2. Select Rules and in the Look for field, search for Enriched.
3. Right-click the rule that you want to enable, and then select Overrides > Override the Monitor > For all objects ofclass.
14 Discover and manage PowerEdge servers on the SCOM console by using the monitoring feature of DSMPS

For example, to collect data about network interface of all Dell EMC systems, right-click the following rules:● Total Transmitted Packets● Received Bytes● Total Received Packets● Transmitted Bytes
4. Select Enabled and set the Override Value to True.
5. In the Management Pack section, select a management pack from the drop-down list.To create a management pack, click New.
6. Click Apply.
Results
In the SCOM console, select Monitoring > Dell EMC > Dell EMC Performance and Power Monitoring Views to view theperformance information collected from Dell EMC PowerEdge servers.
The performance collection rules collect information based on the following parameters:
● Disk Performance (%)● Ambient Temperature (Centigrade)● Amperage (Amps)● Energy Consumption (kWh)● Peak Amperage (Amps)● Peak Power (Watts)● Physical Network Interface● Power Consumption (BTU/hr)● Power Consumption (Watts)● Teamed Network Interface
NOTE: When the Detailed edition of the Server and Rack Workstation Monitoring feature is imported, the disabled
Performance (excluding Network Performance) and license-free Disk Performance (%) collection rules are enabled by
default.
NOTE: Disk Performance (%)—This view displays the Remaining Rated Write Endurance of Solid-State Drives
(SSDs) of a PowerEdge server. To view the data, search for the SSD object.
NOTE: Network Statistics, which are disabled by default, are defined only in the Detailed edition of the Dell EMC Server
and Rack Workstation Monitoring feature.
State views in the monitoring feature of DSMPS for PowerEdge servers andrack workstations
About this task
The State view is available for viewing the health of Dell EMC devices that are monitored by different monitoring features ofDSMPS. To view the state of a device:
Steps
1. In the left pane of the SCOM console, select Monitoring.
2. Expand Dell EMC > Dell EMC State Views.
Different State views are listed based on the monitoring feature. See State views displayed by different monitoring featuresof DSMPS on page 50.
3. To view data about a component, select a component.Information is displayed in the Detail View section.
Results
The health of a component is derived by reviewing the unresolved alerts that are associated with the component. Severity levelsof discovered devices on page 42 explain the various state components that DSMPS use with their corresponding severitylevels.
Discover and manage PowerEdge servers on the SCOM console by using the monitoring feature of DSMPS 15

Discover and manage PowerEdge servers onthe SCOM console by using iSM-WMI
Topics:
•• Scalable and Detailed editions of DSMPS monitoring for PowerEdge servers and rack workstations using iSM-WMI• Discovery and classification of PowerEdge servers and rack workstations using iSM-WMI• Prerequisites for discovering PowerEdge servers by using iSM-WMI• Discover PowerEdge servers by using iSM-WMI• Monitoring features for PowerEdge servers and rack workstations in DSMPS using iSM-WMI
About this task
Dell EMC Server and Rack Workstation Monitoring feature using iSM-WMI provides Detailed or Scalable inventory, based onyour method of discovery and monitoring of the following devices:
● YX2X, YX3X, and iDRAC 9-based PowerEdge servers● PowerVault servers● Dell Precision Racks● Dell-branded OEM servers● Dell OEM Ready servers● PowerEdge Storage Spaces Direct Ready nodes
Inventory and monitoring of these devices could be done through iDRAC Service Module (iSM) installed on the managed DellEMC Server or Rack Workstation through iSM–WMI. For the list of Supported Platforms for iSM, see the iDRAC Service ModuleInstallation Guide on the Dell Technologies support site.
Scalable and Detailed editions of DSMPS monitoringfor PowerEdge servers and rack workstations usingiSM-WMI
About this task
Servers and rack workstations discovered using the iSM-WMI monitoring feature of DSMPS are classified as Servers (iSM-WMI) in the SCOM console.
● Scalable Edition○ Generate inventory up to an individual component level.○ Health monitoring at server, Rack Workstation, and component-group level.
● Detailed Edition○ Inventory and health monitoring of individual components.○ View metrics about power, temperature, NICs, processor, memory, Compute Usage per Second (CUPS), PCIe SSD wear
percentage, and IO performance metrics.
5
16 Discover and manage PowerEdge servers on the SCOM console by using iSM-WMI

Discovery and classification of PowerEdge serversand rack workstations using iSM-WMI
About this task
The following table lists information about the hardware discovery and grouping by the Dell EMC Server and Rack Monitoringfeature of DSMPS by using iSM-WMI:
Table 4. PowerEdge servers discovery and grouping by using iSM-WMI
Group Diagram View Hardware Type
Dell EMC PowerEdge Servers ● Dell EMC Monolithic Servers● Dell EMC Modular Servers● Dell EMC Sled Group
● Dell PowerEdge systems● Dell PowerVault systems
Dell EMC Rack Workstation Dell EMC Rack Workstation Diagram Dell Precision Racks
Prerequisites for discovering PowerEdge servers byusing iSM-WMI● Required version of iSM is installed on the managed node. See Support Matrix for DSMPS on page 7.
NOTE: If you are monitoring devices by using the iSM–WMI feature on systems running Microsoft Nano server, see the
Installing iDRAC Service Module on Nano operating system section in the iDRAC Service Module Installation Guide on
the Dell Technologies support site.
● Windows Management Instrumentation (WMI) feature is enabled on the host. For more information, see the WindowsManagement Instrumentation providers section in the Integrated Dell Remote Access Controller7/8/9 with LifecycleController User’s Guide on the Dell Technologies support site.
● In Dell EMC Feature Management Dashboard, the Enable Agent Proxying task is run for the Dell EMC Server and RackWorkstation monitoring feature using iSM-WMI.
Discover PowerEdge servers by using iSM-WMI
Steps
1. In the left pane of the SCOM console, select Administration.
2. In the left pane, select Discovery Wizard.
3. In the working pane, select Windows computers, and then complete the tasks that are prompted by the Computer andDevice Management Wizard. For more information, see the Microsoft SCOM documentation.
NOTE: The installer automatically imports the Dell EMC Server and Rack Workstation Monitoring (Licensed)
management packs into the SCOM console. If the installer fails to install the management packs, then import the
management packs using the Import Management Packs wizard or Dell EMC Feature Management Dashboard on
the SCOM console.
NOTE: In a distributed environment, the discovery of devices may be not be successful. Ensure all the conditions
displayed in the error message are verified, and then discover the devices.
The discovered servers are displayed under Dell EMC Servers (iSM) State View under Dell EMC State Views.
Discover and manage PowerEdge servers on the SCOM console by using iSM-WMI 17

Figure 1. Discovered PowerEdge servers by using iSM-WMI
A Dell Server (iSM) informational alert is generated when a Dell EMC PowerEdge Server is discoveredthrough iDRAC Service Module (iSM) for the first time. This informational alert is a one-time alert.
Object discoveries using iSM-WMI
About this task
Dell EMC PowerEdge Server Discovery—Classifies the Dell EMC PowerEdge Servers and populates the key attributes andcomponents.
Monitoring features for PowerEdge servers and rackworkstations in DSMPS using iSM-WMIThe Monitoring pane of the SCOM console is used to select views that provide health information of the discovered Dell EMCPowerEdge Servers. The Severity levels of devices that are discovered by the SCOM console enables you to indicate the healthof the Dell EMC PowerEdge servers on the network.
It includes monitoring the health of Dell EMC Modular and Dell EMC Monolithic servers and Dell Precision Rack Workstations attheir group level—both at regular intervals and at the occurrence of events.
View options for Dell EMC Server and Rack Workstation Monitoringfeature of DSMPS using iSM-WMI
DSMPS provides the following types of views for monitoring servers and rack workstations by selecting Monitoring > DellEMC on the SCOM console:
● Alert view in the monitoring feature of DSMPS using iSM-WMI on page 19● Diagram views in the monitoring feature of DSMPS using iSM-WMI on page 19● Performance and power monitoring views in the monitoring feature of DSMPS using iSM-WMI on page 19● State views in the monitoring feature of DSMPS using iSM-WMI on page 20
18 Discover and manage PowerEdge servers on the SCOM console by using iSM-WMI
Alert view in the monitoring feature of DSMPS using iSM-WMI
This view is available for managing hardware and storage events from the Dell EMC Server and Rack Workstation Monitoringfeature using iSM-WMI. Link-up and Link-down alerts for events that are received from the Broadcom and Intel NetworkInterface Cards (NICs) are displayed.
To view the alert views that are displayed by the monitoring feature of DSMPS for PowerEdge servers and workstations usingiSM-WMI:
1. In the left pane of the SCOM console, select Monitoring.2. Expand Dell EMC > Dell EMC Alerts Views. The following alerts are displayed:
● Dell EMC Network Interface Alerts Views—Link-up and Link-down alerts from the discovered NICs.● Dell EMC Server and Rack Workstation Alerts Views—SNMP traps for 12th, 13th, generation, and iDRAC9-based
PowerEdge servers, PowerVault servers, and Dell Precision Racks with iDRAC7, iDRAC8, or iDRAC9 are displayed.● Dell EMC Rack Workstation Alert Views
○ Dell EMC Network Interface Alerts—Link-up and Link-down alerts from the discovered NICs.○ Dell EMC Rack Workstation Alerts
See Alert views displayed by different monitoring features of DSMPS on page 46.3. Select the required Alert View. In the right pane, alerts that meet the criteria—such as alert severity, resolution state, or
alerts that are assigned to you—are displayed.4. Select an alert to view the details in the Alert Details section.
Diagram views in the monitoring feature of DSMPS using iSM-WMI
About this task
The Dell EMC Diagram Views offer a hierarchical and graphical representation of all Dell EMC PowerEdge Servers and supportedRack Workstations on the network.
Steps
1. In the left pane of the SCOM console, select Monitoring.
2. Expand Dell EMC > Dell EMC Diagram Views.
3. Go to the Dell EMC Diagram Views folder to view the available diagram views. See Diagram views displayed by differentmonitoring features of DSMPS on page 47.
4. Select a required Dell EMC Diagram View to view the hierarchical and graphical representation of the selected Dell EMCServer or Rack Workstation in the right pane.
5. Select a component in the diagram to view its details in the Detail View section.
Performance and power monitoring views in the monitoring feature ofDSMPS using iSM-WMI
About this task
To view the Dell EMC performance and power monitoring views on the SCOM console:
Steps
1. In the left pane of the SCOM, select Monitoring.
2. In the Monitoring pane, expand Dell EMC > Dell EMC Performance and Power Monitoring Views.
The following Performance and Power Monitoring views are available:● Dell Performance View (iSM)● Disk Performance - iSM (%)
NOTE: All performance metric rules are disabled by default for Dell EMC Server and Rack Workstation Monitoring
feature.
3. To view the System Board Usage metrics, click Dell EMC Performance and Power Monitoring > Dell EMC SystemBoard Usage for the following views:
● CPU Usage - iSM (%)
Discover and manage PowerEdge servers on the SCOM console by using iSM-WMI 19
● IO Usage - iSM (%)● Memory Usage - iSM (%)● Overall System Usage - iSM (%)
4. Select the counters from the individual performance views and select the time range for which the values are required.
The data that is collected is represented in a graphical format for each system.
Next steps
A unit monitor monitors the performance counter over two successive cycles to check if it exceeds a threshold value. Whenthe threshold value is exceeded, the Dell EMC PowerEdge Server changes state and generates an alert. This unit monitor isdisabled by default. You can override (enable) the threshold values in the Authoring pane of the SCOM console. Unit monitorsare available under Dell Windows Server objects for the Dell EMC Server and Rack Workstation Monitoring feature. To enablethe threshold values of unit monitors, see Enable performance and power monitoring unit monitors on page 14.
To enable the PowerEdge server performance collection rules and for more information about the performance informationcollection, see Enable PowerEdge server performance collection rules set on the SCOM console on page 14.
State views in the monitoring feature of DSMPS using iSM-WMI
About this task
The State View is available for viewing the health of Dell EMC devices that are monitored by different monitoring features ofDSMPS. To view the state of a device:
Steps
1. In the left pane of the SCOM console, select Monitoring.
2. Expand Dell EMC > Dell EMC State Views.
Different State views are listed based on the monitoring feature. See State views displayed by different monitoring featuresof DSMPS on page 50.
3. To view data about a component, select a component.Information is displayed in the Detail View section.
Results
The health of a component is derived by reviewing the unresolved alerts that are associated with the component. Severity levelsof discovered devices on page 42 explain the various state components that DSMPS use with their corresponding severitylevels.
20 Discover and manage PowerEdge servers on the SCOM console by using iSM-WMI
Discover and manage DRACs on the SCOMconsole by using DSMPS
Topics:
• Introduction to the monitoring features in DSMPS for DRACs• Discovery and classification of DRACs• Discover and enable DRAC devices using DSMPS• Monitoring DRACs using DSMPS
Introduction to the monitoring features in DSMPS forDRACs
About this task
DRAC monitoring feature supports discovery and monitoring for the various generations of iDRAC—iDRAC6, iDRAC7, andiDRAC8 systems using SNMP.
NOTE: The DRAC monitoring feature is deprecated for iDRAC9 and later generation of PowerEdge servers. Dell
Technologies recommends that you use the Dell EMC OpenManage Integration with Microsoft System Center—Operations
Manager (OMIMSSC) appliance for iDRAC9 systems. For more information about deploying and configuring OMIMSSC,
see the latest version of Dell EMC OpenManage Integration with Microsoft System Center for System Center Operations
Manager User's Guide on the Dell Technologies Support Site.
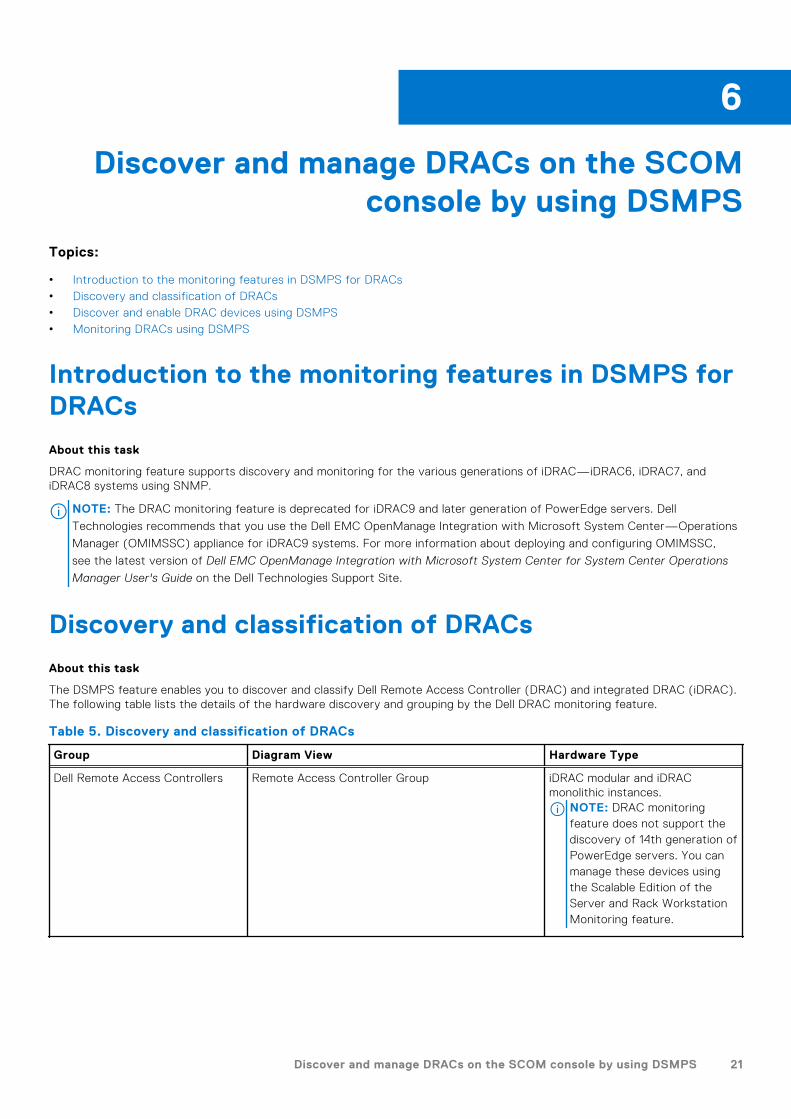
Discovery and classification of DRACs
About this task
The DSMPS feature enables you to discover and classify Dell Remote Access Controller (DRAC) and integrated DRAC (iDRAC).The following table lists the details of the hardware discovery and grouping by the Dell DRAC monitoring feature.
Table 5. Discovery and classification of DRACs
Group Diagram View Hardware Type
Dell Remote Access Controllers Remote Access Controller Group iDRAC modular and iDRACmonolithic instances.
NOTE: DRAC monitoringfeature does not support thediscovery of 14th generation ofPowerEdge servers. You canmanage these devices usingthe Scalable Edition of theServer and Rack WorkstationMonitoring feature.
6
Discover and manage DRACs on the SCOM console by using DSMPS 21

Discover and enable DRAC devices using DSMPS
About this task
The DRAC devices must be discovered as network devices under the Administration section of the SCOM console. Todiscover DRAC devices in the SCOM console, do the following:
Steps
1. Log in to the management server as a SCOM administrator.
2. In the left pane, select Administration.
3. In the left pane, click Discovery Wizard.
4. Select Network devices, and then complete the tasks that are prompted by the Computer and Device ManagementWizard.
For more information, see the Microsoft SCOM documentation.
5. On the Add a Device Console screen, enter the IP address that you want to discover.
6. Select the necessary Run As Account from the SNMP V1 or SNMP V2 Run As Account drop-down menu.
7. Enable the DRAC monitoring feature by using the Dell EMC Feature Management Dashboard.
Results
Scalability recommendation for SCOM
When managing large number of network devices in a distributed setup, use dedicated resource pools of Management Serversfor each device type. For more information about the number of devices that are supported in a Management Group, see theSizing Guide sections in the Microsoft SCOM documentation.
Monitoring DRACs using DSMPSAfter you install DSMPS, you can use the Monitoring pane of SCOM to select views that provide complete health informationof the discovered Dell DRAC devices. The DRAC monitoring feature discovers and monitors the health of the Dell DRAC devices.It includes monitoring health of the Dell DRAC devices, both at regular intervals and on occurrence of events. The Severitylevels of discovered devices on page 42 indicates the health of the Dell DRAC devices on the network.
NOTE: To monitor the health of DRAC devices, associate the community string Run As account with the SNMP Monitoring
Account with the target as the Dell Remote Access Controller class or respective DRAC object (if you have different Run As
accounts for different DRAC devices).
View options for DRAC monitoring feature of DSMPS
DSMPS provides the following types of views for monitoring DRACs by selecting Monitoring > Dell EMC on the SCOMconsole:
● Alert view in the monitoring feature of DSMPS using iSM-WMI on page 19● Diagram views in the monitoring feature of DSMPS using iSM-WMI on page 19● Performance and power monitoring views in the monitoring feature of DSMPS using iSM-WMI on page 19● State views in the monitoring feature of DSMPS using iSM-WMI on page 20
Alert view in the DRAC monitoring feature of DSMPS
The Alert View is available for managing hardware and storage events from Dell EMC DRAC devices. SNMP traps and PlatformEvent Traps (PET) sent by DRAC devices are displayed by the DRAC monitoring feature.
To view DRAC alerts on the SCOM console:
1. In the left pane of the SCOM console, select Monitoring.2. Expand Dell EMC > Dell EMC Alerts Views. The following alerts are displayed:
● PET Traps—These alerts contain information about PET traps from iDRAC6, iDRAC7, and iDRAC8 devices.
22 Discover and manage DRACs on the SCOM console by using DSMPS

● Remote Access Alerts—These alerts contains information about SNMP traps from iDRAC6, iDRAC7, and iDRAC8devices.
See Alert views displayed by different monitoring features of DSMPS on page 46.3. Select the required Alert View. In the right pane, alerts that meet the criteria—such as alert severity, resolution state, or
alerts that are assigned to you—are displayed.4. Select an alert to view the details in the Alert Details section.
Diagram views in the DRAC monitoring feature of DSMPS
The Dell EMC Diagram Views offer a hierarchical and graphical representation of all Dell DRAC devices on the network.
To view the diagrams for DRAC monitoring feature on the SCOM console:
1. In the left pane of the SCOM console, select Monitoring.2. Expand Dell EMC > Dell EMC Diagram Views.3. In the Monitoring pane, select Dell EMC Diagram Views folder for the following views:
● Dell EMC Complete Diagram View● Remote Access Controllers GroupSee Diagram views displayed by different monitoring features of DSMPS on page 47.
Figure 2. Remote Access Controllers Group Diagram View
4. Select a required Dell EMC Diagram View to view the hierarchical and graphical representation of the selected DRAC in theright pane.
5. Select a component in the diagram to view its details in the Detail View section.
State views in the DRAC monitoring feature of DSMPS
About this task
The State View is available for viewing the health of Dell EMC DRAC devices that are monitored by different monitoringfeatures of DSMPS. To view the state of a device:
Steps
1. In the left pane of the SCOM console, select Monitoring.
2. Expand Dell EMC > Dell EMC State Views.
Discover and manage DRACs on the SCOM console by using DSMPS 23
Different State views are listed based on the monitoring feature. See State views displayed by different monitoring featuresof DSMPS on page 50.
3. To view data about a component, select a component.Information is displayed in the Detail View section.
Results
The health of a component is derived by reviewing the unresolved alerts that are associated with the component. Severity levelsof discovered devices on page 42 explain the various state components that DSMPS use with their corresponding severitylevels.
24 Discover and manage DRACs on the SCOM console by using DSMPS

Supported tasks on the SCOM console forDSMPS monitoring features
Topics:
• Run DSMPS monitoring feature-based tasks on SCOM• Tasks run on Dell EMC devices by using the DSMPS monitoring features
Run DSMPS monitoring feature-based tasks on SCOM
Steps
1. In the left pane of the SCOM console, select Monitoring.
2. Expand Dell EMC.
3. Expand either Diagram Views, State Views, or Alerts Views.
4. Select the device on which you want to run the task.A list of tasks you can run by using the monitoring feature that is used by the device is displayed in the Tasks pane of theSCOM console.
5. In the Tasks pane, click the task that you want to run.The task is started, and after the task is successfully run, a summary of the task is displayed.
Results
NOTE: Some tasks have prerequisites to be successfully run.
Tasks run on Dell EMC devices by using the DSMPSmonitoring featuresWhen you select a device or a component, the relevant tasks are displayed in the Tasks pane of SCOM. This is a list of thetasks that you can run on Dell EMC devices by using different monitoring features of DSMPS.
Table 6. Tasks run on Dell EMC devices by using the DSMPS monitoring features
DSMPS tasks run onthe SCOM console
DSMPS monitoring features
Server and Rack Workstationmonitoring feature using OMSA
Server and RackWorkstation monitoringfeature using iSM-WMI
DRAC monitoring feature
Check Node Interface Yes Yes Yes
Get WarrantyInformation
- Yes No
Launch OpenManageServer Administrator(Monolithic Server)
Yes No Yes
Launch Dell EMCRemote Access Console
Yes Yes Yes
Launch Remote Desktop(Monolithic Server)
Yes Yes Yes
7
Supported tasks on the SCOM console for DSMPS monitoring features 25

Table 6. Tasks run on Dell EMC devices by using the DSMPS monitoring features
DSMPS tasks run onthe SCOM console
DSMPS monitoring features
Server and Rack Workstationmonitoring feature using OMSA
Server and RackWorkstation monitoringfeature using iSM-WMI
DRAC monitoring feature
iDRAC Hard Reset No Yes No
Clear ESM Logs Yes No No
Power management-related tasks
Check Power Status Yes No No
Force Power Off Yes No No
Power Cycle Yes No No
Power off Gracefully Yes No No
Power On Yes No No
Power Reset Yes No No
Turn LED IdentificationOn
Yes No No
Turn LED IdentificationOff
Yes No No
To run the monitoring feature-based tasks on a SCOM console, see Run DSMPS monitoring feature-based tasks on SCOM onpage 25.
Check connection to the nodes
By running the Check Node Interfaces task, you can check if the selected Dell EMC device or DRAC/IDRAC and itscorresponding interfaces are reachable. After the task is successfully run, a summary of the reachability to the server andinterface is displayed.
View warranty information of PowerEdge servers
By running the Get Warranty Information task, you can view the warranty status of the Dell EMC device.
Start OMSA on monolithic servers using the SCOM console
By running the Launch Dell OpenManage Server Administrator task, you can start the Dell OMSA application.
NOTE: The Dell EMC Server Management Pack Suite (DSMPS) tasks open the remote console when using Internet
Explorer.
Start iDRAC using the SCOM console
By running the Launch Dell EMC Remote Access Console task, you can start the Dell iDRAC application.
Start Remote Desktop on monolithic servers using the SCOMconsole
By running the Launch Dell EMC Remote Desktop task, you can start a Remote Desktop on Dell EMC monolithic servers.
26 Supported tasks on the SCOM console for DSMPS monitoring features

NOTE: You can start Dell EMC Remote Desktop only if Windows operating system is installed, and Remote Desktop is
manually enabled on the managed node.
Perform a remote iDRAC hard reset operation
You can remotely reset an iDRAC without shutting down the operating system of a server. This task is available only onPowerEdge servers that are discovered through iDRAC Service Manager (iSM) by using WMI. To reset the iDRAC remotely, youmust first ensure that you have administrative privileges on the host operating system.
To remotely reset iDRAC, do the following on the SCOM console:1. In the left pane, click Monitoring.2. Click Dell EMC > Dell EMC State Views > Dell EMC Servers (iSM) State View. The state information is displayed, and
the servers that are discovered though iSM by using WMI are listed in the working pane.3. Select the server on which you want to remotely reset iDRAC. In the Tasks section of the right pane, the tasks that you can
perform on the selected server are displayed.4. Click iDRAC Hard Reset. The Run Task - iDRAC Hard Reset window is displayed.5. Click Run. The Task Status - iDRAC Hard Reset window is displayed with the status of the reset.6. Click Close. The iDRAC is successfully reset without shutting down the server operating system.
Clear Embedded Server Management (ESM) logs
The Server Administrator Embedded Server Management (ESM) log, also referred to as the hardware log, maintains a list of allsystem events that are generated by the hardware, such as Error-Correcting Code (ECC), system reset and boot, and probethreshold changes. You can refer to this log when hardware errors appear or when the system is not functioning properly.
To run the Clear ESM Logs task, do the following:1. In the left pane, click Monitoring.2. Expand Dell EMC.3. Expand either Diagram Views, State Views, or Alerts Views.4. Select the device on which you want to run the task. A list of tasks you can run by using the monitoring feature that is used
by the device is displayed in the Tasks pane of the SCOM console.5. In the Tasks pane, click Dell EMC Windows Server Tasks > Clear ESM Logs. The Run Tasks window is displayed.6. Click Run. The ESM logs of the selected device is deleted.
NOTE: When you run the Clear ESM Logs task, on the task execution screen, only the result of the task initiating is
displayed. For example, the task execution screen may show a success result even if the ESM logs are not cleared. This
means that the Clear ESM Logs task initiation was successful.
Power management-related tasks
● Check power status of Dell EMC PowerEdge servers and Rack Workstations—You can run this task only on servers that aremonitored by DSMPS using OMSA. By running the Check Power Status task, you can check the power status and managepower control tasks by using the IPMI Shell.
● Power off PowerEdge server shutting down the operating system—By running the Force Power Off task, you can power offthe PowerEdge server without shutting down the operating system.
● Power cycle a PowerEdge server—By running the Power Cycle task, you can power off the PowerEdge server, and thenpower on again after a delay.
● Gracefully power off a PowerEdge server—By running the Power Off Gracefully task, you can shut down the operatingsystem, and then power off the PowerEdge server.
● Power on a PowerEdge server—By running the Power On task, you can power on the PowerEdge server of if it is inpowered-off state.
● Reset the PowerEdge server power—By running the Power Reset task, you can power on the PowerEdge server of if it is inpowered-off state.
● Identify an OMSA−based server by enabling the identification LED—By running the Turn LED Identification On task, you canenable the feature to identify a server by using a blinking LED. Similarly, by running the Turn LED Identification Off task, thefeature to identify a server by using a blinking LED is disabled.
Supported tasks on the SCOM console for DSMPS monitoring features 27
NOTE: To enable Advanced Power Control, install BMU in the default path. If BMU is not installed in the default path,
create a console task. For more information about creating a console task, see Identify device and device power status by
using identification LEDs.
28 Supported tasks on the SCOM console for DSMPS monitoring features

Generating DSMPS reportsAbout this task
The reporting feature of the SCOM console enables you to create reports for Dell EMC OpenManage Windows Event Log, Dellserver BIOS, firmware, and RAID configuration.
NOTE:
● Dell EMC Server and Rack Workstation Monitoring feature supports only object-level reporting.
● Dell server BIOS, firmware, and RAID configuration reports are available only in the Detailed edition.
Topics:
• View reports about PowerEdge servers on the SCOM console
View reports about PowerEdge servers on the SCOMconsole
Steps
1. On the SCOM console, select Reporting.
2. Select:
a. Dell Windows Server (Scalable Edition) for the OpenManage Windows Event Log reports.b. Dell Windows Server (Detail Edition) for BIOS configuration, firmware and driver versions, and RAID configuration
reports.
NOTE: You can also access Reporting from the Diagram View or State View by clicking the server instance. The option
for Dell Reports is available in the Tasks pane under the Dell System instance reports along with the default SCOM
reports.
Generate DSMPS reports on the SCOM console
Steps
1. On the SCOM console, select Reporting.
2. In the working pane, based on the report that you want to generate, perform one of the following actions:
a. For OpenManage Windows Event Log report: Select Dell Windows Server (Scalable Edition) and selectOpenManage Windows Event Log.
b. For BIOS configuration report: Select Dell Windows Server (Detail Edition) and select BIOS Configuration.c. For firmware and driver report: Select Dell Windows Server (Detail Edition) and select Firmware and Driver
Versions.d. For RAID configuration report: Select Dell Windows Server (Detail Edition) and select RAID Configuration.
3. In the Tasks pane, click Open.
4. Select the duration for which you want the report to be generated.
5. Click Add Object.
6. Search for the following objects of class and click Add: Dell Windows Server.The object is displayed in the Select object pane.
7. Select the required properties.
8. Click Run.
8
Generating DSMPS reports 29

Results
The selected report is generated.
30 Generating DSMPS reports

Upgrading DSMPSIf you are using Dell EMC Server Management Pack Suite (DSMPS) version 7.1.1 then you can either upgrade to:
● Latest version of the OMIMSSC appliance.● Latest version of DSMPS (using an installer).
Topics:
• Upgrade DSMPS to latest version of OMIMSSC• Upgrade from previous versions of DSMPS
Upgrade DSMPS to latest version of OMIMSSCWhile upgrading to the latest version of OMIMSSC appliance from DSMPS version 7.0, do the following:
1. Set up the OMIMSSC appliance by deploying the VHD file on a Hyper-V VM.2. Enroll the Management Server with the OMIMSSC appliance. Wait for few minutes until the management packs are
upgraded.NOTE: To plan for the number of proxy management servers that are required, see the Scalability with OpenManage
Integration with Microsoft System Center for System Center Operations Manager technical white paper on the support
site.
3. Open the OpenManage Integration Dashboard and perform the Synchronize with MSSC operation from the respectivedevice view to synchronize the devices that are discovered in the SCOM console. For example, to synchronize the SMASHdevices that are discovered in SCOM:a. Go to the Server View in the Dell EMC OpenManage Integration Dashboard.b. Click Synchronize with MSSC.
Synchronizing with MSSC operation also synchronizes the proxy management server information that is added to theDellProxyMSGroup.
CAUTION: Ensure to add the required number of proxy management servers when you want to scale to large
number of devices.
NOTE: Performance metrics that are generated from Dell EMC Servers and Rack Workstation Monitoring feature, which is
discovered through the WS-Man protocol in the 7.0 views, are not retained.
Upgrade from previous versions of DSMPS
NOTE: The feature to upgrade DSMPS version 6.3 to DSMPS version 7.1 and later is not supported.
The installer detects the features that are installed from DSMPS version 7.0, and automatically upgrades the DSMPS to version7.1 and later.
NOTE: The installer may display a message prompting a restart of the MS after the upgrade is completed. Ignore the
message as restart is not required.
NOTE: The alerts generated for PowerEdge servers and Rack Workstations will be acknowledged.
NOTE: Low performance metrics will be retained after the upgrade.
9
Upgrading DSMPS 31

Uninstalling DSMPSAbout this task
You can uninstall the Dell EMC Server Management Pack Suite (DSMPS) by using:● The Windows Control Panel.● The Remove option in the DSMPS EXE file.You can remove the Dell EMC Management packs by de-enrolling one or more Management Servers.Topics:
• Uninstall DSMPS by using the Windows Control Panel• Uninstall DSMPS by using DSMPS installer EXE file
Uninstall DSMPS by using the Windows Control Panel
Steps
1. Click Start > Control Panel > Uninstall a program.
2. Right-click Dell EMC Server Management Pack, and click Uninstall.
3. Complete the uninstallation process by following the on-screen instructions.
Uninstall DSMPS by using DSMPS installer EXE file
Steps
1. From the location where the downloaded DSMPS installation file is extracted, run theDell_EMC_Server_Management_Pack.exe file.The Welcome screen for Dell EMC Server Management Pack is displayed.
2. Click Next.
3. Select Remove, and then select Next.The Remove the Program screen is displayed.
4. Click Remove.
Results
Uninstallation of DSMPS removes the Dell EMC management packs that are imported in the SCOM. For more information aboutremoving management packs from SCOM, see the respective Microsoft documentation.
10
32 Uninstalling DSMPS

Reference topics
Topics:
• Monitoring features supported by DSMPS• Severity levels of discovered devices• Discovery features supported in the DSMPS monitoring of PowerEdge servers and rack workstations using OMSA• Discovery features supported by DSMPS for monitoring DRACs• Hardware components monitored by different monitoring features of DSMPS• View options provided by the monitoring features of DSMPS• Key features of monitoring PowerEdge servers in DSMPS using iSM-WMI• DSMPS Unit Monitors• Event rules used by different monitoring features of DSMPS
Monitoring features supported by DSMPSThe topics in this section describe the monitoring features that are supported by DSMPS for SCOM.
Dell EMC Server and Rack Workstation Monitoring feature inDSMPS using OMSA
Dell EMC Servers and Rack Workstation Monitoring feature supports the discovery and monitoring of the following devices thatare installed with the supported Windows operating system, using OpenManage Server Administrator (OMSA):
● PowerEdge Modular and PowerEdge Monolithic servers● PowerVault servers● Hardware monitoring of Dell EMC-branded or Dell EMC OEM Ready servers● Dell Precision Racks
Inventory and monitoring of these devices is performed through the OpenManage Server Administrator (OMSA) application thatis installed on the servers—which is a license-free monitoring feature.
DSMPS automatically imports the scalable version of the Dell EMC Server and Rack Workstation Monitoring feature into SCOM.
Management packs necessary for using the Server and Rack WorkstationMonitoring feature in DSMPS
After the Dell EMC Server Management Pack Suite management packs are imported successfully, the required managementpacks are imported and should appear in the Administration pane of the SCOM console.
Management packs’ names and library location for monitoring PowerEdge servers andrack workstations
Table 7. Management Packs for the Server and Rack Workstation Monitoring feature
Feature Default location of ManagementPacks
Management Packs
Dell EMC Server and RackWorkstation Monitoring
Library: %PROGRAMFILES%\DellManagement Packs\ServerMgmt\7.2\Library
Library● Dell.Connections.HardwareLibrary.mp● Dell.OperationsLibrary.Server.mp
11
Reference topics 33

Table 7. Management Packs for the Server and Rack Workstation Monitoring feature
Feature Default location of ManagementPacks
Management Packs
Scalable and detailed ManagementPacks: %PROGRAMFILES%\DellManagement Packs\ServerMgmt\7.2\Server Monitoring
Scalable feature● For Dell EMC Servers or Rack Workstations
discovered using OMSA:○ Dell.Model.Server.mp○ Dell.WindowsServer.Scalable.mp○ Dell.View.Server.mp○ (Optional)
Dell.WindowsServer.InformationAlertsOn.mp
NOTE: ImportDell.WindowsServer.InformationAlertsOn.mponly if you want to receive InformationalAlerts.
Detailed feature● Dell.WindowsServer.Detailed.mp and all scalable
management packs.
System configuration required for using the Server and Rack WorkstationMonitoring feature in DSMPS
Management Server (MS) requirements for using the Server and Rack Workstation Monitoring feature in DSMPS
Operating systems supported by Microsoft SCOM Management Servers:
● For SCOM 2019, see https://docs.microsoft.com/en-us/system-center/scom/welcome?view=sc-om-2019.● For SCOM 1807, see https://docs.microsoft.com/en-us/system-center/scom/whats-new-in-om?view=sc-om-1807.● For SCOM 1801, see https://docs.microsoft.com/en-us/system-center/scom/whats-new-in-om?view=sc-om-1801.● For SCOM 2016, see https://docs.microsoft.com/en-us/system-center/scom/release-build-versions-2016?view=sc-
om-2016.
Software requirements for Microsoft SCOM Management Server:
● (Optional) DRAC tools from OpenManage Server Administrator (Server Administrator)—To inventory and monitor Dell EMCServer and Rack Workstation’s iDRAC and its NIC.
● (Optional) Baseboard Management Controller (BMC) Management Utility—To run the Remote Power Control tasks or theLED Identification Control tasks on Dell-managed systems.
NOTE: Access DRAC tools, OpenManage Server Administrator (Server Administrator), and BMC Management Utility from
Dell Systems Management Tools and Documentation media, or download it from Dell Technologies support site.
Management Server Action Account privileges (MSAA)
● Start the DRAC discovery and corresponding DRAC console—Administrator or Power user.● Clear ESM log data—Administrator or Power user. Alternatively, if the MSAA has normal user privileges, operators can,
instead of selecting Use the predefined Run as Account, enter task credentials with Power User (or higher) privileges to runthe Clear ESM Logs task.
Managed System requirements for using the Server and Rack Workstation Monitoring feature in DSMPS
Install any supported OpenManage Server Administrator versions (including the Server Administrator Storage ManagementService) on the managed system.
● If you want to upgrade or uninstall OMSA on the managed system, the Alerts View of the managed system may display thefollowing error: Script or Executable failed to run.
● If the managed system is not a Management Server then switch the system to the Maintenance Mode until the upgrade oruninstall completes. If the managed system is the Management Server, you may manually close the alerts after the upgradeor uninstall is complete.
NOTE: On systems using OMSA 7.2 DRAC tools, it is recommended to upgrade to OMSA 7.4 DRAC tools or later.
NOTE: For more information about the supported operating systems for the managed system, see the OpenManage Server
Administrator Installation Guide on the support site.
34 Reference topics
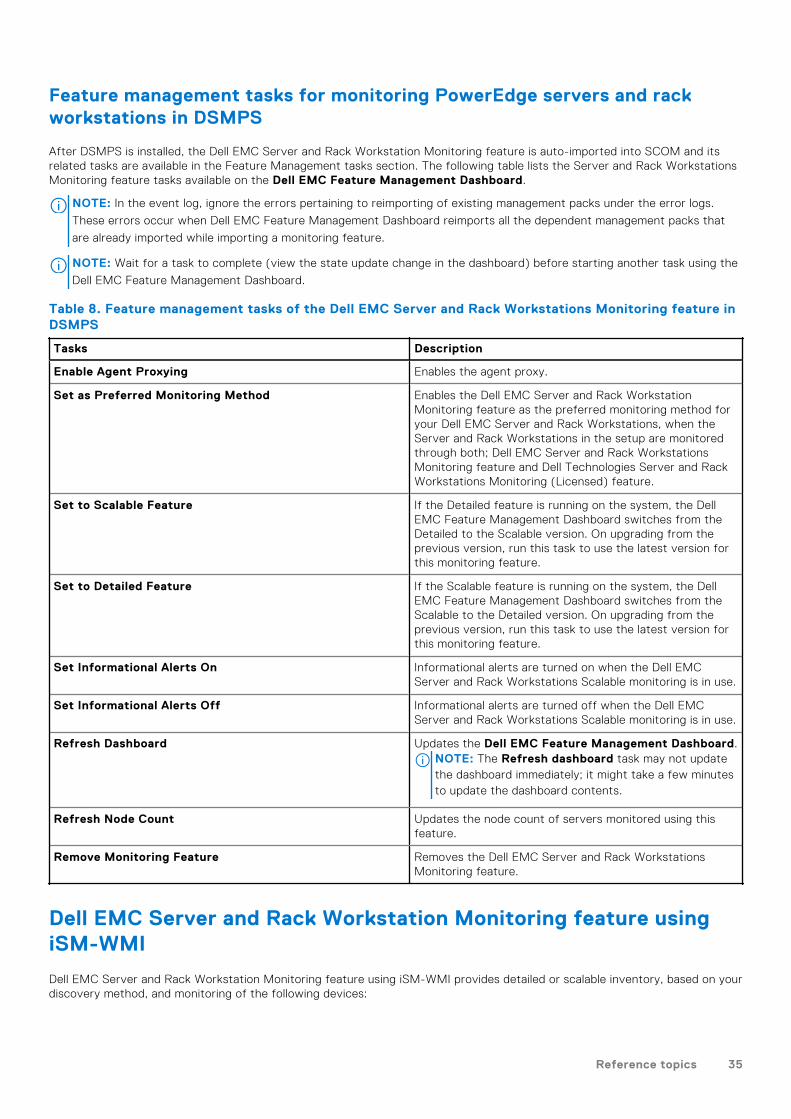
Feature management tasks for monitoring PowerEdge servers and rackworkstations in DSMPS
After DSMPS is installed, the Dell EMC Server and Rack Workstation Monitoring feature is auto-imported into SCOM and itsrelated tasks are available in the Feature Management tasks section. The following table lists the Server and Rack WorkstationsMonitoring feature tasks available on the Dell EMC Feature Management Dashboard.
NOTE: In the event log, ignore the errors pertaining to reimporting of existing management packs under the error logs.
These errors occur when Dell EMC Feature Management Dashboard reimports all the dependent management packs that
are already imported while importing a monitoring feature.
NOTE: Wait for a task to complete (view the state update change in the dashboard) before starting another task using the
Dell EMC Feature Management Dashboard.
Table 8. Feature management tasks of the Dell EMC Server and Rack Workstations Monitoring feature inDSMPS
Tasks Description
Enable Agent Proxying Enables the agent proxy.
Set as Preferred Monitoring Method Enables the Dell EMC Server and Rack WorkstationMonitoring feature as the preferred monitoring method foryour Dell EMC Server and Rack Workstations, when theServer and Rack Workstations in the setup are monitoredthrough both; Dell EMC Server and Rack WorkstationsMonitoring feature and Dell Technologies Server and RackWorkstations Monitoring (Licensed) feature.
Set to Scalable Feature If the Detailed feature is running on the system, the DellEMC Feature Management Dashboard switches from theDetailed to the Scalable version. On upgrading from theprevious version, run this task to use the latest version forthis monitoring feature.
Set to Detailed Feature If the Scalable feature is running on the system, the DellEMC Feature Management Dashboard switches from theScalable to the Detailed version. On upgrading from theprevious version, run this task to use the latest version forthis monitoring feature.
Set Informational Alerts On Informational alerts are turned on when the Dell EMCServer and Rack Workstations Scalable monitoring is in use.
Set Informational Alerts Off Informational alerts are turned off when the Dell EMCServer and Rack Workstations Scalable monitoring is in use.
Refresh Dashboard Updates the Dell EMC Feature Management Dashboard.NOTE: The Refresh dashboard task may not updatethe dashboard immediately; it might take a few minutesto update the dashboard contents.
Refresh Node Count Updates the node count of servers monitored using thisfeature.
Remove Monitoring Feature Removes the Dell EMC Server and Rack WorkstationsMonitoring feature.
Dell EMC Server and Rack Workstation Monitoring feature usingiSM-WMI
Dell EMC Server and Rack Workstation Monitoring feature using iSM-WMI provides detailed or scalable inventory, based on yourdiscovery method, and monitoring of the following devices:
Reference topics 35

● 12th, 13th generation, and iDRAC 9-based PowerEdge servers● PowerVault servers● Hardware monitoring of Dell EMC-branded or Dell EMC OEM Ready servers and Dell EMC Microsoft Storage Spaces Direct
Ready nodes.● Dell Precision Racks
Inventory and monitoring of these devices could be done through iDRAC or iDRAC Service Module (iSM) installed on themanaged Dell EMC Server or Rack Workstation through one of the following methods based on your monitoring preference:
● iDRAC access via Host OS● iSM using WMI
For the list of supported platforms for iSM, see the iDRAC Service Module Installation Guide on the support site.
Management Packs
Table 9. Management Packs required for the Dell EMC Server and Rack Workstations Monitoring(Licensed) feature
Feature Default location of ManagementPacks
Management Packs
Dell EMC Server and RackWorkstation Monitoring usingiSM-WMI
Library: %PROGRAMFILES%\DellManagement Packs\ServerMgmt Suite\7.2\Library
Scalable and detailed ManagementPacks: C%PROGRAMFILES%\DellManagement Packs\ServerMgmt Suite\7.2\ServerMonitoring
Library● Dell.Connections.HardwareLibrary.mp● Dell.OperationsLibrary.Server.mpMonitored Management Packs● For Dell EMC Servers or Rack Workstations that
are discovered through iSM–WMI:○ Dell.ManagedServer.iSM.mp○ Dell.ManagedServer.Model.mp○ Dell.View.Server.mp
● Dell.Model.Server.mp● Dell.View.Server.mp
Configuration prerequisites
● Ensure that the SNMP ports on the firewall are enabled.● To receive alerts in SCOM, enable the OS-to-iDRAC Passthrough setting in iDRAC.
Management Server (MS) requirements
● Microsoft System Center—Operations Manager 2012 and later: Dell EMC Server and Rack Workstation Monitoring(Licensed) feature is available only on management servers running Operations Manager 2012 and later.
● SMASH Library MPB from Microsoft: Dell EMC Server and Rack Workstation Monitoring (Licensed) feature requires SMASHlibrary MPB from Microsoft to discover Dell EMC PowerEdge Servers. See Install Web Services Management (WS-Man) andSMASH device template on page 66.
Managed System requirements
● Required iSM version is installed on the Dell EMC device. Based on your monitoring requirements, the following featuresmust be enabled through the iDRAC console:○ Windows Management Instrumentation (WMI) feature to monitor through iSM–WMI.○ iDRAC access via Host OS (Experimental feature) to monitor through iDRAC using host IP.
● iDRAC7 or later.NOTE: If you are using iDRAC firmware version 2.40.40.40 or later, Transport Layer Security (TLS) versions 1.1 or
later is enabled by default. Before installing Dell EMC Server Management Pack Suite version 7.2 for Microsoft System
Center Configuration Manager, see https://www.support.microsoft.com/en-us/kb/3140245 for more information about
TLS updates. Based on your web browser, you may have to enable support for TLS 1.1 or later.
36 Reference topics

Feature management tasks
The following table lists the Dell EMC Server and Rack Workstation monitoring feature (using iSM-WMI) tasks available on theDell EMC Feature Management Dashboard. Some tasks that are listed in the Feature Management tasks table appear onlyafter you have imported the Dell EMC Server and Rack Workstation Monitoring feature.
NOTE: In the Event Log, ignore the errors pertaining to reimporting of existing management packs under the error logs.
These errors occur when Dell EMC Feature Management Dashboard reimports all the dependent management packs
that are already imported while importing a monitoring feature.
Table 10. Feature management tasks
Tasks Description
Enable Agent Proxying Enables agent proxying for the Dell EMC PowerEdgeServers running the supported iSM version and also triggersdiscovery of these servers.
Set to Scalable Feature If the detailed feature is running on the system, theDell EMC Feature Management Dashboard switchesfrom the detailed feature to the scalable feature forthis monitoring method. On upgrading from the previousversion, run this task to use the latest version for thismonitoring feature.
Set to Detailed Feature If the scalable feature is running on the system, theDell EMC Feature Management Dashboard switchesfrom the scalable feature to the detailed feature forthis monitoring method. On upgrading from the previousversion, run this task to use the latest version for thismonitoring feature.
Set as Preferred Monitoring Method Enables the Dell EMC Server and Rack WorkstationMonitoring (Licensed) feature as the preferred monitoringmethod for your Dell EMC Servers and Rack Workstations,when these devices are monitored through both, the DellEMC Server and Rack Workstation Monitoring featureand Dell EMC Server and Rack Workstation Monitoring(Licensed) feature.
Enable Event Auto-Resolution Enables the Event Auto-Resolution feature.
Disable Event Auto-Resolution Disables the Event Auto-Resolution feature.
Associate Run-As Account This task associates the Run As Account that is used forthe SMASH discovery with all Dell Server objects, which arerequired for health monitoring. For more information, seethe Associate Run-As Account task—Dell EMC Server andRack Workstation Monitoring feature on page 66.
Remove Monitoring Feature Removes the Dell EMC Server and Rack WorkstationMonitoring (Licensed) feature.
Refresh Dashboard Updates the Dell EMC Feature Management Dashboard.NOTE: The Refresh dashboard task may not updatethe dashboard immediately; it might take a few minutesto update the dashboard contents.
Refresh Node Count Updates the node count of servers monitored using thisfeature.
DRAC Monitoring feature of DSMPS
The DRAC Monitoring feature supports discovery and monitoring for the various generations of iDRAC—iDRAC6, iDRAC7, andiDRAC8 systems by using SNMP.
Reference topics 37

NOTE: The DRAC Monitoring feature is deprecated for iDRAC9 and above systems. Recommendation is to use the Dell
EMC Server and Rack Workstation Monitoring (Licensed) feature for iDRAC9 systems.
Management packs necessary for using the DRAC Monitoring feature inDSMPS
Table 11. Management packs for the DRAC monitoring feature in DSMPS
Feature Default location of ManagementPacks
Required Management Packs
DRAC Monitoring Library: %PROGRAMFILES%\DellManagement Packs\Server MgmtSuite\7.2\Library
Management Packs:%PROGRAMFILES%\DellManagement Packs\ServerMgmt Suite\7.2\Remote AccessMonitoring
Library● Dell.Connections.HardwareLibrary.mp● Dell.OperationsLibrary.Common.mpManagement Packs● Dell.DRAC.OM07.mp● Dell.DRAC.OM12.mp—SCOM 2012 or later.● Dell.Model.DRAC.mp● Dell.OperationsLibrary.DRAC.mp● Dell.View.DRAC.mp
Configuration prerequisites required for using the DRAC Monitoring featurein DSMPS
For using the DRAC monitoring feature in DSMPS, you must configure the firewall to enable the SNMP ports.
DRAC monitoring requirement
To monitor the health of DRAC devices, associate the community string Run As account with the SNMP Monitoring Accountwith the target as Dell Remote Access Controller class or respective DRAC object (if you have different Run As accounts fordifferent DRAC devices).
Feature management tasks for DRAC Monitoring feature in DSMPS
The following table lists the DRAC monitoring tasks available in the Dell EMC Feature Management Dashboard. Some tasks thatare listed in the Feature Management tasks table appear only after you have imported the DRAC monitoring feature.
NOTE: In the event log, ignore the errors pertaining to reimporting of existing management packs under the error logs.
These errors occur when Dell EMC Feature Management Dashboard reimports all the dependent management packs that
are already imported while importing a monitoring feature.
NOTE: Wait for a task to complete (view the state update change in the dashboard) before starting another task using the
Dell EMC Feature Management Dashboard.
Table 12. Feature management tasks of the DRAC Monitoring feature in DSMPS
Tasks Description
Import DRAC Monitoring Feature Imports and enables the DRAC monitoring feature in SCOM.
Refresh Dashboard Updates the Dell EMC Feature Management Dashboard.NOTE: The Refresh Dashboard task may not update thedashboard immediately; it might take a few minutes toupdate the dashboard contents.
Refresh Node Count Updates the node count.
38 Reference topics

Configuring the monitoring features of DSMPS by using theFeature Management Dashboard
The Dell EMC Feature Management Dashboard provide options to configure monitoring features using DSMPS to monitorDell EMC PowerEdge servers, Dell EMC Precision Racks, and Dell Remote Access Controllers (DRACs). You can import,upgrade, and remove the monitoring features using the Dell EMC Feature Management dashboard.
Import monitoring features using the Dell EMC Feature ManagementDashboard
About this task
The Dell EMC Feature Management Dashboard enables you to view the available DSMPS monitoring features and thenconfigure them automatically for importing, upgrading, and removing the management packs required by a feature. In adistributed setup (including distributed resource pool in SCOM 2012), the management server, where DSMPS is installed first, isselected to host all the feature-based management activities.
To import the monitoring features:
Steps
1. Start the SCOM console.
2. In the left pane, select Monitoring.
3. Expand Dell EMC > Dell EMC Feature Management Dashboard.
On the Dell Technologies Feature Management Dashboard page, you can view the list of Dell EMC monitoring featuresinstalled, the version currently in use, the version you can upgrade to, the level of monitoring, total nodes used by thecurrent license, and the licenses required, if any.
Figure 3. Dell EMC Feature Management Dashboard
4. Select the monitoring feature that you want to install.
5. In the Tasks pane, expand Dell EMC Monitoring Feature Tasks.
6. Click the task to import a feature.
7. On the Run Task screen, select Use the predefined Run As Account .
8. Click Run.
9. After the task is successfully completed, click Close.
Reference topics 39

Figure 4. Task status of Import Monitoring Feature
10. Repeat steps 3 through 8 for each monitoring feature you want to enable.
Results
NOTE: Before running another task by using the Dell Technologies Feature Management Dashboard, wait for the
current tasks to complete.
Upgrade monitoring features using the Dell EMC Feature ManagementDashboard
About this task
To ensure that you take advantages of the latest monitoring features by using DSMPS, you must upgrade the monitoringfeatures, whenever they are released. To upgrade monitoring features by using the Feature Management Dashboard, do thefollowing:
Steps
1. Start the SCOM console.
2. Select Monitoring.
3. Expand Dell EMC > Dell EMC Feature Management Dashboard.
4. Select the monitoring feature that you want to upgrade.
5. In the Tasks pane, expand Dell EMC Monitoring Feature Tasks and select the upgrade task.
6. On the Run Task upgrade screen, select Use the predefined Run As Account.
7. Click Run.
40 Reference topics

CAUTION: If there are any dependencies or associations that have to be overridden, which results in data
loss, the task cannot be successfully run and an appropriate message is displayed. To continue to run the
task, click Override, and set the AutoResolve Warnings/Errors override to True.
8. After the task is complete, click Close.
Results
During the process of upgrading, all overrides—any customization to discovery, unit monitors, and rules from previous versionsof DSMPS—are carried over to the DSMPS version 7.1 and later.
Customizing monitoring features using the Feature Management Dashboardfor scalable and detailed editions
Table 13. Customizing DSMPS Monitoring Features using Dell EMC Feature Management Dashboard—Scalable and Detailed editions
Features Scalable Edition Detailed Edition
Dell EMC Server and RackWorkstation Monitoring
Inventory and health monitoring atserver and component group level.
Detailed inventory and monitoring ofthe following components: memory,processors, sensors, network interfaces,storage controllers, disks, and volumes.BIOS information is also displayed.
DRAC Monitoring ● iDRAC inventory● iDRAC health monitoring
Not Applicable.
Remove monitoring features using the Dell EMC Feature ManagementDashboard
About this task
To remove or disable the monitoring features, use the Dell EMC Feature Management Dashboard. Before removing anyof the monitoring features, close or resolve all open alerts. While removing a monitoring feature, the Dell EMC FeatureManagement Dashboard exports all override references as backup in the installation folder. However, custom groupinformation and override instance level information cannot be reused in the future.
To remove the monitoring features:
Steps
1. Start the SCOM console and select Monitoring.
2. In the Monitoring pane, expand Dell EMC > Dell EMC Feature Management Dashboard.The Dell EMC Feature Management Dashboard pane displays the list of monitoring features currently available on theSCOM console.
3. Select the monitoring feature that you want to remove.
4. Under the Tasks pane, expand Dell EMC Monitoring Feature Tasks.
5. To remove the monitoring feature, click Remove Feature.For example, to remove Dell EMC Servers and Rack Workstations Monitoring feature, click Remove MonitoringFeature in the Tasks pane.
6. On the Run Task—Remove Feature screen, click Use the predefined Run As Account.
7. Click Run.CAUTION: If there are any dependencies or associations that have to be overridden, which result in data loss,
the task cannot be successfully run. To continue to run the task, click Override, and set the AutoResolve
Warnings/ Errors override to True.
8. After the task is complete, click Close.
Reference topics 41

Results
NOTE: Running the Remove Monitoring Feature task in Dell EMC Feature Management Dashboard may fail if there
are overrides that are referenced to custom group or instances. In such a case, ensure to remove the overrides that are
associated to custom group or instances.
Import management packs to the SCOM console
About this task
To effectively use DSMPS for device monitoring and management purposes, you must import the latest management packs toSCOM, whenever they are released. To import the Dell EMC Management Packs for SCOM, do the following:
Steps
1. Start the SCOM console.
2. In the left pane, select Administration.
3. Click Management Packs and select Import Management Packs from the Administration Overview.
4. On the Select Management Packs screen, click Add > Add from disk.
5. Enter the location details or go to the location where you have installed DSMPS.
If you had chosen to install in the default directory, the management packs are available in: C:\Program Files\ServerMgmt Suite\Dell Management Packs\7.2.
6. Select the management pack that you want to import and click Open.The Import Management Packs screen is displayed, and the management packs are listed in the Import List.
7. Click Install.
Severity levels of discovered devicesThe symbols that indicate the severity levels of the discovered Dell EMC devices on the SCOM console:
● —Normal/OK—The component is working as expected.
● —Critical/Failure/Error—The component has either failed or a failure is imminent. The component requires immediateattention and may must be replaced. Data loss may have occurred.
● —Warning/Noncritical—A probe or other monitoring device has detected a reading for the component that is greaterthan or lesser than the acceptable level. The component may still be functioning, but it could fail. The component may alsobe functioning in an impaired state.
● —The health status is not applicable for the specific component.
● —The service is unavailable.
Discovery features supported in the DSMPSmonitoring of PowerEdge servers and rackworkstations using OMSA● Dell EMC PowerEdge Servers discovery—Classifies the Dell EMC PowerEdge Servers and populates the attributes.● Dell EMC PowerEdge Server Network Interface discovery—Discovers the network interface at group level of the Dell EMC
PowerEdge Server.● Dell EMC PowerEdge Server Hardware Components discovery—Discovers hardware components at a group level (such as
sensors, processor, memory, and power supply).
42 Reference topics

● Dell EMC OpenManage Software Services discovery—Discovers the objects for OMSA Windows services.● Dell EMC PowerEdge Server Detailed BIOS discovery—Discovers BIOS objects for each Dell EMC PowerEdge Server
(Detailed edition only).● Dell EMC PowerEdge Server Detailed Memory discovery—Discovers memory instances for the Dell EMC PowerEdge Server
(Detailed edition only).● Dell EMC PowerEdge Server Detailed Power Supply discovery—Discovers power supply instances for the Dell EMC
PowerEdge Server (Detailed edition only).● Dell EMC PowerEdge Server Detailed Processor discovery—Discovers processor instances for the Dell EMC PowerEdge
Server (Detailed edition only).● Dell EMC PowerEdge Server Detailed Storage discovery—Discovers the complete storage hierarchy for the Dell EMC
PowerEdge Server (Detailed edition only).● Dell Windows Server Detailed Sensor discovery—Discovers sensor instances for Dell EMC PowerEdge Server (Detailed
edition only).● Dell Windows Server Detailed Network Interfaces discovery module—Discovers the physical and teamed network interface
instances of the Dell EMC PowerEdge Server (Detailed edition only).● Dell Windows Server Network Interfaces Group discovery module—Discovers the Network Interfaces group.● Dell EMC Rack Workstation Group discovery—Discovers the Dell EMC Rack Workstation group.● Dell Unmanaged Server Group discovery—Discovers Dell EMC PowerEdge Servers that are not being monitored either due
to the absence of Dell instrumentation, an unsupported OMSA version, or has an instrumentation version lower than therequired version.
Discovery features supported by DSMPS formonitoring DRACsiDRAC Discovery—Discovers all supported Integrated Dell Remote Access Controllers.
Dell Integrated Remote Access Modular Discovery—Discovers the Chassis Name and Chassis Service Tag of Dell IntegratedRemote Access Controllers for Modular systems.
● iDRAC6 Modular Discovery—Discovers the iDRAC6 (Modular) group.● iDRAC6 Monolithic Discovery—Discovers the iDRAC6 (Monolithic) group.● iDRAC7 Modular Discovery—Discovers the iDRAC7 (Modular) group.● iDRAC7 Monolithic Discovery—Discovers the iDRAC7 (Monolithic) group.● iDRAC8 Modular Discovery—Discovers the iDRAC8 (Modular) group.● iDRAC8 Monolithic Discovery—Discovers the iDRAC8 (Monolithic) group.● Dell Remote Access Group Discovery—Discovers the Dell Remote Access group and populates iDRAC.● Dell Integrated Remote Access Monolithic Group Discovery—Discovers the Dell Integrated Remote Access Monolithic group
and iDRAC (Monolithic).● Dell Integrated Remote Access Modular Group Discovery—Discovers and populates the iDRAC (Modular) group.
Hardware components monitored by differentmonitoring features of DSMPSTable 14. Monitored hardware components by DSMPS monitoring features
Monitored hardwarecomponents
Server and Rack Workstation monitoringfeature using OMSA
Server and Rack Workstation monitoringfeature using iSM-WMI
Scalable edition Detailed edition Scalable edition Detailed edition
Battery Sensor No Yes No Yes
Battery Sensor Group No Yes Yes Yes
BIOS Config Unit No No - -
BIOS Unit - - No No
Reference topics 43
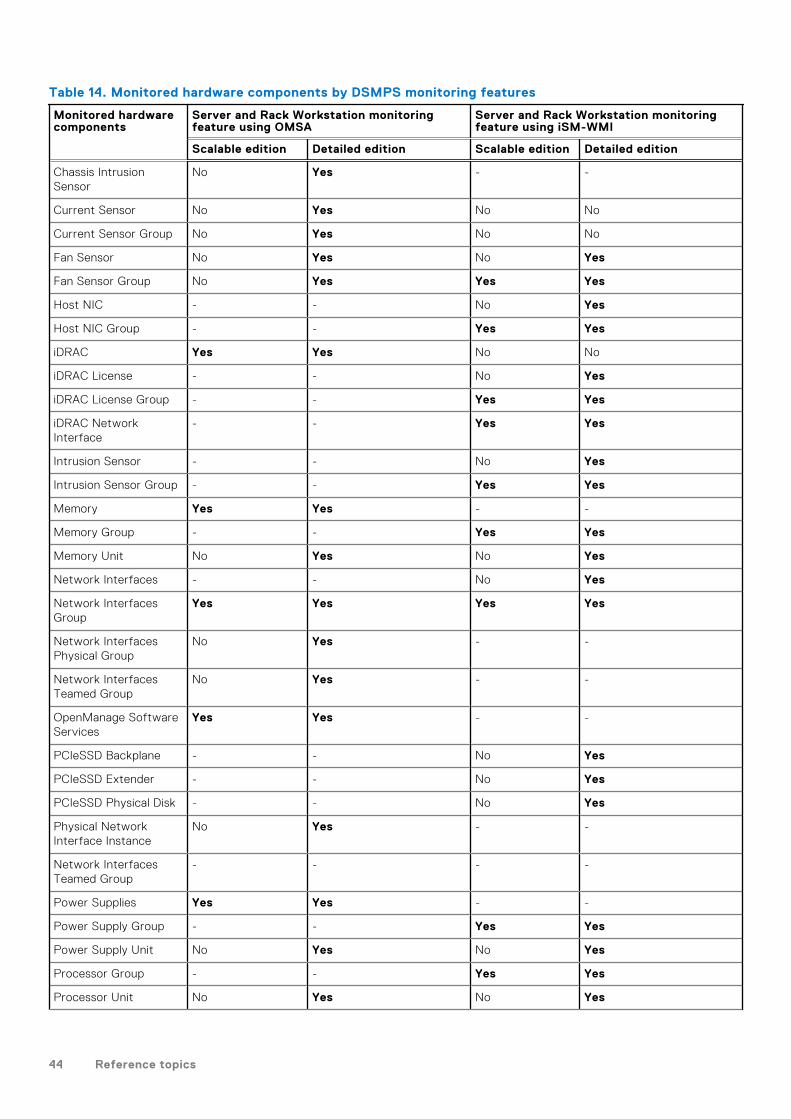
Table 14. Monitored hardware components by DSMPS monitoring features
Monitored hardwarecomponents
Server and Rack Workstation monitoringfeature using OMSA
Server and Rack Workstation monitoringfeature using iSM-WMI
Scalable edition Detailed edition Scalable edition Detailed edition
Chassis IntrusionSensor
No Yes - -
Current Sensor No Yes No No
Current Sensor Group No Yes No No
Fan Sensor No Yes No Yes
Fan Sensor Group No Yes Yes Yes
Host NIC - - No Yes
Host NIC Group - - Yes Yes
iDRAC Yes Yes No No
iDRAC License - - No Yes
iDRAC License Group - - Yes Yes
iDRAC NetworkInterface
- - Yes Yes
Intrusion Sensor - - No Yes
Intrusion Sensor Group - - Yes Yes
Memory Yes Yes - -
Memory Group - - Yes Yes
Memory Unit No Yes No Yes
Network Interfaces - - No Yes
Network InterfacesGroup
Yes Yes Yes Yes
Network InterfacesPhysical Group
No Yes - -
Network InterfacesTeamed Group
No Yes - -
OpenManage SoftwareServices
Yes Yes - -
PCIeSSD Backplane - - No Yes
PCIeSSD Extender - - No Yes
PCIeSSD Physical Disk - - No Yes
Physical NetworkInterface Instance
No Yes - -
Network InterfacesTeamed Group
- - - -
Power Supplies Yes Yes - -
Power Supply Group - - Yes Yes
Power Supply Unit No Yes No Yes
Processor Group - - Yes Yes
Processor Unit No Yes No Yes
44 Reference topics

Table 14. Monitored hardware components by DSMPS monitoring features
Monitored hardwarecomponents
Server and Rack Workstation monitoringfeature using OMSA
Server and Rack Workstation monitoringfeature using iSM-WMI
Scalable edition Detailed edition Scalable edition Detailed edition
Processors Yes Yes - -
SD Card Group - - Yes Yes
SD Card - - No Yes
Sensors Yes Yes - -
Sensors Group - - Yes Yes
Storage Yes Yes - -
Storage ConnectorInternal/external/directattached physical diskgroup
- - No Yes
Storage ConnectorInternal/external/directattached physical diskinstance
- - No Yes
Storage Controller Yes Yes No Yes
Storage ControllerBattery Group
- - No Yes
Storage ControllerBattery
- - No Yes
Storage ControllerConnector Unit
No Yes - -
Storage ControllerEnclosure Fan Sensor
- - No Yes
Storage ControllerEnclosure Fan SensorGroup
- - No Yes
Storage ControllerEnclosure Instance
- - No Yes
Storage ControllerEnclosure Unit
No Yes - -
Storage ControllerPhysical Disk Group
No Yes - -
Storage ControllerPhysical Disk Unit
No Yes - -
Storage ControllerSensors
No Yes No Yes
Storage ControllerVirtual Disk Group
No Yes - -
Storage EnclosureEMM Unit
No Yes No Yes
Storage EnclosurePhysical Disk Group
No Yes - -
Storage EnclosurePower Supply Group
No Yes No Yes
Reference topics 45

Table 14. Monitored hardware components by DSMPS monitoring features
Monitored hardwarecomponents
Server and Rack Workstation monitoringfeature using OMSA
Server and Rack Workstation monitoringfeature using iSM-WMI
Scalable edition Detailed edition Scalable edition Detailed edition
Storage EnclosurePower Supply
- - No Yes
Storage EnclosureSensors
No Yes No Yes
Storage EnclosureTemperature SensorGroup
- - No Yes
Storage EnclosureTemperature Sensors
- - No Yes
Storage Group - - Yes Yes
Storage Virtual Disk - - No Yes
Storage ControllerVirtual Disk Group
- - No Yes
Teamed NetworkInterface Unit
No Yes No No
Temperature Sensor - - No Yes
Temperature SensorGroup
- - Yes Yes
Voltage Sensor No Yes No Yes
Voltage Sensor Group No Yes Yes Yes
View options provided by the monitoring features ofDSMPSTable 15. View options provided by the DSMPS monitoring features
View types DSMPS monitoring features
Server and RackWorkstation monitoringfeature using OMSA
Server and RackWorkstation monitoringfeature using iSM-WMI
DRAC monitoring
Alert View Yes Yes Yes
Diagram View Yes Yes Yes
Performance and PowerMonitoring View
Yes Yes No
State View Yes Yes Yes
Alert views displayed by different monitoring features of DSMPS
Table 16. Alert views displayed by different monitoring features of DSMPS
46 Reference topics

Table 16. Alert views displayed by different monitoring features of DSMPS
Alert View Typedisplayed on the SCOMconsole
DSMPS monitoring feature
Server andRack Workstationmonitoring featureusing OMSA
Server and Rack Workstationmonitoring feature usingiSM-WMI
DRAC monitoring
Dell EMC NetworkInterface Alerts Views
Yes Yes No
Dell EMC Server and RackWorkstation Alerts Views
Yes Yes No
Dell EMC NetworkInterface Alerts
Yes Yes No
Dell EMC Rack WorkstationAlerts
Yes Yes No
PET Traps No No Yes
Remote Access Alerts No No Yes
Diagram views displayed by different monitoring features ofDSMPS
Table 17. Diagram views displayed by different monitoring features of DSMPS
Diagram View Typedisplayed on the SCOMconsole
DSMPS monitoring features
Server andRack Workstationmonitoring featureusing OMSA
Server and Rack Workstationmonitoring feature usingiSM-WMI
DRAC monitoring
Complete Diagram View Yes Yes Yes
Rack Workstation DiagramView
Yes Yes No
Modular Server DiagramView
Yes Yes No
Monolithic Server DiagramView
Yes Yes No
Sled Server Diagram View Yes Yes No
Unit Diagram View Yes Yes No
Remote Access ControllerGroup Diagram View
No No Yes
Complete Diagram View supported by DSMPS
The Dell EMC Complete Diagram View displays a graphical representation of all Dell EMC devices that are monitored in theSCOM console. You can expand and verify the status of individual devices and their components in the diagram.
A Complete Diagram view displayed by the monitoring features in DSMPS has information about the following:
● Dell EMC Modular and Monolithic servers● Dell EMC Sled Group● Dell EMC Rack Workstations Group● Dell EMC Rack Workstations (DSMPS monitoring feature using iSM-WMI)● Remote Access Controllers● Dell EMC unmanaged systems
Reference topics 47

Rack Workstation Diagram View supported by DSMPS
The Dell EMC Rack Workstation Diagram Views provides a graphical representation of all supported Dell EMC RackWorkstations and enables you to expand and verify the status of individual devices and their components in the diagram.Select a Rack Workstation in the diagram to view its details in the Detail View section.
Component data displayed by the Modular and Monolithic Systems Diagram Views
The Dell EMC Modular Systems Diagram View and Dell EMC Monolithic Servers Diagram View displays information about thefollowing components:
Table 18. Component data displayed by the Modular and Monolithic Systems Diagram Views
Component data displayed by theModular and Monolithic DiagramViews
DSMPS monitoring feature
Server and Rack Workstationmonitoring feature using OMSA
Server and Rack Workstation monitoringfeature using iSM-WMI
Physical network interfaces No Yes
Memory No Yes
PSU No Yes
Sensors No Yes
Processors No Yes
Storage Components No Yes
BIOS (Inventory only) No Yes
BIOS Yes No
iDRAC NIC No Yes
Host NIC No Yes
SD Card No Yes
Network Interfaces Group Yes No
License No Yes
Memory Group Yes No
PSU Group Yes No
Sensor Group Yes No
Processor Group Yes No
Storage Component Group Yes No
Host NIC Group Yes No
iDRAC Yes No
iDRAC License Group Yes No
PCIe/SSD Group No No
SD Card Group Yes No
Modular Systems Diagram View supported by DSMPS
The Modular Systems Diagram View offers a graphical representation of all Dell EMC modular systems and enables you toexpand and verify the status of individual devices and their components in the diagram.
48 Reference topics
Monolithic Servers Diagram View supported by DSMPS
The Dell EMC Monolithic Servers Diagram View offers a graphical representation of all Monolithic systems and enables you toexpand and verify the status of individual devices and their components in the diagram.
Sled Servers Diagram View supported by DSMPS
The Dell EMC Sled Servers Diagram View offers a graphical representation of all Sled servers and enables you to expand andverify the status of individual devices and their components in the diagram. Select a Sled server in the diagram to view itsdetails in the Detail View section.
PowerEdge server Unit Diagram View supported by DSMPS
Select a Dell EMC PowerEdge Server from the Dell EMC Modular System View or Dell EMC Monolithic Servers DiagramViews, to view the diagram specific to that particular system. System-specific diagrams illustrate and indicate the status of thecomponents that are supported by the DSMPS monitoring feature.
Remote Access Controllers Group Diagram view supported by DSMPS
The Remote Access Controllers Group diagram view offers a graphical representation of all iDRAC6, iDRAC7, and iDRAC8devices. Select a component in the diagram to view its details in the Detail View section.
Storage controller component hierarchy
To view the status and health of components such as hard drives, connectors, VDs, controllers, sensors, and enclosures, expandthe Storage component in any Dell EMC system instance Diagram View.
Network interfaces component hierarchy
The Dell EMC Network Interfaces group is created only when an Intel or Broadcom network interface card is present andenabled on the Dell EMC PowerEdge server. Network interfaces are grouped under Physical Interfaces and TeamedInterfaces. If you disable a network interface, the network interfaces group will be removed from management in the nextdiscovery cycle. A reference relationship is created between a Teamed network interface and its associated Physical networkinterfaces. You can view the reference relationship only when you enable the Enable Correlation attribute of Dell EMCWindows Server Physical and Teamed Relationship Discovery. For more information, see Enable correlation betweenWindows-based server physical and teamed interfaces in PowerEdge servers monitored by DSMPS using OMSA on page 49.
Enable correlation between Windows-based server physical and teamed interfaces inPowerEdge servers monitored by DSMPS using OMSA
Steps
1. Start the SCOM console.
2. In the left pane, select Authoring.
3. In the left pane, select Management Pack Objects, and then double-click Object Discoveries.
4. In the working pane, search for Dell Windows Server Physical and Teamed Relationship DiscoveryRule.
5. Right-click, and then click Overrides > Override the Object Discovery → For all objects of class: Teamed NetworkInterface instance (Enriched).
6. In the Override Properties dialog box:
a. In the Enabled Correlation row, set the Override Value to True.b. Click OK.
Reference topics 49

Results
The status roll-up of network interfaces on the Diagram view is displayed only up to the Network Interfaces group level. Forexample, if the remaining components of the server are normal and only one or more of the network interfaces are in critical ornoncritical state, the health state of the server is indicated as Normal, but the Network Interfaces group status is indicated asCritical or Warning.
Enable the server rollup health status in PowerEdge servers monitored by DSMPS usingOMSA
About this task
For the status roll-up to be displayed at the server level, enable the Network Interfaces Group to Dell Server Health Roll updependency monitor by doing the following:
Steps
1. Start the SCOM console.
2. In the left pane, select Authoring.
3. In the pane, click Management Pack Objects > Monitors.
4. In the working pane, search for Network Interfaces Group to search for the server you want to enable thefunctionality on.
5. A list of server types on which you can enable the feature is listed. For example, Dell Windows Server.
6. Under Dell Windows Server, expand Entity Health > Availability.
7. Right-click Network Interfaces Group to Dell Server Health Roll up, and click Overrides > Override the Monitor >For all objects of class: Dell Windows Server.
8. In the Override Properties dialog box:
a. In the Enabled row, set the Override Value to True.b. In the Management Pack section, select a management pack from the drop-down list.
9. Click Apply.
Results
The server rollup health status is enabled on PowerEdge servers that are monitored by that specific monitoring feature.
State views displayed by different monitoring features of DSMPS
Table 19. State views displayed by different monitoring features of DSMPS
State View Typedisplayed on the SCOMconsole
DSMPS monitoring feature
Server andRack Workstationmonitoring featureusing OMSA
Server and Rack Workstationmonitoring feature usingiSM-WMI
DRAC monitoring
Servers and RackWorkstation State View
Yes No No
Managed Rack WorkstationState View
Yes No No
FM Servers State View Yes No No
Sled Servers State View Yes No No
Server (iSM) State View No Yes No
Sled Server (iSM) StateView
No Yes No
DRAC State View No No Yes
50 Reference topics

Table 19. State views displayed by different monitoring features of DSMPS
State View Typedisplayed on the SCOMconsole
DSMPS monitoring feature
Server andRack Workstationmonitoring featureusing OMSA
Server and Rack Workstationmonitoring feature usingiSM-WMI
DRAC monitoring
Server and RackWorkstations (Licensed)State View
No No No
Managed Workstation(Licensed) State View
No No No
Sled Servers (Licensed)State View
No No No
Unmanaged Servers(Licensed) State View
No No No
Key features of monitoring PowerEdge servers inDSMPS using iSM-WMI
System configuration lockdown mode in iDRAC9 PowerEdgeservers
The System Configuration Lockdown mode feature is available for servers that are discovered by using iSM-WMI method ofDell EMC Server and Rack Workstation Monitoring feature. This feature is available for iDRAC9—based PowerEdge servers thatlock the system’s configuration, including firmware updates. After the System Configuration Lockdown Mode is enabled:
● You cannot change the system’s configuration. This feature is intended to protect the system from unintentional changes.Using the iDRAC console, you can enable or disable the System Configuration Lockdown mode.
● You cannot configure the trap destination information in the servers. Therefore, alerts are not generated for monitoring. Insuch a case, you are notified with a critical alert indicating that System Configuration Lockdown mode is enabled, and trapdestination information for alerts is not configured.
NOTE: Dell Technologies recommends you to update the “Dell OM : System configuration lockdown alert rule interval”
immediately after the server discovery interval is updated or modified. This ensures that the System Lockdown mode alert is
generated after the completion of server discovery with a certain interval.
You can view information about the System Configuration Lockdown mode in the Detail View pane of the Dell EMC DiagramView. For more information about this feature, see the iDRAC9 Version 3.00.00.00 User’s Guide available on the support site.
iDRAC Group Manager in iDRAC9 PowerEdge servers
The iDRAC Group Manager feature is available for servers that are discovered by using iSM-WMI method of Dell EMC Serverand Rack Workstation Monitoring feature. The iDRAC Group Manager feature is available for iDRAC9—based PowerEdgeservers to offer simplified basic management of iDRAC, and associated servers on the same local network. Group Managerfeature enables one-to-many console experience without requiring a separate application. Using the iDRAC Group Manager, youcan view information about a set of servers by permitting more powerful management than by inspecting servers visually forfaults and other manual methods.
You can view information about the iDRAC Group Manager, iDRAC Group Manager Status, and iDRAC Group Name under theiDRAC object in the Detail View pane of the Diagram View. For more information about this feature, see the iDRAC9 Version3.00.00.00 User's Guide available on the support site.
Reference topics 51

Capacity planning of PowerEdge servers discovered through iDRACand iSM
You can monitor if the server’s utilization has exceeded the configured capacity threshold value using the Dell Server CapacityCheck unit monitor. The unit monitor—Dell Server Capacity Check monitors the average system or CUPS usage for the last oneday of each server against the configured capacity threshold value. By default, this unit monitor is disabled. To enable the DellServer Capacity Check unit monitor, see Enable performance and power monitoring unit monitors on page 14.
The minimum threshold value is 1, and the maximum threshold value is 99. The default threshold value is 60. You can configurethe threshold values within the specified range. That is, 1–99. In case, you provide a threshold value other than the specifiedranges, that threshold is reset to its default value.
A warning event per server is generated when the average system or CUPS usage for the last one day exceeds the configuredthreshold value. The warning event is auto resolved when the average system or CUPS usage for the last one day returns withinthe configured threshold value.
You can view the details of the warning alert in the Alert Details pane under Monitoring.
Port connection information of PowerEdge servers discoveredthrough iDRAC and iSM
NOTE: This feature is supported for iDRAC9-based PowerEdge servers only.
Server port connection information feature provides information about the physical mapping of switch ports to server ports,and iDRAC dedicated port connections. This feature enables you to reduce cabling error debugging by identifying switch portsthat are connected to a server’s network ports, and iDRAC dedicated port. You can view the information about the Server portconnection under iDRAC NIC and NIC objects in the Detail View pane of the Dell EMC Diagram View. Along with the inventoryinformation of each NIC, chassis ID information of the switch and the port ID information is populated. This feature is availablefor Dell EMC PowerEdge servers that are discovered through both the iDRAC and iSM methods of Dell EMC Server and RackWorkstation Monitoring (Licensed) feature.
DSMPS Unit MonitorsA unit monitor monitors the performance counter over two successive cycles to check if it exceeds a threshold value. When thethreshold value is exceeded, the Dell EMC PowerEdge Server changes state and generates an alert. This unit monitor is disabledby default. You can override (enable) the threshold values in the Authoring pane of the SCOM console. Unit monitors areavailable under Dell Windows Server objects for the Dell EMC Server and Rack Workstation Monitoring feature. To enable thethreshold values of unit monitors, see Enable performance and power monitoring unit monitors on page 14. Dell Unit monitorsassess the various conditions that can occur in monitored objects. The result of this assessment determines the health state ofa target.
The Dell unit monitors are:
● Event Monitor—Triggered by the event that the Dell instrumentation logs in the Windows event log indicating the health ofthe corresponding object.
● Periodic Monitor—Triggered by a periodic poll that is configured as Interval Seconds.
Scalable Edition Unit monitors in the monitoring feature of DSMPSfor PowerEdge servers and workstations using OMSA
All the following unit monitors provided by the monitoring feature of DSMPS using OMSA are of Periodic type:
Memory
● Dell EMC Server Memory Status● Dell EMC Server Memory Redundancy Status
OpenManage Software Services
● Dell EMC Server Management (DSM) Connection Service Availability Status● DSM Data Manager Availability Status
52 Reference topics

● DSM Event Manager Availability Status● DSM Shared Service Availability Status● DSM Storage Service Availability Status● Windows Management Instrumentation (WMI) Service Availability Status
Power Supplies
● Dell EMC Server Power Supplies Status
Processors
● Dell EMC Server Processors Status
Sensors
● Dell EMC Server Battery Status● Dell EMC Server Current Status● Dell EMC Server Fans Status● Dell EMC Server Intrusion Sensor Status● Dell EMC Server Temperature Sensor Status● Dell EMC Server Voltage Sensor Status
Storage Controller
● Storage Controller Status
Network Interfaces Group (Basic)
● Global Network Interfaces (Basic) Connection Status
Network Interfaces Group (Enriched)
● Global Enriched Network Interfaces Status● Global Network Interfaces (Basic) Connection Status
iDRAC
● Dell Server iDRAC Network Interface Monitor
Dell OM Performance
● Ambient Temperature Average Threshold AlertMonitor● Amperage Average Threshold AlertMonitor● EnergyConsumption Average Threshold AlertMonitor● PowerConsumption (BTU/hr) Average Threshold● PowerConsumption (Watts) Average Threshold AlertMonitor● Dell OM Server Unsupported Unit Monitor
Detailed Edition Unit monitors in the monitoring feature of DSMPSfor PowerEdge servers and workstations using OMSA
All the following unit monitors provided by the monitoring feature of DSMPS using OMSA are of Periodic type:
Memory Unit
● Detailed Memory Event Monitor● Detailed Memory Unit Monitor
Power Supplies Unit
● Detailed Power Supply
Processor Unit
● Detailed Processor
Storage Controller Connector Unit
● Controller Connector Event Monitor● Controller Connector Unit Monitor
Storage Controller EMM Unit
Reference topics 53

● Enclosure EMM Event Monitor● Enclosure EMM Unit Monitor
Storage Controller Enclosure Unit
● Controller Enclosure Event Monitor● Controller Enclosure Unit Monitor
Storage Controller Physical Disk Unit
● Controller Physical Disk Event Monitor● Controller Physical Disk Unit Monitor● Enclosure Physical Disk Event Monitor● Enclosure Physical Disk Unit Monitor
Storage Controller Power Supply Unit
● Enclosure Power Supply Event Monitor● Enclosure Power Supply Unit Monitor
Storage Controller Sensors
● Controller Sensor Event Unit Monitor● Controller Sensor Unit Monitor
Storage Controller Virtual Disk Group
Storage Controller Virtual Disk Unit
● Controller Virtual Disk Event Monitor● Controller Virtual Disk Unit Monitor
Storage Enclosure Physical Disk Group
Storage Enclosure Sensors
● Enclosure Fan Event Unit Monitor● Enclosure Fan Unit Monitor● Enclosure Temperature Event Monitor● Enclosure Temperature Unit Monitor
Physical Network Interface Unit (Basic)
● Connection Status
Physical Network Interface Unit (Enriched)
● Administrative Status● Connection Status● Link Status● Operational Status
Teamed Network Interface Unit (Basic)
● Teamed Network Interface (Basic) Availability Status
Teamed Network Interface Unit (Enriched)
● Teamed Network Interface Unit (Enriched) Administrative Status● Teamed Network Interface Unit (Enriched) Connection Status● Teamed Network Interface Unit (Enriched) Link Status● Teamed Network Interface Unit (Enriched) Operational Status● Teamed Network Interface Unit (Enriched) Redundancy Status
Fan Sensor
● Fan Sensor Unit Monitor
Current Sensor
● Current Sensor Unit Monitor
Voltage Sensor
● Voltage Sensor Unit Monitor
54 Reference topics

Battery Sensor
● Battery Sensor Unit Monitor
Chassis Intrusion Sensor
● Chassis Intrusion Sensor Unit Monitor
Unit monitors in the monitoring feature of DSMPS for DRACs
All the following unit monitors provided by DSMPS for DRAC monitoring are of Periodic type:
● iDRAC6 Modular○ Dell Remote Access Status
● iDRAC6 Monolithic○ Dell Remote Access Status
● iDRAC7 ModularNOTE: For iDRAC7 modular and monolithic servers, the Dell RAC periodic-based and Dell RAC triggered-based unit
monitors are disabled.
○ Dell Remote Access Status○ Controller Global Status○ Controller Global Storage Status
● iDRAC7 Monolithic○ Dell Remote Access Status○ Controller Global Status○ Controller Global Storage Status
● iDRAC8 ModularNOTE: For iDRAC8 modular and monolithic servers, the Dell RAC periodic-based and Dell RAC triggered-based unit
monitors are disabled.
○ Dell Remote Access Status○ Controller Global Status○ Controller Global Storage Status
● iDRAC8 Monolithic○ Dell Remote Access Status○ Controller Global Status○ Controller Global Storage Status
Event rules used by different monitoring features ofDSMPSThe data center administrators using the SCOM console may want to know about the rules and monitors running on asystem. The event rules that are used by different monitoring features of DSMPS provide information the relevant event rulesinformation to the administrators.
Event rules processed by the monitoring feature of DSMPS forPowerEdge servers and workstations using OMSA
DSMPS processes rules from OMSA and OMSA Storage Management events.
Server Administrator
All informational, warning, and critical events of OMSA have corresponding event processing rule. Each of these rules isprocessed based on the following criteria:
● Source Name = "Server Administrator"● Event ID = Actual event ID of the Server Administrator instrumentation event● Data Provider = Windows System Event Log
Reference topics 55

Storage Management
All informational, warning, and critical events for the Server Administrator Storage Management Service have a correspondingevent processing rule. Each of these rules is processed based on the following criteria:
● Source Name = "Server Administrator"● Event ID = Actual event ID of the Server Administrator Storage Management Service event● Data Provider = Windows system event log
Event rules processed by the monitoring feature of DSMPS forPowerEdge servers and workstations using iSM-WMI
The following section lists the rules specific to the Dell EMC Server and Rack Workstation Monitoring feature using iSM-WMI.
● Dell Systems Event Processing Rules—DSMPS processes rules from Dell EMC PowerEdge Servers.● Dell EMC PowerEdge Servers through iSM-WMI—All informational, warning, and critical events for Dell EMC PowerEdge
Servers discovered using this feature, have a corresponding event rule. Each of these rules is processed based on thefollowing criteria:○ Source Name = “Lifecycle controller Log”○ Event no= Actual event ID of the event○ Data Provider = Windows System Event Log
Event rules processed by the monitoring feature of DSMPS for DRACs
All informational, warning, and critical SNMP traps for the DRAC devices have a corresponding SNMP trap rule. Each of theserules are processed based on the following criteria:
● Source Name = “DRAC/CMC name or IP”● OID = Actual trap ID of the DRAC /CMC SNMP trap event● Data Provider = SNMP trap
NOTE: Informational alerts are turned off by default. To receive these alerts, import informational alerts management pack.
56 Reference topics
Troubleshooting
Topics:
• Data is not displayed on the Feature Management Dashboard• A task run on the Feature Management Dashboard fails• Feature Management alerts• The Management Server (MS) is not functioning, and therefore, tasks associated with it cannot be completed (Health
Service of the Feature Management Host Server is nonfunctional)
Data is not displayed on the Feature ManagementDashboard
About this task
In a distributed setup, the management server, where the Dell EMC Server Management Pack is installed first, is selected tohost all feature management activities such as discoveries, alerts, and tasks. The management server on which the ServerManagement Pack is installed first populates the Feature Management Dashboard. However, if you have manually imported theFeature Monitoring management pack without running the installer on the management server, the Feature Management Packhost is not selected. Therefore, data is not displayed on the Feature Management Dashboard.
To populate the Feature Management Dashboard:
Steps
1. In the SCOM console, click Authoring.
2. In the Authoring section, expand Management Pack Objects.
3. Click Object Discoveries.
4. In the Look for box, search for Dell Feature Management Host Discovery.
5. Right-click Dell Feature Management Host Discovery, and then select Overrides > Override the Object Discovery >For all objects of class: Dell Feature Management Host Discovery.
6. To run the feature management activities, select FmpHostFqdn.
7. Set the override value to the FQDN of the management server.
A task run on the Feature Management Dashboardfails
About this task
Performing upgrade task on the Feature Management Dashboard can result in data loss. For example, if there are anydependencies or associations on the monitoring feature being modified then upgrade task fails by displaying a message.
CAUTION: Overriding task parameters may result in management pack or operational data loss.
To resolve this issue, do the following:
Steps
1. Start the SCOM console and click Monitoring.
2. In the Monitoring pane, browse to Dell EMC > Feature Management Dashboard.The Feature Management Dashboard displays a list of management packs present in SCOM and the management packversion to which you can upgrade.
12
Troubleshooting 57

3. Select the monitoring feature.
4. Under Tasks, expand Dell Monitoring Feature Tasks.
5. Click the upgrade monitoring task.
6. On the Run Task — Upgrade Monitoring Feature screen, click Override.The Override Task parameters are displayed.
7. From the drop-down menu in the New Value column, set the AutoResolve Warnings/Errors property True.
8. Click Override.
9. To run the task, click Run.
Feature Management alertsTable 20. Feature Management alerts
Alert Text Alert State Cause Resolution
Dell FMP: Dell DeviceHelper Utility is either notpresent or incompatible withthe Dell EMC Server andRack Monitoring (Licensed)Management Pack.
Critical ● The required Dell DeviceHelper Utility version wasnot found, or the DellDevice Helper Utility iscorrupted.
● A version later thanthe required Dell DeviceHelper Utility version wasdetected.
● A version earlier thanthe required Dell DeviceHelper Utility version wasdetected.
Run the Dell EMC ServerManagement Pack Suiteversion 7.1 installer on themanagement server. Use theRepair option in the installer.See Repair installation issuesof DSMPS on page 10.
The Management Server (MS) is not functioning,and therefore, tasks associated with it cannotbe completed (Health Service of the FeatureManagement Host Server is nonfunctional)
About this task
In a distributed setup, the management server, where the Dell EMC Server Management Pack is installed first, is selected tohost all feature management activities such as discoveries, alerts and tasks. If the selected management server has stoppedfunctioning, the executed Feature Management task fails, and Dell EMC Feature Management Dashboard is not populated.If such a selected management server is corrupt or health service is not obtained, decommission the management server toremove stale objects. For more information, see https://docs.microsoft.com/en-us/previous-versions/system-center/system-center-2012-R2/hh456439(v=sc.12)?redirectedfrom=MSDN.
To populate the Dell EMC Feature Management Dashboard:
Steps
1. In the SCOM console, click Authoring.
2. In the Authoring section, expand Management Pack Objects.
3. Click Object Discoveries.
4. In the Look for box, search for Dell Feature Management Host Discovery.
5. Right-click Dell Feature Management Host Discovery, and then select Overrides > Override the Object Discovery >For all objects of class: Dell Feature Management Host Discovery.
6. Select FmpHostFqdn, and then set the override value to FQDN of the management server where the feature managementactivities have to run.
58 Troubleshooting

Additional resources
Table 21. Additional resources
Document Description Availability
Dell EMC OpenManageIntegration with MicrosoftSystem Center for SystemCenter Operations ManagerUser's Guide
Provides information about deploying,configuring, using, and troubleshooting theOMIMSSC appliance.
1. Go to Dell.com/esmmanuals.2. Select Server Management Pack Versions
for Microsoft System Center OperationsManager, and then select the requiredapplication version.
3. Select the DOCUMENTATION tab toaccess these documents.
Dell EMC OpenManageIntegration with MicrosoftSystem Center—OperationsManager Release Notes
Provides information about new features,known issues, and workarounds in OMIMSSCand DSMPS.
Scalability withOpenManage Integrationwith Microsoft SystemCenter for SystemCenter Operations Managertechnical white paper
Provides information to scale up yourmonitoring capabilities by adding proxymanagement servers in to your OMIMSSCenvironment.
13
Additional resources 59

Accessing support content from the DellEMC support site
Access supporting content related to an array of systems management tools using direct links, going to the Dell EMC supportsite, or using a search engine.● Direct links:
○ For Dell EMC Enterprise Systems Management and Dell EMC Remote Enterprise Systems Management—https://www.dell.com/esmmanuals
○ For Dell EMC Virtualization Solutions—https://www.dell.com/SoftwareManuals○ For Dell EMC OpenManage—https://www.dell.com/openmanagemanuals○ For iDRAC—https://www.dell.com/idracmanuals○ For Dell EMC OpenManage Connections Enterprise Systems Management—https://www.dell.com/
OMConnectionsEnterpriseSystemsManagement○ For Dell EMC Serviceability Tools—https://www.dell.com/serviceabilitytools
● Dell EMC support site:1. Go to https://www.dell.com/support.
2. Click Browse all products.
3. From the All products page, click Software, and then click the required link.
4. Click the required product and then click the required version.
Using search engines, type the name and version of the document in the search box.
14
60 Accessing support content from the Dell EMC support site

Contacting Dell TechnologiesAbout this task
Dell Technologies provides several online and telephone-based support and service options. Availability varies by country orregion and product, and some services may not be available in your area.
NOTE: If you do not have an active Internet connection, you can find contact information on your purchase invoice, packing
slip, bill, or Dell Technologies product catalog.
To contact Dell Technologies for sales, technical support, or customer service issues:
Steps
1. Go to Dell.com/support.
2. At the bottom right of the page, select preferred country or region from the list.
3. Click Contact Us and select the appropriate support link.
15
Contacting Dell Technologies 61

GlossaryTable 22. Terms used in this guide
Term Description
AMSRP All Management Server Resource Pool
CMC/ OME-M Dell EMC Chassis Management Controller/ OpenManage Enterprise—Modular
DSMPS Dell EMC Server Management Pack Suite for Microsoft System Center—OperationsManager
DRAC/ iDRAC Dell Remote Access Controller/ integrated Dell Remote Access Controller of Dell EMCPowerEdge server, Dell branded OEM servers, and Dell OEM—ready servers, unlessotherwise specified.
Dell EMC Servers and RackWorkstation monitoring
This is a license-free feature that is offered by OMIMSSC to discover and monitorPowerEdge servers, PowerVault Monolithic and Modular systems, Dell EMC branded orDell EMC OEM Ready servers, and supported Dell Precision Racks running the supportedWindows operating system by using the supported OpenManage Server Administrator(OMSA) in a data center.
FMD Dell EMC Feature Management Dashboard
iSM iDRAC Service Module is a lightweight software that runs on the server andcomplements iDRAC with monitoring information from the operating system. For moreinformation about iSM and the supported platform, see the iDRAC Service ModuleInstallation Guide at Dell.com/support.
MS Management Server
MP Management Pack
OMIMSSC Dell EMC OpenManage Integration for Microsoft System Center—Operations Manager
PowerEdge servers This is a monitoring feature offered by DSMPS to discover and monitor PowerEdgeservers, PowerVault Monolithic and Modular systems, Dell EMC branded or Dell EMCOEM Ready servers, and supported Dell Precision Racks running the supported Windowsoperating system by using supported OpenManage Server Administrator (OMSA) in adata center.
SCOM Microsoft System Center for Operations Manager.
VM Virtual Machine
A
62 Glossary

Additional topics
Topics:
• Identify device and device power status by using identification LEDs• Migrate from Dell Server Management Pack Suite Version 6.0 for Microsoft SCOM• Configure SCOM to monitor traps and trap-based unit monitors• Create Run-As-Account for SNMP monitoring• Associate multiple Run-As accounts• Install Web Services Management (WS-Man) and SMASH device template• Associate Run-As Account task—Dell EMC Server and Rack Workstation Monitoring feature
Identify device and device power status by usingidentification LEDs
About this task
Advanced power control and LED identification tasks use the default BMC credentials and installation path (C:\ProgramFiles\Dell\SysMgt\bmc). If the systems deviate from the default BMC credentials and installation path, install BMU 2.0 orlater the management server and create new console tasks.
NOTE: For the following steps, create a task and set the password in plain text. If BMC is not installed on the management
server, the SCOM console may indicate an error with the entire command in a dialog box, and then reveal the password. If
you export the created override management pack containing this task to a drive:
● Open the exported management pack in a common text editor.
● View the password in plain text in the Authoring section of the SCOM console.
NOTE: Create a task only if necessary and consider the security aspects before you proceed.
To create a task for managing the status of LED to identify the status of a device power:
Steps
1. On the SCOM console, in the left pane, click Authoring.
2. Under Management Pack Objects, right-click Tasks, and then select Create a New Task.
3. In the Select a Task Type dialog box, do the following:
a. In the Select the type of task to create section, select Command line.b. Select a destination management pack.c. Click Next.d. Enter a task name and its description.
To select a task target, click Select, and then select from the Select Items to Target dialog box. In this case, selectDell Windows Server—For Server and Rack Workstation Monitoring feature.
e. Click Next.The Command Line screen is displayed.
f. In the Application box, enter the ipmitool.exe application path (the path where BMU was installed on the managementserver).
For example, C:\Program Files\Dell\SysMgt\bmc\ipmitool.exe. For the two LED identification tasks, theapplication path is C:\Program Files\Dell\SysMgt\bmc\ipmish.exe (default BMU path may differ based onthe operating system language).
4. For power control tasks, in the Parameters field, enter the command-line parameters in the following format:● Enter -I lanplus -H, and then choose the Remote Access IP with IPMI capability from the drop-down menu.
B
Additional topics 63

● Enter -U <username> -P <password> -k <kgkey> <IPMI Task String>● Replace <IPMI Task String> with one of the following options:
○ power status (for Check Power Status task)
○ power on (for Power On task)
○ power soft (for Power Off Gracefully task)
○ power off (for Force Power Off task)
○ power cycle (for Power Cycle task)
○ power reset (for Power Reset task)
○ identify on (for LED Identification On task)
○ identify off (for LED Identification Off task)
For example: -I lanplus -H Target/Property[Type="Dell.WindowsServer.Server"]/RemoteAccessIP$ -U root -P<password> -k <kgkey> power status
5. For LED on or off tasks, enter the CLI parameters in the following format:● Enter -ip and select Remote Access IP with IPMI capability from the drop-down menu.
● Enter -u <username> -p <password> -k <kgkey> <IPMI task string>.
6. Click Create.
Perform these actions for each new BMC task.
Migrate from Dell Server Management Pack SuiteVersion 6.0 for Microsoft SCOMUntil Dell Server Management Pack Suite Version 6.0 for SCOM, Dell Connections License Manager (DCLM) was required tomanage licenses. For Dell Server Management Pack Suite Version 6.1 and later, you do not require DCLM. There is no longer alicense-count enforcement post DCLM being removed. You can continue to manage the PowerEdge servers using Server andRack Workstation Monitoring (Licensed) feature for SCOM even after reaching or exceeding the limit of the number of licensespurchased from Dell Technologies. The Checking License Usage section presents the steps to help you determine the number ofnodes being managed to ensure that you have the appropriate number of license entitlements from Dell Inc. Purchase additionallicenses if the number of nodes you are managing exceeds the number of licenses you have purchased.
Licenses that you have purchased for Dell Server Management Pack Suite Version 6.0 for SCOM are still applicable to DellServer Management Pack Suite Version 6.1 and later for SCOM. Therefore, after a product upgrade, the earlier license is stillvalid, and you can still manage servers based on the permissible count mentioned in the previously purchased license.
Configure SCOM to monitor traps and trap-based unitmonitors
About this task
To monitor traps and trap-based unit monitors in SCOM, do the following:
Steps
1. Start the SCOM console and select Administration.
2. In the Administration pane, browse to Run As Configuration > Profiles.
3. From the list of available profiles, right-click SNMP Monitoring Account and click Properties.The Introduction screen is displayed.
4. Click Next.The Specify the Run As profile's general properties screen is displayed.
5. Click Next.The Run As Accounts screen is displayed.
6. Click Add.
7. To discover devices, from the Run-As Account drop-down menu, select the community string.
64 Additional topics

NOTE: If a Run-As-Account community string is not available then create one. See Create Run-As-Account for SNMP
monitoring.
NOTE: If you are using multiple Run-As accounts to discover devices, associate each device with its associated Run-As
account. For more information, see Associate Multiple Run As Accounts.
8. Click OK.
9. After completing tasks prompted by the wizard, click Close.
Create Run-As-Account for SNMP monitoring
Steps
1. Start the SCOM console and select Administration.
2. In the Administration pane, click Run As Configuration > Accounts.
3. Right-click Accounts and click Create Run As Account.The Introduction screen is displayed.
NOTE: For more information about Run As Account for Network Monitoring, see the Microsoft documentation.
4. Click Next.The General Properties screen is displayed.
5. Select a community string from the Run As Account type drop-down menu.
6. In the Display name box, enter the community string name and click Next.
7. In the Community string box, enter the community string, and then click Next.The Distribution Security screen is displayed.
8. Select the Less secure - I want the credentials to be distributed automatically to all managed computers option,and then click Create.
9. After completing tasks prompted by the wizard, click Close.
Associate multiple Run-As accounts
Steps
1. Complete steps 1–6 in Configuring Operations Manager to monitor Traps and Trap-Based Unit Monitors.
2. On the Add a Run As Account screen, select the A selected class, group, or object option.
3. Click Select > Class.The Class Search screen is displayed.
NOTE: You can also associate the community string Run As Account with Object and Group. For more information, see
the Microsoft documentation for SCOM at www.docs.microsoft.com.
4. In the Filter by (optional) box, enter the class name. Based on the type of device, enter Dell EMC Server, DellCMC/OME-M, or Dell EMC DRAC/MC.
5. Click Search.
6. Under Available items, select the class you want to add.
7. Click OK.
8. On the Add Run As account screen, click OK.
9. For each class type you want to manage, repeat steps 2−8.
10. Click Save.
11. After completing tasks prompted by the wizard, click Close.
Additional topics 65

Install Web Services Management (WS-Man) andSMASH device template
Steps
1. From www.microsoft.com/en-in/download/confirmation.aspx?id=29266, download the following SMASH Library MPB file toa temporary location: WS-ManagementAndSMASHDeviceDiscoveryTemplate.msi.
2. To copy the SMASH Library MPB file to the user- or default location, run the MSI file.
3. Start the SCOM console.
4. In the left pane, select Administration.
5. Select Management Packs, and then select Import Management Packs in the working pane.
6. Select Add > Add from disk.
7. Enter the location details or browse the location where you downloaded the Microsoft SMASH Library MPB file.
8. Select the MPB file and click Open.The Import Management Packs screen is displayed with the template in the Import list.
9. Click Install.
Associate Run-As Account task—Dell EMC Server andRack Workstation Monitoring featureAssociate Run-As Account task associates the Run-As Account used for SMASH discovery with all the Dell Server objects thatare required for health monitoring. This task is available as an option for performing object-level association.
WARNING: Perform the Associate Run-As Account task only if necessary. This task affects the configuration
of all Dell Server objects. Dell Server Run-As Account Association unit monitor automatically performs the
object-level association.
66 Additional topics