Delivery Hero Company Presentation€¦ · 216 34 39 66 67 74 150 150 150 107 173 67 69 35 62 255...
28
1 Delivery Hero Company Presentation The #1 GLOBAL LEADER in Online Food Ordering and Delivery 9 May 2017
-
Upload
truongliem -
Category
Documents
-
view
216 -
download
0
Transcript of Delivery Hero Company Presentation€¦ · 216 34 39 66 67 74 150 150 150 107 173 67 69 35 62 255...

216
34
39
66
67
74
150
150
150
107
173
67
69
35
62
255
199
19
1
Delivery Hero Company Presentation
The #1 GLOBAL LEADER in Online Food Ordering and Delivery
9 May 2017

216
34
39
66
67
74
150
150
150
107
173
67
69
35
62
255
199
19
2
ALL FINANCIAL FIGURES INCLUDED IN THE FOLLOWING PRESENTATION ARE BASED ON IFRS, UNLESS NOTED OTHERWISE. THE 2014 AND 2015 DELIVERY HERO FINANCIAL INFORMATION
AND THE 2015 AND 2016 FOODPANDA FINANCIAL INFORMATION IS AUDITED (UNLESS OTHERWISE INDICATED). THE 2016 DELIVERY HERO FINANCIAL INFORMATION (INCLUDING 2015
COMPARATIVE INFORMATION) IS SUBJECT TO THE AUDIT OPINION FOR THE 2016 DELIVERY HERO FINANCIAL INFORMATION BEING DELIVERED.
For the purposes of this notice, “presentation” means this document, its contents or any part of it. This presentation does not, and is not intended to, constitute or form part of, and should not be
construed as, an offer to sell, or a solicitation of an offer to purchase, subscribe for or otherwise acquire, any securities of the Company, nor shall it or any part of it form the basis of or be relied upon in
connection with or act as any inducement to enter into any contract or commitment or investment decision whatsoever.
This presentation is neither an advertisement nor a prospectus and should not be relied upon in making any investment decision to purchase, subscribe for or otherwise acquire any securities.The
information and opinions contained in this presentation are provided as at the date of this presentation, are subject to change without notice and do not purport to contain all information that may be
required to evaluate the Company. No reliance may or should be placed for any purpose whatsoever on the information contained in this presentation, or any other information discussed verbally, or on
its completeness, accuracy or fairness.
The information in this presentation is of preliminary and abbreviated nature and may be subject to updating, revision and amendment, and such information may change materially. Neither the
Company nor any of its directors, officers, employees, agents or affiliates undertakes or is under any duty to update this presentation or to correct any inaccuracies in any such information which may
become apparent or to provide any additional information.
This presentation is not an offer of securities for sale in the United States. The securities of the Company are not and will not be registered pursuant to the provisions of the US Securities Act of 1933, as
amended (the “Securities Act”) or with the securities regulators of the individual states of the United States. The securities may not be offered, sold or delivered, directly or indirectly, in or into the United
States except pursuant to an exemption from the registration and reporting requirements of the United States securities laws and in compliance with all other applicable United States legal regulations.
The Company does not intend to register its securities under the Securities Act or to conduct a public offering of securities in the United States.
Sales in the United Kingdom are also subject to restrictions. The securities are only available in the United Kingdom to, and any invitation, offer or agreement to subscribe, purchase or otherwise acquire
such securities in the United Kingdom will be engaged in only with, such relevant persons to whom it may lawfully be communicated (“Relevant Persons”). Any person in the United Kingdom who is not
a Relevant Person should not act or rely on this presentation or any of its contents.
Certain information (including industry, market and competitive position data) in this presentation is based on the Company’s own internal research and management estimates. In addition, certain data
points in this presentation are selective and may not necessarily be representative for the Delivery Hero Group. Such research, estimates and data points have been made in good faith and represent the
current beliefs of members of management. The Company and those management members believe that such research, estimates and data points are founded on reasonable grounds. However, by their
nature, research and estimates as well as the data points may not be correct or complete, and their underlying methodology and assumptions, have not been verified by any independent source for
accuracy or completeness. Accordingly, no representation or warranty, express or implied, is given that such research, estimates or data points are correct or complete.
The presentation and discussion contain forward looking statements, other estimates, opinions and projections with respect to anticipated future performance of the Company (“Forward-looking
Statements”). These Forward-looking Statements can be identified by the use of forward-looking terminology, including the terms “believes,” “estimates,” “anticipates,” “expects,” “intends,”, “aims”,
“plans”, “predicts”, “may,” “will” or “should” or, in each case, their negative, or other variations or comparable terminology. These Forward-looking Statements include all matters that are not historical
facts. They appear in a number of places throughout this presentation and include statements regarding the Company’s intentions, beliefs or current expectations concerning, among other things, the
Company’s prospects, growth, strategies, the industry in which it operates and potential or ongoing acquisitions. By their nature, Forward-looking Statements involve significant risks and uncertainties
because they relate to events and depend on circumstances that may or may not occur in the future. Forward-looking Statements should not be read as guarantees of future performance or results and
will not necessarily be accurate indications of whether or not such results will be achieved. Similarly, past performance should not be taken as an indication of future results, and no representation or
warranty, express or implied, is made regarding future performance. The development of the Company’s prospects, growth, strategies, the industry in which it operates, and the effect of acquisitions on
the Company may differ materially from those made in or suggested by the Forward-looking Statements contained in this presentation or past performance. In addition, even if the development of the
Company’s prospects, growth, strategies and the industry in which it operates are consistent with the Forward-looking Statements contained in this presentation or past performance, those
developments may not be indicative of the Company’s results, liquidity or financial position or of results or developments in subsequent periods not covered by this presentation. Any Forward-looking
Statements only speak as at the date of this presentation is provided to the recipient and it is up to the recipient to make its own assessment of the validity of any Forward-looking Statements and
assumptions. No liability whatsoever is accepted by the Company in respect of the achievement of such Forward-looking Statements and assumptions.
Important Notice

216
34
39
66
67
74
150
150
150
107
173
67
69
35
62
255
199
19
3
Highlights: Introduction
Our Clear Vision
CREATE AN AMAZING TAKEAWAY EXPERIENCE

216
34
39
66
67
74
150
150
150
107
173
67
69
35
62
255
199
19
4
Highlights: Introduction
We Are an Online Food Ordering and Delivery Marketplace
USER RESTAURANT
1
2
Customer Order
Received (TBU)
3
Search
Order Receive
Deliver
4
Eat
Cook
6
RESTAURANT
DRIVER
Customer Order
Received (TBU)
5

216
34
39
66
67
74
150
150
150
107
173
67
69
35
62
255
199
19
5
Highlights: Introduction
Powerful Network Effects Drive Customer Loyalty
and Platform Stickiness
More Data Better Takeaway
Experience More Orders
Lower Prices & Faster Delivery
Higher Delivery Efficiency
Higher Value for Restaurants
Saved Info and Personalised Experience
More Restaurants to Join and
Higher Leverage to Give Service

216
34
39
66
67
74
150
150
150
107
173
67
69
35
62
255
199
19
6
Highlights: Introduction
1 Large Global Market Opportunity
2 Global Leader
3 Local Know How + Global Scale and Execution
4 At the Forefront of Innovation and Technology
5 Proven Business Model
6 Attractive Scale, Growth and Profitability Potential
7 Multiple Drivers for Long-term Growth
DELIVERY HERO HIGHLIGHTS

216
34
39
66
67
74
150
150
150
107
173
67
69
35
62
255
199
19
7
1 Large Global
Market
Opportunity

216
34
39
66
67
74
150
150
150
107
173
67
69
35
62
255
199
19
8
Highlights: Large Global Market Opportunity
Unlocking the Large Food Market
Online & Mobile
Engagement
On-demand &
Last-mile Logistics
Life-style,
Urbanization &
Convenience
SECULAR MARKET TAILWINDS
Delivery Hero
GMV
€2.6bn1
Total Food Market
€7.5tn4
Takeaway Market
in Delivery Hero’s
Countries
€72bn2,5
Foodservice Market
in Delivery Hero’s
Countries
€563bn3,5
Source: Company information; Euromonitor
Notes:
1. As of 2016
2. Management estimates based on Delivery Hero market model; data as of 2016
3. Source: Euromonitor International; Consumer Foodservice 2017ed; Foodservice data at foodservice value RSP, 2016 fixed exchange rate;
data as of 2016
4. Source: Euromonitor International; Economies and Consumers; Global Food Market represents Consumer Expenditure on Food and Catering, value at fixed 2016 exchange rates; data as of 2016
5. Excluding countries where Delivery Hero operates own delivery business only (Australia, Canada, France, Italy, Netherlands, Norway), countries without local legal entities (Panama, Paraguay) and countries with minority participation that are not fully consolidated (e.g., Poland)

216
34
39
66
67
74
150
150
150
107
173
67
69
35
62
255
199
19
9
2 Global Leader

216
34
39
66
67
74
150
150
150
107
173
67
69
35
62
255
199
19
10
Highlights: Global Leader
Total Addressable Market €72bn1 €28bn N/A €13bn
Expected GDP Growth6 3.1% 1.7% 1.9% 1.5%
2016 Population6 2.7bn 0.5bn 0.3bn 0.2bn
# of Countries 421 12 1 9
#1 Positions 351 12 1 5
# of Orders c. 197m2 c. 136m c. 101m c. 49m
# of Restaurants >150k3 c. 69k c. 50k c. 29k
Revenue Growth4 +71%5 +52% +36% +45%
We Are the Global Leader in Online Food Delivery with
Larger Reach, More Scale and Faster Growth
Source: Company information; management estimates; Euromonitor; public filings
Notes:
1. Management estimates as of 2016 based on Delivery Hero market model: Based on all #1 positions, including positions where Delivery Hero is market leader in markets with strong contender; excluding countries where Delivery Hero operates own delivery business
only (Australia, Canada, France, Italy, Netherlands, Norway), countries without local legal entities (Panama, Paraguay) and countries with minority participation that are not fully consolidated (e.g., Poland)
2. 2016 data including foodpanda and excluding UK and China
3. Refers to number of active restaurants (i.e. restaurants that received at least 1 successful order in 2016) per leading brand as of December 2016, with an adjustment for Yogiyo in South Korea
4. FY 2016 disclosure
5. Based on aggregated Delivery Hero Group, i.e. Delivery Hero + foodpanda revenue, excluding foodpanda other revenue / reconciling items of €1.4m in 2015 and €0.3m in 2016 respectively; LFL adjustments including entities acquired in 2015 (Yemek Sepeti, Talabat
and E-Food Group) for the period between 1 Jan 2015 and the time of their inclusion in financial statements of Delivery Hero; please refer to appendix for detailed information
6. Source: Euromonitor International; Economies and Consumers; 2016-2020 GDP CAGR at constant currency for GDP growth
€
Lead
ing
Pla
yer
Larg
est
Mark
ets

216
34
39
66
67
74
150
150
150
107
173
67
69
35
62
255
199
19
11
Highlights: Global Leader
Global Leader with #1 Positions in 35 Countries1
7 Countries
Brazil
#1
MA
RK
ET
LEA
DER
CO
MP
ET
ITIV
E M
AR
KET
PLA
YER
India
Bulgaria
South Korea
Switzerland
Malaysia
Argentina
Ecuador
Chile
Colombia
Uruguay
Peru
Austria
Georgia
c. 80% OF GMV
FROM #1
COUNTRIES
Source: Company information
Note:
1. Management estimates as of 2016 based on Delivery Hero
market model: Based on all #1 positions, including
positions where Delivery Hero is market leader in markets
with strong contender; excluding countries where Delivery
Hero operates own delivery business only (Australia,
Canada, France, Italy, Netherlands, Norway), countries
without local legal entities (Panama, Paraguay) and
countries with minority participation that are not fully
consolidated (e.g., Poland)
Bosnia &
Herzegovina
Germany
Romania
Serbia
Sweden
Hungary
Croatia Czech Rep.
Finland
Greece
Montenegro
Bahrain
Jordan
Kuwait
Saudi Arabia
Turkey
Qatar Egypt
UAE
Oman
Pakistan
Bangladesh
Hong Kong
Philippines
Brunei
Singapore
Taiwan
Thailand

216
34
39
66
67
74
150
150
150
107
173
67
69
35
62
255
199
19
12
3 Local Know How +
Global Scale and
Execution

216
34
39
66
67
74
150
150
150
107
173
67
69
35
62
255
199
19
13
Highlights: Local Know How + Global Scale and Execution
Local Entrepreneurial Leadership Team Supported by
Highly Experienced Central Management
Constantinos Kyrkinis (Co-founder & Co-CEO)
Paminos Kyrkinis (Co-founder & Co-CEO)
Rodrigo Sampaio (MD & Co-CEO)
Eduardo Goes (MD & Co-CEO)
Abdulhamid Al-Omar (CEO & early executive)
Ariel Burschtin (Co-founder & CEO)
Alvaro Garcia (Co-founder, CMO & CPO)
Ruben Sosenke (CTO)
Nevzat Aydın (Co-founder & CEO)
Knowledge
Exchange
Marketing
Support
Platform
(Components)
Operational
Excellence
Strategy and
Culture
Jose Guillermo Calderon Ardila (Co-founder & CEO)
Pablo González (Co-founder and CSO)

216
34
39
66
67
74
150
150
150
107
173
67
69
35
62
255
199
19
14
Highlights: Local Know How + Global Scale and Execution
Centrally Managed Operations and Logistics Know How
9 Proprietary Technology
1 2 3 4 5 6 7 8
Restaurant
Onboarding
Content
Production
Sales &
Marketing
Delivery
(incl. Last
Mile)
Payment &
Processing
Customer
Care
Customer
Retention Product
216
34
39
66
67
74
150
150
150
107
173
67
69
35
62
255
199
19
15
Highlights: Local Know How + Global Scale and Execution
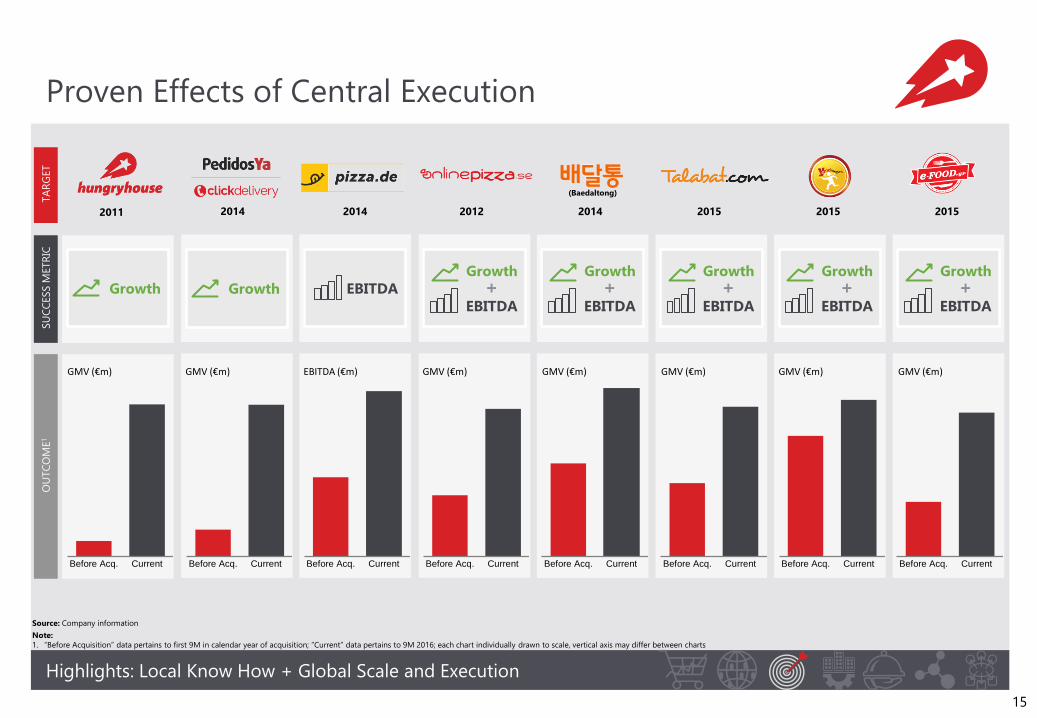
Proven Effects of Central Execution
TA
RG
ET
SU
CC
ESS M
ETR
IC
Growth Growth
Growth
EBITDA
+ Growth
EBITDA
+ Growth
EBITDA
+ Growth
EBITDA
+ Growth
EBITDA
+ EBITDA
2012 2014 2015 2015 2014 2011 2015 2014
(Baedaltong)
Source: Company information
Note:
1. “Before Acquisition” data pertains to first 9M in calendar year of acquisition; “Current” data pertains to 9M 2016; each chart individually drawn to scale, vertical axis may differ between charts
Before Acq. Current
GMV (€m) GMV (€m) GMV (€m) GMV (€m) GMV (€m)
Before Acq. Current Before Acq. Current Before Acq. CurrentBefore Acq. Current
GMV (€m)
Before Acq. Current
EBITDA (€m)
Before Acq. Current
GMV (€m)
Before Acq. Current
OU
TC
OM
E1

216
34
39
66
67
74
150
150
150
107
173
67
69
35
62
255
199
19
16
4 At the Forefront of
Innovation and
Technology

216
34
39
66
67
74
150
150
150
107
173
67
69
35
62
255
199
19
17
Highlights: At the Forefront of Innovation and Technology
Creating an Amazing Takeaway Experience Through
Innovation and Technology
I. Discovery and
Placing Order
II. Restaurant
Integration
III. Delivery
Experience
IV. Manage
Customer
Relations (CRM)

216
34
39
66
67
74
150
150
150
107
173
67
69
35
62
255
199
19
18
5 Proven Business
Model

216
34
39
66
67
74
150
150
150
107
173
67
69
35
62
255
199
19
19
Highlights: Proven Business Model
0 %
5 %
10 %
15 %
20 %
Q1 2015 Q1 2016 Q1 2017
REGIONAL TAKE-RATES1,2
Steadily Growing Take-rates
Europe
Asia
Americas
MENA
Source: Company information
Notes:
1. LFL adjustments including entities acquired in 2015 (Yemek Sepeti, Talabat and E-Food Group) for the period between 1 Jan 2015 and the time of their inclusion in financial statements of the Company; please refer to appendix for more detailed information
2. GMV numbers excl. China operations which have been sold in 2016; China GMV: 2015: €38m, 2016: €5m
%

216
34
39
66
67
74
150
150
150
107
173
67
69
35
62
255
199
19
20
Highlights: Proven Business Model
Own Delivery Has Same Profit per Order as Marketplace
EVOLUTION OF PROFITABILITY FOR BOTH MODELS PROFIT CONTRIBUTION1 (€ PER ORDER)
Q1 2016 Q2 2016 Q3 2016 Q4 2016 Q1 2017
Marketplace Own Delivery (High Basket Size Countries)
Source: Company information; management reporting
Notes:
1. Profit contribution calculated as revenue less delivery costs and payment costs
2. Excluding foodora and foodpanda
3. Data points for own delivery in high basket size countries depicted on this page refer to foodora only; not necessarily representative for Delivery Hero Group
2 3
0

216
34
39
66
67
74
150
150
150
107
173
67
69
35
62
255
199
19
21
6 Attractive Scale,
Growth and
Profitability
Potential

216
34
39
66
67
74
150
150
150
107
173
67
69
35
62
255
199
19
22
Highlights: Attractive Scale, Growth and Profitability Potential
Orders Average
Basket Size GMV Take-rate Revenue
Recurring high quality
cohorts combined
with strong new
customer growth and
increasing frequency
Take-rate
expansion driven
by market
maturity and
own delivery
Cohort-driven Multiyear Revenue Growth

216
34
39
66
67
74
150
150
150
107
173
67
69
35
62
255
199
19
23
Highlights: Attractive Scale, Growth and Profitability Potential
103
171
16
27
10
130
197
2015 2016
ORDERS (#M) (AGGREGATED) GMV (€M) (AGGREGATED)
1,430
2,324
165
299
135
1,731
2,618
2015 2016
LFL Adj.1,2
foodpanda
Delivery Hero
Source: Company information
Notes: GMV denotes Gross Merchandise Value
1. LFL adjustments including entities acquired in 2015 (Yemek Sepeti, Talabat and E-Food Group) for the period between 1 Jan 2015 and the time of their inclusion in financial statements of Delivery Hero; please refer to appendix for detailed information
2. Orders and GMV numbers excl. former China operations which have been sold in 2016. China Orders: 2015: 6m, 2016: 1m; China GMV: 2015: €38m, 2016: €5m
LFL1,2
+52%
65%
65%
GROWTH
’15-’16
81%
62%
GROWTH
’15-’16
LFL1,2
+51% 2 2
Strong Order and GMV Growth…

216
34
39
66
67
74
150
150
150
107
173
67
69
35
62
255
199
19
24
Highlights: Attractive Scale, Growth and Profitability Potential
166
290
22
50
14 <1
7
203
347
REVENUE (€M)1 (AGGREGATED)
GROWTH
’15-’16
128%
75%
2015 2016 Source: Company information
Notes:
1. Based on aggregated Delivery Hero Group, i.e. Delivery Hero + foodpanda revenue, excluding foodpanda other revenue / reconciling items of €1.4m in 2015 and €0.3m in 2016 respectively
2. LFL adjustments including entities acquired in 2015 (Yemek Sepeti, Talabat and E-Food Group) for the period between 1 Jan 2015 and the time of their inclusion in financial statements of Delivery Hero; please refer to appendix for detailed information
3. Denotes Delivery Hero other revenue / reconciling items of €0.5m in 2015 and €6.8m in 2016 respectively
4. Delivery Hero segment revenue, excluding other revenue / reconciling items of €6.8m in 2016
5. foodpanda segment revenue, excluding other revenue / reconciling items of €0.3m in 2016
SEGMENT REVENUE COMPOSITION 2016
LFL Adj.2
foodpanda
Segment
Revenue
Delivery Hero
Segment
Revenue
LFL1,2
+71%
BY REGION (AGGR. LFL ADJ.2 DELIVERY HERO4 + FOODPANDA5)
Europe
43% (48%)
MENA
24% (22%)
Asia
26% (24%)
Americas
7% (6%)
Delivery Hero
foodpanda
188
341
Previous Year ( )
3
3 3
…Accelerate Revenue Growth Beyond Volume Growth

216
34
39
66
67
74
150
150
150
107
173
67
69
35
62
255
199
19
25
Highlights: Attractive Scale, Growth and Profitability Potential
(109) (71)
(66)
(45)
(175)
(116)
2015-16 ADJ. EBITDA (€M)
MARGIN
DH ONLY2 (66)% (25)%
2015 2016
Source: Company information
Notes:
1. Based on aggregated Delivery Hero Group, i.e. Delivery Hero + foodpanda segment revenue, excluding other revenue / reconciling items of €0.5m and €6.8m for Delivery Hero and €1.4m and €0.3m for foodpanda in 2015 and 2016 respectively
2. Adjusted EBITDA margins calculated on the basis of segment revenue, i.e. excluding other / reconciling items of €0.5m and €6.8m in 2015 and 2016 respectively
3. foodpanda adjusted EBITDA excludes the adjusted EBITDA from liquidated/dormant entities and headquarter
4. Calculated as Adj. EBITDA less marketing expenses excl. amortizations. For Delivery Hero marketing expenses exclude amortization of brand names of €18.6m and €22.2m in 2015/16 and amortization of customer / supplier base of €13.4m and €15.9m in 2015/16. For
foodpanda marketing expenses exclude reclassified amortization expenses of intangibles of €2.1m in 2016; please refer to page 16 for information on reclassification of amortization expenses of brands and customer base from G&A to marketing expenses
MARGIN
AGGR.1,2 GROUP
Delivery
Hero
foodpanda3
Aggregated
(93)% (34)%
Includes mid-
double-digit €M
spend on new
premium brand
60
113
(15)
99
2015-16 ADJ. EBITDA BEFORE MARKETING EXPENSES4 (€M)
36% 39%
29%
2015 2016
NPI
Add EBITDA
bridge? Margins Show Strong Operational Leverage With
Y-o-Y Margin Improvement

216
34
39
66
67
74
150
150
150
107
173
67
69
35
62
255
199
19
26
Multiple Drivers
for Long-term
Growth
7

216
34
39
66
67
74
150
150
150
107
173
67
69
35
62
255
199
19
27
Highlights: Multiple Drivers for Long-term Growth
Multiple Drivers for Long-term Growth and Profitability
Source: Company information; Euromonitor; World Bank; United Nations
Notes:
1. Management estimates based on Delivery Hero market model; data as of 2016
2. Excluding countries where Delivery Hero operates own delivery business only (Australia, Canada, France, Italy, Netherlands, Norway), countries without local legal entities (Panama, Paraguay) and countries with minority participation that are not fully consolidated (e.g.,
Poland)
3. As per management estimate
4. Source: Euromonitor International; Economies and Consumers; Global Food Market represents Consumer Expenditure on Food and Catering, value at fixed 2016 exchange rates; data as of 2016
Tomorrow
Today
Food Market
Transformation
Taking on €7.5tn Food Market
Opportunity4
Take-rate
Improvement
Take-rate
Expansion with
Best Marketplace
Markets Already
+18%3
Margin
Expansion
Proven EBITDA
Margin Potential by Industry Best
Practice Levels
M&A
for Scale
Ongoing
Industry
Consolidation
Online
Transition
€72bn Takeaway
Market Going
Online1,2 Technology
& Innovation
Increased
Frequency Through Better
Experience

216
34
39
66
67
74
150
150
150
107
173
67
69
35
62
255
199
19
28
Highlights: Summary
1 Large Global Market Opportunity
2 Global Leader
3 Local Know How + Global Scale and Execution
4 At the Forefront of Innovation and Technology
5 Proven Business Model
6 Attractive Scale, Growth and Profitability Potential
7 Multiple Drivers for Long-term Growth
DELIVERY HERO HIGHLIGHTS