Delivering sustainable growth - Spirax-Sarco … · of solutions for the effective use of steam and...
25
Spirax-Sarco Engineering plc Half Year Report 2014 Delivering sustainable growth
Transcript of Delivering sustainable growth - Spirax-Sarco … · of solutions for the effective use of steam and...

Spirax-Sarco Engineering plc Half Year Report 2014
Delivering sustainable growth
Spirax-Sarco Engineering plc Half Year Report 201401
About us
Our visionTo deliver consistent, profitable and sustainable growth and shareholder value, and to be the customers’ first choice provider of solutions for the effective use of steam and industrial fluids worldwide, as well as the global leader in the development and manufacture of peristaltic and niche pumps.
Our purposeTo help our customers implement environmentally friendly solutions for energy savings, process efficiency, product quality and improvements in plant health, safety and regulatory compliance.
Our executionOur business model is anchored by deep customer insight and our ability to provide our customers with applied engineering solutions. Six key strategic priorities drive our business model. These are to strengthen our position, deliver solutions, broaden our global presence, grow our market share, generate growth and operate sustainably.
Our valuesTo act ethically at all times and embody our core values of respect, accountability, passion, integrity and delivery.
Contents1. Overview
About us 01 Financial and operational highlights 02 Our structure 03 Group performance at a glance 04 Review of operations 05
2. Financial statements
Statement of financial position 10 Consolidated income statement 11 Consolidated statement of comprehensive income 12 Consolidated statement of changes in equity 12 Cash flow statement 14 Notes to the accounts 15 Officers and advisers 23
02Spirax-Sarco Engineering plc Half Year Report 2014
1. O
verv
iew
2. F
inan
cial
sta
tem
ents
Financial highlights
Six months ended 30th June
Adjusted* 2014 2013 ChangeConstant Currency**
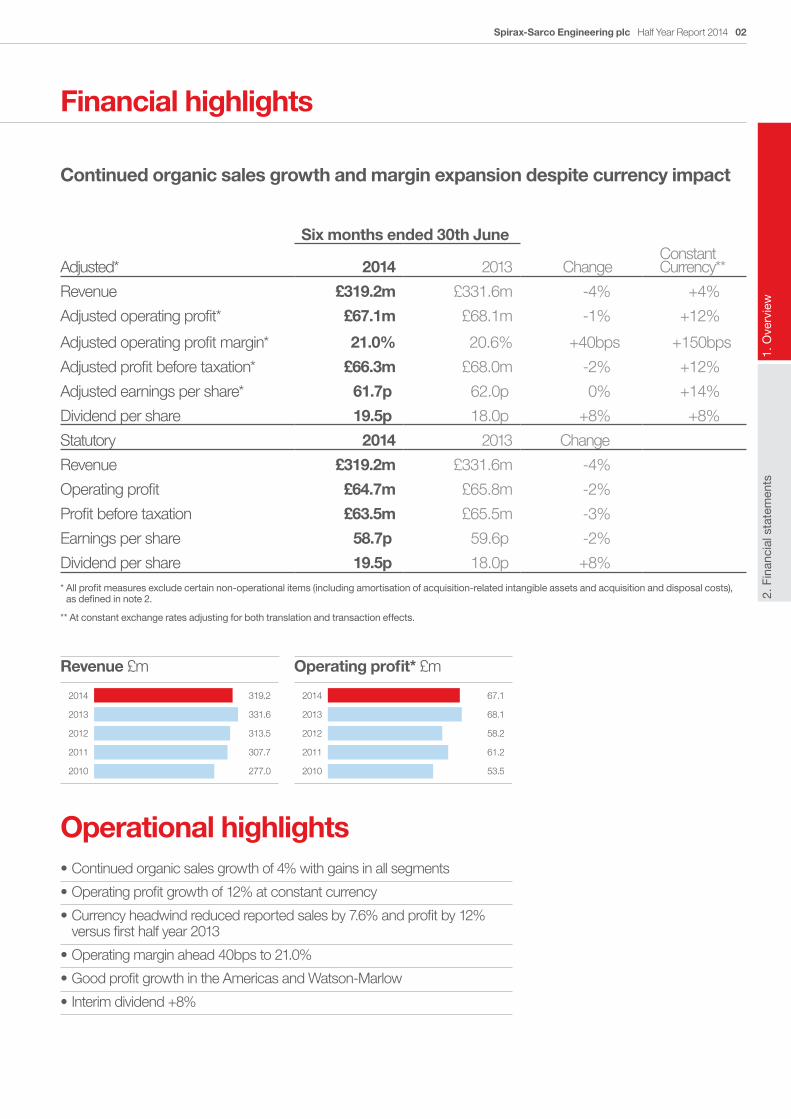
Revenue £319.2m £331.6m -4% +4%
Adjusted operating profit* £67.1m £68.1m -1% +12%
Adjusted operating profit margin* 21.0% 20.6% +40bps +150bps
Adjusted profit before taxation* £66.3m £68.0m -2% +12%
Adjusted earnings per share* 61.7p 62.0p 0% +14%
Dividend per share 19.5p 18.0p +8% +8%
Statutory 2014 2013 Change
Revenue £319.2m £331.6m -4%
Operating profit £64.7m £65.8m -2%
Profit before taxation £63.5m £65.5m -3%
Earnings per share 58.7p 59.6p -2%
Dividend per share 19.5p 18.0p +8%* All profit measures exclude certain non-operational items (including amortisation of acquisition-related intangible assets and acquisition and disposal costs),
as defined in note 2.
** At constant exchange rates adjusting for both translation and transaction effects.
Revenue £m Operating profit* £m
2014
2013
2012
2011
2010
319.2
331.6
313.5
307.7
277.0
2014
2013
2012
2011
2010
67.1
68.1
58.2
61.2
53.5
Operational highlights•Continued organic sales growth of 4% with gains in all segments
•Operating profit growth of 12% at constant currency
•Currency headwind reduced reported sales by 7.6% and profit by 12% versus first half year 2013
•Operating margin ahead 40bps to 21.0%
•Good profit growth in the Americas and Watson-Marlow
•Interim dividend +8%
Continued organic sales growth and margin expansion despite currency impact

Spirax-Sarco Engineering plc Half Year Report 201403
Our structure
Our Spirax Sarco steam specialties business is the global leader in the supply of engineered solutions for the design, maintenance and operation of efficient industrial and commercial steam systems.
As a heat source, steam is the natural choice in most industrial processes due to its high heat-carrying capacity, controllability, sterility and efficiency as a heat transfer fluid. With our specialist knowledge, technical expertise and wide range of products and services, as well as our extensive global presence, Spirax Sarco is uniquely positioned to provide a broad range of environmentally friendly engineered solutions to the many industries using steam.
Our customers face a variety of challenges including high energy and water costs, pressure to improve the operating efficiency and capacity of existing processes, and the need to comply with increasingly stringent health, safety and environmental legislation. Our direct sales force is highly trained in product application, system performance and the troubleshooting of steam systems.
The Spirax Sarco offering is very wide, from single products through to complete turnkey bespoke packages that can include design, fabrication, installation, commissioning and maintenance. Our extensive product range includes steam traps; pressure and temperature control valves; condensate recovery pumps; strainers; separators; humidifiers; flow meters; boiler controls; prefabricated trap manifolds; and heat transfer and recovery packages.
Watson-Marlow is the global leader in peristaltic pumps, specialising in the design and manufacture of the most advanced peristaltic and niche pumps, and tubing.
Our pumps are ideally suited for a wide variety of applications ranging from biotechnology and pharmaceutical processes that demand sterility and precision, to the gentle low-shear requirements of delicate food processing, to highly corrosive or erosive slurries typically seen in precious metal processing.
The Watson-Marlow Pumps Group comprises seven established brands, each with its own area of expertise, but together offering our customers an unrivalled breadth of pumping solutions: Watson-Marlow Pumps (peristaltic tube pumps); Watson-Marlow Tubing (precision tubing for pumping and single-use applications); Bio Pure Hygienic Connectors (connectors for pumping and single-use applications); Bredel (heavy duty industrial hose pumps); Alitea (high-precision peristaltic pumps for OEM customers); Flexicon (aseptic filling and capping systems); and MasoSine (gentle low-shear pumps).
Our pumps are the ideal solution in a wide variety of difficult pumping applications and are highly accurate, controllable and virtually maintenance free. Our direct field sales force works closely with our customers to reduce their life-cycle pumping costs and improve plant operations.
EMEA AmericasAsia Pacific
Revenue by business Operating profit by business Steam specialties EMEA £119.3m
Steam specialties Asia Pacific £75.5m
Steam specialties Americas £59.8m
Watson-Marlow Pumps £64.5m
Total £319.2m
Steam specialties EMEA £24.2m
Steam specialties Asia Pacific £16.8m
Steam specialties Americas £11.9m
Watson-Marlow Pumps £19.3m
Corporate expenses (£5.0m)
Total £67.1m
UngroupExpandPathfinder > TrimDelete white paths
UngroupExpandPathfinder > TrimDelete white paths
Spirax-Sarco Engineering plc
04Spirax-Sarco Engineering plc Half Year Report 2014
1. O
verv
iew
2. F
inan
cial
sta
tem
ents
Group performance at a glance
UngroupExpandPathfinder > TrimDelete white paths
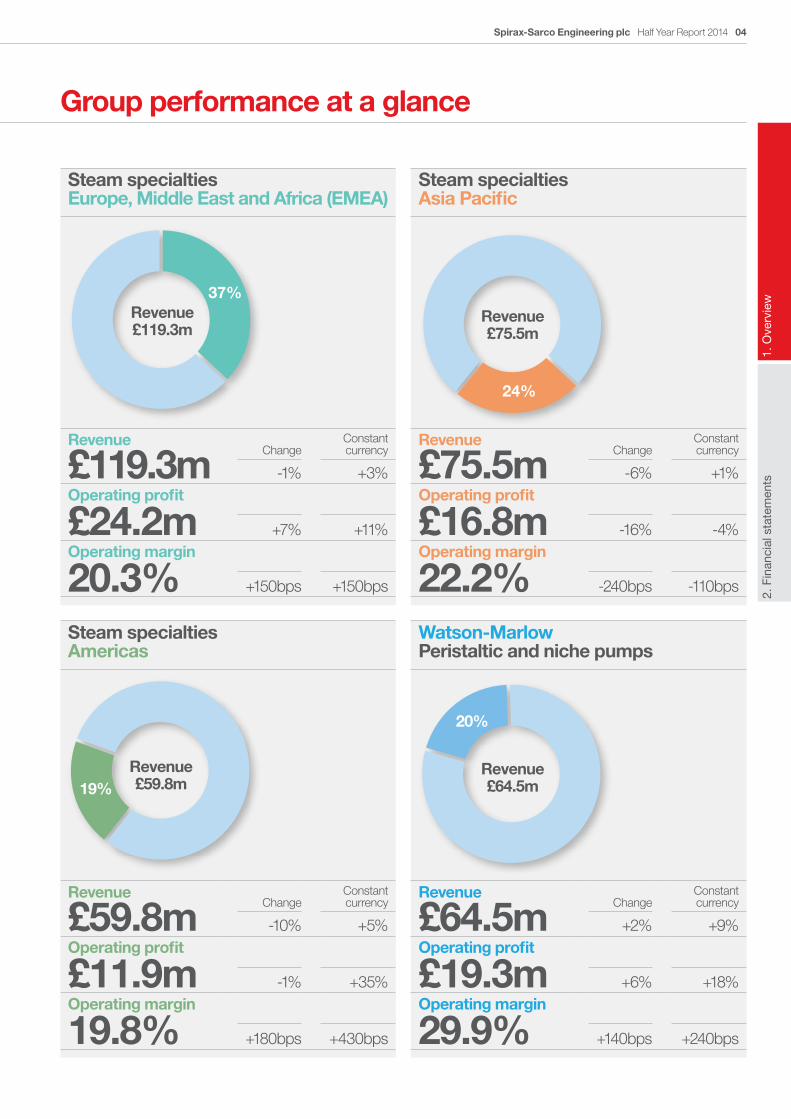
37%Revenue£119.3m
UngroupExpandPathfinder > TrimDelete white paths
24%
UngroupExpandPathfinder > TrimDelete white paths
19%
UngroupExpandPathfinder > TrimDelete white paths
20%
Steam specialties Europe, Middle East and Africa (EMEA)
Steam specialties Asia Pacific
Steam specialties Americas
Watson-Marlow Peristaltic and niche pumps
Revenue£75.5m
Revenue£59.8m
Revenue£64.5m
Revenue
£119.3mChange
Constant currency
-1% +3%Operating profit
£24.2m
+7% +11%Operating margin
20.3%
+150bps +150bps
Revenue
£75.5mChange
Constant currency
-6% +1%Operating profit
£16.8m
-16% -4%Operating margin
22.2%
-240bps -110bps
Revenue
£64.5mChange
Constant currency
+2% +9%Operating profit
£19.3m
+6% +18%Operating margin
29.9%
+140bps +240bps
Revenue
£59.8mChange
Constant currency
-10% +5%Operating profit
£11.9m
-1% +35%Operating margin
19.8%
+180bps +430bps
Spirax-Sarco Engineering plc Half Year Report 201405
Review of operations
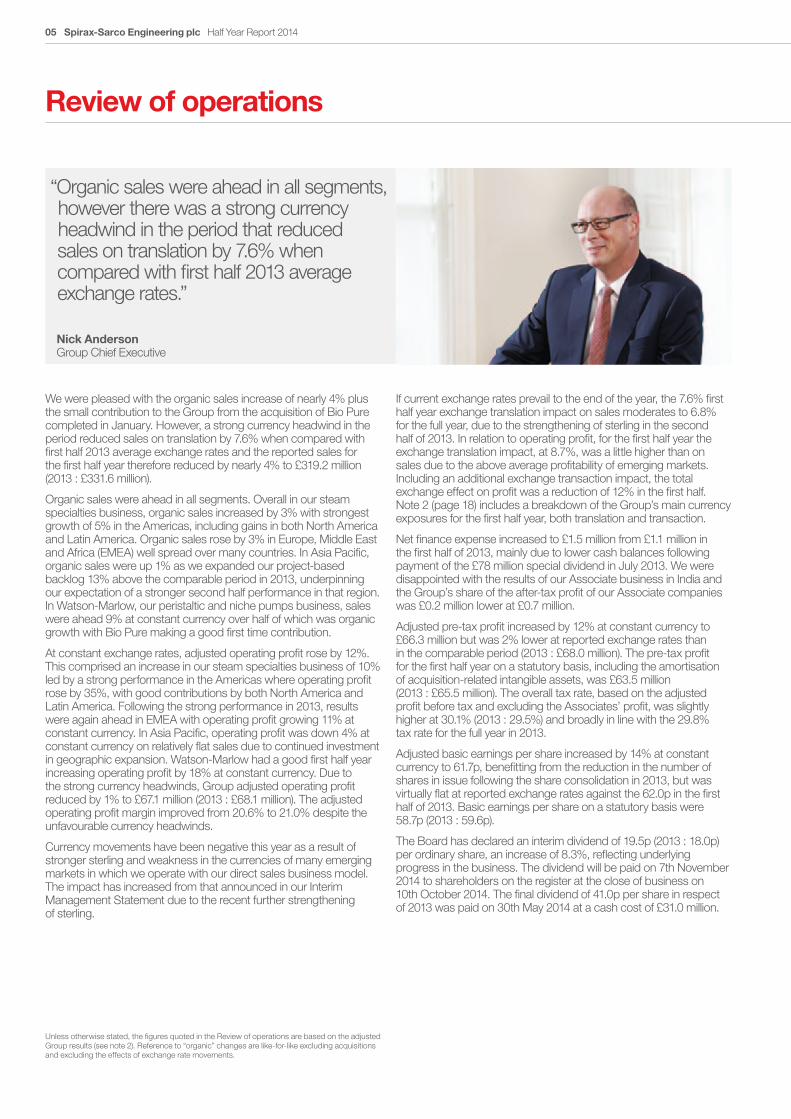
“Organic sales were ahead in all segments, however there was a strong currency headwind in the period that reduced sales on translation by 7.6% when compared with first half 2013 average exchange rates.”
Nick Anderson Group Chief Executive
We were pleased with the organic sales increase of nearly 4% plus the small contribution to the Group from the acquisition of Bio Pure completed in January. However, a strong currency headwind in the period reduced sales on translation by 7.6% when compared with first half 2013 average exchange rates and the reported sales for the first half year therefore reduced by nearly 4% to £319.2 million (2013 : £331.6 million).
Organic sales were ahead in all segments. Overall in our steam specialties business, organic sales increased by 3% with strongest growth of 5% in the Americas, including gains in both North America and Latin America. Organic sales rose by 3% in Europe, Middle East and Africa (EMEA) well spread over many countries. In Asia Pacific, organic sales were up 1% as we expanded our project-based backlog 13% above the comparable period in 2013, underpinning our expectation of a stronger second half performance in that region. In Watson-Marlow, our peristaltic and niche pumps business, sales were ahead 9% at constant currency over half of which was organic growth with Bio Pure making a good first time contribution.
At constant exchange rates, adjusted operating profit rose by 12%. This comprised an increase in our steam specialties business of 10% led by a strong performance in the Americas where operating profit rose by 35%, with good contributions by both North America and Latin America. Following the strong performance in 2013, results were again ahead in EMEA with operating profit growing 11% at constant currency. In Asia Pacific, operating profit was down 4% at constant currency on relatively flat sales due to continued investment in geographic expansion. Watson-Marlow had a good first half year increasing operating profit by 18% at constant currency. Due to the strong currency headwinds, Group adjusted operating profit reduced by 1% to £67.1 million (2013 : £68.1 million). The adjusted operating profit margin improved from 20.6% to 21.0% despite the unfavourable currency headwinds.
Currency movements have been negative this year as a result of stronger sterling and weakness in the currencies of many emerging markets in which we operate with our direct sales business model. The impact has increased from that announced in our Interim Management Statement due to the recent further strengthening of sterling.
If current exchange rates prevail to the end of the year, the 7.6% first half year exchange translation impact on sales moderates to 6.8% for the full year, due to the strengthening of sterling in the second half of 2013. In relation to operating profit, for the first half year the exchange translation impact, at 8.7%, was a little higher than on sales due to the above average profitability of emerging markets. Including an additional exchange transaction impact, the total exchange effect on profit was a reduction of 12% in the first half. Note 2 (page 18) includes a breakdown of the Group’s main currency exposures for the first half year, both translation and transaction.
Net finance expense increased to £1.5 million from £1.1 million in the first half of 2013, mainly due to lower cash balances following payment of the £78 million special dividend in July 2013. We were disappointed with the results of our Associate business in India and the Group’s share of the after-tax profit of our Associate companies was £0.2 million lower at £0.7 million.
Adjusted pre-tax profit increased by 12% at constant currency to £66.3 million but was 2% lower at reported exchange rates than in the comparable period (2013 : £68.0 million). The pre-tax profit for the first half year on a statutory basis, including the amortisation of acquisition-related intangible assets, was £63.5 million (2013 : £65.5 million). The overall tax rate, based on the adjusted profit before tax and excluding the Associates’ profit, was slightly higher at 30.1% (2013 : 29.5%) and broadly in line with the 29.8% tax rate for the full year in 2013.
Adjusted basic earnings per share increased by 14% at constant currency to 61.7p, benefitting from the reduction in the number of shares in issue following the share consolidation in 2013, but was virtually flat at reported exchange rates against the 62.0p in the first half of 2013. Basic earnings per share on a statutory basis were 58.7p (2013 : 59.6p).
The Board has declared an interim dividend of 19.5p (2013 : 18.0p) per ordinary share, an increase of 8.3%, reflecting underlying progress in the business. The dividend will be paid on 7th November 2014 to shareholders on the register at the close of business on 10th October 2014. The final dividend of 41.0p per share in respect of 2013 was paid on 30th May 2014 at a cash cost of £31.0 million.
Unless otherwise stated, the figures quoted in the Review of operations are based on the adjusted Group results (see note 2). Reference to “organic” changes are like-for-like excluding acquisitions and excluding the effects of exchange rate movements.

06Spirax-Sarco Engineering plc Half Year Report 2014
1. O
verv
iew
2. F
inan
cial
sta
tem
ents
Review of operations continued
TradingSteam is widely used as the preferred heat transfer medium in a wide range of industries, which is reflected in the diverse geographic, sector and customer spread of our business. We benefit from a large proportion of revenues being derived from on-going replacement demand and maintenance spending by customers, giving a high degree of resilience. We have a powerful and robust direct sales business model with highly trained sales engineers that directly address customers’ energy and water saving, productivity, quality and sustainability issues in their manufacturing plants. Our markets broadly reflect changes in global economic activity and movements in Industrial Production, with a typical lag to the cycle of a few quarters. Our focus remains on strategic actions to out-perform our markets and we are well positioned to leverage the investments we have made to achieve growth and improvements in our business.
Global economic conditions, and in particular the rate of Industrial Production growth, marginally picked up pace in the fourth quarter of last year and has overall remained stable through the first half year. In emerging markets Industrial Production growth rates have been slower than in the comparable period, including in China, and in South America growth rates have again turned negative. In developed markets, Industrial Production growth rates have been generally a little higher than in the comparable period, although overall in Europe the growth rate is at a comparatively lower level than North America.
In the first half of 2014, revenue in our steam specialties business increased by 3% at constant currency, continuing the trend from the prior year. The large majority of our sales derive from maintenance and operations spend by our customers comprising day-to-day replacement demand and small to mid-sized energy saving and process efficiency projects, often initiated by our highly trained sales engineers. This base maintenance and operations business increased but was partly offset by a general decline in large project business, although there are indications that this large project business is now picking up. Sales grew in our core traditional products and we achieved good increases in controls and boilerhouse products. The operating profit margin in our steam specialties business increased from 20.3% to 20.7%. We benefitted from broadly flat material costs in the first quarter but, as anticipated, we have subsequently seen some increases in our material costs that we expect to continue through 2014. Our business is seasonally biased towards the second half year and we anticipate a broadly normal pattern this year, other than in Asia Pacific where the increased project-based backlog is expected to deliver a relatively stronger second half year performance in that region.
Watson-Marlow increased sales by 9% at constant currency, including a first time contribution from Bio Pure that performed ahead of our expectations. Good progress was made with Watson-Marlow pumps and tubing, including further gains for the revolutionary new Qdos pump, and there were increased sales of Flexicon filling systems. Sales increased across all main industry sectors except precious metals mining, where the platinum sector has been hit hard with lower levels of investment. The operating profit margin in Watson-Marlow improved from 28.5% to 29.9%.
Our strategy is focused on delivering self-generated growth that out-performs our markets. During the first half of 2014 we have refined and evolved a more customer-centric strategy to increase the effectiveness of our direct sales organisation, leverage our strengths in key sectors, take advantage of the most attractive opportunities, expand our addressable markets and align and direct our resources more effectively to improve business performance. This strategy builds on the foundation of our robust, direct sales business model that has proved resilient through the business cycle. Our six primary strategies are:
• Increase direct sales effectiveness through sector focus. It is not our products alone that provide value to customers, the extensive application and systems knowledge of our direct sales and support people are at the heart of our customer value propositions. Through expanding the sector focus of our direct sales force, with particular emphasis on priority industries such as Food & Beverage, Healthcare, and Oil & Petrochemicals, we will enhance our customer value propositions and increase our sales effectiveness. We are also increasing our focus on thermal energy management within those priority sectors, with the goal of making our Spirax Sarco steam specialties business the customers’ first choice provider for steam solutions and thermal energy management.
• Develop the knowledge and skills of our expert sales and service teams. Continually improving the competency, technical skills and in-depth application knowledge of our sales and service engineers is central to our direct sales business model. Understanding our customers’ processes and applying appropriately engineered solutions to their steam or niche pumping problems are pivotal to our business success. In addition to extensive on-the-job training and mentoring, we have developed and will extend a wide-range of training materials and tools that are internet-based and available through our 42 training centres located across the world. Through continually investing in the professional development of our people, we develop a level of expertise that is unrivalled by our competitors.
• Broaden our global presence. Our strong global presence is a result of decades of investment in building easily recognisable brands that symbolise expertise and reliability. We will accelerate our investments to achieve a first-to-market advantage from early entry into newly emerging markets in Asia, Latin America and Africa. Leveraging our existing strong infrastructure, we are also pioneering the introduction of Watson-Marlow into much of the developing world, demonstrating the superior technology and lower life cycle costs of peristaltic and niche pumps.
• Leverage R&D investments. Our ability to deliver an increasingly wider range of solutions to reduce energy and water usage, lower plant emissions and improve plant productivity and efficiency, rests with our commitment to new product development. We have significantly increased our R&D investments in recent years and will leverage these investments to generate sales growth, with shorter time-to-market of new products and solutions in such areas as thermal energy management, controls, condensate management and new pumping technologies and systems. Product development will increasingly be aligned to sector requirements. Where appropriate, we will look to make acquisitions in related areas that deliver new products and technologies and expand our addressable markets.
• Optimise supply chain effectiveness. Our direct sales business model, with extensive product ranges and short order books, requires a regional manufacturing strategy with plants throughout the world to optimise customer service and minimise costs. We will continue to invest on a regional basis and increase focus on developing our entire supply chain to enhance product availability, increase flexibility, reduce costs and improve service levels in support of sales growth.
• Operate sustainably and help improve our customers’ sustainability. Our approach to sustainability encompasses four primary areas of emphasis: good corporate governance, employee wellbeing, community engagement and environmental stewardship. We believe that effective management in each of these areas is essential to improve our long-term sustainability. Further, our business is centred on providing environmentally-friendly solutions to our customers, helping them to improve the efficiency of their plant operations, reduce their energy and water usage, improve quality and meet their sustainability targets.
Spirax-Sarco Engineering plc Half Year Report 201407
Review of operations continued
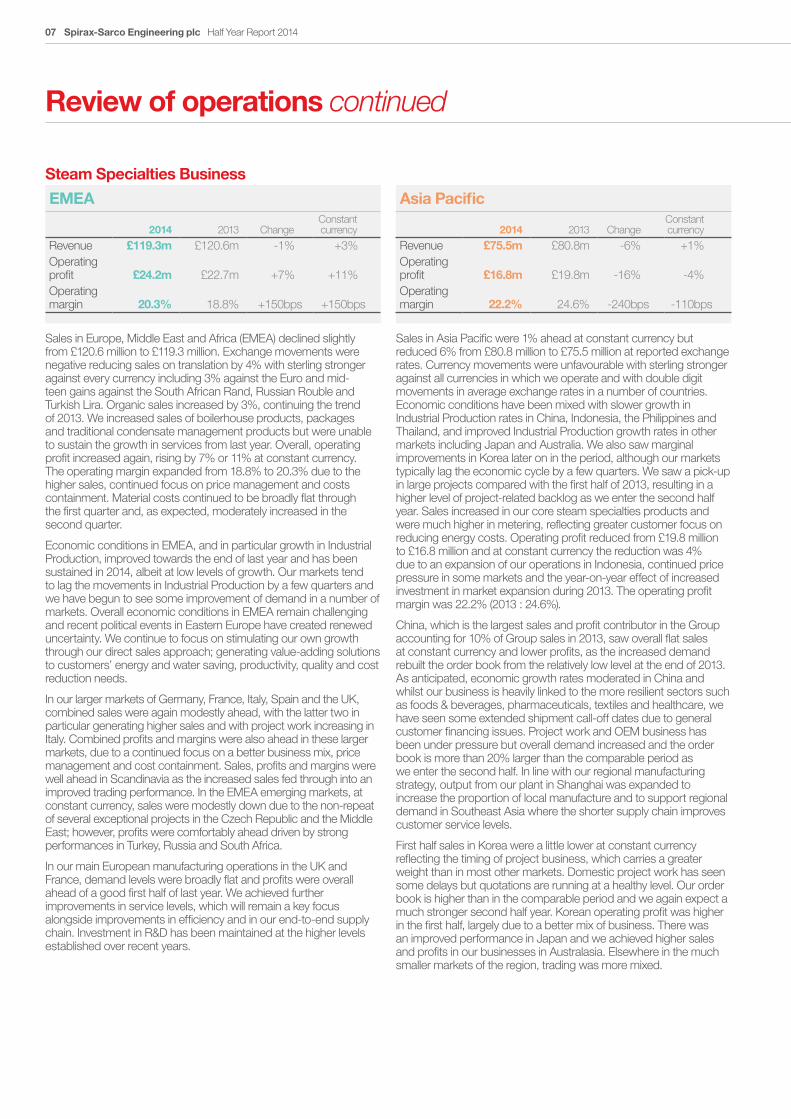
Steam Specialties Business
EMEA
2014 2013 ChangeConstant currency
Revenue £119.3m £120.6m -1% +3%Operating profit £24.2m £22.7m +7% +11%Operating margin 20.3% 18.8% +150bps +150bps
Sales in Europe, Middle East and Africa (EMEA) declined slightly from £120.6 million to £119.3 million. Exchange movements were negative reducing sales on translation by 4% with sterling stronger against every currency including 3% against the Euro and mid-teen gains against the South African Rand, Russian Rouble and Turkish Lira. Organic sales increased by 3%, continuing the trend of 2013. We increased sales of boilerhouse products, packages and traditional condensate management products but were unable to sustain the growth in services from last year. Overall, operating profit increased again, rising by 7% or 11% at constant currency. The operating margin expanded from 18.8% to 20.3% due to the higher sales, continued focus on price management and costs containment. Material costs continued to be broadly flat through the first quarter and, as expected, moderately increased in the second quarter.
Economic conditions in EMEA, and in particular growth in Industrial Production, improved towards the end of last year and has been sustained in 2014, albeit at low levels of growth. Our markets tend to lag the movements in Industrial Production by a few quarters and we have begun to see some improvement of demand in a number of markets. Overall economic conditions in EMEA remain challenging and recent political events in Eastern Europe have created renewed uncertainty. We continue to focus on stimulating our own growth through our direct sales approach; generating value-adding solutions to customers’ energy and water saving, productivity, quality and cost reduction needs.
In our larger markets of Germany, France, Italy, Spain and the UK, combined sales were again modestly ahead, with the latter two in particular generating higher sales and with project work increasing in Italy. Combined profits and margins were also ahead in these larger markets, due to a continued focus on a better business mix, price management and cost containment. Sales, profits and margins were well ahead in Scandinavia as the increased sales fed through into an improved trading performance. In the EMEA emerging markets, at constant currency, sales were modestly down due to the non-repeat of several exceptional projects in the Czech Republic and the Middle East; however, profits were comfortably ahead driven by strong performances in Turkey, Russia and South Africa.
In our main European manufacturing operations in the UK and France, demand levels were broadly flat and profits were overall ahead of a good first half of last year. We achieved further improvements in service levels, which will remain a key focus alongside improvements in efficiency and in our end-to-end supply chain. Investment in R&D has been maintained at the higher levels established over recent years.
Asia Pacific
2014 2013 ChangeConstant currency
Revenue £75.5m £80.8m -6% +1%Operating profit £16.8m £19.8m -16% -4%Operating margin 22.2% 24.6% -240bps -110bps
Sales in Asia Pacific were 1% ahead at constant currency but reduced 6% from £80.8 million to £75.5 million at reported exchange rates. Currency movements were unfavourable with sterling stronger against all currencies in which we operate and with double digit movements in average exchange rates in a number of countries. Economic conditions have been mixed with slower growth in Industrial Production rates in China, Indonesia, the Philippines and Thailand, and improved Industrial Production growth rates in other markets including Japan and Australia. We also saw marginal improvements in Korea later on in the period, although our markets typically lag the economic cycle by a few quarters. We saw a pick-up in large projects compared with the first half of 2013, resulting in a higher level of project-related backlog as we enter the second half year. Sales increased in our core steam specialties products and were much higher in metering, reflecting greater customer focus on reducing energy costs. Operating profit reduced from £19.8 million to £16.8 million and at constant currency the reduction was 4% due to an expansion of our operations in Indonesia, continued price pressure in some markets and the year-on-year effect of increased investment in market expansion during 2013. The operating profit margin was 22.2% (2013 : 24.6%).
China, which is the largest sales and profit contributor in the Group accounting for 10% of Group sales in 2013, saw overall flat sales at constant currency and lower profits, as the increased demand rebuilt the order book from the relatively low level at the end of 2013. As anticipated, economic growth rates moderated in China and whilst our business is heavily linked to the more resilient sectors such as foods & beverages, pharmaceuticals, textiles and healthcare, we have seen some extended shipment call-off dates due to general customer financing issues. Project work and OEM business has been under pressure but overall demand increased and the order book is more than 20% larger than the comparable period as we enter the second half. In line with our regional manufacturing strategy, output from our plant in Shanghai was expanded to increase the proportion of local manufacture and to support regional demand in Southeast Asia where the shorter supply chain improves customer service levels.
First half sales in Korea were a little lower at constant currency reflecting the timing of project business, which carries a greater weight than in most other markets. Domestic project work has seen some delays but quotations are running at a healthy level. Our order book is higher than in the comparable period and we again expect a much stronger second half year. Korean operating profit was higher in the first half, largely due to a better mix of business. There was an improved performance in Japan and we achieved higher sales and profits in our businesses in Australasia. Elsewhere in the much smaller markets of the region, trading was more mixed.
08Spirax-Sarco Engineering plc Half Year Report 2014
1. O
verv
iew
2. F
inan
cial
sta
tem
ents
Review of operations continued
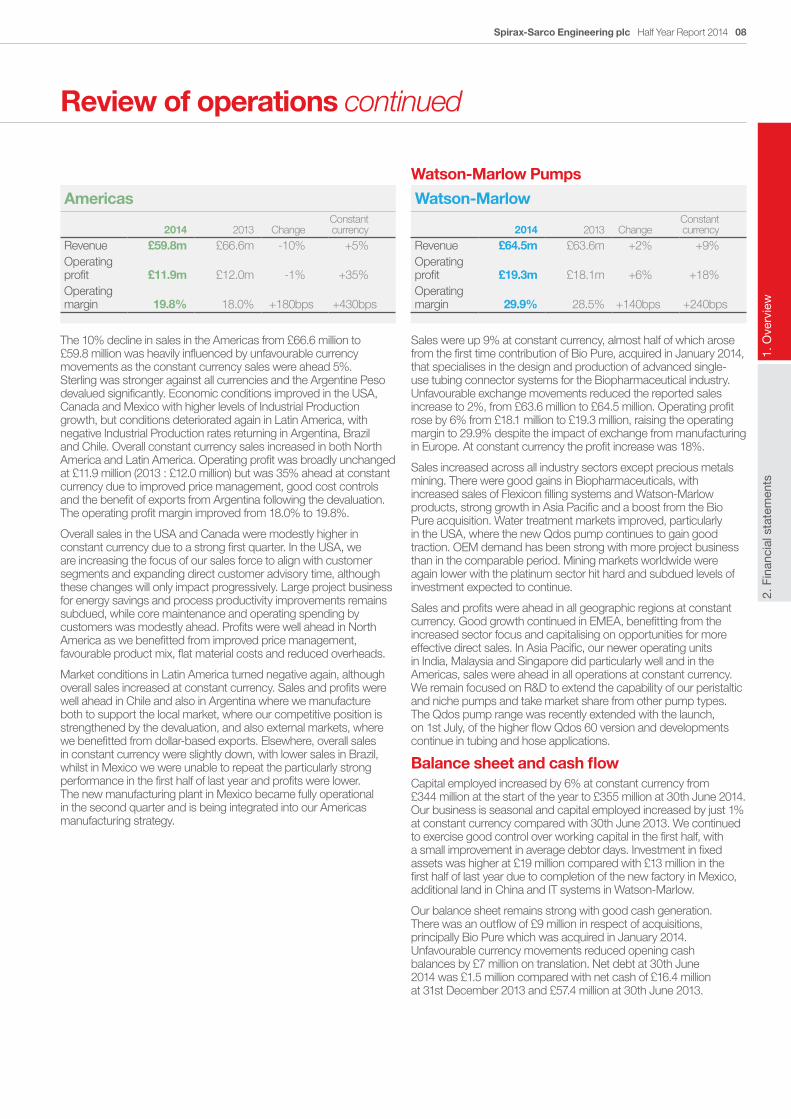
Americas
2014 2013 ChangeConstant currency
Revenue £59.8m £66.6m -10% +5%Operating profit £11.9m £12.0m -1% +35%Operating margin 19.8% 18.0% +180bps +430bps
The 10% decline in sales in the Americas from £66.6 million to £59.8 million was heavily influenced by unfavourable currency movements as the constant currency sales were ahead 5%. Sterling was stronger against all currencies and the Argentine Peso devalued significantly. Economic conditions improved in the USA, Canada and Mexico with higher levels of Industrial Production growth, but conditions deteriorated again in Latin America, with negative Industrial Production rates returning in Argentina, Brazil and Chile. Overall constant currency sales increased in both North America and Latin America. Operating profit was broadly unchanged at £11.9 million (2013 : £12.0 million) but was 35% ahead at constant currency due to improved price management, good cost controls and the benefit of exports from Argentina following the devaluation. The operating profit margin improved from 18.0% to 19.8%.
Overall sales in the USA and Canada were modestly higher in constant currency due to a strong first quarter. In the USA, we are increasing the focus of our sales force to align with customer segments and expanding direct customer advisory time, although these changes will only impact progressively. Large project business for energy savings and process productivity improvements remains subdued, while core maintenance and operating spending by customers was modestly ahead. Profits were well ahead in North America as we benefitted from improved price management, favourable product mix, flat material costs and reduced overheads.
Market conditions in Latin America turned negative again, although overall sales increased at constant currency. Sales and profits were well ahead in Chile and also in Argentina where we manufacture both to support the local market, where our competitive position is strengthened by the devaluation, and also external markets, where we benefitted from dollar-based exports. Elsewhere, overall sales in constant currency were slightly down, with lower sales in Brazil, whilst in Mexico we were unable to repeat the particularly strong performance in the first half of last year and profits were lower. The new manufacturing plant in Mexico became fully operational in the second quarter and is being integrated into our Americas manufacturing strategy.
Watson-Marlow Pumps
Watson-Marlow
2014 2013 ChangeConstant currency
Revenue £64.5m £63.6m +2% +9%Operating profit £19.3m £18.1m +6% +18%Operating margin 29.9% 28.5% +140bps +240bps
Sales were up 9% at constant currency, almost half of which arose from the first time contribution of Bio Pure, acquired in January 2014, that specialises in the design and production of advanced single-use tubing connector systems for the Biopharmaceutical industry. Unfavourable exchange movements reduced the reported sales increase to 2%, from £63.6 million to £64.5 million. Operating profit rose by 6% from £18.1 million to £19.3 million, raising the operating margin to 29.9% despite the impact of exchange from manufacturing in Europe. At constant currency the profit increase was 18%.
Sales increased across all industry sectors except precious metals mining. There were good gains in Biopharmaceuticals, with increased sales of Flexicon filling systems and Watson-Marlow products, strong growth in Asia Pacific and a boost from the Bio Pure acquisition. Water treatment markets improved, particularly in the USA, where the new Qdos pump continues to gain good traction. OEM demand has been strong with more project business than in the comparable period. Mining markets worldwide were again lower with the platinum sector hit hard and subdued levels of investment expected to continue.
Sales and profits were ahead in all geographic regions at constant currency. Good growth continued in EMEA, benefitting from the increased sector focus and capitalising on opportunities for more effective direct sales. In Asia Pacific, our newer operating units in India, Malaysia and Singapore did particularly well and in the Americas, sales were ahead in all operations at constant currency. We remain focused on R&D to extend the capability of our peristaltic and niche pumps and take market share from other pump types. The Qdos pump range was recently extended with the launch, on 1st July, of the higher flow Qdos 60 version and developments continue in tubing and hose applications.
Balance sheet and cash flowCapital employed increased by 6% at constant currency from £344 million at the start of the year to £355 million at 30th June 2014. Our business is seasonal and capital employed increased by just 1% at constant currency compared with 30th June 2013. We continued to exercise good control over working capital in the first half, with a small improvement in average debtor days. Investment in fixed assets was higher at £19 million compared with £13 million in the first half of last year due to completion of the new factory in Mexico, additional land in China and IT systems in Watson-Marlow.
Our balance sheet remains strong with good cash generation. There was an outflow of £9 million in respect of acquisitions, principally Bio Pure which was acquired in January 2014. Unfavourable currency movements reduced opening cash balances by £7 million on translation. Net debt at 30th June 2014 was £1.5 million compared with net cash of £16.4 million at 31st December 2013 and £57.4 million at 30th June 2013.
Spirax-Sarco Engineering plc Half Year Report 201409
Review of operations continued
The triennial valuation of our main UK pension schemes as at 31st December 2013 is nearing completion and is expected to show an improved position, including favourable experience gains since the previous valuation at the end of 2010.
Principal risks and uncertaintiesThe Group has a robust risk management process in place to identify, evaluate and manage the identified risks that could impact the Group’s performance. The current risks, together with an explanation of the impact and mitigation actions, are set out in the 2013 Annual Report on pages 26 to 27. The Group has reviewed these risks and concluded that they represent the current position and remain relevant for the second half of the financial year. A summary of the relevant key risks and uncertainties is:
• Economicandpoliticalinstability
• Significantexchangeratemovements
• LossofmanufacturingoutputatanyGroupfactory
• Breachofregulatoryrequirements
• Non-compliancewithhealth,safetyandenvironmentallegislation
• Definedbenefitpensionschemedeficits
• Failuretorespondtotechnologicaldevelopmentsorcustomer needs
• Failuretorealiseacquisitionobjectives
In the area of economic and political instability, the Group continues to carefully monitor developments in Europe and the Eurozone. We are keeping the events in Russia and Ukraine under constant review and update our Sanctions Policy as announcements are made. We have a well-established and profitable business in that region, which currently accounts for approximately 1.5% of Group sales. Our overall geographic diversity limits the impact of instability in any particular region. Exchange rate movements are also monitored closely and we keep mitigating actions under review.
OutlookWe have a robust business model with an increasing sector focus by our direct sales force to leverage our understanding of our customers’ applications and apply appropriately engineered solutions to help our customers solve their energy efficiency, water saving, productivity, quality and pumping needs. Our business is resilient due to the wide diversification across geographic regions, end markets, customers and products, combined with a high proportion of revenues generated from replacement demand and maintenance spending.
Our markets are largely influenced by changes in economic conditions and in particular the rate of growth in Industrial Production, which our markets typically lag by a few quarters. Global Industrial Production growth has exhibited an overall improvement since the fourth quarter of 2013, albeit to still relatively low levels of growth. We continue to assume that this small improvement in global Industrial Production rates will be reflected in a modest up-tick of our markets through the second half of this year, but remain focused on our strategic priorities to generate our own growth and out-perform our markets.
The benefit from generally flat material costs moderated in the second quarter and is expected to continue at this slower pace for the remainder of the year. Currency movements have been increasingly unfavourable this year but if current exchange rates prevail to the end of the year, the 7.6% first half year exchange translation impact on sales moderates to 6.8% for the full year, due to comparison with the strengthening of sterling in the second half of 2013.
We anticipate that our markets will remain challenging but as we enter the second half year we have a larger backlog than in the comparable period of 2013 and the Board remains confident that we will continue to make progress in 2014.
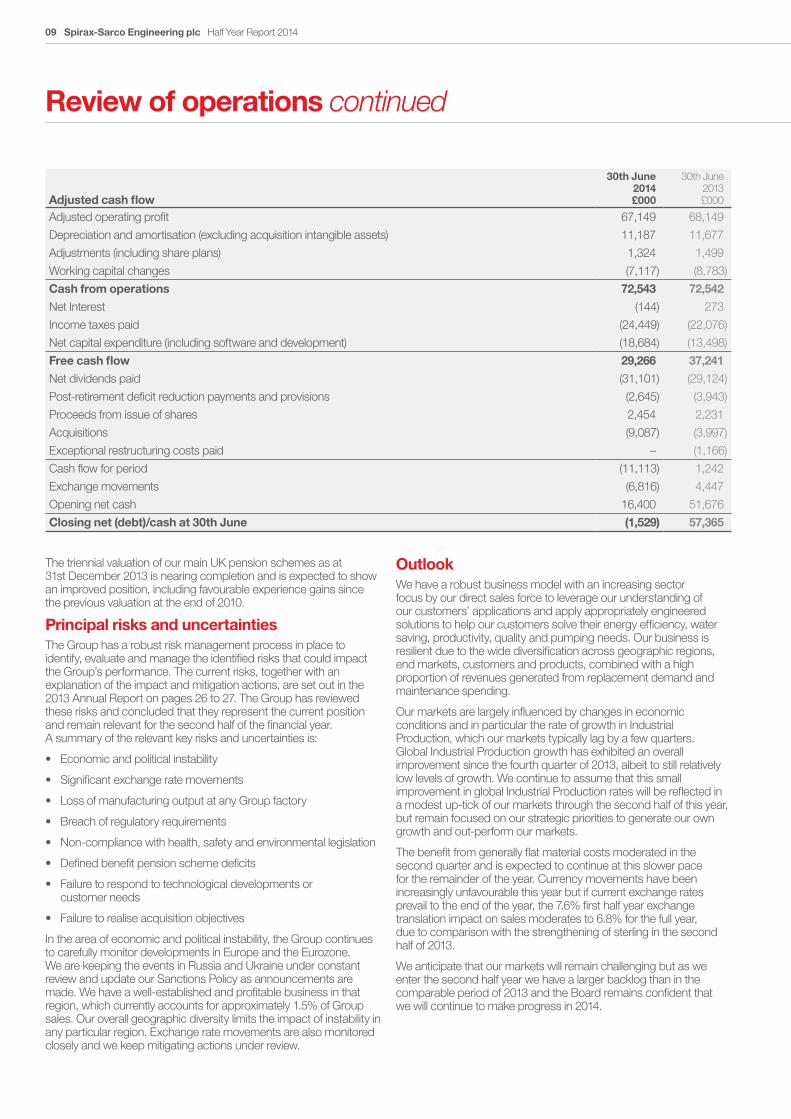
Adjusted cash flow
30th June 2014£000
30th June 2013£000
Adjusted operating profit 67,149 68,149
Depreciation and amortisation (excluding acquisition intangible assets) 11,187 11,677
Adjustments (including share plans) 1,324 1,499
Working capital changes (7,117) (8,783)
Cash from operations 72,543 72,542
Net Interest (144) 273
Income taxes paid (24,449) (22,076)
Net capital expenditure (including software and development) (18,684) (13,498)
Free cash flow 29,266 37,241
Net dividends paid (31,101) (29,124)
Post-retirement deficit reduction payments and provisions (2,645) (3,943)
Proceeds from issue of shares 2,454 2,231
Acquisitions (9,087) (3,997)
Exceptional restructuring costs paid – (1,166)
Cash flow for period (11,113) 1,242
Exchange movements (6,816) 4,447
Opening net cash 16,400 51,676
Closing net (debt)/cash at 30th June (1,529) 57,365
1. O
verv
iew
2. F
inan
cial
Sta
tem
ents
Spirax-Sarco Engineering plc Half Year Report 2014 10
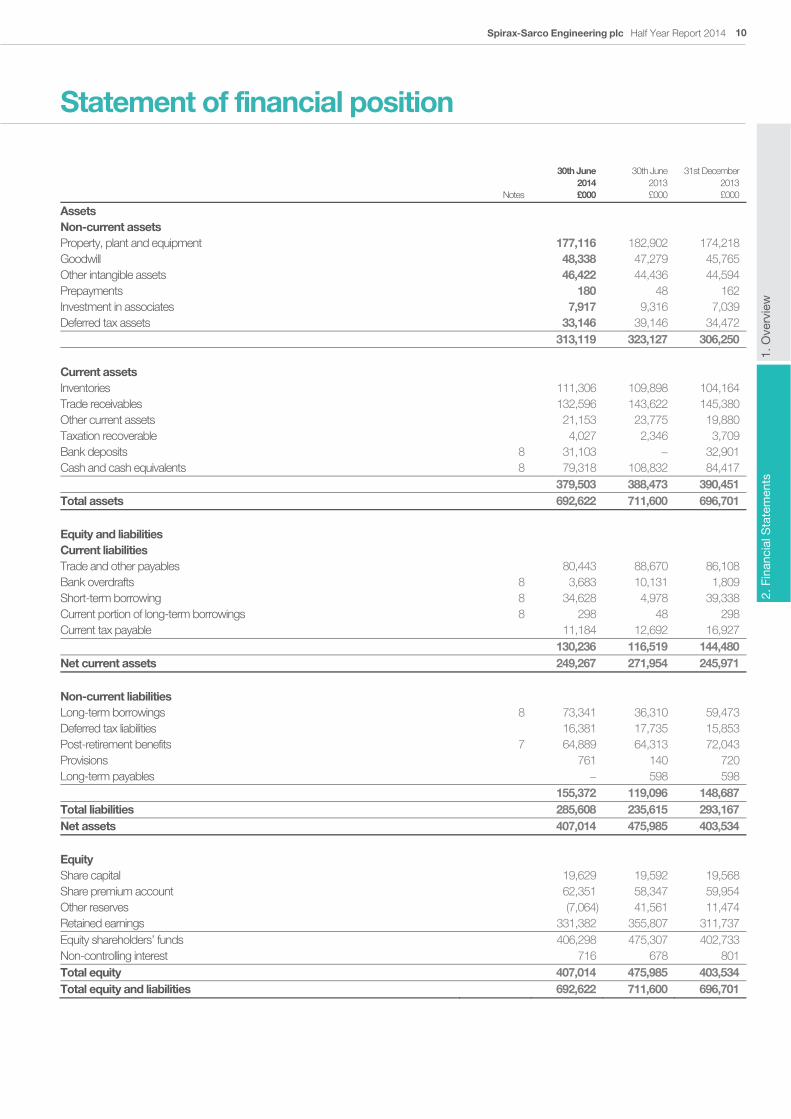
Statement of financial position
Notes
30th June 2014 £000
30th June 2013£000
31st December 2013£000
Assets Non-current assets Property, plant and equipment 177,116 182,902 174,218 Goodwill 48,338 47,279 45,765 Other intangible assets 46,422 44,436 44,594 Prepayments 180 48 162 Investment in associates 7,917 9,316 7,039 Deferred tax assets 33,146 39,146 34,472 313,119 323,127 306,250 Current assets Inventories 111,306 109,898 104,164 Trade receivables 132,596 143,622 145,380 Other current assets 21,153 23,775 19,880 Taxation recoverable 4,027 2,346 3,709 Bank deposits 8 31,103 − 32,901 Cash and cash equivalents 8 79,318 108,832 84,417 379,503 388,473 390,451 Total assets 692,622 711,600 696,701 Equity and liabilities Current liabilities Trade and other payables 80,443 88,670 86,108 Bank overdrafts 8 3,683 10,131 1,809 Short-term borrowing 8 34,628 4,978 39,338 Current portion of long-term borrowings 8 298 48 298 Current tax payable 11,184 12,692 16,927 130,236 116,519 144,480 Net current assets 249,267 271,954 245,971 Non-current liabilities Long-term borrowings 8 73,341 36,310 59,473 Deferred tax liabilities 16,381 17,735 15,853 Post-retirement benefits 7 64,889 64,313 72,043 Provisions 761 140 720 Long-term payables − 598 598 155,372 119,096 148,687 Total liabilities 285,608 235,615 293,167 Net assets 407,014 475,985 403,534 Equity Share capital 19,629 19,592 19,568 Share premium account 62,351 58,347 59,954 Other reserves (7,064) 41,561 11,474 Retained earnings 331,382 355,807 311,737 Equity shareholders’ funds 406,298 475,307 402,733 Non-controlling interest 716 678 801 Total equity 407,014 475,985 403,534 Total equity and liabilities 692,622 711,600 696,701
Spirax-Sarco Engineering plc Half Year Report 201411
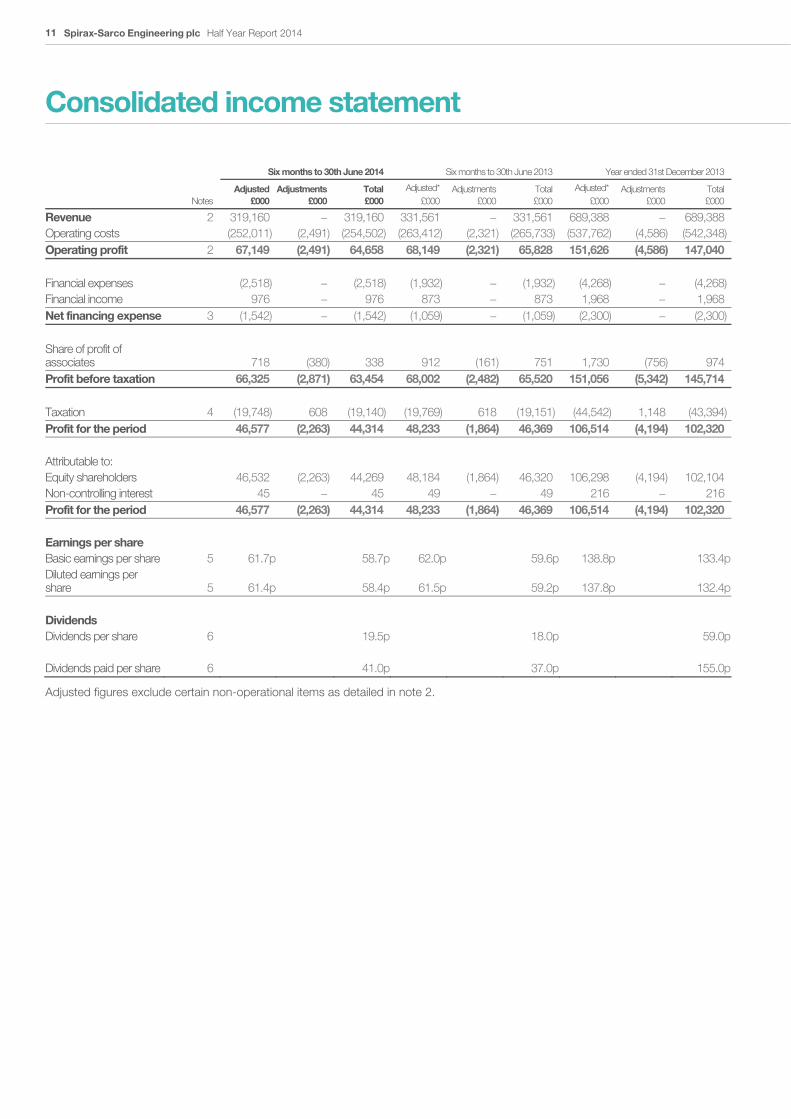
Consolidated income statement
Six months to 30th June 2014 Six months to 30th June 2013 Year ended 31st December 2013
Notes
Adjusted £000
Adjustments £000
Total£000
Adjusted* £000
Adjustments£000
Total£000
Adjusted* £000
Adjustments£000
Total£000
Revenue 2 319,160 − 319,160 331,561 − 331,561 689,388 − 689,388 Operating costs (252,011) (2,491) (254,502) (263,412) (2,321) (265,733) (537,762) (4,586) (542,348)Operating profit 2 67,149 (2,491) 64,658 68,149 (2,321) 65,828 151,626 (4,586) 147,040 Financial expenses (2,518) − (2,518) (1,932) − (1,932) (4,268) − (4,268)Financial income 976 − 976 873 − 873 1,968 − 1,968 Net financing expense 3 (1,542) − (1,542) (1,059) − (1,059) (2,300) − (2,300)
Share of profit of associates 718 (380) 338 912 (161) 751 1,730 (756) 974 Profit before taxation 66,325 (2,871) 63,454 68,002 (2,482) 65,520 151,056 (5,342) 145,714 Taxation 4 (19,748) 608 (19,140) (19,769) 618 (19,151) (44,542) 1,148 (43,394)Profit for the period 46,577 (2,263) 44,314 48,233 (1,864) 46,369 106,514 (4,194) 102,320 Attributable to: Equity shareholders 46,532 (2,263) 44,269 48,184 (1,864) 46,320 106,298 (4,194) 102,104 Non-controlling interest 45 − 45 49 − 49 216 − 216 Profit for the period 46,577 (2,263) 44,314 48,233 (1,864) 46,369 106,514 (4,194) 102,320 Earnings per share Basic earnings per share 5 61.7p 58.7p 62.0p 59.6p 138.8p 133.4pDiluted earnings per share 5 61.4p 58.4p 61.5p 59.2p 137.8p 132.4p
Dividends Dividends per share 6 19.5p 18.0p 59.0p Dividends paid per share 6 41.0p 37.0p 155.0p
Adjusted figures exclude certain non-operational items as detailed in note 2.
1. O
verv
iew
2. F
inan
cial
Sta
tem
ents
Spirax-Sarco Engineering plc Half Year Report 2014 12
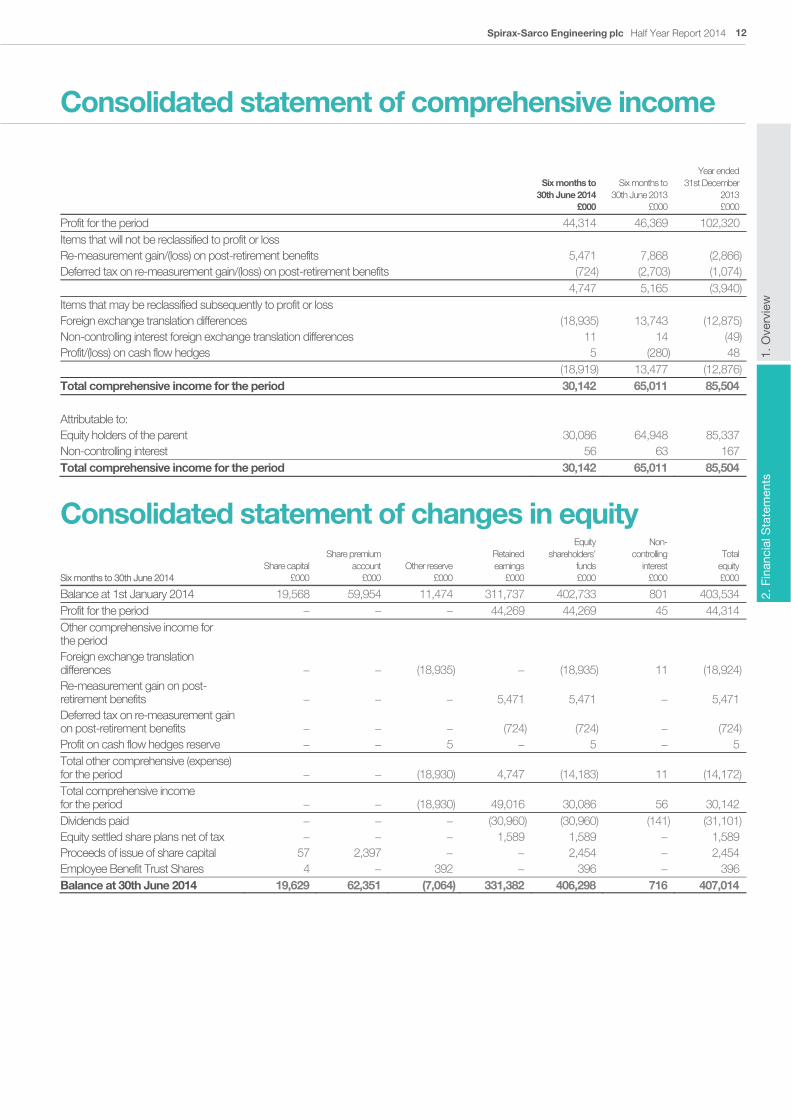
Consolidated statement of comprehensive income
Six months to 30th June 2014
£000
Six months to30th June 2013
£000
Year ended 31st December
2013£000
Profit for the period 44,314 46,369 102,320 Items that will not be reclassified to profit or loss Re-measurement gain/(loss) on post-retirement benefits 5,471 7,868 (2,866)Deferred tax on re-measurement gain/(loss) on post-retirement benefits (724) (2,703) (1,074) 4,747 5,165 (3,940)Items that may be reclassified subsequently to profit or loss Foreign exchange translation differences (18,935) 13,743 (12,875)Non-controlling interest foreign exchange translation differences 11 14 (49)Profit/(loss) on cash flow hedges 5 (280) 48 (18,919) 13,477 (12,876)Total comprehensive income for the period 30,142 65,011 85,504 Attributable to: Equity holders of the parent 30,086 64,948 85,337 Non-controlling interest 56 63 167 Total comprehensive income for the period 30,142 65,011 85,504
Consolidated statement of changes in equity
Six months to 30th June 2014 Share capital
£000
Share premium account
£000 Other reserve
£000
Retained earnings
£000
Equity shareholders’
funds £000
Non-controlling
interest£000
Totalequity£000
Balance at 1st January 2014 19,568 59,954 11,474 311,737 402,733 801 403,534 Profit for the period − − − 44,269 44,269 45 44,314 Other comprehensive income for the period Foreign exchange translation differences − − (18,935) − (18,935) 11 (18,924)Re-measurement gain on post-retirement benefits − − − 5,471 5,471 − 5,471 Deferred tax on re-measurement gain on post-retirement benefits − − − (724) (724) − (724)Profit on cash flow hedges reserve − − 5 − 5 − 5 Total other comprehensive (expense) for the period − − (18,930) 4,747 (14,183) 11 (14,172)Total comprehensive income for the period − − (18,930) 49,016 30,086 56 30,142 Dividends paid − − − (30,960) (30,960) (141) (31,101)Equity settled share plans net of tax − − − 1,589 1,589 − 1,589 Proceeds of issue of share capital 57 2,397 − − 2,454 − 2,454 Employee Benefit Trust Shares 4 − 392 − 396 − 396 Balance at 30th June 2014 19,629 62,351 (7,064) 331,382 406,298 716 407,014
Spirax-Sarco Engineering plc Half Year Report 201413
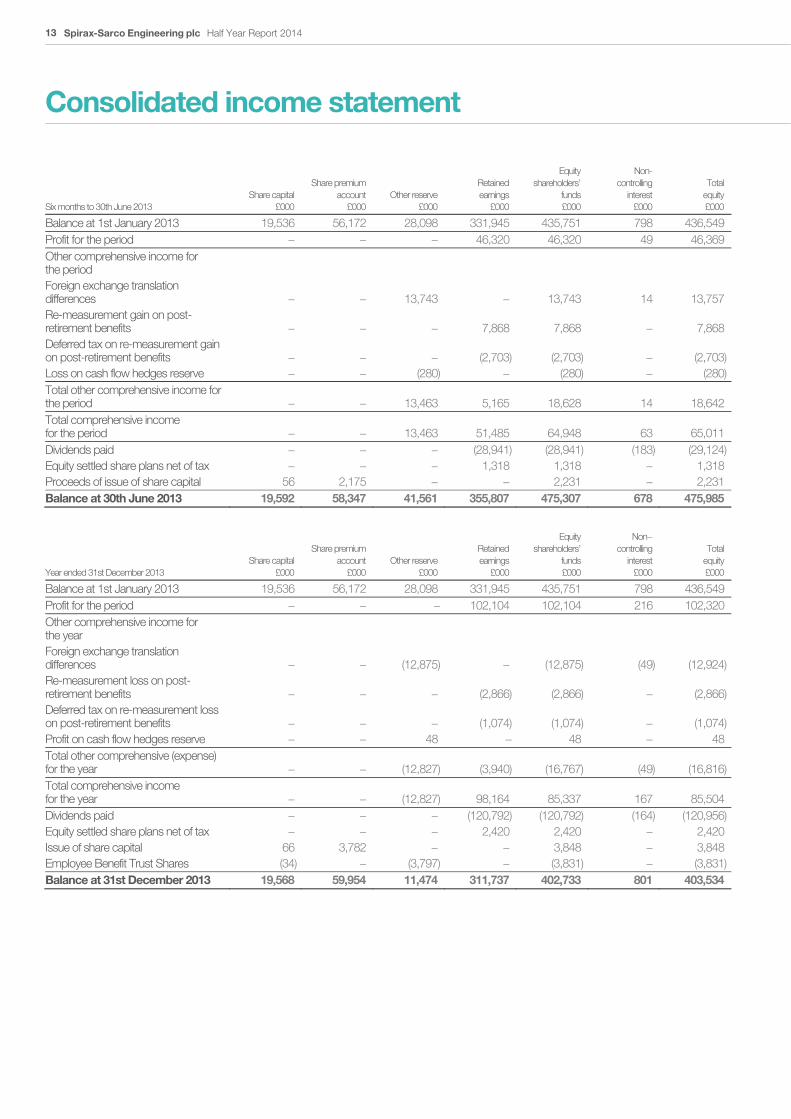
Consolidated income statement
Six months to 30th June 2013 Share capital
£000
Share premium account
£000 Other reserve
£000
Retained earnings
£000
Equity shareholders’
funds £000
Non- controlling
interest £000
Totalequity£000
Balance at 1st January 2013 19,536 56,172 28,098 331,945 435,751 798 436,549 Profit for the period − − − 46,320 46,320 49 46,369 Other comprehensive income for the period Foreign exchange translation differences − − 13,743 − 13,743 14 13,757 Re-measurement gain on post-retirement benefits − − − 7,868 7,868 − 7,868 Deferred tax on re-measurement gain on post-retirement benefits − − − (2,703) (2,703) − (2,703)Loss on cash flow hedges reserve − − (280) − (280) − (280)Total other comprehensive income for the period − − 13,463 5,165 18,628 14 18,642 Total comprehensive income for the period − − 13,463 51,485 64,948 63 65,011 Dividends paid − − − (28,941) (28,941) (183) (29,124)Equity settled share plans net of tax − − − 1,318 1,318 − 1,318 Proceeds of issue of share capital 56 2,175 − − 2,231 − 2,231 Balance at 30th June 2013 19,592 58,347 41,561 355,807 475,307 678 475,985
Year ended 31st December 2013 Share capital
£000
Share premium account
£000 Other reserve
£000
Retained earnings
£000
Equity shareholders’
funds £000
Non− controlling
interest £000
Totalequity£000
Balance at 1st January 2013 19,536 56,172 28,098 331,945 435,751 798 436,549 Profit for the period − − − 102,104 102,104 216 102,320 Other comprehensive income for the year Foreign exchange translation differences − − (12,875) − (12,875) (49) (12,924)Re-measurement loss on post-retirement benefits − − − (2,866) (2,866) − (2,866)Deferred tax on re-measurement loss on post-retirement benefits − − − (1,074) (1,074) − (1,074)Profit on cash flow hedges reserve − − 48 − 48 − 48 Total other comprehensive (expense) for the year − − (12,827) (3,940) (16,767) (49) (16,816)Total comprehensive income for the year − − (12,827) 98,164 85,337 167 85,504 Dividends paid − − − (120,792) (120,792) (164) (120,956)Equity settled share plans net of tax − − − 2,420 2,420 − 2,420 Issue of share capital 66 3,782 − − 3,848 − 3,848 Employee Benefit Trust Shares (34) − (3,797) − (3,831) − (3,831)Balance at 31st December 2013 19,568 59,954 11,474 311,737 402,733 801 403,534

1. O
verv
iew
2. F
inan
cial
Sta
tem
ents
Spirax-Sarco Engineering plc Half Year Report 2014 14
Cash flow statement
Notes
30th June 2014 £000
30th June2013£000
31st December 2013£000
Cash flows from operating activities Profit before taxation 63,454 65,520 145,714 Depreciation, amortisation and impairment 13,207 13,749 26,678 Share of profit of associates (338) (751) (974)Equity settled share plans 1,795 1,748 3,315 Net finance expense 1,542 1,059 2,300 Operating cash flow before changes in working capital and provisions 79,660 81,325 177,033 Change in trade and other receivables 8,751 (4,152) (8,704)Change in inventories (9,771) (3,184) (3,573)Change in provisions and post−retirement benefits (2,645) (3,943) (6,985)Change in trade and other payables (6,097) (2,613) 3,309 Cash generated from operations 69,898 67,433 161,080 Interest paid (1,120) (600) (1,551)Income taxes paid (24,449) (22,076) (42,318)Net cash from operating activities 44,329 44,757 117,211 Cash flows from investing activities Purchase of property, plant and equipment (16,517) (10,612) (20,451)Proceeds from sale of property, plant and equipment 793 721 1,777 Purchase of software and other intangibles (2,069) (3,073) (5,240)Development expenditure capitalised (891) (534) (2,779)Acquisition of businesses (9,087) (3,997) (5,601)Bank deposits − − (32,901)Interest received 976 873 1,968 Dividends received − − 964 Net cash used in investing activities (26,795) (16,622) (62,263) Cash flows from financing activities Proceeds from issue of share capital 2,454 2,231 3,848 Employee Benefit Trust Share purchase − − (4,430)Repaid borrowings 8 (1,703) (8,248) (4,383)New borrowings 8 11,000 1,370 57,506 Change in finance lease liabilities 8 (96) 319 (353)Dividends paid (including minorities) (31,101) (29,124) (120,956)Net cash used in financing activities (19,446) (33,452) (68,768) Net change in cash and cash equivalents 8 (1,912) (5,317) (13,820)Cash and cash equivalents at beginning of period 8 82,608 99,445 99,445 Exchange movement 8 (5,061) 4,573 (3,017)Cash and cash equivalents at end of period 8 75,635 98,701 82,608 Bank deposits 8 31,103 − 32,901 Borrowings and finance leases 8 (108,267) (41,336) (99,109)Net (debt)/cash at the end of period 8 (1,529) 57,365 16,400
Spirax-Sarco Engineering plc Half Year Report 201415
Notes to the accounts
1 Basis of preparation Spirax-Sarco Engineering plc is a company domiciled in the UK. The half year condensed consolidated financial statements of Spirax-Sarco Engineering plc and its subsidiaries (the ‘Group’) have been prepared in accordance with IAS 34 Interim Financial Reporting as adopted by the EU. The accounting policies applied are consistent with those set out in the 2013 Spirax-Sarco Engineering plc Annual Report.
These condensed consolidated half year financial statements do not include all the information required for full annual statements and should be read in conjunction with the 2013 Annual Report. The comparative figures for the year ended 31st December 2013 do not constitute the Group’s statutory accounts for that financial year as defined in section 434 of the Companies Act 2006. The consolidated statutory accounts for Spirax-Sarco Engineering plc in respect of the year ended 31st December 2013 have been reported on by the Company’s former auditors and delivered to the registrar of companies. The report of the auditors was (i) unqualified, (ii) did not include a reference to any matters to which the auditors drew attention by way of emphasis without qualifying their report, and (iii) did not contain a statement under section 498 (2) or (3) of the Companies Act 2006.
The consolidated financial statements of the Group in respect of the year ended December 2013 are available upon request from Mr A J Robson, General Counsel and Company Secretary, Charlton House, Cheltenham, Gloucestershire, GL53 8ER, United Kingdom or on www.spiraxsarcoengineering.com
The financial statements for the six months ended 30th June 2014, which have not been audited or reviewed by the auditors, were authorised by the Board on 6th August 2014.
The interim report has been prepared solely to provide additional information to shareholders as a body to assess the Group’s strategies and the potential for those strategies to succeed. This interim report should not be relied upon by any other party or for any other purpose.
Going concern Having made enquiries and reviewed the Group’s plans and available financial facilities, the Board has a reasonable expectation that the Group has adequate resources to continue its operational existence for the foreseeable future. For this reason, it continues to adopt the going concern basis in preparing the condensed consolidated financial statements. There are no key sensitivities identified in relation to this conclusion.
New standards and interpretations not yet adopted There are a number of new standards, amendments to standards and interpretations that are not yet effective for the period ended 30th June 2014 and have, therefore, not been applied in preparing these condensed consolidated interim financial statements. None of these are anticipated to have a significant impact on the consolidated income statement or consolidated statement of financial position.
Significant accounting judgements and estimates The preparation of interim financial statements in conformity with adopted IFRS requires management to make judgements, estimates and assumptions that affect the application of accounting policies and the reported amount of assets and liabilities, income and expense. Actual results may differ from these estimates. In preparing these condensed consolidated interim financial statements, the significant judgements made by management in applying the Group’s accounting policies and the key sources of estimation uncertainty were the same as those that applied to the consolidated financial statements for the year ended 31st December 2013.
The Directors have considered the facts and circumstances as at 30th June 2014 and concluded that there are no indicators of impairments that require an impairment review to be undertaken on goodwill at the interim statement of financial position date. The annual impairment review will be undertaken later in 2014 consistent with the timing in previous years.
Cautionary statements This interim report contains forward-looking statements. These have been made by the Directors in good faith based on the information available to them up to the time of their approval of this report. The Directors can give no assurance that these expectations will prove to have been correct. Due to the inherent uncertainties, including both economic and business risk factors underlying such forward-looking information, actual results may differ materially from those expressed or implied by these forward-looking statements. The Directors undertake no obligation to update any forward-looking statements, whether as a result of new information, future events, or otherwise.
Responsibility statement The Directors confirm that to the best of their knowledge:
This financial information has been prepared in accordance with IAS 34 Interim Financial Reporting as adopted by the EU
The interim management report includes a fair review of the information required by:
DTR 4.2.7R of the Disclosure and Transparency Rules, being an indication of important events that have occurred during the first six months of the financial year and their impact on the condensed financial statements, and a description of the principal risks and uncertainties for the remaining six months of the financial year.
DTR 4.2.8R of the Disclosure and Transparency Rules, being related party transactions that have taken place in the first six months of the current financial year that have materially affected the financial position or performance of the entity during that period, and any changes in the related party transactions described in the last Annual Report that could do so.
1. O
verv
iew
2. F
inan
cial
Sta
tem
ents
Spirax-Sarco Engineering plc Half Year Report 2014 16
Notes to the accounts continued
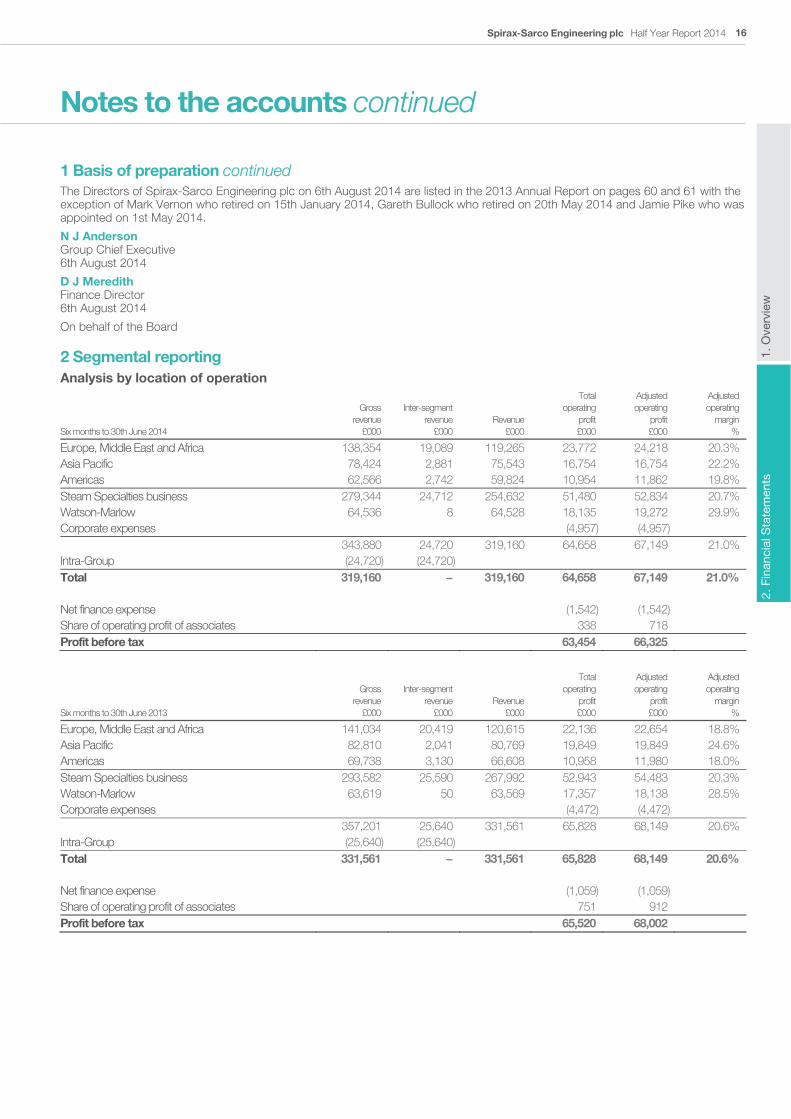
1 Basis of preparation continued The Directors of Spirax-Sarco Engineering plc on 6th August 2014 are listed in the 2013 Annual Report on pages 60 and 61 with the exception of Mark Vernon who retired on 15th January 2014, Gareth Bullock who retired on 20th May 2014 and Jamie Pike who was appointed on 1st May 2014.
N J Anderson Group Chief Executive 6th August 2014
D J Meredith Finance Director 6th August 2014
On behalf of the Board
2 Segmental reporting Analysis by location of operation
Six months to 30th June 2014
Gross revenue
£000
Inter-segmentrevenue
£000 Revenue
£000
Total operating
profit £000
Adjustedoperating
profit£000
Adjusted operating
margin%
Europe, Middle East and Africa 138,354 19,089 119,265 23,772 24,218 20.3% Asia Pacific 78,424 2,881 75,543 16,754 16,754 22.2% Americas 62,566 2,742 59,824 10,954 11,862 19.8% Steam Specialties business 279,344 24,712 254,632 51,480 52,834 20.7% Watson-Marlow 64,536 8 64,528 18,135 19,272 29.9% Corporate expenses (4,957) (4,957) 343,880 24,720 319,160 64,658 67,149 21.0% Intra-Group (24,720) (24,720) Total 319,160 − 319,160 64,658 67,149 21.0% Net finance expense (1,542) (1,542) Share of operating profit of associates 338 718 Profit before tax 63,454 66,325
Six months to 30th June 2013
Gross revenue
£000
Inter-segmentrevenue
£000 Revenue
£000
Total operating
profit £000
Adjustedoperating
profit£000
Adjusted operating
margin%
Europe, Middle East and Africa 141,034 20,419 120,615 22,136 22,654 18.8% Asia Pacific 82,810 2,041 80,769 19,849 19,849 24.6% Americas 69,738 3,130 66,608 10,958 11,980 18.0% Steam Specialties business 293,582 25,590 267,992 52,943 54,483 20.3% Watson-Marlow 63,619 50 63,569 17,357 18,138 28.5% Corporate expenses (4,472) (4,472) 357,201 25,640 331,561 65,828 68,149 20.6% Intra-Group (25,640) (25,640) Total 331,561 − 331,561 65,828 68,149 20.6% Net finance expense (1,059) (1,059) Share of operating profit of associates 751 912 Profit before tax 65,520 68,002
Spirax-Sarco Engineering plc Half Year Report 201417
Notes to the accounts continued
2 Segmental reporting continued
Year ended 31st December 2013
Gross revenue
£000
Inter-segmentrevenue
£000 Revenue
£000
Total operating
profit £000
Adjusted operating
profit £000
Adjusted operating
margin%
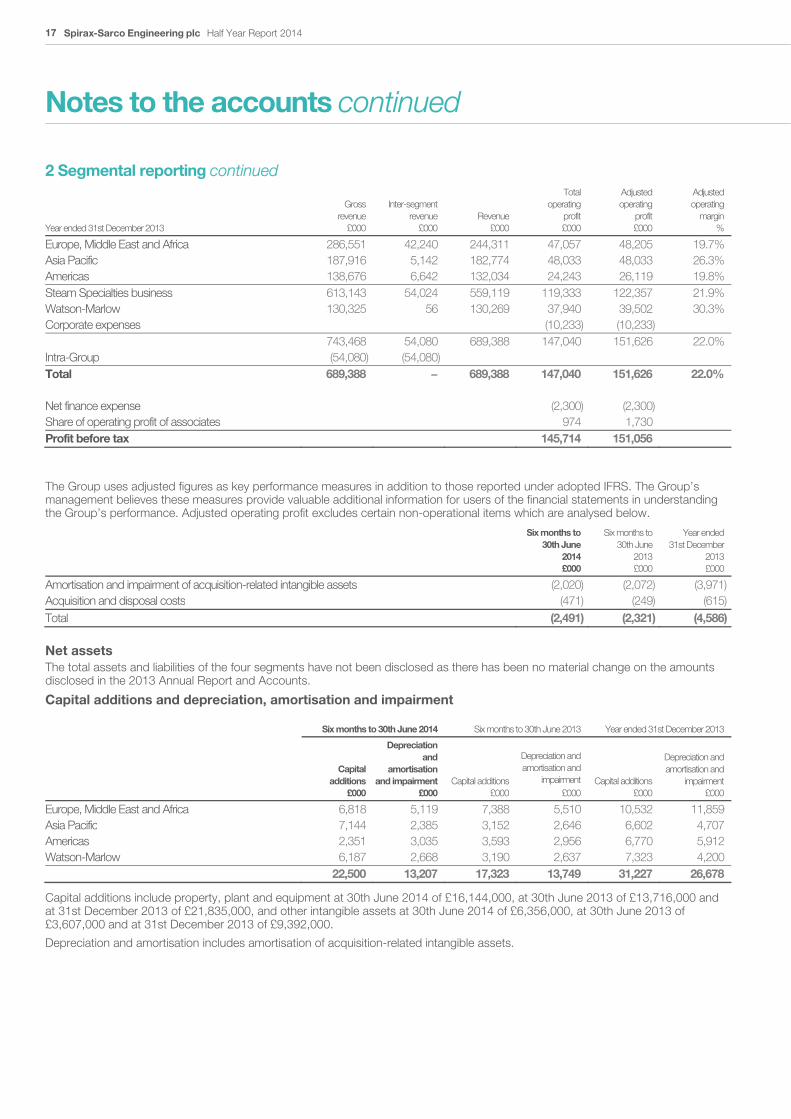
Europe, Middle East and Africa 286,551 42,240 244,311 47,057 48,205 19.7% Asia Pacific 187,916 5,142 182,774 48,033 48,033 26.3% Americas 138,676 6,642 132,034 24,243 26,119 19.8% Steam Specialties business 613,143 54,024 559,119 119,333 122,357 21.9% Watson-Marlow 130,325 56 130,269 37,940 39,502 30.3% Corporate expenses (10,233) (10,233) 743,468 54,080 689,388 147,040 151,626 22.0% Intra-Group (54,080) (54,080) Total 689,388 − 689,388 147,040 151,626 22.0% Net finance expense (2,300) (2,300) Share of operating profit of associates 974 1,730 Profit before tax 145,714 151,056
The Group uses adjusted figures as key performance measures in addition to those reported under adopted IFRS. The Group’s management believes these measures provide valuable additional information for users of the financial statements in understanding the Group’s performance. Adjusted operating profit excludes certain non-operational items which are analysed below.
Six months to 30th June
2014 £000
Six months to 30th June
2013 £000
Year ended 31st December
2013£000
Amortisation and impairment of acquisition-related intangible assets (2,020) (2,072) (3,971)Acquisition and disposal costs (471) (249) (615)Total (2,491) (2,321) (4,586)
Net assets The total assets and liabilities of the four segments have not been disclosed as there has been no material change on the amounts disclosed in the 2013 Annual Report and Accounts.
Capital additions and depreciation, amortisation and impairment
Six months to 30th June 2014 Six months to 30th June 2013 Year ended 31st December 2013
Capitaladditions
£000
Depreciation and
amortisation and impairment
£000 Capital additions
£000
Depreciation and amortisation and
impairment £000
Capital additions £000
Depreciation and amortisation and
impairment£000
Europe, Middle East and Africa 6,818 5,119 7,388 5,510 10,532 11,859 Asia Pacific 7,144 2,385 3,152 2,646 6,602 4,707 Americas 2,351 3,035 3,593 2,956 6,770 5,912 Watson-Marlow 6,187 2,668 3,190 2,637 7,323 4,200 22,500 13,207 17,323 13,749 31,227 26,678
Capital additions include property, plant and equipment at 30th June 2014 of £16,144,000, at 30th June 2013 of £13,716,000 and at 31st December 2013 of £21,835,000, and other intangible assets at 30th June 2014 of £6,356,000, at 30th June 2013 of £3,607,000 and at 31st December 2013 of £9,392,000.
Depreciation and amortisation includes amortisation of acquisition-related intangible assets.
1. O
verv
iew
2. F
inan
cial
Sta
tem
ents
Spirax-Sarco Engineering plc Half Year Report 2014 18
Notes to the accounts continued
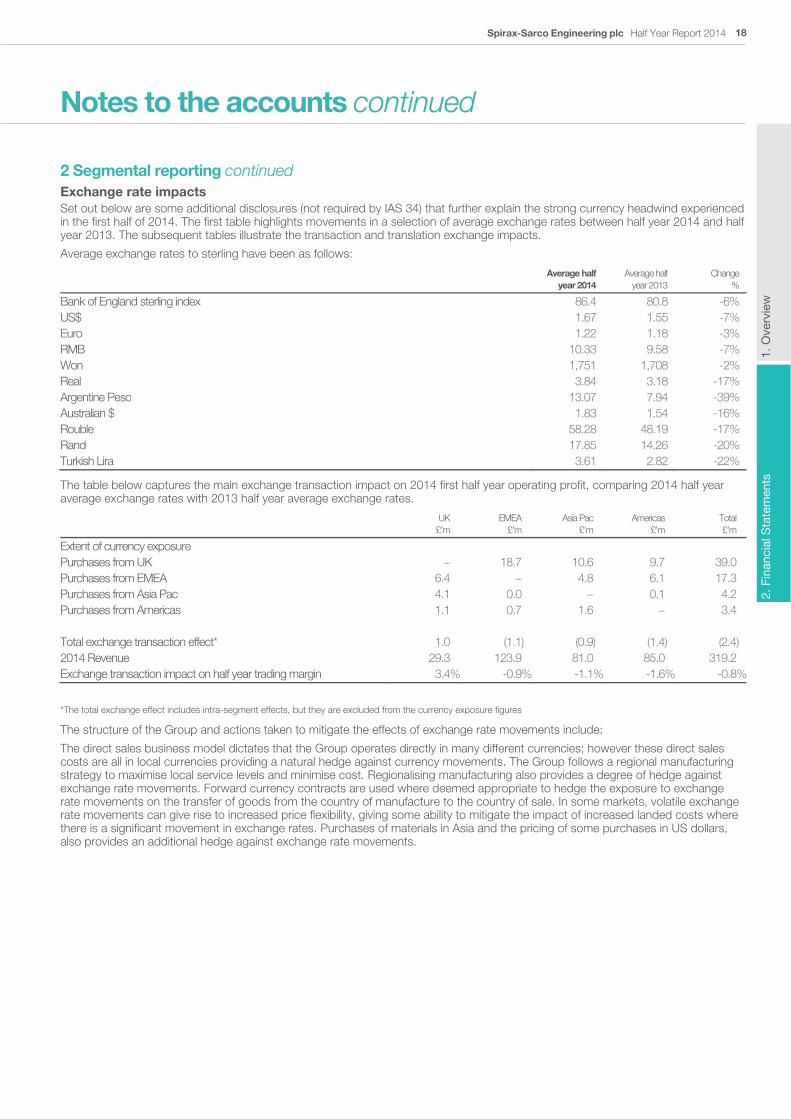
2 Segmental reporting continued Exchange rate impacts Set out below are some additional disclosures (not required by IAS 34) that further explain the strong currency headwind experienced in the first half of 2014. The first table highlights movements in a selection of average exchange rates between half year 2014 and half year 2013. The subsequent tables illustrate the transaction and translation exchange impacts.
Average exchange rates to sterling have been as follows:
Average half
year 2014 Average half
year 2013 Change
%
Bank of England sterling index 86.4 80.8 -6% US$ 1.67 1.55 -7% Euro 1.22 1.18 -3% RMB 10.33 9.58 -7% Won 1,751 1,708 -2% Real 3.84 3.18 -17% Argentine Peso 13.07 7.94 -39% Australian $ 1.83 1.54 -16% Rouble 58.28 48.19 -17% Rand 17.85 14.26 -20% Turkish Lira 3.61 2.82 -22%
The table below captures the main exchange transaction impact on 2014 first half year operating profit, comparing 2014 half year average exchange rates with 2013 half year average exchange rates.
UK £’m
EMEA £’m
Asia Pac £’m
Americas £’m
Total £’m
Extent of currency exposure Purchases from UK − 18.7 10.6 9.7 39.0 Purchases from EMEA 6.4 − 4.8 6.1 17.3 Purchases from Asia Pac 4.1 0.0 − 0.1 4.2 Purchases from Americas 1.1 0.7 1.6 − 3.4 Total exchange transaction effect* 1.0 (1.1) (0.9) (1.4) (2.4) 2014 Revenue 29.3 123.9 81.0 85.0 319.2 Exchange transaction impact on half year trading margin 3.4% -0.9% -1.1% -1.6% -0.8%
*The total exchange effect includes intra-segment effects, but they are excluded from the currency exposure figures
The structure of the Group and actions taken to mitigate the effects of exchange rate movements include:
The direct sales business model dictates that the Group operates directly in many different currencies; however these direct sales costs are all in local currencies providing a natural hedge against currency movements. The Group follows a regional manufacturing strategy to maximise local service levels and minimise cost. Regionalising manufacturing also provides a degree of hedge against exchange rate movements. Forward currency contracts are used where deemed appropriate to hedge the exposure to exchange rate movements on the transfer of goods from the country of manufacture to the country of sale. In some markets, volatile exchange rate movements can give rise to increased price flexibility, giving some ability to mitigate the impact of increased landed costs where there is a significant movement in exchange rates. Purchases of materials in Asia and the pricing of some purchases in US dollars, also provides an additional hedge against exchange rate movements.
Spirax-Sarco Engineering plc Half Year Report 201419
Notes to the accounts continued
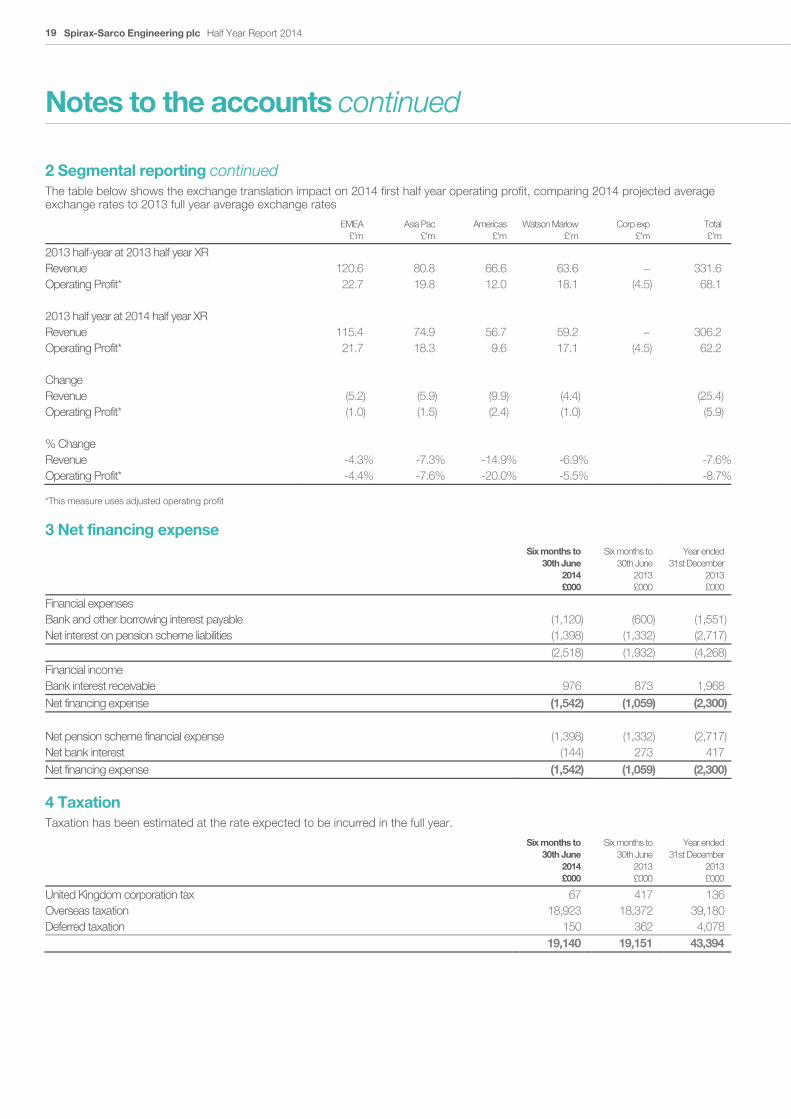
2 Segmental reporting continued The table below shows the exchange translation impact on 2014 first half year operating profit, comparing 2014 projected average exchange rates to 2013 full year average exchange rates
EMEA
£’m Asia Pac
£’m Americas
£’m Watson Marlow
£’m Corp exp
£’m Total £’m
2013 half-year at 2013 half year XR Revenue 120.6 80.8 66.6 63.6 − 331.6 Operating Profit* 22.7 19.8 12.0 18.1 (4.5) 68.1 2013 half year at 2014 half year XR Revenue 115.4 74.9 56.7 59.2 − 306.2 Operating Profit* 21.7 18.3 9.6 17.1 (4.5) 62.2 Change Revenue (5.2) (5.9) (9.9) (4.4) (25.4) Operating Profit* (1.0) (1.5) (2.4) (1.0) (5.9) % Change Revenue -4.3% -7.3% -14.9% -6.9% -7.6%Operating Profit* -4.4% -7.6% -20.0% -5.5% -8.7%
*This measure uses adjusted operating profit
3 Net financing expense
Six months to 30th June
2014 £000
Six months to 30th June
2013 £000
Year ended31st December
2013£000
Financial expenses Bank and other borrowing interest payable (1,120) (600) (1,551)Net interest on pension scheme liabilities (1,398) (1,332) (2,717) (2,518) (1,932) (4,268)Financial income Bank interest receivable 976 873 1,968 Net financing expense (1,542) (1,059) (2,300) Net pension scheme financial expense (1,398) (1,332) (2,717)Net bank interest (144) 273 417 Net financing expense (1,542) (1,059) (2,300)
4 Taxation Taxation has been estimated at the rate expected to be incurred in the full year.
Six months to 30th June
2014 £000
Six months to 30th June
2013 £000
Year ended31st December
2013£000
United Kingdom corporation tax 67 417 136 Overseas taxation 18,923 18,372 39,180 Deferred taxation 150 362 4,078 19,140 19,151 43,394
1. O
verv
iew
2. F
inan
cial
Sta
tem
ents
Spirax-Sarco Engineering plc Half Year Report 2014 20
Notes to the accounts continued
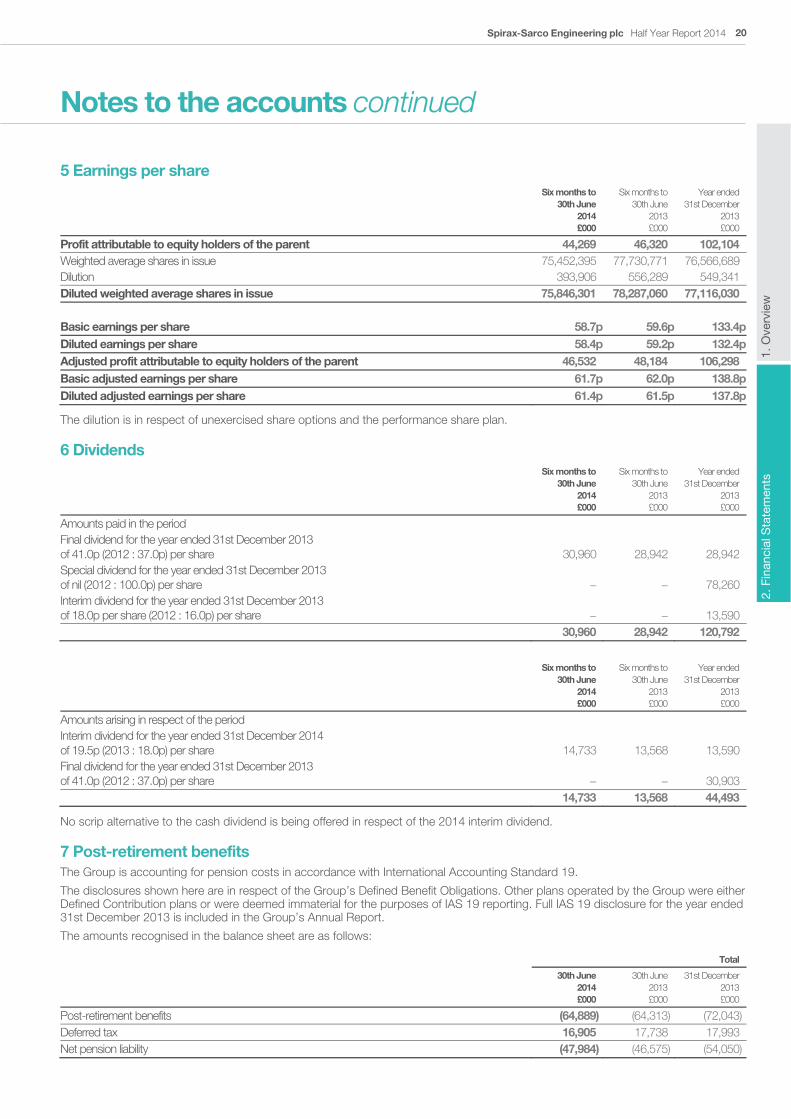
5 Earnings per share
Six months to 30th June
2014 £000
Six months to 30th June
2013 £000
Year ended31st December
2013£000
Profit attributable to equity holders of the parent 44,269 46,320 102,104 Weighted average shares in issue 75,452,395 77,730,771 76,566,689 Dilution 393,906 556,289 549,341 Diluted weighted average shares in issue 75,846,301 78,287,060 77,116,030 Basic earnings per share 58.7p 59.6p 133.4pDiluted earnings per share 58.4p 59.2p 132.4pAdjusted profit attributable to equity holders of the parent 46,532 48,184 106,298 Basic adjusted earnings per share 61.7p 62.0p 138.8pDiluted adjusted earnings per share 61.4p 61.5p 137.8p
The dilution is in respect of unexercised share options and the performance share plan.
6 Dividends
Six months to 30th June
2014 £000
Six months to 30th June
2013£000
Year ended31st December
2013£000
Amounts paid in the period Final dividend for the year ended 31st December 2013 of 41.0p (2012 : 37.0p) per share 30,960 28,942 28,942 Special dividend for the year ended 31st December 2013 of nil (2012 : 100.0p) per share − − 78,260 Interim dividend for the year ended 31st December 2013 of 18.0p per share (2012 : 16.0p) per share − − 13,590 30,960 28,942 120,792
Six months to 30th June
2014 £000
Six months to 30th June
2013£000
Year ended31st December
2013£000
Amounts arising in respect of the period Interim dividend for the year ended 31st December 2014 of 19.5p (2013 : 18.0p) per share 14,733 13,568 13,590 Final dividend for the year ended 31st December 2013 of 41.0p (2012 : 37.0p) per share − − 30,903
14,733 13,568 44,493
No scrip alternative to the cash dividend is being offered in respect of the 2014 interim dividend.
7 Post-retirement benefits The Group is accounting for pension costs in accordance with International Accounting Standard 19.
The disclosures shown here are in respect of the Group’s Defined Benefit Obligations. Other plans operated by the Group were either Defined Contribution plans or were deemed immaterial for the purposes of IAS 19 reporting. Full IAS 19 disclosure for the year ended 31st December 2013 is included in the Group’s Annual Report.
The amounts recognised in the balance sheet are as follows:
Total
30th June 2014 £000
30th June 2013£000
31st December 2013£000
Post-retirement benefits (64,889) (64,313) (72,043)Deferred tax 16,905 17,738 17,993 Net pension liability (47,984) (46,575) (54,050)
Spirax-Sarco Engineering plc Half Year Report 201421
Notes to the accounts continued
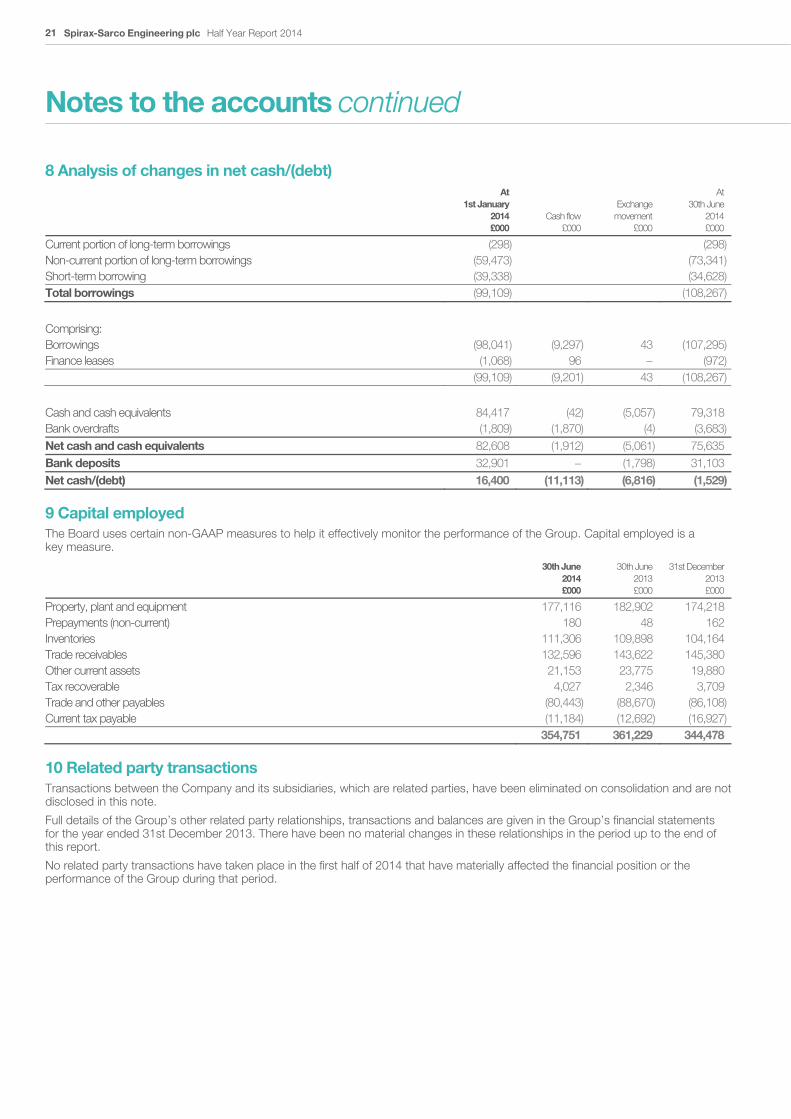
8 Analysis of changes in net cash/(debt)
At1st January
2014 £000
Cash flow £000
Exchange movement
£000
At30th June
2014£000
Current portion of long-term borrowings (298) (298)Non-current portion of long-term borrowings (59,473) (73,341)Short-term borrowing (39,338) (34,628)Total borrowings (99,109) (108,267)
Comprising: Borrowings (98,041) (9,297) 43 (107,295)Finance leases (1,068) 96 − (972) (99,109) (9,201) 43 (108,267)
Cash and cash equivalents 84,417 (42) (5,057) 79,318 Bank overdrafts (1,809) (1,870) (4) (3,683)Net cash and cash equivalents 82,608 (1,912) (5,061) 75,635 Bank deposits 32,901 − (1,798) 31,103 Net cash/(debt) 16,400 (11,113) (6,816) (1,529)
9 Capital employed The Board uses certain non-GAAP measures to help it effectively monitor the performance of the Group. Capital employed is a key measure.
30th June 2014 £000
30th June 2013 £000
31st December 2013£000
Property, plant and equipment 177,116 182,902 174,218 Prepayments (non-current) 180 48 162 Inventories 111,306 109,898 104,164 Trade receivables 132,596 143,622 145,380 Other current assets 21,153 23,775 19,880 Tax recoverable 4,027 2,346 3,709 Trade and other payables (80,443) (88,670) (86,108)Current tax payable (11,184) (12,692) (16,927) 354,751 361,229 344,478
10 Related party transactions Transactions between the Company and its subsidiaries, which are related parties, have been eliminated on consolidation and are not disclosed in this note.
Full details of the Group’s other related party relationships, transactions and balances are given in the Group’s financial statements for the year ended 31st December 2013. There have been no material changes in these relationships in the period up to the end of this report.
No related party transactions have taken place in the first half of 2014 that have materially affected the financial position or the performance of the Group during that period.
1. O
verv
iew
2. F
inan
cial
Sta
tem
ents
Spirax-Sarco Engineering plc Half Year Report 2014 22
Notes to the accounts continued
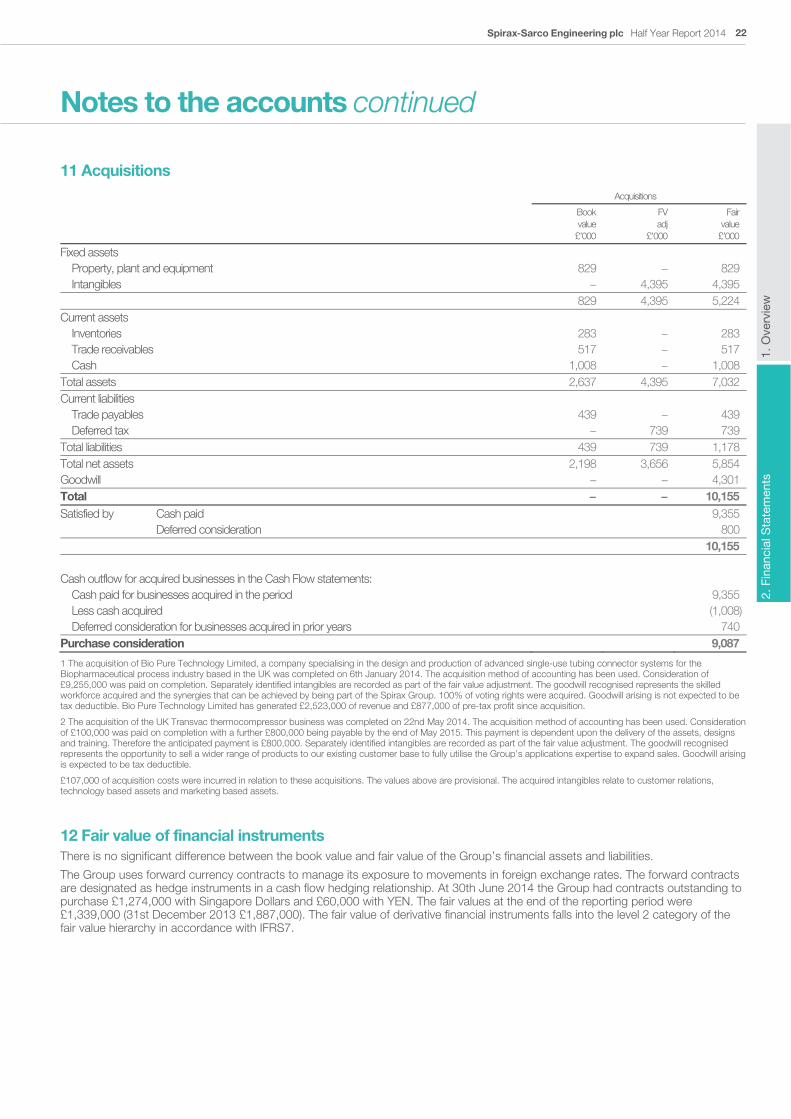
11 Acquisitions Acquisitions
Book value £’000
FV adj
£’000
Fairvalue
£’000
Fixed assets Property, plant and equipment 829 − 829 Intangibles − 4,395 4,395 829 4,395 5,224 Current assets Inventories 283 − 283 Trade receivables 517 − 517 Cash 1,008 − 1,008 Total assets 2,637 4,395 7,032 Current liabilities Trade payables 439 − 439 Deferred tax − 739 739 Total liabilities 439 739 1,178 Total net assets 2,198 3,656 5,854 Goodwill − − 4,301 Total − − 10,155 Satisfied by Cash paid 9,355 Deferred consideration 800 10,155 Cash outflow for acquired businesses in the Cash Flow statements: Cash paid for businesses acquired in the period 9,355 Less cash acquired (1,008) Deferred consideration for businesses acquired in prior years 740 Purchase consideration 9,087
1 The acquisition of Bio Pure Technology Limited, a company specialising in the design and production of advanced single-use tubing connector systems for the Biopharmaceutical process industry based in the UK was completed on 6th January 2014. The acquisition method of accounting has been used. Consideration of £9,255,000 was paid on completion. Separately identified intangibles are recorded as part of the fair value adjustment. The goodwill recognised represents the skilled workforce acquired and the synergies that can be achieved by being part of the Spirax Group. 100% of voting rights were acquired. Goodwill arising is not expected to be tax deductible. Bio Pure Technology Limited has generated £2,523,000 of revenue and £877,000 of pre-tax profit since acquisition.
2 The acquisition of the UK Transvac thermocompressor business was completed on 22nd May 2014. The acquisition method of accounting has been used. Consideration of £100,000 was paid on completion with a further £800,000 being payable by the end of May 2015. This payment is dependent upon the delivery of the assets, designs and training. Therefore the anticipated payment is £800,000. Separately identified intangibles are recorded as part of the fair value adjustment. The goodwill recognised represents the opportunity to sell a wider range of products to our existing customer base to fully utilise the Group’s applications expertise to expand sales. Goodwill arising is expected to be tax deductible.
£107,000 of acquisition costs were incurred in relation to these acquisitions. The values above are provisional. The acquired intangibles relate to customer relations, technology based assets and marketing based assets.
12 Fair value of financial instruments There is no significant difference between the book value and fair value of the Group’s financial assets and liabilities.
The Group uses forward currency contracts to manage its exposure to movements in foreign exchange rates. The forward contracts are designated as hedge instruments in a cash flow hedging relationship. At 30th June 2014 the Group had contracts outstanding to purchase £1,274,000 with Singapore Dollars and £60,000 with YEN. The fair values at the end of the reporting period were £1,339,000 (31st December 2013 £1,887,000). The fair value of derivative financial instruments falls into the level 2 category of the fair value hierarchy in accordance with IFRS7.
Spirax-Sarco Engineering plc Half Year Report 201423
Officers and advisers
Secretary and registered office Mr A J Robson General Counsel and Company Secretary Spirax-Sarco Engineering plc Charlton House Cirencester Road Cheltenham Gloucestershire GL53 8ER
Telephone: 01242 521361 Facsimile: 01242 581470
www.spiraxsarcoengineering.com
Auditor Deloitte LLP
Financial advisers Bank of America Merrill Lynch Rothschild
Bankers Barclays Bank PLC
Corporate brokers Bank of America Merrill Lynch
Registrars Equiniti Aspect House Spencer Road, Lancing West Sussex, BN99 6DA
Telephone: 0871 384 2349* (UK) or +44 (0)121 415 7047 (overseas)
* Calls to this number cost 8p per minute plus network extras. Lines open 8.30 am to 5.30 pm, Monday to Friday.
www.shareview.co.uk
Solicitors Herbert Smith Freehills LLP
Allen & Overy LLP
Important dates Ordinary shares quoted ex dividend 9th October 2014
Record date for interim payment 10th October 2014
Interim dividend payable 7th November 2014
Spirax-Sarco Engineering plc
Charlton HouseCirencester RoadCheltenhamGloucestershireGL53 8ER UK
www.spiraxsarcoengineering.com