Ashiana Housing - A Shareholder Friendly Real Estate Business Model
Delivering Real Shareholder Value:Analysis of Leading Performance in the Automotive Supply Base
December 2013

© 2013 Deloitte Consulting GmbH
Introduction & Auto Industry Analysis
“Top Performers” in Total Shareholder Value Creation
Winning Themes of Top Performers and Examples
Delivering Real Shareholder Value:
Analysis of Leading Performance in the Automotive Supply Base
1 Delivering Real Shareholder Value
© 2013 Deloitte Consulting GmbH
The combined strengths and recognition as market leaders allows Deloitte and IHS to
deliver deep insights and perspectives on how suppliers can improve performance
Delivering Real Shareholder Value2
Deloitte and IHS Partnering Together to Bring Their Collective Strengths to the Table
• Largest professional services firm globally with > 200.000 professionals and $32b USD in revenues
• Recognized by independent analysts as the leader in consulting services focused on strategy, operations management, IT, HR, and financial consulting
• Unmatched ability to bring professionals from various regions and technical disciplines (e.g., tax, consulting, enterprise risk management, etc.) in serving our clients
• Global Manufacturing practice comprised of more than 750 partners and 12,000 industry professionals in over 45 countries
• Teams of automotive specialists based in critical automotive markets around the world, including Beijing, Detroit, Munich, Nagoya, Nashville, Sao Paulo, Seoul, Shanghai, Stuttgart, Sydney, Tokyo, and Torino
About Deloitte
• 6,700 professionals serving 165 countries and speaking 50 languages
• Recognized as the leader in providing macroeconomic forecasts that are the most consistently accurate in the world.
• Interconnected information, expertise and analytics across industries and workflows
• Expert insight and analysis based on comprehensive foundational information
• Deep expertise on key challenges and issues across the globe
• Best-in-class solutions across workflows and industry value chains
About IHS

© 2013 Deloitte Consulting GmbH
While shifting production capacity to Asia is ongoing, diversification, consolidation
and change of business model driven by eMobility become increasingly important
Delivering Real Shareholder Value3
Trends in European Automotive Supply Base Industry
• The propulsion segment is dominated by the trend to downsize powertrains while increasing output.
• The trend towards electrification while present, maybe somewhat overstated.
Regional shifts
Technology
Suppliers
Financing & Investing
Competition
New powertrains
•Managing capital investments will become key for suppliers due to a growing need for flexibility in production capacity and footprint
•OEMs driving global mega-platforms:‒ 70% production volume on
mega-platforms by 2020‒ Getting in on leading-edge
platforms critical for suppliers
‒ Capacity demand alignment crucial as demand patterns change
•Weak spots in the tier 2/3 level introduce risks to the value chain. Expected insolvencies will drive continued consolidation
•Suppliers beginning to develop non-automotive products in an effort to diversify
•Redefinition of mobility will give rise to new business models and competition
•Consumer demand shifts:‒ Growth patterns shifting: Smaller cars
packed with technology content, as well as different geographies
‒ Suppliers will need to adapt product portfolio to market and get global organically or inorganically
•Shifting of production capacity to Asia
• Increasing importance of strategic alliances, JVs and direct investments in emerging markets
Market development

© 2013 Deloitte Consulting GmbH
Global light vehicle output growth indicates a flatter curve until 2020 while the global
capacity utilization will continue to increase over the next 7 years
Delivering Real Shareholder Value4
0%
20%
40%
60%
80%
0
20
40
60
80
100
120
Em
erg
ing
Sh
are
Pro
du
cti
on
Mil Global LV Output
Developed Emerging Emerging %
2000
2010
2020
0% 20% 40% 60% 80% 100%
Global Segmentation
Small Mid-Size Large
Current Situation: Global Light Vehicle Output Growth 2010 - 2020
Insights
• Stronger production output growth expectations especially in the emerging markets will further reduce the European share in LV output
• However, reduction of the European share in the global LV output is expected to slow down beyond 2015
0
50
100
150
0%
20%
40%
60%
80%
100%
202020192018201720162015201420132012
Straight Uti Copy Production
Ca
pa
city
(m
io)
Util
iza
tion
ra
te
Global Capacity Utilization
© 2013 Deloitte Consulting GmbH
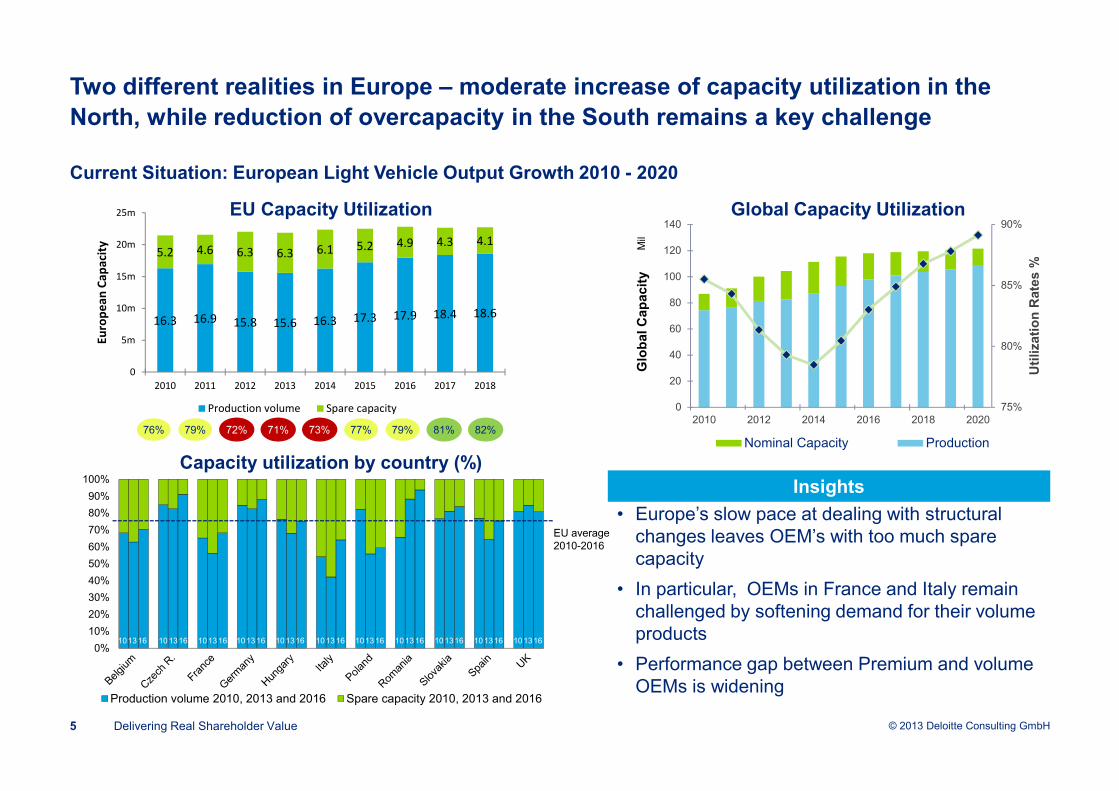
Two different realities in Europe – moderate increase of capacity utilization in the
North, while reduction of overcapacity in the South remains a key challenge
Delivering Real Shareholder Value5
75%
80%
85%
90%
0
20
40
60
80
100
120
140
2010 2012 2014 2016 2018 2020
Uti
lizati
on
Rate
s %
Glo
bal C
ap
acit
y
Nominal Capacity Production
Mil
77%76% 79% 72% 71% 73% 79% 81% 82%
16.3 16.9 15.8 15.6 16.3 17.3 17.9 18.4 18.6
5.2 4.6 6.3 6.3 6.1 5.2 4.9 4.3 4.1
0
5m
10m
15m
20m
25m
2010 2011 2012 2013 2014 2015 2016 2017 2018
Eu
rop
ea
n C
ap
aci
ty
Production volume Spare capacity
0%
10%
20%
30%
40%
50%
60%
70%
80%
90%
100%
Production volume 2010, 2013 and 2016 Spare capacity 2010, 2013 and 2016
EU average 2010-2016
1013 16 10 1316 10 13 16 1013 16 10 1316 10 13 16 1013 16 10 13 16 10 1316 10 1316 10 1316
Insights
EU Capacity Utilization Global Capacity Utilization
Capacity utilization by country (%)
• Europe’s slow pace at dealing with structural changes leaves OEM’s with too much spare capacity
• In particular, OEMs in France and Italy remain challenged by softening demand for their volume products
• Performance gap between Premium and volume OEMs is widening
Current Situation: European Light Vehicle Output Growth 2010 - 2020
© 2013 Deloitte Consulting GmbH
Delivering Real Shareholder Value:
Analysis of Leading Performance in the Automotive Supply Base
6 Delivering Real Shareholder Value
Introduction & Auto Industry Analysis
“Top Performers” in Total Shareholder Value Creation
Winning Themes of Top Performers and Examples

© 2013 Deloitte Consulting GmbH
Our study analyzed 214 suppliers globally including 18 suppliers from Germany to
identify the “Top Performers” in the Automotive supply base
Delivering Real Shareholder Value7
Objective and Scope of Study
Objective
Scope
Analyze performance of global automotive supply base to identify themes that have generated superior shareholder value (SHV) over the last decade, as well as strategic and operational levers that have helped suppliers create shareholder value
Our study analysed 214 suppliers globally (>$500M in annual revenue,>$250M for German suppliers) and focused on trends by region, segment, and size of suppliers to understand performance and drivers of shareholder value over a 10-year period (2002-2012)
Regions # Suppliers
Japan 91
Europe 48
�Germany (18)
North America 43
China/India 18
Rest of World 14
Sizes # Suppliers
>$10B 28
$5B-$10B 31
$2B-$5B 58
$1B-$2B 53
<$1B 43
Segments # Suppliers
Electronics/Electrical
31
Powertrain 75
Chassis 65
Exteriors 46
Interiors/HVAC 39

© 2013 Deloitte Consulting GmbH
A systematic approach was used to analyze SHV1 performance to identify top
performers and derive strategic and operational levers for execution
Delivering Real Shareholder Value8
Study Approach
Who are the Winners?
Ap
pro
ac
hR
es
ult
An
aly
sis
How did they perform vs. the
rest of suppliers?
What droveperformance and
what were the winning themes?
What were the strategic and
operational levers for execution?
Identification of 60"Top
Performers" of the 214
suppliers analyzed
Analyze Total Shareholder Return (TSR) performance in last 10 (2002-2012) years to identify the "Top Performers"
6 winning themes by
which ‘theme leaders’
have exceled in the
marketplace
Correlate performance drivers to superior theme execution among "Top Performers" and identify winning themes and ‘theme leaders’
Identification of strategic
and operational levers
for execution
Deep dive ‘theme leaders’ and identify strategic and operational levers they used to execute on themes
1 Shareholder Value (SHV)
Performance assessment
of regional aspects in
connection with
segmental analysis
Analyze supplier financial performance across income statement, balance sheet and capital structure metrics

© 2013 Deloitte Consulting GmbH
Auto suppliers (in scope) have outperformed their respective regional indices on TSR,
except in China / India, with the German suppliers doing very well compared to DAX
Delivering Real Shareholder Value9
Total Shareholder Return (TSR) Performance
-
200
400
600
800
1.000
2002 2003 2004 2005 2006 2007 2008 2009 2010 2011 2012
Japan
Nikkei
Suppliers
-
200
400
600
800
1.000
2002 2003 2004 2005 2006 2007 2008 2009 2010 2011 2012
Europe / Germany
Suppliers Europe
Suppliers Germany
Stoxx 50
Dax
-
200
400
600
800
1.000
2002 2003 2004 2005 2006 2007 2008 2009 2010 2011 2012
China / India
Suppliers
BSE Sensex
Hang Seng
-
200
400
600
800
1.000
2002 2003 2004 2005 2006 2007 2008 2009 2010 2011 2012
North America
Suppliers
S&P

© 2013 Deloitte Consulting GmbH
-60%
-40%
-20%
0%
20%
40%
60%
80%
020406080100120140
Suppliers1 have generated over $160 Billion in shareholder value in the last decade,
however, there is a significant value creation gap between high performers vs. others
Delivering Real Shareholder Value10
Shareholder Returns1 (2002 – 2012)
• Top publicly listed auto suppliers globally have created ~$160 billion in shareholder value over the last 10 years
• Relative to their own baseline, over a 10 year period
- The top third performers have cumulatively generated 449% in shareholder value
- The middle third have cumulatively generated 106%
- And the bottom third have destroyed 9% of the total shareholder value over the same period
• The findings imply that significant shareholder value premium has been generated by superior performance in the auto supply industry
1 10 Year Market Cap data only available for 120 suppliers; Source: Capital IQ, Deloitte Methodology
Top 1/3rdBottom 1/3rd
$89 B(449% cumulative)
($6 B)(-9%
cumulative)Middle 1/3rd
$78 B(106% cumulative)
Perc
ent M
ark
et C
ap C
hange (
2002 –
2012)
2002 Market Cap
$ 68 B $73 B $19 B
2012 Market Cap
$62 B $151 B $109 B
Change ($6 B) $78 B $89 B
Insights

© 2013 Deloitte Consulting GmbH
$275 $147
$33 $161
0
50
100
150
200
250
300
2002-2007 2007-2009 2009-2012 2002-2012
0
20
40
60
80
100
2002-2007 2007-2009 2009-2012 2002-2012
In total Automotive suppliers have recovered only 23% of the value lost during the
crisis, Top performers have recovered all of their lost market cap post-downturn
Delivering Real Shareholder Value11
Market Cap Change1 (2002 – 2012) in $ Billion
-10
0
10
20
30
40
50
60
2002-2007 2007-2009 2009-2012 2002-2012
-50
0
50
100
150
2002-2007 2007-2009 2009-2012 2002-2012
Source: Capital IQ, Deloitte Methodology
1 2009 is considered till the month of March – trough of S&P 500 Index, all other years are considered till the month of October
Pre-downturn Financial downturn
Post-downturn Overall
To
p 3
rdB
ott
om
3rd
Mid
dle
3rd
89
78
-6
• Automotive suppliers in aggregate recovered only 23% of the value lost during the financial downturn
• However, the top 3rd have recovered most of the value lost during the downturn, while the bottom third have continued to see a slight value erosion
Insights
+23%
+ 8 %
- 44 %
- 111 %

© 2013 Deloitte Consulting GmbH
0
5
10
15
20
25
NA Europe Japan China / India Rest of world
0
5
10
15
20
25
Chassis /Brakes
Powertrain Electrical /Electronics
Interiors /HVAC
Exteriors
Greater number of “Top Performers” aligned to Chassis and Powertrain, and a higher
percentage domiciled in emerging economies
12 (20%)
21 (35%)
13 (22%)
6(10%)
8(13%)
22(37%)
17(28%)
6(10%)
8(13%)
7(12%)
Total = 60
Top PerformersTotal = 60
Top Performers
Delivering Real Shareholder Value12
10%8%
18%
11%
5%7%
0%
4%
8%
12%
16%
20%
NA Germany Europe Japan China /India
Rest ofworld
InsightsShare of Top Performer from total figures
• A greater number of “Top Performers” can be found in the segments Chassis/ Breaks and Powertrain – low level of E/E top performers is surprising
• Europe hosts the most “Top Performers” followed by Japan. Nevertheless, China / India show a positive trend
Number of Suppliers by Segment and by Region
# of suppliers by segment # of suppliers by region

© 2013 Deloitte Consulting GmbH
Region Analysis: China, India and Emerging Markets suppliers with high Revenue
Growth and ROA. Germany’s major suppliers outperformed their European peers
Delivering Real Shareholder Value13
10-year Revenue Growth (CAGR) and Average ROA Performance
10 Year CAGR - Revenue Growth
Average Return on Assets (%)
-20,0%
-10,0%
0,0%
10,0%
20,0%
30,0%
40,0%
-5,0% -3,0% -1,0% 1,0% 3,0% 5,0% 7,0% 9,0% 11,0% 13,0% 15,0%
China / India Europe
NA Japan
Rest of World Germany
Insights
• Suppliers in China, India and Emerging Markets achieved higher than industry revenue growth with double-digit increases
• Japanese suppliers show comparable revenue growth with only few outliers and above average ROA figures
• US suppliers display a more fragmented picture with only a few top performers and below average overall figures
• European suppliers are centered around market averages on an overall basis with certain exceptions
• German suppliers outperformed their European peer group and excelled in the Electronics and Powertrain segments
10 Year Revenue (Median)
10 Year ROA (Median)
Japan 6.3% 8.8%
China / India 26.4% 7.8%
Europe 6.9% 6.5%
Germany 8.4% 6.8%
North America 4.6% 6.3%
RoW 21.0% 8.2%
Total 8.7% 6.3%
Source: Deloitte / IHS: „Money vs. Technology: Wie die Finanz- und Absatzkrise sowie der technologische Wandel die Zulieferwirtschaft verändern wird. Band 42: Materialien zur Automobilindustrie, VDA Verband der Automobilindustrie (2010)

© 2013 Deloitte Consulting GmbH
Segment Analysis – Powertrain: Performance of German Suppliers in comparison to
global competitors show only moderate growth level but strong ROA performance
Delivering Real Shareholder Value14
10-year Revenue Growth (CAGR) and Average ROA Performance
Insights
• Major automotive challenges in the coming decade are characterized by mandatory improvements in fuel efficiency, driven by increasingly stringent emission legislations that are impacting the Powertrain domain
• Engine downsizing, improving transmission efficiency, light-weighting, hybrid powertrains and increase engine management reliability/efficiency are the key trends being considered in the technology roadmap for the Powertrain domain
• The Powertrain segment is very attractive for future M&A activities. Overcapacity in the Powertrain domain is not estimated to be above the industry average. It is expected that M&A activity would be utilized to add to current product portfolio rather than to consolidate the market
10 Year CAGR - Revenue Growth
Average Return on Assets (%)
Source: Deloitte / IHS: „Money vs. Technology: Wie die Finanz- und Absatzkrise sowie der technologische Wandel die Zulieferwirtschaft verändern wird. Band 42: Materialien zur Automobilindustrie, VDA Verband der Automobilindustrie (2010)
© 2013 Deloitte Consulting GmbH
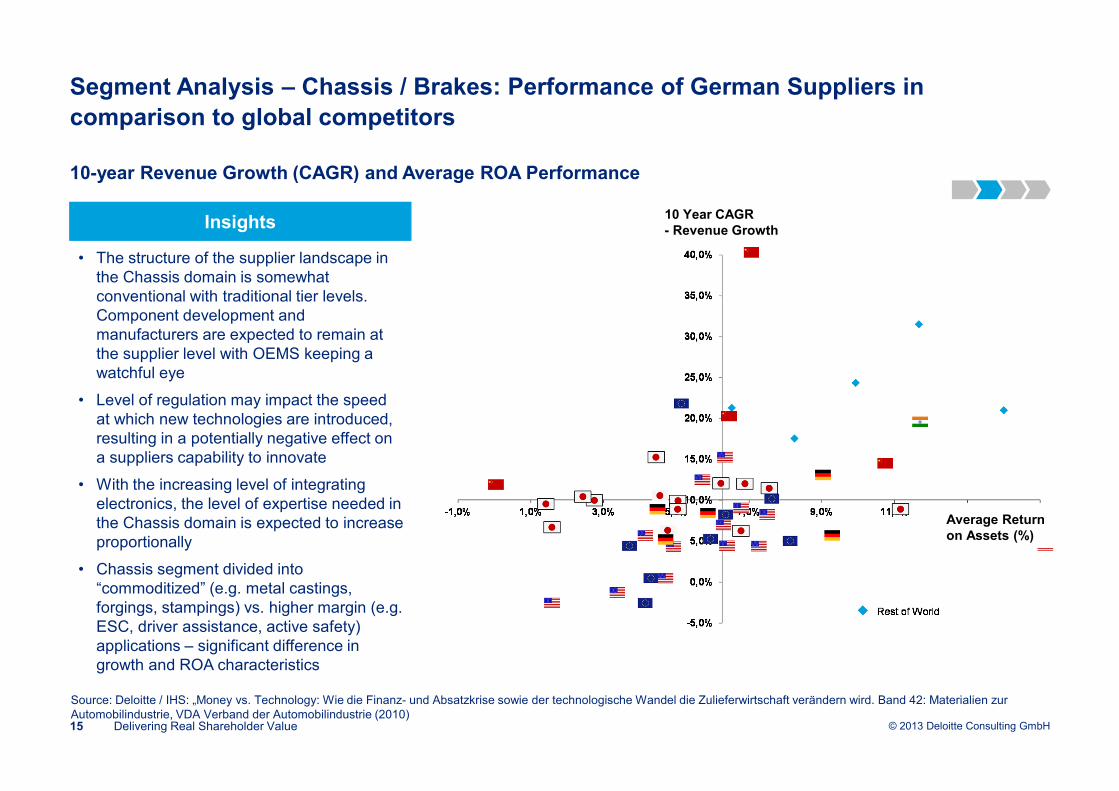
Segment Analysis – Chassis / Brakes: Performance of German Suppliers in
comparison to global competitors
Delivering Real Shareholder Value15
10-year Revenue Growth (CAGR) and Average ROA Performance
10 Year CAGR - Revenue Growth
Average Return on Assets (%)
Insights
• The structure of the supplier landscape in the Chassis domain is somewhat conventional with traditional tier levels. Component development and manufacturers are expected to remain at the supplier level with OEMS keeping a watchful eye
• Level of regulation may impact the speed at which new technologies are introduced, resulting in a potentially negative effect on a suppliers capability to innovate
• With the increasing level of integrating electronics, the level of expertise needed in the Chassis domain is expected to increase proportionally
• Chassis segment divided into “commoditized” (e.g. metal castings, forgings, stampings) vs. higher margin (e.g. ESC, driver assistance, active safety) applications – significant difference in growth and ROA characteristics
Source: Deloitte / IHS: „Money vs. Technology: Wie die Finanz- und Absatzkrise sowie der technologische Wandel die Zulieferwirtschaft verändern wird. Band 42: Materialien zur Automobilindustrie, VDA Verband der Automobilindustrie (2010)

© 2013 Deloitte Consulting GmbH
Segment Analysis – Electronics: Performance of German Suppliers in comparison to
global competitors show strong revenue growth, only second to India
Delivering Real Shareholder Value16
10-year Revenue Growth (CAGR) and Average ROA Performance
10 Year CAGR - Revenue Growth
Average Return on Assets (%)
Insights
• It is expected that about 80% of innovations will be made in electronics presenting this domain a significant potential for future growth and new innovations
• However, the ever-changing electronics world offers non- automotive suppliers the potential to enter the automotive industry triggering a higher level of competition for established suppliers
• Emergence of embedded software content creates significant disruption in the domain – new suppliers entering industry and capturing profit streams. Traditional suppliers struggling to “manage ecosystem”
• Low-cost electronics manufacturing traditionally based in Asia with local suppliers is expected to enter the European market in the short to medium term – mainly in hardware
Source: Deloitte / IHS: „Money vs. Technology: Wie die Finanz- und Absatzkrise sowie der technologische Wandel die Zulieferwirtschaft verändern wird. Band 42: Materialien zur Automobilindustrie, VDA Verband der Automobilindustrie (2010)
© 2013 Deloitte Consulting GmbH
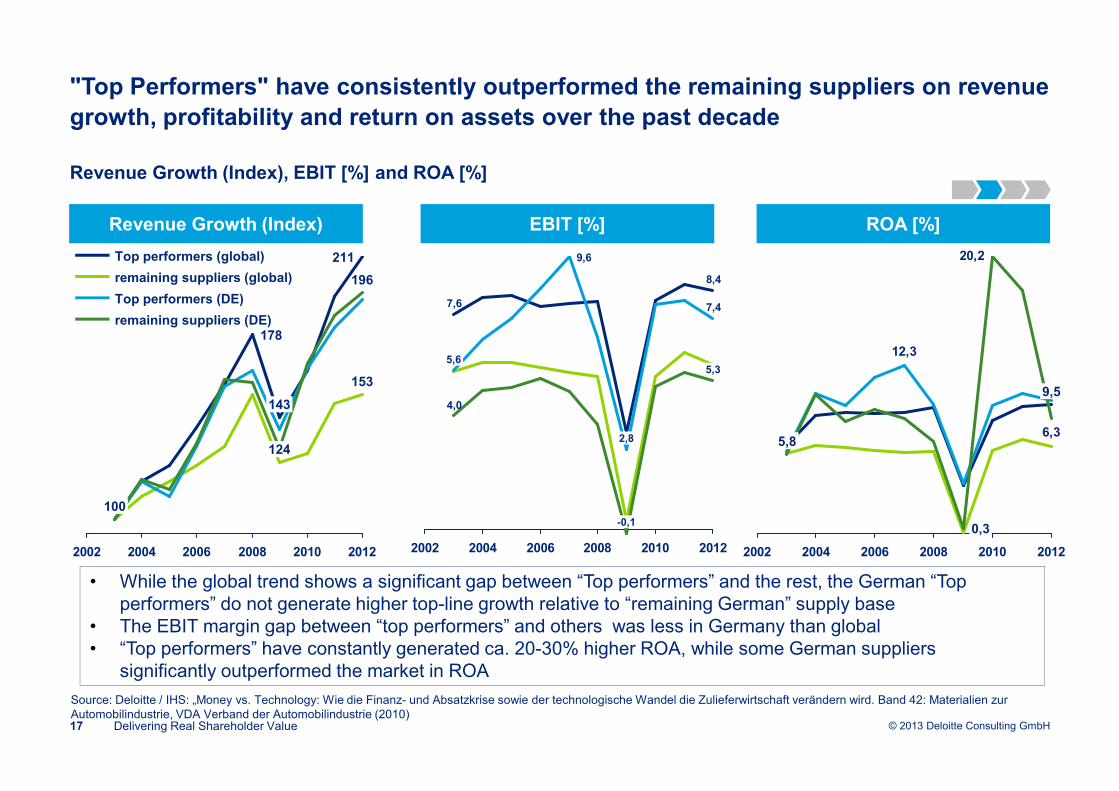
"Top Performers" have consistently outperformed the remaining suppliers on revenue
growth, profitability and return on assets over the past decade
Delivering Real Shareholder Value17
Revenue Growth (Index), EBIT [%] and ROA [%]
2002 2004 2006 2008 2010 2012
196
153
211
124
143
178
100
remaining suppliers (DE)
Top performers (DE)
remaining suppliers (global)
Top performers (global)
7,6
8,4
7,4
9,6
4,0
2002 2004 2006 2008 2010 2012
2,8
5,65,3
-0,1
6,3
12,3
20,2
2002 2004 2006 2008 2010 2012
5,95,8
9,5
0,3
Revenue Growth (Index) EBIT [%] ROA [%]
• While the global trend shows a significant gap between “Top performers” and the rest, the German “Top performers” do not generate higher top-line growth relative to “remaining German” supply base
• The EBIT margin gap between “top performers” and others was less in Germany than global• “Top performers” have constantly generated ca. 20-30% higher ROA, while some German suppliers
significantly outperformed the market in ROA
Source: Deloitte / IHS: „Money vs. Technology: Wie die Finanz- und Absatzkrise sowie der technologische Wandel die Zulieferwirtschaft verändern wird. Band 42: Materialien zur Automobilindustrie, VDA Verband der Automobilindustrie (2010)
© 2013 Deloitte Consulting GmbH
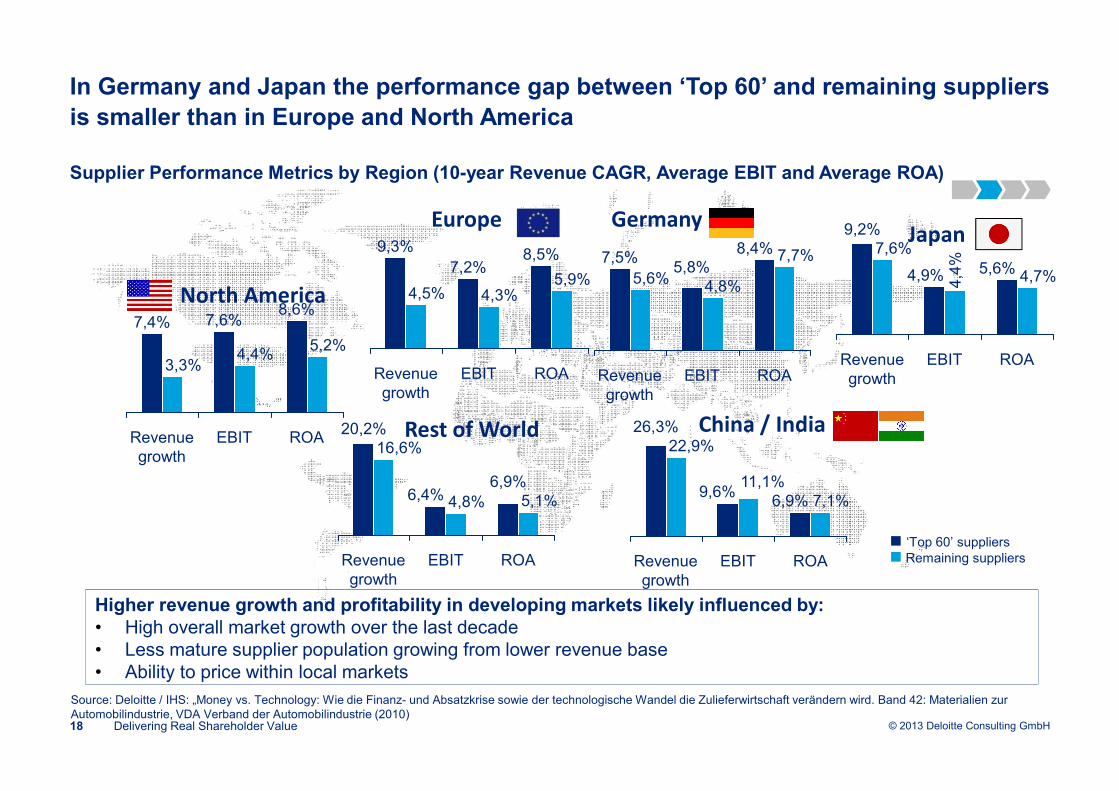
In Germany and Japan the performance gap between ‘Top 60’ and remaining suppliers
is smaller than in Europe and North America
Delivering Real Shareholder Value18
Supplier Performance Metrics by Region (10-year Revenue CAGR, Average EBIT and Average ROA)
Higher revenue growth and profitability in developing markets likely influenced by:• High overall market growth over the last decade• Less mature supplier population growing from lower revenue base• Ability to price within local markets
North America
EuropeJapan
China / IndiaRest of World
‘Top 60’ suppliersRemaining suppliers
Revenue growth
9,3%
EBIT
4,5%
7,2%
4,3%
8,5%
5,9%
ROA3,3%
7,4%
Revenue growth
7,6%
EBIT
4,4%5,2%
ROA
8,6%
4,8%
EBIT
6,9%5,1%
ROA
6,4%
Revenue growth
16,6%20,2%
ROA
4,7%5,6%
EBIT
4,4
%
4,9%
Revenue growth
7,6%9,2%
ROA
7,1%6,9%
EBIT
11,1%9,6%
Revenue growth
22,9%26,3%
Revenue growth
7,5%
EBIT
5,6%5,8%
4,8%
8,4% 7,7%
ROA
Germany
Source: Deloitte / IHS: „Money vs. Technology: Wie die Finanz- und Absatzkrise sowie der technologische Wandel die Zulieferwirtschaft verändern wird. Band 42: Materialien zur Automobilindustrie, VDA Verband der Automobilindustrie (2010)

© 2013 Deloitte Consulting GmbH
Delivering Real Shareholder Value:
Analysis of Leading Performance in the Automotive Supply Base
19 Delivering Real Shareholder Value
Introduction & Auto Industry Analysis
“Top Performers” in Total Shareholder Value Creation
Winning Themes of Top Performers and Examples

© 2013 Deloitte Consulting GmbH
Financial and operational metrics that drove superior performance among the 60 “Top
Performers” were analyzed and classified into “winning themes” that drove success
Delivering Real Shareholder Value20
Three Step Approach to Identify “Winning Themes”
Revenue GrowthPremium / Leading
edge platforms
Return on Capital
EmployedOperating Margins
Cash Conversion
CycleLiquidity
Leveraged Free
Cash Flow
Shareholder Value
Actions
Customer / Market
revenue mix
Regional revenue
mix
Gross Profit
Margin
Asset TurnoverR&D Turnover
Financial
Performance
Metrics
Operational
Performance
Metrics
Top Line Drivers
Bottom Line
Drivers
Capital Structure Drivers
Regress TSR against performance
metrics
STEP 1
Identify key performance drivers
STEP 2
Classify into winning themes and
identify “theme leaders”
STEP 3
© 2013 Deloitte Consulting GmbH
Winning themes
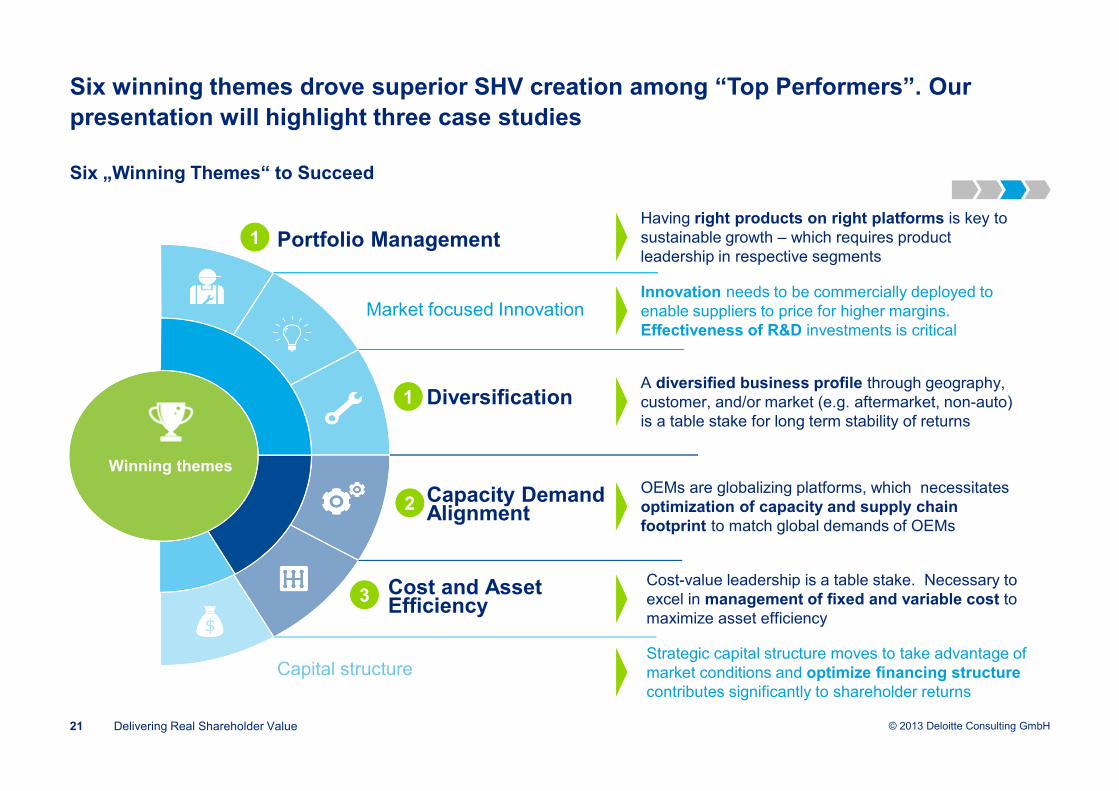
Six winning themes drove superior SHV creation among “Top Performers”. Our
presentation will highlight three case studies
Delivering Real Shareholder Value21
Six „Winning Themes“ to Succeed
Portfolio Management
Market focused Innovation
Diversification
Capacity Demand Alignment
Capital structure
Having right products on right platforms is key to sustainable growth – which requires product leadership in respective segments
Innovation needs to be commercially deployed to enable suppliers to price for higher margins. Effectiveness of R&D investments is critical
A diversified business profile through geography, customer, and/or market (e.g. aftermarket, non-auto) is a table stake for long term stability of returns
OEMs are globalizing platforms, which necessitates optimization of capacity and supply chain footprint to match global demands of OEMs
Strategic capital structure moves to take advantage of market conditions and optimize financing structure contributes significantly to shareholder returns
Cost and Asset Efficiency
Cost-value leadership is a table stake. Necessary to excel in management of fixed and variable cost to maximize asset efficiency
2
1
3
1
© 2013 Deloitte Consulting GmbH
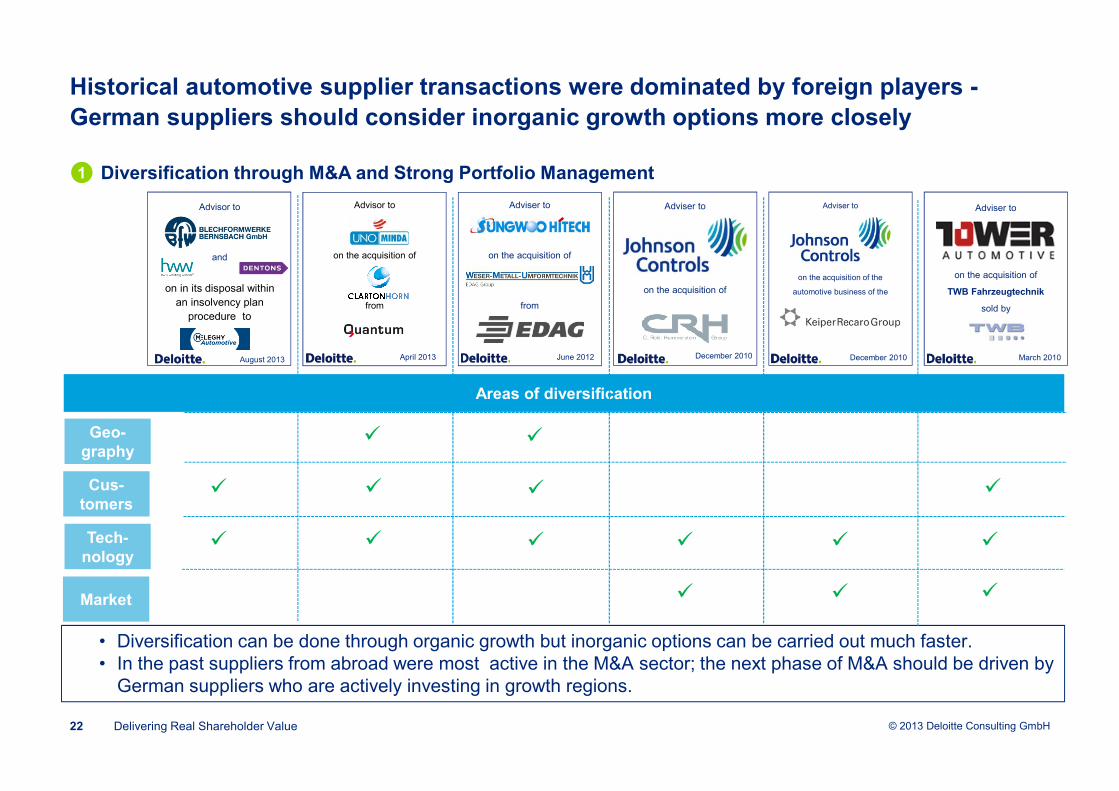
Historical automotive supplier transactions were dominated by foreign players -
German suppliers should consider inorganic growth options more closely
Delivering Real Shareholder Value22
Diversification through M&A and Strong Portfolio Management
June 2012
Adviser to
on the acquisition of
from
Adviser to
on the acquisition of
December 2010
Adviser to
on the acquisition of the
automotive business of the
December 2010
Adviser to
on the acquisition of
TWB Fahrzeugtechnik
sold by
March 2010August 2013
Advisor to
and
on in its disposal within an insolvency plan
procedure to
• Diversification can be done through organic growth but inorganic options can be carried out much faster.• In the past suppliers from abroad were most active in the M&A sector; the next phase of M&A should be driven by
German suppliers who are actively investing in growth regions.
Areas of diversification
Geo-graphy
Cus-tomers
Tech-nology
Market
�
�
�
�
�
�
��
��
�
�
April 2013
Advisor to
on the acquisition of
from
�
�
�
1

© 2013 Deloitte Consulting GmbH
Automotive Supplier Transactions Analysis: Share of cross border M&A activities in
Germany is growing, with higher level of activity by Strategic Investors
Delivering Real Shareholder Value23
Diversification through M&A1
31
15 19 11
23
19
2123
28
22
-
10
20
30
40
50
60
2008 2009 2010 2011 2012
No o
f D
eals
p.a
.
Transactions Automotive GER 2008-2012
Domestic Cross Boarder
394236
4550
71 41 62 44
92
8990
93
64
33
-
50
100
150
200
2008 2009 2010 2011 2012
No
. o
f D
eals
p.a
.
Transactions Automotive Europe 2008-2012
Domestic Cross Boarder
160
131155
108
Cross Border Transactions 2008 & 2012
13
6
19
3
22
9
9
14
Strategic BuyersPrivate Equity
2008 2012
Private Equity Strategic Buyers
Domestic Transactions 2008 & 2012
2008 2012
19 22
31 23
© 2013 Deloitte Consulting GmbH
Maintaining a low cost, but efficient production footprint remains a constant
challenge for suppliers and requires multiple factors to be evaluated and managed
Delivering Real Shareholder Value24
• Seeking lower labor cost has been a key driver for moving European Automotive production further East
• To reap the full benefits of a low cost manufacturing footprint, successful Auto suppliers have paid attention to several other factors:
− Market Attractiveness for OEM sales
− Availability of skilled labor and/or required training programs
− Risk mitigation to minimize legal, regulatory and political risk
− Seek out all available funding options from government and tax incentives
Rank CountryLabor Cost1
Labor Availability2
Legal & Regulatory
Risk3
Political Risk3
1 Bulgaria 3,10 4,12 43 302 Romania 4,20 4,93 50 403 Lithuania 5,45 - - -4 Latvia 5,74 - - -5 Hungary 7,22 4,68 28 306 Poland 7,46 5,78 35 257 Slovakia 8,25 6,07 28 208 Malta 8,27 - - -9 Croatia 8,53 4,57 45 4510 Czech Republic 9,68 7,24 25 2511 Portugal 12,17 - - -12 Slovenia 14,00 6,07 - -13 Greece 17,70 - - -
EU Average 19.02
14 United Kingdom 19,2015 Spain 20,2516 Italy 24,4117 Ireland 27,7618 Austria 28,2319 Finland 28,9720 Germany 29,2021 Netherlands 29,2322 Luxemburg 32,4623 France 33,1524 Sweden 35,9925 Denmark 36,11
Low Cost < -50%
Cost below avg.
Average +/- 20 %
Cost above avg.
High Cost > +50%
Labor Cost are only one key consideration for footprint
1 ) Source: Eurostat – Hourly Costs, 2011,
2) Source: IMD World Competitiveness Report 2011; Ranking: low = positive, high = negative
3) Source: Economist Intelligence Unit (EIU) Risk Tracker 2012; Ranking: low = positive, high = negative
Legend:
Capacity Demand Alignment2

© 2013 Deloitte Consulting GmbH
A strong footprint across regions and continuous optimization efforts are required to
cost-effectively align shifting customer demands with manufacturing capacity
Delivering Real Shareholder Value25
Capacity Demand Alignment
• Footprint optimization for 18 plants in Europe and development of a future state “product - technology competence matrix” across the production network
• Reconfiguration master plan includes ~20 relocations, 3 programs for insourcing, several launch shifts and equipment transfers to mitigate CAPEX investments
• Structural changes led to >1% annual savings in COGS beyond all other operational improvements
Footprint Optimization – Case Study
Standardize product & process portfolio globally & best country allocation for new programs
Regular footprint review is required to align program to plant allocation with shifts in demand
Establish CoC plants to build additional competencies among product & process know-how
Knoweldge transfer & best practice sharing across plants, processes and technologies
Key Takeaways
EU Footprint
(sanitized)
Manufacturing Technology
Products
Key Technologies Category I Category II
EuropeCentral
Plant 1
Plant 2
Plant 3
Plant 4
Plant 5
Technology & Product Competences
within the Production Network Lead Plant
CoC
Plant
2

© 2013 Deloitte Consulting GmbH
There are no “magic” methods for achieving sustainable cost efficiency, but bottom
line impact can be greatly enhanced by establishing cross-functional teams
Delivering Real Shareholder Value26
Cost and Asset Efficiency
Mainly Functional Optimization Holistic Approach
• Drive improvement projects across functions and across products
• Involve CFTs already for the generation of ideas
• Cost down projects are often limited to functional silos and product lines
• No early involvement of other functions
• Adapt cross-functionality in target setting, steering, reporting and decision making
• Set up cross-functional decision committees
• Provide methodology and approaches for cross functional collaboration
• Involve ideas of suppliers (benchmarks & best practice)
• Decision structures and target systems per function lead to conflicting targets and no decisions
• No cross functional decision board existing
• Insufficient collaboration methods and tools
• Limited involvement of supplier know-how
Organi-zation
Gover-nance
Methods
1-2%
Time
Potential
Cost reduction program 1
Cost reductionprogram 2
Cost reduction program n
3%
3%
Functional Optimization
Holistic Cross Functional Approach
Time
Additional potential5-15%
Potential
Today Today
3
© 2013 Deloitte Consulting GmbH
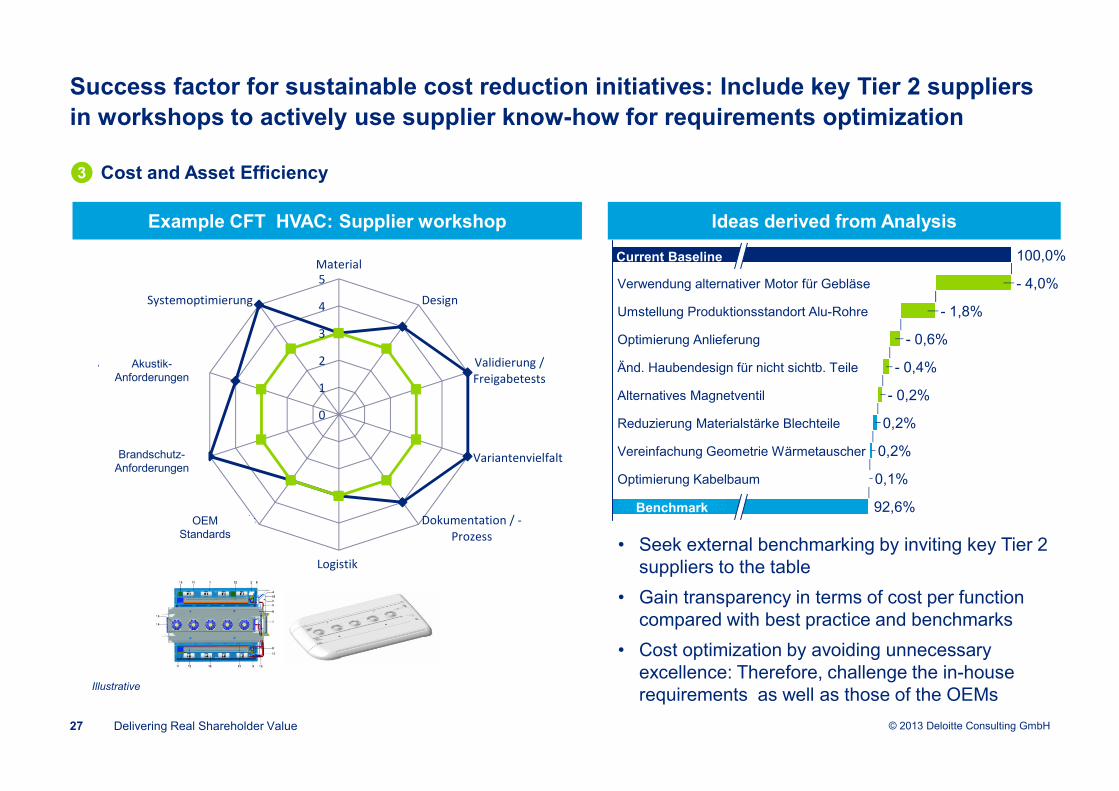
Success factor for sustainable cost reduction initiatives: Include key Tier 2 suppliers
in workshops to actively use supplier know-how for requirements optimization
Delivering Real Shareholder Value27
Cost and Asset Efficiency
- 1,8%
- 4,0%
100,0%
- 0,2%
0,2%
0,2%
92,6%
- 0,4%
0,1%
- 0,6%
Verwendung alternativer Motor für Gebläse
Umstellung Produktionsstandort Alu-Rohre
Optimierung Anlieferung
Änd. Haubendesign für nicht sichtb. Teile
Alternatives Magnetventil
Reduzierung Materialstärke Blechteile
Vereinfachung Geometrie Wärmetauscher
Optimierung Kabelbaum
Benchmark
Current Baseline
• Seek external benchmarking by inviting key Tier 2 suppliers to the table
• Gain transparency in terms of cost per function compared with best practice and benchmarks
• Cost optimization by avoiding unnecessary excellence: Therefore, challenge the in-house requirements as well as those of the OEMs
Ideas derived from AnalysisExample CFT HVAC: Supplier workshop
Illustrative
0
1
2
3
4
5
Material
Design
Validierung /
Freigabetests
Variantenvielfalt
Dokumentation / -
Prozess
Logistik
Daimler Standards
(EMV)
Brandschutzanforde
rungen
Akkustikanforderun
gen
Systemoptimierung
Akustik-Anforderungen
Brandschutz-Anforderungen
OEM Standards
3

© 2013 Deloitte Consulting GmbH
Addressing the winning themes will require a full focus, and an eye on future
challenges, improving cross-functional costs and preparing for market consolidation
Delivering Real Shareholder Value28
Key Takeaways for German Suppliers based on Global Study Results
Drive winning themes in parallel
Focus on portfolio and innovation to escape price pressure
Take advantage of supplier consolidation
All six winning themes need to be considered to be prepared for future trends in Automotive supply base industry and stay ahead of the competition
High pressure on price from OEMs will remain constant. Therefore, rewarding suppliers with technological innovative products, active portfolio management and top cost performance
Globalization and consolidation of the Auto supply base will be on-going. Suppliers with strong financial performance will have a good opportunity to actively participate in the consolidation and seek out growth opportunities

© 2013 Deloitte Consulting GmbH
Contacts
29
Deloitte Consulting GmbHRosenheimer Platz 481669 MunichGermany
Michael A. MaierDirector
Tel: +49 (0)89 29036 [email protected]
www.deloitte.com/de
Deloitte & ToucheCorporate Finance GmbHSchwannstr. 640476 DüsseldorfGermany
Siegfried FrickPartner
Tel: +49 (0)211 8772 [email protected]
www.deloitte.com/de
Ausblick Manufacturing 2/2013
Deloitte refers to one or more of Deloitte Touche Tohmatsu Limited, a UK private company limited by guarantee, and its network of member firms, each of which is a legally separate and independent entity. Please see www.deloitte.com/about or www.deloitte.com/de/UeberUns for a detailed description of the legal structure of Deloitte Touche Tohmatsu Limited and its member firms.
Deloitte provides audit, tax, consulting, and financial advisory services to public and private clients spanning multiple industries. With a globally connected network of member firms in more than 150 countries, Deloitte brings world-class capabilities and high-quality service to clients, delivering the insights they need to address their most complex business challenges. Deloitte has in the region of 200,000 professionals, all committed to becoming the standard of excellence.
This presentation contains general information only, and none of Deloitte Consulting GmbH or Deloitte Touche Tohmatsu Limited (“DTTL”), any of DTTL’s member firms, or any of the foregoing’s affiliates (collectively the “Deloitte Network”) are, by means of this presentation, rendering accounting, business, financial, investment, legal, tax, or other professional advice or services. In particular this presentation cannot be used as a substitute for such professional advice. No entity in the Deloitte Network shall be responsible for any loss whatsoever sustained by any person who relies on this presentation.
© 2013 Deloitte Consulting GmbH