Delivering on our Commitments Empowering Customers to … · ca annual report 2009 | page 1 Dear...
116
Transcript of Delivering on our Commitments Empowering Customers to … · ca annual report 2009 | page 1 Dear...

Delivering on our Commitments
CA Annual Report 2009
Empowering Customers to Manage IT Complexity
CA
Annual Report 2009
ca.comCopyright © 2009 CA. All rights reserved. All trademarks, trade names, service marks andlogos referenced herein belong to their respective companies. MP341520709


c a a n n u a l r e p o r t 2 0 0 9 | p a g e 1
Dear Shareholder:In fiscal 2009, CA delivered a solid performance, improving our operating margin,exceeding both our profit and cash targets, and hitting our revenue target.
CA posted strong earnings per share performance, and the company increasedcash flow from operations by 10 percent, total bookings by 11 percent and GAAPoperating margin by 6 percent. With these results, we believe we are well positionedto move forward with a sense of urgency and a commitment to our shareholders,customers and employees around the world.
These results speak to CA’s resilience and the durability of our value proposition.Customers consider CA’s technology critical to their businesses because it helpsthem reduce risk, manage complexity and improve the overall return on their
information technology (IT) investments. Just as important, our performance reflects our team’s ability to plan, execute and deliver.
We continue to focus on the fundamentals, serving our broad and growing set of customers in both the mainframe anddistributed environments by building on our leadership in Security Management, Project and Portfolio Management,Infrastructure Management and Application Performance Management. Through a combination of organic growth and strategic acquisitions, we will maintain our position as the leading independent software company in enterprise IT management.
We’re confident because CA offers customers a compelling value proposition: The ability to operate their businesseswith superior efficiency and security at a competitive cost by automating their on- and off-premise IT managementprocesses. We call it Lean IT — and our customers are embracing the approach as they look to IT to drive theirbusinesses in a highly competitive environment.
A WHOLE NEW WORLD
It’s no secret the IT world is changing dramatically. We believe these changes expand CA’s market opportunity.
Today, organizations aren’t seeking merely to integrate IT with the business, because in many instances IT is the business.Instead, our customers are seeking to improve their IT systems to drive innovation and growth. IT helps run many partsof a company, from payroll to logistics to resource management to online sales. IT can help win customers, drive revenueand deliver dollars straight to the bottom line.
Not surprisingly, organizations want their existing IT infrastructures to do even more for them. And companies withstrong positions in their markets want cutting-edge technologies now, so that they are ready to seize opportunities whenthe economy picks back up.
As companies continue adding new technology — and more complexity — to their infrastructures, they need enhancedtools to monitor and manage IT. As cloud computing, virtualization, Service Oriented Architecture (SOA), Software as aService (SaaS), and the growing number of networked devices are layered onto already complex IT environments, largeIT users are finding management tools focused on only one discipline are no longer equal to the task. They’re looking fora more automated and integrated solution.
This plays right to CA’s strengths.
CA’s products can be integrated across the various towers of technology found in today’s IT shops to help users automateand integrate their IT services. By doing this, customers can keep systems up and running securely, spot problems beforethey affect the business, and see all that’s going on in their infrastructures to enable them to make smart business decisions.We help them do this at the best possible cost.
l e t t e r f r o m t h e c e o

c a a n n u a l r e p o r t 2 0 0 9 | p a g e 2
THE CUSTOMER IS KING
Add to this the fact that now — more than ever — the customer is king. The more we help companies seamlessly andcost-effectively deliver a great experience to their own customers, the more valuable we become to those companies.This includes helping an airline ensure that its online ticketing service runs smoothly 24 hours a day, seven days a week;a global employment services provider serve its local customers better; and a retailer deliver competitive prices andbetter customer service:
• Qantas uses CA’s Wily Application Performance Management software to help ensure the applications neededto sell airline tickets are up and running. This protects an increasingly important online revenue stream for oneof the world’s largest carriers. Today, the Qantas web site can now handle spikes in traffic of over 20 millionpage views a week.
• Manpower, a global employment services provider, relies on CA’s Clarity Project and Portfolio Managementsolution to support a common set of global IT management processes. By using CA’s software, Manpower hasbeen able to improve supplier management to save $10 million, and identify and remove redundant systems tosignificantly reduce ongoing maintenance costs. This means Manpower can instead use those resources to addvalue to customers. When you serve 400,000 customers every year across 72 countries, that’s a lot of value.
• For Tesco, one of the world’s largest retailers, leaner IT means better service and pricing for its customers.Tesco uses CA software to help it open its new stores quickly and efficiently to ensure the products customerswant — regardless of geography — are on the shelves when customers need them. With more than 4,200 storesworldwide and plans to open more in 2009, that’s a lot of product to manage, a lot of customers to serve welland a lot of value delivered.
These are but a few examples of what our software can do for our customers, who are among the world’s mostsophisticated users of IT. Our software and expertise help our customers become more productive, better compete,innovate and grow. In fact, our approach to managing enterprise IT is what’s driving customers to keep their IT lean,eliminating waste, reducing costs and helping to drive the business.
WE’RE DELIVERING
While we are seeing slightly longer sales cycles as customers scrutinize spending, we’re comfortable knowing our solutions deliver a clear and rapid return on investment. And that’s a compelling value proposition in any economic environment.
What’s more, CA is able to respond to changing market dynamics because we took steps years ago to make CA a more efficient and productive company. Specific changes to processes, internal systems and organizational structurehave benefited our earnings and helped improve margins.
These efforts continue. In particular, in the past year, we instituted a strong pricing discipline. As a result, we can negotiatemore advantageous contracts for CA while making sure they align better with our customers’ business needs. We havea focused, well-trained sales force, complemented by global partners and managed service providers, such as Accentureand Deloitte, so we are able to offer customers comprehensive solutions that solve business problems. We plan tomaintain high levels of training, particularly for sales and development, to ensure we have one of the best-trainedworkforces in the industry. Our services organization has focused on packaging our offerings so customers can hit the ground running when they buy CA products and achieve a quick return on investment.
In addition, we revamped our entire approach to development over the past few years. While there is still work to do,our global team of more than 5,600 engineers has the right tools, more consistent processes and a common goal. They are focused on innovation, delivering new products and the enhancements to our current technologies that our customers need.
l e t t e r f r o m t h e c e o

c a a n n u a l r e p o r t 2 0 0 9 | p a g e 3
We remain prudent in our investments. We will continue to be smart about whether we build or buy, watching foropportunities to acquire companies like Wily, Niku or Concord where we can take great technology and invest to makeit even better — while at the same time making this new technology available to our sales force. In early June 2009, for example, we acquired certain data center automation and policy-based optimization assets and the team that builtthem from Cassatt Corporation. Cassatt, a pioneer in providing innovative cloud computing management software,makes data centers more efficient. This will allow us to accelerate the development of software that helps customersmake more intelligent, business policy-based decisions, and offer a comprehensive infrastructure management approachthat spans monitoring, analysis, planning, optimization and execution.
Many of our technologies are recognized leaders in their respective markets and are delivering impressive value to customers:
• CA Wily Application Performance Management solutions help companies see their customer transactionsand spot problems early. More than 1,200 customers rely on this technology, which processes more than 5 billion transactions a day.
• Our comprehensive service management solutions help companies manage business demand, respond tochange, and measure IT service cost, consumption and performance.
• Our Infrastructure Management solutions provide automation and service assurance, spanning network,voice, systems and virtualization management. They have reduced the cost of service delivery by 30 percentand the time to provision a server by 90 percent.
• CA’s Clarity Project and Portfolio Management solution has been voted “best” at 10 straight PPM Summitsand ranked a leader by industry analysts. This particular solution can be offered on-site as well as on-demand(also known as SaaS). This solution has helped customers substantially reduce redundant projects and reduceproject costs.
• According to a leading industry analyst, CA also is the market leader in Identity and Access Managementsecurity software. We enhanced our security management solutions, which cover data loss prevention,identity, role, access and log management, by both internal development and our recent acquisitions of twocompanies, Orchestria and Eurekify.
• CA is the world’s leading independent mainframe software vendor. We launched a new set of mainframesolutions we call Mainframe 2.0 that can radically improve how customers manage the mainframe.
In fiscal 2010, we plan to increase our spending in product development by nearly $50 million to meet growingcustomer demand. And we’re listening carefully to our customers. Our objective is to fulfill our customers’ need fortoday’s emerging technologies, while ensuring our ability to deliver the innovations that will be in demand 18 to 24months from now.
We are already helping customers take advantage of these new technologies and delivery models, which offer significantbenefits in operational efficiencies, capital expense and energy conservation. In April 2009, we introduced a numberof Enterprise IT Management (EITM) innovations, including 13 new and enhanced EITM software products. But whatseparates CA from our competitors is not simply our ability to provide best-of-breed solutions — although we havemany — it’s the breadth of our offerings and our unique ability to manage across the silos of IT and across all platforms.
That’s a potent, competitive differentiator that speaks directly to CIOs, who are under enormous pressure to deliver morevalue from IT. CA’s Lean IT approach offers CIOs technology and automation that enables them to get more from their ITat minimal cost, while giving them a roadmap for the future. It enables them to continue to manage their IT to achievetheir goals, no matter which new technology enters the infrastructure. This message resonates with customers.

In fact, our approach, along with the strength of our technology, led to a major CA win over key competitors. AcxiomCorp., a global provider of interactive marketing services, chose CA to help transform its global IT infrastructure. Afterreviewing its business processes, Acxiom management concluded their technology infrastructure needed to evolve and that their existing IT and security management tools would be insufficient to meet their rapidly changing businessneeds. The deal included more than 16 CA solutions, including Application Performance Management, Identity andAccess Management, Infrastructure Management, Mainframe Management, Project and Portfolio Management, andService Management.
WE’RE READY
One of CA’s greatest assets continues to be our team of global, well-trained professionals who are committed tocustomers, shareholders, their communities and CA. In fact, CA was named one of the top 100 places to work in IT by Computer World magazine.
In 2009, we delivered our first sustainability report in which we discuss our corporate citizenship in terms of respect for ourenvironment. We have a number of efforts under way to ensure we’re using energy efficiently and reducing our carbonfootprint. We also hold ourselves to a higher standard when it comes to the communities in which we live and work. Wecontinue to invest ourselves into the lives and well-being of others, particularly children, by donating our time, money,technology and talent, a strong tradition CA has built over more than three decades.
We all know that technology moves fast. So does CA. IT will only become a more important and strategic weapon tobusiness. And we know from experience that IT will become even more complicated. We believe that’s good news for CAbecause every new layer of complexity must be managed. We have proven that with leading technology, the right strategyand hard work, we can execute and deliver for our customers, our shareholders, our employees and our communities.
We have strong momentum coming out of fiscal 2009 and will continue to help our customers solve their mostcomplex IT challenges. I could not be more excited about our future.
Thank you for your continued support.
John A. SwainsonChief Executive Officer
c a a n n u a l r e p o r t 2 0 0 9 | p a g e 4
l e t t e r f r o m t h e c e o

UNITED STATESSECURITIES AND EXCHANGE COMMISSION
Washington, D.C. 20549
FORM 10-K(Mark One)
✓ Annual Report Pursuant To Section 13 or 15(d)of the Securities Exchange Act of 1934
For The Fiscal Year Ended March 31, 2009
OR
Transition Report Pursuant To Section 13 or 15(d)of the Securities Exchange Act of 1934
Commission file number 1-9247
CA, Inc.(Exact name of registrant as specified in its charter)
Delaware 13-2857434(State or other jurisdiction of incorporation or organization) (I.R.S. Employer Identification Number)
One CA Plaza,Islandia, New York
11749
(Address of Principal Executive Offices) (Zip Code)
1-800-225-5224(Registrant’s telephone number, including area code)
Securities registered pursuant to Section 12(b) of the Act:
(Title of Each Class) (Name of Each Exchange on Which Registered)Common stock, par value $0.10 per share The NASDAQ Stock Market LLC
Stock Purchase Rights Preferred Stock, Class A The NASDAQ Stock Market LLC
Securities registered pursuant to Section 12(g) of the Act:
None
Indicate by check mark if the registrant is a well-known seasoned issuer, as defined in Rule 405 of the SecuritiesAct. ✓ Yes No
Indicate by check mark if the registrant is not required to file reports pursuant to Section 13 or Section 15(d) of the ExchangeAct. Yes ✓ No
Indicate by check mark whether the registrant (1) has filed all reports required to be filed by Section 13 or 15(d) of theSecurities Exchange Act of 1934 during the preceding 12 months (or for such shorter period that the registrant was requiredto file such reports), and (2) has been subject to such filing requirements for the past 90 days. ✓ Yes No
Indicate by check mark whether the registrant has submitted electronically and posted on its corporate Web site, if any, everyInteractive Data File required to be submitted and posted pursuant to Rule 405 of Regulation S-T during the preceding12 months (or for such shorter period that the registrant was required to submit and post such files). Yes No
Indicate by check mark if disclosure of delinquent filers pursuant to Item 405 of Regulation S-K is not contained herein, andwill not be contained, to the best of registrant’s knowledge, in definitive proxy or information statements incorporated byreference in Part III of this Form 10-K or any amendment to this Form 10-K.
Indicate by check mark whether the registrant is a large accelerated filer, an accelerated filer, or a non-accelerated filer. Seedefinition of “accelerated filer and large accelerated filer” in Rule 12b-2 of the Exchange Act.✓ Large accelerated filer Accelerated filer Non-accelerated filer
Indicate by check mark whether the registrant is a shell company (as defined in Rule 12b-2 of the ExchangeAct). Yes ✓ No
The aggregate market value of the common stock held by non-affiliates of the registrant as of September 30, 2008 (the lastbusiness day of the registrant’s most recently completed second fiscal quarter) was approximately $7.7 billion based on theclosing price of $19.96 on the NASDAQ Stock Market LLC on that date.
The number of shares of each of the registrant’s classes of common stock outstanding at May 8, 2009 was518,836,593 shares of common stock, par value $0.10 per share.
Documents Incorporated by Reference:Part III: Portions of the Proxy Statement to be issued in conjunction with the registrant’s 2009 Annual Meeting of Stockholders.
%%TRANSMSG*** Transmitting Job: Y77913 PCN: 001000000 ***%%PCMSG| |00011|Yes|No|07/07/2009 22:17|0|0|Page is valid, no graphics -- Color: D|

(This page intentionally left blank)

CA, Inc.Table of Contents
Part I
Item 1. Business. . . . . . . . . . . . . . . . . . . . . . . . . . . . . . . . . . . . . . . . . . . . . . . . . . . . . . . . . . . . . . . . . . . . . . . . . . . . . . . 1
Item 1A. Risk Factors . . . . . . . . . . . . . . . . . . . . . . . . . . . . . . . . . . . . . . . . . . . . . . . . . . . . . . . . . . . . . . . . . . . . . . . . . . . . 9
Item 2. Properties . . . . . . . . . . . . . . . . . . . . . . . . . . . . . . . . . . . . . . . . . . . . . . . . . . . . . . . . . . . . . . . . . . . . . . . . . . . . . 17
Item 3. Legal Proceedings . . . . . . . . . . . . . . . . . . . . . . . . . . . . . . . . . . . . . . . . . . . . . . . . . . . . . . . . . . . . . . . . . . . . . . . 17
Item 4. Submission of Matters to a Vote of Security Holders. . . . . . . . . . . . . . . . . . . . . . . . . . . . . . . . . . . . . . . . . . . . . 17
Part II
Item 5. Market for Registrant’s Common Equity, Related Stockholder Matters and Issuer Purchases of EquitySecurities . . . . . . . . . . . . . . . . . . . . . . . . . . . . . . . . . . . . . . . . . . . . . . . . . . . . . . . . . . . . . . . . . . . . . . . . . . . . . . 20
Item 6. Selected Financial Data . . . . . . . . . . . . . . . . . . . . . . . . . . . . . . . . . . . . . . . . . . . . . . . . . . . . . . . . . . . . . . . . . . . 21
Item 7. Management’s Discussion and Analysis of Financial Condition and Result of Operations . . . . . . . . . . . . . . . . . 22
Item 7A. Quantitative and Qualitative Disclosures About Market Risk . . . . . . . . . . . . . . . . . . . . . . . . . . . . . . . . . . . . . . . 45
Item 8. Financial Statements and Supplementary Data. . . . . . . . . . . . . . . . . . . . . . . . . . . . . . . . . . . . . . . . . . . . . . . . . . 45
Item 9. Changes in and Disagreements with Accountants on Accounting and Financial Disclosure . . . . . . . . . . . . . . . . 46
Item 9A. Controls and Procedures . . . . . . . . . . . . . . . . . . . . . . . . . . . . . . . . . . . . . . . . . . . . . . . . . . . . . . . . . . . . . . . . . . 46
Item 9B. Other Information . . . . . . . . . . . . . . . . . . . . . . . . . . . . . . . . . . . . . . . . . . . . . . . . . . . . . . . . . . . . . . . . . . . . . . . 47
Part III
Item 10. Directors, Executive Officers and Corporate Governance . . . . . . . . . . . . . . . . . . . . . . . . . . . . . . . . . . . . . . . . . . 48
Item 11. Executive Compensation . . . . . . . . . . . . . . . . . . . . . . . . . . . . . . . . . . . . . . . . . . . . . . . . . . . . . . . . . . . . . . . . . . 48
Item 12. Security Ownership of Certain Beneficial Owners and Management and Related Stockholder Matters . . . . . . . 48
Item 13. Certain Relationships and Related Transactions, and Director Independence . . . . . . . . . . . . . . . . . . . . . . . . . . . 48
Item 14. Principal Accountant Fees and Services . . . . . . . . . . . . . . . . . . . . . . . . . . . . . . . . . . . . . . . . . . . . . . . . . . . . . . . 48
Part IV
Item 15. Exhibits, Financial Statement Schedules . . . . . . . . . . . . . . . . . . . . . . . . . . . . . . . . . . . . . . . . . . . . . . . . . . . . . . . 49
Signatures . . . . . . . . . . . . . . . . . . . . . . . . . . . . . . . . . . . . . . . . . . . . . . . . . . . . . . . . . . . . . . . . . . . . . . . . . . . . . . . . . . . . . 55
%%TRANSMSG*** Transmitting Job: Y77913 PCN: 002000000 ***%%PCMSG| |00014|Yes|No|07/08/2009 00:12|0|0|Page is valid, no graphics -- Color: D|

(This page intentionally left blank)
This Annual Report on Form 10-K (Form 10-K) contains certain forward-looking information relating to CA, Inc. (the“Company,” “Registrant,” “CA,” “we,” “our,” or “us”), that is based on the beliefs of, and assumptions made by, ourmanagement as well as information currently available to management. When used in this Form 10-K, the words“anticipate,” “believe,” “estimate,” “expect,” and similar expressions are intended to identify forward-looking information.Such information includes, for example, the statements made under the caption “Management’s Discussion and Analysisof Financial Condition and Results of Operations” under Item 7, but also appears in other parts of this Form 10-K. Thisforward-looking information reflects our current views with respect to future events and is subject to certain risks,uncertainties, and assumptions, some of which are described under the caption “Risk Factors” in Part I Item 1A andelsewhere in this Form 10-K. Should one or more of these risks or uncertainties occur, or should our assumptions proveincorrect, actual results may vary materially from those described in this Form 10-K as anticipated, believed, estimated,or expected. We do not intend to update these forward-looking statements.
The product and services names mentioned in this Form 10-K are used for identification purposes only and may beprotected by trademarks, trade names, services marks and/or other intellectual property rights of the Company and/orother parties in the United States and/or other jurisdictions. The absence of a specific attribution in connection with anysuch mark does not constitute a waiver of any such right. ITIL is a registered trademark of the Office of GovernmentCommerce in the United Kingdom and other countries. All other trademarks, trade names, service marks and logosreferenced herein, belong to their respective companies.
References in this Form 10-K to fiscal 2009, fiscal 2008, fiscal 2007 and fiscal 2006, etc. are to our fiscal years endedon March 31, 2009, 2008, 2007 and 2006, etc., respectively.
Part IITEM 1. BUSINESS.(a) General Development of BusinessOverviewCA, Inc. is the world’s leading independent information technology (IT) management software company. We helporganizations manage IT to become lean and more productive, which can help them better compete, innovate and grow.We develop and deliver software that makes it easier for organizations to manage IT throughout complex computingenvironments. With our vision for Enterprise IT Management (EITM) and our expertise, organizations can moreeffectively govern, manage and secure the services IT delivers to the business to reduce costs and risks, improve serviceand ensure IT is integrated with the business.
We address the entire computing environment, which includes all of the people, information, processes, systems,networks, applications and databases from a Web service to the mainframe to a virtualized “cloud”, regardless of thehardware or software customers are using. We serve the majority of the Forbes Global 2000 companies, who rely on oursoftware, in part, to manage mission-critical aspects of their businesses. We have a broad portfolio of software productsand services that address our customers’ needs for mainframe and distributed environments, spanning IT governance,IT management and IT security. Key focus areas include: infrastructure management, project and portfolio management,security management, service management, application performance management, and data center automation andvirtualization.
The Company was incorporated in Delaware in 1974, began operations in 1976 and completed an initial public offeringof common stock in December 1981. Prior to April 28, 2008, our common stock was traded on the New York StockExchange under the symbol “CA.” On April 28, 2008, we commenced trading on The NASDAQ Global Select Market tierof The NASDAQ Stock Market LLC under the same symbol.
Fiscal 2009 Business Developments and HighlightsThe following are some significant fiscal 2009 developments and highlights relating to our business:
• In February 2009, we completed a cash tender offer for our outstanding 4.750% Senior Notes due December 1,2009. We received valid tenders of $176 million of the aggregate principal amount of the notes. During fiscal 2009,we also repurchased $148 million of the aggregate principal amount of these notes in the open market. In total, wereduced our obligations relating to these Notes from $500 million to $176 million during fiscal 2009.
1
%%TRANSMSG*** Transmitting Job: Y77913 PCN: 003000000 ***%%PCMSG|1 |00014|Yes|No|07/07/2009 23:09|0|0|Page is valid, no graphics -- Color: D|

• In December 2008, we released our first Global Corporate Sustainability Report, “Connected.” The report affirms ourdedication to growing the company in environmentally and socially sustainable ways, and highlights our commitmentto our own sustainability, as well as our unique role as a leading provider of software management solutions thatenable customers to achieve their business and sustainability goals.
• In November 2008, we held our 13th user conference, CA World, in Las Vegas. CA World 2008 brought togethermore than 5,000 IT professionals from more than 70 countries to exchange IT management strategies fortransforming IT from a cost center into an enabler of innovation and business growth.
• In November 2008, we announced a Software-as-a-Service (SaaS) delivery option for our market leading enterprise-class solution, ClarityTM Project & Portfolio Manager PPM. By extending the availability options for our award-winningClarity product, we now provide CIOs and business executives with best-in-class functionality through a flexible SaaSdelivery model.
• In October 2008, we announced plans to expand our India Technology Center (ITC) with the construction of a new180,000 square foot building on our campus in Hyderabad.
• In October 2008, our Board of Directors approved a new stock repurchase program that authorizes the Company tobuy up to $250 million of our common stock.
• In September 2008, we began offering broad-based support for Microsoft’s virtualization technology across ourRecovery Management, Virtualization Management, Security and Systems Management products. This support willhelp Microsoft customers effectively govern, manage and secure even the most complex virtualized environments.
• In September 2008, we enhanced our ClarityTM Project & Portfolio Manager solution by fully integrating cost andschedule measurement functionality to help U.S. federal government agencies and contractors conform to the ANSI/EIA-748 standard for Earned Value Management Systems.
• In September 2008, we released CA GRC Manager NERC Program Accelerator, a complete North American ElectricReliability Corporation (NERC) compliance program for power and utility customers.
• In July 2008, we launched a customized channel partner program dedicated to our global Internet Security partners’focus on our anti-malware product portfolio. The program for Internet Security will help value-added resellers,retailers and technology partners market and sell solutions to service small, medium and large organizations, as wellas the home and home office market.
• In June 2008, we released eight new and updated solutions that deliver on our vision of Enterprise IT Management toenable customers to govern, manage and secure the services IT delivers to the business. Our new offerings includeproducts for managing compliance and risk across mainframe and distributed computing environments, and productsthat build on our latest advances in automation.
We made the following additions to our Board of Directors:
• In November 2008, Kay Koplovitz was elected to our Board of Directors. Ms. Koplovitz was named to the Board’sCorporate Governance Committee.
• In April 2008, Arthur F. Weinbach was elected to our Board of Directors and named to the Board’s Compensationand Human Resources Committee. In September 2008, Mr. Weinbach was also named to the Board’s AuditCommittee.
(b) Financial Information About SegmentsOur global business consists of a single industry segment — the design, development, marketing, licensing and supportof IT management software products that operate on a wide range of hardware platforms and operating systems. Referto Note 5 “Segment and Geographic Information,” in the Notes to the Consolidated Financial Statements for financialdata pertaining to our segment and geographic operations.
(c) Narrative Description of the BusinessAs the world’s leading independent IT management software company, we help organizations manage IT to become leanand more productive by helping them automate and improve IT processes at a reduced cost, which helps them bettercompete, innovate and grow. We develop and deliver software that makes it easier for organizations to manage IT
2
%%TRANSMSG*** Transmitting Job: Y77913 PCN: 004000000 ***%%PCMSG|2 |00011|Yes|No|07/07/2009 22:17|0|0|Page is valid, no graphics -- Color: D|

throughout complex computing environments, including handheld to mainframe, physical to virtual, and on-premises to“cloud”. With our vision for Enterprise IT Management (EITM) and our expertise, organizations can more effectivelygovern, manage and secure the services IT delivers to the business to reduce costs and risks, improve service and ensureIT is integrated with the business.
We support our customers’ needs to govern, manage and secure the services IT delivers to the business as follows:
GovernWe help our customers automate IT governance and various aspects of business governance. IT governance is theprocess of deciding about the priorities of their IT investments and how IT will allocate its human and financialresources to support those priorities. Business governance includes risk management, policy and regulatory compliancemanagement, and information governance (such as records and messaging management). IT governance is addressed byCA ClarityTM Project & Portfolio Manager, our market-leading, enterprise-class PPM solution. Business governance isaddressed by our CA GRC Manager and Information Governance products.
ManageWe make it easier to manage technology so that high-quality IT services can be delivered within our customers’businesses at a competitive cost. We focus on service management, data center automation and applicationperformance management, which includes offerings such as CA Wily Introscope »; and infrastructure management,which includes offerings such as CA SPECTRUM Network Fault Manager, CA eHealth » Network Performance Managerand CA NSM.
SecureWe help ensure customers have secure access to the information, applications, systems and services they need toconduct their businesses. We focus on identity and access management, as well as security information managementand threat management, which include CA Access Control, CA Identity Manager and CA SiteMinder.
We believe this is important because IT has become more critical than ever to running a business. Organizations rely onIT to conduct day-to-day business, and they are increasingly using IT to do more, including: comply with regulations,ensure security, manage costs and risks, manage resources, and manage energy consumption, enabling organizations toincrease revenue and profit. At the same time, organizations continue to add new technology to their computingenvironments, taking advantage of trends such as cloud computing, virtualization and Software-as-a-Service (SaaS),which makes the computing environment more complex.
We believe that to get the most out of their technology, organizations must be able to manage IT as a whole and not asisolated functions unable to work together. We see IT, when managed well, as a business driver, not a cost center. Webelieve organizations that are able to manage their entire IT environment, eliminate waste, become leaner and moreproductive are able to compete more effectively and even thrive.
We base our beliefs on our decades of experience with some of the world’s largest, most sophisticated users of IT. CAfocuses on enterprise customers who, by the nature of their size and the complexity of their IT infrastructures, haveunique demands that our software and services are well suited to meet.
Our strategy is to enable Chief Information Officers (CIOs) to realize increasing levels of value from their IT investmentsby helping them manage IT to solve their business problems, move their businesses forward and achieve a compellingreturn on their investments in CA technology.
Business OrganizationOur Company is organized to support our customers’ needs and our business strategy, from how we develop and deliverproducts and services to how we market and sell our software and how we support our technology. We group ourproducts into solution sets under our govern, manage and secure framework. The products we develop are based onareas of focus where we believe we have the greatest growth opportunities and leading solutions.
3
%%TRANSMSG*** Transmitting Job: Y77913 PCN: 005000000 ***%%PCMSG|3 |00013|Yes|No|07/07/2009 22:17|0|0|Page is valid, no graphics -- Color: D|

Our main areas of focus for mainframe and distributed environments are:
• infrastructure management
• project and portfolio management
• IT security management, including compliance and risk management
• service management
• application performance management, and
• data center automation and virtualization
We continuously enhance our areas of focus to meet the needs of our customers and the market, which includes SaaS,cloud computing, and other areas considered emerging technologies.
Sales and MarketingWe offer our solutions through our direct sales force, and indirectly through global systems integrators, managed serviceproviders, technology partners, EITM value-added resellers, original equipment manufacturers and distribution andvolume partners. We have a disciplined, structured and systematic selling process through which we concentrate on ourfocus areas for both the distributed and mainframe environment.
These areas allow us to address customer needs and deepen relationships while opening the door for us to cross-selland up-sell additional solutions. We rely on our marketing organization to help us identify new market opportunities,provide fact-based insight on industry and customer trends, and build awareness of our products globally to help drivesales.
Our sales organization operates on a worldwide basis. We operate through branches, subsidiaries and partners aroundthe world. Approximately 46% of our revenue in fiscal 2009 was from operations outside of the United States. As ofMarch 31, 2009 and March 31, 2008, we had approximately 3,200 and 3,300 sales and sales support personnel,respectively. In certain smaller geographic locations, including in the Asia-Pacific-Japan region, we use our distributionand resale partners as our primary selling vehicle.
CA Customer Value NetworkTo guide customers through the process of selecting, implementing and using IT management software and help themgain business value at every stage of the software lifecycle, we deliver proven, quality solutions and serve as aknowledgeable, trusted partner through a range of offerings and programs that make up the CA Customer ValueNetwork.
The CA Customer Value Network is comprised of CA Education, CA Services, CA Support, CA Partners and CACommunities. CA Education, CA Services, CA Support, and CA Partners provide numerous offerings from solutionimplementation to technology consultation, educational programs and support services, throughout the customer’ssoftware ownership. CA Communities provide programs that can help customers solve problems, network with peers,and gain insight into new products and product development to maximize efficiency, performance and business results.
PartnersAs an integral part of our strategy, we enter into contractual arrangements with third parties to facilitate thedevelopment and sale of our products. We utilize a broad base of partners to enable us to reach more customers, stayahead of technology trends, complement our expertise in niche areas and provide fulfillment and distribution.
We work with several types of partners:
• Global Systems Integrators (GSIs) offer process design and planning as well as vertical expertise. We work with GSIsincluding, but not limited to, Accenture, Deloitte and PricewaterhouseCoopers.
• Managed Service Providers at both the global and regional level. These companies, including but not limited to, CSC,EDS and IBM, often deliver IT services using our software products to organizations that prefer to outsource their IToperations.
4
%%TRANSMSG*** Transmitting Job: Y77913 PCN: 006000000 ***%%PCMSG|4 |00013|Yes|No|07/07/2009 22:17|0|0|Page is valid, no graphics -- Color: D|

• Technology Partners are leading platform and application vendors who enable strong product integration andtechnical collaboration by helping us ensure that CA products and our partners’ products deliver comprehensivesolutions for our customers’ IT environments. Some of our valued partners include Microsoft, SAP and VMware,which help us adapt and respond to the emergence of new technologies and trends, such as virtualization and cloudcomputing.
• EITM Value-Added Resellers combine our software products with specialized consulting services and provideenhanced, user-specific solutions to a particular market or sector.
• Distributors and Volume Partners enable us to broaden our reach to the Small and Medium Business market segmentand provide efficient personalized local delivery, service and support to our customers in that market.
CustomersWe have a large and broad base of customers, including the majority of the Forbes Global 2000. Most of our revenue isgenerated from customers who have the ability to make substantial commitments to software and hardwareimplementations. Our software products are used in a broad range of industries, businesses and applications. Wecurrently service companies across most major industries worldwide, including banks, insurance companies, otherfinancial services providers, governmental agencies, manufacturers, technology companies, retailers, educationalinstitutions and health care institutions.
When customers enter into software license agreements with us, they often pay for the right to use our software for aspecified period of time. When the terms of these agreements expire, the customers may either renew the licenseagreements or pay usage and maintenance fees, if applicable, for the right to continue to use our software, receivesupport, and/or receive future upgrades. Our customers’ satisfaction is important to us and we believe that our flexiblebusiness model allows us to maintain our customer base while allowing us to cross-sell new software products andservices to them.
No individual customer accounted for a material portion of our revenue during any of the past three fiscal years. As ofMarch 31, 2009, three customers accounted for substantially all of our outstanding prior business model net receivables,which amounted to approximately $240 million, including one large IT outsourcing customer with a license arrangementthat extends through fiscal 2012 with a net unbilled receivable balance of approximately $232 million. Refer to “BusinessModel” in Item 7, “Management’s Discussion and Analysis of Financial Condition and Results of Operations,” for furtherinformation.
Research and DevelopmentWe continue to invest extensively in product development and enhancements. We anticipate that we will continue toadapt our software products to the rapid changes in the IT industry and will continue to enhance our products to helpthem remain compatible with hardware, operating system changes and our customers’ needs.
Our research and development activities include a number of efforts. We established CA Labs in 2005 to strengthenrelationships between research communities and us. We formed the CA Council for Technical Excellence in 2006 to leadinnovative projects designed to promote communication, collaboration, and synergy among CA’s global technicalcommunity.
To keep us on top of major technological advances and to ensure our products continue to work well with those of othervendors, we are active in most major standards organizations and take the lead in many. Many of our professionals arecertified across key standards, including ITIL», PMI, CISPP, and have built knowledge and expertise in key verticalmarkets, such as financial services, government, telecommunications, insurance, health care, manufacturing and retail.Further, we were the first major software company to earn the International Organization for Standardization’s (ISO)9001:2000 Global Certification.
We have approximately 5,600 engineers globally who design and support CA software and have charged to operations$486 million, $526 million and $557 million in fiscal 2009, 2008 and 2007, respectively, for product development andenhancements. In fiscal 2009, 2008 and 2007, we capitalized costs of $129 million, $112 million and $85 million,respectively, for internally developed software.
5
%%TRANSMSG*** Transmitting Job: Y77913 PCN: 007000000 ***%%PCMSG|5 |00012|Yes|No|07/07/2009 22:17|0|0|Page is valid, no graphics -- Color: D|

Our product development staff is global, with locations in Australia, Canada, China, the Czech Republic, Germany, India,Israel, Japan, the United Kingdom and the United States. We collaborate in both physical and virtual labs. Ourtechnological efforts around the world ensure we maintain a global perspective of customer needs while cost-effectivelytapping the skills and talents of developers worldwide, and enable us to efficiently and effectively support our customers.
In the United States, product development is primarily performed at our facilities in Redwood City, and San Francisco,California; Lisle, Illinois; Framingham, Massachusetts; Ewing, New Jersey; Islandia, New York; Pittsburgh, Pennsylvania;Plano, Texas; and Herndon, Virginia.
Patents and TrademarksCertain aspects of our products and technology are proprietary. We rely on U.S. and foreign intellectual property laws,including patent, copyright, trademark and trade secret laws to protect our proprietary rights. However, the extent andduration of protection given to different types of intellectual property rights vary under different countries’ legal systems.In some countries, full-scale intellectual property protection for our products and technology may be unavailable, or thelaws of other jurisdictions may not protect our proprietary technology rights to the same extent as the laws of theUnited States. We also maintain contractual restrictions in our agreements with customers, employees and others toprotect our intellectual property rights. In addition, we occasionally license software and technology from third parties,including some competitors, and incorporate them into our own software products.
We maintain a portfolio of U.S. and foreign patents that generally expire at various times over the next 20 years.Although the durations and geographic patent coverage for our inventions may vary, we believe our patent portfolioadequately protects our interests. We expect to maintain a patent portfolio that includes more than 400 issued patentsand 700 pending applications in the United States and the European Union.
The source code for our products is protected both as trade secrets and as copyrighted works. Some of our customersare beneficiaries of a source code escrow arrangement that enables our customers to obtain a contingent, limited rightto access our source code.
We are not aware that our products or technologies infringe on the proprietary rights of third parties. Third parties,however, have asserted and may assert infringement claims against us with respect to our products, and any suchassertion may require us to enter into royalty arrangements or result in costly and time-consuming litigation. Althoughwe have a number of U.S. and foreign patents and pending applications that may have value to various aspects of ourproducts and technology, we are not aware of any single patent that is essential to us or to any of our principal businessproduct areas.
Product LicensingOur licensing model offers customers a wide range of purchasing and payment options. Under our flexible licensingterms, customers can license our software products under multi-year licenses, with most customers choosing terms ofone to three years, although longer terms are sometimes selected by customers who desire greater cost certainty. Wealso help customers reduce uncertainty by providing a standard pricing schedule based on simple usage tiers.Additionally, we offer our customers the ability to establish pricing models for our products based on their key businessmetrics. Although this practice is not widely used by our customers, we believe this metric-based approach can provideus with a competitive advantage in certain circumstances.
On licenses sold for our mainframe products and most of our distributed products, we offer our customers the right toreceive unspecified future software products for no additional fee, as well as maintenance included during the term ofthe license. On licenses sold for certain products or through certain indirect channels, we do not offer our customersunspecified future software products and do not always include maintenance with the license sale. For a description ofour revenue recognition policies, refer to Note 1, “Significant Accounting Policies”, in the Notes to the ConsolidatedFinancial Statements.
CompetitionThe enterprise management software business is highly competitive and is marked by rapid technological change, thesteady emergence of new companies and products, evolving industry standards and changing customer needs. Wecompete with many established companies in the markets we serve. Some of these companies have substantially
6
%%TRANSMSG*** Transmitting Job: Y77913 PCN: 008000000 ***%%PCMSG|6 |00012|Yes|No|07/07/2009 22:17|0|0|Page is valid, no graphics -- Color: D|

greater financial, marketing, and technological resources, broader distribution capabilities, earlier access to customers,and a greater opportunity to address customers’ various information technology requirements than we do. These factorsmay provide our competitors with an advantage in penetrating markets with their products.
We also compete with many smaller, less established companies that may be able to focus more effectively on specificproduct areas or markets. Because of the breadth of our product portfolio, we have competitors who may only competewith us in one product area and other companies who compete across most or all of our product portfolios. Competitivedifferentiators include, but are not limited to: industry vision, performance, quality, breadth of product offerings,expertise, integration of products, brand name recognition, price, functionality, customer support, frequency of upgradesand updates, manageability of products and reputation. Some of our key competitors are IBM, HP, BMC and Symantec.
We believe that we are well positioned and have a unique competitive advantage in the marketplace with our vision forEnterprise IT Management for a number of reasons:
• The breadth and quality of our products, and their ability to integrate with existing customer technology investments.Various CA products manage IT in most environments, whether distributed, mainframe or virtualized. As newtechnologies are introduced, we continue to pursue integration to help customers see how the different elements ofIT — hardware, software and staff — work together to deliver a service to the business.
• The depth of our technical expertise.
• Our commitment to open standards and innovation.
• Our independence, which means we do not have a preferred hardware, software or operating system platformagenda.
• Our ability to work with customers from planning through implementation, helping them quickly realize value fromCA technology.
• Our ability to offer products that are modular, open and integrated so customers can use them at their own paceindividually or in combination with their existing technology.
EmployeesThe table below sets forth the approximate number of employees by location and functional area as of March 31, 2009:
LOCATION FUNCTIONAL AREAEMPLOYEES AS OF
MARCH 31, 2009EMPLOYEES AS OF
MARCH 31, 2009
Corporate headquarters 1,900 Professional services 1,200
Support services 1,500
Other U.S. offices 5,200 Selling and marketing 3,700
General and administrative 2,400
International offices 6,100 Product development 4,400
Total 13,200 Total 13,200
As of March 31, 2009 and 2008, we had 13,200 and 13,700 employees, respectively. The decrease was mostly in oursales and professional services staff and reflects the actions taken under the fiscal 2007 restructuring plan. Foradditional information on the fiscal 2007 restructuring plan refer to Note 3, “Restructuring and Other,” in the Notes tothe Consolidated Financial Statements. We believe our employee relations are satisfactory.
(d) Financial Information About Geographic AreasRefer to Note 5, “Segment and Geographic Information” in the Notes to the Consolidated Financial Statements forfinancial data pertaining to our segment and geographic operations.
(e) Available InformationOur corporate website address is ca.com. All filings we make with the SEC, including our Annual Report on Form 10-K,our Quarterly Reports on Form 10-Q, our Current Reports on Form 8-K, and any amendments, are available for free onour investor relations website (ca.com/investor) as soon as reasonably practicable after they are filed with or furnishedto the SEC. Our SEC filings are available to be read or copied at the SEC’s Public Reference Room at 100 F Street, N.E.,
7
%%TRANSMSG*** Transmitting Job: Y77913 PCN: 009000000 ***%%PCMSG|7 |00013|Yes|No|07/07/2009 22:17|0|0|Page is valid, no graphics -- Color: D|

Washington, D.C. 20549. Information regarding the operation of the Public Reference Room can be obtained by callingthe SEC at 1-800-SEC-0330. Our filings can also be obtained for free on the SEC’s website at www.sec.gov. Thereference to our website address does not constitute incorporation by reference of the information contained on ourwebsite in this Form 10-K or other filings with the SEC, and the information contained on our website is not part of thisdocument.
Our investor relations website (ca.com/investor) also contains information about our initiatives in corporate governance,including: our corporate governance principles; information concerning our Board of Directors (including specific proceduresfor communicating with them); information concerning our Board Committees, including the charters of the AuditCommittee, the Compensation and Human Resources Committee, the Corporate Governance Committee, and theCompliance and Risk Committee; and our CA Code of Conduct: Information and Resource Guide (applicable to all of ouremployees, including our Chief Executive Officer, Chief Financial Officer, Principal Accounting Officer, and our directors).These documents can also be obtained in print by writing to our Corporate Secretary, One CA Plaza, Islandia, NY 11749.
8
%%TRANSMSG*** Transmitting Job: Y77913 PCN: 010000000 ***%%PCMSG|8 |00014|Yes|No|07/07/2009 23:10|0|0|Page is valid, no graphics -- Color: D|

ITEM 1A. RISK FACTORS.Current and potential stockholders should consider carefully the risk factors described below. Any of these factors, orothers, many of which are beyond our control, could materially adversely affect our business, financial condition,operating results, cash flow and stock price.
Given the global nature of our business, economic factors or political events beyond our control and other business risksassociated with non-U.S. operations can affect our business in unpredictable ways.International revenue has historically represented a significant percentage of our total worldwide revenue. Success inselling and developing our products outside the United States will depend on a variety of factors in variousnon-U.S. locations, including:
• Foreign exchange currency rates;
• Local economic conditions;
• Political stability;
• Workforce reorganizations in various non-U.S. locations, including reorganizations of sales, product development,technical services, finance, human resources and facilities functions;
• Effectively staffing key managerial and technical positions;
• Successfully localizing software products for a significant number of international markets;
• More restrictive employment regulation;
• Trade restrictions such as tariffs, duties, taxes or other controls;
• International intellectual property laws, which may be more restrictive or may offer lower levels of protection thanU.S. law;
• Complying with differing and changing local laws and regulations in multiple international locations as well ascomplying with U.S. law and regulations where applicable in these international locations; and
• Developing and executing an effective go-to-market strategy in various locations.
Any of the foregoing factors, among others, could materially adversely affect our business, financial condition, operatingresults and cash flow.
General economic conditions, including concerns regarding a global recession and credit constraints, or unfavorableeconomic conditions in a particular region, business or industry sector, may lead our customers to delay or forgotechnology investments and could have other impacts, any of which could adversely affect our business, financialcondition, operating results and cash flow.Our products are designed to improve the productivity and efficiency of our customers’ information processingresources. However, a general slowdown or recession in the global economy, or in a particular region, or business orindustry sector (such as the financial services sector), or tightening of credit markets, could cause customers to: havedifficulty accessing credit sources; delay contractual payments; or delay or forgo decisions to (i) license new products(particularly with respect to discretionary spending for software), (ii) upgrade their existing environments or(iii) purchase services. Any such impacts could adversely affect our business, financial condition, operating results andcash flow.
Such a general slowdown or recession in the global economy may also materially impact the global banking systemincluding individual institutions as well as a particular business or industry sector, which could cause furtherconsolidations or failures in such a sector. Approximately one third of our revenue comes from arrangements withfinancial institutions (i.e., banking, brokerage and insurance companies). The majority of these arrangements are for therenewal of mainframe capacity and maintenance associated with transactions processed by our financial institutioncustomers. While we cannot predict what impact there may be on our business from further consolidation of thefinancial industry sector, or the impact from the economy in general on our business, to date the impact has not been
9
%%TRANSMSG*** Transmitting Job: Y77913 PCN: 011000000 ***%%PCMSG|9 |00012|Yes|No|07/07/2009 22:17|0|0|Page is valid, no graphics -- Color: D|

material to our balance sheet, results of operations or cash flows. The vast majority of our subscription and maintenancerevenue in any particular reporting period comes from contracts signed in prior periods, generally pursuant to contractsranging in duration from three to five years.
These adverse financial events could also result in further government intervention in the U.S. and world markets. Any ofthese results could impact the manner in which we are able to conduct business including within a particular industrysector or market and could adversely affect our business, financial condition, operating results and cash flow.
Changes to the compensation of our sales organization could materially adversely affect our business, financialcondition, operating results and cash flow.We may change our compensation plans for the sales organization from time to time in order to align the sales forcewith the Company’s economic interests. Under the terms of CA’s Incentive Compensation Plan (Incentive CompensationPlan), management retains broad discretion to change various aspects of the Incentive Compensation Plan such as salesquotas or territory assignments, to ensure that the plan is aligned with CA’s overall business objectives. However, thelaws of many of the countries and states in which CA operates impose limitations on the amount of discretion acompany’s management may exercise on compensation matters such as commissions. The Incentive Compensation Planitself, or changes made by management where CA exercises discretion to change the Incentive Compensation Plan, maylead to outcomes that are not anticipated or intended and may adversely affect our cost of doing business, employeemorale, or other performance metrics, all of which could materially adversely affect our business, financial condition,operating results and cash flow.
Failure to expand our channel partner programs related to the sale of CA solutions may result in lost sales opportunities,increases in expenses and weakening in our competitive position.We sell CA solutions through systems integrators and value-added resellers in channel partner programs that requiretraining and expertise to sell these solutions, and global penetration to grow these aspects of our business. The failure toexpand these channel partner programs and penetrate these markets could materially adversely affect our success withchannel partners, resulting in lost sales opportunities and an increase in expenses, as well as weaken our competitiveposition.
If we do not adequately manage and evolve our financial reporting and managerial systems and processes, including thesuccessful implementation of our enterprise resource planning software, our ability to manage and grow our businessmay be harmed.Our ability to successfully implement our business plan and comply with regulations requires effective planning andmanagement systems and processes. We need to continue to improve and implement existing and new operational andfinancial systems, procedures and controls to manage our business effectively in the future. As a result, we havelicensed enterprise resource planning software, consolidated certain finance functions into regional locations, and are inthe process of expanding and upgrading our operational and financial systems. Any delay in the implementation of, ordisruption in the transition to, our new or enhanced systems, procedures or internal controls, could adversely affect ourability to accurately forecast sales demand, manage our supply chain, achieve accuracy in the conversion of electronicdata and records, and report financial and management information, including the filing of our quarterly or annualreports with the SEC, on a timely and accurate basis. Failure to properly or adequately address these issues could resultin the diversion of management’s attention and resources, adversely affect our ability to manage our business andmaterially adversely affect our business, financial condition, results of operations and cash flow. Refer to Item 9A,“Controls and Procedures,” for additional information.
10
%%TRANSMSG*** Transmitting Job: Y77913 PCN: 012000000 ***%%PCMSG|10 |00012|Yes|No|07/07/2009 22:17|0|0|Page is valid, no graphics -- Color: D|

We may encounter difficulties in successfully integrating companies and products that we have acquired or may acquireinto our existing business and, therefore, such failed integration could materially adversely affect our infrastructure,market presence, or results of operations.In the past we have acquired, and in the future we expect to acquire complementary companies, products, services andtechnologies (including through mergers, asset acquisitions, joint ventures, partnerships, strategic alliances, and equityinvestments). The risks we may encounter include:
• We may find that the acquired company or assets do not further improve our financial and strategic position asplanned;
• We may have difficulty integrating the operations, facilities, personnel and commission plans of the acquiredbusiness;
• We may have difficulty forecasting or reporting results subsequent to acquisitions;
• We may have difficulty retaining the technical skills needed to provide services on the acquired products;
• We may have difficulty incorporating the acquired technologies or products with our existing product lines;
• We may have product liability, customer liability or intellectual property liability associated with the sale of theacquired company’s products;
• Our ongoing business may be disrupted by transition or integration issues; our management’s attention may bediverted from other business concerns;
• We may be unable to obtain timely approvals from governmental authorities under applicable competition andantitrust laws;
• We may have difficulty maintaining uniform standards, controls, procedures and policies;
• Our relationships with current and new employees, customers and distributors could be impaired;
• An acquisition may result in increased litigation risk, including litigation from terminated employees or third parties;
• We may have difficulty with determinations related to accounting matters, including those that require a high degreeof judgment or complex estimation processes, including valuation and accounting for goodwill and intangible assets,stock-based compensation, and income tax matters; and
• Our due diligence process may fail to identify significant issues with the acquired company’s product quality, financialdisclosures, accounting practices, internal control deficiencies, including material weaknesses, product architecture,legal contingencies and other matters.
These factors could have a material adverse effect on our business, results of operations, financial condition and cashflow, particularly in the case of a large acquisition or number of acquisitions. To the extent we issue shares of stock orother rights to purchase stock, including options, to pay for acquisitions or to retain employees, existing stockholders’interests may be diluted and net income per share may decrease.
We are subject to intense competition in product and service offerings and pricing, and we expect to face increasedcompetition in the future, which could either diminish demand for or inhibit growth of our products and, therefore,reduce our sales, revenue and market presence.The markets for our products are intensely competitive, and we expect product and service offerings and pricingcompetition to increase. Some of our competitors have longer operating histories, greater name recognition, a largerinstalled base of customers in any particular market niche, larger technical staffs, established relationships with hardwarevendors or greater financial, technical and marketing resources. We also face competition from numerous smallercompanies that specialize in specific aspects of the highly fragmented software industry, and from shareware authors thatmay develop competing products. In addition, new companies enter the market on a frequent and regular basis, offeringproducts that compete with those offered by us. Moreover, certain customers historically have developed their ownproducts that compete with those offered by us. The competition may affect our ability to attract and retain the technicalskills needed to provide services to our customers, forcing us to become more reliant on delivery of services through thirdparties. This, in turn, could increase operating costs and decrease our revenue, profitability and cash flow. Additionally,
11
%%TRANSMSG*** Transmitting Job: Y77913 PCN: 013000000 ***%%PCMSG|11 |00013|Yes|No|07/07/2009 23:12|0|0|Page is valid, no graphics -- Color: D|

competition from any of these sources could result in price reductions or displacement of our products, which could havea material adverse effect on our business, financial condition, operating results and cash flow.
Our competitors include large vendors of hardware and operating system software and service providers. Thewidespread inclusion of products that perform the same or similar functions as our products bundled within computerhardware or other companies’ software products, or services similar to those provided by us, could reduce the perceivedneed for our products and services, or render our products obsolete and unmarketable. Furthermore, even if theseincorporated products are inferior or more limited than our products, customers may elect to accept the incorporatedproducts rather than purchase our products. In addition, the software industry is currently undergoing consolidation assoftware companies seek to offer more extensive suites and broader arrays of software products and services, as well asintegrated software and hardware solutions. This consolidation may adversely affect our competitive position, whichcould materially adversely affect our business, financial condition, operating results and cash flow. Refer to Item 1,“Business — (c) Narrative Description of the Business — Competition,” for additional information.
Our business may suffer if we are not able to retain and attract adequate qualified personnel, including key managerial,technical, marketing and sales personnel.We operate in a business where there is intense competition for experienced personnel in all of our global markets. Wedepend on our ability to identify, recruit, hire, train, develop and retain qualified and effective personnel. Our ability to doso depends on numerous factors, including factors that we cannot control, such as competition and conditions in thelocal employment markets in which we operate. Our future success depends in large part on the continued contributionof our senior management and other key employees. A loss of a significant number of skilled managerial or otherpersonnel could have a negative effect on the quality of our products. A loss of a significant number of experienced andeffective sales personnel could result in fewer sales of our products. Our failure to retain qualified employees in thesecategories could materially adversely affect our business, financial condition, operating results and cash flow.
Failure to adapt to technological change in a timely manner could materially adversely affect our business.If we fail to keep pace with technological change in our industry, that failure would have an adverse effect on ourrevenue and earnings. We operate in a highly competitive industry characterized by rapid technological change, evolvingindustry standards, changes in customer requirements and frequent new product introductions and enhancements.During the past several years, many new technological advancements and competing products entered the marketplace.The distributed systems and application management markets in which we operate are far more crowded andcompetitive than our traditional mainframe systems management markets.
Our ability to compete effectively and our growth prospects for all of our products depend upon many factors, includingthe success of our existing distributed systems products, the timely introduction and success of future softwareproducts, and the ability of our products to perform well with existing and future leading databases and other platformssupported by our products. We have experienced long development cycles and product delays in the past, particularlywith some of our distributed systems products, and may experience delays in the future. In addition, we have incurred,and expect to continue to incur, significant research and development costs, as we introduce new products. If there aredelays in new product introductions or less-than-anticipated market acceptance of these new products, we will haveinvested substantial resources without realizing adequate revenues in return, which could materially adversely affect ourbusiness, financial condition, operating results and cash flow.
If our products do not remain compatible with ever-changing operating environments we could lose customers and thedemand for our products and services could decrease, which could materially adversely affect our business, financialcondition, operating results and cash flow.The largest suppliers of systems and computing software are, in most cases, the manufacturers of the computerhardware systems used by most of our customers. Historically, these companies have from time to time modified orintroduced new operating systems, systems software and computer hardware. In the future, such new products fromthese companies could incorporate features that perform functions currently performed by our products, or could requiresubstantial modification of our products to maintain compatibility with these companies’ hardware or software.Although we have to date been able to adapt our products and our business to changes introduced by hardwaremanufacturers and system software developers, there can be no assurance that we will be able to do so in the future.
12
%%TRANSMSG*** Transmitting Job: Y77913 PCN: 014000000 ***%%PCMSG|12 |00013|Yes|No|07/07/2009 23:12|0|0|Page is valid, no graphics -- Color: D|

Failure to adapt our products in a timely manner to such changes or customer decisions to forgo the use of ourproducts in favor of those with comparable functionality contained either in their hardware or operating system couldhave a material adverse effect on our business, financial condition, operating results and cash flow.
Certain software that we use in our products is licensed from third parties and thus may not be available to us in thefuture, which has the potential to delay product development and production and, therefore, could materially adverselyaffect our business, financial condition, operating results and cash flow.Some of our solutions contain software licensed from third parties. Some of these licenses may not be available to us inthe future on terms that are acceptable to us or allow our products to remain competitive. The loss of these licenses orthe inability to maintain any of them on commercially acceptable terms could delay development of future products orthe enhancement of existing products.
We may also choose to pay a premium price for such a license in certain circumstances where continuity of thelicensed product would outweigh the premium cost of the license. The unavailability of these licenses or the necessity ofagreeing to commercially unreasonable terms for such licenses could have a material adverse effect on our business,financial condition, operating results and cash flow.
Certain software we use is from open source code sources, which, under certain circumstances, may lead to unintendedconsequences and, therefore, could materially adversely affect our business, financial condition, operating results andcash flow.Some of our products contain software from open source code sources. The use of such open source code may subjectus to certain conditions, including the obligation to offer our products that use open source code for no cost. Wemonitor our use of such open source code to avoid subjecting our products to conditions we do not intend. However,the use of such open source code may ultimately subject some of our products to unintended conditions, so that we arerequired to take remedial action that may divert resources away from our development efforts and therefore could havea material adverse effect on our business, financial condition, operating results and cash flow.
Discovery of errors in our software could materially adversely affect our revenue and earnings and subject us to productliability claims, which may be costly and time consuming.The software products we offer are inherently complex. Despite testing and quality control, we cannot be certain thaterrors will not be found in current versions, new versions or enhancements of our products after commencement ofcommercial shipments. If new or existing customers have difficulty deploying our products or require significantamounts of customer support, our operating margins could be adversely affected. Moreover, we could face possibleclaims and higher development costs if our software contains errors that we have not detected or if our softwareotherwise fails to meet our customers’ expectations. Significant technical challenges also arise with our productsbecause our customers license and deploy our products across a variety of computer platforms and integrate them witha number of third-party software applications and databases. These combinations increase our risk further because, inthe event of a system-wide failure, it may be difficult to determine which product is at fault; thus, we may be harmed bythe failure of another supplier’s products. As a result of the foregoing, we could experience:
• Loss of or delay in revenue and loss of market share;
• Loss of customers, including the inability to do repeat business with existing key customers;
• Damage to our reputation;
• Failure to achieve market acceptance;
• Diversion of development resources;
• Increased service and warranty costs;
• Legal actions by customers against us that could, whether or not successful, be costly, distracting and time-consuming;
• Increased insurance costs; and
• Failure to successfully complete service engagements for product installations and implementations.
13
%%TRANSMSG*** Transmitting Job: Y77913 PCN: 015000000 ***%%PCMSG|13 |00013|Yes|No|07/07/2009 23:12|0|0|Page is valid, no graphics -- Color: D|

Consequently, the discovery of errors in our products after delivery could have a material adverse effect on our business,financial condition, operating results and cash flow.
We have a significant amount of debt. Changes in market conditions or our ratings could increase our interest costs andadversely affect the cost of refinancing our debt and our ability to refinance our debt, which could materially adverselyaffect our business, financial condition, operating results and cash flow.As of March 31, 2009, we had $1,937 million of debt outstanding, consisting of unsecured fixed-rate senior noteobligations, convertible senior notes, and credit facility borrowings. Refer to Note 7, “Debt,” in the Notes to theConsolidated Financial Statements for the payment schedule of our long-term debt obligations. Our senior unsecurednotes are rated by Moody’s Investors Service, Fitch Ratings, and Standard and Poor’s. These agencies or any other creditrating agency could downgrade or take other negative action with respect to our credit ratings in the future. If our creditratings were downgraded or other negative action is taken, we would be required to, among other things, pay additionalinterest on outstanding borrowings under our principal revolving credit agreement. Any downgrades could affect ourability to obtain additional financing in the future and may affect the terms of any such financing.
We expect that existing cash, cash equivalents, marketable securities, cash provided from operations and our bank creditfacilities will be sufficient to meet ongoing cash requirements. However, our failure to generate sufficient cash as ourdebt becomes due or to renew credit lines prior to their expiration could materially adversely affect our business,financial condition, operating results and cash flow.
Failure to protect our intellectual property rights and source code would weaken our competitive position.Our future success is highly dependent upon our proprietary technology, including our software and our source code forthat software. Failure to protect such technology could lead to our loss of valuable assets and competitive advantage.We protect our proprietary information through the use of patents, copyrights, trademarks, trade secret laws,confidentiality procedures and contractual provisions. Notwithstanding our efforts to protect our proprietary rights,policing unauthorized use or copying of our proprietary information is difficult. Unauthorized use or copying occurs fromtime to time and litigation to enforce intellectual property rights could result in significant costs and diversion ofresources. Moreover, the laws of some foreign jurisdictions do not afford the same degree of protection to ourproprietary rights as do the laws of the United States. For example, for some of our products, we rely on “shrink-wrap”or “click-on” licenses, which may be unenforceable in whole or in part in some jurisdictions in which we operate. Inaddition, patents we have obtained may be circumvented, challenged, invalidated or designed around by othercompanies. If we do not adequately protect our intellectual property for these or other reasons, our business, financialcondition, operating results and cash flow could be materially adversely affected. Refer to “Item 1, Business —(c) Narrative Description of the Business — Patents and Trademarks,” for additional information.
The number, terms and duration of our license agreements as well as the timing of orders from our customers andchannel partners, may cause fluctuations in some of our key financial metrics, which may affect our quarterly financialresults.Historically, a substantial portion of our license agreements are executed in the last month of a quarter and the numberof contracts executed during a given quarter can vary substantially. In addition, we experience a historically long salescycle, which is driven in part by the varying terms and conditions of our software contracts. These factors can make itdifficult for us to predict bookings and cash flow on a quarterly basis. Any failure or delay in executing new or renewedlicense agreements in a given quarter could cause declines in some of our key financial metrics (e.g., bookings or cashflow), and, accordingly, increases the risk of unanticipated variations in our quarterly results and financial condition.
We may become dependent upon large transactions, and the failure to close such transactions on a satisfactory basiscould materially adversely affect our business, financial condition, operating results and cash flow.In the past, we have been dependent upon large-dollar enterprise transactions with individual customers. There can beno assurances that we will not be reliant on large-dollar enterprise transactions in the future, and the failure to closethose transactions on terms that are commercially attractive to us could materially adversely affect our business,financial condition, operating results and cash flow.
14
%%TRANSMSG*** Transmitting Job: Y77913 PCN: 016000000 ***%%PCMSG|14 |00013|Yes|No|07/07/2009 23:12|0|0|Page is valid, no graphics -- Color: D|
Our sales to government clients subject us to risks, including early termination, audits, investigations, sanctions andpenalties.Approximately 10% of our total revenue backlog as of March 31, 2009 is associated with multi-year contracts signedwith the U.S. federal government and other U.S. state and local governmental agencies. These contracts are generallysubject to annual fiscal funding approval, may be terminated at the convenience of the government, or both. Terminationof a contract or funding for a contract could adversely affect our sales, revenue and reputation. Additionally, governmentcontracts are generally subject to audits and investigations, which could result in various civil and criminal penalties andadministrative sanctions, including termination of contracts, refund of a portion of fees received, forfeiture of profits,suspension of payments, fines and suspensions or debarment from doing business with the government.
Our customers’ data centers and IT environments may be subject to hacking or other breaches, harming the marketperception of the effectiveness of our products.If an actual or perceived breach of our customers’ network security occurs, allowing access to our customers’ datacenters or other parts of their IT environments, regardless of whether the breach is attributable to our products, themarket perception of the effectiveness of our products could be harmed. Because the techniques used by computerhackers to access or sabotage networks change frequently and may not be recognized until launched against a target,we may be unable to anticipate these techniques. Alleviating any of these problems could require significantexpenditures of our capital and diversion of our resources from development efforts. Additionally, these efforts couldcause interruptions, delays or cessation of our product licensing, or modification of our software, which could cause usto lose existing or potential customers, which could materially adversely affect our business, financial condition,operating results and cash flow.
Our software products, data centers and IT environments may be subject to hacking or other breaches, harming themarket perception of the effectiveness of our products.We expect to be an ongoing target of attacks specifically designed to impede the performance of our products. Similarly,experienced computer programmers, or hackers, may attempt to penetrate our network security or the security of ourdata centers and IT environments and misappropriate proprietary information or cause interruptions of our services.Although we believe we have sufficient controls in place to prevent significant external disruptions, if these intentionallydisruptive efforts are successful, our activities could be adversely affected, our reputation and future sales could beharmed and our business, financial condition, operating results and cash flow could be materially adversely affected.
The use of third-party microcode could negatively affect our product development.We anticipate ongoing use of microcode or firmware provided by hardware manufacturers. Microcode and firmware areessentially software programs embedded in hardware and are, therefore, less flexible than other types of software. Webelieve that such continued use will not have a significant impact on our operations and that our products will remaincompatible with any changes to such code. However, future technological developments involving such microcode couldhave a material adverse effect on our business, financial condition, operating results and cash flow.
We may lose access to third-party operating systems, which could materially adversely affect future productdevelopment.In the past, certain of our licensees using proprietary operating systems were furnished with “source code,” which makesthe operating system understandable to programmers; or “object code,” which directly controls the hardware; and othertechnical documentation. Since the availability of source code facilitated the development of systems and applicationssoftware, which must interface with the operating systems, independent software vendors, such as us, were able todevelop and market compatible software. Other vendors, including some of the largest vendors, have a policy ofrestricting the use or availability of the source code for some of their operating systems. To date, this policy has not hada material effect on us. Some companies, however, may adopt more restrictive policies in the future or imposeunfavorable terms and conditions for such access. These restrictions may, in the future, result in higher research anddevelopment costs for us in connection with the enhancement and modification of our existing products and thedevelopment of new products. There can be no assurance that such restrictions will not have a material adverse effecton our business, financial condition, operating results and cash flow.
15
%%TRANSMSG*** Transmitting Job: Y77913 PCN: 017000000 ***%%PCMSG|15 |00013|Yes|No|07/07/2009 23:12|0|0|Page is valid, no graphics -- Color: D|

Third parties could claim that our products infringe their intellectual property rights or that we owe royalty payments,which could result in significant litigation expense or settlement with unfavorable terms, which could materiallyadversely affect our business, financial condition, operating results and cash flow.From time to time, third parties have claimed and may claim that our products infringe various forms of their intellectualproperty or that we owe royalty payments to them. Investigation of these claims can be expensive and could affectdevelopment, marketing or shipment of our products. As the number of software patents issued increases, it is likelythat additional claims will be asserted. Defending against such claims is time-consuming and could result in significantlitigation expense or settlement on unfavorable terms, which could materially adversely affect our business, financialcondition, operating results and cash flow.
Fluctuations in foreign currencies could result in translation losses.Our consolidated financial results are reported in U.S. dollars. Most of the revenue and expenses of our foreignsubsidiaries are denominated in local currencies. Given that cash is typically received over an extended period of timefor many of our license agreements and given that a substantial portion of our revenue is generated outside of the U.S.,foreign currency fluctuations could result in substantial changes in reported revenues and operating results due to theforeign currency impact upon translation of these transactions into U.S. dollars.
In the normal course of business, we employ various strategies to manage these risks, including the use of derivativeinstruments. To the extent that these strategies do not manage all of the risks inherent in our foreign exchangeexposures or that these strategies may cause our earnings and expenses to fluctuate more than they would have hadthese strategies not been employed, fluctuations of the exchange rates of foreign currencies against the U.S. dollar couldmaterially adversely affect our business, financial condition, operating results and cash flow.
Any failure by us to execute our restructuring plans and related sales model changes successfully could result in totalcosts that are greater than expected or revenues that are less than anticipated.We have announced restructuring plans, which include workforce reductions as well as global facility consolidations andother cost reduction initiatives. We may have further workforce reductions or restructuring actions in the future. Risksassociated with these actions and other workforce management issues include delays in implementation of anticipatedworkforce reductions, changes in restructuring plans that increase or decrease the number of employees affected,decreases in employee morale and the failure to meet operational targets due to the loss of employees, any of whichmay impair our ability to achieve anticipated cost reductions or may otherwise harm our business, which couldmaterially adversely affect our financial condition, operating results and cash flow.
Our restructuring efforts in Asia focused on shifting our sales model in certain smaller countries from a direct salesforce model to an indirect, partner-led model. We may implement this strategy in other regions in the future. Risksassociated with this business model shift include the potential inability of our partners to sell our products effectivelyand to provide adequate implementation services and product support. A greater reliance on partners will also subjectus to further third party risks associated with business practices in those regions.
We have outsourced various functions to third parties and these arrangements may not be successful, thereby resultingin increased costs, or may adversely affect service levels and our public reporting.We have outsourced various functions to third parties including certain development functions and may outsourceadditional functions to third-party providers in the future. We rely on those third parties to provide services on a timelyand effective basis. Although we periodically monitor the performance of these third parties and maintain contingencyplans in case the third parties are unable to perform as agreed, we do not ultimately control the performance of ouroutsourcing partners. The failure of third-party outsourcing partners to perform as expected or as required by contractcould result in significant disruptions and costs to our operations, which could materially adversely affect our business,financial condition, operating results and cash flow and our ability to file our financial statements with the Securities andExchange Commission timely or accurately.
Potential tax liabilities may materially adversely affect our results.We are subject to income taxes in the United States and in numerous foreign jurisdictions. Significant judgment isrequired in determining our worldwide provision for income taxes. In the ordinary course of our business, there are many
16
%%TRANSMSG*** Transmitting Job: Y77913 PCN: 018000000 ***%%PCMSG|16 |00012|Yes|No|07/07/2009 22:17|0|0|Page is valid, no graphics -- Color: D|

transactions and calculations where the ultimate tax determination is uncertain. We are regularly under audit by taxauthorities. Although we believe our tax estimates are reasonable, the final determination of tax audits and any relatedlitigation could be materially different from that which is reflected in our income tax provisions and accruals. Additionaltax assessments resulting from an audit or litigation may result in increased tax provisions or payments which couldmaterially adversely affect our financial condition, operating results and cash flow in the period or periods in which thatdetermination is made.
ITEM 2. PROPERTIES.Our principal real estate properties are located in areas necessary to meet sales and operating requirements. All of theproperties are considered to be both suitable and adequate to meet current and anticipated operating requirements.
As of March 31, 2009, we leased 68 facilities throughout the United States and 113 facilities outside the United States.Our lease obligations expire on various dates with the longest commitment extending to 2023. We believe all of ourleases will be renewable at market terms at our option as they become due.
We own one facility in Germany totaling approximately 100,000 square feet, two facilities in Italy which totalapproximately 140,000 square feet, one facility in India totaling approximately 255,000 square feet and an approximately215,000 square foot European headquarters in the United Kingdom.
We own and lease various computer, telecommunications, electronic, and transportation equipment. We also leasemainframe and distributed computers at our facilities in Islandia, New York, and Lisle, Illinois. This equipment is used forinternal product development, technical support efforts, and administrative purposes. We consider our computer andother equipment to be adequate for our current and anticipated needs. Refer to “Contractual Obligations” in Item 7,“Management’s Discussion and Analysis of Financial Condition and Results of Operations,” and Note 8, “Commitmentsand Contingencies,” in the Notes to the Consolidated Financial Statements for additional information.
ITEM 3. LEGAL PROCEEDINGS.On April 9, 2007, the Company filed a complaint in the United States District Court for the Eastern District of New York(the Federal Court) against Rocket Software, Inc. (Rocket). On August 1, 2007, the Company filed an amendedcomplaint alleging that Rocket misappropriated intellectual property associated with a number of the Company’sdatabase management software products. The amended complaint included causes of action for copyright infringement,misappropriation of trade secrets, unfair competition, and unjust enrichment. In the amended complaint, the Companysought damages of at least $200 million for Rocket’s alleged theft and misappropriation of the Company’s intellectualproperty, as well as an injunction preventing Rocket from continuing to distribute the database management softwareproducts at issue. On February 10, 2009, the Company announced that it had reached a settlement with Rocketresolving the Company’s claims of copyright infringement and trade secret misappropriation. As part of the settlement,Rocket agreed to license technology from the Company, including source code authored several years ago and relatedtrade secrets that were the subject of the litigation for $50 million to be received and recognized as software fees andother with the consolidated statement of operations in increments through fiscal 2014. Rocket did not admit anywrongdoing in connection with this settlement.
ITEM 4. SUBMISSION OF MATTERS TO A VOTE OF SECURITY HOLDERS.None.
Executive Officers of the Registrant.The name, age, present position, and business experience for the past five years of our executive officers as of May 15,2009 are listed below:
John A. Swainson, 54, has been Chief Executive Officer of the Company since February 2005 and a member of theCompany’s Board of Directors since November 2004. Mr. Swainson joined the Company in November 2004. He alsoserved as the Company’s President from November 2004 to March 2008. From July to November 2004, Mr. Swainsonwas Vice President of Worldwide Sales and Marketing of the Software Group at International Business Machines
17
%%TRANSMSG*** Transmitting Job: Y77913 PCN: 019000000 ***%%PCMSG|17 |00012|Yes|No|07/07/2009 22:17|0|0|Page is valid, no graphics -- Color: D|

Corporation (IBM), a manufacturer of information processing products and a technology, software, and networkingsystems manufacturer and developer. From 1997 to July 2004, he was General Manager of the Application Integrationand Middleware division of IBM’s Software Group.
Michael J. Christenson, 50, has been President of the Company since March 2008 and Chief Operating Officer sinceApril 2006. Mr. Christenson joined the Company in 2005. He served as the Company’s Executive Vice President ofStrategy and Business Development from February 2005 to April 2006. He retired in 2004 from Citigroup GlobalMarkets, Inc. after a 23-year career as an investment banker, where he was responsible for that company’s GlobalPrivate Equity Investment Banking, North American Regional Investment Banking, and Latin American InvestmentBanking.
Russell M. Artzt, 62, co-founded the Company in June 1976. He has been Vice Chairman and Founder of the Companysince April 2007, playing an instrumental role in the evolution of the Company’s EITM vision. Mr. Artzt also providescounsel in the areas of strategic partnerships, product development leadership, and corporate strategy. Mr. Artzt was theCompany’s Executive Vice President of Products from January 2004 to April 2007 and was Executive Vice President,eTrust» Solutions from April 2002 to January 2004.
James E. Bryant, 64, has been Executive Vice President, Risk, and Chief Administrative Officer of the Company sinceApril 2009. He is responsible for the Company’s information technology, facilities and administration, corporatetransformation, enterprise risk management, internal audit and internal controls. Mr. Bryant joined the Company inJune 2006. He served as the Company’s Executive Vice President and Chief Administrative Officer from June 2006 toMarch 2009. From 2005 to June 2006, Mr. Bryant was a member of Common Angels, a Boston-based investment groupthat provides funding and mentoring for high technology start-ups. From 2003 to June 2006, he was a Selectman for theTown of Hamilton, Massachusetts. From 1994 to 2002, Mr. Bryant served as Vice President of Finance in IBM’s SoftwareGroup.
Nancy E. Cooper, 55, has been Executive Vice President and Chief Financial Officer of the Company since she joined theCompany in August 2006. From December 2001 to August 2006, she served as Senior Vice President and ChiefFinancial Officer of IMS Health Incorporated, a provider of information solutions to the pharmaceutical and healthcareindustries. Ms. Cooper began her career at IBM, where she held positions of increasing responsibility over a 22-yearperiod including Chief Financial Officer of the Global Industries Division, Assistant Corporate Controller, and Controllerand Treasurer of IBM Credit Corporation.
Andrew Goodman, 50, has been Executive Vice President, Worldwide Human Resources of the Company sinceJuly 2005. Mr. Goodman joined the Company in July 2002. From July 2002 to July 2005, he served as Senior VicePresident of Human Resources.
Ajei S. Gopal, 47, has been Executive Vice President, Products and Technology Group, since February 2009. Dr. Gopalhas overall responsibility for the Company’s Products and Technology Group, including the EITM Group, the MainframeBusiness Unit, the IT Governance Business Unit and the Office of the Chief Technology Officer. He joined the Companyin July 2006. He served as Senior Vice President and General Manager, Enterprise Systems Management Business Unitfrom July 2006 to May 2007, as Executive Vice President and General Manager of the Management Business Unit andSecurity Business Unit from May 2007 to January 2008 and as Executive Vice President, EITM Group from January2008 to February 2009. Dr. Gopal was with Symantec Corporation, a provider of infrastructure software, from September2004 to July 2006, where he served most recently as Executive Vice President and Chief Technology Officer, and earlieras Senior Vice President, Global Technology and Corporate Development. From June 2001 to June 2004, Dr. Gopal waswith ReefEdge Networks, a provider of wireless LAN systems, a company he co-founded, where he served on the Boardof Directors and held several executive roles.
Jacob Lamm, 44, has been the Company’s Executive Vice President, Strategy and Corporate Development, sinceFebruary 2009. He joined the Company in 1998. He is responsible for coordinating the Company’s overall businessstrategy, as well as the Company’s strategy for acquisitions. He served as the Company’s Executive Vice President,Governance Group from January 2008 to February 2009, as Executive Vice President and General Manager, BusinessService Optimization Business Unit from March 2007 to January 2008, as Senior Vice President, General Manager andBusiness Unit Executive from April 2005 to March 2007, and as Senior Vice President, Development from October 2003to April 2005.
18
%%TRANSMSG*** Transmitting Job: Y77913 PCN: 020000000 ***%%PCMSG|18 |00014|Yes|No|07/07/2009 23:14|0|0|Page is valid, no graphics -- Color: D|

Amy Fliegelman Olli, 45, has been Executive Vice President and General Counsel of the Company since February 2007.She is responsible for all of the Company’s legal and compliance functions worldwide. Ms. Olli joined the Company inSeptember 2006. From September 2006 to February 2007, she served as Executive Vice President and Co-GeneralCounsel of the Company. Before September 2006, Ms. Olli spent nearly 20 years in various senior-level legal positionswith divisions of IBM, most recently as General Counsel — Americas and Global Coordinator for Sales and Distributionfor IBM, where she was responsible for a team of more than 200 lawyers in the U.S., Europe, Latin America and Canada,and for coordination of all of IBM’s sales and distribution lawyers on a global basis.
19
%%TRANSMSG*** Transmitting Job: Y77913 PCN: 021000000 ***%%PCMSG|19 |00013|Yes|No|07/07/2009 23:14|0|0|Page is valid, no graphics -- Color: D|

Part IIITEM 5. MARKET FOR REGISTRANT’S COMMON EQUITY, RELATEDSTOCKHOLDER MATTERS AND ISSUER PURCHASES OF EQUITY SECURITIES.During fiscal 2008 and through April 27, 2008, our common stock was traded on the New York Stock Exchange underthe symbol “CA.” On April 28, 2008, our common stock commenced trading on The NASDAQ Global Select Market tierof The NASDAQ Stock Market LLC (“NASDAQ”) under the same symbol. The following table sets forth, for the fiscalquarters indicated, the quarterly high and low closing sales prices on the NASDAQ and the New York Stock Exchange,as applicable:
HIGH LOW HIGH LOW
FISCAL 2009 FISCAL 2008
Fourth Quarter $ 18.90 $ 15.40 $ 26.31 $ 21.26
Third Quarter $ 20.12 $ 14.37 $ 27.18 $ 24.15
Second Quarter $ 24.63 $ 18.31 $ 26.68 $ 23.41
First Quarter $ 26.54 $ 21.67 $ 28.21 $ 25.39
On March 31, 2009, the closing price for our common stock on the NASDAQ was $17.61. As of March 31, 2009, wehad approximately 9,300 stockholders of record.
We have paid cash dividends each year since July 1990. For each of fiscal 2009, 2008 and 2007, we paid annual cashdividends of $0.16 per share, which have been paid out in quarterly installments of $0.04 per share as and whendeclared by the Board of Directors.
Purchases of Equity Securities by the IssuerOn October 29, 2008, our Board of Directors approved a stock repurchase program that authorizes us to acquire up to$250 million of our common stock. During the third quarter of fiscal 2009, we paid $4 million to repurchaseapproximately 0.3 million of our common shares at an average price of $15.84 per share. As of March 31, 2009, weremained authorized to purchase an aggregate amount of up to approximately $246 million of additional commonshares under our current stock repurchase program.
20
%%TRANSMSG*** Transmitting Job: Y77913 PCN: 022000000 ***%%PCMSG|20 |00011|Yes|No|07/07/2009 22:17|0|0|Page is valid, no graphics -- Color: D|

ITEM 6. SELECTED FINANCIAL DATA.The information set forth below should be read in conjunction with the “Results of Operations” section included inItem 7, “Management’s Discussion and Analysis of Financial Condition and Results of Operations.”
Statement of Operations Data
(IN MILLIONS, EXCEPT PER SHARE AMOUNTS) 2009 2008 2007 2006 2005
YEAR ENDED MARCH 31,
Revenue $ 4,271 $ 4,277 $ 3,943 $ 3,772 $ 3,583
Income from continuing operations1 694 500 121 160 27
Basic income from continuing operations per share 1.35 0.97 0.22 0.28 0.05
Diluted income from continuing operations per share 1.29 0.93 0.22 0.27 0.05
Dividends declared per common share 0.16 0.16 0.16 0.16 0.08
Balance Sheet and Other Data
(IN MILLIONS) 2009 2008 2007 2006 2005
MARCH 31,
Cash provided by continuing operating activities $ 1,212 $ 1,103 $ 1,068 $ 1,380 $ 1,527
Working capital surplus (deficit) 102 190 (51) (462) 199
Working capital, excluding deferred revenue2 2,533 2,854 2,332 1,694 2,243
Total assets 11,252 11,756 11,517 11,118 11,726
Long-term debt (less current maturities) 1,287 2,221 2,572 1,813 1,810
Stockholders’ equity 4,344 3,709 3,654 4,718 5,034
1 In fiscal 2009, 2008 and 2007 we incurred after-tax charges of $64 million, $74 million and $124 million, respectively, for restructuring and other costs. In fiscal 2007, we also incurredafter-tax charges of $6 million for write-offs of in-process research and development costs due to acquisitions.
In fiscal 2006, we incurred after-tax charges of $54 million for restructuring and other costs and an after-tax benefit of $5 million relating to the gain on the divestiture of assets that werecontributed during the formation of Ingres Corp. We also incurred an after-tax charge of $18 million for write-offs of in-process research and development costs due to acquisitions.
In fiscal 2005, we incurred after-tax charges of $144 million related to shareholder litigation and government investigation settlements, a tax expense charge of $55 million related to theplanned repatriation of $500 million in cash under the American Jobs Creation Act of 2004, and after-tax charges of $17 million for severance and other expenses in connection with arestructuring plan.
2 Deferred revenue includes all amounts billed or collected in advance of revenue recognition from all sources including subscription license agreements, maintenance, and professionalservices. It does not include unearned revenue on future installments not yet billed as of the respective balance sheet dates.
21
%%TRANSMSG*** Transmitting Job: Y77913 PCN: 023000000 ***%%PCMSG|21 |00013|Yes|No|07/07/2009 23:48|0|0|Page is valid, no graphics -- Color: D|
ITEM 7. MANAGEMENT’S DISCUSSION AND ANALYSIS OF FINANCIALCONDITION AND RESULTS OF OPERATIONS.IntroductionThis “Management’s Discussion and Analysis of Financial Condition and Results of Operations” (MD&A) is intended toprovide an understanding of our financial condition, change in financial condition, cash flow, liquidity and results ofoperations. This MD&A should be read in conjunction with our Consolidated Financial Statements and theaccompanying Notes to Consolidated Financial Statements appearing elsewhere in this Report. References in this MD&Ato fiscal 2009, fiscal 2008, fiscal 2007 and fiscal 2006, etc. are to our fiscal years ended on March 31, 2009, 2008,2007 and 2006, etc., respectively.
Business OverviewWe are the world’s leading independent information technology (IT) management software company, helpingorganizations manage IT to become lean and more productive, which can help them better compete, innovate and grow.We develop and deliver software that makes it easier for organizations to manage IT throughout complex computingenvironments and to help them govern, manage and secure their entire IT operation — all of the people, information,processes, systems, networks, applications and databases from Web services to the mainframe, regardless of thehardware or software they are using.
We license our products worldwide, principally to large IT service providers, financial services companies, governmentalagencies, retailers, manufacturers, educational institutions, and healthcare institutions. These customers typicallymaintain IT infrastructures that are both complex and central to their objectives for operational excellence.
We offer our software products and solutions directly to our customers through our direct sales force and indirectlythrough global systems integrators, managed service providers, technology partners, Enterprise IT Management (EITM)value-added resellers and distribution and volume partners.
CA’s Business ModelAs described in greater detail in Part I, Item 1, “Business,” we license our software products directly to customers aswell as through distributors, resellers and value-added resellers. We generate revenue from the following sources: licensefees — licensing our products on a right-to-use basis; maintenance fees — providing customer technical support andproduct enhancements; and service fees — providing professional services such as product implementation, consultingand education. The timing and amount of fees recognized as revenue during a reporting period are determined inaccordance with generally accepted accounting principles in the United States of America (GAAP). Revenue is reportednet of applicable sales taxes.
Under our business model, we offer customers a wide range of licensing options, including the flexibility to licensesoftware under month-to-month licenses or to fix their costs by committing to longer-term agreements. Licenses soldfor most of our software products permit customers to change their software product mix as their business andtechnology needs change and includes the right to receive software products in the future within defined product linesfor no additional fee, commonly referred to as unspecified future software products. In such instances, we do not havevendor-specific objective evidence (VSOE) for the fair value of the undelivered elements, and we are therefore requiredunder GAAP to recognize revenue from such license agreements evenly on a monthly basis (also known as ratably) overthe license term.
A relatively small percentage of our revenue is recognized on a perpetual or up-front basis once all revenue recognitioncriteria are met in accordance with Statement of Position 97-2 “Software Revenue Recognition,” issued by the AmericanInstitute of Certified Public Accountants, as amended by SOP 98-9 “Modification of SOP 97-2, Software RevenueRecognition, With Respect to Certain Transactions” (SOP 97-2) (see “Critical Accounting Policies and Estimates” below fordetails). In such cases, these products are not sold with the right to receive unspecified future software products andVSOE exists for maintenance. We expect to continue to offer these types of licensing arrangements; therefore, theamount of revenue we expect to recognize on an up-front basis may increase to the extent that such licenseagreements are not executed within a short time frame of other agreements with the same customer or in
22
%%TRANSMSG*** Transmitting Job: Y77913 PCN: 024000000 ***%%PCMSG|22 |00014|Yes|No|07/07/2009 22:17|0|0|Page is valid, no graphics -- Color: D|

contemplation of other license agreements with the same customer where the right exists to receive unspecified futuresoftware products.
Several contracts executed prior to October 2000 (the prior business model) remain in effect and have not yet beenrenewed under license arrangements that contain the right to receive unspecified future software products. Under thoseagreements, we did not offer our customers the right to receive unspecified future software products and we record thepresent value of the license agreement as revenue at the time the license agreement was signed. As these customerlicense agreements are renewed under our current licensing model, we expect to see an increase in revenue backlogrelated to these licenses, from which subscription revenue will be amortized in future periods. The favorable impact onsubscription revenue from the conversion of contracts from our prior business model to our current business model isdecreasing over time as the transition is completed and was not material for fiscal 2009 or 2008. The remaining balanceof unbilled installment receivables that were previously recognized as revenue under our prior business model was$240 million and $342 million as of March 31, 2009 and March 31, 2008, respectively.
Under our license agreements, customers generally make installment payments for the right to use our softwareproducts over the term of the associated software license agreement. While the timing of revenue recognition is affectedby the offering of unspecified future software products, it generally has not changed the timing of how we bill andcollect cash from customers and as a result, our cash generated from operations has generally not been affected by theoffering of unspecified future software products.
Performance IndicatorsManagement uses several quantitative and qualitative performance indicators to assess our financial results andcondition. Each provides a measurement of the performance of our business model and how well we are executing ourplan.
Our predominantly subscription-based business model is unique among our competitors in the software industry and itmay be difficult to compare our results for many of our performance indicators with those of our competitors. Thefollowing is a summary of the principal quantitative and qualitative performance indicators that management uses toreview performance:
(DOLLARS IN MILLIONS) 2009 2008 CHANGEPERCENTCHANGE
YEAR ENDED MARCH 31,
Total revenue $ 4,271 $ 4,277 $ (6) —%
Subscription and maintenance revenue $ 3,772 $ 3,762 $ 10 —%
Net income $ 694 $ 500 $ 194 39%
Cash provided by operating activities $ 1,212 $ 1,103 $ 109 10%
Total bookings $ 5,245 $ 4,724 $ 521 11%
Subscription and maintenance bookings $ 4,783 $ 4,110 $ 673 16%
Weighted average subscription and maintenance license agreement duration in years 3.61 2.98 0.63 21%
Annualized subscription and maintenance bookings $ 1,325 $ 1,379 $ (54) (4)%
(DOLLARS IN MILLIONS)
AS OFMARCH 31,
2009
AS OFMARCH 31,
2008 CHANGEPERCENTCHANGE
Cash, cash equivalents and marketable securities1 $ 2,713 $ 2,796 $ (83) (3)%
Total debt $ 1,937 $ 2,582 $ (645) (25)%
Total expected future cash collections from committed contracts2 $ 4,914 $ 4,362 $ 552 13%
Total revenue backlog2 $ 7,378 $ 6,858 $ 520 8%
1 At March 31, 2009 and March 31, 2008, marketable securities were less than $1 million.
2 Refer to the discussion in the “Liquidity and Capital Resources” section of this MD&A for additional information on expected future cash collections from committed contracts, billingbacklog and revenue backlog.
Analyses of our performance indicators, including general trends, can be found in the “Results of Operations” and“Liquidity and Capital Resources” sections of this MD&A.
Subscription and Maintenance Revenue — Subscription and maintenance revenue is the amount of revenue recognizedratably during the reporting period from both: (i) subscription license agreements that were in effect during the period,
23
%%TRANSMSG*** Transmitting Job: Y77913 PCN: 025000000 ***%%PCMSG|23 |00013|Yes|No|07/07/2009 23:53|0|0|Page is valid, no graphics -- Color: D|

generally including maintenance that is bundled with and not separately identifiable from software usage fees or productsales, and (ii) maintenance agreements associated with providing customer technical support and access to softwarefixes and upgrades that are separately identifiable from software usage fees or product sales. These amounts include thesale of products directly by us, as well as by distributors, resellers and value-added resellers to end-users, where thecontracts incorporate the right for end-users to receive unspecified future software products and other contracts enteredinto in close proximity or contemplation of such agreements.
Total Bookings — Total bookings includes the incremental value of all subscription, maintenance and professional servicecontracts and software fees and other contracts entered into during the reporting period. Effective April 1, 2008, wechanged our performance indicator for measuring our new business activity from new deferred subscription value tototal bookings. In addition to what was previously included in new deferred subscription value, subscription andmaintenance bookings now includes the value of maintenance contracts committed by customers in the current periodthat were separate from license subscription contracts, whereas new deferred subscription value excluded certain ofthese types of agreements. The bookings amounts disclosed in this MD&A include the effects of this change. Theincremental value of subscription and maintenance agreements added was $252 million for the year ended March 31,2008. Total bookings also includes the value of new professional services and software fees and other contracts thatwere not previously included in new deferred subscription value.
Subscription and Maintenance Bookings — Subscription and maintenance bookings is the aggregate incremental amountwe expect to collect from our customers over the terms of the underlying subscription and maintenance agreementsentered into during a reporting period. These amounts include the sale of products directly by us, as well as indirectly bydistributors, resellers and value-added resellers to end-users, where the contracts incorporate the right for end-users toreceive unspecified future software products, and other contracts without these rights entered into in close proximity orcontemplation of such agreements. These amounts are expected to be recognized ratably as subscription andmaintenance revenue over the applicable term of the agreement. Subscription and maintenance bookings excludes thevalue associated with certain perpetual based licenses, license-only indirect sales, and professional servicesarrangements.
The license and maintenance agreements that contribute to subscription and maintenance bookings represent bindingpayment commitments by customers over periods that range generally from three to five years, although in certaincases customer commitments can be for longer periods. The amount of new subscription and maintenance bookingsrecorded in a period is affected by the volume and value of contracts renewed during that period. Our subscription andmaintenance bookings typically increase in each consecutive quarter during a fiscal year, with the first quarter being theleast and the fourth quarter being the most. However, subscription and maintenance bookings may not always followthe pattern of increasing in consecutive quarters during a fiscal year, and the quarter to quarter differences insubscription and maintenance bookings may vary. Additionally, period-to-period changes in subscription andmaintenance bookings do not necessarily correlate to changes in billings or cash receipts. The contribution to currentperiod revenue from subscription and maintenance bookings from any single license or maintenance agreement isrelatively small, since revenue is recognized ratably over the applicable term for these agreements.
Weighted Average Subscription and Maintenance License Agreement Duration in Years — The weighted average subscriptionand maintenance license agreement duration in years reflects the duration of all subscription and maintenanceagreements executed during a period, weighted by the total contract value of each individual agreement. EffectiveApril 1, 2008, our calculation of weighted average subscription and maintenance license agreement duration in yearsnow includes all subscription and maintenance contracts from both direct and indirect channels, whereas the priorcalculation reflected direct product subscription licenses only. This modification has also been reflected in the weightedaverage subscription and maintenance license agreement duration in years for fiscal 2008 for comparison purposes andresulted in a decrease of 0.24 years for fiscal 2008.
Annualized Subscription and Maintenance Bookings — Annualized subscription and maintenance bookings is an indicatorthat normalizes the bookings recorded in the current period to account for contract length. It is calculated by dividingthe total value of all new subscription and maintenance license agreements entered into during a period by the weightedaverage subscription and license agreement duration in years of all such license and maintenance agreements recordedduring the same period.
24
%%TRANSMSG*** Transmitting Job: Y77913 PCN: 026000000 ***%%PCMSG|24 |00015|Yes|No|07/07/2009 22:17|0|0|Page is valid, no graphics -- Color: D|
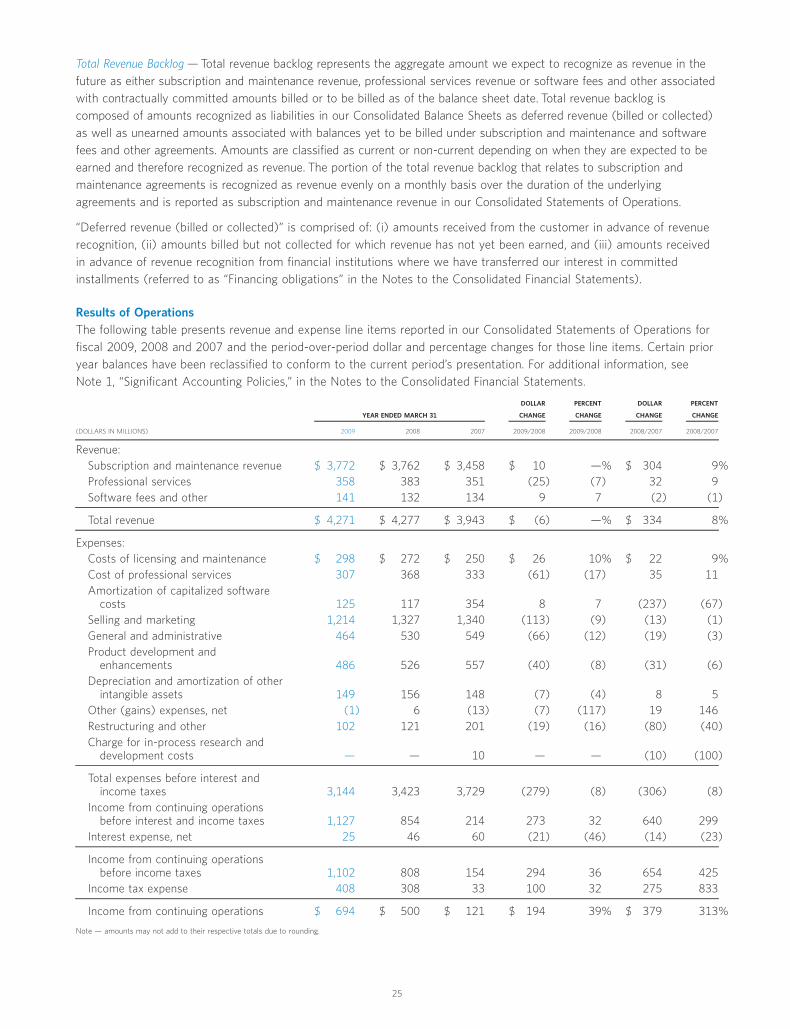
Total Revenue Backlog — Total revenue backlog represents the aggregate amount we expect to recognize as revenue in thefuture as either subscription and maintenance revenue, professional services revenue or software fees and other associatedwith contractually committed amounts billed or to be billed as of the balance sheet date. Total revenue backlog iscomposed of amounts recognized as liabilities in our Consolidated Balance Sheets as deferred revenue (billed or collected)as well as unearned amounts associated with balances yet to be billed under subscription and maintenance and softwarefees and other agreements. Amounts are classified as current or non-current depending on when they are expected to beearned and therefore recognized as revenue. The portion of the total revenue backlog that relates to subscription andmaintenance agreements is recognized as revenue evenly on a monthly basis over the duration of the underlyingagreements and is reported as subscription and maintenance revenue in our Consolidated Statements of Operations.
“Deferred revenue (billed or collected)” is comprised of: (i) amounts received from the customer in advance of revenuerecognition, (ii) amounts billed but not collected for which revenue has not yet been earned, and (iii) amounts receivedin advance of revenue recognition from financial institutions where we have transferred our interest in committedinstallments (referred to as “Financing obligations” in the Notes to the Consolidated Financial Statements).
Results of OperationsThe following table presents revenue and expense line items reported in our Consolidated Statements of Operations forfiscal 2009, 2008 and 2007 and the period-over-period dollar and percentage changes for those line items. Certain prioryear balances have been reclassified to conform to the current period’s presentation. For additional information, seeNote 1, “Significant Accounting Policies,” in the Notes to the Consolidated Financial Statements.
(DOLLARS IN MILLIONS) 2009 2008 2007 2009/2008 2009/2008 2008/2007 2008/2007
YEAR ENDED MARCH 31
DOLLAR
CHANGE
PERCENT
CHANGE
DOLLAR
CHANGE
PERCENT
CHANGE
Revenue:Subscription and maintenance revenue $ 3,772 $ 3,762 $ 3,458 $ 10 —% $ 304 9%Professional services 358 383 351 (25) (7) 32 9Software fees and other 141 132 134 9 7 (2) (1)
Total revenue $ 4,271 $ 4,277 $ 3,943 $ (6) —% $ 334 8%
Expenses:Costs of licensing and maintenance $ 298 $ 272 $ 250 $ 26 10% $ 22 9%Cost of professional services 307 368 333 (61) (17) 35 11Amortization of capitalized software
costs 125 117 354 8 7 (237) (67)Selling and marketing 1,214 1,327 1,340 (113) (9) (13) (1)General and administrative 464 530 549 (66) (12) (19) (3)Product development and
enhancements 486 526 557 (40) (8) (31) (6)Depreciation and amortization of other
intangible assets 149 156 148 (7) (4) 8 5Other (gains) expenses, net (1) 6 (13) (7) (117) 19 146Restructuring and other 102 121 201 (19) (16) (80) (40)Charge for in-process research and
development costs — — 10 — — (10) (100)
Total expenses before interest andincome taxes 3,144 3,423 3,729 (279) (8) (306) (8)
Income from continuing operationsbefore interest and income taxes 1,127 854 214 273 32 640 299
Interest expense, net 25 46 60 (21) (46) (14) (23)
Income from continuing operationsbefore income taxes 1,102 808 154 294 36 654 425
Income tax expense 408 308 33 100 32 275 833
Income from continuing operations $ 694 $ 500 $ 121 $ 194 39% $ 379 313%
Note — amounts may not add to their respective totals due to rounding.
25
%%TRANSMSG*** Transmitting Job: Y77913 PCN: 027000000 ***%%PCMSG|25 |00013|Yes|No|07/07/2009 22:17|0|0|Page is valid, no graphics -- Color: D|
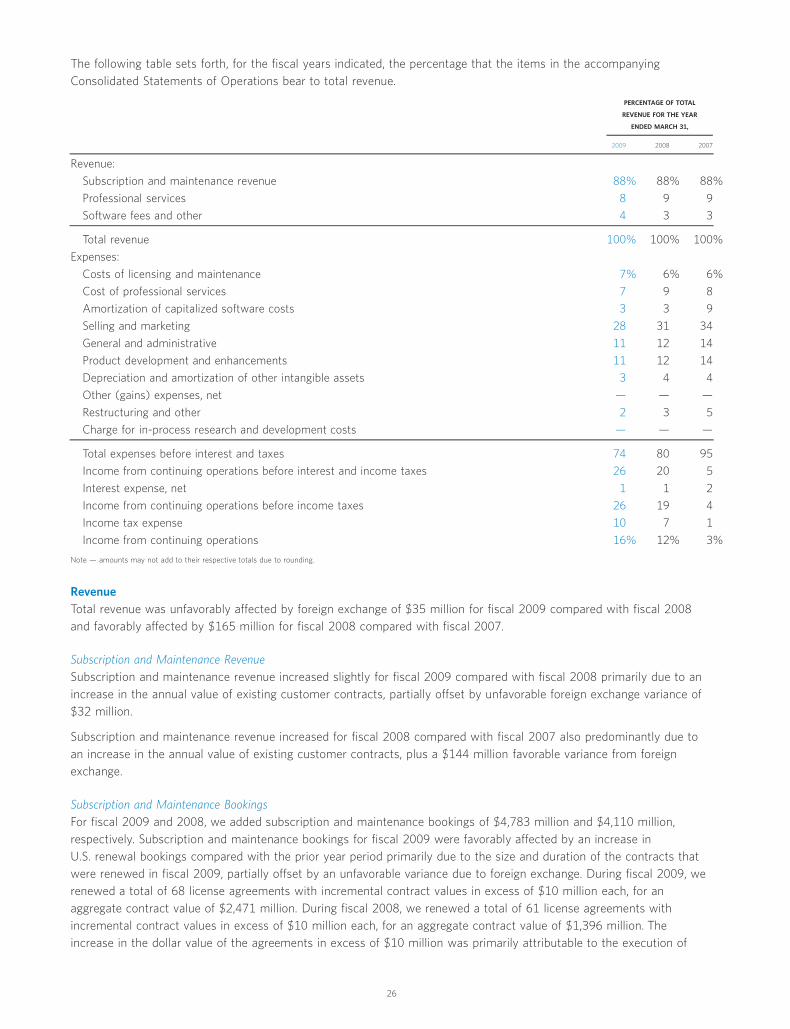
The following table sets forth, for the fiscal years indicated, the percentage that the items in the accompanyingConsolidated Statements of Operations bear to total revenue.
2009 2008 2007
PERCENTAGE OF TOTAL
REVENUE FOR THE YEAR
ENDED MARCH 31,
Revenue:
Subscription and maintenance revenue 88% 88% 88%
Professional services 8 9 9
Software fees and other 4 3 3
Total revenue 100% 100% 100%
Expenses:
Costs of licensing and maintenance 7% 6% 6%
Cost of professional services 7 9 8
Amortization of capitalized software costs 3 3 9
Selling and marketing 28 31 34
General and administrative 11 12 14
Product development and enhancements 11 12 14
Depreciation and amortization of other intangible assets 3 4 4
Other (gains) expenses, net — — —
Restructuring and other 2 3 5
Charge for in-process research and development costs — — —
Total expenses before interest and taxes 74 80 95
Income from continuing operations before interest and income taxes 26 20 5
Interest expense, net 1 1 2
Income from continuing operations before income taxes 26 19 4
Income tax expense 10 7 1
Income from continuing operations 16% 12% 3%
Note — amounts may not add to their respective totals due to rounding.
RevenueTotal revenue was unfavorably affected by foreign exchange of $35 million for fiscal 2009 compared with fiscal 2008and favorably affected by $165 million for fiscal 2008 compared with fiscal 2007.
Subscription and Maintenance RevenueSubscription and maintenance revenue increased slightly for fiscal 2009 compared with fiscal 2008 primarily due to anincrease in the annual value of existing customer contracts, partially offset by unfavorable foreign exchange variance of$32 million.
Subscription and maintenance revenue increased for fiscal 2008 compared with fiscal 2007 also predominantly due toan increase in the annual value of existing customer contracts, plus a $144 million favorable variance from foreignexchange.
Subscription and Maintenance BookingsFor fiscal 2009 and 2008, we added subscription and maintenance bookings of $4,783 million and $4,110 million,respectively. Subscription and maintenance bookings for fiscal 2009 were favorably affected by an increase inU.S. renewal bookings compared with the prior year period primarily due to the size and duration of the contracts thatwere renewed in fiscal 2009, partially offset by an unfavorable variance due to foreign exchange. During fiscal 2009, werenewed a total of 68 license agreements with incremental contract values in excess of $10 million each, for anaggregate contract value of $2,471 million. During fiscal 2008, we renewed a total of 61 license agreements withincremental contract values in excess of $10 million each, for an aggregate contract value of $1,396 million. Theincrease in the dollar value of the agreements in excess of $10 million was primarily attributable to the execution of
26
%%TRANSMSG*** Transmitting Job: Y77913 PCN: 028000000 ***%%PCMSG|26 |00013|Yes|No|07/24/2009 11:36|0|0|Page is valid, no graphics -- Color: D|

several large contract extensions with terms of approximately five years in the second quarter, two of which had acombined contract value of approximately $550 million. For fiscal 2009, annualized subscription and maintenancebookings decreased $54 million from the prior year period to $1,325 million. The weighted average subscription andmaintenance license agreement duration in years increased to 3.61 for fiscal 2009 compared with 2.98 for fiscal 2008due to an increase in the number and dollar values of contracts executed with contract terms longer than historicalaverages. Although each contract is subject to terms negotiated by the respective parties, management does notcurrently expect the duration of contracts to increase materially beyond historical levels.
For fiscal 2008 and 2007, we added subscription and maintenance bookings of $4,110 million and $3,610 million,respectively. Bookings for fiscal 2008 were favorably affected by growth in sales of new products and services,continued improvement in the management of contract renewals, and an increase in the number and dollar amounts oflarge contracts during the fiscal year. During fiscal 2008, we renewed a total of 61 license agreements with incrementalcontract values in excess of $10 million each, for an aggregate contract value of $1,396 million. During fiscal 2007, werenewed 42 license agreements with incremental contract values in excess of $10 million each, for an aggregatecontract value of $1,142 million. For fiscal 2008, annualized subscription and maintenance bookings increased$151 million from the prior year period to $1,379 million.
Professional ServicesProfessional services revenue primarily includes product implementation, customer training and customer education. Therevenue decrease for fiscal 2009 compared with fiscal 2008 was primarily due to our concerted efforts to reduce thenumber of low margin service contracts in all regions, revenue decreases from customer delays in signing professionalservice contracts due to the difficult economic environment and revenue decreases in the APJ region, which was due toour decision to stop providing professional services in certain markets in conjunction with our change in that regionfrom a direct to an indirect sales model.
The increase in professional services revenue for fiscal 2008 compared with fiscal 2007 was driven primarily by growthin the volume of Project and Portfolio Management, Identity and Access Management and Service Managementimplementation projects in fiscal 2008.
Software Fees and OtherSoftware fees and other revenue primarily consists of revenue that is recognized on an up-front basis as required bySOP 97-2. This includes revenue generated through transactions with distribution and original equipment manufacturerchannel partners (sometimes referred to as our “indirect” or “channel” revenue) and certain revenue associated with newor acquired products sold on an up-front basis. Also included is financing fee revenue, which results from thediscounting of product sales recognized on an up-front basis with extended payment terms to present value. Revenuerecognized on an up-front basis results in higher revenue for the current period than if the same revenue had beenrecognized ratably under our subscription model.
For fiscal 2009, software fees and other revenue increased from fiscal 2008 primarily due to an $11 million increase inour indirect business revenue and $5 million due to the license agreement we entered into with Rocket Software, Inc.(Rocket). These increases were partially offset by lower financing fees and other revenues. Refer to Note 8“Commitments and Contingencies” for additional information relating to the Rocket agreement.
For fiscal 2008, software fees and other revenue slightly decreased compared with fiscal 2007 due to lower financingfee revenue due to the decrease in the remaining number of contracts from the prior business model with extendedpayment terms, which was partially offset by revenue increases in our indirect business.
27
%%TRANSMSG*** Transmitting Job: Y77913 PCN: 029000000 ***%%PCMSG|27 |00013|Yes|No|07/07/2009 22:17|0|0|Page is valid, no graphics -- Color: D|
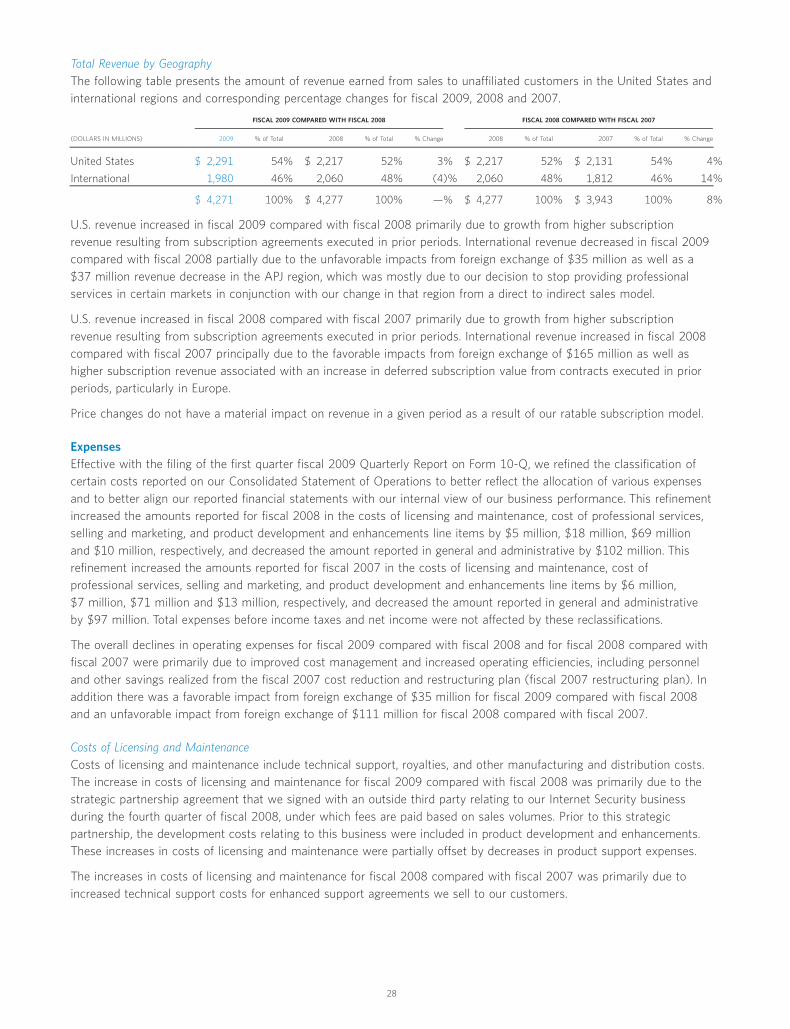
Total Revenue by GeographyThe following table presents the amount of revenue earned from sales to unaffiliated customers in the United States andinternational regions and corresponding percentage changes for fiscal 2009, 2008 and 2007.
(DOLLARS IN MILLIONS) 2009 % of Total 2008 % of Total % Change 2008 % of Total 2007 % of Total % Change
FISCAL 2009 COMPARED WITH FISCAL 2008 FISCAL 2008 COMPARED WITH FISCAL 2007
United States $ 2,291 54% $ 2,217 52% 3% $ 2,217 52% $ 2,131 54% 4%
International 1,980 46% 2,060 48% (4)% 2,060 48% 1,812 46% 14%
$ 4,271 100% $ 4,277 100% —% $ 4,277 100% $ 3,943 100% 8%
U.S. revenue increased in fiscal 2009 compared with fiscal 2008 primarily due to growth from higher subscriptionrevenue resulting from subscription agreements executed in prior periods. International revenue decreased in fiscal 2009compared with fiscal 2008 partially due to the unfavorable impacts from foreign exchange of $35 million as well as a$37 million revenue decrease in the APJ region, which was mostly due to our decision to stop providing professionalservices in certain markets in conjunction with our change in that region from a direct to indirect sales model.
U.S. revenue increased in fiscal 2008 compared with fiscal 2007 primarily due to growth from higher subscriptionrevenue resulting from subscription agreements executed in prior periods. International revenue increased in fiscal 2008compared with fiscal 2007 principally due to the favorable impacts from foreign exchange of $165 million as well ashigher subscription revenue associated with an increase in deferred subscription value from contracts executed in priorperiods, particularly in Europe.
Price changes do not have a material impact on revenue in a given period as a result of our ratable subscription model.
ExpensesEffective with the filing of the first quarter fiscal 2009 Quarterly Report on Form 10-Q, we refined the classification ofcertain costs reported on our Consolidated Statement of Operations to better reflect the allocation of various expensesand to better align our reported financial statements with our internal view of our business performance. This refinementincreased the amounts reported for fiscal 2008 in the costs of licensing and maintenance, cost of professional services,selling and marketing, and product development and enhancements line items by $5 million, $18 million, $69 millionand $10 million, respectively, and decreased the amount reported in general and administrative by $102 million. Thisrefinement increased the amounts reported for fiscal 2007 in the costs of licensing and maintenance, cost ofprofessional services, selling and marketing, and product development and enhancements line items by $6 million,$7 million, $71 million and $13 million, respectively, and decreased the amount reported in general and administrativeby $97 million. Total expenses before income taxes and net income were not affected by these reclassifications.
The overall declines in operating expenses for fiscal 2009 compared with fiscal 2008 and for fiscal 2008 compared withfiscal 2007 were primarily due to improved cost management and increased operating efficiencies, including personneland other savings realized from the fiscal 2007 cost reduction and restructuring plan (fiscal 2007 restructuring plan). Inaddition there was a favorable impact from foreign exchange of $35 million for fiscal 2009 compared with fiscal 2008and an unfavorable impact from foreign exchange of $111 million for fiscal 2008 compared with fiscal 2007.
Costs of Licensing and MaintenanceCosts of licensing and maintenance include technical support, royalties, and other manufacturing and distribution costs.The increase in costs of licensing and maintenance for fiscal 2009 compared with fiscal 2008 was primarily due to thestrategic partnership agreement that we signed with an outside third party relating to our Internet Security businessduring the fourth quarter of fiscal 2008, under which fees are paid based on sales volumes. Prior to this strategicpartnership, the development costs relating to this business were included in product development and enhancements.These increases in costs of licensing and maintenance were partially offset by decreases in product support expenses.
The increases in costs of licensing and maintenance for fiscal 2008 compared with fiscal 2007 was primarily due toincreased technical support costs for enhanced support agreements we sell to our customers.
28
%%TRANSMSG*** Transmitting Job: Y77913 PCN: 030000000 ***%%PCMSG|28 |00012|Yes|No|07/07/2009 22:17|0|0|Page is valid, no graphics -- Color: D|

Cost of Professional ServicesCost of professional services consists primarily of our personnel-related costs associated with providing professionalservices and training to customers. The decrease in cost of professional services for fiscal 2009 compared with fiscal2008 was primarily due to a reduced use of external consultants, reduced personnel costs and our effort to reduce thenumber of low margin service contracts which resulted in cost reductions due to lower sales volume and marginimprovements. As a result of the decreased costs of professional services, the margins on professional services revenueimproved to 14% for fiscal 2009 compared with 4% for fiscal 2008.
For fiscal 2008, cost of professional services increased compared with fiscal 2007 primarily due to the growth inprofessional services provided. Fiscal 2008 margins on professional services revenue were 4%, which represented aslight decrease from fiscal 2007.
Amortization of Capitalized Software CostsAmortization of capitalized software costs consists of the amortization of both purchased software and internally generatedcapitalized software development costs. Internally generated capitalized software development costs relate to new productsand significant enhancements to existing software products that have reached the technological feasibility stage.
The slight increase in amortization of capitalized software costs in fiscal 2009 from fiscal 2008 was principally due to theamount of projects that have reached technological feasibility and were capitalized during fiscal 2009 and fiscal 2008.
The decline in amortization of capitalized software costs from fiscal 2007 to fiscal 2008 was principally due to the fullamortization of certain capitalized software costs related to prior acquisitions.
Selling and MarketingSelling and marketing expenses include the costs relating to our sales force, costs relating to our channel partners,corporate and business marketing costs and our customer training programs. Including a $15 million decrease due toforeign exchange, the decline in selling and marketing expenses for fiscal 2009 compared with fiscal 2008 was primarilydue to decreases in personnel costs of $48 million, promotion expenses of $26 million, office and IT costs of $14 millionand external consulting costs of $11 million. Including a $53 million increase due to foreign exchange, the decline inselling and marketing expenses for fiscal 2008 compared with fiscal 2007 was primarily due to reduced personnel andoffice costs of $11 million, mostly due to savings realized in connection with the fiscal 2007 restructuring plan partiallyoffset by higher sales commissions that resulted from an increase in the aggregate value of contracts executed duringthe year. For additional information regarding the fiscal 2007 restructuring plan, refer to Note 3, “Restructuring andOther,” in the Notes to the Consolidated Financial Statements.
General and AdministrativeGeneral and administrative expenses include the costs of corporate and support functions, including our executiveleadership and administration groups, finance, legal, human resources, corporate communications and other costs, suchas provisions for doubtful accounts. Including a $4 million decrease due to foreign exchange, general and administrativecosts decreased in fiscal 2009 compared with fiscal 2008 primarily due to lower office and IT costs of $28 million, lowerpersonnel-related expenses of $16 million, lower external consulting costs of $18 million and a reduction in bad debtexpenses of $9 million, partially offset by a $12 million reduction in general and administrative expenses we recorded infiscal 2008 due to obligations from prior period acquisitions that were settled for amounts less than originally estimatedthat did not recur in fiscal 2009 (refer to Note 2, “Acquisitions and Divestitures,” in the Notes to the ConsolidatedFinancial Statements for additional information).
Including a $3 million increase due to foreign exchange, general and administrative costs decreased in fiscal 2008compared with fiscal 2007 primarily due to lower personnel-related expenses and consulting costs of $42 million. Infiscal 2008, we increased our provision for doubtful accounts by $19 million, compared with fiscal 2007. In fiscal 2008,we recorded a $12 million expense reduction due to obligations from prior period acquisitions that were settled foramounts less than originally estimated (refer to Note 2, “Acquisitions and Divestitures,” in the Notes to the ConsolidatedFinancial Statements for additional information).
Product Development and EnhancementsFor fiscal 2009, fiscal 2008 and fiscal 2007, product development and enhancements expenses representedapproximately 11%, 12% and 14% of total revenue, respectively. Expenses declined during fiscal 2009 as compared
29
%%TRANSMSG*** Transmitting Job: Y77913 PCN: 031000000 ***%%PCMSG|29 |00013|Yes|No|07/07/2009 22:17|0|0|Page is valid, no graphics -- Color: D|

with fiscal 2008 primarily due to the strategic partnership agreement signed relating to the development of productsassociated with our Internet Security business and increased capitalization of internally developed software, partiallyoffset by higher personnel costs. The year-over-year decline in product development and enhancements in fiscal 2008compared with fiscal 2007 was principally due to a continued focus on transferring development to lower cost regionsand savings realized from restructuring activities.
Depreciation and Amortization of Other Intangible AssetsThe decrease in depreciation and amortization of other intangible assets for fiscal 2009 compared with fiscal 2008 wasprimarily due to decreased amortization costs of intangible assets relating to prior period acquisitions.
The increase in depreciation and amortization of other intangible assets for fiscal 2008 as compared with fiscal 2007was primarily due to the amortization of intangibles recognized in conjunction with prior year acquisitions and costscapitalized in connection with our continued investment in our enterprise resource planning system.
Other (Gains) Expenses, NetGains and losses attributable to divestitures of certain assets, certain foreign currency exchange rate fluctuations, andcertain other infrequent events have been included in the “Other (gains) expenses, net” line item in the ConsolidatedStatements of Operations. The components of “Other (gains) expenses, net” are as follows:
(IN MILLIONS) 2009 2008 2007
YEAR ENDED MARCH 31,
(Gains) expenses attributable to divestitures of certain assets and other items $ (5) $ 1 $ (17)
Fluctuations in foreign currency exchange rates (11) (28) —
Expenses attributable to litigation claims and settlements 15 33 4
Total $ (1) $ 6 $ (13)
In fiscal 2009, we recorded net foreign exchange gains of $11 million. The foreign exchange amounts recorded in fiscal2009 included net gains of $77 million associated with derivative foreign exchange contracts, which we use to mitigateour operating risks and exposures to foreign currency exchange rates. These gains were mostly offset by foreignexchange losses from other operating activities due to the strengthening of the U.S. dollar against other currencies inwhich we conduct our operations. During the third quarter of fiscal 2009, we recognized a gain of $5 million associatedwith our repurchase of $148 million principal amount of our 4.750% Senior Notes due 2009. For additional information,refer to Note 1, “Significant Accounting Policies,” in the Notes to the Consolidated Financial Statements.
For fiscal 2008, we incurred expenses associated with litigation claims of $33 million. Included in the expenses forlitigation claims was a charge of $14 million representing the present value of the obligation to pay additional amountsin connection with a settlement agreement on our Senior Notes due in 2014 (refer to the discussion of the Fiscal 2005Senior Notes in the “Liquidity and Capital Resources” section of this MD&A for additional information).
Restructuring and OtherIn August 2006, we announced the fiscal 2007 restructuring plan to significantly improve our expense structure andincrease our competitiveness. The objectives of the fiscal 2007 restructuring plan included a workforce reduction, globalfacilities consolidations and other cost reduction initiatives. The total cost of the fiscal 2007 restructuring plan wasinitially expected to be $200 million.
In April 2008, the objectives of the plan were expanded to include additional workforce reductions, global facilitiesconsolidations and other cost reduction initiatives with expected additional costs of $75 million to $100 million, bringingthe total pre-tax restructuring charges for the fiscal 2007 restructuring plan to $275 million to $300 million.
On March 31, 2009, our Board of Directors approved additional cost reduction and restructuring actions relating to thefiscal 2007 restructuring plan. The objectives were expanded to now include (1) an additional workforce reduction of300 to bring the total to 3,100 positions since the inception of the fiscal 2007 restructuring plan, (2) additional globalfacilities consolidations and (3) additional other cost reduction initiatives. These additional charges of $45 million bringthe total expected pre-tax restructuring charges for the fiscal 2007 restructuring plan to $345 million, $340 million ofwhich was incurred by the end of fiscal 2009. Refer to Note 3, “Restructuring and Other” in the Notes to theConsolidated Financial Statements for additional information.
30
%%TRANSMSG*** Transmitting Job: Y77913 PCN: 032000000 ***%%PCMSG|30 |00014|Yes|No|07/07/2009 22:17|0|0|Page is valid, no graphics -- Color: D|
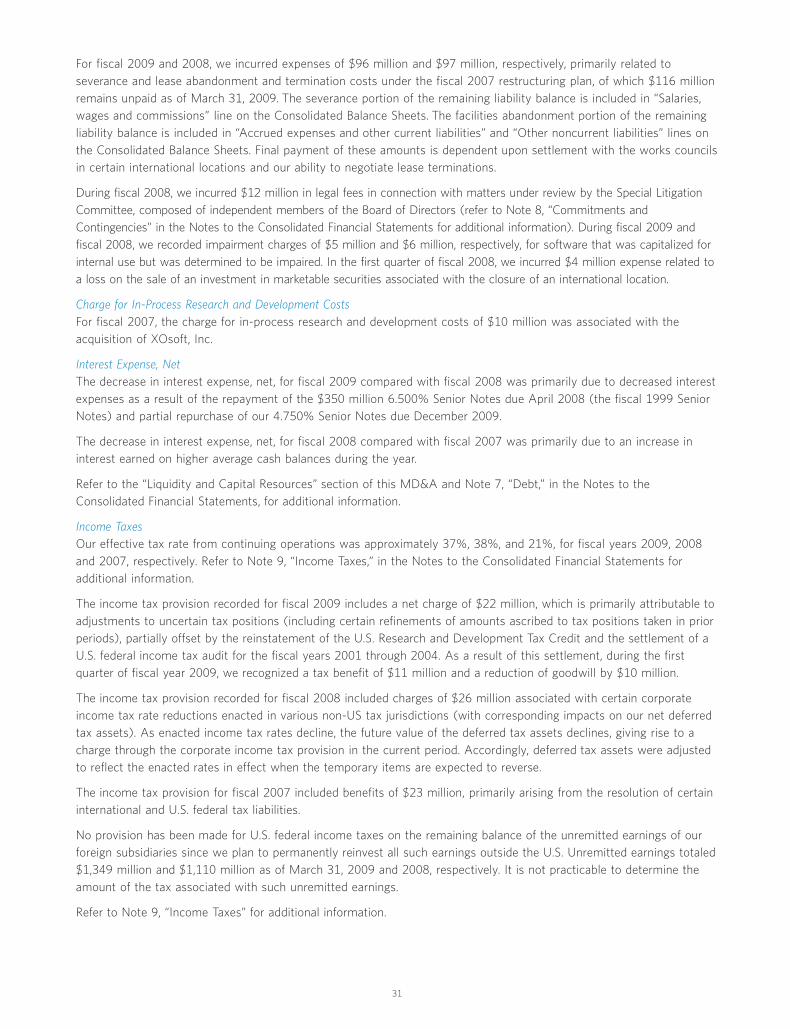
For fiscal 2009 and 2008, we incurred expenses of $96 million and $97 million, respectively, primarily related toseverance and lease abandonment and termination costs under the fiscal 2007 restructuring plan, of which $116 millionremains unpaid as of March 31, 2009. The severance portion of the remaining liability balance is included in “Salaries,wages and commissions” line on the Consolidated Balance Sheets. The facilities abandonment portion of the remainingliability balance is included in “Accrued expenses and other current liabilities” and “Other noncurrent liabilities” lines onthe Consolidated Balance Sheets. Final payment of these amounts is dependent upon settlement with the works councilsin certain international locations and our ability to negotiate lease terminations.
During fiscal 2008, we incurred $12 million in legal fees in connection with matters under review by the Special LitigationCommittee, composed of independent members of the Board of Directors (refer to Note 8, “Commitments andContingencies” in the Notes to the Consolidated Financial Statements for additional information). During fiscal 2009 andfiscal 2008, we recorded impairment charges of $5 million and $6 million, respectively, for software that was capitalized forinternal use but was determined to be impaired. In the first quarter of fiscal 2008, we incurred $4 million expense related toa loss on the sale of an investment in marketable securities associated with the closure of an international location.
Charge for In-Process Research and Development CostsFor fiscal 2007, the charge for in-process research and development costs of $10 million was associated with theacquisition of XOsoft, Inc.
Interest Expense, NetThe decrease in interest expense, net, for fiscal 2009 compared with fiscal 2008 was primarily due to decreased interestexpenses as a result of the repayment of the $350 million 6.500% Senior Notes due April 2008 (the fiscal 1999 SeniorNotes) and partial repurchase of our 4.750% Senior Notes due December 2009.
The decrease in interest expense, net, for fiscal 2008 compared with fiscal 2007 was primarily due to an increase ininterest earned on higher average cash balances during the year.
Refer to the “Liquidity and Capital Resources” section of this MD&A and Note 7, “Debt,” in the Notes to theConsolidated Financial Statements, for additional information.
Income TaxesOur effective tax rate from continuing operations was approximately 37%, 38%, and 21%, for fiscal years 2009, 2008and 2007, respectively. Refer to Note 9, “Income Taxes,” in the Notes to the Consolidated Financial Statements foradditional information.
The income tax provision recorded for fiscal 2009 includes a net charge of $22 million, which is primarily attributable toadjustments to uncertain tax positions (including certain refinements of amounts ascribed to tax positions taken in priorperiods), partially offset by the reinstatement of the U.S. Research and Development Tax Credit and the settlement of aU.S. federal income tax audit for the fiscal years 2001 through 2004. As a result of this settlement, during the firstquarter of fiscal year 2009, we recognized a tax benefit of $11 million and a reduction of goodwill by $10 million.
The income tax provision recorded for fiscal 2008 included charges of $26 million associated with certain corporateincome tax rate reductions enacted in various non-US tax jurisdictions (with corresponding impacts on our net deferredtax assets). As enacted income tax rates decline, the future value of the deferred tax assets declines, giving rise to acharge through the corporate income tax provision in the current period. Accordingly, deferred tax assets were adjustedto reflect the enacted rates in effect when the temporary items are expected to reverse.
The income tax provision for fiscal 2007 included benefits of $23 million, primarily arising from the resolution of certaininternational and U.S. federal tax liabilities.
No provision has been made for U.S. federal income taxes on the remaining balance of the unremitted earnings of ourforeign subsidiaries since we plan to permanently reinvest all such earnings outside the U.S. Unremitted earnings totaled$1,349 million and $1,110 million as of March 31, 2009 and 2008, respectively. It is not practicable to determine theamount of the tax associated with such unremitted earnings.
Refer to Note 9, “Income Taxes” for additional information.
31
%%TRANSMSG*** Transmitting Job: Y77913 PCN: 033000000 ***%%PCMSG|31 |00013|Yes|No|07/07/2009 22:17|0|0|Page is valid, no graphics -- Color: D|
Selected Quarterly Information
(IN MILLIONS, EXCEPT PER SHARE AND PERCENTAGE AMOUNTS) JUNE 30 SEPT. 30 DEC. 31 MAR. 31 TOTAL
FISCAL 2009 QUARTER ENDED
Revenue $ 1,087 $ 1,107 $ 1,042 $ 1,035 $ 4,271
Percentage of annual revenue 26% 26% 24% 24% 100%
Net income1 $ 200 $ 209 $ 213 $ 72 $ 694
Basic income per share $ 0.39 $ 0.41 $ 0.41 $ 0.14 $ 1.35
Diluted income per share $ 0.37 $ 0.39 $ 0.40 $ 0.13 $ 1.29
(IN MILLIONS, EXCEPT PER SHARE AND PERCENTAGE AMOUNTS) JUNE 30 SEPT. 30 DEC. 31 MAR. 31 TOTAL
FISCAL 2008 QUARTER ENDED
Revenue $ 1,025 $ 1,067 $ 1,100 $ 1,085 $ 4,277
Percentage of annual revenue 24% 25% 26% 25% 100%
Net income2 $ 129 $ 137 $ 163 $ 71 $ 500
Basic income per share $ 0.25 $ 0.27 $ 0.32 $ 0.14 $ 0.97
Diluted income per share $ 0.24 $ 0.26 $ 0.31 $ 0.13 $ 0.93
1 Includes after-tax charges of $1 million, $1 million, $0 million and $58 million for severance and other expenses in connection with a restructuring plan for the quarters ended June 30,September 30, December 31, and March 31, respectively. Refer to “Restructuring and Other” within the Results of Operations section of this MD&A for additional information. Also includesa net charge of $16 million from certain tax items and $25 million ascribed to refinements of tax positions taken in prior periods, recorded during the quarter ended March 31, 2009.
2 Includes after-tax charges of $4 million, $7 million, $7 million and $43 million for severance and other expenses in connection with a restructuring plan for the quarters ended June 30,September 30, December 31, and March 31, respectively. Refer to “Restructuring and Other” within the Results of Operations section of this MD&A for additional information.
Liquidity and Capital ResourcesOur cash balances, including cash equivalents and marketable securities, are held in numerous locations throughout theworld, with 50% residing outside the United States at March 31, 2009. Cash and cash equivalents totaled $2,712 millionas of March 31, 2009, representing a decrease of $83 million from the March 31, 2008 balance of $2,795 million,primarily due to the repayment of the $350 million principal amount of our 6.500% Senior Notes due April 2008 thatwas due and payable during the first quarter of fiscal 2009 and the partial repurchase of $324 million principal amountof our 4.750% Senior Notes due December 2009 during the second half of fiscal 2009 (refer to Debt Arrangementsbelow for additional information). As of March 31, 2009 compared with March 31, 2008, cash and cash equivalentsdecreased $252 million due to the unfavorable translation effect that foreign currency exchange rates had on cash heldoutside the United States in currencies other than the U.S. dollar.
On October 29, 2008, our Board of Directors approved a stock repurchase program that authorizes us to acquire up to$250 million of our common stock. During the third quarter of fiscal 2009, we paid $4 million to repurchase 0.3 millionof our common shares at an average price of $15.84. As of March 31, 2009, we remain authorized to purchase anaggregate amount of up to $246 million of additional shares of common stock under our existing stock repurchaseprogram. We will fund the program with available cash on hand and may repurchase shares on the open market fromtime to time based on market conditions and other factors.
Sources and Uses of CashCash generated by operating activities, which represents our primary source of liquidity, increased $109 million in fiscal2009 to $1,212 million from $1,103 million in fiscal 2008. For fiscal 2009, accounts receivable decreased by$199 million, compared with a decline in the comparable prior year period of $111 million. For fiscal 2009, accountspayable, accrued expenses and other liabilities decreased $99 million compared with a decrease in the comparable prioryear period of $95 million.
Under our subscription and maintenance agreements, customers generally make installment payments over the term ofthe agreement, often with one payment due at contract execution, for the right to use our software products and receiveproduct support, software fixes and new products when available. The timing and actual amounts of cash received fromcommitted customer installment payments under any specific agreement can be affected by several factors, includingthe time value of money and the customer’s credit rating. Often, the amount received is the result of direct negotiationswith the customer when establishing pricing and payment terms. In certain instances, the customer negotiates a pricefor a single installment payment and seeks its own internal or external financing sources. In other instances, we may
32
%%TRANSMSG*** Transmitting Job: Y77913 PCN: 034000000 ***%%PCMSG|32 |00012|Yes|No|07/07/2009 22:17|0|0|Page is valid, no graphics -- Color: D|
assist the customer by arranging financing on their behalf through a third party financial institution. Alternatively, wemay decide to transfer our rights to the future committed installment payments due under the license agreement to athird party financial institution in exchange for a cash payment. Once transferred, the future committed installments arepayable by the customer to the third party financial institution. Whether the future committed installments have beenfinanced directly by the customer with our assistance or by the transfer of our rights to future committed installmentsto a third party, such financing agreements may contain limited recourse provisions with respect to our continuedperformance under the license agreements. Based on our historical experience, we believe that any liability that we mayincur as a result of these limited recourse provisions will be immaterial.
Amounts billed or collected as a result of a single installment for the entire contract value, or a substantial portion ofthe contract value, rather than being invoiced and collected over the life of the license agreement are reflected in theliability section of the Consolidated Balance Sheets as “Deferred revenue (billed or collected).” Amounts received fromeither the customer or a third-party financial institution in the current period that are attributable to later years of alicense agreement have a positive impact on billings and cash provided by operating activities. Accordingly, to the extentsuch collections are attributable to the later years of a license agreement, billings and cash provided by operatingactivities during the license’s later years will be lower than if the payments were received over the license term. We areunable to predict with certainty the amount of cash to be collected from single installments for the entire contract value,or a substantial portion of the contract value, under new or renewed license agreements to be executed in futureperiods.
For fiscal 2009, gross receipts related to single installments for the entire contract value, or a substantial portion of thecontract value, were $526 million, compared with $641 million in fiscal 2008. These amounts include transactionsfinanced through third parties of $98 million and $257 million for fiscal 2009 and fiscal 2008, respectively.
In any fiscal year, cash provided by continuing operating activities typically increases in each consecutive quarterthroughout the fiscal year in accordance with our bookings cycle, with the fourth quarter being the highest and the firstquarter being the lowest. The timing of net cash provided by operating activities during the fiscal year is also affected bymany other factors, including the timing of any customer financing or transfer of our interest in such contractualinstallments and the level and timing of expenditures.
In any quarter, we may receive payments in advance of the contractually committed date on which the payments wereotherwise due. In limited circumstances, we may offer discounts to customers to ensure payment in the current periodof invoices that have been billed, but might not otherwise be paid until a subsequent period because of payment termsor other factors. Historically, any such discounts have not been material.
Our estimate of the fair value of net installment accounts receivable recorded under the prior business modelapproximates carrying value. Amounts due from customers under our current business model are offset by deferredrevenue related to these license agreements, leaving no or minimal net carrying value for such amounts. The fair value ofsuch amounts may exceed, equal, or be less than this carrying value but cannot be practically assessed since there is noexisting market for a pool of customer receivables with contractual commitments similar to those owned by us. Theactual fair value may not be known until these amounts are sold, securitized or collected. Although these customerlicense agreements commit the customer to payment under a fixed schedule, to the extent amounts are not yet due andpayable by the customer, the agreements are considered executory in nature due to our ongoing commitment to providemaintenance and unspecified future software products as part of the agreement terms.
We can estimate the total amounts to be billed from committed contracts, referred to as our billings backlog, and thetotal amount to be recognized as revenue from committed contracts, referred to as our revenue backlog. The aggregateamounts of our billings backlog and trade and installment receivables already reflected on our Consolidated BalanceSheets represent the amounts we expect to collect in the future from committed contracts.
33
%%TRANSMSG*** Transmitting Job: Y77913 PCN: 035000000 ***%%PCMSG|33 |00014|Yes|No|07/07/2009 22:17|0|0|Page is valid, no graphics -- Color: D|

(IN MILLIONS)MARCH 31,
2009MARCH 31,
2008
Billings Backlog:
Amounts to be billed — current $ 1,719 $ 1,716
Amounts to be billed — noncurrent 2,228 1,442
Total billings backlog $ 3,947 $ 3,158
Revenue Backlog:
Revenue to be recognized within the next 12 months — current $ 3,295 $ 3,478
Revenue to be recognized beyond the next 12 months — noncurrent 4,083 3,380
Total revenue backlog $ 7,378 $ 6,858
Deferred revenue (billed or collected) $ 3,431 $ 3,700
Total billings backlog 3,947 3,158
Total revenue backlog $ 7,378 $ 6,858
Note: Revenue Backlog includes deferred subscription, maintenance and professional services revenue
We can also estimate the total cash to be collected in the future from committed contracts, referred to as our “Expectedfuture cash collections” by adding the total billings backlog to the current and noncurrent Trade and InstallmentAccounts Receivable from our balance sheet.
(IN MILLIONS)MARCH 31,
2009MARCH 31,
2008
Expected future cash collections:
Total billings backlog $ 3,947 $ 3,158
Trade and installment accounts receivable — current, net 839 970
Installment accounts receivable — noncurrent, net 128 234
Total expected future cash collections $ 4,914 $ 4,362
The increases in our revenue and billings backlogs as well as our expected future cash collections were driven byincreased bookings value and the increased duration associated with those bookings. Revenue to be recognized in thenext 12 months decreased 5% at March 31, 2009 as compared with March 31, 2008 mostly due to the negative effectof foreign exchange. Excluding the effect of foreign exchange, revenue to be recognized in the next 12 months increasedby 3% at March 31, 2009 as compared with March 31, 2008. In any fiscal year, cash provided by operating activitieshas typically increased in each consecutive quarter throughout the fiscal year, with the fourth quarter being the highestand the first quarter being the lowest. The timing of cash provided by operating activities during the fiscal year isaffected by many factors, including the timing of new or renewed contracts and the associated billings, as well as thetiming of any customer financing or transfer of our interests in contractual installments. Other factors that influence thelevels of cash generated throughout the quarter can include the level and timing of expenditures.
Unbilled amounts under our business model are mostly collectible over one to five years. As of March 31, 2009, on acumulative basis, 44%, 72%, 86%, 96%, and 100% of amounts due from customers recorded under our business modelcome due within fiscal 2010 through 2014, respectively.
Remaining unbilled amounts under the prior business model are collectible over one to three years. As of March 31,2009, on a cumulative basis, 45%, 81% and 100% of amounts due from customers recorded under the prior businessmodel come due within fiscal 2010 through 2012, respectively.
34
%%TRANSMSG*** Transmitting Job: Y77913 PCN: 036000000 ***%%PCMSG|34 |00013|Yes|No|07/07/2009 22:17|0|0|Page is valid, no graphics -- Color: D|
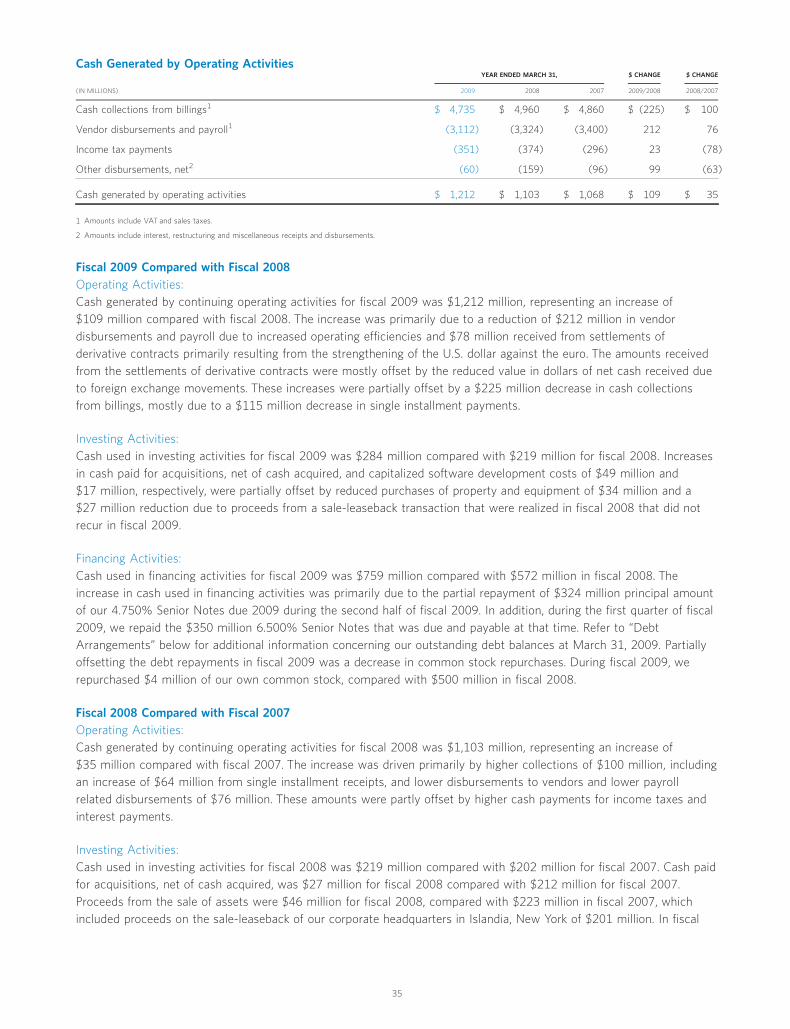
Cash Generated by Operating Activities
(IN MILLIONS) 2009 2008 2007 2009/2008 2008/2007
YEAR ENDED MARCH 31, $ CHANGE $ CHANGE
Cash collections from billings1 $ 4,735 $ 4,960 $ 4,860 $ (225) $ 100
Vendor disbursements and payroll1 (3,112) (3,324) (3,400) 212 76
Income tax payments (351) (374) (296) 23 (78)
Other disbursements, net2 (60) (159) (96) 99 (63)
Cash generated by operating activities $ 1,212 $ 1,103 $ 1,068 $ 109 $ 35
1 Amounts include VAT and sales taxes.
2 Amounts include interest, restructuring and miscellaneous receipts and disbursements.
Fiscal 2009 Compared with Fiscal 2008Operating Activities:Cash generated by continuing operating activities for fiscal 2009 was $1,212 million, representing an increase of$109 million compared with fiscal 2008. The increase was primarily due to a reduction of $212 million in vendordisbursements and payroll due to increased operating efficiencies and $78 million received from settlements ofderivative contracts primarily resulting from the strengthening of the U.S. dollar against the euro. The amounts receivedfrom the settlements of derivative contracts were mostly offset by the reduced value in dollars of net cash received dueto foreign exchange movements. These increases were partially offset by a $225 million decrease in cash collectionsfrom billings, mostly due to a $115 million decrease in single installment payments.
Investing Activities:Cash used in investing activities for fiscal 2009 was $284 million compared with $219 million for fiscal 2008. Increasesin cash paid for acquisitions, net of cash acquired, and capitalized software development costs of $49 million and$17 million, respectively, were partially offset by reduced purchases of property and equipment of $34 million and a$27 million reduction due to proceeds from a sale-leaseback transaction that were realized in fiscal 2008 that did notrecur in fiscal 2009.
Financing Activities:Cash used in financing activities for fiscal 2009 was $759 million compared with $572 million in fiscal 2008. Theincrease in cash used in financing activities was primarily due to the partial repayment of $324 million principal amountof our 4.750% Senior Notes due 2009 during the second half of fiscal 2009. In addition, during the first quarter of fiscal2009, we repaid the $350 million 6.500% Senior Notes that was due and payable at that time. Refer to “DebtArrangements” below for additional information concerning our outstanding debt balances at March 31, 2009. Partiallyoffsetting the debt repayments in fiscal 2009 was a decrease in common stock repurchases. During fiscal 2009, werepurchased $4 million of our own common stock, compared with $500 million in fiscal 2008.
Fiscal 2008 Compared with Fiscal 2007Operating Activities:Cash generated by continuing operating activities for fiscal 2008 was $1,103 million, representing an increase of$35 million compared with fiscal 2007. The increase was driven primarily by higher collections of $100 million, includingan increase of $64 million from single installment receipts, and lower disbursements to vendors and lower payrollrelated disbursements of $76 million. These amounts were partly offset by higher cash payments for income taxes andinterest payments.
Investing Activities:Cash used in investing activities for fiscal 2008 was $219 million compared with $202 million for fiscal 2007. Cash paidfor acquisitions, net of cash acquired, was $27 million for fiscal 2008 compared with $212 million for fiscal 2007.Proceeds from the sale of assets were $46 million for fiscal 2008, compared with $223 million in fiscal 2007, whichincluded proceeds on the sale-leaseback of our corporate headquarters in Islandia, New York of $201 million. In fiscal
35
%%TRANSMSG*** Transmitting Job: Y77913 PCN: 037000000 ***%%PCMSG|35 |00013|Yes|No|07/07/2009 22:17|0|0|Page is valid, no graphics -- Color: D|

2008, we had net purchases of marketable securities of $3 million compared with proceeds from sales of marketablesecurities in fiscal 2007 of $44 million.
Financing Activities:Cash used in financing activities for fiscal 2008 was $572 million compared with $515 million in fiscal 2007. Duringfiscal 2008, we repurchased $500 million of our own common stock, compared with $1,216 million in fiscal 2007.Partially offsetting the share repurchases in fiscal 2007 was an increase in borrowings of $750 million under our 2004Revolving Credit Facility. In the second quarter of fiscal 2008, we repaid our 2004 Revolving Credit Facility with proceedsfrom our 2008 Revolving Credit Facility. During fiscal 2008, we paid dividends of $82 million, compared with $88 millionin fiscal 2007.
As of March 31, 2009 and 2008, our debt arrangements consisted of the following:
(IN MILLIONS)MAXIMUMAVAILABLE
OUTSTANDINGBALANCE
MAXIMUMAVAILABLE
OUTSTANDINGBALANCE
MARCH 31, 2009 MARCH 31, 2008
Debt Arrangements:
2008 Revolving Credit Facility (expires August 2012) $ 1,000 $ 750 $ 1,000 $ 750
6.500% Senior Notes due April 2008 — — — 350
1.625% Convertible Senior Notes due December 2009 — 460 — 460
4.750% Senior Notes due December 2009 — 176 — 500
6.125% Senior Notes due December 2014 — 500 — 500
International line of credit 25 — 25 —
Capital lease obligations and other — 51 — 22
Total $ 1,937 $ 2,582
As of March 31, 2009, we had $1,937 million in debt and $2,713 million in cash, cash equivalents and marketablesecurities. Our net cash surplus position, cash in excess of debt, was $776 million.
Additionally, we reported restricted cash balances of $56 million and $62 million as of March 31, 2009 and 2008,respectively, which were included in the “Other noncurrent assets, net” line item.
2008 Revolving Credit FacilityIn August 2007, we entered into the 2008 Revolving Credit Facility. The maximum committed amount available underthe 2008 Revolving Credit Facility is $1 billion, exclusive of incremental credit increases of up to an additional$500 million, which are available subject to certain conditions and the agreement of our lenders. The 2008 RevolvingCredit Facility replaces the prior $1 billion 2004 Revolving Credit Facility, which was due to expire on December 2, 2008.The 2004 Revolving Credit Facility was terminated effective August 29, 2007, at which time outstanding borrowings of$750 million were repaid and simultaneously re-borrowed under the 2008 Revolving Credit Facility. The 2008 RevolvingCredit Facility expires on August 29, 2012. As of March 31, 2009 and 2008, $750 million was drawn down under the2008 Revolving Credit Facility.
Borrowings under the 2008 Revolving Credit Facility bear interest at a rate dependent on our credit ratings at the time ofsuch borrowings and are calculated according to a base rate or a Eurocurrency rate, as the case may be, plus anapplicable margin and utilization fee. The applicable margin for a base rate borrowing is 0% and, depending on our creditrating, the applicable margin for a Eurocurrency borrowing ranges from 0.27% to 0.875%. Also, depending on our creditrating at the time of the borrowing, the utilization fee can range from 0.1% to 0.25% for borrowings over 50% of thetotal commitment. At our credit ratings as of March 31, 2009, the applicable margin was 0% for a base rate borrowingand 0.425% for a Eurocurrency borrowing, and the utilization fee was 0.1%. As of March 31, 2009, the weightedaverage interest rate on our outstanding borrowings was 1.95%. In addition, we must pay facility commitment feesquarterly at rates dependent on our credit ratings. The facility commitment fees can range from 0.08% to 0.375% of thefinal allocated amount of each Lender’s full revolving credit commitment (without taking into account any outstandingborrowings under such commitments). Based on our credit ratings as of March 31, 2009, the facility commitment feewas 0.125% of the $1 billion committed amount.
36
%%TRANSMSG*** Transmitting Job: Y77913 PCN: 038000000 ***%%PCMSG|36 |00012|Yes|No|07/07/2009 22:17|0|0|Page is valid, no graphics -- Color: D|
The 2008 Revolving Credit Facility contains customary covenants for transactions of this type, including two financialcovenants: (i) for the 12 months ending each quarter-end, the ratio of consolidated debt for borrowed money toconsolidated cash flow, each as defined in the 2008 Revolving Credit Facility, must not exceed 4.00 to 1.00; and (ii) forthe 12 months ending each quarter-end, the ratio of consolidated cash flow to the sum of interest payable on, andamortization of debt discount in respect of, all consolidated debt for borrowed money, as defined in the 2008 RevolvingCredit Facility, must not be less than 5.00 to 1.00. In addition, as a condition precedent to each borrowing made underthe 2008 Revolving Credit Facility, as of the date of such borrowing, (i) no event of default shall have occurred and becontinuing and (ii) we are to reaffirm that the representations and warranties made by us in the 2008 Revolving CreditFacility (other than the representation with respect to material adverse changes, but including the representationregarding the absence of certain material litigation) are correct. As of March 31, 2009, we are in compliance with thesedebt covenants.
6.500% Senior NotesIn fiscal 1999, we issued $1,750 million of unsecured 6.500% Senior Notes in a transaction pursuant to Rule 144Aunder the Securities Act of 1933 (Rule 144A). In the first quarter of fiscal 2009, we paid the $350 million6.500% Senior Notes that was due and payable at that time. Subsequent to this scheduled payment, there were nofurther amounts due under this issuance.
1.625% Convertible Senior NotesIn fiscal 2003, we issued $460 million of unsecured 1.625% Convertible Senior Notes (1.625% Notes) due December2009, in a transaction pursuant to Rule 144A. The 1.625% Notes are senior unsecured indebtedness and rank equallywith all existing senior unsecured indebtedness. Concurrent with the issuance of the 1.625% Notes, we entered into callspread repurchase option transactions (1.625% Notes Call Spread) to partially mitigate potential dilution fromconversion of the 1.625% Notes. The option purchase price of the 1.625% Notes Call Spread was $73 million and theentire purchase price was charged to stockholders’ equity in December 2002. Under the terms of the 1.625% Notes CallSpread, we can elect to receive (i) outstanding shares equivalent to the number of shares that will be issued if all of the1.625% Notes are converted into shares (23 million shares) upon payment of an exercise price of $20.04 per share(aggregate price of $460 million); or (ii) a net cash settlement, net share settlement or a combination, whereby we willreceive cash or shares equal to the increase in the market value of the 23 million shares from the aggregate value at the$20.04 exercise price (aggregate price of $460 million), subject to the upper limit of $30.00 discussed below. The1.625% Notes Call Spread is designed to partially mitigate the potential dilution from conversion of the 1.625% Notes,depending upon the market price of our common stock at such time. The 1.625% Notes Call Spread can be exercised inDecember 2009 at an exercise price of $20.04 per share. To limit the cost of the 1.625% Notes Call Spread, an upperlimit of $30.00 per share has been set, such that if the price of the common stock is above that limit at the time ofexercise, the number of shares eligible to be purchased will be proportionately reduced based on the amount by whichthe common share price exceeds $30.00 at the time of exercise. As of March 31, 2009, the estimated fair value of the1.625% Notes Call Spread was $34 million, which was based upon valuations from independent third-party financialinstitutions.
Fiscal Year 2005 Senior NotesIn November 2004, we issued an aggregate of $1 billion of unsecured Senior Notes (collectively, the 2005 Senior Notes)in a transaction pursuant to Rule 144A. We issued $500 million of 4.75%, 5-year notes due December 2009 and$500 million of 5.625%, 10-year notes due December 2014. In December 2007, the 5.625% Senior Notes dueDecember 2014 were renamed the 6.125% Senior Notes due December 2014 (see below for additional information).
4.750% Senior Notes due December 2009: During the fourth quarter of fiscal 2009, we completed a tender offer torepay a portion of our 4.750% Senior Notes due December 1, 2009, under which we repaid $176 million of theaggregate principal amount of the notes, exclusive of accrued interest. During the third quarter of fiscal 2009, we alsorepaid $148 million of the aggregate principal amount of our 4.750% Senior Notes due December 2009 on the openmarket at a price of $143 million in cash, exclusive of accrued interest. As a result of this repayment, we recognized again of $5 million in the “Other (gains) expenses, net” line of the Consolidated Statements of Operations in the thirdquarter. At March 31, 2009, $176 million of our 4.750% Senior Notes remains outstanding.
37
%%TRANSMSG*** Transmitting Job: Y77913 PCN: 039000000 ***%%PCMSG|37 |00013|Yes|No|07/07/2009 22:17|0|0|Page is valid, no graphics -- Color: D|

6.125% Senior Notes due December 2014: On December 21, 2007, the Company, The Bank of New York, and theholders of a majority of the Notes reached a settlement of a lawsuit captioned The Bank of New York v. CA, Inc. et al.,filed in the Supreme Court of the State of New York, New York County and executed a First Supplemental Indenture. TheFirst Supplemental Indenture provides, among other things, that we will pay an additional 0.50% per annum interest onthe $500 million principal amount of the Notes, with such additional interest beginning to accrue as of December 1,2007. Pursuant to the Supplemental Indenture, the Notes are now referred to as our 6.125% Senior Notes due 2014. Asa result of the settlement in the third quarter of fiscal 2008, we recorded a charge of $14 million, representing thepresent value of the additional amounts that will be paid. This charge is included in “Other (gains) expenses, net” lineitem in the Consolidated Statements of Operations. In connection with the settlement, we also entered into anAddendum to Registration Rights Agreement, which confirms that we no longer have any obligations under the originalRegistration Rights Agreement entered into with respect to the Notes. The settlement became effective upon thesignature of the Stipulation of Dismissal with Prejudice by a Justice of the New York Supreme Court on January 3, 2008.
We have the option to redeem the 2005 Senior Notes at any time, at redemption prices equal to the greater of(i) 100% of the aggregate principal amount of the notes of such series being redeemed and (ii) the present value of theprincipal and interest payable over the life of the 2005 Senior Notes, discounted at a rate equal to 15 basis points and20 basis points for the 5-year notes and 10-year notes, respectively, over a comparable U.S. Treasury bond yield. Thematurity of the 2005 Senior Notes may be accelerated by the holders upon certain events of default, including failure tomake payments when due and failure to comply with covenants in the 2005 Senior Notes. The 5-year notes were issuedat a price equal to 99.861% of the principal amount and the 10-year notes at a price equal to 99.505% of the principalamount for resale under Rule 144A and Regulation S.
International Line of CreditAn unsecured and uncommitted multi-currency line of credit is available to meet short-term working capital needs forour subsidiaries operating outside the United States. The line of credit is available on an offering basis, meaning thattransactions under the line of credit will be on such terms and conditions, including interest rate, maturity,representations, covenants and events of default, as mutually agreed between our subsidiaries and the local bank at thetime of each specific transaction. As of March 31, 2009, the amount available under this line totaled approximately$25 million and approximately $6 million was pledged in support of bank guarantees and other local credit lines.Amounts drawn under these facilities as of March 31, 2009 were nominal.
In addition to the above facility, we and our subsidiaries use guarantees and letters of credit issued by financialinstitutions to guarantee performance on certain contracts. As of March 31, 2009, none of these arrangements had beendrawn down by third parties.
Share RepurchasesOn October 29, 2008, our Board of Directors approved a stock repurchase program that authorizes us to acquire up to$250 million of our common stock. During the third quarter of fiscal 2009, we paid $4 million to repurchaseapproximately 0.3 million shares of our common stock at an average price of $15.84. As of March 31, 2009, weremained authorized to purchase an aggregate amount of up to $246 million of additional common shares under ourcurrent stock repurchase program.
DividendsWe have paid cash dividends each year since July 1990. For fiscal 2009, 2008 and 2007, we paid annual cash dividendsof $0.16 per share, which have been paid out in quarterly installments of $0.04 per share as and when declared by theBoard of Directors. Total cash dividends paid was $83 million, $82 million and $88 million for fiscal 2009, fiscal 2008and fiscal 2007 respectively.
Effect of Exchange Rate ChangesThere was a $252 million unfavorable impact to our cash balances in fiscal 2009 predominantly due to thestrengthening of the U.S. dollar against the euro, British pound, Australian dollar, Brazilian real and Canadian dollar of16%, 28%, 24%, 24% and 19%, respectively. In fiscal 2008, we had a favorable $208 million impact to our cash
38
%%TRANSMSG*** Transmitting Job: Y77913 PCN: 040000000 ***%%PCMSG|38 |00013|Yes|No|07/07/2009 22:17|0|0|Page is valid, no graphics -- Color: D|
balances, predominantly due to the weakening of the U.S. dollar against the euro, Australian dollar and Canadian dollarof 18%, 13%, and 12%, respectively.
Other MattersAs of March 31, 2009, our senior unsecured notes were rated Ba1, BBB, and BB+ by Moody’s Investors Service(Moody’s), Standard and Poor’s (S&P) and Fitch Ratings (Fitch), respectively. In April 2009, Fitch upgraded our rating toBBB.
As of March 31, 2009, the outlook on these unsecured notes was stable by all three rating agencies. Peak borrowingsunder all debt facilities during fiscal 2009 totaled $2,582 million, with a weighted average interest rate of 4.47%.
Capital resource requirements as of March 31, 2009 and 2008 consisted of lease obligations for office space,equipment, mortgage and loan obligations, our enterprise resource planning implementation, and amounts due as aresult of product and company acquisitions. Refer to “Contractual Obligations and Commitments” for additionalinformation.
We expect that existing cash, cash equivalents, marketable securities, the availability of borrowings under existing andrenewable credit lines, and cash expected to be provided from operations will be sufficient to meet our ongoing cashrequirements.
We expect to use existing cash balances and future cash generated from operations to fund capital spending, includingour continued investment in our enterprise resource planning implementation, future acquisitions and financing activities,such as the repayment of our debt balances either before or as they mature, the payment of dividends, and therepurchase of shares of common stock in accordance with any plans approved by our Board of Directors.
We conduct an ongoing review of our capital structure and debt obligations as part of our risk management strategy.The fair value of our current and long term portions of debt, excluding the 2008 Revolving Credit Facility and Capitallease obligations and other, was approximately $1,130 million and $1,885 million as of March 31, 2009 and 2008,respectively. The fair value of long-term debt is based on quoted market prices. See also Note 1, “Significant AccountingPolicies.”
Off-Balance Sheet ArrangementsPrior to fiscal 2001, we sold individual accounts receivable to a third party subject to certain recourse provisions. Theoutstanding principal balance subject to recourse of these receivables approximated $38 million and $81 million as ofMarch 31, 2009 and 2008, respectively. As of March 31, 2009, we have established a liability for the fair value of therecourse provision of $2 million associated with these receivables.
Other than the commitments and recourse provisions described above, we do not have any other off-balance sheetarrangements with unconsolidated entities or related parties and, accordingly, off-balance sheet risks to our liquidity andcapital resources from unconsolidated entities are limited.
Contractual Obligations and CommitmentsWe have commitments under certain contractual arrangements to make future payments for goods and services. Thesecontractual arrangements secure the rights to various assets and services to be used in the future in the normal courseof business. For example, we are contractually committed to make certain minimum lease payments for the use ofproperty under operating lease agreements. In accordance with current accounting rules, the future rights and relatedobligations pertaining to such contractual arrangements are not reported as assets or liabilities on our ConsolidatedBalance Sheets. We expect to fund these contractual arrangements with cash generated from operations in the normalcourse of business.
39
%%TRANSMSG*** Transmitting Job: Y77913 PCN: 041000000 ***%%PCMSG|39 |00013|Yes|No|07/07/2009 22:17|0|0|Page is valid, no graphics -- Color: D|

The following table summarizes our contractual arrangements as of March 31, 2009 and the timing and effect that suchcommitments are expected to have on our liquidity and cash flow in future periods. In addition, the table summarizesthe timing of payments on our debt obligations as reported on our Consolidated Balance Sheets as of March 31, 2009.
(IN MILLIONS) TOTALLESS THAN
1 YEAR1–3
YEARS3–5
YEARSMORE THAN
5 YEARS
PAYMENTS DUE BY PERIOD
Contractual Obligations
Long-term debt obligations (inclusive of interest) $ 2,173 $ 708 $ 112 $ 823 $ 530
Operating lease obligations1 656 119 173 119 245
Purchase obligations 76 57 19 — —
Other obligations2 172 54 73 30 15
Total $ 3,077 $ 938 $ 377 $ 972 $ 790
1 The contractual obligations for noncurrent operating leases include sublease income totaling $42 million expected to be received in the following periods: $18 million (less than 1 year);$16 million (1–3 years); $7 million (3–5 years); and $1 million (more than 5 years).
2 Includes $9 million of estimated liabilities for unrecognized tax benefits under the “less than 1 year” column for amounts that are estimated to be settled within one year of the balancesheet date. In addition, $302 million of estimated liabilities for unrecognized tax benefits are excluded from the contractual obligations table because a reasonable estimate of when suchamounts will become payable could not be made.
As of March 31, 2009, we have no material capital lease obligations, either individually or in the aggregate.
Critical Accounting Policies and EstimatesWe review our financial reporting and disclosure practices and accounting policies quarterly to help ensure that theyprovide accurate and transparent information relative to the current economic and business environment. Note 1,“Significant Accounting Policies” in the Notes to the Consolidated Financial Statements contains a summary of thesignificant accounting policies that we use. Many of these accounting policies involve complex situations and require ahigh degree of judgment, either in the application and interpretation of existing accounting literature or in thedevelopment of estimates that impact our financial statements. On an ongoing basis, we evaluate our estimates andjudgments based on historical experience as well as other factors that are believed to be reasonable under thecircumstances. These estimates may change in the future if underlying assumptions or factors change.
We consider the following significant accounting policies to be critical because of their complexity and the high degreeof judgment involved in implementing them.
Revenue RecognitionWe generate revenue from the following primary sources: (1) licensing software products; (2) providing customertechnical support (referred to as maintenance); and (3) providing professional services, such as product implementation,consulting and education. Revenue is recorded net of applicable sales taxes.
We recognize revenue pursuant to the requirements of Statement of Position (SOP) 97-2 “Software Revenue Recognition”,issued by the American Institute of Certified Public Accountants, as amended by SOP 98-9 “Modification of SOP 97-2,Software Revenue Recognition, With Respect to Certain Transactions.” In accordance with SOP 97-2, we begin to recognizerevenue from licensing and supporting our software products when all of the following criteria are met: (1) we haveevidence of an arrangement with a customer; (2) we deliver the products; (3) license agreement terms are deemedfixed or determinable and free of contingencies or uncertainties that may alter the agreement such that it may not becomplete and final; and (4) collection is probable.
Under our subscription model, implemented in October 2000, software license agreements typically combine the right touse specified software products, the right to maintenance, and the right to receive and use unspecified future softwareproducts for no additional fee during the term of the agreement. Under these subscription licenses, once all four of theabove noted revenue recognition criteria are met, we are required under generally accepted accounting principles torecognize revenue ratably over the term of the license agreement.
For license agreements signed prior to October 2000, once all four of the above noted revenue recognition criteria weremet, software license fees were recognized as revenue generally when the software was delivered to the customer, or“up-front” (as the contracts did not include a right to unspecified future software products), and the maintenance feeswere deferred and subsequently recognized as revenue over the term of the license. Under our current business model, a
40
%%TRANSMSG*** Transmitting Job: Y77913 PCN: 042000000 ***%%PCMSG|40 |00013|Yes|No|07/07/2009 23:14|0|0|Page is valid, no graphics -- Color: D|

relatively small percentage of our revenue from software licenses is recognized on an up-front basis, subject to meetingthe same revenue recognition criteria in accordance with SOP 97-2 as described above. Software fees from suchlicenses are recognized up-front and are reported in the “Software fees and other” line item in the ConsolidatedStatements of Operations. Maintenance fees from such licenses are recognized ratably over the term of the license andare reported in the “Subscription and maintenance revenue” line item in the Consolidated Statements of Operations.License agreements under which software fees are recognized up-front do not include the right to receive unspecifiedfuture software products. However, in the event such license agreements are executed within close proximity or incontemplation of other license agreements that are signed under our subscription model with the same customer, thelicenses together may be deemed a single multi-element agreement, and all such revenue is required to be recognizedratably and is recorded as “Subscription and maintenance revenue” in the Consolidated Statements of Operations.
We are unable to establish VSOE of fair value for all undelivered elements in license agreements that include softwareproducts for which maintenance pricing is based on both discounted and undiscounted license list prices andarrangements that contain rights to unspecified future software products. If VSOE of fair value of one or moreundelivered elements does not exist, license revenue is deferred and recognized upon delivery of those elements orwhen VSOE of fair value can be established. When the license includes the right to receive unspecified future softwareproducts, license revenue is recognized ratably over the term on the arrangement as VSOE does not exist for the futureunspecified software products.
Since we implemented our subscription model in October 2000, our practice with respect to newly acquired productswith established VSOE of fair value has been to record revenue initially on the acquired company’s systems, generallyunder an up-front model; and, starting within the first fiscal year after the acquisition, to enter new licenses for suchproducts under our subscription model, following which revenue is recognized ratably and recorded as “Subscription andmaintenance revenue.” In some instances, we sell some newly developed and recently acquired products without theright to receive unspecified future software products. Revenue from these agreements is generally recorded on an up-front model, to the extent that we are able to establish VSOE of fair value for all undelivered elements and such licenseagreements are not deemed to have been linked with other contracts executed within a short time frame with the samecustomer or in contemplation of other license agreements with the same customer for which the right exists to receiveunspecified future software products. The software license fees from these contracts are recorded on an up-front basisas “Software fees and other.” Selling such licenses under an up-front model will result in higher total revenue in areporting period than if such licenses were based on our subscription model and the associated revenue recognizedratably.
Maintenance revenue is derived from two primary sources: (1) the maintenance portion of combined license andmaintenance agreements; and (2) stand-alone maintenance agreements. Maintenance revenue is reported on the“Subscription and maintenance revenue” line item in the Consolidated Statements of Operations over the term of therenewal agreement.
Revenue from professional service arrangements is generally recognized as the services are performed. Revenue fromcommitted professional services that are sold as part of a software transaction is deferred and recognized on a ratablebasis over the life of the related software transaction. If it is not probable that a project will be completed or thepayment will be received, revenue is deferred until the uncertainty is removed.
Revenue from sales to distributors, resellers, and value added resellers commences when all four of the SOP 97-2revenue recognition criteria noted above are met and when these entities sell the software product to their customers.This is commonly referred to as the sell-through method. Revenue from the sale of products to distributors, resellers andvalue added resellers that incorporates the right for the end-users to receive certain unspecified future software productsis recognized on a ratable basis.
We have an established business practice of offering installment payment options to customers and have a history ofsuccessfully collecting substantially all amounts due under such agreements. We assess collectability based on anumber of factors, including past transaction history with the customer and the creditworthiness of the customer. If, inour judgment, collection of a fee is not probable, we will not recognize revenue until the uncertainty is removed throughthe receipt of cash payment.
41
%%TRANSMSG*** Transmitting Job: Y77913 PCN: 043000000 ***%%PCMSG|41 |00012|Yes|No|07/07/2009 22:17|0|0|Page is valid, no graphics -- Color: D|

Our standard licensing agreements include a product warranty provision for all products. Such warranties are accountedfor in accordance with Statement of Financial Accounting Standards (SFAS) No. 5, “Accounting for Contingencies.” Thelikelihood that we will be required to make refunds to customers under such provisions is considered remote.
Under the terms of substantially all of our license agreements, we have agreed to indemnify customers for costs anddamages arising from claims against such customers based on, among other things, allegations that our softwareproducts infringe the intellectual property rights of a third-party. In most cases, in the event of an infringement claim, weretain the right to (i) procure for the customer the right to continue using the software product; (ii) replace or modifythe software product to eliminate the infringement while providing substantially equivalent functionality; or (iii) if neither(i) nor (ii) can be reasonably achieved, we may terminate the license agreement and refund to the customer a pro-rataportion of the fees paid. Such indemnification provisions are accounted for in accordance with SFAS No. 5. Thelikelihood that we will be required to make refunds to customers under such provisions is considered remote. In mostcases and where legally enforceable, the indemnification is limited to the amount paid by the customer.
Accounts ReceivableThe allowance for doubtful accounts is a valuation account used to reserve for the potential impairment of accountsreceivable on the balance sheet. In developing the estimate for the allowance for doubtful accounts, we rely on severalfactors, including:
• Historical information, such as general collection history of multi-year software agreements;
• Current customer information and events, such as extended delinquency, requests for restructuring, and filings forbankruptcy;
• Results of analyzing historical and current data; and
• The overall macroeconomic environment.
The allowance is composed of two components: (a) specifically identified receivables that are reviewed for impairmentwhen, based on current information, we do not expect to collect the full amount due from the customer; and (b) anallowance for losses inherent in the remaining receivable portfolio-based historical activity.
Income TaxesSFAS No. 109, “Accounting for Income Taxes,” requires us to estimate our actual current tax liability in each jurisdiction;estimate differences resulting from differing treatment of items for financial statement purposes versus tax returnpurposes (known as “temporary differences”), resulting in deferred tax assets and liabilities; and assess the likelihoodthat our deferred tax assets will be recovered from future taxable income. If we believe that recovery is not likely, weestablish a valuation allowance.
Deferred tax assets result from acquisition expenses, such as duplicate facility costs, employee severance and othercosts that are not deductible until paid, net operating losses (NOLs) and temporary differences between the taxablecash payments received from customers and the ratable recognition of revenue in accordance with GAAP. The NOLs willexpire as follows: $457 million between 2009 and 2028 and $151 million may be carried forward indefinitely.
As of March 31, 2009, our gross deferred tax assets, net of a valuation allowance, totaled $837 million. The factors thatwe consider in assessing the likelihood of realization of these deferred tax assets include the forecast of future taxableincome and available tax planning strategies that could be implemented to realize the deferred tax assets.
When we prepare our consolidated financial statements, we estimate our income taxes in each jurisdiction in which weoperate. On April 1, 2007, we adopted Financial Accounting Standards Board Interpretation No. 48, “Accounting forUncertainty in Income Taxes — an interpretation of FASB Statement No. 109” (FIN 48). Among other things, FIN 48prescribes a “more-likely-than-not” threshold for the recognition and derecognition of tax positions.
Goodwill, Capitalized Software Products, and Other Intangible AssetsSFAS No. 142, “Goodwill and Other Intangible Assets” (SFAS No. 142), requires an impairment-only approach toaccounting for goodwill and other intangibles with an indefinite life. Absent any prior indicators of impairment, weperform an annual impairment analysis during the fourth quarter of our fiscal year.
42
%%TRANSMSG*** Transmitting Job: Y77913 PCN: 044000000 ***%%PCMSG|42 |00012|Yes|No|07/07/2009 22:17|0|0|Page is valid, no graphics -- Color: D|

The SFAS No. 142 goodwill impairment model is a two-step process. The first step is used to identify potentialimpairment by comparing the fair value of a reporting unit with its net book value (or carrying amount), includinggoodwill. If the fair value exceeds the carrying amount, goodwill of the reporting unit is considered not impaired and thesecond step of the impairment test is unnecessary. If the carrying amount of a reporting unit exceeds its fair value, thesecond step of the goodwill impairment test is performed to measure the amount of impairment loss, if any. The secondstep of the goodwill impairment test compares the implied fair value of the reporting unit’s goodwill with the carryingamount of that goodwill. If the carrying amount of the reporting unit’s goodwill exceeds the implied fair value of thatgoodwill, an impairment loss is recognized in an amount equal to that excess. The implied fair value of goodwill isdetermined in the same manner as the amount of goodwill recognized in a business combination; that is, the fair valueof the reporting unit is allocated to all of the assets and liabilities of that unit (including any unrecognized intangibleassets) as if the reporting unit had been acquired in a business combination and the fair value of the reporting unit wasthe purchase price paid to acquire the reporting unit.
The fair value of a reporting unit under the first step of the goodwill impairment test is measured using the quotedmarket price method. Determining the fair value of individual assets and liabilities of a reporting unit (includingunrecognized intangible assets) under the second step of the goodwill impairment test is judgmental in nature and ofteninvolves the use of significant estimates and assumptions. These estimates and assumptions could have a significantimpact on whether an impairment charge is recognized and the magnitude of any such charge. These estimates aresubject to review and approval by senior management. This approach uses significant assumptions, including projectedfuture cash flow, the discount rate reflecting the risk inherent in future cash flow, and a terminal growth rate. Weperformed our annual assessment of goodwill during the fourth quarter of fiscal 2009 and concluded that no impairmentcharge was required.
The carrying values of capitalized software products, for both purchased software and internally developed software, andother intangible assets, are reviewed on a regular basis to ensure that any excess of the carrying value over the netrealizable value is written off. The facts and circumstances considered include an assessment of the net realizable valuefor capitalized software products and the future recoverability of cost for other intangible assets as of the balance sheetdate. It is not possible for us to predict the likelihood of any possible future impairments or, if such an impairment wereto occur, the magnitude thereof.
Intangible assets with finite useful lives are subject to amortization over the expected period of economic benefit to us.We evaluate the remaining useful lives of intangible assets to determine whether events or circumstances have occurredthat warrant a revision to the remaining period of amortization. In cases where a revision to the remaining period ofamortization is deemed appropriate, the remaining carrying amounts of the intangible assets are amortized over therevised remaining useful life.
Accounting for Business CombinationsThe allocation of the purchase price for acquisitions requires extensive use of accounting estimates and judgments toallocate the purchase price to the identifiable tangible and intangible assets acquired, including in-process research anddevelopment, and liabilities assumed based on their respective fair values.
Product Development and EnhancementsWe account for product development and enhancements in accordance with SFAS No. 86, “Accounting for the Costs ofComputer Software to be Sold, Leased, or Otherwise Marketed” (SFAS No. 86). SFAS No. 86 specifies that costs incurredinternally in researching and developing a computer software product should be charged to expense until technologicalfeasibility has been established for the product. Once technological feasibility is established, all software costs arecapitalized until the product is available for general release to customers. Judgment is required in determining whentechnological feasibility of a product is established and assumptions are used that reflect our best estimates. If otherassumptions had been used in the current period to estimate technological feasibility, the reported product developmentand enhancement expense could have been affected. Annual amortization of capitalized software costs is the greater ofthe amount computed using the ratio that current gross revenues for a product bear to the total of current andanticipated future gross revenues for that product or the straight-line method over the remaining estimated economiclife of the software product, generally estimated to be five years from the date the product became available for generalrelease to customers. We amortized capitalized software costs using the straight-line method in fiscal 2009 and fiscal
43
%%TRANSMSG*** Transmitting Job: Y77913 PCN: 045000000 ***%%PCMSG|43 |00012|Yes|No|07/07/2009 22:17|0|0|Page is valid, no graphics -- Color: D|

2008, as anticipated future revenue is projected to increase for several years considering that we are continuouslyintegrating current software technology into new software products.
Accounting for Stock-Based CompensationWe currently maintain several stock-based compensation plans. We use the Black-Scholes option-pricing model tocompute the estimated fair value of certain stock-based awards. The Black-Scholes model includes assumptionsregarding dividend yields, expected volatility, expected lives, and risk-free interest rates. These assumptions reflect ourbest estimates, but these items involve uncertainties based on market and other conditions outside of our control. As aresult, if other assumptions had been used, stock-based compensation expense could have been materially affected.Furthermore, if different assumptions are used in future periods, stock-based compensation expense could be materiallyaffected in future years.
As described in Note 10, “Stock Plans,” in the Notes to the Consolidated Financial Statements, performance share units(PSUs) are awards under the long-term incentive programs for senior executives where the number of shares orrestricted shares, as applicable, ultimately received by the employee depends on Company performance measuredagainst specified targets and will be determined after a three-year or one-year period as applicable. The fair value ofeach award is estimated on the date that the performance targets are established based on the fair value of our stockand our estimate of the level of achievement of our performance targets. We are required to recalculate the fair value ofissued PSUs each reporting period until the underlying shares are granted. The adjustment is based on the quotedmarket price of our stock on the reporting period date. Each quarter, we compare the actual performance we expect toachieve with the performance targets.
Legal ContingenciesWe are currently involved in various legal proceedings and claims. Periodically, we review the status of each significantmatter and assess our potential financial exposure. If the potential loss from any legal proceeding or claim is consideredprobable and the amount can be reasonably estimated, we accrue a liability for the estimated loss. Significant judgmentis required in both the determination of the probability of a loss and the determination as to whether the amount of lossis reasonably estimable. Due to the uncertainties related to these matters, the decision to record an accrual and theamount of accruals recorded are based only on the best information available at the time. As additional informationbecomes available, we reassess the potential liability related to our pending litigation and claims, and may revise ourestimates. Such revisions could have a material impact on our results of operations and financial condition. Refer toNote 8, “Commitments and Contingencies,” in the Notes to the Consolidated Financial Statements for a description ofour material legal proceedings.
New Accounting PronouncementsIn May 2008, the Financial Accounting Standards Board (FASB) issued Financial Staff Position (FSP) No. APB 14-1,“Accounting for Convertible Debt Instruments That May Be Settled in Cash upon Conversion (Including Partial Cash Settlement).”FSP No. APB 14-1 requires the issuer of convertible debt instruments with cash settlement features to accountseparately for the liability and equity components of the instrument. The debt will be recognized at the present value ofits cash flows discounted using the issuer’s nonconvertible debt borrowing rate at the time of issuance. The equitycomponent will be recognized as the difference between the proceeds from the issuance of the convertible debtinstrument and the fair value of the liability. FSP No. APB 14-1 will also require an accretion of the resulting debtdiscount over the expected life of the debt. The proposed transition guidance requires retrospective application to allperiods presented, and does not grandfather existing instruments. FSP No. APB 14-1 is effective for fiscal yearsbeginning after December 15, 2008. We plan to adopt FSP No. APB 14-1 on April 1, 2009.
Upon adoption of FSP No. APB 14-1, we will be required to revise prior period financial statements. Total stockholders’equity will increase by $11 million as of March 31, 2009. Our reported net income will decrease by $15 million,$14 million and $13 million for fiscal 2009, 2008 and 2007, respectively. Our basic net income per share will decreaseby $0.03, $0.02 and $0.02 for fiscal 2009, 2008 and 2007, respectively. Our diluted net income per share will decreaseby $0.02 for fiscal 2007. Fiscal 2009 and 2008 diluted net income per share would not be affected.
In June 2008, the FASB issued Emerging Issues Task Force (EITF) 03-6-1, “Determining Whether Instruments Granted inShare-Based Payment Transactions are Participating Securities.” FSP EITF No. 03-6-1 clarifies that unvested share-based
44
%%TRANSMSG*** Transmitting Job: Y77913 PCN: 046000000 ***%%PCMSG|44 |00013|Yes|No|07/07/2009 22:17|0|0|Page is valid, no graphics -- Color: D|

payment awards that contain nonforfeitable rights to dividends or dividend equivalents (whether paid or unpaid) areparticipating securities and are to be included in the computation of earnings per share under the two-class methoddescribed in SFAS No. 128, “Earnings Per Share.” FSP EITF No. 03-6-1 is effective for fiscal years beginning afterDecember 15, 2008 and requires all presented prior-period earnings per share data to be adjusted retrospectively. FSPEITF No. 03-6-1 will not have a material impact on our Consolidated Financial Statements.
ITEM 7A. QUANTITATIVE AND QUALITATIVE DISCLOSURES ABOUT MARKET RISK.Interest Rate RiskOur exposure to market rate risk for changes in interest rates relates primarily to our investment portfolio, debt, andinstallment accounts receivable. We have a prescribed methodology whereby we invest our excess cash in liquidinvestments that are composed of money market funds and debt instruments of government agencies and high-qualitycorporate issuers (S&P single “A” rating and higher). To mitigate risk, all of the securities have a maturity date within oneyear, and holdings of any one issuer do not exceed 10% of the portfolio.
As of March 31, 2009, our outstanding debt was $1,937 million, most of which was in fixed rate obligations. Each25 basis point increase or decrease in interest rates would have a corresponding effect on our variable rate debt of lessthan $1 million as of March 31, 2009. If market rates were to decline, we could be required to make payments on thefixed rate debt that would exceed those based on current market rates.
During fiscal 2009, we entered into interest rate swaps with a total notional value of $250 million to hedge a portion ofour variable interest rate payments. These derivatives are designated as cash flow hedges under SFAS No. 133. Theeffective portion of these cash flow hedges are recorded as “Accumulated other comprehensive loss” in ourConsolidated Balance Sheet and reclassified into “Interest expense, net,” in our Consolidated Statements of Operations inthe same period during which the hedged transaction affects earnings. Any ineffective portion of the cash flow hedgeswould be recorded immediately to “Interest expense, net;” however, no ineffectiveness existed at March 31, 2009. Referto Note 4, “Derivatives and Fair Value Measurements,” for additional information regarding our derivative activities.
We offer financing arrangements with installment payment terms in connection with our software license agreements.The aggregate amounts due from customers include an imputed interest element, which can vary with the interest rateenvironment. Each 25 basis point increase in interest rates would currently have an associated annual opportunity costof $10 million.
Foreign Currency Exchange RiskWe conduct business on a worldwide basis through subsidiaries in 46 countries and, as such, a portion of our revenues,earnings, and net investments in foreign affiliates is exposed to changes in foreign exchange rates. We seek to manageour foreign exchange risk in part through operational means, including managing expected local currency revenues inrelation to local currency costs and local currency assets in relation to local currency liabilities. In October 2005, theBoard of Directors adopted our Risk Management Policy and Procedures, which authorizes us to manage, based onmanagement’s assessment, our risks and exposures to foreign currency exchange rates through the use of derivativefinancial instruments (e.g., forward contracts, options, swaps) or other means. We only use derivative financialinstruments in the context of hedging and do not use them for speculative purposes.
Derivatives are accounted for in accordance with SFAS No. 133, “Accounting for Derivative Instruments and HedgingActivities” (SFAS No. 133). During fiscal 2009 and 2008, we did not designate our foreign exchange derivatives ashedges under SFAS No. 133. Accordingly, all foreign exchange derivatives are recognized on the balance sheet at fairvalue and unrealized or realized changes in fair value from these contracts are recorded as “Other (gains) expenses, net”in our Consolidated Statements of Operations. Refer to Note 4, “Derivatives and Fair Value Measurements,” foradditional information regarding our derivative activities.
ITEM 8. FINANCIAL STATEMENTS AND SUPPLEMENTARY DATA.Our Consolidated Financial Statements are listed in the List of Consolidated Financial Statements and FinancialStatement Schedules filed as part of this Annual Report on Form 10-K and are incorporated herein by reference.
45
%%TRANSMSG*** Transmitting Job: Y77913 PCN: 047000000 ***%%PCMSG|45 |00011|Yes|No|07/07/2009 22:17|0|0|Page is valid, no graphics -- Color: D|

The Supplementary Data specified by Item 302 of Regulation S-K as it relates to selected quarterly data is included inthe “Selected Quarterly Information” section of Item 7, “Management’s Discussion and Analysis of Financial Conditionand Results of Operations.” Information on the effects of changing prices is not required.
ITEM 9. CHANGES IN AND DISAGREEMENTS WITH ACCOUNTANTS ONACCOUNTING AND FINANCIAL DISCLOSURE.Not applicable.
ITEM 9A. CONTROLS AND PROCEDURES.(a) Evaluation of Disclosure Controls and ProceduresUnder the supervision and with the participation of the Company’s management, including the Chief Executive Officerand Chief Financial Officer, the Company has evaluated the effectiveness of its disclosure controls and procedures assuch term is defined in Rules 13a-15(e) or 15d-15(e) under the Securities Exchange Act of 1934 (Exchange Act). Basedon that evaluation, the Chief Executive Officer and Chief Financial Officer have concluded that these disclosure controlsand procedures are effective as of the end of the period covered by this report.
(b) Management’s Report on Internal Control Over Financial ReportingThe Company’s management is responsible for establishing and maintaining adequate internal control over financialreporting as defined in Exchange Act Rules 13a-15(f) and 15d-15(f). The Company’s internal control over financialreporting is a process designed to provide reasonable assurance regarding the reliability of financial reporting and thepreparation of financial statements for external purposes in accordance with generally accepted accounting principles.
The Company’s internal control over financial reporting includes those policies and procedures that (i) pertain to themaintenance of records that, in reasonable detail, accurately and fairly reflect the transactions and dispositions of theassets of the Company; (ii) provide reasonable assurance that transactions are recorded as necessary to permitpreparation of financial statements in accordance with generally accepted accounting principles, and that receipts andexpenditures of the Company are being made only in accordance with authorizations of management and directors ofthe Company; and (iii) provide reasonable assurance regarding prevention or timely detection of unauthorizedacquisition, use, or disposition of the Company’s assets that could have a material effect on the Company’s financialstatements.
Because of its inherent limitations, internal control over financial reporting may not prevent or detect misstatements.Therefore, even those systems determined to be effective can provide only reasonable assurance with respect tofinancial statement preparation and presentation. Also, projections of any evaluation of effectiveness to future periodsare subject to the risk that controls may become inadequate because of changes in conditions, or that the degree ofcompliance with the policies or procedures may deteriorate.
Management conducted its evaluation of the effectiveness of internal control over financial reporting as of March 31,2009 based on the framework in Internal Control — Integrated Framework issued by the Committee of SponsoringOrganizations of the Treadway Commission (COSO). Management’s assessment included an evaluation of the design ofthe Company’s internal control over financial reporting and testing the effectiveness of the Company’s internal controlover financial reporting. Based on that evaluation, the Company’s management concluded that the Company’s internalcontrol over financial reporting was effective as of March 31, 2009.
(c) Changes in Internal Control Over Financial ReportingThere were no changes in the Company’s internal control over financial reporting, as such term is defined inRules 13a-15(f) and 15d-15(f) under the Exchange Act, that occurred during the most recently completed fiscal quarterthat have materially affected, or are reasonably likely to materially affect, the Company’s internal control over financialreporting.
As previously disclosed in Item 9A of our 2008 Form 10-K, the Company began the migration of certain financial andsales processing systems to an enterprise resource planning (ERP) system in fiscal 2007 as part of its on-going projectto implement ERP at the Company’s facilities worldwide. In addition, during the first quarter of fiscal 2009, the Company
46
%%TRANSMSG*** Transmitting Job: Y77913 PCN: 048000000 ***%%PCMSG|46 |00013|Yes|No|07/07/2009 22:17|0|0|Page is valid, no graphics -- Color: D|

implemented a new financial reporting and consolidation software package designed to provide additional financialreporting functionality and to improve overall control and efficiency associated with the financial reporting process.Additional changes are planned for fiscal 2010 and the Company will continue to monitor and test these systems aspart of management’s annual evaluation of internal control over financial reporting.
The Company’s independent registered public accountants, KPMG LLP, have audited the effectiveness of the Company’sinternal control over financial reporting as stated in their report which appears on page 55 of this Form 10-K.
Item 9B. OTHER INFORMATION.Not applicable
47
%%TRANSMSG*** Transmitting Job: Y77913 PCN: 049000000 ***%%PCMSG|47 |00013|Yes|No|07/07/2009 22:17|0|0|Page is valid, no graphics -- Color: D|

Part IIIITEM 10. DIRECTORS, EXECUTIVE OFFICERS AND CORPORATE GOVERNANCE.Information required by this Item that will appear under the headings “Election of Directors,” “Litigation InvolvingDirectors and Executive Officers,” “Nominating Procedures,” “Board Committees and Meetings,” “Communications withDirectors” and “Section 16(a) Beneficial Ownership Reporting Compliance” in the definitive proxy statement to be filedwith the SEC relating to our 2009 Annual Meeting of Stockholders is incorporated herein by reference. Also, refer toPart I, Item 4, “Submission of Matters to a Vote of Security Holders” of this Report for information concerning executiveofficers under the heading “Executive Officers of the Registrant.”
We maintain a “code of ethics” (within the meaning of Item 406 of the SEC’s Regulation S-K) entitled “CA Code ofConduct: Information and Resource Guide” (Code of Conduct). Our Code of Conduct is applicable to all employees anddirectors, including our principal executive officer, principal financial officer, principal accounting officer or controller, orpersons performing similar functions. Our Code of Conduct is available on our website at ca.com/investor. Anyamendment or waiver to the “code of ethics” provisions of our Code of Conduct that applies to our directors orexecutive officers will be included in a report filed with the SEC on Form 8-K or will be otherwise disclosed to the extentrequired and as permitted by law or regulation. The Code of Conduct is available without charge in print to anystockholder who requests a copy by writing to our Corporate Secretary, at CA, Inc., One CA Plaza, Islandia, New York11749.
ITEM 11. EXECUTIVE COMPENSATION.Information required by this Item that will appear under the headings “Compensation and Other Information ConcerningExecutive Officers,” “Compensation Discussion and Analysis,” “Compensation of Directors,” and “Compensation andHuman Resources Committee Report on Executive Compensation” in the definitive proxy statement to be filed with theSEC relating to our 2009 Annual Meeting of Stockholders is incorporated herein by reference.
ITEM 12. SECURITY OWNERSHIP OF CERTAIN BENEFICIAL OWNERS ANDMANAGEMENT AND RELATED STOCKHOLDER MATTERS.Information required by this Item that will appear under the headings “Compensation and Other Information ConcerningExecutive Officers” and “Information Regarding Beneficial Ownership of Principal Stockholders, the Board andManagement” in the definitive proxy statement to be filed with the SEC relating to our 2009 Annual Meeting ofStockholders is incorporated herein by reference.
ITEM 13. CERTAIN RELATIONSHIPS AND RELATED TRANSACTIONS, ANDDIRECTOR INDEPENDENCE.Information required by this Item that will appear under the headings “Related Person Transactions,” “Election ofDirectors,” “Board Committees and Meetings,” and “Corporate Governance” in the definitive proxy statement to be filedwith the SEC relating to our 2009 Annual Meeting of Stockholders is incorporated herein by reference.
ITEM 14. PRINCIPAL ACCOUNTANT FEES AND SERVICES.Information required by this Item that will appear under the headings “Ratification of Appointment of IndependentRegistered Public Accountants” and “Audit Committee Report” in the definitive proxy statement to be filed with the SECrelating to our 2009 Annual Meeting of Stockholders is incorporated herein by reference.
48
%%TRANSMSG*** Transmitting Job: Y77913 PCN: 050000000 ***%%PCMSG|48 |00012|Yes|No|07/07/2009 22:17|0|0|Page is valid, no graphics -- Color: D|
Part IVITEM 15. EXHIBITS, FINANCIAL STATEMENT SCHEDULES.(a) (1) The Registrant’s financial statements together with a separate table of contents are annexed hereto.
(2) Financial Statement Schedules are listed in the separate table of contents annexed hereto.(3) Exhibits.
Regulation S-KExhibit Number
2.1 Announcement of Restructuring Plan. Previously filed as Exhibit 99.1 to the Company’s CurrentReport on Form 8-K dated August 14, 2006, and incorporatedherein by reference.
2.2 Announcement of Increase in RestructuringPlan.
Previously filed as Item 2.05 to the Company’s Current Reporton Form 8-K dated March 31, 2008, and incorporated hereinby reference.
2.3 Announcement of Increase in RestructuringPlan.
Previously filed as Item 2.05 to the Company’s Current Reporton Form 8-K dated March 31, 2009, and incorporated hereinby reference.
3.1 Restated Certificate of Incorporation. Previously filed as Exhibit 3.3 to the Company’s Current Reporton Form 8-K dated March 6, 2006, and incorporated herein byreference.
3.2 By-Laws of the Company, as amended. Previously filed as Exhibit 3.1 to the Company’s Current Reporton Form 8-K dated February 23, 2007, and incorporated hereinby reference.
4.1 Restated Certificate of Designation of SeriesOne Junior Participating Preferred Stock, Class Aof the Company.
Previously filed as Exhibit 3.2 to the Company’s Current Reporton Form 8-K dated March 6, 2006, and incorporated herein byreference.
4.2 Stockholder Protection Rights Agreement, datedas of October 16, 2006, between the Companyand Mellon Investor Services LLC, as RightsAgent, including as Exhibit A the forms ofRights Certificate and of Election to Exercise andas Exhibit B the form of Certificate ofDesignation and Terms of the ParticipatingPreferred Stock of the Company.
Previously filed as Exhibit 4.1 to the Company’s Current Reporton Form 8-K dated October 16, 2006, and incorporated hereinby reference.
4.3 Indenture with respect to the Company’s $1.75billion Senior Notes, dated April 24, 1998,between the Company and The ChaseManhattan Bank, as Trustee.
Previously filed as Exhibit 4(f) to the Company’s Annual Reporton Form 10-K for fiscal 1998, and incorporated herein byreference.
4.4 Indenture with respect to the Company’s1.625% Convertible Senior Notes due 2009,dated December 11, 2002, between theCompany and State Street Bank and TrustCompany, as Trustee.
Previously filed as Exhibit 4.1 to the Company’s QuarterlyReport on Form 10-Q for fiscal quarter ended December 31,2002, and incorporated herein by reference.
4.5 Indenture with respect to the Company’s4.75% Senior Notes due 2009 and5.625% Senior Notes due 2014, datedNovember 18, 2004, between the Company andThe Bank of New York, as Trustee.
Previously filed as Exhibit 4.2 to the Company’s Current Reporton Form 8-K dated November 15, 2004, and incorporatedherein by reference.
49
%%TRANSMSG*** Transmitting Job: Y77913 PCN: 051000000 ***%%PCMSG|49 |00013|Yes|No|07/07/2009 23:54|0|0|Page is valid, no graphics -- Color: D|

Regulation S-KExhibit Number
4.6 Purchase Agreement dated November 15, 2004,among the Initial Purchasers of the4.75% Senior Notes due 2009 and5.625% Senior Notes due 2014, and theCompany.
Previously filed as Exhibit 4.1 to the Company’s Current Reporton Form 8-K dated November 15, 2004, and incorporatedherein by reference.
4.7 First Supplemental Indenture, dated as ofNovember 30, 2007, to the Indenture, dated asof November 18, 2004, between CA, Inc. andThe Bank of New York, as trustee.
Previously filed as Exhibit 4.1 to the Company’s Current Reporton Form 8-K dated January 3, 2008, and incorporated herein byreference.
10.1* CA, Inc. 1991 Stock Incentive Plan, as amended. Previously filed as Exhibit 1 to the Company’s Quarterly Reporton Form 10-Q for fiscal quarter ended September 30, 1997,and incorporated herein by reference.
10.2* 1993 Stock Option Plan for Non-EmployeeDirectors.
Previously filed as Annex 1 to the Company’s definitive ProxyStatement dated July 7, 1993, and incorporated herein byreference.
10.3* Amendment No. 1 to the 1993 Stock OptionPlan for Non-Employee Directors dated October20, 1993.
Previously filed as Exhibit E to the Company’s Annual Reporton Form 10-K for fiscal 1994, and incorporated herein byreference.
10.4* 1996 Deferred Stock Plan for Non-EmployeeDirectors.
Previously filed as Exhibit A to the Company’s Proxy Statementdated July 8, 1996, and incorporated herein by reference.
10.5* Amendment No. 1 to the 1996 Deferred StockPlan for Non-Employee Directors.
Previously filed on Exhibit A to the Company’s Proxy Statementdated July 6, 1998, and incorporated herein by reference.
10.6* 1998 Incentive Award Plan. Previously filed on Exhibit B to the Company’s Proxy Statementdated July 6, 1998, and incorporated herein by reference.
10.7* CA, Inc. Year 2000 Employee Stock PurchasePlan.
Previously filed on Exhibit A to the Company’s Proxy Statementdated July 12, 1999, and incorporated herein by reference.
10.8* 2001 Stock Option Plan. Previously filed as Exhibit B to the Company’s Proxy Statementdated July 18, 2001, and incorporated herein by reference.
10.9* CA, Inc. 2002 Incentive Plan (Amended andRestated Effective as of April 27, 2007).
Previously filed as Exhibit 10.9 to the Company’s AnnualReport on Form 10-K for the fiscal year 2007, and incorporatedherein by reference.
10.10* CA, Inc. 2002 Compensation Plan for Non-Employee Directors.
Previously filed as Exhibit C to the Company’s Proxy Statementdated July 26, 2002, and incorporated herein by reference.
10.11* CA, Inc. 2003 Compensation Plan for Non-Employee Directors.
Previously filed as Exhibit A to the Company’s Proxy Statementdated July 17, 2003, and incorporated herein by reference.
10.12* Relocation Polices including Form of Moving andRelocation Expense Agreement.
Previously filed as Exhibit 10.4 to the Company’s CurrentReport on Form 8-K dated February 1, 2005, and incorporatedherein by reference.
10.13* Restricted Stock Unit Agreement for John A.Swainson.
Previously filed as Exhibit 10.5 to the Company’s CurrentReport on Form 8-K dated November 18, 2004, andincorporated herein by reference.
50
%%TRANSMSG*** Transmitting Job: Y77913 PCN: 052000000 ***%%PCMSG|50 |00013|Yes|No|07/07/2009 23:54|0|0|Page is valid, no graphics -- Color: D|
Regulation S-KExhibit Number
10.14* Form of Moving and Relocation ExpenseAgreement.
Previously filed as Exhibit 10.6 to the Company’s CurrentReport on Form 8-K dated November 18, 2004, andincorporated herein by reference.
10.15* CA, Inc. Change in Control Severance Policy. Previously filed as Exhibit 10.22 to the Company’s AnnualReport on Form 10-K for fiscal 2006, and incorporated hereinby reference.
10.16 Deferred Prosecution Agreement, including therelated Information and Stipulation of Facts.
Previously filed as Exhibit 10.1 to the Company’s CurrentReport on Form 8-K dated September 22, 2004, andincorporated herein by reference.
10.17 Final Consent Judgment of Permanent Injunctionand Other Relief, including SEC complaint.
Previously filed as Exhibit 10.2 to the Company’s CurrentReport on Form 8-K dated September 22, 2004, andincorporated herein by reference.
10.18* Form of Restricted Stock Unit Certificate. Previously filed as Exhibit 10.1 to the Company’s QuarterlyReport on Form 10- Q for fiscal quarter ended December 31,2004, and incorporated herein by reference.
10.19* Form of Non-Qualified Stock Option Certificate. Previously filed as Exhibit 10.2 to the Company’s QuarterlyReport on Form 10- Q for fiscal quarter ended December 31,2004, and incorporated herein by reference.
10.20* Form of RSU Award Certificate. Previously filed as Exhibit 10.1 to the Company’s CurrentReport on Form 8-K dated June 2, 2006, and incorporatedherein by reference.
10.21* Form of RSU Award Certificate (EmploymentAgreement).
Previously filed as Exhibit 10.2 to the Company’s CurrentReport on Form 8-K dated June 2, 2006, and incorporatedherein by reference.
10.22* Form of Restricted Stock Award Certificate. Previously filed as Exhibit 10.3 to the Company’s CurrentReport on Form 8-K dated June 2, 2006, and incorporatedherein by reference.
10.23* Form of Restricted Stock Award Certificate(Employment Agreement).
Previously filed as Exhibit 10.4 to the Company’s CurrentReport on Form 8-K dated June 2, 2006, and incorporatedherein by reference.
10.24* Form of Non-Qualified Stock Option AwardCertificate.
Previously filed as Exhibit 10.5 to the Company’s CurrentReport on Form 8-K dated June 2, 2006, and incorporatedherein by reference.
10.25* Form of Non-Qualified Stock Option AwardCertificate (Employment Agreement).
Previously filed as Exhibit 10.6 to the Company’s CurrentReport on Form 8-K dated June 2, 2006, and incorporatedherein by reference.
10.26* Form of Incentive Stock Option AwardCertificate.
Previously filed as Exhibit 10.7 to the Company’s CurrentReport on Form 8-K dated June 2, 2006, and incorporatedherein by reference.
10.27* Form of Incentive Stock Option AwardCertificate (Employment Agreement).
Previously filed as Exhibit 10.8 to the Company’s CurrentReport on Form 8-K dated June 2, 2006, and incorporatedherein by reference.
10.28* CA, Inc. Deferred Compensation Plan for JohnA. Swainson, dated April 29, 2005.
Previously filed as Exhibit 10.1 to the Company’s CurrentReport on Form 8-K dated April 29, 2005, and incorporatedherein by reference.
10.29 Trust Agreement between Computer AssociatesInternational, Inc. and Fidelity ManagementTrust Company, dated as of April 29, 2005.
Previously filed as Exhibit 10.2 to the Company’s CurrentReport on Form 8-K dated April 29, 2005, and incorporatedherein by reference.
51
%%TRANSMSG*** Transmitting Job: Y77913 PCN: 053000000 ***%%PCMSG|51 |00013|Yes|No|07/07/2009 23:54|0|0|Page is valid, no graphics -- Color: D|

Regulation S-KExhibit Number
10.30* 1995 Key Employee Stock Ownership Plan, asamended on June 26, 2000 and February 25,2003.
Previously filed as Exhibit 10.7 to the Company’s AnnualReport on Form 10-K for fiscal 2003, and incorporated hereinby reference.
10.31* Program whereby certain designated employees,including the Company’s named executiveofficers, are provided with certain coveredmedical services, effective August 1, 2005.
Previously filed as Item 1.01 and Exhibit 10.1 to the Company’sCurrent Report on Form 8-K dated August 1, 2005, andincorporated herein by reference.
10.32* Amended and Restated CA, Inc. ExecutiveDeferred Compensation Plan, effectiveNovember 20, 2006.
Previously filed as Exhibit 10.1 to the Company’s QuarterlyReport on Form 10-Q for fiscal quarter ended December 31,2006, and incorporated herein by reference.
10.33* Form of Deferral Election. Previously filed as Exhibit 10.52 to the Company’s AnnualReport on Form 10-K for the fiscal year 2006, and incorporatedherein by reference.
10.34* Modified compensation arrangements for thenon-employee directors of the Company,effective August 24, 2005.
Previously filed as Item 1.01 of the Company’s Current Reporton Form 8-K dated August 24, 2005, and incorporated hereinby reference.
10.35* Modified compensation arrangements for thenon-executive Chairman of the Board, effectiveFebruary 23, 2007.
Previously filed as Item 1.01 of the Company’s Current Reporton Form 8-K dated February 23, 2007, and incorporated hereinby reference.
10.36* Amendment to the CA, Inc. 2003 CompensationPlan for Non-Employee Directors, dated August24, 2005.
Previously filed as Exhibit 10.4 to the Company’s CurrentReport on Form 8-K dated August 24, 2005, and incorporatedherein by reference.
10.37* Employment Agreement, dated as of June 28,2006, between the Company and James Bryant.
Previously filed as Exhibit 10.2 to the Company’s CurrentReport on Form 8-K dated June 26, 2006, and incorporatedherein by reference.
10.38* Employment Agreement, dated as of August 1,2006, between CA, Inc. and Nancy Cooper.
Previously filed as Exhibit 10.2 to the Company’s CurrentReport on Form 8-K dated July 27, 2006, and incorporatedherein by reference.
10.39* Employment Agreement, dated as of August 22,2006, between CA, Inc. and Amy FliegelmanOlli.
Previously filed as Exhibit 10.6 to the Company’s QuarterlyReport on Form 10-Q for fiscal quarter ended September 30,2006, and incorporated herein by reference.
10.40* Acknowledgement between CA, Inc. and AmyFliegelman Olli.
Previously filed as Exhibit 10.59 to the Company’s AnnualReport on Form 10-K for fiscal 2007, and incorporated hereinby reference.
10.41* Lease, dated as of August 15, 2006, among CA,Inc., Island Headquarters Operators LLC andIslandia Operators LLC.
Previously filed as Exhibit 10.2 to the Company’s CurrentReport on Form 8-K dated August 15, 2006, and incorporatedherein by reference.
10.42* CA, Inc. 2007 Incentive Plan. Previously filed as Exhibit 10.1 to the Company’s CurrentReport on Form 8-K dated August 21, 2007, and incorporatedherein by reference.
10.43* Form of Award Agreement — Restricted StockUnits.
Previously filed as Exhibit 10.2 to the Company’s CurrentReport on Form 8-K dated August 21, 2007, and incorporatedherein by reference.
10.44* Form of Award Agreement — Restricted StockAwards.
Previously filed as Exhibit 10.3 to the Company’s CurrentReport on Form 8-K dated August 21, 2007, and incorporatedherein by reference.
52
%%TRANSMSG*** Transmitting Job: Y77913 PCN: 054000000 ***%%PCMSG|52 |00012|Yes|No|07/07/2009 23:54|0|0|Page is valid, no graphics -- Color: D|

Regulation S-KExhibit Number
10.45* Form of Award Agreement — NonqualifiedStock Awards.
Previously filed as Exhibit 10.4 to the Company’s CurrentReport on Form 8-K dated August 21, 2007, and incorporatedherein by reference.
10.46* Form of Award Agreement — Incentive StockOptions.
Previously filed as Exhibit 10.5 to the Company’s CurrentReport on Form 8-K dated August 21, 2007, and incorporatedherein by reference.
10.47 Credit Agreement dated August 29, 2007. Previously filed as Exhibit 10.1 to the Company’s CurrentReport on Form 8-K dated August 29, 2007, and incorporatedherein by reference.
10.48 Settlement Agreement, dated as of December21, 2007, between CA, Inc. and the Bank ofNew York, as trustee, Linden Capital L.P. andSwiss Re Financial Products Corporation.
Previously filed as Exhibit 99.2 to the Company’s CurrentReport on Form 8-K dated January 3, 2008, and incorporatedherein by reference.
10.49 Addendum to Registration Rights Agreement,dated as of November 30, 2007, relating to$500,000,000 5.625% Senior Notes Due 2014.
Previously filed as Exhibit 99.3 to the Company’s CurrentReport on Form 8-K dated January 3, 2008, and incorporatedherein by reference.
10.50* Summary of Special Payment to non- executiveChairman of the Board.
Previously filed as Exhibit 10.1 to the Company’s QuarterlyReport on Form 10-Q for the quarterly period endedDecember 31, 2007, and incorporated herein by reference.
10.51* Amended and Restated EmploymentAgreement, dated as of February 29, 2008 toEmployment Agreement between the Companyand John A. Swainson.
Previously filed as Exhibit 99.2 to the Company’s CurrentReport on Form 8-K dated February 26, 2008, and incorporatedherein by reference.
10.52* Amended and Restated EmploymentAgreement, dated as of February 29, 2008 toEmployment Agreement between the Companyand Michael Christenson.
Previously filed as Exhibit 99.3 to the Company’s CurrentReport on Form 8-K dated February 26, 2008, and incorporatedherein by reference.
10.53* First Amendment to CA, Inc. Executive DeferredCompensation Plan, effective February 25, 2008.
Previously filed as Exhibit 10.68 to the Company Annual Reporton Form 10-K for the Fiscal Year ended March 31, 2008, andincorporated herein by reference.
10.54* First Amendment to Adoption Agreement forCA, Inc. Executive Deferred Compensation Plan,effective February 25, 2008.
Previously filed as Exhibit 10.69 to the Company Annual Reporton Form 10-K for the Fiscal Year ended March 31, 2008, andincorporated herein by reference.
10.55* CA, Inc. Change in Control Severance Policy. Previously filed as Exhibit 10.1 to the Company’s QuarterlyReport on Form 10-Q for the quarterly period endedSeptember 30, 2008, and incorporated herein by reference.
10.56* First Amendment to CA, Inc. 2003Compensatory Plan for Non-Employee Directors.
Previously filed as Exhibit 10.1 to the Company’s QuarterlyReport on Form 10-Q for the quarterly period endedDecember 31, 2008, and incorporated herein by reference.
10.57* Amendment to Employment Agreement, datedDecember 8, 2008, between the Company andJohn Swainson.
Previously filed as Exhibit 10.2 to the Company’s QuarterlyReport on Form 10-Q for the quarterly period endedDecember 31, 2008, and incorporated herein by reference.
10.58* Amendment to Employment Agreement, datedDecember 29, 2008, between the Company andMichael Christenson.
Previously filed as Exhibit 10.3 to the Company’s QuarterlyReport on Form 10-Q for the quarterly period endedDecember 31, 2008, and incorporated herein by reference.
10.59* Amendment to Employment Agreement, datedDecember 12, 2008, between the Company andNancy Cooper.
Previously filed as Exhibit 10.4 to the Company’s QuarterlyReport on Form 10-Q for the quarterly period endedDecember 31, 2008, and incorporated herein by reference.
53
%%TRANSMSG*** Transmitting Job: Y77913 PCN: 055000000 ***%%PCMSG|53 |00013|Yes|No|07/07/2009 23:54|0|0|Page is valid, no graphics -- Color: D|

Regulation S-KExhibit Number
10.60* Amendment to Employment Agreement, datedDecember 18, 2008, between the Company andAmy Fliegelman Olli.
Previously filed as Exhibit 10.5 to the Company’s QuarterlyReport on Form 10-Q for the quarterly period endedDecember 31, 2008, and incorporated herein by reference.
10.61* Amendment to Employment Agreement, datedDecember 29, 2008, between the Company andJames Bryant.
Previously filed as Exhibit 10.6 to the Company’s QuarterlyReport on Form 10-Q for the quarterly period endedDecember 31, 2008, and incorporated herein by reference.
10.62* Letter dated July 21, 2006 from the Company toAjei S. Gopal regarding terms of employment.
Previously filed as Exhibit 10.7 to the Company’s QuarterlyReport on Form 10-Q for the quarterly period endedDecember 31, 2008, and incorporated herein by reference.
10.63* Amendment dated December 12, 2008 to letterdated July 21, 2006 from the Company to AjeiS. Gopal regarding terms of employment.
Previously filed as Exhibit 10.8 to the Company’s QuarterlyReport on Form 10-Q for the quarterly period endedDecember 31, 2008, and incorporated herein by reference.
12.1 Statement of Ratios of Earnings to FixedCharges.
Filed herewith.
21 Subsidiaries of the Registrant. Filed herewith.
23 Consent of Independent Registered PublicAccounting Firm.
Filed herewith.
31.1 Certification of the CEO pursuant to §302 ofthe Sarbanes-Oxley Act of 2002.
Filed herewith.
31.2 Certification of the CFO pursuant to §302 of theSarbanes-Oxley Act of 2002.
Filed herewith.
32 Certification pursuant to §906 of the Sarbanes-Oxley Act of 2002.
Filed herewith.
* Management contract or compensatory plan or arrangement
54
%%TRANSMSG*** Transmitting Job: Y77913 PCN: 056000000 ***%%PCMSG|54 |00011|Yes|No|07/07/2009 23:54|0|0|Page is valid, no graphics -- Color: D|

Signatures
Pursuant to the requirements of Section 13 or 15(d) of the Securities Exchange Act of 1934, the Registrant has dulycaused this report to be signed on its behalf by the undersigned, thereunto duly authorized.
CA, INC.By: /s/ JOHN A. SWAINSON
John A. SwainsonChief Executive Officer
Dated: May 15, 2009
Pursuant to the requirements of the Securities Exchange Act of 1934, this report has been signed by the followingpersons on behalf of the Registrant and in the capacities and on the dates indicated:
By: /s/ NANCY E. COOPERNancy E. CooperExecutive Vice President and Chief Financial Officer
By: /s/ RICHARD J. BECKERTRichard J. BeckertCorporate Senior Vice President andCorporate Controller (Principal Accounting Officer)
Dated: May 15, 2009
55
%%TRANSMSG*** Transmitting Job: Y77913 PCN: 057000000 ***%%PCMSG|55 |00010|Yes|No|07/07/2009 22:17|0|0|Page is valid, no graphics -- Color: D|

Signatures
Pursuant to the requirements of the Securities Exchange Act of 1934, this report has been signed by the followingpersons on behalf of the Registrant and in the capacities and on the dates indicated:
/s/ Raymond J. BromarkRaymond J. Bromark
Director
/s/ Gary J. FernandesGary J. Fernandes
Director
/s/ Kay KoplovitzKay Koplovitz
Director
/s/ Robert E. La BlancRobert E. La Blanc
Director
/s/ Christopher B. LofgrenChristopher B. Lofgren
Director
/s/ William E. McCrackenWilliam E. McCracken
Non-Executive Chairman of the Board and Director
/s/ John A. SwainsonJohn A. Swainson
Chief Executive Officer and Director
/s/ Laura S. UngerLaura S. Unger
Director
/s/ Arthur F. WeinbachArthur F. Weinbach
Director
/s/ Renato ZamboniniRenato Zambonini
Director
Dated: May 15, 2009
56
%%TRANSMSG*** Transmitting Job: Y77913 PCN: 058000000 ***%%PCMSG|56 |00011|Yes|No|07/07/2009 22:17|0|0|Page is valid, no graphics -- Color: D|

CA, Inc. and SubsidiariesIslandia, New York
ANNUAL REPORT ON FORM 10-KITEM 8, ITEM 9A, ITEM 15(a)(1) AND (2), AND ITEM 15(c)
LIST OF CONSOLIDATED FINANCIAL STATEMENTSAND FINANCIAL STATEMENT SCHEDULE
CONSOLIDATED FINANCIAL STATEMENTS ANDFINANCIAL STATEMENT SCHEDULE
YEAR ENDED MARCH 31, 2009
PAGE
The following Consolidated Financial Statements of CA, Inc.
and subsidiaries are included in Items 8 and 9A:
Report of Independent Registered Public Accounting Firm 58
Consolidated Statements of Operations — Years Ended March 31, 2009, 2008, and 2007 60
Consolidated Balance Sheets — March 31, 2009 and 2008 61
Consolidated Statements of Stockholders’ Equity — Years Ended March 31, 2009, 2008, and 2007 63
Consolidated Statements of Cash Flows — Years Ended March 31, 2009, 2008, and 2007 65
Notes to the Consolidated Financial Statements 67
The following Consolidated Financial Statement Schedule of CA, Inc.
and subsidiaries is included in Item 15(c):
Schedule II — Valuation and Qualifying Accounts 101
All other schedules for which provision is made in the applicable accounting regulations of the Securities and ExchangeCommission are not required under the related instructions or are inapplicable, and therefore have been omitted.
57
%%TRANSMSG*** Transmitting Job: Y77913 PCN: 059000000 ***%%PCMSG|57 |00010|Yes|No|07/08/2009 00:02|0|0|Page is valid, no graphics -- Color: D|

Report of Independent Registered Public Accounting FirmThe Board of Directors and StockholdersCA, Inc.:
We have audited the accompanying consolidated balance sheets of CA, Inc. and subsidiaries as of March 31,2009 and 2008, and the related consolidated statements of operations, stockholders’ equity, and cash flows foreach of the fiscal years in the three-year period ended March 31, 2009. In connection with our audits of theconsolidated financial statements, we also have audited the consolidated financial statement schedule listed inItem 15(c). We also have audited CA, Inc.’s internal control over financial reporting as of March 31, 2009, basedon criteria established in Internal Control — Integrated Framework issued by the Committee of SponsoringOrganizations of the Treadway Commission (COSO). CA, Inc.’s management is responsible for these consolidatedfinancial statements and the consolidated financial statement schedule, for maintaining effective internal controlover financial reporting, and for its assessment of the effectiveness of internal control over financial reporting,included in the accompanying Management’s Report on Internal Control Over Financial Reporting underItem 9A(b). Our responsibility is to express an opinion on these consolidated financial statements and theconsolidated financial statement schedule, and an opinion on the Company’s internal control over financialreporting based on our audits.
We conducted our audits in accordance with the standards of the Public Company Accounting Oversight Board(United States). Those standards require that we plan and perform the audits to obtain reasonable assurance aboutwhether the financial statements are free of material misstatement and whether effective internal control over financialreporting was maintained in all material respects. Our audits of the consolidated financial statements includedexamining, on a test basis, evidence supporting the amounts and disclosures in the financial statements, assessing theaccounting principles used and significant estimates made by management, and evaluating the overall financialstatement presentation. Our audit of internal control over financial reporting included obtaining an understanding ofinternal control over financial reporting, assessing the risk that a material weakness exists, and testing and evaluatingthe design and operating effectiveness of internal control based on the assessed risk. Our audits also includedperforming such other procedures as we considered necessary in the circumstances. We believe that our audits providea reasonable basis for our opinions.
A company’s internal control over financial reporting is a process designed to provide reasonable assurance regardingthe reliability of financial reporting and the preparation of financial statements for external purposes in accordance withgenerally accepted accounting principles. A company’s internal control over financial reporting includes those policiesand procedures that (1) pertain to the maintenance of records that, in reasonable detail, accurately and fairly reflect thetransactions and dispositions of the assets of the company; (2) provide reasonable assurance that transactions arerecorded as necessary to permit preparation of financial statements in accordance with generally accepted accountingprinciples, and that receipts and expenditures of the company are being made only in accordance with authorizations ofmanagement and directors of the company; and (3) provide reasonable assurance regarding prevention or timelydetection of unauthorized acquisition, use, or disposition of the company’s assets that could have a material effect onthe financial statements.
Because of its inherent limitations, internal control over financial reporting may not prevent or detect misstatements.Also, projections of any evaluation of effectiveness to future periods are subject to the risk that controls may becomeinadequate because of changes in conditions, or that the degree of compliance with the policies or procedures maydeteriorate.
In our opinion, the consolidated financial statements referred to above present fairly, in all material respects, the financialposition of CA, Inc. and subsidiaries as of March 31, 2009 and 2008, and the results of their operations and their cashflows for each of the fiscal years in the three-year period ended March 31, 2009, in conformity with U.S. generallyaccepted accounting principles. Also, in our opinion, the related consolidated financial statement schedule, whenconsidered in relation to the basic consolidated financial statements taken as a whole, presents fairly, in all materialrespects, the information set forth therein.
58
%%TRANSMSG*** Transmitting Job: Y77913 PCN: 060000000 ***%%PCMSG|58 |00010|Yes|No|07/07/2009 23:17|0|0|Page is valid, no graphics -- Color: D|

Also, in our opinion, CA, Inc. maintained, in all material respects, effective internal control over financial reporting as ofMarch 31, 2009, based on criteria established in Internal Control — Integrated Framework issued by COSO.
Effective April 1, 2007, the Company adopted the provisions of Financial Accounting Standards Board (FASB)Interpretation No. 48, Accounting for Uncertainty in Income Taxes — an interpretation of FASB Statement No. 109, whichclarifies the accounting for uncertainty in income taxes recognized in an enterprise’s financial statements.
/s/ KPMG LLP
New York, New YorkMay 15, 2009
59
%%TRANSMSG*** Transmitting Job: Y77913 PCN: 061000000 ***%%PCMSG|59 |00010|Yes|No|07/07/2009 23:17|0|0|Page is valid, no graphics -- Color: D|

CA, Inc. and SubsidiariesConsolidated Statements of Operations
(IN MILLIONS, EXCEPT PER SHARE AMOUNTS) 2009 2008 2007
YEAR ENDED MARCH 31,
Revenue:
Subscription and maintenance revenue $ 3,772 $ 3,762 $ 3,458
Professional services 358 383 351
Software fees and other 141 132 134
Total Revenue 4,271 4,277 3,943
Expenses:
Costs of licensing and maintenance 298 272 250
Cost of professional services 307 368 333
Amortization of capitalized software costs 125 117 354
Selling and marketing 1,214 1,327 1,340
General and administrative 464 530 549
Product development and enhancements 486 526 557
Depreciation and amortization of other intangible assets 149 156 148
Other (gains) expenses, net (1) 6 (13)
Restructuring and other 102 121 201
Charge for in-process research and development costs — — 10
Total Expenses before Interest and Income Taxes 3,144 3,423 3,729
Income from continuing operations before interest and income taxes 1,127 854 214
Interest expense, net 25 46 60
Income from continuing operations before income taxes 1,102 808 154
Income tax expense 408 308 33
Income from Continuing Operations 694 500 121
Loss from discontinued operations, inclusive of realized losses on sale, net of income taxes — — (3)
Net Income $ 694 $ 500 $ 118
Basic Income Per Share
Income from continuing operations $ 1.35 $ 0.97 $ 0.22
Loss from discontinued operations — — —
Net income $ 1.35 $ 0.97 $ 0.22
Basic weighted average shares used in computation 513 514 544
Diluted Income Per Share
Income from continuing operations $ 1.29 $ 0.93 $ 0.22
Loss from discontinued operations — — —
Net income $ 1.29 $ 0.93 $ 0.22
Diluted weighted average shares used in computation 540 541 569
See accompanying Notes to the Consolidated Financial Statements.
60
%%TRANSMSG*** Transmitting Job: Y77913 PCN: 062000000 ***%%PCMSG|60 |00009|Yes|No|07/07/2009 22:17|0|0|Page is valid, no graphics -- Color: D|

CA, Inc. and SubsidiariesConsolidated Balance Sheets
(DOLLARS IN MILLIONS) 2009 2008
MARCH 31,
Assets
Current Assets
Cash, cash equivalents and marketable securities $ 2,713 $ 2,796
Trade and installment accounts receivable, net 839 970
Deferred income taxes — current 524 623
Other current assets 104 79
Total Current Assets 4,180 4,468
Installment accounts receivable, due after one year, net 128 234
Property and Equipment
Land and buildings 199 256
Equipment, furniture and improvements 1,258 1,236
1,457 1,492
Accumulated depreciation and amortization (1,015) (996)
Total Property and Equipment, net 442 496
Purchased software products, net of accumulated amortization of $4,712 and $4,662, respectively 155 171
Goodwill 5,364 5,351
Deferred income taxes — noncurrent 268 293
Other noncurrent assets, net 715 743
Total Assets $ 11,252 $ 11,756
See accompanying Notes to the Consolidated Financial Statements.
61
%%TRANSMSG*** Transmitting Job: Y77913 PCN: 063000000 ***%%PCMSG|61 |00011|Yes|No|07/07/2009 22:17|0|0|Page is valid, no graphics -- Color: D|

CA, Inc. and SubsidiariesConsolidated Balance Sheets (Continued)
(DOLLARS IN MILLIONS) 2009 2008
MARCH 31,
Liabilities and Stockholders’ Equity
Current Liabilities
Current portion of long-term debt and loans payable $ 650 $ 361
Accounts payable 120 152
Accrued salaries, wages, and commissions 306 400
Accrued expenses and other current liabilities 362 439
Deferred revenue (billed or collected) — current 2,431 2,664
Taxes payable, other than income taxes payable 85 97
Federal, state, and foreign income taxes payable 84 59
Deferred income taxes — current 40 106
Total Current Liabilities 4,078 4,278
Long-term debt, net of current portion 1,287 2,221
Federal, state, and foreign income taxes payable 284 225
Deferred income taxes — noncurrent 136 200
Deferred revenue (billed or collected) — noncurrent 1,000 1,036
Other noncurrent liabilities 123 87
Total Liabilities 6,908 8,047
Stockholders’ Equity
Preferred stock, no par value, 10,000,000 shares authorized; No shares issued and outstanding — —
Common stock, $0.10 par value, 1,100,000,000 shares authorized; 589,695,081 and 589,695,081 sharesissued; 514,292,558 and 509,782,514 shares outstanding, respectively 59 59
Additional paid-in capital 3,557 3,566
Retained earnings 2,784 2,173
Accumulated other comprehensive loss (183) (101)
Treasury stock, at cost, 75,402,523 shares and 79,912,567 shares, respectively (1,873) (1,988)
Total Stockholders’ Equity 4,344 3,709
Total Liabilities and Stockholders’ Equity $ 11,252 $ 11,756
See accompanying Notes to the Consolidated Financial Statements.
62
%%TRANSMSG*** Transmitting Job: Y77913 PCN: 064000000 ***%%PCMSG|62 |00009|Yes|No|07/07/2009 22:17|0|0|Page is valid, no graphics -- Color: D|

CA, Inc. and SubsidiariesConsolidated Statements of Stockholders’ Equity
(IN MILLIONS, EXCEPT PER SHARE AMOUNTS)COMMON
STOCK
ADDITIONALPAID-IN
CAPITALRETAINEDEARNINGS
ACCUMULATEDOTHER
COMPREHENSIVELOSS
TREASURYSTOCK
TOTALSTOCKHOLDERS’
EQUITY
Balance as of March 31, 2006 $ 63 $ 4,536 $ 1,714 $ (107) $ (1,488) $ 4,718
Net income 118 118
Translation adjustment in 2007 10 10
Unrealized gain on marketable securities, net of taxes 1 1
Comprehensive income 129
Stock-based compensation 88 88
Dividends declared ($0.16 per share) (88) (88)
Exercise of common stock options, ESPP, and other items (95) 113 18
Issuance of options related to acquisitions, net ofamortization 5 5
Treasury stock purchased (225) (225)
Common stock purchased and retired (4) (987) (991)
Balance as of March 31, 2007 $ 59 $ 3,547 $ 1,744 $ (96) $ (1,600) $ 3,654
Net income 500 500
Translation adjustment in 2008 (4) (4)
Unrealized loss on marketable securities, net of taxes (1) (1)
Comprehensive income 495
Adoption of new accounting principle — FIN 48 11 11
Stock-based compensation 102 102
Dividends declared ($0.16 per share) (82) (82)
Exercise of common stock options, ESPP, and other items (85) 112 27
Issuance of options related to acquisitions, net ofamortization 2 2
Treasury stock purchased (500) (500)
Balance as of March 31, 2008 $ 59 $ 3,566 $ 2,173 $ (101) $ (1,988) $ 3,709
See accompanying Notes to the Consolidated Financial Statements.
63
%%TRANSMSG*** Transmitting Job: Y77913 PCN: 065000000 ***%%PCMSG|63 |00009|Yes|No|07/07/2009 22:17|0|0|Page is valid, no graphics -- Color: D|

CA, Inc. and SubsidiariesConsolidated Statements of Stockholders’ Equity(Continued)
(IN MILLIONS, EXCEPT PER SHARE AMOUNTS)COMMON
STOCK
ADDITIONALPAID-IN
CAPITALRETAINEDEARNINGS
ACCUMULATEDOTHER
COMPREHENSIVELOSS
TREASURYSTOCK
TOTALSTOCKHOLDERS’
EQUITY
Balance as of March 31, 2008 $ 59 $ 3,566 $ 2,173 $ (101) $ (1,988) $ 3,709
Net income 694 694
Translation adjustment in 2009 (77) (77)
Unrealized loss on derivatives, net of $3 million in taxes (5) (5)
Comprehensive income 612
Stock-based compensation 92 92
Dividends declared ($0.16 per share) (83) (83)
Exercise of common stock options, ESPP, and other items (101) 119 18
Treasury stock purchased (4) (4)
Balance as of March 31, 2009 $ 59 $ 3,557 $ 2,784 $ (183) $ (1,873) $ 4,344
See accompanying Notes to the Consolidated Financial Statements.
64
%%TRANSMSG*** Transmitting Job: Y77913 PCN: 066000000 ***%%PCMSG|64 |00010|Yes|No|07/24/2009 11:37|0|0|Page is valid, no graphics -- Color: D|

CA, Inc. and SubsidiariesConsolidated Statements of Cash Flows
(IN MILLIONS) 2009 2008 2007
YEAR ENDED MARCH 31,
OPERATING ACTIVITIES:
Net income $ 694 $ 500 $ 118
Loss from discontinued operations, net of income taxes — — 3
Income from continuing operations 694 500 121
Adjustments to reconcile income from continuing operations to net cash provided
by continuing operating activities:
Depreciation and amortization 274 273 502
Provision for deferred income taxes (42) (4) (217)
Provision for bad debts 15 23 4
Non-cash stock based compensation expense and defined contribution plan 116 122 116
Non-cash charge for purchased in-process research and development — — 10
(Gains) losses on sale and disposal of assets and repayment of debt, net (3) 12 (18)
Charge for impairment of assets 5 6 16
Foreign currency transaction losses (gains) — before taxes 67 (28) —
Changes in other operating assets and liabilities, net of effect of acquisitions:
Decrease in trade and current installment accounts receivable, net 44 71 195
Decrease in noncurrent installment accounts receivable, net 155 40 79
(Decrease) increase in deferred revenue (billed or collected) — current and noncurrent (49) 258 294
Increase (decrease) in taxes payable, net 35 (82) (93)
Decrease in accounts payable, accrued expenses and other (99) (95) (12)
(Decrease) increase in accrued salaries, wages, and commissions (29) 26 (14)
Restructuring and other, net (13) 12 77
Changes in other operating assets and liabilities 42 (31) 8
Net Cash Provided by Continuing Operating Activities 1,212 1,103 1,068
Investing Activities:
Acquisitions, primarily goodwill, purchased software, and other intangible assets, net of cash acquired (76) (27) (212)
Settlements of purchase accounting liabilities (7) (7) (21)
Purchases of property and equipment (83) (117) (150)
Proceeds from sale and divesture of assets 6 19 22
Proceeds from sale-lease back transactions — 27 201
Capitalized software development costs (129) (112) (85)
Other investing activities 5 (2) 43
Net Cash Used in Investing Activities (284) (219) (202)
See accompanying Notes to the Consolidated Financial Statements.
65
%%TRANSMSG*** Transmitting Job: Y77913 PCN: 067000000 ***%%PCMSG|65 |00008|Yes|No|07/07/2009 22:17|0|0|Page is valid, no graphics -- Color: D|

CA, Inc. and SubsidiariesConsolidated Statements of Cash Flows (Continued)
(IN MILLIONS) 2009 2008 2007
YEAR ENDED MARCH 31,
FINANCING ACTIVITIES:
Dividends paid (83) (82) (88)
Purchases of common stock (4) (500) (1,216)
Debt borrowings 1 750 751
Debt repayments (680) (759) (5)
Debt issuance costs — (3) —
Exercise of common stock options and other 7 22 43
Net Cash Used in Financing Activities (759) (572) (515)
Increase in Cash and Cash Equivalents before Effect of Exchange Rate Changes on Cash 169 312 351
Effect of exchange rate changes on cash (252) 208 93
(Decrease) Increase in Cash and Cash Equivalents (83) 520 444
Cash and Cash Equivalents at Beginning of Period 2,795 2,275 1,831
Cash and Cash Equivalents at End of Period $ 2,712 $ 2,795 $ 2,275
See accompanying Notes to the Consolidated Financial Statements.
66
%%TRANSMSG*** Transmitting Job: Y77913 PCN: 068000000 ***%%PCMSG|66 |00009|Yes|No|07/07/2009 22:17|0|0|Page is valid, no graphics -- Color: D|

Notes to the Consolidated Financial StatementsNote 1 — Significant Accounting Policies(a) Description of Business: CA, Inc. and subsidiaries (the Company) develops, markets, delivers and licenses softwareproducts and services.
(b) Principles of Consolidation: The Consolidated Financial Statements include the accounts of the Company and itsmajority-owned and controlled subsidiaries. Investments in affiliates owned 50% or less are accounted for by the equitymethod. Intercompany balances and transactions have been eliminated in consolidation. Companies acquired duringeach reporting period are reflected in the results of the Company effective from their respective dates of acquisitionthrough the end of the reporting period (refer to Note 2, “Acquisitions and Divestitures” in these Notes to theConsolidated Financial Statements for additional information).
(c) Divestiture: In November 2006, the Company sold its 70% equity interest in Benit Company (Benit) to the minorityinterest holder. As a result, Benit has been classified as a discontinued operation and its results of operations have beenreclassified in the Consolidated Statements of Operations for the fiscal year ended March 31, 2007. The cash flows forBenit were deemed immaterial for separate presentation as a discontinued operation in the Consolidated Balance Sheetand Consolidated Statements of Cash Flows. All related footnotes to the Consolidated Financial Statements have beenadjusted to exclude the effect of the operating results of Benit. Refer to Note 2, “Acquisitions and Divestitures,” in theseNotes to the Consolidated Financial Statements for additional information.
(d) Use of Estimates: The preparation of financial statements in conformity with generally accepted accounting principlesin the United States of America (GAAP) requires management to make estimates and assumptions that affect theamounts reported in the financial statements and accompanying notes. Although these estimates are based onmanagement’s knowledge of current events and actions it may undertake in the future, these estimates may ultimatelydiffer from actual results.
(e) Translation of Foreign Currencies: Foreign currency assets and liabilities of the Company’s international subsidiaries aretranslated using the exchange rates in effect at the balance sheet date. Results of operations are translated using theaverage exchange rates prevailing throughout the year. The effects of exchange rate fluctuations on translating foreigncurrency assets and liabilities into U.S. dollars are accumulated as part of the foreign currency translation adjustment inStockholders’ Equity. Gains and losses from foreign currency transactions are included in the “Other (gains) expenses,net” line item in the Consolidated Statements of Operations in the period in which they occur. Net income includesexchange transaction gains (losses) and the impact of derivatives, net of taxes, of approximately $7 million, $17 millionand $0 million in the fiscal years ended March 31, 2009, 2008 and 2007, respectively. Refer to Note 4, “Derivatives andFair Value Measurements,” for additional information.
(f) Revenue Recognition: The Company generates revenue from the following primary sources: (1) licensing softwareproducts; (2) providing customer technical support (referred to as “maintenance”); and (3) providing professionalservices, such as product implementation, consulting and education. Revenue is recorded net of applicable sales taxes.
The Company recognizes revenue pursuant to the requirements of Statement of Position (SOP) 97-2, “Software RevenueRecognition,” issued by the American Institute of Certified Public Accountants, as amended by SOP 98-9, “Modification ofSOP 97-2, Software Revenue Recognition, With Respect to Certain Transactions.” In accordance with SOP 97-2, the Companybegins to recognize revenue from licensing and maintenance when all of the following criteria are met: (1) the Companyhas evidence of an arrangement with a customer; (2) the Company delivers the products; (3) license agreement termsare fixed or determinable and free of contingencies or uncertainties that may alter the agreement such that it may notbe complete and final; and (4) collection is probable.
The Company’s software licenses generally do not include acceptance provisions. An acceptance provision allows acustomer to test the software for a defined period of time before committing to license the software. If a licenseagreement includes an acceptance provision, the Company does not recognize revenue until the earlier of the receipt ofa written customer acceptance or, if not notified by the customer to cancel the license agreement, the expiration of theacceptance period.
67
%%TRANSMSG*** Transmitting Job: Y77913 PCN: 069000000 ***%%PCMSG|67 |00010|Yes|No|07/07/2009 22:17|0|0|Page is valid, no graphics -- Color: D|

Under the Company’s subscription model, implemented in October 2000, software license agreements typically combinethe right to use specified software products, the right to maintenance, and the right to receive unspecified futuresoftware products for no additional fee during the term of the agreement. Under these subscription licenses, once allfour of the above-noted revenue recognition criteria are met, the Company is required under GAAP to recognize revenueratably over the term of the license agreement.
For license agreements signed prior to October 2000, once all four of the above-noted revenue recognition criteria weremet, software license fees were recognized as revenue generally when the software was delivered to the customer, or“up-front” (as the contracts did not include a right to unspecified future software products), and the maintenance feeswere deferred and subsequently recognized as revenue over the term of the license. Currently, a relatively small amountof the Company’s revenue from software licenses is recognized on an up-front basis, subject to meeting the samerevenue recognition criteria in accordance with SOP 97-2 as described above. Software fees from such licenses arerecognized up-front and are reported in the “Software fees and other” line item in the Consolidated Statements ofOperations. Maintenance fees from such licenses are recognized ratably over the term of the license and are recordedon the “Subscription and maintenance revenue” line item in the Consolidated Statements of Operations. Licenseagreements with software fees that are recognized up-front do not include the right to receive unspecified futuresoftware products. However, in the event such license agreements are executed within close proximity to or incontemplation of other license agreements that are signed under the Company’s subscription model with the samecustomer, the licenses together may be considered a single multi-element agreement, and all such revenue is required tobe recognized ratably and is recorded as “Subscription and maintenance revenue” in the Consolidated Statements ofOperations.
Since the Company implemented its subscription model in October 2000, the Company’s practice with respect toproducts of newly acquired businesses with established vendor specific objective evidence (VSOE) of fair value has beento record revenue initially on the acquired company’s systems, generally under an up-front model; and, starting withinthe first fiscal year after the acquisition, to enter new licenses for such products under the Company’s subscriptionmodel, following which revenue is recognized ratably and recorded as “Subscription and maintenance revenue.” In someinstances, the Company sells newly developed and recently acquired products on an up-front model. The softwarelicense fees from these contracts are presented as “Software fees and other.” Selling such licenses under an up-frontmodel may result in higher total revenue in a current reporting period than if such licenses were based on theCompany’s subscription model and the associated revenue recognized ratably.
Revenue from professional service arrangements is generally recognized as the services are performed. Revenue fromcommitted professional services that are sold as part of a subscription license agreement is deferred and recognized ona ratable basis over the term of the related software license. If it is not probable that a project will be completed or thepayment will be received, revenue recognition is deferred until the uncertainty is removed.
Revenue from sales to distributors, resellers, and value-added resellers commences when all four of the SOP 97-2revenue recognition criteria noted above are met and when these entities sell the software product to their customers.This is commonly referred to as the sell-through method. Revenue from the sale of products to distributors, resellers andvalue-added resellers that include licensing terms that provide the right for the end-users to receive certain unspecifiedfuture software products is recognized on a ratable basis.
In the second quarter of fiscal year 2008, the Company decided that certain channel or “commercial” products soldthrough tier two distributors will no longer be licensed with terms entitling the customer to receive unspecified futuresoftware products. As such, license revenue from these sales where the Company has established VSOE formaintenance is recognized on a perpetual or up-front basis using the residual method and is reflected as “Software feesand other,” with maintenance revenue being deferred and recognized ratably.
The Company has an established business practice of offering installment payment options to customers and has ahistory of successfully collecting substantially all amounts due under such agreements. The Company assessescollectibility based on a number of factors, including past transaction history with the customer and the creditworthinessof the customer. If, in the Company’s judgment, collection of a fee is not probable, revenue will not be recognized untilthe uncertainty is removed, which is generally through the receipt of cash payment.
68
%%TRANSMSG*** Transmitting Job: Y77913 PCN: 070000000 ***%%PCMSG|68 |00010|Yes|No|07/07/2009 22:17|0|0|Page is valid, no graphics -- Color: D|
The Company’s standard licensing agreements include a product warranty provision for all products. Such warranties areaccounted for in accordance with Statement of Financial Accounting Standards (SFAS) No. 5, “Accounting forContingencies.” The likelihood that the Company would be required to make refunds to customers under such provisionsis considered remote.
Under the terms of substantially all of the Company’s license agreements, the Company has agreed to indemnifycustomers for costs and damages arising from claims against such customers based on, among other things, allegationsthat its software products infringe the intellectual property rights of a third party. In most cases, in the event of aninfringement claim, the Company retains the right to (i) procure for the customer the right to continue using thesoftware product; (ii) replace or modify the software product to eliminate the infringement while providing substantiallyequivalent functionality; or (iii) if neither (i) nor (ii) can be reasonably achieved, the Company may terminate the licenseagreement and refund to the customer a pro-rata portion of the fees paid. Such indemnification provisions areaccounted for in accordance with SFAS No. 5. The likelihood that the Company would be required to make refunds tocustomers under such provisions is considered remote. In most cases and where legally enforceable, the indemnificationis limited to the amount paid by the customer.
Subscription and Maintenance Revenue: Subscription and maintenance revenue is the amount of revenue recognizedratably during the reporting period from either: (i) subscription license agreements that were in effect during the period,which generally include maintenance that is bundled with and not separately identifiable from software usage fees orproduct sales, or (ii) maintenance agreements associated with providing customer technical support and access tosoftware fixes and upgrades which are separately identifiable from software usage fees or product sales. Deferredrevenue (billed or collected) is comprised of: (i) amounts received in advance of revenue recognition from the customer,(ii) amounts billed but not collected for which revenue has not yet been earned, and (iii) amounts received in advanceof revenue recognition from financial institutions where the Company has transferred its interest in committedinstallments. Each of the categories is further differentiated by current or non-current classification depending on whenthe revenue is anticipated to be earned (i.e., within the next twelve months or subsequent to the next twelve months).
Software Fees and Other: Software fees and other revenue primarily consist of revenue that is recognized on an up-frontbasis. This includes revenue generated through transactions with distribution and original equipment manufacturerchannel partners (sometimes referred to as the Company’s “indirect” or “channel” revenue) and certain revenueassociated with new or acquired products sold on an up-front basis. Also included is financing fee revenue, whichresults from the discounting of product sales recognized on an up-front basis with extended payment terms to presentvalue. Revenue recognized on an up-front basis results in higher revenue for the period than if the same revenue hadbeen recognized ratably under the Company’s subscription model.
(g) Sales Commissions: Sales commissions are recognized in the period the commissions are earned by employees, whichis typically upon the signing of the contract. The Company accrues for sales commissions based on, among other things,estimates of how the sales personnel will perform against specified annual sales quotas. These estimates involveassumptions regarding the Company’s projected new product sales and billings. All of these assumptions reflect theCompany’s best estimates, but these items involve uncertainties, and as a result, if other assumptions had been used inthe period, sales commission expense could have been affected for that period. Under the Company’s current salescompensation model, during periods of high growth and sales of new products relative to revenue in that period, theamount of sales commission expense attributable to the license agreements signed in the period would be recognizedfully and could negatively impact income and net income per share in that period.
(h) Accounting for Stock-Based Compensation: Stock-based compensation cost is measured at the grant date, based onthe calculated fair value of the award, and is recognized as an expense over the employee requisite service period(generally the vesting period of the equity grant).
The Company currently maintains several stock-based compensation plans. The Company uses the Black-Scholesoption-pricing model to compute the estimated fair value of certain stock-based awards. The Black-Scholes modelincludes assumptions regarding dividend yields, expected volatility, expected lives, and risk-free interest rates. Theseassumptions reflect the Company’s best estimates, but these items involve uncertainties based on market and otherconditions outside of the Company’s control. As a result, if other assumptions had been used, stock-based
69
%%TRANSMSG*** Transmitting Job: Y77913 PCN: 071000000 ***%%PCMSG|69 |00009|Yes|No|07/07/2009 22:17|0|0|Page is valid, no graphics -- Color: D|
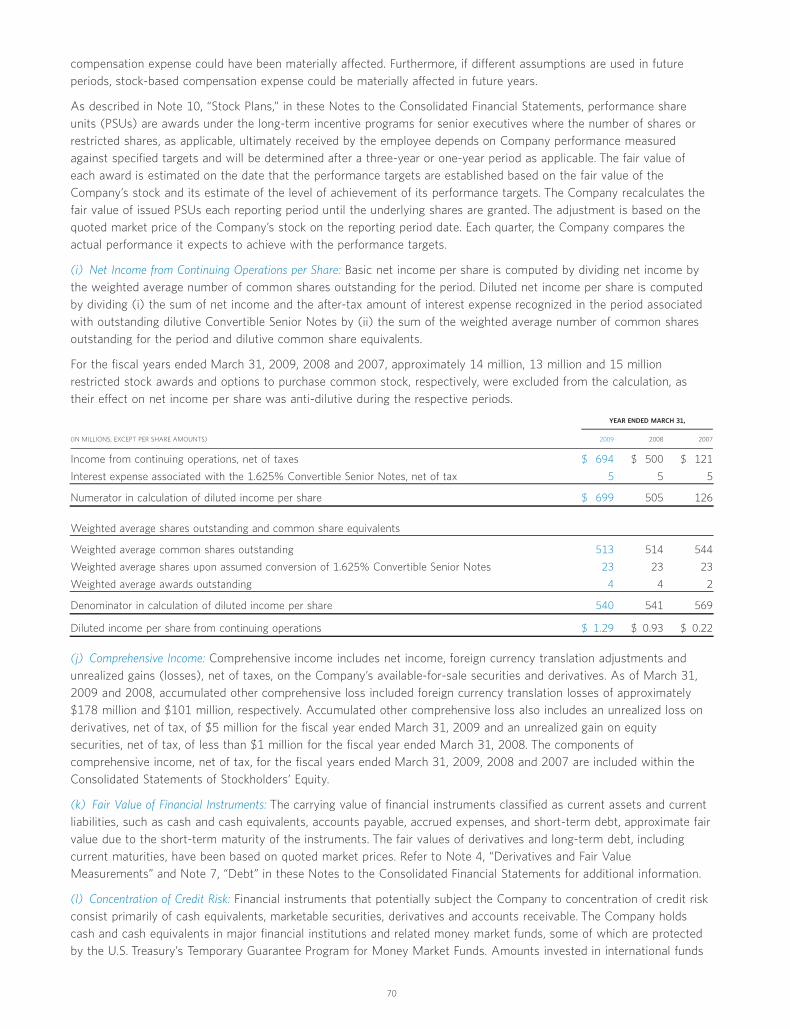
compensation expense could have been materially affected. Furthermore, if different assumptions are used in futureperiods, stock-based compensation expense could be materially affected in future years.
As described in Note 10, “Stock Plans,” in these Notes to the Consolidated Financial Statements, performance shareunits (PSUs) are awards under the long-term incentive programs for senior executives where the number of shares orrestricted shares, as applicable, ultimately received by the employee depends on Company performance measuredagainst specified targets and will be determined after a three-year or one-year period as applicable. The fair value ofeach award is estimated on the date that the performance targets are established based on the fair value of theCompany’s stock and its estimate of the level of achievement of its performance targets. The Company recalculates thefair value of issued PSUs each reporting period until the underlying shares are granted. The adjustment is based on thequoted market price of the Company’s stock on the reporting period date. Each quarter, the Company compares theactual performance it expects to achieve with the performance targets.
(i) Net Income from Continuing Operations per Share: Basic net income per share is computed by dividing net income bythe weighted average number of common shares outstanding for the period. Diluted net income per share is computedby dividing (i) the sum of net income and the after-tax amount of interest expense recognized in the period associatedwith outstanding dilutive Convertible Senior Notes by (ii) the sum of the weighted average number of common sharesoutstanding for the period and dilutive common share equivalents.
For the fiscal years ended March 31, 2009, 2008 and 2007, approximately 14 million, 13 million and 15 millionrestricted stock awards and options to purchase common stock, respectively, were excluded from the calculation, astheir effect on net income per share was anti-dilutive during the respective periods.
(IN MILLIONS, EXCEPT PER SHARE AMOUNTS) 2009 2008 2007
YEAR ENDED MARCH 31,
Income from continuing operations, net of taxes $ 694 $ 500 $ 121
Interest expense associated with the 1.625% Convertible Senior Notes, net of tax 5 5 5
Numerator in calculation of diluted income per share $ 699 505 126
Weighted average shares outstanding and common share equivalents
Weighted average common shares outstanding 513 514 544
Weighted average shares upon assumed conversion of 1.625% Convertible Senior Notes 23 23 23
Weighted average awards outstanding 4 4 2
Denominator in calculation of diluted income per share 540 541 569
Diluted income per share from continuing operations $ 1.29 $ 0.93 $ 0.22
(j) Comprehensive Income: Comprehensive income includes net income, foreign currency translation adjustments andunrealized gains (losses), net of taxes, on the Company’s available-for-sale securities and derivatives. As of March 31,2009 and 2008, accumulated other comprehensive loss included foreign currency translation losses of approximately$178 million and $101 million, respectively. Accumulated other comprehensive loss also includes an unrealized loss onderivatives, net of tax, of $5 million for the fiscal year ended March 31, 2009 and an unrealized gain on equitysecurities, net of tax, of less than $1 million for the fiscal year ended March 31, 2008. The components ofcomprehensive income, net of tax, for the fiscal years ended March 31, 2009, 2008 and 2007 are included within theConsolidated Statements of Stockholders’ Equity.
(k) Fair Value of Financial Instruments: The carrying value of financial instruments classified as current assets and currentliabilities, such as cash and cash equivalents, accounts payable, accrued expenses, and short-term debt, approximate fairvalue due to the short-term maturity of the instruments. The fair values of derivatives and long-term debt, includingcurrent maturities, have been based on quoted market prices. Refer to Note 4, “Derivatives and Fair ValueMeasurements” and Note 7, “Debt” in these Notes to the Consolidated Financial Statements for additional information.
(l) Concentration of Credit Risk: Financial instruments that potentially subject the Company to concentration of credit riskconsist primarily of cash equivalents, marketable securities, derivatives and accounts receivable. The Company holdscash and cash equivalents in major financial institutions and related money market funds, some of which are protectedby the U.S. Treasury’s Temporary Guarantee Program for Money Market Funds. Amounts invested in international funds
70
%%TRANSMSG*** Transmitting Job: Y77913 PCN: 072000000 ***%%PCMSG|70 |00011|Yes|No|07/07/2009 23:22|0|0|Page is valid, no graphics -- Color: D|

are subject to different levels of protection depending upon the jurisdiction. The Company historically has notexperienced any losses in its cash and cash equivalent portfolios.
Amounts included in accounts receivable expected to be collected from customers, as disclosed in Note 6, “Trade andInstallment Accounts Receivable,” have limited exposure to concentration of credit risk due to the diverse customer baseand geographic areas covered by operations. Unbilled amounts due under the Company’s prior business model that areexpected to be collected from customers include one large IT outsourcer with a license arrangement that extendsthrough fiscal year 2012 with a net unbilled receivable balance of approximately $232 million at March 31, 2009.
Prior to fiscal year 2001, the Company sold individual accounts receivable from certain financial institutions to a thirdparty subject to certain recourse provisions. The outstanding principal balance subject to recourse of these receivableswas approximately $38 million and $81 million as of March 31, 2009 and March 31, 2008, respectively. As ofMarch 31, 2009, the Company has established a liability for the fair value of the recourse provisions of approximately$2 million associated with these receivables.
(m) Cash, Cash Equivalents and Marketable Securities: All financial instruments purchased with an original maturity ofthree months or less are considered cash equivalents. The Company has determined that all of its investment securitiesshould be classified as available-for-sale. Available-for-sale securities are carried at fair value, with unrealized gains andlosses reported in the Stockholders’ Equity of the balance sheet under the caption “Accumulated Other ComprehensiveLoss.” The amortized cost of debt securities is adjusted for amortization of premiums and accretion of discounts tomaturity. Such amortization and accretion is included in the “Interest expense, net” line item in the ConsolidatedStatements of Operations. Realized gains and losses and declines in value judged to be other than temporary onavailable-for-sale securities are included in the “General, and administrative” line item in the Consolidated Statements ofOperations. The cost of securities sold is based on the specific identification method. Interest and dividends on securitiesclassified as available-for-sale are included in the “Interest expense, net” line item in the Consolidated Statements ofOperations.
The Company’s cash, cash equivalents and marketable securities are held in numerous locations throughout the world,with approximately 50% residing outside the United States at March 31, 2009. Marketable securities were less than$1 million at March 31, 2009 and March 31, 2008.
Total interest income, which primarily related to the Company’s cash and cash equivalent balances, for the fiscal yearsended March 31, 2009, 2008 and 2007 was approximately $70 million, $92 million and $66 million, respectively, and isincluded in the “Interest expense, net” line item in the Consolidated Statements of Operations.
(n) Restricted Cash: The Company’s insurance subsidiary requires a minimum restricted cash balance of $50 million. Inaddition, the Company has other restricted cash balances, including cash collateral for letters of credit. The total amountof restricted cash as of March 31, 2009 and 2008 was approximately $56 million and $62 million, respectively, and isincluded in the “Other noncurrent assets, net” line item on the Consolidated Balance Sheets.
(o) Long-Lived Assets
Property and Equipment: Land, buildings, equipment, furniture, and improvements are stated at cost. Depreciation andamortization are provided over the estimated useful lives of the assets by the straight-line method. Building andimprovements are estimated to have 5- to 40-year lives, and the remaining property and equipment are estimated tohave 3- to 7-year lives.
A summary of property and equipment is as follows:
(DOLLARS IN MILLIONS) 2009 2008
MARCH 31,
Land and buildings $ 199 $ 256
Equipment, furniture, and improvements 1,258 1,236
1,457 1,492
Accumulated depreciation and amortization (1,015) (996)
Net property and equipment $ 442 $ 496
71
%%TRANSMSG*** Transmitting Job: Y77913 PCN: 073000000 ***%%PCMSG|71 |00010|Yes|No|07/07/2009 23:24|0|0|Page is valid, no graphics -- Color: D|
Depreciation expense for the fiscal years ended March 31, 2009, 2008 and 2007 was approximately $96 million,$91 million and $92 million, respectively.
Capitalized Software Costs and Other Identified Intangible Assets: Capitalized software costs include the fair value of rightsto market software products acquired in purchase business combinations. In allocating the purchase price to the assetsacquired in a purchase business combination, the Company allocates a portion of the purchase price equal to the fairvalue at the acquisition date of the rights to market the software products of the acquired company. The Companyamortizes all purchased software costs over their remaining economic lives, estimated to be between two and ten yearsfrom the date of acquisition.
In accordance with SFAS No. 86, “Accounting for the Costs of Computer Software to be Sold, Leased, or Otherwise Marketed,”internally generated software development costs associated with new products and significant enhancements to existingsoftware products are expensed as incurred until technological feasibility has been established. Internally generatedsoftware development costs of approximately $135 million, $112 million and $85 million were capitalized during fiscalyears 2009, 2008 and 2007, respectively. The Company recorded amortization of approximately $68 million, $57 millionand $54 million for the fiscal years ended March 31, 2009, 2008 and 2007, respectively, which was included in the“Amortization of capitalized software costs” line item in the Consolidated Statements of Operations. Unamortized,internally generated software development costs included in the “Other noncurrent assets, net” line item on theConsolidated Balance Sheets as of March 31, 2009 and 2008 were approximately $333 million and $276 million,respectively. Annual amortization of capitalized software costs is the greater of the amount computed using the ratiothat current gross revenues for a product bear to the total of current and anticipated future gross revenues for thatproduct or the straight-line method over the remaining estimated economic life of the software product, generallyestimated to be five years from the date the product became available for general release to customers. The Companyamortized capitalized software costs using the straight-line method in fiscal years 2009, 2008 and 2007, as anticipatedfuture revenue is projected to increase for several years considering the Company is continuously integrating currentsoftware technology into new software products.
Other identified intangible assets include both customer relationships and trademarks/trade names.
In connection with the acquisition of Cybermation, Inc., MDY Group International, Inc., and XOsoft, Inc., in fiscal year2007, the Company recognized approximately $19 million, $3 million and $7 million, respectively, of customerrelationships and trademarks/trade names.
In accordance with SFAS No. 142, “Goodwill and Other Intangible Assets,” certain identified intangible assets withindefinite lives are not subject to amortization. The Company reviews its long lived assets and certain identifiableintangible assets with indefinite lives for impairment annually or whenever events or changes in business circumstancesindicate that the carrying amount of the assets may not be fully recoverable or that the useful lives of these assets areno longer appropriate. During fiscal year 2009, the Company did not record impairment charges relating to certainidentifiable intangible assets that were acquired in conjunction with prior year acquisitions and not subject toamortization. During the first quarter of fiscal year 2008, the Company recorded impairment charges of less than$1 million relating to certain identifiable intangible assets that were acquired in conjunction with prior year acquisitionsand not subject to amortization. These impairment charges were reported in the “Restructuring and other” line item inthe Consolidated Statements of Operations.
The Company amortizes all other identified intangible assets over their remaining economic lives, estimated to bebetween three and twelve years from the date of acquisition. The Company recorded amortization of other identifiedintangible assets of approximately $53 million, $66 million and $57 million in fiscal 2009, 2008 and 2007, respectively.The net carrying value of other identified intangible assets as of March 31, 2009 and 2008 was approximately$237 million and $285 million, respectively, and was included in the “Other noncurrent assets, net” line item on theConsolidated Balance Sheets.
The gross carrying amounts and accumulated amortization for identified intangible assets at March 31, 2009 wasapproximately $6,408 million and $5,683 million, respectively. These amounts include fully amortized intangible assetsof approximately $5,042 million, which is composed of purchased software of approximately $4,545 million, internallydeveloped software of approximately $381 million and other identified intangible assets subject to amortization of
72
%%TRANSMSG*** Transmitting Job: Y77913 PCN: 074000000 ***%%PCMSG|72 |00010|Yes|No|07/07/2009 22:17|0|0|Page is valid, no graphics -- Color: D|

approximately $116 million. The remaining gross carrying amounts and accumulated amortization for identifiedintangible assets that are not fully amortized are as follows:
(IN MILLIONS)
GROSSAMORTIZABLE
ASSETSACCUMULATEDAMORTIZATION
NETASSETS
AS OF MARCH 31, 2009
Capitalized software:
Purchased $ 322 $ 167 $ 155
Internally developed 481 148 333
Other identified intangible assets subject to amortization 549 326 223
Other identified intangible assets not subject to amortization 14 — 14
Total $ 1,366 $ 641 $ 725
The gross carrying amounts and accumulated amortization for identified intangible assets at March 31, 2008 wasapproximately $6,249 million and $5,517 million, respectively. These amounts include fully amortized intangible assetsof approximately $4,943 million, which is composed of purchased software of approximately $4,488 million, internallydeveloped software of approximately $345 million and other identified intangible assets subject to amortization ofapproximately $110 million. The remaining gross carrying amounts and accumulated amortization for identifiedintangible assets that are not fully amortized are as follows:
(IN MILLIONS)
GROSSAMORTIZABLE
ASSETSACCUMULATEDAMORTIZATION
NETASSETS
AS OF MARCH 31, 2008
Capitalized software:
Purchased $ 345 $ 174 $ 171
Internally developed 397 121 276
Other identified intangible assets subject to amortization 550 279 271
Other identified intangible assets not subject to amortization 14 — 14
Total $ 1,306 $ 574 $ 732
Based on the identified intangible assets recorded through March 31, 2009, the annual amortization expense over thenext five fiscal years is expected to be as follows:
(IN MILLIONS) 2010 2011 2012 2013 2014
YEAR ENDED MARCH 31,
Capitalized software:
Purchased $ 51 $ 40 $ 28 $ 20 $ 12
Internally developed 87 83 67 53 34
Other identified intangible assets subject to amortization 53 52 32 26 21
Total $ 191 $ 175 $ 127 $ 99 $ 67
Accounting for Long-Lived Assets: The carrying values of purchased software products, other intangible assets, and otherlong-lived assets, including investments, are reviewed on a regular basis for the existence of facts or circumstances, bothinternally and externally, that may suggest impairment. If an impairment is deemed to exist, any related impairment lossis calculated based on net realizable value for capitalized software and fair value for all other intangibles.
Goodwill: Goodwill represents the excess of the aggregate purchase price over the fair value of the net tangible andidentifiable intangible assets and in-process research and development acquired by the Company in a purchase businesscombination. Goodwill is not amortized into results of operations but instead is reviewed for impairment. During thefourth quarter of fiscal year 2009, the Company performed its annual impairment review of goodwill and concluded thatthere was no impairment in fiscal year 2009. Similar impairment reviews were performed during the fourth quarter offiscal years 2008 and 2007. The Company concluded that there was no impairment to be recorded in those fiscal years.
The carrying value of goodwill was approximately $5,364 million and $5,351 million as of March 31, 2009 andMarch 31, 2008, respectively. During fiscal year 2009, goodwill increased by approximately $26 million as a result of
73
%%TRANSMSG*** Transmitting Job: Y77913 PCN: 075000000 ***%%PCMSG|73 |00011|Yes|No|07/07/2009 22:17|0|0|Page is valid, no graphics -- Color: D|

fiscal year 2009 acquisitions, which was partially offset by approximately $13 million of goodwill adjustments for prioryear acquisitions.
The carrying value of goodwill was approximately $5,351 million and $5,345 million as of March 31, 2008 andMarch 31, 2007, respectively. During fiscal year 2008, goodwill increased by approximately $12 million as a result offiscal year 2008 acquisitions, which was partially offset by approximately $6 million of goodwill adjustments for prioryear acquisitions.
(p) Income Taxes: SFAS No. 109, “Accounting for Income Taxes,” requires the Company to estimate its actual current taxliability in each jurisdiction; estimate differences resulting from differing treatment of items for financial statementpurposes versus tax return purposes (known as “temporary differences”), resulting in deferred tax assets and liabilities;and assess the likelihood that the Company’s deferred tax assets will be recovered from future taxable income. If theCompany believes that recovery is not likely, it establishes a valuation allowance. The factors that the Companyconsiders in assessing the likelihood of realization of these deferred tax assets include the forecast of future taxableincome and available tax planning strategies that could be implemented to realize the deferred tax assets.
When the Company prepares its consolidated financial statements, the Company estimates its income taxes in eachjurisdiction in which it operates. On April 1, 2007, the Company adopted Financial Accounting Standards BoardInterpretation No. 48, “Accounting for Uncertainty in Income Taxes — an interpretation of FASB Statement No. 109”(FIN 48). Among other things FIN 48 prescribes a “more-likely-than-not” threshold for the recognition and derecognitionof tax positions.
(q) Deferred Revenue (Billed or Collected): The Company accounts for unearned revenue on billed amounts due fromcustomers on a “gross method” of presentation. Under the gross method, unearned revenue on billed installments(collected or uncollected) is reported as deferred revenue in the liability section of the balance sheet. The components of“Deferred revenue (billed or collected) — current” and “Deferred revenue (billed or collected) — noncurrent” as ofMarch 31, 2009 and March 31, 2008 are as follows:
(IN MILLIONS) 2009 2008
AS OF MARCH 31,
Current:
Subscription and maintenance $ 2,272 $ 2,455
Professional services 150 166
Financing obligations and other 9 43
Total deferred revenue (billed or collected) — current 2,431 2,664
Noncurrent:
Subscription and maintenance 987 1,001
Professional services 10 22
Financing obligations and other 3 13
Total deferred revenue (billed or collected) — noncurrent 1,000 1,036
Total deferred revenue (billed or collected) $ 3,431 $ 3,700
Deferred revenue (billed or collected) excludes unrealized revenue from contractual obligations that will be billed by theCompany in future periods.
(r) Stock Repurchases: During the third quarter of fiscal year 2009, the Company paid approximately $4 million torepurchase approximately 0.3 million of its common shares at an average price of $15.84. The repurchase is included in“Cash used in financing activities” in the Company’s Consolidated Statement of Cash Flows for fiscal year endedMarch 31, 2009. As of March 31, 2009, the Company remained authorized to purchase an aggregate amount of up toapproximately $246 million of additional common shares under the current stock repurchase program that wasapproved on October 29, 2008 by the Company’s Board of Directors. The approved stock repurchase program authorizesthe Company to acquire up to $250 million of its common stock.
During fiscal year 2008, the Company concluded its previously announced $500 million Accelerated Share Repurchaseprogram with a third-party financial institution. In June 2007, the Company paid $500 million to repurchase shares of its
74
%%TRANSMSG*** Transmitting Job: Y77913 PCN: 076000000 ***%%PCMSG|74 |00010|Yes|No|07/07/2009 22:17|0|0|Page is valid, no graphics -- Color: D|

common stock and received approximately 16.9 million shares at inception. Based on the terms of the agreementbetween the Company and the third-party financial institution, the Company received approximately 3.0 millionadditional shares of its common stock at the conclusion of the program in November 2007 at no additional cost. Theaverage price paid under the Accelerated Share Repurchase program was $25.13 per share and total shares repurchasedwas approximately 19.9 million. The $500 million payment under the Accelerated Share Repurchase program is includedin the cash flows used in financing activities section in the Company’s Consolidated Statement of Cash Flows for thefiscal year ended March 31, 2008 and is recorded as treasury stock in the Stockholders’ Equity section of theConsolidated Balance Sheet.
(s) Adoption of new accounting principles: Effective April 1, 2008, the Company adopted the provisions of SFAS No. 157,“Fair Value Measurements,” as modified by the Financial Accounting Standards Board (FASB) Staff Position (FSP) FinancialAccounting Standard (FAS) 157-1, “Application of FASB Statement No. 157 to FASB Statement No. 13 and Its RelatedInterpretive Accounting Pronouncements That Address Leasing Transactions,” and FSP FAS 157-2, “Effective Date of FASBStatement No. 157.” SFAS No. 157 defines fair value, establishes a framework for measuring fair value in GAAP andexpands disclosures about fair value measurements. FSP FAS 157-1 removes leasing from the scope of SFAS No. 157.FSP FAS 157-2 delays the effective date of SFAS No. 157 from the Company’s fiscal year ending March 31, 2009 to theCompany’s fiscal year ending March 31, 2010 for all non-financial assets and non-financial liabilities, except those thatare recognized or disclosed at fair value in the financial statements on a recurring basis (at least annually).
The provisions of SFAS No. 157 as amended by FSP FAS 157-1 were applied prospectively to fair value measurementsand disclosures for financial assets and financial liabilities recognized or disclosed at fair value in the financialstatements. The adoption of these Statements did not have an effect on the Company’s consolidated results ofoperations or financial position for the fiscal year 2009. While the Company does not expect the adoption of theseStatements to have a material effect on its consolidated results of operations or financial position in subsequentreporting periods, the Company will continue to monitor any additional implementation guidance that is issued thataddresses the fair value measurements for certain financial assets, and non-financial assets and non-financial liabilitiesnot disclosed at fair value in the financial statements on at least an annual basis as required by SFAS No. 157.
In accordance with SFAS No. 157 as amended by FSP FAS 157-1, the Company modified its disclosures relating to thefair value measurements and disclosures for financial assets. Refer to Note 4, “Derivatives and Fair ValueMeasurements,” for additional information regarding the assets and liabilities carried at fair value on the Company’sfinancial statements.
Effective April 1, 2008, the Company adopted the provisions of SFAS No. 159, “The Fair Value Option for Financial Assetsand Financial Liabilities — Including an amendment of FASB Statement No. 115.” SFAS No. 159 permits entities to elect tomeasure many financial instruments and certain other items at fair value. Unrealized gains and losses on items forwhich the fair value option has been elected will be recognized in earnings at each subsequent reporting date. Aspermitted by SFAS No. 159 implementation options, the Company chose not to elect the fair value option for itsfinancial assets and liabilities that had not been previously measured at fair value. Therefore, material financial assetsand liabilities, such as the Company’s short- and long-term debt obligations, are reported at their historical carryingamounts.
Effective April 1, 2008, the Company elected to adopt the provisions of SFAS No. 161, “Disclosures about DerivativeInstruments and Hedging Activities, an Amendment of FASB Statement No. 133.” SFAS No. 161 changes the disclosurerequirements for derivative instruments and hedging activities. Entities are required to provide enhanced disclosuresabout (a) how and why an entity uses derivative instruments, (b) how derivative instruments and related hedged itemsare accounted for under SFAS No. 133 and its related interpretations, and (c) how derivative instruments and relatedhedged items affect an entity’s financial position, financial performance, and cash flows. The adoption of SFAS No. 161did not have an effect on the Company’s consolidated results of operations or financial position for the fiscal year 2009.
Refer to Note 4, “Derivatives and Fair Value Measurements,” for additional information regarding the Company’sderivative activities.
In May 2008, the Financial Accounting Standards Board (FASB) issued Financial Staff Position (FSP) No. APB 14-1,“Accounting for Convertible Debt Instruments That May Be Settled in Cash upon Conversion (Including Partial Cash Settlement).”FSP No. APB 14-1 requires the issuer of convertible debt instruments with cash settlement features to account
75
%%TRANSMSG*** Transmitting Job: Y77913 PCN: 077000000 ***%%PCMSG|75 |00012|Yes|No|07/07/2009 22:17|0|0|Page is valid, no graphics -- Color: D|
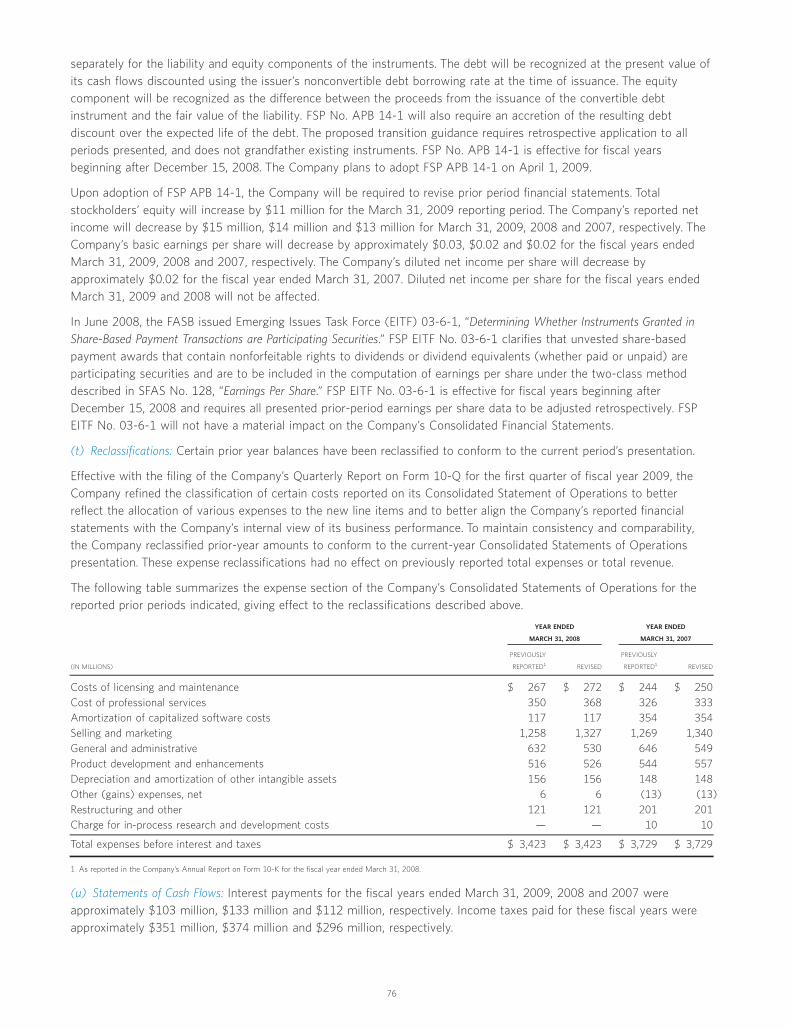
separately for the liability and equity components of the instruments. The debt will be recognized at the present value ofits cash flows discounted using the issuer’s nonconvertible debt borrowing rate at the time of issuance. The equitycomponent will be recognized as the difference between the proceeds from the issuance of the convertible debtinstrument and the fair value of the liability. FSP No. APB 14-1 will also require an accretion of the resulting debtdiscount over the expected life of the debt. The proposed transition guidance requires retrospective application to allperiods presented, and does not grandfather existing instruments. FSP No. APB 14-1 is effective for fiscal yearsbeginning after December 15, 2008. The Company plans to adopt FSP APB 14-1 on April 1, 2009.
Upon adoption of FSP APB 14-1, the Company will be required to revise prior period financial statements. Totalstockholders’ equity will increase by $11 million for the March 31, 2009 reporting period. The Company’s reported netincome will decrease by $15 million, $14 million and $13 million for March 31, 2009, 2008 and 2007, respectively. TheCompany’s basic earnings per share will decrease by approximately $0.03, $0.02 and $0.02 for the fiscal years endedMarch 31, 2009, 2008 and 2007, respectively. The Company’s diluted net income per share will decrease byapproximately $0.02 for the fiscal year ended March 31, 2007. Diluted net income per share for the fiscal years endedMarch 31, 2009 and 2008 will not be affected.
In June 2008, the FASB issued Emerging Issues Task Force (EITF) 03-6-1, “Determining Whether Instruments Granted inShare-Based Payment Transactions are Participating Securities.” FSP EITF No. 03-6-1 clarifies that unvested share-basedpayment awards that contain nonforfeitable rights to dividends or dividend equivalents (whether paid or unpaid) areparticipating securities and are to be included in the computation of earnings per share under the two-class methoddescribed in SFAS No. 128, “Earnings Per Share.” FSP EITF No. 03-6-1 is effective for fiscal years beginning afterDecember 15, 2008 and requires all presented prior-period earnings per share data to be adjusted retrospectively. FSPEITF No. 03-6-1 will not have a material impact on the Company’s Consolidated Financial Statements.
(t) Reclassifications: Certain prior year balances have been reclassified to conform to the current period’s presentation.
Effective with the filing of the Company’s Quarterly Report on Form 10-Q for the first quarter of fiscal year 2009, theCompany refined the classification of certain costs reported on its Consolidated Statement of Operations to betterreflect the allocation of various expenses to the new line items and to better align the Company’s reported financialstatements with the Company’s internal view of its business performance. To maintain consistency and comparability,the Company reclassified prior-year amounts to conform to the current-year Consolidated Statements of Operationspresentation. These expense reclassifications had no effect on previously reported total expenses or total revenue.
The following table summarizes the expense section of the Company’s Consolidated Statements of Operations for thereported prior periods indicated, giving effect to the reclassifications described above.
(IN MILLIONS)
PREVIOUSLY
REPORTED1 REVISED
PREVIOUSLY
REPORTED1 REVISED
YEAR ENDED
MARCH 31, 2008
YEAR ENDED
MARCH 31, 2007
Costs of licensing and maintenance $ 267 $ 272 $ 244 $ 250Cost of professional services 350 368 326 333Amortization of capitalized software costs 117 117 354 354Selling and marketing 1,258 1,327 1,269 1,340General and administrative 632 530 646 549Product development and enhancements 516 526 544 557Depreciation and amortization of other intangible assets 156 156 148 148Other (gains) expenses, net 6 6 (13) (13)Restructuring and other 121 121 201 201Charge for in-process research and development costs — — 10 10
Total expenses before interest and taxes $ 3,423 $ 3,423 $ 3,729 $ 3,729
1 As reported in the Company’s Annual Report on Form 10-K for the fiscal year ended March 31, 2008.
(u) Statements of Cash Flows: Interest payments for the fiscal years ended March 31, 2009, 2008 and 2007 wereapproximately $103 million, $133 million and $112 million, respectively. Income taxes paid for these fiscal years wereapproximately $351 million, $374 million and $296 million, respectively.
76
%%TRANSMSG*** Transmitting Job: Y77913 PCN: 078000000 ***%%PCMSG|76 |00012|Yes|No|07/24/2009 11:38|0|0|Page is valid, no graphics -- Color: D|

Note 2 — Acquisitions and DivestituresAcquisitionsAcquisitions are accounted for as purchases and, accordingly, their results of operations have been included in theCompany’s Consolidated Financial Statements since the dates of the acquisitions. The purchase price for the Company’sacquisitions is allocated to the assets acquired and liabilities assumed from the acquired entity. These allocations arebased upon estimates which may be revised within one year of the date of acquisition as additional informationbecomes available. The Company’s acquisitions during fiscal years 2009 and 2008 were considered immaterial, bothindividually and in the aggregate, compared with the results of the Company’s operations and therefore purchaseaccounting information and proforma disclosure are not presented.
During fiscal year 2007, the Company acquired the following companies:
• Cybermation, Inc., a privately held provider of enterprise workload automation solutions.
• MDY Group International, Inc., a privately held provider of enterprise records management software and services.
• XOsoft, Inc., a privately held provider of complete recovery management solutions.
• Cendura Corporation, a privately held provider of IT service management service delivery solutions.
The total cost of these acquisitions was approximately $173 million, net of approximately $20 million of cash and cashequivalents acquired and excluding a holdback of approximately $9 million. The Company paid the entire holdbackpayment amount during fiscal year 2008.
The Company recorded a charge of approximately $10 million for in-process research and development costs associatedwith the acquisition of XOsoft during the second quarter of fiscal year 2007. Total goodwill recognized in thesetransactions amounted to approximately $117 million, which included a downward adjustment recorded in fiscal year2008 of approximately $4 million. The downward adjustment was due to the recognition of deferred tax assetsassociated with acquired net operating losses. The allocation of a significant portion of the purchase price to goodwillwas predominantly due to the relatively short lives of the developed technology assets, whereas a substantial amount ofthe purchase price was based on anticipated earnings beyond the estimated lives of the intangible assets. Theacquisitions completed in fiscal year 2007 were considered immaterial, both individually and in the aggregate, andtherefore pro-forma information for fiscal year 2007 is not presented.
The Company had approximately $20 million and $13 million of accrued acquisition-related costs as of March 31, 2009and 2008, respectively. Approximately $10 million of the March 31, 2009 accrued acquisition-related costs related toholdback amounts for current year acquisitions. Acquisition-related costs are comprised of employee costs, duplicatefacilities and other acquisition-related costs that are incurred as a result of the Company’s current and prior periodacquisitions.
The liabilities for duplicate facilities and other costs relate to operating leases, which are actively being renegotiated andexpire at various times through 2013, negotiated buyouts of certain operating lease commitments, and other contractualliabilities. The liabilities for employee costs primarily relate to involuntary termination benefits. The Company recordedadjustments of approximately $12 million in fiscal year 2008. The adjustments primarily consisted of reductions toobligations from prior period acquisitions that were settled for amounts less than originally estimated. This amount wasrecorded as a reduction in general and administrative expenses. The remaining liability balances are included in the“Accrued expenses and other current liabilities” line item on the Consolidated Balance Sheets.
Discontinued OperationsIn fiscal year 2007, the Company sold its 70% interest in Benit for approximately $3 million. The 70% interest soldrepresented all of the Company’s outstanding equity interest in Benit. As a result of the sale, the Company realized aloss of approximately $2 million, net of taxes, in the third quarter of fiscal year 2007. Included in the loss was therecognition of the cumulative foreign currency translation amount related to Benit of approximately $10 million whichwas previously included in “Accumulated other comprehensive loss.” The cash flows for Benit were deemed immaterialfor separate presentation as a discontinued operation in the Consolidated Statements of Cash Flows. Benit offered awide range of corporate solution services, such as IT outsourcing, business integration services, enterprise solutions andIT service management in Korea. The sale was part of the Company’s fiscal year 2007 cost reduction and restructuring
77
%%TRANSMSG*** Transmitting Job: Y77913 PCN: 079000000 ***%%PCMSG|77 |00014|Yes|No|07/07/2009 22:17|0|0|Page is valid, no graphics -- Color: D|

plan (the fiscal 2007 restructuring plan). Refer to Note 3, “Restructuring and Other” in these Notes to the ConsolidatedFinancial Statements for additional information.
Pursuant to SFAS No. 144, “Accounting for the Impairment or Disposal of Long-Lived Assets,” the Company has separatelypresented the results of Benit as a discontinued operation, including the loss on the sale, on the Consolidated Statementof Operations.
The operating results of Benit are summarized as follows:
(IN MILLIONS)YEAR ENDED
MARCH 31, 2007
Subscription and maintenance revenue $ 11
Software fees and other 3
Professional services 7
Total revenue $ 21
Loss from sale of discontinued operation, net of taxes $ (2)
Loss from discontinued operation, net of taxes $ (1)
Note 3 — Restructuring and OtherRestructuringFiscal 2007 restructuring plan: In August 2006, the Company announced the fiscal 2007 restructuring plan to significantlyimprove the Company’s expense structure and increase its competitiveness. The fiscal 2007 restructuring plan’sobjectives included a workforce reduction, global facilities consolidations and other cost reduction initiatives. The totalcost of the fiscal 2007 restructuring plan was initially expected to be approximately $200 million.
In April 2008, the objectives of the plan were expanded to include additional workforce reductions, global facilitiesconsolidations and other cost reduction initiatives with expected additional cost of $75 million to $100 million, bringingthe total pre-tax restructuring charges for the fiscal 2007 restructuring plan to $275 million to $300 million.
On March 31, 2009, the Company approved additional cost reduction and restructuring actions relating to the fiscal2007 restructuring plan. The objectives were expanded to now include (1) an additional workforce reduction ofapproximately 300 to bring the total to approximately 3,100 positions since the inception of the fiscal 2007restructuring plan, (2) additional global facilities consolidations and (3) additional other cost reduction initiatives. TheCompany expects total additional charges of approximately $45 million, bringing the total expected pre-tax restructuringcharges for the fiscal 2007 restructuring plan to approximately $345 million.
Severance: The Company currently estimates a reduction in workforce of approximately 3,100 individuals under the fiscal2007 restructuring plan. The termination benefits the Company has offered in connection with this workforce reductionare substantially the same as the benefits the Company has provided historically for non-performance-based workforcereductions, and in certain countries have been provided based upon prior experiences with the restructuring planannounced in July 2005 (the fiscal 2006 plan) as described below. These costs have been recognized in accordance withSFAS No. 112, “Employer’s Accounting for Post Employment Benefits, an Amendment of FASB Statements No. 5 and 43”(SFAS No. 112). Enhancements to termination benefits which exceed past practice will be recognized as incurred inaccordance with SFAS No. 146 “Accounting for Costs Associated With Exit or Disposal Activities” (SFAS No. 146). TheCompany incurred approximately $28 million and $71 million of severance costs for the fiscal years ended March 31,2009 and March 31, 2008, respectively. These charges relate to a total of approximately 600 individuals in fiscal year2009 and approximately 1,000 individuals in fiscal year 2008. Final payment of these amounts is dependent uponsettlement with the works councils in certain international locations. The plans associated with the balance of thereductions in workforce are still being finalized and the associated charges will be recorded once the actions areapproved by management.
Facilities Abandonment: The Company recorded the costs associated with lease termination or abandonment when theCompany ceased to utilize the leased property. Under SFAS No. 146, the liability associated with lease termination orabandonment is measured as the present value of the total remaining lease costs and associated operating costs, lessprobable sublease income. The Company accretes its obligations related to facilities abandonment to the then-presentvalue and, accordingly, recognizes accretion expense in future periods. The Company incurred approximately $68 million
78
%%TRANSMSG*** Transmitting Job: Y77913 PCN: 080000000 ***%%PCMSG|78 |00014|Yes|No|07/07/2009 22:17|0|0|Page is valid, no graphics -- Color: D|

and $26 million of charges related to abandoned properties during the fiscal years ended March 31, 2009 andMarch 31, 2008, respectively.
Accrued restructuring costs and changes in the accruals for fiscal years 2008 and 2007 associated with the fiscal 2007restructuring plan were as follows:
(IN MILLIONS) SEVERANCEFACILITIES
ABANDONMENT
Accrued balance as of March 31, 2007 $ 87 $ 17
Additions 71 26
Payments (65) (16)
Accrued balance as of March 31, 2008 93 27
Additions 28 68
Payments (76) (24)
Accrued balance as of March 31, 2009 $ 45 $ 71
The liability balance for the severance portion of the remaining reserve is included in the “Salaries, wages andcommissions” line on the Consolidated Balance Sheets. The liability for the facilities portion of the remaining reserve isincluded in the “Accrued expenses and other current liabilities” and “Other noncurrent liabilities” line items on theConsolidated Balance Sheets. The costs are included in the “Restructuring and other” line item on the ConsolidatedStatements of Operations for the fiscal years ended March 31, 2009 and March 31, 2008.
Fiscal 2006 Restructuring Plan: In July 2005, the Company announced the fiscal 2006 restructuring plan to increaseefficiency and productivity and to more closely align its investments with strategic growth opportunities. The Companyhas recognized substantially all of the costs associated with the fiscal 2006 restructuring plan. The liability balance forthe severance portion of the remaining reserve is included in the “Salaries, wages and commissions” line on theConsolidated Balance Sheets. The balance of accrued severance related to the fiscal 2006 plan as of March 31, 2009and March 31, 2008 is less than $1 million and approximately $1 million, respectively. The liability for the facilitiesportion of the remaining reserve is included in the “Accrued expenses and other current liabilities” line item on theConsolidated Balance Sheets. The balance of accrued facilities related to the fiscal 2006 plan as of March 31, 2009 andMarch 31, 2008 is approximately $8 million and $10 million, respectively.
OtherDuring the fiscal year ended March 31, 2008, the Company incurred approximately $12 million in legal fees inconnection with matters under review by the Special Litigation Committee, composed of independent members of theBoard of Directors (refer to Note 8, “Commitments and Contingencies” in these Notes to the Consolidated FinancialStatements for additional information). Additionally, during fiscal year 2009 and fiscal year 2008, the Company recordedimpairment charges of approximately $5 million and $6 million, respectively, for software that was capitalized forinternal use but was determined to be impaired. During fiscal year 2008, the Company incurred an approximate$4 million expense related to a loss on the sale of an investment in marketable securities associated with the closure ofan international location.
Note 4 — Derivatives and Fair Value MeasurementThe Company is exposed to certain financial market risks relating to its business operations, including changes ininterest rates, which could include monetary assets and liabilities, and foreign exchange rate risk associated with theCompany’s operating exposures, which could include its exposure to foreign currency denominated monetary assets andliabilities and forecasted transactions. The Company enters into derivative contracts with the intent of mitigating acertain portion of these risks.
Derivatives are accounted for in accordance with SFAS No. 133, “Accounting for Derivative Instruments and HedgingActivities” (SFAS No. 133). During fiscal years 2009 and 2008, the Company did not designate its foreign exchangederivatives as hedges under SFAS No. 133. Accordingly, all foreign exchange derivatives are recognized on theConsolidated Balance Sheets at fair value and unrealized or realized changes in fair value from these contracts arerecorded as “Other (gains) expenses, net” in the Company’s Consolidated Statements of Operations.
79
%%TRANSMSG*** Transmitting Job: Y77913 PCN: 081000000 ***%%PCMSG|79 |00012|Yes|No|07/07/2009 22:17|0|0|Page is valid, no graphics -- Color: D|

During fiscal year 2009, the Company entered into interest rate swaps with a total notional value of $250 million tohedge a portion of its variable interest rate payments. These derivatives are designated as cash flow hedges underSFAS No. 133. The effective portion of these cash flow hedges are recorded as “Accumulated other comprehensive loss”in the Company’s Consolidated Balance Sheet and reclassified into “Interest expense, net,” in the Company’sConsolidated Statements of Operations in the same period during which the hedged transaction affects earnings. Anyineffective portion of the cash flow hedges would be recorded immediately to “Interest expense, net;” however, noineffectiveness existed in the fiscal year ended March 31, 2009.
As described in Note 1, the Company adopted the provisions of SFAS No. 157 as amended by FSP FAS 157-1 and FSPFAS 157-2 on April 1, 2008. Pursuant to the provisions of FSP FAS 157-2, the Company will not apply the provisions ofSFAS No. 157 to any nonfinancial assets and nonfinancial liabilities until April 1, 2009. The Company recorded nochange to its opening balance of retained earnings as of April 1, 2008 as it did not have any financial instrumentsrequiring retrospective application under the provisions of SFAS No. 157.
Fair Value HierarchySFAS No. 157 specifies a hierarchy of valuation techniques based upon whether the inputs to those valuation techniquesreflect assumptions other market participants would use based upon market data obtained from independent sources(observable inputs) or reflect the company’s own assumptions of market participant valuation (unobservable inputs). Inaccordance with SFAS No. 157, these two types of inputs have created the following fair value hierarchy:
• Level 1 — Quoted prices in active markets that are unadjusted and accessible at the measurement date for identical,unrestricted assets or liabilities;
• Level 2 — Quoted prices for identical assets and liabilities in markets that are not active, quoted prices for similarassets and liabilities in active markets or financial instruments for which significant inputs are observable, eitherdirectly or indirectly;
• Level 3 — Prices or valuations that require inputs that are both significant to the fair value measurement andunobservable.
SFAS No. 157 requires the use of observable market data if such data is available without undue cost and effort.
Items Measured at Fair Value on a Recurring BasisThe following table presents the Company’s assets and liabilities that are measured at fair value on a recurring basis atMarch 31, 2009 consistent with the fair value hierarchy provisions of SFAS No. 157.
Fair Value Measurement at Reporting Date Using
(IN MILLIONS)
ESTIMATEDFAIR VALUE
AS OFMARCH 31, 2009
QUOTED PRICES INACTIVE MARKETS FOR
IDENTICAL ASSETS(LEVEL 1)
SIGNIFICANT OTHEROBSERVABLE INPUTS
(LEVEL 2)
Assets:
Money market funds $ 1,617 $ 1,617 $ —
Government securities 405 405 —
Total Assets $ 2,022 $ 2,022 $ —
Liabilities:
Interest Rate Derivatives1 7 — 7
Total Liabilities $ 7 $ — $ 7
1 Interest rate derivatives are designated as cash flow hedges under SFAS No. 133
As of March 31, 2009, the Company had approximately $1,567 million and $50 million of investments in money marketfunds classified as “Cash, cash equivalents and marketable securities” and “Other noncurrent assets, net” for restrictedcash amounts, respectively, in its Consolidated Balance Sheet. The Company also had approximately $405 million ingovernment securities, comprised of treasury bills, classified as “Cash, cash equivalents and marketable securities” in itsConsolidated Balance Sheet at March 31, 2009.
80
%%TRANSMSG*** Transmitting Job: Y77913 PCN: 082000000 ***%%PCMSG|80 |00012|Yes|No|07/07/2009 22:17|0|0|Page is valid, no graphics -- Color: D|

As of March 31, 2009, the Company had no foreign exchange derivative contracts outstanding. At March 31, 2009,approximately $7 million of the Company’s interest rate derivatives are included in “Other current liabilities” on theConsolidated Balance Sheet.
As of March 31, 2009, the Company did not have any assets or liabilities measured at fair value on a recurring basisusing significant unobservable inputs (Level 3). The Company did not have any outstanding asset or liability derivativesas of March 31, 2008.
For the Company’s interest rate derivatives, the amount of loss recorded in accumulated other comprehensive loss fromthe “Effective Portion” was approximately $7 million for the fiscal year ended March 31, 2009. The amount of lossreclassified from accumulated other comprehensive income into “Interest expense, net” was approximately $2 million forthe fiscal year ended March 31, 2009. In the next twelve months, approximately $5 million is expected to be releasedfrom “Accumulated other comprehensive loss” to income. The Company did not enter into interest rate derivativearrangements for the fiscal year ended March 31, 2008.
A summary of the effect of the interest rate and foreign exchange derivatives on the Company’s Consolidated Statementof Operations is as follows:
Location of Net Gain Recognized in Income on Derivatives
(IN MILLIONS)
YEAR ENDEDMARCH 31,
2009
YEAR ENDEDMARCH 31,
2008
AMOUNT OF NET(GAIN)/LOSS RECOGNIZED
IN INCOME ON DERIVATIVES
Interest expenses, net1 $ 2 $ —
Other (gains) expenses, net2 $ (77) $ 14
1 Interest rate derivatives are designated as cash flow hedges under SFAS No. 133
2 Foreign exchange derivatives are not designated as hedges under SFAS No. 133
Note 5 — Segment and Geographic InformationThe Company’s chief operating decision makers review financial information presented on a consolidated basis,accompanied by disaggregated information about revenue, by geographic region, for purposes of assessing financialperformance and making operating decisions. Accordingly, the Company considers itself to be operating in a singleindustry segment. The Company does not manage its business by solution or focus area and therefore does notmaintain financial statements on such a basis.
81
%%TRANSMSG*** Transmitting Job: Y77913 PCN: 083000000 ***%%PCMSG|81 |00013|Yes|No|07/07/2009 23:25|0|0|Page is valid, no graphics -- Color: D|

In addition to its United States operations, the Company operates through branches and wholly-owned subsidiaries in 46foreign countries located in North America (4), Africa (1), South America (7), Asia/Pacific (14) and Europe (20).Revenue is allocated to a geographic area based on the location of the sale. The following table presents informationabout the Company by geographic area for the fiscal years ended March 31, 2009, 2008 and 2007:
(IN MILLIONS)UNITEDSTATES EUROPE OTHER ELIMINATIONS TOTAL
Year Ended March 31, 2009
Revenue
To unaffiliated customers $ 2,291 $ 1,265 $ 715 $ — $ 4,271
Between geographic areas1 522 — — (522) —
Total revenue 2,813 1,265 715 (522) 4,271
Property and equipment, net 254 129 59 — 442
Identifiable assets 8,835 1,726 691 — 11,252
Total liabilities 5,327 1,038 543 — 6,908
Year Ended March 31, 2008
Revenue
To unaffiliated customers $ 2,217 $ 1,299 $ 761 $ — $ 4,277
Between geographic areas1 562 — — (562) —
Total revenue 2,779 1,299 761 (562) 4,277
Property and equipment, net 239 179 78 — 496
Identifiable assets2 8,976 2,008 772 — 11,756
Total liabilities 6,045 1,281 721 — 8,047
Year Ended March 31, 2007
Revenue:
To unaffiliated customers $ 2,131 $ 1,131 $ 681 $ — $ 3,943
Between geographic areas1 510 — — (510) —
Total revenue 2,641 1,131 681 (510) 3,943
Property and equipment, net 242 177 50 — 469
Identifiable assets2 8,807 1,928 782 — 11,517
Total liabilities2 6,182 1,057 624 — 7,863
1 Represents royalties from foreign subsidiaries determined as a percentage of certain amounts invoiced to customers.
2 Certain balances have been reclassified to conform to the current-year presentation.
No single customer accounted for 10% or more of total revenue for the fiscal years ended March 31, 2009, 2008 or2007.
Note 6 — Trade and Installment Accounts ReceivableThe Company uses installment license agreements as a standard business practice and has a history of successfullycollecting substantially all amounts due under the original payment terms without making concessions on payments,software products, maintenance, or professional services. Net trade and installment accounts receivable representfinancial assets derived from the committed amounts due from the Company’s customers. These accounts receivablebalances are reflected net of unamortized discounts based on imputed interest for the time value of money for licenseagreements under the Company’s prior business model and allowances for doubtful accounts. These balances do not
82
%%TRANSMSG*** Transmitting Job: Y77913 PCN: 084000000 ***%%PCMSG|82 |00012|Yes|No|07/07/2009 23:25|0|0|Page is valid, no graphics -- Color: D|

include unbilled contractual commitments executed under the Company’s current business model. Trade and installmentaccounts receivable are composed of the following components:
(IN MILLIONS)MARCH 31,
2009MARCH 31,
2008
Current:
Accounts receivable — billed $ 658 $ 817
Accounts receivable — unbilled 71 50
Other receivables 34 57
Unbilled amounts due within the next 12 months — prior business model 108 103
Less: Allowance for doubtful accounts (25) (30)
Less: Unamortized discounts (7) (27)
Net trade and installment accounts receivable — current $ 839 $ 970
Noncurrent:
Unbilled amounts due beyond the next 12 months — prior business model $ 132 $ 239
Less: Allowance for doubtful accounts — (1)
Less: Unamortized discounts (4) (4)
Net installment accounts receivable — noncurrent $ 128 $ 234
During fiscal year 2008, the Company transferred its rights and interest in future committed installments under ratablesoftware license agreements to third-party financial institutions with an aggregate contract value of approximately$17 million, for which the Company received cash of approximately $14 million. As of March 31, 2009 and 2008, theaggregate remaining amounts due to the third party financing institutions were approximately $10 million and$56 million, respectively. These amounts are classified as “Deferred revenue (billed or collected)” on the ConsolidatedBalance Sheets. The financing agreements may contain limited recourse provisions with respect to the Company’scontinued performance under the license agreements. Based on the Company’s historical experience, the Companybelieves that any liability which may be incurred as a result of these limited recourse provisions is remote.
Note 7 — DebtCredit FacilitiesAs of March 31, 2009 and 2008, the Company’s committed bank credit facilities consisted of a $1 billion, unsecuredbank revolving credit facility.
(IN MILLIONS)MAXIMUMAVAILABLE
OUTSTANDINGBALANCE
MAXIMUMAVAILABLE
OUTSTANDINGBALANCE
2009 2008
AS OF MARCH 31,
2008 Revolving Credit Facility (expires August 2012) $ 1,000 $ 750 $ 1,000 $ 750
2008 Revolving Credit FacilityIn August 2007, the Company entered into an unsecured revolving credit facility (the 2008 Revolving Credit Facility).The maximum committed amount available under the 2008 Revolving Credit Facility is $1 billion, exclusive ofincremental credit increases of up to an additional $500 million, which are available subject to certain conditions andthe agreement of its lenders. The 2008 Revolving Credit Facility replaced the prior $1 billion 2004 Revolving CreditFacility (the 2004 Revolving Credit Facility), which was due to expire on December 2, 2008. The 2004 Revolving CreditFacility was terminated effective August 29, 2007, at which time outstanding borrowings of $750 million were repaidand simultaneously re-borrowed under the 2008 Revolving Credit Facility. The 2008 Revolving Credit Facility expires onAugust 29, 2012. As of March 31, 2009 and 2008, $750 million was drawn down under the 2008 Revolving CreditFacility. Total interest expense relating to borrowings under the 2008 Revolving Credit Facility for fiscal years 2009, 2008and 2007 was approximately $24 million, $44 million and $25 million, respectively.
Borrowings under the 2008 Revolving Credit Facility bear interest at a rate dependent on the Company’s credit ratings atthe time of such borrowings and are calculated according to a base rate or a Eurocurrency rate, as the case may be,plus an applicable margin and utilization fee. The applicable margin for a base rate borrowing is 0.0% and, depending onthe Company’s credit rating, the applicable margin for a Eurocurrency borrowing ranges from 0.27% to 0.875%. Also,
83
%%TRANSMSG*** Transmitting Job: Y77913 PCN: 085000000 ***%%PCMSG|83 |00011|Yes|No|07/07/2009 22:17|0|0|Page is valid, no graphics -- Color: D|

depending on the Company’s credit rating at the time of the borrowing, the utilization fee can range from 0.10% to0.25% for borrowings over 50% of the total commitment. At the Company’s credit ratings as of March 31, 2009, theapplicable margin was 0% for a base rate borrowing and 0.425% for a Eurocurrency borrowing, and the utilization feewas 0.1%. As of March 31, 2009, the weighted average interest rate on the Company’s outstanding borrowings was1.95%. In addition, the Company must pay facility commitment fees quarterly at rates dependent on its credit ratings.The facility commitment fees can range from 0.08% to 0.375% of the final allocated amount of each Lender’s fullrevolving credit commitment (without taking into account any outstanding borrowings under such commitments). Basedon the Company’s credit ratings as of March 31, 2009, the facility commitment fee was 0.125% of the $1 billioncommitted amount.
The 2008 Revolving Credit Facility contains customary covenants for transactions of this type, including two financialcovenants: (i) for the 12 months ending each quarter-end, the ratio of consolidated debt for borrowed money toconsolidated cash flow, each as defined in the 2008 Revolving Credit Facility, must not exceed 4.00 to 1.00; and (ii) forthe 12 months ending each quarter-end, the ratio of consolidated cash flow to the sum of interest payable on, andamortization of debt discount in respect of, all consolidated debt for borrowed money, as defined in the 2008 RevolvingCredit Facility, must not be less than 5.00 to 1.00. In addition, as a condition precedent to each borrowing made underthe 2008 Revolving Credit Facility, as of the date of such borrowing, (i) no event of default shall have occurred and becontinuing and (ii) the Company is to reaffirm that the representations and warranties made by the Company in the2008 Revolving Credit Facility (other than the representation with respect to material adverse changes, but including therepresentation regarding the absence of certain material litigation) are correct. As of March 31, 2009, the Company is incompliance with these debt covenants.
Senior Note ObligationsAs of March 31, 2009 and 2008, the Company had the following unsecured, fixed-rate interest, senior note obligationsoutstanding:
(IN MILLIONS) 2009 2008
YEAR ENDED MARCH 31,
6.500% Senior Notes due April 2008 $ — $ 350
1.625% Convertible Senior Notes due December 2009 460 460
4.750% Senior Notes due December 2009 176 500
6.125% Senior Notes due December 2014 500 500
6.500% Senior NotesIn the fiscal year ended March 31, 1999, the Company issued $1.75 billion of unsecured 6.500% Senior Notes in atransaction pursuant to Rule 144A under the Securities Act of 1933 (Rule 144A). In the first quarter of fiscal year 2009,the Company paid the $350 million of the 6.500% Senior Notes that was due and payable at that time. Subsequent tothis scheduled payment, there were no further amounts due under this issuance.
1.625% Convertible Senior NotesIn fiscal year 2003, the Company issued $460 million of unsecured 1.625% Convertible Senior Notes (1.625% Notes)due December 2009, in a transaction pursuant to Rule 144A. The 1.625% Notes are senior unsecured indebtedness andrank equally with all existing senior unsecured indebtedness. Concurrent with the issuance of the 1.625% Notes, theCompany entered into call spread repurchase option transactions (1.625% Notes Call Spread) to partially mitigatepotential dilution from conversion of the 1.625% Notes. The option purchase price of the 1.625% Notes Call Spread wasapproximately $73 million and the entire purchase price was charged to stockholders’ equity in December 2002. Underthe terms of the 1.625% Notes Call Spread, the Company can elect to receive (i) outstanding shares equivalent to thenumber of shares that will be issued if all of the 1.625% Notes are converted into shares (23 million shares) uponpayment of an exercise price of $20.04 per share (aggregate price of $460 million); or (ii) a net cash settlement, netshare settlement or a combination, whereby the Company will receive cash or shares equal to the increase in the marketvalue of the 23 million shares from the aggregate value at the $20.04 exercise price (aggregate price of $460 million),subject to the upper limit of $30.00 discussed below. The 1.625% Notes Call Spread is designed to partially mitigate thepotential dilution from conversion of the 1.625% Notes, depending upon the market price of the Company’s commonstock at such time. The 1.625% Notes Call Spread can be exercised in December 2009 at an exercise price of $20.04
84
%%TRANSMSG*** Transmitting Job: Y77913 PCN: 086000000 ***%%PCMSG|84 |00011|Yes|No|07/07/2009 22:17|0|0|Page is valid, no graphics -- Color: D|

per share. To limit the cost of the 1.625% Notes Call Spread, an upper limit of $30.00 per share has been set, such thatif the price of the common stock is above that limit at the time of exercise, the number of shares eligible to bepurchased will be proportionately reduced based on the amount by which the common share price exceeds $30.00 atthe time of exercise. As of March 31, 2009, the estimated fair value of the 1.625% Notes Call Spread wasapproximately $34 million, which was based upon valuations from independent third-party financial institutions.
Fiscal Year 2005 Senior NotesIn November 2004, the Company issued an aggregate of $1 billion of unsecured Senior Notes (2005 Senior Notes) in atransaction pursuant to Rule 144A. The Company issued $500 million of 4.75%, 5-year notes due December 2009 and$500 million of 5.625%, 10-year notes due December 2014. In December 2007, the 5.625% Senior Notes dueDecember 2014 were renamed the 6.125% Senior Notes due December 2014 (see below for additional information).
4.750% Senior Notes due December 2009: During the fourth quarter of fiscal 2009, the Company completed a tenderoffer to repay a portion of the Company’s 4.750% Senior Notes due December 2009, under which the Company repaidapproximately $176 million of the aggregate principal amount of the notes, exclusive of accrued interest. During thethird quarter of fiscal year 2009, the Company repaid approximately $148 million principal amount of the Company’s4.750% Senior Notes due December 2009 on the open market at a price of $143 million, exclusive of accrued interest.As a result of this repayment, the Company recognized a gain of $5 million in the “Other (gains) expenses, net” line ofthe Consolidated Statements of Operations in the third quarter. At March 31, 2009, $176 million of the 4.750% SeniorNotes remains outstanding.
6.125% Senior Notes due December 2014: On December 21, 2007, the Company, The Bank of New York, and the holdersof a majority of the Notes reached a settlement of a lawsuit captioned The Bank of New York v. CA, Inc. et al., filed in theSupreme Court of the State of New York, New York County and executed a First Supplemental Indenture. The FirstSupplemental Indenture provides, among other things, that the Company will pay an additional 0.50% per annuminterest on the $500 million principal amount of the Notes, with such additional interest beginning to accrue as ofDecember 1, 2007. Pursuant to the Supplemental Indenture, the Notes are now referred to as the Company’s6.125% Senior Notes due 2014. As a result of the settlement in the third quarter of fiscal year 2008, the Companyrecorded a charge of approximately $14 million, representing the present value of the additional amounts that will bepaid. This charge is included in “Other (gains) expenses, net” line item in the Consolidated Statements of Operations. Inconnection with the settlement, the Company also entered into an Addendum to Registration Rights Agreement, whichconfirms that the Company no longer has any obligations under the original Registration Rights Agreement entered intowith respect to the Notes. The settlement became effective upon the signature of the Stipulation of Dismissal withPrejudice by a Justice of the New York Supreme Court on January 3, 2008.
The Company has the option to redeem the 2005 Senior Notes at any time, at redemption prices equal to the greater of(i) 100% of the aggregate principal amount of the notes of such series being redeemed and (ii) the present value of theprincipal and interest payable over the life of the 2005 Senior Notes, discounted at a rate equal to 15 basis points and20 basis points for the 5-year notes and 10-year notes, respectively, over a comparable U.S. Treasury bond yield. Thematurity of the 2005 Senior Notes may be accelerated by the holders upon certain events of default, including failure tomake payments when due and failure to comply with covenants in the 2005 Senior Notes. The 5-year notes were issuedat a price equal to 99.861% of the principal amount and the 10-year notes at a price equal to 99.505% of the principalamount for resale under Rule 144A and Regulation S.
Other Indebtedness
(IN MILLIONS)MAXIMUMAVAILABLE
OUTSTANDINGBALANCE
MAXIMUMAVAILABLE
OUTSTANDINGBALANCE
2009 2008
YEAR ENDED MARCH 31,
International line of credit $ 25 $ — $ 25 $ —
Capital lease obligations and other — 51 — 22
International Line of CreditAn unsecured and uncommitted multi-currency line of credit is available to meet short-term working capital needs forthe Company’s subsidiaries operating outside the United States. The line of credit is available on an offering basis,
85
%%TRANSMSG*** Transmitting Job: Y77913 PCN: 087000000 ***%%PCMSG|85 |00012|Yes|No|07/07/2009 22:17|0|0|Page is valid, no graphics -- Color: D|
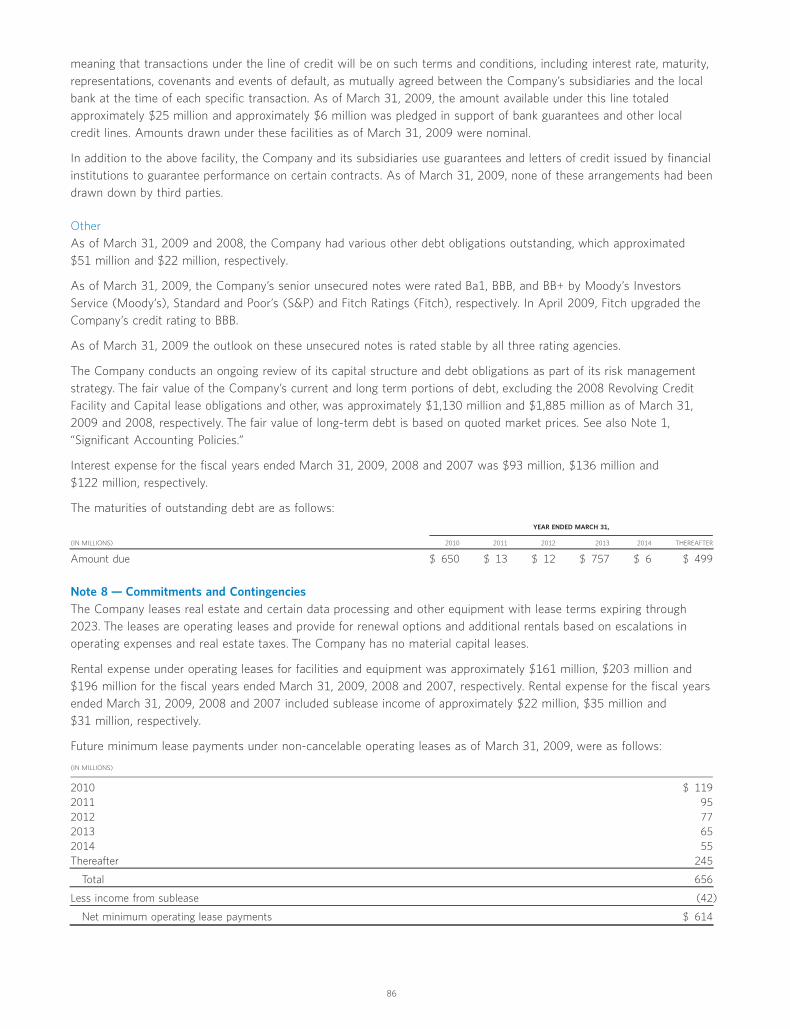
meaning that transactions under the line of credit will be on such terms and conditions, including interest rate, maturity,representations, covenants and events of default, as mutually agreed between the Company’s subsidiaries and the localbank at the time of each specific transaction. As of March 31, 2009, the amount available under this line totaledapproximately $25 million and approximately $6 million was pledged in support of bank guarantees and other localcredit lines. Amounts drawn under these facilities as of March 31, 2009 were nominal.
In addition to the above facility, the Company and its subsidiaries use guarantees and letters of credit issued by financialinstitutions to guarantee performance on certain contracts. As of March 31, 2009, none of these arrangements had beendrawn down by third parties.
OtherAs of March 31, 2009 and 2008, the Company had various other debt obligations outstanding, which approximated$51 million and $22 million, respectively.
As of March 31, 2009, the Company’s senior unsecured notes were rated Ba1, BBB, and BB+ by Moody’s InvestorsService (Moody’s), Standard and Poor’s (S&P) and Fitch Ratings (Fitch), respectively. In April 2009, Fitch upgraded theCompany’s credit rating to BBB.
As of March 31, 2009 the outlook on these unsecured notes is rated stable by all three rating agencies.
The Company conducts an ongoing review of its capital structure and debt obligations as part of its risk managementstrategy. The fair value of the Company’s current and long term portions of debt, excluding the 2008 Revolving CreditFacility and Capital lease obligations and other, was approximately $1,130 million and $1,885 million as of March 31,2009 and 2008, respectively. The fair value of long-term debt is based on quoted market prices. See also Note 1,“Significant Accounting Policies.”
Interest expense for the fiscal years ended March 31, 2009, 2008 and 2007 was $93 million, $136 million and$122 million, respectively.
The maturities of outstanding debt are as follows:
(IN MILLIONS) 2010 2011 2012 2013 2014 THEREAFTER
YEAR ENDED MARCH 31,
Amount due $ 650 $ 13 $ 12 $ 757 $ 6 $ 499
Note 8 — Commitments and ContingenciesThe Company leases real estate and certain data processing and other equipment with lease terms expiring through2023. The leases are operating leases and provide for renewal options and additional rentals based on escalations inoperating expenses and real estate taxes. The Company has no material capital leases.
Rental expense under operating leases for facilities and equipment was approximately $161 million, $203 million and$196 million for the fiscal years ended March 31, 2009, 2008 and 2007, respectively. Rental expense for the fiscal yearsended March 31, 2009, 2008 and 2007 included sublease income of approximately $22 million, $35 million and$31 million, respectively.
Future minimum lease payments under non-cancelable operating leases as of March 31, 2009, were as follows:
(IN MILLIONS)
2010 $ 1192011 952012 772013 652014 55Thereafter 245
Total 656
Less income from sublease (42)
Net minimum operating lease payments $ 614
86
%%TRANSMSG*** Transmitting Job: Y77913 PCN: 088000000 ***%%PCMSG|86 |00011|Yes|No|07/07/2009 22:17|0|0|Page is valid, no graphics -- Color: D|

Prior to fiscal year 2001, the Company sold individual accounts receivable under the prior business model to a thirdparty subject to certain recourse provisions. The outstanding principal balance of these receivables subject to recourseapproximated $38 million and $81 million as of March 31, 2009 and 2008, respectively.
Stockholder Class Action and Derivative Lawsuits Filed Prior to 2004 - BackgroundThe Company, its former Chairman and CEO Charles B. Wang, its former Chairman and CEO Sanjay Kumar, its formerChief Financial Officer Ira Zar, and its Vice Chairman and Founder Russell M. Artzt were defendants in one or morestockholder class action lawsuits filed in July 1998, February 2002, and March 2002 in the United States District Courtfor the Eastern District of New York (the Federal Court), alleging, among other things, that a class consisting of allpersons who purchased the Company’s Common Stock during the period from January 20, 1998 until July 22, 1998were harmed by misleading statements, misrepresentations, and omissions regarding the Company’s future financialperformance.
In addition, in May 2003, a class action lawsuit captioned John A. Ambler v. Computer Associates International, Inc., et al.was filed in the Federal Court. The complaint in this matter, a purported class action on behalf of the CA SavingsHarvest Plan (the CASH Plan) and the participants in, and beneficiaries of, the CASH Plan for a class period fromMarch 30, 1998 through May 30, 2003, asserted claims of breach of fiduciary duty under the federal EmployeeRetirement Income Security Act (ERISA). The named defendants were the Company, the Company’s Board of Directors,the CASH Plan, the Administrative Committee of the CASH Plan, and the following current or former employees and/orformer directors of the Company: Messrs. Wang, Kumar, Zar, Artzt, Peter A. Schwartz (the Company’s former ChiefFinancial Officer), and Charles P. McWade (the Company’s former head of Financial Reporting and businessdevelopment); and various unidentified alleged fiduciaries of the CASH Plan. The complaint alleged that the defendantsbreached their fiduciary duties by causing the CASH Plan to invest in Company securities and sought damages in anunspecified amount.
A stockholder derivative lawsuit was filed by Charles Federman against certain current and former directors of theCompany, based on essentially the same allegations as those contained in the February and March 2002 stockholderlawsuits discussed above. This action was commenced in April 2002 in the Delaware Chancery Court, and an amendedcomplaint was filed in November 2002. The defendants named in the amended complaint were current Companydirector The Honorable Alfonse M. D’Amato and former Company directors Shirley Strum Kenny and Messrs. Wang,Kumar, Artzt, Willem de Vogel, Richard Grasso, Roel Pieper, and Lewis S. Ranieri. The Company was named as a nominaldefendant. The derivative suit alleged breach of fiduciary duties on the part of all the individual defendants and, asagainst the former management director defendants, insider trading on the basis of allegedly misappropriatedconfidential, material information. The amended complaint sought an accounting and recovery on behalf of the Companyof an unspecified amount of damages, including recovery of the profits allegedly realized from the sale of CommonStock.
On August 25, 2003, the Company announced the settlement of the above-described class action lawsuits against theCompany and certain of its present and former officers and directors, alleging misleading statements,misrepresentations, and omissions regarding the Company’s financial performance, as well as breaches of fiduciary duty.At the same time, the Company also announced the settlement of a derivative lawsuit, in which the Company wasnamed as a nominal defendant, filed against certain present and former officers and directors of the Company, allegingbreaches of fiduciary duty and, against certain management directors, insider trading, as well as the settlement of anadditional derivative action filed by Charles Federman that had been pending in the Federal Court. As part of the classaction settlement, which was approved by the Federal Court in December 2003, the Company agreed to issue a total ofup to 5.7 million shares of Common Stock to the stockholders represented in the three class action lawsuits, includingpayment of attorneys’ fees. The Company has completed the issuance of the settlement shares as well as payment of$3.3 million to the plaintiffs’ attorneys in legal fees and related expenses.
In settling the derivative suits, which settlement was approved by the Federal Court in December 2003, the Companycommitted to maintain certain corporate governance practices. Under the settlement, the Company, the individualdefendants and all other current and former officers and directors of the Company were released from any potentialclaim by stockholders arising from accounting-related or other public statements made by the Company or its agentsfrom January 1998 through February 2002 (and from March 11, 1998 through May 2003 in the case of the employee
87
%%TRANSMSG*** Transmitting Job: Y77913 PCN: 089000000 ***%%PCMSG|87 |00013|Yes|No|07/07/2009 22:17|0|0|Page is valid, no graphics -- Color: D|

ERISA action). The individual defendants were released from any potential claim by or on behalf of the Company relatingto the same matters.
On October 5, 2004 and December 9, 2004, four purported Company stockholders served motions to vacate the Orderof Final Judgment and Dismissal entered by the Federal Court in December 2003 in connection with the settlement ofthe derivative action. These motions primarily sought to void the releases that were granted to the individual defendantsunder the settlement. On December 7, 2004, a motion to vacate the Order of Final Judgment and Dismissal entered bythe Federal Court in December 2003 in connection with the settlement of the 1998 and 2002 stockholder lawsuitsdiscussed above (together with the October 5, 2004 and December 9, 2004 motions, the 60(b) Motions) was filed bySam Wyly and certain related parties (the Wyly Litigants). The motion sought to reopen the settlement to permit themoving stockholders to pursue individual claims against certain present and former officers of the Company. The motionstated that the moving stockholders did not seek to file claims against the Company.
Derivative Actions Filed in 2004In June and July 2004, three purported derivative actions were filed in the Federal Court by Ranger Governance, Ltd.(Ranger), Bert Vladimir and Irving Rosenzweig against certain current or former employees and/or directors of theCompany (the Derivative Actions). In November 2004, the Federal Court issued an order consolidating the DerivativeActions. The plaintiffs filed a consolidated amended complaint (the Consolidated Complaint) on January 7, 2005. TheConsolidated Complaint names as defendants Messrs. Wang, Kumar, Zar, McWade, Schwartz, de Vogel, Grasso, Pieper,Artzt, D’Amato, and Ranieri, Stephen Richards, Steven Woghin, David Kaplan, David Rivard, Lloyd Silverstein, Michael A.McElroy, Gary Fernandes, Robert E. La Blanc, Jay W. Lorsch, Kenneth Cron, Walter P. Schuetze, KPMG LLP, and Ernst &Young LLP. The Company is named as a nominal defendant. The Consolidated Complaint seeks from one or more of thedefendants (1) contribution towards the consideration the Company had previously agreed to provide current andformer stockholders in settlement of certain class action litigation commenced against the Company and certain officersand directors in 1998 and 2002 (see “Stockholder Class Action and Derivative Lawsuits Filed Prior to 2004-Background”), (2) compensatory and consequential damages in an amount not less than $500 million in connectionwith the investigations giving rise to the Deferred Prosecution Agreement (DPA) entered into between the Companyand the United States Attorney’s Office (USAO) in 2004 and a consent to enter into a final judgment (ConsentJudgment) in a parallel proceeding brought by the Securities and Exchange Commission (SEC) regarding certain of theCompany’s past accounting practices, including its revenue recognition policies and procedures during certain periodsprior to the adoption of the Company’s new business model in October 2000. (In May 2007, based upon the Company’scompliance with the terms of the DPA, the Federal Court ordered dismissal of the charges that had been filed againstthe Company in connection with the DPA, and the DPA expired. The injunctive provisions of the Consent Judgmentpermanently enjoining the Company from violating certain provisions of the federal securities laws remain in effect.),(3) unspecified relief for violations of Section 14(a) of the Exchange Act for alleged false and material misstatementsmade in the Company’s proxy statements issued in 2002 and 2003, (4) relief for alleged breach of fiduciary duty,(5) unspecified compensatory, consequential and punitive damages based upon allegations of corporate waste andfraud, (6) unspecified damages for breach of duty of reasonable care, (7) restitution and rescission of the compensationearned under the Company’s executive compensation plan and (8) pursuant to Section 304 of the Sarbanes-Oxley Act,reimbursement of bonus or other incentive-based equity compensation and alleged profits realized from sales ofsecurities issued by the Company. Although no relief is sought from the Company, the Consolidated Complaint seeksmonetary damages, both compensatory and consequential, from the other defendants, including current or formeremployees and/or directors of the Company, Ernst & Young LLP and KPMG LLP in an amount totaling not less than$500 million.
On February 1, 2005, the Company established a Special Litigation Committee of independent members of its Board ofDirectors to, among other things, control and determine the Company’s response to the Derivative Actions and the60(b) Motions. On April 13, 2007, the Special Litigation Committee issued its reports, which announced the SpecialLitigation Committee’s conclusions, determinations, recommendations and actions with respect to the claims asserted inthe Derivative Actions and the 60(b) Motions. The Special Litigation Committee also served a motion which seeks to
88
%%TRANSMSG*** Transmitting Job: Y77913 PCN: 090000000 ***%%PCMSG|88 |00010|Yes|No|07/07/2009 22:17|0|0|Page is valid, no graphics -- Color: D|
dismiss and realign the claims and parties in accordance with the Special Litigation Committee’s recommendations. Assummarized below, the Special Litigation Committee concluded as follows:
• The Special Litigation Committee has concluded that it would be in the best interests of the Company to pursuecertain of the claims against Messrs. Wang and Schwartz.
• The Special Litigation Committee has concluded that it would be in the best interests of the Company to pursuecertain of the claims against the former Company executives who have pled guilty to various charges of securitiesfraud and/or obstruction of justice — including Messrs. Kaplan, Richards, Rivard, Silverstein, Woghin and Zar. TheSpecial Litigation Committee has determined and directed that these claims be pursued by the Company usingcounsel retained by the Company, unless the Special Litigation Committee is able to successfully conclude itsongoing settlement negotiations with these individuals.
• The Special Litigation Committee has reached a settlement (subject to court approval) with Messrs. Kumar, McWadeand Artzt.
• The Special Litigation Committee believes that the claims (the Director Claims) against current and former Companydirectors Messrs. Cron, D’Amato, de Vogel, Fernandes, Grasso, La Blanc, Lorsch, Pieper, Ranieri and Schuetze,Ms. Kenny, and Alex Vieux should be dismissed. The Special Litigation Committee has concluded that these directorsdid not breach their fiduciary duties and the claims against them lack merit.
• The Special Litigation Committee has concluded that it would be in the best interests of the Company to seekdismissal of the claims against Ernst & Young LLP, KPMG LLP and Mr. McElroy.
The Special Litigation Committee has served a motion which seeks dismissal of the Director Claims, the claims againstErnst & Young LLP, KPMG LLP and Mr. McElroy, and certain other claims. In addition, the Special Litigation Committeehas asked for the Federal Court’s approval for the Company to be realigned as the plaintiff with respect to claims againstcertain other parties, including Messrs. Wang and Schwartz.
Current Procedural Status of Stockholder Class Action and Derivative Lawsuits Filed Prior to 2004 and DerivativeActions Filed in 2004By letter dated July 19, 2007, counsel for the Special Litigation Committee advised the Federal Court that the SpecialLitigation Committee had reached a settlement of the Derivative Actions with two of the three derivative plaintiffs —Bert Vladimir and Irving Rosenzweig. In connection with the settlement, both of these plaintiffs have agreed to supportthe Special Litigation Committee’s motion to dismiss and to realign. The Company has agreed to pay the attorney’s feesof Messrs. Vladimir and Rosenzweig in an amount up to $525,000 each. If finalized, this settlement would requireapproval of the Federal Court. On July 23, 2007, Ranger filed a letter with the Federal Court objecting to the proposedsettlement. On October 29, 2007, the Federal Court denied the Special Litigation Committee’s motion to dismiss andrealign, without prejudice to renewing the motion after a decision by the appellate court regarding the Federal Court’sdecisions concerning the 60(b) Motions.
In a memorandum and order dated August 2, 2007, the Federal Court denied all of the 60(b) Motions and reaffirmedthe 2003 settlements (the August 2 decision). On August 24, 2007, Ranger and the Wyly Litigants filed notices ofappeal of the August 2 decision. On August 16, 2007, the Special Litigation Committee filed a motion to amend orclarify the August 2 decision, and the Company joined that motion. On September 12, 2007 and October 4, 2007, theFederal Court issued opinions denying the motions to amend or clarify. On September 18, 2007, the Wyly Litigants andRanger filed notices of appeal of the September 12 decision. The Company filed notices of cross-appeal of theSeptember 12 and October 4 decisions on November 2, 2007. Oral argument on the appeals and cross-appealsoccurred on March 11, 2009, and decisions are pending.
Texas LitigationOn August 9, 2004, a petition was filed by Sam Wyly and Ranger against the Company in the District Court of DallasCounty, Texas, seeking to obtain a declaratory judgment that plaintiffs did not breach two separation agreements theyentered into with the Company in 2002 (the 2002 Agreements). On February 18, 2005, Mr. Wyly filed a separatelawsuit in the United States District Court for the Northern District of Texas (the Texas Federal Court) alleging that he isentitled to attorneys’ fees in connection with the original litigation filed in the District Court of Dallas County, Texas. The
89
%%TRANSMSG*** Transmitting Job: Y77913 PCN: 091000000 ***%%PCMSG|89 |00012|Yes|No|07/27/2009 11:26|0|0|Page is valid, no graphics -- Color: D|

two actions have been consolidated. On March 31, 2005, the plaintiffs amended their complaint to allege a claim thatthey were defrauded into entering the 2002 Agreements and to seek rescission of those agreements and damages. OnSeptember 1, 2005, the Texas Federal Court granted the Company’s motion to transfer the action to the Federal Court.On November 9, 2007, plaintiffs served a motion to reopen discovery for 90 days to permit unspecified additionaldocument requests and depositions. The Federal Court denied plaintiffs’ discovery motion on August 29, 2008 andcertified that discovery was complete on September 3, 2008. On September 15, 2008, the Company moved forsummary judgment dismissing all of plaintiffs’ claims, and plaintiffs moved for reconsideration of the Federal Court’sAugust 29, 2008 order denying plaintiffs’ discovery motion. These motions are fully briefed and pending determinationby the Federal Court.
Other Civil ActionsIn 2004, the Company entered a voluntary disclosure agreement (VDA) with the State of Delaware, by which theCompany agreed to disclose information about its failure to comply with certain abandoned property (“escheatment”)procedures and, in return, the State agreed, among other things, not to impose interest or conduct an audit. TheCompany engaged an independent consultant to review its records and provide an estimate of its liability to the State.The State refused to accept that estimate. In October 2008, the Company commenced an action entitled CA, Inc. v.Cordrey, et al, Civil Action No. 4111-CC in the Delaware Chancery Court (the Delaware Court) seeking, among otherthings, to compel the State to abide by its obligations under the VDA. In November 2008, the State filed a suit in theDelaware Court entitled Cordrey, et al v. CA, Inc. et al, Civil Action No. 4195-CC, that seeks to enforce a request forpayment of abandoned property liability, compel an audit and impose interest. By an amended complaint, datedMarch 2, 2009, the State alleged, among other things, that the Company made material misrepresentations in andunreasonably delayed the VDA process and the state added causes of action for fraud and/or negligentmisrepresentation. Although the ultimate outcome cannot be determined, the Company believes that the State’s claimsare unfounded and that the Company has meritorious defenses. In the opinion of management, the resolution of thislawsuit is not expected to have a material adverse effect on the Company’s financial position, results of operations, orcash flows.
On April 9, 2007, the Company filed a complaint in the United States District Court for the Eastern District of New York(the Federal Court) against Rocket Software, Inc. (Rocket). On August 1, 2007, the Company filed an amendedcomplaint alleging that Rocket misappropriated intellectual property associated with a number of the Company’sdatabase management software products. The amended complaint included causes of action for copyright infringement,misappropriation of trade secrets, unfair competition, and unjust enrichment. In the amended complaint, the Companysought damages of at least $200 million for Rocket’s alleged theft and misappropriation of the Company’s intellectualproperty, as well as an injunction preventing Rocket from continuing to distribute the database management softwareproducts at issue. On February 10, 2009, the Company announced that it had reached a settlement with Rocketresolving the Company’s claims of copyright infringement and trade secret misappropriation. As part of the settlement,Rocket agreed to license technology from the Company, including source code authored several years ago and relatedtrade secrets that were the subject of the litigation for $50 million to be received and recognized as software fees andother with the consolidated statement of operations in increments through fiscal 2014. Rocket did not admit anywrongdoing in connection with this settlement.
In December 2008, a lawsuit captioned Information Protection and Authentication of Texas LLC v. Symantec Corp., et al. wasfiled in the United States District Court for the Eastern District of Texas. The complaint seeks monetary damages in anundisclosed amount against twenty-two separate defendants including the Company based upon claims for direct andcontributory infringement of two separate patents. The complaint does not disclose which of the Company’s productsallegedly infringe the claimed patents. In March 2009, the Company both answered the complaint and filed a cross-complaint seeking a declaratory judgment that the Company does not infringe the claimed patents and that suchpatents are invalid. Although the ultimate outcome cannot be determined, the Company believes that the claims areunfounded and that the Company has meritorious defenses. In the opinion of management, the resolution of this lawsuitis not expected to have a material adverse effect on the Company’s financial position, results of operations, or cashflows.
The Company, various subsidiaries, and certain current and former officers have been named as defendants in variousother lawsuits and claims arising in the normal course of business. The Company believes that it has meritorious
90
%%TRANSMSG*** Transmitting Job: Y77913 PCN: 092000000 ***%%PCMSG|90 |00013|Yes|No|07/27/2009 11:26|0|0|Page is valid, no graphics -- Color: D|
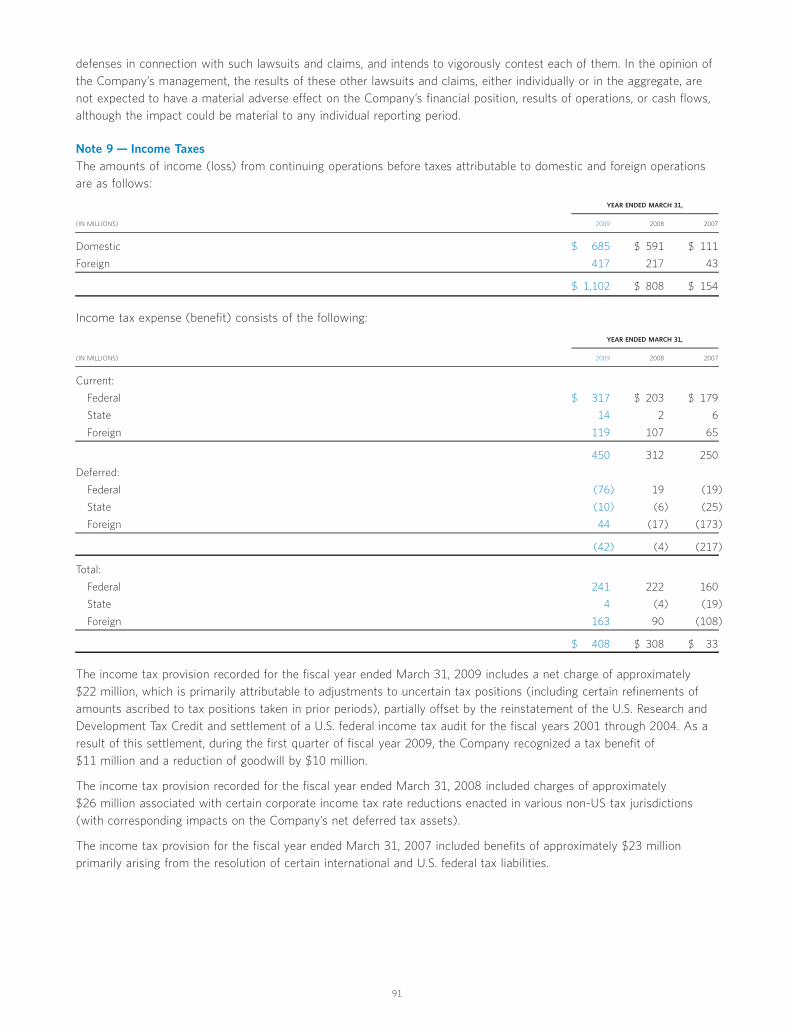
defenses in connection with such lawsuits and claims, and intends to vigorously contest each of them. In the opinion ofthe Company’s management, the results of these other lawsuits and claims, either individually or in the aggregate, arenot expected to have a material adverse effect on the Company’s financial position, results of operations, or cash flows,although the impact could be material to any individual reporting period.
Note 9 — Income TaxesThe amounts of income (loss) from continuing operations before taxes attributable to domestic and foreign operationsare as follows:
(IN MILLIONS) 2009 2008 2007
YEAR ENDED MARCH 31,
Domestic $ 685 $ 591 $ 111
Foreign 417 217 43
$ 1,102 $ 808 $ 154
Income tax expense (benefit) consists of the following:
(IN MILLIONS) 2009 2008 2007
YEAR ENDED MARCH 31,
Current:
Federal $ 317 $ 203 $ 179
State 14 2 6
Foreign 119 107 65
450 312 250
Deferred:
Federal (76) 19 (19)
State (10) (6) (25)
Foreign 44 (17) (173)
(42) (4) (217)
Total:
Federal 241 222 160
State 4 (4) (19)
Foreign 163 90 (108)
$ 408 $ 308 $ 33
The income tax provision recorded for the fiscal year ended March 31, 2009 includes a net charge of approximately$22 million, which is primarily attributable to adjustments to uncertain tax positions (including certain refinements ofamounts ascribed to tax positions taken in prior periods), partially offset by the reinstatement of the U.S. Research andDevelopment Tax Credit and settlement of a U.S. federal income tax audit for the fiscal years 2001 through 2004. As aresult of this settlement, during the first quarter of fiscal year 2009, the Company recognized a tax benefit of$11 million and a reduction of goodwill by $10 million.
The income tax provision recorded for the fiscal year ended March 31, 2008 included charges of approximately$26 million associated with certain corporate income tax rate reductions enacted in various non-US tax jurisdictions(with corresponding impacts on the Company’s net deferred tax assets).
The income tax provision for the fiscal year ended March 31, 2007 included benefits of approximately $23 millionprimarily arising from the resolution of certain international and U.S. federal tax liabilities.
91
%%TRANSMSG*** Transmitting Job: Y77913 PCN: 093000000 ***%%PCMSG|91 |00011|Yes|No|07/27/2009 11:26|0|0|Page is valid, no graphics -- Color: D|

The provision (benefit) for income taxes is allocated as follows:
(IN MILLIONS) 2009 2008 2007
YEAR ENDED MARCH 31,
Continuing operations $ 408 $ 308 $ 33
Discontinued operations — — (1)
$ 408 $ 308 $ 32
The tax expense from continuing operations is reconciled to the tax expense from continuing operations computed atthe federal statutory tax rate as follows:
(IN MILLIONS) 2009 2008 2007
YEAR ENDED MARCH 31,
Tax expense at U.S. federal statutory tax rate $ 386 $ 283 $ 54
Increase in tax expense resulting from:
U.S. share-based compensation 4 4 8
Effect of international operations (11) (24) (47)
Corporate tax rate changes 8 26 —
State taxes, net of federal tax benefit 2 3 (17)
Valuation allowance 7 (11) 8
Other, net 12 27 27
Tax expense from continuing operations $ 408 $ 308 $ 33
Deferred income taxes reflect the impact of temporary differences between the carrying amounts of assets and liabilitiesrecognized for financial reporting purposes and the amounts recognized for tax purposes. The tax effects of thetemporary differences are as follows:
(IN MILLIONS) 2009 2008
MARCH 31,
Deferred tax assets:
Modified accrual basis accounting $ 445 $ 428
Acquisition accruals — 6
Share-based compensation 84 102
Accrued expenses 73 48
Net operating losses 179 206
Purchased intangibles amortizable for tax purposes 24 28
Depreciation 20 26
Deductible state tax and interest benefits 31 42
Purchased software 13 18
Other 44 42
Total deferred tax assets 913 946
Valuation allowances (76) (118)
Total deferred tax assets, net of valuation allowances 837 828
Deferred tax liabilities:
Other intangible assets 86 105
Capitalized development costs 135 113
Total deferred tax liabilities 221 218
Net deferred tax asset $ 616 $ 610
In management’s judgment, it is more likely than not that the total deferred tax assets, net of valuation allowance, ofapproximately $837 million will be realized as reductions to future taxable income or by utilizing available tax planningstrategies. Worldwide net operating loss carryforwards (NOLs) totaled approximately $608 million and $697 million as
92
%%TRANSMSG*** Transmitting Job: Y77913 PCN: 094000000 ***%%PCMSG|92 |00014|Yes|No|07/07/2009 22:17|0|0|Page is valid, no graphics -- Color: D|

of March 31, 2009 and 2008, respectively. The NOLs will expire as follows: $457 million between 2009 and 2028 and$151 million may be carried forward indefinitely.
The valuation allowance decreased approximately $42 million and $13 million at March 31, 2009 and 2008,respectively. The decrease in the valuation allowance at March 31, 2009 primarily relates to the utilization of NOLs. Thedecrease in valuation allowance at March 31, 2008 primarily related to the amount of NOLs in foreign jurisdictionswhich, in management’s judgment, were “more likely than not” to be realized.
No provision has been made for U.S. federal income taxes on the balance of unremitted earnings of the Company’sforeign subsidiaries since the Company plans to permanently reinvest all such earnings outside the U.S. Unremittedearnings totaled approximately $1,349 million and $1,110 million as of March 31, 2009 and 2008, respectively. It is notpracticable to determine the amount of tax associated with such unremitted earnings.
In 2006, the FASB issued FIN 48, which clarifies the accounting for uncertainty in tax positions. FIN 48 requires that theCompany recognize in its financial statements the impact of a tax position, if that position is more likely than not ofbeing sustained on audit, based on the technical merits of the position. The Company adopted the provisions of FIN 48as of the beginning of fiscal year 2008.
A number of years may elapse before a particular uncertain tax position for which the Company has not recorded afinancial statement benefit is audited and finally resolved. The number of years with open tax audits varies depending onthe tax jurisdiction. The Company’s major taxing jurisdictions and the related open tax audits are as follows:
• United States — federal audits have been completed for all taxable years through 2004;
• Germany— audits have been completed for all taxable years through 2003;
• Italy — audits have been completed for all taxable years through 1999;
• Japan— audits have been completed for all taxable years through 2003; and
• United Kingdom — audits have been completed for all taxable years prior to 1999.
While it is often difficult to predict the final outcome or the timing of resolution of any particular tax matter, theCompany believes that its financial statements reflect the probable outcome of known uncertain tax positions. TheCompany adjusts these reserves, as well as any related interest or penalties, in light of changing facts andcircumstances. To the extent a settlement differs from the amounts previously reserved, such difference would begenerally recognized as a component of the Company’s annual tax rate in the year of resolution.
As of March 31, 2009, the liability for income taxes associated with uncertain tax positions is approximately$311 million (of which approximately $9 million is classified as current). In addition, the Company has recordedapproximately $31 million of deferred tax assets for future deductions of interest and state income taxes related tothese uncertain tax positions.
As of March 31, 2009, the total gross amount of reserves for income taxes, reported in other liabilities, is $247 million.Any prospective adjustments to these reserves will be recorded as an increase or decrease to the Company’s provisionfor income taxes and would impact its effective tax rate. In addition, the Company accrues in its income tax provisioninterest and any associated penalties related to reserves for income taxes. The gross amount of interest and penaltiesaccrued, reported in total liabilities, is $64 million as of March 31, 2009, of which a reduction of $5 million is recognizedin fiscal year 2009. The gross amount accrued in such regard was $69 million as of March 31, 2008, of which $4 millionwas recognized in fiscal year 2008.
93
%%TRANSMSG*** Transmitting Job: Y77913 PCN: 095000000 ***%%PCMSG|93 |00012|Yes|No|07/07/2009 22:17|0|0|Page is valid, no graphics -- Color: D|

A roll-forward of the Company’s reserves for all federal, state and foreign tax jurisdictions is as follows:
(IN MILLIONS) 2009 2008
MARCH 31
Balance, beginning of year $ 211 $ 238
FIN 48 adoption adjustment to retained earnings — (10)
Adjusted balance, beginning of year 211 228
Additions for tax positions related to the current year 26 19
Additions for tax positions from prior years 82 27
Reductions for tax positions from prior years (4) (32)
Settlement payments (54) (27)
Statute of limitations expiration (4) (4)
Translation and other (10) —
Balance, end of year $ 247 $ 211
Note 10 — Stock PlansShare-based incentive awards are provided to employees under the terms of the Company’s equity compensation plans(the Plans). The Plans are administered by the Compensation and Human Resources Committee of the Board ofDirectors (the Committee). Awards under the Plans may include at-the-money stock options, premium-priced stockoptions, restricted stock (RSAs), restricted stock units (RSUs), performance share units (PSUs) or any combinationthereof. The non-employee members of the Company’s Board of Directors receive deferred stock units under separatedirector compensation plans. The Company typically settles awards under employee and non-employee directorcompensation plans with stock held in treasury.
All Plans, with the exception of acquired companies’ stock plans, have been approved by the Company’s shareholders.Descriptions of the Plans are as follows:
The Company’s 1991 Stock Incentive Plan (the 1991 Plan) provided that stock appreciation rights and/or options, bothqualified and non-statutory, to purchase up to 67.5 million shares of common stock of the Company could be granted toemployees (including officers of the Company). As of March 31, 2009, options covering approximately 70.9 millionshares have been granted, including option shares issued that were previously terminated due to employee forfeitures.As of March 31, 2009, all of the options outstanding under the 1991 Plan, which cover approximately 3.5 million shares,were exercisable with exercise prices ranging from $27.00 — $74.69 per share.
The 1993 Stock Option Plan for Non-Employee Directors (the 1993 Plan) provided for non-statutory options topurchase up to a total of 337,500 shares of common stock of the Company to be available for grant to each member ofthe Board of Directors who is not an employee of the Company. Pursuant to the 1993 Plan, the exercise price was thefair market value of the Company’s stock on the date of grant. All options expire 10 years from the date of grant unlessotherwise terminated. As of March 31, 2009, options covering 222,750 shares have been granted under this plan. As ofMarch 31, 2009, all of the options outstanding under the 1993 Plan, which cover 13,500 shares, were exercisable withexercise prices ranging from $32.38 — $51.44 per share.
The 1996 Deferred Stock Plan for Non-Employee Directors (the 1996 Plan) provided for each director to receive annualdirector fees in the form of deferred shares. As of March 31, 2009, approximately 7,600 deferred shares wereoutstanding under the 1996 Plan.
The 2001 Stock Option Plan (the 2001 Plan) provided that non-statutory and incentive stock options to purchase up to7.5 million shares of common stock of the Company could be granted to select employees and consultants. As ofMarch 31, 2009, options covering approximately 6.5 million shares have been granted. As of March 31, 2009, all of theoptions outstanding under the 2001 Plan, which cover approximately 1.6 million shares, were exercisable with anexercise price of $21.89 per share.
The 2002 Incentive Plan (the 2002 Plan) as amended and restated effective April 27, 2007 provides that annualperformance bonuses, long-term performance bonuses, both qualified and non-statutory stock options, RSAs, RSUs andother equity-based awards to purchase up to 45 million shares of common stock of the Company may be granted to
94
%%TRANSMSG*** Transmitting Job: Y77913 PCN: 096000000 ***%%PCMSG|94 |00011|Yes|No|07/07/2009 22:17|0|0|Page is valid, no graphics -- Color: D|
select employees and consultants. In addition, any shares of common stock that were subject to issuance but notawarded under the 2001 Plan are available for issuance under the 2002 Plan. As of March 31, 2009, approximately3.0 million of such shares were available under the 2002 Plan. As of March 31, 2009, options covering 19.8 millionshares have been granted under the 2002 Plan. As of March 31, 2009, options covering 8.5 million shares wereoutstanding, of which options covering approximately 7.9 million shares are exercisable. The outstanding options haveexercise prices ranging from $12.89 — $32.80 per share. As of March 31, 2009, approximately 9.2 million RSAs andapproximately 2.6 million RSUs have been awarded to employees, of which approximately 2.9 million and 0.3 millionshares, respectively, were unreleased.
The 2002 Compensation Plan for Non-Employee Directors (the 2002 Director Plan) provided for each eligible director toreceive annual fees in the form of deferred shares and automatic option grants to purchase 6,750 shares of commonstock of the Company, up to a total of 650,000 shares. Pursuant to the 2002 Director Plan, the exercise price of theoptions granted was the fair market value of the Company’s stock price on the date of grant. All options expire 10 yearsfrom the date of grant unless otherwise terminated. As of March 31, 2009, all of the options outstanding under the2002 Director Plan, which cover approximately 28,000 shares, were exercisable, with exercise prices ranging from$11.04 — $23.37 per share. As of March 31, 2009, approximately 8,800 deferred shares were outstanding in connectionwith annual director fees.
The 2003 Compensation Plan for Non-Employee Directors (the 2003 Director Plan) as amended September 10, 2008provides for each director to receive director fees in the form of deferred shares. In addition, certain directors receive anadditional annual fee for their service as a committee chair, and the chairman of the board receives an additional fee forhis service as the lead director. Directors may elect to receive up to 50% of fees under the 2003 Director Plan in cash.As of March 31, 2009, approximately 207,000 deferred shares were outstanding under the 2003 Director Plan.
The 2007 Incentive Plan (the 2007 Plan) effective June 22, 2007 provides that annual performance bonuses, long-termperformance bonuses, both qualified and non-statutory stock options, RSAs, RSUs and other equity-based awards up toapproximately 30 million shares of common stock of the Company may be granted to select employees and consultants.No more than 10 million incentive stock options may be granted. As of March 31, 2009, approximately 1.8 million RSAshave been awarded to employees, of which approximately 1.7 million were unreleased. As of March 31, 2009,approximately 0.3 million RSUs were awarded and unreleased. As of March 31, 2009, approximately 25.5 million shareswere available for future issuance.
Share-Based CompensationShare-based awards exchanged for employee services are accounted for under the fair value method. Accordingly,share-based compensation cost is measured at the grant date, based on the fair value of the award. The Company usesthe straight-line attribution method to recognize share-based compensation costs related to awards with only serviceconditions. The expense for awards expected to vest is recognized over the employee’s requisite service period(generally the vesting period of the award). Awards expected to vest are estimated based upon a combination ofhistorical experience and future expectations.
Upon adoption of SFAS No. 123(R), the Company elected to treat awards with only service conditions and with gradedvesting as one award. Consequently, the total compensation expense is recognized ratably over the entire vesting period,so long as compensation cost recognized at any date at least equals the portion of the grant date fair value of the awardthat is vested at that date.
95
%%TRANSMSG*** Transmitting Job: Y77913 PCN: 097000000 ***%%PCMSG|95 |00013|Yes|No|07/07/2009 22:17|0|0|Page is valid, no graphics -- Color: D|

The Company recognized share-based compensation in the following line items in the Consolidated Statements ofOperations for the periods indicated:
(IN MILLIONS) 2009 2008 2007
YEAR ENDED MARCH 31,
Cost of professional services $ 4 $ 4 $ 3
Cost of licensing and maintenance 3 3 2
Selling and marketing 30 30 27
General and administrative 30 40 36
Product development and enhancements 25 27 25
Share-based compensation expense before tax 92 104 93
Income tax benefit (30) (34) (27)
Net compensation expense $ 62 $ 70 $ 66
The following table summarizes information about unrecognized share-based compensation costs as of March 31, 2009:UNRECOGNIZEDCOMPENSATION
COSTS(IN MILLIONS)
WEIGHTED AVERAGE PERIODEXPECTED TO BE
RECOGNIZED(IN YEARS)
Stock option awards $ 2 1.0
Restricted stock units 7 1.5
Restricted stock 48 1.4
Performance share units 22 1.7
Stock purchase plan 2 0.3
Total unrecognized share-based compensation costs $ 81 1.5
There were no capitalized share-based compensation costs as of March 31, 2009, 2008 or 2007.
Stock Option AwardsStock options are awards issued to employees that entitle the holder to purchase shares of the Company’s stock at afixed price. Stock options are generally granted at an exercise price equal to or greater than the Company’s stock priceon the date of grant and with a contractual term of ten years. Stock option awards granted after fiscal year 2000generally vest one-third per year and become fully vested three years from the grant date.
As of March 31, 2009, options outstanding that have vested and are expected to vest are as follows:
NUMBEROF SHARES
(IN MILLIONS)WEIGHTED AVERAGE
EXERCISE PRICE
WEIGHTED AVERAGEREMAINING
CONTRACTUAL LIFE(IN YEARS)
AGGREGATE INTRINSICVALUE1
(IN MILLIONS)
Vested 13.5 $ 27.46 3.7 $ 5.7
Expected to vest2 0.6 22.01 7.3 —3
Total 14.1 $ 27.22 3.9 $ 5.7
1 These amounts represent the difference between the exercise price and $17.61, the closing price of the Company’s common stock on March 31, 2009, the last trading day of theCompany’s fiscal year as reported on the NASDAQ Stock Market for all in the money options.
2 Outstanding options expected to vest are net of estimated future forfeitures.
3 Less than $0.1 million.
96
%%TRANSMSG*** Transmitting Job: Y77913 PCN: 098000000 ***%%PCMSG|96 |00012|Yes|No|07/07/2009 22:17|0|0|Page is valid, no graphics -- Color: D|

Additional information with respect to stock option plan activity is as follows:
(SHARES IN MILLIONS)NUMBER OF
SHARESWEIGHTED AVERAGE
EXERCISE PRICE
Outstanding as of March 31, 2006 30.8 $ 28.96
Granted 3.4 23.28
Exercised (2.4) 17.96
Expired or terminated (10.5) 30.04
Outstanding as of March 31, 2007 21.3 $ 28.72
Granted —1 25.79
Exercised (1.0) 19.17
Expired or terminated (3.5) 36.32
Outstanding as of March 31, 2008 16.8 $ 27.70
Exercised (0.4) 18.85
Expired or terminated (2.3) 32.09
Outstanding as of March 31, 2009 14.1 $ 27.21
1 Less than 0.1 million shares.
(SHARES IN MILLIONS)NUMBER OF
SHARESWEIGHTED AVERAGE
EXERCISE PRICE
Options exercisable at:
March 31, 2007 16.9 29.78
March 31, 2008 14.9 28.22
March 31, 2009 13.5 27.46
The following table summarizes stock option information as of March 31, 2009:
RANGE OF EXERCISE PRICES SHARES
AGGREGATEINTRINSIC
VALUE
WEIGHTEDAVERAGE
REMAININGCONTRACTUAL
LIFE
WEIGHTEDAVERAGEEXERCISE
PRICE SHARES
AGGREGATEINTRINSIC
VALUE
WEIGHTEDAVERAGE
REMAININGCONTRACTUAL
LIFE
WEIGHTEDAVERAGEEXERCISE
PRICE
OPTIONS OUTSTANDING OPTIONS EXERCISABLE
(SHARES AND AGGREGATE INTRINSIC VALUE IN MILLIONS; WEIGHTED AVERAGE REMAINING CONTRACTUAL LIFE IN YEARS)
$ 1.37 — $ 20.00 1.4 $ 5.7 4.0 $ 13.61 1.4 $ 5.7 4.0 $ 13.61
$ 20.01 — $ 30.00 10.5 — 4.2 25.52 9.9 — 4.0 25.75
$ 30.01 — $ 40.00 0.8 — 5.4 31.05 0.8 — 5.4 31.05
$ 40.01 — $ 50.00 —1 — 2.4 47.31 —1 — 2.4 47.31
$ 50.01 — $ 74.69 1.4 — 0.3 51.98 1.4 — 0.3 51.98
14.1 $ 5.7 3.9 $ 27.21 13.5 $ 5.7 3.7 $ 27.46
1 Less than 0.1 million shares.
The fair value of each option is estimated on the date of grant using the Black-Scholes option pricing model. TheCompany believes that the valuation technique and the approach utilized to develop the underlying assumptions areappropriate in calculating the fair values of the Company’s stock options granted. Estimates of fair value are notintended to predict actual future events or the value ultimately realized by employees who receive equity awards.
No options were granted in fiscal year 2009. The weighted average estimated values of employee stock option grants, aswell as the weighted average assumptions that were used in calculating such values during fiscal years 2008 and 2007were based on estimates at the date of grant as follows:
2008 2007
YEAR ENDED MARCH 31,
Weighted average fair value $ 7.84 $ 8.40
Dividend yield .62% .73%
Expected volatility factor1 .28 .41
Risk-free interest rate2 5.1% 4.9%
Expected life (in years)3 4.5 4.5
97
%%TRANSMSG*** Transmitting Job: Y77913 PCN: 099000000 ***%%PCMSG|97 |00012|Yes|No|07/07/2009 22:17|0|0|Page is valid, no graphics -- Color: D|
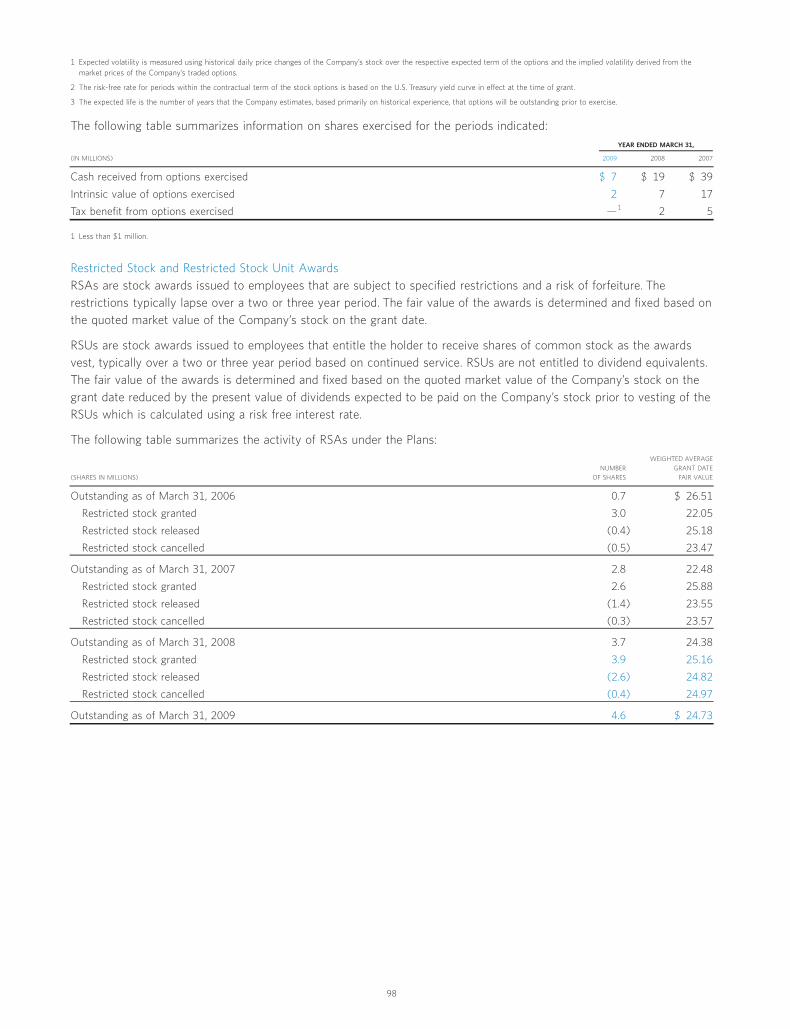
1 Expected volatility is measured using historical daily price changes of the Company’s stock over the respective expected term of the options and the implied volatility derived from themarket prices of the Company’s traded options.
2 The risk-free rate for periods within the contractual term of the stock options is based on the U.S. Treasury yield curve in effect at the time of grant.
3 The expected life is the number of years that the Company estimates, based primarily on historical experience, that options will be outstanding prior to exercise.
The following table summarizes information on shares exercised for the periods indicated:
(IN MILLIONS) 2009 2008 2007
YEAR ENDED MARCH 31,
Cash received from options exercised $ 7 $ 19 $ 39
Intrinsic value of options exercised 2 7 17
Tax benefit from options exercised —1 2 5
1 Less than $1 million.
Restricted Stock and Restricted Stock Unit AwardsRSAs are stock awards issued to employees that are subject to specified restrictions and a risk of forfeiture. Therestrictions typically lapse over a two or three year period. The fair value of the awards is determined and fixed based onthe quoted market value of the Company’s stock on the grant date.
RSUs are stock awards issued to employees that entitle the holder to receive shares of common stock as the awardsvest, typically over a two or three year period based on continued service. RSUs are not entitled to dividend equivalents.The fair value of the awards is determined and fixed based on the quoted market value of the Company’s stock on thegrant date reduced by the present value of dividends expected to be paid on the Company’s stock prior to vesting of theRSUs which is calculated using a risk free interest rate.
The following table summarizes the activity of RSAs under the Plans:
(SHARES IN MILLIONS)NUMBER
OF SHARES
WEIGHTED AVERAGEGRANT DATE
FAIR VALUE
Outstanding as of March 31, 2006 0.7 $ 26.51
Restricted stock granted 3.0 22.05
Restricted stock released (0.4) 25.18
Restricted stock cancelled (0.5) 23.47
Outstanding as of March 31, 2007 2.8 22.48
Restricted stock granted 2.6 25.88
Restricted stock released (1.4) 23.55
Restricted stock cancelled (0.3) 23.57
Outstanding as of March 31, 2008 3.7 24.38
Restricted stock granted 3.9 25.16
Restricted stock released (2.6) 24.82
Restricted stock cancelled (0.4) 24.97
Outstanding as of March 31, 2009 4.6 $ 24.73
98
%%TRANSMSG*** Transmitting Job: Y77913 PCN: 100000000 ***%%PCMSG|98 |00012|Yes|No|07/07/2009 22:17|0|0|Page is valid, no graphics -- Color: D|

The following table summarizes the activity of the RSUs under the Plans:
(SHARES IN MILLIONS)NUMBER
OF SHARES
WEIGHTED AVERAGEGRANT DATE
FAIR VALUE
Outstanding as of March 31, 2006 1.8 $ 28.53
Restricted units granted 0.3 21.97
Restricted units released (0.5) 27.48Restricted units cancelled (0.2) 26.38
Outstanding as of March 31, 2007 1.4 26.86
Restricted units granted 0.2 25.23Restricted units released (0.6) 27.70
Restricted units cancelled (0.1) 25.06
Outstanding as of March 31, 2008 0.9 27.20Restricted units granted 0.4 24.02
Restricted units released (0.6) 27.91
Restricted units cancelled (0.1) 24.11
Outstanding as of March 31, 2009 0.6 $ 24.99
The total intrinsic value of RSAs and RSUs released during the fiscal years 2009, 2008 and 2007 was approximately$78 million, $50 million and $25 million, respectively.
Performance AwardsPSUs are target awards issued under the Company’s long-term incentive plan to senior executives where the number ofshares ultimately issued to the employees depends on Company performance measured against specified targets. TheCommittee determines the number of shares to grant after either a one-year or three-year performance cycle asapplicable to the 1-year and 3-year PSUs, respectively. The fair value of each award is estimated on the date that theperformance targets are established based on the quoted market value of the Company’s stock adjusted for dividends asdescribed above for RSUs, and the Company’s estimate of the level of achievement of the performance targets. TheCompany recalculates the fair value of issued PSUs each reporting period until they are granted. The adjustment isbased on the quoted market value of the Company’s stock on the reporting period date, adjusted for dividends asdescribed above for RSUs, and the Company’s comparison of the performance it expects to achieve with theperformance targets. Compensation costs will continue to be amortized over the requisite service period of the awards.
Under the Company’s long-term incentive program for fiscal years 2009, 2008 and 2007 senior executives were issuedPSUs, under which the senior executives are eligible to receive RSAs or RSUs and unrestricted shares at the end of theperformance cycle if certain performance targets are achieved. Additionally, senior executives were granted RSAs orRSUs for fiscal years 2009 and 2008 and stock options for fiscal year 2007. At the conclusion of each performancecycle, the applicable number of shares of RSAs, RSUs or unrestricted stock granted may vary based upon the level ofachievement of the performance targets and the approval of the Committee (which has discretion to reduce any awardfor any reason). The related compensation cost recognized will be based on the number of shares granted.
RSAs and RSUs relating to 1-year PSUs were granted as follows:
(SHARES IN MILLIONS) SHARES
WEIGHTED AVERAGEGRANT DATE
FAIR VALUE SHARES
WEIGHTED AVERAGEGRANT DATE
FAIR VALUE SHARES
WEIGHTED AVERAGEGRANT DATE
FAIR VALUE
YEAR ENDED MARCH 31, 2009FOR THE PERFORMANCE CYCLE OF
FISCAL 2008
YEAR ENDED MARCH 31, 2008 FORTHE PERFORMANCE CYCLE OF
FISCAL 2007
YEAR ENDED MARCH 31, 2007 FORTHE PERFORMANCE CYCLE OF
FISCAL 2006
RSAs 1.8 $ 26.04 0.9 $ 26.45 0.3 $ 21.88
RSUs —1 $ 25.96 —1 $ 26.38 — —
1 Shares granted amount to less than 0.1 million shares.
During the year ended March 31, 2009, approximately 0.4 million unrestricted shares with a weighted average grantdate fair value of $25.80 were granted relating to 3-year PSUs.
The Committee approved also the FY09 Sales Retention Equity Program (the Program) to reward and retain top salesperformers. Awards granted under the Program may not exceed 0.8 million shares or $20 million of grant date value.Eligible participants may receive RSAs or RSUs at the end of the performance cycle if certain performance targets are
99
%%TRANSMSG*** Transmitting Job: Y77913 PCN: 101000000 ***%%PCMSG|99 |00011|Yes|No|07/07/2009 22:17|0|0|Page is valid, no graphics -- Color: D|

achieved, subject to the approval of the Committee (which has discretion to reduce any award for any reason). Therelated compensation cost recognized will be based on the number of shares granted.
Stock Purchase PlanThe Company maintains the Year 2000 Employee Stock Purchase Plan (the Purchase Plan) for all eligible employees. ThePurchase Plan is considered compensatory. Under the terms of the Purchase Plan, employees may elect to withholdbetween 1% and 25% of their base pay through regular payroll deductions, subject to Internal Revenue Code limitations.Shares of the Company’s common stock may be purchased at six-month intervals at 85% of the lower of the fair marketvalue of the Company’s common stock on the first or last day of each six-month period. During fiscal years 2009, 2008,and 2007, employees purchased approximately 1.5 million, 1.3 million and 1.5 million shares, respectively, at averageprices of $17.56, $20.19 and $17.47 per share, respectively. As of March 31, 2009, approximately 19.8 million shareswere reserved for future issuance under the Purchase Plan.
The fair value is estimated on the first date of the offering period using the Black-Scholes option pricing model. The fairvalues and the weighted average assumptions for the Purchase Plan offer periods commencing in the respective fiscalyears are as follows:
2009 2008 2007
YEAR ENDED MARCH 31,
Weighted average fair value $ 5.89 $ 5.57 $ 4.73
Dividend yield .78% .63% .74%
Expected volatility factor1 .50 .23 .22
Risk-free interest rate2 1.1% 4.2% 5.2%
Expected life (in years)3 0.5 0.5 0.5
1 Expected volatility is measured using historical daily price changes of the Company’s stock over the respective term of the offer period and the implied volatility is derived from the marketprices of the Company’s traded options.
2 The risk-free rate for periods within the contractual term of the offer period is based on the U.S. Treasury yield curve in effect at the beginning of the offer period.
3 The expected life is the six-month offer period.
Note 11 — Profit-Sharing PlanThe Company maintains a defined contribution plan, the CA, Inc. Savings Harvest Plan (CASH Plan), for the benefit ofthe U.S. employees of the Company. The CASH Plan is intended to be a qualified plan under Section 401(a) of theInternal Revenue Code of 1986 (the Code), and contains a qualified cash or deferred arrangement as described underSection 401(k) of the Code. Pursuant to the CASH Plan, eligible participants may elect to contribute a percentage oftheir base compensation. The Company may make matching contributions under the CASH plan. The matchingcontributions to the CASH Plan totaled approximately $14 million, $14 million and $13 million for the fiscal years endedMarch 31, 2009, 2008 and 2007, respectively. In addition, the Company may make discretionary contributions ofCompany common stock to the CASH Plan. Charges for the discretionary contributions to the CASH plan totaledapproximately $24 million, $18 million and $24 for the fiscal years ended March 31, 2009, 2008 and 2007, respectively.
Note 12 — Rights PlanEach outstanding share of the Company’s common stock carries a Stock Purchase Right issued under the Company’sStockholder Protection Rights Agreement, dated October 16, 2006 (the Rights Agreement). Under certain circumstances,each right may be exercised to purchase one one-thousandth of a share of Participating Preferred Stock, Class A, for $100.Following (i) the acquisition of 20% or more of the Company’s outstanding common stock by an Acquiring Person asdefined in the Rights Agreement (Walter Haefner and his affiliates and associates are “grandfathered” under this provisionso long as their aggregate ownership of Common Stock does not exceed approximately 126,562,500 shares), or (ii) thecommencement of a tender offer or exchange offer that would result in a person or group owning 20% or more of theCompany’s outstanding common stock, under certain circumstances each right, other than rights held by an AcquiringPerson, may be exercised to purchase common stock of the Company or a successor company with a market value oftwice the $100 exercise price. However, the rights will not be triggered by a Qualifying Offer, as defined in the RightsAgreement, if holders of at least 10 percent of the outstanding shares of the Company’s common stock request that aspecial meeting of stockholders be convened for the purpose of exempting such offer from the Rights Agreement, andthereafter the stockholders vote at such meeting to exempt such Qualifying Offer from the Rights Agreement. The rights,which are redeemable by the Company at one cent per right, expire November 30, 2009.
100
%%TRANSMSG*** Transmitting Job: Y77913 PCN: 102000000 ***%%PCMSG|100 |00011|Yes|No|07/07/2009 22:17|0|0|Page is valid, no graphics -- Color: D|

Schedule IICA, INC. AND SUBSIDIARIESVALUATION AND QUALIFYING ACCOUNTS
(IN MILLIONS)
BALANCE ATBEGINNINGOF PERIOD
ADDITIONSCHARGED TO
COSTS ANDEXPENSES DEDUCTIONS1
BALANCEAT END
OF PERIOD
Allowance for doubtful accounts
Year ended March 31, 2009 $ 31 $ 9 $ (15) $ 25
Year ended March 31, 2008 $ 37 $ 22 $ (28) $ 31
Year ended March 31, 2007 $ 45 $ 11 $ (19) $ 37
1 Write-offs and recoveries of amounts against allowance provided.
This concludes the Form 10-K portion of the Annual Report.
101
%%TRANSMSG*** Transmitting Job: Y77913 PCN: 103000000 ***%%PCMSG|101 |00010|Yes|No|07/08/2009 20:17|0|0|Page is valid, no graphics -- Color: D|

$0
$20
$40
$60
$80
$100
$120
$140
$160
3/04 3/05 3/06 3/07 3/08 3/09
CA, Inc. S&P 500 S&P Software
Comparison of 5-Year Cumulative Total Return*Among CA, Inc., the S&P 500 Index and the S&P Software Index
* $100 invested on 3/31/04 in stock or index, including reinvestment of dividends. Fiscal years ending March 31.
3/04 3/05 3/06 3/07 3/08 3/09
CA, Inc. 100.00 101.17 102.17 97.97 85.62 67.55S&P 500 100.00 106.69 119.20 133.31 126.54 78.34S&P Software 100.00 107.53 120.87 131.10 133.78 97.61
Copyright © 2009 S&P, a division of The McGraw-Hill Companies Inc. All rights reserved.(www.researchdatagroup.com/S&P.htm)

Board of Directors
William E. McCrackenChairman of the BoardCA, Inc.
Raymond J. BromarkRetired PartnerPricewaterhouseCoopers LLP
Gary J. FernandesChairman and PresidentFLF Investments
Kay KoplovitzChairmanLiz Claiborne, Inc.
Robert E. La BlancFounder and PresidentRobert E. La Blanc Associates, Inc.
Christopher B. LofgrenPresident and Chief Executive OfficerSchneider National, Inc.
John A. SwainsonChief Executive OfficerCA, Inc.
Laura S. UngerPrivate Consultant and Former SEC Commissioner
Arthur F. WeinbachExecutive ChairmanBroadridge Financial Solutions, Inc.
Renato (Ron) ZamboniniFormer ChairmanCognos Incorporated
Executive Leadership Team
John A. SwainsonChief Executive Officer
Michael J. ChristensonPresident and Chief Operating Officer
Russell M. ArtztVice Chairman and Founder
James E. BryantExecutive Vice President,Risk and Chief Administrative Officer
Nancy E. CooperExecutive Vice President,Chief Financial Officer
George J. FischerExecutive Vice President,Global Sales and Marketing
Andrew GoodmanExecutive Vice President,Worldwide Human Resources
Ajei S. GopalExecutive Vice President,Products and Technology Group
Kenneth V. HandalExecutive Vice President,Office of the CEO
Jacob LammExecutive Vice President,Strategy and Corporate Development
Amy Fliegelman OlliExecutive Vice President,General Counsel
Christopher T. O’MalleyExecutive Vice President,General Manager, Mainframe
John RuthvenExecutive Vice President,Worldwide Sales Operations
Board of Directors and Executive Leadership Team

International HeadquartersCA, Inc.One CA PlazaIslandia, NY 117491-800-225-5224Fax: 1-631-342-6800
CA StockThe following table sets forth, for the fiscal quartersindicated, the quarterly high and low closing sales priceson the NASDAQ and the New York Stock Exchange, asapplicable.
HIGH LOW
FISCAL 2009:
Fourth Quarter $18.90 $15.40Third Quarter $20.12 $14.37Second Quarter $24.63 $18.31First Quarter $26.54 $21.67
HIGH LOW
FISCAL 2008:
Fourth Quarter $26.31 $21.26Third Quarter $27.18 $24.15Second Quarter $26.68 $23.41First Quarter $28.21 $25.39
On March 31, 2009, the closing price for the Company’sCommon Stock on the NASDAQ was $17.61. At March 31,2009, the Company had approximately 9,300 stockholdersof record.
During fiscal 2008 and through April 27, 2008, ourcommon stock was traded on the New York StockExchange under the symbol “CA.” On April 28, 2008,our common stock commenced trading on the NASDAQunder the same symbol.
Independent AuditorsKPMG LLP345 Park AvenueNew York, NY 10154-0102
Stockholder InformationA copy of the Annual Report on Form 10-K, filed with theSecurities and Exchange Commission, is available withoutcharge upon written request addressed to:
Investor RelationsCA, Inc.520 Madison AvenueNew York, NY 10022
The Form 10-K, quarterly earnings releases and generalCompany information can be obtained via the Internetat ca.com.
The most recent certifications by our Chief ExecutiveOfficer and Chief Financial Officer pursuant toSections 302 and 906 of the Sarbanes-Oxley Actof 2002 are filed as exhibits to our Form 10-K.
Dividend Reinvestment ProgramCA’s Dividend Reinvestment Program enablesstockholders to reinvest dividends and invest additionalcash to purchase CA Common Stock. You must alreadybe a stockholder to participate. For more information,contact CA’s transfer agent at the address or telephonenumber below.
Transfer AgentQuestions concerning dividend reinvestment, stockcertificates, address changes, account consolidation,1099 tax forms and dividend checks or direct depositshould be directed to:
BNYMellon Shareowner ServicesPO Box 358015Pittsburgh, PA 15252-80151-800-244-7155 or 1-201-680-6578Hearing impaired: 1-800-231-5469 or 1-201-680-6610bnymellon.com/shareowner/isd
BNY Mellon Investor Services offers Investor ServiceDirect, a service that allows registered U.S. shareholdersto access their accounts online. Shareholders canview account information, obtain dividend paymentinformation, request a stock certificate or print a duplicate1099 via the Internet at bnymellon.com/shareowner/isd.
Corporate Information


Delivering on our Commitments
CA Annual Report 2009
Empowering Customers to Manage IT Complexity
CA
Annual Report 2009
ca.comCopyright © 2009 CA. All rights reserved. All trademarks, trade names, service marks andlogos referenced herein belong to their respective companies. MP341520709