Delivering for customers and shareholders in electricity ... · • RIIO-T1 capital expenditure to...
62
Transcript of Delivering for customers and shareholders in electricity ... · • RIIO-T1 capital expenditure to...


•RAV £3.4bn
•EBIT Contribution to group 22-27%*
•RAV £3.1bn
•EBIT Contribution to group 7-16%*
•RAV £1.8bn
•EBIT Contribution to group9-15%*
*range over the past 5 years
2

0
100
200
300
400
FY17 FY18
239
165
0
1
2
3
FY17 FY18
1.7 1.8
▪ 33% equity stake
▪ Contributed 9% of Group Adjusted EBIT in FY17/18
▪ At the frontier of regulatory performance
▪ New shareholder structure providing flexibility and development potential
▪ Expansion into new markets▪ Meter Asset Provider company▪ Gas to the West
* SSE share16.7% share sold October 2016
3

4


sale of stake in SGN
*SSE 33% share
0
1
2
3
4
5
6
7
FY13 FY14 FY15 FY16 FY17 FY18
Electricity Distribution
Electricity Transmission
£2.3bn RAV England
£1.1bn RAV Scotland
RAV growth of over 190% to £3.1bn since
FY13
3.0m customers
England
770k customers Scotland
Connected over 1.3GW of
renewables since 2013
Price control ending FY2023
Price control ending FY2021
Shared services and management
expertise
6

▪ Drive efficiencies through technological transformation
▪ Deliver a reduction in cost to serve
▪ Focus on customer service
▪ Lead the industry transition to a smart, flexible system
▪ Build capability for increased competition
▪ Deliver £1.1bn Caithness-Moray and future SWW projects on time and within allowances
▪ Efficient delivery of Capex programme in Transmission and Distribution
7

▪ Distribution RAV up 5% to £3.4bn
▪ Generating sustainable cash flows
▪ Stable group EBIT contribution at c. £400m
▪ Successful delivery of £869m Capex in the first three years of ED1
▪ Forecast investment of £2.4bn over the price control
2.8
3.0
3.2
3.4
3.6
3.8
4.0
0
100
200
300
400
500
600
FY13/14 FY14/15 FY15/16 FY16/17 FY17/18
RAV (RHS) EBIT
£m £bn
Beginning of new price control RIIO-ED1
8

Targeted improvements in incentives performance
Efficient delivery of capital investment
programme
Focused delivery of regulatory outputs
Maintain leadership position on innovation
9

0
5
10
15
20
25
30
35
£m
Maximum incentive
SSEN Actual
All nominal prices
10
Numbers are shown in the price base of the year in which the incentive is earned, and under the price control are inflated to the price base of the year in which they are recovered (two years later)* Stakeholder Engagement estimated at £1.15 (actual not determined until later in 2018)
FY17 FY18 FY17 FY18 FY17 FY18

£12.5mActual
incentives revenue FY1718
£43.2mPotential
incentives revenue FY1718
11
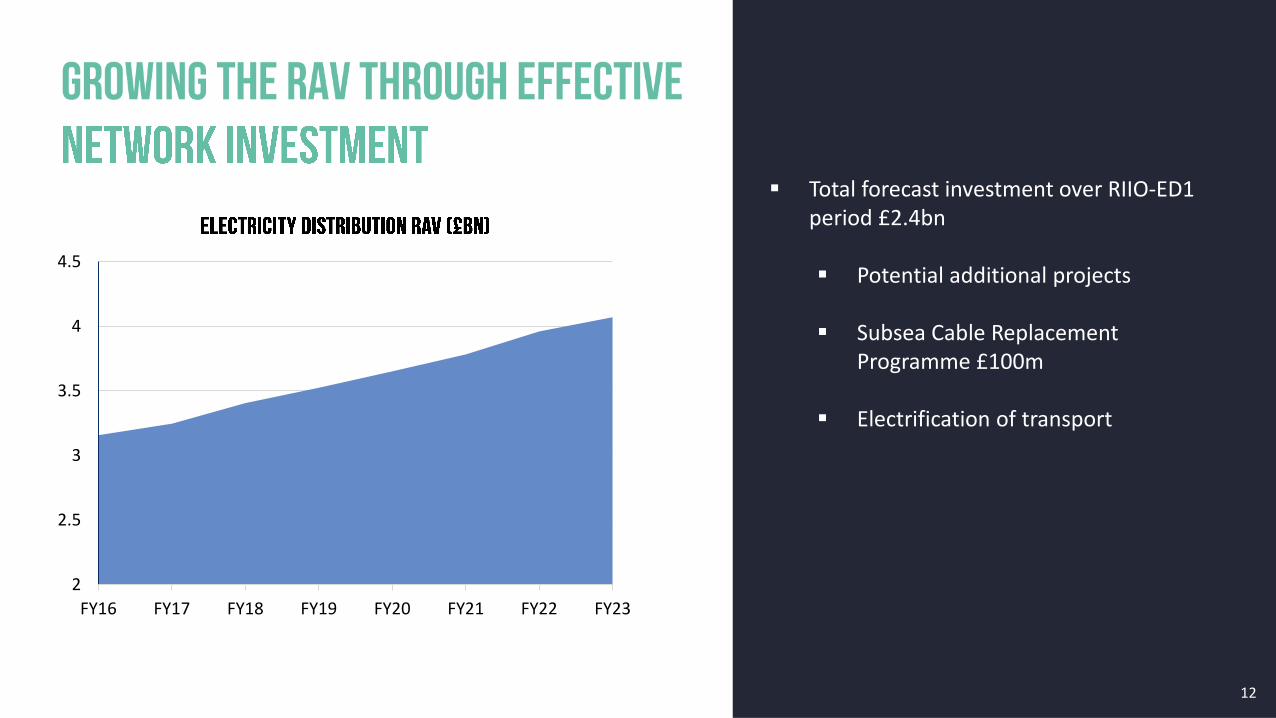
▪ Total forecast investment over RIIO-ED1 period £2.4bn
▪ Potential additional projects
▪ Subsea Cable Replacement Programme £100m
▪ Electrification of transport
2
2.5
3
3.5
4
4.5
FY16 FY17 FY18 FY19 FY20 FY21 FY22 FY23
12

13

Secured over
in innovation funding since 2010
Discretionary award of
for Low Carbon Networks Fund in 2017
14

SSE’s innovation portfolio is informing our preparations for the DSO transition:
▪ NINES – an integrated solution for managing constraints in Shetland involving ANM
▪ Constraint managed zones - first network operator to issue CMZ tender as a BAU activity
▪ Active Network Management – Orkney - first network operator to deliver ANM on a large-scale
▪ Thames Valley Vision - long-term £30m project to monitor and model demand and trial flexible solutions
▪ My Electric Avenue – leading research on the impact of electric vehicle clusters on the low voltage network
15

16

17

Targeted improvements in incentives performance
Efficient delivery of capital investment
programme
Focused delivery of regulatory outputs
Maintain leadership position on innovation
18


▪ Renewables connected to network grown from 3.7GW to over 5GW since 2013
▪ Forecast to grow to over 6GW by 2020
0.0
0.5
1.0
1.5
2.0
2.5
3.0
3.5
0
1
2
3
4
5
FY13 FY14 FY15 FY16 FY17 FY18
Transmission RAV growth
Transmission RAV (RHS) Renewables conntected to Transmission network
GW£bn
20

• RIIO-T1 capital expenditure to date over £2 billion
• Track record of delivery on time and under budget
1. Beauly Denny delivered and closed out with Ofgem
2. Kintyre Hunterston
3. Beauly-Blackhillock-Kintore
4. Beauly Mossford
5. Foyers Knockknagael
6. Fort Augustus
8. Largest project and on target for 2018 completion
7. Connection to Stronelairg Wind Farm delivered within 18 months
21*£0.35bn within the previous price control

22
▪ £1.1bn project
▪ Over £900m spent to date
▪ Remains on track for delivery in 2018
22

• £1.1bn project
• [c£900]m spent to date
• Remains on track for delivery in 2018
23
▪ £1.1bn project
▪ Over £900m spent to date
▪ Remains on track for delivery in 2018
23

24
▪ £0.9bn of planned capital investment in remaining three years of the price control to FY20/21
1. Rothienorman GSP2. Inverary to Port Ann3. Beauly to Keith
4. Loch Buidhe to Dounreay
5. Keith to Blackhillock6. Beauly to Tomatin7. Fort Augustus 400/133kv
24
▪ Visibility on contingent projects of up to £0.7bn including:
Dounreay to Gills Bay, North Argyll, Lairg to Loch Buidhie, Skye Reinforcement, East Coast upgrade

▪ In October 2017, the Government confirmed that remote island wind projects would be CfD eligible
▪ Needs case for Orkney link submitted to Ofgem March 2018
▪ Total investment opportunity of c.£1.5 billion for all three island groups
25

0
0.5
1
1.5
2
2.5
3
3.5
4
4.5
RAV Growth base case26
▪ Visibility on contingent projects of up to £0.7bn
▪ Islands opportunity of up to £1.5bn
▪ 3yr Capex pipeline to FY2021 of £0.9bn▪ Estimated RAV £3.6bn at Mar2021
▪ 5yr Capex pipeline to FY2023 of £1.2bn▪ Estimated RAV £3.8bn at Mar2023
£bn

28

0
2
4
6
8
10
12
FY14 FY15 FY16 FY17 FY18 FY19 FY20 FY21 FY22 FY23
Transmission RAV Distribution RAV SGN RAV (SSE share)
29*stylised range
£bn
£m
▪ Base case RAV growth to FY2023 forecast at c3.6% CAGR
▪ EBIT averaging around £800m out to 2023
▪ Positioning well for the future with significant options for further upside
▪ Creating value in a sustainable way
29

30


▪ Aim of this session is to leave with a better understanding of the:
- Value of SSE’s portfolio of assets and why it’s worth more than the SoTP
- Attributes of SSE’s unique portfolio of renewables
- Importance of flexible thermal generation
- Benefits of gas production and gas storage
- Significant and diverse growth opportunities for SSE


Generating 1st March 2018 - Snapshot
On and offshore wind
Hydro
Pumped storage
Thermal including gas, coal and multifuel
Gas production
Gas storage
Most remaining thermal plant available as back up

Source: Reuters, 17 November
Source: BBC, 1 March
Source: The Guardian, 11 December
Source: Reuters, 17 January
UK GAS-PRICES DOWN ON
WARM WEATHER AND
STRONG WIND FORECASTS
SNOW AND ICE DISRUPTS
TRAVEL ACROSS UK AS
THOUSANDS OF SCHOOLS
CLOSE
Source: Reuters, 21 February
Source: The Times, 13 October
BRITISH WHOLESALE PROMPT GAS PRICES
ROSE, AS COOLER WEATHER AND LOW OUTPUT
FROM THE COUNTRY'S WIND FARMS BUOYED
DEMAND
UK GAS PRICE DECLINES
DUE TO ROBUST SUPPLY


Renewable and thermal assets highly complementary:
▪ Renewable output benefits from high wind
and rain
▪ CCGTs and coal deliver value when wind penetration low
▪ Thermal flexibility offers value in a market of mass
intermittency
▪ Balancing Mechanism activity EBIT between £50-£100m
during 3 years to FY17/18

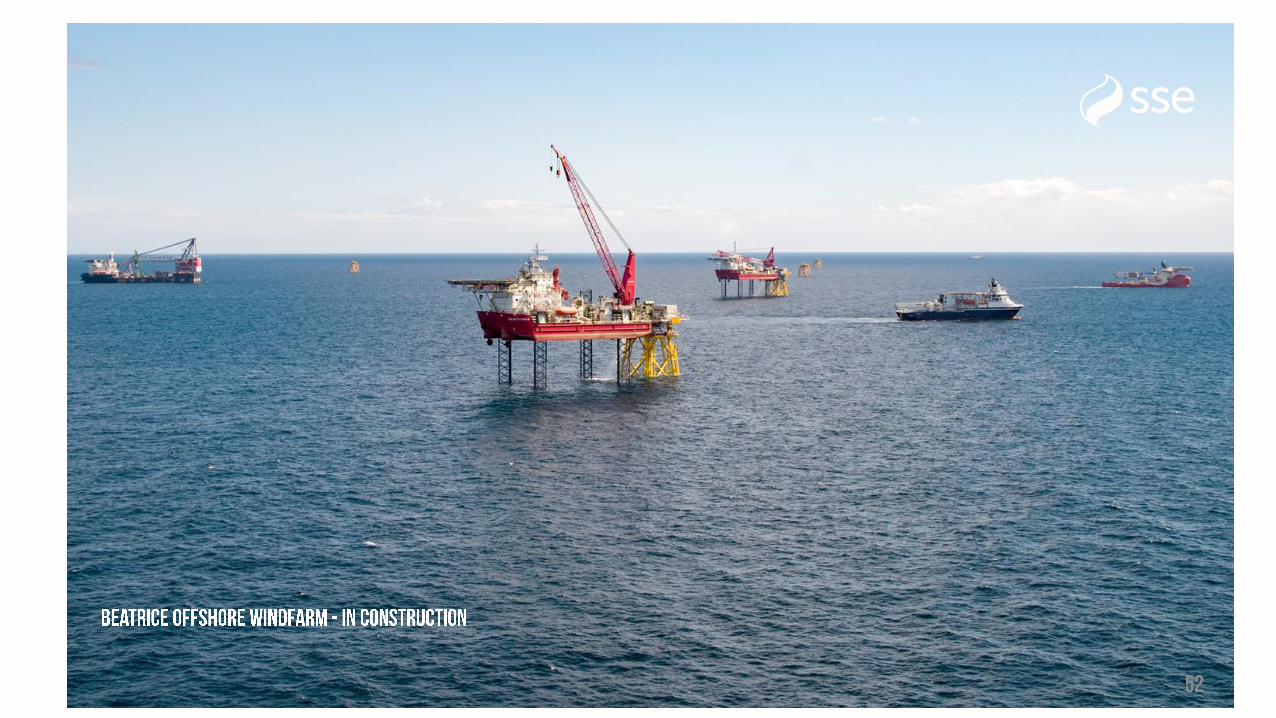
In Construction

▪ Renewable engineering capability
▪ Strategic siting of assets into operational hubs reduces costs
▪ Size, scale and experience provide competitive edge
▪ Proven longevity of trading expertise GB NI ROI GB in construction
SSE’s onshore wind capacity
output inc. constrained off volumesFY18 inc. £24m gain on sale of Clyde2020 prices based £45/MWh power and £50/MWh ROC

▪ Geographic diversity around UK increases wind capture
potential
▪ Continuous improvement to improve availability and
reliability
▪ Commercial partnerships provide shared learnings
▪ Partnership experience useful in future bids
SSE’s offshore wind capacity
GB GB in construction
output inc. constrained off volumes 2020 prices based £45/Mwh power and £50/MWh ROC

Run of river Flexible hydro Pumped storage
▪ Hydro flexibility delivers value
▪ Operational expertise
▪ Long term investment strategy
▪ Responding to changing market conditions
SSE’s hydro capacity
2020 prices based £45/MWh power and £50/MWh ROC

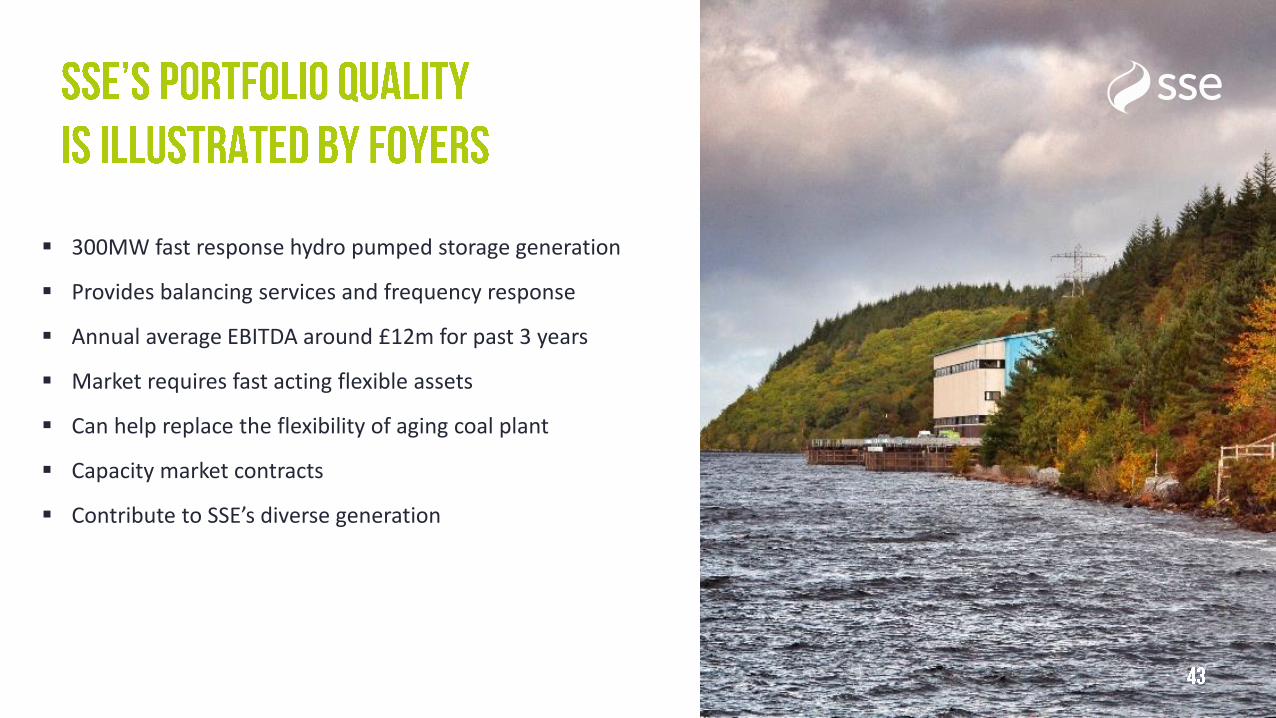
▪ 300MW fast response hydro pumped storage generation
▪ Provides balancing services and frequency response
▪ Annual average EBITDA around £12m for past 3 years
▪ Market requires fast acting flexible assets
▪ Can help replace the flexibility of aging coal plant
▪ Capacity market contracts
▪ Contribute to SSE’s diverse generation

▪ ~12 TWh output per annum
▪ Based on £45/MWh power and £50/MWh ROC price
▪ Focus on returns
▪ Helps deliver a lower carbon economy


47
▪ Shifting merit order▪ Increased load factors on SSE’s CCGTs reflect this

▪ Produced c1.6mth/day gas & liquids in 2017/18
▪ Produce enough gas from assets to supply:- SSE’s Business Energy customers - SSE Airtricity household customers
▪ 2017/18 EBITDA of £153m

▪ Separate business with returns driven by seasonal spreads and volatility
▪ SSE holds ~40% of UK’s conventional gas storage with good recycling capability
▪ UK conventional storage duration curve shrunk to ~ 16 days,
▪ Expect this to be further exacerbated by future coal closures
▪ Gas storage will play important role in safeguarding UK’s gas and electricity security of supply
▪ SSE’s assets well-placed to provide this service

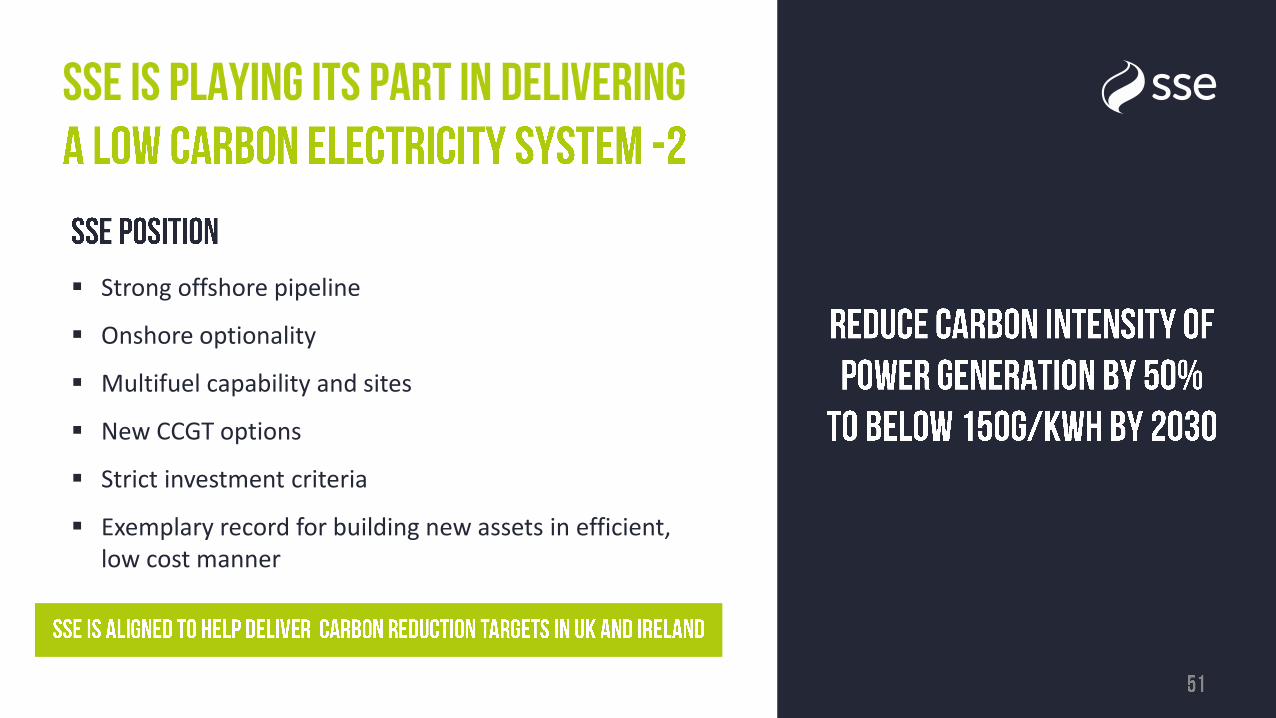
▪ Strong offshore pipeline
▪ Onshore optionality
▪ Multifuel capability and sites
▪ New CCGT options
▪ Strict investment criteria
▪ Exemplary record for building new assets in efficient, low cost manner

▪ Offshore wind space highly competitive
▪ Economics continuously evolving
▪ SSE’s options include:- Arklow Bank – up to 520MW - fully owned- Seagreen – up to 1.1GW - 50% JV- Doggerbank - up to 3.6GW - 50% JV
▪ Political ambition for new offshore wind
▪ SSE will retain financial discipline

▪ Delivered 7 projects - 586MW - in last 16 months
▪ Stronelairg 228MW in construction
▪ 12 years experience of developing, owning & operating onshore wind
▪ ~ 800MW pipeline of potential new development
▪ Portfolio can be monetised
▪ Asset management credentials attractive to prospective partners
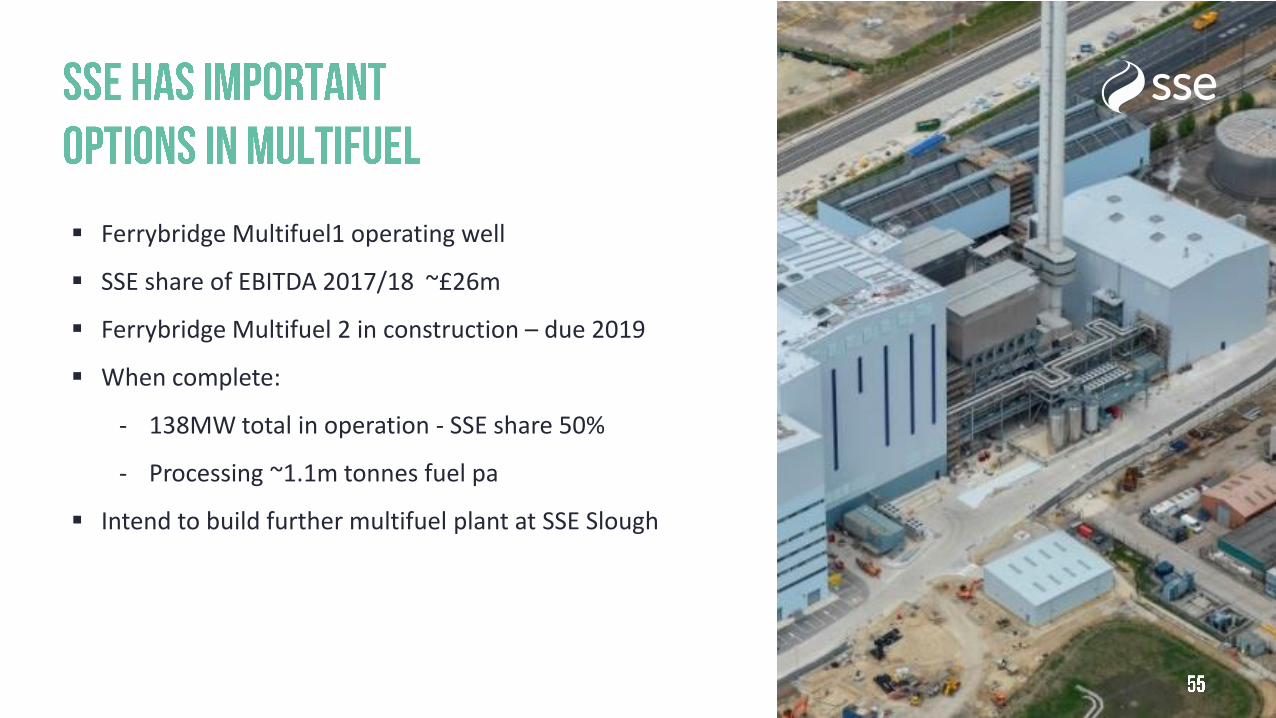
▪ Ferrybridge Multifuel1 operating well
▪ SSE share of EBITDA 2017/18 ~£26m
▪ Ferrybridge Multifuel 2 in construction – due 2019
▪ When complete:
- 138MW total in operation - SSE share 50%
- Processing ~1.1m tonnes fuel pa
▪ Intend to build further multifuel plant at SSE Slough

▪ Coal closure and nuclear uncertainty
▪ UK requires some new CCGT volumes by mid-2020s
▪ SSE proceeding with construction of Keadby 2 with Ferrybridge D CCGT in development
▪ Optionality at Ferrybridge and Fiddler’s Ferry sites
▪ Financial discipline paramount

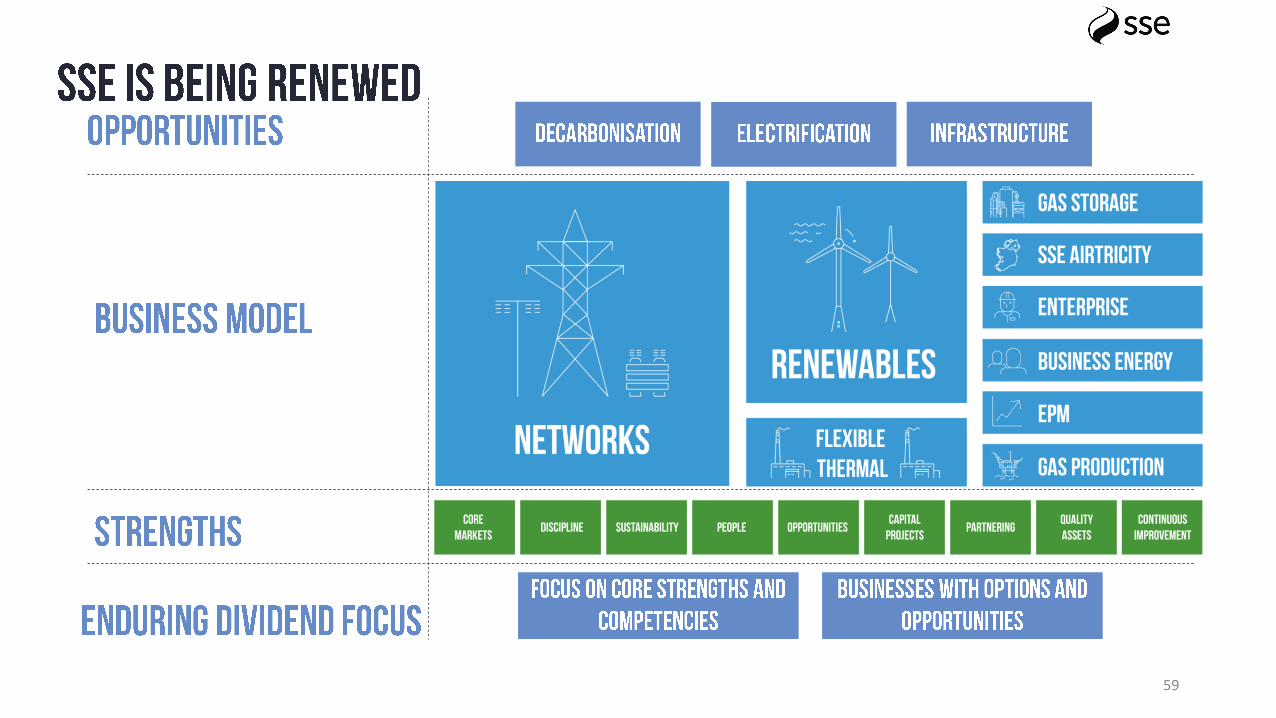
▪ Afternoon has set out:
- Value of SSE’s portfolio of assets and why it’s worth more than the SoTP
- Attributes of SSE’s unique portfolio of renewables
- Importance of flexible thermal generation
- Benefits of gas production and storage
- Significant and diverse growth opportunities for SSE

59

▪ FY20 – 4.3GW capacity and 12TWh electricity
▪ FY20 – £45/MWh electricity price and £50/MWh ROC price equals EBITDA of c£800m
▪ Invest c£2.8bn in next 5 years in electricity networks
▪ EBIT contribution to average over £800m pa

*Intend to recommend

This financial report contains forward-looking statements about financial and operational matters. Because they relate to future events and are subject to future circumstances, these forward-looking statements are subject to risks, uncertainties and other factors. As a result, actual financial results, operational performance and other future developments could differ materially from those envisaged by the forward-looking statements.SSE plc gives no express or implied warranty as to the impartiality, accuracy, completeness or correctness of the information, opinions or statements expressed herein. Neither SSE plc nor its affiliates assume liability of any kind for any damage or loss arising from any use of this document or its contents.This document does not constitute an offer or invitation to underwrite, subscribe for, or otherwise acquire or dispose of any SSE shares or other securities and the information contained herein cannot be relied upon as a guide to future performance.DefinitionsThese financial results for the twelve months to 31 March 2018 are reported under IFRS, as adopted by the EU.In order to present the financial results and performance of the Group in a consistent and meaningful way, SSE applies a number of adjusted accounting measures throughout this financial report. These adjusted measures are used for internal management reporting purposes and are believed to present the underlying performance of the Group in the most useful manner for ordinary shareholders and other stakeholders.The definitions SSE uses for adjusted measures are consistently applied and are explained in the Alternative Performance Measures section of the Preliminary Results Statement, before the Condensed Interim Statements.In preparing this financial report SSE has been mindful of the commentary issued in May 2016 by the Financial Reporting Council on the European Securities and Markets Authority’s Guidelines on Alternative Performance Measures. SSE will monitor developing practice in the use of Alternative Performance Measures and will continue to prioritise this, ensuring the financial information in its results statements is clear, consistent and relevant to the users of those statements.
62