DELIVERED VIA EMAIL - US EPA VIA EMAIL ... The Association is requesting your approval of the plan...
24
DELIVERED VIA EMAIL May 4, 2012 Mr. Bryon Bunker Environmental Protection Agency Acting Director, Compliance and Innovative Strategies Division 1200 Pennsylvania Avenue, NW Washington, D.C. 20460 Dear Mr. Bunker: The RFG Survey Association, Inc. (RFGSA) is a not-for-profit Association of refiners, importers and blenders of reformulated gasoline (RFG) and reformulated gasoline blendstock for oxygenate blending (RBOB). The Association is requesting your approval of the RFGSA’s 2012 E15 Compliance Survey Program. The Association working closely with the Agency, obligated parties and their representatives has developed a nationwide retail E15 sampling and testing program to meet the E15 partial fuel wavier condition and the regulatory requirements found in 40 C.F.R. § 80.1502. On behalf of it’s participating companies the Association is hereby submitting the 2012 E15 Compliance Survey Program as required in the partial fuel wavier and 40 C.F.R. § 80.1502. The proposed 2012 survey design includes a comprehensive survey program designed to achieve the objectives established in the regulations and the retail survey requirement under the partial fuel wavier conditions. Attached please find the 2012 E15 Compliance Survey Design Plan (Attachment 1) and a listing of participating companies registered to participate in the survey as of April 20, 2012 (Attachment 2). The RFGSA will be provide EPA with regular updates (currently monthly) of Attachment 2 and each registrant’s contact/program information. The Association is requesting your approval of the plan to facilitate its implementation ASAP. If you have any questions, please do not hesitate to call me. Sincerely, Cc: Robert Anderson – EPA Jeff Kodish – EPA S. Deviney – SWRI Attachments (2) 2012E15_SD
Transcript of DELIVERED VIA EMAIL - US EPA VIA EMAIL ... The Association is requesting your approval of the plan...
DELIVERED VIA EMAIL May 4, 2012 Mr. Bryon Bunker Environmental Protection Agency Acting Director, Compliance and Innovative Strategies Division 1200 Pennsylvania Avenue, NW Washington, D.C. 20460 Dear Mr. Bunker: The RFG Survey Association, Inc. (RFGSA) is a not-for-profit Association of refiners, importers and blenders of reformulated gasoline (RFG) and reformulated gasoline blendstock for oxygenate blending (RBOB). The Association is requesting your approval of the RFGSA’s 2012 E15 Compliance Survey Program. The Association working closely with the Agency, obligated parties and their representatives has developed a nationwide retail E15 sampling and testing program to meet the E15 partial fuel wavier condition and the regulatory requirements found in 40 C.F.R. § 80.1502. On behalf of it’s participating companies the Association is hereby submitting the 2012 E15 Compliance Survey Program as required in the partial fuel wavier and 40 C.F.R. § 80.1502. The proposed 2012 survey design includes a comprehensive survey program designed to achieve the objectives established in the regulations and the retail survey requirement under the partial fuel wavier conditions. Attached please find the 2012 E15 Compliance Survey Design Plan (Attachment 1) and a listing of participating companies registered to participate in the survey as of April 20, 2012 (Attachment 2). The RFGSA will be provide EPA with regular updates (currently monthly) of Attachment 2 and each registrant’s contact/program information. The Association is requesting your approval of the plan to facilitate its implementation ASAP. If you have any questions, please do not hesitate to call me. Sincerely,
Cc: Robert Anderson – EPA Jeff Kodish – EPA S. Deviney – SWRI Attachments (2) 2012E15_SD
E15 Compliance Survey Plan
Proposal
May 4, 2012
Prepared for:
RFG Survey Association 11350 Random Hills Road
Suite 800 Fairfax, VA 22030
Prepared by:
Ipsos Synovate 7600 Leesburg Pike, East Building
Suite 110 Falls Church, VA 22043
May 4, 2012 Ipsos Synovate Page 0
Study Plan for an E15 Survey Program Goals ...................................................................................................................................... 1
The Plan ................................................................................................................................. 2 Overview of Sampling Plan ............................................................................................................... 2 Number of Surveys ........................................................................................................................... 5 Stratification and Sampling Plan within Strata .................................................................................. 5
Densely Populated Areas (DPAs) ......................................................................................................... 5 Transportation Corridor Areas ............................................................................................................ 7 Remaining Survey Areas ...................................................................................................................... 8
Sample Sizes ..................................................................................................................................... 9 Sample Size Calculation ....................................................................................................................... 9
Handling Newly Registered Stations ............................................................................................... 11 Field Protocol for Selection of Specimens at the Station ................................................................. 11
Site Blender Sampling ........................................................................................................................ 12 Samples Collection and Testing ...................................................................................................... 14
Reporting .............................................................................................................................. 15
Sensitivity of E15 Survey Program ......................................................................................... 15 Detecting Proper/ Low Ethanol Value Fuel within a Stratum ........................................................... 15 Detecting Compliance with Signage Requirements ......................................................................... 16 Sensitivity of the Sampling Programs for RVP Testing ..................................................................... 17
Appendix 1: ........................................................................................................................... 19
Appendix 2: ........................................................................................................................... 20
May 4, 2012 Ipsos Synovate Page 1
Study Plan for an E15 Survey Program Goals
E15 may be lawfully sold only after the manufacturer has registered E15 and met the conditions of the partial waivers. The conditions of the partial wavier include: E15 pump labeling, tracking of E15 through the supply chain through product transfer documentation, and the implementation of retail survey program to monitor E15 content and labeling compliance. Collectively, these required items are to be documented/addressed in a “Misfueling Mitigation Plan” submitted to EPA for approval by each obligated party under the regulations.
The E15 retail survey requirement is described in 40 CFR Part 80 §1502, there are two options under which parties involved in making, distributing and selling E15 can conduct ongoing surveys to monitor compliance with the composition and signage for E15. The two options are:
Survey Option 1 – This option allows an individual, group of gasoline and ethanol producers, importers or oxygenate blenders to conduct local or regional surveys to their level of distribution. Survey Option 2 – This option allows responsible parties to conduct a nationwide survey to reflect when producers decide to sell product in more parts of the country.
The EPA provided these options to allow flexibility in the survey program to match the anticipated gradual introduction of E15. The current survey program adopts the second option for a national survey plan. For 2012, the sampling for the E15 program under these options, have these goals:
• Provide a framework for representative samples of retail fuel outlets in the United States with emphasis on retail stations registered/identified as Site Blenders1. Site Blenders are one of the obligated parties (refiners/importer, ethanol producers, blenders and site blenders) required to participate/fund the E15 retail survey to sell E15.
• Provide a representative sampling of retail fuel outlets. • Statistical power designed to detect % outside the parameters for E15 and
signage compliance. • Provide a sample of non-E15 fuel that verifies the ethanol concentration of non-
E15 fuel. This will determine that E15 fuel has not been mis-fueled in the non-E15 fuel supply.
1 A site blender is a retail location with blender pumps capable of blending multiple grades of gasoline blendstock with various ethanol concentrations (E10, E15..E85) or alternatively a site blender could also be a retail location where splash blending occurs (tank blending of gasoline and additional ethanol) to create a final Ethanol blended fuel (i.e. E15).
May 4, 2012 Ipsos Synovate Page 2
• Monitor compliance with applicable RVP standards during the high ozone season for E15
The Plan Overview of Sampling Plan The Industry has requested to commence the E15 retail-sampling program, on a nationwide basis beginning in May 2012. Although the survey will provide nationwide E15 sampling coverage, it is likely that E15 will emerge in small geographic areas. Initially the survey will monitor these areas closely to evaluate the E15 product emergence into commerce. The E15 Survey program has identified these small geographic areas where E15 is likely to enter into commerce. The distribution of the product will most likely be confined to small areas through individual site blender pumps (site blenders). Initially the number of site blenders offering E15 will be very small. The survey will require the registration of these site blenders prior to E15 entering into commerce.2 The E15 Survey program will use this requirement to assist in the sample design. The sample design will follow this logic. First the nation will be divided into three sampling strata. The strata are referred to as Densely Populated Survey Areas, Transportation Corridor Survey Areas and Remaining Survey Areas. Each of these sampling strata is further divided into smaller sampling areas or clusters. Each survey period a sample of clusters are selected at random and then retail outlets are selected at random within a cluster. The full sample design flows these steps:
1) Strata definitions – The three strata are the Densely Populated Survey Areas (DPA), Transportation Corridor Survey Areas (TCA) and Remaining Survey Areas (RSA). They are:
a. DPA – The Densely Populated Survey Areas are the clusters with known site blenders.
b. TCA – The Transportation Corridor Survey Areas are based on the Interstate Highways outside of the major urban areas. The corridor consists of the Interstate and a two-mile swath on each side of the highway.
c. RSA – All remaining clusters are assigned to the Remaining Survey Area stratum.
2) Cluster definitions – There are two cluster definitions to be used. a. DPA and RSA strata cluster definitions – Groupings of contiguous
counties were constructed such that travel from one end of the grouping to other could be made in a half day. The groupings were further divided by 3-digit ZIP Codes within the groupings. All counties and 3-digit ZIP Codes
2 For purposes of this survey plan, registration refers to an act by a responsible party, as define in 40 CFR 80.1502, signing on to participate in the E15 Compliance Survey program. This does not refer to the separate action of registering a fuel or fuel additive under 40 CFR Part 79.
May 4, 2012 Ipsos Synovate Page 3
within the 50 United States, the District of Columbia, Puerto Rico and the U.S. Virgin Islands accounted for.
b. TCA strata – TCA clusters were identified by 150 mile or less segments along the Interstate Highway System.
3) Assigning clusters to the DPA stratum a. Addresses of known individual site blenders are used to identify clusters
with at least one site blender. b. Clusters with a site blender are assigned to the DPA substrata. If new site
blenders are identified, these will be added to the respective DPA. By design, these clusters include all of the United States including the continental United States, Alaska, Hawaii, the District of Columbia, Puerto Rico and the U.S. Virgin Islands.
4) Stations will be selected using a two-stage process. First, a cluster will be selected, and then stations will be selected within a cluster. The process is slightly different for the DPA, TCA and RSA strata. The main differences in the sampling process are described here and elaborated on in the sampling plan section
a. DPA – The DPA stratum will be subdivided into 9 substrata based on states. A random sample of clusters will be selected each quarter. The stratification ensures a large geographic dispersion in the sample. The sampling plan will accomplish the following goals – every registered site blended will be selected each quarter, every non-registered site blender will be selected with certainty at least once per year, and the total number of samples to be collected will be capped at 817 each quarter, To ensure that each site blender is selected at least once during a calendar year, each site blender will be assigned at random to a quarter of the year. In that quarter, the clusters with the assigned site blender will be selected with certainty as will that station. At least 100 clusters will be selected each quarter. A site blender location will be selected within each cluster, and a random sample of 6 additional stations will be selected without replacement from that cluster at random based on the RFGSA database of stations. The cluster defines the surrounding area for each site blender, and it assures a random and representative sample of the site blenders neighboring stations. The number of additional stations will be adjusted to limit the number of expected samples to be selected from the stations to 817 per quarter. Three different scenarios can occur within each cluster, and the sampling plan for the site blender and 5 other stations within a cluster will use the following priority:
i. Registered site blender known to be selling E15 fuel – Within a cluster, a registered site blender that is known to be selling E15 will be selected with certainty. (As of 5/01/12 – there are 3 registered site blender locations IA(1), WI(2). If there is more than one site blender in this category, one will selected at random, and the others

May 4, 2012 Ipsos Synovate Page 4
will be placed back into the sample pool for the remaining selections. Six additional stations will be selected per cluster.
ii. Registered Site blender that may not be selling E15 fuel (i.e. due to market conditions or in advance preparation to sell E15) – A registered site blender without definite knowledge of selling E15 will be selected with certainty. If there is more than one site blender in this category, one will selected at random, and the others will be placed back into the sample pool for the remaining selections. Additional stations will be selected per cluster to have at least 7 selections per cluster
iii. No registered site blender – In cluster without a registered site blender, six stations will be selected at random. Each cluster should have at least one site blender, but sometimes stations close permanently or temporarily before the sampling plan will undergo a quarterly update. If additional site blenders are identified during field sampling process the database will be updated and sampling will occur based on protocols stated above.
b. TCA – The TCA stratum will be subdivided into 3 substrata based on the number of stations within the cluster. The stratification used is an equal aggregate size strata method. The clusters are ordered by size. An equal number of clusters will be selected within each substrata. Approximately 135 clusters will be selected with about 45 clusters per substrata. Six stations at random will be selected per cluster from the RFGSA database of fuel stations.
c. RSA – The RSA stratum will be subdivided into 3 substrata on the number of square miles per station within the cluster. This station density will be using in equal aggregate size strata method. An equal number of clusters per substrata will be selected. Approximately 150 clusters with 50 per substrata will be selected. Eight stations will be selected at random within each cluster from the RFGSA database of fuel stations.
d. Late registration of Site Blenders – The registration of site blenders will be ongoing, and it is expected that site blenders will be registered after the quarterly update and sample selection and prior to the field execution of the E15 sample. Each quarter will reserve up to 4% of the sample (100 samples) to visit the site blenders not identified and in the quarterly update. These unused samples (in cases where late registrations do not occur) will be available for use in subsequent sampling quarters.
Based on these definitions, the country is divided among the three strata. The next table provides the division of outlets, population, geography and the defined clusters between the strata.
Strata Size
Strata Number of Clusters
2008 Population
Total Outlets
Square Miles
Densely Populated Areas 244 13,703,420 7,732 324,530 Transportation Corridor Areas 275 -- 22,284 --

May 4, 2012 Ipsos Synovate Page 5
Remaining Survey Areas 2,433 295,595,845 115,226 2,957,9063 The E15 Survey program uses a proprietary national database of fuel outlets developed and maintained by New Image Marketing. The database is constructed using fleet and consumer credit card data, findings from commissioned market surveys, member and participant company data and Internet searches. The database is updated on an ongoing basis along with periodic complete reviews of the database. The last complete review was completed in September 2010. Number of Surveys There will be 4 quarterly surveys each calendar year. For 2012, there will be 3 quarterly surveys. The first survey will cover May 1, 2012 through June 30, 2012; the second survey will cover July 1, 2012 through September 30, 2012; and the third quarterly survey will cover October 1, 2012 through December 31, 2012. Retail outlets will be selected at random for each survey series. At least one specimen will be selected from each outlet with as many as three based on the variety of product offered. This process is described in the Field Protocol section. Stratification and Sampling Plan within Strata The sampling areas are subdivided into smaller primary sampling units. The E15 primary sampling units consist of the clusters described previously. Clusters within a stratum are selected probabilistically. The sampling plan for cluster differs by stratum.
Densely Populated Areas (DPAs)
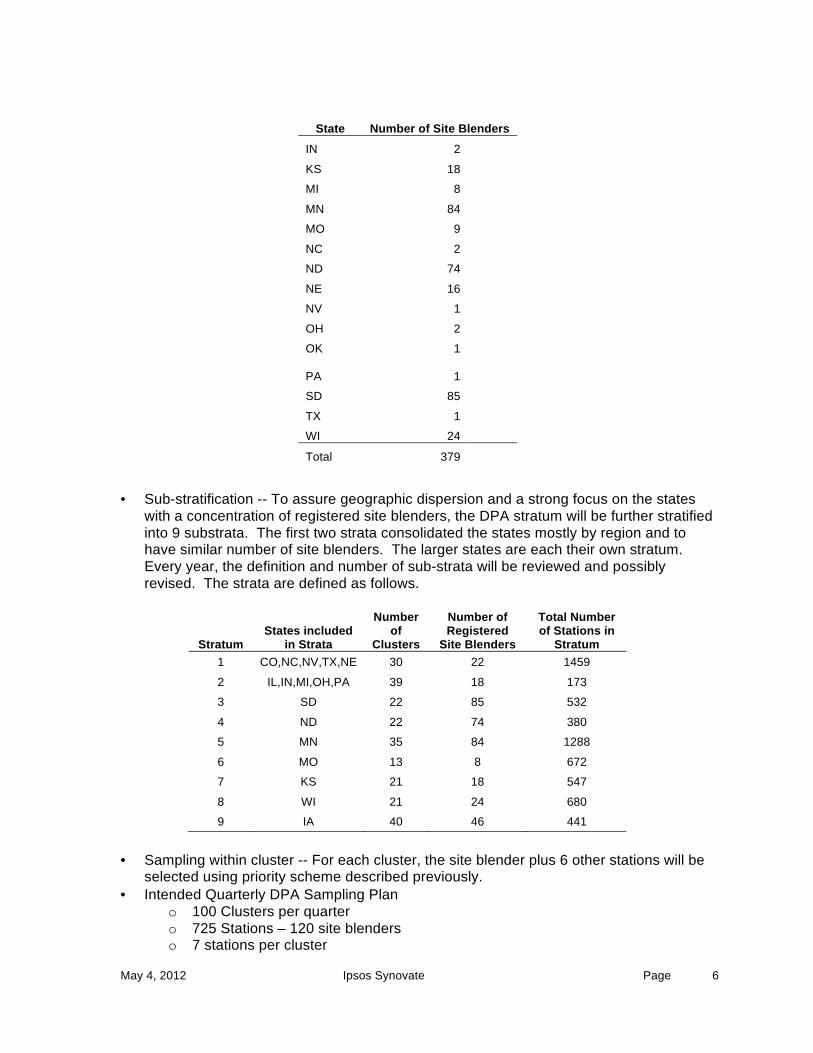
The DPA stratum consists of all clusters with a registered site blender. As of April 10, 2012, there are 379 site blender locations in the database for the E15 program. Only a limited number of the locations in database have indicated plans to begin selling E15 fuel during the first quarterly survey period (May 1-June 30, 2012). Site blenders are required to participate/register for the (a) survey prior to introducing E15 into commerce. The main statistics are:
• 379 separate retail entities • 224 Clusters • 17 states – The following table
State Number of Site Blenders
CO 1
IA 46
IL 4
3 Does not include Puerto Rico
May 4, 2012 Ipsos Synovate Page 6
State Number of Site Blenders IN 2
KS 18
MI 8
MN 84
MO 9
NC 2
ND 74
NE 16
NV 1
OH 2
OK 1
PA 1
SD 85
TX 1
WI 24
Total 379
• Sub-stratification -- To assure geographic dispersion and a strong focus on the states
with a concentration of registered site blenders, the DPA stratum will be further stratified into 9 substrata. The first two strata consolidated the states mostly by region and to have similar number of site blenders. The larger states are each their own stratum. Every year, the definition and number of sub-strata will be reviewed and possibly revised. The strata are defined as follows.
Stratum States included
in Strata
Number of
Clusters
Number of Registered
Site Blenders
Total Number of Stations in
Stratum 1 CO,NC,NV,TX,NE 30 22 1459
2 IL,IN,MI,OH,PA 39 18 173
3 SD 22 85 532
4 ND 22 74 380
5 MN 35 84 1288
6 MO 13 8 672
7 KS 21 18 547
8 WI 21 24 680
9 IA 40 46 441
• Sampling within cluster -- For each cluster, the site blender plus 6 other stations will be
selected using priority scheme described previously. • Intended Quarterly DPA Sampling Plan
o 100 Clusters per quarter o 725 Stations – 120 site blenders o 7 stations per cluster
May 4, 2012 Ipsos Synovate Page 7
o Approximately 817 samples per quarter. o 1.5 samples per Site Blender station.
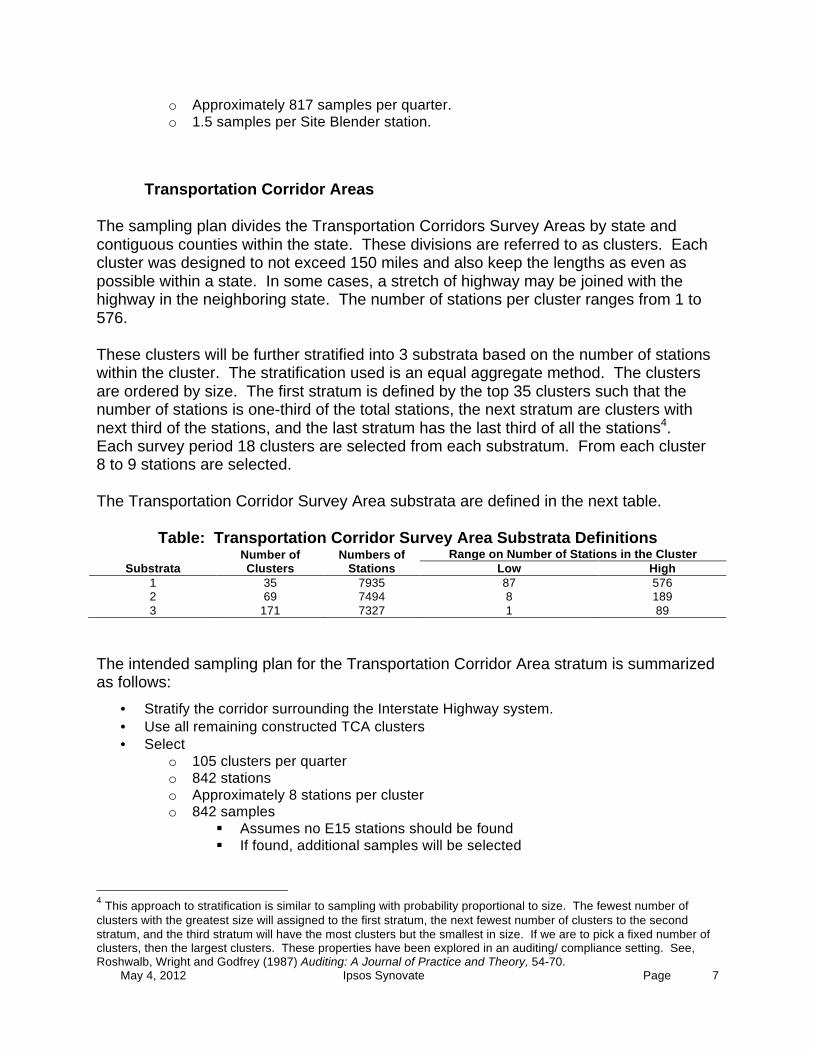
Transportation Corridor Areas The sampling plan divides the Transportation Corridors Survey Areas by state and contiguous counties within the state. These divisions are referred to as clusters. Each cluster was designed to not exceed 150 miles and also keep the lengths as even as possible within a state. In some cases, a stretch of highway may be joined with the highway in the neighboring state. The number of stations per cluster ranges from 1 to 576. These clusters will be further stratified into 3 substrata based on the number of stations within the cluster. The stratification used is an equal aggregate method. The clusters are ordered by size. The first stratum is defined by the top 35 clusters such that the number of stations is one-third of the total stations, the next stratum are clusters with next third of the stations, and the last stratum has the last third of all the stations4. Each survey period 18 clusters are selected from each substratum. From each cluster 8 to 9 stations are selected. The Transportation Corridor Survey Area substrata are defined in the next table.
Table: Transportation Corridor Survey Area Substrata Definitions
Substrata Number of Clusters
Numbers of Stations
Range on Number of Stations in the Cluster Low High
1 35 7935 87 576 2 69 7494 8 189 3 171 7327 1 89
The intended sampling plan for the Transportation Corridor Area stratum is summarized as follows:
• Stratify the corridor surrounding the Interstate Highway system. • Use all remaining constructed TCA clusters • Select
o 105 clusters per quarter o 842 stations o Approximately 8 stations per cluster o 842 samples
§ Assumes no E15 stations should be found § If found, additional samples will be selected
4 This approach to stratification is similar to sampling with probability proportional to size. The fewest number of clusters with the greatest size will assigned to the first stratum, the next fewest number of clusters to the second stratum, and the third stratum will have the most clusters but the smallest in size. If we are to pick a fixed number of clusters, then the largest clusters. These properties have been explored in an auditing/ compliance setting. See, Roshwalb, Wright and Godfrey (1987) Auditing: A Journal of Practice and Theory, 54-70.
May 4, 2012 Ipsos Synovate Page 8
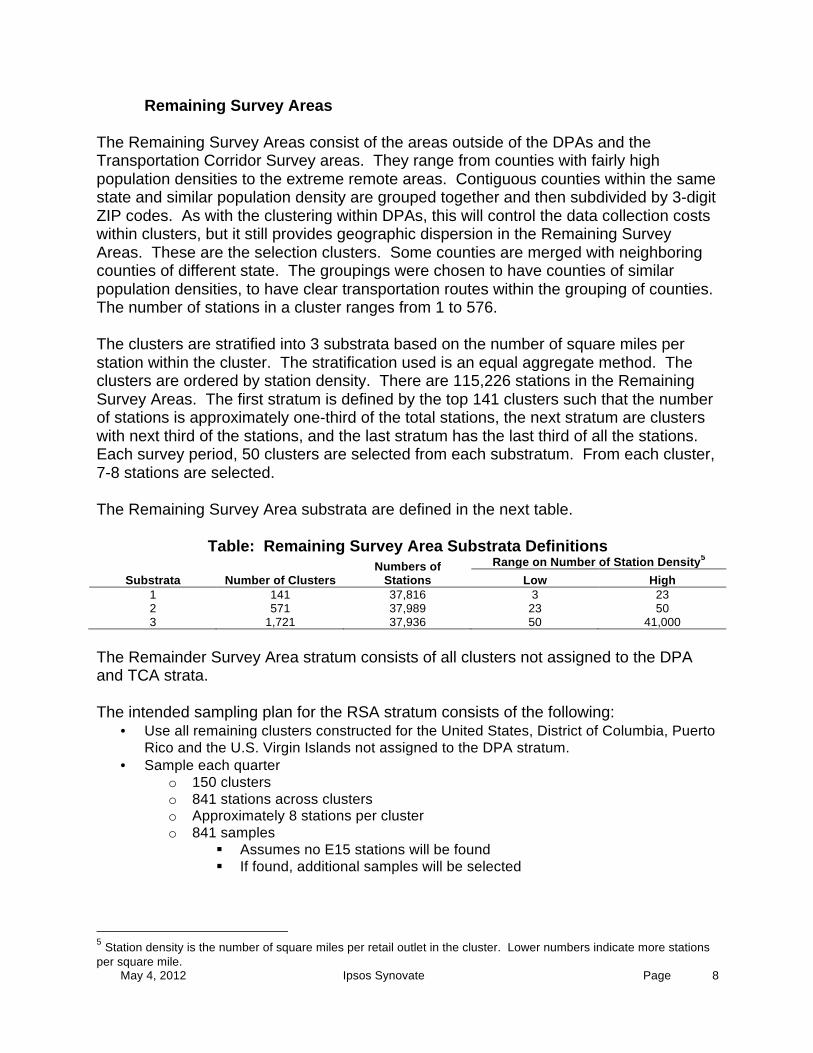
Remaining Survey Areas The Remaining Survey Areas consist of the areas outside of the DPAs and the Transportation Corridor Survey areas. They range from counties with fairly high population densities to the extreme remote areas. Contiguous counties within the same state and similar population density are grouped together and then subdivided by 3-digit ZIP codes. As with the clustering within DPAs, this will control the data collection costs within clusters, but it still provides geographic dispersion in the Remaining Survey Areas. These are the selection clusters. Some counties are merged with neighboring counties of different state. The groupings were chosen to have counties of similar population densities, to have clear transportation routes within the grouping of counties. The number of stations in a cluster ranges from 1 to 576. The clusters are stratified into 3 substrata based on the number of square miles per station within the cluster. The stratification used is an equal aggregate method. The clusters are ordered by station density. There are 115,226 stations in the Remaining Survey Areas. The first stratum is defined by the top 141 clusters such that the number of stations is approximately one-third of the total stations, the next stratum are clusters with next third of the stations, and the last stratum has the last third of all the stations. Each survey period, 50 clusters are selected from each substratum. From each cluster, 7-8 stations are selected. The Remaining Survey Area substrata are defined in the next table.
Table: Remaining Survey Area Substrata Definitions
Substrata Number of Clusters Numbers of
Stations Range on Number of Station Density5
Low High 1 141 37,816 3 23 2 571 37,989 23 50 3 1,721 37,936 50 41,000
The Remainder Survey Area stratum consists of all clusters not assigned to the DPA and TCA strata. The intended sampling plan for the RSA stratum consists of the following:
• Use all remaining clusters constructed for the United States, District of Columbia, Puerto Rico and the U.S. Virgin Islands not assigned to the DPA stratum.
• Sample each quarter o 150 clusters o 841 stations across clusters o Approximately 8 stations per cluster o 841 samples
§ Assumes no E15 stations will be found § If found, additional samples will be selected
5 Station density is the number of square miles per retail outlet in the cluster. Lower numbers indicate more stations per square mile.
May 4, 2012 Ipsos Synovate Page 9
Sample Sizes Sample size in a compliance program is based on needed precision of estimates and desired power of statistical tests to accomplish the program’s goals. The study’s sampling plan sample size will have three components:
Ø Base sample – Stations selected to meet program goals Ø Non-compliance sample – Stations found to be non-compliant in last month’s
testing Ø Unavailability sample – Additional stations included to account for stations found
to be unavailable due to temporary or permanent closures.
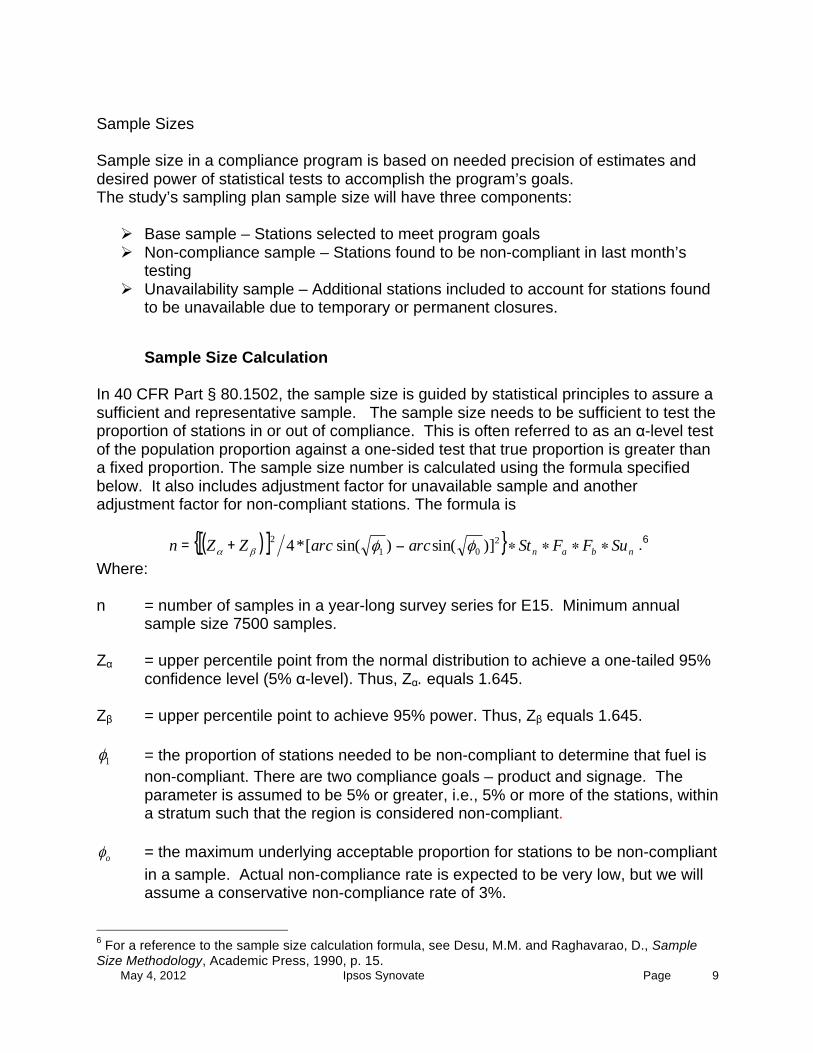
Sample Size Calculation In 40 CFR Part § 80.1502, the sample size is guided by statistical principles to assure a sufficient and representative sample. The sample size needs to be sufficient to test the proportion of stations in or out of compliance. This is often referred to as an α-level test of the population proportion against a one-sided test that true proportion is greater than a fixed proportion. The sample size number is calculated using the formula specified below. It also includes adjustment factor for unavailable sample and another adjustment factor for non-compliant stations. The formula is
( )[ ] }{ nban SuFFStarcarcZZn ∗∗∗∗−+= 201
2 )]sin()sin([*4 φφβα .6 Where: n = number of samples in a year-long survey series for E15. Minimum annual
sample size 7500 samples. Zα = upper percentile point from the normal distribution to achieve a one-tailed 95%
confidence level (5% α-level). Thus, Zα. equals 1.645. Zβ = upper percentile point to achieve 95% power. Thus, Zβ equals 1.645.
1φ = the proportion of stations needed to be non-compliant to determine that fuel is non-compliant. There are two compliance goals – product and signage. The parameter is assumed to be 5% or greater, i.e., 5% or more of the stations, within a stratum such that the region is considered non-compliant.
oφ = the maximum underlying acceptable proportion for stations to be non-compliant
in a sample. Actual non-compliance rate is expected to be very low, but we will assume a conservative non-compliance rate of 3%.
6 For a reference to the sample size calculation formula, see Desu, M.M. and Raghavarao, D., Sample Size Methodology, Academic Press, 1990, p. 15.
May 4, 2012 Ipsos Synovate Page 10
Stn = number of sampling strata. For a national study, the number of strata is 3. Fa = adjustment factor for the number of extra samples required to compensate for
collected samples that cannot be included in the survey (oversampling), based on the rate of oversampling required during the previous four surveys. For the initial year, the E15 Survey Program will use 1.15. This number will be reviewed annually and recalculated based on the number of locations visited and the number able to collect samples. This value will never be below 1.1.
Fb = adjustment factor for the number of samples required to resample each retail
stations with test results indicating noncompliance. This will be based on the historical rate of resampling. In no case shall the value of Fb be smaller than 1.1. The E15 Survey Program will use 1.15 in the first year.
SUn = number of surveys per year. For purposes of this survey program, SUn equals
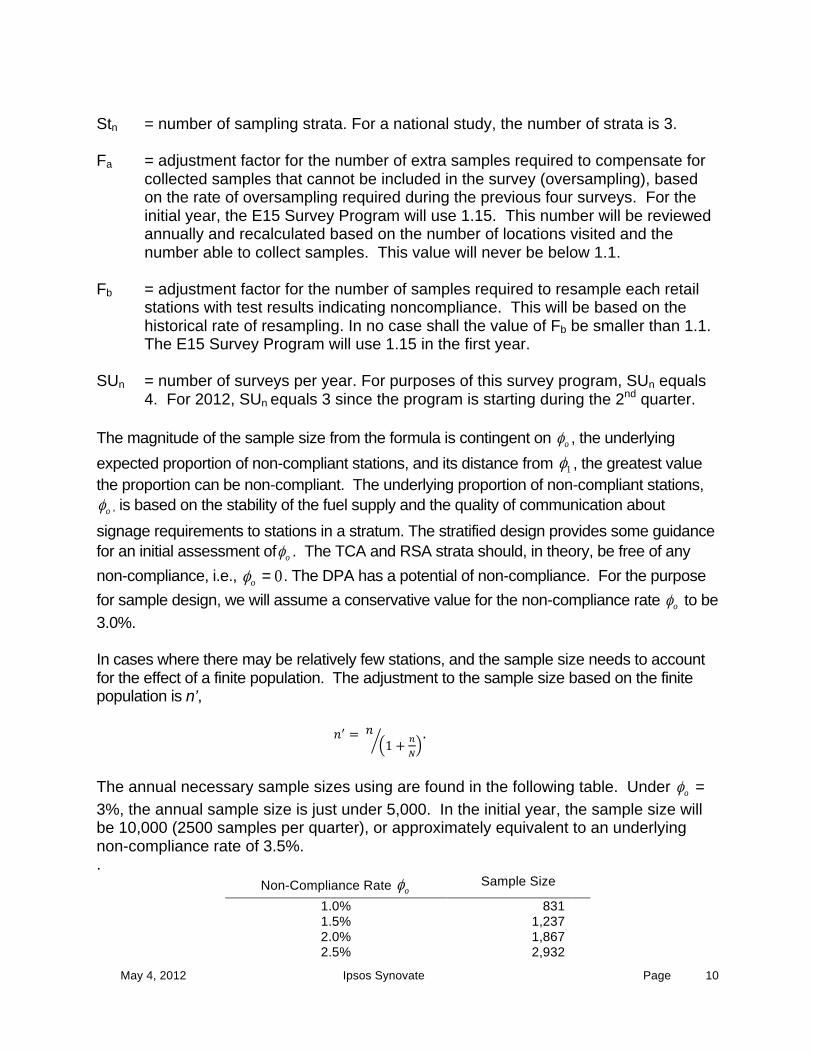
4. For 2012, SUn equals 3 since the program is starting during the 2nd quarter. The magnitude of the sample size from the formula is contingent on oφ , the underlying expected proportion of non-compliant stations, and its distance from 1φ , the greatest value the proportion can be non-compliant. The underlying proportion of non-compliant stations,
oφ , is based on the stability of the fuel supply and the quality of communication about signage requirements to stations in a stratum. The stratified design provides some guidance for an initial assessment of oφ . The TCA and RSA strata should, in theory, be free of any non-compliance, i.e., 0=oφ . The DPA has a potential of non-compliance. For the purpose for sample design, we will assume a conservative value for the non-compliance rate oφ to be 3.0%. In cases where there may be relatively few stations, and the sample size needs to account for the effect of a finite population. The adjustment to the sample size based on the finite population is n’,
𝑛! = 𝑛1 + !
!
.
The annual necessary sample sizes using are found in the following table. Under oφ = 3%, the annual sample size is just under 5,000. In the initial year, the sample size will be 10,000 (2500 samples per quarter), or approximately equivalent to an underlying non-compliance rate of 3.5%. .
Non-Compliance Rate oφ Sample Size
1.0% 831 1.5% 1,237 2.0% 1,867 2.5% 2,932
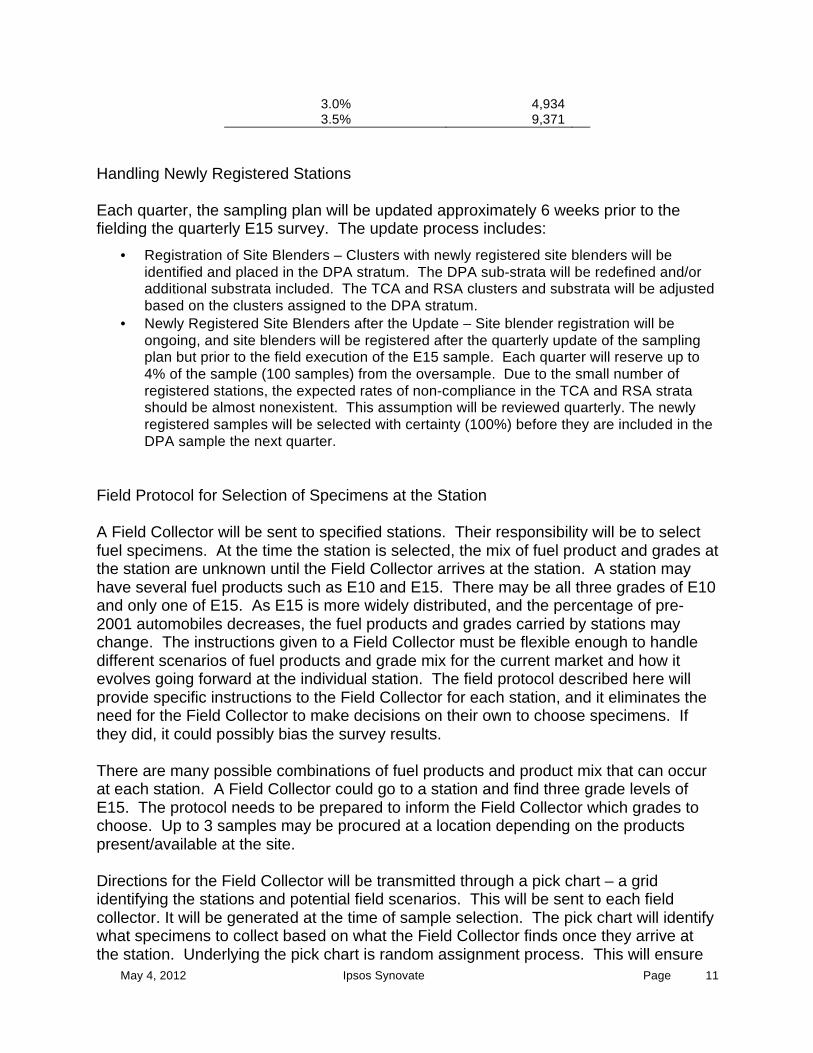
May 4, 2012 Ipsos Synovate Page 11
3.0% 4,934 3.5% 9,371
Handling Newly Registered Stations Each quarter, the sampling plan will be updated approximately 6 weeks prior to the fielding the quarterly E15 survey. The update process includes:
• Registration of Site Blenders – Clusters with newly registered site blenders will be identified and placed in the DPA stratum. The DPA sub-strata will be redefined and/or additional substrata included. The TCA and RSA clusters and substrata will be adjusted based on the clusters assigned to the DPA stratum.
• Newly Registered Site Blenders after the Update – Site blender registration will be ongoing, and site blenders will be registered after the quarterly update of the sampling plan but prior to the field execution of the E15 sample. Each quarter will reserve up to 4% of the sample (100 samples) from the oversample. Due to the small number of registered stations, the expected rates of non-compliance in the TCA and RSA strata should be almost nonexistent. This assumption will be reviewed quarterly. The newly registered samples will be selected with certainty (100%) before they are included in the DPA sample the next quarter.
Field Protocol for Selection of Specimens at the Station A Field Collector will be sent to specified stations. Their responsibility will be to select fuel specimens. At the time the station is selected, the mix of fuel product and grades at the station are unknown until the Field Collector arrives at the station. A station may have several fuel products such as E10 and E15. There may be all three grades of E10 and only one of E15. As E15 is more widely distributed, and the percentage of pre-2001 automobiles decreases, the fuel products and grades carried by stations may change. The instructions given to a Field Collector must be flexible enough to handle different scenarios of fuel products and grade mix for the current market and how it evolves going forward at the individual station. The field protocol described here will provide specific instructions to the Field Collector for each station, and it eliminates the need for the Field Collector to make decisions on their own to choose specimens. If they did, it could possibly bias the survey results. There are many possible combinations of fuel products and product mix that can occur at each station. A Field Collector could go to a station and find three grade levels of E15. The protocol needs to be prepared to inform the Field Collector which grades to choose. Up to 3 samples may be procured at a location depending on the products present/available at the site. Directions for the Field Collector will be transmitted through a pick chart – a grid identifying the stations and potential field scenarios. This will be sent to each field collector. It will be generated at the time of sample selection. The pick chart will identify what specimens to collect based on what the Field Collector finds once they arrive at the station. Underlying the pick chart is random assignment process. This will ensure
May 4, 2012 Ipsos Synovate Page 12
that the Field Collector does not have discretion to choose the specimen type. The pick charts were developed such that:
• E15 fuel has precedent over other fuel products. o If E15 is present at station, it will be collected. o The grade chosen will be selected in proportion to the mix of grade within
the state. • E10 fuel has precedent over E0.
o If E10 is present (states in most all cases require labels), it will be collected.
o If more than one grade of E10 is present, it will be selected in proportion to mix of grade within the state.
• At most cases 2 specimens of E15, E10 or E0 will be selected (See exception below – Site Blender Sampling).
The Field Collector will be required to complete a Pick Chart provided for each selected station. The Pick chart will have the location and identifying information for each station (Brand name, address and map coordinates). The Field Collector will mark each product category sold at the station. The highest priority E15 and E10 specimens will be collected. The following example Pick Chart has priority order for Grades of PU, MU and RU. This order is rotated at random when the charts are printed for each station. This changes order of specimen grade from station to station and visit to visit at the same station. The order will be generated based such that the first specimen noted to be selected will match the grade mix within the station’s state. For each product sampled, the Field Collector will photograph the subject label/dispenser. The Field Collector will also note the field site documents to account for the presence of other properly labeled E15 dispensers/discrepancies.
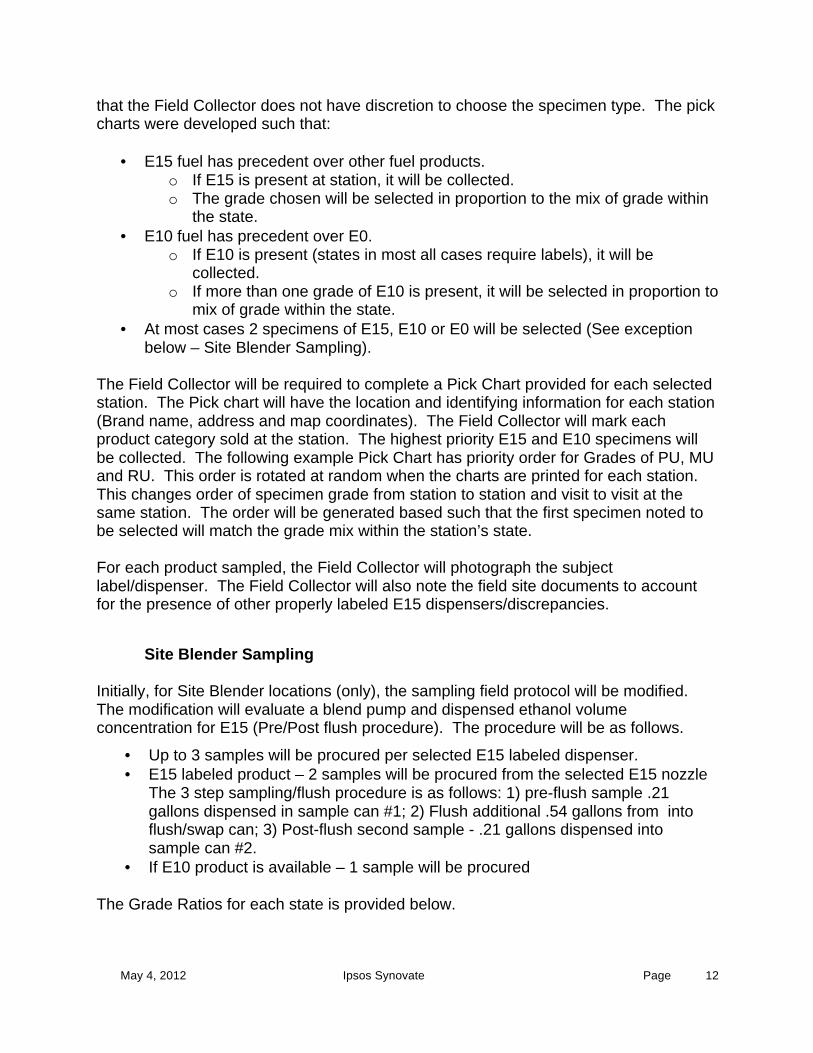
Site Blender Sampling Initially, for Site Blender locations (only), the sampling field protocol will be modified. The modification will evaluate a blend pump and dispensed ethanol volume concentration for E15 (Pre/Post flush procedure). The procedure will be as follows.
• Up to 3 samples will be procured per selected E15 labeled dispenser. • E15 labeled product – 2 samples will be procured from the selected E15 nozzle
The 3 step sampling/flush procedure is as follows: 1) pre-flush sample .21 gallons dispensed in sample can #1; 2) Flush additional .54 gallons from into flush/swap can; 3) Post-flush second sample - .21 gallons dispensed into sample can #2.
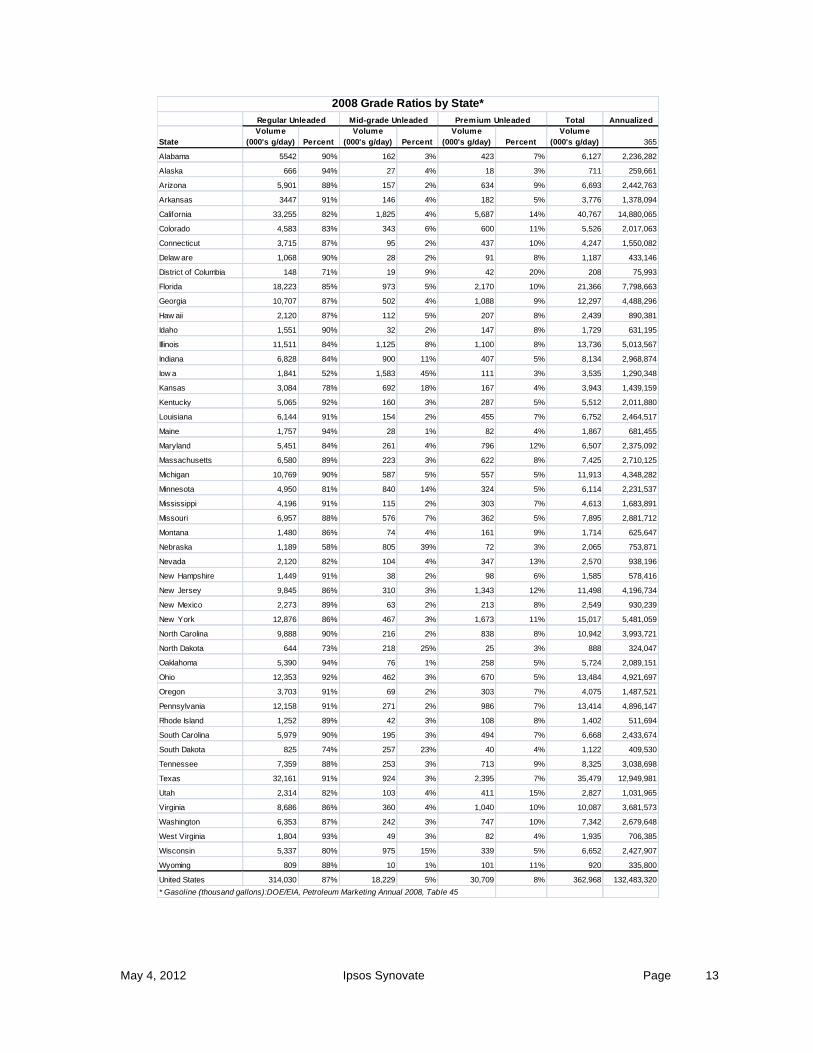
• If E10 product is available – 1 sample will be procured The Grade Ratios for each state is provided below.
May 4, 2012 Ipsos Synovate Page 13
Total Annualized
StateVolume
(000's g/day) PercentVolume
(000's g/day) PercentVolume
(000's g/day) PercentVolume
(000's g/day) 365
Alabama 5542 90% 162 3% 423 7% 6,127 2,236,282
Alaska 666 94% 27 4% 18 3% 711 259,661
Arizona 5,901 88% 157 2% 634 9% 6,693 2,442,763
Arkansas 3447 91% 146 4% 182 5% 3,776 1,378,094
California 33,255 82% 1,825 4% 5,687 14% 40,767 14,880,065
Colorado 4,583 83% 343 6% 600 11% 5,526 2,017,063
Connecticut 3,715 87% 95 2% 437 10% 4,247 1,550,082
Delaw are 1,068 90% 28 2% 91 8% 1,187 433,146
District of Columbia 148 71% 19 9% 42 20% 208 75,993
Florida 18,223 85% 973 5% 2,170 10% 21,366 7,798,663
Georgia 10,707 87% 502 4% 1,088 9% 12,297 4,488,296
Haw aii 2,120 87% 112 5% 207 8% 2,439 890,381
Idaho 1,551 90% 32 2% 147 8% 1,729 631,195
Illinois 11,511 84% 1,125 8% 1,100 8% 13,736 5,013,567
Indiana 6,828 84% 900 11% 407 5% 8,134 2,968,874
Iow a 1,841 52% 1,583 45% 111 3% 3,535 1,290,348
Kansas 3,084 78% 692 18% 167 4% 3,943 1,439,159
Kentucky 5,065 92% 160 3% 287 5% 5,512 2,011,880
Louisiana 6,144 91% 154 2% 455 7% 6,752 2,464,517
Maine 1,757 94% 28 1% 82 4% 1,867 681,455
Maryland 5,451 84% 261 4% 796 12% 6,507 2,375,092
Massachusetts 6,580 89% 223 3% 622 8% 7,425 2,710,125
Michigan 10,769 90% 587 5% 557 5% 11,913 4,348,282
Minnesota 4,950 81% 840 14% 324 5% 6,114 2,231,537
Mississippi 4,196 91% 115 2% 303 7% 4,613 1,683,891
Missouri 6,957 88% 576 7% 362 5% 7,895 2,881,712
Montana 1,480 86% 74 4% 161 9% 1,714 625,647
Nebraska 1,189 58% 805 39% 72 3% 2,065 753,871
Nevada 2,120 82% 104 4% 347 13% 2,570 938,196
New Hampshire 1,449 91% 38 2% 98 6% 1,585 578,416
New Jersey 9,845 86% 310 3% 1,343 12% 11,498 4,196,734
New Mexico 2,273 89% 63 2% 213 8% 2,549 930,239
New York 12,876 86% 467 3% 1,673 11% 15,017 5,481,059
North Carolina 9,888 90% 216 2% 838 8% 10,942 3,993,721
North Dakota 644 73% 218 25% 25 3% 888 324,047
Oaklahoma 5,390 94% 76 1% 258 5% 5,724 2,089,151
Ohio 12,353 92% 462 3% 670 5% 13,484 4,921,697
Oregon 3,703 91% 69 2% 303 7% 4,075 1,487,521
Pennsylvania 12,158 91% 271 2% 986 7% 13,414 4,896,147
Rhode Island 1,252 89% 42 3% 108 8% 1,402 511,694
South Carolina 5,979 90% 195 3% 494 7% 6,668 2,433,674
South Dakota 825 74% 257 23% 40 4% 1,122 409,530
Tennessee 7,359 88% 253 3% 713 9% 8,325 3,038,698
Texas 32,161 91% 924 3% 2,395 7% 35,479 12,949,981
Utah 2,314 82% 103 4% 411 15% 2,827 1,031,965
Virginia 8,686 86% 360 4% 1,040 10% 10,087 3,681,573
Washington 6,353 87% 242 3% 747 10% 7,342 2,679,648
West Virginia 1,804 93% 49 3% 82 4% 1,935 706,385
Wisconsin 5,337 80% 975 15% 339 5% 6,652 2,427,907
Wyoming 809 88% 10 1% 101 11% 920 335,800
United States 314,030 87% 18,229 5% 30,709 8% 362,968 132,483,320* Gasoline (thousand gallons):DOE/EIA, Petroleum Marketing Annual 2008, Table 45
Regular Unleaded Mid-grade Unleaded Premium Unleaded
2008 Grade Ratios by State*
May 4, 2012 Ipsos Synovate Page 14
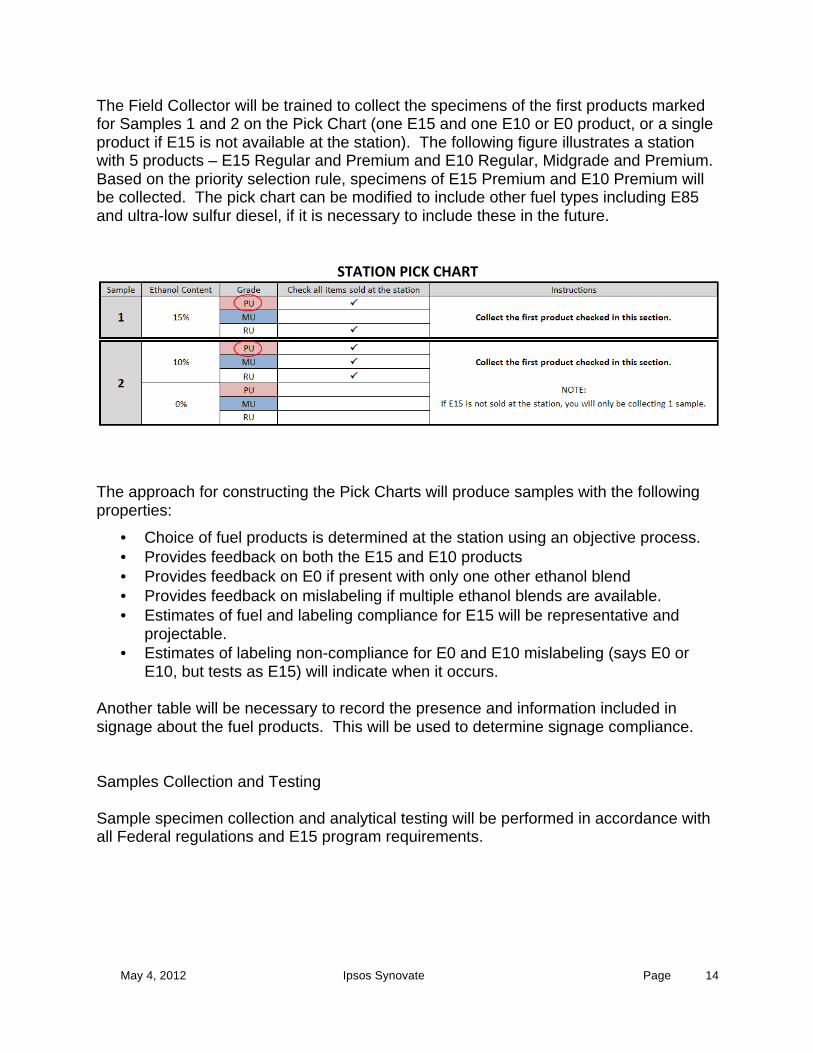
The Field Collector will be trained to collect the specimens of the first products marked for Samples 1 and 2 on the Pick Chart (one E15 and one E10 or E0 product, or a single product if E15 is not available at the station). The following figure illustrates a station with 5 products – E15 Regular and Premium and E10 Regular, Midgrade and Premium. Based on the priority selection rule, specimens of E15 Premium and E10 Premium will be collected. The pick chart can be modified to include other fuel types including E85 and ultra-low sulfur diesel, if it is necessary to include these in the future.
STATION PICK CHART
The approach for constructing the Pick Charts will produce samples with the following properties:
• Choice of fuel products is determined at the station using an objective process. • Provides feedback on both the E15 and E10 products • Provides feedback on E0 if present with only one other ethanol blend • Provides feedback on mislabeling if multiple ethanol blends are available. • Estimates of fuel and labeling compliance for E15 will be representative and
projectable. • Estimates of labeling non-compliance for E0 and E10 mislabeling (says E0 or
E10, but tests as E15) will indicate when it occurs. Another table will be necessary to record the presence and information included in signage about the fuel products. This will be used to determine signage compliance. Samples Collection and Testing Sample specimen collection and analytical testing will be performed in accordance with all Federal regulations and E15 program requirements.
May 4, 2012 Ipsos Synovate Page 15
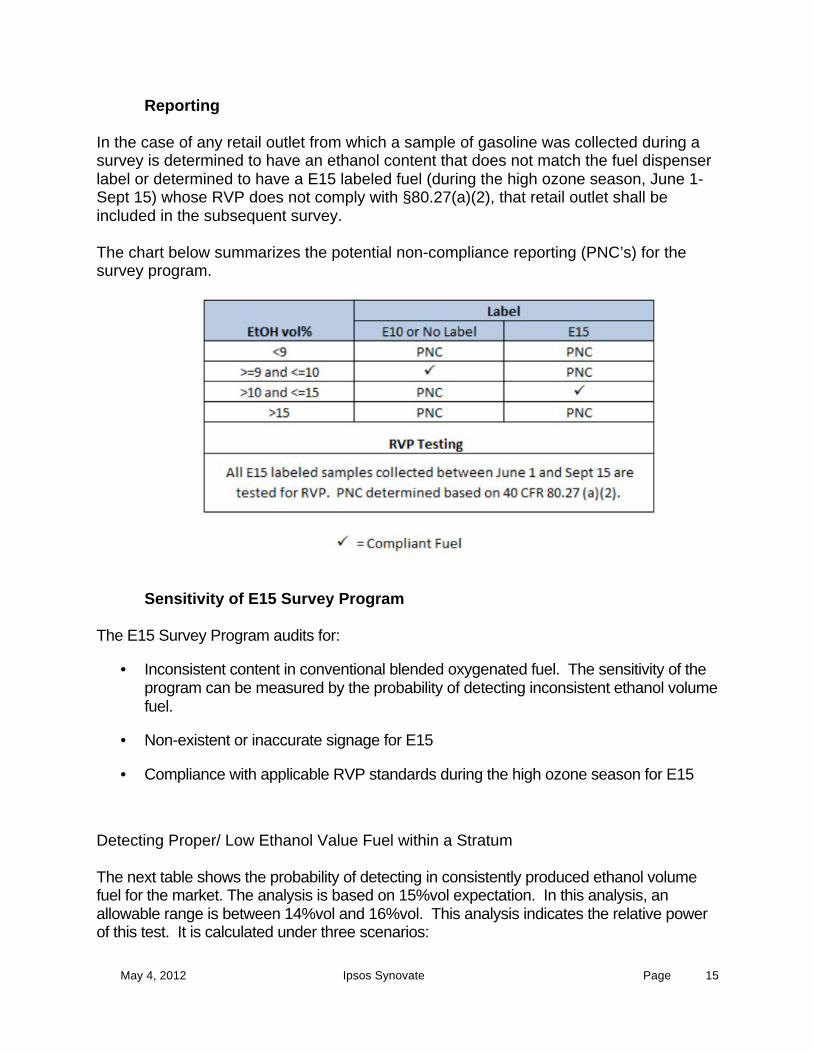
Reporting In the case of any retail outlet from which a sample of gasoline was collected during a survey is determined to have an ethanol content that does not match the fuel dispenser label or determined to have a E15 labeled fuel (during the high ozone season, June 1-Sept 15) whose RVP does not comply with §80.27(a)(2), that retail outlet shall be included in the subsequent survey. The chart below summarizes the potential non-compliance reporting (PNC’s) for the survey program.
Sensitivity of E15 Survey Program The E15 Survey Program audits for:
• Inconsistent content in conventional blended oxygenated fuel. The sensitivity of the program can be measured by the probability of detecting inconsistent ethanol volume fuel.
• Non-existent or inaccurate signage for E15
• Compliance with applicable RVP standards during the high ozone season for E15
Detecting Proper/ Low Ethanol Value Fuel within a Stratum The next table shows the probability of detecting in consistently produced ethanol volume fuel for the market. The analysis is based on 15%vol expectation. In this analysis, an allowable range is between 14%vol and 16%vol. This analysis indicates the relative power of this test. It is calculated under three scenarios:

May 4, 2012 Ipsos Synovate Page 16
• A sample size of 800 – Approximately the size of a stratum • A sample size of 10 – Approximately the size of a single cluster • A sample size of 1 -- Equivalent to a single station.
The next table shows that the probability of detecting noncompliance is very high. The lowest probability of detecting noncompliance for a region for samples with content below 14 or above 16 is at 99.95%. The lowest probability of detecting noncompliance for a cluster is at 72.61%, and the probability of detection quickly moves towards 100% as the degree of noncompliance increases. Finally, the lowest probability of non detection is 57.54% for a single station. The analysis shows that for a single station, if there is exact compliance (Fuel mix is exactly 15.00), then the probability of detecting noncompliance is 5.73% or around the 5% level of confidence expected, in effect, the expected α-level for the test.
Fuel Mix at Station
(EtOH%)
Sample Size
Fuel Mix at Station
(EtOH%)
Sample Size
Region n=800
Cluster n=10
Station
n=1
Region n=800
Cluster n=10
Station
n=1 Probability to Detect
Noncompliance Probability to Detect Noncompliance
6.00 1.0000 1.0000 1.0000 15.10 0.0000 0.0000 0.0618 9.00 1.0000 1.0000 1.0000 15.20 0.0000 0.0000 0.0754
11.00 1.0000 1.0000 1.0000 15.30 0.0000 0.0000 0.0984 12.00 1.0000 1.0000 1.0000 15.40 0.0000 0.0000 0.1309 13.00 1.0000 1.0000 0.9999 15.50 0.0000 0.0000 0.1731 13.25 1.0000 1.0000 0.9714 15.60 0.0000 0.0000 0.2247 13.50 1.0000 1.0000 0.9230 15.70 0.0000 0.0000 0.2848 13.60 1.0000 1.0000 0.8291 15.80 0.0000 0.0000 0.3522 13.70 1.0000 1.0000 0.7765 15.90 0.0000 0.0099 0.4248 13.80 1.0000 1.0000 0.6481 16.00 0.5000 0.5000 0.5001 13.90 1.0000 0.9901 0.5754 16.10 1.0000 0.9901 0.5754 14.00 0.5000 0.5000 0.5001 16.20 1.0000 1.0000 0.6481 14.10 0.0000 0.0099 0.4248 16.40 1.0000 1.0000 0.7765 14.20 0.0000 0.0000 0.3522 16.50 1.0000 1.0000 0.8291 14.30 0.0000 0.0000 0.2848 16.75 1.0000 1.0000 0.9230 14.40 0.0000 0.0000 0.2247 17.00 1.0000 1.0000 0.9714 14.50 0.0000 0.0000 0.1731 18.00 1.0000 1.0000 0.9999 14.60 0.0000 0.0000 0.1309 19.00 1.0000 1.0000 1.0000 14.70 0.0000 0.0000 0.0984 20.00 1.0000 1.0000 1.0000 14.80 0.0000 0.0000 0.0754 25.00 1.0000 1.0000 1.0000 14.90 0.0000 0.0000 0.0618 30.00 1.0000 1.0000 1.0000 15.00 0.0000 0.0000 0.0573 35.00 1.0000 1.0000 1.0000
Used a historical standard deviation of 0.52 This analysis shows that this approach is sensitive to changes in the underlying assumptions. Detecting Compliance with Signage Requirements
May 4, 2012 Ipsos Synovate Page 17
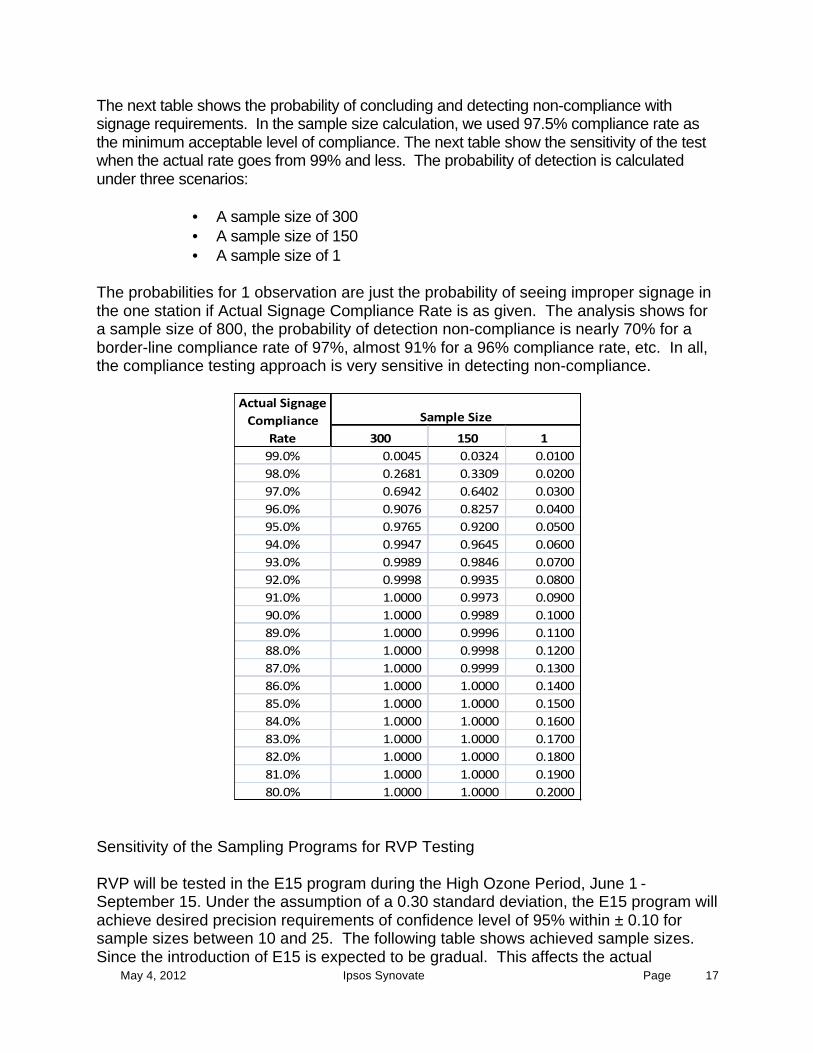
The next table shows the probability of concluding and detecting non-compliance with signage requirements. In the sample size calculation, we used 97.5% compliance rate as the minimum acceptable level of compliance. The next table show the sensitivity of the test when the actual rate goes from 99% and less. The probability of detection is calculated under three scenarios:
• A sample size of 300 • A sample size of 150 • A sample size of 1
The probabilities for 1 observation are just the probability of seeing improper signage in the one station if Actual Signage Compliance Rate is as given. The analysis shows for a sample size of 800, the probability of detection non-compliance is nearly 70% for a border-line compliance rate of 97%, almost 91% for a 96% compliance rate, etc. In all, the compliance testing approach is very sensitive in detecting non-compliance.
300 150 199.0% 0.0045 0.0324 0.0100 98.0% 0.2681 0.3309 0.0200 97.0% 0.6942 0.6402 0.0300 96.0% 0.9076 0.8257 0.0400 95.0% 0.9765 0.9200 0.0500 94.0% 0.9947 0.9645 0.0600 93.0% 0.9989 0.9846 0.0700 92.0% 0.9998 0.9935 0.0800 91.0% 1.0000 0.9973 0.0900 90.0% 1.0000 0.9989 0.1000 89.0% 1.0000 0.9996 0.1100 88.0% 1.0000 0.9998 0.1200 87.0% 1.0000 0.9999 0.1300 86.0% 1.0000 1.0000 0.1400 85.0% 1.0000 1.0000 0.1500 84.0% 1.0000 1.0000 0.1600 83.0% 1.0000 1.0000 0.1700 82.0% 1.0000 1.0000 0.1800 81.0% 1.0000 1.0000 0.1900 80.0% 1.0000 1.0000 0.2000
Actual Signage Compliance
Rate
Sample Size
Sensitivity of the Sampling Programs for RVP Testing RVP will be tested in the E15 program during the High Ozone Period, June 1 - September 15. Under the assumption of a 0.30 standard deviation, the E15 program will achieve desired precision requirements of confidence level of 95% within ± 0.10 for sample sizes between 10 and 25. The following table shows achieved sample sizes. Since the introduction of E15 is expected to be gradual. This affects the actual

May 4, 2012 Ipsos Synovate Page 18
confidence interval. The following table provides a sense of the actual confidence intervals for different size regions. Sample sizes as small as 10 achieve the confidence intervals levels if the population is very small, say under 40 stations. A sample size of 15 and higher achieves the precision with actual confidence intervals at least 95% even for larger populations.
0% 5% 10% 20% 30% 40%10 92.7% 93.0% 93.3% 94.0% 94.8% 95.7%15 95.1% 95.4% 95.7% 96.3% 96.9% 97.6%20 96.6% 96.8% 97.1% 97.6% 98.1% 98.6%25 97.6% 97.8% 98.0% 98.4% 98.8% 99.2%50 99.5% 99.6% 99.7% 99.8% 99.9% 99.9%100 100.0% 100.0% 100.0% 100.0% 100.0% 100.0%150 100.0% 100.0% 100.0% 100.0% 100.0% 100.0%200 100.0% 100.0% 100.0% 100.0% 100.0% 100.0%250 100.0% 100.0% 100.0% 100.0% 100.0% 100.0%
Sample as Proportion of PopulationSample Size
Confidence Level for Sample Size Relative to Population
In addition to the confidence interval, a sample size of 10 achieves at least a power of 80% -- the probability of identifying RVP greater than the allowable maximum. The following table shows the power of this test for an actual RVP 1 unit above the maximum allowable. The power of the test for a sample size is 85.4% for a large population and 91.3% for a small population. Sample sizes of 15 or higher achieves a 90% power.
0% 5% 10% 20% 30% 40%10 85.4% 86.0% 86.7% 88.1% 89.6% 91.3%15 90.2% 90.7% 91.3% 92.6% 93.9% 95.2%20 93.2% 93.7% 94.2% 95.2% 96.3% 97.3%25 95.2% 95.6% 96.1% 96.9% 97.7% 98.4%50 99.1% 99.2% 99.4% 99.6% 99.8% 99.9%100 100.0% 100.0% 100.0% 100.0% 100.0% 100.0%150 100.0% 100.0% 100.0% 100.0% 100.0% 100.0%200 100.0% 100.0% 100.0% 100.0% 100.0% 100.0%250 100.0% 100.0% 100.0% 100.0% 100.0% 100.0%
Sample Size
Sample as Proportion of PopulationPower of Test for 1 Unit Increase in RVP
This analysis shows that testing for RVP under E15 meets the precision requirements, and the tests are sufficiently powerful.
May 4, 2012 Ipsos Synovate Page 19
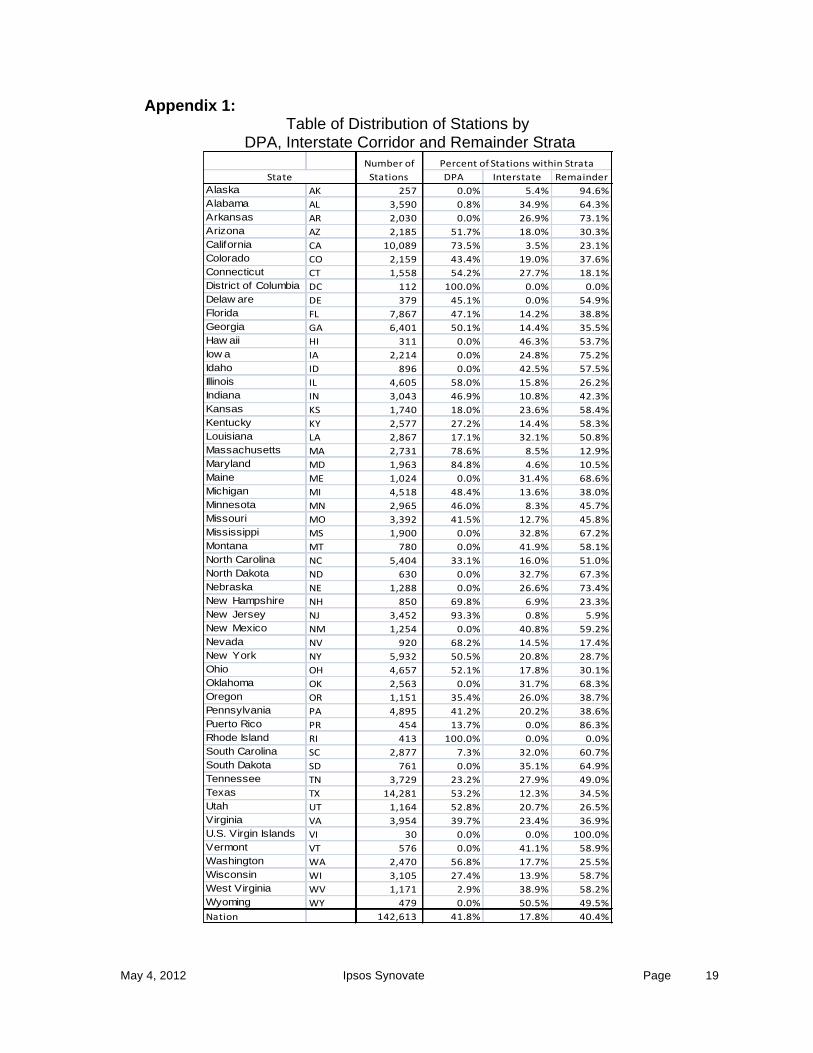
Appendix 1: Table of Distribution of Stations by
DPA, Interstate Corridor and Remainder Strata
DPA Interstate RemainderAlaska AK 257 0.0% 5.4% 94.6%Alabama AL 3,590 0.8% 34.9% 64.3%Arkansas AR 2,030 0.0% 26.9% 73.1%Arizona AZ 2,185 51.7% 18.0% 30.3%California CA 10,089 73.5% 3.5% 23.1%Colorado CO 2,159 43.4% 19.0% 37.6%Connecticut CT 1,558 54.2% 27.7% 18.1%District of Columbia DC 112 100.0% 0.0% 0.0%Delaw are DE 379 45.1% 0.0% 54.9%Florida FL 7,867 47.1% 14.2% 38.8%Georgia GA 6,401 50.1% 14.4% 35.5%Haw aii HI 311 0.0% 46.3% 53.7%Iow a IA 2,214 0.0% 24.8% 75.2%Idaho ID 896 0.0% 42.5% 57.5%Illinois IL 4,605 58.0% 15.8% 26.2%Indiana IN 3,043 46.9% 10.8% 42.3%Kansas KS 1,740 18.0% 23.6% 58.4%Kentucky KY 2,577 27.2% 14.4% 58.3%Louisiana LA 2,867 17.1% 32.1% 50.8%Massachusetts MA 2,731 78.6% 8.5% 12.9%Maryland MD 1,963 84.8% 4.6% 10.5%Maine ME 1,024 0.0% 31.4% 68.6%Michigan MI 4,518 48.4% 13.6% 38.0%Minnesota MN 2,965 46.0% 8.3% 45.7%Missouri MO 3,392 41.5% 12.7% 45.8%Mississippi MS 1,900 0.0% 32.8% 67.2%Montana MT 780 0.0% 41.9% 58.1%North Carolina NC 5,404 33.1% 16.0% 51.0%North Dakota ND 630 0.0% 32.7% 67.3%Nebraska NE 1,288 0.0% 26.6% 73.4%New Hampshire NH 850 69.8% 6.9% 23.3%New Jersey NJ 3,452 93.3% 0.8% 5.9%New Mexico NM 1,254 0.0% 40.8% 59.2%Nevada NV 920 68.2% 14.5% 17.4%New York NY 5,932 50.5% 20.8% 28.7%Ohio OH 4,657 52.1% 17.8% 30.1%Oklahoma OK 2,563 0.0% 31.7% 68.3%Oregon OR 1,151 35.4% 26.0% 38.7%Pennsylvania PA 4,895 41.2% 20.2% 38.6%Puerto Rico PR 454 13.7% 0.0% 86.3%Rhode Island RI 413 100.0% 0.0% 0.0%South Carolina SC 2,877 7.3% 32.0% 60.7%South Dakota SD 761 0.0% 35.1% 64.9%Tennessee TN 3,729 23.2% 27.9% 49.0%Texas TX 14,281 53.2% 12.3% 34.5%Utah UT 1,164 52.8% 20.7% 26.5%Virginia VA 3,954 39.7% 23.4% 36.9%U.S. Virgin Islands VI 30 0.0% 0.0% 100.0%Vermont VT 576 0.0% 41.1% 58.9%Washington WA 2,470 56.8% 17.7% 25.5%Wisconsin WI 3,105 27.4% 13.9% 58.7%West Virginia WV 1,171 2.9% 38.9% 58.2%Wyoming WY 479 0.0% 50.5% 49.5%Nation 142,613 41.8% 17.8% 40.4%
StateNumber of Stations
Percent of Stations within Strata
May 4, 2012 Ipsos Synovate Page 20
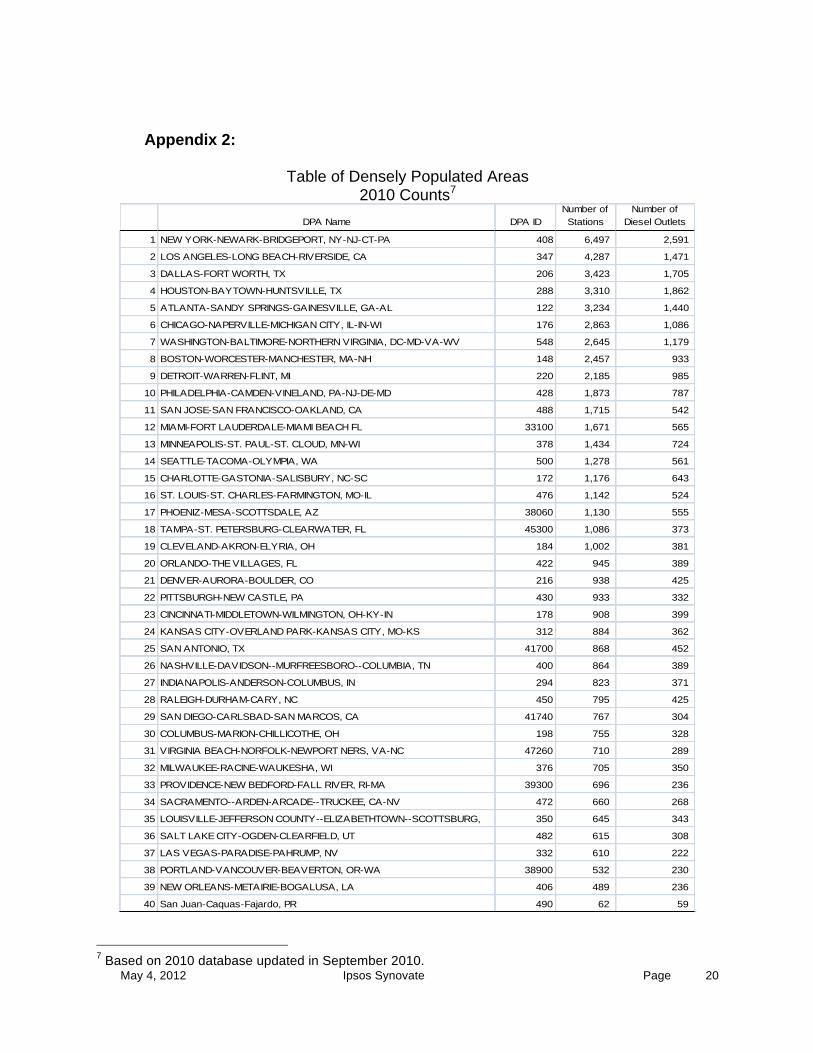
Appendix 2:
Table of Densely Populated Areas 2010 Counts7
DPA Name DPA IDNumber of Stations
Number of Diesel Outlets
1 NEW YORK-NEWARK-BRIDGEPORT, NY-NJ-CT-PA 408 6,497 2,591
2 LOS ANGELES-LONG BEACH-RIVERSIDE, CA 347 4,287 1,471
3 DALLAS-FORT WORTH, TX 206 3,423 1,705
4 HOUSTON-BAYTOWN-HUNTSVILLE, TX 288 3,310 1,862
5 ATLANTA-SANDY SPRINGS-GAINESVILLE, GA-AL 122 3,234 1,440
6 CHICAGO-NAPERVILLE-MICHIGAN CITY, IL-IN-WI 176 2,863 1,086
7 WASHINGTON-BALTIMORE-NORTHERN VIRGINIA, DC-MD-VA-WV 548 2,645 1,179
8 BOSTON-WORCESTER-MANCHESTER, MA-NH 148 2,457 933
9 DETROIT-WARREN-FLINT, MI 220 2,185 985
10 PHILADELPHIA-CAMDEN-VINELAND, PA-NJ-DE-MD 428 1,873 787
11 SAN JOSE-SAN FRANCISCO-OAKLAND, CA 488 1,715 542
12 MIAMI-FORT LAUDERDALE-MIAMI BEACH FL 33100 1,671 565
13 MINNEAPOLIS-ST. PAUL-ST. CLOUD, MN-WI 378 1,434 724
14 SEATTLE-TACOMA-OLYMPIA, WA 500 1,278 561
15 CHARLOTTE-GASTONIA-SALISBURY, NC-SC 172 1,176 643
16 ST. LOUIS-ST. CHARLES-FARMINGTON, MO-IL 476 1,142 524
17 PHOENIZ-MESA-SCOTTSDALE, AZ 38060 1,130 555
18 TAMPA-ST. PETERSBURG-CLEARWATER, FL 45300 1,086 373
19 CLEVELAND-AKRON-ELYRIA, OH 184 1,002 381
20 ORLANDO-THE VILLAGES, FL 422 945 389
21 DENVER-AURORA-BOULDER, CO 216 938 425
22 PITTSBURGH-NEW CASTLE, PA 430 933 332
23 CINCINNATI-MIDDLETOWN-WILMINGTON, OH-KY-IN 178 908 399
24 KANSAS CITY-OVERLAND PARK-KANSAS CITY, MO-KS 312 884 362
25 SAN ANTONIO, TX 41700 868 452
26 NASHVILLE-DAVIDSON--MURFREESBORO--COLUMBIA, TN 400 864 389
27 INDIANAPOLIS-ANDERSON-COLUMBUS, IN 294 823 371
28 RALEIGH-DURHAM-CARY, NC 450 795 425
29 SAN DIEGO-CARLSBAD-SAN MARCOS, CA 41740 767 304
30 COLUMBUS-MARION-CHILLICOTHE, OH 198 755 328
31 VIRGINIA BEACH-NORFOLK-NEWPORT NERS, VA-NC 47260 710 289
32 MILWAUKEE-RACINE-WAUKESHA, WI 376 705 350
33 PROVIDENCE-NEW BEDFORD-FALL RIVER, RI-MA 39300 696 236
34 SACRAMENTO--ARDEN-ARCADE--TRUCKEE, CA-NV 472 660 268
35 LOUISVILLE-JEFFERSON COUNTY--ELIZABETHTOWN--SCOTTSBURG, 350 645 343
36 SALT LAKE CITY-OGDEN-CLEARFIELD, UT 482 615 308
37 LAS VEGAS-PARADISE-PAHRUMP, NV 332 610 222
38 PORTLAND-VANCOUVER-BEAVERTON, OR-WA 38900 532 230
39 NEW ORLEANS-METAIRIE-BOGALUSA, LA 406 489 236
40 San Juan-Caquas-Fajardo, PR 490 62 59
7 Based on 2010 database updated in September 2010.
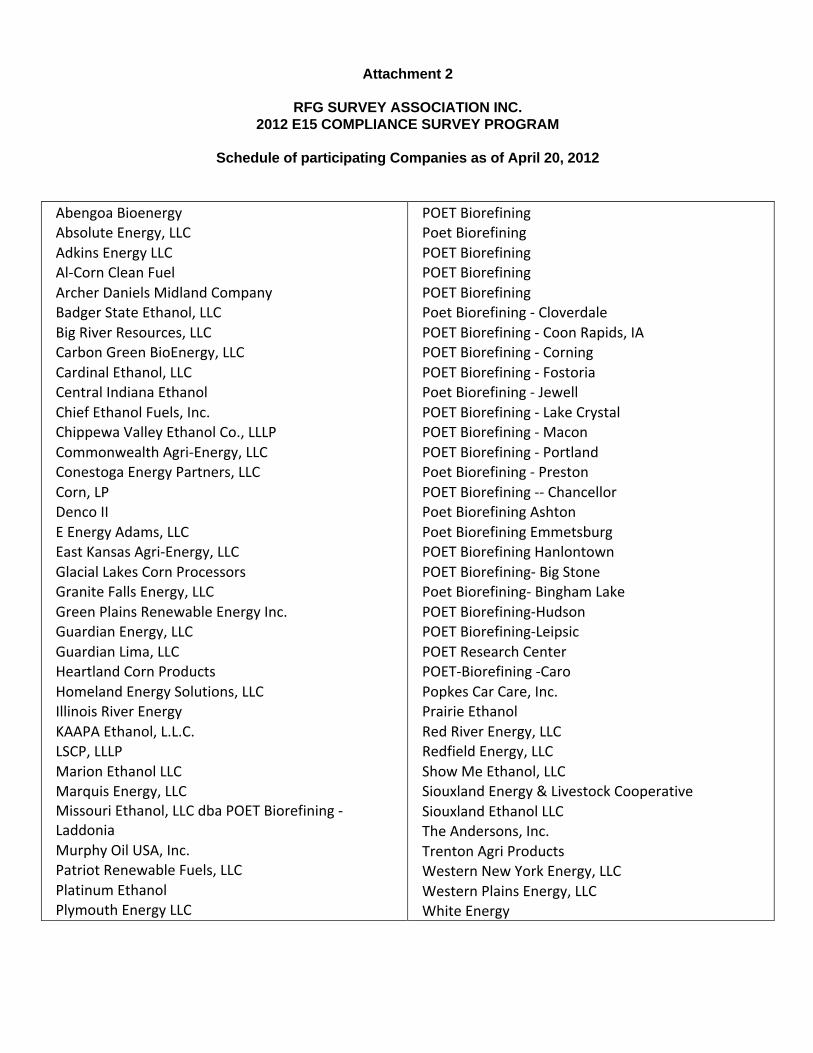
Attachment 2
RFG SURVEY ASSOCIATION INC.
2012 E15 COMPLIANCE SURVEY PROGRAM
Schedule of participating Companies as of April 20, 2012
Abengoa Bioenergy Absolute Energy, LLC Adkins Energy LLC Al-‐Corn Clean Fuel Archer Daniels Midland Company Badger State Ethanol, LLC Big River Resources, LLC Carbon Green BioEnergy, LLC Cardinal Ethanol, LLC Central Indiana Ethanol Chief Ethanol Fuels, Inc. Chippewa Valley Ethanol Co., LLLP Commonwealth Agri-‐Energy, LLC Conestoga Energy Partners, LLC Corn, LP Denco II E Energy Adams, LLC East Kansas Agri-‐Energy, LLC Glacial Lakes Corn Processors Granite Falls Energy, LLC Green Plains Renewable Energy Inc. Guardian Energy, LLC Guardian Lima, LLC Heartland Corn Products Homeland Energy Solutions, LLC Illinois River Energy KAAPA Ethanol, L.L.C. LSCP, LLLP Marion Ethanol LLC Marquis Energy, LLC Missouri Ethanol, LLC dba POET Biorefining -‐ Laddonia Murphy Oil USA, Inc. Patriot Renewable Fuels, LLC Platinum Ethanol Plymouth Energy LLC
POET Biorefining Poet Biorefining POET Biorefining POET Biorefining POET Biorefining Poet Biorefining -‐ Cloverdale POET Biorefining -‐ Coon Rapids, IA POET Biorefining -‐ Corning POET Biorefining -‐ Fostoria Poet Biorefining -‐ Jewell POET Biorefining -‐ Lake Crystal POET Biorefining -‐ Macon POET Biorefining -‐ Portland Poet Biorefining -‐ Preston POET Biorefining -‐-‐ Chancellor Poet Biorefining Ashton Poet Biorefining Emmetsburg POET Biorefining Hanlontown POET Biorefining-‐ Big Stone Poet Biorefining-‐ Bingham Lake POET Biorefining-‐Hudson POET Biorefining-‐Leipsic POET Research Center POET-‐Biorefining -‐Caro Popkes Car Care, Inc. Prairie Ethanol Red River Energy, LLC Redfield Energy, LLC Show Me Ethanol, LLC Siouxland Energy & Livestock Cooperative Siouxland Ethanol LLC The Andersons, Inc. Trenton Agri Products Western New York Energy, LLC Western Plains Energy, LLC White Energy