Delivered Between Two Differing CT Comparison of Image ... · PDF fileDelivered Between Two...
14
Received 07/10/2016 Review began 07/20/2016 Review ended 09/06/2016 Published 09/12/2016 © Copyright 2016 Lechuga et al. This is an open access article distributed under the terms of the Creative Commons Attribution License CC-BY 3.0., which permits unrestricted use, distribution, and reproduction in any medium, provided the original author and source are credited. Cone Beam CT vs. Fan Beam CT: A Comparison of Image Quality and Dose Delivered Between Two Differing CT Imaging Modalities Lawrence Lechuga , Georg A. Weidlich 1. California State University Fresno 2. Radiation Oncology, National Medical Physics and Dosimetry Comp., Inc Corresponding author: Lawrence Lechuga, [email protected] Disclosures can be found in Additional Information at the end of the article Abstract A comparison of image quality and dose delivered between two differing computed tomography (CT) imaging modalities—fan beam and cone beam—was performed. A literature review of quantitative analyses for various image quality aspects such as uniformity, signal-to-noise ratio, artifact presence, spatial resolution, modulation transfer function (MTF), and low contrast resolution was generated. With these aspects quantified, cone beam computed tomography (CBCT) shows a superior spatial resolution to that of fan beam, while fan beam shows a greater ability to produce clear and anatomically correct images with better soft tissue differentiation. The results indicate that fan beam CT produces superior images to that of on- board imaging (OBI) cone beam CT systems, while providing a considerably less dose to the patient. Categories: Medical Physics, Radiation Oncology Keywords: cbct, fbct, fan beam, image quality, dose, uniformity Introduction And Background Purpose The purpose of this paper is to review and compare cone beam CT (CBCT) and fan beam CT (FBCT) and their respective image quality. Better image quality will improve visualization of anatomical detail, increase ability to diagnose disease, and improve accuracy of the image guidance process during radiotherapy. Previous studies by Elstrøm, et al. and Garayoa, et al. laid the foundation for this work [1-2]. These studies implemented various imaging protocols with both FBCT and CBCT and quantitatively analyzed different aspects of the images. Under clinical pelvis and head and neck protocols, numerous scan modes were implemented. The images were then assessed for various image quality parameters to determine which modalities produced the more desirable images. The images produced by FBCT were shown to be of superior quality in clarity, uniformity, anatomical accuracy, low contrast resolution, and delivery of a lower dose to the patient. The following analysis of the literature leads to the conclusion that FBCT is more desirable for in vivo imaging. Background In 1971, the first prototype computer assisted tomography (CAT) scanner was installed in a 1 2 Open Access Review Article DOI: 10.7759/cureus.778 How to cite this article Lechuga L, Weidlich G A. (September 12, 2016) Cone Beam CT vs. Fan Beam CT: A Comparison of Image Quality and Dose Delivered Between Two Differing CT Imaging Modalities. Cureus 8(9): e778. DOI 10.7759/cureus.778
Transcript of Delivered Between Two Differing CT Comparison of Image ... · PDF fileDelivered Between Two...

Received 07/10/2016 Review began 07/20/2016 Review ended 09/06/2016 Published 09/12/2016
© Copyright 2016Lechuga et al. This is an openaccess article distributed under theterms of the Creative CommonsAttribution License CC-BY 3.0.,which permits unrestricted use,distribution, and reproduction in anymedium, provided the originalauthor and source are credited.
Cone Beam CT vs. Fan Beam CT: AComparison of Image Quality and DoseDelivered Between Two Differing CTImaging ModalitiesLawrence Lechuga , Georg A. Weidlich
1. California State University Fresno 2. Radiation Oncology, National Medical Physics and DosimetryComp., Inc
Corresponding author: Lawrence Lechuga, [email protected] Disclosures can be found in Additional Information at the end of the article
AbstractA comparison of image quality and dose delivered between two differing computed tomography(CT) imaging modalities—fan beam and cone beam—was performed. A literature review ofquantitative analyses for various image quality aspects such as uniformity, signal-to-noiseratio, artifact presence, spatial resolution, modulation transfer function (MTF), and lowcontrast resolution was generated. With these aspects quantified, cone beam computedtomography (CBCT) shows a superior spatial resolution to that of fan beam, while fan beamshows a greater ability to produce clear and anatomically correct images with better soft tissuedifferentiation. The results indicate that fan beam CT produces superior images to that of on-board imaging (OBI) cone beam CT systems, while providing a considerably less dose to thepatient.
Categories: Medical Physics, Radiation OncologyKeywords: cbct, fbct, fan beam, image quality, dose, uniformity
Introduction And BackgroundPurposeThe purpose of this paper is to review and compare cone beam CT (CBCT) and fan beam CT(FBCT) and their respective image quality. Better image quality will improve visualization ofanatomical detail, increase ability to diagnose disease, and improve accuracy of the image
guidance process during radiotherapy. Previous studies by Elstrøm, et al. and Garayoa, et al. laidthe foundation for this work [1-2]. These studies implemented various imaging protocols withboth FBCT and CBCT and quantitatively analyzed different aspects of the images. Underclinical pelvis and head and neck protocols, numerous scan modes were implemented. Theimages were then assessed for various image quality parameters to determine which modalitiesproduced the more desirable images. The images produced by FBCT were shown to be ofsuperior quality in clarity, uniformity, anatomical accuracy, low contrast resolution, anddelivery of a lower dose to the patient. The following analysis of the literature leads to theconclusion that FBCT is more desirable for in vivo imaging.
BackgroundIn 1971, the first prototype computer assisted tomography (CAT) scanner was installed in a
1 2
Open Access ReviewArticle DOI: 10.7759/cureus.778
How to cite this articleLechuga L, Weidlich G A. (September 12, 2016) Cone Beam CT vs. Fan Beam CT: A Comparison ofImage Quality and Dose Delivered Between Two Differing CT Imaging Modalities. Cureus 8(9): e778. DOI10.7759/cureus.778

hospital in England [3]. This type of scan involved acquiring sequential, thin axial scansthrough the patient's volume. This method allowed the visualization of soft tissue, which ledthis technology to become very popular. We will refer to it as FBCT. In 2001, a form of computedtomography became commercially available in the United States and became known as ConeBeam CT (CBCT). CBCT using diverging kV X-rays has the ability to visualize anatomicalstructures and acquire images over a much larger volume in a single scan than is capable withFBCT. Building on this, a great advancement was made in the field of radiation therapy with theintegration of linear accelerator mounted CBCT for radiation therapy units. This integration ofCBCT imaging with radiotherapy units has allowed the patient to be imaged directly beforetherapy. This has the advantage of providing pretreatment verification of patient target andnormal tissue anatomy. Therefore, any small changes in the afflicted area’s geometry may bepresented prior to delivering the dose. This simultaneously assures that the patient is correctlypositioned for treatment. As stated in a study by Verellen, et al., the primary goals of imageguided radiotherapy (IGRT) are to optimize the reduction in treatment margins, allow the use ofsharp dose gradients that are common with intensity-modulated radiation therapy (IMRT),utilize “dose painting,” and interactively adapt to changes within the lesion at the time oftreatment [4]. These goals rely heavily on proper images between the planning CT andverification CBCT and minimal patient movement.
Though CBCT is a very dominant form of IGRT used in radiotherapy, it still exhibits manyweaknesses that can affect image quality. As Elstrøm, et al. pointed out, current CBCTacquisition modes are aimed at minimizing dose to the patient [1]. This reduction in dose mayprove to be beneficial to the patient, but it may reduce the quality of the images and theaccuracy of the assigned Hounsfield unit (HU). Compounding this issue is the intrinsic problemthat the large cone geometry produces more artifacts and scatter than the conventional fanbeam CT [1]. With this knowledge in mind, it may prove beneficial to objectively compare theimage quality and dose delivered by CBCT and FBCT. This comparison can be accomplished byanalyzing the quality of reconstructed images, defining specific image quality, and examiningabsorbed dose statistics that will take subjective bias out of the equation.
ReviewMethods and materialsVarious imaging protocols were designed to investigate differences in image quality of CBCTand FBCT. In the study by Elstrøm, et al., all the CBCT scans were performed with a Varian OBISystem (Varian Medical Systems, Inc., CA, USA) on a Trilogy Tx linear accelerator (VarianMedical Systems, Inc., CA, USA) [1]. This system used a kV X-ray source with orthogonaldetectors mounted on the gantry. Utilizing a head and neck protocol, the following parameterswere used: full-fan cone beam with bow tie filtration, source to detector distance of 1500 mm,3-mm slice thickness, transversal FOV of 250 mm, and longitudinal FOV of 175 mm.Furthermore, for the fan beam CT, two multi-slice scanners (Mx8000 IDT 16 and BB16),(Phillips Medical Systems, Wisconsin, USA) were used under standard multi-slice CT head andneck protocol. The protocol incorporated the parameters: 250 mm FOV, 512x512 pixel matrix,sharp filter, 3-mm slice thickness, and 16x0.75-mm collimation. Five different scanacquisitions and two different exposures were used for the CBCT and fan beam CT respectively(see Table 1) [1].
2016 Lechuga et al. Cureus 8(9): e778. DOI 10.7759/cureus.778 2 of 14

ImageModality Acquisition Mode
PeakVoltage(kVp)
TubeCurrent(mA)
ExposureTime (ms)
RotationRange (Deg)
Number ofProjections
Exposure(mAs)
CBCT
Standard DoseHead (SDH) 100 20 20 200 372 149
Standard DoseHead Full (SDHFS) 100 20 20 360 669 268
High Quality Head(HQH) 100 80 25 200 372 744
High Quality HeadFull (HQHFS) 100 80 25 360 669 1338
OBI1.3 Full Scan(OBI13FS) 125 80 25 360 669 1338
FBCTMx8000 IDT (CTMX) 120 - - - - 150/300
BB16 (CTBB) 120 - - - - 150/300
TABLE 1: Acquisition Modes Under Head and Neck ProtocolAcquisition modes and parameters for CBCT and CT scans under head and neck protocol for the study by Elstrøm, et al. [1]
In a separate study by Garayoa and Castro, images were acquired with both CBCT (Varian OBIsystem with mounted Varian CLINAC 21EX linear accelerator with orthogonally placeddetectors) and FBCT (CT Aquilion LB, Toshiba Medical Systems Corporation, Japan) [2]. Imagesfor CBCT were acquired under the pelvis clinical and pelvis spotlight protocol which used thefollowing parameters respectively: 650/375 projections in 364/200° rotation, detector to sourcedistance of 1500 mm, half-fan/full-fan filter, FOV of 256x256 mm, and a 512x512reconstruction matrix. Moreover, the images from the fan beam CT were acquired in an attemptto match parameters of the CBCT. The fan beam CT used a helical technique with a pitch of0.938 and a 512x512 reconstructed pixel matrix with a FOV of 256 mm. The protocolparameters for CBCT and CT can be seen in Table 2 [2].
2016 Lechuga et al. Cureus 8(9): e778. DOI 10.7759/cureus.778 3 of 14

Scan Type Protocol PeakVoltage
Det. toSource Current Pulse
widthRotation(deg) FOV Projections
CBCT HalfFan
PelvisClinical 125 kVp 150 cm 80 mA 13 ms 364 256x256
mm 650
CBCT FullFan
Pelvis SpotLight 125 kVp 150 cm 80 mA 25 ms 200 256x256
mm 370
Fan BeamCT
PelvisClinical 120 kVp 127.5 cm 80 mA 1 rotation helical 256x256
mm -
TABLE 2: Acquisition Modes for CBCT and CT ScansModes for CBCT and CT scans under pelvis protocols for the study by Garayoa, et al. [2]
In order to evaluate image quality, there have to be some nominal values and features tocompare the results to. For this reason the use of a phantom was employed in the studiesmentioned earlier. For the study by Elstrøm, et al., the Catphan® 504 phantom (The PhantomLaboratory, NY, USA) was used [1]. This cylindrical phantom used three different modules (seeFigure 1) which were the following: CTP 486 uniform water equivalent disk, CTP 404 containingeight inhomogeneity inserts, and the CTP 528 with 21 line pairs/cm [1]. Though similar,Garayoa and Castro’s study used the Catphan® 600 (The Phantom Laboratory, NY, USA), whichcontains five modules as shown in Figure 1 [2]. These modules were the CTP 404, the CTP 486,the CTP 528, and the CTP 591 with a tungsten-carbide bead embedded into uniform material,and finally the CTP 515 with inserts of varying contrast. Each of these modules have manypurposes in evaluating image quality.
FIGURE 1: Catphan Modules Used in the Studies Discussed
2016 Lechuga et al. Cureus 8(9): e778. DOI 10.7759/cureus.778 4 of 14
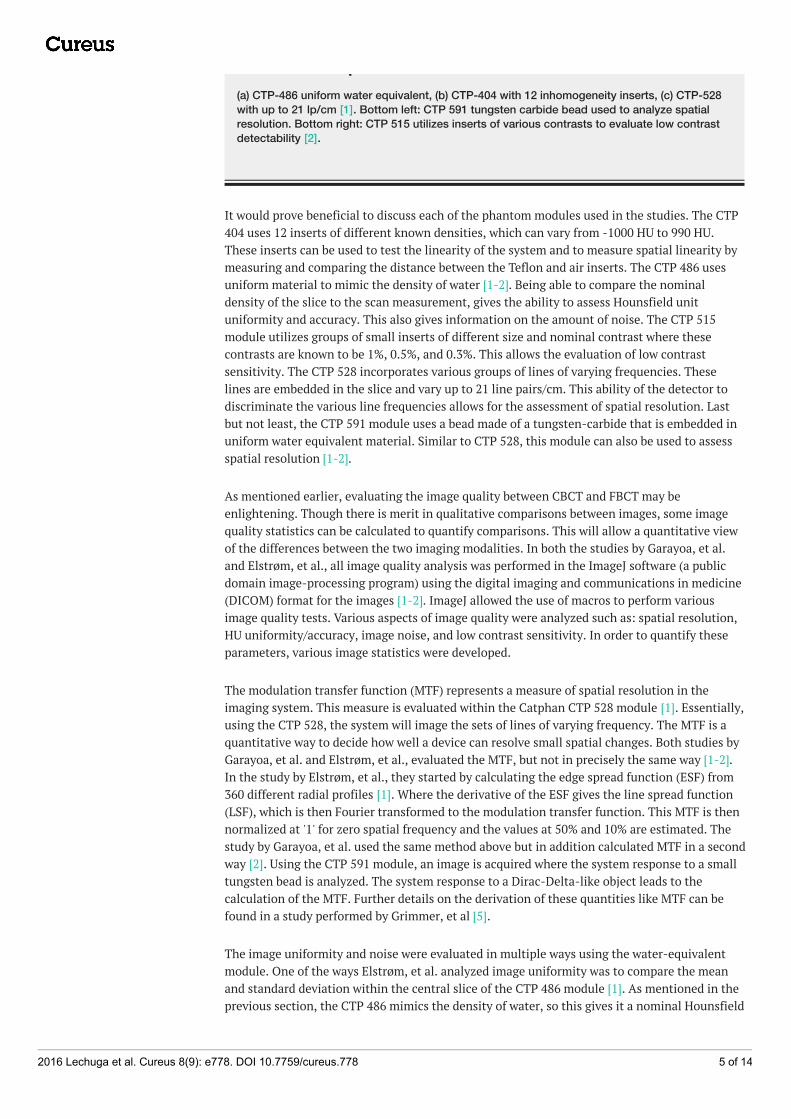
FIGURE 1: Catphan Modules Used in the Studies Discussed(a) CTP-486 uniform water equivalent, (b) CTP-404 with 12 inhomogeneity inserts, (c) CTP-528with up to 21 lp/cm [1]. Bottom left: CTP 591 tungsten carbide bead used to analyze spatialresolution. Bottom right: CTP 515 utilizes inserts of various contrasts to evaluate low contrastdetectability [2].
It would prove beneficial to discuss each of the phantom modules used in the studies. The CTP404 uses 12 inserts of different known densities, which can vary from -1000 HU to 990 HU.These inserts can be used to test the linearity of the system and to measure spatial linearity bymeasuring and comparing the distance between the Teflon and air inserts. The CTP 486 usesuniform material to mimic the density of water [1-2]. Being able to compare the nominaldensity of the slice to the scan measurement, gives the ability to assess Hounsfield unituniformity and accuracy. This also gives information on the amount of noise. The CTP 515module utilizes groups of small inserts of different size and nominal contrast where thesecontrasts are known to be 1%, 0.5%, and 0.3%. This allows the evaluation of low contrastsensitivity. The CTP 528 incorporates various groups of lines of varying frequencies. Theselines are embedded in the slice and vary up to 21 line pairs/cm. This ability of the detector todiscriminate the various line frequencies allows for the assessment of spatial resolution. Lastbut not least, the CTP 591 module uses a bead made of a tungsten-carbide that is embedded inuniform water equivalent material. Similar to CTP 528, this module can also be used to assessspatial resolution [1-2].
As mentioned earlier, evaluating the image quality between CBCT and FBCT may beenlightening. Though there is merit in qualitative comparisons between images, some imagequality statistics can be calculated to quantify comparisons. This will allow a quantitative viewof the differences between the two imaging modalities. In both the studies by Garayoa, et al.and Elstrøm, et al., all image quality analysis was performed in the ImageJ software (a publicdomain image-processing program) using the digital imaging and communications in medicine(DICOM) format for the images [1-2]. ImageJ allowed the use of macros to perform variousimage quality tests. Various aspects of image quality were analyzed such as: spatial resolution,HU uniformity/accuracy, image noise, and low contrast sensitivity. In order to quantify theseparameters, various image statistics were developed.
The modulation transfer function (MTF) represents a measure of spatial resolution in theimaging system. This measure is evaluated within the Catphan CTP 528 module [1]. Essentially,using the CTP 528, the system will image the sets of lines of varying frequency. The MTF is aquantitative way to decide how well a device can resolve small spatial changes. Both studies byGarayoa, et al. and Elstrøm, et al., evaluated the MTF, but not in precisely the same way [1-2].In the study by Elstrøm, et al., they started by calculating the edge spread function (ESF) from360 different radial profiles [1]. Where the derivative of the ESF gives the line spread function(LSF), which is then Fourier transformed to the modulation transfer function. This MTF is thennormalized at '1' for zero spatial frequency and the values at 50% and 10% are estimated. Thestudy by Garayoa, et al. used the same method above but in addition calculated MTF in a secondway [2]. Using the CTP 591 module, an image is acquired where the system response to a smalltungsten bead is analyzed. The system response to a Dirac-Delta-like object leads to thecalculation of the MTF. Further details on the derivation of these quantities like MTF can befound in a study performed by Grimmer, et al [5].
The image uniformity and noise were evaluated in multiple ways using the water-equivalentmodule. One of the ways Elstrøm, et al. analyzed image uniformity was to compare the meanand standard deviation within the central slice of the CTP 486 module [1]. As mentioned in theprevious section, the CTP 486 mimics the density of water, so this gives it a nominal Hounsfield
2016 Lechuga et al. Cureus 8(9): e778. DOI 10.7759/cureus.778 5 of 14

unit value of zero. Therefore, a scan should return a value of zero for each voxel in the imageand give a mean value of zero. This method measures the system response and calibration.When the standard deviation from the mean is considered, it will give a quantitative measure ofthe variation in the detector response as well as the deconvolution process. One other way thatuniformity was measured was to define a quantity called the uniformity index (UI). The UI takesthe maximum percent difference between the mean HU value of each peripheral region ofinterest (ROI) and the central ROI respectively (see Figure 1) [1]. The study by Elstrøm, et al.defined UI as the following:
This image statistic allows the quantification of the amount of “cupping” and “capping” artifactin the image. The study by Garayoa, et al. defined a statistic called the C-value which alsoquantified the amount of “cupping” and “capping” [2]. A positive value represents capping,while a negative C-value represents cupping.
Another aspect to consider is the signal-to-noise ratio. It is important to not look at solely thelevel of noise in the images, but to look at the ratio of the “true” signal to the noise signal. The“true” signal is the signal that is representative of the true anatomy of the region of interest.The signal from the noise would represent the amount of signal that is due to random scatteringeffects. When the signal-to-noise ratio is decreased, that will produce a grainier image. It isgenerally assumed that the cone-beam imaging modality will intrinsically produce relativelymore noise from scattering due to its large cone geometry [1].
Lastly, another aspect of image quality to consider is a system’s ability to detect objects of lowvisibility or of differing contrast. One way to measure image quality was to define a valueknown as low contrast visibility (LCV). In the study by Elstrøm, et al. two inserts with theclosest HU values, low density polyethylene and polystyrene, were placed in the CTP 404module to be imaged [1]. From this the LCV was calculated via:
where represents the standard deviation in the HU values of the respective inserts [1]. Thismethod allows one to quantify a system’s ability to discriminate small differences in thevisibility of materials.
In addition to the feature of image quality, it is worth discussing the dose delivered by the twodiffering imaging modalities. In a study by Kan, et al. the radiation dose from CBCT and fanbeam CT for three different protocols were investigated [6]. This study acquired all CBCT datausing a Varian OBI. The scanning protocols used can be viewed in Table 3. Fan beam imageswere acquired using a GE Lightspeed RT 16 Multislice CT (GE Healthcare, UK). The protocolspecifics for the FBCT scans can be found in Table 3. Utilizing a female anthropomorphicRANDO® Phantom (The Phantom Laboratory, NY, USA) and Thermoluminescent dosimeters,or TLD-100 chips (Thermo Fisher Scientific, MA, USA), the absorbed dose for various organs
2016 Lechuga et al. Cureus 8(9): e778. DOI 10.7759/cureus.778 6 of 14

and effective dose to the body was calculated [6].
Scan Site Scan Mode Field of View kVp/mAs Slice Thickness Longitudinal Extent
CBCT
Head and Neck Full fan 24 cm - 2.5 mm 15.5 cm
Chest Half fan 40 cm - 2.5 mm 13.7 cm
Pelvis Half fan 40 cm - 2.5 mm 13.7 cm
FBCT
Head and Neck Axial 2.5 mm x 4i 25 cm 120/300 - 15.5 cm
Chest Axial 2.5 mm x 4i 50 cm 120/265 - 13.7 cm
Pelvis Axial 2.5 mm x 4i 50 cm 140/210 - 13.7
TABLE 3: CBCT and FBCT Scan ProtocolsCBCT and FBCT scan protocols used for study by Kan, et al. [6].
To calculate the absorbed dose, the study based the calculation on an Institution of Physics andEngineering in Medicine and Biology (IPEMB) protocol for low-energy X-rays, which resulted inthe following [6-7]:
where:
q= user’s energy in terms on HVL.
N k,q = units of Gy/C, is the air kerma calibration factor for ion chamber at energy
q.
Mq = corrected electrometer reading in C for the ion chamber at the energy q for acertain treatment cone.
Bw,q = backscatter factor for water at the surface with energy q.
= mass energy absorption coefficient of water to air at energy q.
The effective dose to the body, which represents the stochastic health effect risks, wascalculated with the International Commission on Radiological Protection 60 (ICRP60) recommendations that follow:
2016 Lechuga et al. Cureus 8(9): e778. DOI 10.7759/cureus.778 7 of 14

where wR is the weighting factor for radiation type, DT,R is the mean dose absorbed to the
organ, and wT is the tissue weighting factor. The doses to various organs were calculated under
three protocols: head and neck, chest, and pelvis. Utilizing identical TLD placement, this studywas able to compare the delivered dose from CBCT with FBCT [6]. These calculations of dosecan help quantify the real possibility of increased risk of tissue damage and secondary cancersfrom the two differing CT systems.
ConclusionsResultsIn the comparison performed by Elstrøm, et al. on CBCT vs CT, the edge spread function wasused to calculate the MTF for various scans (see Table 1) [1]. As listed in Table 4, it was foundthat CBCT outperformed fan beam CT in having a greater MTF value at both 50% and 10%. Itwas suggested by Elstrøm, et al. that a reduction in MTF values on full rotation scans may be aresult of increased mechanical instability of the full rotation methods compared to the partialscan methods [1]. These results are consistent with a study performed by McCann, et al. wheresimilar MTF values were found for fan beam CT [8]. However, it is important to note that theMTF values obtained by McCann vary greatly with applied protocol [8]. In addition, the studyperformed by Garayoa, et al. found similar results comparing CBCT to FBCT under theparameters listed in Table 2 [2]. That is, CBCT showed higher spatial resolution than the fanbeam CT system. Garayoa expains that the CBCT’s greater resolution is related to the smallersize detectors that are present in the CBCT system compared to fan beam CT [2].
2016 Lechuga et al. Cureus 8(9): e778. DOI 10.7759/cureus.778 8 of 14

Image Parameter Uniformity Index (UI) MTF (lp/cm) 50% / 10% LCV Mean HU in Water Equiv.
CBCT
SDH -2.0± 0.73 5.42/9.39 1.6 ±0.1 -2.0±42.8
SDHFS -1.5±0.55 4.95/8.56 2.4±0.2 -3±27.4
HQH -2.0±0.67 5.39/9.27 3.8±0.2 -2.0±28.5
HQHFS -1.5±0.55 4.61/8.02 5.4±0.3 -4.0±17.1
OBI13FS -1.3±0.36 4.47/7.72 6.6±0.3 0±14.4
FBCT
CTMX (150 mAs) -0.125±0.18 3.44/6.10 6.6±0.5 18±8.1
CTMX (300 mAs) 0.125±0.12 3.39/5.99 9.6±0.3 17±5.7
CTBB (150 mAs) -0.25± 0.06 3.69/6.68 5.6±0.4 12±9.3
CTBB (300 mAs) -0.25±0.06 3.67/6.66 8.4±0.25 12±6.6
TABLE 4: Image Quality ValuesVarious image quality values for CBCT and FBCT are given for the study by Elstrøm, et al. [1].
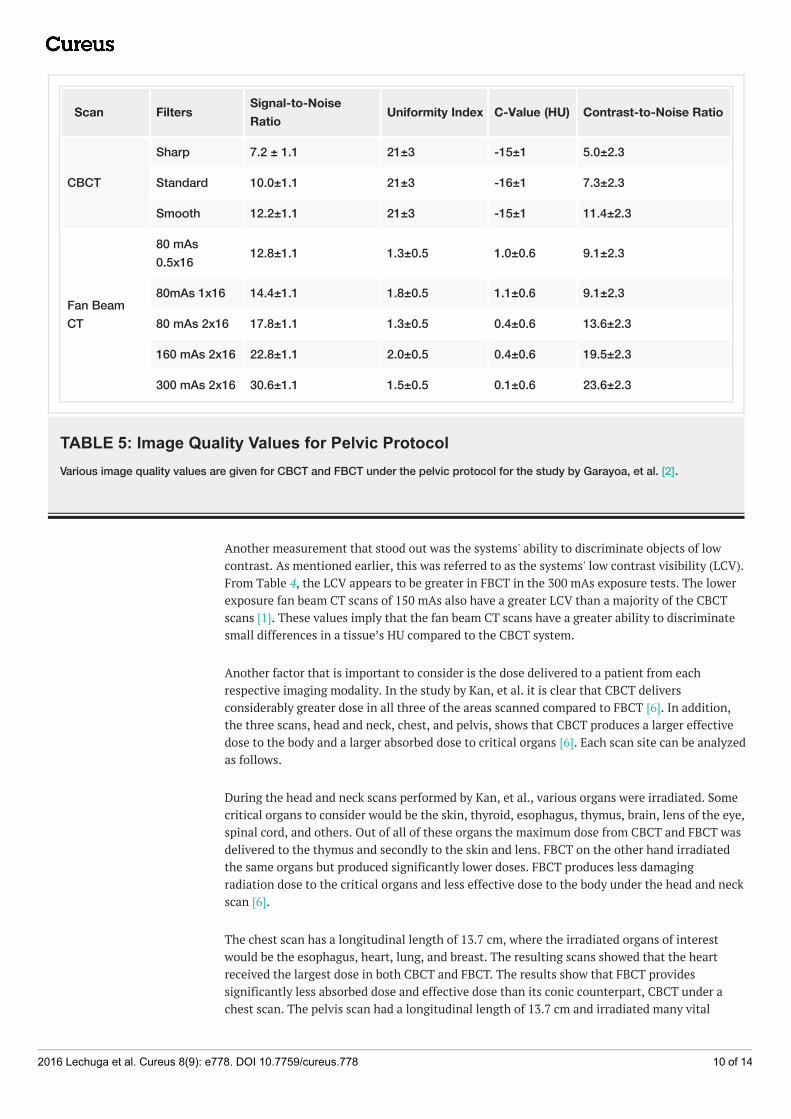
Both studies performed by Elstrøm, et al. and Garayoa, et al. generated similar results whenuniformity and noise were considered [1-2]. In Elstrøm’s study, uniformity was studied by usingthe CTP486 module mentioned earlier [1]. When the mean values and standard deviation werestudied (see Table 4) within the uniform disk, CBCT demonstrated a more accurate mean valuethan fan beam for the known value of '0' HU. When the standard deviation is taken intoconsideration, FBCT shows considerably smaller deviations compared to that of CBCT. Thisleads to the suggestion that fan beam CT produces images with less random noise. Scattering,beam hardening, and noise can bring about artifacts in the images. When looking at theuniformity index in Table 4 calculated by Elstrøm, et al. we can see that all CBCT scan modesproduced a far greater uniformity index [1]. This was also the case in the Garayoa, et al. studywhere CBCT produced a much greater uniformity index and C-value as seen in Table 5 [2]. Thegreater UI and C-values result in images that have greater presence of artifacts in the CBCTimages such as: capping, cupping, ring, and streaking artifacts. CBCT has much greater noiseand artifact presence; however, the signal-to-noise ratio is lower compared to fan beam CT. TheCBCT will have more grainy images, as the “true” signal will be drowned out by the large noisesignal.
2016 Lechuga et al. Cureus 8(9): e778. DOI 10.7759/cureus.778 9 of 14
Scan Filters Signal-to-NoiseRatio Uniformity Index C-Value (HU) Contrast-to-Noise Ratio
CBCT
Sharp 7.2 ± 1.1 21±3 -15±1 5.0±2.3
Standard 10.0±1.1 21±3 -16±1 7.3±2.3
Smooth 12.2±1.1 21±3 -15±1 11.4±2.3
Fan BeamCT
80 mAs0.5x16 12.8±1.1 1.3±0.5 1.0±0.6 9.1±2.3
80mAs 1x16 14.4±1.1 1.8±0.5 1.1±0.6 9.1±2.3
80 mAs 2x16 17.8±1.1 1.3±0.5 0.4±0.6 13.6±2.3
160 mAs 2x16 22.8±1.1 2.0±0.5 0.4±0.6 19.5±2.3
300 mAs 2x16 30.6±1.1 1.5±0.5 0.1±0.6 23.6±2.3
TABLE 5: Image Quality Values for Pelvic ProtocolVarious image quality values are given for CBCT and FBCT under the pelvic protocol for the study by Garayoa, et al. [2].
Another measurement that stood out was the systems' ability to discriminate objects of lowcontrast. As mentioned earlier, this was referred to as the systems' low contrast visibility (LCV).From Table 4, the LCV appears to be greater in FBCT in the 300 mAs exposure tests. The lowerexposure fan beam CT scans of 150 mAs also have a greater LCV than a majority of the CBCTscans [1]. These values imply that the fan beam CT scans have a greater ability to discriminatesmall differences in a tissue’s HU compared to the CBCT system.
Another factor that is important to consider is the dose delivered to a patient from eachrespective imaging modality. In the study by Kan, et al. it is clear that CBCT deliversconsiderably greater dose in all three of the areas scanned compared to FBCT [6]. In addition,the three scans, head and neck, chest, and pelvis, shows that CBCT produces a larger effectivedose to the body and a larger absorbed dose to critical organs [6]. Each scan site can be analyzedas follows.
During the head and neck scans performed by Kan, et al., various organs were irradiated. Somecritical organs to consider would be the skin, thyroid, esophagus, thymus, brain, lens of the eye,spinal cord, and others. Out of all of these organs the maximum dose from CBCT and FBCT wasdelivered to the thymus and secondly to the skin and lens. FBCT on the other hand irradiatedthe same organs but produced significantly lower doses. FBCT produces less damagingradiation dose to the critical organs and less effective dose to the body under the head and neckscan [6].
The chest scan has a longitudinal length of 13.7 cm, where the irradiated organs of interestwould be the esophagus, heart, lung, and breast. The resulting scans showed that the heartreceived the largest dose in both CBCT and FBCT. The results show that FBCT providessignificantly less absorbed dose and effective dose than its conic counterpart, CBCT under achest scan. The pelvis scan had a longitudinal length of 13.7 cm and irradiated many vital
2016 Lechuga et al. Cureus 8(9): e778. DOI 10.7759/cureus.778 10 of 14

organs such as the ovary, uterus, small intestine, bone marrow in the iliac crest, bladder, colon,rectum, and skin. The largest dose was delivered to the head and the skin for both CBCT andFBCT. This third scan tells the same story as the previous two scan sites discussed [6]. FBCTshowed again that it provides a lower absorbed dose to the critical organs and lower effectivedose than CBCT scans of the pelvis region. From Table 6, it can be seen that FBCT provides lessabsorbed dose and effective dose than the CBCT modality in every area including the thymus,heart, small intestine, skin, and overall effective body dose [6].
Scan Protocol Max organ dose Dose to skin (cGy) Effective Dose (mSv)
FBCT
Head and Neck Thymus 3.8 cGy 4.5 3.6
Chest Heart 3.0 cGy 3.0 6.9
Pelvis Small Intestine 3.0 cGy 3.0 10.0
CBCT
Head and Neck Thymus 11.1 cGy 6.7 10.3
Chest Heart 6.7 cGy 6.4 23.6
Pelvis Small Intestine 6.2 cGy 5.4 22.7
TABLE 6: Dose ComparisonComparison of absorbed dose to various areas and effective dose from CBCT and FBCT under a head and neck, chest, andpelvis scan [6].
DiscussionThe quantitative analysis of the image quality studies comparing cone beam CT and fan beamCT brought forth many results. The fan beam CT system appears to have lower artifactpresence, less noise, greater signal-to-noise ratio, and a greater ability to discriminate lowcontrast objects compared to CBCT. Given that CBCT systems are intrinsically more proneto scattering, beam hardening, and artifacts, the images are grainier and less uniform. CBCTshowed relative superiority in the MTF readings compared to FBCT. These greater MTF valuesimply that CBCT has a greater ability to distinguish small spatial variations, though itsimportant to reiterate that these MTF values can vary greatly on protocol as mentioned earlier.
These image quality measurements were taken to remove human bias and provide a numericalway to evaluate specific aspects of image quality. Although this is important, it may take thisevaluation full-circle to apply qualitative analysis to actual images taken by the two competingsystems. The images in Figure 2 were taken with an anthropomorphic head phantom byElstrøm, et al. [1]. The CBCT images (b)-(f) show a greater presence of crescent artifact in theneck, as well as streaking throughout the image compared to the minimal artifacts with FBCT.
2016 Lechuga et al. Cureus 8(9): e778. DOI 10.7759/cureus.778 11 of 14

FIGURE 2: Anthropomorphic Head PhantomReconstructed anthropomorphic head phantom images taken by (a) CT (b)-(f) OBI CBCT. Fromleft to right on CBCT: SDH, SDHFS, HQH, HQHFS, and OBI13FS reconstructions [1].
Figure 3 shows clinical examples of CBCT and FBCT images in axial and sagittal orientation fora head and neck IGRT case. As seen, the FBCT image is more anatomically revealing and clear.From these reconstructed images, it appears that fan beam CT systems produce betterdefined and more anatomically correct images compared to the cone beam CT systems.
FIGURE 3: FBCT vs CBCTCone beam CT (left) vs. fan beam CT (right) of head and neck IGRT in axial and sagittalorientation.
Aside from pure image quality, the patient receives significantly less radiation per scan underFBCT than CBCT, around two to three times less dose to be more exact [6]. This aspect isimportant to consider, given that some treatments can have numerous fractions that require
2016 Lechuga et al. Cureus 8(9): e778. DOI 10.7759/cureus.778 12 of 14

daily scans. These daily scans can cause large amounts of dose to accumulate on critical organs.Furthermore, the effective dose is considerably greater for those patients undergoing CBCTscans for IGRT, which can increase the chance of secondary cancers. In the study by Kan, et al.,the linear no-threshold model describes that with a patient receiving daily treatment of 35fractions for prostate cancer, the CBCT scans will deliver approximately 800 mSv, which couldincrease the secondary cancer risk by 4.0% [6].
With all of the aforementioned image parameters in mind, it can be seen from Table 7 thatFBCT outperforms CBCT in various areas. Fan beam CT produces overall superior images due tothe uniformity, accuracy, and clarity. These results not only indicate better image quality, italso allows the patient to receive considerably less dose with each successive scan, lowering therisk of secondary cancers and irreparable damage to critical organs. With the help of variousstudies discussed in this work, it can be concluded that images taken directly before treatmentwith CBCT suffer from a drop in quality and visualization with an increased risk of adversehealth effects compared to FBCT images.
Image Criteria Supporting MeasurementsPreferrable System
CBCT FBCT
Spatial Resolution MTF x
Noise in Image SNR, Water Equivalent Std Dev x
Low Contrast Resolution Low Constrast Visibility x
Uniformity Image Artifacts C- Value Uniformity Index x
Anatomic Visualization UI, head phantom reconstruction, C Value x
Dose to Patient Effective Dose, Absorbed dose to patient x
TABLE 7: Summarized Results Comparing CBCT and FBCTSummarized results from Elstrøm, et al., Garayoa, et al., and Kan, et al. showing the preferable system for various aspects [1-2,6].
Overall this review covers important image quality aspects regarding uniformity, noise, spatialresolution, low contrast visibility, and overall patient dose, but it may prove beneficial toextend this review to cover more aspects in the future. Further research areas should includemore variety of protocols and the system’s dynamic range.
Additional InformationDisclosuresConflicts of interest: In compliance with the ICMJE uniform disclosure form, all authorsdeclare the following: Payment/services info: All authors have declared that no financialsupport was received from any organization for the submitted work. Financial relationships:All authors have declared that they have no financial relationships at present or within theprevious three years with any organizations that might have an interest in the submitted work.Other relationships: All authors have declared that there are no other relationships or
2016 Lechuga et al. Cureus 8(9): e778. DOI 10.7759/cureus.778 13 of 14

activities that could appear to have influenced the submitted work.
References1. Elstrøm U, Muren L, Peterson J, Grau C: Evaluation of image quality for different kV cone-
beam CT acquisition and reconstruction methods in the head and neck region. ActaOncologica. 2011, 50:908-917. 10.3109/0284186X.2011.590525
2. Garayoa J, Castro P: A study on image quality provided by a kilovoltage cone-beam computedtomography. J Appl Clin Med Phys. 2013, 14:239-257. Accessed: March 5, 2016:http://www.jacmp.org/index.php/jacmp/article/view/3888.
3. Richmond C: Sir Godfrey Hounsfield. BMJ. 2004, 329:687. 10.1136/bmj.329.7467.6874. Verellen D, De Ridder M, Storme G: A (short) history of image-guided radiotherapy . Radiother
Oncol. 2008, 86:4-13. 10.1016/j.radonc.2007.11.0235. Grimmer R, Krause J, Karolczak M, Lapp R, Kachelriess M: Assessment of spatial resolution in
CT. IEEE Nucl Sci Symp Conf Rec. 2008, 5562-5566. 10.1109/NSSMIC.2008.47745086. Kan M, Leung L, Wong W, Lam N: Radiation dose from cone beam computed tomography for
image-guided radiation therapy. Int J Radiat Oncol Biol Phys. 2008, 70:272-279.10.1016/j.ijrobp.2007.08.062
7. Klevenhagen S, Aukett R, Harrison R, Moretti C, Nahum A, Rosser K: The IPEMB code ofpractice for the determination of absorbed dose for x-rays below 300 kV generating potential(0.035 mm Al - 4 mm Cu HVL; 10 - 300 kV generating potential). Phys Med Biol. 1996,41:2605-2625.
8. McCann C, Alasti H: Comparative evaluation of image quality from three CT simulationscanners. J Appl Clin Med Phys. 2004, 5:55-70. Accessed: March 6, 2016:http://jacmp.org/index.php/jacmp/article/view/1978. 10.1120/jacmp.v5i4.1978
2016 Lechuga et al. Cureus 8(9): e778. DOI 10.7759/cureus.778 14 of 14