Deliverable n°D7-2 European workshop and publication of ...
29
Forwast Deliverable 7-2 1/29 SIXTH FRAMEWORK PROGRAMME PRIORITY [policy-oriented research priority SSP 5A] SPECIFIC TARGETED RESEARCH OR INNOVATION PROJECT FORWAST Overall mapping of physical flows and stocks of resources to forecast waste quantities in Europe and identify life-cycle environmental stakes of waste prevention and recycling Contract number: 044409 Deliverable n°D7-2 European workshop and publication of proceedings Due date of deliverable: 30 th November 2009 Actual submission date: 10 th January 2009 Start date of project: 1 st March 2007 Duration: 2 years and 9 months Organisation name of lead contractor for this deliverable: BRGM Revision: final Project home page: http://forwast.brgm.fr Project co-funded by the European Commission within the Sixth Framework Programme (2002-2006) Dissemination Level PU Public PU PP Restricted to other programme participants (including the Commission Services) RE Restricted to a group specified by the consortium (including the Commission Services) CO Confidential, only for members of the consortium (including the Commission Services)
Transcript of Deliverable n°D7-2 European workshop and publication of ...

Forwast Deliverable 7-2
1/29
SIXTH FRAMEWORK PROGRAMME
PRIORITY [policy-oriented research priority SSP 5A]
SPECIFIC TARGETED RESEARCH OR INNOVATION PROJECT
FORWAST
Overall mapping of physical flows and stocks of resources to forecast waste quantities in Europe and identify life-cycle environmental stakes of waste prevention and recycling
Contract number: 044409
Deliverable n°D7-2
European workshop and publication of proceedings
Due date of deliverable: 30th November 2009 Actual submission date: 10th January 2009
Start date of project: 1st March 2007 Duration: 2 years and 9 months Organisation name of lead contractor for this deliverable: BRGM
Revision: final
Project home page: http://forwast.brgm.fr
Project co-funded by the European Commission within the Sixth Framework Programme (2002-2006)
Dissemination Level PU Public PU PP Restricted to other programme participants (including the Commission Services) RE Restricted to a group specified by the consortium (including the Commission Services) CO Confidential, only for members of the consortium (including the Commission Services)

Forwast Deliverable 7-2
2/29
Key words : Forwast, Valorisation Plan of the results Authors: VILLENEUVE, J., LEMIERE, B. (2009) – FORWAST deliverable 72, European workshop and publication of proceedings.
© BRGM, 2009, this document cannot be reproduced without formal authorisation of BRGM.

Forwast Deliverable 7-2
3/29
CONTENTS
1. WORKSHOP SUMMARY REPORT..........................................................................................4
2. WORKSHOP PROGRAM..........................................................................................................6
3. PRESENTATIONS AND PROCEEDINGS ................................................................................8
4. LIST OF PARTICIPANTS........................................................................................................26
5. CONCLUSION.........................................................................................................................27

Forwast Deliverable 7-2
4/29
1. WORKSHOP SUMMARY REPORT
Rationale
The activities of the European economy use a considerable amount of natural resources that end in products, emissions and waste. Products accumulate in the antropospheric stock (buildings, infrastructure, machines, cars, etc.). The degradation of stocks produces emissions. The demolition, dismantling of stocks produces new resources and waste. In turn, the recycling and treatment of waste produces new resources and emissions. What will be our future waste? Where will they come from, in which quantity? How can we act now to favour the productivity of resources and minimise the environmental impact of our economy? The understanding of this complex loop within the economy from natural resources to waste and waste to resources, accompanied by its leaks of emissions to the environment is the core objective of Forwast.
Background
The organisation of an international workshop dedicated to EC Waste Policy is one of the main communication action of the project results. It constitutes the Forwast deliverable 7.2, and is accompanied by this report.
The workshop covers most of the work performed during the project and reflects its structure. The aims of the workshop were to:
• stimulate the dissemination of Forwast results, • raise awareness of effective implementation of Physical Input-Output modelling of
EU 27 economy, including the accounting of waste, • present forecasts of flows and stocks of resources, waste generation and global
environmental impact under 9 different scenarios mixing macro-economic hypothesis and waste management policies,
• promote the model developed in Forwast for supporting the choice of future waste policies,
• stimulate the utilisation of knowledge by various stakeholders interested in LCA, environmental statistics, sectoral associations, etc.
Workshop record
The final Forwast workshop titled: “Overall mapping of physical flows and stocks of resources to forecast waste quantities in Europe and identify life-cycle environmental stakes of waste prevention and recycling” was held on the 25 November 2009 at the Alexandersalen, Bispetorvet 1-3, University of Copenhagen.
The workshop was organized by BRGM with logistic support of 2.0 LCA Consultants. 39 conference participants from 11 European countries represented different stakeholders involved in waste management, environmental statistics and assessments. Present were representatives of World, European, National administrations and institutes, universities and research institutes, industry associations, consultants.
The workshop language was English.

Forwast Deliverable 7-2
5/29
The workshop contained 5 sessions, consisting in 6 presentations where the method, data acquisition and model’s results were presented. It was followed by a round-table discussion where workshop participants got opportunities to exchange views and thoughts on the possible uses of such a model. Workshop announcement and report
Information materials including the conference announcement (see Annex 1) and the registration form were published in internet on the Forwast website. The conference was announced on:
• http://forwast.brgm.fr/ • LCT forum of the JRC ISPRA ('[email protected]') • The “environmental technologies research” newsletter n° 17 (available at:
http://forum.europa.eu.int/Public/irc/rtd/eesdwatkeact/info/data/ETR_index.htm) • on Baltic21 Institute web-page:
http://www.baltic21institute.org/news/news/euprojectonwasteforecast.5.764bd915124e8f2573d80006353.html on “Sustainable development online” (http://sd-online.ewindows.eu.org/)
• on the “Cleaner production” network site (http://www.cleanerproduction.com/) There was also information about the workshop via personnel contacts of the coordinator. This report is designed as a brief summary of the workshop presentations and round-table discussion feedback. The information on the event, including all the presentations is available at http://forwast.brgm.fr/Conference.asp.

Forwast Deliverable 7-2
6/29
2. WORKSHOP PROGRAM
FORWAST f ina l workshop Overall mapping of physical flows and stocks of resources to forecast waste
quantities in Europe and identify life-cycle environmental stakes of waste prevention and recycling
November 25, 2009, Copenhagen, Denmark
Final agenda
The final workshop is aimed at giving an overview of the methodology and disseminating the results of the project. It offers an opportunity to discuss the interest of future waste policies of prevention and recycling.
9:00 – 9:30. Welcome and opening
• the Forwast project (Jacques Villeneuve, BRGM)
9:30 – 11:00. Methodology
• the Forwast model (Jannick Schmidt, 2.-0 LCA Consultants) • data mining in 27 European countries (Gerold Hafner, U. Stuttgart,
Alina Rejman – Burzynska, GIG) • 9 scenarios of waste management for the next 25 years (Paul Brunner,
Edi Munawar, TU Vienna)
11:00 – 11:15. Coffee break
11:15 – 12:30 Results (Jannick Schmidt, 2.-0 LCA Consultants)
• the flows and stocks of resources in Europe • the future waste generation in 9 scenarios • the stakes of prevention and recycling
12:30 – 13:30. Lunch
13:30 – 14:15. Limits of the approach (Jannick Schmidt, 2.-0 LCA Consultants)
• the IO aggregation level for waste accounting • the products composition • the data gaps

Forwast Deliverable 7-2
7/29
14:15 – 15:00. Perspectives
• use of the FORWAST method in the ecoinvent LCI-database – ”detailed and refined version of the FORWAST-model” (Bo Weidema, 2.-0 LCA Consultants)
15:00 – 16:00. Round table discussion/ questions of the audience
16:00 – 16:30. Closing

Forwast Deliverable 7-2
8/29
3. PRESENTATIONS AND PROCEEDINGS
Welcome and opening - the Forwast project (Jacques Villeneuve, BRGM)
Presentation available at:
http://forwast.brgm.fr/Documents/Workshop/Forwast_Jacques_Workshop_Intro.pdf
Forwast happened at the 5th call of FP6, on the theme “Forecasting and developing innovative policies for sustainability in the medium and long term”. The project had an initial duration of 2 years delayed to 2.75 years. The total budget is 1.4 MEuro, with a CE contribution of 966 kEuro. It gathers 151 Man-months efforts from the partners: BRGM (F), 2.0 LCA (DK), RMA (A), TU Vienna (A), U. Stuttgart (D), U. Thessaloniki (GR), GIG (PL)
The objectives are to:
• Provide an inventory of the historically cumulated physical stock of materials in EU-27,
• Forecast the expected amounts of waste generated, per resource category, in the next 25 years,
• Provide an assessment of the life-cycle wide environmental impacts from different scenarios of waste prevention, recycling and waste treatment in the EU-27.
The project is organised in three main steps as reflects the organisation of the day:
• The Forwast model
• Feeding the model: data mining
• Forecasting exercise: the definition of scenarios and the results
The results include the flows and stocks of resources in Europe, the future waste generation in 9 scenarios and the stakes of prevention and recycling.
Following the project’s presentation, the limits and perspectives are given to open the roundtable discussion with the scientific Officer and the advisory board members, and an open debate ends the workshop.
Before starting the presentation of the model, a short introduction to the project concepts (terms) is given. The model is a Leontief-type environmentally extended, quasi-dynamic, physical input-output model covering the EU27. The Physical IO model is built from Physical supply and use tables including environmental accounts.

Forwast Deliverable 7-2
9/29
The Supply table (monetary) gives the (monetary) production of products by industries. It should ideally be diagonal, but industries may supply co-products
The Use table (monetary) gives the (monetary) use of products by industries (intermediate consumption) and the “final uses”.
To elaborate the Input Output Table (IOT) from Supply and Use, three steps are necessary:
• Combining (balancing) the SUTs: Output by industry = Input by industry, Total supply by product = Total use by product
• Build a matrix of input coefficients for intermediate consumption (technology matrix A)
• Solve the Leontief system in order to obtain the production necessary to obtain a final demand
In Forwast, the IOT is physical, meaning that the framework for data mining has been to set the following matter balances:
• Per activity: Supply + supply of waste + stock change + emissions = Use + Resources + use of waste
• Per product: Supply + Import = Use + Export
Methodology 1 - The Forwast Model (Jannick Schmidt, 2.-0 LCA Consultants)
Presentation available at:
http://forwast.brgm.fr/Documents/Workshop/FORWAST_Jannick1_model.pdf
The model calculates the following outputs: waste generation in the years 2003 to 2035, the accumulated stocks in the same period and the environmental impact of EU27 production and consumption.
It is based on a mass balance approach. At a global level, the total resources used minus the total emissions are balanced by the waste supplied and the stock change. (The stock here is considered as being made of products that have not yet become a waste or an emission). At an intermediate step, the resources are transformed into products, products into other products, within the global mass balance.

Forwast Deliverable 7-2
10/29
The (waste generation + stock change) is calculated from the use of products and resources, and from the use of waste in waste treatments, as shown below:
ProductsResources Waste
Physical activity Waste treatment activity
To identify the waste supplied and the stock change, a “stock degradation” time factor is used, representing the fraction of the (waste supplied + stock change) that becomes waste in years 1 to 100.
Question (Hubert Reisinger): Is stock equivalent to the amount of products already produced, but to be supplied next year? Answer: the graph on the slide deals with one year, it includes any previously accumulated stock not yet used
Question: Is Import/export included ? Answer: Yes
Question: Is stock degradation along time considered ? Answer: Yes, taken into account
Question (Michele Galatola): Is there any detailed evaluation of degradation according to product type ? Answer: No. Stock degradation is estimated globally
Question: Is food waste considered as stock ? Answer: it would be stock not in use (it cannot become products)
A discussion followed on the distinction between waste and stock addition (stock not in use). Waste is made of products that are known never to be used again, and treated so, while stock not in use is made of products that may never to be used again. This difference might be impractical to apply, though it is easy to understand for equipment products (vehicles, computers…).
In the model, Waste and Stock variation are actually split according to degradation coefficient (for instance, 0.04 for media), and not from mined data.
Question (Hubert Reisinger): What about accumulated out of use products in household and in landfill? Answer: they are not distinguished here: this is stock not in use
The waste treatment activities in the physical SU tables are fed using a distribution matrix (J) for each waste supplied. 34 waste types are distinguished.

Forwast Deliverable 7-2
11/29
At the end, the IO model is mixing physical units for production activities (per kg supplied), physical units for waste treatment activities (per kg treated) and monetary units for non-physical production activities (services). It is made using the “by-product technology model”.
The first model output, Environmental impact, is obtained from the Leontief inverse of the hybrid IO model. As previously mentioned, the stock degradation matrix sets the fraction of a stock appearing in year “x” that become waste in year “x+i” (i = 1 to 100). The model includes the calculation of the time series that figures the “decrease” past stocks and the waste arising from them. The system is implemented using the historical stock accumulation (since 1903) and allows the forecasting of stocks & waste up to 2035. This supplies the second and third model outputs: waste generation (including from previous stocks) and accumulated stock calculation.
As a conclusion, it was underlined that
• the model is self-validating (by crossed mass balances by activities and products),
• the overall model outputs are only affected by uncertainties in resource and emission data
• the model represents the State-of-art IO-model (hybrid unit model, where waste is correctly modelled)
Question (Alejandro Villanueva): As a quasi dynamic model, is it based on constants? Or on constant technology? Answer: Yes. We just scaled up or down 2003 technology.
Question (Michele Galatola): How the model manages products not produced in EU? Answer: they are assumed to be produced under EU technology.
Question: Where do the emissions take place? Answer: We used an old US IO table to represent the rest of the world that does not tell how much waste is produced outside EU. There is anyhow a need for a LCA-based EIA.
Question (Michele Galatola): How are determined the emissions on the waste treatment processes? Answer: From waste processing sector data. We even included the products required by the waste treatment.
Remark (Hubert Reisinger): We do not know much about material flows outside the EU… Answer: true
Take the example of paper production: Imports, Exports are well known. Use is less known, but is calculated by monetary balance between Supply and Use. The distribution is made using monetary information.
Question (Christian Fisher): The price information is heterogeneous. How to relate it with uses by different activities? Answer: This can be done by manual redistribution if we have data.

Forwast Deliverable 7-2
12/29
Methodology 2 – In-depth data Mining in 4 European countries (Gerold Hafner, U. Stuttgart) - Austria, Denmark, France, Germany (WP 3)
Original photo from: http://gohelle.free.fr/gnoires/k/k.htm
Presentation available at:
http://forwast.brgm.fr/Documents/Workshop/FORWAST_Gerold_WP3.pdf
The WP 3 objectives were to collect and validate data for 4 specific countries: Austria, Denmark, France, Germany
The Main Working Steps include: the definition of operational data structure in relation with WP1 and WP2, the collection of statistics and additional data, the review and verification of acquired data, the identification of missing data, the processing / substitution of missing data, the plausibility check and Data Reconciliation and the identification of potentials and difficulties for completing data collection.
The starting data Sources are the monetary Supply and Use Matrix from EUROSTAT, giving 59 x 59 categories (NACE 01 – 95) for the reference year: 2003. The Supply table is in “basic price” (price of products at the output gate) whereas the Use table is in “purchaser price” (basic price + transport and trade price). The first step of “data processing” is to transform the Use table into basic price.
The second step consists in disaggregation from 59 to 117 activities (by adding recycling, waste treatments and households activities) to be able to track the waste flows. This requires additional information from PRODCOM (PRODuction COMmunautaire, available at EUROSTAT, giving detailed data of supplied commodities), UNDATA, UNFCC, UNCTAD, British Geological Survey (BGS), Euromines, EPER, EIONET, FAOSTAT and from additional data sources like sectoral data (e.g. iron industry, paper industry, energy economics etc.) and national data (e.g. macroeconomic accounting, environmental accounting, air pollution registers, national statistics etc.). The processing of Eurostat MSUTs is facilitated by the Matrix expander.
To “convert” the monetary tables into physical ones, we use a “Price matrix”. Once the disaggregated PSUTs are obtained, the Resources & Emissions matrices are filled. As explained in the presentation of the model, the balance between uses (product and resources) and supplies (products and emissions) give the remaining terms of the mass balance (stock change + supply of residuals.
This calculation sometimes reveals inconsistencies (negative waste) due to potentially multiple causes: bad prices, wrong disaggregation of the use of some products, wrong

Forwast Deliverable 7-2
13/29
disaggregation of emissions data, poor data quality and thus, each imbalance has to be corrected manually. One difficulty lies in the totally linked calculations in the tables (mass balances per product and per activity) that pass inconsistencies along when changing manually one cell.
The main problems identified are due to:
• the conversion of monetary into physical is sometimes problematic (insufficient level of price information)
• the combination of data obtained from several sources and different statistics leads to inconsistencies
• the differences in system boundaries, aggregation of activities and systematic methodologies influences statistical data.
• the large number of manual adjustments necessary in order to fit to the FORWAST-model. At the end, how many adjustments can be tolerated?
As results of this in-depth data mining, we obtain the balanced monetary and physical tables for Austria, Denmark, France and Germany. The numerous data manipulations and adjustments necessary pose the question of the verification of manipulations and the significance of statistical data.
Methodology 2 – Coverage Data Mining in the other 23 European countries (Alina Rejman – Burzynska, GIG) (WP 4)
Presentation available at:
http://forwast.brgm.fr/Documents/Workshop/Forwast_Alina_WP4-Metodology.pdf
The WP4 objective is to elaborate the MSUTs and PSUTs for the 23 countries not included in WP3. The methodology of data mining follows the recommendations supplied by WP1 & WP2. It consists in data mining & review, verification, estimation of missing data, adjustment of inconsistencies.
The input of data for the model is made of 7 sets of matrices: 1 Eurostat MSUTs, 2 PSUTs, 3 prices, 4 resources, 5 emissions, 6 emissions distribution, 7 residuals

Forwast Deliverable 7-2
14/29
distribution. It is facilitated by “tools” like the basic price converter, the matrix expander, the emissions machine. The main data sources are:
• National sectoral Statistics: Agriculture, Forestry, Industrial Production, etc.
• EUROSTAT, UN Database, FAOSTAT, UNCE Timber Database
• Energy Statistics: IEA Statistics, IMUNDI, etc.
• Minerals: USGS, BGS, PAN
• Metals: IISICES (Steel Yearbook), EAMI, EUROFER,
• Emissions: UNFCCC (National Inventory-CRF)
• Waste: EUROSTAT, EIONET, UN, CEPI, National Waste Management Programs
• Import/Export intra EU-27 and extra EU-27: EUROSTAT, External Trade, ComExt
To make the elaboration of these PSUTs feasible during the course of the project, a reduced version of the matrices (from 117*117 to 57*57) was supplied by 2.0 LCA.
As results of WP4, we obtained the following 117*117 PSUTs: GREECE, IRELAND, NETHERLANDS, POLAND, SLOVENIA, SPAIN, SWEDEN, UNITED KINGDOM, FINLAND, CZECH R.+SLOVAKIA+HUNGARY, ESTONIA+LITHUANIA+LATVIA, and the following 57*57 PSUTs: BELGIUM, BULGARIA, CYPRUS, ITALY, LUXEMBURG, MALTA, Portugal, ROMANIA.
The data gaps identified are: • MSUTs (2003) for some countries are not available from EUROSTAT, in some cases
not consistent, • MSUTs: for confidentiality reasons some products and industries have been merged
and added up, • No available physical data for USE for most of the product / activities categories • Mass data for heterogeneous streams of products were difficult to estimate, different
units from physical data (mass, number,…) • National classifications of products/activities are not exactly harmonized with
CPA/NACE • Lack of data and clear information on mass flows of waste directed to different
activities of waste treatment • For many recycled flows corresponding to FORWAST categories of products
statistical data are not available (except for basic metals)
The main difficulties were that the availability and quality of physical data as well as data processing related to supply, use, import and export, varied significantly between categories of products/industries. The availability of statistical data differed from one country to another.
Two areas of progress related to waste statistics emerged during data mining, which we consider to be of particular importance: there is a need for good quality data and consistent information on mass flows of waste directed to different activities of waste treatment as well as quantity of recycled materials defined in FORWAST.

Forwast Deliverable 7-2
15/29
Methodology 3 - 9 Scenarios of Waste Management for the next 25 years (Paul Brunner, Edi Munawar, TU Vienna)
Presentation available at:
http://forwast.brgm.fr/Documents/Workshop/Forwast_Presentation_Brunner_Munawar.pdf
The preparation of scenarios for simulating the effects of future waste policies was made according to the following procedure:
0. Review former WM scenarios
1. Define macro- economic scenarios
2. Establish a model for Waste Management policies
3. Determine emissions for waste treatment processes
4. Define input into the model using 3 WM scenarios and 3 economic scenarios as well as I/O tables
The calculated output of the model for the 9 scenarios is intended to evaluate the scenarios and draw conclusions regarding the waste hierarchy.
The review of Waste Management Scenarios from literature showed conflicting and contradictory general results due to assessment methods and to criteria, even if clear results for specific wastes such as “recycling of building waste” and “recycling of metals“ appear.
We define new scenarios including three policy options (waste prevention, recycling and waste treatment) on 2 periods: 2010-2015 and 2015-35.
Waste prevention scenario
The procedure identifies the most important waste flows, and the activities resulting in the waste flows. Relevant information is applied about prevention strategies on waste generation activities.
The following waste streams were assessed: C&D wastes, Excavation and soil material, Wood waste, MSW, Service and production sectors, and others
During the first waste reduction period (up to 2015): Application of reduction rates to specific Forwast categories according to expected behaviour evolution (ex: reduction of the share of meat in food).
During the later waste reduction period (2015 - 2035): a further 25 % of waste reduction was added.

Forwast Deliverable 7-2
16/29
Input data were obtained from the I/O model and from D5-3 (% prevention). Waste management system design is taken from D5-4, along with transfer coefficients (emission data) from D5-4. Calculation of outputs is done by using input data, waste management system and transfer coefficients of waste treatment processes.
Waste recycling scenario
The key variables are market prices (primary resources, secondary products), the legal framework, product qualities and the demand for secondary resources (depending on economic conditions).
Input data were obtained from the I/O model. Waste management system design and transfer coefficients are taken from D5-4. Calculation of outputs is done as above.
The demand for construction materials exceeds by ten times the market demand for secondary materials.
Increased recycling rates were applied to specific Forwast categories, according to the expected behaviour evolution (ex: construction material, WEEE).
Waste treatment scenario
The modelling of waste management systems was carried out by MFA and using the STAN software. The European Union targets for the reduction of waste to landfills are: 2010: - 25 %, 2013: - 50 %, 2020: - 65 %. Waste treatment processes considered (as BAT!) are: MBT, incineration, “landfilling”. Transfer coefficients and emission data are consolidated for each WT-process. Consumption emissions are higher than production emissions. Time evolution of emissions is modelled. Focus is set on emissions, particularly of heavy metals. Wastes are important carriers of hazardous materials. Nearly 50% of total Hg and Cd in the economy end up in MSW.
Conclusions
The model was not designed to produce country specific or regionalised scenarios, it was used to produce scenarios for consolidated EU-27. No technology specific scenario was developed, but this may be done later. The nine scenarios defined were calculated by “the Model”. Significant results include emissions calculation from actual flows (independent from emissions declarations), but also to calculate fractions in clean cycles and in sinks, to estimate waste management costs and stranded investments.
Question: Are forecast results in accordance to practice and BATs ? Answer: Such information will be provided in WP6 deliverables.

Forwast Deliverable 7-2
17/29
4. Results (Jannick Schmidt, 2.-0 LCA Consultants)
Presentation available at:
http://forwast.brgm.fr/Documents/Workshop/FORWAST_Jannick2_results.pdf
Data coverage and pre-conditions
The model, as of today, includes 20 countries and provides a 38% coverage of the EU27 economy in GDP terms. The results are upscaled from the available countries for the missing countries according to the GDP ration (EU27=EU20/0.38).
Historical series of GDP from 1971 were used. Extrapolation, according to an exponential law, was made back to 1903. This purely monetary approach should be refined by hypotheses on a more or less material-intensive type of development with time.
The rest of the world is assumed to be identical to EU27, in terms of hypotheses.
Scenario implementation
Prevention scenarios were implemented, with specific hypotheses expressed by sectors (including household behaviour). Examples: the share of meat in food will decrease; a lower waste proportion will result from from better logistics in transport or distribution.
Recycling scenarios were implemented, with specific hypotheses expressed by sectors (in the industry). It was observed that increased recycling affects landfill.
Treatment scenarios were implemented. It was observed that increased recycling and increased incineration affect landfill.
Question (Michele Galatola): How is considered the production of biogas from biowaste ? Answer: The waste treatment activity was assumed to produce gas or electricity. For the treatment scenarios, we assumed there would be no major change in technology or policy.
(Michele Galatola): the evolution depends also upon the availability of plants to process biowaste – the required investment itself depending upon the policy !
Question (Michele Galatola): do you consider operating plants, or plants in construction? Answer: Yes, both.
Question (Christian Fisher): We are not only dealing with Northern EU – are the targets applicable to EU27 ? Answer: this is accounted for by the scenario figures, more conservative than EU targets. We are modelling for the next years higher

Forwast Deliverable 7-2
18/29
waste amounts than those extrapolated from existing statistics. There is a risk of overestimating incineration. Paul Brunner: Two schools exist: follow conventional approaches, or go as far as possible into the reduce/recycle approaches.
Question (Alejandro Villanueva): What is the representativity of available waste statistics against a so comprehensive model ? Answer: We used extra data such as those from recycling sector for validation or difference, beyond raw waste statistics. In some countries, estimations were required.
Question (Alejandro Villanueva): What is the representativity of waste and material flow statistics for the rest of the world ? Is it EU equivalent ? (answered also above).
Accumulated stocks in EU27 in 2003 Stocks still in the economy are by decreasing order of magnitude: Sand, Stone and Gravel (and their products) >> Wood and metal (and their products) > other materials (and their products)
Stocks not in use are, by decreasing order of magnitude: glass & inert >> slag/ash > oil/hazardous waste, and food > other materials
Question (Michele Galatola): Why call this stocks ? it is waste. Answer: this was not called waste because these stocks may still become resources. Alternately, we might call it “waste stocks”
It should be remembered that for most commodities, stocks exceed extracted resources by a factor greater than 102
Question: What about mining waste ? Answer: Tailings were not included in the model (in-situ waste).
Waste generation in EU27 in 2003 Sand, Stone and Gravel > ash slag, food, cement > iron, plastic, manure, paper > rest
Question: should not wet weight data be presented rather than dry weight data (logistics differences are implied) Answer: No, dry weight data are more meaningful for emissions and environmental impact.
Waste generation in EU27 in future scenarios The total waste generation in the baseline macro-economic scenario gives: recycling (9000 Million tons, dry weight) > treatment > prevention (7500 Million tons) in 2035.
It should be remembered that in a high recycling scenario, each original kg of material becomes waste several times, and increases thus total waste statistics even if residual waste is actually reduced!
Question: Is this linked with the fact waste data do not include stocks not in use ?
Question (Michele Galatola): This might be uneasy to follow by listeners not aware of the project idiom… Answer: Waste is not only a cost or a problem. It may be a benefit (available resources, energy)
Question: Why is there a break in slope ? Answer: it is an X-Scale effect
Question (Hubert Reisinger): Can we separate primary and secondary waste ? Answer: Yes, this can be done
Question (Christian Fisher): Does waste treatment include recycling ? Answer: Yes – otherwise the green would be more constant
Forwast Deliverable 7-2
19/29
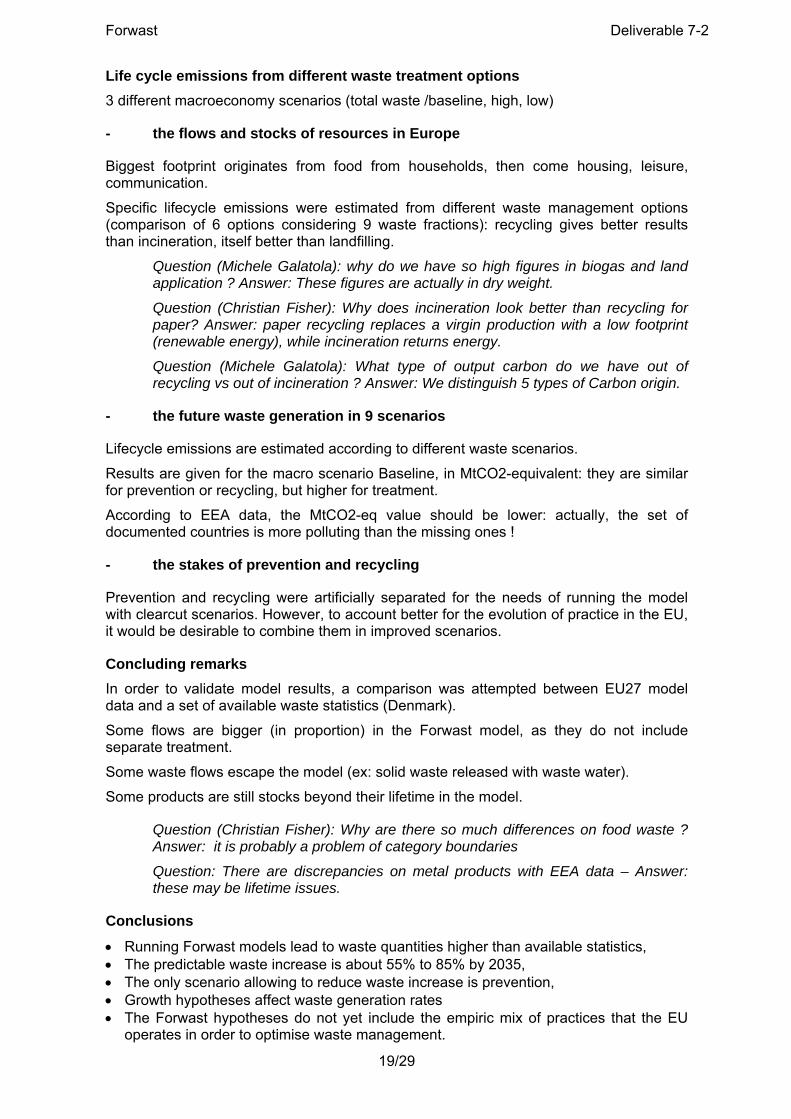
Life cycle emissions from different waste treatment options 3 different macroeconomy scenarios (total waste /baseline, high, low)
- the flows and stocks of resources in Europe
Biggest footprint originates from food from households, then come housing, leisure, communication.
Specific lifecycle emissions were estimated from different waste management options (comparison of 6 options considering 9 waste fractions): recycling gives better results than incineration, itself better than landfilling.
Question (Michele Galatola): why do we have so high figures in biogas and land application ? Answer: These figures are actually in dry weight.
Question (Christian Fisher): Why does incineration look better than recycling for paper? Answer: paper recycling replaces a virgin production with a low footprint (renewable energy), while incineration returns energy.
Question (Michele Galatola): What type of output carbon do we have out of recycling vs out of incineration ? Answer: We distinguish 5 types of Carbon origin.
- the future waste generation in 9 scenarios
Lifecycle emissions are estimated according to different waste scenarios.
Results are given for the macro scenario Baseline, in MtCO2-equivalent: they are similar for prevention or recycling, but higher for treatment.
According to EEA data, the MtCO2-eq value should be lower: actually, the set of documented countries is more polluting than the missing ones !
- the stakes of prevention and recycling
Prevention and recycling were artificially separated for the needs of running the model with clearcut scenarios. However, to account better for the evolution of practice in the EU, it would be desirable to combine them in improved scenarios.
Concluding remarks In order to validate model results, a comparison was attempted between EU27 model data and a set of available waste statistics (Denmark).
Some flows are bigger (in proportion) in the Forwast model, as they do not include separate treatment.
Some waste flows escape the model (ex: solid waste released with waste water).
Some products are still stocks beyond their lifetime in the model.
Question (Christian Fisher): Why are there so much differences on food waste ? Answer: it is probably a problem of category boundaries
Question: There are discrepancies on metal products with EEA data – Answer: these may be lifetime issues.
Conclusions
• Running Forwast models lead to waste quantities higher than available statistics, • The predictable waste increase is about 55% to 85% by 2035, • The only scenario allowing to reduce waste increase is prevention, • Growth hypotheses affect waste generation rates • The Forwast hypotheses do not yet include the empiric mix of practices that the EU
operates in order to optimise waste management.

Forwast Deliverable 7-2
20/29
5. Limits of the approach (Jannick Schmidt, 2.-0 LCA Consultants)
Presentation available at:
http://forwast.brgm.fr/Documents/Workshop/FORWAST_Jannick3_limits_of_the_approach.pdf
The IO aggregation level for waste accounting limits the types of waste. We have 44 different physical products. For example, we have “chemicals nec” in many products.
Another limit is the Product composition (13 substances/components) that does not allow distinguishing many types of waste. The Waste treatment mix (J-matrix) specifies how waste types are treated, e.g. Iron waste: 30% recycling, 5% incineration, 65% landfill. J is based on countries’ existing waste statistics – they underestimate waste generation. Therefore recycling and incineration is likely to be overestimated in the model.
Each country data set is thoroughly validated: - Product balance (input = output) - Negative waste not allowed - Feedstock efficiencies are compared with existing LCI databases - Use – emission balance for fuels - Animal/human emissions and manure based on mass balances for animals and
humans - Samples testing ”normal values”/common sense - Cross checks with statistics
But still, some wrong data entries may escape validation
Data gaps: the available SUTs cover only 20 EU countries ( 38% of EU27 GDP). In the current model, EU20 is scaled up to EU27 with GDP. This affects the representativeness of the EU27 data and the import/export share.
The Indirect land use (the transformation of non-productive land into productive land – often outside EU27 induced by the occupation of land) is not included. This affects GHG-emissions among others.
Another assumption is that EU data (emissions) are representative for the imports/exports from the rest of the world.

Forwast Deliverable 7-2
21/29
6. Perspectives - Use of the Forwast Method in the Ecoinvent LCI-Database – ”Detailed and Refined Version of the Forwast-Model” (Bo Weidema, 2.-0 LCA Consultants)
Presentation available at:
http://forwast.brgm.fr/Documents/Workshop/FORWAST_Bo_in_ecoinvent2.pdf
Limits of Forwast: can we do it better? The limits of Forwast are the high level of aggregation in products & wastes, the difficulty to maintain and document big files (xls). These limits can be overcome in a commercial Database.
Ecoinvent contains 4000 activities/products. The version 3 will be significantly expanded (activities/products), include complete global data sets (IO) as well as hybrid data set (bottom up/industry supplied), time series and macro-economic scenarios. It is continuously updated (several times/year), validated automatically and by manual review (experts group of 50 to 100 people).
Elements of Forwast in Ecoinvent 3 Forwast has been very useful to define the frame of Ecoinvent 3: data format supporting multiple properties, completeness, ISIC classification, mass balances/transfer coefficients, geographically specific waste treatment scenarios (further than matrix J in Forwast giving the proportions of each waste directed to waste treatments), store data as supply/use, i.e. unlinked and unallocated. Further, during Forwast, the demonstration of the identity of IO technology models and LCA solutions to co-production (i.e. system expansion and allocation, refer to the new paper by Suh, Weidema, Schmidt in Journal of Industrial ecology) will allow to disconnect (spin-off) data and methods.
Implementation in Ecoinvent 3 These ideas will be implemented by allowing multi properties for each product, a repository for supply/use data in the same format as LCA detailed data, storing the production volume for each product, global default data, the calculation of residual IO data, Rest-of-World data sets and market pools for international trade. Geography, time and scenarios will be the 3 dimensions of the data, with products linked via market activities. 2 versions will be implemented: consequential and attributional for LCA, LCC & MFA, based on the same data.
Question: Oliver Kerserue: You propose to input Forwast results in Ecoinvent – is it an open or commercial software? Any royalties ? Answer (Bo Weidema): Forwast results will be put on line on the project site. The learnings will be used commercially. Ecoinvent is a non-profit organisation but with a cost. The licence

Forwast Deliverable 7-2
22/29
(1800€) covers this cost. The database will be accessible through the ILCD system. The Ecoinvent database may become free provided sponsors support it
Question (Paul Brunner): Before going further, the model should be finished and validated – who and when? We have a high degree of uncertainty in the outcome. How can it be evaluated and sensitivity tested? Answer: Forwast results could be used as background data for Ecoinvent (as there are country specific results too), but the more important value of Forwast for Ecoinvent is that some new methodological approaches have be tested and proved to be valuable (the hybrid supply-use-tables).
Question: How to implement Forwast in each country? Is it possible? Answer: This was not investigated
Question (Alejandro Villanueva): How is the outcome linked with the initial assumptions? Answer: The SUTs are fundamental and “model neutral” – the assumptions lie in the links.
7. Round-table discussion
Introduction To introduce the discussion, Jacques Villeneuve underlined the presence in the audience of representatives of a large number of stakeholders potentially interested in Forwast. Particularly, we had participants from the EEA, UNEP - Blue plan programme, several representatives of National EPAs, specialists of environmental statistics, specialists of LCA, several representatives of sectoral activities, and a strong representation of the research community.
The Forwast project is a “scientific support to policies” project. It produced mainly three types of results: a model of the EU27 economy, data to feed this model in the form of countries PSUTs (Physical Supply and Use Tables), and results concerning the forecast of flows and stocks of resources in 9 scenarios and the environmental impact associated to waste policies.
As a primary discussion, the topic was set on the “policy aspects”, with a question to the project’s Scientific Officer, Michele Galatola and the supporting advisors: Ulrich Gromke, Hubert Reisinger and Alejandro Villanueva: What is your reaction to the presentation of the project and the potential use of its results?
Position of the EC and advisors
Michele Galatola: The results have just been disclosed today and a proper reaction would require some time…The main goals of the EC DG Research are:
1/ get better support for policies => requires info but also in a usable form,
2/ help the development of activities (here: the assessment of environmental Impact) provided this is within the consortium agreement and that there are no “hidden data”. The perspectives for further use of project’s results in Ecoinvent show that in this field the project is successful.
How can results be used?
A problem with such big complex projects is communication. For example, we have no clear idea on how to use Forwast for Environmental Impact prediction. So it seems that the results are not usable as such. A lot of training is required – it is not likely that the training module will be able to provide it => little use is possible (for example in statistical institutes).

Forwast Deliverable 7-2
23/29
The 2006 call was led by the need of data for supporting policies. We need to plan future capacities for waste treatments. Example: what will be the production of biowaste? The model answer was consistent.
Question (Thomas Ekvall): National waste prevention plans would take profit of using FORWAST results.
Answer (Bo Weidema): You need to go down to national level data for that – for instance to minimise Environmental Impact.
Hubert Reisinger: The initial objectives were: mapping flows, inventory stock, predict waste quantities. The focus of the project seems to have been to develop a consistent and as far as possible detailed and complete Input/Output model of product/material flows in Europe. There seem be some steps ahead for a broader application of Input/Output models. The problem with IO stays if we can trust the results.
Inventory of stocks, detailed modeling of the waste sector and waste management options (prevention, recycling, treatment) seem to be not in the focus but rather by-products of the project. For me it is somewhat a pity that there was not the possibility to develop an equally strong process oriented model for waste prevention, recycling and waste treatment in parallel to the IO-model with results from one model fed into the other and vice versa. The lack of knowledge of connection between material inputs and waste output – how are materials going through the economy: especially important for waste prevention: here the results of Forwast may be of considerable value. But it would be necessary to get a good documentation of the assumptions and the material flows.
Answer (Bo Weidema): IO & process are not very much different models, and can be used together. In Forwast, waste treatment models (i.e. for recycling) are process based. A process-based model for EU-27 would require convergent efforts from many projects. The base idea is to develop a database where all models on European products, material flows, technologies, waste management can derive information from and feed results in.
Question (Michele Galatola): Such an idea is followed by the Commission for quite some time. It could be Ecoinvent only if it can be used for free. A repository for such data is not an EC project, but is within the scope of the ELCD network that has to be cooperative rather than competitive.
Answer (Bo Weidema): EcoInvent welcomes cooperative approaches, but none came.
Answer (Michele Galatola): the EC cannot be connected with a commercial database.
Answer (Bo Weidema): we offer to make the database free
Answer (Michele Galatola): EcoInvent asks for money to do that…
Alejandro Villanueva: Praising the consortium to choose the I/O approach. From the modelers point of view, it is a really interesting project and interesting results The methodology is new. Nobody tried it before. It constitutes an excellent first step. Nevertheless, we can have doubts on the applicability of the model for practical reasons. How does the static nature of variables (transfer coefficients, process factors, time series options, notions such as residence time of products in economy…) influence the outputs? Other questions on inventory methods (Example: are emissions by tourism local or by country of origin?) also can bring uncertainties. As a conclusion, the approach presents a lot of potential uncertainties that limits the confidence we can have but definitive judgment can only be given after very detailed examination of the assumptions and methods applied .
Ulrich Grömke: It seems it is a very complex model. Results are not easily usable if input data are not perfectly documented. As well, the gaps and assumptions made in input data

Forwast Deliverable 7-2
24/29
make difficult their use by statistical offices. Does everybody agree with the followed methodology? There is a need for validation.
Answer (Bo Weidema): the requirements for documentation are recognised. Validation of the approach is further work.
Questions to the attendance
How the Forwast results can complement the Environmental report of the EEA? Almut Reichel: EEA has never tried to model the whole waste generating system. It would be necessary to reduce the uncertainties in Forwast before using the results: any number which comes out of this project which deviates more than 50 % from official statistical numbers must be explained in detail and cannot be used in policy making before proving that it reflects the reality.
As well, the forecasts of emissions are not easily reconciled with NAMEA, but combining LCA with IO is very interesting in the potential for getting information on other environmental impacts of waste.
Answer (Bo Weidema): The current way NAMEAs are made provide the complete picture. The FORWAST may show a way how bottom-up-LCA and IO can be married. IO can complete the life-cycle (fill the holes of the process oriented model).
Question (Jacques Villeneuve): The emissions linked to imports/exports are taken into account “as if” they were generated in EU27. Is that a possible reason for difficulties in forecasting emissions?
Answer: Bo Weidema: This would be easier with a whole world model
How the Forwast method could be applied in the Blue Plan? Jacques Villeneuve: How the Forwast approach would serve the MED2020 reflexion?
Oliver Kerserue: One axis of reflexion in the Blue Plan is the forecasting of waste types and quantities in the South Med countries in order to define waste policies and treatment capacities. A number of academic projects addressed the topic, especially the effects of Imports/Exports.
In the Mediterranean countries, statistics are really poor. There is a need to bridge data gaps in innovative ways in order to estimate waste production (by input-output statistics). The aim is to get a much better understanding of the impacts of the material and waste streams, especially of waste trade and trans-boundary impacts, have the basis for waste trade restrictions etc. (Southern Med countries rely heavily on import of goods). The level of disaggregation here will be difficult to reach. They need to implement in their policies the lessons of FORWAST-type models. The January 2010 call is an opportunity for developing tools which allows the estimation of waste streams and their impacts in Mediterranean countries.
Pros and cons about Forwast model and results Question (Christian Fisher, ETC): There is a challenge to reduce the uncertainties. WP3 countries provided field data. Have you made any specific arrangements to discuss in detail with experts of the countries with the best data basis for FORWAST? Are there any future plans to improve data sets and the model?
Answer (Jannick Schmidt): if we want to improve the model, we need to go into more detailed data validation, especially with respect to environmental impacts. This was done for the Danish data sets.
Remark (Jean Louis Pasquier, French Ministry of Environment): FORWAST should be presented to the Eurostat NAMEA task force (EU staff and countries' representatives

Forwast Deliverable 7-2
25/29
involved) in the context of the resumption of the reflexion on the development of NAMEA-type waste accounts. This should be helpful both for NAMEA people and FORWAST people concerning methodology and data sources.
Answer (Marton Herczeg, ETC): We have to set the focus on communication – also on the use of FORWAST specific terminology that may be confusing for the general public. This affects the meaning of scenarios too.
Answer (Bo Weidema): Agreed. Not the most difficult thing to do. Example “stocks not in use” is easy to change to “waste in landfills”…
Answer (Avraam Karagiannidis, U. Thessaloniki): Integrating North African countries would be challenging… Some notions from the waste directives would be ambitious to implement …
Answer (Paul Brunner): FORWAST was the opportunity for training young researchers on MFA, waste flows and IO. Also the older guys learned. We did not reach any discovery but made a significant step on the way to global modelling. But if we try to achieve the world model we fail. The goal was to provide the policy maker with decision support. This failed. The obtained results were sufficient to model scenarios and to provide results, though the model is too complex to provide policy support now in EU countries.
An alternative would be to use a case study in 3 or 4 countries with the best data basis to test prevention and recycling policy options. The results need to be easily validated and understood. I would recommend to take the case study approach the next time
Answer (Jacques Villeneuve): As a demonstration, the models predicts in the best case (scenario) that we double the CO2 emissions in 25 years…
Answer (Paul Brunner): can we validate better our results?
Answer: Bo Weidema: At least what the model shows is that the sensitivity of waste policies is small on the global concerns. Our real weak point is consumption data. Waste simulation is necessary but may be biased. Our project will help to better formulate incoming questions.
Answer (Jannick Schmidt): The model will take benefit of answering new policy questions not yet asked.
Answer (Paul Brunner): Countries spend 0.2 to 0.4 % of their GDP for waste management. The real policy question is: a) Is the European waste hierarchy justifiable? The chance of giving an answer on this has been missed, and b) what can be done with GHG emissions, what CO2 policy decisions can be taken ?
The project partners are not in a position to do it without Jannick Sshmidt…
Answer (Michele Galatola): CO2 decisions are not always taken in full awareness. Forwast results would help but there is some chance that some people will draw the wrong conclusions from the Forwast results.
Closing Jacques Villeneuve: Forwast has a potential for many applications. The developments in Ecoinvent of the IO database for Europe will be interesting for many LCA practitioners.

Forwast Deliverable 7-2
26/29
4. LIST OF PARTICIPANTS
N° Name First name Company Country Contact 1 Bakas Ioannis ETC SCP DK [email protected] 2 Bigum Marianne DTU DK [email protected] 3 Brunner Paul TU Vienna AT [email protected] 4 Chrintz Torben NIRAS DK [email protected] 5 Clavreul Julie DTU DK [email protected] 6 Ekvall Tomas IVL SE [email protected] 7 Fisher Christian ETC SCP DK [email protected] 8 Galatola Michele EC EU [email protected] 9 Gromke Ulrich EPA Germany DE [email protected] 10 Grosso Mario POLIMI IT [email protected] 11 Guilbard Laure Renault FR [email protected] 12 Hafner Gerold U. Stuttgart DE [email protected] 13 Herczeg Marton ETC SCP DK [email protected] 14 Jedrysik Eugeniusz GIG PL [email protected] 15 Jørgensen Andreas DTU DK [email protected] 16 Karagiannidis Avraam AUTH GR [email protected] 17 Keserue Oliver UNEP MAP Blue Plan UN [email protected] 18 Lemière Bruno BRGM FR [email protected] 19 Merrild Hanna FORCE Technology DK [email protected] 20 Mohr Alexander FEVE EU [email protected] 21 Munawar Edi TU Vienna AT [email protected] 22 Olsen Stig Irving DTU DK [email protected] 23 Ortega Francisco U. Oviedo SP [email protected]
24 Pasquier Jean-Louis French Ministry of ecology FR
25 Reichel Almut EEA EU [email protected] 26 Reisinger Hubert EPA Austria AT [email protected]
27 Rejman-Burzynska Alina GIG PL [email protected]
28 Ringman Jori CEPI EU [email protected] 29 Schmidt Jannick 2.0-LCA DK [email protected] 30 Skals Peter COLOPLAST DK [email protected] 31 Śliwinska Anna GIG PL [email protected] 32 Smeets Koen OVAM BE [email protected] 33 Vanderlinden Ann VITO BE [email protected] 34 Vaxelaire Stéphane BRGM FR [email protected] 35 Vercalsteren An VITO BE [email protected] 36 Villanueva Alejandro JRC IPTS EU [email protected] 37 Villeneuve Jacques BRGM FR [email protected] 38 Weidema Bo 2.0-LCA DK [email protected] 39 Wilts Henning Wuppertal Institute DE [email protected]

Forwast Deliverable 7-2
27/29
5. CONCLUSION
The final meeting provided the participants with an opportunity to have a clear outline of all the components of the FORWAST project, its database, model structure and modelling potential, despite the database was not yet fully consolidated. The presence of representatives of the waste and environmental management sector, and of industry experts on resources proved that the FORWAST approach met a need in policy support.
The subsequent fruitful discussions supplied numerous paths for the valorisation of the project's outcome, and for the definition of further research needs.


Forwast Deliverable 7-2
Centre scientifique et technique Service Environnement & Procédés
3, avenue Claude-Guillemin BP 6009 – 45060 Orléans Cedex 2 – France – Tél. : 02 38 64 34 34