Deliverable D4.2 Implementation of the Doctor...
50
Project ANR: DOCTOR <ANR-14-CE28-0001> DeplOyment and seCurisaTion of new functiOnalities in virtualized networking enviRonnements Deliverable D4.2 Implementation of the Doctor Components Version 1.4, 30 September 2018 Authors Orange Patrick Truong, Bertrand Mathieu Thales Theo Combe Montimage Edgardo Montes de Oca, Wissam Mallouli, Long Hoang Mai ICD Moustapha EL Aoun, Tan Nguyen, Alain Ploix, Guillaume Doyen CNRS-LORIA Xavier Marchal, Thibault Cholez, Daishi Kondo Abstract: This document presents the status of implementation of the Doctor Solution. The code of these components is available as an open source project available on the github platform following this link: https://github.com/DOCTOR-ANR/
Transcript of Deliverable D4.2 Implementation of the Doctor...
Project ANR: DOCTOR
<ANR-14-CE28-0001>
DeplOyment and seCurisaTion of new functiOnalities
in virtualized networking enviRonnements
Deliverable D4.2
Implementation of the Doctor Components
Version 1.4, 30 September 2018
Authors
Orange Patrick Truong, Bertrand Mathieu Thales Theo Combe
Montimage Edgardo Montes de Oca, Wissam Mallouli, Long Hoang Mai ICD Moustapha EL Aoun, Tan Nguyen, Alain Ploix, Guillaume Doyen
CNRS-LORIA Xavier Marchal, Thibault Cholez, Daishi Kondo
Abstract:
This document presents the status of implementation of the Doctor Solution. The code of these components is available as an open source project available on the github platform following this link: https://github.com/DOCTOR-ANR/
Deliverable D4.2: Implementation of the Doctor Components
2/50 DOCTOR Project, <ANR-14-CE28-0001>
TABLE OF CONTENTS 1 Introduction 3
2 Doctor Architecture reminder 5
3 Doctor Orchestrator 8
3.1 Requirements 8
3.2 Installation 8
3.3 Usage 10
3.4 Demonstration examples 17
4 HTTP/NDN Gateways 19
4.1 Requirements and Installation 19
4.2 Usage 19
4.3 Demonstration example(s) 20
5 NDN Firewall 21
5.1 Requirements and Installation 21
5.2 Usage 21
5.3 Demonstration example(s) 22
6 NDNperf 23
6.1 Requirements and Installation 23
6.2 Usage 23
6.3 Demonstration example(s) 25
7 Signature verification module 26
7.1 Requirements 26
7.2 Usage 26
8 NDN microservices 27
8.1 Requirements and Installation 27
8.2 Usage 28
8.3 Demonstration example(s) 28
9 NDN Monitoring Probe 30
9.1 Requirements 30
9.1.1 Hardware 30
9.1.2 Software 31
9.2 Installation 31
9.3 Usage 32
9.4 Demonstration example(s) 33
10 MMT Security Engine 34
10.1 Requirements 34
10.2 Installation 34
Deliverable D4.2: Implementation of the Doctor Components
3/50 DOCTOR Project, <ANR-14-CE28-0001>
10.3 Usage 34
10.4 Demonstration example(s) 34
10.4.1 IFA example 34
10.4.2 CPA example 34
11 MMT Dashboard 35
11.1 Requirements 35
11.2 Installation 35
11.3 Usage 36
11.4 Demonstration example(s) 36
11.4.1 Tosca Editing 36
11.4.2 Statistics & Notifications 37
12 Cybercaptor 38
12.1 Requirements 38
12.2 Installation 38
12.3 Usage 41
12.4 Demonstration example(s) 42
1 Introduction
The goal of the DOCTOR project is to define and demonstrate the secure deployment and operation of NDN. By complying with an SDN/NFV architecture based on the ETSI recommendations, thus running the NDN components in a virtualized architecture, it demonstrates the induced flexibility, the low cost and ability to be orchestrated and quickly react to events. This organization permits to in-crease the security, the resilience and the QoS of the whole network architecture. The project first subtask (T1.1) was a technical assessment of the most appropriate IT virtualization solution to be used as an infrastructure by the DOCTOR project. By taking advantage of the VNFI and the SDN controller, the next subtask (T1.2) consisted in designing a secure network services deployment. This is based on the definition of a Control and Management plane integrating the Security Orchestration. The following subtask (T2.1) was performing the security analysis of this architecture in order to identify the most critical attacks able to target the NDN technology and the SDN/NFV virtual infrastructure. It was followed by a definition in the next subtask (T2.2) of the technical solutions for the detection of these attacks, the required security-oriented monitoring and the software components implementing it. The subtask (T3.1) specified the DOCTOR solution and components including exchanged data format and flows and the subtask (T3.2) concentrated on the implementation of the security evaluation and performance enhancement via microservices. This document presents the implementation of the DOCTOR solution that is able to provide the expected reliability level of the NDN network functions. It contains details of the components’ implementation, including SDN/NFV virtualized ones, and demonstrates how each component can run. Each component is presented in four subsections: requirements, installation, usage and demonstration. It is organized as follow: Section 2 reminds the ETSI compatible architecture [1] [2] of the DOCTOR deployment with the updated project support architecture required for the security of the NDN and SDN/NFV environment. The details on the components implementation and usage are presented in the remaining sections as follows:

Deliverable D4.2: Implementation of the Doctor Components
4/50 DOCTOR Project, <ANR-14-CE28-0001>
Section 3: Doctor Orchectrator Section 4: HTTP/NDN Gateways Section 5: NDN Firewall Section 6: NDNperf Section 7: Signature verification module Section 8: NDN microservices Section 9: NDN monitoring probe Section 10: MMT Security engine Section 11: MMT Dashboard Section 12: CyberCaptor
Deliverable D4.2: Implementation of the Doctor Components
5/50 DOCTOR Project, <ANR-14-CE28-0001>
2 Doctor Architecture reminder
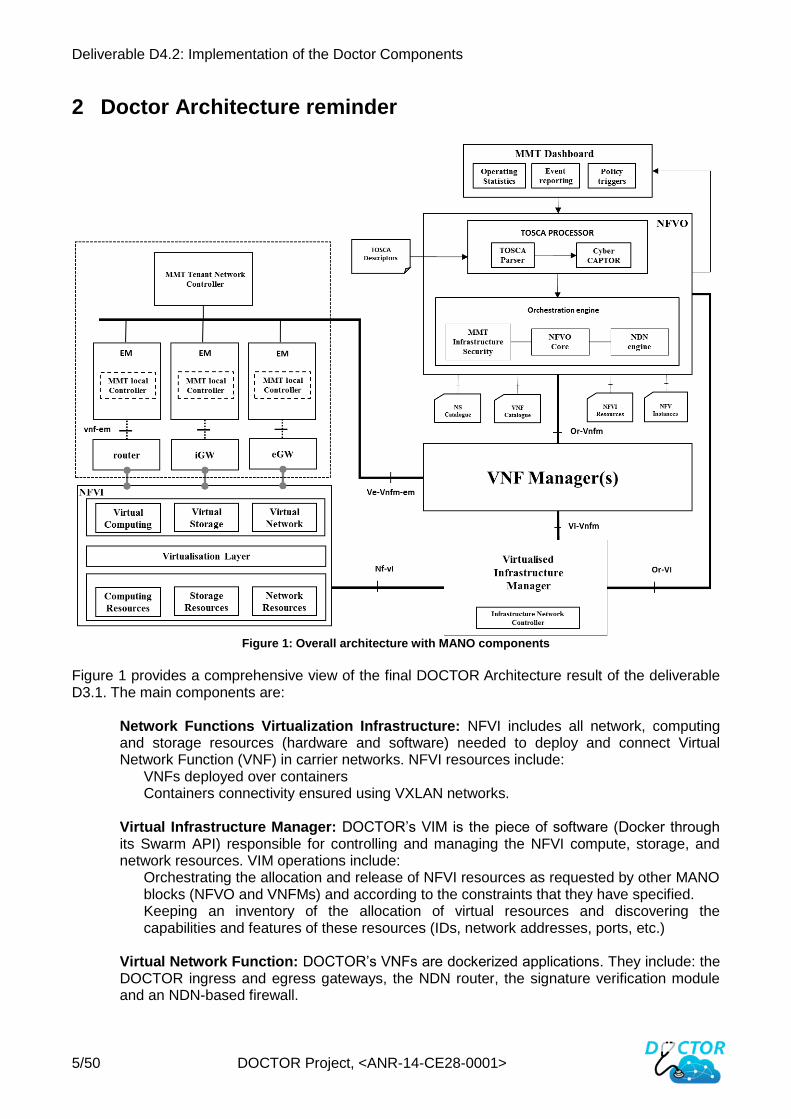
Figure 1: Overall architecture with MANO components
Figure 1 provides a comprehensive view of the final DOCTOR Architecture result of the deliverable D3.1. The main components are:
Network Functions Virtualization Infrastructure: NFVI includes all network, computing and storage resources (hardware and software) needed to deploy and connect Virtual Network Function (VNF) in carrier networks. NFVI resources include:
VNFs deployed over containers Containers connectivity ensured using VXLAN networks.
Virtual Infrastructure Manager: DOCTOR’s VIM is the piece of software (Docker through its Swarm API) responsible for controlling and managing the NFVI compute, storage, and network resources. VIM operations include:
Orchestrating the allocation and release of NFVI resources as requested by other MANO blocks (NFVO and VNFMs) and according to the constraints that they have specified. Keeping an inventory of the allocation of virtual resources and discovering the capabilities and features of these resources (IDs, network addresses, ports, etc.)
Virtual Network Function: DOCTOR’s VNFs are dockerized applications. They include: the DOCTOR ingress and egress gateways, the NDN router, the signature verification module and an NDN-based firewall.
Deliverable D4.2: Implementation of the Doctor Components
6/50 DOCTOR Project, <ANR-14-CE28-0001>
Element Manager (EM): The EM is responsible for FCAPS management functionality for a VNF. More specifically, the EM includes a local controller unit (MMT Local Controller) which provides monitoring, management and control of a virtualized NDN function. This includes:
Monitoring key content-based metrics (e.g., cache hits and misses); Monitoring key performance metrics (system); Triggering alarms (security and performance) towards the MMT Tenant controller; Configuring (add/update/delete) ICN routes using NDN API.
MMT Tenant Controller: The tenant controller is the strategic control point for the NDN virtualized network. It manages and controls the virtualized underlying network according to NFVO requirements. Following the SDN logic, the MMT Tenant Controller represents a central point of control and maintains a global view over the deployed virtual network. His main functions include:
Sending configurations to VNF’s element manager; Receiving VNFs operating statistics; Receiving VNFs notification.
The tenant controller also embeds security applications that allow it to monitor the virtual network and to issue notifications towards the orchestrator.
VNF Manager: The VNF Manager is responsible for the lifecycle management of VNF instances. In the context of the DOCTOR project, each network tenant will have its own VNFM. VNFM actions include:
Configuring VNFs (e.g. a NDN prefix for a HTTP/NDN gateway) Starting/stopping VNFs Monitoring (received through the MMT tenant controller) Scaling up/down (e.g. spawning new containers) Upgrading (e.g. adding new strategies to the NFD module)
Communication between the VNFM and both the NFVO and the Tenant controller are also ensured through RESTful API.
TOSCA processor: TOSCA, which is an OASIS standardized language, is the de-facto standard for modelling Cloud and NFV applications. The TOSCA processor reads the TOSCA templates and creates an in-memory graph of TOSCA nodes and their relationship. The in-memory graph is then passed to the NFVO engine which extracts deployment and service functions chaining information.
Orchestration engine: The Orchestration engine represents the NFVO core component. It includes three main modules:
NFVO core represents the glue between all others NFVO modules. In particular, NFVO core includes all the processes that allow transforming a TOSCA specification to a set of instruction to send to other MANO blocks. NDN engine centralizes the NDN knowledge of the orchestrator. This generally represents the routines and instructions that allow the orchestrator to deal with ICN key concepts, such as: Interest and Data packets. MMT infrastructure security ensures multi-tenancy security. To do this, MMT infrastructure security module receives operational information and security reports from all VNFMs. Subsequently, all these data are analysed and if an attack or vulnerability is detected, a report is sent to the administrator (through the dashboard) so that he can triggers the required remediation, whether automatic (already on-boarder TOSCA templates) or manual.
MMT Dashboard: MMT dashboard is a human-friendly interface to the NFVO. It allows admins to monitor virtual networks operating status. Also, MMT dashboard can show notifications to get inputs from administrator like applying some on-border strategies (already specified in the TOSCA file, or other file type).
Deliverable D4.2: Implementation of the Doctor Components
7/50 DOCTOR Project, <ANR-14-CE28-0001>
CyberCaptor: CyberCaptor is composed by a set of dockerized applications which provides comprehensive risk analysis on a network through attack graph generation in mixed IP and NDN networks. It complements other components performing attacks detection based on dynamic computation of probes output, by providing predictive security intelligence based on incremental environment analysis, computation of the potential attacker chains of vulnerabilities exploitation and of the more effective response according to defined cost metrics. It offers the following features:
vulnerabilities collect potential threats evaluation most probable and impacting attacks identification risk assessment and countermeasure solution proposal
Processing is performed on raw cyber security data: network topology, firewall rules, flow matrix, routing tables for the IP part faces, links, routers and gateways for the NDN part virtual machines deployment, hypervisors and orchestrators for the virtualized infrastructure part vulnerability scan information (e.g. by Nessus)
Having access to this information, the attack graph engine is able to generate the attack graph containing all attack paths (chain of vulnerability exploitation) of the information system. The attack paths are then scored according to their likelihood and difficulty, using metrics such as the Common Vulnerability Scoring System (CVSS) and presented to client applications through a RESTful API.
The installation and usage of such components are described in the following sections.
Deliverable D4.2: Implementation of the Doctor Components
8/50 DOCTOR Project, <ANR-14-CE28-0001>
3 Doctor Orchestrator
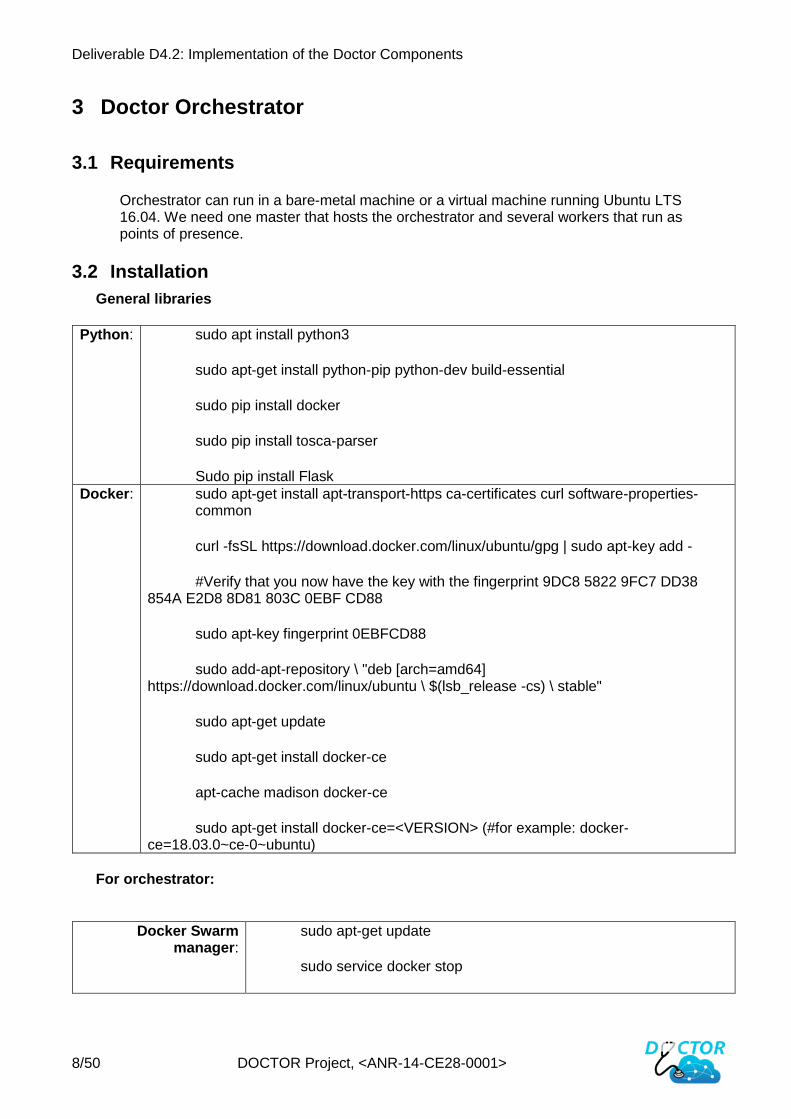
3.1 Requirements
Orchestrator can run in a bare-metal machine or a virtual machine running Ubuntu LTS 16.04. We need one master that hosts the orchestrator and several workers that run as points of presence.
3.2 Installation
General libraries Python: sudo apt install python3
sudo apt-get install python-pip python-dev build-essential
sudo pip install docker
sudo pip install tosca-parser
Sudo pip install Flask Docker: sudo apt-get install apt-transport-https ca-certificates curl software-properties-
common
curl -fsSL https://download.docker.com/linux/ubuntu/gpg | sudo apt-key add -
#Verify that you now have the key with the fingerprint 9DC8 5822 9FC7 DD38 854A E2D8 8D81 803C 0EBF CD88
sudo apt-key fingerprint 0EBFCD88
sudo add-apt-repository \ "deb [arch=amd64] https://download.docker.com/linux/ubuntu \ $(lsb_release -cs) \ stable"
sudo apt-get update
sudo apt-get install docker-ce
apt-cache madison docker-ce
sudo apt-get install docker-ce=<VERSION> (#for example: docker-ce=18.03.0~ce-0~ubuntu)
For orchestrator:
Docker Swarm manager:
sudo apt-get update
sudo service docker stop
Deliverable D4.2: Implementation of the Doctor Components
9/50 DOCTOR Project, <ANR-14-CE28-0001>
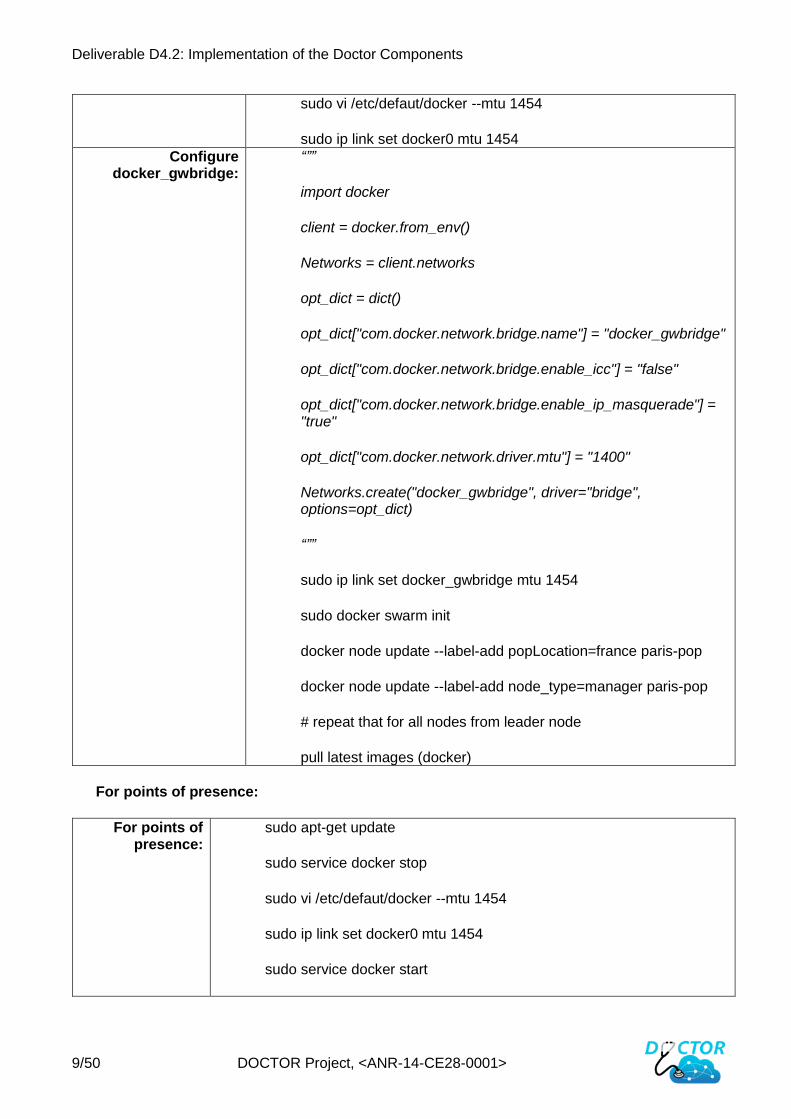
sudo vi /etc/defaut/docker --mtu 1454
sudo ip link set docker0 mtu 1454 Configure
docker_gwbridge: “””
import docker
client = docker.from_env()
Networks = client.networks
opt_dict = dict()
opt_dict["com.docker.network.bridge.name"] = "docker_gwbridge"
opt_dict["com.docker.network.bridge.enable_icc"] = "false"
opt_dict["com.docker.network.bridge.enable_ip_masquerade"] = "true"
opt_dict["com.docker.network.driver.mtu"] = "1400"
Networks.create("docker_gwbridge", driver="bridge", options=opt_dict)
“””
sudo ip link set docker_gwbridge mtu 1454
sudo docker swarm init
docker node update --label-add popLocation=france paris-pop
docker node update --label-add node_type=manager paris-pop
# repeat that for all nodes from leader node
pull latest images (docker)
For points of presence:
For points of presence:
sudo apt-get update
sudo service docker stop
sudo vi /etc/defaut/docker --mtu 1454
sudo ip link set docker0 mtu 1454
sudo service docker start
Deliverable D4.2: Implementation of the Doctor Components
10/50 DOCTOR Project, <ANR-14-CE28-0001>
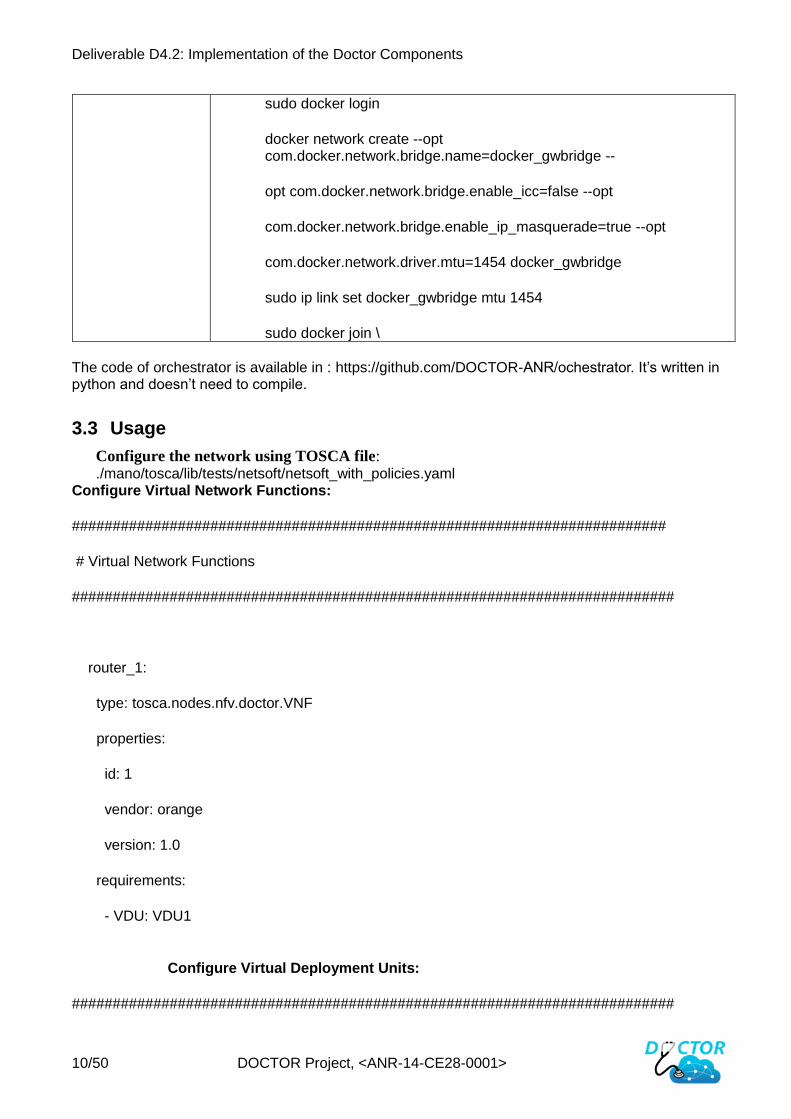
sudo docker login
docker network create --opt com.docker.network.bridge.name=docker_gwbridge --
opt com.docker.network.bridge.enable_icc=false --opt
com.docker.network.bridge.enable_ip_masquerade=true --opt
com.docker.network.driver.mtu=1454 docker_gwbridge
sudo ip link set docker_gwbridge mtu 1454
sudo docker join \ The code of orchestrator is available in : https://github.com/DOCTOR-ANR/ochestrator. It’s written in python and doesn’t need to compile.
3.3 Usage
Configure the network using TOSCA file: ./mano/tosca/lib/tests/netsoft/netsoft_with_policies.yaml
Configure Virtual Network Functions:
#########################################################################
# Virtual Network Functions
##########################################################################
router_1:
type: tosca.nodes.nfv.doctor.VNF
properties:
id: 1
vendor: orange
version: 1.0
requirements:
- VDU: VDU1
Configure Virtual Deployment Units:
##########################################################################
Deliverable D4.2: Implementation of the Doctor Components
11/50 DOCTOR Project, <ANR-14-CE28-0001>
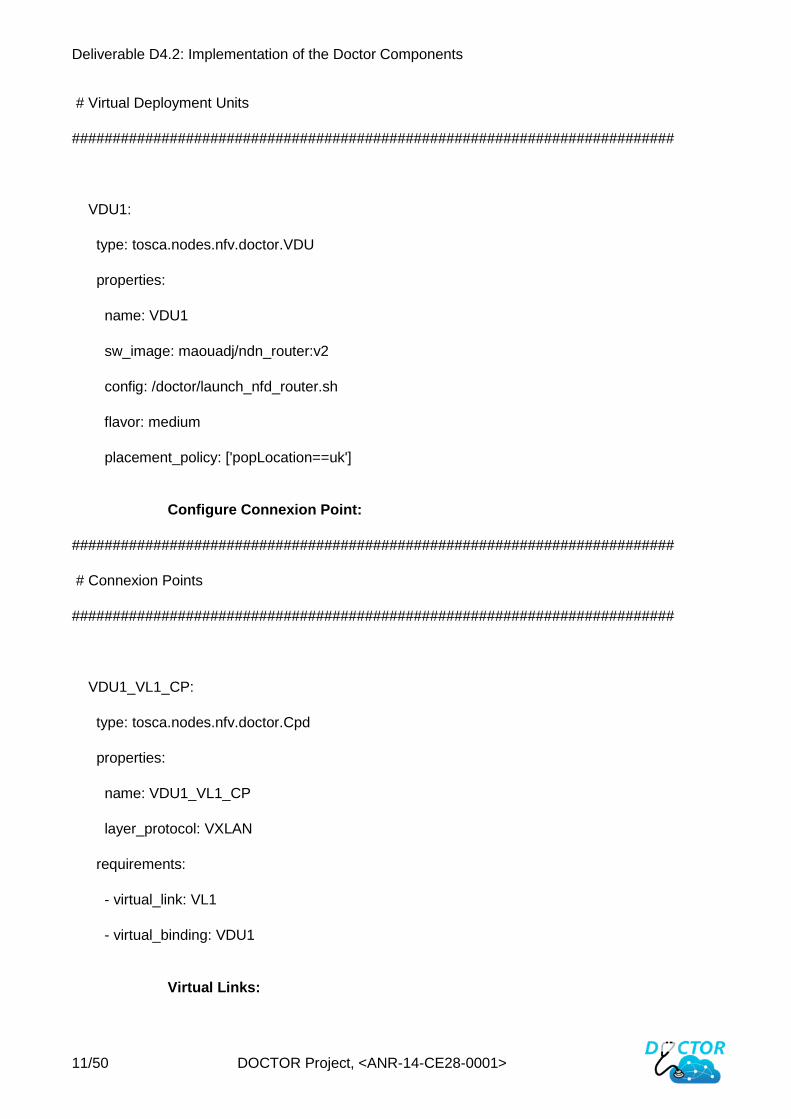
# Virtual Deployment Units
##########################################################################
VDU1:
type: tosca.nodes.nfv.doctor.VDU
properties:
name: VDU1
sw_image: maouadj/ndn_router:v2
config: /doctor/launch_nfd_router.sh
flavor: medium
placement_policy: ['popLocation==uk']
Configure Connexion Point:
##########################################################################
# Connexion Points
##########################################################################
VDU1_VL1_CP:
type: tosca.nodes.nfv.doctor.Cpd
properties:
name: VDU1_VL1_CP
layer_protocol: VXLAN
requirements:
- virtual_link: VL1
- virtual_binding: VDU1
Virtual Links:
Deliverable D4.2: Implementation of the Doctor Components
12/50 DOCTOR Project, <ANR-14-CE28-0001>
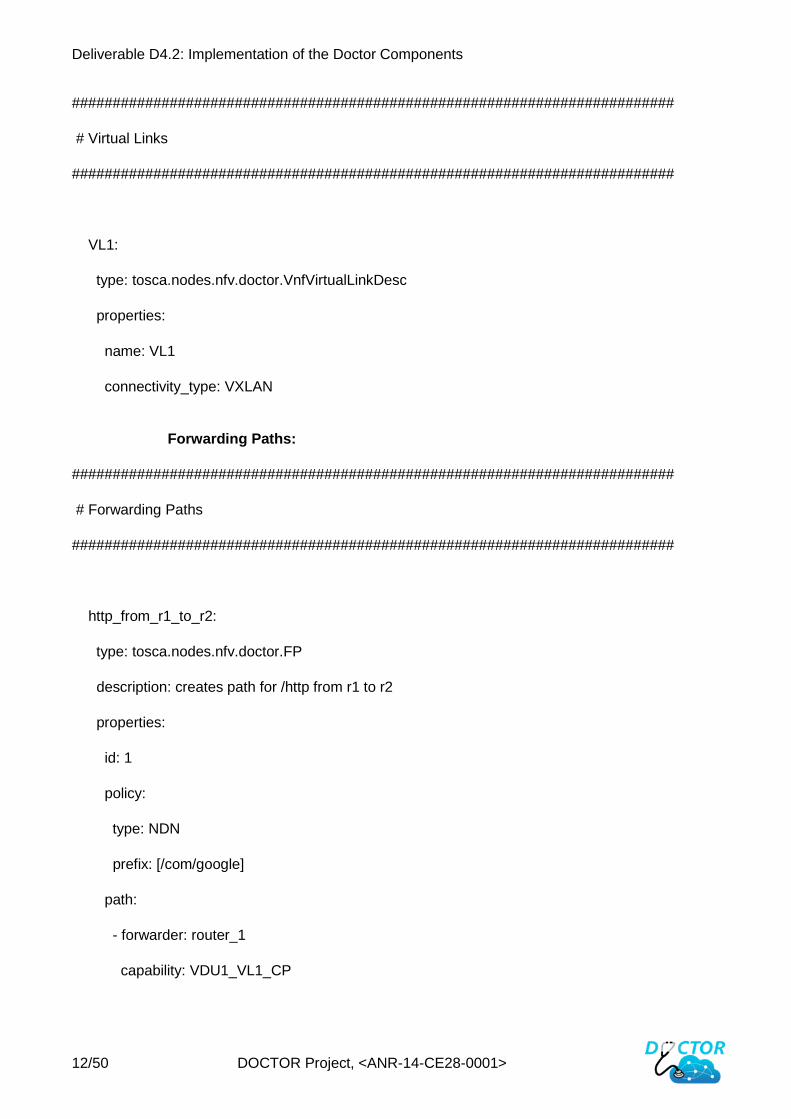
##########################################################################
# Virtual Links
##########################################################################
VL1:
type: tosca.nodes.nfv.doctor.VnfVirtualLinkDesc
properties:
name: VL1
connectivity_type: VXLAN
Forwarding Paths:
##########################################################################
# Forwarding Paths
##########################################################################
http_from_r1_to_r2:
type: tosca.nodes.nfv.doctor.FP
description: creates path for /http from r1 to r2
properties:
id: 1
policy:
type: NDN
prefix: [/com/google]
path:
- forwarder: router_1
capability: VDU1_VL1_CP
Deliverable D4.2: Implementation of the Doctor Components
13/50 DOCTOR Project, <ANR-14-CE28-0001>
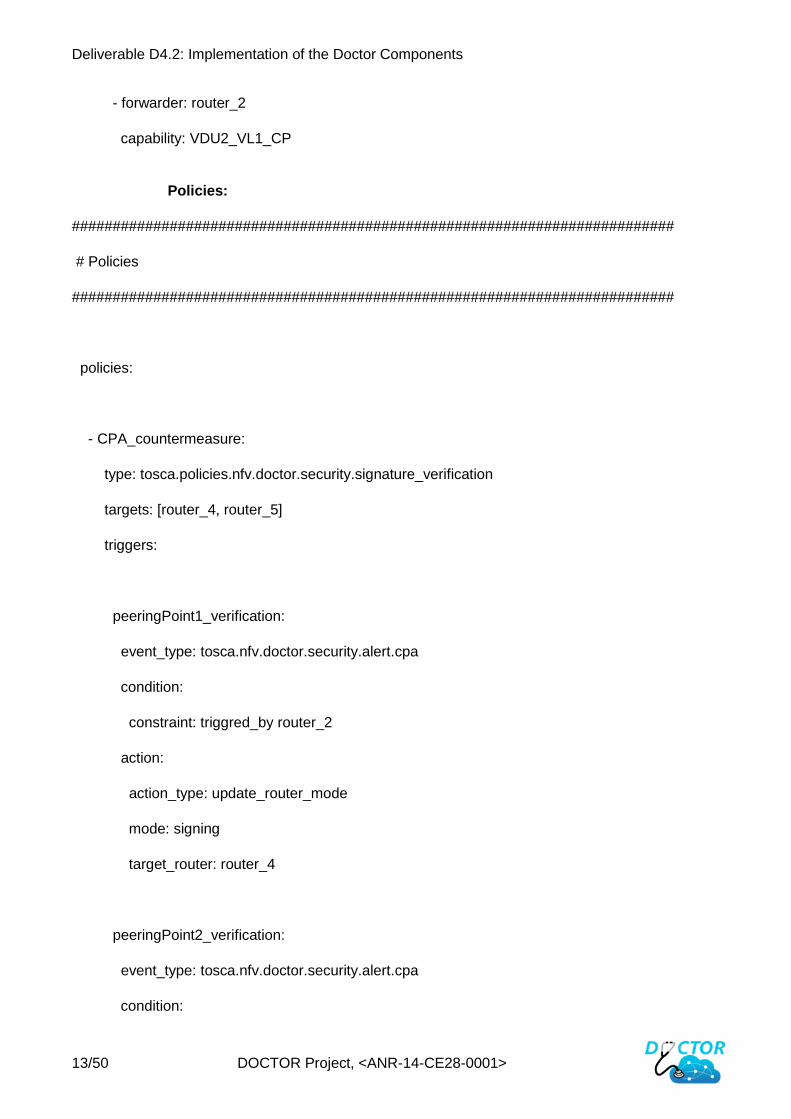
- forwarder: router_2
capability: VDU2_VL1_CP
Policies:
##########################################################################
# Policies
##########################################################################
policies:
- CPA_countermeasure:
type: tosca.policies.nfv.doctor.security.signature_verification
targets: [router_4, router_5]
triggers:
peeringPoint1_verification:
event_type: tosca.nfv.doctor.security.alert.cpa
condition:
constraint: triggred_by router_2
action:
action_type: update_router_mode
mode: signing
target_router: router_4
peeringPoint2_verification:
event_type: tosca.nfv.doctor.security.alert.cpa
condition:
Deliverable D4.2: Implementation of the Doctor Components
14/50 DOCTOR Project, <ANR-14-CE28-0001>
constraint: triggred_by router_2
action:
action_type: update_router_mode
mode: signing
target_router: router_5
- update_firewall_1:
type: tosca.policies.nfv.doctor.ndn.security.update_firewall
targets: [firewall_1, firewall_2]
triggers:
peering_point_1:
event_type: tosca.nfv.doctor.security.alert.poisoned_content
condition:
constraint: triggred_by router_4
action:
action_type: update_firewall
target_firewall: firewall_1
peering_point_2:
event_type: tosca.nfv.doctor.security.alert.poisoned_content
condition:
constraint: triggred_by router_5
action:
action_type: update_firewall
target_firewall: firewall_2
Deliverable D4.2: Implementation of the Doctor Components
15/50 DOCTOR Project, <ANR-14-CE28-0001>
- scaling_out_policy:
type: tosca.policies.nfv.doctor.ndn.scaling
targets: [router_4, router_5]
triggers:
scale_out:
meter_name: PIT
event_type: tosca.policies.nfv.doctor.ndn.utilization
condition:
constraint: pending_interests greater_than 10
threshold: 10
comparison_operator: gt
period: 15
action:
action_type: scale_out
number: 3
Forwarding graph:
##########################################################################
# Forwarding graph
##########################################################################
groups:
VNFFG1:
type: tosca.groups.nfv.doctor.VNFFG
description: FR and COM interest to egress_gw
Deliverable D4.2: Implementation of the Doctor Components
16/50 DOCTOR Project, <ANR-14-CE28-0001>
properties:
vendor: Doctor
version: 1.0
dependent_virtual_link: [VL]
connection_point: [router]
constituent_vnfs: [CP]
members: [http_from_r1_to_r2, http_from_r2_to_as2, http_from_r2_to_as1]
Deploy network: Make sure that the old network is removed:
sudo pkill python
sudo [path]/mano_v2/netsoft_clean
Deploy network:
cd [path]/maouadj/mano_v2 ; sudo ./launch_doctor_mano.sh <path-to-tosca-file> <IP-of-Orchestrator>:3999
Deliverable D4.2: Implementation of the Doctor Components
17/50 DOCTOR Project, <ANR-14-CE28-0001>
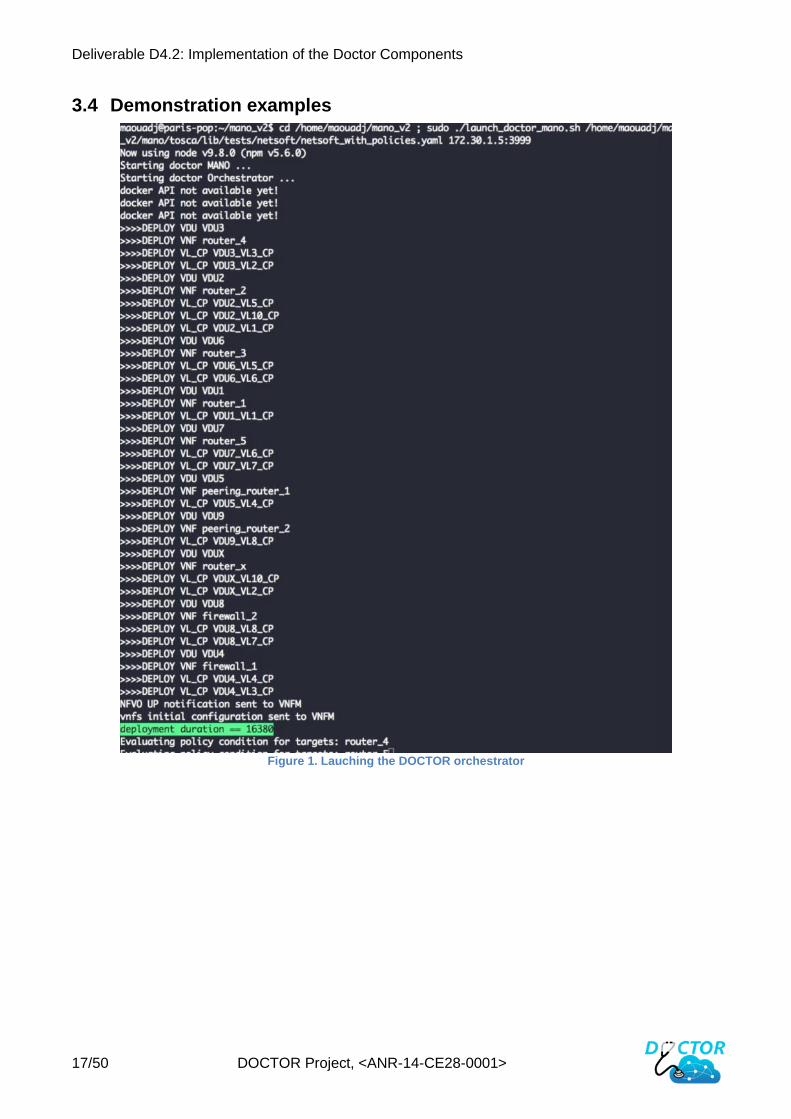
3.4 Demonstration examples
Figure 1. Lauching the DOCTOR orchestrator
Deliverable D4.2: Implementation of the Doctor Components
18/50 DOCTOR Project, <ANR-14-CE28-0001>
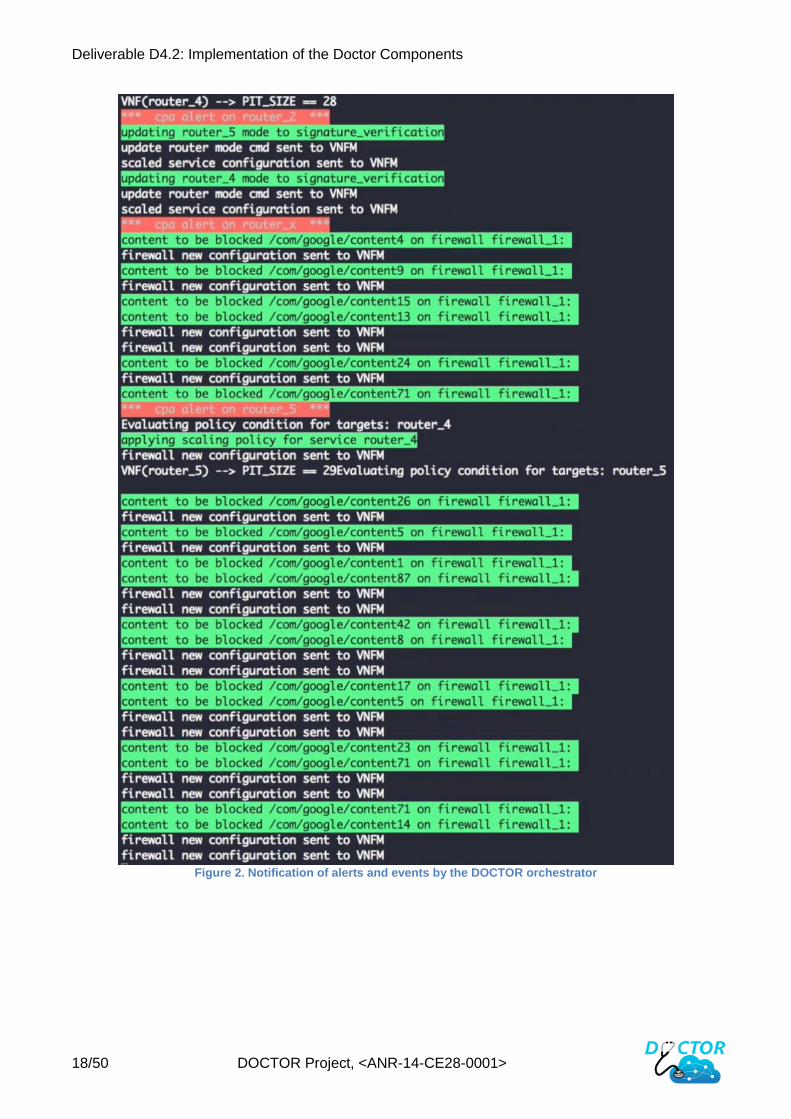
Figure 2. Notification of alerts and events by the DOCTOR orchestrator
Deliverable D4.2: Implementation of the Doctor Components
19/50 DOCTOR Project, <ANR-14-CE28-0001>
4 HTTP/NDN Gateways
We have two types of gateways which have complementary functionalities. The first is named ingress gateway (iGW) and is able to adapt HTTP/IP request messages to be efficiently transported on a NDN network. In the same way, it can also adapt HTTP/NDN response messages to be transported on an IP network. The second gateway, named egress gateway (eGW), has the exact reverse functionalities. It is able to adapt HTTP/IP response messages to be transported on NDN and converts HTTP/NDN request messages to be transported on IP. It has also an inner cache which should be more considered as a buffer since it aims to store the responses to the latest requests it receives (it stores them up to 90 seconds after the last asked segment).
We also provide a native NDN web server as PoC. It can handle HEAD and GET requests and it is possible to implement the other easily but may need some third-party program like PHP interpreter.
4.1 Requirements and Installation
To get the software, please clone the repository: https://github.com/DOCTOR-ANR/HTTP-NDN-gateway
$ git clone https://github.com/DOCTOR-ANR/NDN-HTTP-Gateway.git To compile the software, we provide a Cmake file for each of the 2 gateways and for the NDN
web server. The single dependency required to be installed is the ndn-cxx library. $ cd igw (or egw, or ndn_server) $ cmake . && make
4.2 Usage
Some parameters can be changed before compilation. It is possible to edit the thread configuration of the gateways, each gateway is composed of 3 modules and each of them has a thread pool. The size of each thread pool can be defined in the main.cpp file:
NdnResolver ndn_resolver(4); NdnHttpInterpreter interpreter(2); HttpClient http_client(4); It is also possible to change the timeout delay for header and body reception for requests and
responses in the global.h file. const boost::posix_time::milliseconds DEFAULT_WAIT_REDO(5); const boost::posix_time::seconds DEFAULT_WAIT_PURGE(60); const boost::posix_time::seconds DEFAULT_TIMEOUT_CONNECT(2); const boost::posix_time::seconds DEFAULT_TIMEOUT_READ_HTTP_HEADER(5); const boost::posix_time::seconds DEFAULT_TIMEOUT_READ_HTTP_BODY(2);
iGW :
./igw (-n [PREFIX]) (-p [PORT])
eGW :
./egw (-n [PREFIX])
ndn_server :
./ndn_server -n [DOMAIN_AS_PREFIX]
Deliverable D4.2: Implementation of the Doctor Components
20/50 DOCTOR Project, <ANR-14-CE28-0001>
4.3 Demonstration example(s)
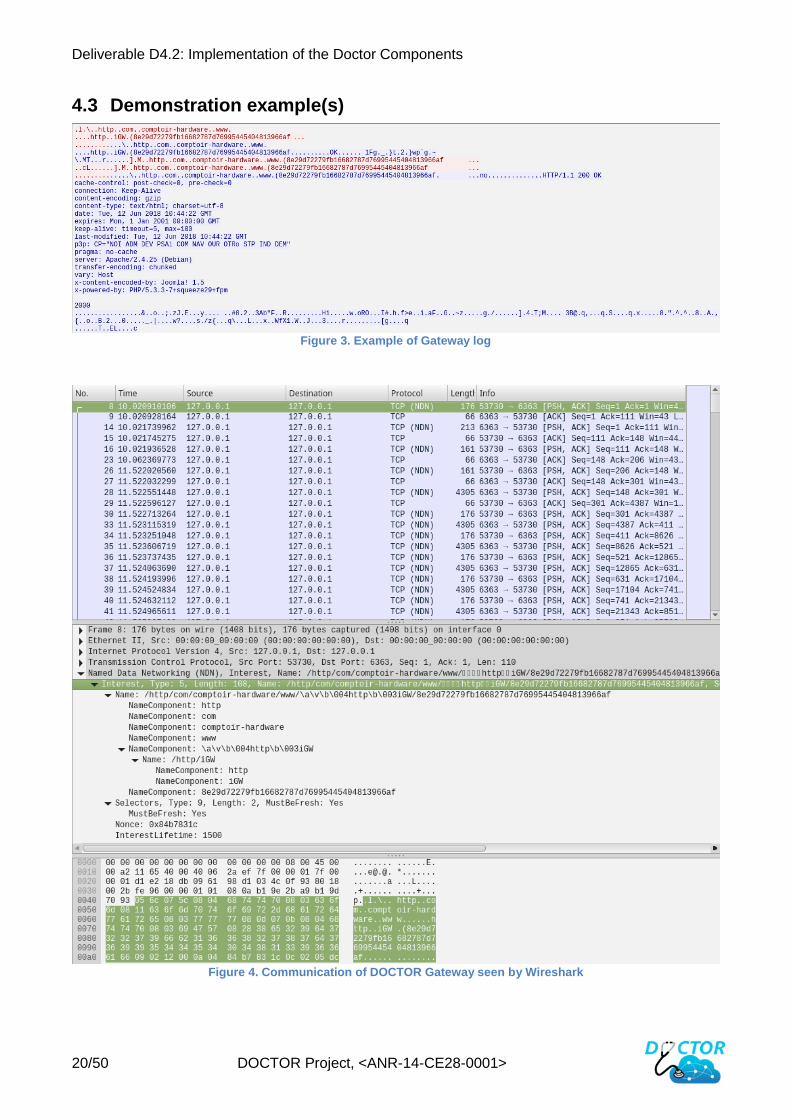
Figure 3. Example of Gateway log
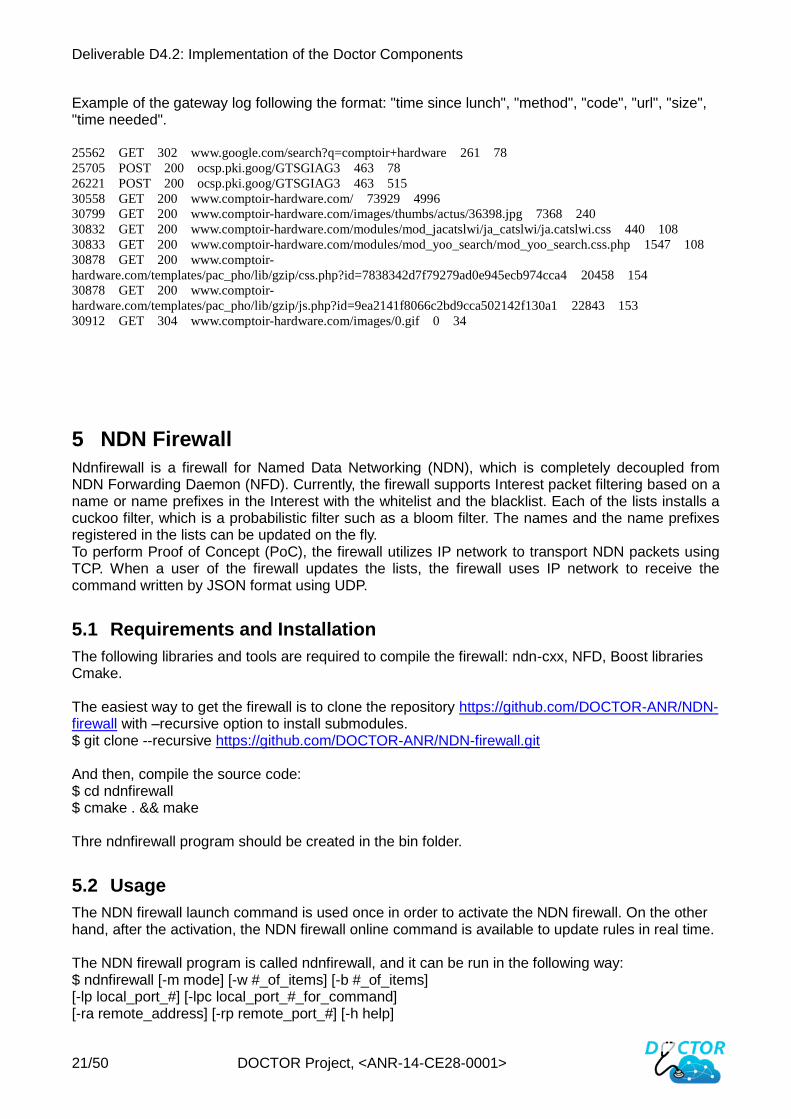
Figure 4. Communication of DOCTOR Gateway seen by Wireshark
Deliverable D4.2: Implementation of the Doctor Components
21/50 DOCTOR Project, <ANR-14-CE28-0001>
Example of the gateway log following the format: "time since lunch", "method", "code", "url", "size", "time needed". 25562 GET 302 www.google.com/search?q=comptoir+hardware 261 78
25705 POST 200 ocsp.pki.goog/GTSGIAG3 463 78
26221 POST 200 ocsp.pki.goog/GTSGIAG3 463 515
30558 GET 200 www.comptoir-hardware.com/ 73929 4996
30799 GET 200 www.comptoir-hardware.com/images/thumbs/actus/36398.jpg 7368 240
30832 GET 200 www.comptoir-hardware.com/modules/mod_jacatslwi/ja_catslwi/ja.catslwi.css 440 108
30833 GET 200 www.comptoir-hardware.com/modules/mod_yoo_search/mod_yoo_search.css.php 1547 108
30878 GET 200 www.comptoir-
hardware.com/templates/pac_pho/lib/gzip/css.php?id=7838342d7f79279ad0e945ecb974cca4 20458 154
30878 GET 200 www.comptoir-
hardware.com/templates/pac_pho/lib/gzip/js.php?id=9ea2141f8066c2bd9cca502142f130a1 22843 153
30912 GET 304 www.comptoir-hardware.com/images/0.gif 0 34
5 NDN Firewall
Ndnfirewall is a firewall for Named Data Networking (NDN), which is completely decoupled from NDN Forwarding Daemon (NFD). Currently, the firewall supports Interest packet filtering based on a name or name prefixes in the Interest with the whitelist and the blacklist. Each of the lists installs a cuckoo filter, which is a probabilistic filter such as a bloom filter. The names and the name prefixes registered in the lists can be updated on the fly. To perform Proof of Concept (PoC), the firewall utilizes IP network to transport NDN packets using TCP. When a user of the firewall updates the lists, the firewall uses IP network to receive the command written by JSON format using UDP.
5.1 Requirements and Installation
The following libraries and tools are required to compile the firewall: ndn-cxx, NFD, Boost libraries Cmake. The easiest way to get the firewall is to clone the repository https://github.com/DOCTOR-ANR/NDN-firewall with –recursive option to install submodules. $ git clone --recursive https://github.com/DOCTOR-ANR/NDN-firewall.git And then, compile the source code: $ cd ndnfirewall $ cmake . && make Thre ndnfirewall program should be created in the bin folder.
5.2 Usage
The NDN firewall launch command is used once in order to activate the NDN firewall. On the other hand, after the activation, the NDN firewall online command is available to update rules in real time. The NDN firewall program is called ndnfirewall, and it can be run in the following way: $ ndnfirewall [-m mode] [-w #_of_items] [-b #_of_items] [-lp local_port_#] [-lpc local_port_#_for_command] [-ra remote_address] [-rp remote_port_#] [-h help]
Deliverable D4.2: Implementation of the Doctor Components
22/50 DOCTOR Project, <ANR-14-CE28-0001>
where:
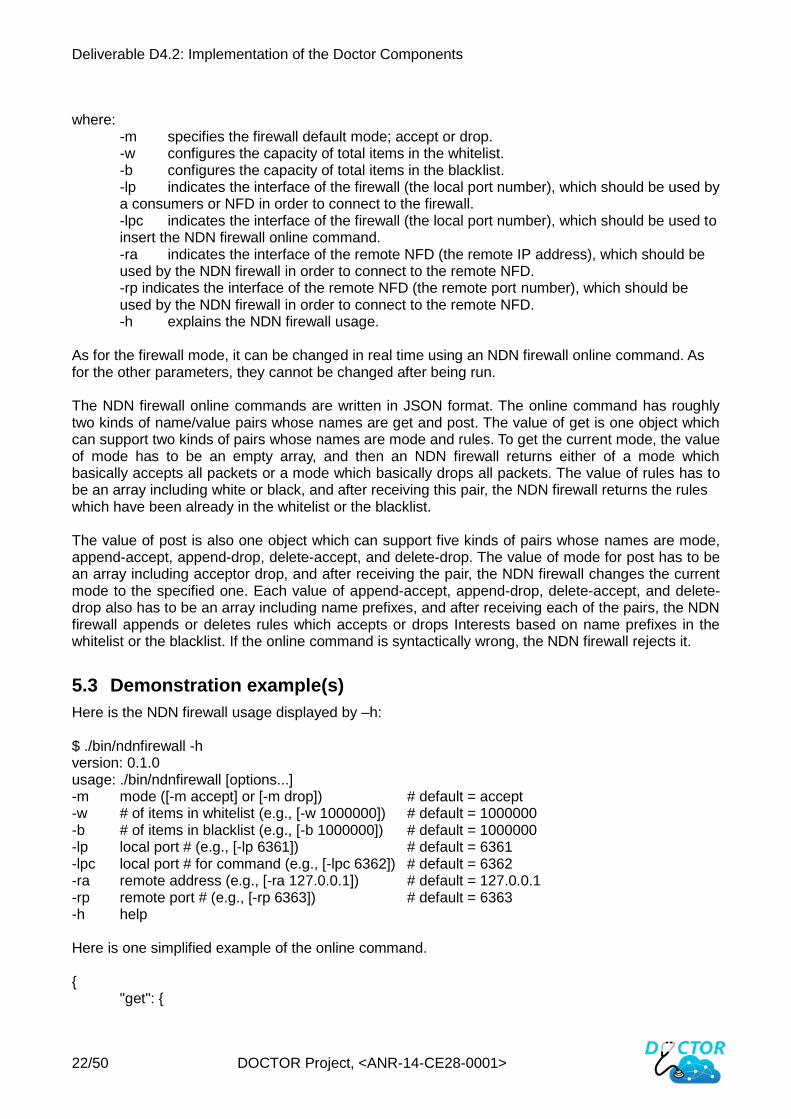
-m specifies the firewall default mode; accept or drop. -w configures the capacity of total items in the whitelist. -b configures the capacity of total items in the blacklist. -lp indicates the interface of the firewall (the local port number), which should be used by a consumers or NFD in order to connect to the firewall. -lpc indicates the interface of the firewall (the local port number), which should be used to insert the NDN firewall online command. -ra indicates the interface of the remote NFD (the remote IP address), which should be used by the NDN firewall in order to connect to the remote NFD. -rp indicates the interface of the remote NFD (the remote port number), which should be used by the NDN firewall in order to connect to the remote NFD. -h explains the NDN firewall usage.
As for the firewall mode, it can be changed in real time using an NDN firewall online command. As for the other parameters, they cannot be changed after being run. The NDN firewall online commands are written in JSON format. The online command has roughly two kinds of name/value pairs whose names are get and post. The value of get is one object which can support two kinds of pairs whose names are mode and rules. To get the current mode, the value of mode has to be an empty array, and then an NDN firewall returns either of a mode which basically accepts all packets or a mode which basically drops all packets. The value of rules has to be an array including white or black, and after receiving this pair, the NDN firewall returns the rules which have been already in the whitelist or the blacklist. The value of post is also one object which can support five kinds of pairs whose names are mode, append-accept, append-drop, delete-accept, and delete-drop. The value of mode for post has to be an array including acceptor drop, and after receiving the pair, the NDN firewall changes the current mode to the specified one. Each value of append-accept, append-drop, delete-accept, and delete-drop also has to be an array including name prefixes, and after receiving each of the pairs, the NDN firewall appends or deletes rules which accepts or drops Interests based on name prefixes in the whitelist or the blacklist. If the online command is syntactically wrong, the NDN firewall rejects it.
5.3 Demonstration example(s)
Here is the NDN firewall usage displayed by –h: $ ./bin/ndnfirewall -h version: 0.1.0 usage: ./bin/ndnfirewall [options...] -m mode ([-m accept] or [-m drop]) # default = accept -w # of items in whitelist (e.g., [-w 1000000]) # default = 1000000 -b # of items in blacklist (e.g., [-b 1000000]) # default = 1000000 -lp local port # (e.g., [-lp 6361]) # default = 6361 -lpc local port # for command (e.g., [-lpc 6362]) # default = 6362 -ra remote address (e.g., [-ra 127.0.0.1]) # default = 127.0.0.1 -rp remote port # (e.g., [-rp 6363]) # default = 6363 -h help Here is one simplified example of the online command. {
"get": {
Deliverable D4.2: Implementation of the Doctor Components
23/50 DOCTOR Project, <ANR-14-CE28-0001>
"mode": [ ], "rules": ["white", "black"]
}, "post": {
"mode": ["accept", "drop"], "append-accept": ["/example1", "/example2"], "append-drop": ["/example3", "/example4"], "delete-accept": ["/example1", "/example2"], "delete-drop": ["/example3", "/example4"]
} }
6 NDNperf
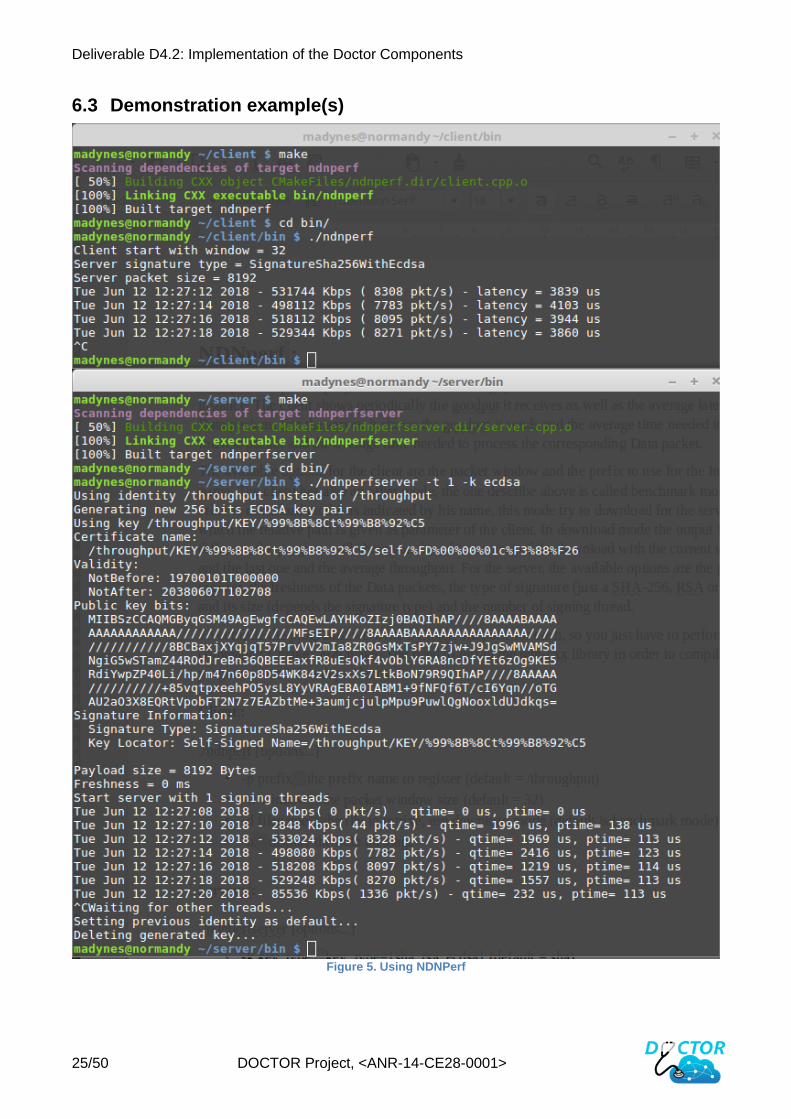
NDNperf is a tool that can measure the throughput between a NDNperf client instance and a NDNperf server instance. The client shows periodically the goodput it receives as well as the average latency of the Data packets. For the server, it shows the goodput it sends and the average time needed to handle an Interest packet and the average time needed to process the corresponding Data packet.
6.1 Requirements and Installation
To get the software, please clone the repository: https://github.com/DOCTOR-ANR/ndnperf $ git clone https://github.com/DOCTOR-ANR/ndnperf.git The ndn-cxx library is required in order to compile the program since it is its sole dependency.
To compile the two programs (server-side and client-side), we wrote a Cmake file for each one. $ cd client (or cd server)
$ cmake . && make
6.2 Usage
The available options for the client are the packet window size and the prefix to use for the Interest name. The client has also another mode, the one described above is called the benchmark mode and the other is the download mode. As suggested by his name, this mode tries to download from the server a file which the relative path is given as parameter of the client. In the download mode the output is different: the program shows the progress of the download with the current segment and the last one and the average throughput. For the server, the available options are the prefix to register, the freshness of the Data packets, the type of signature (among SHA-256, RSA or ECDSA) and its size (different sizes are possible depending on the signature type) and the number of signing threads. Client :
./ndnperf [options...]
-p prefix the prefix name to register (default = /throughput)
-w window the packet window size (default = 32)
-d filename the file to retrive, use download mode (default is benchmark mode)
-h display the help message
Server :
Deliverable D4.2: Implementation of the Doctor Components
24/50 DOCTOR Project, <ANR-14-CE28-0001>
./ndnperfserver [options...]
-k key_type key_type={sha, rsa, ecdsa} (default = sha)
-s key_size size of the key, rsa >= 1024, ecdsa={256, 384}
-t thread_count number of CPU used to handle Interests (default = logical core count)
-c payload_size size of the data carried by the packet (default = 8192)
-f freshness freshness of the Data in milliseconds (default = 0)
-h display this help message
Deliverable D4.2: Implementation of the Doctor Components
25/50 DOCTOR Project, <ANR-14-CE28-0001>
6.3 Demonstration example(s)
Figure 5. Using NDNPerf
Deliverable D4.2: Implementation of the Doctor Components
26/50 DOCTOR Project, <ANR-14-CE28-0001>
7 Signature verification module
7.1 Requirements
The signature verification module can be retrieved from this repository:
https://github.com/DOCTOR-ANR/ochestrator/tree/master/vnfs/nfd_router/SV_ST
To compile the signature verification module we provide a Cmake file. The ndn-cxx and
OpenSSL library are required in order to compile the program.
$ cd SV_ST (or cd server) $ cmake . && make
7.2 Usage
To launch the signature verification module, you need to provide four parameters: the name of the module ‘-n’, the IP address ‘-a’ and port ‘-p’ of a remote endpoint to connect, this endpoint is used to forward NDN packets and is most of the time a NDN router, and an other port ‘-C’ for the management interface. $ ./sv -n sv1 -a 192.168.1.10 -p 6363 -C 1000 The signature verifier module is designed to improve an existing NDN network composed with NFD nodes. It is better to deploy it between two existing nodes. As its name implies, this module verify signature of NDN Data packets that pass through it. To do that, you need to register producers’ public keys in a index file in the same directory as the executable. The module accept at least any keys generated with the help of NDN library (ndn-cxx, jndn, etc…) in to formats: PEM and DER. To register a key in the index file you have to provide 3 information: the KeyLocator, this encoding and the path of the file that contain the key. The index file is read at lunch to load the public key in memory but it is possible to edit the file during the execution. After edition you can ask the module to reload the index so it can apply the change(s).
/throughput/KEY/%A0%BD%A8%0F%85%ACyA PEM throughput.pub /testname/KEY/DSK-123/ID-CERT DER tan.pub
Example of index file
The module is also able to send periodical reports to a remote UDP endpoint you can specify and can be change dynamically. By default this function is not activated and to enable it you just have to provide an address, a port and a period between each report, in milliseconds, since these contain the aggregation of all packets’ name that have failed the verification during the defined period. You can also define a drop policy, by default the signature verifier does not drop packets that fail the verification but you can change the policy dynamically. You have three types of drop policy, when the packet fail the verification, if no known key for the packet is available and if packet is not signed (just a hash). For dynamic configuration, you have to interact through the management interface (UDP) of the module with JSON string. Two kinds of action are defined : edit the configuration and list the current configuration. When changing the configuration, you can just send parameters you want to change and ignore the other in the JSON string.
{“action”:”list”}
JSON string to list the current configuration
Deliverable D4.2: Implementation of the Doctor Components
27/50 DOCTOR Project, <ANR-14-CE28-0001>
{“action”:”edit”, “drop”:true, “no_key_drop”:true, “hash_drop”:true, “address”:”127.0.0.1”, “port”:7000, “report_each”:5000}
Example of JSON string to push configuration into signature verifier
{“type”:”report”, “name”:”SV1”, ”invalid_signature_packet_name”:[“/a”,”/b”,”/c”]}
Exemple of report JSON string
8 NDN microservices
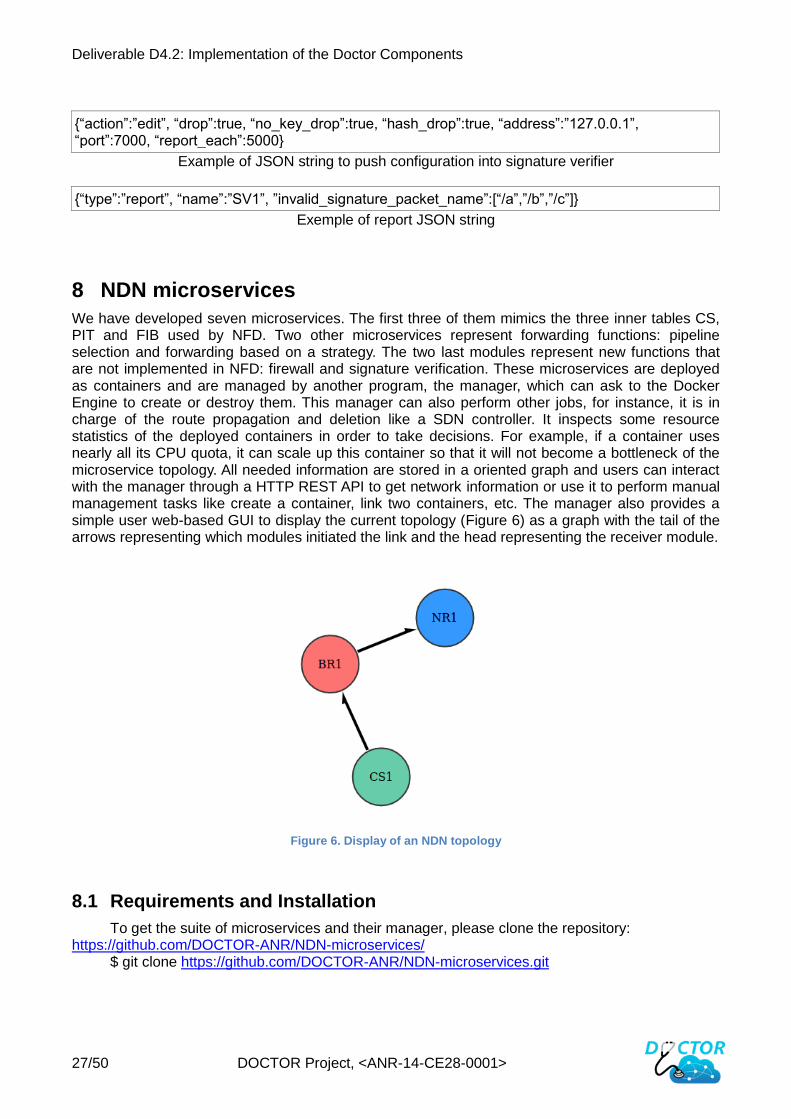
We have developed seven microservices. The first three of them mimics the three inner tables CS, PIT and FIB used by NFD. Two other microservices represent forwarding functions: pipeline selection and forwarding based on a strategy. The two last modules represent new functions that are not implemented in NFD: firewall and signature verification. These microservices are deployed as containers and are managed by another program, the manager, which can ask to the Docker Engine to create or destroy them. This manager can also perform other jobs, for instance, it is in charge of the route propagation and deletion like a SDN controller. It inspects some resource statistics of the deployed containers in order to take decisions. For example, if a container uses nearly all its CPU quota, it can scale up this container so that it will not become a bottleneck of the microservice topology. All needed information are stored in a oriented graph and users can interact with the manager through a HTTP REST API to get network information or use it to perform manual management tasks like create a container, link two containers, etc. The manager also provides a simple user web-based GUI to display the current topology (Figure 6) as a graph with the tail of the arrows representing which modules initiated the link and the head representing the receiver module.
Figure 6. Display of an NDN topology
8.1 Requirements and Installation
To get the suite of microservices and their manager, please clone the repository: https://github.com/DOCTOR-ANR/NDN-microservices/
$ git clone https://github.com/DOCTOR-ANR/NDN-microservices.git
Deliverable D4.2: Implementation of the Doctor Components
28/50 DOCTOR Project, <ANR-14-CE28-0001>
The manager is written in Python 3 and does not require to be compiled. The microservices
are written in C++ and can be compiled separately if needed, but please note that the way to go is
to use the automated procedure of the orchestrator to deploy them.
$ cd NDN-microservices/modules/BR_ST/ (or any other module) $ cmake . && make
At launch, the manager checks if the container’s images are present or else it builds the
missing images. The manager requires the twisted, klein, networkx and docker python libraries. The
microservices require the ndn-cxx library to be built.
8.2 Usage
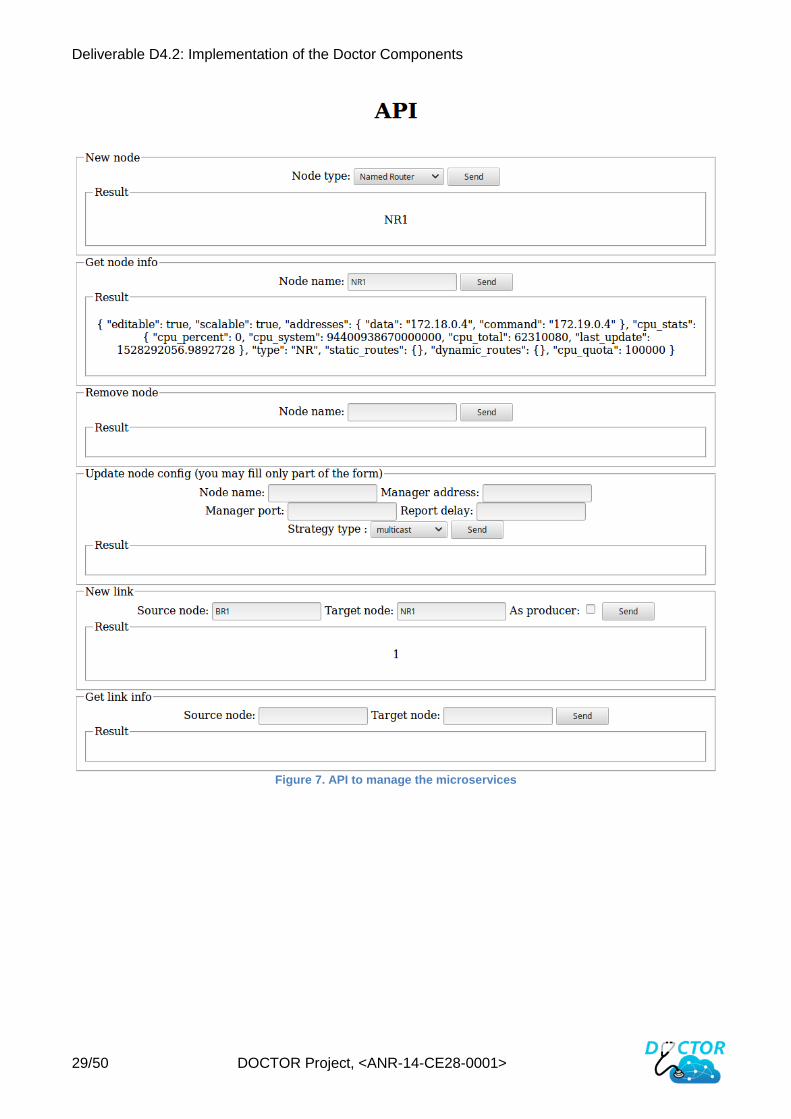
The following command launches the manager: $python3 manager.py Then the web GUI is available at this local address: http://0.0.0.0:8080 Below is the list of the possible actions that can be performed through the API (Figure 7 shows only
a part of the forms). The current possible actions are:
create a new node
inspect a node
remove a node
update the node configuration
create a new link
inspect a link
remove a link
add a new public key
remove a public key
The microservices have two types of parameters: some are static and other are dynamic. Static
parameters are:
the name of the container,
the listening port(s),
the maximum number of objects processed by the microservice (both static and dynamic).
To change dynamic parameters, JSON messages can be sent to the management interface of the
microservices. The microservices have a common base for Face management and also exhibit
specific parameters like the route management for the Name Router. Some microservices are also
able to send periodical reports of some metrics, for example the Content Store can report its cache
hit/miss counter.
8.3 Demonstration example(s)
Deliverable D4.2: Implementation of the Doctor Components
29/50 DOCTOR Project, <ANR-14-CE28-0001>
Figure 7. API to manage the microservices
Deliverable D4.2: Implementation of the Doctor Components
30/50 DOCTOR Project, <ANR-14-CE28-0001>
9 NDN Monitoring Probe
9.1 Requirements
9.1.1 Hardware
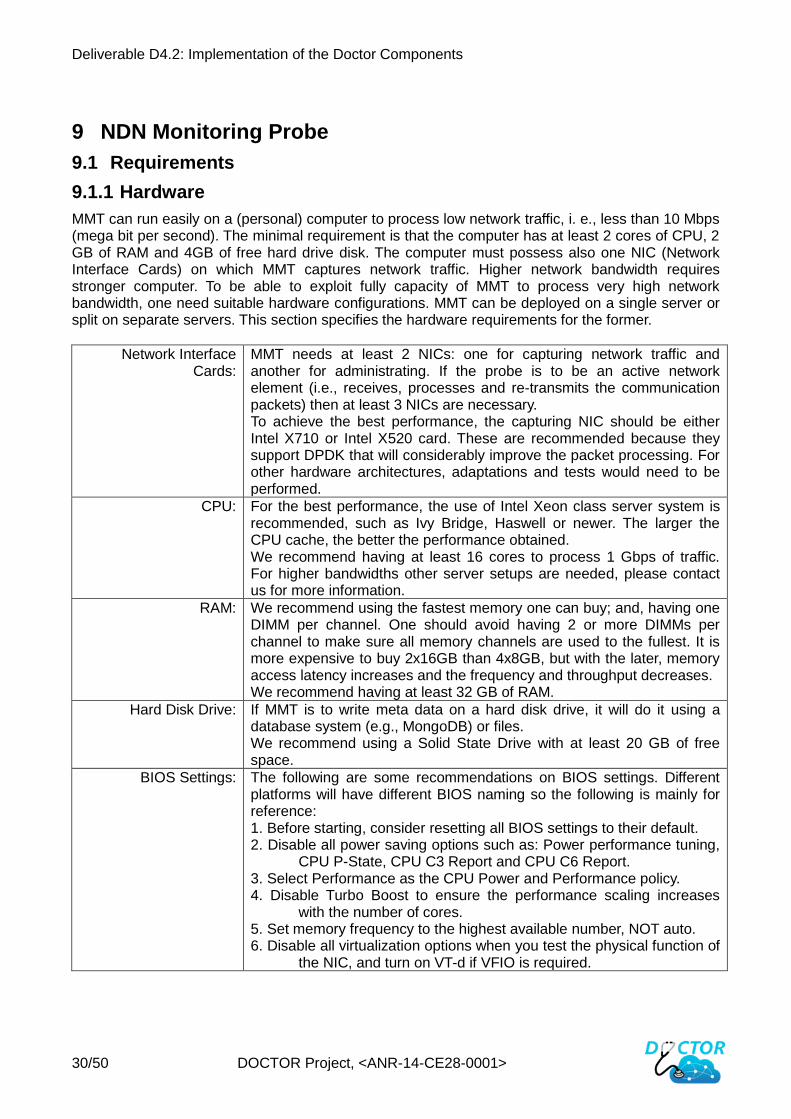
MMT can run easily on a (personal) computer to process low network traffic, i. e., less than 10 Mbps (mega bit per second). The minimal requirement is that the computer has at least 2 cores of CPU, 2 GB of RAM and 4GB of free hard drive disk. The computer must possess also one NIC (Network Interface Cards) on which MMT captures network traffic. Higher network bandwidth requires stronger computer. To be able to exploit fully capacity of MMT to process very high network bandwidth, one need suitable hardware configurations. MMT can be deployed on a single server or split on separate servers. This section specifies the hardware requirements for the former.
Network Interface Cards:
MMT needs at least 2 NICs: one for capturing network traffic and another for administrating. If the probe is to be an active network element (i.e., receives, processes and re-transmits the communication packets) then at least 3 NICs are necessary. To achieve the best performance, the capturing NIC should be either Intel X710 or Intel X520 card. These are recommended because they support DPDK that will considerably improve the packet processing. For other hardware architectures, adaptations and tests would need to be performed.
CPU: For the best performance, the use of Intel Xeon class server system is recommended, such as Ivy Bridge, Haswell or newer. The larger the CPU cache, the better the performance obtained. We recommend having at least 16 cores to process 1 Gbps of traffic. For higher bandwidths other server setups are needed, please contact us for more information.
RAM: We recommend using the fastest memory one can buy; and, having one DIMM per channel. One should avoid having 2 or more DIMMs per channel to make sure all memory channels are used to the fullest. It is more expensive to buy 2x16GB than 4x8GB, but with the later, memory access latency increases and the frequency and throughput decreases. We recommend having at least 32 GB of RAM.
Hard Disk Drive: If MMT is to write meta data on a hard disk drive, it will do it using a database system (e.g., MongoDB) or files. We recommend using a Solid State Drive with at least 20 GB of free space.
BIOS Settings: The following are some recommendations on BIOS settings. Different platforms will have different BIOS naming so the following is mainly for reference: 1. Before starting, consider resetting all BIOS settings to their default. 2. Disable all power saving options such as: Power performance tuning,
CPU P-State, CPU C3 Report and CPU C6 Report. 3. Select Performance as the CPU Power and Performance policy. 4. Disable Turbo Boost to ensure the performance scaling increases
with the number of cores. 5. Set memory frequency to the highest available number, NOT auto. 6. Disable all virtualization options when you test the physical function of
the NIC, and turn on VT-d if VFIO is required.
Deliverable D4.2: Implementation of the Doctor Components
31/50 DOCTOR Project, <ANR-14-CE28-0001>
9.1.2 Software
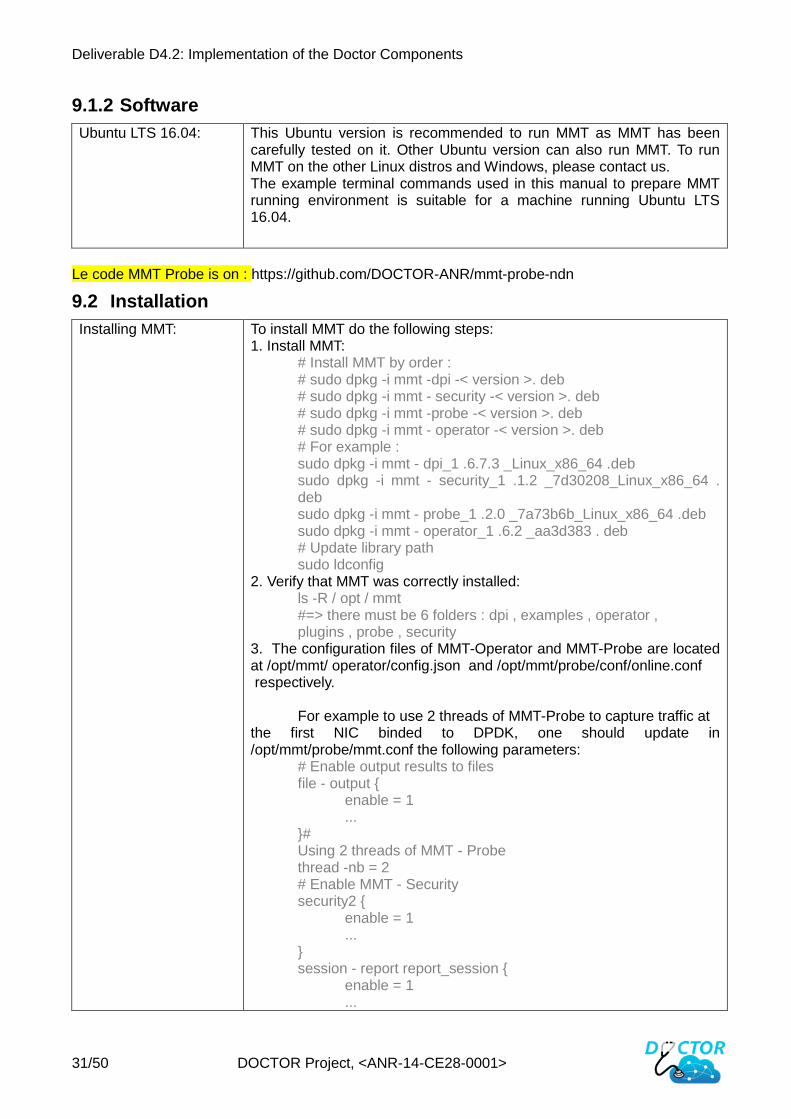
Ubuntu LTS 16.04: This Ubuntu version is recommended to run MMT as MMT has been carefully tested on it. Other Ubuntu version can also run MMT. To run MMT on the other Linux distros and Windows, please contact us. The example terminal commands used in this manual to prepare MMT running environment is suitable for a machine running Ubuntu LTS 16.04.
Le code MMT Probe is on : https://github.com/DOCTOR-ANR/mmt-probe-ndn
9.2 Installation
Installing MMT: To install MMT do the following steps: 1. Install MMT:
# Install MMT by order : # sudo dpkg -i mmt -dpi -< version >. deb # sudo dpkg -i mmt - security -< version >. deb # sudo dpkg -i mmt -probe -< version >. deb # sudo dpkg -i mmt - operator -< version >. deb # For example : sudo dpkg -i mmt - dpi_1 .6.7.3 _Linux_x86_64 .deb sudo dpkg -i mmt - security_1 .1.2 _7d30208_Linux_x86_64 . deb sudo dpkg -i mmt - probe_1 .2.0 _7a73b6b_Linux_x86_64 .deb sudo dpkg -i mmt - operator_1 .6.2 _aa3d383 . deb # Update library path sudo ldconfig
2. Verify that MMT was correctly installed: ls -R / opt / mmt #=> there must be 6 folders : dpi , examples , operator , plugins , probe , security
3. The configuration files of MMT-Operator and MMT-Probe are located at /opt/mmt/ operator/config.json and /opt/mmt/probe/conf/online.conf respectively.
For example to use 2 threads of MMT-Probe to capture traffic at the first NIC binded to DPDK, one should update in /opt/mmt/probe/mmt.conf the following parameters:
# Enable output results to files file - output {
enable = 1 ...
}# Using 2 threads of MMT - Probe thread -nb = 2 # Enable MMT - Security security2 {
enable = 1 ...
} session - report report_session {
enable = 1 ...
Deliverable D4.2: Implementation of the Doctor Components
32/50 DOCTOR Project, <ANR-14-CE28-0001>
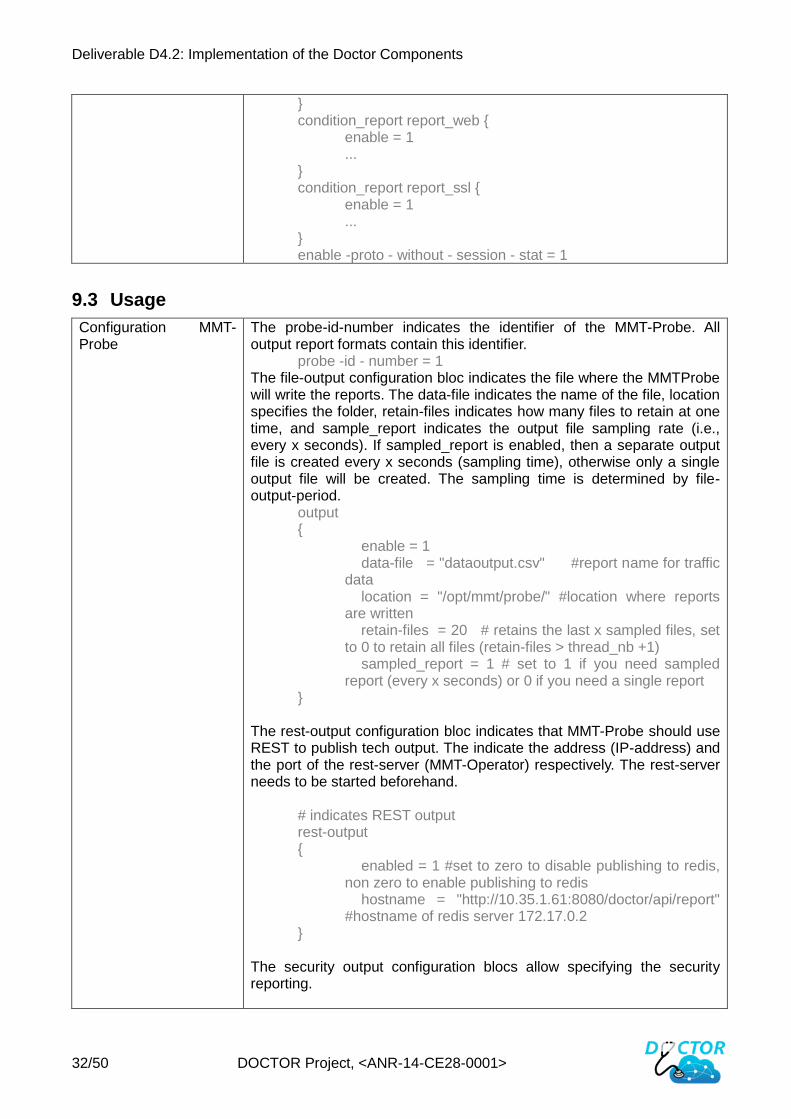
} condition_report report_web {
enable = 1 ...
} condition_report report_ssl {
enable = 1 ...
} enable -proto - without - session - stat = 1
9.3 Usage
Configuration MMT-Probe
The probe-id-number indicates the identifier of the MMT-Probe. All output report formats contain this identifier.
probe -id - number = 1 The file-output configuration bloc indicates the file where the MMTProbe will write the reports. The data-file indicates the name of the file, location specifies the folder, retain-files indicates how many files to retain at one time, and sample_report indicates the output file sampling rate (i.e., every x seconds). If sampled_report is enabled, then a separate output file is created every x seconds (sampling time), otherwise only a single output file will be created. The sampling time is determined by file-output-period.
output {
enable = 1 data-file = "dataoutput.csv" #report name for traffic data location = "/opt/mmt/probe/" #location where reports are written retain-files = 20 # retains the last x sampled files, set to 0 to retain all files (retain-files > thread_nb +1) sampled_report = 1 # set to 1 if you need sampled report (every x seconds) or 0 if you need a single report
} The rest-output configuration bloc indicates that MMT-Probe should use REST to publish tech output. The indicate the address (IP-address) and the port of the rest-server (MMT-Operator) respectively. The rest-server needs to be started beforehand.
# indicates REST output rest-output {
enabled = 1 #set to zero to disable publishing to redis, non zero to enable publishing to redis hostname = "http://10.35.1.61:8080/doctor/api/report" #hostname of redis server 172.17.0.2
}
The security output configuration blocs allow specifying the security reporting.
Deliverable D4.2: Implementation of the Doctor Components
33/50 DOCTOR Project, <ANR-14-CE28-0001>
# indicates ndn security ndn_security_config { enabled = 1 #set to zero to disable the feature, 1 to enable output = 2 #0 for csv file, 1 for redis, 2 for rest path_output = "./data_nfd.csv" # path to the report localhost_filter = 1 #1 to enable, use to filter interest with prefix /localhost and /localhop redis_hostname = "127.0.0.1" #hostname of redis server in local/tenant for ndn_security redis_port = 6379 # port number of redis server rest_hostname = "http://127.0.0.1:8080/api/ndn_security" #hostname of REST server in local/tenant for ndn_security time_period = 5 # time period to send info to redis server in local/tenant path_nfd_log = "/var/log/nfd_log" # path to the nfd_log file /var/log/nfd_log ./nfd_log_R1 ./test_nfd_log }
Start MMT-Probe Execute the following commands to launch the MMT-Probe.
# Start MMT - Probe to monitor traffic # run this command on a new terminal sudo ./probe -c /opt/mmt/probe/conf/mmt.conf
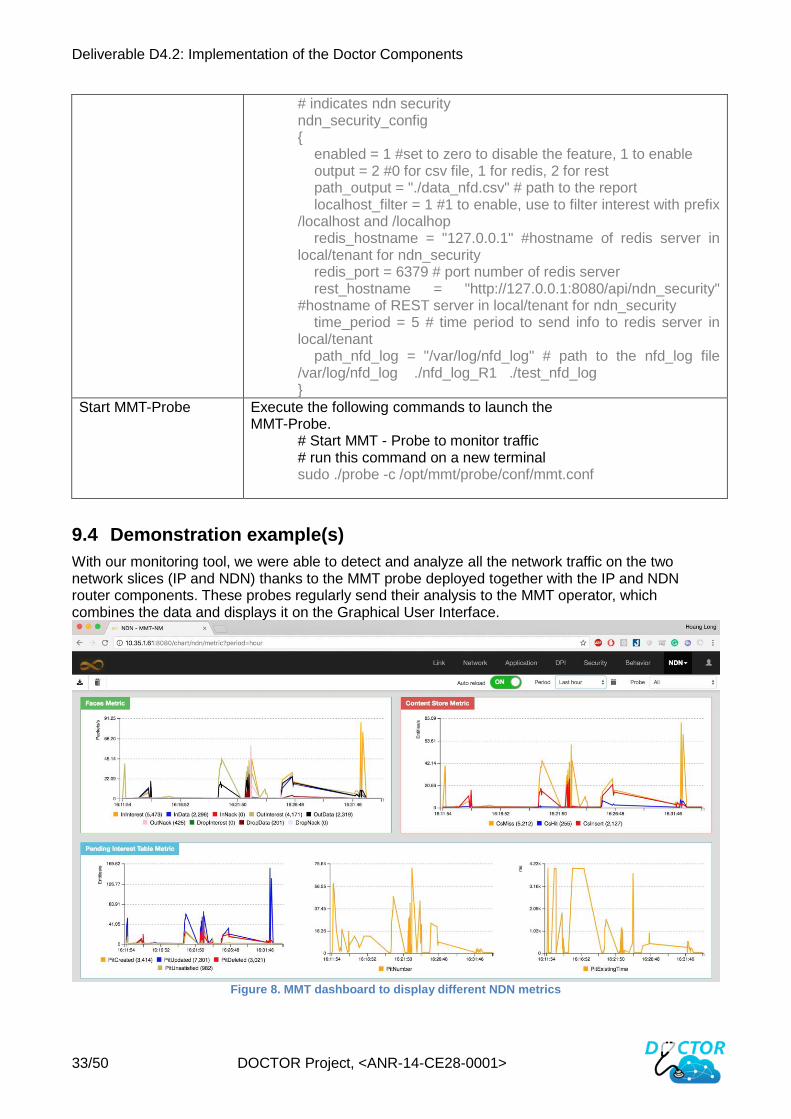
9.4 Demonstration example(s)
With our monitoring tool, we were able to detect and analyze all the network traffic on the two network slices (IP and NDN) thanks to the MMT probe deployed together with the IP and NDN router components. These probes regularly send their analysis to the MMT operator, which combines the data and displays it on the Graphical User Interface.
Figure 8. MMT dashboard to display different NDN metrics
Deliverable D4.2: Implementation of the Doctor Components
34/50 DOCTOR Project, <ANR-14-CE28-0001>
10 MMT Security Engine
10.1 Requirements
MMT Security is installed on the same computer/container with MMT-Probe. See the NDN Monitoring Probe for the requirements.
10.2 Installation
The installation of MMT-Security is explained in the section of installation MMT Probe Le code MMT Security is on : https://github.com/DOCTOR-ANR/mmt-security-ndn
10.3 Usage
Start MMT-Security Execute the following commands to launch the MMT-Security: ./mmt_sec_server –a 8080 –o <dashboard-ip:dashboard-port>/doctor/api/report –b <probe-id> &
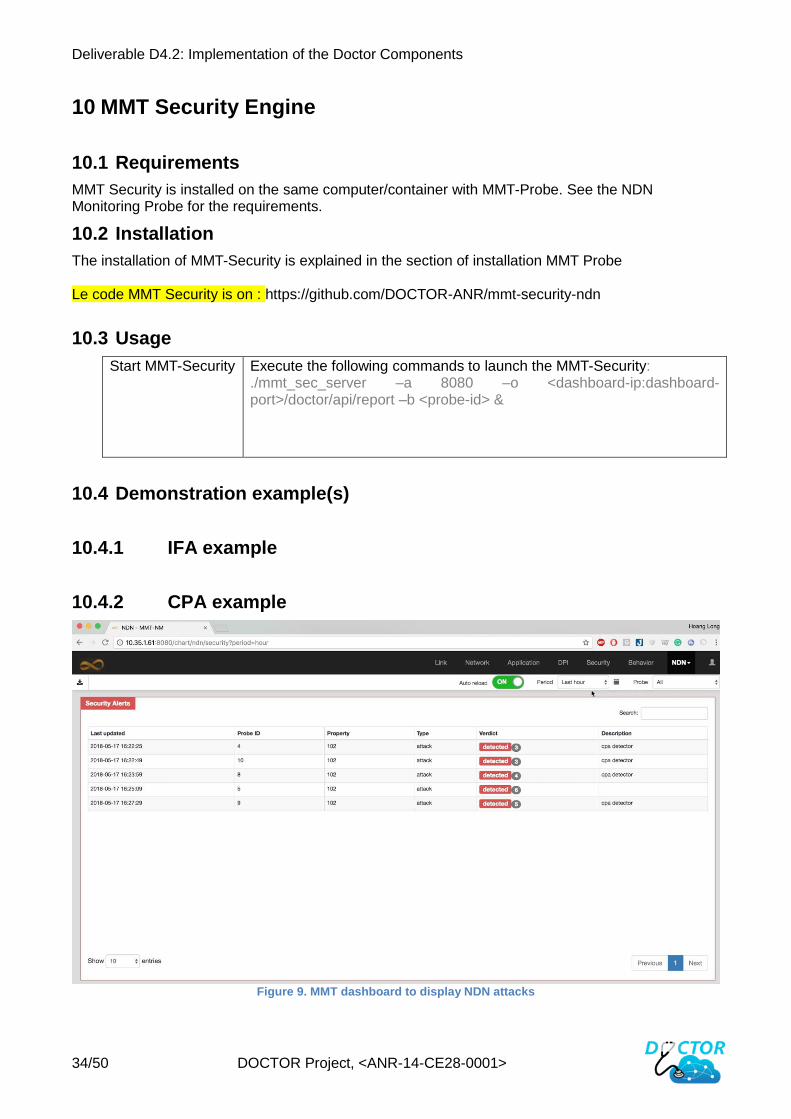
10.4 Demonstration example(s)
10.4.1 IFA example
10.4.2 CPA example
Figure 9. MMT dashboard to display NDN attacks
Deliverable D4.2: Implementation of the Doctor Components
35/50 DOCTOR Project, <ANR-14-CE28-0001>
11 MMT Dashboard
11.1 Requirements
Ubuntu LTS 16.04:
This Ubuntu version is recommended to run MMT as MMT has been carefully tested on it. Other Ubuntu version can also run MMT. To run MMT on the other Linux distros and Windows, please contact us. The example terminal commands used in this manual to prepare MMT running environment is suitable for a machine running Ubuntu LTS 16.04.
MongoDB:
MMT stores meta data using MongoDB. For the use of other database systems please contact us. To install MongoDB follow steps described in https://docs.mongodb.com/manual/tutorial/install-mongodbon- ubuntu/ . To resume, for Ubuntu 16.04 LTS, one needs to do the following:
1. Import the public key used by the package management system: sudo apt - key adv -- keyserver hkp :// keyserver . ubuntu . com :80 --recv 0 C49F3730359A14518585931BC711F9BA15703C6 2. Create a list file for MongoDB and reload the local package database: echo " deb [ arch =amd64 , arm64 ] http :// repo . mongodb . org /apt / ubuntu xenial / mongodb - org /3.4 multiverse " | sudo tee /etc /apt / sources . list .d/ mongodb -org -3.4. list sudo apt - get update 3. Install the MongoDB package: sudo apt - get install -y mongodb - org 4. Start MongoDB: sudo service mongod start 5. Verify that the mongod process has started successfully by checking that the log file /var/log/mongodb/mongod.log contains the line: [ initandlisten ] waiting for connections on port 27017
NodeJS:
The MMT-Operator runs using NodeJS. To install NodeJS, follow the steps described in https://nodejs.org/en/download/packagemanager/ . To resume, for Ubuntu 16.04 LTS, one needs to do the following:
1. Create a list file for NodeJS and reload the local package database: curl -sL https :// deb . nodesource . com / setup_6 .x | sudo -E bash - 2. Install NodeJS: sudo apt - get install -y nodejs 3. Verify that NodeJS was successfully installed: node -v
11.2 Installation
The installation of MMT-Operator is explained also in the section of installation MMT Probe Le code MMT Operator is on : https://github.com/DOCTOR-ANR/mmt-operator-ndn
Deliverable D4.2: Implementation of the Doctor Components
36/50 DOCTOR Project, <ANR-14-CE28-0001>
11.3 Usage
NodeJS:
Execute the following commands to launch the MMT-Operator and the MMT-Probe.
# Start MMT - Operator sudo mmt - operator
11.4 Demonstration example(s)
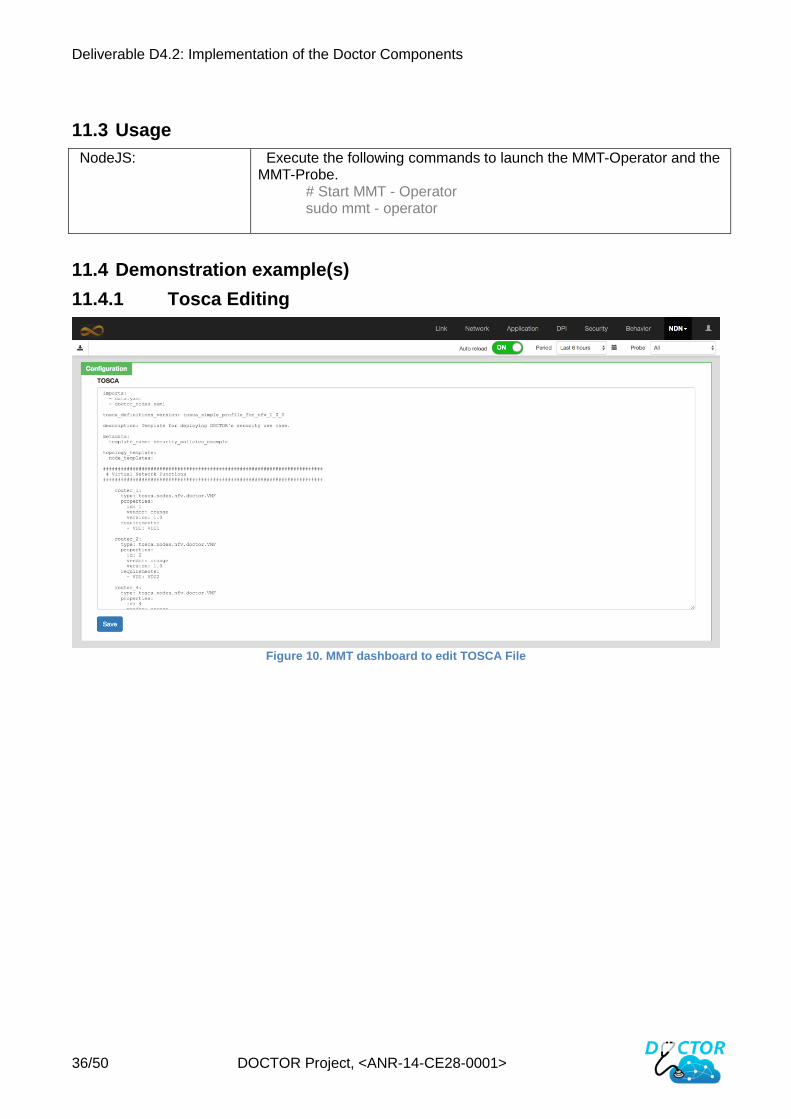
11.4.1 Tosca Editing
Figure 10. MMT dashboard to edit TOSCA File
Deliverable D4.2: Implementation of the Doctor Components
37/50 DOCTOR Project, <ANR-14-CE28-0001>
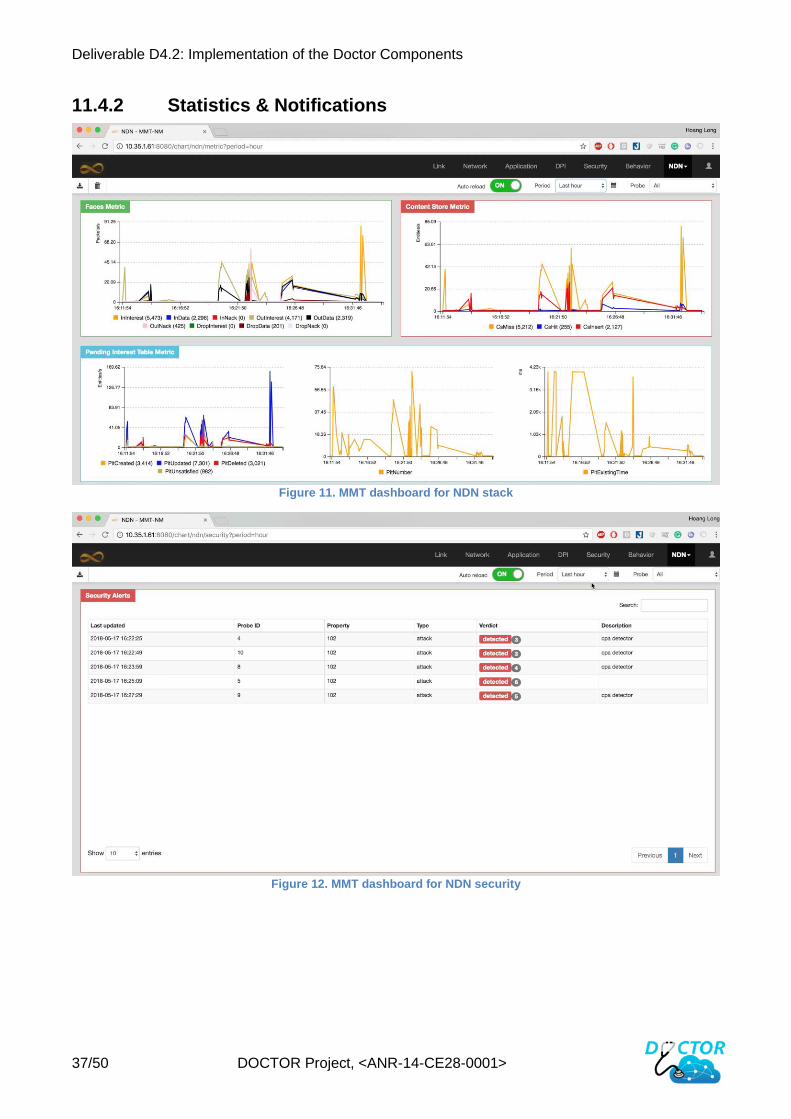
11.4.2 Statistics & Notifications
Figure 11. MMT dashboard for NDN stack
Figure 12. MMT dashboard for NDN security
Deliverable D4.2: Implementation of the Doctor Components
38/50 DOCTOR Project, <ANR-14-CE28-0001>
12 Cybercaptor
12.1 Requirements
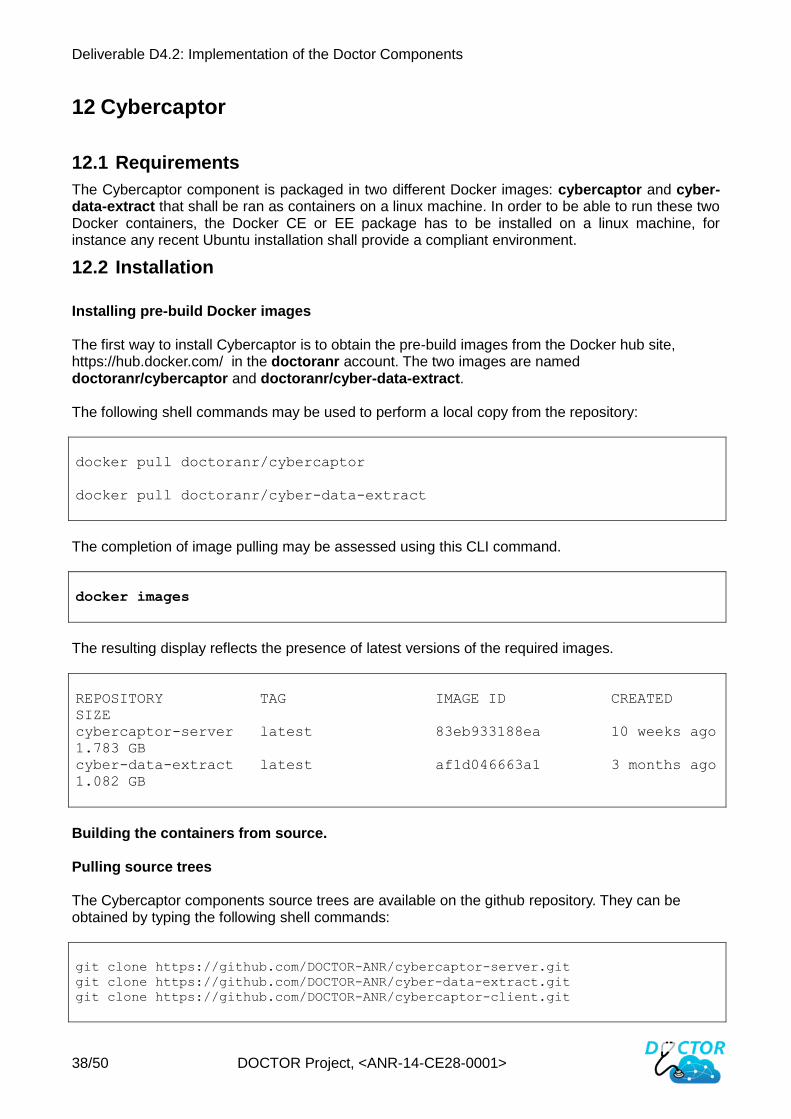
The Cybercaptor component is packaged in two different Docker images: cybercaptor and cyber-data-extract that shall be ran as containers on a linux machine. In order to be able to run these two Docker containers, the Docker CE or EE package has to be installed on a linux machine, for instance any recent Ubuntu installation shall provide a compliant environment.
12.2 Installation
Installing pre-build Docker images The first way to install Cybercaptor is to obtain the pre-build images from the Docker hub site, https://hub.docker.com/ in the doctoranr account. The two images are named doctoranr/cybercaptor and doctoranr/cyber-data-extract. The following shell commands may be used to perform a local copy from the repository:
docker pull doctoranr/cybercaptor
docker pull doctoranr/cyber-data-extract
The completion of image pulling may be assessed using this CLI command.
docker images
The resulting display reflects the presence of latest versions of the required images.
REPOSITORY TAG IMAGE ID CREATED
SIZE cybercaptor-server latest 83eb933188ea 10 weeks ago
1.783 GB cyber-data-extract latest af1d046663a1 3 months ago
1.082 GB
Building the containers from source. Pulling source trees The Cybercaptor components source trees are available on the github repository. They can be obtained by typing the following shell commands:
git clone https://github.com/DOCTOR-ANR/cybercaptor-server.git git clone https://github.com/DOCTOR-ANR/cyber-data-extract.git
git clone https://github.com/DOCTOR-ANR/cybercaptor-client.git
Deliverable D4.2: Implementation of the Doctor Components
39/50 DOCTOR Project, <ANR-14-CE28-0001>
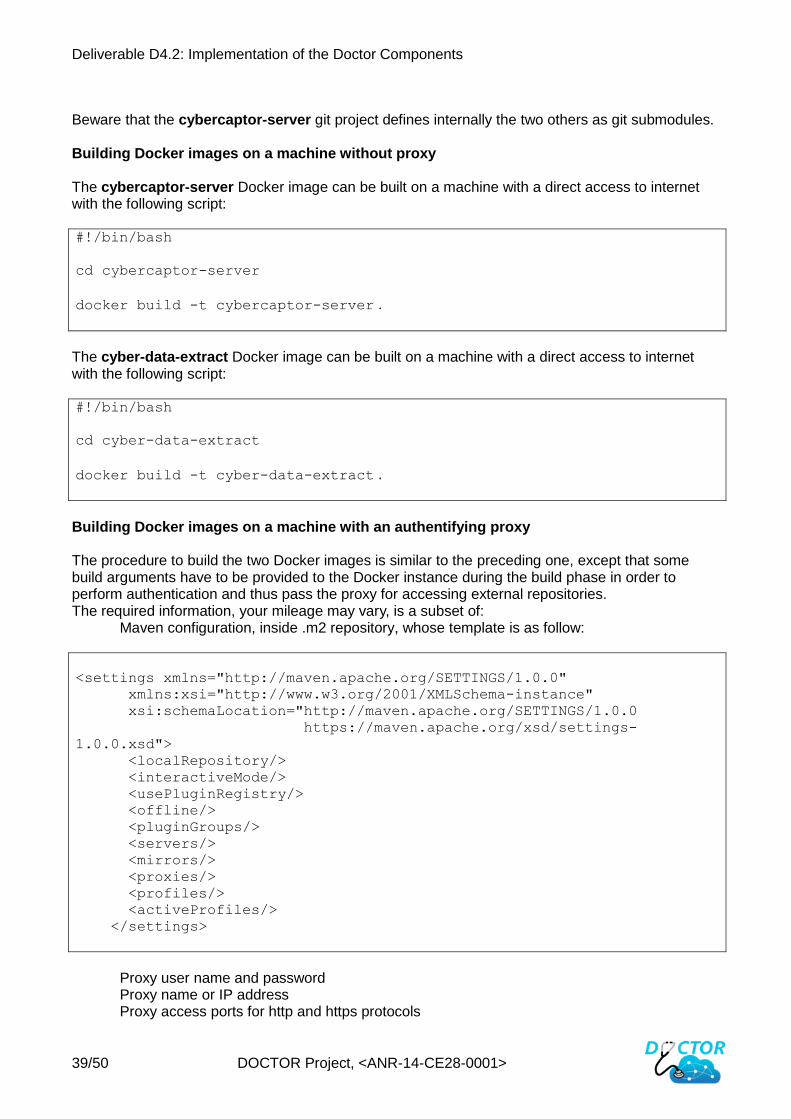
Beware that the cybercaptor-server git project defines internally the two others as git submodules. Building Docker images on a machine without proxy The cybercaptor-server Docker image can be built on a machine with a direct access to internet with the following script: #!/bin/bash
cd cybercaptor-server
docker build -t cybercaptor-server .
The cyber-data-extract Docker image can be built on a machine with a direct access to internet with the following script: #!/bin/bash
cd cyber-data-extract
docker build -t cyber-data-extract .
Building Docker images on a machine with an authentifying proxy The procedure to build the two Docker images is similar to the preceding one, except that some build arguments have to be provided to the Docker instance during the build phase in order to perform authentication and thus pass the proxy for accessing external repositories. The required information, your mileage may vary, is a subset of:
Maven configuration, inside .m2 repository, whose template is as follow:
<settings xmlns="http://maven.apache.org/SETTINGS/1.0.0" xmlns:xsi="http://www.w3.org/2001/XMLSchema-instance" xsi:schemaLocation="http://maven.apache.org/SETTINGS/1.0.0 https://maven.apache.org/xsd/settings-
1.0.0.xsd"> <localRepository/> <interactiveMode/> <usePluginRegistry/> <offline/> <pluginGroups/> <servers/> <mirrors/> <proxies/> <profiles/> <activeProfiles/> </settings>
Proxy user name and password Proxy name or IP address Proxy access ports for http and https protocols
Deliverable D4.2: Implementation of the Doctor Components
40/50 DOCTOR Project, <ANR-14-CE28-0001>
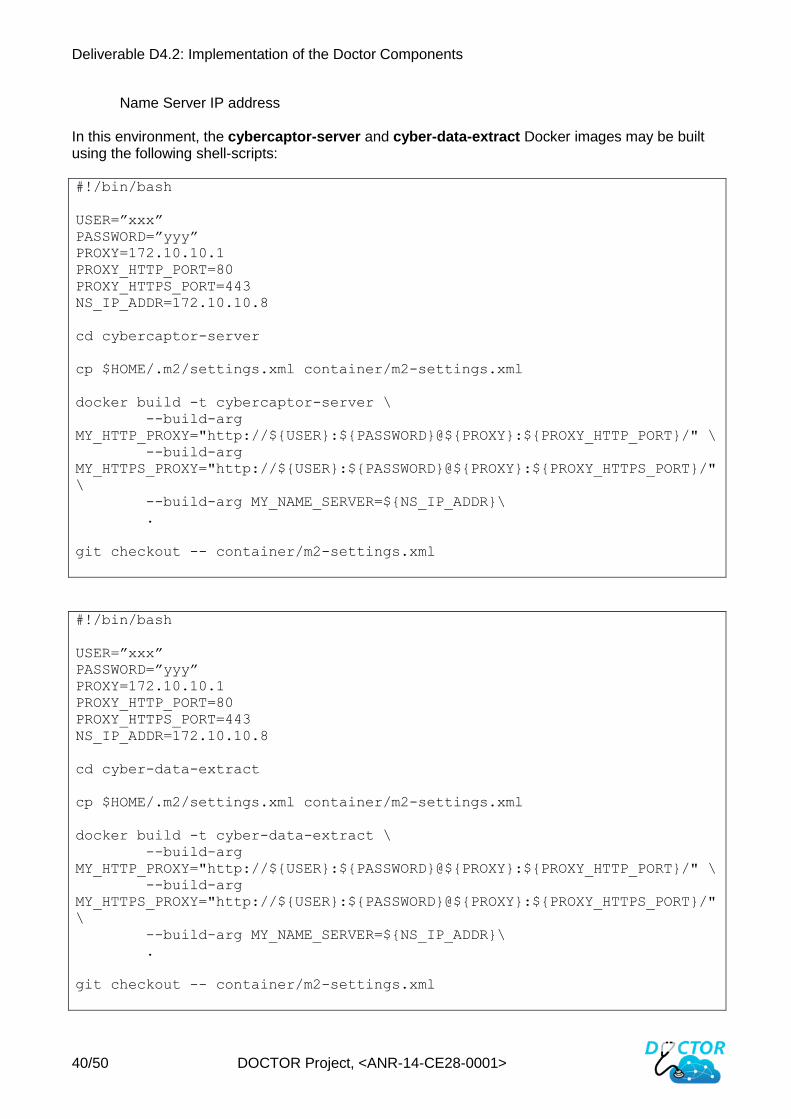
Name Server IP address In this environment, the cybercaptor-server and cyber-data-extract Docker images may be built using the following shell-scripts: #!/bin/bash
USER=”xxx” PASSWORD=”yyy” PROXY=172.10.10.1 PROXY_HTTP_PORT=80 PROXY_HTTPS_PORT=443 NS_IP_ADDR=172.10.10.8
cd cybercaptor-server
cp $HOME/.m2/settings.xml container/m2-settings.xml
docker build -t cybercaptor-server \ --build-arg
MY_HTTP_PROXY="http://${USER}:${PASSWORD}@${PROXY}:${PROXY_HTTP_PORT}/" \ --build-arg
MY_HTTPS_PROXY="http://${USER}:${PASSWORD}@${PROXY}:${PROXY_HTTPS_PORT}/"
\ --build-arg MY_NAME_SERVER=${NS_IP_ADDR}\ .
git checkout -- container/m2-settings.xml
#!/bin/bash
USER=”xxx” PASSWORD=”yyy” PROXY=172.10.10.1 PROXY_HTTP_PORT=80 PROXY_HTTPS_PORT=443 NS_IP_ADDR=172.10.10.8
cd cyber-data-extract
cp $HOME/.m2/settings.xml container/m2-settings.xml
docker build -t cyber-data-extract \ --build-arg
MY_HTTP_PROXY="http://${USER}:${PASSWORD}@${PROXY}:${PROXY_HTTP_PORT}/" \ --build-arg
MY_HTTPS_PROXY="http://${USER}:${PASSWORD}@${PROXY}:${PROXY_HTTPS_PORT}/"
\ --build-arg MY_NAME_SERVER=${NS_IP_ADDR}\ .
git checkout -- container/m2-settings.xml
Deliverable D4.2: Implementation of the Doctor Components
41/50 DOCTOR Project, <ANR-14-CE28-0001>
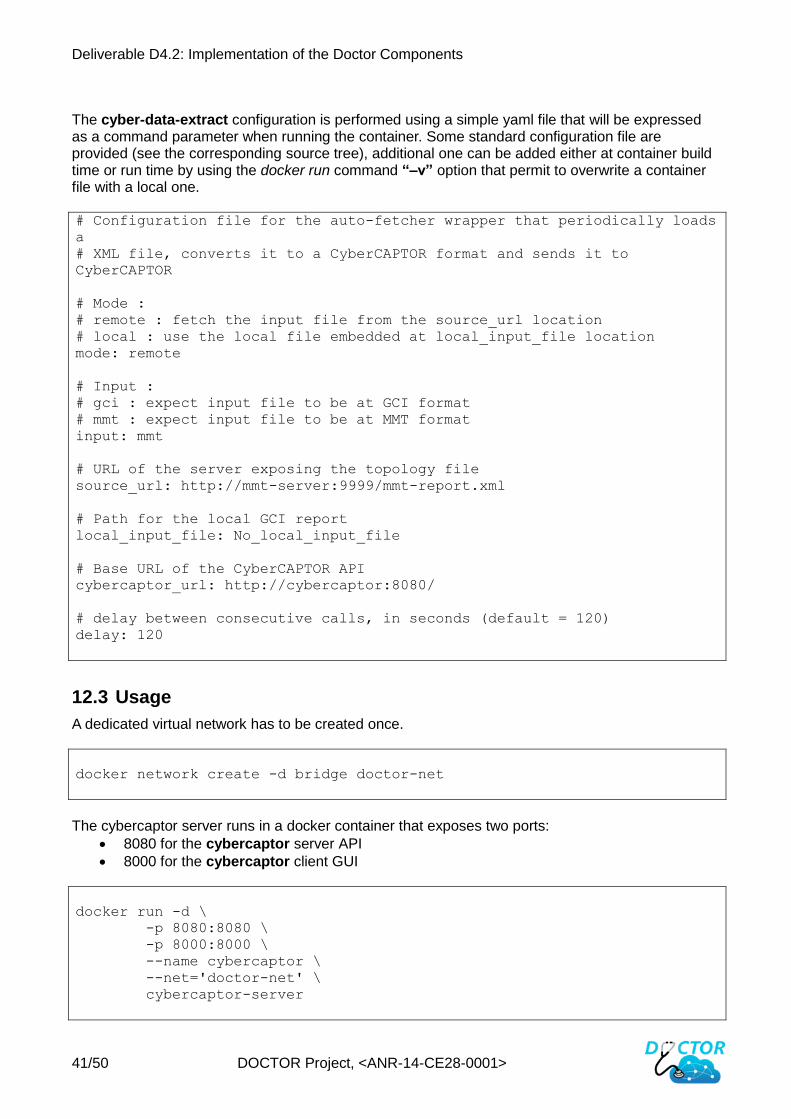
The cyber-data-extract configuration is performed using a simple yaml file that will be expressed as a command parameter when running the container. Some standard configuration file are provided (see the corresponding source tree), additional one can be added either at container build time or run time by using the docker run command “–v” option that permit to overwrite a container file with a local one. # Configuration file for the auto-fetcher wrapper that periodically loads
a # XML file, converts it to a CyberCAPTOR format and sends it to
CyberCAPTOR
# Mode : # remote : fetch the input file from the source_url location # local : use the local file embedded at local_input_file location mode: remote
# Input : # gci : expect input file to be at GCI format # mmt : expect input file to be at MMT format input: mmt
# URL of the server exposing the topology file source_url: http://mmt-server:9999/mmt-report.xml
# Path for the local GCI report local_input_file: No_local_input_file
# Base URL of the CyberCAPTOR API cybercaptor_url: http://cybercaptor:8080/
# delay between consecutive calls, in seconds (default = 120) delay: 120
12.3 Usage
A dedicated virtual network has to be created once.
docker network create -d bridge doctor-net
The cybercaptor server runs in a docker container that exposes two ports:
• 8080 for the cybercaptor server API
• 8000 for the cybercaptor client GUI
docker run -d \ -p 8080:8080 \ -p 8000:8000 \ --name cybercaptor \ --net='doctor-net' \ cybercaptor-server
Deliverable D4.2: Implementation of the Doctor Components
42/50 DOCTOR Project, <ANR-14-CE28-0001>
The cyber-data-extract server runs also in a Docker container. It has two modes: a pull one and a push one. This command runs cyber-data-extract in pull mode. It means that it fetches cyclically the system topology definition by invocating an external REST service.
docker run \ --rm -it \ --net='doctor-net' \ --name='data' \ -e MODE='FETCH' \ -e CONFIG='auto-fetcher-config_for_remote_mmt_fetch.yaml' \ cyber-data-extract
This command runs cyber-data-extract in push mode. It means that it runs a REST service on the exposed port. An external server is than able to push the system topology on it.
docker run \ --rm -it \ --net='doctor-net' \ --name='data' \ -e MODE='REST' \ -e CONFIG='auto-fetcher-config_for_mmt_rest.yaml' \ -p 5000:5000 \ cyber-data-extract
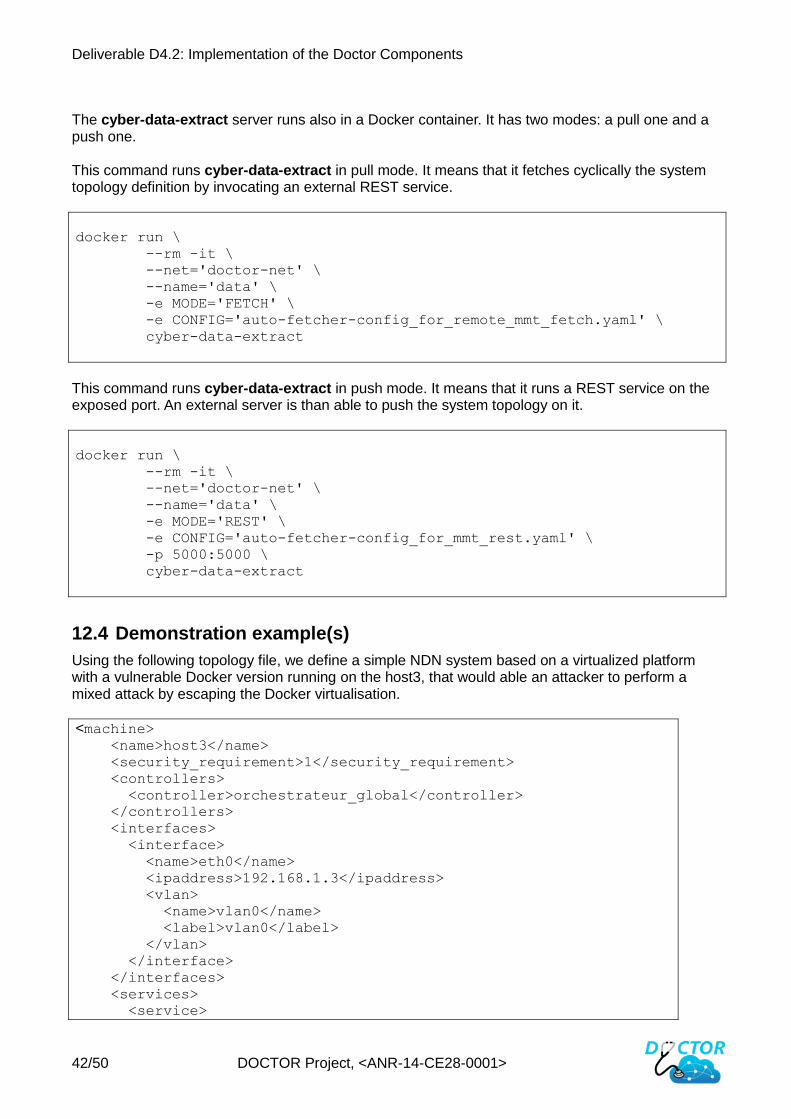
12.4 Demonstration example(s)
Using the following topology file, we define a simple NDN system based on a virtualized platform with a vulnerable Docker version running on the host3, that would able an attacker to perform a mixed attack by escaping the Docker virtualisation.
<machine> <name>host3</name>
<security_requirement>1</security_requirement>
<controllers>
<controller>orchestrateur_global</controller>
</controllers>
<interfaces>
<interface>
<name>eth0</name>
<ipaddress>192.168.1.3</ipaddress>
<vlan>
<name>vlan0</name>
<label>vlan0</label>
</vlan>
</interface>
</interfaces>
<services>
<service>
Deliverable D4.2: Implementation of the Doctor Components
43/50 DOCTOR Project, <ANR-14-CE28-0001>
<name>docker</name>
<ipaddress>192.168.1.3</ipaddress>
<protocol>none</protocol>
<port>0</port>
<global_name>host3_docker</global_name>
<cpe>cpe:/a:docker:docker:1.12.2</cpe>
</service>
</services>
<routes>
<route>
<destination>0.0.0.0</destination>
<mask>0.0.0.0</mask>
<gateway>192.168.1.254</gateway>
<interface>eth0</interface>
</route>
</routes>
</machine> <machine>
<name>ndn2</name>
<security_requirement>0</security_requirement>
<physical_host>
<hostname>host3</hostname>
<hypervisor>docker</hypervisor>
<user>docker</user>
</physical_host>
<controllers>
<controller>orchestrateur_global</controller>
</controllers>
<interfaces />
<faces>
<face>
<name>r1</name>
</face>
<face>
<name>r4</name>
</face>
</faces>
<services>
<service>
<name>NFD</name>
<protocol>ndn</protocol>
<port>0</port>
<vulnerabilities>
</vulnerabilities>
</service>
</services>
<routes />
</machine>
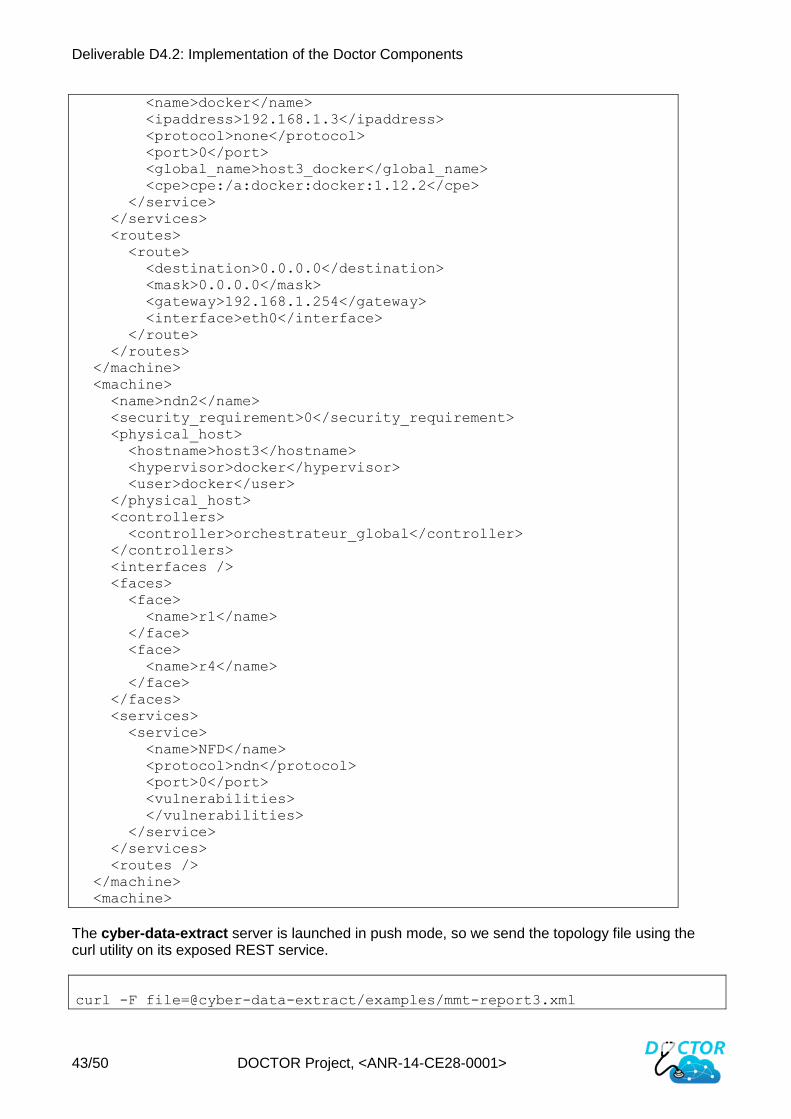
<machine>
The cyber-data-extract server is launched in push mode, so we send the topology file using the curl utility on its exposed REST service.
curl -F file=@cyber-data-extract/examples/mmt-report3.xml
Deliverable D4.2: Implementation of the Doctor Components
44/50 DOCTOR Project, <ANR-14-CE28-0001>
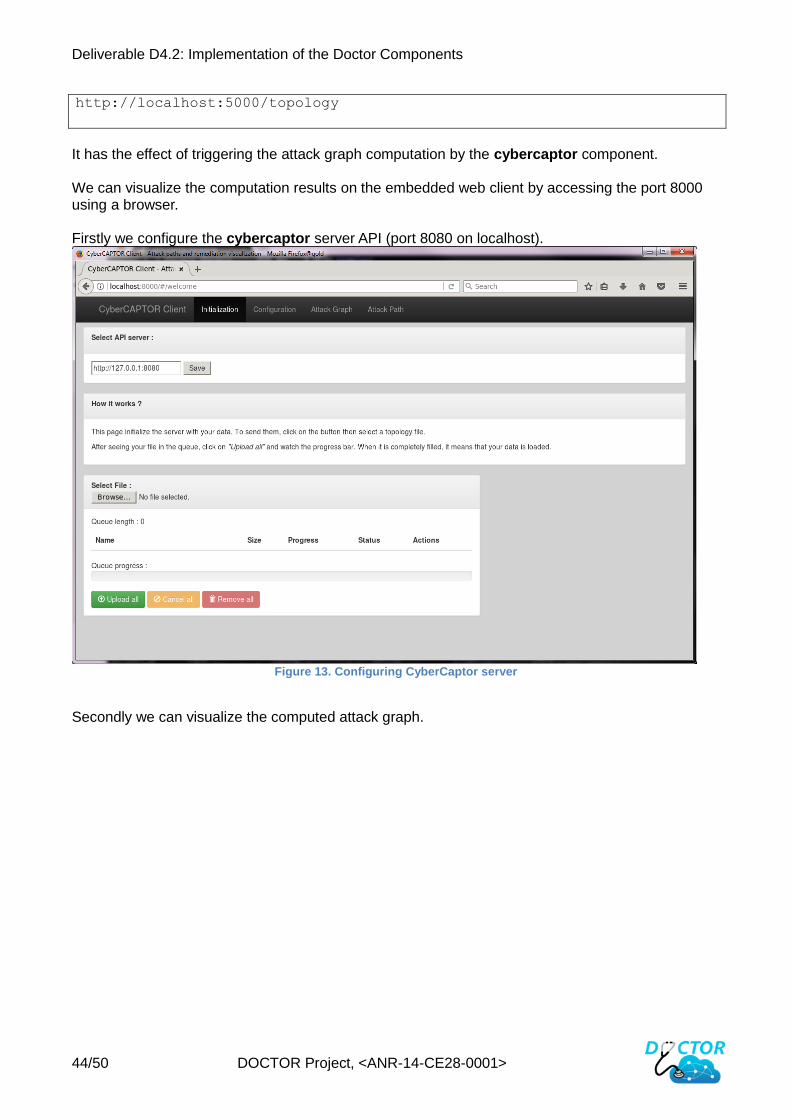
http://localhost:5000/topology
It has the effect of triggering the attack graph computation by the cybercaptor component. We can visualize the computation results on the embedded web client by accessing the port 8000 using a browser. Firstly we configure the cybercaptor server API (port 8080 on localhost).
Figure 13. Configuring CyberCaptor server
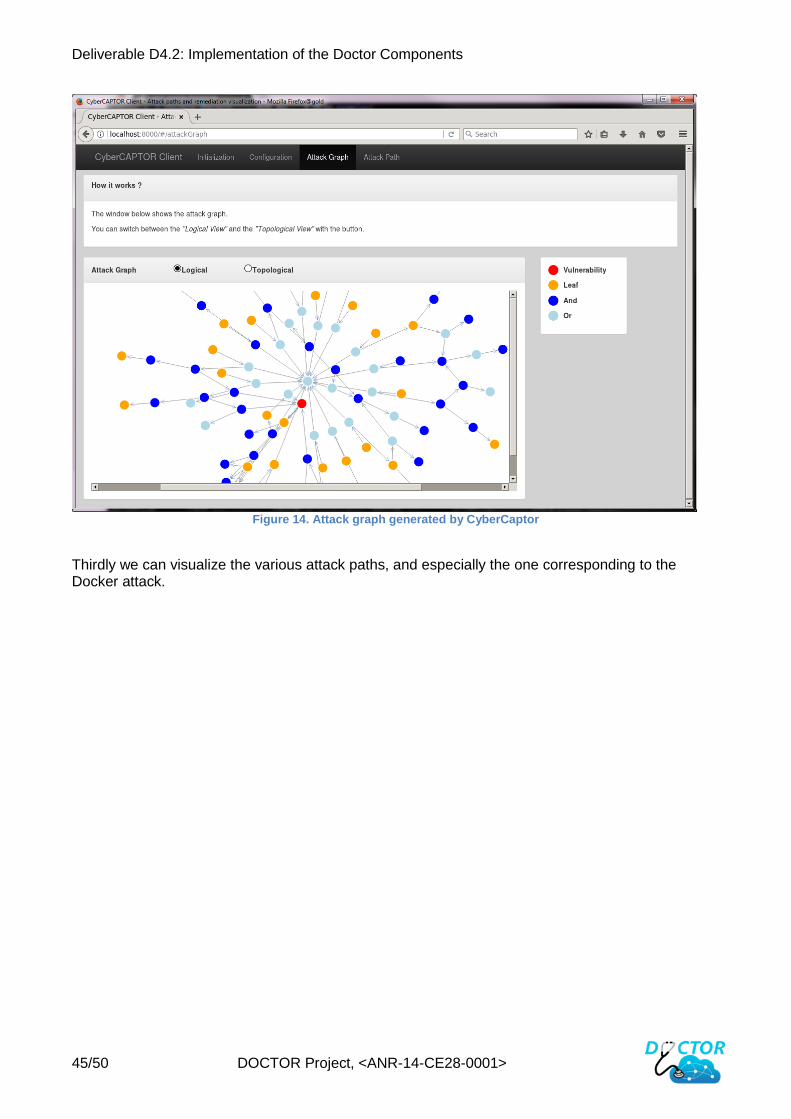
Secondly we can visualize the computed attack graph.
Deliverable D4.2: Implementation of the Doctor Components
45/50 DOCTOR Project, <ANR-14-CE28-0001>
Figure 14. Attack graph generated by CyberCaptor
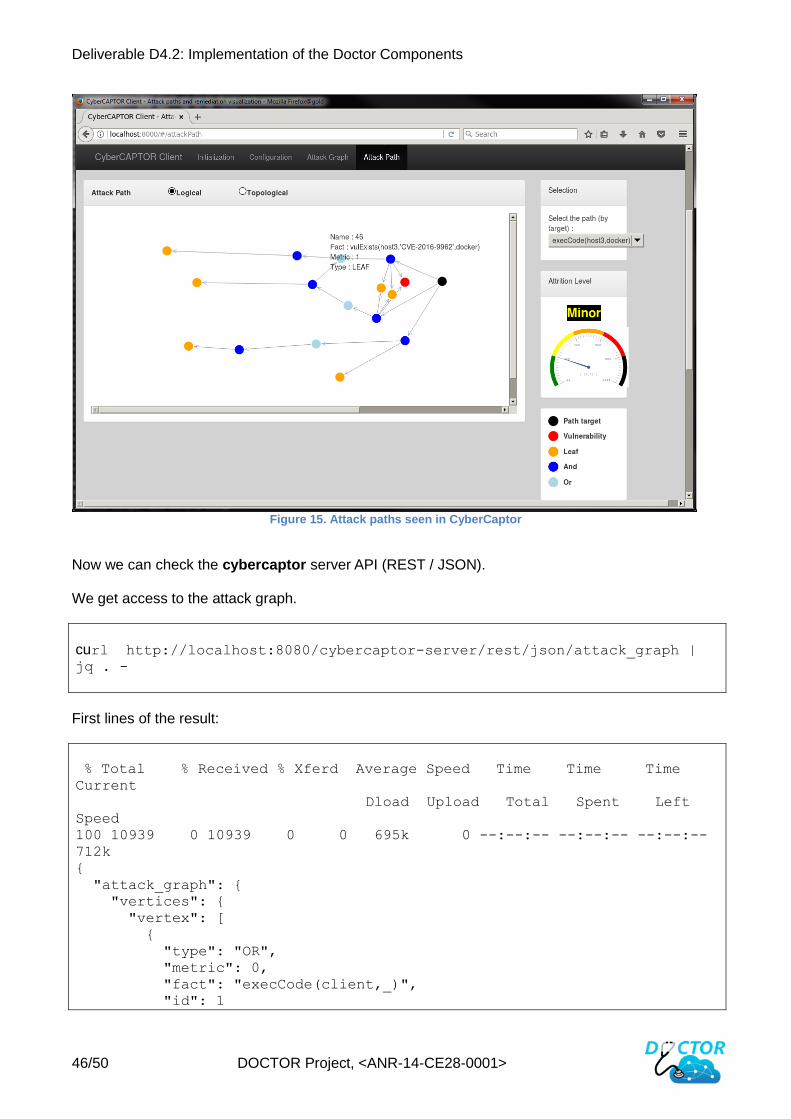
Thirdly we can visualize the various attack paths, and especially the one corresponding to the Docker attack.
Deliverable D4.2: Implementation of the Doctor Components
46/50 DOCTOR Project, <ANR-14-CE28-0001>
Figure 15. Attack paths seen in CyberCaptor
Now we can check the cybercaptor server API (REST / JSON). We get access to the attack graph.
curl http://localhost:8080/cybercaptor-server/rest/json/attack_graph | jq . -
First lines of the result:
% Total % Received % Xferd Average Speed Time Time Time Current Dload Upload Total Spent Left
Speed 100 10939 0 10939 0 0 695k 0 --:--:-- --:--:-- --:--:--
712k { "attack_graph": { "vertices": { "vertex": [ { "type": "OR", "metric": 0, "fact": "execCode(client,_)", "id": 1
Deliverable D4.2: Implementation of the Doctor Components
47/50 DOCTOR Project, <ANR-14-CE28-0001>
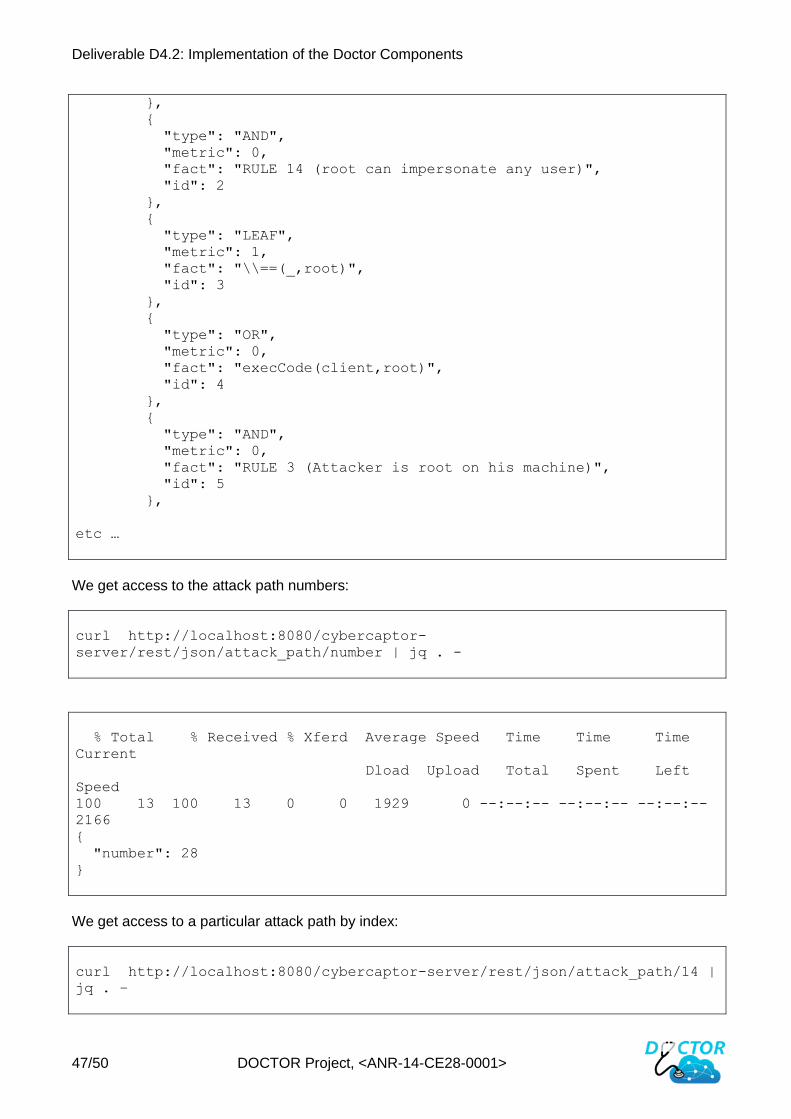
}, { "type": "AND", "metric": 0, "fact": "RULE 14 (root can impersonate any user)", "id": 2 }, { "type": "LEAF", "metric": 1, "fact": "\\==(_,root)", "id": 3 }, { "type": "OR", "metric": 0, "fact": "execCode(client,root)", "id": 4 }, { "type": "AND", "metric": 0, "fact": "RULE 3 (Attacker is root on his machine)", "id": 5 },
etc …
We get access to the attack path numbers:
curl http://localhost:8080/cybercaptor-
server/rest/json/attack_path/number | jq . -
% Total % Received % Xferd Average Speed Time Time Time
Current
Dload Upload Total Spent Left
Speed
100 13 100 13 0 0 1929 0 --:--:-- --:--:-- --:--:--
2166
{
"number": 28
}
We get access to a particular attack path by index:
curl http://localhost:8080/cybercaptor-server/rest/json/attack_path/14 |
jq . –
Deliverable D4.2: Implementation of the Doctor Components
48/50 DOCTOR Project, <ANR-14-CE28-0001>
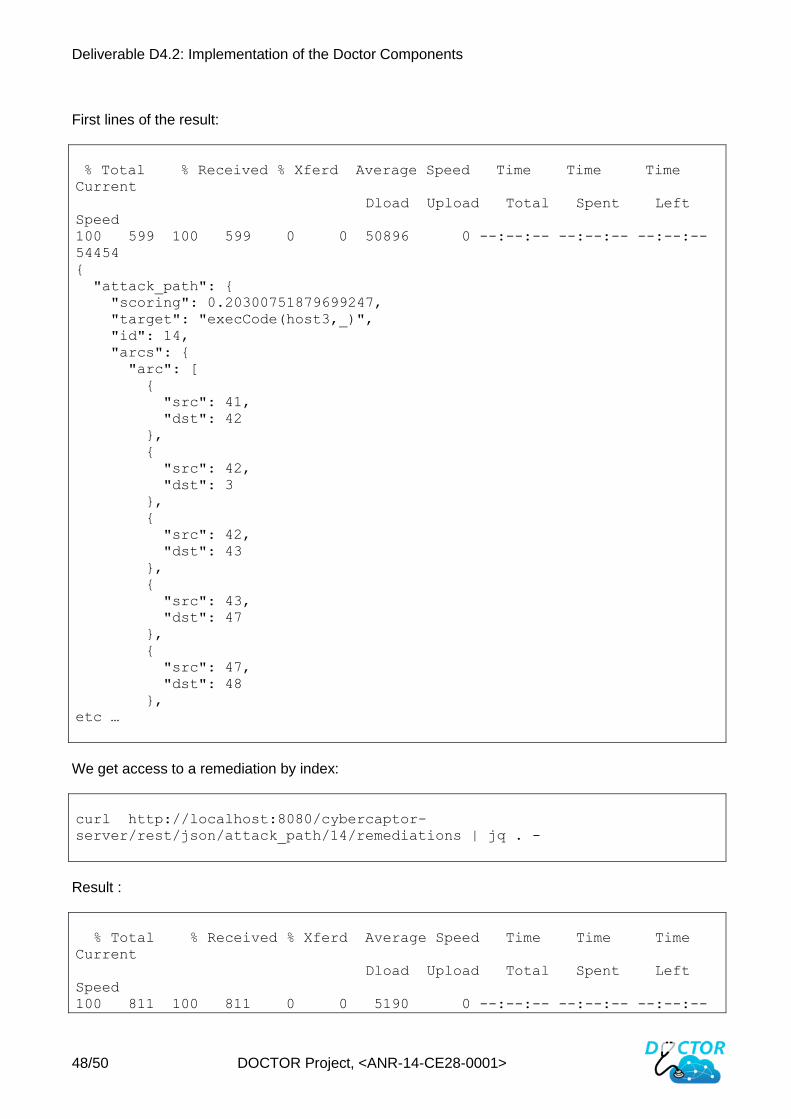
First lines of the result:
% Total % Received % Xferd Average Speed Time Time Time Current
Dload Upload Total Spent Left
Speed
100 599 100 599 0 0 50896 0 --:--:-- --:--:-- --:--:--
54454
{
"attack_path": {
"scoring": 0.20300751879699247,
"target": "execCode(host3,_)",
"id": 14,
"arcs": {
"arc": [
{
"src": 41,
"dst": 42
},
{
"src": 42,
"dst": 3
},
{
"src": 42,
"dst": 43
},
{
"src": 43,
"dst": 47
},
{
"src": 47,
"dst": 48
},
etc …
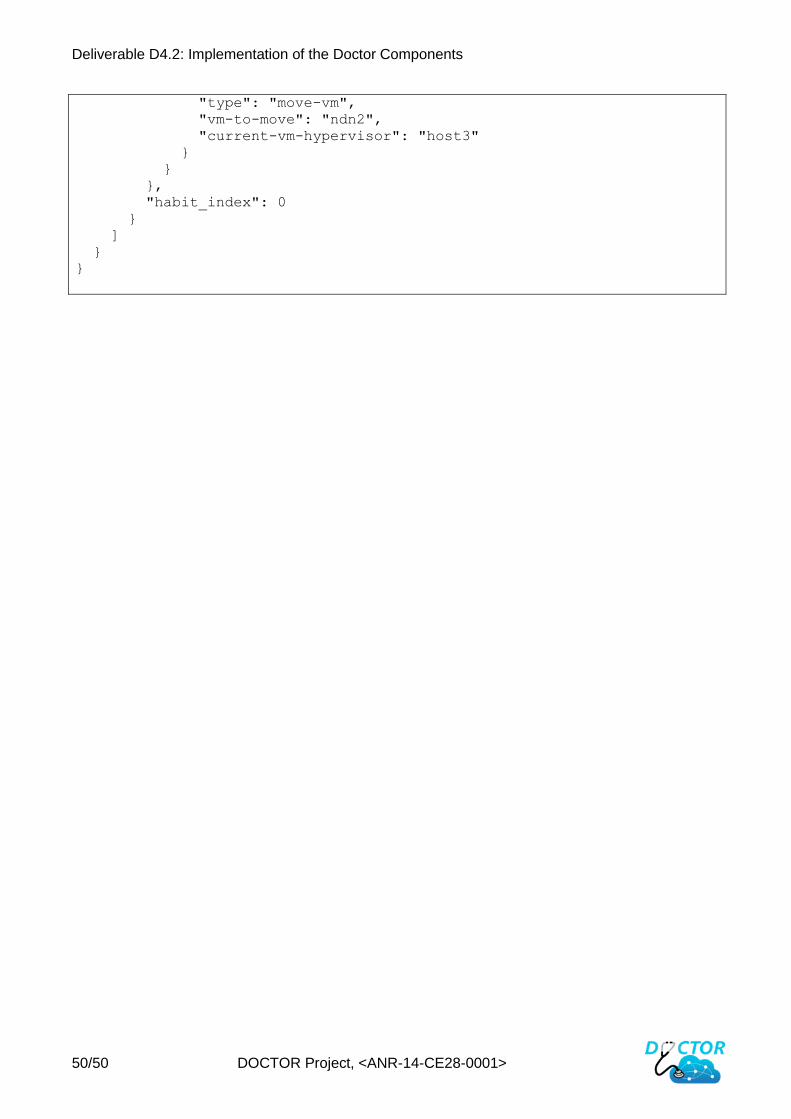
We get access to a remediation by index:
curl http://localhost:8080/cybercaptor-
server/rest/json/attack_path/14/remediations | jq . -
Result :
% Total % Received % Xferd Average Speed Time Time Time
Current
Dload Upload Total Spent Left
Speed
100 811 100 811 0 0 5190 0 --:--:-- --:--:-- --:--:--
Deliverable D4.2: Implementation of the Doctor Components
49/50 DOCTOR Project, <ANR-14-CE28-0001>
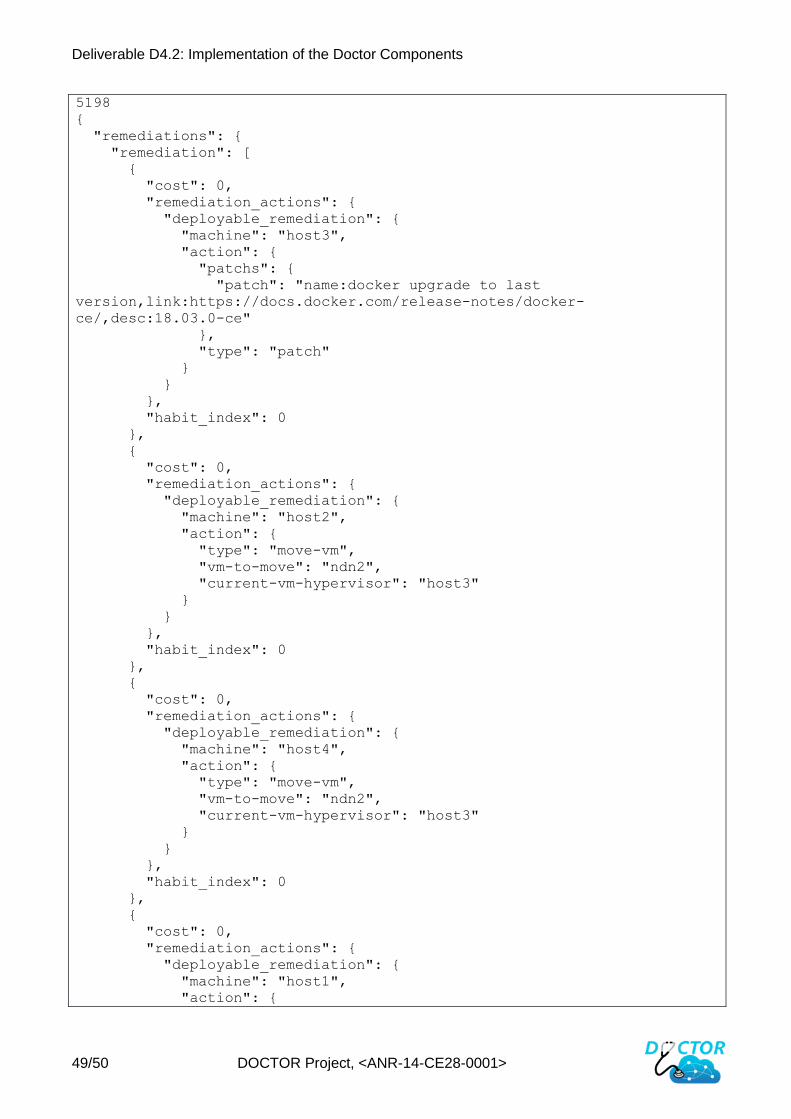
5198
{
"remediations": {
"remediation": [
{
"cost": 0,
"remediation_actions": {
"deployable_remediation": {
"machine": "host3",
"action": {
"patchs": {
"patch": "name:docker upgrade to last
version,link:https://docs.docker.com/release-notes/docker-
ce/,desc:18.03.0-ce"
},
"type": "patch"
}
}
},
"habit_index": 0
},
{
"cost": 0,
"remediation_actions": {
"deployable_remediation": {
"machine": "host2",
"action": {
"type": "move-vm",
"vm-to-move": "ndn2",
"current-vm-hypervisor": "host3"
}
}
},
"habit_index": 0
},
{
"cost": 0,
"remediation_actions": {
"deployable_remediation": {
"machine": "host4",
"action": {
"type": "move-vm",
"vm-to-move": "ndn2",
"current-vm-hypervisor": "host3"
}
}
},
"habit_index": 0
},
{
"cost": 0,
"remediation_actions": {
"deployable_remediation": {
"machine": "host1",
"action": {
Deliverable D4.2: Implementation of the Doctor Components
50/50 DOCTOR Project, <ANR-14-CE28-0001>
"type": "move-vm",
"vm-to-move": "ndn2",
"current-vm-hypervisor": "host3"
}
}
},
"habit_index": 0
}
]
}
}