DELINQUENT BEHAVIOR AMONG YOUNG PEOPLE IN THE …
55
STUDIES ON CRIME AND JUSTICE A SERIES FROM THE DUTCH RESEARCH AND DOCUMENTATION CENTRE DELINQUENT BEHAVIOR AMONG YOUNG PEOPLE IN THE WESTERN WORLD FIRST RESULTS OF THE INTERNATIONAL SELF-REPORT DELINQUENCY STUDY EDITED BY JOSINE JUNGER-TAS, GERT-JAN TERLOUW AND MALCOLM W. KLEIN RDC - MINISTRY OF JUSTICE KUGLER PUBLICATIONS - AMSTERDAM / NEW YORK 13*
Transcript of DELINQUENT BEHAVIOR AMONG YOUNG PEOPLE IN THE …

STUDIES ON CRIMEAND JUSTICEA SERIES FROMTHE DUTCH RESEARCHAND DOCUMENTATIONCENTRE
DELINQUENT BEHAVIORAMONG YOUNG PEOPLEIN THE WESTERN WORLD
FIRST RESULTS OF THEINTERNATIONAL SELF-REPORTDELINQUENCY STUDY
EDITED BY JOSINE JUNGER-TAS,GERT-JAN TERLOUW AND MALCOLM W. KLEIN
RDC - MINISTRY OF JUSTICEKUGLER PUBLICATIONS - AMSTERDAM / NEW YORK
13*

TABLE OF CONTENTS
Preface viiThe international self-report delinquency study: some methodologi-
cal and theoretical issues, Josine Junger-Tas 1Self-reported delinquency in Helsinki, Finland, 1992,
Kauko Aroma 000Self-reported offending among young people in England and Wales,
Benjamin Bowling, John Graham and Alec Ross 000The self-report delinquency study in Belfast, Northern Ireland,
Joan McQuoid 000Self-reported delinquency in the Netherlands, Gert-Jan Terlouw
and Gerben J.N. Bruinsma 000Self-reported delinquency in Liège, Belgium, Michel Born and
Claire Gavray 000Self-reported juvenile delinquency in Mannheim, Germany, Peter
Sutterer and Thomas Karger 000Self-reported juvenile delinquency in Switzerland, Martin Killias,
Patrice Villettaz and Juan Rabasa 000The self-report delinquency study in Portugal, Eliana Gersdo and
Manuel Lisboa 000Self-reported juvenile delinquency in Spain, Rosemary Barberet,
Cristina Rechea-Alberola and Juan Montanés-Rodriguez 000Self-reported delinquency in 3 Italian cities, Uberto Gatti,
G. Fossa, E. Lusetti, M.I. Marugo, G. Russo and G.B. Traverso 000Key-findings of a preliminary self-report delinquency study in
Athens, Greece, Calliope D. Spinellis, Eleni Apospori,Mazia Kranidioti, Yiota Symiyianni and Nina Angelopoulou 000
Self-reported delinquency in a midwestern American city,Ineke Haen Marshall and Vincent J. Webb 000
Self-reported delinquency in Germany after the reunification,Klaus Boers, Michael Class and Peter Kurz 000
Self-reported delinquency at age 18: New Zealand's Dunedin multi-disciplinary health,and development study, Terri E. Moff`itt,Phil A. Silva, Donald R. Lynam and Bill Henry 000
Delinquency in thirteen Western countries: some preliminaryconciusions, Josine Junger-Tas 000
Epilogue, Malcolm W. Klein 000

THE INTERNATIONAL SELF-REPORTDELINQUENCY STUDY: SOMEMETHODOLOGICAL ANDTHEORETICAL ISSUES
J. Junger-Tas
1. Introduction
There has always been some interest in comparative and cross-nationalresearch, but it has clearly inereased in recent years. There are severalreasons for this. One is that international contacts between policy makersas well as between scientists have become increasingly frequent. Anotheris that the need for collaboration in both these fields is ever more urgent.It is of very importance that policy makers gather information on the ex-tent and nature of crime in comparable western countries and investigatehow crime and delinquency relate to specific socioeconomic and culturalcontexts. Delinquent behavior of young people is a problem in the entirewestern world: teenagers commit most of the crimes such as all kinds oftheft, burglary, vandalism and violence. New insights and knowledge mayeventually have an impact on the development of criminal policies in vari-ous countries.This need for policy makers is reflected in the United Nations Crime Pre-vention and Criminal Justice Program and in the Council of Europe's ef-forts in bringing together scientists and policy makers of some 27 Euro-pean countries with the objective of providing information on and improv-ing and evaluating criminal policy.However, a persistent and nagging problem in cross-national research isthe Jack of adequate instruments to enable reliable and valid com-parisons. Major efforts have been made by the United Nations to achievecomparisons between nations on the basis of police and criminal justicestatistics (Vetere and Newman, 1977; Pease and Hukkila, 1990). Inter-preting the resuits presents major problems, however, because nationsdiffer widely in the way they organize their police and court systems, theway they define legal categories and the way they collect and presenttheir statistics. In fact, the Jack of uniform definitions of criminal acts, ofcommon measuring instruments and of a common methodology makescomparisons among countries extremely hazardous. It is in this area thatthe needs of policy makers and the interests of criminologists coincide.
Address for correspondence: Department of Justice, Research and DocumentationCenter, P.O. Box 20301, 2500 EH The Hague, The Netherlands

2
0
0
Criminologists have been interested for a long time in differences in crimebetween countries (Clinard, 1978; Friday, 1973; LePoole, 1977; Levinson,1977; Vetere and Newman, 1977). At the same time, criminologists havebeen trying, not without success, to develop measures of crime to comple-ment the e:dsting official statistics which reflect police activities ratherthan the `true' level of crime. Victim surveys are widely used as a correc-tive and sensitive measure of crime trends, and two large-scale interna-tional comparative victimization studies have yielded extremely interest-ing results (Van Dijk, et al., 1990; Van Dijk and Mayhew, 1992).In addition to victim surveys, another way to measure crime is throughthe use of self-reports. Both methods have their strengths and their limi-tations. Self-reports, however, have certain clear advantages over victimsurveys. They make it possible to measure non-personal and victimlesscrimes as well as characteristics of offenders. Moreover, they can estab-lish the prevalence and incidente of criminal acts committed by offendersand the relationship between types of crimes and types of offenders.The ISRD study has three main objectives:- To achieve comparability of prevalence and frequency of different types
of delinquent behavior in the participating countries.- To contribute to the explanation of (differences in) delinquent behavior,
that is to try to advance theory building by examining whether gener-ally accepted theoretical notions can be applied to all articipating coun-tries, and, if not, what differential factors might account for it.
- To contribute to the solution of a multitude of methodological problemsrelated to cross-national research as well as to self-report methodology.
Two meetings were held at the Dutch Research and DocumentationCenter to coordinate the study. The first one, in the spring of 1990, wasspent in finalizing a common-core measurement instrument. The secondone, in the winter of 1990, discuseed the results of pilot studies and madea number of changes in the survey instrument.In this chapter I will review some of the methodological and theoreticalproblems that the participants were confronted with and the ways inwhich they tried to deal with them.Stating this, it should be made clear that we are modest in our ambitions.For many of the problems and dilemmas there were no perfect solutions.The gap between the ideal design and reality forced some researchers toaccept less than ideal solutions. Despite these caveats, developing thisline of research remains a real challenge to all of us.
2. Some methodological problems: how are they managed?
2.1 Sampling method
One important question concerns the scope of the sample: national sam-ples or city samples. Obviously if the objective is to compare national de-linquency rates, nationally representative samples are needed. However,if we are interested in trying to explain some of the crime differences be-

3
i
tween countries, then we could do with smaller local samples. Of course,we would have liked to do both, hut, although much attention was given tothis matter, the harsh reality of funding limitations dictated the optionsavailable: only four participating study groups - in Switzerland, Portugal,the United Kingdom and The Netherlands - had sufficient funds to allowthem to draw a national random sample; the others opted for city samples- Liège, Belfast, Athene, Dunedin, Helsinki, Omaha, and three cities inItaly (Genoa, Messina and Sienna ), while Spain used a stratified nationalsample of cities. This means that comparisons of national delinquencyrates had to be limited to those countries that drew national random sam-ples, while the study of correlates of crime could be extended to all sam-ples. However, in view of the many socioeconomic and cultural differencesbetween countries that we cannot possibly control, we had to avóid rigidclassifications. Wisdom suggests that the best we could do was comparethe relative rank ordering of the prevalence of specific types of crimes indifferent countries and cities of comparable urbanization level.This is not so much an immediate problem since this book presents a firstoverview of the findings, without comparative analysis. The next volumeplaneed will be devoted to cross-national comparisons. At that point wemust consider whether we can control for individual study differences orwhether we should limit comparisons to those participants who used simi-lar sampling methods.
Apart from sample scope, different sampling methods were used, eachwith its own problems and pitfalls. One of the most frequently used sam-pling methode was to select from some school population. Access was rela-tively easy and questionnaires were administered to groups of students.The shortcomings of this method are well known. Marginal students suchas truants and drop-outs who are likely to be different from the averagestudent on a number of variables including delinquency are excluded fromthe sample. Moreover, in some countries, the age limit for compulsoryeducation is 16 years, which considerably restricts the age range of thesample. To this should be added that, as a consequence of extensive pri-vacy regulations in a number of countries, access to schools is becomingmore and more difficult and in some countries even impossible.Several participants - Italy (three cities), Belgium (Liège), Nebraska(Omaha) and Finland (Helsinki) - had recourse to school samples, al-though their procedures differed. The Belgian researcher made a randomselection of schools, where he approached students of 14 to 18 years of age(the limit of compulsory education is 18 years). The sample of those aged18 to 21 was based on a random selection of population files. In the threeItalian cities the schools were randomiy selected according to type (pre-paratory schools, technical schools, etc.) and, within the schools, the sub-jects were also selected at random. The age range was 14 to 19 years.The Finish school sample was restricted to all 9th graders (15-16 years)and llth graders (17-18 years). However, since compulsory education endsat age 16, those who did not continue their education were excluded.The Omaha school sample included a random selection of public schoolstudente in 12 public high schools, aged 14 to 18. Despite the efforts of

4
0
Ie
these participants to achieve random selection of schools and subjectswithin the schools, there is no exact way of knowing to which extent tru-ancy and/or drop-out may have introduced a bias in the findings of thesestudies, leading to a possible underestimation of delinquency in the targetpopulations.An obvious answer to this problem would be random sampling. However,random sampling does not ensure that one will achieve a representativesample. Some marginalized groups of juveniles, such as school drop-outs,unemployed youths, ethnic minority juveniles and institutionalizedyouths, are usually underrepresented. These youths are generally hard toreach, and even when one succeeds in getting in touch with them they of-ten do not want to participate in such a study. Since one may anticipatethat delinquency levels among these groups are higher than among theaverage respondents, this sampling method may also lead to an underes-timation of the extent of delinquency in the youth population.One solution in such a case is to combine a random sample with a strati-fied sample. This procedure was used by Hindelang and his colleagues inthe Seattle study (1981) in order to estimate delinquency in a generalschool population as well as to maximize variance on delinquency. An-other possibility is to draw a random sample and add specific groups ofyoung people, such as students of vocational training schools, regular visi-tors of special youth clubs (which was done in the Omaha pilot of theISRD project), or ethnic minority children living in specific neighborhoods(which was done in the Dutch and English studies). Still another way toinclude `high risk' juveniles, known to have higher delinquency rates thanthe average youths, is to include institutionalized juveniles. This wasdone in the Los Angeles pilot, where 155 detainees in Central JuvenileHall were interviewed (Junger-Tas et al., 1992).The following solutions were tried by some participants: Spain used astratified sample, based on city size and randomly selected census secti-ons. The sample is not representative for the country as a whole becauserural areas were excluded. Moreover, as the samples were not propor-tional, weighting was needed. But sample size was large (2,100) and, inorder to add a number of high-risk juveniles, an additional 250 young peo-ple in marginalized neighborhoods were interviewed. A comparable proce-dure was followed in The Netherlands, where a stratified country-widerandom sample of 17 cities was drawn. The cities were selected on the ba-sis of urbanization degree and geographical distribution. The sample sizeof 914 includes an oversampling of 68 Turkish and Moroccan youths in thetwo largest Dutch cities. Switzerland, Portugal, the United Kingdom andNorthern Ireland also drew random samples. Moreover, in the Englishstudy, two samples were added: a random sample in high crime areas anda booster sample of ethnic minorities. The only exception is New Zealandwhere the research is part of a longitudinal study. The sample is a birthcohort and includes all young people aged 18 in one particular city(Dunedin).

5
0
2.2 Response
A number of factors may have an impact on the willingness of young peo-ple to participate in a self-report delinquency study. One such factor isprior contacts with the juvenile justice system. Research among juveniles(Junger-Tas et al., 1983) has shown that such contacts have a serious im-pact on response rates: the highest response was among those who re-ported no prior police contacts; the lowest response was among those whohad police contacts as well as prosecutor contacts. Similar results havebeen found for adult males, where response was also related to beingknown by the police (Veendrick, 1976). Unfortunately, there is not muchthat can be done to remedy this situation if one draws a random sample.The best option in this case is to oversample certain high-risk categories,which has indeed been done by a number of participants in the ISRDstudy.Another problem may arise from differences in response rates betweenparticipating countries. The difficulty lies in explaining these differences.Of course, they may be related to shortcomings in the studies themselves.But they may also be related to unknown cultural differences among coun-tries. Some countries may be `oversollicited' by social or marketing re-search, while others are perhaps not yet used to this type of research. Inboth cases the situation can lead to low response rates. It is important,therefore, to collect information about non-response so that we can get abetter idea about its characteristics. Five questions were added in theISRD instrument which tap the state of the home, the maintenance of thebuilding and of the other buildings in the Street, the general appearanceof the neighborhood and the presence of signs of vandalism. These ques-tions, which are completed by the interviewers, were added in order tohave some additional, and somewhat standardized, socioeconomic infor-mation. The information is collected for all potential respondents. As a re-sult, non-response can be analyzed not only with respect to variables suchas age and sex but also with respect to socio-economic status (SES). How-ever, response also depends on the sampling method. In school samples,the response will generally be high, although Finland reports some casesof low response where only a few youngsters showed up in the specialclasses organized for the survey, due to the unusually fine weather for theseason. This resulted in a total response rate of 75%, whereas this was98% in Belgium. In the case of random samples non-response is generallyhigher. As far as the Dutch study is concerned, taking into account non-existent addresses and persons who had moved, the overall response ratewas 61%. Response was clearly higher in the middie-sized (57%) andsmall cities (66%) than in the four large cities - including Amsterdam -(52%). The response rate among ethnic minorities was fairly similar tothat of the Dutch sample, namely 63%. The Dutch study checked the re-presentativeness of the sample on a number of variables, comparing it tothe same-age youth population. With respect to sex, age distribution,school involvement, education and employment status, there were onlyslight differences.An unexpected factor was the exceptionally good summer, which started

6
even before the month of June. Many young people did not keep their -even repeated - appointments and could not be traced. In Spain the re-sponse rate was 64% and among the high-risk youth even higher, at 75%.But in countries such as Portugal (95%) and Northern Ireland (92%), re-sponse was much higher. Where data were reported on non-response, wenoted contradictary findings with respect to SES of respondents and non-respondents. In The Netherlands non-respondents lived in relatively moredeteriorated living environments than respondents (in ferms of upkeep ofthe home and street vandalism). In Spain, however, it was the other wayaround: there the respondents were living in a less attractive environ-ment. As the other participants did not report on this matter, we cannotdraw any definite conclusions at this stage of the study.
2.3 Data collection
There was consensus about the preferred mode of data collection. Consider-ing the kind of data to be collected, the best method would be face-to-faceinterviews. However, this was not one of the options in all studies. Where itwas impossible, as in the case of school samples, according to the Finishresearcher, some of the students had difficulties with the rather complexnature and the length of the questionnaire. In Italy all data were collectedby face-to-face interviews during school hours and in rooms that were madeavailable for this purpose.An important point with respect to both reliability and validity was thepreparation of the interviewers. In the Dutch main study, interviewerswere given a one-day training session organized by one of the researchersand the marketing bureau, and, in addition, received elaborate written in-structions. In the Dutch city sample research, undertaken by the Univer-sity of Twente, a separate test-retest reliability study was conducted on asub-sample of 65 youths.The Dutch pilot study indicated that the presence of a third party disringthe interview - frequently the mother - introduced some bias in the an-swers given: comparison of those who veere alone with the interviewer andthose accompanied by another person indicated a lower admission rate ofdelinquent acts in the second group. On the basis of these results particu-.lar attention was paid to this point during the interviewer training. As aconsequente, in the main study the proportion of third parties presentduring the interview was reduced by almost one-tenth, the proportion ofthose intervering was reduced by half, and the differente in admitted de-linquency between the two groups was considerably less pronounced inthe main study than in the pilot (Terlouw and Junger-Tas, 1992). Ofcourse in this respect a situation such as in the Italian and the Omahastudy, where the interviewer and the respondent are alone in a room, isfar preferable.Except in the case of school samples where the questionnaire was self-ad-ministered, data collection was generally based on face-to-face interviews,sometimes combined with a self-administered section of the questionnai-re. Most of the interviews took place in the home of the interviewees. Un-
7
fortunately, in a number of cases the respondent was not alone in theroom with the interviewer. The Netherlands and Northern Ireland reportthat in 10% to 8% of the cases a third person influenced the interviewees'answers. This was one of the reasons that delinquency questions in thepresent study have been self-administered. For example, in the Englishstudy the socio-demographic questions were asked face-to-face, while thequestions on drugs and on the other offences were asked via self-comple-tion forens in two seperate booklets. In Germany a similar method was fol-lowed.It is very fortunate that the response rates are generally satisfactory andnot too disparate. Although we are not sure as to what eetent the resultsmight be biased by non-response, the fact that in some studies additionalsamples of high-risk juveniles have been drawn while in others the sam-ple is comparable with population data, would suggest that we can havesome confidence in the generalizability of the findings.
2.4 The survey instrument
The instrument that is now used by participants is the result of a long proc-ess of negotiation among representatives of the different countries. It wasno easy task to achieve consensus on the delinquency items that were to beincluded in the core list, that is those items on which we wanted to havecomparative data. Some compromises had to be made, essentially betweenU.S. participants and the European ones, because of the fact that a numberof acts which are offenses in the U.S are not so in Europe (alcohol use andpurchase) or are not prosecuted (cannabis use).
Globally the questions covered five groups of variables: prevalence andfrequency of delinquent behavior; circumstances of the act; social reac-tions to delinquency; social background variables; and some theoreticalvariables.Prevalence and frequency are measured in different ways. All delinquencyquestions are introduced by `did you ever....' (lifetime prevalence), followedby `did you do it last year?' (current prevalence). The nest question is then`how many times did you do it' (frequency)*.Circumstances of the act are measured by questions such as: did respon-dent act alone or with others, who was the victim, where did it happen.Social reactions implied discovery of the act and reactions to it by parents,others or the police.Social and demographic variables include sex, age, family composition,ethnicity, SES, education, school attendance or employment, leisure acti-vities.A limited number of theoretical variables, related to social control theory,include relations with parents, parental supervision, school involvementand performance, attitudes towards school and/or work and leisure activi-
*See for list of offenses Questionnaire p. n

8
ties.Of course we are talking here of the common-core instrument. Partici-pants could, and did, add variables that were important in their own localsituation. In this book, however, only the findings that relate to the voreinstrument will be reported.There was much discussion about the level of detail that would still allowsufficient and reliable information. Several participants performed relia-bility tests, repeating earlier questions at the end of the interview(Junger-Tas et al., 1992). In this pilot study internal consistency of the an-swers to six questions ranged from about 90% for five of them to 75% forshoplifting, a high frequency offense. The Spanah study similarly re-peated a number of questions at the end of the questionnaire and com-pared the answers with the earlier answers given. They found high levelsof reliability.A more serious problem was the instrument's validity. For comparativepurposes we agreed on a common-core operationalization of delinquency,including acts that are considered offenses if committed by an adult, in allparticipating countries. Status offenses are defined as `problem' or deviantbehavior but are not part of the delinquency definition as used in interna-tional comparisons. Moreover, we used a set of filtering questions, such as`have you ever...' before going into details about the exact meaning and cir-cumstances of the act. In order to optimize response validity, a number ofstudies used a mixed approach. The first and second part of the question-naire, including all sociodemographic questions, was administered in face-to-face interviews. The third part of the questionnaire, that is, the selec-tion of follow-up questions that refer to the admitted acts, was subse-quently given to the respondent by the interviewer to complete.Great care was also taken to have high item-specificity: for example, whatexactly is meant by `threatening other people'? Did the boy steal the car ordid he merely use it for joy-riding? Further, the reference period for thedetailed questions was one year only, sine longer periods increase therisk of memory bias.
2.5 Concurrent validity
Another nagging methodological problem is how to achieve some measureof concurrent validity. What other sources on delinquent behavior are avail-able to control our data? In many studies police reports are used to controlwhether the offenses figuring in the police reports were mentioned by therespondents. Such studies have been done both for adults (Veendrick, 1976)and for juveniles (Hindelang et al., 1981; Junger-Tas et al., 1983; Junger,1990). The self-report method did not seem adequate in the case of adults:there was considerable underreporting of burglary, assaults and hit-and-run offenses. As for juveniles the results suggest moderate to high validity.However, there are indications that juveniles are far more inclined to talkwith relative openness about their delinquent behavior than they are abouttheir contacts with the juvenile justice system or the police. Unfortunatelymost participants in the ISRD study do not have the names and addresses

9
needed for this type of control, while others - on the basis of legal regula-tions - are not allowed to check validity this way.One way to approach this problem is to check the data with data fromother similar, or at least comparable, studies. This was tried by the Bel-gian and Spanish researchers, but they were not able to achieve the com-parison. The questionnaires used were too dissimilar in several respects:the reference period for committing delinquent acts, the euphemisticwording in the definition of the acts (pinching or borrowing instead ofstealing) which almost certainly undermined validity, and differences inthe delinquency items. Moreover, the geographical areas covered and thesample ages were different.Partial validity controls were introduced in the Dutch study by comparingdelinquency data with results from two comparable studies: first, the bi-annual self-report study of a national random youth sample of 12- to 18-year-old minors, and second, a longitudinal self-report study of a 12- to 25-year-old sample. In the national youth study many questionnaire itemsare comparable to those of the ISRD study, while in the second study theISRD questionnaire was used. Both data sets are also used to test exter-nal validity. The comparison showed considerable similarity in the re-sults. A similar approach was used in the Omaha study, where the datawere compared with two large self-report studies in the U.S - the Seattlestudy (Hindelang et al., 1981) and the National Youth Survey (Elliott etal., 1983). Considering the fact that the Omaha sample is a school-basedone, there was a surprising similarity in the relative rank-ordering of theoffenses.The Finnish study used different techniques to check validity, such as acomparison with a qualitative study on self-reported criminal behavioramong a similar school population and a parallel study in another Finnishcity. An interesting partial validation resulted from the consultation ofthe so-called `penalty books' of the sampled schools, wherein disturbancesand (school) problem behaviors are recorded. Although no individual ratescan be compared, this would allow for comparison of troublesome behaviorwith delinquent behavior at the classroom level.There is one validity problem left that is hard to solve: the validity of theself-report method administered to ethnic minorities. One earlier Dutchstudy found large variations in validity among three different ethnicgroups (Junger, 1990). One way to check validity is to compare the self-re-port data with police data. This was done in Junger's study.Three ISRD participants (Switzerland, England and Wales, and TheNetherlands) found that ethnic minorities reported fewer delinquent actsthan their national counterparts. Unfortunately, there were no additional(police) data to operate a validity check so that the discrepancy betweenself-report data and official data on ethnic minorities remains essentiallyunexplained. If we also take into account the differential response validitybetween blacks and whites in American self-report studies (Hindelang etal., 1981; Elliott and Ageton, 1980), we might venture the following tenta-tive statements about this problem. The bulk of the research in this fieldtends to suggest that where specific ethnic groups are well-integrated inmainstream society - speaking the language and participating in the

10
country's economic and social life - response validity of these groups willnot differ to any great extent from that of the national youth population.Where new immigrant groups participate in self-report studies, validitymay be low, if only for cultural reasons. In the case of long-standing, verydeprived minority groups, validity will at least be questionable. In prac-tice this would mean that any research on ethnic minorities using self-re-port would require careful study of the social, economic and cultural posi-tion of the groups in question before conclusions can be drawn on responsevalidity. Of course it would be better still to check response validity withanother source of delinquent or problem behavior.
3. Some further methodological issues
Once the data collection of the individual studies was completed, there ap-peared to be several requirements for a useful analysis, recalling that thefocus of the analysis is the country/city rather than the individual respon-dent. A first requirement was to reach agreement on at least the followingdependent variables:- the prevalence and frequency of delinquency either at the national level
or at the city level (depending on the sample available);- the nature of delinquency, for example the distribution of specific
offenses or the proportion of property-related and violent offenders;- the seriousness of delinquency measured, for example, by frequency
and/or by the nature of the delinquent acts;- the prevalence and frequency of `problem' behavior (status offenses);- the nature of problem behavior, such as differences in the amount of
truancy and alcohol and drug use.Second, in order to allow for simple comparisons in this first volume, andwith an eye to later, more complex, comparative analyses in the next one,certain decisions had to be taken with respect to the independent vari-ables, some of which had to be constructed on the basis of the existingdata set.The main independent variables were the following:socioeconomic uariables:(un)employment father(un)employment mothereducation levelsource of income(part-time) employmentunemployment respondentschool drop-outdegree of urbanizationdemographic variables - composition of the population:ethnicity/raceage

11
sexsingle-parent familypresence of stepparentcultural variables with respect to adolescents and young adults:alcohol usedrug usepeer group involvementother variables related to criminological theory:school performanceschool commitmentwork commitmentbond with parentssupervision by parentsbond with friendsorganized leisure/sports participationSome variables, such as education status, SES and ethnicity, present seri-ous problems because of different definitions among countries.With respect to educational status, long discussions and several trials tocombine classifications based on the many different school systems re-sulted in the following definition: education status is defined as the levelof education achieved, measured in completed school years. For those stillin school this is the current level; for Chose who have lelt school this is thehighest level achieved, whether completed with a diploma/certificate ornot. Three categories were distinguished:- high: university or comparable higher education; gymnasium/lycée or
preparatory school leading to university;- medium: professional, vocational or training schools leading to me-
dium-skill jobs;- low: vocational training, apprenticeships, no training after leaving el-
ementary school, leading to low-skili jobs;The assumption is that this classification is somewhat independent ofage, since a youngster in a medium-level school will probably get a me-dium-level job. Thus, although he ages, his educational status will remainthe same.SES presents similar definitional problems. The final proposal was tocombine father's professional status and the interviewer's estimate of thestatus of the home*. Father's professional status is classified as:- lower class (unskilled job; unemployed)- lower middle class (skilled job)- middle class (employees; employers of middle-sized businesses)- higher middle class (professions; jobs requiring higher education)- upper class (employers in big enterprises)Home status is evaluated by the interviewer at the end of the interview onthe basis of home appearance, street appearance, evidence of vandalismand/or whether neighborhood is run down.
*This would be impossible in the case of school samples.

12
0
0
Finally, ethnicity is essentially based on the place of birth of the fatherand/or on races.All this is fairly straightforward, and it helped to standardize to a certainextent the analysis of the individual studies. The results give us infor-mation on either entire countries or on cities. This allowed us to place onecountry/city next to another and to examine the question of whetherrelationships that are established in one of them are also valid in others.In order to make these comparisons worthwhile, we recommended that re-searchers conduct the analyses of the individual studies along similarlines, offering a common format for presentation of the results. This wasindeed achieved and makes reading the different chapters much easierand more interesting.In conclusion, however, a word of caution is required. In designing theISRD study we tried to keep sources of variatioá between countries withincertain limits. For example, we decided to restrict the study to countriesin the western world so that there would not, be too many differences inthe economic, social and cultural situation of the participating countriesand to ensure a more or less similar understanding and interpretation ofmost of the delinquency items. Also, all participants in the ISRD studyused the common measurement instrument. (The Dunedin and E/W-Ger-man studies being partial exceptions).However, as will already be evident, despite these similarities, there areconsiderable differences between studies in sampling method, samplescope and data collection. To just exactly what extent and in what waysthese differences will influence the studies' results, we do not know. Butof course they will have an impact on the closer comparisons to be con-ducted later on.These future much more complex comparative analyses will be devoted totrying to explain variations in delinquency prevalence and frequency aswell as variations in the nature of delinquency across participating coun-tries. In addition we will examine the differential distribution of indepen-dent variables over the various indívidual country/city samples. To the ex-tent that these variables are related to delinquency, their differential dis-tribution over the various samples might offer some explanation for varia-tions in delinquency.It is clear, however, that for the purpose of these comparisons, decisionsmust be made on questions such as which countries or cities may be com-pared among themselves, what elements we might control for and whatdifferences we would be willing to pass over for the sake of comparison. Itwill be of paramount importance to report carefully the steps that will betaken in this exercise, so that the scientific community can judge whathas been done so far and support attempts to improve the methodology ofinternational comparative research.

13
References
Clinard, M.B. (1978), Cities with Little Crime: The Case of Switzerland. Boston,Maas., Cambridge University Presa.
Elliot, D.S. and R. Huizinga (1983), Social class and delinquent behavior in a na-tional youth panel: 1976-1980. Criminology, 21: 2.
Elliot, D.S. and S.S. Ageton (1980), Reconciling race and class differences in self-re-ported and official estimates of delinquency. American sociological review 45: 1.
Friday, P.C. (1973), Problems in comparative criminology: comments on the feasi-bility and implications of research. International Journal of Criminology and Pe-nology, 1:2.
Hindelang, M.J. (1981), Variations in sex-race-age specific incidence rates of of-fending. American Sociological Review, 46.
Hindelang, M.J., T. Hirschi and J.G. Weis (1981), Measuring Delinquency. BeverlyHills, Calif., Sage Publication.
Junger, M. (1990), Delinquency and Ethnicity: An Inuestigation on Social Factorsrelating to Delinquency among Moroccan, Turkish, Surinamese and Dutch Boys.Boston, Mass. and Deventer, The Netherlands, Kluwer Law and Taxation Publi-cations.
Junger-Tas, J. et al. (1983), Jeugddelinquentie: Achtergronden en Justitiële Reactie.`s Gravenhage, Staatsuitgeverij.
Junger-Tas, J. and G.J. Terlouw (1991), Het Nederlandse Publiek en het Criminali-teitsprobleem (IxII). Delikt en Delinkwent, March and April Issues.
Junger-Tas, J., M.W. Klein and X. Zhang (1992), Problems and dilemmas in com-parative self-report delinquency research. British Journal of Criminology, forth-coming.
Klein, M.W., ed. (1989), Cross-national Research in Self-reported Crime and Delin-quency. Deventer, The Netherlands, Kluwer Academic Publications.
Levinson, D. (1977), What have we learned from cross-cultural surveys? AmericanBehavioral Scientist, 20:5.
LePoole, F. (1977), Law and practice concerning the counterparts of `persons inneed of supervision' in some European countries with a particular emphasis onthe Netherlands. In: Lee E. Teitelbaum, ed., Beyond Control, Status Offenders inthe Juuenile Court. Cambridge, Mass., Ballinger Publication Company.
Pease, K and K Hukkila (1990), Criminal Justice Systems in Europe and NorthAmerica. Helsinki, Finland, Helsinki Institute for Crime Prevention and Control.(affiliated with the United Nations).
Terlouw, G.J. and J. Junger-Tas (1992), The International Juvenile Self-report De-linquency Study: Design and first results of the Dutch study. Paper presented atthe 441h Annual meeting of the American Society of Criminology. New Orleans,U.S.A.
Van Dijk, J.J.M., P. Mayhew and M. Killias (1990), Experiences of Crime Across theWorld. Boston, Mass., and Deventer, The Netherlands, Kluwer Law and Taxa-tion Publications.
Van Dijk, J.J.M. and P. Mayhew (1992), Criminal victimization in the industrializedworld: key findings of the 1989 and 1992 International Crime Surveys. TheHague, The Netherlands, Directorate for Crime Prevention, Ministry of Justice.
Veendrick, L. (1976), Verborgen en Geregistreerde Criminaliteit in Groningen.Groningen, The Netherlands, Rijksuniversiteit Groningen, Criminologisch Insti-tuut.
Vetere, E. and Gr. Newman (1977), International crime statistica: Au overview froma comparative perspective. Abstracts on Criminology and Penology, 17:3.

SELF-REPORTED DELINQUENCY INTHE NETHERLANDS
Gert-Jan Terlouw' and Gerben J.N. Bruinsma2Ministry of Justicel, University of Twente2
1. Introduction
This chapter reports on the results of the Dutch survey for the internationalproject on self-reported juvenile delinquency. First, we will briefly sketchThe Netherlands in sociodemographic and socioeconomic terms. Then, theprocedures used in sampling and the sample are discussed. After a descrip-tion of the delinquency levels found in the sample, the relationship betweensocioeconomie and some other background characteristics of respondentsand their offending behavior are analyzed. In conclusion we eiamine towhat extent these characteristics can explain involvement in delinquency.
2. Sociodemographic and socioeconomie characteristies
The Netherlands is a relatively small country, occupying 41,526 squarekilometers, including 498 square kilometers are occupied by LakeIJsselmeer and the North Sea. As of January 1, 1992, the population num-bered 15,129,150 inhabitants, of which 4.8% were non-Dutch. The centraland western part of the country are the most densely populated. A quarterof the inhabitants (24.9%) is in the age range 0-19, 33% in the range from20-39 and the remainder is over 40 years of age (Netherlands Central Bu-reau of Statistics (CBS), 1993, p.35).
Among the 4.8% non-Dutch inhabitante the main groups are Turks(1.4%), Moroccans (1.1%; CBS, 1992b, May, p.35). Persons of Surinameseorigin account for 1.5% of the' population (Tas, 1992b). Many Surinamese(91.6%) have a Dutch passport as until 1975 Surinam was a Dutch colony.In comparison, 8% of;-the Turkiah residents and 12% of the Moroccanshave Dutch passports (Tas, 1992a, 1992b; Harmsen, 1992).
In big cities like Amsterdam and Rotterdam, the percentage of theseethnic groups is considerably higher. In the age group 14-21 (used in thisstudy), the combined percentage of Turks and Moroccans in Amsterdam isestimated at 15.5%, and in Rotterdam at 14% (CBS, 1992, November,p.32, 36, 45). In the next few years the percentage of ethnic minorities inthese age groups is expected to increase.
In the school year 1991/1992, there were 3,074,000 pupils/studente infull-time education in The Netherlands (provisional figures, CBS, 1993,
Address for correspondence: G.J. Terlouw, Ministry of Justice, RDC, PO. Box 20301, 2500 EHThe Hague, The Netherlands.

103
p.446). Close to half of this group (45.8%) was in basic education, 3.6% inspecial education and 21.9% in secondary general education. Further-more, 7.2% and 9.2% were in junior and senior vocational training respec-tively, while 6.6% were in vocational college and 5.7% in university.
In 1991, the labor force' in The Netherlands consisted of approximately7,133,000 persons, aged 15-64, of which 60.3% were male and 39.7% werefemale (CBS, 1993, p.102). The registered unemployment rate for 1991was 4.5% (16-64 year group), and 5.1% in the 16-24 year group (CBS,1992a, p.18).
Unemployment among Turks, Moroccans and Surinamese, althoughslowly decreasing since 1988, is considerably higher (16-64 year group, re-spectively, 28%, 22% and 19%; Muus, 1992, pp. 30, 84).
3. Drug and alcohol policy
According to self-report data, in 1990, 3.8% of juveniles in the altes of 12-17years had used soft drugs (cannabis). In big cities the percentage washigher (6.2%; Junger-Tas et al., 1992). Though possession and trading softdrugs is illegal, possessing under 30 grams of cannabis products is classi-fied as a misdemeanor and not as a criminal offense.
As for hard drugs (opiates and cocaine), from 1973 on the number ofproblematic (addicted) drug users has grown to an estimated 20,000-25,000, of which 40% in Amsterdam. Official figures indicate that over thesame period, property crime grew proportionally. Property crime appearsto be correlated with drug use: since 1973 the increase in property crimein Amsterdam has been two to three times higher than in cities which didnot share the increase in problematic opiate users (Grapendaal et al.,1991).
Dutch drug policy is midway between prohibition and legalization ofdrugs. Pragmatism (coat-benefit analysis) and harm reduction are itsmain features (Van Capelle, 1988). Important aspects of Dutch drug policyare the distinction which iq,made between `soft' and `hard' drugs (hard be-ing those substances posing unacceptable risks), and that between drugusers and drug traffickers, dealers, etc. Drug use is considered a healthproblem, and (thus) the Department of Health and Welfare is the first re-aponsible for drug policy. The Ministry of Justice is concerned withcombatting drug transport and crime.
Recent self-report surveys (1986, 1988 and 1990) show that in the agegroup of 12-17 about half of the juveniles use alcohol. Young people whouse alcohol regularly are more often involved in offending behavior thanthe others (56% versus 26%; Junger-Tas et al., 1992). The alcohol controlpolicy pursued by the Dutch government aims at preventing the healthand social risks associated with alcohol use. However, alcohol advertising
*The labor force, according to the definition used by the CBS, (in brief) consists of personswho perform some work for wages or salary, persons not receiving wages or salaries, who areself-employed or work for profit or family gain, and persons without work receiving unem-ployment benefits.
104
•
has not been banned from radio and television. Instead, since September1990, the alcohol industry has been practising some self-restriction in thismatter (Engelsman, 1990).
4. Sampling method and procedure
Two ISRD surveys were available for The Netherlands. One was conductedby the Research and Documentation Center (RDC) of the Ministry of Jus-tice and the second by the University of Twente (UT). Both surveys used thestandard ISRD questionnaire (see Questionnaire p. M). For the present re-port, the surveys were combined, resulting in a sample size of 914 respond-ents.
The RDC sample contains 866 respondents, including 68 oversampledTurkish and Moroccan juveniles from Amsterdam and Rotterdam. Juve-niles in the age group 14-21 were randomly sampled from the populationregisters of 15 cities spread over The Netherlands. The later addition ofthe UT sample was accounted for in the selection of these 15 cities. Thenumber of respondents to be sampled from every city was weighted ac-cording to city size.
Before the fieldwork (Spring, 1992) the 108 interviewers received half aday of instruction on interviewing procedures and on the questionnaire.Turkish and Moroccan interviewers were available for interviews withyouths from those ethnic groups.
The sociodemographic part of the questionnaire was administered inface-to-face interviews. The delinquency items were completed personallyby the respondent while the interviewer was present.
The UT sample has 620 respondents from two cities in the eastern partof the country. The survey was conducted by students as part of their uni-versity study program. Apart from the fact that male interviewers inter-viewed only male respondents and female interviewers female respond-ents, the survey method did not differ from the one used for the RDC sur-vey.
As mentioned above, fop'this report the RDC and the UT samples werecombined. First we took.the 'coke' RDC sample (without the oversample)of 798 respondents. Then we calculated that, weighted according to citysizes, we needed 79 cáses from the UT sample. These were randomlydrawn from the 620 UT respondents. Mter combining the two samples,the percentage of Turks and Moroccans in Rotterdam and Amsterdam inthe sample was weighted to match the population percentages in thesecities. These ethnic juveniles were randomly drawn from the oversampleand added to the main sample.
5. Response and non-response
The response success rate for the RDC survey was 56%. Non-response wasmostly a result of the respondent not being at home when the interviewertried to get in touch (each address had to be tried three times). `Not in the

105
mood' was the most frequently heard argument for non-cooperation.For the UT sample of 79 respondents, the response rate was, at 72.5%,
considerably higher that for the RDC sample. The overall non-responserate for the combined RDC-UT sample of 914 respondents was 43%.
On average, an interview took 29 minutes (the range being 10 to 80minutes). Almost all interviews took place at the home of the respondent(96.1%). The remainder were conducted at the home of a friend of the re-spondent. Leas than 1% took place in some public place, for example, acafe or bar. In half of the interviews (55.3%) the interviewer was alonewith the respondent. In 10.6% of the cases where other persons werepresent, the interviewers feit that those persons influenced the responsesto the questions.
Many more interviewers considered the living circumstances `good' forthe response group than for the non-response group. The level of mainte-nance of the house/apartment and neighborhood is significantly higher forthe group of respondents than for the non-response group'. Moreover, for21.3% of the non-response addresses, the interviewers reported vandalismand/or graffiti in the vicinity of the home. For the response group this per-centage was 16.3%. Therefore, it would seem that middle-class youths areoverrepresented among the respondents.
6. Sample description and representativeness
The sample of 914 respondents consists of 51.4% girls and 48.6% boys, aged14-21 years. For the population the, gender distribution in this age group is51% males and 49% females (CBS, 1992b, May, p.31).
The group contains 80.6% Dutch respondents, 5.6% Surinamese, 3.5%Moroccan and 5.1% Turkish respondents. The remaining 5.1% containsother ethnicities (e.g., Ghanese).
The age distribution in the sample does not really differ from that inthe population. The main difference is found at age 21, which is somewhatunderrepresented in thé;.ISRD sample. Considered per ethnic group, theDutch, Surinamese and ^'othér; ethnicity' respondents are distributed fairlyevenly over the ages. Moroccans appear slightly overrepresented at age14-17 and underrepresented in the age group 19-21, while the Turks are(rather randomly it seems) underrepresented at the ages 18, 19 and 21.
Most of the respondents are still attending school (53.3%). About oneout of three (30.2%) is combining school and work, while 11.5% has a job.The unemployment percentage is 5%. Of those unemployed, over half hashad a job previously (56.5%). In the Dutch population the unemploymentpercentage for young people in the ages 16-24 was 5.1% in 1991 (CBS,1992b, February, p.18). In the selection of ISRD respondents aged 16-21,the unemployment rate is 6.5%, slightly higher than the population fig-ure. CBS statietics show that the unemployment percentage declines with
*House/apartment: one sammleX2=197.6, p<.000Neighborhood: one sample X =108.0, p<.000

106
age, which might explain the difference between the ISRD and the popula-tion percentage (the ISRD subsample used for the comparison does notcover juveniles aged 22-24.)
Comparing the percentual distribution of ISRD respondents over edu-cational types (subsample of 763 respondents in education) to the popula-tion distribution (schoolyear 1989-1990; CBS, 1992, pp. 428-443), we findthat respondents in medium-level secondary general education areoverrepresented in the ISRD sample, and university students areunderrepresented. This may be accounted for by the difference in agegroups: the ISRD sample is aged 14-21, while the population figuren coverthe age group 12-25. The underrepresentation of those aged 21 in the sam-ple may also contribute to this.
Of the 151 respondents who left school (16.5%), just over half completedtheir last education successfully (54.5%). In this last group 34.6% has ajunior vocational training diploma (highest achieved), while 32.1% fin-ished senior vocational training with a diploma. Diplomas in medium-and high-level secondary general education were each achieved by ap-proximately 16% of this group; 1.3% got a vocational college diploma (i.e.,higher professional training such as nursing or social work).
The rest of the group that is no longer in school dropped out. In thislast selection, 44.6% of the respondents has only basic education, and15.4% has a general secondary education, while 29.2% has a diploma in alower vocational school. The group that succesfully completed and thegroup that did not complete their last education differ significantly in un-employment percentage (respectively, 16.9% and 43.1% unemployed,x2=11.78, p <.001).
Most respondents (63.9%) live at home with both parents. The percent-age of respondents from a broken family is 14.8%, while 9.3% live on theirown. About one in twenty respondents cohabitates with her/his boy-/girl-friend (5.1%) and 1.5% is married. This last percentage is just under thepopulation percentage of married persons in the ages of 14-21, which is2.1%.
Almost half of the respondents (47.7%) come from urbanized areas, thatis, from cities of over 200,000'- inhabitants. A quarter of the subjecte(25.5%) comes from smaller municipalities (100,000-200,000 inhabitants),and the remaining subjects (26.8%, 245 respondents) are from rural areasand towns of leas than 100,000. This distribution is a result of samplingcriteria. The Surinámese respondents are almost exclusively from200,000+ cities. Moroccan and Turkish respondents are mostly from heav-ily urbanized areas as well (71%).
7. Delinquency and problem behavior
Not counting alcohol use and status offenses like truancy and running awayfrom home, 84.5% of the respondents admitted to having at least once `ever'committed one (or more) of the acts asked for in the questionnaire. Tables 1and II (Appendix) give the results for each `ever' and `last year' delinquencyitem (both prevalence and frequency; see also Tables III and N (Appendix)for prevalence for each sex and age category).

107
0
About one out of every four respondents who reported delinquentbehavior `ever' had contacts with the police as a result of that behavior(24.6%).
Questions like `did you ever ...' have a cumulative effect, however: the,probability of an affirmative answer increases with age. This results inhigh percentages in the `ever' column in Table I (Appendix) and in a highoverall level of `ever offending behavior'.
Asking whether the offense was committed `laat year' (the year beforethe moment of the interview) avoids this effect. Table I (Appendix) showsthat the offender percentage drops significantly, most notably in the caseof shoplifting, vandalism and fare dodging on (local) public transport(dropping 31.7%, 30.3% and 27.7% respectively). In some inatances thepercentages are not really comparable. For example, if respondents wereno longer going to school over the year before the interview, a questionabout skipping classes is not very relevant. Summed over all types ofbehavior, the prevalence of delinquency in the year before the interview is61.2%.
When we rank-order offenses according to prevalence level, we find theitem `not paying on local public transport' at the top of the `ever' list at47.3% (not counting alcohol use; see Table V, Appendix). This item ranksthird in the `last year' table, where `staying away from school' comes first(26.4%). Globally, though, there is not much difference between the orderof the offenses in the two tables. Shoplifting makes the biggest jump,dropping from the fifth place on the `ever' list to the twelfth on the `lastyear' list.
How do the ISRD delinquency figures compare to other representativesamples from the Dutch juvenile population?
Representative samples of Dutch juveniles in the age group of 12-17years were drawn up in 1988 and 1990 for a study concerning the develop-ment of juvenile delinquency (Junger-Tas et al., 1992). Another samplerepresentative for Dutch youth was drawn up in 1991 for the first wave ofa longitudinal study on the effects of significant life events on different as-pects of the life of young people,.including criminal behaviors (Rutenfransand Terlouw, 1994).
The `last year' prevalence rates found for the ISRD sample are a bithigher than those for the other three samples. This may be explained bythe fact that the ISRD sample does not contain 12- to 13-year-old young-sters, who are generally less involved in delinquent behavior than juve-niles who are a few years older (Hirschi and Gottfredson, 1983; Junger-Tas et al., 1985). Adding the 12- to 13-year-old respondents from the 1990sample to the (RDC) ISRD sample for four offenses results in a lowering ofthe prevalence rates for these types of delinquent behavior to a level thatdoes not really differ from the ratel found for the 1988 and 1991 samples.
The delinquency questions were grouped (by summing) into six catego-ries, according to the nature of the offenses (see Table VI, Appendix). Ta-ble 1 gives the `ever' and `last year' prevalence rate for the six delinquencyclasses. The percentage of respondents that scored on combinations of twodelinquency categories is given in Table VII (Appendix).

108
Table 1. Categorized prevalence of delinquent behaviors `ever' and `last year' (all respond-ents, n=914)
Type Ever Last yearn % n %
Property offenses 553 60.5 270 29.5Overall violent offenses 526 57.5 268 29.3violence against objects 419 45.8 128 14.0violence against persons 350 38.3 202 22.1Drug offenses 197 21.6 140 15.3Other youth-related offenses 624 68.3 331 36.2
Overall delinquency withoutalchohol and `problem' behavior 772 84.5 559 61.2
• ` 'roblem' behaviorwithout alcohol use 442 48.4 245 26.8
The following offenses have the highest last year' prevalence level inthe delinquency categories (Table I, Appendix): buying stolen goods .(11.6%, category property crime), vandalism (12.6%, category violenceagainst objects), carrying a weapon (15.4%, violence against persons), softdrug use (15%, drug offenses), not paying on local public transport anddriving without a license or insurance (both at approx. 20%, `other youth-related offenses'), and skipping classes (26.4%, problem behavior).
About half of the violent offenders (52.2%) were involved in violenceagainst persons only, while 24.6% reported violente against objects only.For the remaining 23.1% both types of behavior were recorded. Eight outof ten violent offenders (82.5%) reported carrying a weapon around, inmost cases (59.5%) a stiletto or comparable knife. Table 1 tells us furtherthat the highest `last year' prevalence rate is observed for `other youth-re-lated offenses' (36.2%).
In addition to Table 1, Table II (Appendix), showing the categorized fre-quency scores for the `last.year',.delinquency categories, informs us thatover the `last year', 143 respondents (15.6%) committed (any of the) `otheryouth-related offenses' one or two timer, 71 respondents 3 to 5 times etc.Twelve respondents repórted cómmitting (any of) these offenses 51 or moretimer. Compared to the offender frequency rates found for violent, propertyand drug offenses, the levels for `other youth-related offenses' are fairlyhigh.
Below we will look into the occurrence of delinquent behaviors in sub-groups of the sample having different characteristics.
8. Sociodemographic characteristics and delinquency
8.1 Gender
In many respects, male respondents are more likely to have been involvedin delinquent behavior in the year before the interview than female re-

109
spondents. The prevalence rates are shown in Table 2. Apart from problembehavior, for which the groups do not differ, there is a significant differencein prevalence between male and female respondents, especially for violentand property offensea.
Approximately twice as many mala as female respondents committedproperty offenses and violence against objects. Violent behavior againstpersons was recorded for over four times as many males as females. Thedifference is less conspicuous for drug offenses and 'other youth offenses'.Males were about 1.3 tienes more likely to have been involved in thesebehaviors than females.
When controlled for age (14-15, 16-17, 18-19, 20-21 years), the differ-ence between male and female respondents in prevalence of propertycrime, overall violence and violence against other persons holds for all agegroups. For violente against objects (graffiti and vandalism), however,there are statistically significant prevalence differences between malesand females in the age classes 14-15 and 20-21 years only (respectively,29.2% versus 13%, x2=7.7, p<.01 and 11.4% versus 4.1%, x2=5.0, p<.05). Inthe ages 16-19 the sexes do not differ.
The significant difference between male and female respondents in theprevalence of drug offenses occurs mainly in the age group 20-21, in which29.5% of the men as compared to 16.3% of the women reported suchbehavior over the last year ()C2=6.3, p<.05). In the ages 14-19 the differenceis not statistically significant.
The age control also shows that differences between sexes found for'other youth-related offenses' (i.e., not paying on public transportationetc.) are mainly due to significant differences that show up in ages 14-15and 16-17'. From age 18 and up male and female respondents do notdiffer.
7hble 2. Gender and prevalence of delinquent behaviors last year'(n=914)*
Type Male Femalen % n %
Property offenses .. 175 39.4 95 20.2Overall violent offences 192 43.2 76 16.2violence against objects 83 18.7 45 9.6violence against persons 163 36.7 39 8.3Drug offenses 83 18.7 67 12.1Other youth-related offeraces 190 42.8 141 30.0
Overall delinquency without al-cohol and'problem' behavior 325 73.2 234 49.8
'Problem' behaviorwithout alcohol use 121 27.3 124 26.4
*Property offenses Xa=40.4, p<.001. Overall violent offenses %a=80.7, p<.001, violence againstobjects x2=15.8, p<.001; violenceagainst persons X2=107.1, p<.001. Drug offenses Xa=7.6, p<.01.Other youth-related offenses %a=16.2, p<.001. Overall delinquency without alcohol and'prob-lem' behaviorx2=52.7, p<.001.
'Male-f male 14-15 prevalence 53.1%-28.3%, %2=12.9, p<.001. Male-female 16-17 prevalence51.6%-37.59ó, )a=4.7, p<.05

110
Overall, in all age groups a significantly higher percentage of respond-ents in the male group has been involved in delinquent behavior ('overalldelinquency last year' indicator) than in the female group. The maleprevalence level in the 14-15 year group is 74.3%, 32% higher than the fe-males. For the older groups the difference averages about 20%.
8.2 Age
We found significant differences in delinquency prevalence `last year' be-tween age groups (Table 3). For violence (overall), the highest prevalencerate is found in the age group 14-17 (approximately 36.5%). This is main-ly caused by the female subgroup, in which the violence prevalence isabout 22.5% in the ages 14-17, decreasing to 11.5% for those over 17. Inthe male group the percentage of violent offenders diminishes as well butnot significantly (from approximately 48.6% to 37.2% for the same agegroups).
While for these age categories (14-17) the prevalence rate for violenceagainst objects drops off steeply at age 18 (from approximately 21% downto approximately 7.6%), for violence against persons the cutoff point is notnearly as clear: there is a decline from 26.3% to approximately 18.5% forthe 18- to 21-year-old respondents. For neither male nor female respond-ents does the percentage of respondents reporting violence against per-sons change significantly with age.
The age groups do not differ significantly regarding property crime: the
7hble 3. Age and prevalence of delinquent behaviors last year' (n=914)'
Type14-15n
Age group16-17 18-19 20-21
% n % n % n %
27.3 81 34.4 65 29.4 68 27.036.6 86 36.4 52 23.5 55 21,822.0 47 19.9 18 8.1 18 7.126.3 62 26.3 44 19.9 42 16.73.9 36 15.3 41 18.6 55 21.8
42.0 106 44.9 84 38.0 55 21.9
60.0 162 68.6 136 61.5 138 54.8
11.2 62 26.3 87 39.4 73 29.0
Property offenses 56.^Overall violent offenses 75violence against objects 45violence against persons 54Drug offenses 8Other youth-relatedoffenses 86
Overall delinquency without alcoholand'problem' behavior 123
Troblem' behaviorwithout alcohol use 23
*Overall violent offenses X2=21.4, p<.001, violente against objects XZ=33.7, p<.001; violentesint persons %2=9.5, p<.05. Drug offenses X2=30.6, p<.00L Other youth-related offenses
X -=33.6, p<.001. Problem behavior without alcohol use X2=43.8, p<.001.Overall delinquencywithout alcohol and'problem' behaviorX2=10.0, p<.05.

111
highest prevalence rate is found for the 16-17 year group (34.3%), and thelowest for the youngest (27.3%) and oldest group (27.0%).
Drug offenses show a steady and significant prevalence increase withage, from a negligeable 3.9% for the 14-15 year group to 21.8% for the old-est respondents. This curve is found for male and female subgroups sepa-rately. Traveling on public transport without paying, etc., as combined inthe `other youth offenses' category, gets leas with age, as Table 3 shows.This is for the greater part due to the mala subgroup, where the preva-lence level drops from approximately 52% to 20% for the older respond-ents. The percentage of offenders in the female group decreases as well(about 10%), but the decrease is not so impressive, the prevalence rate forthe 14-17 year groups being about 33% (not significant).
Problem behavior is most common at the ages 18-19, where it was re-corded for 39.4% of the respondents, for males and females equally.
The overall delinquency measure shows the highest prevalence level forthe 16-17 year group (68.6%), going down to 54.8% for the 20-21 age group.
Though the pattern is similar for men and women separately, in noneof these groups is the delinquency prevalence difference between the agegroups statistically significant.
8.3 Educational status
The educational status of the respondents was measured by looking at theirschool achievements. For those still in school, we took the current level asan indicator for educational status, and, for respondents no longer in school,the highest level/class achieved, irrespective of whether the study was com-pleted by a diploma or not. Educational status has three categories: high(n=146), medium (n=365) and low (n=403).
As for prevalence of property crime last year', no significant differencesfound between the three groups. In the low and medium educational levelgroups the prevalence rate is approximately 27.3%, and in the high educa-tion group 36.3%. The gróupë do differ on violence, however: 19.2% preva-lence for the high education -group going up to 36.5% for the low group.The same trend is visible in the subeategories violence against objects andviolence against persons. For violent behavior against objects, the preva-lence level ranges from 8.9% (high educational status) to 18.4% (low edu-cational status), and for violence against persons the prevalence rangesfrom 13.7% to 28.3% for these groups respectively.
On the other hand, in the high education group a significantly higherpercentage of respondents reported having been engaged in drug use ordrug dealing in the year before the interview (26%). For the medium levelgroup this is 16.4% and for the low education category 10.4%. Also, prob-lem behavior like truancy and staying away from home is more commonin the high education group than in the other groups (37.7% versus 32.9%and 17.4% for the low education group).
Using public transport like buses, subways and trains without payingor driving cars without a driver's license was recorded for more respond-
112
ents in the low educational status group than for those in the medium orhigh group (41.1%, 35.9% and 22.6% respectively)'.
Probably because of these mixed results for the various delinquencycategories, the overall prevalence indicator - being the sum of most delin-quency categories - does not show a significant difference in delinquencyfor the three educational subgroups (averaging about 61%).
8.4 Socioeconomic status and household composition
In order to get an estimate of the socioeconomic status (SES) of the respond-ent, we created an indicator by combining the occupational status of thefather of the respondent with the interviewer's assessment of the status ofthe place (house/apartment, etc.) where the respondent lives. The twomeasures were given the same weight in the new SES indicator, which con-tains the categories high (n=59), medium high (n=162), medium (n=238),medium low (n=321) and low (n=129)7.
Significant differences in prevalence percentage between the five SESgroups are observed for problem behavior onlys. This behavior was mostfrequently recorded for medium-high and medium SES respondents(about 32%). Going from high to low SES, we observe roughly an invertedU prevalence curve. The low-SES group has a somewhat higher preva-lence level than the medium-low group, however (25.6% versus 20.9%).
The percentage of respondents involved in property crime over the lastyear is, at about 30%, the same for the five SES groups. For violence, thelow-SES group shows the highest prevalence rate (34.1%), followed by thehigh and medium-high SES respondents at approximately 30.7%. The me-dium and medium-low groups are at the bottom of the prevalence ranking(about 27.9%). The objects/persons violence subdivision alters the overallpicture slightly. For violente against objects (graffiti, vandalism) the me-dium-high SES group ranks first at 18.5%, with the low and high group asrunners-up (approximately 15.4%), while for violence against personsthere is a steady prevalence: increase from high SES to low SES (18.6% to27.9%). These differences are not statistically significant though.
The drug-offenses category shows an inverted U curve comparable tothe one we found for problem behavior: from about 18% for the medium-high and medium SES'respondents dropping off to 11.9% (high) and ap-proximately 13.8% (low SES).
The prevalence rate of the remaining overall delinquency indicator andthe `other youth-related offenses' measure averages approximately 61%and 36% respectively, without any significant difference between SESgroups.
'Overall violent offenses X2=19.8, p<.001, violente against objects X'=11.8, p<.01; violenteagainst persons X2=17.5, p<.001. Drug offenses X20.7, p<.001. Otheryouth-related offensesX'=16.5, p<.001. Problem behavior without alcohol X'=33.9, p<.001."There are 5 missing answers on the SES indicator."problem behavior without alcohol )'=11.5, p<.05

113
Household composition is not associated with prevalence of propertycrime or violence (overall, objects or persons).
Among respondents from broken families, respondents who live aloneand those who live in a household situation other than with parents orhusband/wife and the two situations above (broken family or alone), wefind a relatively high percentage of drug offenders (21.5%, 29.4% and28.6% respectively versus approximately 11.2%) and juveniles with prob-lem behavior (34.1%, 34.1% and 38.8% respectively versus approximately23.5%).
The braken family respondents are also high on `other youth offenses'(46.7% as compared to 36.8% for the next highest group: household withboth parents present). On overall delinquency the prevalence rate amongrespondents who live alone and respondents from broken families (69.5%)is 11% higher than among other respondents .
8.5 Ethnicity
Analyses of prevalence of delinquent behavior in the year before the surveyand the ethnic group to which the respondent belongs show that the fivedifferent ethnic groups differ only on drug use/dealing and overall delin-quency". As for drugs, the highest prevalence level is found for the indig-enous Dutch respondents, followed by the `other ethnicity' group (respec-tively 17.2% and 14.9%). The percentage of drug offenders amongSurinamese, Moroccan and Turkish juveniles is much lower at 7.8%, 3.1%and 2.1% respectively.
The overall delinquency indicator shows that the Surinamese, Dutchand `other ethnicity' groups contain relatively many offenders at 70.6%,62.7% and 57.4%. The percentage of offenders among the Moroccan andTurkish respondents is 37.5% and 46.8%.
For the other delinquency prevalence indicators, the ethnic groups donot differ significantly. The global prevalence rates for property crime andviolence are 29.5% and' 29.3%, whereas on both indicators Moroccanyouth, at 12.5% and 18:8%, are markedly lower than the other groups.
While for graffiti plus vandalism the prevalence percentage is more orless the same for the five groups at 14%, the Moroccans are low in vio-lence against persons at 12.5%, as compared to an overall level of 22.1%.The average offender percentage for the category `other youth-related of-fenses' and `problem behavior' is, 36.2% and 26.8%, respectively.
Drug offenses XZ=36.0, p<.001. Otheryouth-relatedoffensesX2=14.8, p<.01. Problembehaviorwithout alcohol X1=13.4, p<.01. Overall delinquency without alcohol and `problem' behavior2=10.7, p<.05.
g offenses X2=14.3, p<.01. Overall delinquency without alcohol and'problem' behaviorXa=14.5, p<.01.

114
8.6 Source of incomes
The main sources of income the respondents mentioned could be classifiedinto five categories: parents (34.3%), work (16.4%), parents+work (12.1%),scholarship (26.4%) and other sources (8.2%), including social welfare (2.3%of all respondents). There is a small group of 24 respondents (2.7%) thatclaims to have no money at all to spend'.
The income groups differ significantly in offender percentage on all de-linquency indicators". The average prevalence level for property crimeand (overall) violence is, 29.7% and 29.4% respectively. The 'other incomesources' group contains by fat the most offenders for property crime(45.2%) and is high on violence as well (34.2%). Possibly property crime it-self is this 'other income source' for this group. Other high scores on vio-lence are found among those respondents who get their money from theirparents (34.9%) and those who give parents+work as the main source ofmoney (41.7%). This pattern is repeated in the subcategories violenceagainst objects and personal violence.
For drug offenses the 'scholarship' and 'other source' groups rank at thetop of the offerader list. These groups are, 6% and 11% respectively abovethe mean offender percentage for drug crimes (15.2%). In case of 'scholar-ship' as the main source of income, we are probably talking about stu-dents who use drugs as part of their leisure-time behavior. The 'othersource' group may consist of respondents with an unconventional life-style, since this group was also high on property crime, violence and 'otheryouth-related offenses' (below).
The mean prevalence on the 'other youth-related offenses' and 'problembehavior' measures is, 36.5% and 27% respectively. On the former indica-tor the group with the highest level of offenders is the 'other sources'group (50.7%), followed by the 'parents+work' group (44.4%), while on thelatter measure the 'scholarship' group ranks first at 42.4%, lome 15%above the mean.
Lastly, the 'other income source' and the 'parents+work' groups are themost delinquent as found on.jhe overall delinquency indicator. About 70%of the juveniles in these gi óups was involved at least once in delinquentbehaviors in the year before thé interview, which is about 9% above aver-age.
9. Some theoretical background factors and delinquency
One of the objectives of the ISRD project is to do some theory testing.Hirschi's (1969) social control theory specifying four elements (attachment,
'Nineteen respondents did not answer this question.' Property crime X1=13.6, p<.05. Overall violent offenses )a=28.3 p<.001, violence againstobjects 2=28.4, p<.001; violenceagainst persons 2=16.4, p<.O L Drug offenses Xe=25.4, .001.Other youth-related offenses X2=25.7, p<.001. Problem behavior without alcohol X?=42.6,p<.001. Overall delinquency without alcohol and'problem' behavior Xa=13.6, p<.05

115
•
commitment, beliefs and involvement) that bind the individual to societywas at the basis of most of the background questions selected. An analysisof some of these background characteristics and their relationship to delin-quency in the past year yielded the results outlined below. We took a lookmainly at questions concerning school/job performance and involvement,relationship with parents and parental supervision, socioeconomic statusand socializing behavior (Table VIII, Appendix).
Violence against objects shows the least relationships to the back-ground variables tested. Apparently, vandalism and graffiti are things alljuveniles get involved in at some time or another.
For the rest, indicators for school performance and involvement like en-joying school and failing classes are significantly related to delinquency.Juveniles who generally (did) like going to school were less involved in de-linquent behavior (overall) than those who do not enjoy school that much(57.4% versus 70.1%). Also, those who failed classes were higher on delin-quency prevalence than those who did not. The opinion on the importanceof doing one's best at school and getting a diploma, and the age of leavingschool, are not related to involvement in delinquent behavior.
On the other hand, the prevalence of delinquency in the group of re-spondents who hold the attitude that it is important to work hard in orderto achieve something in life is generally lower than the prevalence levelamong respondents who do not consider this important, with the excep-tion of `other youth offenses'. Drug offenses and problem behavior aremore frequent among those who ever changed jobs than among the rest.The number of job changes is not related to delinquency, however. Thesame is true for whether or not a respondent has a job, and whether he/she likes the job. Nor is the status of the job the father of the respondentholds is related to the respondent's involvement in delinquent behavior.
Parental supervision, as measured through questions as to whetherparents generally know where the respondent is going when going out andwith whom`, is related to all types of delinquent behavior (excluding vio-lence against objects). For the overall delinquency level, the results showthat the percentage of `Iow,supervision' respondents reporting offenses inthe past year is, at approximately 81.5%, some 22% higher than the `highsupervision group'. This holde: mostly when controlled for age:the effect isstrongest in the ages of 18 and over, and for the question whether the par-ents are aware of the' company their kids are in. Similar pictures emergefor the composite delinquency categories like property offenses etc. Thequality of the relationship with father or mother is virtually unassociatedwith delinquency. Significant differences are found only for drug offenses(relationship with father) and overall violente and overall delinquency (re-lationship with mother). Globally, the highest prevalence rates are ob-served in the groups that state that they get along reasonably well withtheir parents. Family cohesion in the eense of how frequently the respond-ents go out with their family (e.g., to restaurants, movies, etc.) is in noway related to delinquent behavior, nor is whether or not the respondenthas a steady (girl-/boy)friend.
'The correlation between the two questions is .40.

116
Looking at the company the respondent goes out with, the highest per-centage of offenders is found in the groups that spend their leisure timewith friends who are not associated with the school they attend or theplace they work (as opposed to family, friends from school/work andsteady girl-/boyfriend)'. This is also the group in which the percentage ofparents who are unaware of the company their sons/daughters are in ishighest (23%). Furthermore, among respondents who claim to have many`real' friends, i.e., 11 or more, we find significantly more offenders thanamong juveniles who say they have fewer than 10 `real' friends. This istrue for all delinquency categories, except drug offenses and problembehavior. The dif£erence is globally in the order of 10% to 25%.
For the overall delinquency measure, we see that in the non-offendergroup, with respect to personal problems, respondents almost always getsupport from their friends if that is the party they generally go out withor from family members if they mostly socialize with them. This (signifi-cant) difference is not found for the offenders, which could lead to the con-clusion that the attachment level to friends/family might be lower amongthese respondents.
10. An overall picture
So far, only results from analyses concerning a (selected) set of single vari-ables like age or enjoyíng school and categories of delinquent behavior havebeen presented. We would like to conclude with a global view to try to showhow these respondent features which have shown to be individually impor-tant relate in combination to involvement in delinquent behavior.
The following variables were used to predict involvement in (overall)delinquent behavior `last year' (alcohol use and problem behavior ex-cluded):
Sex, age, educational status, SES, household composition, daily activi-ties, ethnic group, source of income, company with which leisure time isprimarily spent, enjoying. school, failing classes, importance of workinghard, parental supervision íknowing where one's children are when theygo out), number of `real'.`friends and support from friends in case of prob-lems. Interaction effectè were not accounted for in the analysis".
Table 4 shows which of these variables proved to be significant predic-tors of (overall) delinquency in the past year'. Remarkably, age is notone of them. This may be an effect of the different types of delinquentbehavior included in the overall measure. Table 3 showed that some typesof offenses are more frequent in young respondents while other types aremore common in older age groups.
'Property crime 44%, overall violence 42% and overall delinquency 76%."Logistic regression was used for the analysis (59 missing cases). In logistic regression adichotomous dependent variable is predicted by one or more independent variables whichcan be categorical.^'See Appendix, Table IX for exact results.

117
4
7hble 4. Significant predictors of involvement in delinquency last year' (overall) and direc-tion of the relationship
Predictor More delinquent if:
SexHousehold typeDaily activityEthnicityLiking schoolWorking hard is important (attitude)Parents know where you are going outNumber of 'real' friendsSupport from friends in case of problems
MaleLiving aloneStudy+workSurinameseLessNoNoHighLess probable
Some indicators, like household type and ethnicity, are categorical. Forsuch indicators this implies in this analysis that the predictive value of acategory in an indicator can only be understood in comparison to snothercategory in that indicator: the reference group. For instance, for householdtype the reference group is `living with both parents'. Table 4 shows thatthere is a greater risk of being an offender if one falss in the category liv-ing alone' - as compared to the delinquency risk in the comparison groupliving with both parents'.
Seven out of ten cases (70.5%) are predicted correctly by the nine predic-tors in the analysis (the last year' overall delinquency prevalence rate was61.2%).
For the category non-offenders 49.2% of the cases are predicted cor-rectly, while for the offenders it is 83.8%. The goodness of fit x2 test sug-gests this prediction model is acceptable (Table IX, Appendix).
These results indicate that, on average, respondents who have the fea-tures listed in Table 4 at the right have a high probability of being offend-ers. After all, only 16.2% of the juveniles possessing those features are in-correctly predicted as being non-delinquent.
We also know that the. cbance of being an offender is smaller for re-spondents who do not have such characteristics. However, there is muchmore uncertainty when.forecasting non-offending for this set of respond-ents on an individual basis: the percentage of juveniles incorrectly pre-dicted as being delinquent (false positives) is 50.8%. Apparently, in this
*The reference values (comparison groups) in the categorical variables are for. Householdtype : having both parentsDaily activity : study/schoolEthnicity : DutchSource of income : money fiom parents and/or workFree time company : boy-/girlfriend/family/1-2 friends.For the categorical variables, the analysis also shows whether certain characteristics aresignificant predictors of being less delinquent than the reference group. In this analysis wefind that'no study/school'(categoricalvariable'daily activity'),'Moroccan' (ethnicity), 'schol-arship'(source of income) and'alone' (leisure time company) are all significant predictors ofbeing less delinquent than the reference group (see also Appendix, Table Iem.

118
group the mean predicted probability level of offending is still fairly high,making adequate prediction difficult.
This is visible in the histogram of predicted probabilities (Table X, Ap-pendix). Ideally, we would like to see a predicted probability of being de-linquent of close to 0% for non-offenders, and of 100% for offenders.
However, a glance at the incorrectly predicted cases in the graph (theY's to the lelt of the .5 point (50% chance) on the X axis and the Ns to theright of that point) shows that non-offending is hard to predict; many non-offenders (N's) have a relatively high (>.5) estimated probability of beingdelinquent.
The model does a better job at predicting offenders; although there aresome offenders (Y's) who have a predicted chance of leas than 50% of beingdelinquent, for most offenders the predicted probability is over 65%. Manyrespondents are in the .4-.6 probability zone, indicating that it is difficultto predict whether they will be offenders.
Logistic regressions on the delinquency categories show that age doesplay a significant role as a predictor for the categories of violence againstobjects, drugs, and 'other youth-related offenses'. Age is also a significantpredictor for 'problem behavior' (which is not a part of the overall delin-quency measure). In this category, sex is non-significant.
Summarizing analyses on five delinquency categories (property crime,violence against objects and persons, drug offenses and 'other youth-re-lated offenses'), the best general predictors are sex (all offending catego-ries), liking school and daily activity (four offending categories), age,money source, failing classes and parental supervision (three catego-ries)". Ethnicity, though a significant predictor in the overall delinquencyregression, does not play a significant predicting role in any of these sepa-rate analyses.
11. Conclusions
Summarizing, the most salierot results from the Dutch ISRD survey are:- The offender percentagé`'for•"overall delinquent behavior last year' is
61.2%. The main contributing crime categories are property crime andviolence (prevalence levels 29.5% and 29.3%), and 'other youth-relatedoffenses' (36.2%).
- Within these crime categories, the most important factors are 'buyingstolen goods' (11.6%), 'carrying a weapon' and 'vandalism' (15.4% and
'`problem behavior' and overall violence are not included in these figures."Sex: nales are associated with more delinquency.Daily occupation: if study+work - more delinquent.Liking school: more - leas delinquent.Age: Violence against objects: younger - more delinquent.Drug offenses: younger - less delinquent.Other youth-related offenses: younger - more delinquent.Source of income other than parents, work, both, or scholarship: if so - more delinquentFailed or Repeated classes: if yes - more delinquent.Parents know where you are when going out: if yes - leas delinquent.

119
12.6%), and `driving without license or insurance' and `using local pub-lic transport without paying' (20.7% and 19.6%).Globally, more male than female respondents are involved in delin-quent behavior (overall 73.2% versus 49.8%). This is true for the sepa-rate crime categories as well, with the exception of problem behavior.Delinquent behavior is most prevalent in the ages 16-17 (68.6%), gener-ally dropping off steeply after age 19. This age-prevalence trend alsoshows up in the crime categories. Drug offenses (mainly soft drug use)is the only category that does not fit this picture: the prevalence rateincreases steadily with age.For overall delinquency, there is no difference between respondents ofdifferent educational status. Nonetheless, the low-status group is high-est on violence and `other youth-related offenses', while the high-educa-tional-status group ranks at the top for drug offenses.Socioeconomic status is not related to differences in delinquency. It isonly problem behavior where we find that medium and medium-highSES respondents attain higher scores.In general, ethnicity is not related to delinquency. The only significantdifferences are found for drug offenses, where the Dutch are the mostfrequent offenders, and for overall delinquency, where the Surinamesejuveniles are highest, followed by the Dutch.Respondents with (a) source(s) of income other than parents, work,parents+work or scholarship are highest on property crime, violenceagainst persons, drug offenses, and `other youth-related offenses'. Theparents+work group tops the offender list for overall violence, its sub-category violence against objects and overall delinquency. Respondentswho receive a scholarship are most likely to report problem behavior.Violence against objects is generally, not, associated with respondentcharacteristics like school/job performance and involvement, parentalattachement and supervision, SES and social behavior. Respondentswho like school, do not fail classes and think it is important to workhard are less involved in delinquency than the other respondents.Parental supervision. is., inversely related to the prevalence of delin-quency. The perceived'quality of the relationship with father or motheris generally not correlated with delinquency.Respondents who say they. have many `real' friends and who go out withfriends who do not have anything to do with the school they attend orthe job they have, are more likely to have been involved in delinquentbehavior (property crime, violence and overall delinquency).Using the moet important respondent characteristics from the base setselected as predictors of delinquency last year' results in a correct pre-diction for 71% of the cases. Offending is much better predicted thannon-offending: many non-offenders stil have a relatively high predictedprobability of being delinquent. Generally, sex, daily activity, school in-volvement, the number of friends a respondent has and parental super-vision appear to be the best predictors of involvement in different cat-egories of offending.

120
References
Centraal Bureau voor de Statistiek (CBS) (1992a), Beroepsbevolking en geregis-treerde werkloosheid. Sociaal-Economische Maandstatistiek, 92:2.
Centraal Bureau voor de Statistiek (CBS) (1992b), Stand en loop van de bevolkingvan Nederland naar land van nationaliteit. Maandstatistiek van de Bevolking,92:5, pp. 31 and 35.
Centraal Bureau voor de Statistiek (CBS) (1992c), Statistisch Jaarboek 1992.`s-Gravenhage, The Netherlands, Staatsuitgeverij.
Centraal Bureau voor de Statistiek (CBS) (1992), Maandstatistiek van de Bevolking,92/10, pp. 32, 36, 45.'s-Gravenhage: Staatsuitgeverij.
Centraal Bureau voor de Statistiek (CBS) (1993), Statistisch Jaarboek 1993.'s-Gravenhage, The Netherlands, Staatsuitgeverij.
Engelsman, E.L. (1990), Alcohol policy in the Netherlands: A three-pronged attack.World Health Forum, 11:3, 257-263.
Grapendaal, M., E. Leuw and J.M. Nelen (1991), De Economie van het Drugs-bestaan, WODC nr.115. Arnhem and Gouda, The Netherlands, Quint.
Harmsen, C.N. (1992), Hoeveel allochtonen wonen er in Nederland? Maand-statistiek van de Bevolking, Centraal Bureau voor de Statistiek (CBS), 92:4, pp.6-8.
Hirschi, T. (1969), Causes of Delinquency. Berkeley, Calif., University of CaliforniaPress.
Hirschi, T., and M. Gottfredson (1983), Age and the explanation of crime. AmericanJournal of Sociology, 89:3.
Junger-Tas, J., M.Junger and E. Barendse-Hoornweg (1985), Jeugddelinquentie II:De Invloed van Justitieel Ingrijpen, WODC nr.63. `s Gravenhage, The Nether-lands, Staatsuitgeverij.
Junger-Tas, J., M.K Kruissink and P.H. Van der Laan, P.H. (1992), Ontwikkelingvan de Jeugdcriminaliteit en de Justitiële Jeugdbescherming: Periode 1980-1990,WODC nr.119. Arnhem and Gouda, The Netherlands, Quint.
Muus, Ph.J. (1992), Migration, Minorities and Policy in The Netherlands. Report onbehalf of the Continuous Reporting System on Migration (SOPEMI) of the Or-ganisation for Economic Cooperation and Development (OECD). Amsterdam,The Netherlands, University of Amsterdam, CEMIO.
Questionnaire for the International Self-Report Delinquency Project (1991), Devel-oped by the Research and Documentation Center, RDC, Ministry of Justice, TheHague, The Netherlands.
Rutenfrans, C.J.C., G.J. Terlouw' (1994), Delinquentie, sociale controle en `lifeevents'. Eerste resultaten van een longitudinaal onderzoek. WODC, nr. 131.Arnhem, Gouda Quint. ;
Tas, R.F.J. (1992a), Niet-Nederlanders op 1 januari 1992, Maandstatistiek van deBevolking, Centraal Bureau voor de Statistiek (CBS), 92:6, p.14.
Tas, R.F.J. (1992b), Surinaamse en Antilliaanse bevolking in Nederland, 1 januari1991, Maandstatistiek van de Bevolking, Centraal Bureau voor de Statistiek(CBS), 92:1, p.6.
Van Capelle, M.A.A. (1988), Het Nederlandse drugsbeleid in hoofdlijnen. AlgemeenPolitieblad, 13, 291-296.

121
APPENDIX
7lcble L Prevalence of delinquent behaviors 'ever' and last year' (n=914)
Type Ever Last yearn % n %
Stealing from telephonebooth or automata 51 5.6 10 1.1Shoplifting 336 36.8 47 5.1Stealing at school 222 24.3 76 8.3Stealing at home 122 13,3 38 4.2Stealing from work 67 7.3 36 3.9Stealingbike/moped/motor 114 12.5 48 5.3Stealing a car 2 .2 - -Stealing from/out car 16 1.8 3 .3Pickpocketing 6 .7 - -Snatching a purse or bag 5 .5 1 .1Burglary 63 6.9 15 1.6Stealing other 90 9.8 30 3.3Buying stolen goods 215 23.5 106 11.6Selling stolen goods 64 7.0 24 2.6
Prevalence property offenses 553 60.5 270 29.5
Graffiti 119 13.0 34 3.7Vandalism 392 42.9 115 12.6Carrying a weapon 246 26.9 141 15.4Threatening somebody 9 1.0 2 .2Engagement in riots etc. 175 19.1 92 10.1Arson 50 5.5 8 .9Beating up non-family 61 6.7 23 2.5Beating up family 8 .9 3 .3Hurtingwithweapon 27 3.0 6 .7
Overall violent offenses 526 57.5 268 29.3- Violence against objects 419 45.8 128 14.0- Violence against persons 350 38.3 202 22.1
Soft drug use 194 21.2 137 15.0Hard drug usa 16 1.8 10 1.1Soft drug selling 18 2.0 6 .7Hard drug selling 5 .5 2 .2
• Prevalence drug offenses 197 21.6 140 15.3
Fare dodging tram/bus/metro 432 47.3 179 19.6Fare dodging train 195 21.3 69 7.5Driving without license/insurance 367 40.2 189 20.7
Prevalence other youth-related offenses 624 68.3 331 36.2
Overall delinquency withoutalcohol and'problem' behavior 772 84.5 559 61.2
Truancy 431 47.2 241 26.4Running away 63 6.9 13 1.4Alcohol use 730 79.9 694 75.9
Prevalence 'problem' behaviorwithout alcohol use 442 48.4 245 26.8

122
. . . . . . . . . . . .1
.-110 q . . . . . . . . . . . . . .
AO10.- 1
td't M.-. • • ' • • d'ei NN
r
r=+
c0q
D d' 0m 1-4 • • • • ' CoN
' O114'O)00 W ' .- ' • N001Od'.-i .-1
md
m en co t- 00M q 1.4
Nd
-4 "i bNN '. mtC NN d'
N " " !tO.1 N O)
YN
.--i p ^N 1ON NM , N • -.M-1.M)0)t
T 0)t 00 -! tC- OO) eMt -0
,m90 2,09 252*g
veo mom" 0o t909
q0
O.0
Q o"' ',4: aa°
0aa
o00p3 ó a enino aFd qdq y
m deo ó 3en L.' en en eo 00 e0 eo eo y W
bo to
m.0CI)C C20 co oW pgcZ
N
N . . . . . . . .
tD.-i
.-4 N t ' 1-1 11
00
ri
00 0) -1 . OD . M
1-4
Nt CO O ' t ' M ' '
N -j N 't N r+0
N10
O 01 ' V' N .-.
tOo M 09 N M OM 19
i 00 O) t 04
0 9 O N 1 M to M 101-1
IR0t
CM "In llOcq C)-! iq t,: O0
O) m 0) O)OÓ 0)O) ói ó)i
O 0)MNN^pCppp^ 0top
Mti N 0)0)0) 0too O)O)
10 ' 10H N
ti -4
CD t CDCM * CV
M O N
t 1O COco -4 4
00 t O)10 co to
1100 (0 M
N .-i y.
,e 00 Nr1 ri
t_ 00)O cO t-

0
123
O10
F.0
to 010 N
.-1
N'-1 CO N eN ' O t0m8° N N N N to M 09 10 M
'-i
OO
N N N N' N M
^a 00m
M .M-1co
ll^ ei M IO h O 0! 00 O Nte Oy aor1 N m d' 0, d' 00 .d'
CD to'-1 N co V' co t M
"i M ' rl h T 01 oq q 1,NO 0co t- co t- N t-
w
00 M ' r 1 -4 M t 10 1-1 01 O N d' ' -1M N M b 1
t-t-
a .-1
d d' tO "i N O M W CO el O N
óQ N N 01 V 01 m .irt M
a0d tO .I M M NOl tO M
N a CO 00 d Ot O GO O
OOM 00 N -0 10-co M M IR t0 li ClLOCOM
c dM
MOT T 00 0)0 o N 0 N t-
t- -0 00 eq to tD 1Oto
0
Z ar-89-4 N
Nco
ti M O0tNto t0
dv
tti^yy^Q

124
7hble III. Prevalence of delinquent behaviors `lastyear' by sex (n=914)
Type Male Femalen % n %
Stealing from telephonebooth or automata 8 1.8 2 0.4 *Shoplifting 28 6.3 19 4.0Stealing at school • 47 10.6 29 6.2 *Stealing at home 21 4.7 17 3.6Stealing Erom work 22 6.0 14 3.0Stealingbike/moped/motor 40 9.0 8 1.7 *Stealing a car - - - -
mlout carStealing fr 3 0.7Pickpocketngi - - -Snatching a purse or bag 1 0.2 - -Burglary 11 2.5 4 0.9Stealing other 21 4.7 9 1.9 *Buying stolen goods 72 16.2 34 7.2 *Selling stolen goods 21 4.7 3 0.6 *
Prevalence property offenses 175 39.4 95 20.2
Graffiti 23 6.2 11 2.3 *Vandalism 73 16.4 42 8.9 *Carrying a weapon 119 26.8 22 4.7 *Threatening somebody 1 0.2 1 0.2Engagement in riots etc. 74 16.7 18 3.8 *Arson 7 1.6 1 0.2 *Beating up non-family 21 4.7 2 0.4 *Beating up family 2 0.5 1 0.2Hurting with weapon 4 0.9 2 0.4
Overall prevalence violent offenses 192 43.2 76 16.2 *- Violence against objects 83 18.7 45 9.6- Violence against persons 163 36.7 39 8.3 *
Soft drug use 80 18.0 67 12.1 *Hard drug use 8 1.8 2 0.4 *Soft drug selling 5 1.1 1 0.2Hard drug selling 2 0.5 - -
Prevalence drug offenses 83 18.7 57 12.1 *
Fare dodging tram/bus/metro 96 21.6 83 17.7Fare dodging train 42 9.5 27 5.7 *Driving without license/insurance 131 29.5 58 12.3 *
Prevalence other youth-related offenses 190 42.8 141 30.0 *
Overall delinquency prevalence withoutalcohol and'problem' behavior 325 73.2 234 49.8 *
Truancy 118 26.6 123 26.2Runningaway 9 2.0 4 0.9Alcohol use 338 76.1 356 75.7
Prevalence'problem' behaviorwithout alcohol use 121 27.3 124 26.4
*significant difference at the .05 level

125
óco0c g • •a . ogác; oN koCV mN 0 0CN N
r-1N
0N
0 i0 d'10 O 0^
8° d; rl ag cq 0.4 "c0 N10 W
oÓ4
9 mm 10 m
a
60
NH
N
co 10: corn.l.r C- ;lC- w lo
11
óQ
q
' •'1 • ' N10M 10
• • • • t0 M 00 eM
•w 1 .1;agNNO0 0 0 ,'• c co
M a2N-WIZSI ' .-1 • .-IN^cYlP
O M ag o? ' Q^ • !O O) W ag o)N t- O" 0 C Oco co
N
2
m
ei
co
M
N
C^ 't cq 't 'tt- 0 o-OOOO
fflceg ' 9rN1-4-4
d;og.-i . O Nqa.-1 t0 O^ NOO
co Q1 ' N ' co '-1 r•11.4
'tIg19 ao co t,: Iq ' mcG^^óO^ iN .ti
^mcON1od'co • M
cq q • N i0 V; IQ lb
N.0 .1N •1.•-i eM 0Ó
^ W? ' NMO-,•••1
cc'ti
N^ O-4
w-4rnoom
2 ' 220

126
tON^^NOO
-*m 10 00.-1
M OQ CO
t ' N
ti
H
CO ' co r-1
co 0
N , -4 co
OQ V.Mto (0 coN N
ér4(00
rn oq o2
NtON
dv
0N O
t0
^O^pp^ ^ t0
M~000
W Mel;N H co
N Iq h1-i m
'-1 t0
N
rnm
Mp
N

127
Thble V Overall rank-ordering of prevalence of delinquent behaviors 'ever' and last year'(use of alcohol excluded; n=914)
Type Ever Last yearPrev.% Rank Type Pree % Rank
Fare dodging tram/bus/metro 47.3 1 Truancy 26.4 1Truancy 47.2 2 Driving w/o license/insurance 20.7 2Vandalism 42.9 3 Fare dodging tram/bus/metro 19.6 3Driving w/o license/insurance 40.2 4 Carrying a weapon 15.4 4Shoplifting 36.8 5 Soft drug use 15.0 5Carrying a weapon 26.9 6 Vandalism 12.6 6Stealing at school 24.3 7 Buying stolen goods 11.6 7Buying stolen goods 23.5 8 Engagement in riots etc. 10.1 8Para dodging train 21.3 9 Stealing at school 8.3 9Soft drug use 21.2 10 Pare dodging train 7.5 10Engagement in riots, etc. 19.1 11 Stealing bike/moped/motor 5.3 11Stealing at home 13.3 12 Shoplifting 5.1 12Graffiti 13.0 13 Stealing at home 4.2 13Stealingbike/moped/motor 12.5 14 Stealing from work 3.9 14Stealing other 9.8 15 Graffiti 3.7 15Stealing from work 7.3 16 Stealing other 3.3 16Selling stolen goods 7.0 17 Selling stolen goods 2.6 17Burglary 6.9 18 Beating up non-family 2.5 18Running away 6.9 18 Burglary 1.6 19Beating up non-familyStealing from telephone
6.7 20 Running awayStealing from telephone
1.4 20
booth/automata 5.6 21 booth/automata 1.1 21Arson 5.5 22 Hard drug use 1.1 21Hurting with weapon 3.0 23 Arson .9 23Soft drug selling 2.0 24 Hurting with weapon .7 24Stealing from/out car 1.8 25 Soft drug selling .7 24Hard drug use 1.8 25 Stealing from/out car .3 26Threatening somebody 1.0 27 Beatingupfamily .3 26Beatingup family .9 28 Threatening somebody .2 28Pickpocketing .7 29 Hard drug selling .2 28Snatching a pui-se or bag .5 30 Snatching a purse or bag .1 30Hard drug selling .5 30 Stealing a car - 31Stealing a car 32 Pickpocketing - 32
Alcohol use 79.9 Alcohol use 75.9
Thble VI. Categories of delinquent behaviors
1. Problem behavior2. Property crime3. Overall violence
a. Violence against objectsb. Violence against persons
4. Drug offenses6. Other youth-related offenses6. Overall delinquency
items 1 + 2 in ISRD delinquency questionnaireitems 20 through 33violence objects + violence personsitems 6 + 7 through 19items 34 through 40items 41 + 42 + 44 + 45items 3+4 + 5Property crime + Overall violence +Drug offenses + Other youth-related offenses

128
7hble VII. Percentage of respondents in total sample reporting combinations of 2 differenttypes of offenses `last year'
P V VO VP D OY PB
Property crime 15.5 8.9 12.0 9.0 16.5 10.8Violence overall 14.0 22.1 6.8 15.3 9.3violence against objects • 6.8 3.3 8.0 4.9violence against persons 5.7 12.1 7.4Drugs 7.2 7.2Other youth-related offs. • 12.4Overall delinquency 20.1
P = property crime; V = overall violence; VO = violence against objects (vandalism+graffiti);VP = violence against persons; D = drug use/selling; OY = other youth-related offenses;PB = problem behavior.Overall delinquency does not include alcohol use and problem behavior.
7hble VIII. Some socioeconomic and background characteristics and delinquency revalencelast year`
p v VO VP D OY PB TOT
SexAge categoryEducational statusSocioeconomic statusHousehold compositionEthnicitySource(s) of income
** * * *
* * * * * * * *
bilring school * * * * * * *Repeating or failingclasses * * - * * * * *Doing your best at school - - - - - - - -Age of leaving school - - - - - - - -
Work hard toachievesomethingLiking jobJob nowEver change jobF requency change jobOccupational classfather
Parents know where *Parents know with whomFrequency going out withfamily -Get along with father -Get along with mother -
Steady (girl)friend -Wants this relation to last -
**
* * * *
*
* * * * ** * * * *
0
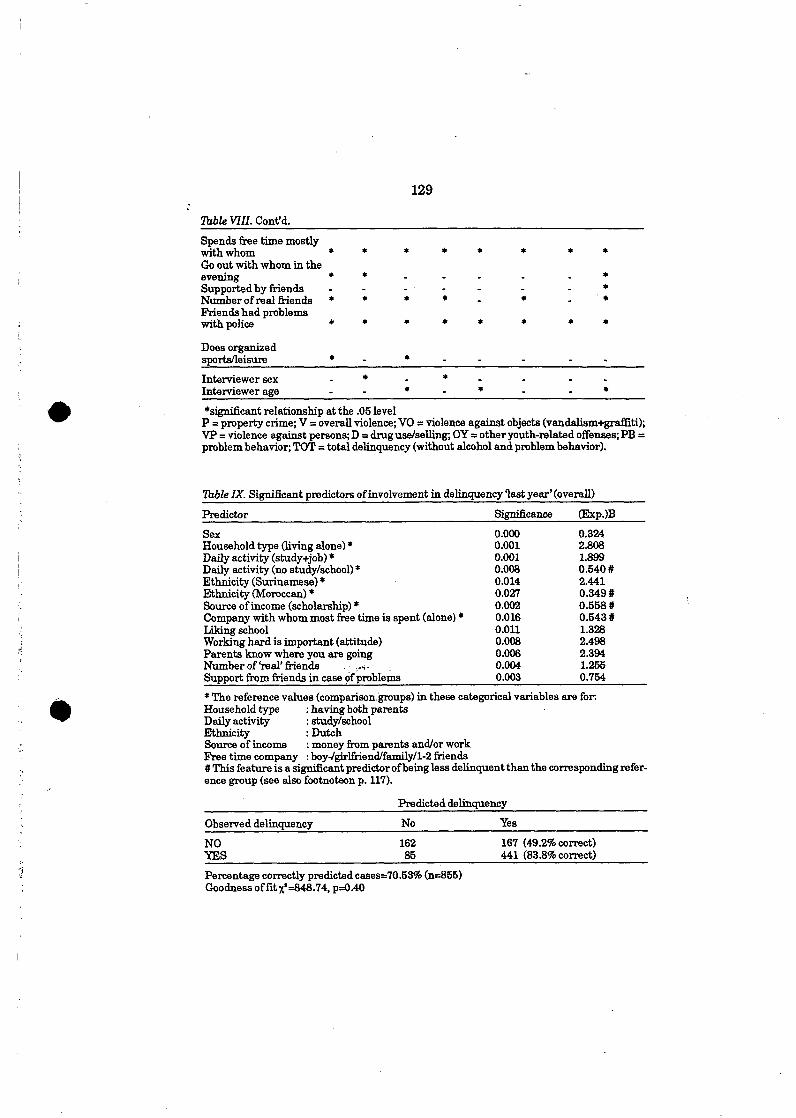
129
7bble VIII. Cont'd.
Spends free time mostlywith whomGo out with whom in theeveningSupported by friendsNumber of real friendsFriends had problemswith police
Does organizedsports/leisure
Interviewer sexInterviewer age
* * * * * * * *
*
*significant relationship at the .05 levelP = property crime; V = overall violence; VO = violence against objects (vandalism+graffiti);VP = violence against persons; D = drug use/selling; OY = other youth-related offenses;PB =problem behavior; TOT = total delinquency (without alcohol and problem behavior).
1hble A'. Significant predictors of involvement in delinquency last year' (overall)
Predictor Significance (Exp.)B
Sex 0.000 0.324Household type (living alone) * 0.001 2.808Daily activity (study+job) * 0.001 1.899Daily activity (no study/school) * 0.008 0.540 #Ethnicity (Surinamese) * 0.014 2.441Ethnicity (Moroccan) * 0.027 0.349 #Source of income (scholarship) * 0.002 0.558 #Company with whom most free time is spent (alone) 0.016 0.543 #Lildng school 0.011 1.328Working hard is important (attitude) 0.008 2.498Parents know where you are going 0.006 2.394Number of `real' friends 0.004 1.255Support from friends in case óf p'roblems 0.003 0.754
The reference values (comparison.groups) in these categorical variables are for:Household type : having both parentsDaily activity : study/schoolEthnicity : DutchSource of income : money from parents and/or workFree time company : boy-/girlfriend/family/1-2 friends# This feature is a significant predictor ofbeing less delinquent than the corresponding refer-ence group (see also footnoteon p. 117).
Predicted delinquency
Observed delinquency No Yes
NO 162 167 (49.2% correct)YES 85 441 (83.8% correct)
Percentage correctly predicted cases=70.53% (n=855)Goodness of fit x'=848.74, p=0.40

0
130
00

DELINQUENCY IN THIRTEENWESTERN COUNTRIES: SOMEPRELIMINARY CONCLUSIONS
Josine Junger-Tas
This book presents a review of the main results of the ISRD survey in thir-teen western countries. The outcomes of the individual studies are reportedin the preceding chapters. Although we do not present any comparativeanalysis, it certainly is worthwhile to try to draw some conclusions on thebasis of the material presented, considering the fact that a common instru-ment is used, as well as a number of similar samples.
Reviewing the contributions, four studies - in Switzerland, England,Portugal and The Netherlands - are based on national random samples,and one - Spain - on a large, stratified urban sample. These will first becompared. Two studies are based on city samples - the cities of Mann-heim (Germany) and Belfast (Northern Ireland) - and one on a stratifiedsample - Athens (Greece). Three more cities had recourse to school sam-ples - Omaha (Nebraska, U.S.A.), Helsinki (Finland) and the Italian cities- while one city has a mixed approach - Liège (Belgium). Two additionalstudies have been included in the book, a cohort study in a New Zealandcity and some preliminary results of a survey done in East and West Ger-many. Neither is not strictly comparable to the other studies: they differconsiderably in sampling method and used only part of the common sur-vey instrument. But because we have for the first time some East Germandata available as well as some results of a New Zealand self-report study,we decided to include them as `extra' information at the end of the book.However, they will not be included in this global overview of the surveyresults.
It is clear that differences in the sampling methods and data collectionsused, limit the assertions that can be made on the basis of the availableresearch results. This is the more so because at this moment we have not.yet introduced any techniques to correct some of the problems related tothese differences. Therefore our claims for generalization of the researchoutcomes are rather modest. However, despite this obvious difficulty, it isworth trying to examine some of the basic general trends that can befound in the studies. This exercise is the first step in attempting to dis-cover to what extent there are similarities and differences between west-ern countries in the volume, nature and make-up of delinquency of youngpeople in these countries.
Address for correspondente: Ministry of Justice, RDC, PO Box 20301, 2500 ER The Hague,The Netherlands.

373
•
7hble 1. Prevalence rates in five countries
Ever Last 12 months
Netherlands (n=914) 84.5 61.2England and Wales (n=1.223) 65.9 44Portugal (n=1000) 81.5 57.2Switzerland (n=970) 90.3 72.2Spain(n=2.100) 81.1 57.8
74ble 2. Prevalence ofthree categories of delinquent behavior in five countries (last 12 months)
Property Violence Drugs
Netherlands 29.5 29.3 15.3England and Wales 16 15.8 25.9Portugal 21.4 29.5 11.3Switzerland 33.5 29.1 20.9Spain 20.1 34.5 15.4
7hble 3. Prevalence of four violent acts in five countries (last 12 months)
Vandalism Carryingweapon
Group fightspart. in riots
Beatingupnon-family
Netherlands 12.6 15.4 10.1 2.5England & Wales 3.5 9.4 6.3 1.4Portugal 16.1 10.8 11.1 2.5Switzerland 17.0 11.2 8.8 0.9Spain 16.3 8.4 17.2 2.3
1. Delinquent behavior
Considering first the national random samples, Table 1 shows the delin-quency rates*, excluding so-called `problem behavior' (status-offenses).
Without looldng at the detailed list of delinquent acts and comparingthe acts one by one, it is of course impossible to draw any hut very globalconclusions. What one might say is that the rates are roughly similar,with the exception of the United Kingdom, which shows clearly lowerrates. An interesting outcome is the strildng similarity in delinquencyrates in Spain and in Portugal.
The following table, which compares three different categories ofbehaviors, suggests where we may find some of the differences.
As can be seen, property offending shows some differences, with TheNetherlands and Switzerland - two highly prosperous countries - show-ing the highest rates and England, Portugal and Spain having lowerrates.
* The treatment of missing values differs per country, which might have had a slight effect onthe delinquency rates presented in the book.

374
0
2hble 4. Prevalence rates in seven city samples
Ever Last 12 months
Mannheim (n=300) 82.3 51Belfast (n= 883) 75.5 47.3Liège (n=618) 82.5 56.1Athens (n=300) 96.9 85.1
Omaha (n=539) 87.4 61.23 Italian cities (n=1009) 85 64.6Helsinki (n=1.672) 94.8 79.5
Table 2 shows again fairly similar rates for violent offenses - except forEngland which has considerably lower rates. The rates for violence arerelatively high. This is due to the combination of violence against objects,such as vandalism, and violence against persons. In order to get a betterunderstanding in the distribution of different violent behaviors the follow-ing table presents some more details (Table 3).
Looking at vandalism, the ratel do not differ a great deal except forEngland which seems to have extraordinarily low rates. We included inthis category `carrying a weapon', which shows fairly high rates in most ofthe countries. It seems that nowadays, when young people go out, carryingbaseball bats and all kinds of stabbing weapons hal become accepted as anormal thing to do. Group fighting is most prevalent in The Netherlands,Portugal and Spain and lowest in England and Switzerland. As for beat-ing up a person not belonging to one's family, that is a rather rare event.We also looked at the rates for hurting someone with a weapon, and theserates are even lower, with England having the highest rate (1.4) and TheNetherlands and Switzerland the lowest (0.7).
There are some interesting differences in the rates for drug use. Thedata suggest that England and Switzerland have relatively more drug useamong young people than Holland, Spain and Portugal. In all five coun-tries drug use is mainly restricted to cannabis use, although the numberof respondents mentioning other drugs is somewhat higher in Englandthan in the other countries.
Looking at separate offenses, there is again much similarity in the actsthat are committed by the largest number of young people. All studiesmention vandalism, fare evasion, buying or selling stolen goods (which ismore frequent than one might have thought), driving without a license,fights and riots, carrying a weapon and cannabis use as the most fre-quently committed offenses.
The following samples are all city samples, three of which are exclu-sively school-based (Omaha, Helsinki and Genoa, Messina and Siena). Asa consequence, these have a more limited age range (14-18+ instead of 14-21) (Table 4).
Again the similarity - with the exceptions of Athens and Helsinki - isstriking. What is especially striking, and somewhat surprising, is that theschool samples, despite their limited age range, do not show differentrates compared to the other samples. This may be related to the fact that

375
0
7hble 5. Prevalence of three categories of delinquent behavior in seven city samples Gast 12months)
Property Violence Druguse
Mannheim 20.7 21.7 7Belfast 25.5 23.8 19.9Liège 27.3 29.9 8.2Athene 34.9 51.8 9.1
Omaha 36.9 34.9 17.33 Italian cities 16.7 14 6.3Helsinki 38.6 34.7 13.2
74ble 6. Prevalence of some violent acts in seven city samples (last 12 months)
Vandalism Carryingweapon
Groupfightspart. in riots
Beatingupnon-family
Mannheim 4.7 13.7 4.3 0.7Belfast 12.5 6.5 6.1 2.4Liège 13.6 13.3 7.3 2.9Athens 54.5 12.6 19.9 6.2
Omaha 13.7 18.0 15.0 4.3Threé Italian cities 7.6 3.4 10.4 2.1Helsinki 19.6 12.4 12.6 1.0
criminal activity is very much age-related and has its peak in adolescence,so that the age range of 19-21 might not add much to the general preva-lence rates.
As far as property offenses are concerned, prevalence rates forMannheim, Belfast and Liège are somewhat similar, Italy shows lowerrates and Omaha, Athens and Helsinki higher ones (Table 5). Violenceshows a similar pattern, with higher rates in Omaha, Helsinki and Ath-ens. The high rates in Athens are due to the large number of acts of van-dalism that were reported, as we can see in Table 6.
Athens has a very high rate of vandalism, while Mannheim and theItalian cities have very low rates. The other cities show fairly similarrates. Carrying a weapon seems to be most frequent in Omaha and leastfrequent in Italy and Belfast, with very little difference in the other cities.Group fights or rioting do not seem to occur very frequently in the cities ofBelfast, Mannheim and Liège but leem to occur at least twice as often inthe other cities. F inally, beating up someone remains a very rare event,although a little less so in Omaha and Athens. The highest rate of hurtingsomeone with a weapon is found in Omaha, but it is low even there (2.4).Drug use appears to be relatively low in southern European countries (seealso Portugal). Maybe the penetration of (soft) drug use in the youth popu-lation of these countries is not yet as great as in western Europe and theUnited States. However, surprisingly, Mannheim's respondents also re-port low drug use, while Belfast and Omaha report the highest rates ofdrug use. With respect to the nature of the offenses most frequently com-

376
mitted, we find the same acts as those previously mentioned in the case ofthe national samples. The outcomes presented should be interpreted withcaution: much more detailed and in-depth analysis is needed to be able tosay more about possible explanations of differential delinquency rates.
2. Sociodemographic factors and delinquency
Considering the correlates of offending, the nature of the sample - countryor city - is of less importance. However, it should be remembered that atthis stage of the study we did not control for all possible other interveningfactors.
2.1 Gender
In all participating countries, boys commit more offenses than girls. Thisvaries between 1.5 to 2 times as many property offenses to about 2 to 4times as many violent offenses, in particular violence against persons.Some offenses, such as shoplifting and fare evasion, are reported by asmany girls as boys. This is also true for `problem behavior' or statusoffenses. In general the more serious (and violent) the offense, the greaterthe difference between boys and girls. Drug use is also mentioned by moreboys than girls, although the disparity is not always that large: 1.5 times asmany boys as girls in the England and Wales, The Netherlands, Spain andMannheim, twice as many in Switzerland, Portugal and Belfast and aboutthree timer as many in Italy and Liège. In two cities, Omaha and Athens,drug use is mentioned by as many boys as girls, while in Helsinki more girlsthan boys report drug use. However, in the Jatter case, the girls reportmainly the use of pain-killers or tranquilizers.
2.2 Age
Confirming what has been found in much of the self-report literature, thepeak age of offending in the participating countries is 16-17 years (Hirschiand Gottfredson, 1983; Wikstr5m, 1990; Gottfredson and Hirschi, 1990;Junger-Tas, 1992a). However, there are some differences according tooffense category. Peak age of property crime is indeed 16-17; for vandalismand graffiti, it is 14-15, hut violence against persons peaks at a later age(18-19, and in England 20). Drug use starts at a later age and continues wellafter adolescence. This is also true for alcohol use and such offenses as driv-ing without a license, fare evasion, stealing at work, selling stolen goodsand stealing a car. Generally girls start somewhat later than boys and stopat an earlier age. For example in England, the peak age for boys is 16-17and for girls 16. Although in a number of countries differences in offendingprevalence between age categories are not (or hardly) significant, thetrends are similar in all of them.

•
0
377
2.3 Education
Two countries - the United States and England and Wales - have educationsystems that differ from most of the European states. Indeed the formerhave one school type - high school in the U.S and the comprehensive schoolin England and Wales - within which there might be lome differentiation,while the Jatter generally differentiate between levels of education, whereeach level has its specific schools. Thus most of these countries have schoolsfor lower (vocational) training, medium (technical) education and highereducation, which might be of a technical nature or university preparatory.This means that in the case of Omaha and the United Kingdom, we have nodata available on the relation between educational level and delinquentbehavior. The other studies, however, tell us a rather identical story
The main finding is that, overall, there is hardly any relationship be-tween educational level and delinquent behavior. However, one has to dif-ferentiate between offense types. For example, in all studies, violence isfairly strongly related to the lower educational levels, that is, the lowerthe education level, the violent the offenses. In general property offensesshow no relationship to education level, although several studies showed alower number of reported property offenses among those who had leftschool and found employment. Fare evasion and driving without a licenseseem to increase with educational level in some countries (Mannheim),but not in others (Portugal and The Netherlands).
The results with respect to drug use are particularly interesting, withthe exception of southern Europe, where there is too little reported druguse to show any clear trends. Some of the other studies indicate that (soft)drug use is more frequent among those who are involved in the highereducation streams. This is the case for the Netherlands, Spain andMannheim. Others, however, looked at what happened when respondentshad left school. The Belgian study suggests that drug use appears to berelated to a lack of further prospects. For example, it was found that 7% ofthe students had reported drug use. This proportion increased to 14%among those who had left school but veere employed, and to 22% amongthose who had lelt school but did not have a job. In Switzerland drug useis also higher among those who are unemployed after having lelt schoolthan among students. In Belfast the number of drug offenses is signifi-cantly higher among school leavers than among students.
2.4 Socioeconomic status
In general there appears to be no relationship between socioeconomic sta-tus and delinquency. This outcome is no different from what has been re-ported in the research literature on self-report studies (Hindelang et al.,1981). One of the reasons for this finding probably is that self-report sur-veys include a fairly large number of non-serious offenses that seldom ap-pear in police statistics (Hindelang, 1981). For example, fare evasion is acharacteristic and frequent offense of students who belong to the highersocial strata, whereas the more serious violent offenses tend to be more

378
•
often committed by the lower social strata. Some indications for this ten-dency have been found in the ISRD studies. For example, in the Belfaststudy, there is a trend of more reported property and violent offenses in thelower socioeconomic groups, with significant differences for such offenses asstealing cars, buying stolen goods and arson. More young people from thelower strata report committing delinquent acts, and they also commit thesewith greater frequency than young people from higher social strata.
Another interesting outcome in the Belfast study is the existence of arelationship between delinquent behavior of young people and their sourceof income: of those who are on welfare, 66.3% reported committing one ormore delinquent acts during the last 12 months, as opposed to 43% ofthose who have a job and 27,8 of those with a scholarship. The young peo-ple on welfare reported essentially more violent offenses and more drugoffenses. The Swiss study looked at school failure in relation to the fa-ther's social status and found more reported offenses among those whoselow educational status predicts a lower social positron in future than theirfather's positron. Again, a number of studies indicated more violence inthe lower strata (Belfast, The Netherlands and Mannheim), and the Bel-gian study found more drug use among those whose father was unem-ployed, but on the whole no strong relations have been established be-tween delinquent behavior and socioeconomie status.
2.5 Ethnicity
A number of countries have hardly any identifiable and sizable ethnic mi-nority groups in their population. This is the case for Northern Ireland,Portugal, Greece, Italy and Spain. Switzerland, The Netherlands, Englandand Wales, the United States, Belgium and Germany have large groups ofminorities, whose origins lay in North Africa, India, Asia, South Americaand the Caribbean.
In most of these countries, with perhaps the exception of the UnitedStates, there is a nagging problem in comparing delinquent behavior ofthe indigenous youth population with that of minority populations. This isrelated to the fact that most self-report studies seem to indicate that mi-nority groups have lower prevalence rates than indigenous youth, whilethey are heavily over-represented in official police statistics. For example,Switzerland, The Netherlands, England and Liège report either no differ-ence or lower rates for minorities in property offenses and violent acts.Some of them (Liège and Mannheim) indicate more problem behavior anddrug use among minorities, but this outcome may heavily depend on theminorities' background. For example, the English study found one druguser in four among white youth, one in eight among blacks and one intwelve among Asians. The American findings stands in contrast to whathas been reported so far. No difference was found in prevalence of prop-erty offenses, other offenses and alcohol use among whites, blacks andHispanics. However, violent offenses and drug offenses were most preva-lent among Hispanics, followed by blacks and then by whites.
The question is how to explain the dispanty in self-reported and re-

379
•
corded delinquency? Several explanations might be forwarded. Althoughwe know that the more delinquent members of the indigenous youthpoplation are difficult to reach with self-report surveys, this problemmight be even more pronounced in the case of minority groups. There arealso indications that some minority youngsters have more difficulties inanswering or completing the questions, depending on length of residencein the host country and how well integrated they are. Another factor maybe a certain tendency to dicriminatory practices by the police and thecriminal justice system in general. However, research done in the UnitedStates and in The Netherlands (Petersilia, 1985; Junger, 1990) does notshow any evidence of police discrimination. Finally, it is possible that theresponse validity of minority respondents is luwer than that of indigenousrespondents, a factor that might be related to either differential culturalnorms and values or to fear or mistrust of authorities or both. Actually wereally do not know, and more research is needed to answer this question.
3. Some selected bonding factors and delinquency
3.1 Family variables
As mentioned before, we added some theoretical background variables tothe questionnaire, based on social control theory. There are only a few ofthem because we did not want the questionnaire to become too voluminous.
As we know from the literature, the quality of the relationships with fa-ther and mother have a very important effect on the likelihood of delin-quent behavior of young people (Hirschi, 1969; Laub and Sampson, 1988;Wells and Rankin, 1991; Junger-Tas, 1992b). All studies report less delin-quency when there is a close relationship with parents. With the excep-tion of Portugal, most studies reveal that the relationship with the fatherappears to be as important as the relation with the mother, especiallywith regard to violence, drug offenses and problem behavior. The Englishsurvey found that the likelihood of running away from home is four timesas great when the relationship with the mother is disturbed, but ninetimes as great when there is a bad relation with the father.
Having a boy- or girlfriend is related in a more complex way to delin-quent behavior. In earlier surveys in The Netherlands (Junger-Tas andKruissink, 1988, 1990), it appeared to be the high number of girlfriendssucceeding each other that was related to the likelihood of delinquency:the more girlfriends, especially at younger ages, the greater the risk of of-fending behavior, truancy, high alcohol use and drug use. Our conclusionwas that there exists a sort of `risky' lifestyle among young people, ofwhich heavy alcohol use, drug use, truancy and delinquent behavior areessential aspects. Comparable findings are shown by the Spanish study.This finding has also been confirmed in some of the other ISRD data. F o rexample, the Belfast study noted that the existence of a special boy/girl-friend was related to more delinquent behavior unless the respondentswanted the relationship to last. Similarly the English survey draws atten-tion to the fact that having a girlfriend in one's early teens is related to

380
0
•
more offending, but a steady relationship at a later age, as well as mar-riage, is related to leas offending.
Parental supervision is a very strong predictor of delinquency in allstudies (Wells and Rankin, 1988; Farrington, 1986). Two English re-searchers found in an earlier study that effectave perental supervision isdependent on the quality of the relationship with the parents: when thatrelationship is bad, the supervision cannot be effective because the juve-niles keep their parents uninformed about their whereabouts and theirfriends (Riley and Shaw, 1986).
The questions as phrased in the ISRD instrument have both a commu-nication dimension and a control dimension ('do your parents know whereyou are going and with whom?'). In most of the ISRD studies, these vari-ables are strongly related to all types of offending behavior, as might beexpected on the basis of the research literature. The Dutch study found norelationship between parental supervision and vandalism and concludedthat the frequency of acts of vandalism is so great among the young that itdoes not differentiate between the well-supervised and the less-super-vised.
But generally, the less supervision, the more delinquent behavior, in-cluding alcohol consumption and drug use and problem behavior.
3.2 Some school and work variables
All studies mention that liking school is strongly related to delinquentbehavior. Those who like school report considerably less delinquent involve-ment than those who do not like school. The relationship holde for everytype of offerding behavior, although there are some minor variations.
Liking school is of course related to successful performance or schoolachievement. One outcome in a number of countries is the strong relation-ship between repeating classes and violent behavior. This has been foundin Italy, Athens, Spain, Portugal and Belfast. The other studies merely re-port the relationship with overall delinquency. Liège observed that thecorrelation was especially strong with repeating classes in the past andnot in the last 12 months. The suggestion was made that the significantvariable might be the negative reactions of teachers and family as well asthe juvenile's perception of failure in school that triggered off the ten-dency to delinquent behavior, an explanation that seems to be based onlabeling theory (Lemert, 1967). An additional explanation of the relation-ship with violent behavior would be the strong feelings of frustrationamong young people facing school failure, which has also been found inearlier research (Junger-Tas, 1988).
Questions such as `do you believe in working hard to achieve success inlife' or 'is it important to work hard in school in order to get a diploma'have variable outcomes. In some cases there is no relationship at all to de-linquency. In a number of cases, however, there appears to be a negativerelationship with drug use, alcohol use and problem behavior. But, as weknow, questions that tap attitudes very often do not show any (or at mosta weak) relationship with the dependent variable.

381
3.3 A concluding note
Presenting the main findings so far with the necessary caution, we may saythe following.
i
- There appears to be a great similarity in rates of delinquent behaviorin the countries that participated in the ISRD survey, as well as in thenature of the offenses that are most frequently committed;
- an exception to this finding is drug use, which does not seem to havepenetrated as deeply in the youth culture in southern Europe as is thecase in western Europe and in the United States;
- the ratio of boys to girls' criminality is 1.5:1 for property offenses anddrug use and 2:1 to 4:1 for violence, with violence against personsshowing the largest disparity. There is very little or no differencebetween the sexes with respect to fare evasion, shoplifting and problembehavior;
- the peak age for property offenses is 16-17; for vandalism it is 14-15; forviolence against persons 18-19. Drug use starts rather late and doesnot stop at age 21;
- the lower the educational level, the more the violent behavior isreported;
- drug use seems related to early school-leaving and to unemployment;- there is a striking disparity in delinquency self-reports of ethnic
minorities and their over-representation in police statistics;- both the relationships with the mother and with the father are
important to delinquency;- parental supervision appears to be a strong predictor of delinquent
behavior in all participating countries;- the stronger the bond with school, the less delinquent behavior. School
failure is found to be related to violent offenses.
An important conclusion is that the similarity in prevalence ratesseems independent of the nature of the samples drawn, an outcome thatwe had not expected. This certainly suggests that self-report measuresare fairly robust, despite differences in sampling method, method of ad-ministration and probably other not-yet-considered differences in culturalvalues and socioeconomie situations as well.
Another conclusion is that `ever' prevalence rates are generally quitehigh, which may meao that some delinquent or deviant behavior formspart of the growing-up process of western children. However, last year'prevalence rates are considerably lower and suggest that on average halfto two-thirds of normal young people aged 14 to 21 do commit an occa-sional offense of a not-too-serious nature in a one-year period.
In volume II further multi-variate analysis of the data combined in onestandardized data-set will shed more light on these preliminary findings.

382
References
Farrington, D.P. (1986), Stepping stones to adult criminal careers. In D. Olweus etal., eds., Development of Antisocial and Prosocial Behavior, pp. 359-384. NewYork, Academic Press.
Gottfredson, M.R., T. Hirschi (1990), A General Theory of Crime. Stanford, CA,Stanford University Press.
Hindelang, M.J. (1981), Variation in sex-race-age specific incidence rates of offend-ing. American Sociol. Review, vol. 46.
Hindelang, M.J., T. Hirschi, J. Weis (1981), Measuring Delinquency. Beverly Hills,Sage Publication.
Hirschi, T. (1969), Causes of Delinquency. Berkeley, Los Angeles, University ofCalifornia Press.
Hirschi, T., M.R. Gottfredson (1983), Age and the explanation of crime, AmericanJournal of Sociology, vol. 89, no. 3.
Junger-Tas, J. (1988), Causal factors: Social control theory. In J. Junger-Tas and R.Block, eds., Juvenile Delinquency in The Netherlands. Berkeley, Amstelveen,Kugler Publication.
Junger, M. (1990), Delinquency and Ethnicity - An Investigation on Social Factorsrelating to Delinquency among Moroccan, Turkish, Surinamese and Dutch Boys.Deventer, Boston, Kluwer Law and Taxation Publication.
Junger-Tas, J. (1992a), Criminaliteit en leeftijd. Justitiële Verkenningen, vol. 18, nr.3.
Junger-Tas, J. (1992b), Changes in the family and their impact on delinquency. Eu-ropean Journal on Criminal Policy and Research, vol. 1, no. 1.
Junger-Tas, J., and M. Kruissink (1988), De Ontwikkeling van de Jeugdcriminaliteitin 1986. Den Haag, WODC, Ministerie van Justitie.
Junger-Tas, J., M. Kruissink (1990), De Ontwikkeling van de Jeugdcriminaliteit:1980 - 1988. Den Haag, WODC, Ministerie van Justitie.
Laub, J.H., R.J. Sampson (1988), Unraveling families and delinquency: A reanalysisof the Gluecks data. Criminology, vol. 26, no. 3.
Lemert, E.M. (1967), Human Deviance, Social Problems and Social Control. Engle-wood Cliffs, New Jersey, Prentice Hall.
Petersilia, J. (1985), Racial disparities in the criminal justice system: A summary,Crime and Delinquency, vol. 31, 15-34.
Riley, D., M. Shaw (1985), Parental Supervision and Juvenile Delinquency. London,Home Office Research Unit, No. 83.
Wells, L.E., J.H. Rankin (1998), Direct parental controls and delinquency. Crimi-nology, vol. 26, no. 2.
Wella, L.E., J.H. Rankin (1991), Families and delinquency: A meta-analysis of theimpact of broken homes. Social Problems, vol. 38, no. 1.
WikstrSm, P-O.H. (1990), Age and Crime in a Stockholm Cohort. Journal of Quanti-tative Criminology, vol. 6, no. 1.